This pipeline computes the correlation between significant copy number variation (cnv focal) genes and selected clinical features.
Testing the association between copy number variation 39 focal events and 13 clinical features across 859 patients, 253 significant findings detected with Q value < 0.25.
-
amp_1q32.1 cnv correlated to 'Time to Death', 'YEARS_TO_BIRTH', 'NEOPLASM_DISEASESTAGE', 'PATHOLOGY_T_STAGE', 'PATHOLOGY_N_STAGE', 'HISTOLOGICAL_TYPE', and 'YEAR_OF_TOBACCO_SMOKING_ONSET'.
-
amp_2q32.1 cnv correlated to 'PATHOLOGY_N_STAGE' and 'HISTOLOGICAL_TYPE'.
-
amp_3q26.32 cnv correlated to 'YEARS_TO_BIRTH', 'PATHOLOGY_N_STAGE', 'PATHOLOGY_M_STAGE', 'KARNOFSKY_PERFORMANCE_SCORE', 'HISTOLOGICAL_TYPE', and 'RACE'.
-
amp_5q35.1 cnv correlated to 'NEOPLASM_DISEASESTAGE', 'PATHOLOGY_T_STAGE', 'PATHOLOGY_N_STAGE', 'PATHOLOGY_M_STAGE', 'HISTOLOGICAL_TYPE', and 'RACE'.
-
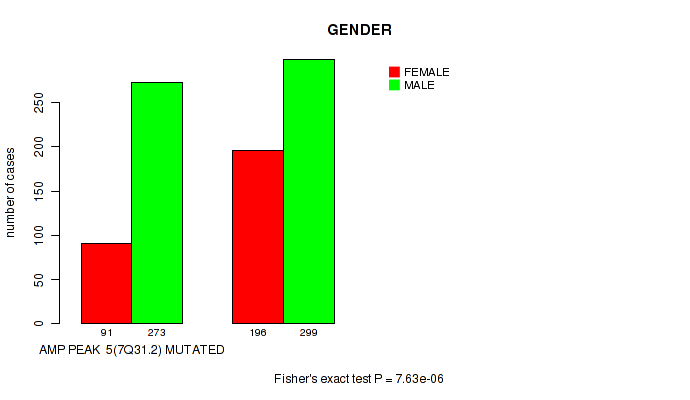
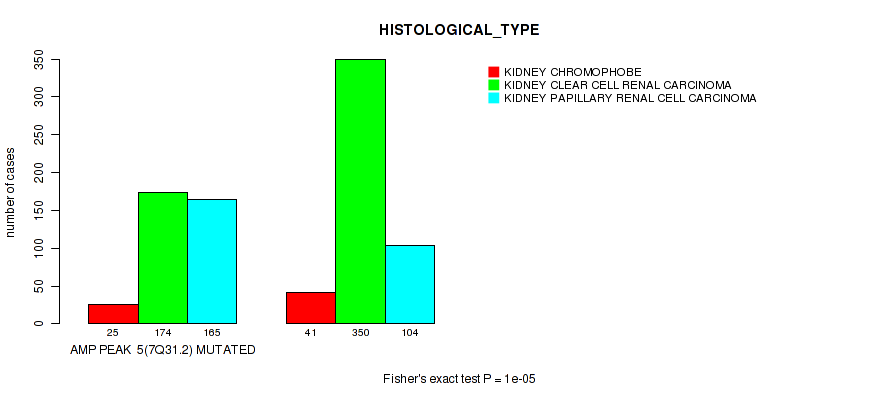
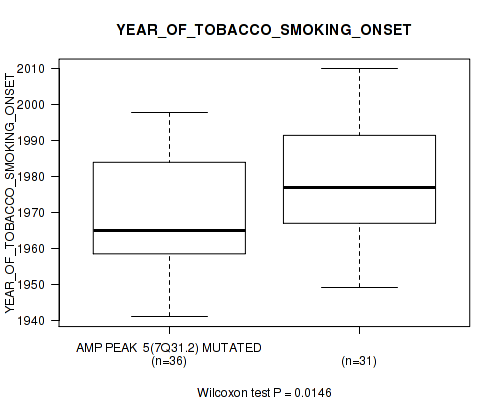
amp_7q31.2 cnv correlated to 'NEOPLASM_DISEASESTAGE', 'PATHOLOGY_M_STAGE', 'GENDER', 'HISTOLOGICAL_TYPE', and 'YEAR_OF_TOBACCO_SMOKING_ONSET'.
-
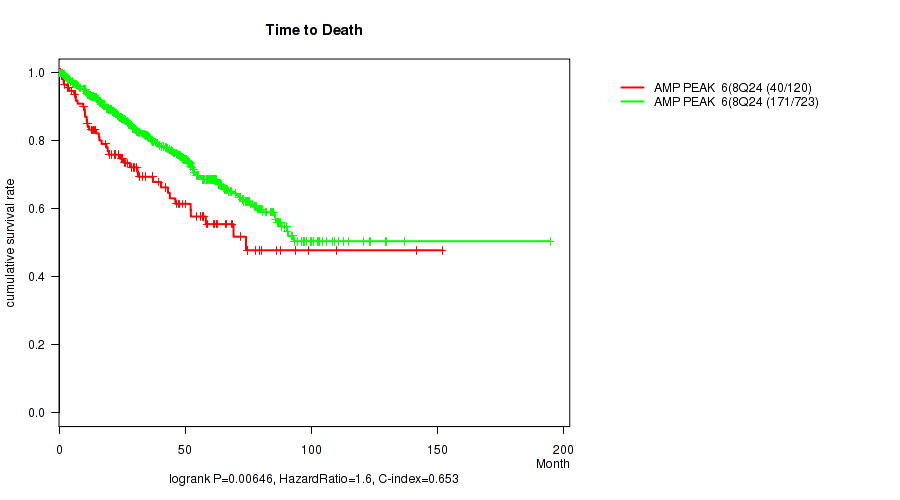
amp_8q24.22 cnv correlated to 'Time to Death', 'YEARS_TO_BIRTH', 'NEOPLASM_DISEASESTAGE', 'PATHOLOGY_T_STAGE', 'PATHOLOGY_N_STAGE', 'PATHOLOGY_M_STAGE', 'HISTOLOGICAL_TYPE', 'NUMBER_PACK_YEARS_SMOKED', and 'RACE'.
-
amp_10p14 cnv correlated to 'PATHOLOGY_T_STAGE' and 'PATHOLOGY_N_STAGE'.
-
amp_17q25.2 cnv correlated to 'YEARS_TO_BIRTH', 'NEOPLASM_DISEASESTAGE', 'PATHOLOGY_T_STAGE', 'PATHOLOGY_N_STAGE', 'GENDER', 'HISTOLOGICAL_TYPE', 'YEAR_OF_TOBACCO_SMOKING_ONSET', and 'RACE'.
-
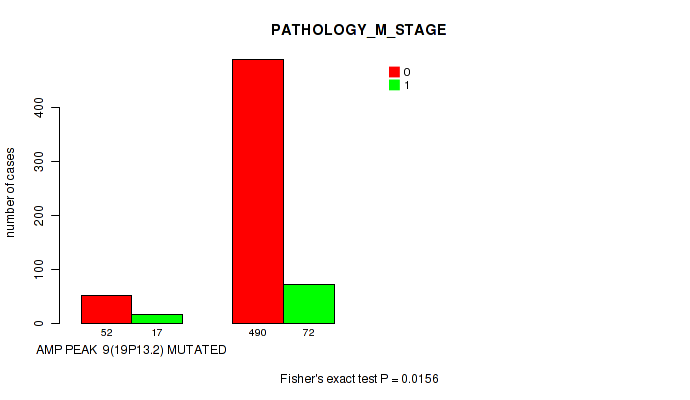
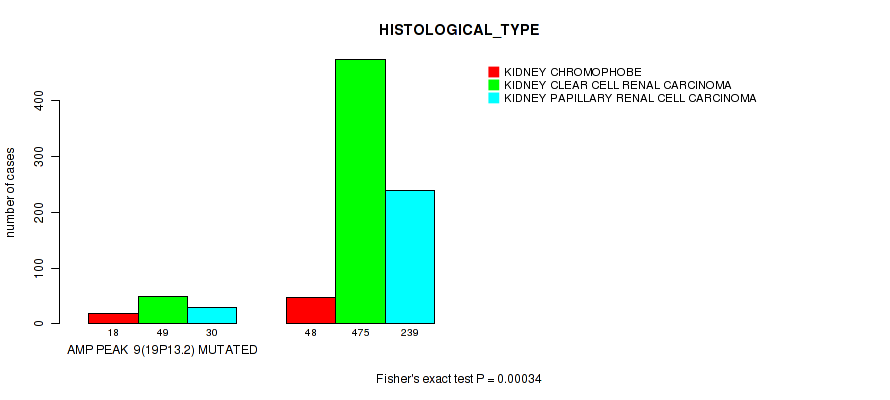
amp_19p13.2 cnv correlated to 'NEOPLASM_DISEASESTAGE', 'PATHOLOGY_T_STAGE', 'PATHOLOGY_M_STAGE', and 'HISTOLOGICAL_TYPE'.
-
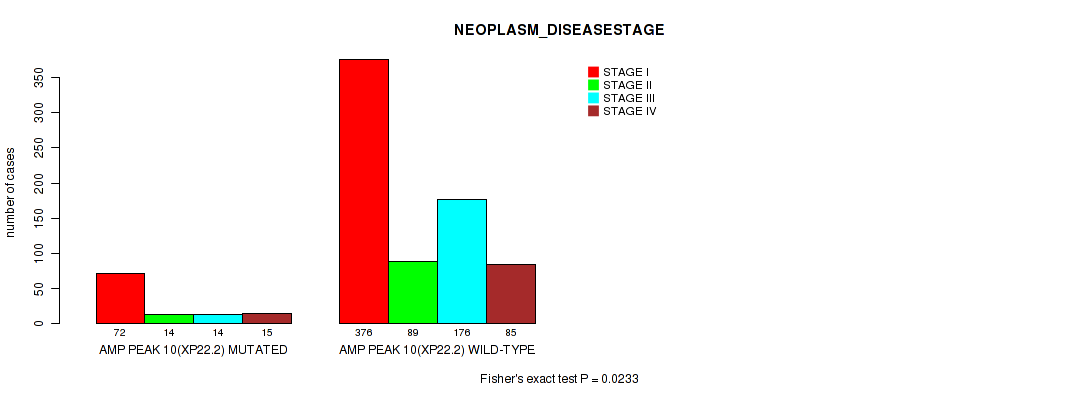
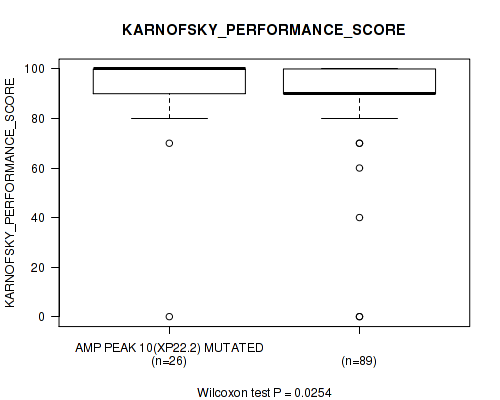
amp_xp22.2 cnv correlated to 'NEOPLASM_DISEASESTAGE', 'PATHOLOGY_T_STAGE', 'GENDER', 'KARNOFSKY_PERFORMANCE_SCORE', 'HISTOLOGICAL_TYPE', and 'YEAR_OF_TOBACCO_SMOKING_ONSET'.
-
amp_xp11.4 cnv correlated to 'NEOPLASM_DISEASESTAGE', 'PATHOLOGY_T_STAGE', 'GENDER', 'KARNOFSKY_PERFORMANCE_SCORE', 'HISTOLOGICAL_TYPE', and 'YEAR_OF_TOBACCO_SMOKING_ONSET'.
-
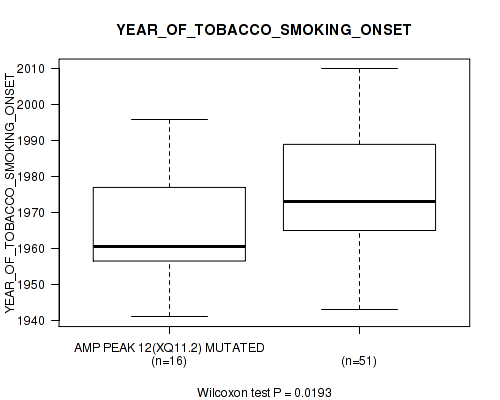
amp_xq11.2 cnv correlated to 'Time to Death', 'NEOPLASM_DISEASESTAGE', 'PATHOLOGY_T_STAGE', 'GENDER', 'KARNOFSKY_PERFORMANCE_SCORE', 'HISTOLOGICAL_TYPE', and 'YEAR_OF_TOBACCO_SMOKING_ONSET'.
-
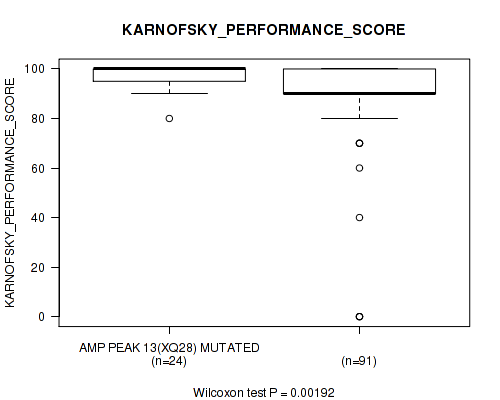
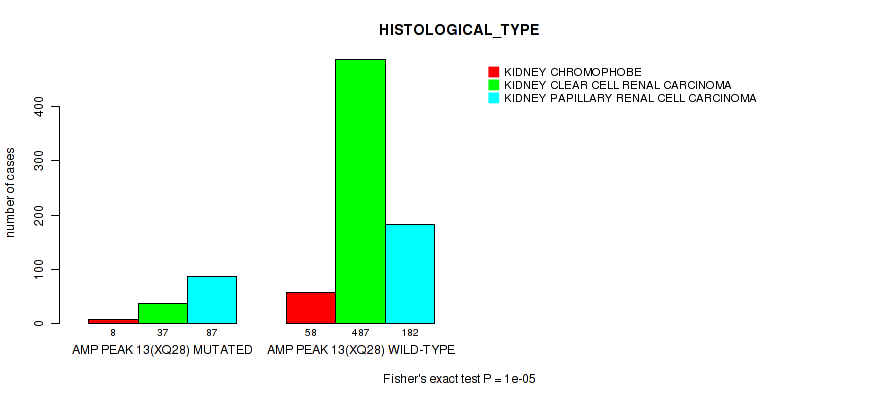
amp_xq28 cnv correlated to 'Time to Death', 'NEOPLASM_DISEASESTAGE', 'PATHOLOGY_T_STAGE', 'GENDER', 'KARNOFSKY_PERFORMANCE_SCORE', and 'HISTOLOGICAL_TYPE'.
-
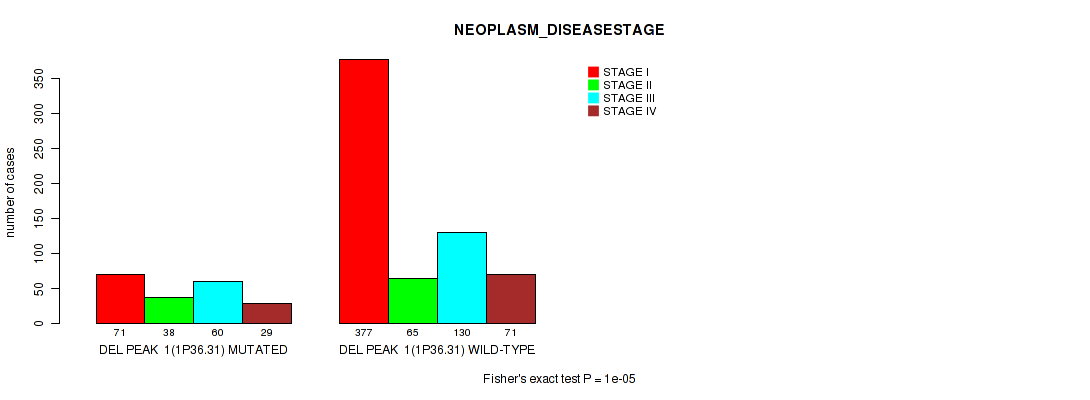
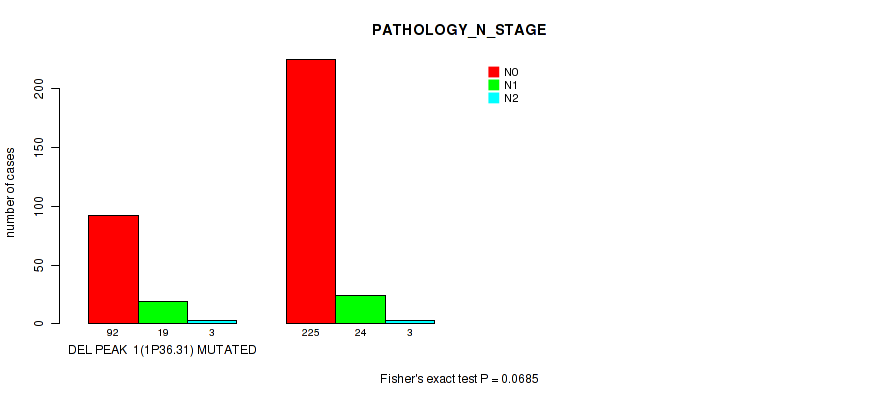
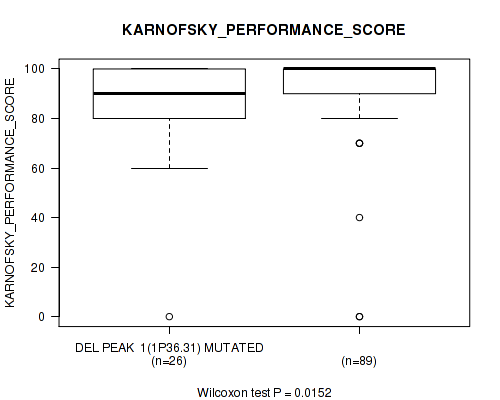
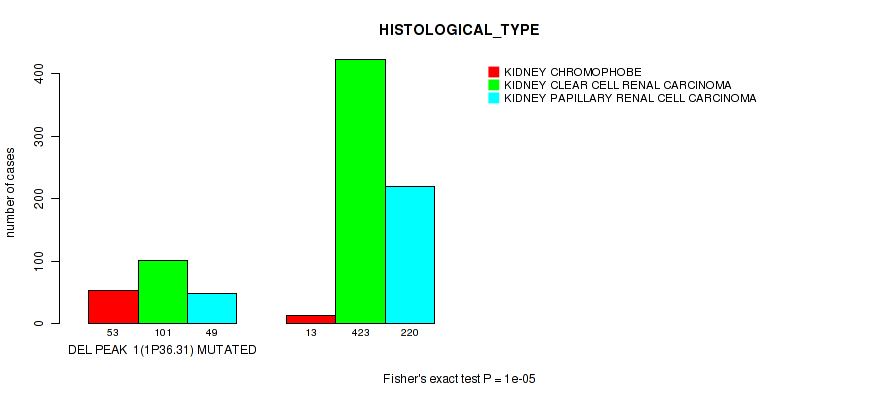
del_1p36.31 cnv correlated to 'YEARS_TO_BIRTH', 'NEOPLASM_DISEASESTAGE', 'PATHOLOGY_T_STAGE', 'PATHOLOGY_N_STAGE', 'KARNOFSKY_PERFORMANCE_SCORE', and 'HISTOLOGICAL_TYPE'.
-
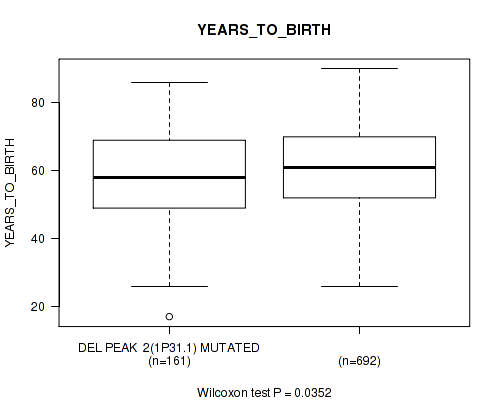
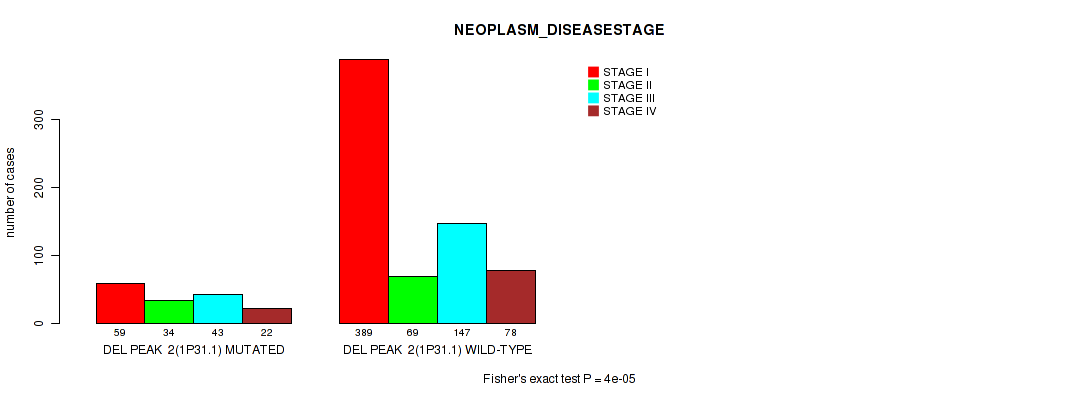
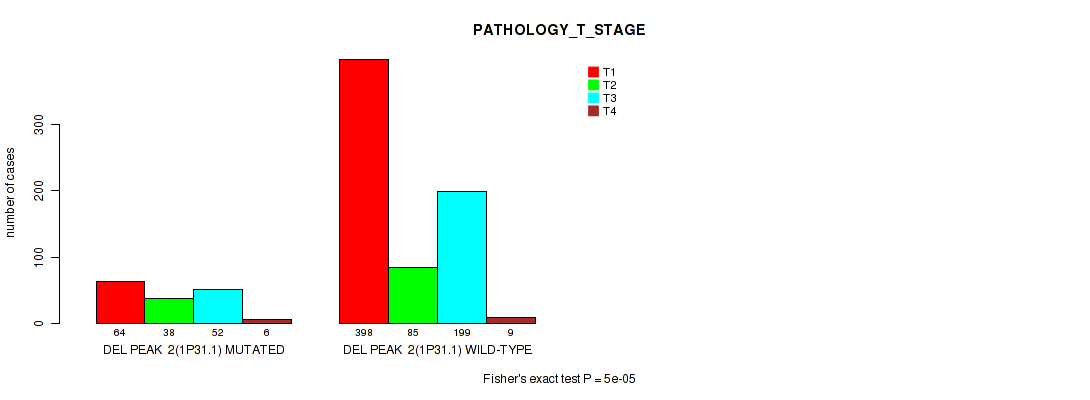
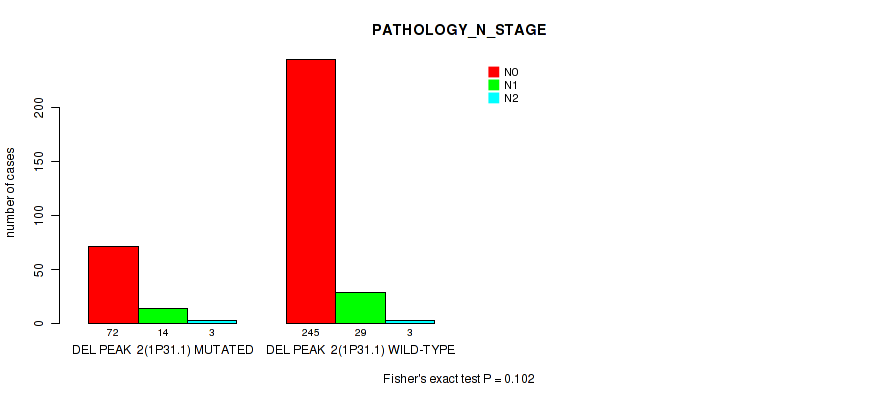
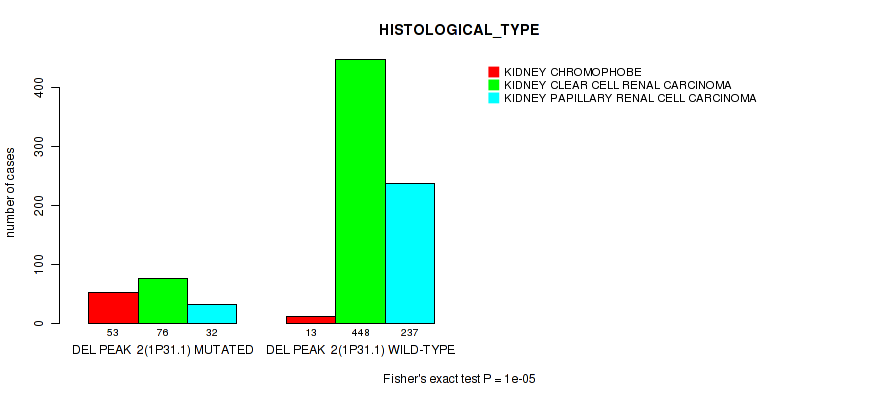
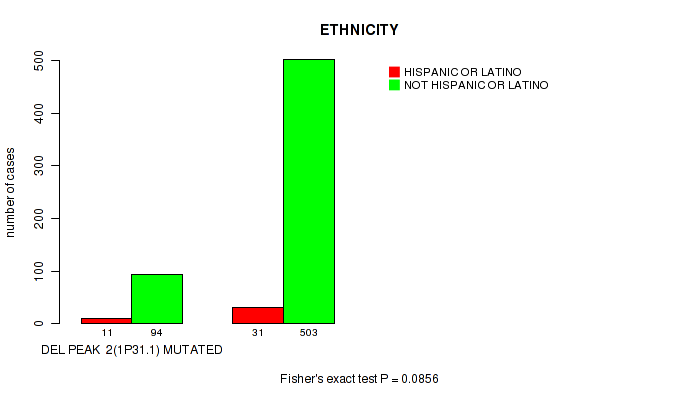
del_1p31.1 cnv correlated to 'YEARS_TO_BIRTH', 'NEOPLASM_DISEASESTAGE', 'PATHOLOGY_T_STAGE', 'PATHOLOGY_N_STAGE', 'HISTOLOGICAL_TYPE', and 'ETHNICITY'.
-
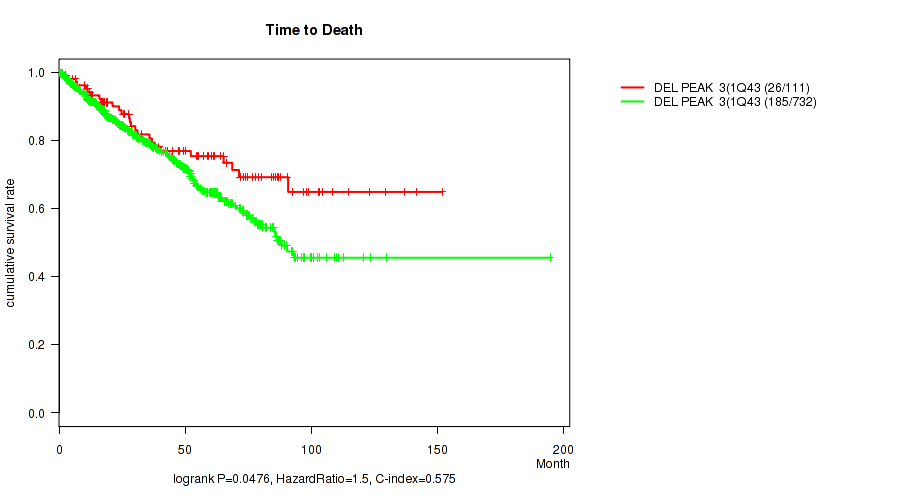
del_1q43 cnv correlated to 'Time to Death', 'YEARS_TO_BIRTH', 'NEOPLASM_DISEASESTAGE', 'PATHOLOGY_T_STAGE', and 'HISTOLOGICAL_TYPE'.
-
del_2q37.3 cnv correlated to 'Time to Death', 'YEARS_TO_BIRTH', 'NEOPLASM_DISEASESTAGE', 'PATHOLOGY_T_STAGE', 'PATHOLOGY_M_STAGE', and 'HISTOLOGICAL_TYPE'.
-
del_3p26.3 cnv correlated to 'Time to Death', 'NEOPLASM_DISEASESTAGE', 'PATHOLOGY_T_STAGE', 'PATHOLOGY_N_STAGE', 'GENDER', 'HISTOLOGICAL_TYPE', 'YEAR_OF_TOBACCO_SMOKING_ONSET', and 'RACE'.
-
del_3p21.2 cnv correlated to 'Time to Death', 'NEOPLASM_DISEASESTAGE', 'PATHOLOGY_T_STAGE', 'PATHOLOGY_N_STAGE', 'PATHOLOGY_M_STAGE', 'KARNOFSKY_PERFORMANCE_SCORE', 'HISTOLOGICAL_TYPE', 'YEAR_OF_TOBACCO_SMOKING_ONSET', and 'RACE'.
-
del_3p14.1 cnv correlated to 'Time to Death', 'NEOPLASM_DISEASESTAGE', 'PATHOLOGY_T_STAGE', 'HISTOLOGICAL_TYPE', 'YEAR_OF_TOBACCO_SMOKING_ONSET', and 'RACE'.
-
del_3p12.2 cnv correlated to 'Time to Death', 'NEOPLASM_DISEASESTAGE', 'PATHOLOGY_T_STAGE', 'GENDER', 'HISTOLOGICAL_TYPE', 'YEAR_OF_TOBACCO_SMOKING_ONSET', and 'RACE'.
-
del_4q34.3 cnv correlated to 'Time to Death', 'NEOPLASM_DISEASESTAGE', 'PATHOLOGY_T_STAGE', 'PATHOLOGY_N_STAGE', 'PATHOLOGY_M_STAGE', 'HISTOLOGICAL_TYPE', and 'RACE'.
-
del_5p15.33 cnv correlated to 'YEARS_TO_BIRTH', 'NEOPLASM_DISEASESTAGE', 'PATHOLOGY_T_STAGE', 'PATHOLOGY_N_STAGE', and 'HISTOLOGICAL_TYPE'.
-
del_6q22.31 cnv correlated to 'YEARS_TO_BIRTH', 'NEOPLASM_DISEASESTAGE', 'PATHOLOGY_T_STAGE', 'PATHOLOGY_N_STAGE', 'KARNOFSKY_PERFORMANCE_SCORE', 'HISTOLOGICAL_TYPE', and 'RACE'.
-
del_6q26 cnv correlated to 'NEOPLASM_DISEASESTAGE', 'PATHOLOGY_T_STAGE', 'PATHOLOGY_N_STAGE', 'KARNOFSKY_PERFORMANCE_SCORE', 'HISTOLOGICAL_TYPE', and 'RACE'.
-
del_6q26 cnv correlated to 'NEOPLASM_DISEASESTAGE', 'PATHOLOGY_T_STAGE', 'PATHOLOGY_N_STAGE', 'KARNOFSKY_PERFORMANCE_SCORE', 'HISTOLOGICAL_TYPE', and 'RACE'.
-
del_8p23.2 cnv correlated to 'Time to Death', 'NEOPLASM_DISEASESTAGE', 'PATHOLOGY_T_STAGE', 'PATHOLOGY_M_STAGE', 'HISTOLOGICAL_TYPE', and 'RACE'.
-
del_9p23 cnv correlated to 'Time to Death', 'YEARS_TO_BIRTH', 'NEOPLASM_DISEASESTAGE', 'PATHOLOGY_T_STAGE', 'PATHOLOGY_N_STAGE', 'PATHOLOGY_M_STAGE', 'KARNOFSKY_PERFORMANCE_SCORE', 'HISTOLOGICAL_TYPE', and 'RACE'.
-
del_9p21.3 cnv correlated to 'Time to Death', 'YEARS_TO_BIRTH', 'NEOPLASM_DISEASESTAGE', 'PATHOLOGY_T_STAGE', 'PATHOLOGY_N_STAGE', 'PATHOLOGY_M_STAGE', 'KARNOFSKY_PERFORMANCE_SCORE', 'HISTOLOGICAL_TYPE', and 'RACE'.
-
del_10q23.31 cnv correlated to 'YEARS_TO_BIRTH', 'NEOPLASM_DISEASESTAGE', 'PATHOLOGY_T_STAGE', 'HISTOLOGICAL_TYPE', and 'RACE'.
-
del_11q21 cnv correlated to 'Time to Death', 'YEARS_TO_BIRTH', 'NEOPLASM_DISEASESTAGE', 'PATHOLOGY_T_STAGE', 'PATHOLOGY_N_STAGE', 'PATHOLOGY_M_STAGE', 'KARNOFSKY_PERFORMANCE_SCORE', and 'HISTOLOGICAL_TYPE'.
-
del_11q23.1 cnv correlated to 'Time to Death', 'YEARS_TO_BIRTH', 'NEOPLASM_DISEASESTAGE', 'PATHOLOGY_T_STAGE', 'PATHOLOGY_N_STAGE', 'PATHOLOGY_M_STAGE', 'KARNOFSKY_PERFORMANCE_SCORE', and 'HISTOLOGICAL_TYPE'.
-
del_13q12.13 cnv correlated to 'Time to Death', 'YEARS_TO_BIRTH', 'NEOPLASM_DISEASESTAGE', 'PATHOLOGY_T_STAGE', 'PATHOLOGY_N_STAGE', 'GENDER', 'HISTOLOGICAL_TYPE', and 'RACE'.
-
del_13q14.2 cnv correlated to 'Time to Death', 'YEARS_TO_BIRTH', 'NEOPLASM_DISEASESTAGE', 'PATHOLOGY_T_STAGE', 'PATHOLOGY_N_STAGE', 'GENDER', 'HISTOLOGICAL_TYPE', and 'RACE'.
-
del_14q31.1 cnv correlated to 'Time to Death', 'YEARS_TO_BIRTH', 'NEOPLASM_DISEASESTAGE', 'PATHOLOGY_T_STAGE', 'PATHOLOGY_N_STAGE', 'PATHOLOGY_M_STAGE', 'KARNOFSKY_PERFORMANCE_SCORE', 'HISTOLOGICAL_TYPE', 'YEAR_OF_TOBACCO_SMOKING_ONSET', and 'RACE'.
-
del_16q23.3 cnv correlated to 'Time to Death', 'NEOPLASM_DISEASESTAGE', 'PATHOLOGY_T_STAGE', and 'PATHOLOGY_N_STAGE'.
-
del_18q22.2 cnv correlated to 'Time to Death', 'NEOPLASM_DISEASESTAGE', 'PATHOLOGY_T_STAGE', 'PATHOLOGY_N_STAGE', 'PATHOLOGY_M_STAGE', 'YEAR_OF_TOBACCO_SMOKING_ONSET', 'RACE', and 'ETHNICITY'.
-
del_19p13.3 cnv correlated to 'Time to Death', 'NEOPLASM_DISEASESTAGE', 'PATHOLOGY_T_STAGE', 'PATHOLOGY_N_STAGE', 'PATHOLOGY_M_STAGE', 'KARNOFSKY_PERFORMANCE_SCORE', and 'HISTOLOGICAL_TYPE'.
-
del_xp22.2 cnv correlated to 'YEARS_TO_BIRTH', 'NEOPLASM_DISEASESTAGE', 'PATHOLOGY_T_STAGE', 'PATHOLOGY_N_STAGE', and 'HISTOLOGICAL_TYPE'.
Table 1. Get Full Table Overview of the association between significant copy number variation of 39 focal events and 13 clinical features. Shown in the table are P values (Q values). Thresholded by Q value < 0.25, 253 significant findings detected.
|
Clinical Features |
Time to Death |
YEARS TO BIRTH |
NEOPLASM DISEASESTAGE |
PATHOLOGY T STAGE |
PATHOLOGY N STAGE |
PATHOLOGY M STAGE |
GENDER |
KARNOFSKY PERFORMANCE SCORE |
HISTOLOGICAL TYPE |
NUMBER PACK YEARS SMOKED |
YEAR OF TOBACCO SMOKING ONSET |
RACE | ETHNICITY | ||
| nCNV (%) | nWild-Type | logrank test | Wilcoxon-test | Fisher's exact test | Fisher's exact test | Fisher's exact test | Fisher's exact test | Fisher's exact test | Wilcoxon-test | Fisher's exact test | Wilcoxon-test | Wilcoxon-test | Fisher's exact test | Fisher's exact test | |
| del 14q31 1 | 274 (32%) | 585 |
8.67e-09 (8.79e-07) |
0.0799 (0.178) |
1e-05 (7.57e-05) |
1e-05 (7.57e-05) |
0.00205 (0.00829) |
4.84e-05 (0.000332) |
0.699 (0.819) |
0.0447 (0.111) |
1e-05 (7.57e-05) |
0.163 (0.305) |
0.00272 (0.0106) |
0.011 (0.0346) |
1 (1.00) |
| amp 8q24 22 | 121 (14%) | 738 |
0.00646 (0.0217) |
0.0485 (0.119) |
1e-05 (7.57e-05) |
1e-05 (7.57e-05) |
0.0615 (0.147) |
0.00979 (0.0312) |
0.533 (0.664) |
0.86 (0.932) |
0.00092 (0.0042) |
0.118 (0.237) |
0.149 (0.287) |
0.00454 (0.0162) |
1 (1.00) |
| del 3p21 2 | 499 (58%) | 360 |
7.97e-06 (7.57e-05) |
0.683 (0.803) |
1e-05 (7.57e-05) |
1e-05 (7.57e-05) |
0.0986 (0.208) |
0.0049 (0.017) |
0.143 (0.277) |
0.0596 (0.143) |
1e-05 (7.57e-05) |
0.194 (0.342) |
0.0343 (0.0893) |
1e-05 (7.57e-05) |
0.873 (0.936) |
| del 9p23 | 196 (23%) | 663 |
2.91e-11 (4.92e-09) |
0.0247 (0.068) |
1e-05 (7.57e-05) |
1e-05 (7.57e-05) |
0.00724 (0.0241) |
0.000223 (0.00121) |
0.301 (0.453) |
0.0204 (0.0586) |
1e-05 (7.57e-05) |
0.932 (0.966) |
0.525 (0.656) |
0.0126 (0.0389) |
0.704 (0.82) |
| del 9p21 3 | 207 (24%) | 652 |
1.12e-14 (5.69e-12) |
0.0358 (0.0915) |
1e-05 (7.57e-05) |
1e-05 (7.57e-05) |
0.00013 (0.000758) |
9.23e-06 (7.57e-05) |
0.177 (0.323) |
0.0401 (0.102) |
1e-05 (7.57e-05) |
0.932 (0.966) |
0.525 (0.656) |
0.00827 (0.0271) |
0.852 (0.927) |
| amp 17q25 2 | 232 (27%) | 627 |
0.592 (0.723) |
0.0619 (0.147) |
0.00052 (0.00251) |
0.003 (0.0114) |
0.00017 (0.000968) |
0.214 (0.366) |
0.000821 (0.00382) |
0.514 (0.651) |
1e-05 (7.57e-05) |
0.987 (1.00) |
0.0926 (0.197) |
0.0121 (0.0379) |
0.228 (0.38) |
| del 3p26 3 | 486 (57%) | 373 |
0.00113 (0.00513) |
0.786 (0.884) |
1e-05 (7.57e-05) |
2e-05 (0.000149) |
0.00885 (0.0288) |
0.133 (0.261) |
0.0684 (0.159) |
0.151 (0.288) |
1e-05 (7.57e-05) |
0.43 (0.59) |
0.0786 (0.175) |
1e-05 (7.57e-05) |
0.267 (0.423) |
| del 11q21 | 60 (7%) | 799 |
0.00196 (0.0082) |
0.00478 (0.0167) |
0.00026 (0.00136) |
0.00041 (0.00206) |
0.00019 (0.00106) |
0.0998 (0.209) |
0.671 (0.793) |
0.0624 (0.147) |
0.00304 (0.0114) |
0.46 (0.619) |
0.886 (0.941) |
0.418 (0.578) |
0.349 (0.504) |
| del 11q23 1 | 70 (8%) | 789 |
0.00373 (0.0136) |
0.00293 (0.0112) |
3e-05 (0.000214) |
1e-05 (7.57e-05) |
0.00047 (0.00229) |
0.112 (0.228) |
0.428 (0.59) |
0.0253 (0.0686) |
0.00361 (0.0134) |
0.669 (0.793) |
0.927 (0.965) |
0.27 (0.426) |
0.242 (0.397) |
| del 13q12 13 | 148 (17%) | 711 |
0.0323 (0.0845) |
0.000423 (0.0021) |
1e-05 (7.57e-05) |
1e-05 (7.57e-05) |
0.0135 (0.041) |
0.228 (0.38) |
0.0212 (0.0604) |
0.316 (0.47) |
1e-05 (7.57e-05) |
0.751 (0.854) |
0.278 (0.432) |
0.103 (0.213) |
0.377 (0.539) |
| del 13q14 2 | 148 (17%) | 711 |
0.0241 (0.0666) |
8.11e-05 (0.000501) |
1e-05 (7.57e-05) |
1e-05 (7.57e-05) |
0.015 (0.0449) |
0.132 (0.261) |
0.0125 (0.0389) |
0.379 (0.541) |
1e-05 (7.57e-05) |
0.914 (0.955) |
0.249 (0.407) |
0.104 (0.214) |
0.66 (0.791) |
| del 18q22 2 | 152 (18%) | 707 |
6.48e-07 (5.47e-05) |
0.619 (0.749) |
1e-05 (7.57e-05) |
1e-05 (7.57e-05) |
0.0213 (0.0604) |
0.00917 (0.0294) |
1 (1.00) |
0.56 (0.693) |
0.318 (0.472) |
0.513 (0.651) |
0.117 (0.236) |
0.0746 (0.171) |
0.0894 (0.192) |
| amp 1q32 1 | 81 (9%) | 778 |
0.000273 (0.00141) |
0.0313 (0.0827) |
3e-05 (0.000214) |
0.00019 (0.00106) |
0.0705 (0.163) |
0.137 (0.269) |
0.623 (0.752) |
0.297 (0.45) |
0.00282 (0.0108) |
0.336 (0.491) |
0.101 (0.212) |
0.149 (0.287) |
0.259 (0.415) |
| amp xq11 2 | 128 (15%) | 731 |
0.0918 (0.196) |
0.468 (0.62) |
0.00471 (0.0167) |
0.00788 (0.0259) |
0.894 (0.945) |
0.564 (0.695) |
0.000237 (0.00127) |
0.0254 (0.0686) |
1e-05 (7.57e-05) |
0.742 (0.847) |
0.0193 (0.0556) |
0.184 (0.335) |
0.661 (0.791) |
| del 3p12 2 | 334 (39%) | 525 |
0.00116 (0.00521) |
0.813 (0.902) |
0.0127 (0.039) |
0.00642 (0.0217) |
0.515 (0.651) |
0.731 (0.841) |
0.0884 (0.191) |
0.774 (0.874) |
1e-05 (7.57e-05) |
0.233 (0.385) |
0.0826 (0.182) |
0.00473 (0.0167) |
0.741 (0.847) |
| del 4q34 3 | 111 (13%) | 748 |
7.22e-09 (8.79e-07) |
0.671 (0.793) |
1e-05 (7.57e-05) |
1e-05 (7.57e-05) |
0.0109 (0.0346) |
0.0143 (0.043) |
0.83 (0.911) |
0.885 (0.941) |
0.0318 (0.0836) |
0.401 (0.561) |
0.665 (0.793) |
0.0647 (0.151) |
0.482 (0.634) |
| del 6q22 31 | 225 (26%) | 634 |
0.383 (0.543) |
0.124 (0.248) |
0.00013 (0.000758) |
4e-05 (0.000278) |
0.0357 (0.0915) |
1 (1.00) |
0.681 (0.803) |
0.107 (0.219) |
1e-05 (7.57e-05) |
0.206 (0.356) |
0.22 (0.372) |
0.00221 (0.00882) |
0.263 (0.42) |
| del 19p13 3 | 40 (5%) | 819 |
8.5e-12 (2.16e-09) |
0.443 (0.601) |
6e-05 (0.00038) |
1e-05 (7.57e-05) |
0.00022 (0.00121) |
0.064 (0.15) |
0.864 (0.934) |
0.0779 (0.175) |
0.0287 (0.0763) |
0.464 (0.62) |
0.334 (0.49) |
0.716 (0.829) |
|
| amp 3q26 32 | 185 (22%) | 674 |
0.414 (0.574) |
0.116 (0.236) |
0.21 (0.361) |
0.185 (0.336) |
0.0217 (0.061) |
0.00735 (0.0244) |
0.187 (0.337) |
0.107 (0.219) |
1e-05 (7.57e-05) |
0.38 (0.541) |
0.262 (0.419) |
0.0571 (0.138) |
0.704 (0.82) |
| amp 5q35 1 | 372 (43%) | 487 |
0.189 (0.338) |
0.129 (0.256) |
0.00012 (0.000724) |
0.00911 (0.0294) |
0.0235 (0.0656) |
0.0161 (0.0467) |
0.307 (0.459) |
0.514 (0.651) |
1e-05 (7.57e-05) |
0.431 (0.59) |
0.274 (0.428) |
3e-05 (0.000214) |
0.873 (0.936) |
| amp xp22 2 | 121 (14%) | 738 |
0.269 (0.425) |
0.392 (0.552) |
0.0233 (0.0654) |
0.0759 (0.173) |
0.896 (0.945) |
0.252 (0.409) |
0.00494 (0.017) |
0.0254 (0.0686) |
1e-05 (7.57e-05) |
0.826 (0.91) |
0.044 (0.11) |
0.32 (0.474) |
0.821 (0.907) |
| amp xp11 4 | 129 (15%) | 730 |
0.236 (0.388) |
0.28 (0.434) |
0.00376 (0.0136) |
0.0259 (0.069) |
0.897 (0.945) |
0.133 (0.261) |
0.000532 (0.00254) |
0.0254 (0.0686) |
1e-05 (7.57e-05) |
0.832 (0.911) |
0.0579 (0.139) |
0.251 (0.408) |
0.522 (0.656) |
| amp xq28 | 132 (15%) | 727 |
0.0777 (0.175) |
0.46 (0.619) |
0.0369 (0.094) |
0.0412 (0.104) |
0.908 (0.953) |
0.466 (0.62) |
0.016 (0.0465) |
0.00192 (0.00811) |
1e-05 (7.57e-05) |
0.855 (0.928) |
0.267 (0.423) |
0.162 (0.304) |
0.282 (0.435) |
| del 1p36 31 | 203 (24%) | 656 |
0.396 (0.556) |
0.0774 (0.175) |
1e-05 (7.57e-05) |
1e-05 (7.57e-05) |
0.0685 (0.159) |
0.502 (0.645) |
0.496 (0.643) |
0.0152 (0.045) |
1e-05 (7.57e-05) |
0.344 (0.499) |
0.327 (0.482) |
0.603 (0.732) |
0.335 (0.49) |
| del 1p31 1 | 161 (19%) | 698 |
0.511 (0.651) |
0.0352 (0.091) |
4e-05 (0.000278) |
5e-05 (0.000334) |
0.102 (0.213) |
0.885 (0.941) |
1 (1.00) |
0.229 (0.38) |
1e-05 (7.57e-05) |
0.473 (0.623) |
0.699 (0.819) |
0.397 (0.556) |
0.0856 (0.186) |
| del 2q37 3 | 110 (13%) | 749 |
0.0153 (0.0451) |
0.00203 (0.00829) |
1e-05 (7.57e-05) |
1e-05 (7.57e-05) |
0.282 (0.435) |
0.0853 (0.186) |
0.516 (0.651) |
0.955 (0.986) |
1e-05 (7.57e-05) |
0.559 (0.692) |
0.866 (0.934) |
0.494 (0.642) |
1 (1.00) |
| del 3p14 1 | 405 (47%) | 454 |
0.00206 (0.00829) |
0.91 (0.953) |
0.00023 (0.00124) |
6e-05 (0.00038) |
0.219 (0.372) |
0.565 (0.695) |
0.192 (0.341) |
0.286 (0.438) |
1e-05 (7.57e-05) |
0.34 (0.496) |
0.055 (0.133) |
0.00013 (0.000758) |
0.75 (0.854) |
| del 6q26 | 230 (27%) | 629 |
0.302 (0.453) |
0.187 (0.337) |
6e-05 (0.00038) |
5e-05 (0.000334) |
0.0548 (0.133) |
1 (1.00) |
0.624 (0.752) |
0.086 (0.186) |
1e-05 (7.57e-05) |
0.206 (0.356) |
0.22 (0.372) |
0.00126 (0.0056) |
0.191 (0.34) |
| del 6q26 | 231 (27%) | 628 |
0.298 (0.45) |
0.193 (0.341) |
8e-05 (0.000501) |
6e-05 (0.00038) |
0.0549 (0.133) |
1 (1.00) |
0.807 (0.899) |
0.086 (0.186) |
1e-05 (7.57e-05) |
0.206 (0.356) |
0.22 (0.372) |
0.00323 (0.012) |
0.192 (0.341) |
| del 8p23 2 | 181 (21%) | 678 |
0.000909 (0.00419) |
0.501 (0.645) |
0.00201 (0.00829) |
0.00183 (0.0078) |
0.47 (0.62) |
0.0257 (0.0689) |
0.791 (0.887) |
0.434 (0.593) |
1e-05 (7.57e-05) |
0.491 (0.64) |
0.524 (0.656) |
0.00376 (0.0136) |
0.156 (0.295) |
| amp 7q31 2 | 364 (42%) | 495 |
0.91 (0.953) |
0.376 (0.539) |
0.0134 (0.041) |
0.793 (0.887) |
0.228 (0.38) |
0.00198 (0.00821) |
7.63e-06 (7.57e-05) |
0.292 (0.445) |
1e-05 (7.57e-05) |
0.411 (0.571) |
0.0146 (0.0439) |
0.186 (0.337) |
0.259 (0.415) |
| del 1q43 | 112 (13%) | 747 |
0.0476 (0.118) |
0.00276 (0.0107) |
0.00037 (0.00188) |
0.00154 (0.00662) |
0.275 (0.429) |
0.17 (0.314) |
0.164 (0.305) |
0.139 (0.272) |
1e-05 (7.57e-05) |
0.831 (0.911) |
0.601 (0.731) |
0.226 (0.38) |
0.146 (0.282) |
| del 5p15 33 | 31 (4%) | 828 |
0.948 (0.981) |
0.00445 (0.016) |
0.00148 (0.00647) |
0.00057 (0.0027) |
0.00573 (0.0196) |
0.741 (0.847) |
0.176 (0.323) |
0.777 (0.875) |
1e-05 (7.57e-05) |
0.469 (0.62) |
0.253 (0.41) |
0.575 (0.706) |
0.154 (0.291) |
| del 10q23 31 | 162 (19%) | 697 |
0.707 (0.822) |
0.0425 (0.107) |
1e-05 (7.57e-05) |
1e-05 (7.57e-05) |
0.341 (0.496) |
0.888 (0.941) |
0.713 (0.827) |
0.283 (0.435) |
1e-05 (7.57e-05) |
0.214 (0.366) |
0.223 (0.375) |
0.0994 (0.209) |
0.385 (0.544) |
| del xp22 2 | 123 (14%) | 736 |
0.918 (0.958) |
0.00136 (0.006) |
0.0001 (0.000611) |
0.00025 (0.00132) |
0.0948 (0.201) |
0.867 (0.934) |
0.538 (0.668) |
0.718 (0.829) |
1e-05 (7.57e-05) |
0.813 (0.902) |
0.291 (0.445) |
0.152 (0.289) |
0.46 (0.619) |
| amp 19p13 2 | 97 (11%) | 762 |
0.957 (0.986) |
0.436 (0.594) |
0.00152 (0.00659) |
0.00247 (0.00978) |
0.593 (0.723) |
0.0156 (0.0456) |
0.17 (0.314) |
0.301 (0.453) |
0.00034 (0.00174) |
0.404 (0.563) |
0.768 (0.87) |
0.507 (0.651) |
0.803 (0.897) |
| del 16q23 3 | 36 (4%) | 823 |
9.39e-06 (7.57e-05) |
0.724 (0.834) |
0.00647 (0.0217) |
0.00014 (0.000807) |
0.00046 (0.00226) |
0.353 (0.508) |
1 (1.00) |
0.489 (0.64) |
0.151 (0.288) |
0.168 (0.313) |
0.82 (0.907) |
0.439 (0.596) |
1 (1.00) |
| amp 2q32 1 | 133 (15%) | 726 |
0.843 (0.921) |
0.205 (0.356) |
0.257 (0.414) |
0.385 (0.544) |
0.0752 (0.172) |
0.876 (0.937) |
0.273 (0.428) |
0.467 (0.62) |
0.00253 (0.00994) |
0.85 (0.927) |
0.461 (0.619) |
0.491 (0.64) |
0.656 (0.788) |
| amp 10p14 | 33 (4%) | 826 |
0.67 (0.793) |
0.311 (0.463) |
0.126 (0.252) |
0.00061 (0.00286) |
0.0809 (0.179) |
0.576 (0.706) |
1 (1.00) |
0.497 (0.643) |
0.514 (0.651) |
0.764 (0.866) |
0.2 (0.351) |
1 (1.00) |
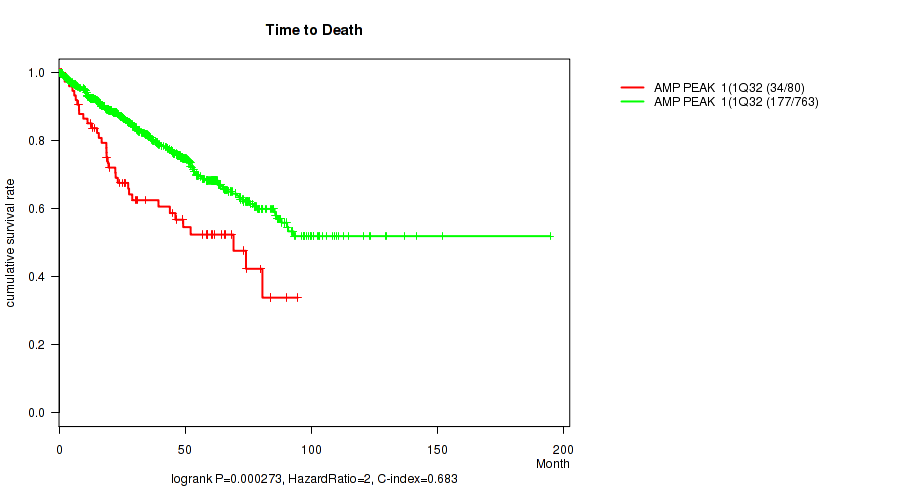
P value = 0.000273 (logrank test), Q value = 0.0014
Table S1. Gene #1: 'amp_1q32.1' versus Clinical Feature #1: 'Time to Death'
| nPatients | nDeath | Duration Range (Median), Month | |
|---|---|---|---|
| ALL | 843 | 211 | 0.1 - 194.8 (30.5) |
| AMP PEAK 1(1Q32.1) MUTATED | 80 | 34 | 0.4 - 94.7 (26.8) |
| AMP PEAK 1(1Q32.1) WILD-TYPE | 763 | 177 | 0.1 - 194.8 (30.7) |
Figure S1. Get High-res Image Gene #1: 'amp_1q32.1' versus Clinical Feature #1: 'Time to Death'
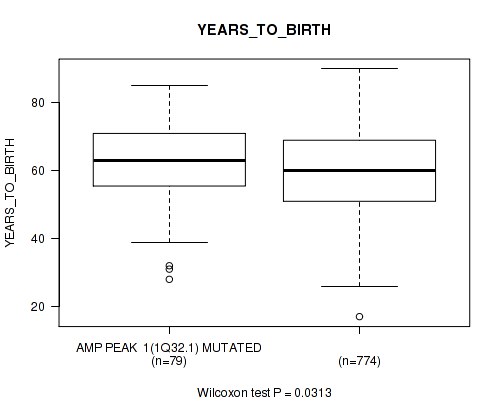
P value = 0.0313 (Wilcoxon-test), Q value = 0.083
Table S2. Gene #1: 'amp_1q32.1' versus Clinical Feature #2: 'YEARS_TO_BIRTH'
| nPatients | Mean (Std.Dev) | |
|---|---|---|
| ALL | 853 | 60.1 (12.6) |
| AMP PEAK 1(1Q32.1) MUTATED | 79 | 62.5 (12.2) |
| AMP PEAK 1(1Q32.1) WILD-TYPE | 774 | 59.9 (12.6) |
Figure S2. Get High-res Image Gene #1: 'amp_1q32.1' versus Clinical Feature #2: 'YEARS_TO_BIRTH'
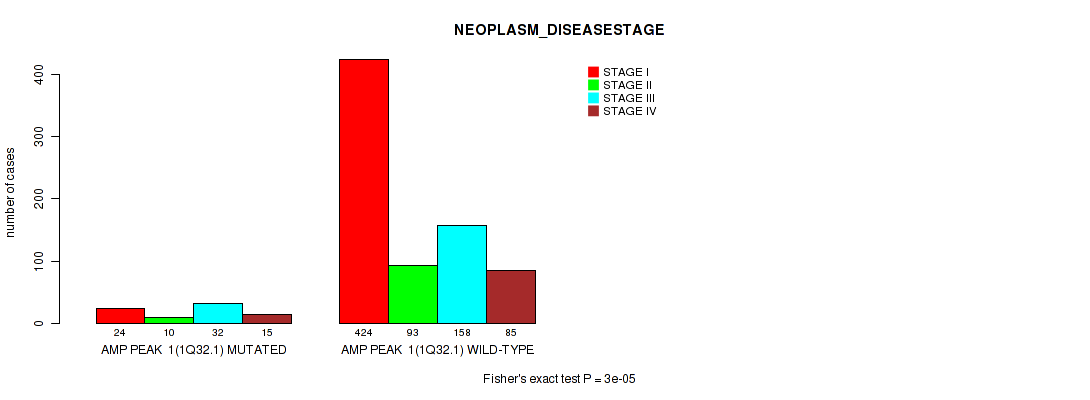
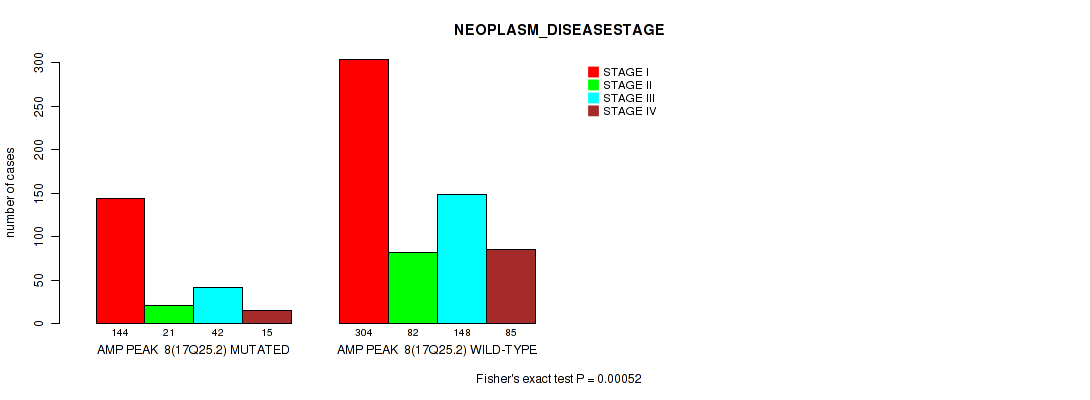
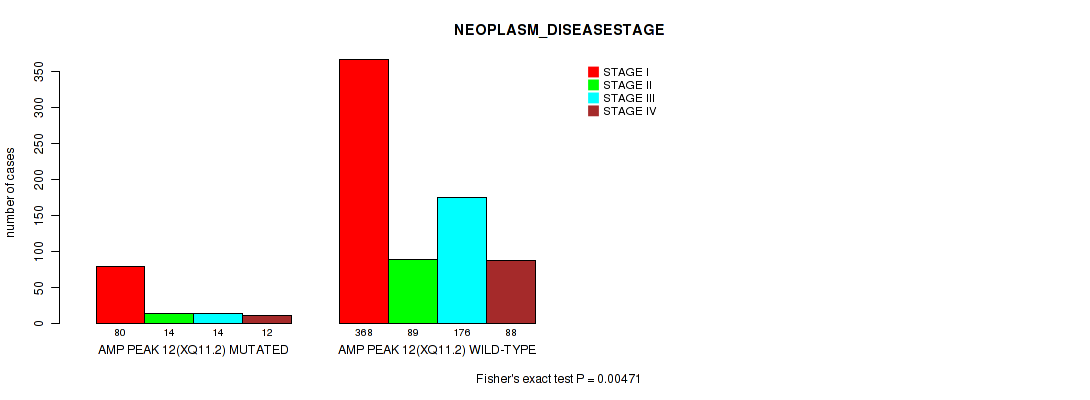
P value = 3e-05 (Fisher's exact test), Q value = 0.00021
Table S3. Gene #1: 'amp_1q32.1' versus Clinical Feature #3: 'NEOPLASM_DISEASESTAGE'
| nPatients | STAGE I | STAGE II | STAGE III | STAGE IV |
|---|---|---|---|---|
| ALL | 448 | 103 | 190 | 100 |
| AMP PEAK 1(1Q32.1) MUTATED | 24 | 10 | 32 | 15 |
| AMP PEAK 1(1Q32.1) WILD-TYPE | 424 | 93 | 158 | 85 |
Figure S3. Get High-res Image Gene #1: 'amp_1q32.1' versus Clinical Feature #3: 'NEOPLASM_DISEASESTAGE'
P value = 0.00019 (Fisher's exact test), Q value = 0.0011
Table S4. Gene #1: 'amp_1q32.1' versus Clinical Feature #4: 'PATHOLOGY_T_STAGE'
| nPatients | T1 | T2 | T3 | T4 |
|---|---|---|---|---|
| ALL | 462 | 123 | 251 | 15 |
| AMP PEAK 1(1Q32.1) MUTATED | 27 | 12 | 41 | 1 |
| AMP PEAK 1(1Q32.1) WILD-TYPE | 435 | 111 | 210 | 14 |
Figure S4. Get High-res Image Gene #1: 'amp_1q32.1' versus Clinical Feature #4: 'PATHOLOGY_T_STAGE'

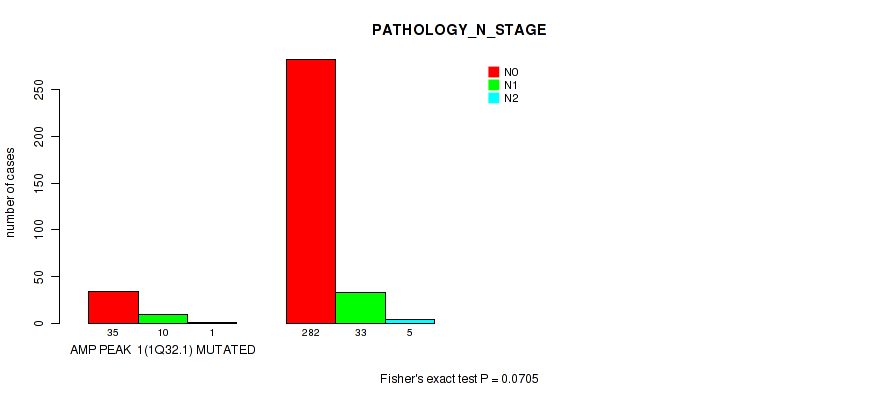
P value = 0.0705 (Fisher's exact test), Q value = 0.16
Table S5. Gene #1: 'amp_1q32.1' versus Clinical Feature #5: 'PATHOLOGY_N_STAGE'
| nPatients | N0 | N1 | N2 |
|---|---|---|---|
| ALL | 317 | 43 | 6 |
| AMP PEAK 1(1Q32.1) MUTATED | 35 | 10 | 1 |
| AMP PEAK 1(1Q32.1) WILD-TYPE | 282 | 33 | 5 |
Figure S5. Get High-res Image Gene #1: 'amp_1q32.1' versus Clinical Feature #5: 'PATHOLOGY_N_STAGE'
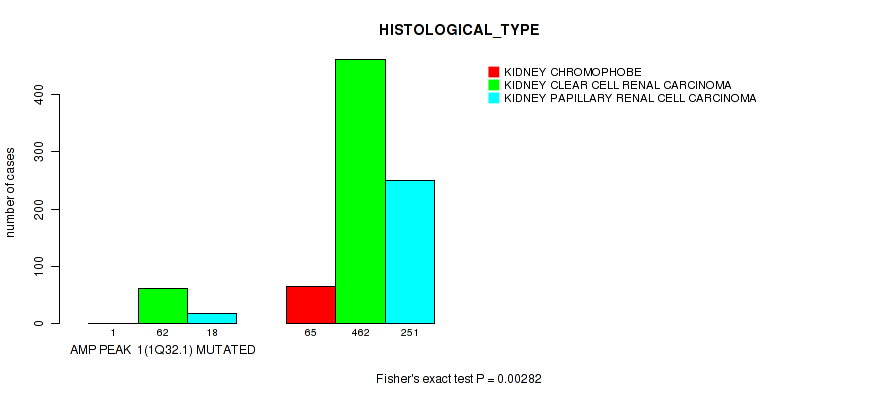
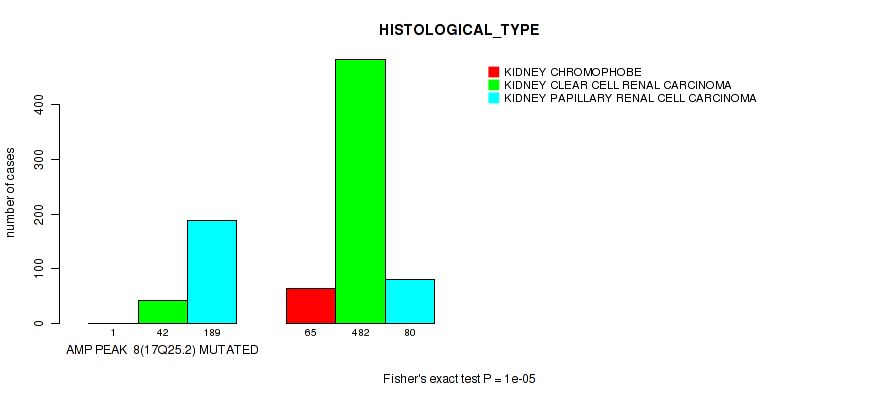
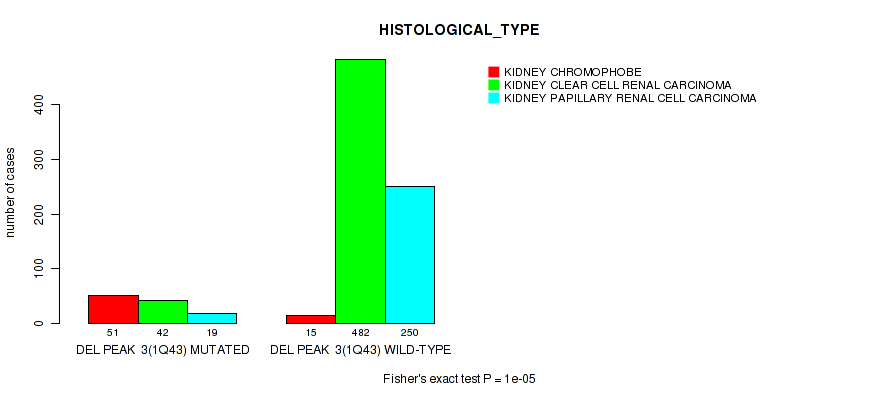
P value = 0.00282 (Fisher's exact test), Q value = 0.011
Table S6. Gene #1: 'amp_1q32.1' versus Clinical Feature #9: 'HISTOLOGICAL_TYPE'
| nPatients | KIDNEY CHROMOPHOBE | KIDNEY CLEAR CELL RENAL CARCINOMA | KIDNEY PAPILLARY RENAL CELL CARCINOMA |
|---|---|---|---|
| ALL | 66 | 524 | 269 |
| AMP PEAK 1(1Q32.1) MUTATED | 1 | 62 | 18 |
| AMP PEAK 1(1Q32.1) WILD-TYPE | 65 | 462 | 251 |
Figure S6. Get High-res Image Gene #1: 'amp_1q32.1' versus Clinical Feature #9: 'HISTOLOGICAL_TYPE'
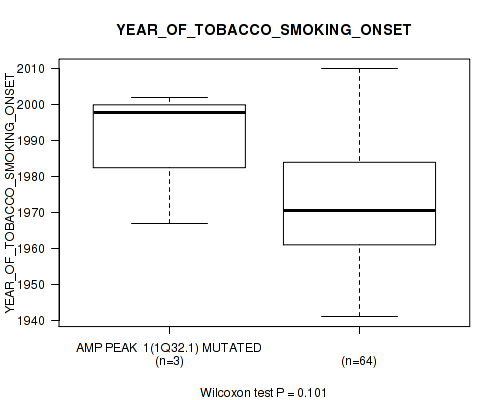
P value = 0.101 (Wilcoxon-test), Q value = 0.21
Table S7. Gene #1: 'amp_1q32.1' versus Clinical Feature #11: 'YEAR_OF_TOBACCO_SMOKING_ONSET'
| nPatients | Mean (Std.Dev) | |
|---|---|---|
| ALL | 67 | 1973.4 (16.4) |
| AMP PEAK 1(1Q32.1) MUTATED | 3 | 1989.0 (19.2) |
| AMP PEAK 1(1Q32.1) WILD-TYPE | 64 | 1972.7 (16.1) |
Figure S7. Get High-res Image Gene #1: 'amp_1q32.1' versus Clinical Feature #11: 'YEAR_OF_TOBACCO_SMOKING_ONSET'
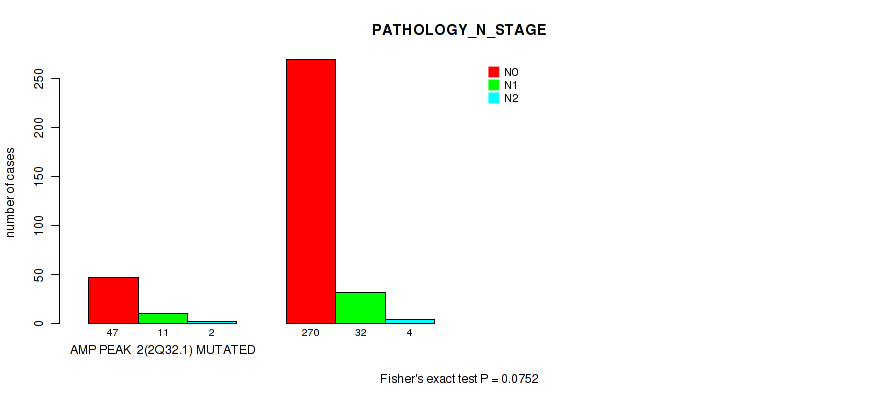
P value = 0.0752 (Fisher's exact test), Q value = 0.17
Table S8. Gene #2: 'amp_2q32.1' versus Clinical Feature #5: 'PATHOLOGY_N_STAGE'
| nPatients | N0 | N1 | N2 |
|---|---|---|---|
| ALL | 317 | 43 | 6 |
| AMP PEAK 2(2Q32.1) MUTATED | 47 | 11 | 2 |
| AMP PEAK 2(2Q32.1) WILD-TYPE | 270 | 32 | 4 |
Figure S8. Get High-res Image Gene #2: 'amp_2q32.1' versus Clinical Feature #5: 'PATHOLOGY_N_STAGE'
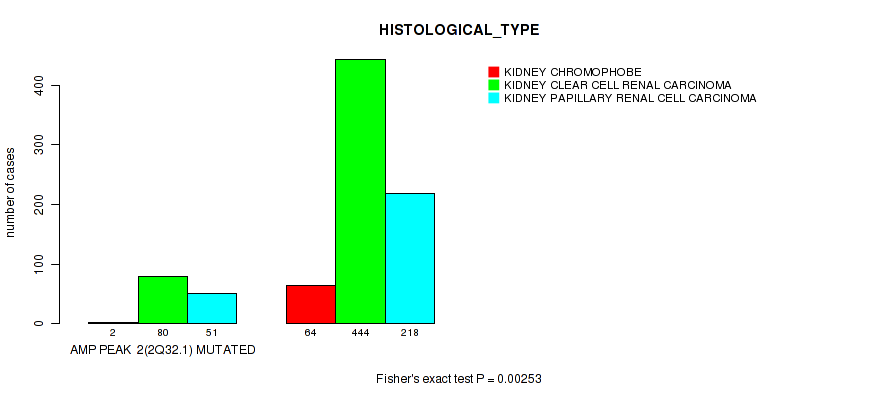
P value = 0.00253 (Fisher's exact test), Q value = 0.0099
Table S9. Gene #2: 'amp_2q32.1' versus Clinical Feature #9: 'HISTOLOGICAL_TYPE'
| nPatients | KIDNEY CHROMOPHOBE | KIDNEY CLEAR CELL RENAL CARCINOMA | KIDNEY PAPILLARY RENAL CELL CARCINOMA |
|---|---|---|---|
| ALL | 66 | 524 | 269 |
| AMP PEAK 2(2Q32.1) MUTATED | 2 | 80 | 51 |
| AMP PEAK 2(2Q32.1) WILD-TYPE | 64 | 444 | 218 |
Figure S9. Get High-res Image Gene #2: 'amp_2q32.1' versus Clinical Feature #9: 'HISTOLOGICAL_TYPE'
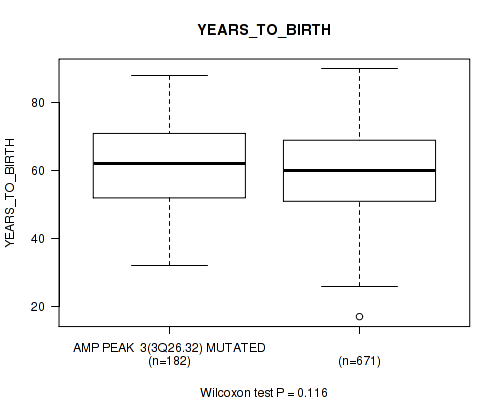
P value = 0.116 (Wilcoxon-test), Q value = 0.24
Table S10. Gene #3: 'amp_3q26.32' versus Clinical Feature #2: 'YEARS_TO_BIRTH'
| nPatients | Mean (Std.Dev) | |
|---|---|---|
| ALL | 853 | 60.1 (12.6) |
| AMP PEAK 3(3Q26.32) MUTATED | 182 | 61.5 (12.1) |
| AMP PEAK 3(3Q26.32) WILD-TYPE | 671 | 59.7 (12.7) |
Figure S10. Get High-res Image Gene #3: 'amp_3q26.32' versus Clinical Feature #2: 'YEARS_TO_BIRTH'
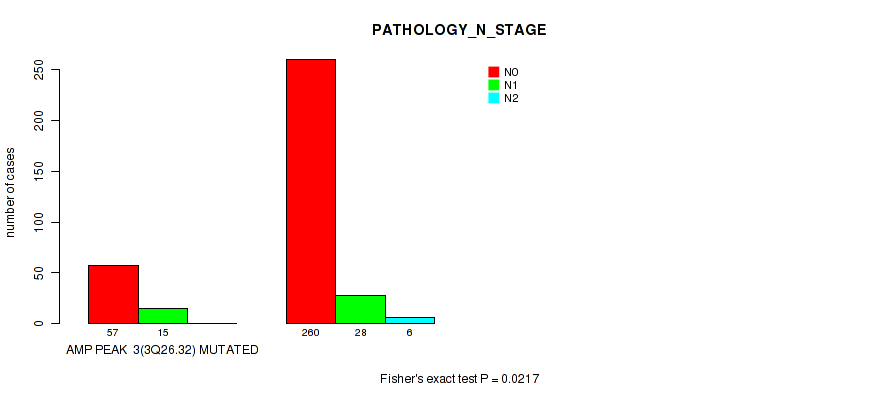
P value = 0.0217 (Fisher's exact test), Q value = 0.061
Table S11. Gene #3: 'amp_3q26.32' versus Clinical Feature #5: 'PATHOLOGY_N_STAGE'
| nPatients | N0 | N1 | N2 |
|---|---|---|---|
| ALL | 317 | 43 | 6 |
| AMP PEAK 3(3Q26.32) MUTATED | 57 | 15 | 0 |
| AMP PEAK 3(3Q26.32) WILD-TYPE | 260 | 28 | 6 |
Figure S11. Get High-res Image Gene #3: 'amp_3q26.32' versus Clinical Feature #5: 'PATHOLOGY_N_STAGE'
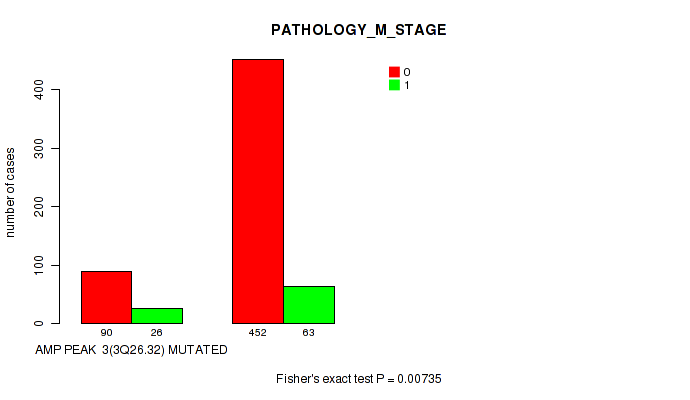
P value = 0.00735 (Fisher's exact test), Q value = 0.024
Table S12. Gene #3: 'amp_3q26.32' versus Clinical Feature #6: 'PATHOLOGY_M_STAGE'
| nPatients | 0 | 1 |
|---|---|---|
| ALL | 542 | 89 |
| AMP PEAK 3(3Q26.32) MUTATED | 90 | 26 |
| AMP PEAK 3(3Q26.32) WILD-TYPE | 452 | 63 |
Figure S12. Get High-res Image Gene #3: 'amp_3q26.32' versus Clinical Feature #6: 'PATHOLOGY_M_STAGE'
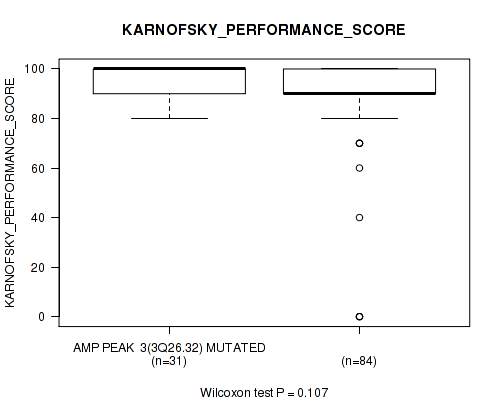
P value = 0.107 (Wilcoxon-test), Q value = 0.22
Table S13. Gene #3: 'amp_3q26.32' versus Clinical Feature #8: 'KARNOFSKY_PERFORMANCE_SCORE'
| nPatients | Mean (Std.Dev) | |
|---|---|---|
| ALL | 115 | 90.3 (17.6) |
| AMP PEAK 3(3Q26.32) MUTATED | 31 | 94.8 (6.8) |
| AMP PEAK 3(3Q26.32) WILD-TYPE | 84 | 88.6 (19.9) |
Figure S13. Get High-res Image Gene #3: 'amp_3q26.32' versus Clinical Feature #8: 'KARNOFSKY_PERFORMANCE_SCORE'
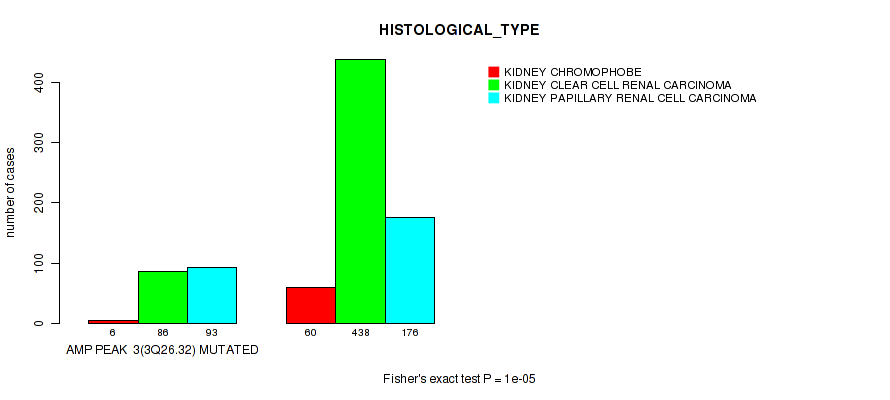
P value = 1e-05 (Fisher's exact test), Q value = 7.6e-05
Table S14. Gene #3: 'amp_3q26.32' versus Clinical Feature #9: 'HISTOLOGICAL_TYPE'
| nPatients | KIDNEY CHROMOPHOBE | KIDNEY CLEAR CELL RENAL CARCINOMA | KIDNEY PAPILLARY RENAL CELL CARCINOMA |
|---|---|---|---|
| ALL | 66 | 524 | 269 |
| AMP PEAK 3(3Q26.32) MUTATED | 6 | 86 | 93 |
| AMP PEAK 3(3Q26.32) WILD-TYPE | 60 | 438 | 176 |
Figure S14. Get High-res Image Gene #3: 'amp_3q26.32' versus Clinical Feature #9: 'HISTOLOGICAL_TYPE'
P value = 0.0571 (Fisher's exact test), Q value = 0.14
Table S15. Gene #3: 'amp_3q26.32' versus Clinical Feature #12: 'RACE'
| nPatients | AMERICAN INDIAN OR ALASKA NATIVE | ASIAN | BLACK OR AFRICAN AMERICAN | WHITE |
|---|---|---|---|---|
| ALL | 2 | 15 | 116 | 702 |
| AMP PEAK 3(3Q26.32) MUTATED | 2 | 1 | 24 | 149 |
| AMP PEAK 3(3Q26.32) WILD-TYPE | 0 | 14 | 92 | 553 |
Figure S15. Get High-res Image Gene #3: 'amp_3q26.32' versus Clinical Feature #12: 'RACE'

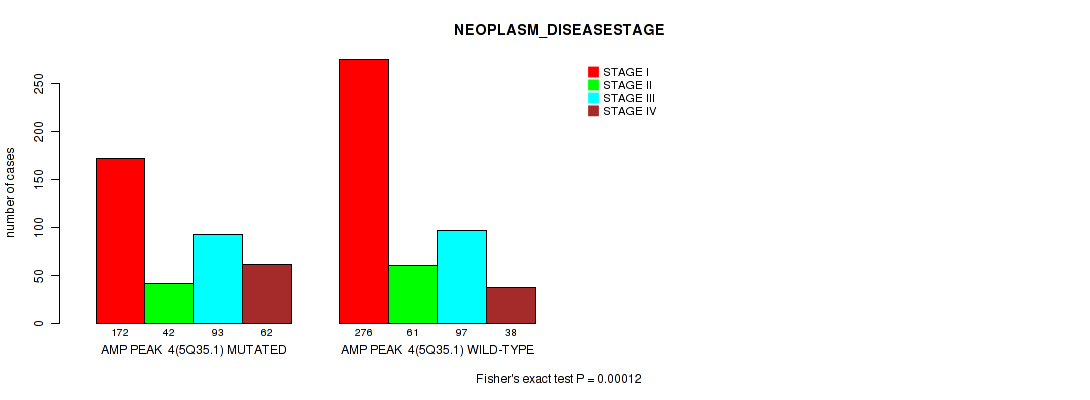
P value = 0.00012 (Fisher's exact test), Q value = 0.00072
Table S16. Gene #4: 'amp_5q35.1' versus Clinical Feature #3: 'NEOPLASM_DISEASESTAGE'
| nPatients | STAGE I | STAGE II | STAGE III | STAGE IV |
|---|---|---|---|---|
| ALL | 448 | 103 | 190 | 100 |
| AMP PEAK 4(5Q35.1) MUTATED | 172 | 42 | 93 | 62 |
| AMP PEAK 4(5Q35.1) WILD-TYPE | 276 | 61 | 97 | 38 |
Figure S16. Get High-res Image Gene #4: 'amp_5q35.1' versus Clinical Feature #3: 'NEOPLASM_DISEASESTAGE'
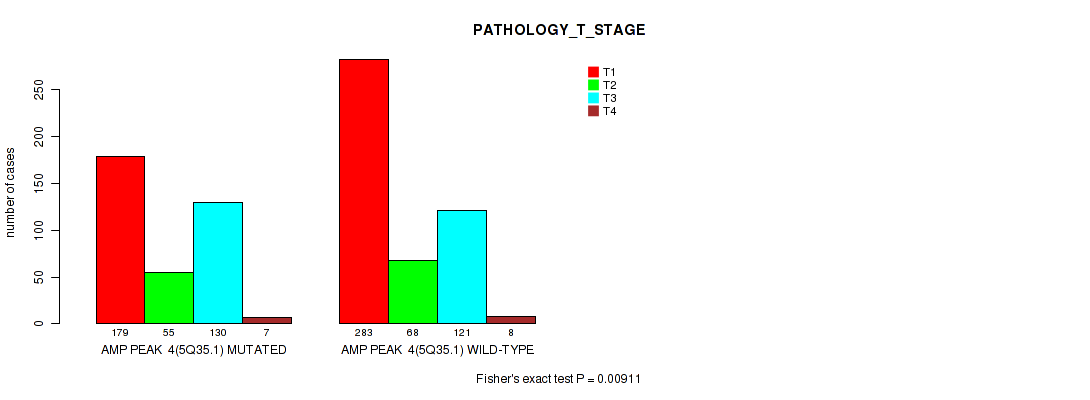
P value = 0.00911 (Fisher's exact test), Q value = 0.029
Table S17. Gene #4: 'amp_5q35.1' versus Clinical Feature #4: 'PATHOLOGY_T_STAGE'
| nPatients | T1 | T2 | T3 | T4 |
|---|---|---|---|---|
| ALL | 462 | 123 | 251 | 15 |
| AMP PEAK 4(5Q35.1) MUTATED | 179 | 55 | 130 | 7 |
| AMP PEAK 4(5Q35.1) WILD-TYPE | 283 | 68 | 121 | 8 |
Figure S17. Get High-res Image Gene #4: 'amp_5q35.1' versus Clinical Feature #4: 'PATHOLOGY_T_STAGE'
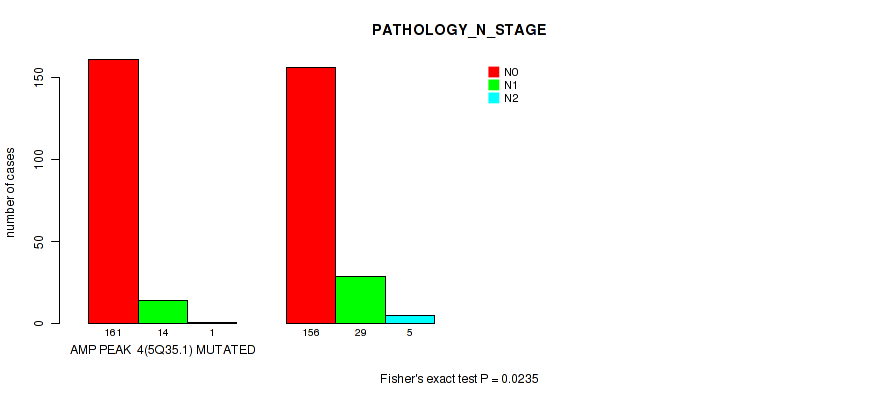
P value = 0.0235 (Fisher's exact test), Q value = 0.066
Table S18. Gene #4: 'amp_5q35.1' versus Clinical Feature #5: 'PATHOLOGY_N_STAGE'
| nPatients | N0 | N1 | N2 |
|---|---|---|---|
| ALL | 317 | 43 | 6 |
| AMP PEAK 4(5Q35.1) MUTATED | 161 | 14 | 1 |
| AMP PEAK 4(5Q35.1) WILD-TYPE | 156 | 29 | 5 |
Figure S18. Get High-res Image Gene #4: 'amp_5q35.1' versus Clinical Feature #5: 'PATHOLOGY_N_STAGE'
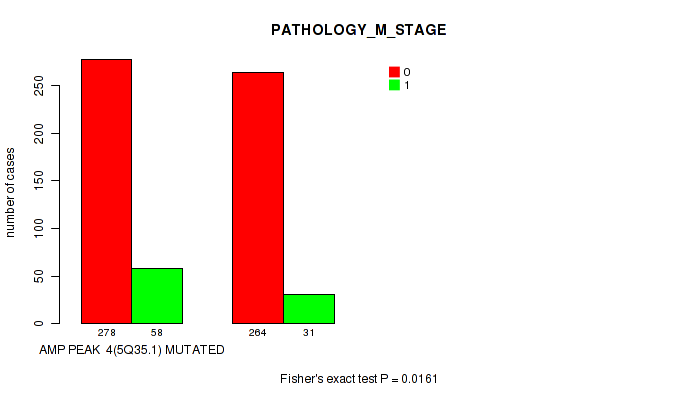
P value = 0.0161 (Fisher's exact test), Q value = 0.047
Table S19. Gene #4: 'amp_5q35.1' versus Clinical Feature #6: 'PATHOLOGY_M_STAGE'
| nPatients | 0 | 1 |
|---|---|---|
| ALL | 542 | 89 |
| AMP PEAK 4(5Q35.1) MUTATED | 278 | 58 |
| AMP PEAK 4(5Q35.1) WILD-TYPE | 264 | 31 |
Figure S19. Get High-res Image Gene #4: 'amp_5q35.1' versus Clinical Feature #6: 'PATHOLOGY_M_STAGE'
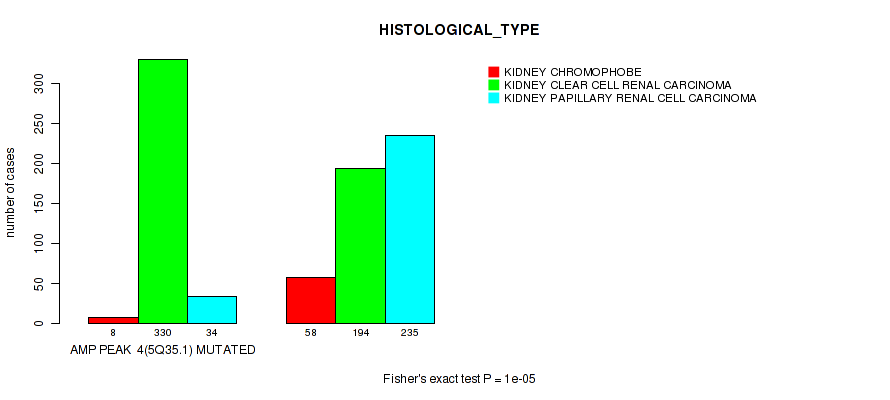
P value = 1e-05 (Fisher's exact test), Q value = 7.6e-05
Table S20. Gene #4: 'amp_5q35.1' versus Clinical Feature #9: 'HISTOLOGICAL_TYPE'
| nPatients | KIDNEY CHROMOPHOBE | KIDNEY CLEAR CELL RENAL CARCINOMA | KIDNEY PAPILLARY RENAL CELL CARCINOMA |
|---|---|---|---|
| ALL | 66 | 524 | 269 |
| AMP PEAK 4(5Q35.1) MUTATED | 8 | 330 | 34 |
| AMP PEAK 4(5Q35.1) WILD-TYPE | 58 | 194 | 235 |
Figure S20. Get High-res Image Gene #4: 'amp_5q35.1' versus Clinical Feature #9: 'HISTOLOGICAL_TYPE'
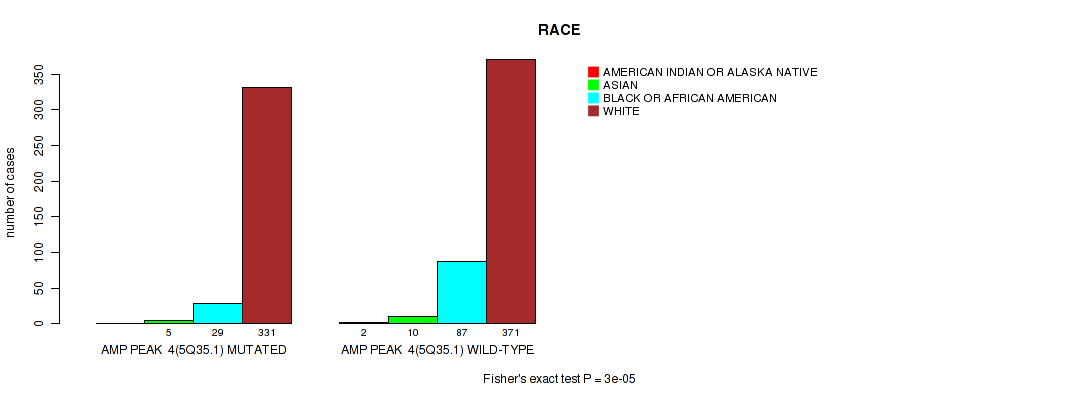
P value = 3e-05 (Fisher's exact test), Q value = 0.00021
Table S21. Gene #4: 'amp_5q35.1' versus Clinical Feature #12: 'RACE'
| nPatients | AMERICAN INDIAN OR ALASKA NATIVE | ASIAN | BLACK OR AFRICAN AMERICAN | WHITE |
|---|---|---|---|---|
| ALL | 2 | 15 | 116 | 702 |
| AMP PEAK 4(5Q35.1) MUTATED | 0 | 5 | 29 | 331 |
| AMP PEAK 4(5Q35.1) WILD-TYPE | 2 | 10 | 87 | 371 |
Figure S21. Get High-res Image Gene #4: 'amp_5q35.1' versus Clinical Feature #12: 'RACE'
P value = 0.0134 (Fisher's exact test), Q value = 0.041
Table S22. Gene #5: 'amp_7q31.2' versus Clinical Feature #3: 'NEOPLASM_DISEASESTAGE'
| nPatients | STAGE I | STAGE II | STAGE III | STAGE IV |
|---|---|---|---|---|
| ALL | 448 | 103 | 190 | 100 |
| AMP PEAK 5(7Q31.2) MUTATED | 193 | 37 | 68 | 54 |
| AMP PEAK 5(7Q31.2) WILD-TYPE | 255 | 66 | 122 | 46 |
Figure S22. Get High-res Image Gene #5: 'amp_7q31.2' versus Clinical Feature #3: 'NEOPLASM_DISEASESTAGE'
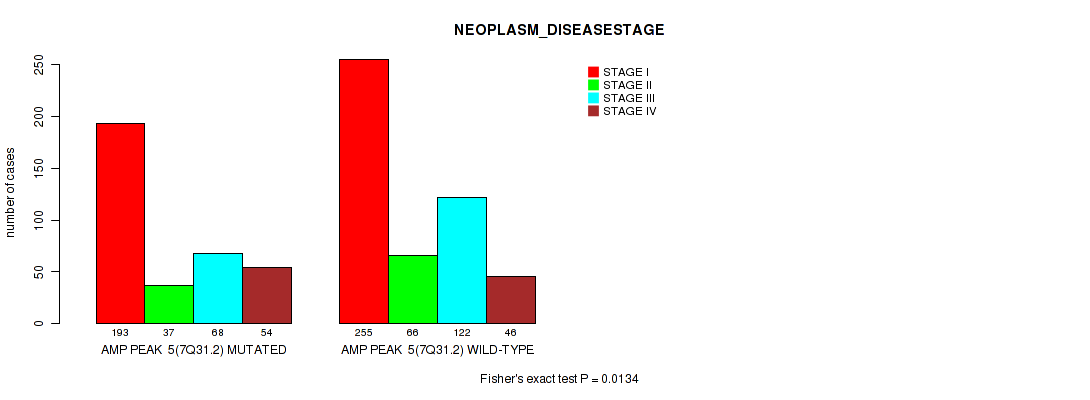
P value = 0.00198 (Fisher's exact test), Q value = 0.0082
Table S23. Gene #5: 'amp_7q31.2' versus Clinical Feature #6: 'PATHOLOGY_M_STAGE'
| nPatients | 0 | 1 |
|---|---|---|
| ALL | 542 | 89 |
| AMP PEAK 5(7Q31.2) MUTATED | 189 | 47 |
| AMP PEAK 5(7Q31.2) WILD-TYPE | 353 | 42 |
Figure S23. Get High-res Image Gene #5: 'amp_7q31.2' versus Clinical Feature #6: 'PATHOLOGY_M_STAGE'

P value = 7.63e-06 (Fisher's exact test), Q value = 7.6e-05
Table S24. Gene #5: 'amp_7q31.2' versus Clinical Feature #7: 'GENDER'
| nPatients | FEMALE | MALE |
|---|---|---|
| ALL | 287 | 572 |
| AMP PEAK 5(7Q31.2) MUTATED | 91 | 273 |
| AMP PEAK 5(7Q31.2) WILD-TYPE | 196 | 299 |
Figure S24. Get High-res Image Gene #5: 'amp_7q31.2' versus Clinical Feature #7: 'GENDER'
P value = 1e-05 (Fisher's exact test), Q value = 7.6e-05
Table S25. Gene #5: 'amp_7q31.2' versus Clinical Feature #9: 'HISTOLOGICAL_TYPE'
| nPatients | KIDNEY CHROMOPHOBE | KIDNEY CLEAR CELL RENAL CARCINOMA | KIDNEY PAPILLARY RENAL CELL CARCINOMA |
|---|---|---|---|
| ALL | 66 | 524 | 269 |
| AMP PEAK 5(7Q31.2) MUTATED | 25 | 174 | 165 |
| AMP PEAK 5(7Q31.2) WILD-TYPE | 41 | 350 | 104 |
Figure S25. Get High-res Image Gene #5: 'amp_7q31.2' versus Clinical Feature #9: 'HISTOLOGICAL_TYPE'
P value = 0.0146 (Wilcoxon-test), Q value = 0.044
Table S26. Gene #5: 'amp_7q31.2' versus Clinical Feature #11: 'YEAR_OF_TOBACCO_SMOKING_ONSET'
| nPatients | Mean (Std.Dev) | |
|---|---|---|
| ALL | 67 | 1973.4 (16.4) |
| AMP PEAK 5(7Q31.2) MUTATED | 36 | 1969.0 (15.8) |
| AMP PEAK 5(7Q31.2) WILD-TYPE | 31 | 1978.5 (15.8) |
Figure S26. Get High-res Image Gene #5: 'amp_7q31.2' versus Clinical Feature #11: 'YEAR_OF_TOBACCO_SMOKING_ONSET'
P value = 0.00646 (logrank test), Q value = 0.022
Table S27. Gene #6: 'amp_8q24.22' versus Clinical Feature #1: 'Time to Death'
| nPatients | nDeath | Duration Range (Median), Month | |
|---|---|---|---|
| ALL | 843 | 211 | 0.1 - 194.8 (30.5) |
| AMP PEAK 6(8Q24.22) MUTATED | 120 | 40 | 0.2 - 152.0 (25.8) |
| AMP PEAK 6(8Q24.22) WILD-TYPE | 723 | 171 | 0.1 - 194.8 (31.2) |
Figure S27. Get High-res Image Gene #6: 'amp_8q24.22' versus Clinical Feature #1: 'Time to Death'
P value = 0.0485 (Wilcoxon-test), Q value = 0.12
Table S28. Gene #6: 'amp_8q24.22' versus Clinical Feature #2: 'YEARS_TO_BIRTH'
| nPatients | Mean (Std.Dev) | |
|---|---|---|
| ALL | 853 | 60.1 (12.6) |
| AMP PEAK 6(8Q24.22) MUTATED | 121 | 62.1 (12.7) |
| AMP PEAK 6(8Q24.22) WILD-TYPE | 732 | 59.8 (12.5) |
Figure S28. Get High-res Image Gene #6: 'amp_8q24.22' versus Clinical Feature #2: 'YEARS_TO_BIRTH'

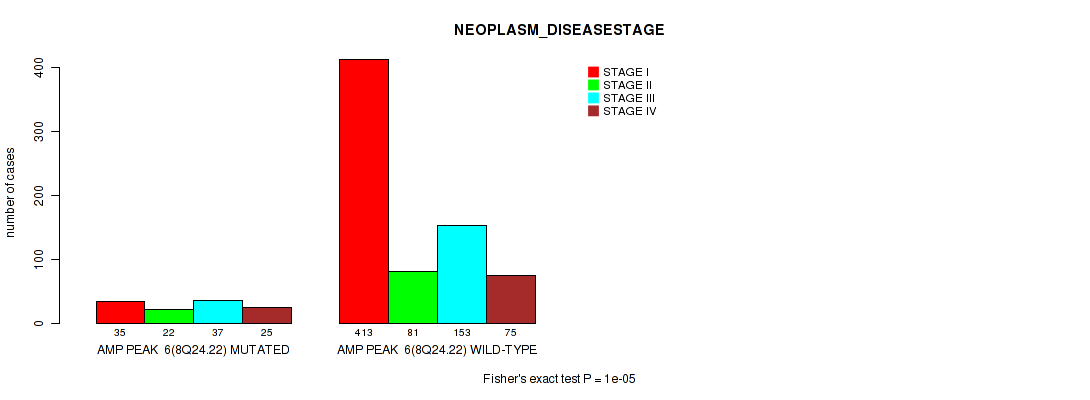
P value = 1e-05 (Fisher's exact test), Q value = 7.6e-05
Table S29. Gene #6: 'amp_8q24.22' versus Clinical Feature #3: 'NEOPLASM_DISEASESTAGE'
| nPatients | STAGE I | STAGE II | STAGE III | STAGE IV |
|---|---|---|---|---|
| ALL | 448 | 103 | 190 | 100 |
| AMP PEAK 6(8Q24.22) MUTATED | 35 | 22 | 37 | 25 |
| AMP PEAK 6(8Q24.22) WILD-TYPE | 413 | 81 | 153 | 75 |
Figure S29. Get High-res Image Gene #6: 'amp_8q24.22' versus Clinical Feature #3: 'NEOPLASM_DISEASESTAGE'
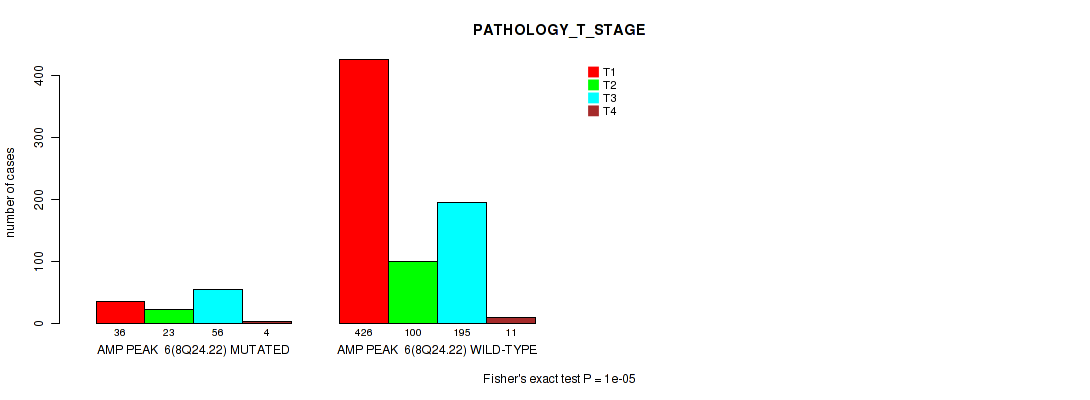
P value = 1e-05 (Fisher's exact test), Q value = 7.6e-05
Table S30. Gene #6: 'amp_8q24.22' versus Clinical Feature #4: 'PATHOLOGY_T_STAGE'
| nPatients | T1 | T2 | T3 | T4 |
|---|---|---|---|---|
| ALL | 462 | 123 | 251 | 15 |
| AMP PEAK 6(8Q24.22) MUTATED | 36 | 23 | 56 | 4 |
| AMP PEAK 6(8Q24.22) WILD-TYPE | 426 | 100 | 195 | 11 |
Figure S30. Get High-res Image Gene #6: 'amp_8q24.22' versus Clinical Feature #4: 'PATHOLOGY_T_STAGE'
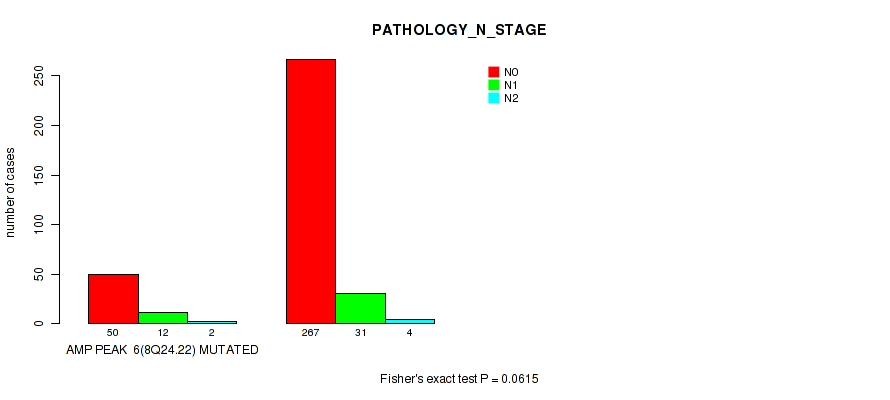
P value = 0.0615 (Fisher's exact test), Q value = 0.15
Table S31. Gene #6: 'amp_8q24.22' versus Clinical Feature #5: 'PATHOLOGY_N_STAGE'
| nPatients | N0 | N1 | N2 |
|---|---|---|---|
| ALL | 317 | 43 | 6 |
| AMP PEAK 6(8Q24.22) MUTATED | 50 | 12 | 2 |
| AMP PEAK 6(8Q24.22) WILD-TYPE | 267 | 31 | 4 |
Figure S31. Get High-res Image Gene #6: 'amp_8q24.22' versus Clinical Feature #5: 'PATHOLOGY_N_STAGE'
P value = 0.00979 (Fisher's exact test), Q value = 0.031
Table S32. Gene #6: 'amp_8q24.22' versus Clinical Feature #6: 'PATHOLOGY_M_STAGE'
| nPatients | 0 | 1 |
|---|---|---|
| ALL | 542 | 89 |
| AMP PEAK 6(8Q24.22) MUTATED | 73 | 22 |
| AMP PEAK 6(8Q24.22) WILD-TYPE | 469 | 67 |
Figure S32. Get High-res Image Gene #6: 'amp_8q24.22' versus Clinical Feature #6: 'PATHOLOGY_M_STAGE'

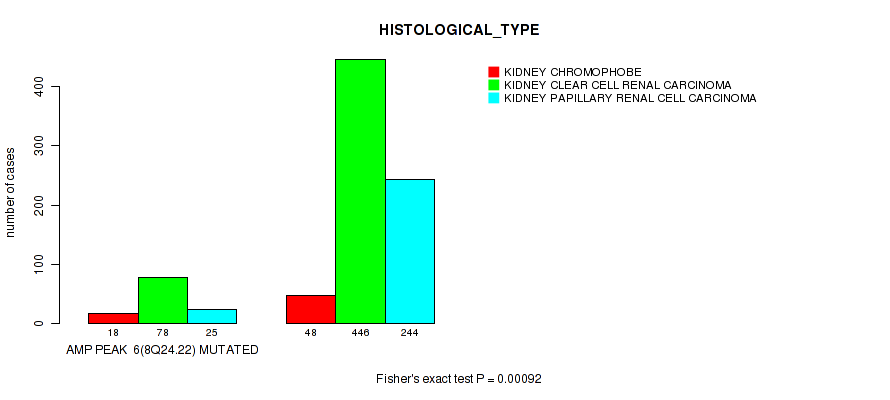
P value = 0.00092 (Fisher's exact test), Q value = 0.0042
Table S33. Gene #6: 'amp_8q24.22' versus Clinical Feature #9: 'HISTOLOGICAL_TYPE'
| nPatients | KIDNEY CHROMOPHOBE | KIDNEY CLEAR CELL RENAL CARCINOMA | KIDNEY PAPILLARY RENAL CELL CARCINOMA |
|---|---|---|---|
| ALL | 66 | 524 | 269 |
| AMP PEAK 6(8Q24.22) MUTATED | 18 | 78 | 25 |
| AMP PEAK 6(8Q24.22) WILD-TYPE | 48 | 446 | 244 |
Figure S33. Get High-res Image Gene #6: 'amp_8q24.22' versus Clinical Feature #9: 'HISTOLOGICAL_TYPE'
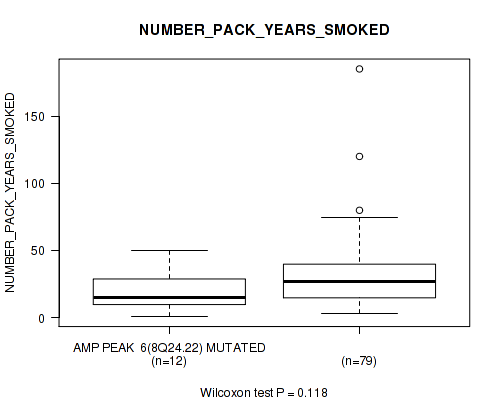
P value = 0.118 (Wilcoxon-test), Q value = 0.24
Table S34. Gene #6: 'amp_8q24.22' versus Clinical Feature #10: 'NUMBER_PACK_YEARS_SMOKED'
| nPatients | Mean (Std.Dev) | |
|---|---|---|
| ALL | 91 | 30.8 (26.2) |
| AMP PEAK 6(8Q24.22) MUTATED | 12 | 20.8 (15.9) |
| AMP PEAK 6(8Q24.22) WILD-TYPE | 79 | 32.3 (27.2) |
Figure S34. Get High-res Image Gene #6: 'amp_8q24.22' versus Clinical Feature #10: 'NUMBER_PACK_YEARS_SMOKED'
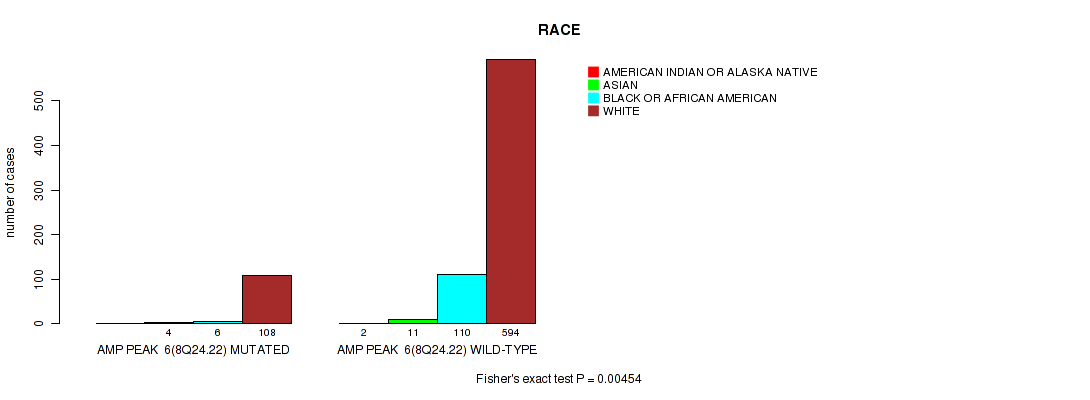
P value = 0.00454 (Fisher's exact test), Q value = 0.016
Table S35. Gene #6: 'amp_8q24.22' versus Clinical Feature #12: 'RACE'
| nPatients | AMERICAN INDIAN OR ALASKA NATIVE | ASIAN | BLACK OR AFRICAN AMERICAN | WHITE |
|---|---|---|---|---|
| ALL | 2 | 15 | 116 | 702 |
| AMP PEAK 6(8Q24.22) MUTATED | 0 | 4 | 6 | 108 |
| AMP PEAK 6(8Q24.22) WILD-TYPE | 2 | 11 | 110 | 594 |
Figure S35. Get High-res Image Gene #6: 'amp_8q24.22' versus Clinical Feature #12: 'RACE'
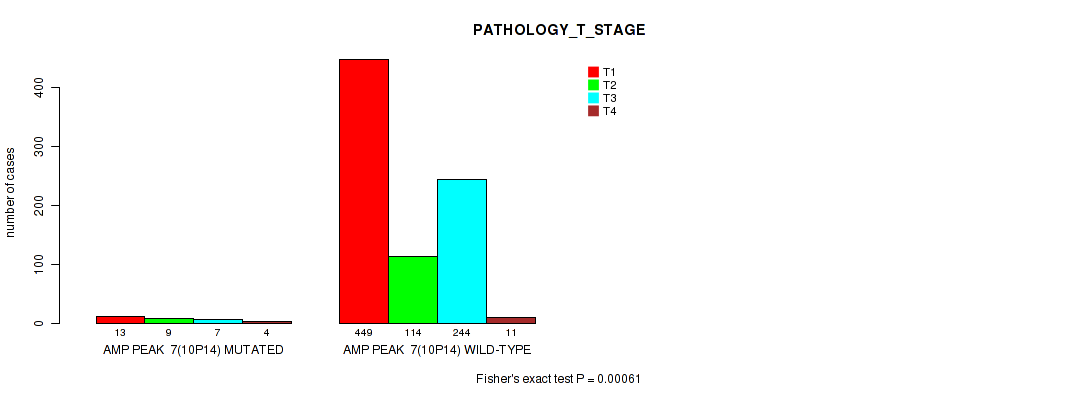
P value = 0.00061 (Fisher's exact test), Q value = 0.0029
Table S36. Gene #7: 'amp_10p14' versus Clinical Feature #4: 'PATHOLOGY_T_STAGE'
| nPatients | T1 | T2 | T3 | T4 |
|---|---|---|---|---|
| ALL | 462 | 123 | 251 | 15 |
| AMP PEAK 7(10P14) MUTATED | 13 | 9 | 7 | 4 |
| AMP PEAK 7(10P14) WILD-TYPE | 449 | 114 | 244 | 11 |
Figure S36. Get High-res Image Gene #7: 'amp_10p14' versus Clinical Feature #4: 'PATHOLOGY_T_STAGE'
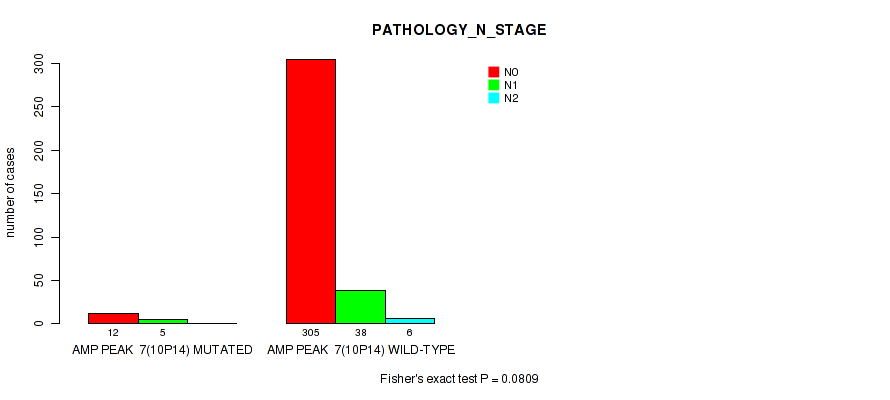
P value = 0.0809 (Fisher's exact test), Q value = 0.18
Table S37. Gene #7: 'amp_10p14' versus Clinical Feature #5: 'PATHOLOGY_N_STAGE'
| nPatients | N0 | N1 | N2 |
|---|---|---|---|
| ALL | 317 | 43 | 6 |
| AMP PEAK 7(10P14) MUTATED | 12 | 5 | 0 |
| AMP PEAK 7(10P14) WILD-TYPE | 305 | 38 | 6 |
Figure S37. Get High-res Image Gene #7: 'amp_10p14' versus Clinical Feature #5: 'PATHOLOGY_N_STAGE'
P value = 0.0619 (Wilcoxon-test), Q value = 0.15
Table S38. Gene #8: 'amp_17q25.2' versus Clinical Feature #2: 'YEARS_TO_BIRTH'
| nPatients | Mean (Std.Dev) | |
|---|---|---|
| ALL | 853 | 60.1 (12.6) |
| AMP PEAK 8(17Q25.2) MUTATED | 229 | 61.4 (12.3) |
| AMP PEAK 8(17Q25.2) WILD-TYPE | 624 | 59.6 (12.6) |
Figure S38. Get High-res Image Gene #8: 'amp_17q25.2' versus Clinical Feature #2: 'YEARS_TO_BIRTH'

P value = 0.00052 (Fisher's exact test), Q value = 0.0025
Table S39. Gene #8: 'amp_17q25.2' versus Clinical Feature #3: 'NEOPLASM_DISEASESTAGE'
| nPatients | STAGE I | STAGE II | STAGE III | STAGE IV |
|---|---|---|---|---|
| ALL | 448 | 103 | 190 | 100 |
| AMP PEAK 8(17Q25.2) MUTATED | 144 | 21 | 42 | 15 |
| AMP PEAK 8(17Q25.2) WILD-TYPE | 304 | 82 | 148 | 85 |
Figure S39. Get High-res Image Gene #8: 'amp_17q25.2' versus Clinical Feature #3: 'NEOPLASM_DISEASESTAGE'
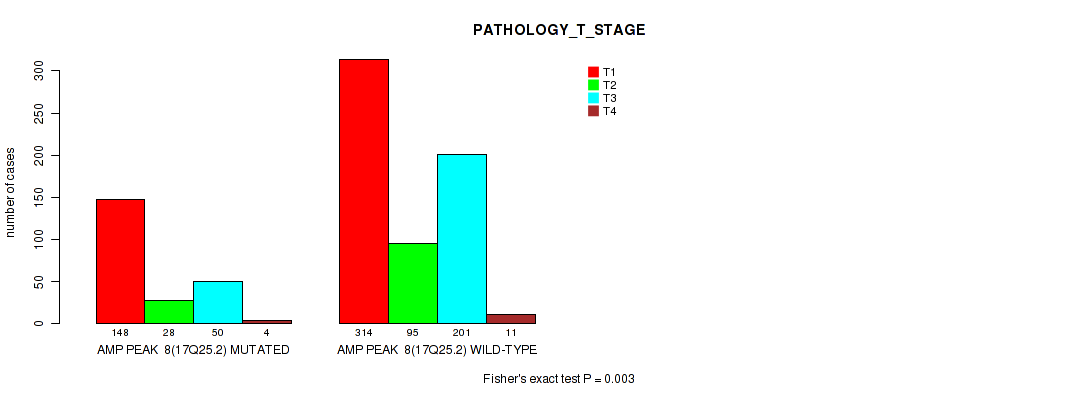
P value = 0.003 (Fisher's exact test), Q value = 0.011
Table S40. Gene #8: 'amp_17q25.2' versus Clinical Feature #4: 'PATHOLOGY_T_STAGE'
| nPatients | T1 | T2 | T3 | T4 |
|---|---|---|---|---|
| ALL | 462 | 123 | 251 | 15 |
| AMP PEAK 8(17Q25.2) MUTATED | 148 | 28 | 50 | 4 |
| AMP PEAK 8(17Q25.2) WILD-TYPE | 314 | 95 | 201 | 11 |
Figure S40. Get High-res Image Gene #8: 'amp_17q25.2' versus Clinical Feature #4: 'PATHOLOGY_T_STAGE'
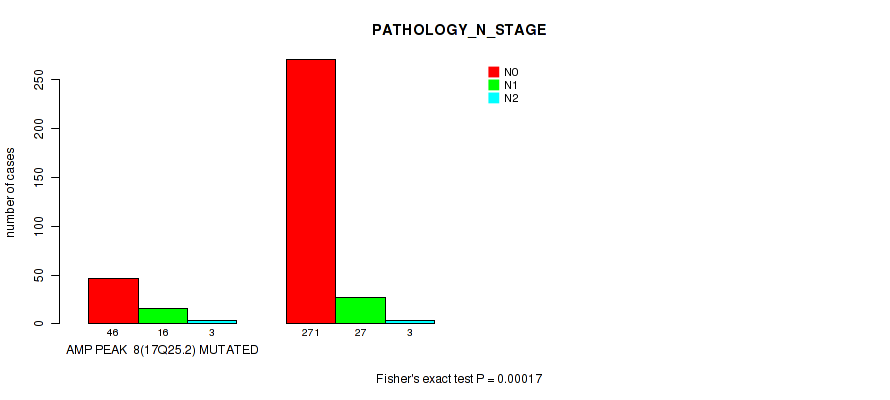
P value = 0.00017 (Fisher's exact test), Q value = 0.00097
Table S41. Gene #8: 'amp_17q25.2' versus Clinical Feature #5: 'PATHOLOGY_N_STAGE'
| nPatients | N0 | N1 | N2 |
|---|---|---|---|
| ALL | 317 | 43 | 6 |
| AMP PEAK 8(17Q25.2) MUTATED | 46 | 16 | 3 |
| AMP PEAK 8(17Q25.2) WILD-TYPE | 271 | 27 | 3 |
Figure S41. Get High-res Image Gene #8: 'amp_17q25.2' versus Clinical Feature #5: 'PATHOLOGY_N_STAGE'
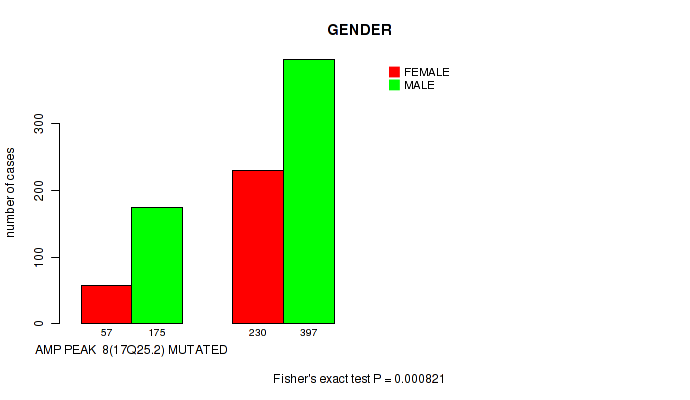
P value = 0.000821 (Fisher's exact test), Q value = 0.0038
Table S42. Gene #8: 'amp_17q25.2' versus Clinical Feature #7: 'GENDER'
| nPatients | FEMALE | MALE |
|---|---|---|
| ALL | 287 | 572 |
| AMP PEAK 8(17Q25.2) MUTATED | 57 | 175 |
| AMP PEAK 8(17Q25.2) WILD-TYPE | 230 | 397 |
Figure S42. Get High-res Image Gene #8: 'amp_17q25.2' versus Clinical Feature #7: 'GENDER'
P value = 1e-05 (Fisher's exact test), Q value = 7.6e-05
Table S43. Gene #8: 'amp_17q25.2' versus Clinical Feature #9: 'HISTOLOGICAL_TYPE'
| nPatients | KIDNEY CHROMOPHOBE | KIDNEY CLEAR CELL RENAL CARCINOMA | KIDNEY PAPILLARY RENAL CELL CARCINOMA |
|---|---|---|---|
| ALL | 66 | 524 | 269 |
| AMP PEAK 8(17Q25.2) MUTATED | 1 | 42 | 189 |
| AMP PEAK 8(17Q25.2) WILD-TYPE | 65 | 482 | 80 |
Figure S43. Get High-res Image Gene #8: 'amp_17q25.2' versus Clinical Feature #9: 'HISTOLOGICAL_TYPE'
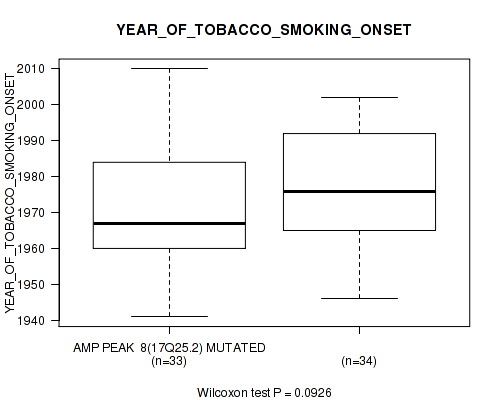
P value = 0.0926 (Wilcoxon-test), Q value = 0.2
Table S44. Gene #8: 'amp_17q25.2' versus Clinical Feature #11: 'YEAR_OF_TOBACCO_SMOKING_ONSET'
| nPatients | Mean (Std.Dev) | |
|---|---|---|
| ALL | 67 | 1973.4 (16.4) |
| AMP PEAK 8(17Q25.2) MUTATED | 33 | 1970.4 (16.0) |
| AMP PEAK 8(17Q25.2) WILD-TYPE | 34 | 1976.3 (16.5) |
Figure S44. Get High-res Image Gene #8: 'amp_17q25.2' versus Clinical Feature #11: 'YEAR_OF_TOBACCO_SMOKING_ONSET'
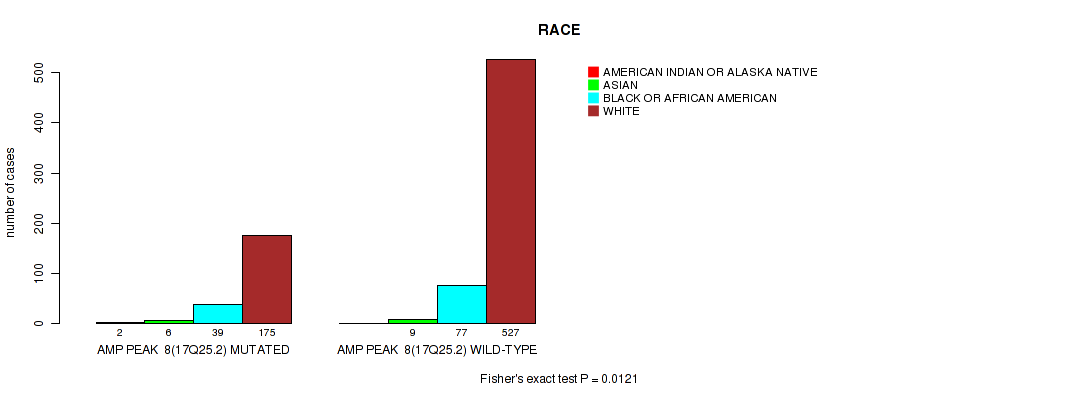
P value = 0.0121 (Fisher's exact test), Q value = 0.038
Table S45. Gene #8: 'amp_17q25.2' versus Clinical Feature #12: 'RACE'
| nPatients | AMERICAN INDIAN OR ALASKA NATIVE | ASIAN | BLACK OR AFRICAN AMERICAN | WHITE |
|---|---|---|---|---|
| ALL | 2 | 15 | 116 | 702 |
| AMP PEAK 8(17Q25.2) MUTATED | 2 | 6 | 39 | 175 |
| AMP PEAK 8(17Q25.2) WILD-TYPE | 0 | 9 | 77 | 527 |
Figure S45. Get High-res Image Gene #8: 'amp_17q25.2' versus Clinical Feature #12: 'RACE'
P value = 0.00152 (Fisher's exact test), Q value = 0.0066
Table S46. Gene #9: 'amp_19p13.2' versus Clinical Feature #3: 'NEOPLASM_DISEASESTAGE'
| nPatients | STAGE I | STAGE II | STAGE III | STAGE IV |
|---|---|---|---|---|
| ALL | 448 | 103 | 190 | 100 |
| AMP PEAK 9(19P13.2) MUTATED | 35 | 18 | 19 | 19 |
| AMP PEAK 9(19P13.2) WILD-TYPE | 413 | 85 | 171 | 81 |
Figure S46. Get High-res Image Gene #9: 'amp_19p13.2' versus Clinical Feature #3: 'NEOPLASM_DISEASESTAGE'

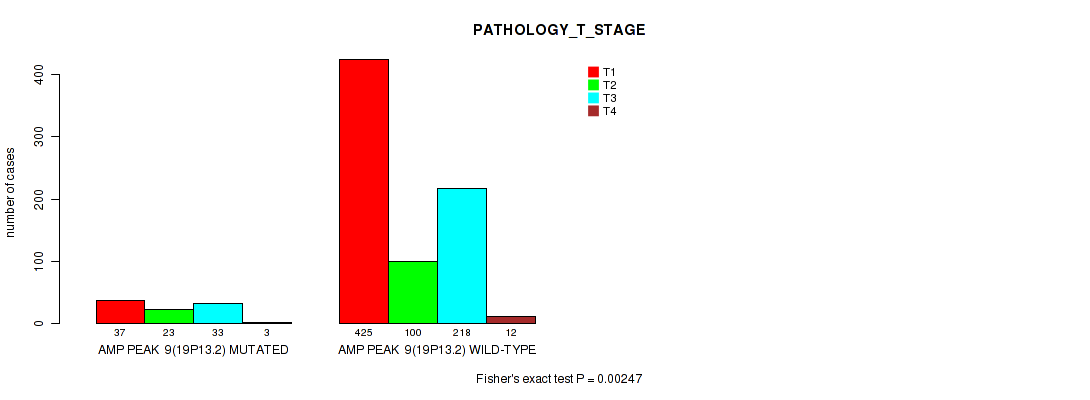
P value = 0.00247 (Fisher's exact test), Q value = 0.0098
Table S47. Gene #9: 'amp_19p13.2' versus Clinical Feature #4: 'PATHOLOGY_T_STAGE'
| nPatients | T1 | T2 | T3 | T4 |
|---|---|---|---|---|
| ALL | 462 | 123 | 251 | 15 |
| AMP PEAK 9(19P13.2) MUTATED | 37 | 23 | 33 | 3 |
| AMP PEAK 9(19P13.2) WILD-TYPE | 425 | 100 | 218 | 12 |
Figure S47. Get High-res Image Gene #9: 'amp_19p13.2' versus Clinical Feature #4: 'PATHOLOGY_T_STAGE'
P value = 0.0156 (Fisher's exact test), Q value = 0.046
Table S48. Gene #9: 'amp_19p13.2' versus Clinical Feature #6: 'PATHOLOGY_M_STAGE'
| nPatients | 0 | 1 |
|---|---|---|
| ALL | 542 | 89 |
| AMP PEAK 9(19P13.2) MUTATED | 52 | 17 |
| AMP PEAK 9(19P13.2) WILD-TYPE | 490 | 72 |
Figure S48. Get High-res Image Gene #9: 'amp_19p13.2' versus Clinical Feature #6: 'PATHOLOGY_M_STAGE'
P value = 0.00034 (Fisher's exact test), Q value = 0.0017
Table S49. Gene #9: 'amp_19p13.2' versus Clinical Feature #9: 'HISTOLOGICAL_TYPE'
| nPatients | KIDNEY CHROMOPHOBE | KIDNEY CLEAR CELL RENAL CARCINOMA | KIDNEY PAPILLARY RENAL CELL CARCINOMA |
|---|---|---|---|
| ALL | 66 | 524 | 269 |
| AMP PEAK 9(19P13.2) MUTATED | 18 | 49 | 30 |
| AMP PEAK 9(19P13.2) WILD-TYPE | 48 | 475 | 239 |
Figure S49. Get High-res Image Gene #9: 'amp_19p13.2' versus Clinical Feature #9: 'HISTOLOGICAL_TYPE'
P value = 0.0233 (Fisher's exact test), Q value = 0.065
Table S50. Gene #10: 'amp_xp22.2' versus Clinical Feature #3: 'NEOPLASM_DISEASESTAGE'
| nPatients | STAGE I | STAGE II | STAGE III | STAGE IV |
|---|---|---|---|---|
| ALL | 448 | 103 | 190 | 100 |
| AMP PEAK 10(XP22.2) MUTATED | 72 | 14 | 14 | 15 |
| AMP PEAK 10(XP22.2) WILD-TYPE | 376 | 89 | 176 | 85 |
Figure S50. Get High-res Image Gene #10: 'amp_xp22.2' versus Clinical Feature #3: 'NEOPLASM_DISEASESTAGE'
P value = 0.0759 (Fisher's exact test), Q value = 0.17
Table S51. Gene #10: 'amp_xp22.2' versus Clinical Feature #4: 'PATHOLOGY_T_STAGE'
| nPatients | T1 | T2 | T3 | T4 |
|---|---|---|---|---|
| ALL | 462 | 123 | 251 | 15 |
| AMP PEAK 10(XP22.2) MUTATED | 73 | 19 | 24 | 3 |
| AMP PEAK 10(XP22.2) WILD-TYPE | 389 | 104 | 227 | 12 |
Figure S51. Get High-res Image Gene #10: 'amp_xp22.2' versus Clinical Feature #4: 'PATHOLOGY_T_STAGE'

P value = 0.00494 (Fisher's exact test), Q value = 0.017
Table S52. Gene #10: 'amp_xp22.2' versus Clinical Feature #7: 'GENDER'
| nPatients | FEMALE | MALE |
|---|---|---|
| ALL | 287 | 572 |
| AMP PEAK 10(XP22.2) MUTATED | 27 | 94 |
| AMP PEAK 10(XP22.2) WILD-TYPE | 260 | 478 |
Figure S52. Get High-res Image Gene #10: 'amp_xp22.2' versus Clinical Feature #7: 'GENDER'

P value = 0.0254 (Wilcoxon-test), Q value = 0.069
Table S53. Gene #10: 'amp_xp22.2' versus Clinical Feature #8: 'KARNOFSKY_PERFORMANCE_SCORE'
| nPatients | Mean (Std.Dev) | |
|---|---|---|
| ALL | 115 | 90.3 (17.6) |
| AMP PEAK 10(XP22.2) MUTATED | 26 | 92.3 (20.3) |
| AMP PEAK 10(XP22.2) WILD-TYPE | 89 | 89.7 (16.8) |
Figure S53. Get High-res Image Gene #10: 'amp_xp22.2' versus Clinical Feature #8: 'KARNOFSKY_PERFORMANCE_SCORE'
P value = 1e-05 (Fisher's exact test), Q value = 7.6e-05
Table S54. Gene #10: 'amp_xp22.2' versus Clinical Feature #9: 'HISTOLOGICAL_TYPE'
| nPatients | KIDNEY CHROMOPHOBE | KIDNEY CLEAR CELL RENAL CARCINOMA | KIDNEY PAPILLARY RENAL CELL CARCINOMA |
|---|---|---|---|
| ALL | 66 | 524 | 269 |
| AMP PEAK 10(XP22.2) MUTATED | 7 | 30 | 84 |
| AMP PEAK 10(XP22.2) WILD-TYPE | 59 | 494 | 185 |
Figure S54. Get High-res Image Gene #10: 'amp_xp22.2' versus Clinical Feature #9: 'HISTOLOGICAL_TYPE'

P value = 0.044 (Wilcoxon-test), Q value = 0.11
Table S55. Gene #10: 'amp_xp22.2' versus Clinical Feature #11: 'YEAR_OF_TOBACCO_SMOKING_ONSET'
| nPatients | Mean (Std.Dev) | |
|---|---|---|
| ALL | 67 | 1973.4 (16.4) |
| AMP PEAK 10(XP22.2) MUTATED | 14 | 1966.4 (14.1) |
| AMP PEAK 10(XP22.2) WILD-TYPE | 53 | 1975.3 (16.6) |
Figure S55. Get High-res Image Gene #10: 'amp_xp22.2' versus Clinical Feature #11: 'YEAR_OF_TOBACCO_SMOKING_ONSET'

P value = 0.00376 (Fisher's exact test), Q value = 0.014
Table S56. Gene #11: 'amp_xp11.4' versus Clinical Feature #3: 'NEOPLASM_DISEASESTAGE'
| nPatients | STAGE I | STAGE II | STAGE III | STAGE IV |
|---|---|---|---|---|
| ALL | 448 | 103 | 190 | 100 |
| AMP PEAK 11(XP11.4) MUTATED | 78 | 14 | 13 | 16 |
| AMP PEAK 11(XP11.4) WILD-TYPE | 370 | 89 | 177 | 84 |
Figure S56. Get High-res Image Gene #11: 'amp_xp11.4' versus Clinical Feature #3: 'NEOPLASM_DISEASESTAGE'

P value = 0.0259 (Fisher's exact test), Q value = 0.069
Table S57. Gene #11: 'amp_xp11.4' versus Clinical Feature #4: 'PATHOLOGY_T_STAGE'
| nPatients | T1 | T2 | T3 | T4 |
|---|---|---|---|---|
| ALL | 462 | 123 | 251 | 15 |
| AMP PEAK 11(XP11.4) MUTATED | 80 | 20 | 24 | 3 |
| AMP PEAK 11(XP11.4) WILD-TYPE | 382 | 103 | 227 | 12 |
Figure S57. Get High-res Image Gene #11: 'amp_xp11.4' versus Clinical Feature #4: 'PATHOLOGY_T_STAGE'

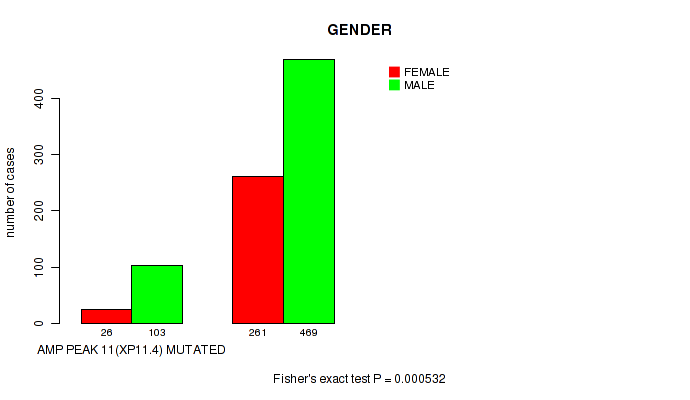
P value = 0.000532 (Fisher's exact test), Q value = 0.0025
Table S58. Gene #11: 'amp_xp11.4' versus Clinical Feature #7: 'GENDER'
| nPatients | FEMALE | MALE |
|---|---|---|
| ALL | 287 | 572 |
| AMP PEAK 11(XP11.4) MUTATED | 26 | 103 |
| AMP PEAK 11(XP11.4) WILD-TYPE | 261 | 469 |
Figure S58. Get High-res Image Gene #11: 'amp_xp11.4' versus Clinical Feature #7: 'GENDER'
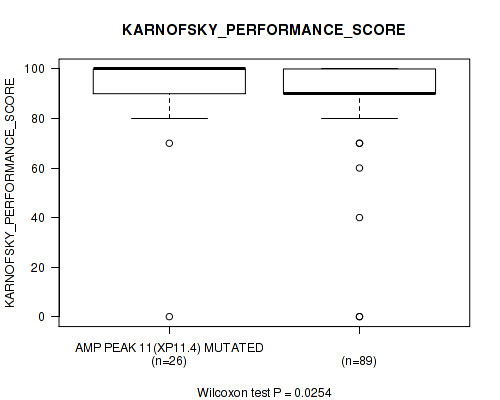
P value = 0.0254 (Wilcoxon-test), Q value = 0.069
Table S59. Gene #11: 'amp_xp11.4' versus Clinical Feature #8: 'KARNOFSKY_PERFORMANCE_SCORE'
| nPatients | Mean (Std.Dev) | |
|---|---|---|
| ALL | 115 | 90.3 (17.6) |
| AMP PEAK 11(XP11.4) MUTATED | 26 | 92.3 (20.3) |
| AMP PEAK 11(XP11.4) WILD-TYPE | 89 | 89.7 (16.8) |
Figure S59. Get High-res Image Gene #11: 'amp_xp11.4' versus Clinical Feature #8: 'KARNOFSKY_PERFORMANCE_SCORE'
P value = 1e-05 (Fisher's exact test), Q value = 7.6e-05
Table S60. Gene #11: 'amp_xp11.4' versus Clinical Feature #9: 'HISTOLOGICAL_TYPE'
| nPatients | KIDNEY CHROMOPHOBE | KIDNEY CLEAR CELL RENAL CARCINOMA | KIDNEY PAPILLARY RENAL CELL CARCINOMA |
|---|---|---|---|
| ALL | 66 | 524 | 269 |
| AMP PEAK 11(XP11.4) MUTATED | 7 | 32 | 90 |
| AMP PEAK 11(XP11.4) WILD-TYPE | 59 | 492 | 179 |
Figure S60. Get High-res Image Gene #11: 'amp_xp11.4' versus Clinical Feature #9: 'HISTOLOGICAL_TYPE'

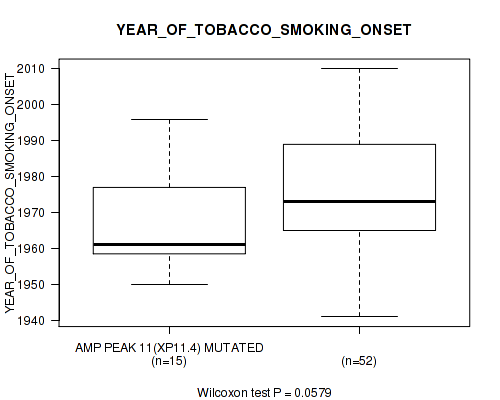
P value = 0.0579 (Wilcoxon-test), Q value = 0.14
Table S61. Gene #11: 'amp_xp11.4' versus Clinical Feature #11: 'YEAR_OF_TOBACCO_SMOKING_ONSET'
| nPatients | Mean (Std.Dev) | |
|---|---|---|
| ALL | 67 | 1973.4 (16.4) |
| AMP PEAK 11(XP11.4) MUTATED | 15 | 1966.9 (13.8) |
| AMP PEAK 11(XP11.4) WILD-TYPE | 52 | 1975.3 (16.8) |
Figure S61. Get High-res Image Gene #11: 'amp_xp11.4' versus Clinical Feature #11: 'YEAR_OF_TOBACCO_SMOKING_ONSET'
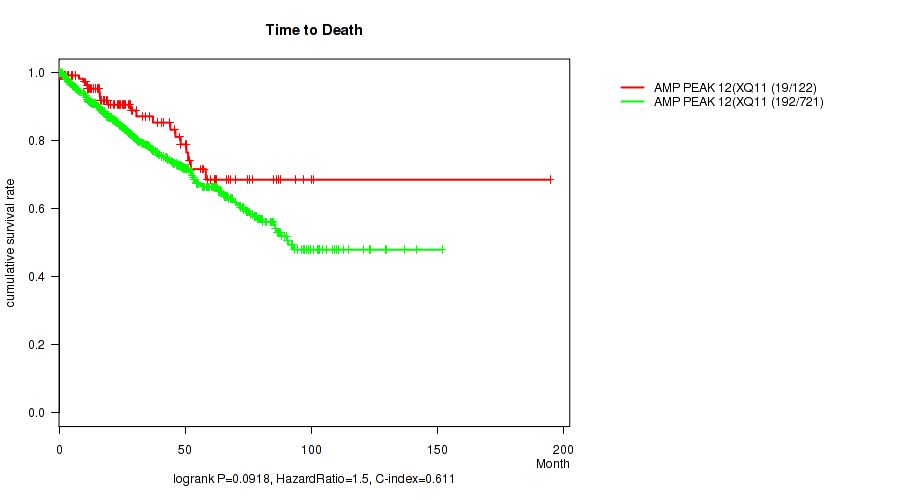
P value = 0.0918 (logrank test), Q value = 0.2
Table S62. Gene #12: 'amp_xq11.2' versus Clinical Feature #1: 'Time to Death'
| nPatients | nDeath | Duration Range (Median), Month | |
|---|---|---|---|
| ALL | 843 | 211 | 0.1 - 194.8 (30.5) |
| AMP PEAK 12(XQ11.2) MUTATED | 122 | 19 | 0.1 - 194.8 (25.6) |
| AMP PEAK 12(XQ11.2) WILD-TYPE | 721 | 192 | 0.1 - 152.0 (31.3) |
Figure S62. Get High-res Image Gene #12: 'amp_xq11.2' versus Clinical Feature #1: 'Time to Death'
P value = 0.00471 (Fisher's exact test), Q value = 0.017
Table S63. Gene #12: 'amp_xq11.2' versus Clinical Feature #3: 'NEOPLASM_DISEASESTAGE'
| nPatients | STAGE I | STAGE II | STAGE III | STAGE IV |
|---|---|---|---|---|
| ALL | 448 | 103 | 190 | 100 |
| AMP PEAK 12(XQ11.2) MUTATED | 80 | 14 | 14 | 12 |
| AMP PEAK 12(XQ11.2) WILD-TYPE | 368 | 89 | 176 | 88 |
Figure S63. Get High-res Image Gene #12: 'amp_xq11.2' versus Clinical Feature #3: 'NEOPLASM_DISEASESTAGE'
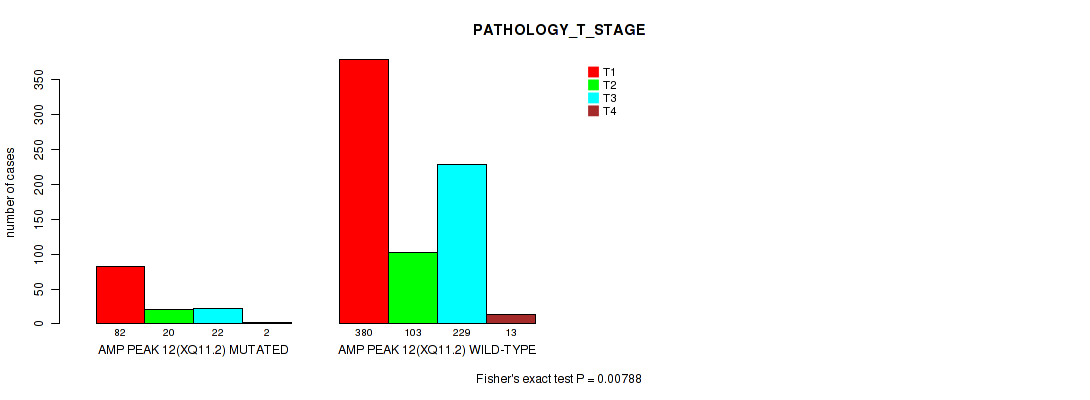
P value = 0.00788 (Fisher's exact test), Q value = 0.026
Table S64. Gene #12: 'amp_xq11.2' versus Clinical Feature #4: 'PATHOLOGY_T_STAGE'
| nPatients | T1 | T2 | T3 | T4 |
|---|---|---|---|---|
| ALL | 462 | 123 | 251 | 15 |
| AMP PEAK 12(XQ11.2) MUTATED | 82 | 20 | 22 | 2 |
| AMP PEAK 12(XQ11.2) WILD-TYPE | 380 | 103 | 229 | 13 |
Figure S64. Get High-res Image Gene #12: 'amp_xq11.2' versus Clinical Feature #4: 'PATHOLOGY_T_STAGE'
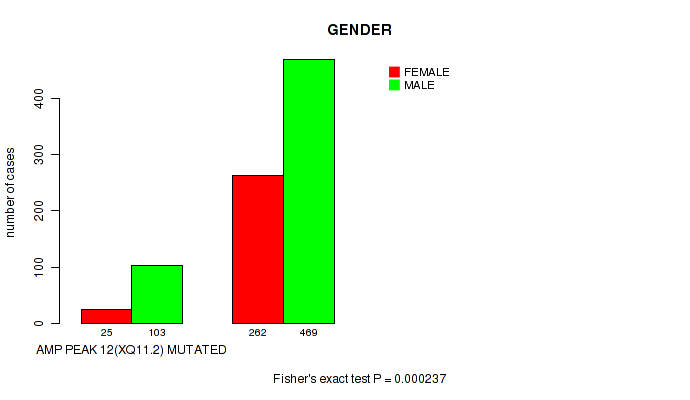
P value = 0.000237 (Fisher's exact test), Q value = 0.0013
Table S65. Gene #12: 'amp_xq11.2' versus Clinical Feature #7: 'GENDER'
| nPatients | FEMALE | MALE |
|---|---|---|
| ALL | 287 | 572 |
| AMP PEAK 12(XQ11.2) MUTATED | 25 | 103 |
| AMP PEAK 12(XQ11.2) WILD-TYPE | 262 | 469 |
Figure S65. Get High-res Image Gene #12: 'amp_xq11.2' versus Clinical Feature #7: 'GENDER'
P value = 0.0254 (Wilcoxon-test), Q value = 0.069
Table S66. Gene #12: 'amp_xq11.2' versus Clinical Feature #8: 'KARNOFSKY_PERFORMANCE_SCORE'
| nPatients | Mean (Std.Dev) | |
|---|---|---|
| ALL | 115 | 90.3 (17.6) |
| AMP PEAK 12(XQ11.2) MUTATED | 26 | 92.3 (20.3) |
| AMP PEAK 12(XQ11.2) WILD-TYPE | 89 | 89.7 (16.8) |
Figure S66. Get High-res Image Gene #12: 'amp_xq11.2' versus Clinical Feature #8: 'KARNOFSKY_PERFORMANCE_SCORE'

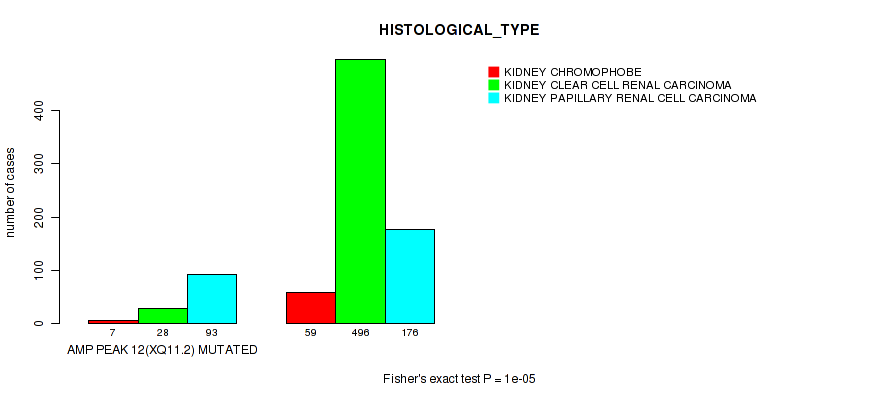
P value = 1e-05 (Fisher's exact test), Q value = 7.6e-05
Table S67. Gene #12: 'amp_xq11.2' versus Clinical Feature #9: 'HISTOLOGICAL_TYPE'
| nPatients | KIDNEY CHROMOPHOBE | KIDNEY CLEAR CELL RENAL CARCINOMA | KIDNEY PAPILLARY RENAL CELL CARCINOMA |
|---|---|---|---|
| ALL | 66 | 524 | 269 |
| AMP PEAK 12(XQ11.2) MUTATED | 7 | 28 | 93 |
| AMP PEAK 12(XQ11.2) WILD-TYPE | 59 | 496 | 176 |
Figure S67. Get High-res Image Gene #12: 'amp_xq11.2' versus Clinical Feature #9: 'HISTOLOGICAL_TYPE'
P value = 0.0193 (Wilcoxon-test), Q value = 0.056
Table S68. Gene #12: 'amp_xq11.2' versus Clinical Feature #11: 'YEAR_OF_TOBACCO_SMOKING_ONSET'
| nPatients | Mean (Std.Dev) | |
|---|---|---|
| ALL | 67 | 1973.4 (16.4) |
| AMP PEAK 12(XQ11.2) MUTATED | 16 | 1965.3 (14.8) |
| AMP PEAK 12(XQ11.2) WILD-TYPE | 51 | 1975.9 (16.2) |
Figure S68. Get High-res Image Gene #12: 'amp_xq11.2' versus Clinical Feature #11: 'YEAR_OF_TOBACCO_SMOKING_ONSET'
P value = 0.0777 (logrank test), Q value = 0.17
Table S69. Gene #13: 'amp_xq28' versus Clinical Feature #1: 'Time to Death'
| nPatients | nDeath | Duration Range (Median), Month | |
|---|---|---|---|
| ALL | 843 | 211 | 0.1 - 194.8 (30.5) |
| AMP PEAK 13(XQ28) MUTATED | 126 | 20 | 0.1 - 194.8 (25.5) |
| AMP PEAK 13(XQ28) WILD-TYPE | 717 | 191 | 0.1 - 152.0 (31.3) |
Figure S69. Get High-res Image Gene #13: 'amp_xq28' versus Clinical Feature #1: 'Time to Death'

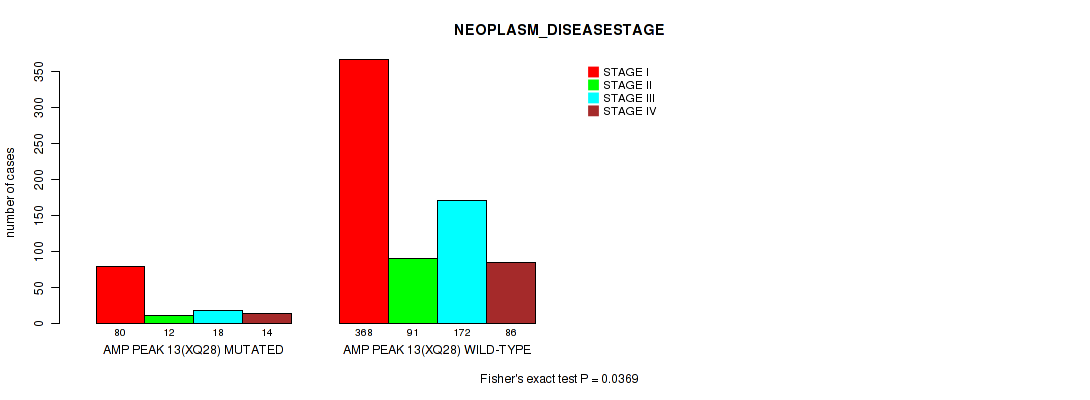
P value = 0.0369 (Fisher's exact test), Q value = 0.094
Table S70. Gene #13: 'amp_xq28' versus Clinical Feature #3: 'NEOPLASM_DISEASESTAGE'
| nPatients | STAGE I | STAGE II | STAGE III | STAGE IV |
|---|---|---|---|---|
| ALL | 448 | 103 | 190 | 100 |
| AMP PEAK 13(XQ28) MUTATED | 80 | 12 | 18 | 14 |
| AMP PEAK 13(XQ28) WILD-TYPE | 368 | 91 | 172 | 86 |
Figure S70. Get High-res Image Gene #13: 'amp_xq28' versus Clinical Feature #3: 'NEOPLASM_DISEASESTAGE'
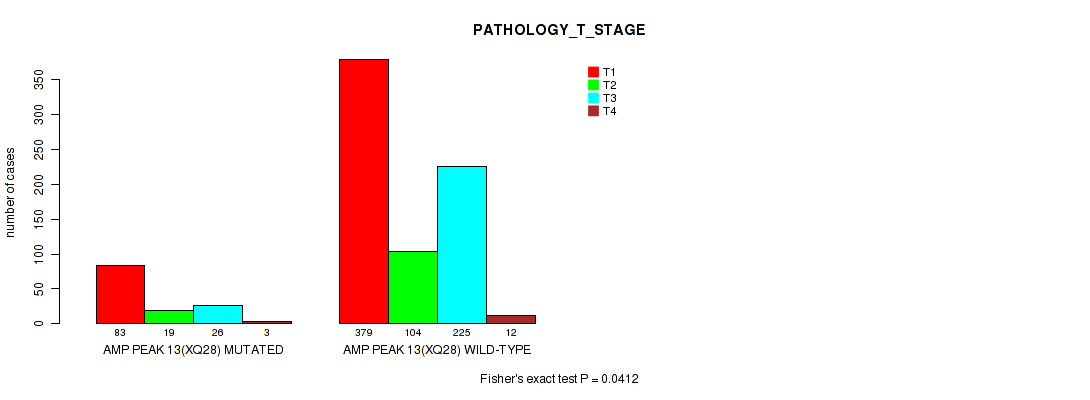
P value = 0.0412 (Fisher's exact test), Q value = 0.1
Table S71. Gene #13: 'amp_xq28' versus Clinical Feature #4: 'PATHOLOGY_T_STAGE'
| nPatients | T1 | T2 | T3 | T4 |
|---|---|---|---|---|
| ALL | 462 | 123 | 251 | 15 |
| AMP PEAK 13(XQ28) MUTATED | 83 | 19 | 26 | 3 |
| AMP PEAK 13(XQ28) WILD-TYPE | 379 | 104 | 225 | 12 |
Figure S71. Get High-res Image Gene #13: 'amp_xq28' versus Clinical Feature #4: 'PATHOLOGY_T_STAGE'
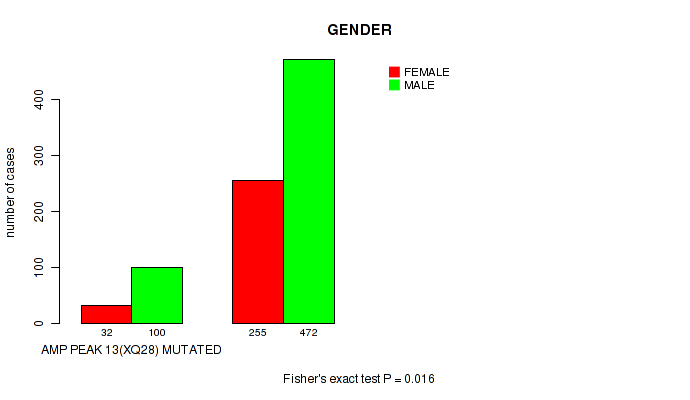
P value = 0.016 (Fisher's exact test), Q value = 0.047
Table S72. Gene #13: 'amp_xq28' versus Clinical Feature #7: 'GENDER'
| nPatients | FEMALE | MALE |
|---|---|---|
| ALL | 287 | 572 |
| AMP PEAK 13(XQ28) MUTATED | 32 | 100 |
| AMP PEAK 13(XQ28) WILD-TYPE | 255 | 472 |
Figure S72. Get High-res Image Gene #13: 'amp_xq28' versus Clinical Feature #7: 'GENDER'
P value = 0.00192 (Wilcoxon-test), Q value = 0.0081
Table S73. Gene #13: 'amp_xq28' versus Clinical Feature #8: 'KARNOFSKY_PERFORMANCE_SCORE'
| nPatients | Mean (Std.Dev) | |
|---|---|---|
| ALL | 115 | 90.3 (17.6) |
| AMP PEAK 13(XQ28) MUTATED | 24 | 97.1 (5.5) |
| AMP PEAK 13(XQ28) WILD-TYPE | 91 | 88.5 (19.2) |
Figure S73. Get High-res Image Gene #13: 'amp_xq28' versus Clinical Feature #8: 'KARNOFSKY_PERFORMANCE_SCORE'
P value = 1e-05 (Fisher's exact test), Q value = 7.6e-05
Table S74. Gene #13: 'amp_xq28' versus Clinical Feature #9: 'HISTOLOGICAL_TYPE'
| nPatients | KIDNEY CHROMOPHOBE | KIDNEY CLEAR CELL RENAL CARCINOMA | KIDNEY PAPILLARY RENAL CELL CARCINOMA |
|---|---|---|---|
| ALL | 66 | 524 | 269 |
| AMP PEAK 13(XQ28) MUTATED | 8 | 37 | 87 |
| AMP PEAK 13(XQ28) WILD-TYPE | 58 | 487 | 182 |
Figure S74. Get High-res Image Gene #13: 'amp_xq28' versus Clinical Feature #9: 'HISTOLOGICAL_TYPE'
P value = 0.0774 (Wilcoxon-test), Q value = 0.17
Table S75. Gene #14: 'del_1p36.31' versus Clinical Feature #2: 'YEARS_TO_BIRTH'
| nPatients | Mean (Std.Dev) | |
|---|---|---|
| ALL | 853 | 60.1 (12.6) |
| DEL PEAK 1(1P36.31) MUTATED | 202 | 58.4 (13.7) |
| DEL PEAK 1(1P36.31) WILD-TYPE | 651 | 60.6 (12.2) |
Figure S75. Get High-res Image Gene #14: 'del_1p36.31' versus Clinical Feature #2: 'YEARS_TO_BIRTH'

P value = 1e-05 (Fisher's exact test), Q value = 7.6e-05
Table S76. Gene #14: 'del_1p36.31' versus Clinical Feature #3: 'NEOPLASM_DISEASESTAGE'
| nPatients | STAGE I | STAGE II | STAGE III | STAGE IV |
|---|---|---|---|---|
| ALL | 448 | 103 | 190 | 100 |
| DEL PEAK 1(1P36.31) MUTATED | 71 | 38 | 60 | 29 |
| DEL PEAK 1(1P36.31) WILD-TYPE | 377 | 65 | 130 | 71 |
Figure S76. Get High-res Image Gene #14: 'del_1p36.31' versus Clinical Feature #3: 'NEOPLASM_DISEASESTAGE'
P value = 1e-05 (Fisher's exact test), Q value = 7.6e-05
Table S77. Gene #14: 'del_1p36.31' versus Clinical Feature #4: 'PATHOLOGY_T_STAGE'
| nPatients | T1 | T2 | T3 | T4 |
|---|---|---|---|---|
| ALL | 462 | 123 | 251 | 15 |
| DEL PEAK 1(1P36.31) MUTATED | 77 | 45 | 73 | 6 |
| DEL PEAK 1(1P36.31) WILD-TYPE | 385 | 78 | 178 | 9 |
Figure S77. Get High-res Image Gene #14: 'del_1p36.31' versus Clinical Feature #4: 'PATHOLOGY_T_STAGE'

P value = 0.0685 (Fisher's exact test), Q value = 0.16
Table S78. Gene #14: 'del_1p36.31' versus Clinical Feature #5: 'PATHOLOGY_N_STAGE'
| nPatients | N0 | N1 | N2 |
|---|---|---|---|
| ALL | 317 | 43 | 6 |
| DEL PEAK 1(1P36.31) MUTATED | 92 | 19 | 3 |
| DEL PEAK 1(1P36.31) WILD-TYPE | 225 | 24 | 3 |
Figure S78. Get High-res Image Gene #14: 'del_1p36.31' versus Clinical Feature #5: 'PATHOLOGY_N_STAGE'
P value = 0.0152 (Wilcoxon-test), Q value = 0.045
Table S79. Gene #14: 'del_1p36.31' versus Clinical Feature #8: 'KARNOFSKY_PERFORMANCE_SCORE'
| nPatients | Mean (Std.Dev) | |
|---|---|---|
| ALL | 115 | 90.3 (17.6) |
| DEL PEAK 1(1P36.31) MUTATED | 26 | 86.2 (19.8) |
| DEL PEAK 1(1P36.31) WILD-TYPE | 89 | 91.5 (16.8) |
Figure S79. Get High-res Image Gene #14: 'del_1p36.31' versus Clinical Feature #8: 'KARNOFSKY_PERFORMANCE_SCORE'
P value = 1e-05 (Fisher's exact test), Q value = 7.6e-05
Table S80. Gene #14: 'del_1p36.31' versus Clinical Feature #9: 'HISTOLOGICAL_TYPE'
| nPatients | KIDNEY CHROMOPHOBE | KIDNEY CLEAR CELL RENAL CARCINOMA | KIDNEY PAPILLARY RENAL CELL CARCINOMA |
|---|---|---|---|
| ALL | 66 | 524 | 269 |
| DEL PEAK 1(1P36.31) MUTATED | 53 | 101 | 49 |
| DEL PEAK 1(1P36.31) WILD-TYPE | 13 | 423 | 220 |
Figure S80. Get High-res Image Gene #14: 'del_1p36.31' versus Clinical Feature #9: 'HISTOLOGICAL_TYPE'
P value = 0.0352 (Wilcoxon-test), Q value = 0.091
Table S81. Gene #15: 'del_1p31.1' versus Clinical Feature #2: 'YEARS_TO_BIRTH'
| nPatients | Mean (Std.Dev) | |
|---|---|---|
| ALL | 853 | 60.1 (12.6) |
| DEL PEAK 2(1P31.1) MUTATED | 161 | 57.8 (13.8) |
| DEL PEAK 2(1P31.1) WILD-TYPE | 692 | 60.6 (12.2) |
Figure S81. Get High-res Image Gene #15: 'del_1p31.1' versus Clinical Feature #2: 'YEARS_TO_BIRTH'
P value = 4e-05 (Fisher's exact test), Q value = 0.00028
Table S82. Gene #15: 'del_1p31.1' versus Clinical Feature #3: 'NEOPLASM_DISEASESTAGE'
| nPatients | STAGE I | STAGE II | STAGE III | STAGE IV |
|---|---|---|---|---|
| ALL | 448 | 103 | 190 | 100 |
| DEL PEAK 2(1P31.1) MUTATED | 59 | 34 | 43 | 22 |
| DEL PEAK 2(1P31.1) WILD-TYPE | 389 | 69 | 147 | 78 |
Figure S82. Get High-res Image Gene #15: 'del_1p31.1' versus Clinical Feature #3: 'NEOPLASM_DISEASESTAGE'
P value = 5e-05 (Fisher's exact test), Q value = 0.00033
Table S83. Gene #15: 'del_1p31.1' versus Clinical Feature #4: 'PATHOLOGY_T_STAGE'
| nPatients | T1 | T2 | T3 | T4 |
|---|---|---|---|---|
| ALL | 462 | 123 | 251 | 15 |
| DEL PEAK 2(1P31.1) MUTATED | 64 | 38 | 52 | 6 |
| DEL PEAK 2(1P31.1) WILD-TYPE | 398 | 85 | 199 | 9 |
Figure S83. Get High-res Image Gene #15: 'del_1p31.1' versus Clinical Feature #4: 'PATHOLOGY_T_STAGE'
P value = 0.102 (Fisher's exact test), Q value = 0.21
Table S84. Gene #15: 'del_1p31.1' versus Clinical Feature #5: 'PATHOLOGY_N_STAGE'
| nPatients | N0 | N1 | N2 |
|---|---|---|---|
| ALL | 317 | 43 | 6 |
| DEL PEAK 2(1P31.1) MUTATED | 72 | 14 | 3 |
| DEL PEAK 2(1P31.1) WILD-TYPE | 245 | 29 | 3 |
Figure S84. Get High-res Image Gene #15: 'del_1p31.1' versus Clinical Feature #5: 'PATHOLOGY_N_STAGE'
P value = 1e-05 (Fisher's exact test), Q value = 7.6e-05
Table S85. Gene #15: 'del_1p31.1' versus Clinical Feature #9: 'HISTOLOGICAL_TYPE'
| nPatients | KIDNEY CHROMOPHOBE | KIDNEY CLEAR CELL RENAL CARCINOMA | KIDNEY PAPILLARY RENAL CELL CARCINOMA |
|---|---|---|---|
| ALL | 66 | 524 | 269 |
| DEL PEAK 2(1P31.1) MUTATED | 53 | 76 | 32 |
| DEL PEAK 2(1P31.1) WILD-TYPE | 13 | 448 | 237 |
Figure S85. Get High-res Image Gene #15: 'del_1p31.1' versus Clinical Feature #9: 'HISTOLOGICAL_TYPE'
P value = 0.0856 (Fisher's exact test), Q value = 0.19
Table S86. Gene #15: 'del_1p31.1' versus Clinical Feature #13: 'ETHNICITY'
| nPatients | HISPANIC OR LATINO | NOT HISPANIC OR LATINO |
|---|---|---|
| ALL | 42 | 597 |
| DEL PEAK 2(1P31.1) MUTATED | 11 | 94 |
| DEL PEAK 2(1P31.1) WILD-TYPE | 31 | 503 |
Figure S86. Get High-res Image Gene #15: 'del_1p31.1' versus Clinical Feature #13: 'ETHNICITY'
P value = 0.0476 (logrank test), Q value = 0.12
Table S87. Gene #16: 'del_1q43' versus Clinical Feature #1: 'Time to Death'
| nPatients | nDeath | Duration Range (Median), Month | |
|---|---|---|---|
| ALL | 843 | 211 | 0.1 - 194.8 (30.5) |
| DEL PEAK 3(1Q43) MUTATED | 111 | 26 | 0.1 - 152.0 (47.2) |
| DEL PEAK 3(1Q43) WILD-TYPE | 732 | 185 | 0.1 - 194.8 (29.0) |
Figure S87. Get High-res Image Gene #16: 'del_1q43' versus Clinical Feature #1: 'Time to Death'
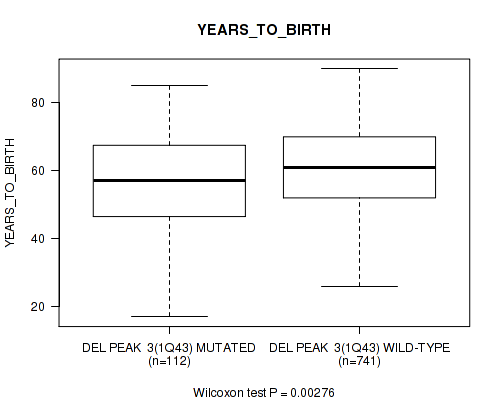
P value = 0.00276 (Wilcoxon-test), Q value = 0.011
Table S88. Gene #16: 'del_1q43' versus Clinical Feature #2: 'YEARS_TO_BIRTH'
| nPatients | Mean (Std.Dev) | |
|---|---|---|
| ALL | 853 | 60.1 (12.6) |
| DEL PEAK 3(1Q43) MUTATED | 112 | 56.4 (14.3) |
| DEL PEAK 3(1Q43) WILD-TYPE | 741 | 60.7 (12.2) |
Figure S88. Get High-res Image Gene #16: 'del_1q43' versus Clinical Feature #2: 'YEARS_TO_BIRTH'
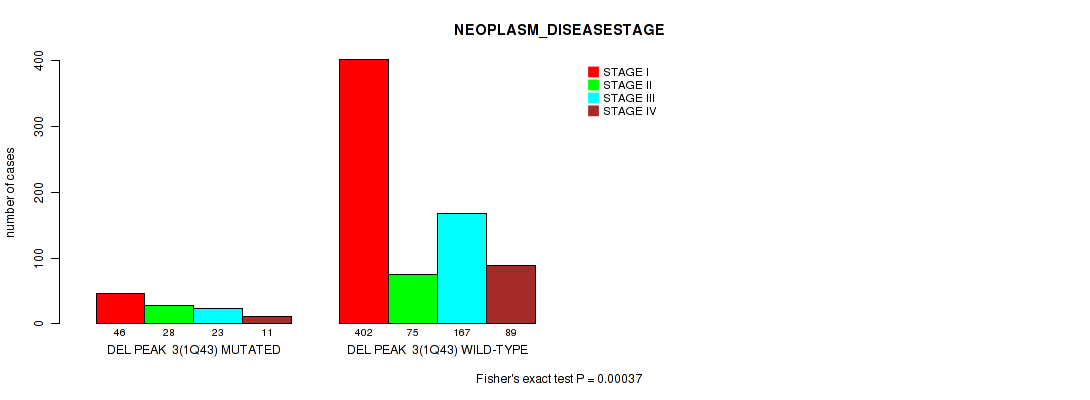
P value = 0.00037 (Fisher's exact test), Q value = 0.0019
Table S89. Gene #16: 'del_1q43' versus Clinical Feature #3: 'NEOPLASM_DISEASESTAGE'
| nPatients | STAGE I | STAGE II | STAGE III | STAGE IV |
|---|---|---|---|---|
| ALL | 448 | 103 | 190 | 100 |
| DEL PEAK 3(1Q43) MUTATED | 46 | 28 | 23 | 11 |
| DEL PEAK 3(1Q43) WILD-TYPE | 402 | 75 | 167 | 89 |
Figure S89. Get High-res Image Gene #16: 'del_1q43' versus Clinical Feature #3: 'NEOPLASM_DISEASESTAGE'
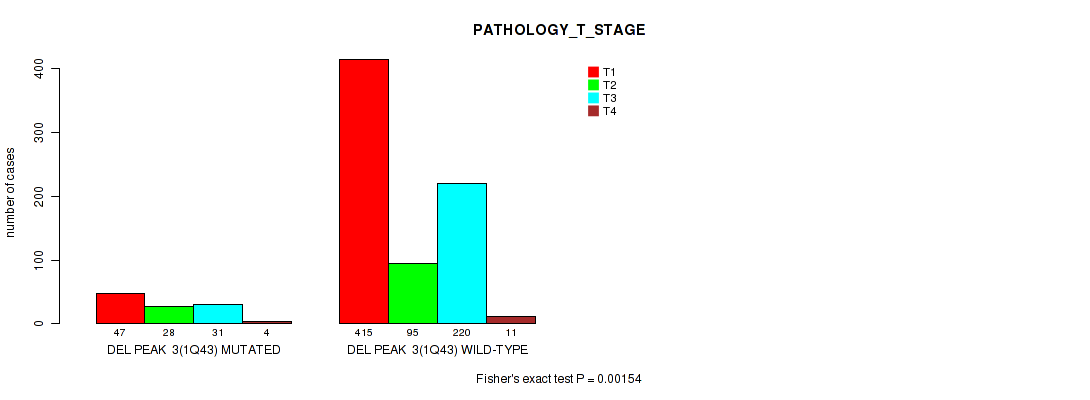
P value = 0.00154 (Fisher's exact test), Q value = 0.0066
Table S90. Gene #16: 'del_1q43' versus Clinical Feature #4: 'PATHOLOGY_T_STAGE'
| nPatients | T1 | T2 | T3 | T4 |
|---|---|---|---|---|
| ALL | 462 | 123 | 251 | 15 |
| DEL PEAK 3(1Q43) MUTATED | 47 | 28 | 31 | 4 |
| DEL PEAK 3(1Q43) WILD-TYPE | 415 | 95 | 220 | 11 |
Figure S90. Get High-res Image Gene #16: 'del_1q43' versus Clinical Feature #4: 'PATHOLOGY_T_STAGE'
P value = 1e-05 (Fisher's exact test), Q value = 7.6e-05
Table S91. Gene #16: 'del_1q43' versus Clinical Feature #9: 'HISTOLOGICAL_TYPE'
| nPatients | KIDNEY CHROMOPHOBE | KIDNEY CLEAR CELL RENAL CARCINOMA | KIDNEY PAPILLARY RENAL CELL CARCINOMA |
|---|---|---|---|
| ALL | 66 | 524 | 269 |
| DEL PEAK 3(1Q43) MUTATED | 51 | 42 | 19 |
| DEL PEAK 3(1Q43) WILD-TYPE | 15 | 482 | 250 |
Figure S91. Get High-res Image Gene #16: 'del_1q43' versus Clinical Feature #9: 'HISTOLOGICAL_TYPE'
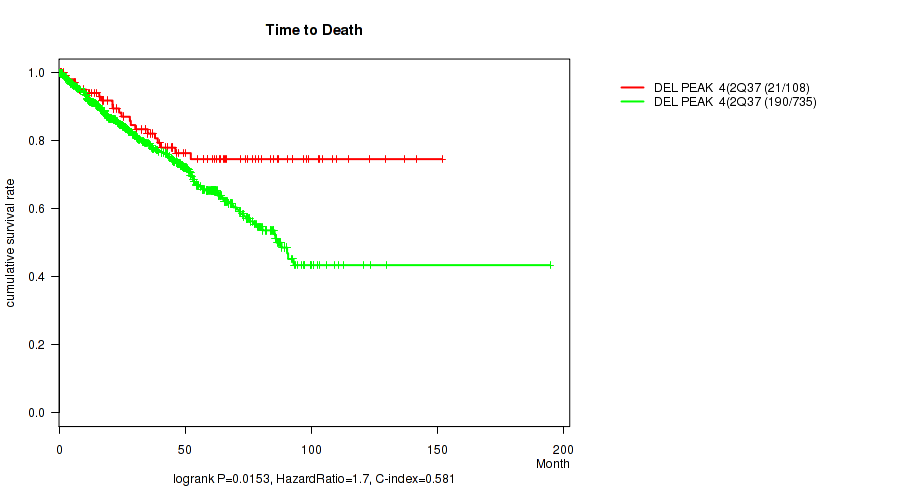
P value = 0.0153 (logrank test), Q value = 0.045
Table S92. Gene #17: 'del_2q37.3' versus Clinical Feature #1: 'Time to Death'
| nPatients | nDeath | Duration Range (Median), Month | |
|---|---|---|---|
| ALL | 843 | 211 | 0.1 - 194.8 (30.5) |
| DEL PEAK 4(2Q37.3) MUTATED | 108 | 21 | 0.4 - 152.0 (42.7) |
| DEL PEAK 4(2Q37.3) WILD-TYPE | 735 | 190 | 0.1 - 194.8 (29.0) |
Figure S92. Get High-res Image Gene #17: 'del_2q37.3' versus Clinical Feature #1: 'Time to Death'
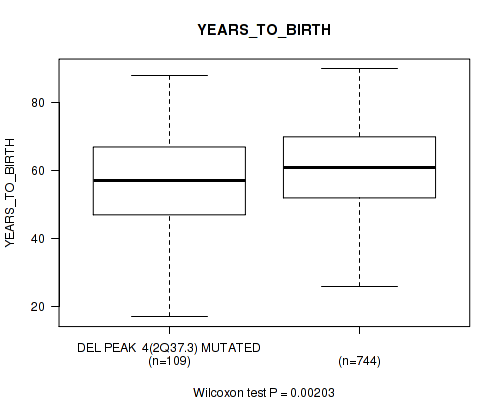
P value = 0.00203 (Wilcoxon-test), Q value = 0.0083
Table S93. Gene #17: 'del_2q37.3' versus Clinical Feature #2: 'YEARS_TO_BIRTH'
| nPatients | Mean (Std.Dev) | |
|---|---|---|
| ALL | 853 | 60.1 (12.6) |
| DEL PEAK 4(2Q37.3) MUTATED | 109 | 56.4 (14.0) |
| DEL PEAK 4(2Q37.3) WILD-TYPE | 744 | 60.6 (12.3) |
Figure S93. Get High-res Image Gene #17: 'del_2q37.3' versus Clinical Feature #2: 'YEARS_TO_BIRTH'
P value = 1e-05 (Fisher's exact test), Q value = 7.6e-05
Table S94. Gene #17: 'del_2q37.3' versus Clinical Feature #3: 'NEOPLASM_DISEASESTAGE'
| nPatients | STAGE I | STAGE II | STAGE III | STAGE IV |
|---|---|---|---|---|
| ALL | 448 | 103 | 190 | 100 |
| DEL PEAK 4(2Q37.3) MUTATED | 38 | 32 | 28 | 10 |
| DEL PEAK 4(2Q37.3) WILD-TYPE | 410 | 71 | 162 | 90 |
Figure S94. Get High-res Image Gene #17: 'del_2q37.3' versus Clinical Feature #3: 'NEOPLASM_DISEASESTAGE'

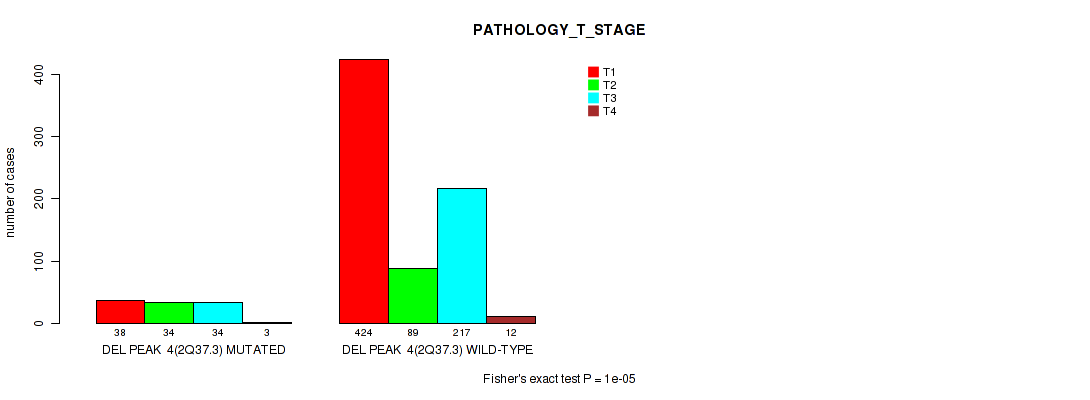
P value = 1e-05 (Fisher's exact test), Q value = 7.6e-05
Table S95. Gene #17: 'del_2q37.3' versus Clinical Feature #4: 'PATHOLOGY_T_STAGE'
| nPatients | T1 | T2 | T3 | T4 |
|---|---|---|---|---|
| ALL | 462 | 123 | 251 | 15 |
| DEL PEAK 4(2Q37.3) MUTATED | 38 | 34 | 34 | 3 |
| DEL PEAK 4(2Q37.3) WILD-TYPE | 424 | 89 | 217 | 12 |
Figure S95. Get High-res Image Gene #17: 'del_2q37.3' versus Clinical Feature #4: 'PATHOLOGY_T_STAGE'
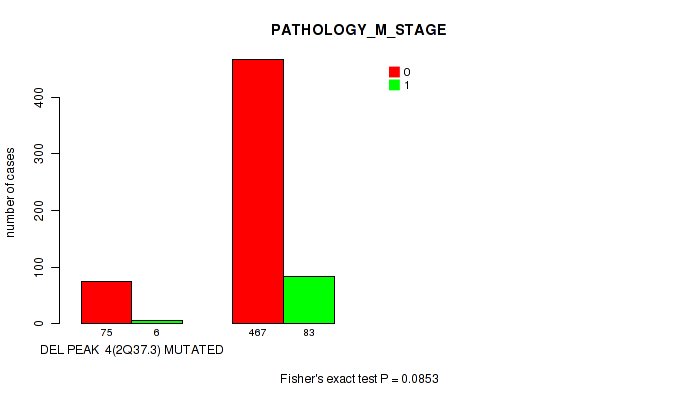
P value = 0.0853 (Fisher's exact test), Q value = 0.19
Table S96. Gene #17: 'del_2q37.3' versus Clinical Feature #6: 'PATHOLOGY_M_STAGE'
| nPatients | 0 | 1 |
|---|---|---|
| ALL | 542 | 89 |
| DEL PEAK 4(2Q37.3) MUTATED | 75 | 6 |
| DEL PEAK 4(2Q37.3) WILD-TYPE | 467 | 83 |
Figure S96. Get High-res Image Gene #17: 'del_2q37.3' versus Clinical Feature #6: 'PATHOLOGY_M_STAGE'
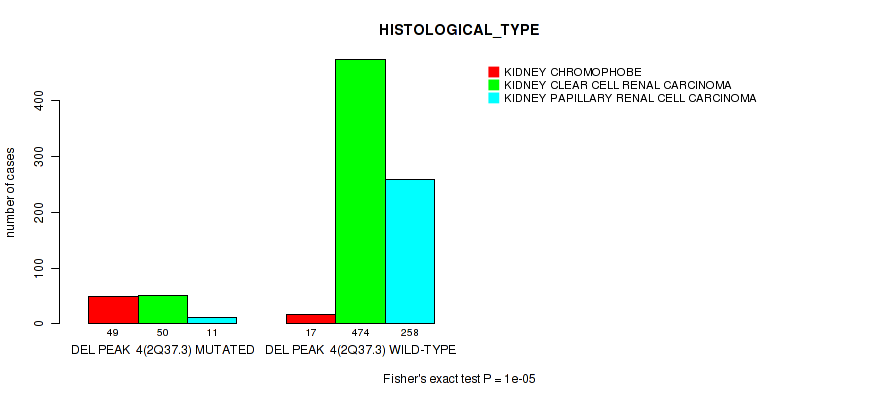
P value = 1e-05 (Fisher's exact test), Q value = 7.6e-05
Table S97. Gene #17: 'del_2q37.3' versus Clinical Feature #9: 'HISTOLOGICAL_TYPE'
| nPatients | KIDNEY CHROMOPHOBE | KIDNEY CLEAR CELL RENAL CARCINOMA | KIDNEY PAPILLARY RENAL CELL CARCINOMA |
|---|---|---|---|
| ALL | 66 | 524 | 269 |
| DEL PEAK 4(2Q37.3) MUTATED | 49 | 50 | 11 |
| DEL PEAK 4(2Q37.3) WILD-TYPE | 17 | 474 | 258 |
Figure S97. Get High-res Image Gene #17: 'del_2q37.3' versus Clinical Feature #9: 'HISTOLOGICAL_TYPE'
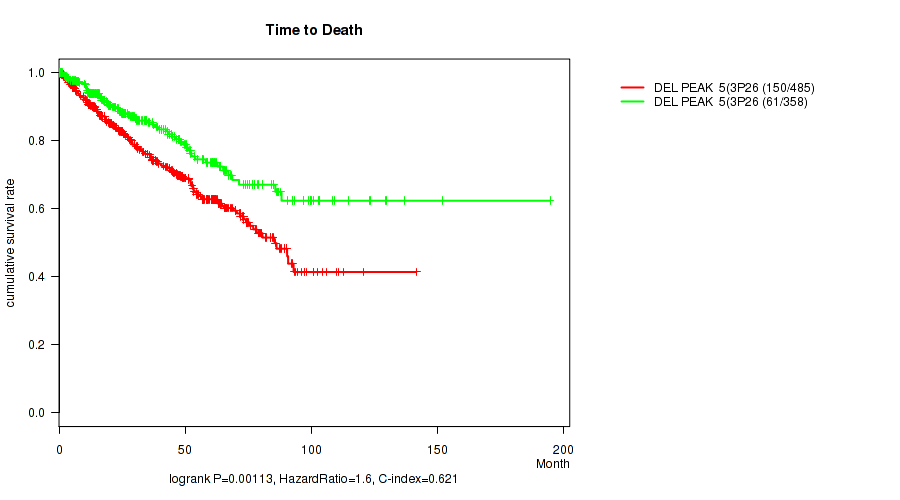
P value = 0.00113 (logrank test), Q value = 0.0051
Table S98. Gene #18: 'del_3p26.3' versus Clinical Feature #1: 'Time to Death'
| nPatients | nDeath | Duration Range (Median), Month | |
|---|---|---|---|
| ALL | 843 | 211 | 0.1 - 194.8 (30.5) |
| DEL PEAK 5(3P26.3) MUTATED | 485 | 150 | 0.1 - 141.7 (36.4) |
| DEL PEAK 5(3P26.3) WILD-TYPE | 358 | 61 | 0.1 - 194.8 (25.9) |
Figure S98. Get High-res Image Gene #18: 'del_3p26.3' versus Clinical Feature #1: 'Time to Death'
P value = 1e-05 (Fisher's exact test), Q value = 7.6e-05
Table S99. Gene #18: 'del_3p26.3' versus Clinical Feature #3: 'NEOPLASM_DISEASESTAGE'
| nPatients | STAGE I | STAGE II | STAGE III | STAGE IV |
|---|---|---|---|---|
| ALL | 448 | 103 | 190 | 100 |
| DEL PEAK 5(3P26.3) MUTATED | 227 | 57 | 131 | 71 |
| DEL PEAK 5(3P26.3) WILD-TYPE | 221 | 46 | 59 | 29 |
Figure S99. Get High-res Image Gene #18: 'del_3p26.3' versus Clinical Feature #3: 'NEOPLASM_DISEASESTAGE'
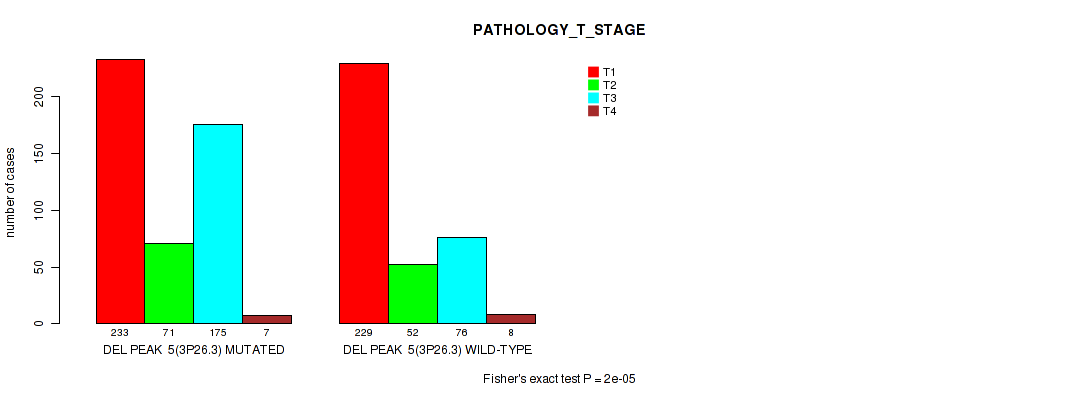
P value = 2e-05 (Fisher's exact test), Q value = 0.00015
Table S100. Gene #18: 'del_3p26.3' versus Clinical Feature #4: 'PATHOLOGY_T_STAGE'
| nPatients | T1 | T2 | T3 | T4 |
|---|---|---|---|---|
| ALL | 462 | 123 | 251 | 15 |
| DEL PEAK 5(3P26.3) MUTATED | 233 | 71 | 175 | 7 |
| DEL PEAK 5(3P26.3) WILD-TYPE | 229 | 52 | 76 | 8 |
Figure S100. Get High-res Image Gene #18: 'del_3p26.3' versus Clinical Feature #4: 'PATHOLOGY_T_STAGE'
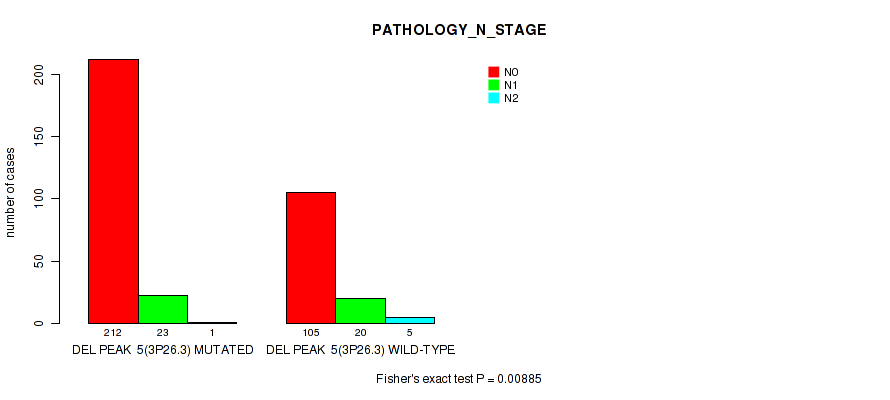
P value = 0.00885 (Fisher's exact test), Q value = 0.029
Table S101. Gene #18: 'del_3p26.3' versus Clinical Feature #5: 'PATHOLOGY_N_STAGE'
| nPatients | N0 | N1 | N2 |
|---|---|---|---|
| ALL | 317 | 43 | 6 |
| DEL PEAK 5(3P26.3) MUTATED | 212 | 23 | 1 |
| DEL PEAK 5(3P26.3) WILD-TYPE | 105 | 20 | 5 |
Figure S101. Get High-res Image Gene #18: 'del_3p26.3' versus Clinical Feature #5: 'PATHOLOGY_N_STAGE'
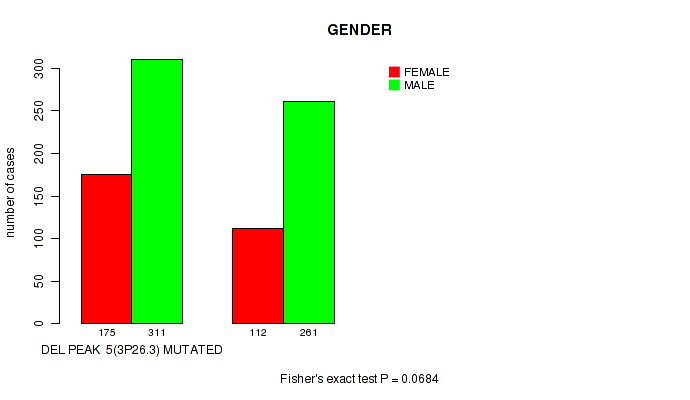
P value = 0.0684 (Fisher's exact test), Q value = 0.16
Table S102. Gene #18: 'del_3p26.3' versus Clinical Feature #7: 'GENDER'
| nPatients | FEMALE | MALE |
|---|---|---|
| ALL | 287 | 572 |
| DEL PEAK 5(3P26.3) MUTATED | 175 | 311 |
| DEL PEAK 5(3P26.3) WILD-TYPE | 112 | 261 |
Figure S102. Get High-res Image Gene #18: 'del_3p26.3' versus Clinical Feature #7: 'GENDER'
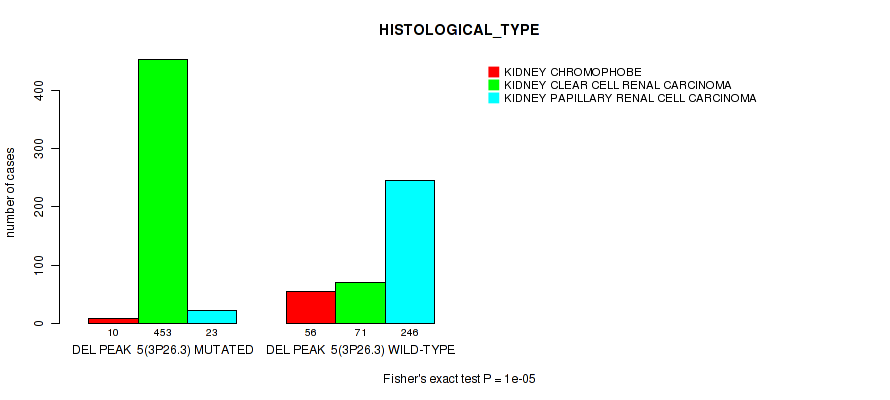
P value = 1e-05 (Fisher's exact test), Q value = 7.6e-05
Table S103. Gene #18: 'del_3p26.3' versus Clinical Feature #9: 'HISTOLOGICAL_TYPE'
| nPatients | KIDNEY CHROMOPHOBE | KIDNEY CLEAR CELL RENAL CARCINOMA | KIDNEY PAPILLARY RENAL CELL CARCINOMA |
|---|---|---|---|
| ALL | 66 | 524 | 269 |
| DEL PEAK 5(3P26.3) MUTATED | 10 | 453 | 23 |
| DEL PEAK 5(3P26.3) WILD-TYPE | 56 | 71 | 246 |
Figure S103. Get High-res Image Gene #18: 'del_3p26.3' versus Clinical Feature #9: 'HISTOLOGICAL_TYPE'
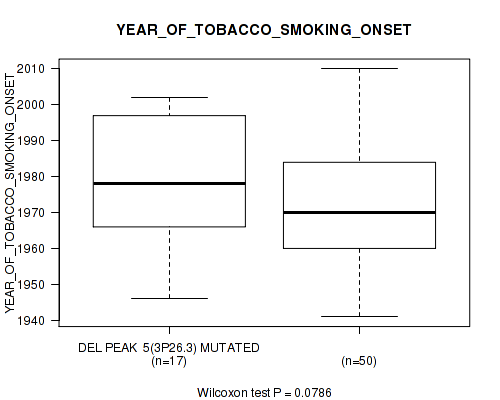
P value = 0.0786 (Wilcoxon-test), Q value = 0.18
Table S104. Gene #18: 'del_3p26.3' versus Clinical Feature #11: 'YEAR_OF_TOBACCO_SMOKING_ONSET'
| nPatients | Mean (Std.Dev) | |
|---|---|---|
| ALL | 67 | 1973.4 (16.4) |
| DEL PEAK 5(3P26.3) MUTATED | 17 | 1979.4 (18.6) |
| DEL PEAK 5(3P26.3) WILD-TYPE | 50 | 1971.4 (15.3) |
Figure S104. Get High-res Image Gene #18: 'del_3p26.3' versus Clinical Feature #11: 'YEAR_OF_TOBACCO_SMOKING_ONSET'
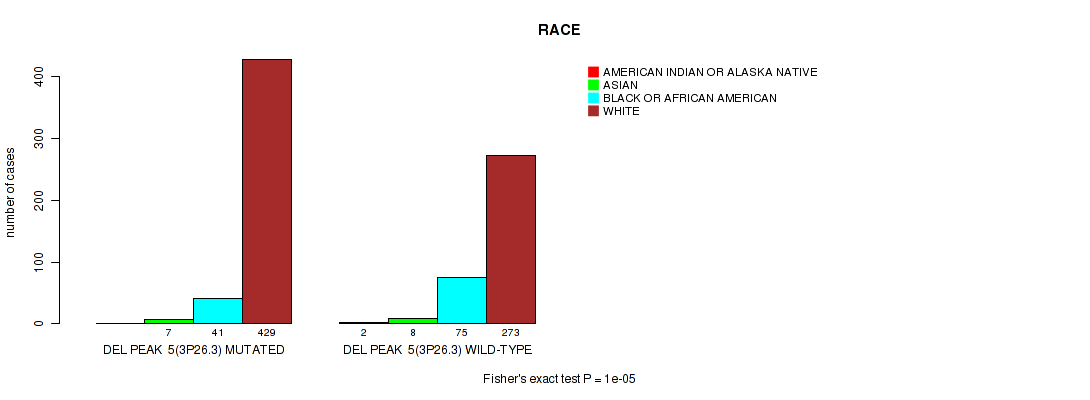
P value = 1e-05 (Fisher's exact test), Q value = 7.6e-05
Table S105. Gene #18: 'del_3p26.3' versus Clinical Feature #12: 'RACE'
| nPatients | AMERICAN INDIAN OR ALASKA NATIVE | ASIAN | BLACK OR AFRICAN AMERICAN | WHITE |
|---|---|---|---|---|
| ALL | 2 | 15 | 116 | 702 |
| DEL PEAK 5(3P26.3) MUTATED | 0 | 7 | 41 | 429 |
| DEL PEAK 5(3P26.3) WILD-TYPE | 2 | 8 | 75 | 273 |
Figure S105. Get High-res Image Gene #18: 'del_3p26.3' versus Clinical Feature #12: 'RACE'
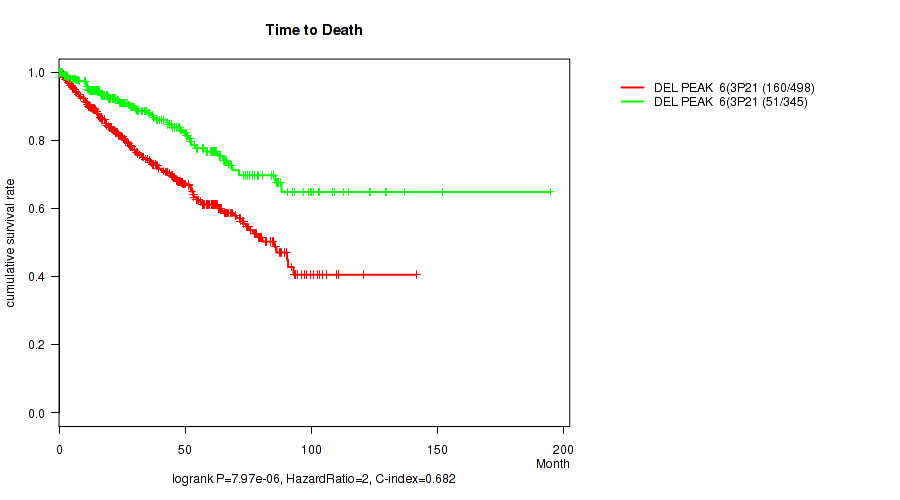
P value = 7.97e-06 (logrank test), Q value = 7.6e-05
Table S106. Gene #19: 'del_3p21.2' versus Clinical Feature #1: 'Time to Death'
| nPatients | nDeath | Duration Range (Median), Month | |
|---|---|---|---|
| ALL | 843 | 211 | 0.1 - 194.8 (30.5) |
| DEL PEAK 6(3P21.2) MUTATED | 498 | 160 | 0.1 - 141.7 (35.1) |
| DEL PEAK 6(3P21.2) WILD-TYPE | 345 | 51 | 0.1 - 194.8 (26.4) |
Figure S106. Get High-res Image Gene #19: 'del_3p21.2' versus Clinical Feature #1: 'Time to Death'
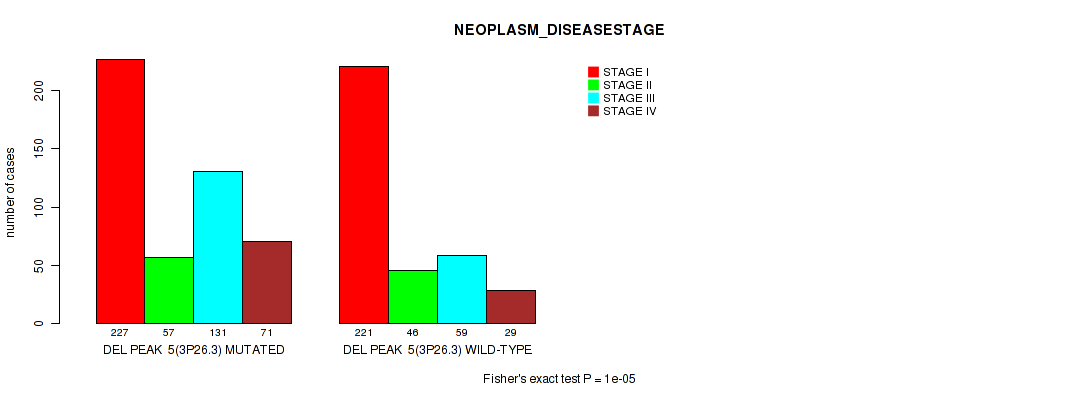
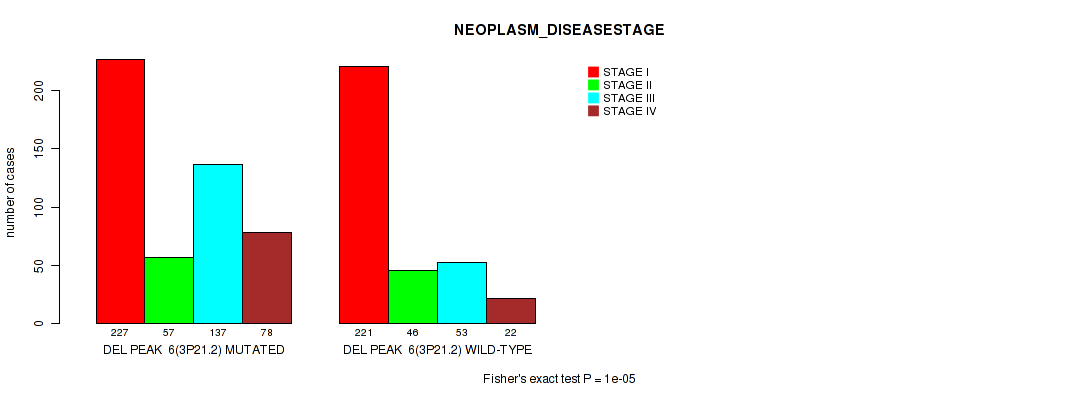
P value = 1e-05 (Fisher's exact test), Q value = 7.6e-05
Table S107. Gene #19: 'del_3p21.2' versus Clinical Feature #3: 'NEOPLASM_DISEASESTAGE'
| nPatients | STAGE I | STAGE II | STAGE III | STAGE IV |
|---|---|---|---|---|
| ALL | 448 | 103 | 190 | 100 |
| DEL PEAK 6(3P21.2) MUTATED | 227 | 57 | 137 | 78 |
| DEL PEAK 6(3P21.2) WILD-TYPE | 221 | 46 | 53 | 22 |
Figure S107. Get High-res Image Gene #19: 'del_3p21.2' versus Clinical Feature #3: 'NEOPLASM_DISEASESTAGE'
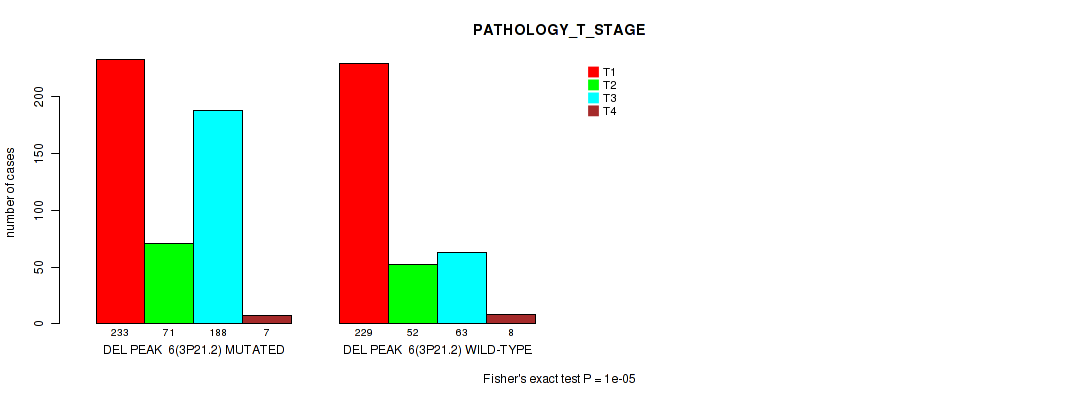
P value = 1e-05 (Fisher's exact test), Q value = 7.6e-05
Table S108. Gene #19: 'del_3p21.2' versus Clinical Feature #4: 'PATHOLOGY_T_STAGE'
| nPatients | T1 | T2 | T3 | T4 |
|---|---|---|---|---|
| ALL | 462 | 123 | 251 | 15 |
| DEL PEAK 6(3P21.2) MUTATED | 233 | 71 | 188 | 7 |
| DEL PEAK 6(3P21.2) WILD-TYPE | 229 | 52 | 63 | 8 |
Figure S108. Get High-res Image Gene #19: 'del_3p21.2' versus Clinical Feature #4: 'PATHOLOGY_T_STAGE'
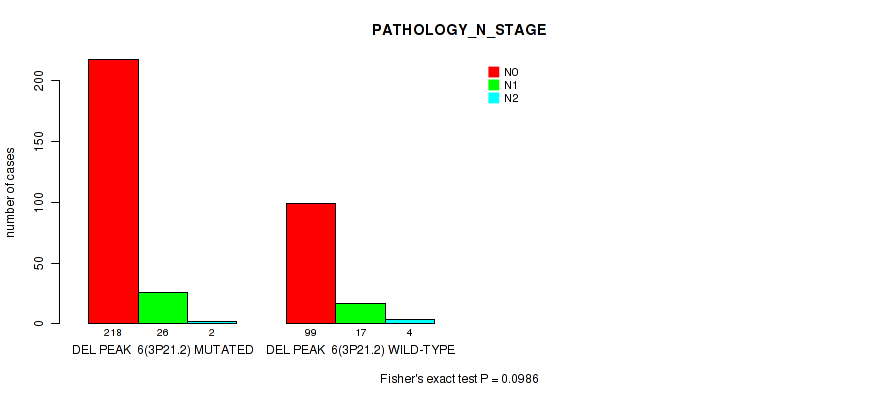
P value = 0.0986 (Fisher's exact test), Q value = 0.21
Table S109. Gene #19: 'del_3p21.2' versus Clinical Feature #5: 'PATHOLOGY_N_STAGE'
| nPatients | N0 | N1 | N2 |
|---|---|---|---|
| ALL | 317 | 43 | 6 |
| DEL PEAK 6(3P21.2) MUTATED | 218 | 26 | 2 |
| DEL PEAK 6(3P21.2) WILD-TYPE | 99 | 17 | 4 |
Figure S109. Get High-res Image Gene #19: 'del_3p21.2' versus Clinical Feature #5: 'PATHOLOGY_N_STAGE'
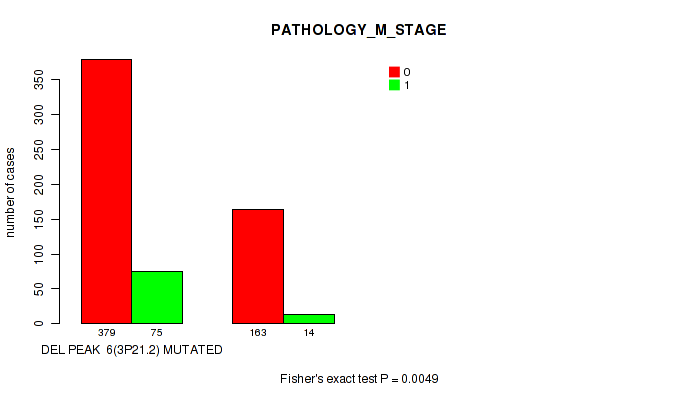
P value = 0.0049 (Fisher's exact test), Q value = 0.017
Table S110. Gene #19: 'del_3p21.2' versus Clinical Feature #6: 'PATHOLOGY_M_STAGE'
| nPatients | 0 | 1 |
|---|---|---|
| ALL | 542 | 89 |
| DEL PEAK 6(3P21.2) MUTATED | 379 | 75 |
| DEL PEAK 6(3P21.2) WILD-TYPE | 163 | 14 |
Figure S110. Get High-res Image Gene #19: 'del_3p21.2' versus Clinical Feature #6: 'PATHOLOGY_M_STAGE'
P value = 0.0596 (Wilcoxon-test), Q value = 0.14
Table S111. Gene #19: 'del_3p21.2' versus Clinical Feature #8: 'KARNOFSKY_PERFORMANCE_SCORE'
| nPatients | Mean (Std.Dev) | |
|---|---|---|
| ALL | 115 | 90.3 (17.6) |
| DEL PEAK 6(3P21.2) MUTATED | 48 | 86.0 (24.0) |
| DEL PEAK 6(3P21.2) WILD-TYPE | 67 | 93.3 (10.1) |
Figure S111. Get High-res Image Gene #19: 'del_3p21.2' versus Clinical Feature #8: 'KARNOFSKY_PERFORMANCE_SCORE'

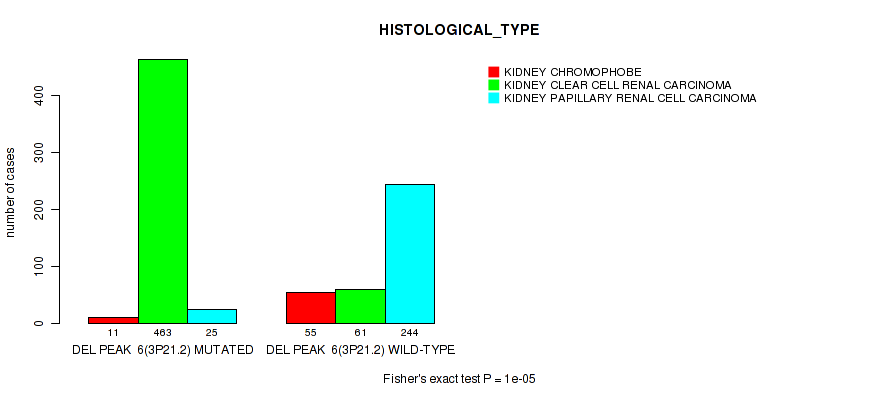
P value = 1e-05 (Fisher's exact test), Q value = 7.6e-05
Table S112. Gene #19: 'del_3p21.2' versus Clinical Feature #9: 'HISTOLOGICAL_TYPE'
| nPatients | KIDNEY CHROMOPHOBE | KIDNEY CLEAR CELL RENAL CARCINOMA | KIDNEY PAPILLARY RENAL CELL CARCINOMA |
|---|---|---|---|
| ALL | 66 | 524 | 269 |
| DEL PEAK 6(3P21.2) MUTATED | 11 | 463 | 25 |
| DEL PEAK 6(3P21.2) WILD-TYPE | 55 | 61 | 244 |
Figure S112. Get High-res Image Gene #19: 'del_3p21.2' versus Clinical Feature #9: 'HISTOLOGICAL_TYPE'
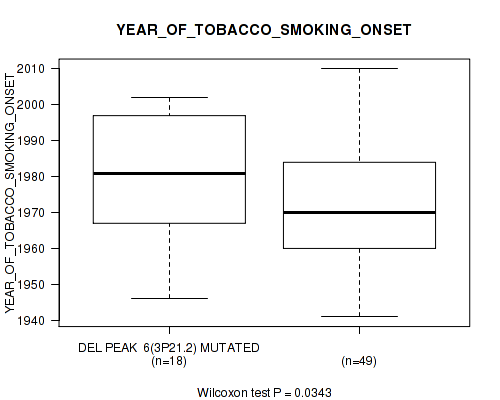
P value = 0.0343 (Wilcoxon-test), Q value = 0.089
Table S113. Gene #19: 'del_3p21.2' versus Clinical Feature #11: 'YEAR_OF_TOBACCO_SMOKING_ONSET'
| nPatients | Mean (Std.Dev) | |
|---|---|---|
| ALL | 67 | 1973.4 (16.4) |
| DEL PEAK 6(3P21.2) MUTATED | 18 | 1980.1 (17.8) |
| DEL PEAK 6(3P21.2) WILD-TYPE | 49 | 1971.0 (15.3) |
Figure S113. Get High-res Image Gene #19: 'del_3p21.2' versus Clinical Feature #11: 'YEAR_OF_TOBACCO_SMOKING_ONSET'
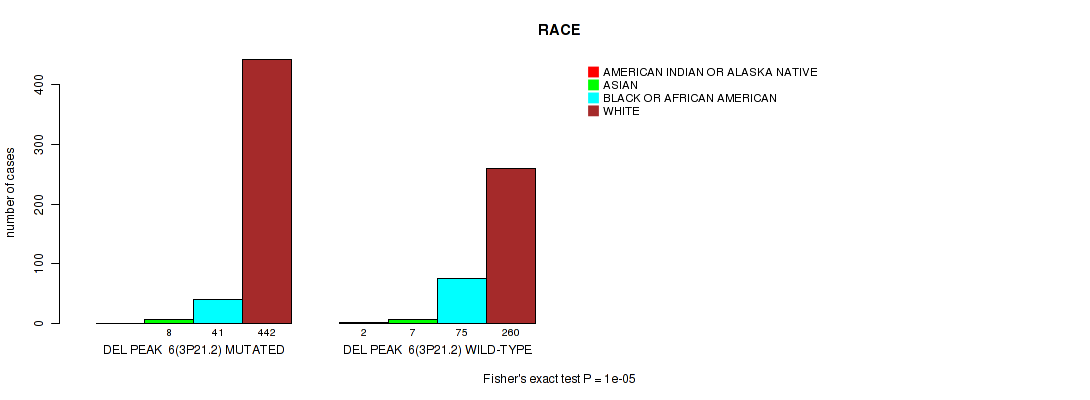
P value = 1e-05 (Fisher's exact test), Q value = 7.6e-05
Table S114. Gene #19: 'del_3p21.2' versus Clinical Feature #12: 'RACE'
| nPatients | AMERICAN INDIAN OR ALASKA NATIVE | ASIAN | BLACK OR AFRICAN AMERICAN | WHITE |
|---|---|---|---|---|
| ALL | 2 | 15 | 116 | 702 |
| DEL PEAK 6(3P21.2) MUTATED | 0 | 8 | 41 | 442 |
| DEL PEAK 6(3P21.2) WILD-TYPE | 2 | 7 | 75 | 260 |
Figure S114. Get High-res Image Gene #19: 'del_3p21.2' versus Clinical Feature #12: 'RACE'
P value = 0.00206 (logrank test), Q value = 0.0083
Table S115. Gene #20: 'del_3p14.1' versus Clinical Feature #1: 'Time to Death'
| nPatients | nDeath | Duration Range (Median), Month | |
|---|---|---|---|
| ALL | 843 | 211 | 0.1 - 194.8 (30.5) |
| DEL PEAK 7(3P14.1) MUTATED | 405 | 128 | 0.1 - 141.7 (36.4) |
| DEL PEAK 7(3P14.1) WILD-TYPE | 438 | 83 | 0.1 - 194.8 (27.1) |
Figure S115. Get High-res Image Gene #20: 'del_3p14.1' versus Clinical Feature #1: 'Time to Death'

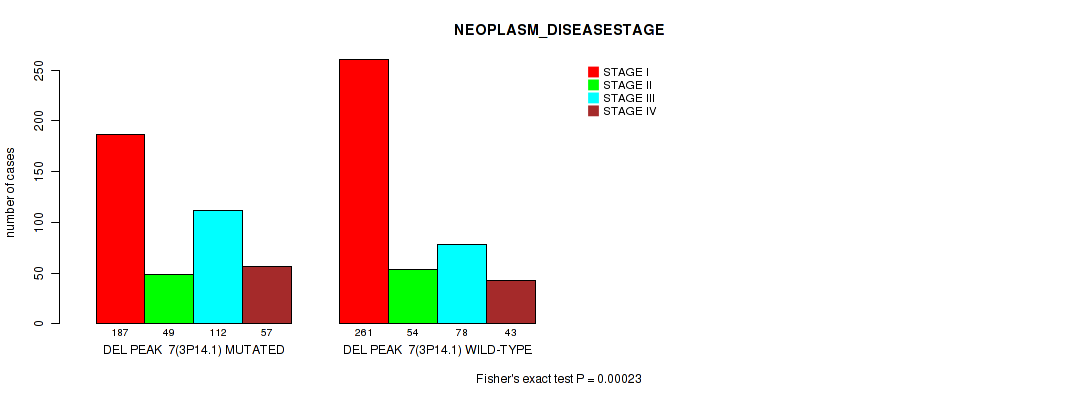
P value = 0.00023 (Fisher's exact test), Q value = 0.0012
Table S116. Gene #20: 'del_3p14.1' versus Clinical Feature #3: 'NEOPLASM_DISEASESTAGE'
| nPatients | STAGE I | STAGE II | STAGE III | STAGE IV |
|---|---|---|---|---|
| ALL | 448 | 103 | 190 | 100 |
| DEL PEAK 7(3P14.1) MUTATED | 187 | 49 | 112 | 57 |
| DEL PEAK 7(3P14.1) WILD-TYPE | 261 | 54 | 78 | 43 |
Figure S116. Get High-res Image Gene #20: 'del_3p14.1' versus Clinical Feature #3: 'NEOPLASM_DISEASESTAGE'
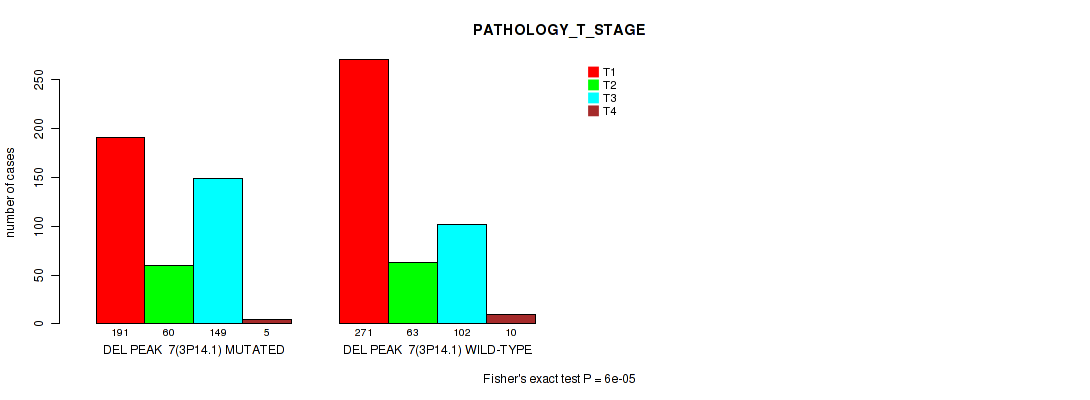
P value = 6e-05 (Fisher's exact test), Q value = 0.00038
Table S117. Gene #20: 'del_3p14.1' versus Clinical Feature #4: 'PATHOLOGY_T_STAGE'
| nPatients | T1 | T2 | T3 | T4 |
|---|---|---|---|---|
| ALL | 462 | 123 | 251 | 15 |
| DEL PEAK 7(3P14.1) MUTATED | 191 | 60 | 149 | 5 |
| DEL PEAK 7(3P14.1) WILD-TYPE | 271 | 63 | 102 | 10 |
Figure S117. Get High-res Image Gene #20: 'del_3p14.1' versus Clinical Feature #4: 'PATHOLOGY_T_STAGE'
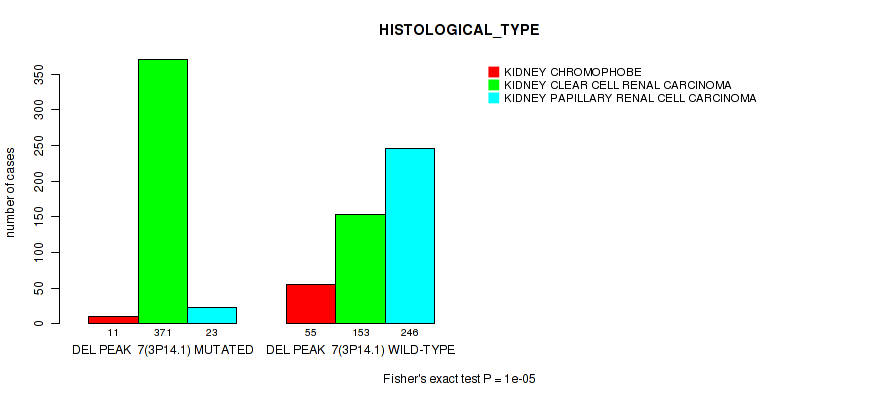
P value = 1e-05 (Fisher's exact test), Q value = 7.6e-05
Table S118. Gene #20: 'del_3p14.1' versus Clinical Feature #9: 'HISTOLOGICAL_TYPE'
| nPatients | KIDNEY CHROMOPHOBE | KIDNEY CLEAR CELL RENAL CARCINOMA | KIDNEY PAPILLARY RENAL CELL CARCINOMA |
|---|---|---|---|
| ALL | 66 | 524 | 269 |
| DEL PEAK 7(3P14.1) MUTATED | 11 | 371 | 23 |
| DEL PEAK 7(3P14.1) WILD-TYPE | 55 | 153 | 246 |
Figure S118. Get High-res Image Gene #20: 'del_3p14.1' versus Clinical Feature #9: 'HISTOLOGICAL_TYPE'
P value = 0.055 (Wilcoxon-test), Q value = 0.13
Table S119. Gene #20: 'del_3p14.1' versus Clinical Feature #11: 'YEAR_OF_TOBACCO_SMOKING_ONSET'
| nPatients | Mean (Std.Dev) | |
|---|---|---|
| ALL | 67 | 1973.4 (16.4) |
| DEL PEAK 7(3P14.1) MUTATED | 15 | 1980.1 (18.7) |
| DEL PEAK 7(3P14.1) WILD-TYPE | 52 | 1971.5 (15.3) |
Figure S119. Get High-res Image Gene #20: 'del_3p14.1' versus Clinical Feature #11: 'YEAR_OF_TOBACCO_SMOKING_ONSET'
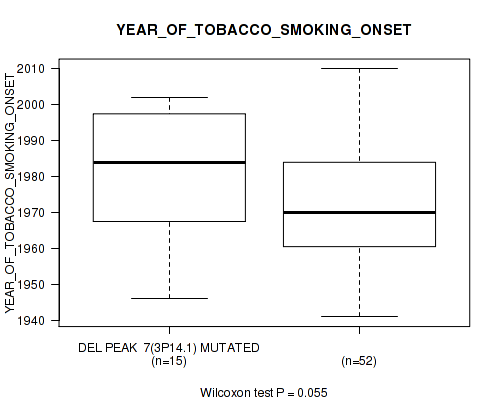
P value = 0.00013 (Fisher's exact test), Q value = 0.00076
Table S120. Gene #20: 'del_3p14.1' versus Clinical Feature #12: 'RACE'
| nPatients | AMERICAN INDIAN OR ALASKA NATIVE | ASIAN | BLACK OR AFRICAN AMERICAN | WHITE |
|---|---|---|---|---|
| ALL | 2 | 15 | 116 | 702 |
| DEL PEAK 7(3P14.1) MUTATED | 0 | 7 | 35 | 356 |
| DEL PEAK 7(3P14.1) WILD-TYPE | 2 | 8 | 81 | 346 |
Figure S120. Get High-res Image Gene #20: 'del_3p14.1' versus Clinical Feature #12: 'RACE'
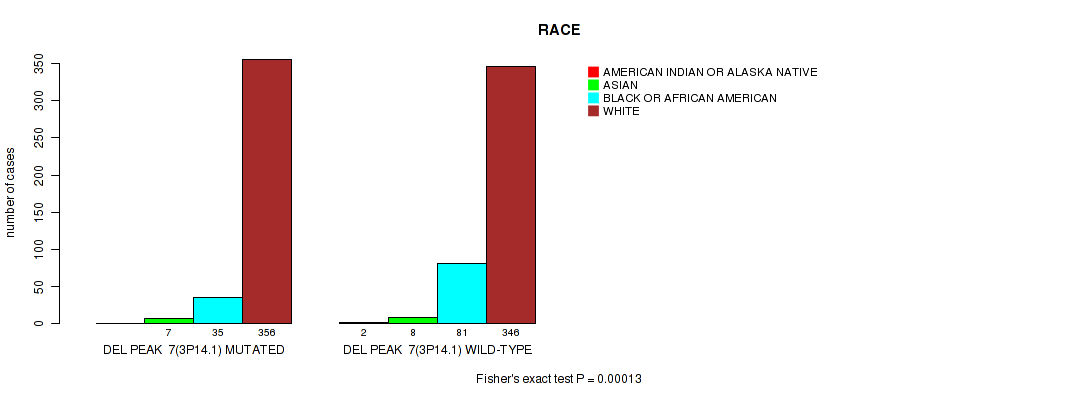
P value = 0.00116 (logrank test), Q value = 0.0052
Table S121. Gene #21: 'del_3p12.2' versus Clinical Feature #1: 'Time to Death'
| nPatients | nDeath | Duration Range (Median), Month | |
|---|---|---|---|
| ALL | 843 | 211 | 0.1 - 194.8 (30.5) |
| DEL PEAK 8(3P12.2) MUTATED | 334 | 109 | 0.1 - 141.7 (36.7) |
| DEL PEAK 8(3P12.2) WILD-TYPE | 509 | 102 | 0.1 - 194.8 (27.6) |
Figure S121. Get High-res Image Gene #21: 'del_3p12.2' versus Clinical Feature #1: 'Time to Death'
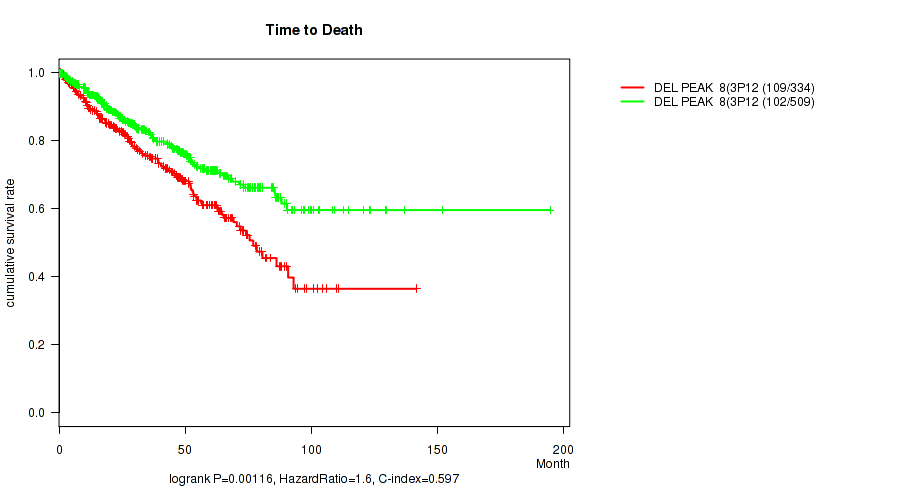
P value = 0.0127 (Fisher's exact test), Q value = 0.039
Table S122. Gene #21: 'del_3p12.2' versus Clinical Feature #3: 'NEOPLASM_DISEASESTAGE'
| nPatients | STAGE I | STAGE II | STAGE III | STAGE IV |
|---|---|---|---|---|
| ALL | 448 | 103 | 190 | 100 |
| DEL PEAK 8(3P12.2) MUTATED | 156 | 42 | 89 | 47 |
| DEL PEAK 8(3P12.2) WILD-TYPE | 292 | 61 | 101 | 53 |
Figure S122. Get High-res Image Gene #21: 'del_3p12.2' versus Clinical Feature #3: 'NEOPLASM_DISEASESTAGE'
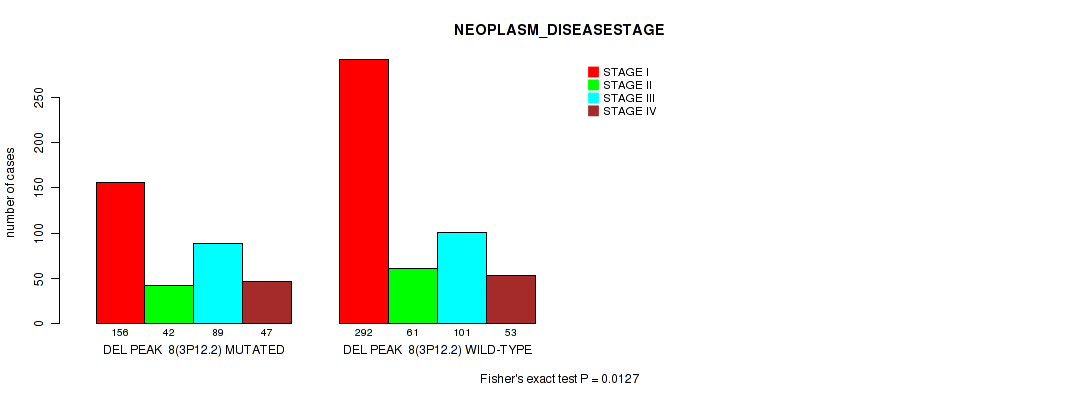
P value = 0.00642 (Fisher's exact test), Q value = 0.022
Table S123. Gene #21: 'del_3p12.2' versus Clinical Feature #4: 'PATHOLOGY_T_STAGE'
| nPatients | T1 | T2 | T3 | T4 |
|---|---|---|---|---|
| ALL | 462 | 123 | 251 | 15 |
| DEL PEAK 8(3P12.2) MUTATED | 160 | 51 | 119 | 4 |
| DEL PEAK 8(3P12.2) WILD-TYPE | 302 | 72 | 132 | 11 |
Figure S123. Get High-res Image Gene #21: 'del_3p12.2' versus Clinical Feature #4: 'PATHOLOGY_T_STAGE'
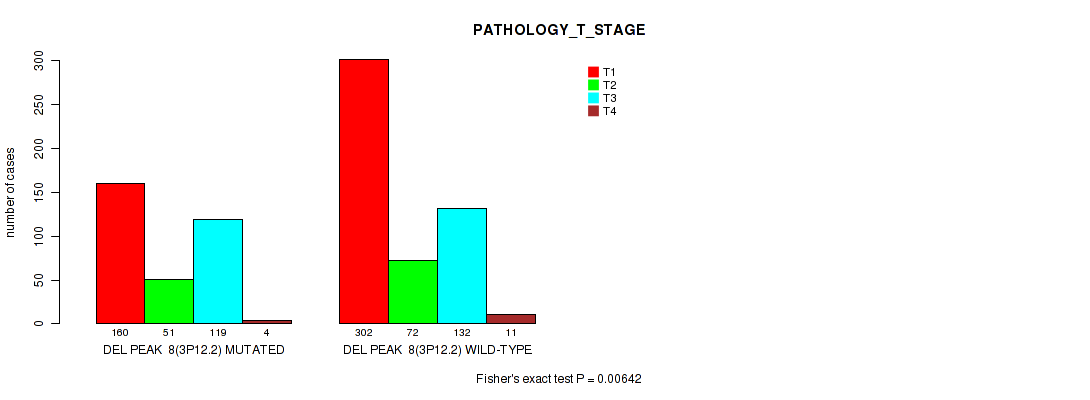
P value = 0.0884 (Fisher's exact test), Q value = 0.19
Table S124. Gene #21: 'del_3p12.2' versus Clinical Feature #7: 'GENDER'
| nPatients | FEMALE | MALE |
|---|---|---|
| ALL | 287 | 572 |
| DEL PEAK 8(3P12.2) MUTATED | 100 | 234 |
| DEL PEAK 8(3P12.2) WILD-TYPE | 187 | 338 |
Figure S124. Get High-res Image Gene #21: 'del_3p12.2' versus Clinical Feature #7: 'GENDER'
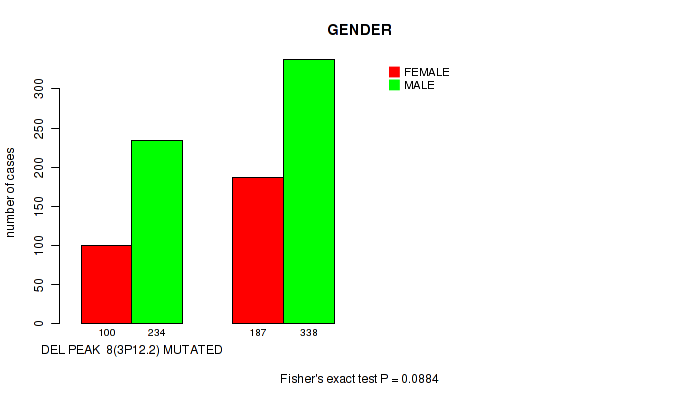
P value = 1e-05 (Fisher's exact test), Q value = 7.6e-05
Table S125. Gene #21: 'del_3p12.2' versus Clinical Feature #9: 'HISTOLOGICAL_TYPE'
| nPatients | KIDNEY CHROMOPHOBE | KIDNEY CLEAR CELL RENAL CARCINOMA | KIDNEY PAPILLARY RENAL CELL CARCINOMA |
|---|---|---|---|
| ALL | 66 | 524 | 269 |
| DEL PEAK 8(3P12.2) MUTATED | 11 | 304 | 19 |
| DEL PEAK 8(3P12.2) WILD-TYPE | 55 | 220 | 250 |
Figure S125. Get High-res Image Gene #21: 'del_3p12.2' versus Clinical Feature #9: 'HISTOLOGICAL_TYPE'
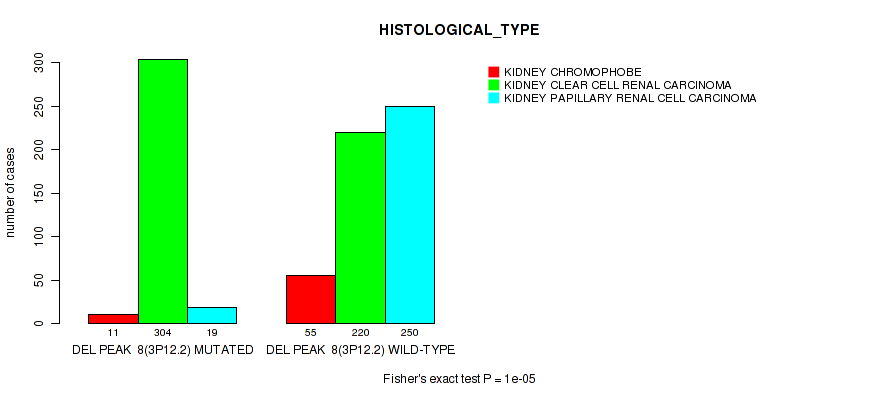
P value = 0.0826 (Wilcoxon-test), Q value = 0.18
Table S126. Gene #21: 'del_3p12.2' versus Clinical Feature #11: 'YEAR_OF_TOBACCO_SMOKING_ONSET'
| nPatients | Mean (Std.Dev) | |
|---|---|---|
| ALL | 67 | 1973.4 (16.4) |
| DEL PEAK 8(3P12.2) MUTATED | 11 | 1980.5 (17.8) |
| DEL PEAK 8(3P12.2) WILD-TYPE | 56 | 1972.0 (15.9) |
Figure S126. Get High-res Image Gene #21: 'del_3p12.2' versus Clinical Feature #11: 'YEAR_OF_TOBACCO_SMOKING_ONSET'
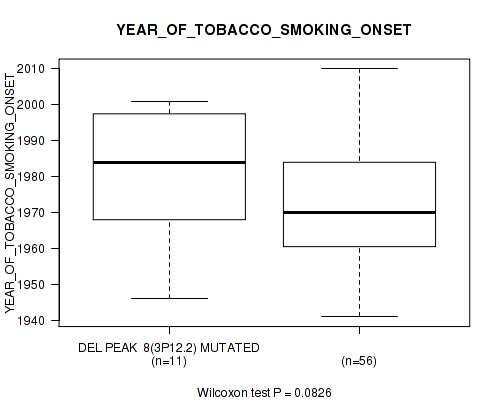
P value = 0.00473 (Fisher's exact test), Q value = 0.017
Table S127. Gene #21: 'del_3p12.2' versus Clinical Feature #12: 'RACE'
| nPatients | AMERICAN INDIAN OR ALASKA NATIVE | ASIAN | BLACK OR AFRICAN AMERICAN | WHITE |
|---|---|---|---|---|
| ALL | 2 | 15 | 116 | 702 |
| DEL PEAK 8(3P12.2) MUTATED | 0 | 6 | 30 | 292 |
| DEL PEAK 8(3P12.2) WILD-TYPE | 2 | 9 | 86 | 410 |
Figure S127. Get High-res Image Gene #21: 'del_3p12.2' versus Clinical Feature #12: 'RACE'
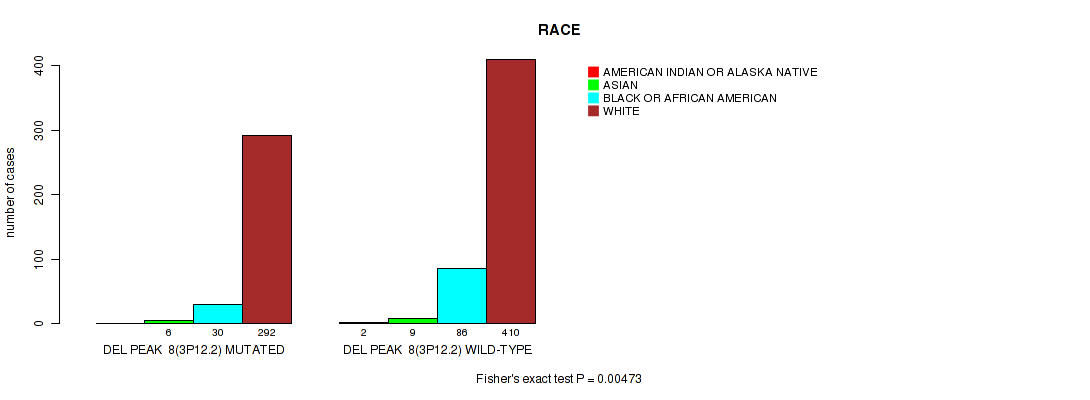
P value = 7.22e-09 (logrank test), Q value = 8.8e-07
Table S128. Gene #22: 'del_4q34.3' versus Clinical Feature #1: 'Time to Death'
| nPatients | nDeath | Duration Range (Median), Month | |
|---|---|---|---|
| ALL | 843 | 211 | 0.1 - 194.8 (30.5) |
| DEL PEAK 9(4Q34.3) MUTATED | 110 | 50 | 0.1 - 112.8 (22.8) |
| DEL PEAK 9(4Q34.3) WILD-TYPE | 733 | 161 | 0.1 - 194.8 (30.6) |
Figure S128. Get High-res Image Gene #22: 'del_4q34.3' versus Clinical Feature #1: 'Time to Death'
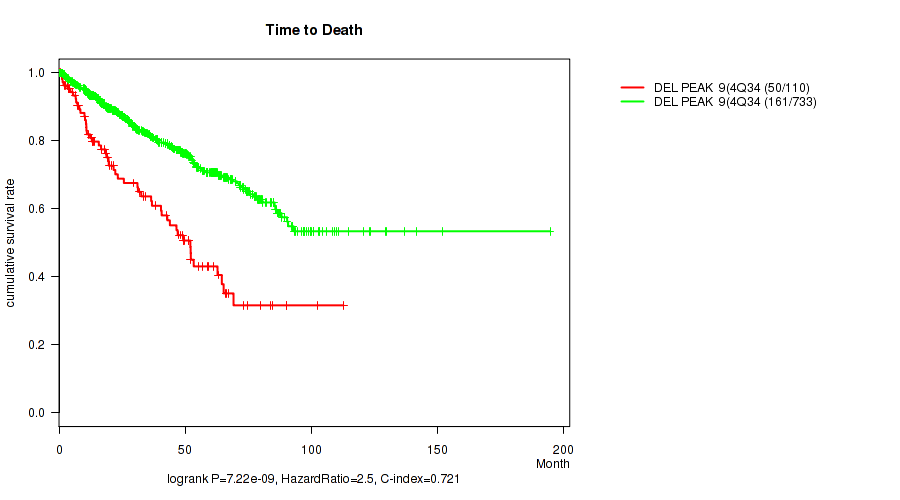
P value = 1e-05 (Fisher's exact test), Q value = 7.6e-05
Table S129. Gene #22: 'del_4q34.3' versus Clinical Feature #3: 'NEOPLASM_DISEASESTAGE'
| nPatients | STAGE I | STAGE II | STAGE III | STAGE IV |
|---|---|---|---|---|
| ALL | 448 | 103 | 190 | 100 |
| DEL PEAK 9(4Q34.3) MUTATED | 26 | 10 | 48 | 24 |
| DEL PEAK 9(4Q34.3) WILD-TYPE | 422 | 93 | 142 | 76 |
Figure S129. Get High-res Image Gene #22: 'del_4q34.3' versus Clinical Feature #3: 'NEOPLASM_DISEASESTAGE'
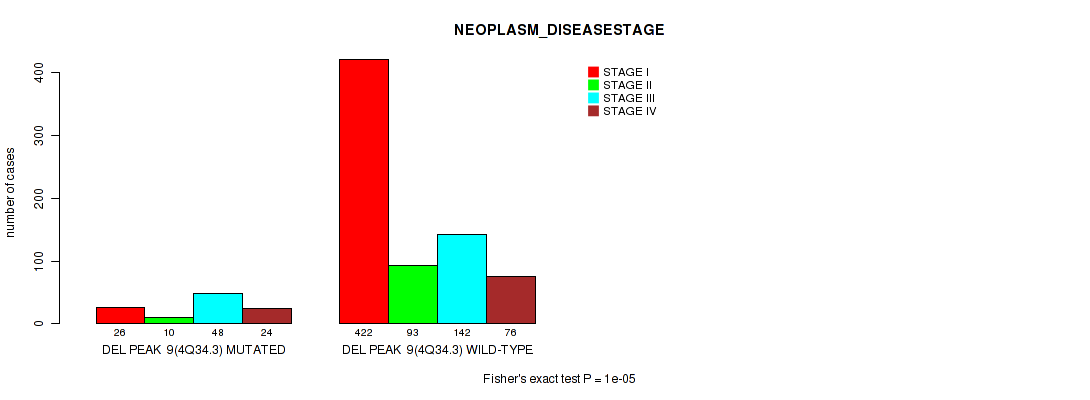
P value = 1e-05 (Fisher's exact test), Q value = 7.6e-05
Table S130. Gene #22: 'del_4q34.3' versus Clinical Feature #4: 'PATHOLOGY_T_STAGE'
| nPatients | T1 | T2 | T3 | T4 |
|---|---|---|---|---|
| ALL | 462 | 123 | 251 | 15 |
| DEL PEAK 9(4Q34.3) MUTATED | 29 | 14 | 59 | 7 |
| DEL PEAK 9(4Q34.3) WILD-TYPE | 433 | 109 | 192 | 8 |
Figure S130. Get High-res Image Gene #22: 'del_4q34.3' versus Clinical Feature #4: 'PATHOLOGY_T_STAGE'
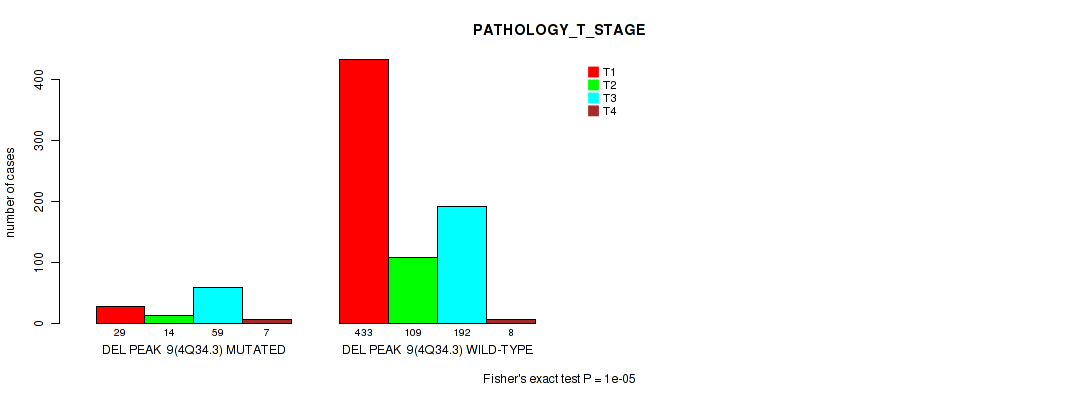
P value = 0.0109 (Fisher's exact test), Q value = 0.035
Table S131. Gene #22: 'del_4q34.3' versus Clinical Feature #5: 'PATHOLOGY_N_STAGE'
| nPatients | N0 | N1 | N2 |
|---|---|---|---|
| ALL | 317 | 43 | 6 |
| DEL PEAK 9(4Q34.3) MUTATED | 40 | 13 | 0 |
| DEL PEAK 9(4Q34.3) WILD-TYPE | 277 | 30 | 6 |
Figure S131. Get High-res Image Gene #22: 'del_4q34.3' versus Clinical Feature #5: 'PATHOLOGY_N_STAGE'
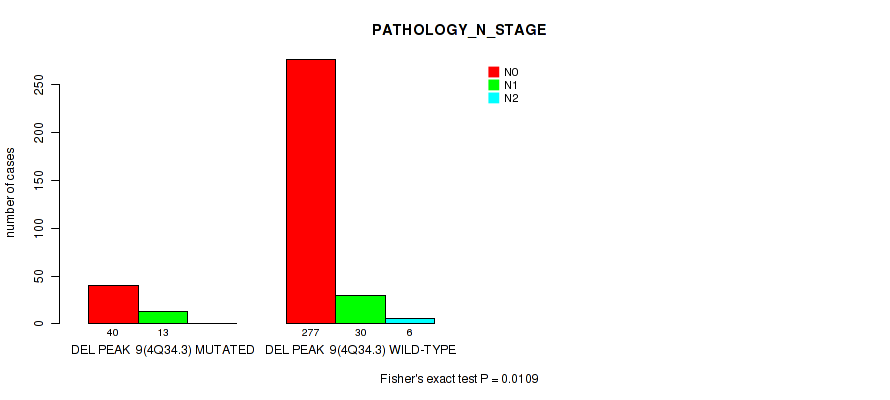
P value = 0.0143 (Fisher's exact test), Q value = 0.043
Table S132. Gene #22: 'del_4q34.3' versus Clinical Feature #6: 'PATHOLOGY_M_STAGE'
| nPatients | 0 | 1 |
|---|---|---|
| ALL | 542 | 89 |
| DEL PEAK 9(4Q34.3) MUTATED | 71 | 21 |
| DEL PEAK 9(4Q34.3) WILD-TYPE | 471 | 68 |
Figure S132. Get High-res Image Gene #22: 'del_4q34.3' versus Clinical Feature #6: 'PATHOLOGY_M_STAGE'
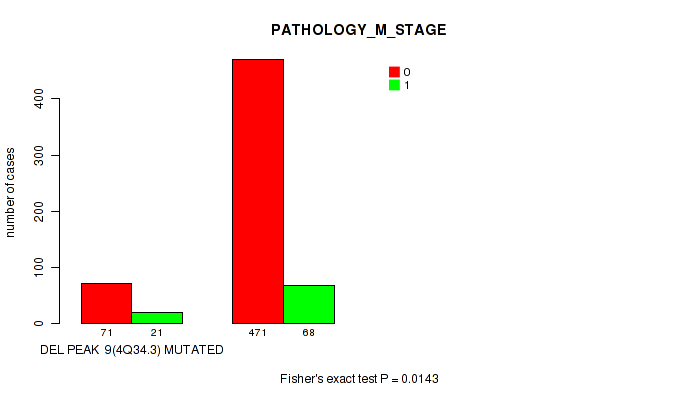
P value = 0.0318 (Fisher's exact test), Q value = 0.084
Table S133. Gene #22: 'del_4q34.3' versus Clinical Feature #9: 'HISTOLOGICAL_TYPE'
| nPatients | KIDNEY CHROMOPHOBE | KIDNEY CLEAR CELL RENAL CARCINOMA | KIDNEY PAPILLARY RENAL CELL CARCINOMA |
|---|---|---|---|
| ALL | 66 | 524 | 269 |
| DEL PEAK 9(4Q34.3) MUTATED | 3 | 78 | 30 |
| DEL PEAK 9(4Q34.3) WILD-TYPE | 63 | 446 | 239 |
Figure S133. Get High-res Image Gene #22: 'del_4q34.3' versus Clinical Feature #9: 'HISTOLOGICAL_TYPE'
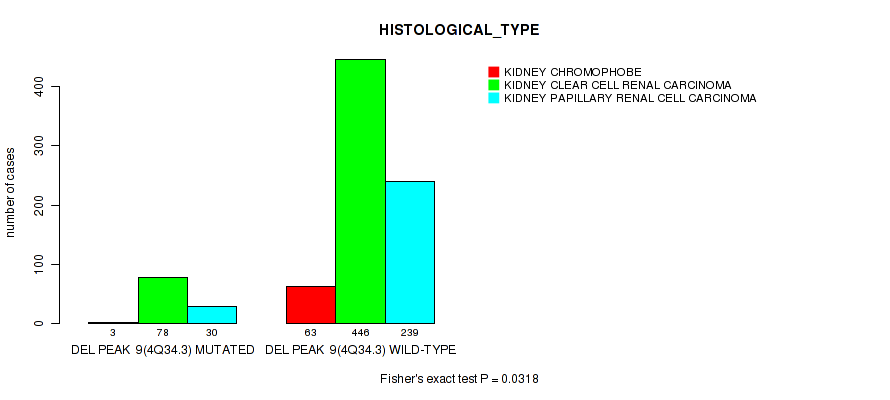
P value = 0.0647 (Fisher's exact test), Q value = 0.15
Table S134. Gene #22: 'del_4q34.3' versus Clinical Feature #12: 'RACE'
| nPatients | AMERICAN INDIAN OR ALASKA NATIVE | ASIAN | BLACK OR AFRICAN AMERICAN | WHITE |
|---|---|---|---|---|
| ALL | 2 | 15 | 116 | 702 |
| DEL PEAK 9(4Q34.3) MUTATED | 0 | 4 | 8 | 93 |
| DEL PEAK 9(4Q34.3) WILD-TYPE | 2 | 11 | 108 | 609 |
Figure S134. Get High-res Image Gene #22: 'del_4q34.3' versus Clinical Feature #12: 'RACE'
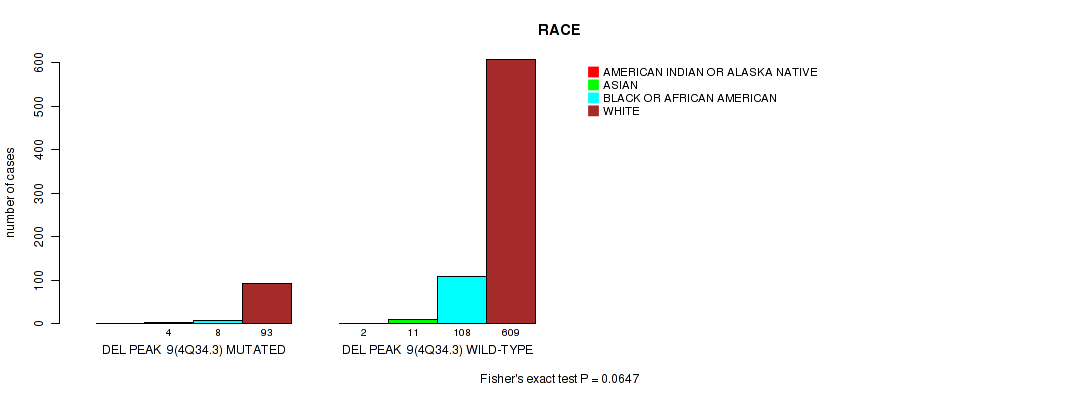
P value = 0.00445 (Wilcoxon-test), Q value = 0.016
Table S135. Gene #23: 'del_5p15.33' versus Clinical Feature #2: 'YEARS_TO_BIRTH'
| nPatients | Mean (Std.Dev) | |
|---|---|---|
| ALL | 853 | 60.1 (12.6) |
| DEL PEAK 10(5P15.33) MUTATED | 30 | 52.4 (14.6) |
| DEL PEAK 10(5P15.33) WILD-TYPE | 823 | 60.4 (12.4) |
Figure S135. Get High-res Image Gene #23: 'del_5p15.33' versus Clinical Feature #2: 'YEARS_TO_BIRTH'
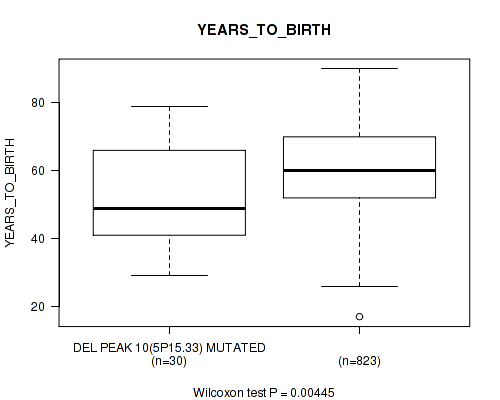
P value = 0.00148 (Fisher's exact test), Q value = 0.0065
Table S136. Gene #23: 'del_5p15.33' versus Clinical Feature #3: 'NEOPLASM_DISEASESTAGE'
| nPatients | STAGE I | STAGE II | STAGE III | STAGE IV |
|---|---|---|---|---|
| ALL | 448 | 103 | 190 | 100 |
| DEL PEAK 10(5P15.33) MUTATED | 7 | 9 | 9 | 5 |
| DEL PEAK 10(5P15.33) WILD-TYPE | 441 | 94 | 181 | 95 |
Figure S136. Get High-res Image Gene #23: 'del_5p15.33' versus Clinical Feature #3: 'NEOPLASM_DISEASESTAGE'

P value = 0.00057 (Fisher's exact test), Q value = 0.0027
Table S137. Gene #23: 'del_5p15.33' versus Clinical Feature #4: 'PATHOLOGY_T_STAGE'
| nPatients | T1 | T2 | T3 | T4 |
|---|---|---|---|---|
| ALL | 462 | 123 | 251 | 15 |
| DEL PEAK 10(5P15.33) MUTATED | 7 | 11 | 13 | 0 |
| DEL PEAK 10(5P15.33) WILD-TYPE | 455 | 112 | 238 | 15 |
Figure S137. Get High-res Image Gene #23: 'del_5p15.33' versus Clinical Feature #4: 'PATHOLOGY_T_STAGE'

P value = 0.00573 (Fisher's exact test), Q value = 0.02
Table S138. Gene #23: 'del_5p15.33' versus Clinical Feature #5: 'PATHOLOGY_N_STAGE'
| nPatients | N0 | N1 | N2 |
|---|---|---|---|
| ALL | 317 | 43 | 6 |
| DEL PEAK 10(5P15.33) MUTATED | 13 | 5 | 2 |
| DEL PEAK 10(5P15.33) WILD-TYPE | 304 | 38 | 4 |
Figure S138. Get High-res Image Gene #23: 'del_5p15.33' versus Clinical Feature #5: 'PATHOLOGY_N_STAGE'

P value = 1e-05 (Fisher's exact test), Q value = 7.6e-05
Table S139. Gene #23: 'del_5p15.33' versus Clinical Feature #9: 'HISTOLOGICAL_TYPE'
| nPatients | KIDNEY CHROMOPHOBE | KIDNEY CLEAR CELL RENAL CARCINOMA | KIDNEY PAPILLARY RENAL CELL CARCINOMA |
|---|---|---|---|
| ALL | 66 | 524 | 269 |
| DEL PEAK 10(5P15.33) MUTATED | 10 | 8 | 13 |
| DEL PEAK 10(5P15.33) WILD-TYPE | 56 | 516 | 256 |
Figure S139. Get High-res Image Gene #23: 'del_5p15.33' versus Clinical Feature #9: 'HISTOLOGICAL_TYPE'
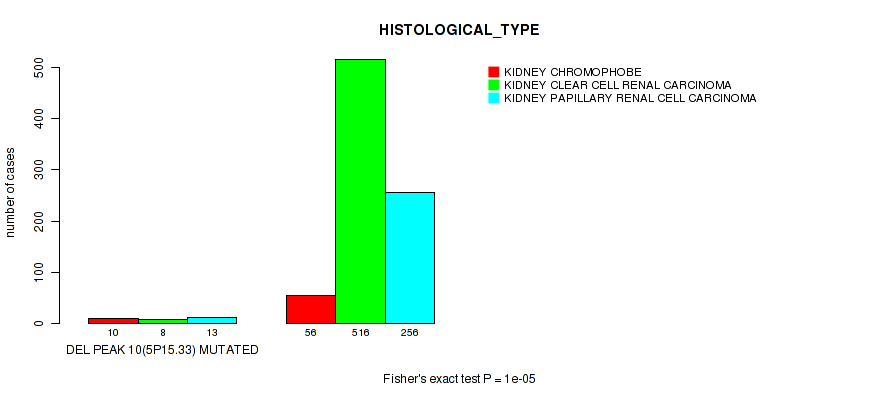
P value = 0.124 (Wilcoxon-test), Q value = 0.25
Table S140. Gene #24: 'del_6q22.31' versus Clinical Feature #2: 'YEARS_TO_BIRTH'
| nPatients | Mean (Std.Dev) | |
|---|---|---|
| ALL | 853 | 60.1 (12.6) |
| DEL PEAK 11(6Q22.31) MUTATED | 223 | 58.6 (13.8) |
| DEL PEAK 11(6Q22.31) WILD-TYPE | 630 | 60.6 (12.1) |
Figure S140. Get High-res Image Gene #24: 'del_6q22.31' versus Clinical Feature #2: 'YEARS_TO_BIRTH'
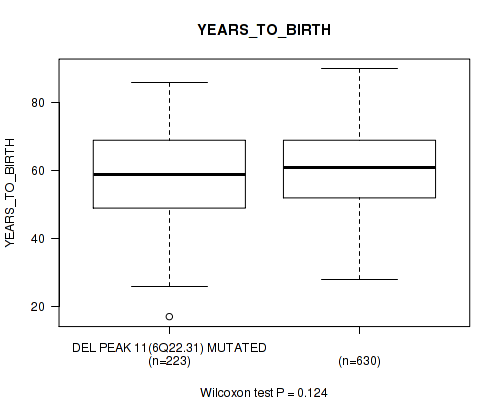
P value = 0.00013 (Fisher's exact test), Q value = 0.00076
Table S141. Gene #24: 'del_6q22.31' versus Clinical Feature #3: 'NEOPLASM_DISEASESTAGE'
| nPatients | STAGE I | STAGE II | STAGE III | STAGE IV |
|---|---|---|---|---|
| ALL | 448 | 103 | 190 | 100 |
| DEL PEAK 11(6Q22.31) MUTATED | 93 | 41 | 55 | 35 |
| DEL PEAK 11(6Q22.31) WILD-TYPE | 355 | 62 | 135 | 65 |
Figure S141. Get High-res Image Gene #24: 'del_6q22.31' versus Clinical Feature #3: 'NEOPLASM_DISEASESTAGE'
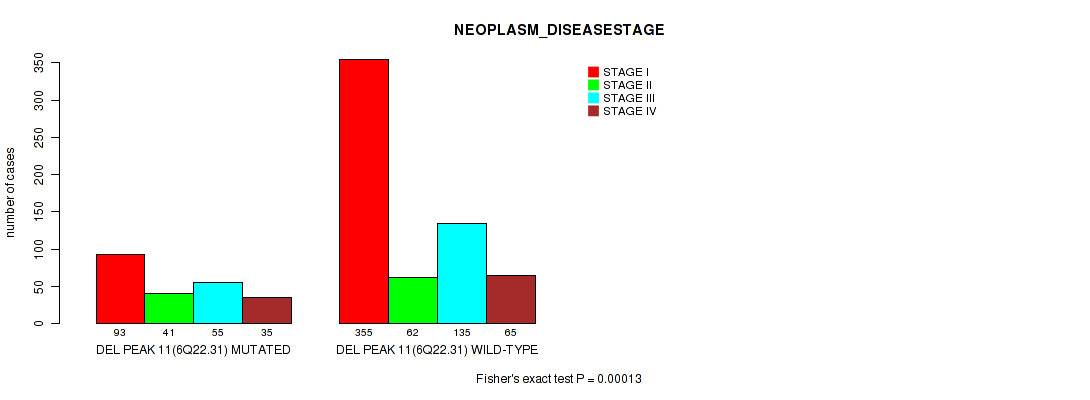
P value = 4e-05 (Fisher's exact test), Q value = 0.00028
Table S142. Gene #24: 'del_6q22.31' versus Clinical Feature #4: 'PATHOLOGY_T_STAGE'
| nPatients | T1 | T2 | T3 | T4 |
|---|---|---|---|---|
| ALL | 462 | 123 | 251 | 15 |
| DEL PEAK 11(6Q22.31) MUTATED | 94 | 44 | 80 | 7 |
| DEL PEAK 11(6Q22.31) WILD-TYPE | 368 | 79 | 171 | 8 |
Figure S142. Get High-res Image Gene #24: 'del_6q22.31' versus Clinical Feature #4: 'PATHOLOGY_T_STAGE'
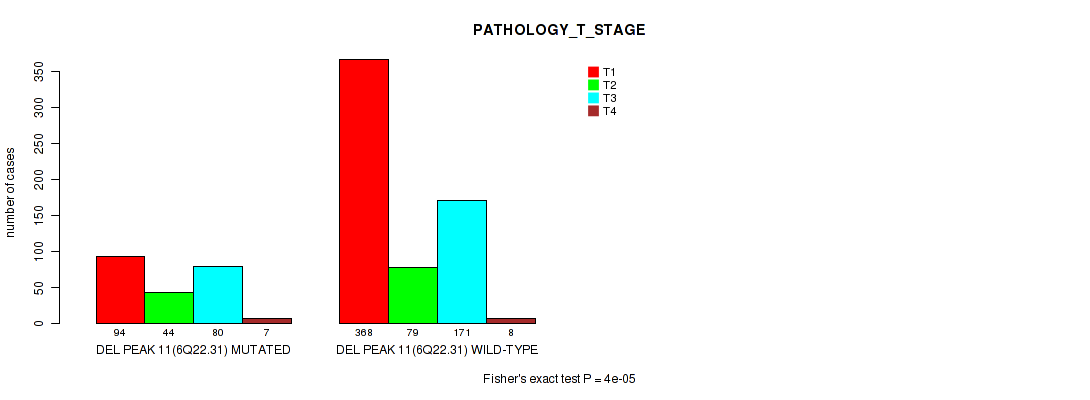
P value = 0.0357 (Fisher's exact test), Q value = 0.092
Table S143. Gene #24: 'del_6q22.31' versus Clinical Feature #5: 'PATHOLOGY_N_STAGE'
| nPatients | N0 | N1 | N2 |
|---|---|---|---|
| ALL | 317 | 43 | 6 |
| DEL PEAK 11(6Q22.31) MUTATED | 87 | 17 | 4 |
| DEL PEAK 11(6Q22.31) WILD-TYPE | 230 | 26 | 2 |
Figure S143. Get High-res Image Gene #24: 'del_6q22.31' versus Clinical Feature #5: 'PATHOLOGY_N_STAGE'
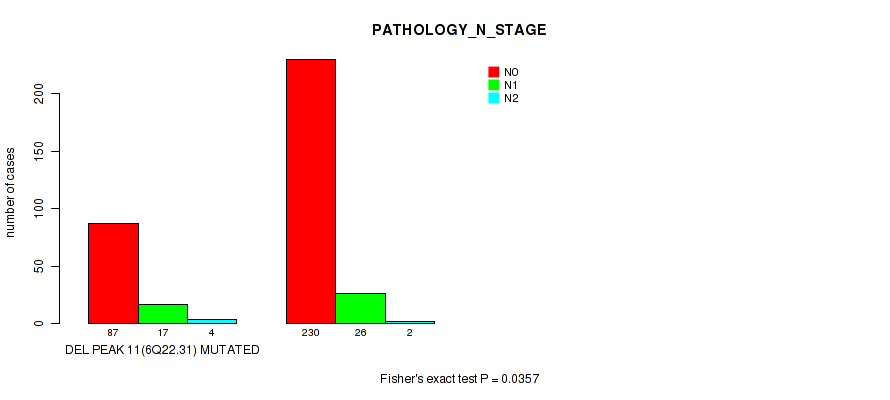
P value = 0.107 (Wilcoxon-test), Q value = 0.22
Table S144. Gene #24: 'del_6q22.31' versus Clinical Feature #8: 'KARNOFSKY_PERFORMANCE_SCORE'
| nPatients | Mean (Std.Dev) | |
|---|---|---|
| ALL | 115 | 90.3 (17.6) |
| DEL PEAK 11(6Q22.31) MUTATED | 32 | 85.6 (24.2) |
| DEL PEAK 11(6Q22.31) WILD-TYPE | 83 | 92.0 (14.0) |
Figure S144. Get High-res Image Gene #24: 'del_6q22.31' versus Clinical Feature #8: 'KARNOFSKY_PERFORMANCE_SCORE'
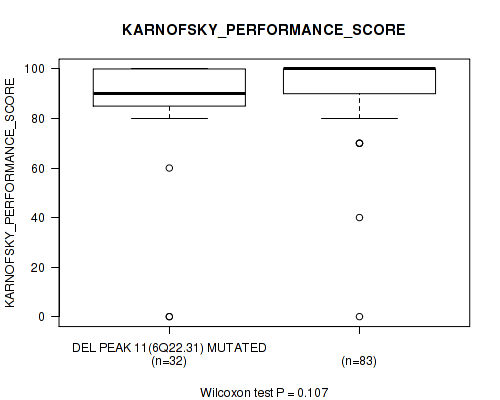
P value = 1e-05 (Fisher's exact test), Q value = 7.6e-05
Table S145. Gene #24: 'del_6q22.31' versus Clinical Feature #9: 'HISTOLOGICAL_TYPE'
| nPatients | KIDNEY CHROMOPHOBE | KIDNEY CLEAR CELL RENAL CARCINOMA | KIDNEY PAPILLARY RENAL CELL CARCINOMA |
|---|---|---|---|
| ALL | 66 | 524 | 269 |
| DEL PEAK 11(6Q22.31) MUTATED | 51 | 147 | 27 |
| DEL PEAK 11(6Q22.31) WILD-TYPE | 15 | 377 | 242 |
Figure S145. Get High-res Image Gene #24: 'del_6q22.31' versus Clinical Feature #9: 'HISTOLOGICAL_TYPE'
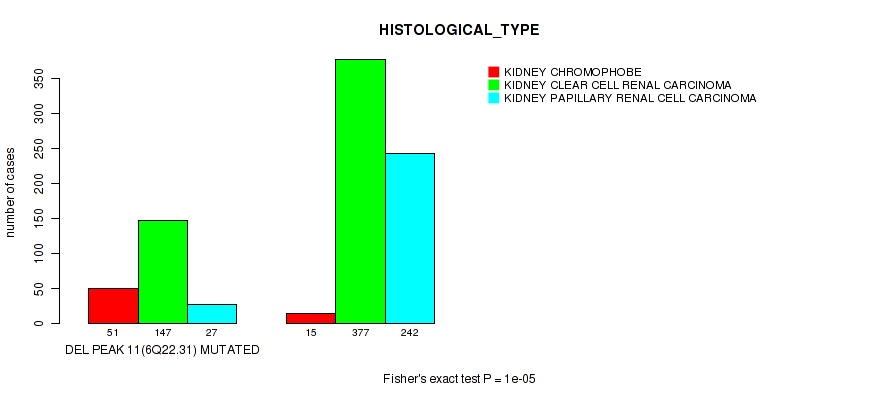
P value = 0.00221 (Fisher's exact test), Q value = 0.0088
Table S146. Gene #24: 'del_6q22.31' versus Clinical Feature #12: 'RACE'
| nPatients | AMERICAN INDIAN OR ALASKA NATIVE | ASIAN | BLACK OR AFRICAN AMERICAN | WHITE |
|---|---|---|---|---|
| ALL | 2 | 15 | 116 | 702 |
| DEL PEAK 11(6Q22.31) MUTATED | 0 | 6 | 16 | 195 |
| DEL PEAK 11(6Q22.31) WILD-TYPE | 2 | 9 | 100 | 507 |
Figure S146. Get High-res Image Gene #24: 'del_6q22.31' versus Clinical Feature #12: 'RACE'

P value = 6e-05 (Fisher's exact test), Q value = 0.00038
Table S147. Gene #25: 'del_6q26' versus Clinical Feature #3: 'NEOPLASM_DISEASESTAGE'
| nPatients | STAGE I | STAGE II | STAGE III | STAGE IV |
|---|---|---|---|---|
| ALL | 448 | 103 | 190 | 100 |
| DEL PEAK 12(6Q26) MUTATED | 94 | 43 | 58 | 34 |
| DEL PEAK 12(6Q26) WILD-TYPE | 354 | 60 | 132 | 66 |
Figure S147. Get High-res Image Gene #25: 'del_6q26' versus Clinical Feature #3: 'NEOPLASM_DISEASESTAGE'
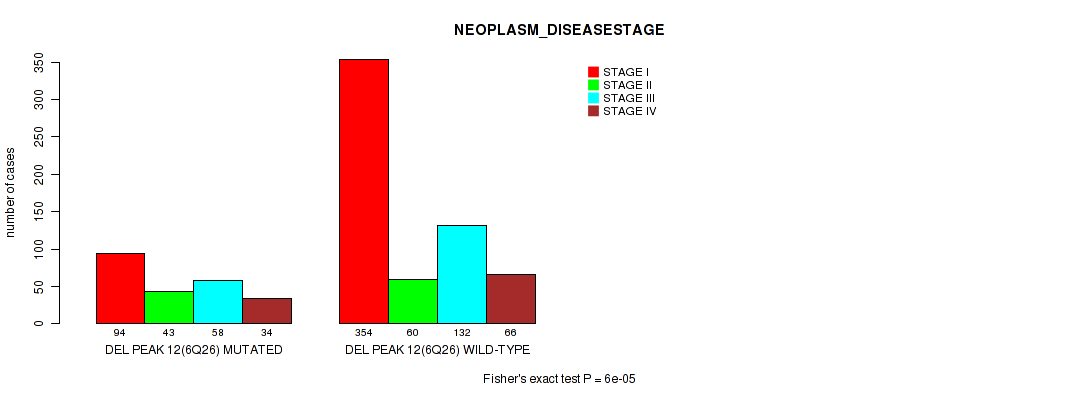
P value = 5e-05 (Fisher's exact test), Q value = 0.00033
Table S148. Gene #25: 'del_6q26' versus Clinical Feature #4: 'PATHOLOGY_T_STAGE'
| nPatients | T1 | T2 | T3 | T4 |
|---|---|---|---|---|
| ALL | 462 | 123 | 251 | 15 |
| DEL PEAK 12(6Q26) MUTATED | 95 | 46 | 83 | 6 |
| DEL PEAK 12(6Q26) WILD-TYPE | 367 | 77 | 168 | 9 |
Figure S148. Get High-res Image Gene #25: 'del_6q26' versus Clinical Feature #4: 'PATHOLOGY_T_STAGE'

P value = 0.0548 (Fisher's exact test), Q value = 0.13
Table S149. Gene #25: 'del_6q26' versus Clinical Feature #5: 'PATHOLOGY_N_STAGE'
| nPatients | N0 | N1 | N2 |
|---|---|---|---|
| ALL | 317 | 43 | 6 |
| DEL PEAK 12(6Q26) MUTATED | 92 | 17 | 4 |
| DEL PEAK 12(6Q26) WILD-TYPE | 225 | 26 | 2 |
Figure S149. Get High-res Image Gene #25: 'del_6q26' versus Clinical Feature #5: 'PATHOLOGY_N_STAGE'

P value = 0.086 (Wilcoxon-test), Q value = 0.19
Table S150. Gene #25: 'del_6q26' versus Clinical Feature #8: 'KARNOFSKY_PERFORMANCE_SCORE'
| nPatients | Mean (Std.Dev) | |
|---|---|---|
| ALL | 115 | 90.3 (17.6) |
| DEL PEAK 12(6Q26) MUTATED | 33 | 85.8 (23.9) |
| DEL PEAK 12(6Q26) WILD-TYPE | 82 | 92.1 (14.1) |
Figure S150. Get High-res Image Gene #25: 'del_6q26' versus Clinical Feature #8: 'KARNOFSKY_PERFORMANCE_SCORE'
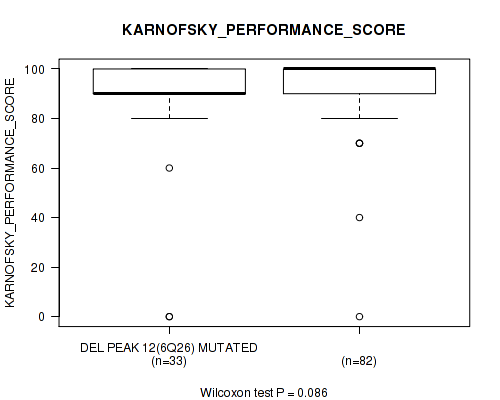
P value = 1e-05 (Fisher's exact test), Q value = 7.6e-05
Table S151. Gene #25: 'del_6q26' versus Clinical Feature #9: 'HISTOLOGICAL_TYPE'
| nPatients | KIDNEY CHROMOPHOBE | KIDNEY CLEAR CELL RENAL CARCINOMA | KIDNEY PAPILLARY RENAL CELL CARCINOMA |
|---|---|---|---|
| ALL | 66 | 524 | 269 |
| DEL PEAK 12(6Q26) MUTATED | 51 | 151 | 28 |
| DEL PEAK 12(6Q26) WILD-TYPE | 15 | 373 | 241 |
Figure S151. Get High-res Image Gene #25: 'del_6q26' versus Clinical Feature #9: 'HISTOLOGICAL_TYPE'

P value = 0.00126 (Fisher's exact test), Q value = 0.0056
Table S152. Gene #25: 'del_6q26' versus Clinical Feature #12: 'RACE'
| nPatients | AMERICAN INDIAN OR ALASKA NATIVE | ASIAN | BLACK OR AFRICAN AMERICAN | WHITE |
|---|---|---|---|---|
| ALL | 2 | 15 | 116 | 702 |
| DEL PEAK 12(6Q26) MUTATED | 0 | 6 | 16 | 200 |
| DEL PEAK 12(6Q26) WILD-TYPE | 2 | 9 | 100 | 502 |
Figure S152. Get High-res Image Gene #25: 'del_6q26' versus Clinical Feature #12: 'RACE'
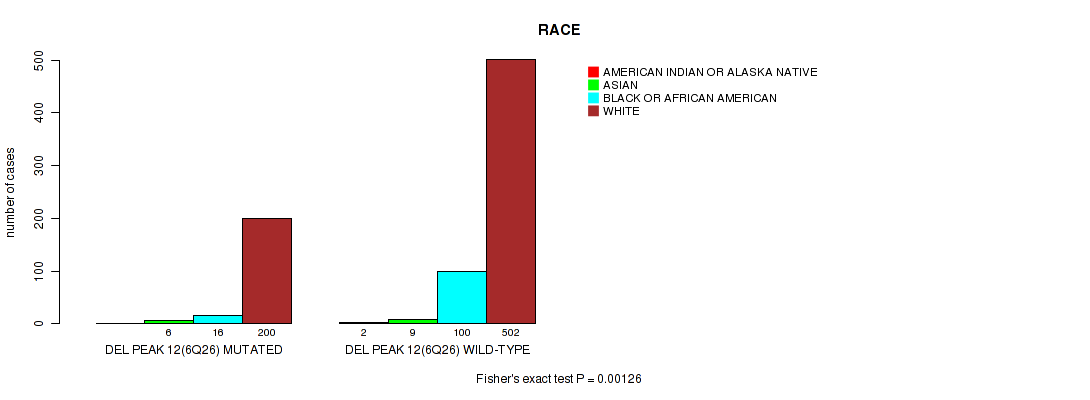
P value = 8e-05 (Fisher's exact test), Q value = 5e-04
Table S153. Gene #26: 'del_6q26' versus Clinical Feature #3: 'NEOPLASM_DISEASESTAGE'
| nPatients | STAGE I | STAGE II | STAGE III | STAGE IV |
|---|---|---|---|---|
| ALL | 448 | 103 | 190 | 100 |
| DEL PEAK 13(6Q26) MUTATED | 95 | 43 | 58 | 34 |
| DEL PEAK 13(6Q26) WILD-TYPE | 353 | 60 | 132 | 66 |
Figure S153. Get High-res Image Gene #26: 'del_6q26' versus Clinical Feature #3: 'NEOPLASM_DISEASESTAGE'

P value = 6e-05 (Fisher's exact test), Q value = 0.00038
Table S154. Gene #26: 'del_6q26' versus Clinical Feature #4: 'PATHOLOGY_T_STAGE'
| nPatients | T1 | T2 | T3 | T4 |
|---|---|---|---|---|
| ALL | 462 | 123 | 251 | 15 |
| DEL PEAK 13(6Q26) MUTATED | 96 | 46 | 83 | 6 |
| DEL PEAK 13(6Q26) WILD-TYPE | 366 | 77 | 168 | 9 |
Figure S154. Get High-res Image Gene #26: 'del_6q26' versus Clinical Feature #4: 'PATHOLOGY_T_STAGE'
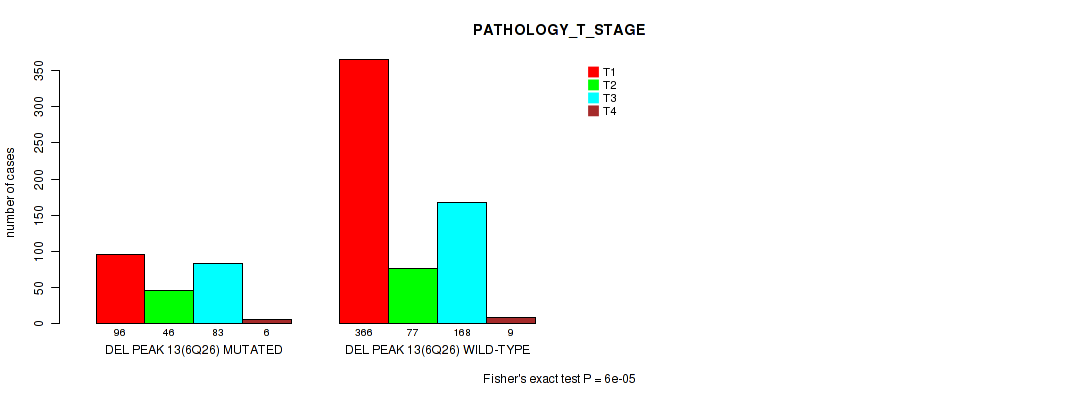
P value = 0.0549 (Fisher's exact test), Q value = 0.13
Table S155. Gene #26: 'del_6q26' versus Clinical Feature #5: 'PATHOLOGY_N_STAGE'
| nPatients | N0 | N1 | N2 |
|---|---|---|---|
| ALL | 317 | 43 | 6 |
| DEL PEAK 13(6Q26) MUTATED | 92 | 17 | 4 |
| DEL PEAK 13(6Q26) WILD-TYPE | 225 | 26 | 2 |
Figure S155. Get High-res Image Gene #26: 'del_6q26' versus Clinical Feature #5: 'PATHOLOGY_N_STAGE'
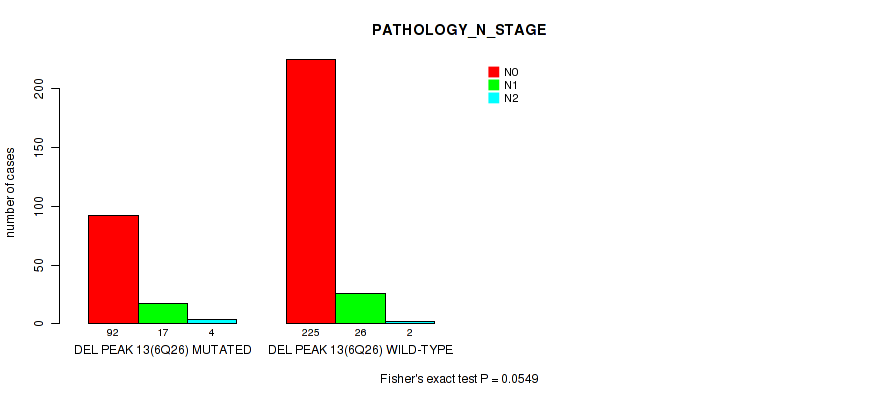
P value = 0.086 (Wilcoxon-test), Q value = 0.19
Table S156. Gene #26: 'del_6q26' versus Clinical Feature #8: 'KARNOFSKY_PERFORMANCE_SCORE'
| nPatients | Mean (Std.Dev) | |
|---|---|---|
| ALL | 115 | 90.3 (17.6) |
| DEL PEAK 13(6Q26) MUTATED | 33 | 85.8 (23.9) |
| DEL PEAK 13(6Q26) WILD-TYPE | 82 | 92.1 (14.1) |
Figure S156. Get High-res Image Gene #26: 'del_6q26' versus Clinical Feature #8: 'KARNOFSKY_PERFORMANCE_SCORE'
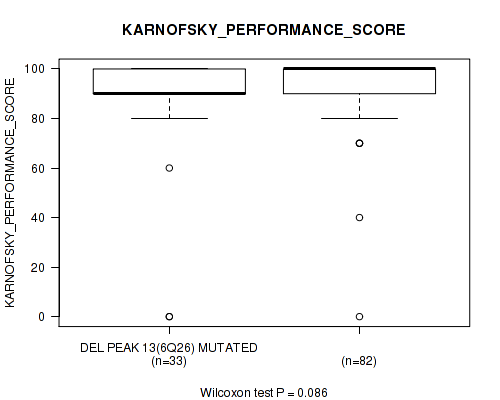
P value = 1e-05 (Fisher's exact test), Q value = 7.6e-05
Table S157. Gene #26: 'del_6q26' versus Clinical Feature #9: 'HISTOLOGICAL_TYPE'
| nPatients | KIDNEY CHROMOPHOBE | KIDNEY CLEAR CELL RENAL CARCINOMA | KIDNEY PAPILLARY RENAL CELL CARCINOMA |
|---|---|---|---|
| ALL | 66 | 524 | 269 |
| DEL PEAK 13(6Q26) MUTATED | 51 | 151 | 29 |
| DEL PEAK 13(6Q26) WILD-TYPE | 15 | 373 | 240 |
Figure S157. Get High-res Image Gene #26: 'del_6q26' versus Clinical Feature #9: 'HISTOLOGICAL_TYPE'
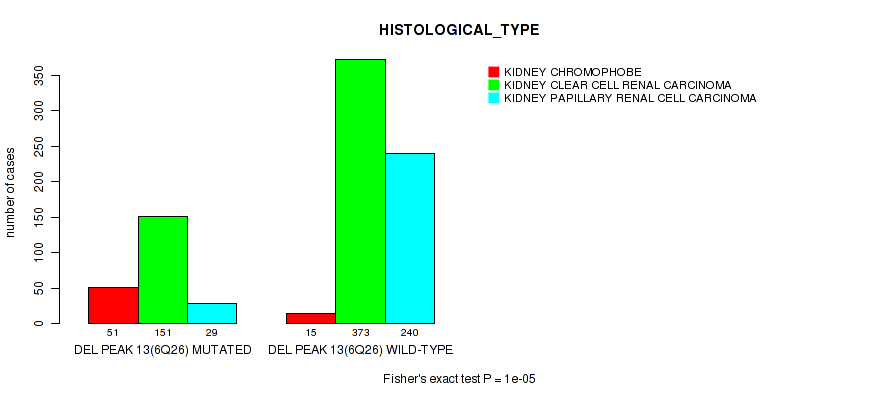
P value = 0.00323 (Fisher's exact test), Q value = 0.012
Table S158. Gene #26: 'del_6q26' versus Clinical Feature #12: 'RACE'
| nPatients | AMERICAN INDIAN OR ALASKA NATIVE | ASIAN | BLACK OR AFRICAN AMERICAN | WHITE |
|---|---|---|---|---|
| ALL | 2 | 15 | 116 | 702 |
| DEL PEAK 13(6Q26) MUTATED | 0 | 6 | 17 | 200 |
| DEL PEAK 13(6Q26) WILD-TYPE | 2 | 9 | 99 | 502 |
Figure S158. Get High-res Image Gene #26: 'del_6q26' versus Clinical Feature #12: 'RACE'
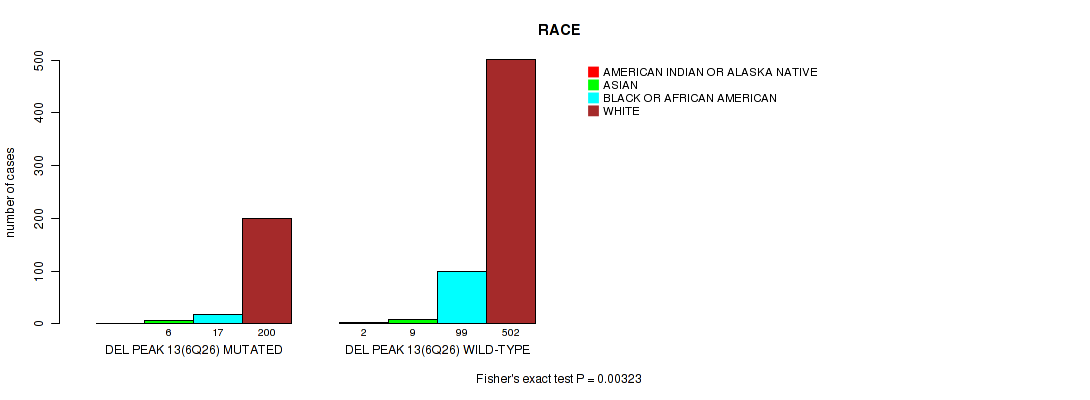
P value = 0.000909 (logrank test), Q value = 0.0042
Table S159. Gene #27: 'del_8p23.2' versus Clinical Feature #1: 'Time to Death'
| nPatients | nDeath | Duration Range (Median), Month | |
|---|---|---|---|
| ALL | 843 | 211 | 0.1 - 194.8 (30.5) |
| DEL PEAK 14(8P23.2) MUTATED | 181 | 63 | 0.1 - 137.1 (31.9) |
| DEL PEAK 14(8P23.2) WILD-TYPE | 662 | 148 | 0.1 - 194.8 (30.3) |
Figure S159. Get High-res Image Gene #27: 'del_8p23.2' versus Clinical Feature #1: 'Time to Death'
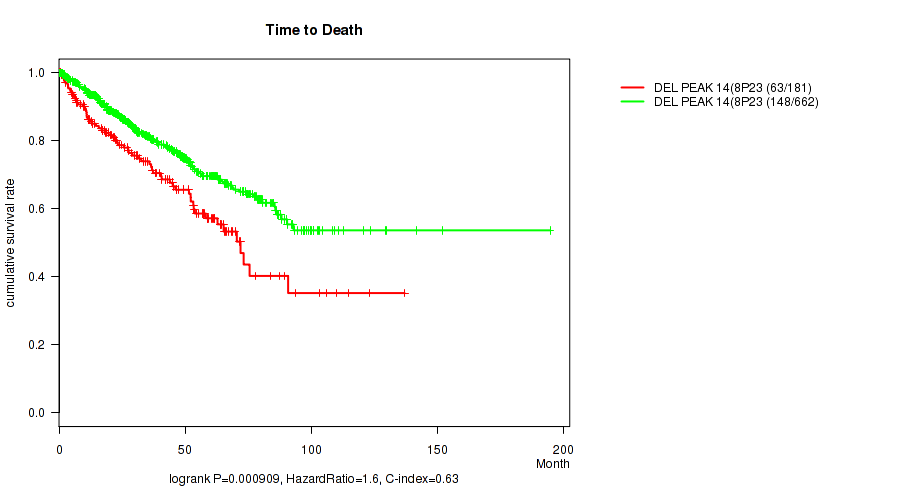
P value = 0.00201 (Fisher's exact test), Q value = 0.0083
Table S160. Gene #27: 'del_8p23.2' versus Clinical Feature #3: 'NEOPLASM_DISEASESTAGE'
| nPatients | STAGE I | STAGE II | STAGE III | STAGE IV |
|---|---|---|---|---|
| ALL | 448 | 103 | 190 | 100 |
| DEL PEAK 14(8P23.2) MUTATED | 75 | 25 | 48 | 32 |
| DEL PEAK 14(8P23.2) WILD-TYPE | 373 | 78 | 142 | 68 |
Figure S160. Get High-res Image Gene #27: 'del_8p23.2' versus Clinical Feature #3: 'NEOPLASM_DISEASESTAGE'

P value = 0.00183 (Fisher's exact test), Q value = 0.0078
Table S161. Gene #27: 'del_8p23.2' versus Clinical Feature #4: 'PATHOLOGY_T_STAGE'
| nPatients | T1 | T2 | T3 | T4 |
|---|---|---|---|---|
| ALL | 462 | 123 | 251 | 15 |
| DEL PEAK 14(8P23.2) MUTATED | 77 | 30 | 68 | 6 |
| DEL PEAK 14(8P23.2) WILD-TYPE | 385 | 93 | 183 | 9 |
Figure S161. Get High-res Image Gene #27: 'del_8p23.2' versus Clinical Feature #4: 'PATHOLOGY_T_STAGE'
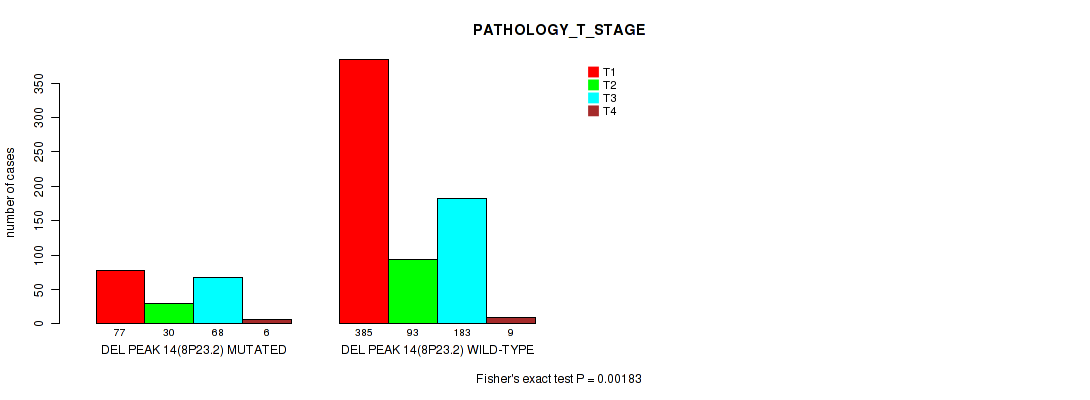
P value = 0.0257 (Fisher's exact test), Q value = 0.069
Table S162. Gene #27: 'del_8p23.2' versus Clinical Feature #6: 'PATHOLOGY_M_STAGE'
| nPatients | 0 | 1 |
|---|---|---|
| ALL | 542 | 89 |
| DEL PEAK 14(8P23.2) MUTATED | 131 | 32 |
| DEL PEAK 14(8P23.2) WILD-TYPE | 411 | 57 |
Figure S162. Get High-res Image Gene #27: 'del_8p23.2' versus Clinical Feature #6: 'PATHOLOGY_M_STAGE'
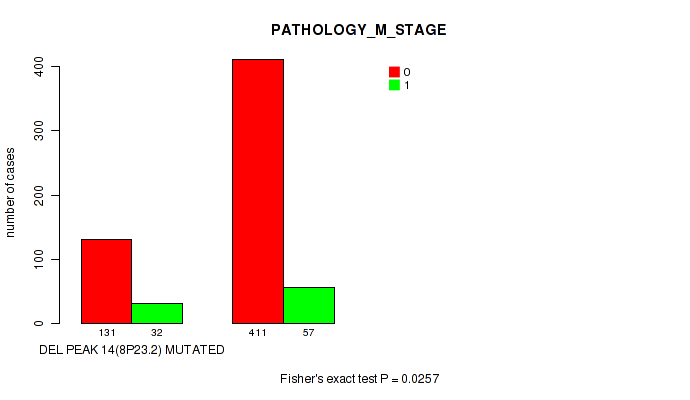
P value = 1e-05 (Fisher's exact test), Q value = 7.6e-05
Table S163. Gene #27: 'del_8p23.2' versus Clinical Feature #9: 'HISTOLOGICAL_TYPE'
| nPatients | KIDNEY CHROMOPHOBE | KIDNEY CLEAR CELL RENAL CARCINOMA | KIDNEY PAPILLARY RENAL CELL CARCINOMA |
|---|---|---|---|
| ALL | 66 | 524 | 269 |
| DEL PEAK 14(8P23.2) MUTATED | 12 | 154 | 15 |
| DEL PEAK 14(8P23.2) WILD-TYPE | 54 | 370 | 254 |
Figure S163. Get High-res Image Gene #27: 'del_8p23.2' versus Clinical Feature #9: 'HISTOLOGICAL_TYPE'
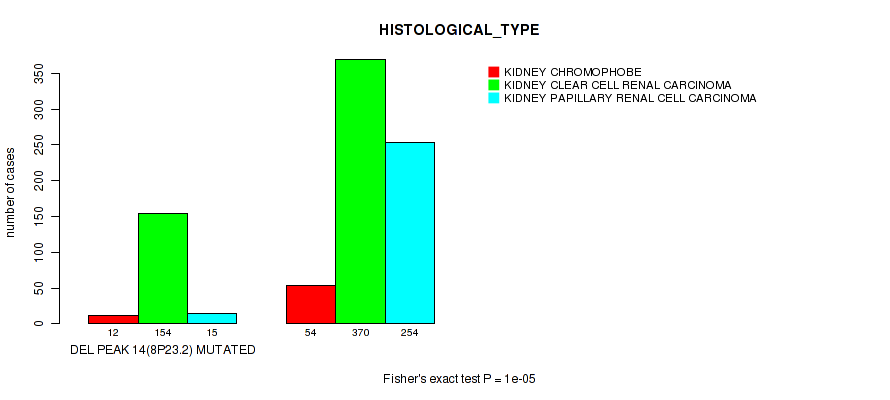
P value = 0.00376 (Fisher's exact test), Q value = 0.014
Table S164. Gene #27: 'del_8p23.2' versus Clinical Feature #12: 'RACE'
| nPatients | AMERICAN INDIAN OR ALASKA NATIVE | ASIAN | BLACK OR AFRICAN AMERICAN | WHITE |
|---|---|---|---|---|
| ALL | 2 | 15 | 116 | 702 |
| DEL PEAK 14(8P23.2) MUTATED | 0 | 7 | 14 | 157 |
| DEL PEAK 14(8P23.2) WILD-TYPE | 2 | 8 | 102 | 545 |
Figure S164. Get High-res Image Gene #27: 'del_8p23.2' versus Clinical Feature #12: 'RACE'
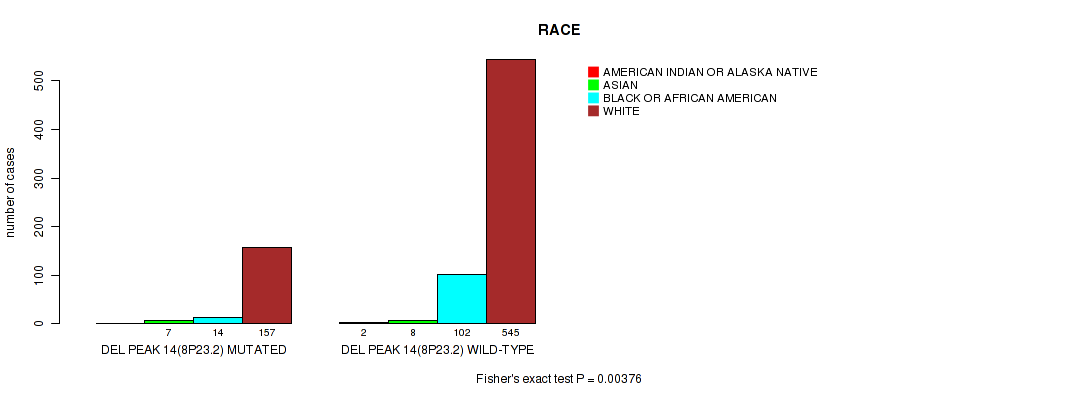
P value = 2.91e-11 (logrank test), Q value = 4.9e-09
Table S165. Gene #28: 'del_9p23' versus Clinical Feature #1: 'Time to Death'
| nPatients | nDeath | Duration Range (Median), Month | |
|---|---|---|---|
| ALL | 843 | 211 | 0.1 - 194.8 (30.5) |
| DEL PEAK 15(9P23) MUTATED | 193 | 85 | 0.1 - 141.7 (31.3) |
| DEL PEAK 15(9P23) WILD-TYPE | 650 | 126 | 0.1 - 194.8 (30.3) |
Figure S165. Get High-res Image Gene #28: 'del_9p23' versus Clinical Feature #1: 'Time to Death'
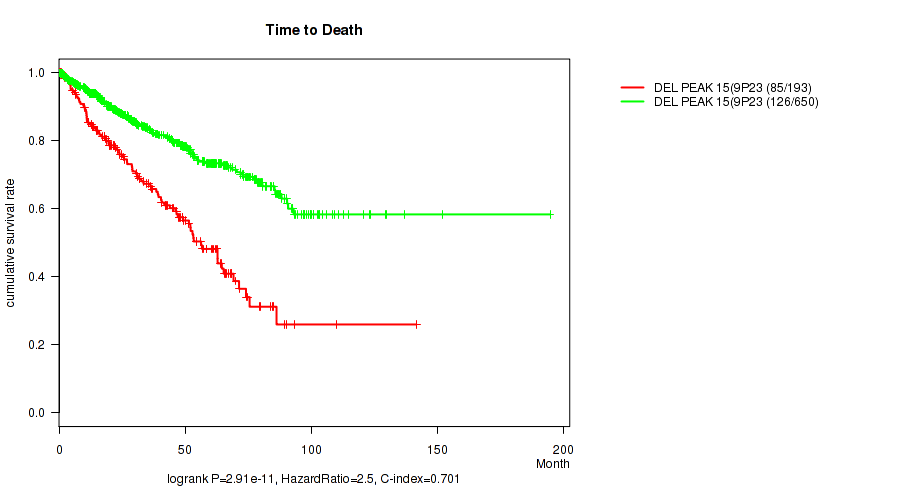
P value = 0.0247 (Wilcoxon-test), Q value = 0.068
Table S166. Gene #28: 'del_9p23' versus Clinical Feature #2: 'YEARS_TO_BIRTH'
| nPatients | Mean (Std.Dev) | |
|---|---|---|
| ALL | 853 | 60.1 (12.6) |
| DEL PEAK 15(9P23) MUTATED | 194 | 61.8 (12.0) |
| DEL PEAK 15(9P23) WILD-TYPE | 659 | 59.6 (12.7) |
Figure S166. Get High-res Image Gene #28: 'del_9p23' versus Clinical Feature #2: 'YEARS_TO_BIRTH'
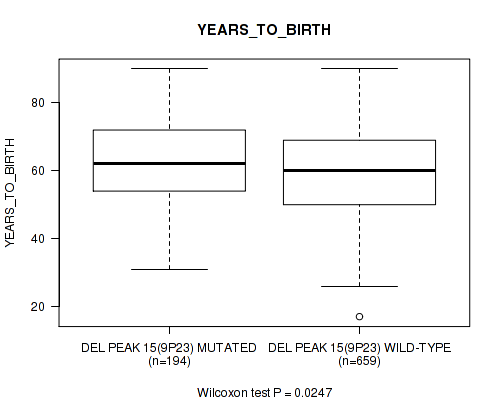
P value = 1e-05 (Fisher's exact test), Q value = 7.6e-05
Table S167. Gene #28: 'del_9p23' versus Clinical Feature #3: 'NEOPLASM_DISEASESTAGE'
| nPatients | STAGE I | STAGE II | STAGE III | STAGE IV |
|---|---|---|---|---|
| ALL | 448 | 103 | 190 | 100 |
| DEL PEAK 15(9P23) MUTATED | 64 | 16 | 69 | 43 |
| DEL PEAK 15(9P23) WILD-TYPE | 384 | 87 | 121 | 57 |
Figure S167. Get High-res Image Gene #28: 'del_9p23' versus Clinical Feature #3: 'NEOPLASM_DISEASESTAGE'
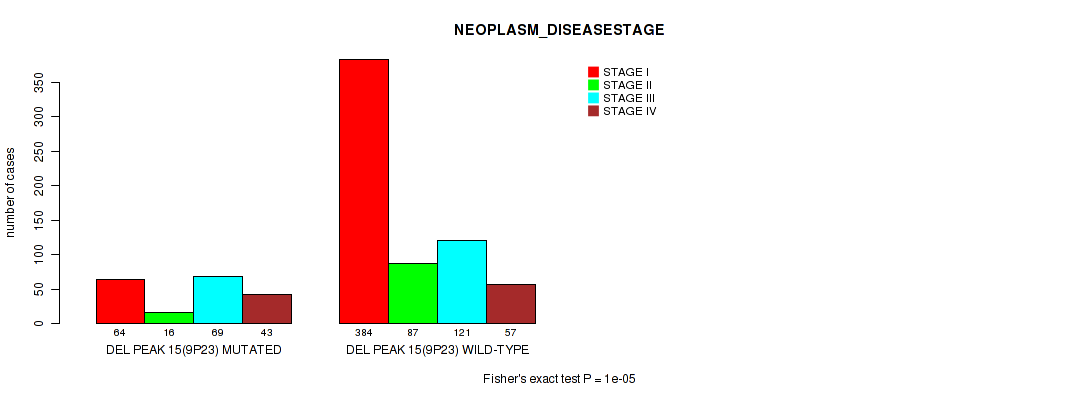
P value = 1e-05 (Fisher's exact test), Q value = 7.6e-05
Table S168. Gene #28: 'del_9p23' versus Clinical Feature #4: 'PATHOLOGY_T_STAGE'
| nPatients | T1 | T2 | T3 | T4 |
|---|---|---|---|---|
| ALL | 462 | 123 | 251 | 15 |
| DEL PEAK 15(9P23) MUTATED | 68 | 23 | 96 | 7 |
| DEL PEAK 15(9P23) WILD-TYPE | 394 | 100 | 155 | 8 |
Figure S168. Get High-res Image Gene #28: 'del_9p23' versus Clinical Feature #4: 'PATHOLOGY_T_STAGE'

P value = 0.00724 (Fisher's exact test), Q value = 0.024
Table S169. Gene #28: 'del_9p23' versus Clinical Feature #5: 'PATHOLOGY_N_STAGE'
| nPatients | N0 | N1 | N2 |
|---|---|---|---|
| ALL | 317 | 43 | 6 |
| DEL PEAK 15(9P23) MUTATED | 71 | 19 | 2 |
| DEL PEAK 15(9P23) WILD-TYPE | 246 | 24 | 4 |
Figure S169. Get High-res Image Gene #28: 'del_9p23' versus Clinical Feature #5: 'PATHOLOGY_N_STAGE'
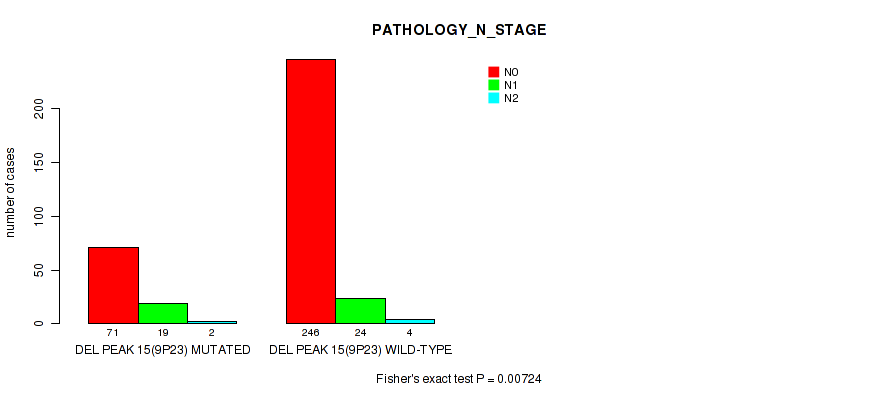
P value = 0.000223 (Fisher's exact test), Q value = 0.0012
Table S170. Gene #28: 'del_9p23' versus Clinical Feature #6: 'PATHOLOGY_M_STAGE'
| nPatients | 0 | 1 |
|---|---|---|
| ALL | 542 | 89 |
| DEL PEAK 15(9P23) MUTATED | 126 | 38 |
| DEL PEAK 15(9P23) WILD-TYPE | 416 | 51 |
Figure S170. Get High-res Image Gene #28: 'del_9p23' versus Clinical Feature #6: 'PATHOLOGY_M_STAGE'
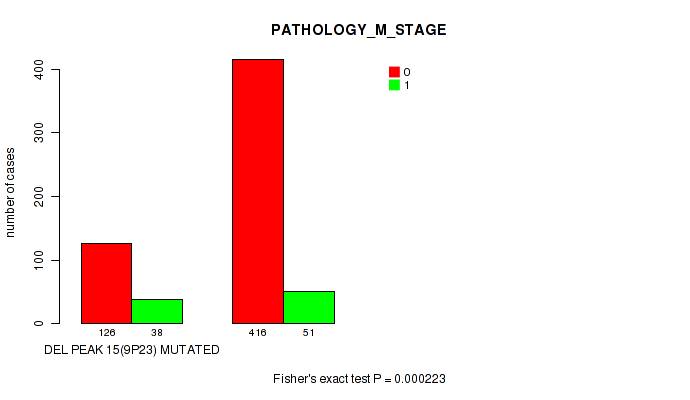
P value = 0.0204 (Wilcoxon-test), Q value = 0.059
Table S171. Gene #28: 'del_9p23' versus Clinical Feature #8: 'KARNOFSKY_PERFORMANCE_SCORE'
| nPatients | Mean (Std.Dev) | |
|---|---|---|
| ALL | 115 | 90.3 (17.6) |
| DEL PEAK 15(9P23) MUTATED | 23 | 83.0 (27.0) |
| DEL PEAK 15(9P23) WILD-TYPE | 92 | 92.1 (13.9) |
Figure S171. Get High-res Image Gene #28: 'del_9p23' versus Clinical Feature #8: 'KARNOFSKY_PERFORMANCE_SCORE'
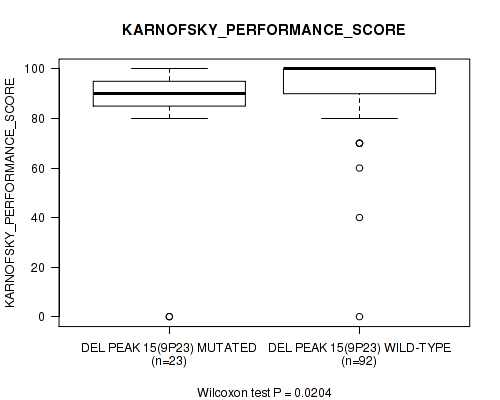
P value = 1e-05 (Fisher's exact test), Q value = 7.6e-05
Table S172. Gene #28: 'del_9p23' versus Clinical Feature #9: 'HISTOLOGICAL_TYPE'
| nPatients | KIDNEY CHROMOPHOBE | KIDNEY CLEAR CELL RENAL CARCINOMA | KIDNEY PAPILLARY RENAL CELL CARCINOMA |
|---|---|---|---|
| ALL | 66 | 524 | 269 |
| DEL PEAK 15(9P23) MUTATED | 10 | 151 | 35 |
| DEL PEAK 15(9P23) WILD-TYPE | 56 | 373 | 234 |
Figure S172. Get High-res Image Gene #28: 'del_9p23' versus Clinical Feature #9: 'HISTOLOGICAL_TYPE'
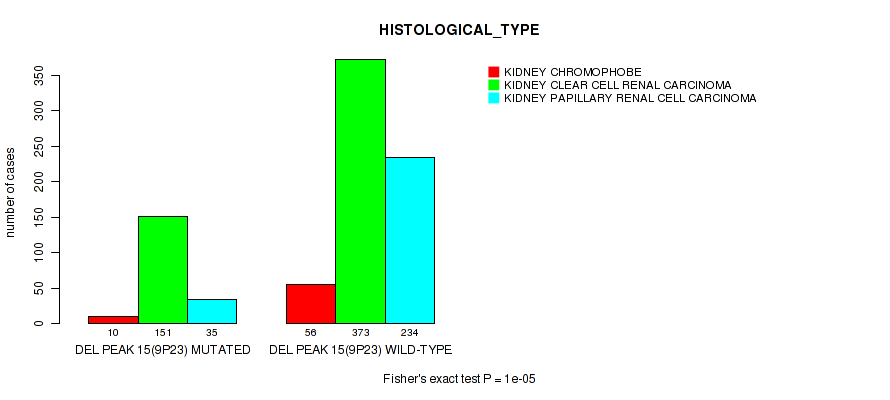
P value = 0.0126 (Fisher's exact test), Q value = 0.039
Table S173. Gene #28: 'del_9p23' versus Clinical Feature #12: 'RACE'
| nPatients | AMERICAN INDIAN OR ALASKA NATIVE | ASIAN | BLACK OR AFRICAN AMERICAN | WHITE |
|---|---|---|---|---|
| ALL | 2 | 15 | 116 | 702 |
| DEL PEAK 15(9P23) MUTATED | 0 | 4 | 14 | 172 |
| DEL PEAK 15(9P23) WILD-TYPE | 2 | 11 | 102 | 530 |
Figure S173. Get High-res Image Gene #28: 'del_9p23' versus Clinical Feature #12: 'RACE'
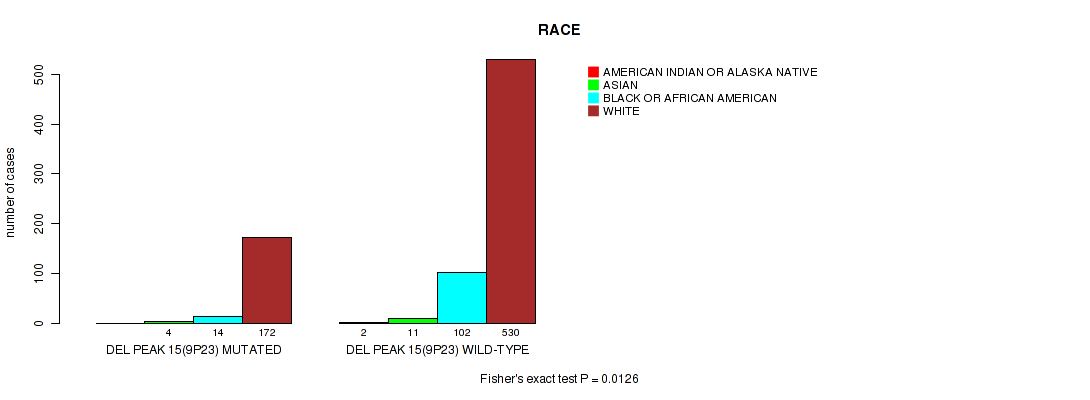
P value = 1.12e-14 (logrank test), Q value = 5.7e-12
Table S174. Gene #29: 'del_9p21.3' versus Clinical Feature #1: 'Time to Death'
| nPatients | nDeath | Duration Range (Median), Month | |
|---|---|---|---|
| ALL | 843 | 211 | 0.1 - 194.8 (30.5) |
| DEL PEAK 16(9P21.3) MUTATED | 203 | 93 | 0.1 - 141.7 (28.9) |
| DEL PEAK 16(9P21.3) WILD-TYPE | 640 | 118 | 0.1 - 194.8 (30.7) |
Figure S174. Get High-res Image Gene #29: 'del_9p21.3' versus Clinical Feature #1: 'Time to Death'
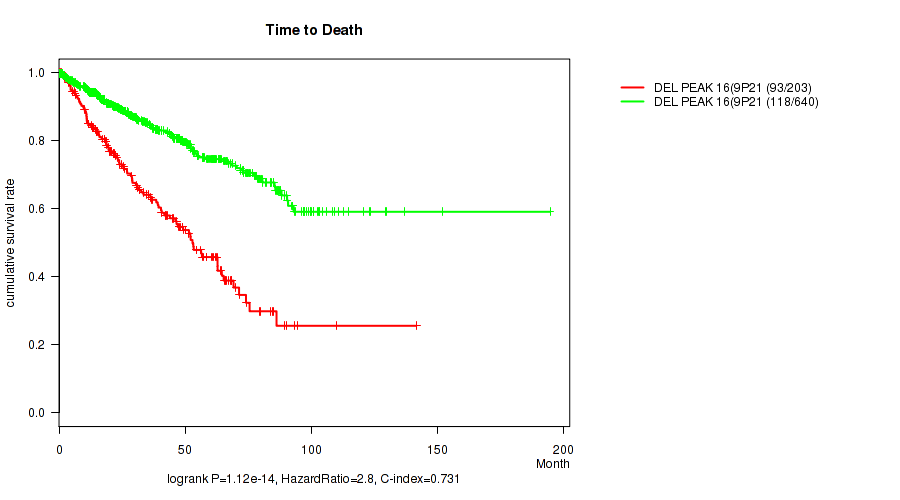
P value = 0.0358 (Wilcoxon-test), Q value = 0.092
Table S175. Gene #29: 'del_9p21.3' versus Clinical Feature #2: 'YEARS_TO_BIRTH'
| nPatients | Mean (Std.Dev) | |
|---|---|---|
| ALL | 853 | 60.1 (12.6) |
| DEL PEAK 16(9P21.3) MUTATED | 205 | 61.6 (12.2) |
| DEL PEAK 16(9P21.3) WILD-TYPE | 648 | 59.6 (12.7) |
Figure S175. Get High-res Image Gene #29: 'del_9p21.3' versus Clinical Feature #2: 'YEARS_TO_BIRTH'
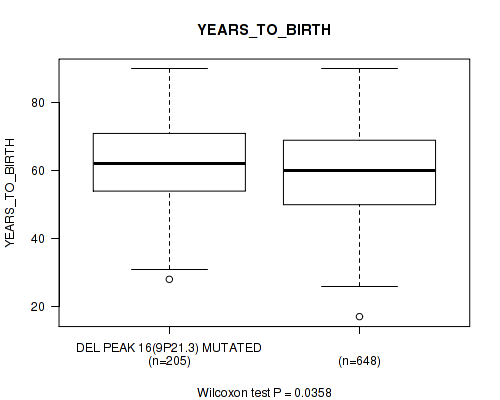
P value = 1e-05 (Fisher's exact test), Q value = 7.6e-05
Table S176. Gene #29: 'del_9p21.3' versus Clinical Feature #3: 'NEOPLASM_DISEASESTAGE'
| nPatients | STAGE I | STAGE II | STAGE III | STAGE IV |
|---|---|---|---|---|
| ALL | 448 | 103 | 190 | 100 |
| DEL PEAK 16(9P21.3) MUTATED | 66 | 15 | 74 | 48 |
| DEL PEAK 16(9P21.3) WILD-TYPE | 382 | 88 | 116 | 52 |
Figure S176. Get High-res Image Gene #29: 'del_9p21.3' versus Clinical Feature #3: 'NEOPLASM_DISEASESTAGE'
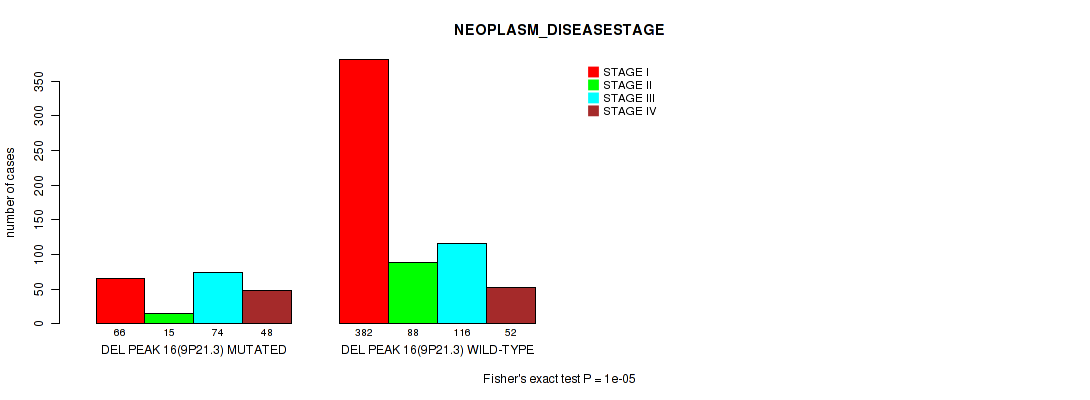
P value = 1e-05 (Fisher's exact test), Q value = 7.6e-05
Table S177. Gene #29: 'del_9p21.3' versus Clinical Feature #4: 'PATHOLOGY_T_STAGE'
| nPatients | T1 | T2 | T3 | T4 |
|---|---|---|---|---|
| ALL | 462 | 123 | 251 | 15 |
| DEL PEAK 16(9P21.3) MUTATED | 70 | 22 | 105 | 8 |
| DEL PEAK 16(9P21.3) WILD-TYPE | 392 | 101 | 146 | 7 |
Figure S177. Get High-res Image Gene #29: 'del_9p21.3' versus Clinical Feature #4: 'PATHOLOGY_T_STAGE'
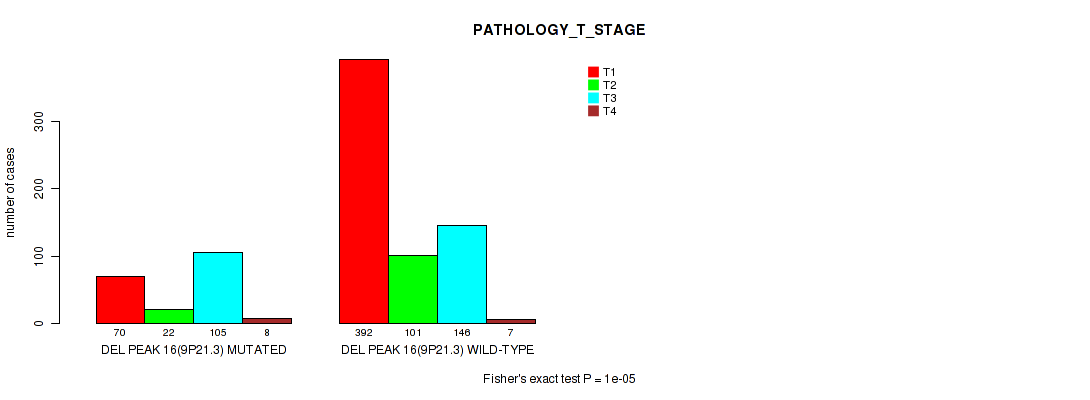
P value = 0.00013 (Fisher's exact test), Q value = 0.00076
Table S178. Gene #29: 'del_9p21.3' versus Clinical Feature #5: 'PATHOLOGY_N_STAGE'
| nPatients | N0 | N1 | N2 |
|---|---|---|---|
| ALL | 317 | 43 | 6 |
| DEL PEAK 16(9P21.3) MUTATED | 77 | 24 | 2 |
| DEL PEAK 16(9P21.3) WILD-TYPE | 240 | 19 | 4 |
Figure S178. Get High-res Image Gene #29: 'del_9p21.3' versus Clinical Feature #5: 'PATHOLOGY_N_STAGE'
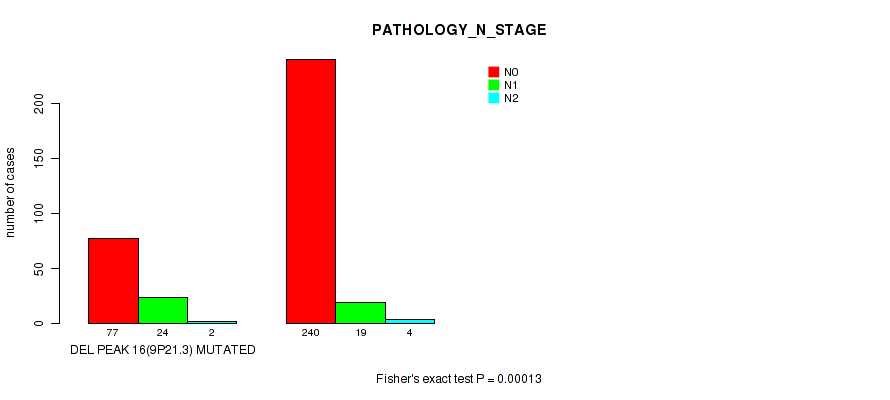
P value = 9.23e-06 (Fisher's exact test), Q value = 7.6e-05
Table S179. Gene #29: 'del_9p21.3' versus Clinical Feature #6: 'PATHOLOGY_M_STAGE'
| nPatients | 0 | 1 |
|---|---|---|
| ALL | 542 | 89 |
| DEL PEAK 16(9P21.3) MUTATED | 131 | 43 |
| DEL PEAK 16(9P21.3) WILD-TYPE | 411 | 46 |
Figure S179. Get High-res Image Gene #29: 'del_9p21.3' versus Clinical Feature #6: 'PATHOLOGY_M_STAGE'

P value = 0.0401 (Wilcoxon-test), Q value = 0.1
Table S180. Gene #29: 'del_9p21.3' versus Clinical Feature #8: 'KARNOFSKY_PERFORMANCE_SCORE'
| nPatients | Mean (Std.Dev) | |
|---|---|---|
| ALL | 115 | 90.3 (17.6) |
| DEL PEAK 16(9P21.3) MUTATED | 24 | 83.8 (26.7) |
| DEL PEAK 16(9P21.3) WILD-TYPE | 91 | 92.0 (14.0) |
Figure S180. Get High-res Image Gene #29: 'del_9p21.3' versus Clinical Feature #8: 'KARNOFSKY_PERFORMANCE_SCORE'
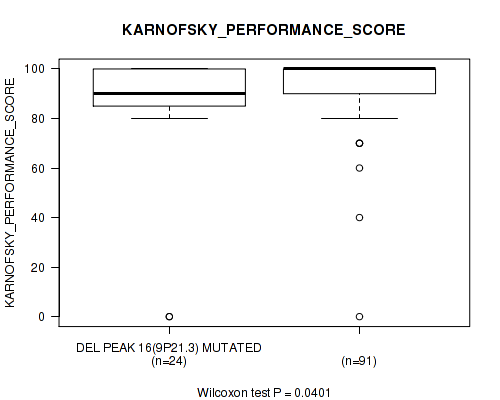
P value = 1e-05 (Fisher's exact test), Q value = 7.6e-05
Table S181. Gene #29: 'del_9p21.3' versus Clinical Feature #9: 'HISTOLOGICAL_TYPE'
| nPatients | KIDNEY CHROMOPHOBE | KIDNEY CLEAR CELL RENAL CARCINOMA | KIDNEY PAPILLARY RENAL CELL CARCINOMA |
|---|---|---|---|
| ALL | 66 | 524 | 269 |
| DEL PEAK 16(9P21.3) MUTATED | 10 | 159 | 38 |
| DEL PEAK 16(9P21.3) WILD-TYPE | 56 | 365 | 231 |
Figure S181. Get High-res Image Gene #29: 'del_9p21.3' versus Clinical Feature #9: 'HISTOLOGICAL_TYPE'
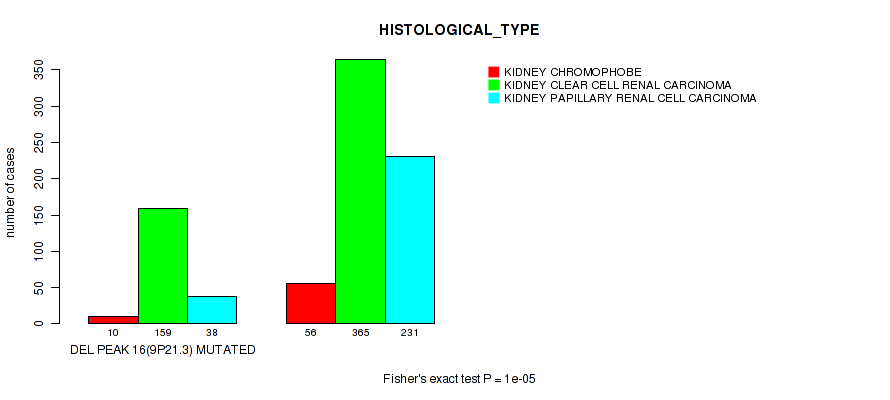
P value = 0.00827 (Fisher's exact test), Q value = 0.027
Table S182. Gene #29: 'del_9p21.3' versus Clinical Feature #12: 'RACE'
| nPatients | AMERICAN INDIAN OR ALASKA NATIVE | ASIAN | BLACK OR AFRICAN AMERICAN | WHITE |
|---|---|---|---|---|
| ALL | 2 | 15 | 116 | 702 |
| DEL PEAK 16(9P21.3) MUTATED | 0 | 3 | 15 | 184 |
| DEL PEAK 16(9P21.3) WILD-TYPE | 2 | 12 | 101 | 518 |
Figure S182. Get High-res Image Gene #29: 'del_9p21.3' versus Clinical Feature #12: 'RACE'

P value = 0.0425 (Wilcoxon-test), Q value = 0.11
Table S183. Gene #30: 'del_10q23.31' versus Clinical Feature #2: 'YEARS_TO_BIRTH'
| nPatients | Mean (Std.Dev) | |
|---|---|---|
| ALL | 853 | 60.1 (12.6) |
| DEL PEAK 17(10Q23.31) MUTATED | 160 | 58.0 (14.0) |
| DEL PEAK 17(10Q23.31) WILD-TYPE | 693 | 60.6 (12.2) |
Figure S183. Get High-res Image Gene #30: 'del_10q23.31' versus Clinical Feature #2: 'YEARS_TO_BIRTH'
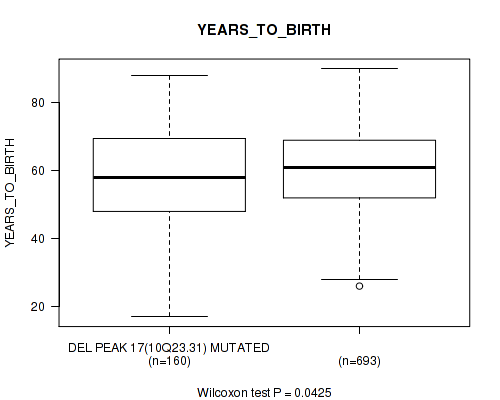
P value = 1e-05 (Fisher's exact test), Q value = 7.6e-05
Table S184. Gene #30: 'del_10q23.31' versus Clinical Feature #3: 'NEOPLASM_DISEASESTAGE'
| nPatients | STAGE I | STAGE II | STAGE III | STAGE IV |
|---|---|---|---|---|
| ALL | 448 | 103 | 190 | 100 |
| DEL PEAK 17(10Q23.31) MUTATED | 52 | 32 | 53 | 25 |
| DEL PEAK 17(10Q23.31) WILD-TYPE | 396 | 71 | 137 | 75 |
Figure S184. Get High-res Image Gene #30: 'del_10q23.31' versus Clinical Feature #3: 'NEOPLASM_DISEASESTAGE'
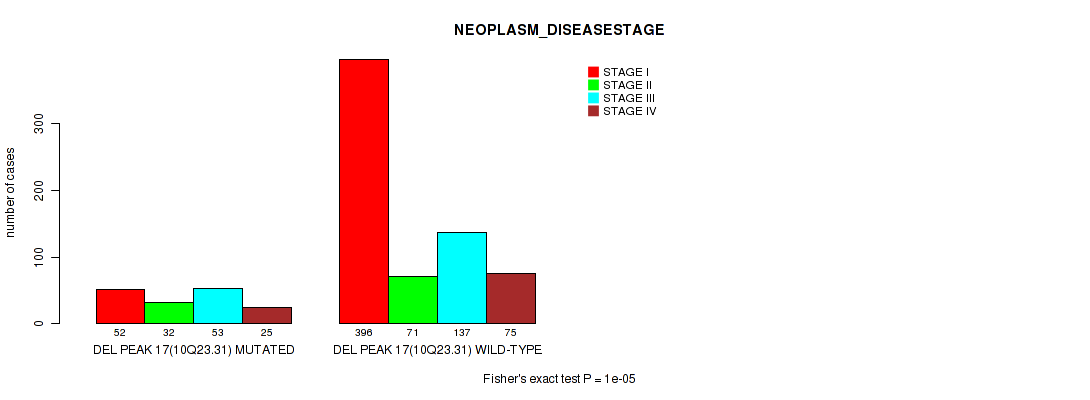
P value = 1e-05 (Fisher's exact test), Q value = 7.6e-05
Table S185. Gene #30: 'del_10q23.31' versus Clinical Feature #4: 'PATHOLOGY_T_STAGE'
| nPatients | T1 | T2 | T3 | T4 |
|---|---|---|---|---|
| ALL | 462 | 123 | 251 | 15 |
| DEL PEAK 17(10Q23.31) MUTATED | 53 | 33 | 69 | 7 |
| DEL PEAK 17(10Q23.31) WILD-TYPE | 409 | 90 | 182 | 8 |
Figure S185. Get High-res Image Gene #30: 'del_10q23.31' versus Clinical Feature #4: 'PATHOLOGY_T_STAGE'
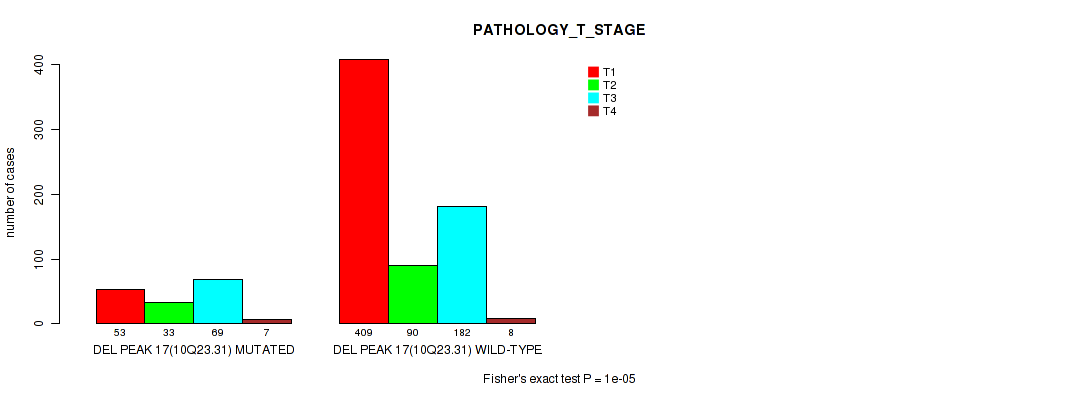
P value = 1e-05 (Fisher's exact test), Q value = 7.6e-05
Table S186. Gene #30: 'del_10q23.31' versus Clinical Feature #9: 'HISTOLOGICAL_TYPE'
| nPatients | KIDNEY CHROMOPHOBE | KIDNEY CLEAR CELL RENAL CARCINOMA | KIDNEY PAPILLARY RENAL CELL CARCINOMA |
|---|---|---|---|
| ALL | 66 | 524 | 269 |
| DEL PEAK 17(10Q23.31) MUTATED | 49 | 96 | 17 |
| DEL PEAK 17(10Q23.31) WILD-TYPE | 17 | 428 | 252 |
Figure S186. Get High-res Image Gene #30: 'del_10q23.31' versus Clinical Feature #9: 'HISTOLOGICAL_TYPE'

P value = 0.0994 (Fisher's exact test), Q value = 0.21
Table S187. Gene #30: 'del_10q23.31' versus Clinical Feature #12: 'RACE'
| nPatients | AMERICAN INDIAN OR ALASKA NATIVE | ASIAN | BLACK OR AFRICAN AMERICAN | WHITE |
|---|---|---|---|---|
| ALL | 2 | 15 | 116 | 702 |
| DEL PEAK 17(10Q23.31) MUTATED | 0 | 4 | 13 | 139 |
| DEL PEAK 17(10Q23.31) WILD-TYPE | 2 | 11 | 103 | 563 |
Figure S187. Get High-res Image Gene #30: 'del_10q23.31' versus Clinical Feature #12: 'RACE'

P value = 0.00196 (logrank test), Q value = 0.0082
Table S188. Gene #31: 'del_11q21' versus Clinical Feature #1: 'Time to Death'
| nPatients | nDeath | Duration Range (Median), Month | |
|---|---|---|---|
| ALL | 843 | 211 | 0.1 - 194.8 (30.5) |
| DEL PEAK 18(11Q21) MUTATED | 59 | 22 | 0.1 - 123.6 (19.7) |
| DEL PEAK 18(11Q21) WILD-TYPE | 784 | 189 | 0.1 - 194.8 (31.1) |
Figure S188. Get High-res Image Gene #31: 'del_11q21' versus Clinical Feature #1: 'Time to Death'
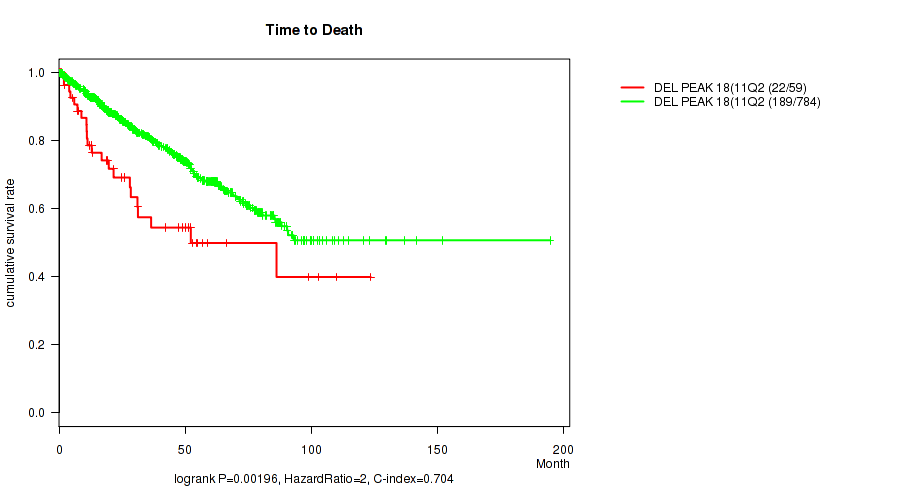
P value = 0.00478 (Wilcoxon-test), Q value = 0.017
Table S189. Gene #31: 'del_11q21' versus Clinical Feature #2: 'YEARS_TO_BIRTH'
| nPatients | Mean (Std.Dev) | |
|---|---|---|
| ALL | 853 | 60.1 (12.6) |
| DEL PEAK 18(11Q21) MUTATED | 59 | 64.2 (11.0) |
| DEL PEAK 18(11Q21) WILD-TYPE | 794 | 59.8 (12.6) |
Figure S189. Get High-res Image Gene #31: 'del_11q21' versus Clinical Feature #2: 'YEARS_TO_BIRTH'
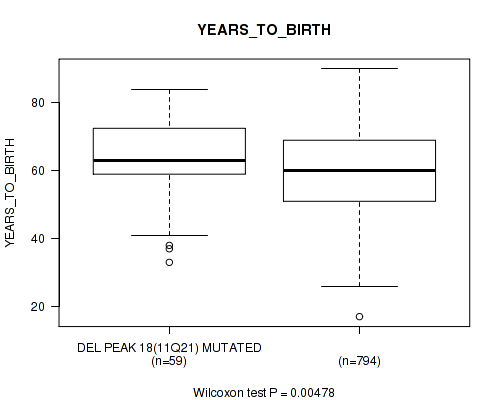
P value = 0.00026 (Fisher's exact test), Q value = 0.0014
Table S190. Gene #31: 'del_11q21' versus Clinical Feature #3: 'NEOPLASM_DISEASESTAGE'
| nPatients | STAGE I | STAGE II | STAGE III | STAGE IV |
|---|---|---|---|---|
| ALL | 448 | 103 | 190 | 100 |
| DEL PEAK 18(11Q21) MUTATED | 16 | 11 | 20 | 12 |
| DEL PEAK 18(11Q21) WILD-TYPE | 432 | 92 | 170 | 88 |
Figure S190. Get High-res Image Gene #31: 'del_11q21' versus Clinical Feature #3: 'NEOPLASM_DISEASESTAGE'
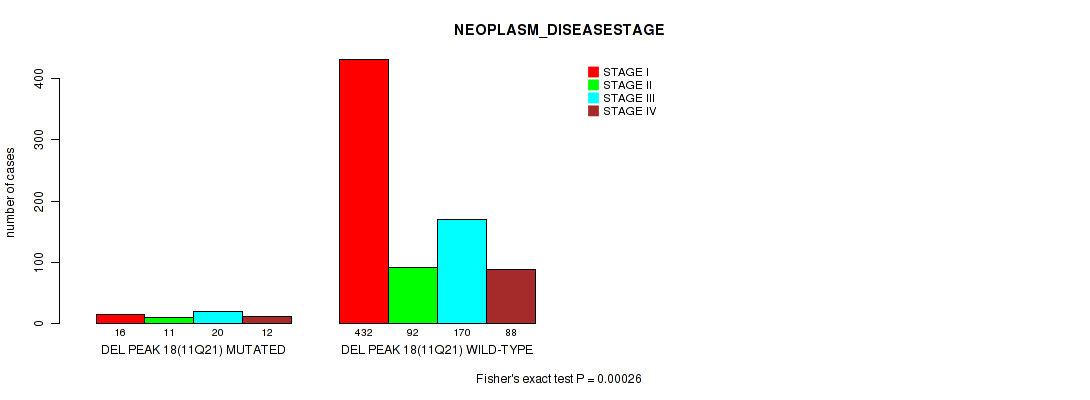
P value = 0.00041 (Fisher's exact test), Q value = 0.0021
Table S191. Gene #31: 'del_11q21' versus Clinical Feature #4: 'PATHOLOGY_T_STAGE'
| nPatients | T1 | T2 | T3 | T4 |
|---|---|---|---|---|
| ALL | 462 | 123 | 251 | 15 |
| DEL PEAK 18(11Q21) MUTATED | 17 | 12 | 29 | 1 |
| DEL PEAK 18(11Q21) WILD-TYPE | 445 | 111 | 222 | 14 |
Figure S191. Get High-res Image Gene #31: 'del_11q21' versus Clinical Feature #4: 'PATHOLOGY_T_STAGE'
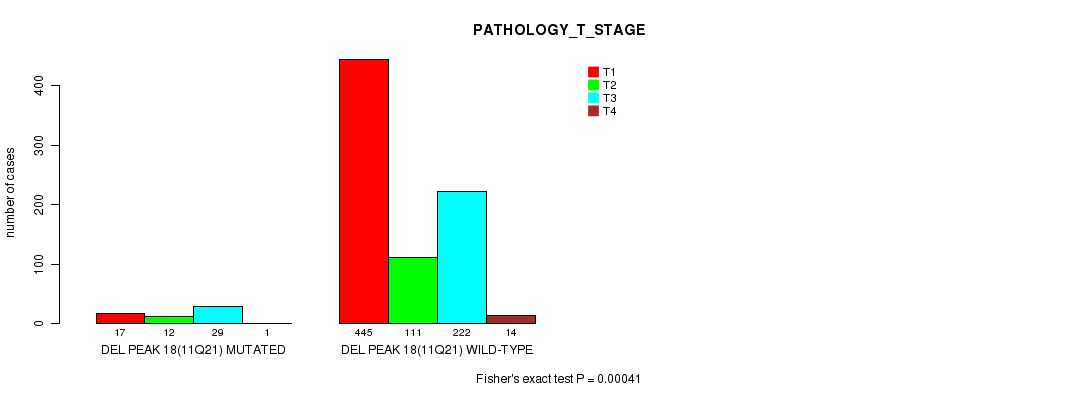
P value = 0.00019 (Fisher's exact test), Q value = 0.0011
Table S192. Gene #31: 'del_11q21' versus Clinical Feature #5: 'PATHOLOGY_N_STAGE'
| nPatients | N0 | N1 | N2 |
|---|---|---|---|
| ALL | 317 | 43 | 6 |
| DEL PEAK 18(11Q21) MUTATED | 21 | 11 | 2 |
| DEL PEAK 18(11Q21) WILD-TYPE | 296 | 32 | 4 |
Figure S192. Get High-res Image Gene #31: 'del_11q21' versus Clinical Feature #5: 'PATHOLOGY_N_STAGE'
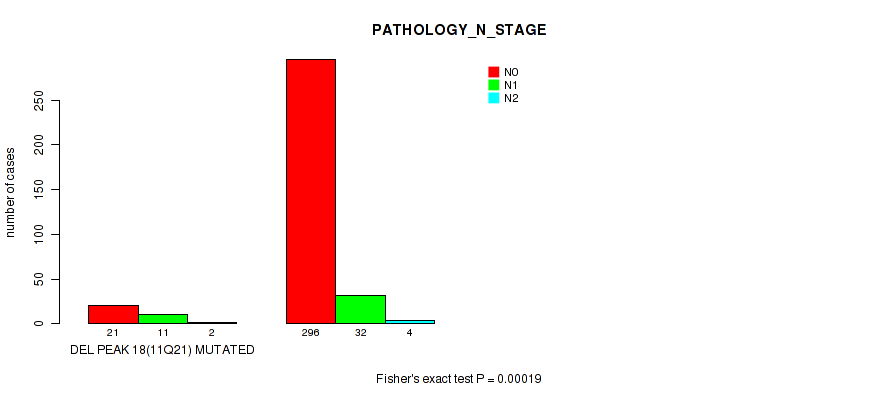
P value = 0.0998 (Fisher's exact test), Q value = 0.21
Table S193. Gene #31: 'del_11q21' versus Clinical Feature #6: 'PATHOLOGY_M_STAGE'
| nPatients | 0 | 1 |
|---|---|---|
| ALL | 542 | 89 |
| DEL PEAK 18(11Q21) MUTATED | 30 | 9 |
| DEL PEAK 18(11Q21) WILD-TYPE | 512 | 80 |
Figure S193. Get High-res Image Gene #31: 'del_11q21' versus Clinical Feature #6: 'PATHOLOGY_M_STAGE'
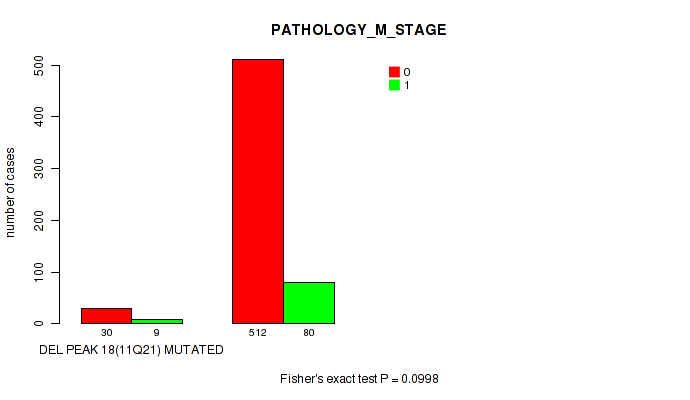
P value = 0.0624 (Wilcoxon-test), Q value = 0.15
Table S194. Gene #31: 'del_11q21' versus Clinical Feature #8: 'KARNOFSKY_PERFORMANCE_SCORE'
| nPatients | Mean (Std.Dev) | |
|---|---|---|
| ALL | 115 | 90.3 (17.6) |
| DEL PEAK 18(11Q21) MUTATED | 11 | 89.1 (7.0) |
| DEL PEAK 18(11Q21) WILD-TYPE | 104 | 90.4 (18.4) |
Figure S194. Get High-res Image Gene #31: 'del_11q21' versus Clinical Feature #8: 'KARNOFSKY_PERFORMANCE_SCORE'
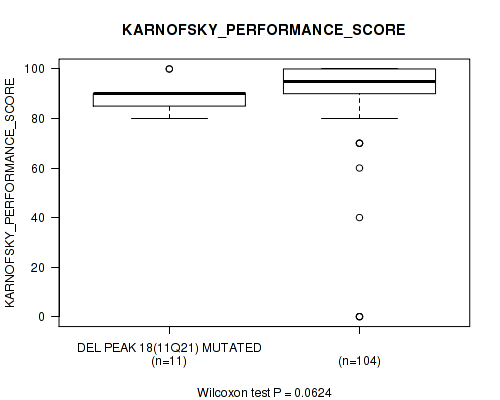
P value = 0.00304 (Fisher's exact test), Q value = 0.011
Table S195. Gene #31: 'del_11q21' versus Clinical Feature #9: 'HISTOLOGICAL_TYPE'
| nPatients | KIDNEY CHROMOPHOBE | KIDNEY CLEAR CELL RENAL CARCINOMA | KIDNEY PAPILLARY RENAL CELL CARCINOMA |
|---|---|---|---|
| ALL | 66 | 524 | 269 |
| DEL PEAK 18(11Q21) MUTATED | 9 | 25 | 26 |
| DEL PEAK 18(11Q21) WILD-TYPE | 57 | 499 | 243 |
Figure S195. Get High-res Image Gene #31: 'del_11q21' versus Clinical Feature #9: 'HISTOLOGICAL_TYPE'

P value = 0.00373 (logrank test), Q value = 0.014
Table S196. Gene #32: 'del_11q23.1' versus Clinical Feature #1: 'Time to Death'
| nPatients | nDeath | Duration Range (Median), Month | |
|---|---|---|---|
| ALL | 843 | 211 | 0.1 - 194.8 (30.5) |
| DEL PEAK 19(11Q23.1) MUTATED | 68 | 25 | 0.1 - 123.6 (20.6) |
| DEL PEAK 19(11Q23.1) WILD-TYPE | 775 | 186 | 0.1 - 194.8 (30.7) |
Figure S196. Get High-res Image Gene #32: 'del_11q23.1' versus Clinical Feature #1: 'Time to Death'
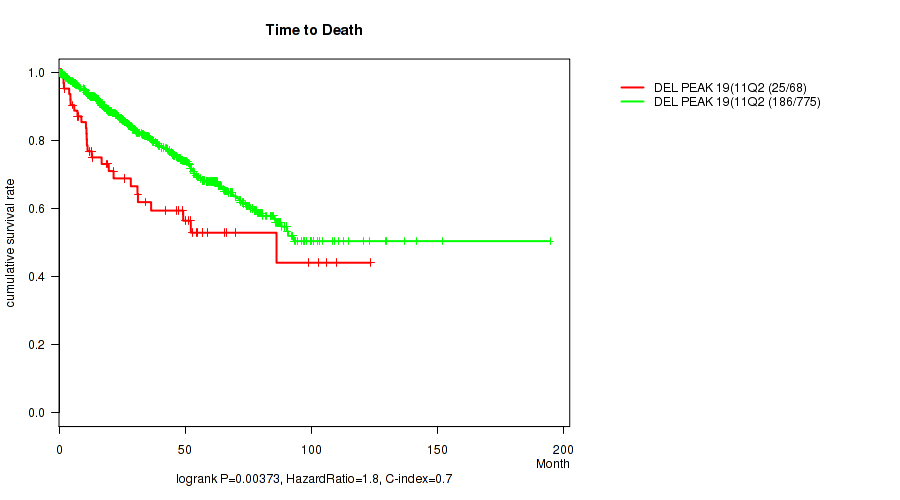
P value = 0.00293 (Wilcoxon-test), Q value = 0.011
Table S197. Gene #32: 'del_11q23.1' versus Clinical Feature #2: 'YEARS_TO_BIRTH'
| nPatients | Mean (Std.Dev) | |
|---|---|---|
| ALL | 853 | 60.1 (12.6) |
| DEL PEAK 19(11Q23.1) MUTATED | 69 | 64.1 (11.0) |
| DEL PEAK 19(11Q23.1) WILD-TYPE | 784 | 59.8 (12.6) |
Figure S197. Get High-res Image Gene #32: 'del_11q23.1' versus Clinical Feature #2: 'YEARS_TO_BIRTH'
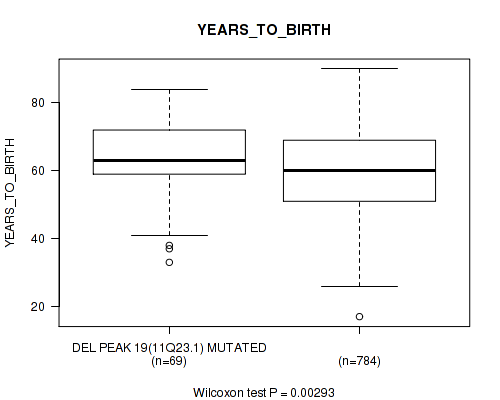
P value = 3e-05 (Fisher's exact test), Q value = 0.00021
Table S198. Gene #32: 'del_11q23.1' versus Clinical Feature #3: 'NEOPLASM_DISEASESTAGE'
| nPatients | STAGE I | STAGE II | STAGE III | STAGE IV |
|---|---|---|---|---|
| ALL | 448 | 103 | 190 | 100 |
| DEL PEAK 19(11Q23.1) MUTATED | 18 | 13 | 24 | 14 |
| DEL PEAK 19(11Q23.1) WILD-TYPE | 430 | 90 | 166 | 86 |
Figure S198. Get High-res Image Gene #32: 'del_11q23.1' versus Clinical Feature #3: 'NEOPLASM_DISEASESTAGE'
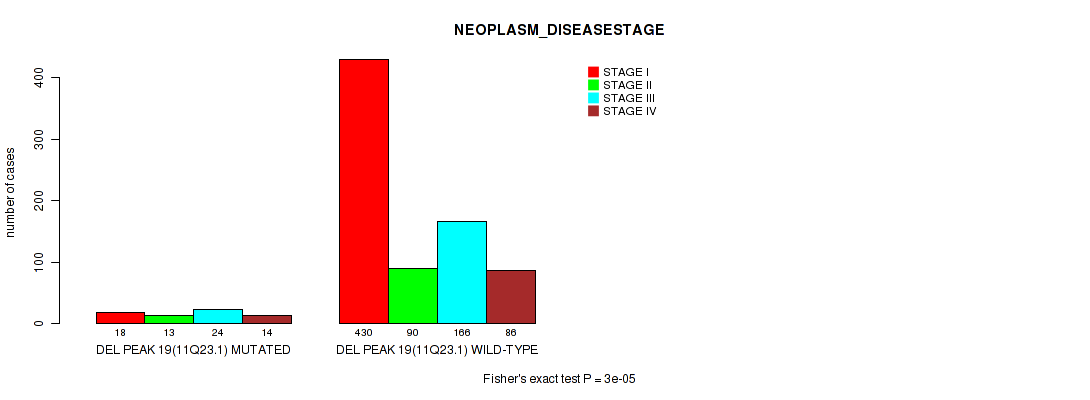
P value = 1e-05 (Fisher's exact test), Q value = 7.6e-05
Table S199. Gene #32: 'del_11q23.1' versus Clinical Feature #4: 'PATHOLOGY_T_STAGE'
| nPatients | T1 | T2 | T3 | T4 |
|---|---|---|---|---|
| ALL | 462 | 123 | 251 | 15 |
| DEL PEAK 19(11Q23.1) MUTATED | 19 | 15 | 32 | 3 |
| DEL PEAK 19(11Q23.1) WILD-TYPE | 443 | 108 | 219 | 12 |
Figure S199. Get High-res Image Gene #32: 'del_11q23.1' versus Clinical Feature #4: 'PATHOLOGY_T_STAGE'
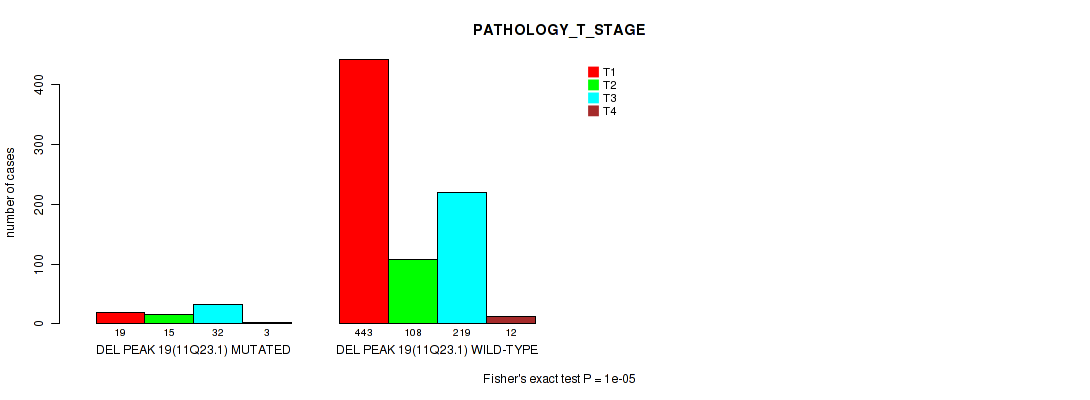
P value = 0.00047 (Fisher's exact test), Q value = 0.0023
Table S200. Gene #32: 'del_11q23.1' versus Clinical Feature #5: 'PATHOLOGY_N_STAGE'
| nPatients | N0 | N1 | N2 |
|---|---|---|---|
| ALL | 317 | 43 | 6 |
| DEL PEAK 19(11Q23.1) MUTATED | 24 | 11 | 2 |
| DEL PEAK 19(11Q23.1) WILD-TYPE | 293 | 32 | 4 |
Figure S200. Get High-res Image Gene #32: 'del_11q23.1' versus Clinical Feature #5: 'PATHOLOGY_N_STAGE'

P value = 0.112 (Fisher's exact test), Q value = 0.23
Table S201. Gene #32: 'del_11q23.1' versus Clinical Feature #6: 'PATHOLOGY_M_STAGE'
| nPatients | 0 | 1 |
|---|---|---|
| ALL | 542 | 89 |
| DEL PEAK 19(11Q23.1) MUTATED | 34 | 10 |
| DEL PEAK 19(11Q23.1) WILD-TYPE | 508 | 79 |
Figure S201. Get High-res Image Gene #32: 'del_11q23.1' versus Clinical Feature #6: 'PATHOLOGY_M_STAGE'
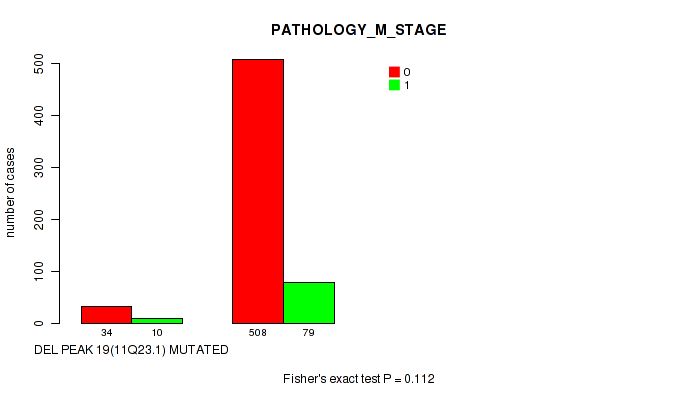
P value = 0.0253 (Wilcoxon-test), Q value = 0.069
Table S202. Gene #32: 'del_11q23.1' versus Clinical Feature #8: 'KARNOFSKY_PERFORMANCE_SCORE'
| nPatients | Mean (Std.Dev) | |
|---|---|---|
| ALL | 115 | 90.3 (17.6) |
| DEL PEAK 19(11Q23.1) MUTATED | 12 | 88.3 (7.2) |
| DEL PEAK 19(11Q23.1) WILD-TYPE | 103 | 90.5 (18.4) |
Figure S202. Get High-res Image Gene #32: 'del_11q23.1' versus Clinical Feature #8: 'KARNOFSKY_PERFORMANCE_SCORE'
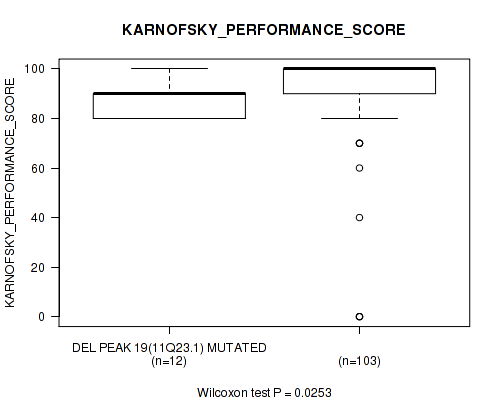
P value = 0.00361 (Fisher's exact test), Q value = 0.013
Table S203. Gene #32: 'del_11q23.1' versus Clinical Feature #9: 'HISTOLOGICAL_TYPE'
| nPatients | KIDNEY CHROMOPHOBE | KIDNEY CLEAR CELL RENAL CARCINOMA | KIDNEY PAPILLARY RENAL CELL CARCINOMA |
|---|---|---|---|
| ALL | 66 | 524 | 269 |
| DEL PEAK 19(11Q23.1) MUTATED | 9 | 30 | 31 |
| DEL PEAK 19(11Q23.1) WILD-TYPE | 57 | 494 | 238 |
Figure S203. Get High-res Image Gene #32: 'del_11q23.1' versus Clinical Feature #9: 'HISTOLOGICAL_TYPE'
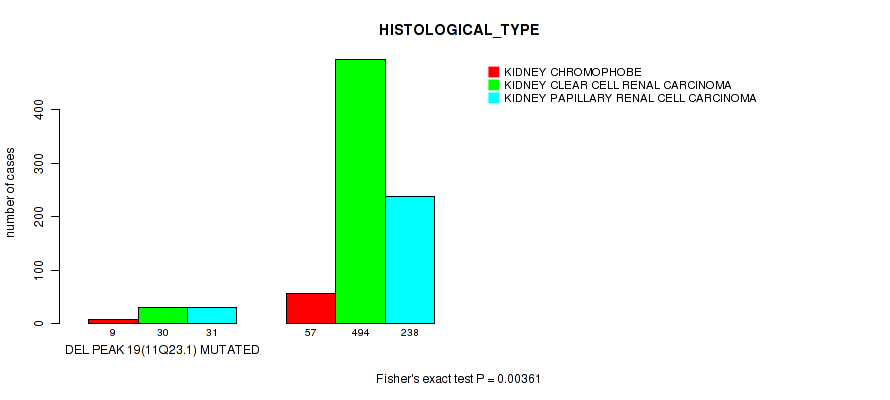
P value = 0.0323 (logrank test), Q value = 0.085
Table S204. Gene #33: 'del_13q12.13' versus Clinical Feature #1: 'Time to Death'
| nPatients | nDeath | Duration Range (Median), Month | |
|---|---|---|---|
| ALL | 843 | 211 | 0.1 - 194.8 (30.5) |
| DEL PEAK 20(13Q12.13) MUTATED | 146 | 53 | 0.1 - 152.0 (36.7) |
| DEL PEAK 20(13Q12.13) WILD-TYPE | 697 | 158 | 0.1 - 194.8 (29.5) |
Figure S204. Get High-res Image Gene #33: 'del_13q12.13' versus Clinical Feature #1: 'Time to Death'

P value = 0.000423 (Wilcoxon-test), Q value = 0.0021
Table S205. Gene #33: 'del_13q12.13' versus Clinical Feature #2: 'YEARS_TO_BIRTH'
| nPatients | Mean (Std.Dev) | |
|---|---|---|
| ALL | 853 | 60.1 (12.6) |
| DEL PEAK 20(13Q12.13) MUTATED | 148 | 56.2 (15.2) |
| DEL PEAK 20(13Q12.13) WILD-TYPE | 705 | 60.9 (11.8) |
Figure S205. Get High-res Image Gene #33: 'del_13q12.13' versus Clinical Feature #2: 'YEARS_TO_BIRTH'

P value = 1e-05 (Fisher's exact test), Q value = 7.6e-05
Table S206. Gene #33: 'del_13q12.13' versus Clinical Feature #3: 'NEOPLASM_DISEASESTAGE'
| nPatients | STAGE I | STAGE II | STAGE III | STAGE IV |
|---|---|---|---|---|
| ALL | 448 | 103 | 190 | 100 |
| DEL PEAK 20(13Q12.13) MUTATED | 46 | 24 | 50 | 28 |
| DEL PEAK 20(13Q12.13) WILD-TYPE | 402 | 79 | 140 | 72 |
Figure S206. Get High-res Image Gene #33: 'del_13q12.13' versus Clinical Feature #3: 'NEOPLASM_DISEASESTAGE'

P value = 1e-05 (Fisher's exact test), Q value = 7.6e-05
Table S207. Gene #33: 'del_13q12.13' versus Clinical Feature #4: 'PATHOLOGY_T_STAGE'
| nPatients | T1 | T2 | T3 | T4 |
|---|---|---|---|---|
| ALL | 462 | 123 | 251 | 15 |
| DEL PEAK 20(13Q12.13) MUTATED | 48 | 26 | 65 | 9 |
| DEL PEAK 20(13Q12.13) WILD-TYPE | 414 | 97 | 186 | 6 |
Figure S207. Get High-res Image Gene #33: 'del_13q12.13' versus Clinical Feature #4: 'PATHOLOGY_T_STAGE'
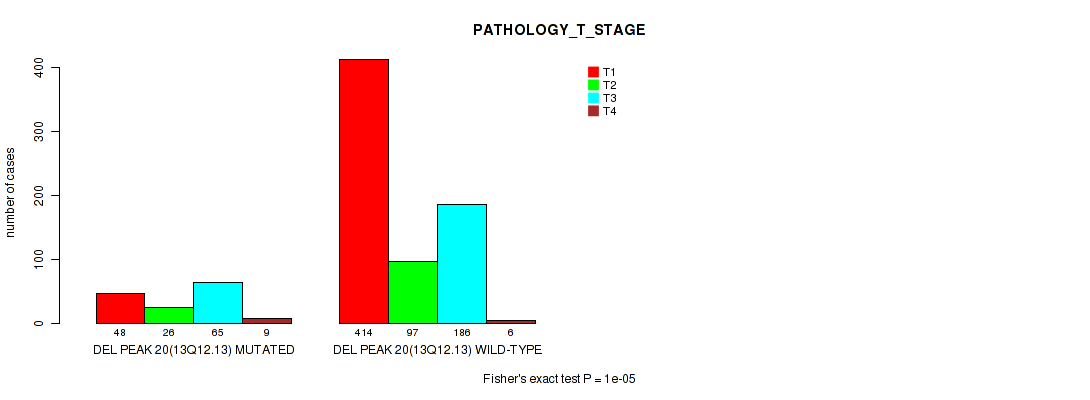
P value = 0.0135 (Fisher's exact test), Q value = 0.041
Table S208. Gene #33: 'del_13q12.13' versus Clinical Feature #5: 'PATHOLOGY_N_STAGE'
| nPatients | N0 | N1 | N2 |
|---|---|---|---|
| ALL | 317 | 43 | 6 |
| DEL PEAK 20(13Q12.13) MUTATED | 68 | 14 | 4 |
| DEL PEAK 20(13Q12.13) WILD-TYPE | 249 | 29 | 2 |
Figure S208. Get High-res Image Gene #33: 'del_13q12.13' versus Clinical Feature #5: 'PATHOLOGY_N_STAGE'
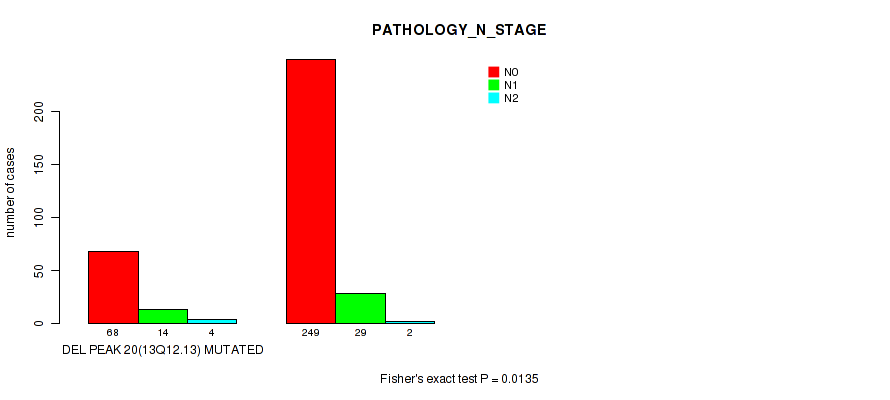
P value = 0.0212 (Fisher's exact test), Q value = 0.06
Table S209. Gene #33: 'del_13q12.13' versus Clinical Feature #7: 'GENDER'
| nPatients | FEMALE | MALE |
|---|---|---|
| ALL | 287 | 572 |
| DEL PEAK 20(13Q12.13) MUTATED | 62 | 86 |
| DEL PEAK 20(13Q12.13) WILD-TYPE | 225 | 486 |
Figure S209. Get High-res Image Gene #33: 'del_13q12.13' versus Clinical Feature #7: 'GENDER'

P value = 1e-05 (Fisher's exact test), Q value = 7.6e-05
Table S210. Gene #33: 'del_13q12.13' versus Clinical Feature #9: 'HISTOLOGICAL_TYPE'
| nPatients | KIDNEY CHROMOPHOBE | KIDNEY CLEAR CELL RENAL CARCINOMA | KIDNEY PAPILLARY RENAL CELL CARCINOMA |
|---|---|---|---|
| ALL | 66 | 524 | 269 |
| DEL PEAK 20(13Q12.13) MUTATED | 44 | 81 | 23 |
| DEL PEAK 20(13Q12.13) WILD-TYPE | 22 | 443 | 246 |
Figure S210. Get High-res Image Gene #33: 'del_13q12.13' versus Clinical Feature #9: 'HISTOLOGICAL_TYPE'
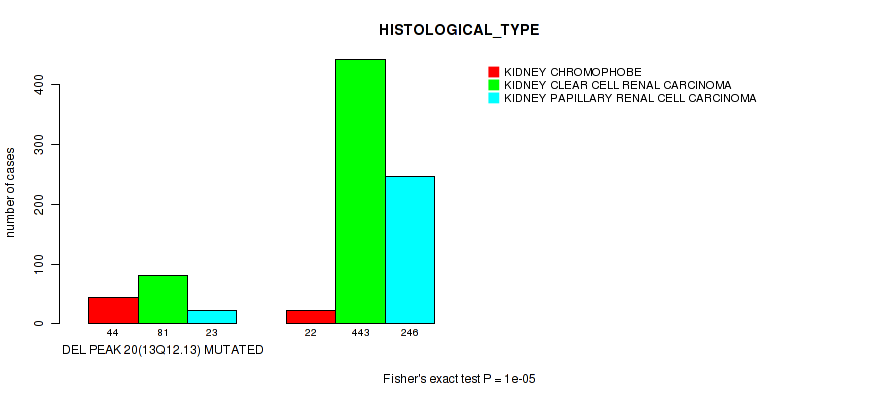
P value = 0.103 (Fisher's exact test), Q value = 0.21
Table S211. Gene #33: 'del_13q12.13' versus Clinical Feature #12: 'RACE'
| nPatients | AMERICAN INDIAN OR ALASKA NATIVE | ASIAN | BLACK OR AFRICAN AMERICAN | WHITE |
|---|---|---|---|---|
| ALL | 2 | 15 | 116 | 702 |
| DEL PEAK 20(13Q12.13) MUTATED | 0 | 4 | 12 | 127 |
| DEL PEAK 20(13Q12.13) WILD-TYPE | 2 | 11 | 104 | 575 |
Figure S211. Get High-res Image Gene #33: 'del_13q12.13' versus Clinical Feature #12: 'RACE'
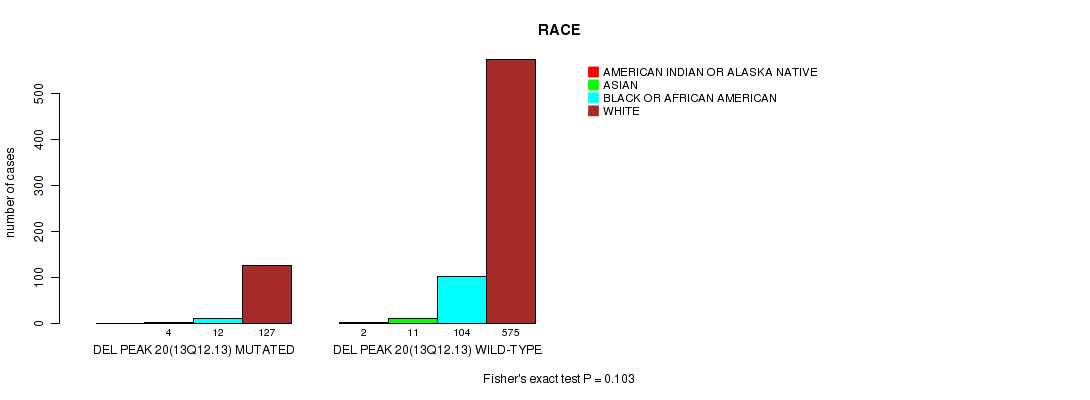
P value = 0.0241 (logrank test), Q value = 0.067
Table S212. Gene #34: 'del_13q14.2' versus Clinical Feature #1: 'Time to Death'
| nPatients | nDeath | Duration Range (Median), Month | |
|---|---|---|---|
| ALL | 843 | 211 | 0.1 - 194.8 (30.5) |
| DEL PEAK 21(13Q14.2) MUTATED | 146 | 53 | 0.1 - 152.0 (33.7) |
| DEL PEAK 21(13Q14.2) WILD-TYPE | 697 | 158 | 0.1 - 194.8 (29.9) |
Figure S212. Get High-res Image Gene #34: 'del_13q14.2' versus Clinical Feature #1: 'Time to Death'
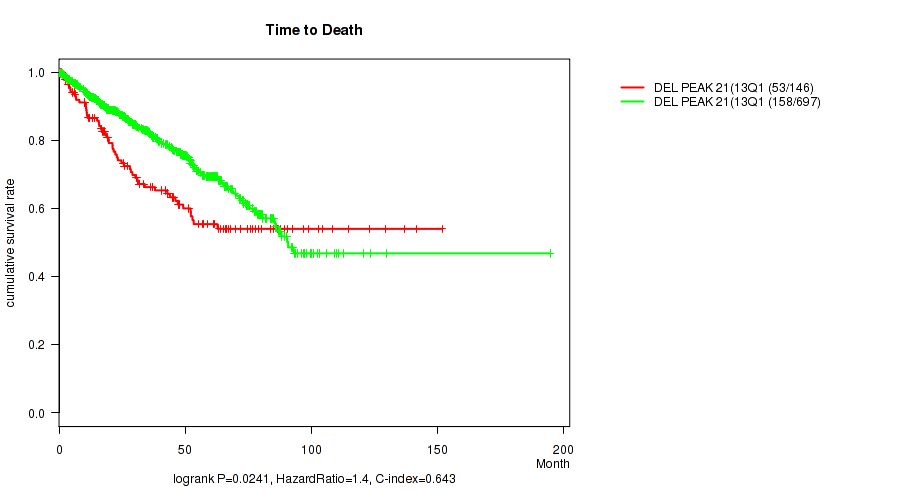
P value = 8.11e-05 (Wilcoxon-test), Q value = 5e-04
Table S213. Gene #34: 'del_13q14.2' versus Clinical Feature #2: 'YEARS_TO_BIRTH'
| nPatients | Mean (Std.Dev) | |
|---|---|---|
| ALL | 853 | 60.1 (12.6) |
| DEL PEAK 21(13Q14.2) MUTATED | 148 | 55.7 (15.0) |
| DEL PEAK 21(13Q14.2) WILD-TYPE | 705 | 61.0 (11.8) |
Figure S213. Get High-res Image Gene #34: 'del_13q14.2' versus Clinical Feature #2: 'YEARS_TO_BIRTH'
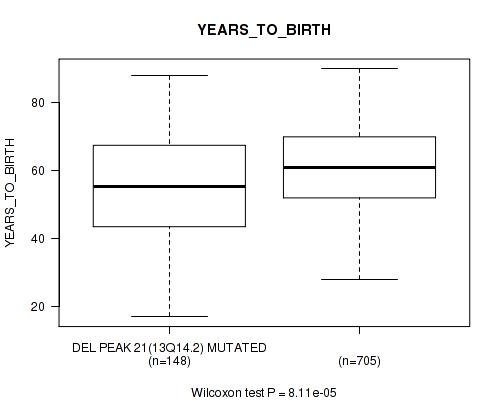
P value = 1e-05 (Fisher's exact test), Q value = 7.6e-05
Table S214. Gene #34: 'del_13q14.2' versus Clinical Feature #3: 'NEOPLASM_DISEASESTAGE'
| nPatients | STAGE I | STAGE II | STAGE III | STAGE IV |
|---|---|---|---|---|
| ALL | 448 | 103 | 190 | 100 |
| DEL PEAK 21(13Q14.2) MUTATED | 46 | 22 | 51 | 29 |
| DEL PEAK 21(13Q14.2) WILD-TYPE | 402 | 81 | 139 | 71 |
Figure S214. Get High-res Image Gene #34: 'del_13q14.2' versus Clinical Feature #3: 'NEOPLASM_DISEASESTAGE'
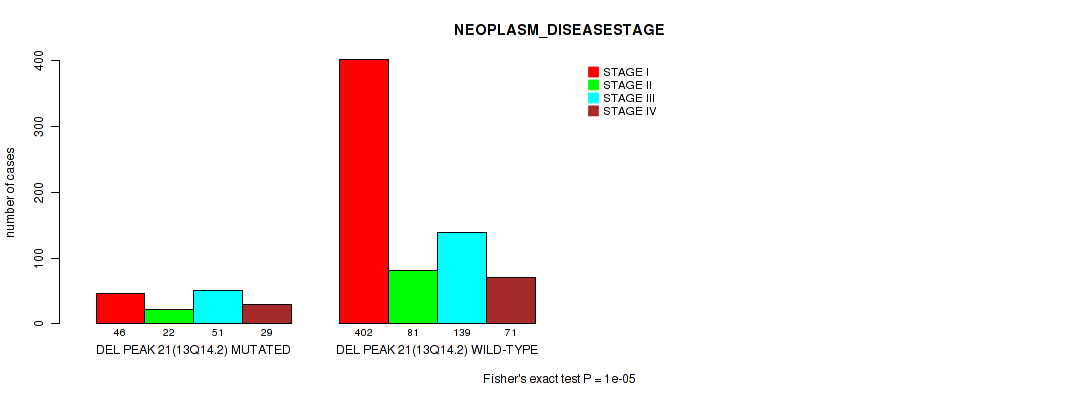
P value = 1e-05 (Fisher's exact test), Q value = 7.6e-05
Table S215. Gene #34: 'del_13q14.2' versus Clinical Feature #4: 'PATHOLOGY_T_STAGE'
| nPatients | T1 | T2 | T3 | T4 |
|---|---|---|---|---|
| ALL | 462 | 123 | 251 | 15 |
| DEL PEAK 21(13Q14.2) MUTATED | 48 | 24 | 67 | 9 |
| DEL PEAK 21(13Q14.2) WILD-TYPE | 414 | 99 | 184 | 6 |
Figure S215. Get High-res Image Gene #34: 'del_13q14.2' versus Clinical Feature #4: 'PATHOLOGY_T_STAGE'

P value = 0.015 (Fisher's exact test), Q value = 0.045
Table S216. Gene #34: 'del_13q14.2' versus Clinical Feature #5: 'PATHOLOGY_N_STAGE'
| nPatients | N0 | N1 | N2 |
|---|---|---|---|
| ALL | 317 | 43 | 6 |
| DEL PEAK 21(13Q14.2) MUTATED | 69 | 14 | 4 |
| DEL PEAK 21(13Q14.2) WILD-TYPE | 248 | 29 | 2 |
Figure S216. Get High-res Image Gene #34: 'del_13q14.2' versus Clinical Feature #5: 'PATHOLOGY_N_STAGE'

P value = 0.0125 (Fisher's exact test), Q value = 0.039
Table S217. Gene #34: 'del_13q14.2' versus Clinical Feature #7: 'GENDER'
| nPatients | FEMALE | MALE |
|---|---|---|
| ALL | 287 | 572 |
| DEL PEAK 21(13Q14.2) MUTATED | 63 | 85 |
| DEL PEAK 21(13Q14.2) WILD-TYPE | 224 | 487 |
Figure S217. Get High-res Image Gene #34: 'del_13q14.2' versus Clinical Feature #7: 'GENDER'
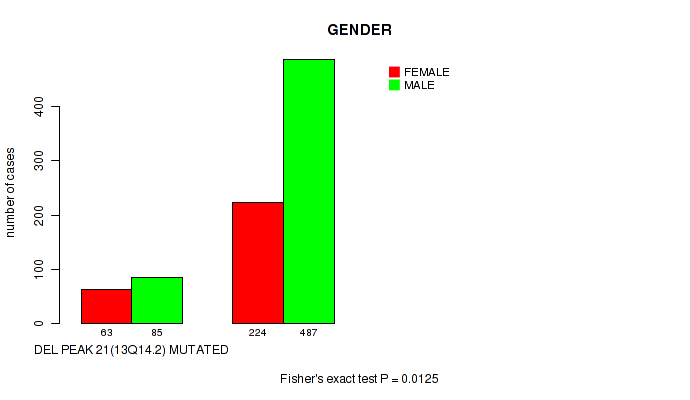
P value = 1e-05 (Fisher's exact test), Q value = 7.6e-05
Table S218. Gene #34: 'del_13q14.2' versus Clinical Feature #9: 'HISTOLOGICAL_TYPE'
| nPatients | KIDNEY CHROMOPHOBE | KIDNEY CLEAR CELL RENAL CARCINOMA | KIDNEY PAPILLARY RENAL CELL CARCINOMA |
|---|---|---|---|
| ALL | 66 | 524 | 269 |
| DEL PEAK 21(13Q14.2) MUTATED | 43 | 82 | 23 |
| DEL PEAK 21(13Q14.2) WILD-TYPE | 23 | 442 | 246 |
Figure S218. Get High-res Image Gene #34: 'del_13q14.2' versus Clinical Feature #9: 'HISTOLOGICAL_TYPE'

P value = 0.104 (Fisher's exact test), Q value = 0.21
Table S219. Gene #34: 'del_13q14.2' versus Clinical Feature #12: 'RACE'
| nPatients | AMERICAN INDIAN OR ALASKA NATIVE | ASIAN | BLACK OR AFRICAN AMERICAN | WHITE |
|---|---|---|---|---|
| ALL | 2 | 15 | 116 | 702 |
| DEL PEAK 21(13Q14.2) MUTATED | 0 | 4 | 12 | 127 |
| DEL PEAK 21(13Q14.2) WILD-TYPE | 2 | 11 | 104 | 575 |
Figure S219. Get High-res Image Gene #34: 'del_13q14.2' versus Clinical Feature #12: 'RACE'

P value = 8.67e-09 (logrank test), Q value = 8.8e-07
Table S220. Gene #35: 'del_14q31.1' versus Clinical Feature #1: 'Time to Death'
| nPatients | nDeath | Duration Range (Median), Month | |
|---|---|---|---|
| ALL | 843 | 211 | 0.1 - 194.8 (30.5) |
| DEL PEAK 22(14Q31.1) MUTATED | 273 | 103 | 0.1 - 129.4 (30.5) |
| DEL PEAK 22(14Q31.1) WILD-TYPE | 570 | 108 | 0.1 - 194.8 (30.5) |
Figure S220. Get High-res Image Gene #35: 'del_14q31.1' versus Clinical Feature #1: 'Time to Death'
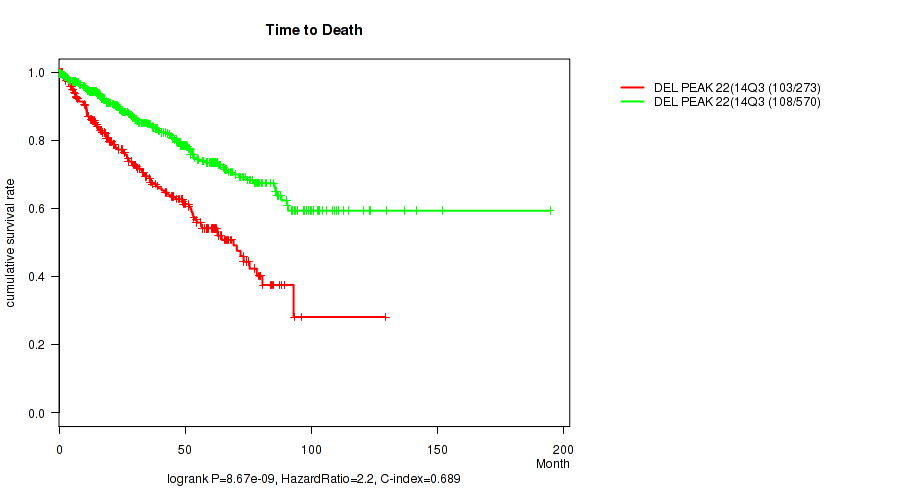
P value = 0.0799 (Wilcoxon-test), Q value = 0.18
Table S221. Gene #35: 'del_14q31.1' versus Clinical Feature #2: 'YEARS_TO_BIRTH'
| nPatients | Mean (Std.Dev) | |
|---|---|---|
| ALL | 853 | 60.1 (12.6) |
| DEL PEAK 22(14Q31.1) MUTATED | 273 | 61.3 (12.4) |
| DEL PEAK 22(14Q31.1) WILD-TYPE | 580 | 59.6 (12.6) |
Figure S221. Get High-res Image Gene #35: 'del_14q31.1' versus Clinical Feature #2: 'YEARS_TO_BIRTH'
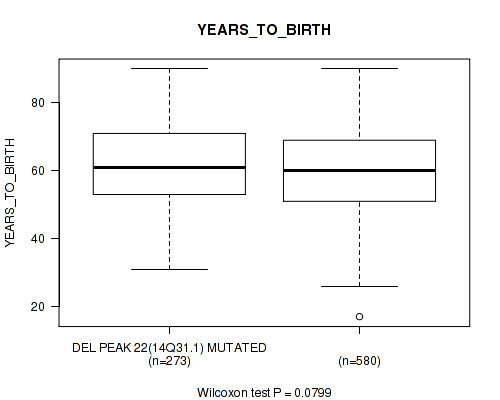
P value = 1e-05 (Fisher's exact test), Q value = 7.6e-05
Table S222. Gene #35: 'del_14q31.1' versus Clinical Feature #3: 'NEOPLASM_DISEASESTAGE'
| nPatients | STAGE I | STAGE II | STAGE III | STAGE IV |
|---|---|---|---|---|
| ALL | 448 | 103 | 190 | 100 |
| DEL PEAK 22(14Q31.1) MUTATED | 103 | 31 | 83 | 54 |
| DEL PEAK 22(14Q31.1) WILD-TYPE | 345 | 72 | 107 | 46 |
Figure S222. Get High-res Image Gene #35: 'del_14q31.1' versus Clinical Feature #3: 'NEOPLASM_DISEASESTAGE'
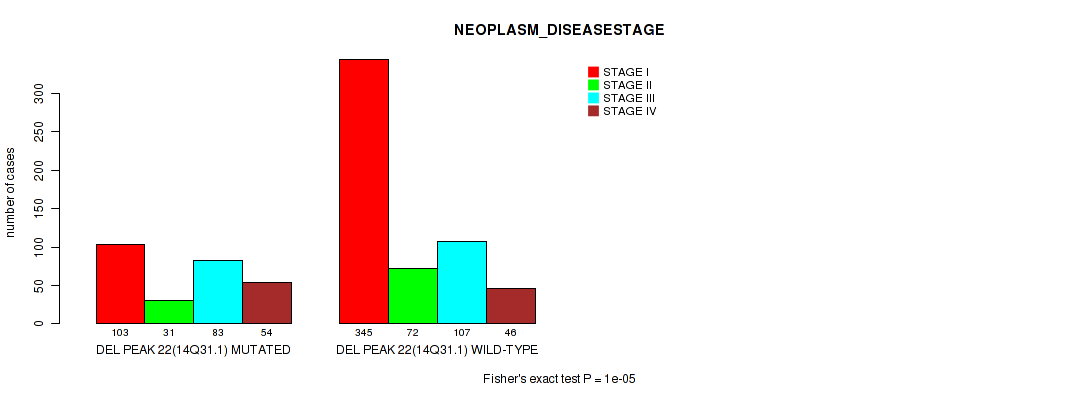
P value = 1e-05 (Fisher's exact test), Q value = 7.6e-05
Table S223. Gene #35: 'del_14q31.1' versus Clinical Feature #4: 'PATHOLOGY_T_STAGE'
| nPatients | T1 | T2 | T3 | T4 |
|---|---|---|---|---|
| ALL | 462 | 123 | 251 | 15 |
| DEL PEAK 22(14Q31.1) MUTATED | 110 | 40 | 119 | 5 |
| DEL PEAK 22(14Q31.1) WILD-TYPE | 352 | 83 | 132 | 10 |
Figure S223. Get High-res Image Gene #35: 'del_14q31.1' versus Clinical Feature #4: 'PATHOLOGY_T_STAGE'
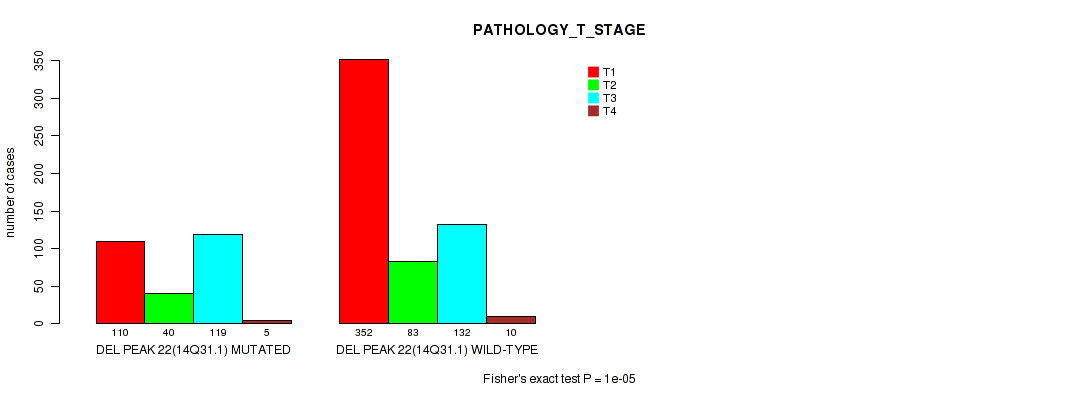
P value = 0.00205 (Fisher's exact test), Q value = 0.0083
Table S224. Gene #35: 'del_14q31.1' versus Clinical Feature #5: 'PATHOLOGY_N_STAGE'
| nPatients | N0 | N1 | N2 |
|---|---|---|---|
| ALL | 317 | 43 | 6 |
| DEL PEAK 22(14Q31.1) MUTATED | 108 | 26 | 3 |
| DEL PEAK 22(14Q31.1) WILD-TYPE | 209 | 17 | 3 |
Figure S224. Get High-res Image Gene #35: 'del_14q31.1' versus Clinical Feature #5: 'PATHOLOGY_N_STAGE'
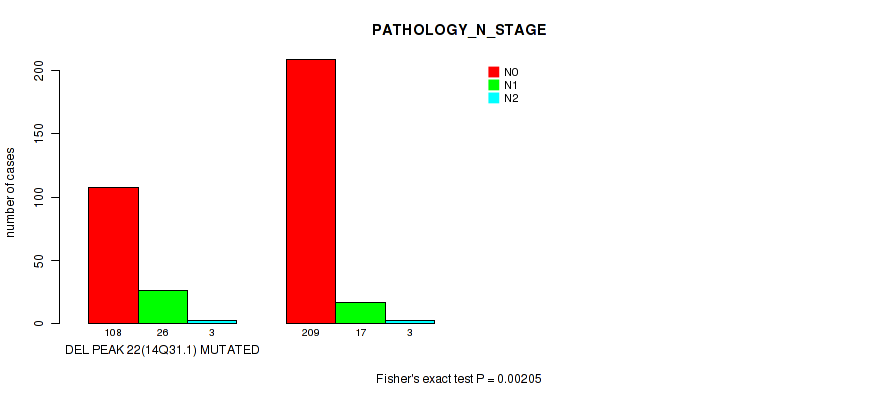
P value = 4.84e-05 (Fisher's exact test), Q value = 0.00033
Table S225. Gene #35: 'del_14q31.1' versus Clinical Feature #6: 'PATHOLOGY_M_STAGE'
| nPatients | 0 | 1 |
|---|---|---|
| ALL | 542 | 89 |
| DEL PEAK 22(14Q31.1) MUTATED | 185 | 51 |
| DEL PEAK 22(14Q31.1) WILD-TYPE | 357 | 38 |
Figure S225. Get High-res Image Gene #35: 'del_14q31.1' versus Clinical Feature #6: 'PATHOLOGY_M_STAGE'
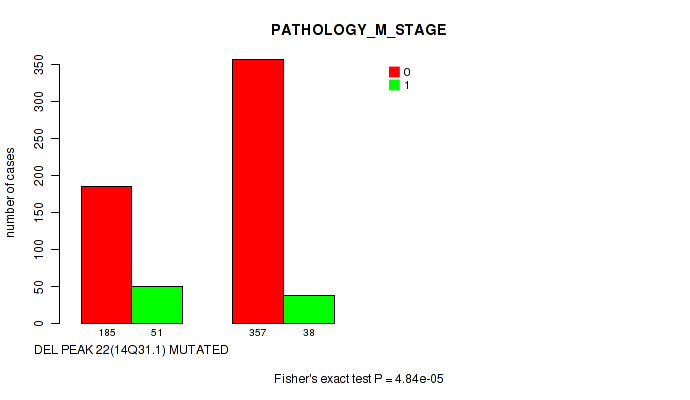
P value = 0.0447 (Wilcoxon-test), Q value = 0.11
Table S226. Gene #35: 'del_14q31.1' versus Clinical Feature #8: 'KARNOFSKY_PERFORMANCE_SCORE'
| nPatients | Mean (Std.Dev) | |
|---|---|---|
| ALL | 115 | 90.3 (17.6) |
| DEL PEAK 22(14Q31.1) MUTATED | 30 | 82.0 (29.3) |
| DEL PEAK 22(14Q31.1) WILD-TYPE | 85 | 93.2 (9.5) |
Figure S226. Get High-res Image Gene #35: 'del_14q31.1' versus Clinical Feature #8: 'KARNOFSKY_PERFORMANCE_SCORE'
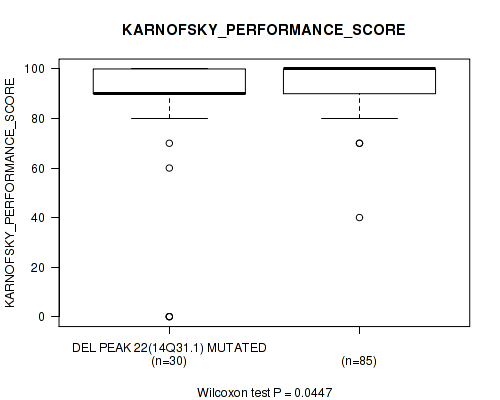
P value = 1e-05 (Fisher's exact test), Q value = 7.6e-05
Table S227. Gene #35: 'del_14q31.1' versus Clinical Feature #9: 'HISTOLOGICAL_TYPE'
| nPatients | KIDNEY CHROMOPHOBE | KIDNEY CLEAR CELL RENAL CARCINOMA | KIDNEY PAPILLARY RENAL CELL CARCINOMA |
|---|---|---|---|
| ALL | 66 | 524 | 269 |
| DEL PEAK 22(14Q31.1) MUTATED | 3 | 226 | 45 |
| DEL PEAK 22(14Q31.1) WILD-TYPE | 63 | 298 | 224 |
Figure S227. Get High-res Image Gene #35: 'del_14q31.1' versus Clinical Feature #9: 'HISTOLOGICAL_TYPE'
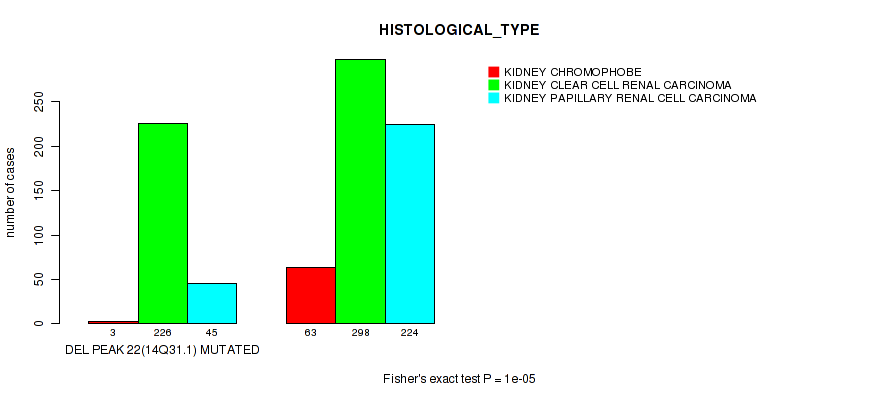
P value = 0.00272 (Wilcoxon-test), Q value = 0.011
Table S228. Gene #35: 'del_14q31.1' versus Clinical Feature #11: 'YEAR_OF_TOBACCO_SMOKING_ONSET'
| nPatients | Mean (Std.Dev) | |
|---|---|---|
| ALL | 67 | 1973.4 (16.4) |
| DEL PEAK 22(14Q31.1) MUTATED | 11 | 1987.4 (14.2) |
| DEL PEAK 22(14Q31.1) WILD-TYPE | 56 | 1970.7 (15.5) |
Figure S228. Get High-res Image Gene #35: 'del_14q31.1' versus Clinical Feature #11: 'YEAR_OF_TOBACCO_SMOKING_ONSET'
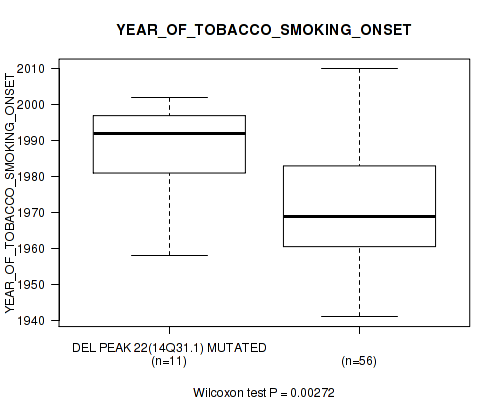
P value = 0.011 (Fisher's exact test), Q value = 0.035
Table S229. Gene #35: 'del_14q31.1' versus Clinical Feature #12: 'RACE'
| nPatients | AMERICAN INDIAN OR ALASKA NATIVE | ASIAN | BLACK OR AFRICAN AMERICAN | WHITE |
|---|---|---|---|---|
| ALL | 2 | 15 | 116 | 702 |
| DEL PEAK 22(14Q31.1) MUTATED | 0 | 3 | 24 | 240 |
| DEL PEAK 22(14Q31.1) WILD-TYPE | 2 | 12 | 92 | 462 |
Figure S229. Get High-res Image Gene #35: 'del_14q31.1' versus Clinical Feature #12: 'RACE'
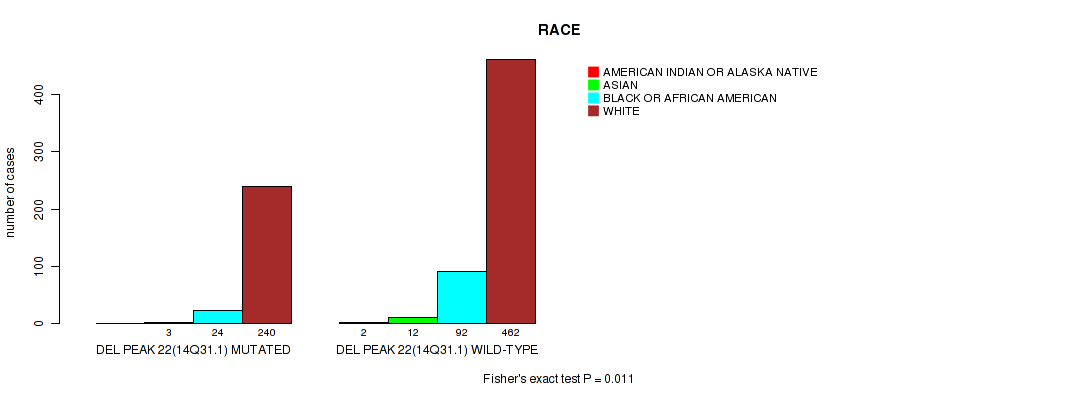
P value = 9.39e-06 (logrank test), Q value = 7.6e-05
Table S230. Gene #36: 'del_16q23.3' versus Clinical Feature #1: 'Time to Death'
| nPatients | nDeath | Duration Range (Median), Month | |
|---|---|---|---|
| ALL | 843 | 211 | 0.1 - 194.8 (30.5) |
| DEL PEAK 23(16Q23.3) MUTATED | 35 | 18 | 0.1 - 90.5 (27.6) |
| DEL PEAK 23(16Q23.3) WILD-TYPE | 808 | 193 | 0.1 - 194.8 (30.6) |
Figure S230. Get High-res Image Gene #36: 'del_16q23.3' versus Clinical Feature #1: 'Time to Death'
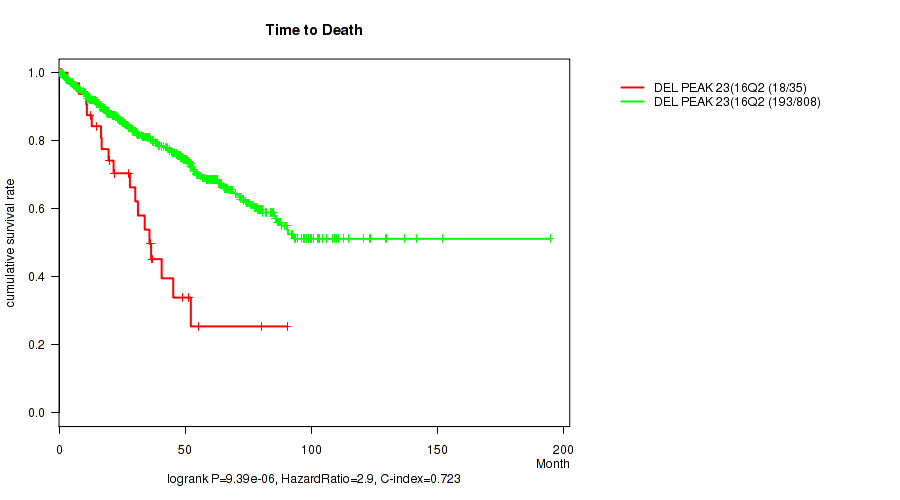
P value = 0.00647 (Fisher's exact test), Q value = 0.022
Table S231. Gene #36: 'del_16q23.3' versus Clinical Feature #3: 'NEOPLASM_DISEASESTAGE'
| nPatients | STAGE I | STAGE II | STAGE III | STAGE IV |
|---|---|---|---|---|
| ALL | 448 | 103 | 190 | 100 |
| DEL PEAK 23(16Q23.3) MUTATED | 11 | 4 | 11 | 10 |
| DEL PEAK 23(16Q23.3) WILD-TYPE | 437 | 99 | 179 | 90 |
Figure S231. Get High-res Image Gene #36: 'del_16q23.3' versus Clinical Feature #3: 'NEOPLASM_DISEASESTAGE'

P value = 0.00014 (Fisher's exact test), Q value = 0.00081
Table S232. Gene #36: 'del_16q23.3' versus Clinical Feature #4: 'PATHOLOGY_T_STAGE'
| nPatients | T1 | T2 | T3 | T4 |
|---|---|---|---|---|
| ALL | 462 | 123 | 251 | 15 |
| DEL PEAK 23(16Q23.3) MUTATED | 12 | 4 | 15 | 5 |
| DEL PEAK 23(16Q23.3) WILD-TYPE | 450 | 119 | 236 | 10 |
Figure S232. Get High-res Image Gene #36: 'del_16q23.3' versus Clinical Feature #4: 'PATHOLOGY_T_STAGE'

P value = 0.00046 (Fisher's exact test), Q value = 0.0023
Table S233. Gene #36: 'del_16q23.3' versus Clinical Feature #5: 'PATHOLOGY_N_STAGE'
| nPatients | N0 | N1 | N2 |
|---|---|---|---|
| ALL | 317 | 43 | 6 |
| DEL PEAK 23(16Q23.3) MUTATED | 12 | 7 | 2 |
| DEL PEAK 23(16Q23.3) WILD-TYPE | 305 | 36 | 4 |
Figure S233. Get High-res Image Gene #36: 'del_16q23.3' versus Clinical Feature #5: 'PATHOLOGY_N_STAGE'

P value = 6.48e-07 (logrank test), Q value = 5.5e-05
Table S234. Gene #37: 'del_18q22.2' versus Clinical Feature #1: 'Time to Death'
| nPatients | nDeath | Duration Range (Median), Month | |
|---|---|---|---|
| ALL | 843 | 211 | 0.1 - 194.8 (30.5) |
| DEL PEAK 24(18Q22.2) MUTATED | 149 | 59 | 0.1 - 123.6 (25.6) |
| DEL PEAK 24(18Q22.2) WILD-TYPE | 694 | 152 | 0.1 - 194.8 (31.3) |
Figure S234. Get High-res Image Gene #37: 'del_18q22.2' versus Clinical Feature #1: 'Time to Death'
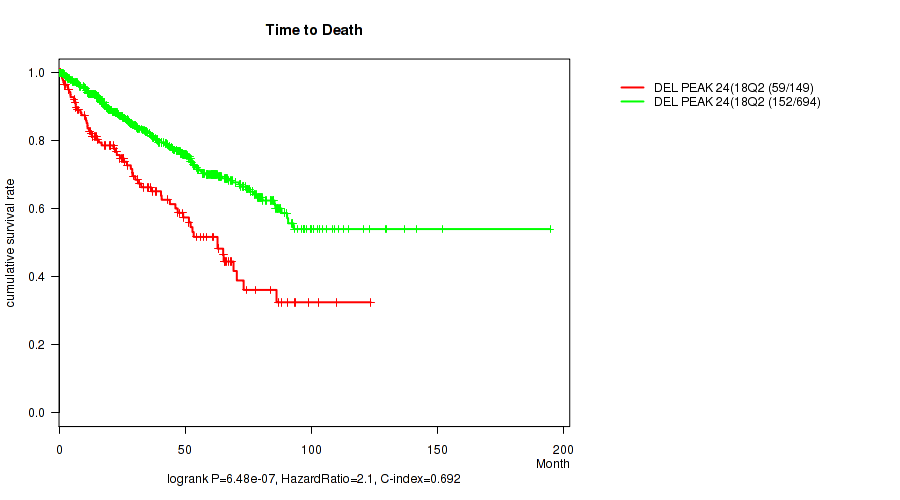
P value = 1e-05 (Fisher's exact test), Q value = 7.6e-05
Table S235. Gene #37: 'del_18q22.2' versus Clinical Feature #3: 'NEOPLASM_DISEASESTAGE'
| nPatients | STAGE I | STAGE II | STAGE III | STAGE IV |
|---|---|---|---|---|
| ALL | 448 | 103 | 190 | 100 |
| DEL PEAK 24(18Q22.2) MUTATED | 51 | 12 | 55 | 31 |
| DEL PEAK 24(18Q22.2) WILD-TYPE | 397 | 91 | 135 | 69 |
Figure S235. Get High-res Image Gene #37: 'del_18q22.2' versus Clinical Feature #3: 'NEOPLASM_DISEASESTAGE'
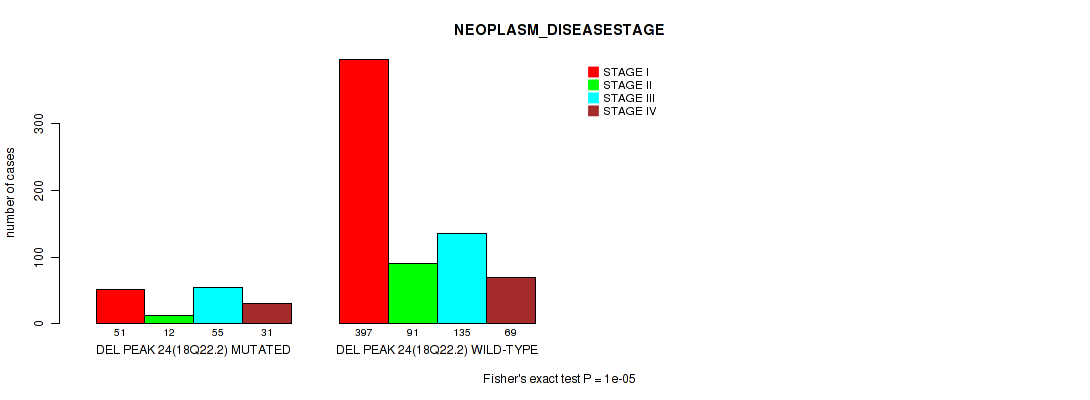
P value = 1e-05 (Fisher's exact test), Q value = 7.6e-05
Table S236. Gene #37: 'del_18q22.2' versus Clinical Feature #4: 'PATHOLOGY_T_STAGE'
| nPatients | T1 | T2 | T3 | T4 |
|---|---|---|---|---|
| ALL | 462 | 123 | 251 | 15 |
| DEL PEAK 24(18Q22.2) MUTATED | 54 | 17 | 73 | 7 |
| DEL PEAK 24(18Q22.2) WILD-TYPE | 408 | 106 | 178 | 8 |
Figure S236. Get High-res Image Gene #37: 'del_18q22.2' versus Clinical Feature #4: 'PATHOLOGY_T_STAGE'
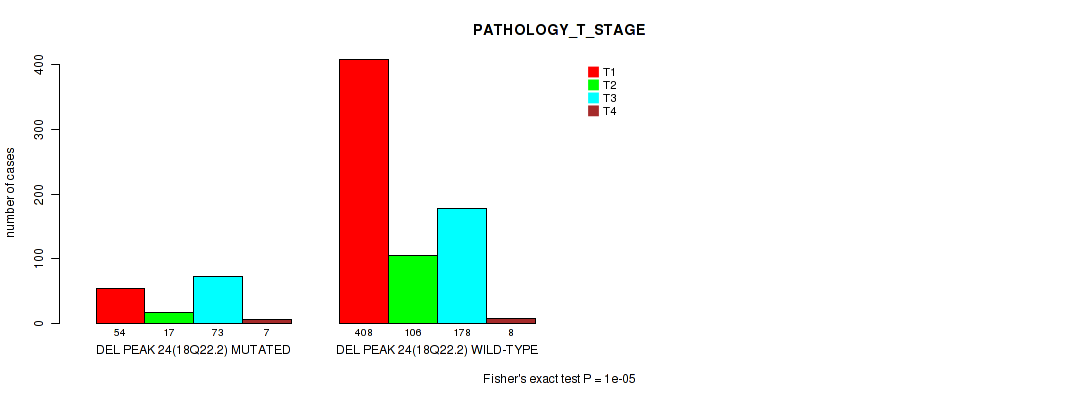
P value = 0.0213 (Fisher's exact test), Q value = 0.06
Table S237. Gene #37: 'del_18q22.2' versus Clinical Feature #5: 'PATHOLOGY_N_STAGE'
| nPatients | N0 | N1 | N2 |
|---|---|---|---|
| ALL | 317 | 43 | 6 |
| DEL PEAK 24(18Q22.2) MUTATED | 64 | 15 | 3 |
| DEL PEAK 24(18Q22.2) WILD-TYPE | 253 | 28 | 3 |
Figure S237. Get High-res Image Gene #37: 'del_18q22.2' versus Clinical Feature #5: 'PATHOLOGY_N_STAGE'
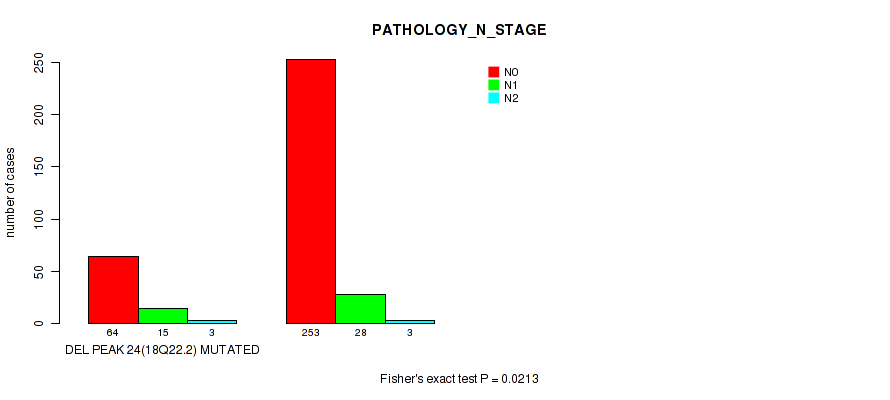
P value = 0.00917 (Fisher's exact test), Q value = 0.029
Table S238. Gene #37: 'del_18q22.2' versus Clinical Feature #6: 'PATHOLOGY_M_STAGE'
| nPatients | 0 | 1 |
|---|---|---|
| ALL | 542 | 89 |
| DEL PEAK 24(18Q22.2) MUTATED | 97 | 27 |
| DEL PEAK 24(18Q22.2) WILD-TYPE | 445 | 62 |
Figure S238. Get High-res Image Gene #37: 'del_18q22.2' versus Clinical Feature #6: 'PATHOLOGY_M_STAGE'
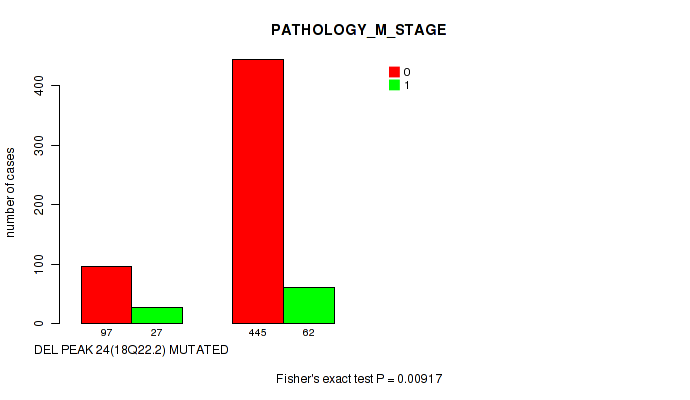
P value = 0.117 (Wilcoxon-test), Q value = 0.24
Table S239. Gene #37: 'del_18q22.2' versus Clinical Feature #11: 'YEAR_OF_TOBACCO_SMOKING_ONSET'
| nPatients | Mean (Std.Dev) | |
|---|---|---|
| ALL | 67 | 1973.4 (16.4) |
| DEL PEAK 24(18Q22.2) MUTATED | 8 | 1981.1 (13.2) |
| DEL PEAK 24(18Q22.2) WILD-TYPE | 59 | 1972.4 (16.6) |
Figure S239. Get High-res Image Gene #37: 'del_18q22.2' versus Clinical Feature #11: 'YEAR_OF_TOBACCO_SMOKING_ONSET'
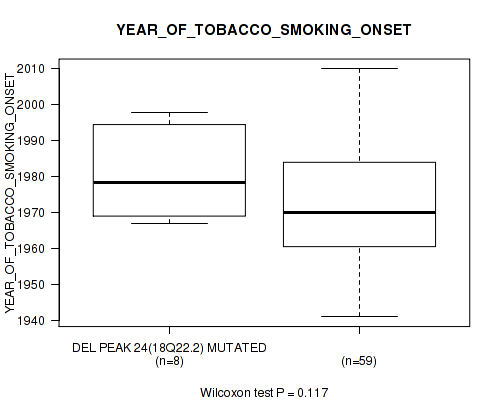
P value = 0.0746 (Fisher's exact test), Q value = 0.17
Table S240. Gene #37: 'del_18q22.2' versus Clinical Feature #12: 'RACE'
| nPatients | AMERICAN INDIAN OR ALASKA NATIVE | ASIAN | BLACK OR AFRICAN AMERICAN | WHITE |
|---|---|---|---|---|
| ALL | 2 | 15 | 116 | 702 |
| DEL PEAK 24(18Q22.2) MUTATED | 0 | 6 | 15 | 128 |
| DEL PEAK 24(18Q22.2) WILD-TYPE | 2 | 9 | 101 | 574 |
Figure S240. Get High-res Image Gene #37: 'del_18q22.2' versus Clinical Feature #12: 'RACE'

P value = 0.0894 (Fisher's exact test), Q value = 0.19
Table S241. Gene #37: 'del_18q22.2' versus Clinical Feature #13: 'ETHNICITY'
| nPatients | HISPANIC OR LATINO | NOT HISPANIC OR LATINO |
|---|---|---|
| ALL | 42 | 597 |
| DEL PEAK 24(18Q22.2) MUTATED | 3 | 106 |
| DEL PEAK 24(18Q22.2) WILD-TYPE | 39 | 491 |
Figure S241. Get High-res Image Gene #37: 'del_18q22.2' versus Clinical Feature #13: 'ETHNICITY'
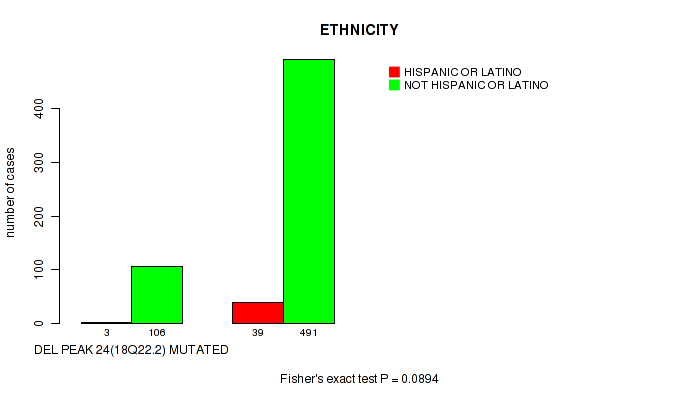
P value = 8.5e-12 (logrank test), Q value = 2.2e-09
Table S242. Gene #38: 'del_19p13.3' versus Clinical Feature #1: 'Time to Death'
| nPatients | nDeath | Duration Range (Median), Month | |
|---|---|---|---|
| ALL | 843 | 211 | 0.1 - 194.8 (30.5) |
| DEL PEAK 25(19P13.3) MUTATED | 40 | 21 | 0.1 - 109.9 (17.5) |
| DEL PEAK 25(19P13.3) WILD-TYPE | 803 | 190 | 0.1 - 194.8 (31.3) |
Figure S242. Get High-res Image Gene #38: 'del_19p13.3' versus Clinical Feature #1: 'Time to Death'
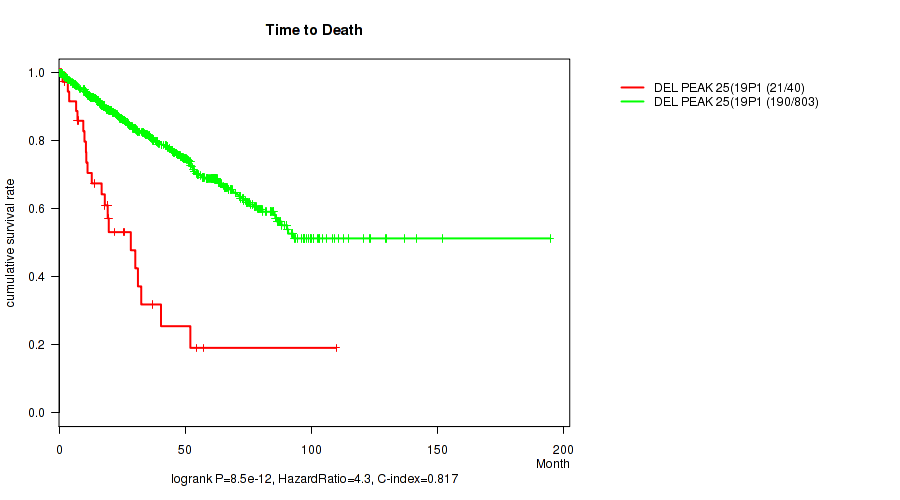
P value = 6e-05 (Fisher's exact test), Q value = 0.00038
Table S243. Gene #38: 'del_19p13.3' versus Clinical Feature #3: 'NEOPLASM_DISEASESTAGE'
| nPatients | STAGE I | STAGE II | STAGE III | STAGE IV |
|---|---|---|---|---|
| ALL | 448 | 103 | 190 | 100 |
| DEL PEAK 25(19P13.3) MUTATED | 10 | 1 | 17 | 11 |
| DEL PEAK 25(19P13.3) WILD-TYPE | 438 | 102 | 173 | 89 |
Figure S243. Get High-res Image Gene #38: 'del_19p13.3' versus Clinical Feature #3: 'NEOPLASM_DISEASESTAGE'

P value = 1e-05 (Fisher's exact test), Q value = 7.6e-05
Table S244. Gene #38: 'del_19p13.3' versus Clinical Feature #4: 'PATHOLOGY_T_STAGE'
| nPatients | T1 | T2 | T3 | T4 |
|---|---|---|---|---|
| ALL | 462 | 123 | 251 | 15 |
| DEL PEAK 25(19P13.3) MUTATED | 11 | 2 | 23 | 4 |
| DEL PEAK 25(19P13.3) WILD-TYPE | 451 | 121 | 228 | 11 |
Figure S244. Get High-res Image Gene #38: 'del_19p13.3' versus Clinical Feature #4: 'PATHOLOGY_T_STAGE'
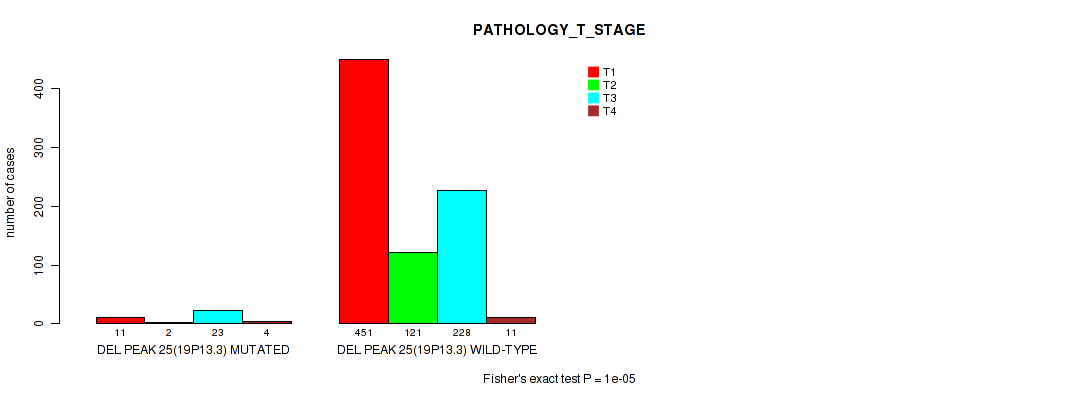
P value = 0.00022 (Fisher's exact test), Q value = 0.0012
Table S245. Gene #38: 'del_19p13.3' versus Clinical Feature #5: 'PATHOLOGY_N_STAGE'
| nPatients | N0 | N1 | N2 |
|---|---|---|---|
| ALL | 317 | 43 | 6 |
| DEL PEAK 25(19P13.3) MUTATED | 10 | 7 | 2 |
| DEL PEAK 25(19P13.3) WILD-TYPE | 307 | 36 | 4 |
Figure S245. Get High-res Image Gene #38: 'del_19p13.3' versus Clinical Feature #5: 'PATHOLOGY_N_STAGE'
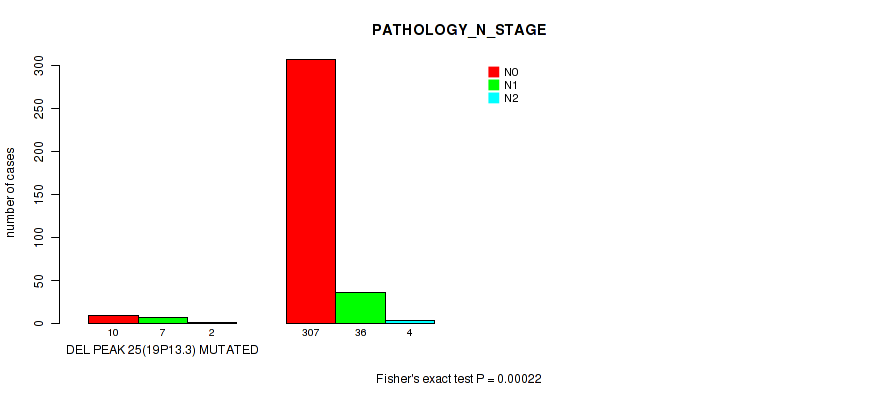
P value = 0.064 (Fisher's exact test), Q value = 0.15
Table S246. Gene #38: 'del_19p13.3' versus Clinical Feature #6: 'PATHOLOGY_M_STAGE'
| nPatients | 0 | 1 |
|---|---|---|
| ALL | 542 | 89 |
| DEL PEAK 25(19P13.3) MUTATED | 17 | 7 |
| DEL PEAK 25(19P13.3) WILD-TYPE | 525 | 82 |
Figure S246. Get High-res Image Gene #38: 'del_19p13.3' versus Clinical Feature #6: 'PATHOLOGY_M_STAGE'
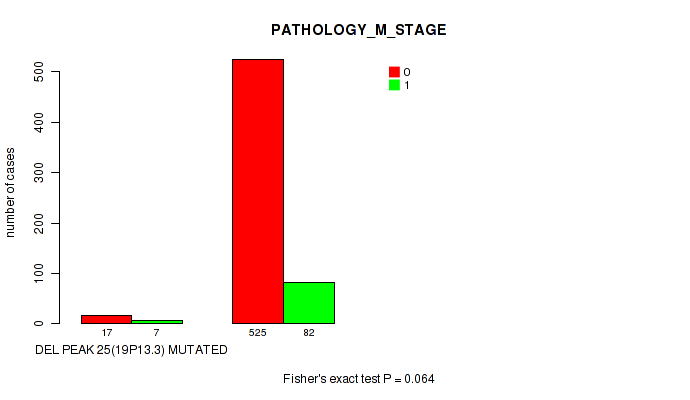
P value = 0.0779 (Wilcoxon-test), Q value = 0.17
Table S247. Gene #38: 'del_19p13.3' versus Clinical Feature #8: 'KARNOFSKY_PERFORMANCE_SCORE'
| nPatients | Mean (Std.Dev) | |
|---|---|---|
| ALL | 115 | 90.3 (17.6) |
| DEL PEAK 25(19P13.3) MUTATED | 9 | 80.0 (30.8) |
| DEL PEAK 25(19P13.3) WILD-TYPE | 106 | 91.1 (15.9) |
Figure S247. Get High-res Image Gene #38: 'del_19p13.3' versus Clinical Feature #8: 'KARNOFSKY_PERFORMANCE_SCORE'
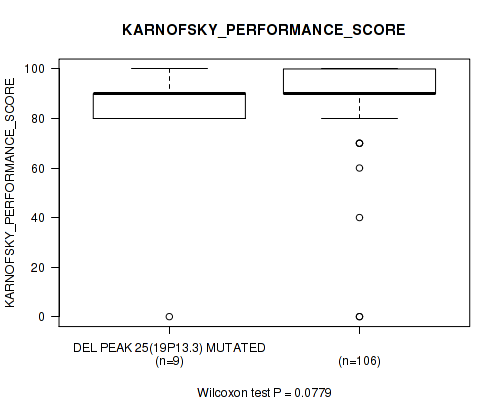
P value = 0.0287 (Fisher's exact test), Q value = 0.076
Table S248. Gene #38: 'del_19p13.3' versus Clinical Feature #9: 'HISTOLOGICAL_TYPE'
| nPatients | KIDNEY CHROMOPHOBE | KIDNEY CLEAR CELL RENAL CARCINOMA | KIDNEY PAPILLARY RENAL CELL CARCINOMA |
|---|---|---|---|
| ALL | 66 | 524 | 269 |
| DEL PEAK 25(19P13.3) MUTATED | 3 | 17 | 20 |
| DEL PEAK 25(19P13.3) WILD-TYPE | 63 | 507 | 249 |
Figure S248. Get High-res Image Gene #38: 'del_19p13.3' versus Clinical Feature #9: 'HISTOLOGICAL_TYPE'
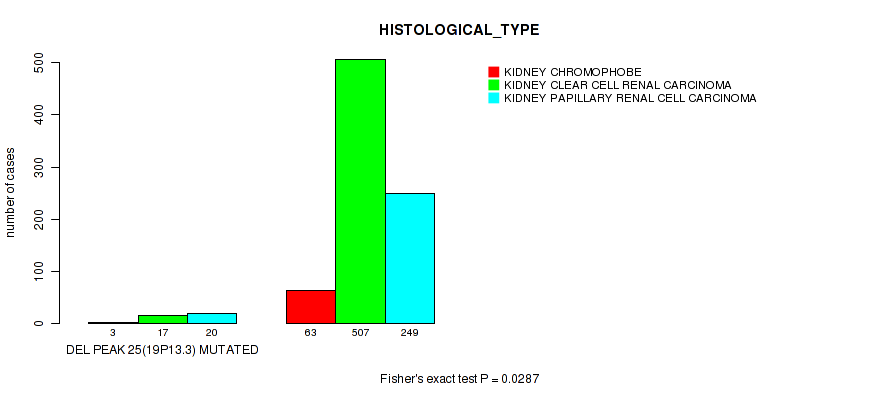
P value = 0.00136 (Wilcoxon-test), Q value = 0.006
Table S249. Gene #39: 'del_xp22.2' versus Clinical Feature #2: 'YEARS_TO_BIRTH'
| nPatients | Mean (Std.Dev) | |
|---|---|---|
| ALL | 853 | 60.1 (12.6) |
| DEL PEAK 26(XP22.2) MUTATED | 123 | 56.2 (13.9) |
| DEL PEAK 26(XP22.2) WILD-TYPE | 730 | 60.8 (12.2) |
Figure S249. Get High-res Image Gene #39: 'del_xp22.2' versus Clinical Feature #2: 'YEARS_TO_BIRTH'
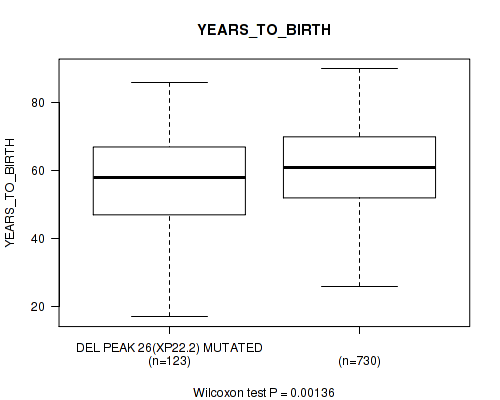
P value = 1e-04 (Fisher's exact test), Q value = 0.00061
Table S250. Gene #39: 'del_xp22.2' versus Clinical Feature #3: 'NEOPLASM_DISEASESTAGE'
| nPatients | STAGE I | STAGE II | STAGE III | STAGE IV |
|---|---|---|---|---|
| ALL | 448 | 103 | 190 | 100 |
| DEL PEAK 26(XP22.2) MUTATED | 43 | 24 | 39 | 14 |
| DEL PEAK 26(XP22.2) WILD-TYPE | 405 | 79 | 151 | 86 |
Figure S250. Get High-res Image Gene #39: 'del_xp22.2' versus Clinical Feature #3: 'NEOPLASM_DISEASESTAGE'
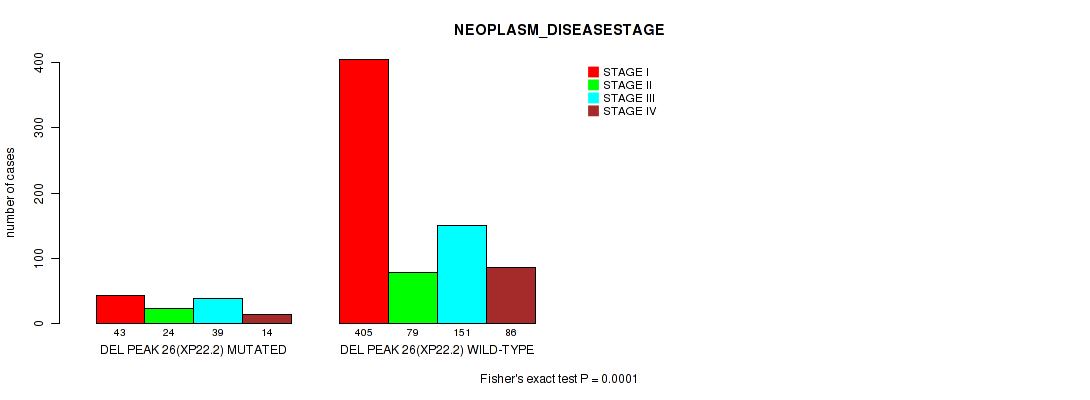
P value = 0.00025 (Fisher's exact test), Q value = 0.0013
Table S251. Gene #39: 'del_xp22.2' versus Clinical Feature #4: 'PATHOLOGY_T_STAGE'
| nPatients | T1 | T2 | T3 | T4 |
|---|---|---|---|---|
| ALL | 462 | 123 | 251 | 15 |
| DEL PEAK 26(XP22.2) MUTATED | 44 | 26 | 49 | 3 |
| DEL PEAK 26(XP22.2) WILD-TYPE | 418 | 97 | 202 | 12 |
Figure S251. Get High-res Image Gene #39: 'del_xp22.2' versus Clinical Feature #4: 'PATHOLOGY_T_STAGE'

P value = 0.0948 (Fisher's exact test), Q value = 0.2
Table S252. Gene #39: 'del_xp22.2' versus Clinical Feature #5: 'PATHOLOGY_N_STAGE'
| nPatients | N0 | N1 | N2 |
|---|---|---|---|
| ALL | 317 | 43 | 6 |
| DEL PEAK 26(XP22.2) MUTATED | 48 | 11 | 2 |
| DEL PEAK 26(XP22.2) WILD-TYPE | 269 | 32 | 4 |
Figure S252. Get High-res Image Gene #39: 'del_xp22.2' versus Clinical Feature #5: 'PATHOLOGY_N_STAGE'
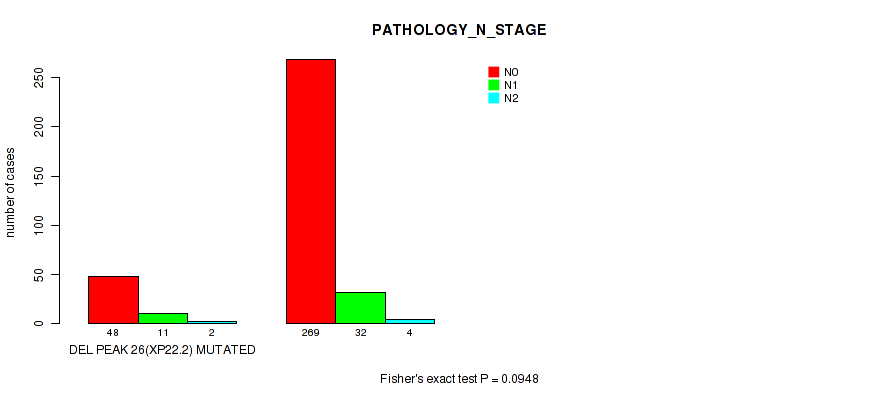
P value = 1e-05 (Fisher's exact test), Q value = 7.6e-05
Table S253. Gene #39: 'del_xp22.2' versus Clinical Feature #9: 'HISTOLOGICAL_TYPE'
| nPatients | KIDNEY CHROMOPHOBE | KIDNEY CLEAR CELL RENAL CARCINOMA | KIDNEY PAPILLARY RENAL CELL CARCINOMA |
|---|---|---|---|
| ALL | 66 | 524 | 269 |
| DEL PEAK 26(XP22.2) MUTATED | 39 | 55 | 29 |
| DEL PEAK 26(XP22.2) WILD-TYPE | 27 | 469 | 240 |
Figure S253. Get High-res Image Gene #39: 'del_xp22.2' versus Clinical Feature #9: 'HISTOLOGICAL_TYPE'
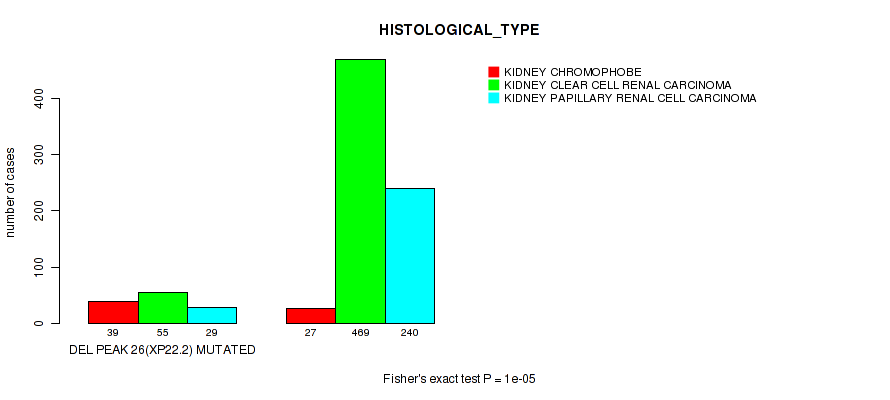
-
Copy number data file = all_lesions.txt from GISTIC pipeline
-
Processed Copy number data file = /xchip/cga/gdac-prod/tcga-gdac/jobResults/GDAC_Correlate_Genomic_Events_Preprocess/KIPAN-TP/15087107/transformed.cor.cli.txt
-
Clinical data file = /xchip/cga/gdac-prod/tcga-gdac/jobResults/Append_Data/KIPAN-TP/15081103/KIPAN-TP.merged_data.txt
-
Number of patients = 859
-
Number of significantly focal cnvs = 39
-
Number of selected clinical features = 13
-
Exclude genes that fewer than K tumors have mutations, K = 3
For survival clinical features, the Kaplan-Meier survival curves of tumors with and without gene mutations were plotted and the statistical significance P values were estimated by logrank test (Bland and Altman 2004) using the 'survdiff' function in R
For binary or multi-class clinical features (nominal or ordinal), two-tailed Fisher's exact tests (Fisher 1922) were used to estimate the P values using the 'fisher.test' function in R
For multiple hypothesis correction, Q value is the False Discovery Rate (FDR) analogue of the P value (Benjamini and Hochberg 1995), defined as the minimum FDR at which the test may be called significant. We used the 'Benjamini and Hochberg' method of 'p.adjust' function in R to convert P values into Q values.
In addition to the links below, the full results of the analysis summarized in this report can also be downloaded programmatically using firehose_get, or interactively from either the Broad GDAC website or TCGA Data Coordination Center Portal.