This report serves to describe the mutational landscape and properties of a given individual set, as well as rank genes and genesets according to mutational significance. MutSig v2.0 was used to generate the results found in this report.
-
Working with individual set: OV-TP
-
Number of patients in set: 466
The input for this pipeline is a set of individuals with the following files associated for each:
-
An annotated .maf file describing the mutations called for the respective individual, and their properties.
-
A .wig file that contains information about the coverage of the sample.
-
MAF used for this analysis:OV-TP.final_analysis_set.maf
-
Blacklist used for this analysis: pancan_mutation_blacklist.v14.hg19.txt
-
Significantly mutated genes (q ≤ 0.1): 9
-
Mutations seen in COSMIC: 525
-
Significantly mutated genes in COSMIC territory: 40
-
Significantly mutated genesets: 32
-
Significantly mutated genesets: (excluding sig. mutated genes):0
-
Read 148 MAFs of type "Broad"
-
Read 234 MAFs of type "WashU"
-
Read 91 MAFs of type "Baylor-SOLiD"
-
Total number of mutations in input MAFs: 28038
-
After removing 112 mutations outside chr1-24: 27926
-
After removing 933 noncoding mutations: 26993
-
After collapsing adjacent/redundant mutations: 26731
-
Number of mutations before filtering: 26731
-
After removing 55 mutations outside patient set: 26676
-
After removing 1398 mutations outside gene set: 25278
-
After removing 11 mutations outside category set: 25267
-
After removing 6 "impossible" mutations in
-
gene-patient-category bins of zero coverage: 23797
Table 1. Get Full Table Table representing breakdown of mutations by type.
| type | count |
|---|---|
| Frame_Shift_Del | 576 |
| Frame_Shift_Ins | 172 |
| In_Frame_Del | 201 |
| In_Frame_Ins | 44 |
| Missense_Mutation | 17116 |
| Nonsense_Mutation | 1063 |
| Nonstop_Mutation | 20 |
| Silent | 5503 |
| Splice_Site | 566 |
| Splice_Site_SNP | 5 |
| Translation_Start_Site | 1 |
| Total | 25267 |
Table 2. Get Full Table A breakdown of mutation rates per category discovered for this individual set.
| category | n | N | rate | rate_per_mb | relative_rate | exp_ns_s_ratio |
|---|---|---|---|---|---|---|
| *CpG->T | 2611 | 599277488 | 4.4e-06 | 4.4 | 2.7 | 2.2 |
| *Cp(A/C/T)->T | 2787 | 5454735038 | 5.1e-07 | 0.51 | 0.31 | 1.7 |
| C->(G/A) | 6832 | 6054012526 | 1.1e-06 | 1.1 | 0.69 | 5 |
| A->mut | 4880 | 6101008844 | 8e-07 | 0.8 | 0.49 | 3.8 |
| indel+null | 2637 | 12155021370 | 2.2e-07 | 0.22 | 0.13 | NaN |
| double_null | 11 | 12155021370 | 9e-10 | 0.0009 | 0.00056 | NaN |
| Total | 19758 | 12155021370 | 1.6e-06 | 1.6 | 1 | 3.5 |
The x axis represents the samples. The y axis represents the exons, one row per exon, and they are sorted by average coverage across samples. For exons with exactly the same average coverage, they are sorted next by the %GC of the exon. (The secondary sort is especially useful for the zero-coverage exons at the bottom). If the figure is unpopulated, then full coverage is assumed (e.g. MutSig CV doesn't use WIGs and assumes full coverage).
Figure 1.
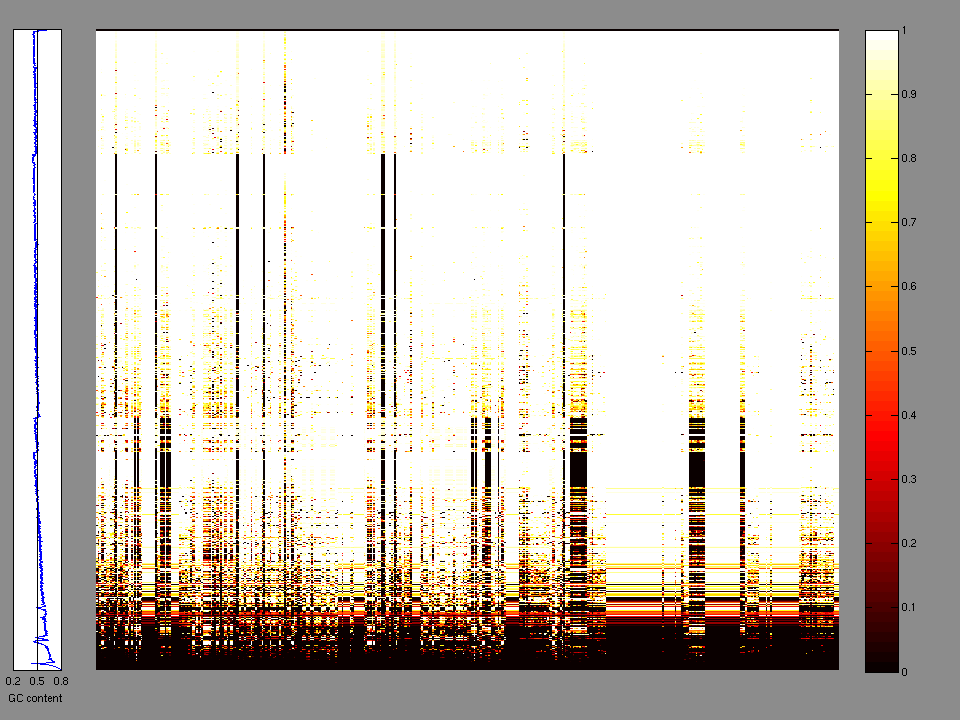
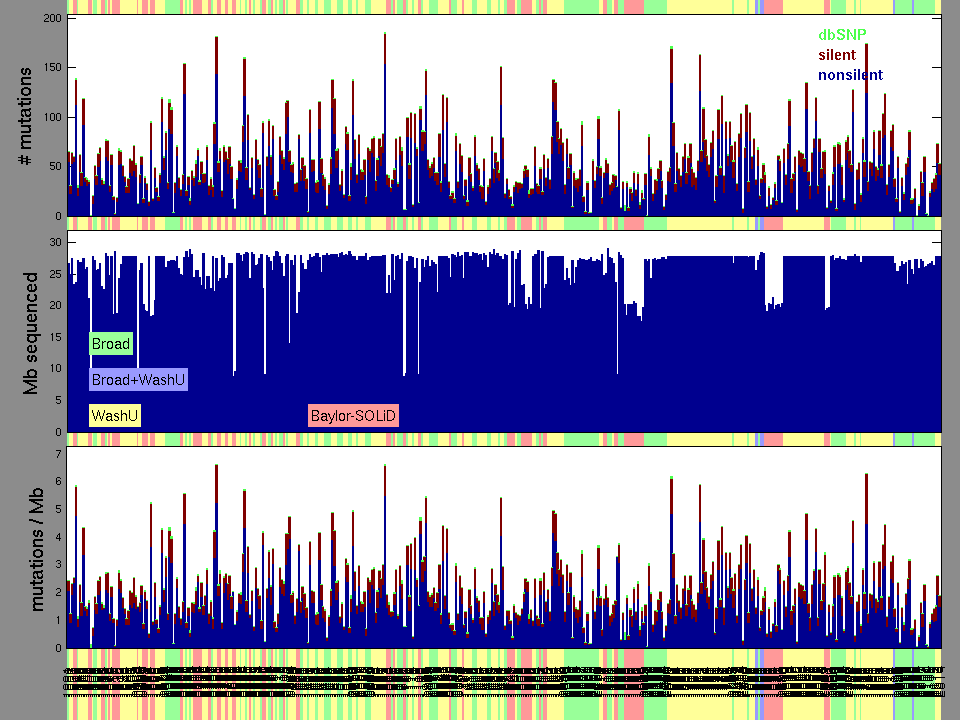
Figure 2. Patients counts and rates file used to generate this plot: OV-TP.patients.counts_and_rates.txt
The mutation spectrum is depicted in the lego plots below in which the 96 possible mutation types are subdivided into six large blocks, color-coded to reflect the base substitution type. Each large block is further subdivided into the 16 possible pairs of 5' and 3' neighbors, as listed in the 4x4 trinucleotide context legend. The height of each block corresponds to the mutation frequency for that kind of mutation (counts of mutations normalized by the base coverage in a given bin). The shape of the spectrum is a signature for dominant mutational mechanisms in different tumor types.
Figure 3. Get High-res Image SNV Mutation rate lego plot for entire set. Each bin is normalized by base coverage for that bin. Colors represent the six SNV types on the upper right. The three-base context for each mutation is labeled in the 4x4 legend on the lower right. The fractional breakdown of SNV counts is shown in the pie chart on the upper left. If this figure is blank, not enough information was provided in the MAF to generate it.
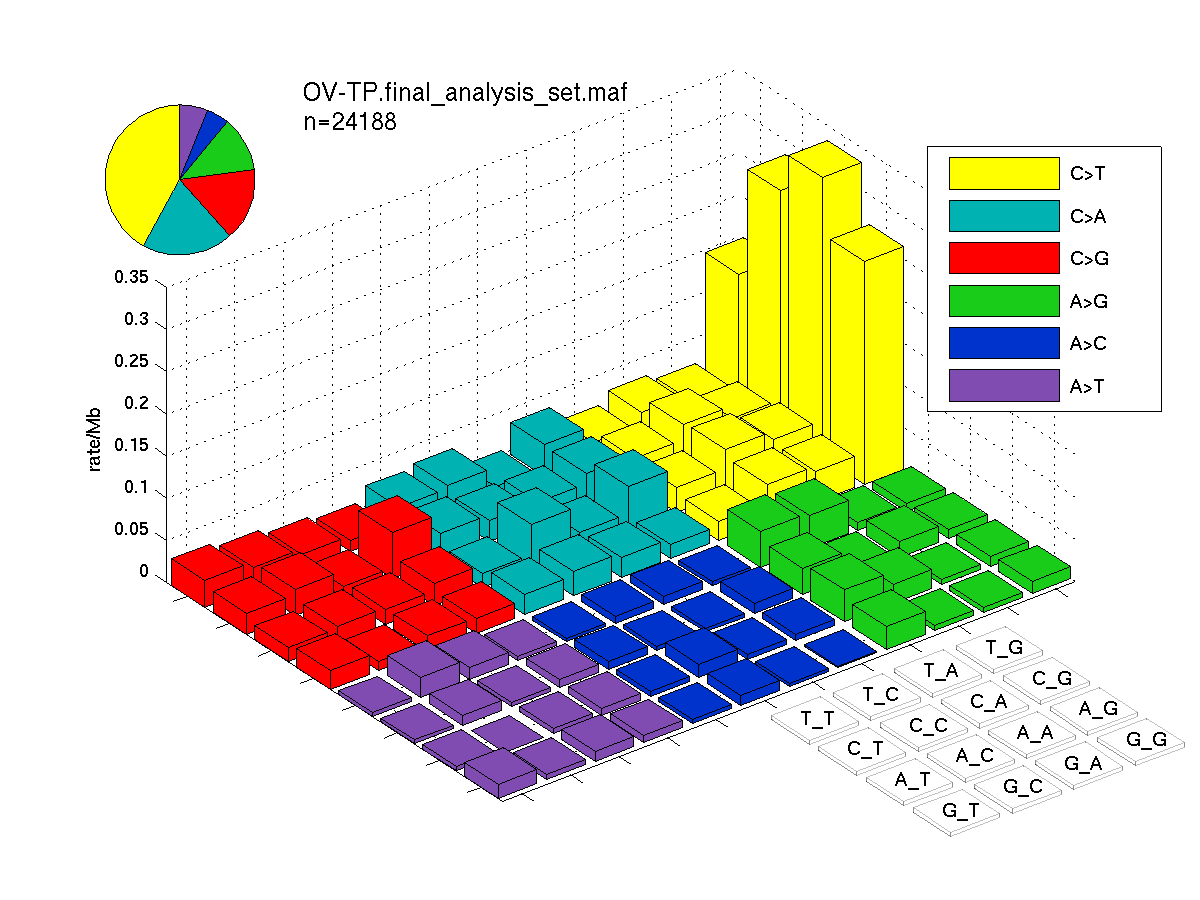
Figure 4. Get High-res Image SNV Mutation rate lego plots for 4 slices of mutation allele fraction (0<=AF<0.1, 0.1<=AF<0.25, 0.25<=AF<0.5, & 0.5<=AF) . The color code and three-base context legends are the same as the previous figure. If this figure is blank, not enough information was provided in the MAF to generate it.

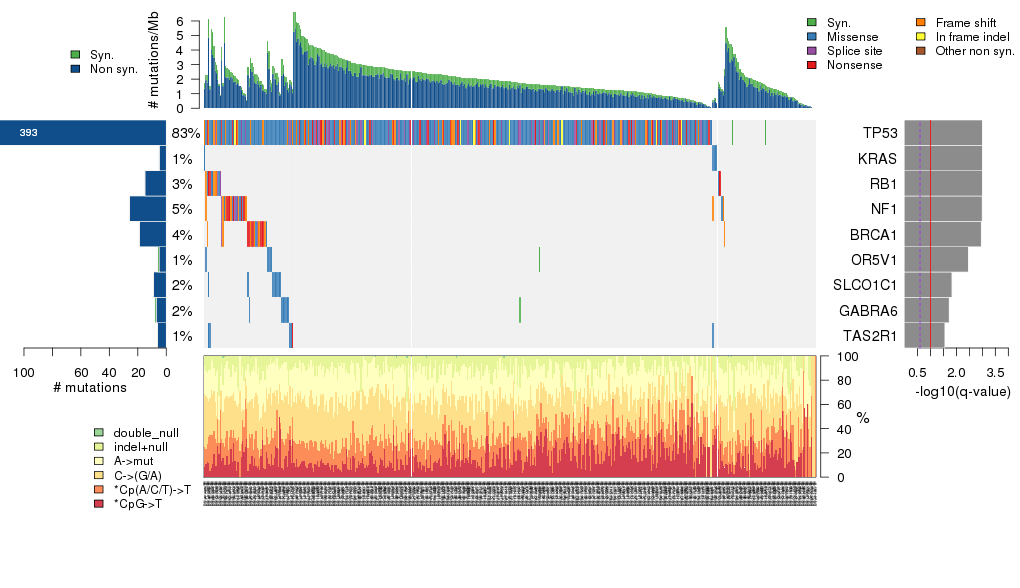
Figure 5. Get High-res Image The matrix in the center of the figure represents individual mutations in patient samples, color-coded by type of mutation, for the significantly mutated genes. The rate of synonymous and non-synonymous mutations is displayed at the top of the matrix. The barplot on the left of the matrix shows the number of mutations in each gene. The percentages represent the fraction of tumors with at least one mutation in the specified gene. The barplot to the right of the matrix displays the q-values for the most significantly mutated genes. The purple boxplots below the matrix (only displayed if required columns are present in the provided MAF) represent the distributions of allelic fractions observed in each sample. The plot at the bottom represents the base substitution distribution of individual samples, using the same categories that were used to calculate significance.
Column Descriptions:
-
N = number of sequenced bases in this gene across the individual set
-
n = number of (nonsilent) mutations in this gene across the individual set
-
npat = number of patients (individuals) with at least one nonsilent mutation
-
nsite = number of unique sites having a non-silent mutation
-
nsil = number of silent mutations in this gene across the individual set
-
n1 = number of nonsilent mutations of type: *CpG->T
-
n2 = number of nonsilent mutations of type: *Cp(A/C/T)->T
-
n3 = number of nonsilent mutations of type: C->(G/A)
-
n4 = number of nonsilent mutations of type: A->mut
-
n5 = number of nonsilent mutations of type: indel+null
-
n6 = number of nonsilent mutations of type: double_null
-
p_classic = p-value for the observed amount of nonsilent mutations being elevated in this gene
-
p_ns_s = p-value for the observed nonsilent/silent ratio being elevated in this gene
-
p_cons = p-value for enrichment of mutations at evolutionarily most-conserved sites in gene
-
p_joint = p-value for clustering + conservation
-
p = p-value (overall)
-
q = q-value, False Discovery Rate (Benjamini-Hochberg procedure)
Table 3. Get Full Table A Ranked List of Significantly Mutated Genes. Number of significant genes found: 9. Number of genes displayed: 35. Click on a gene name to display its stick figure depicting the distribution of mutations and mutation types across the chosen gene (this feature may not be available for all significant genes).
| rank | gene | description | N | n | npat | nsite | nsil | n1 | n2 | n3 | n4 | n5 | n6 | p_classic | p_ns_s | p_clust | p_cons | p_joint | p | q |
|---|---|---|---|---|---|---|---|---|---|---|---|---|---|---|---|---|---|---|---|---|
| 1 | TP53 | tumor protein p53 | 589258 | 391 | 387 | 175 | 2 | 63 | 54 | 55 | 86 | 133 | 0 | <1.00e-15 | <1.00e-15 | 0 | 0 | 0 | <1.00e-15 | <8.63e-12 |
| 2 | KRAS | v-Ki-ras2 Kirsten rat sarcoma viral oncogene homolog | 324777 | 5 | 5 | 2 | 0 | 0 | 0 | 5 | 0 | 0 | 0 | 5.78e-06 | 0.650 | 2e-07 | 0.18 | 0 | <1.00e-15 | <8.63e-12 |
| 3 | RB1 | retinoblastoma 1 (including osteosarcoma) | 1230770 | 15 | 15 | 15 | 0 | 0 | 1 | 4 | 0 | 10 | 0 | 1.39e-10 | 0.134 | 0.086 | 0.34 | 0.14 | 4.87e-10 | 2.80e-06 |
| 4 | NF1 | neurofibromin 1 (neurofibromatosis, von Recklinghausen disease, Watson disease) | 3889455 | 26 | 24 | 26 | 0 | 1 | 0 | 2 | 4 | 19 | 0 | 3.36e-10 | 0.0453 | 0.33 | 0.67 | 0.54 | 4.22e-09 | 1.82e-05 |
| 5 | BRCA1 | breast cancer 1, early onset | 2651883 | 19 | 19 | 19 | 0 | 0 | 0 | 1 | 1 | 17 | 0 | 1.87e-09 | 0.118 | 0.9 | 0.3 | 0.74 | 2.96e-08 | 0.000102 |
| 6 | OR5V1 | olfactory receptor, family 5, subfamily V, member 1 | 439234 | 5 | 5 | 5 | 1 | 1 | 1 | 2 | 1 | 0 | 0 | 0.000174 | 0.481 | 0.022 | 0.0012 | 0.00028 | 8.57e-07 | 0.00247 |
| 7 | SLCO1C1 | solute carrier organic anion transporter family, member 1C1 | 1055932 | 9 | 9 | 9 | 0 | 0 | 2 | 5 | 2 | 0 | 0 | 1.38e-05 | 0.164 | 0.017 | 0.25 | 0.026 | 5.62e-06 | 0.0139 |
| 8 | GABRA6 | gamma-aminobutyric acid (GABA) A receptor, alpha 6 | 636553 | 7 | 7 | 7 | 1 | 1 | 3 | 1 | 2 | 0 | 0 | 1.54e-05 | 0.306 | 0.027 | 0.24 | 0.035 | 8.33e-06 | 0.0180 |
| 9 | TAS2R1 | taste receptor, type 2, member 1 | 400943 | 6 | 6 | 6 | 0 | 0 | 0 | 3 | 2 | 1 | 0 | 1.19e-05 | 0.291 | 0.063 | 0.34 | 0.08 | 1.41e-05 | 0.0270 |
| 10 | PECAM1 | platelet/endothelial cell adhesion molecule (CD31 antigen) | 14209 | 2 | 2 | 2 | 1 | 0 | 1 | 0 | 0 | 1 | 0 | 7.05e-05 | 0.889 | NaN | NaN | NaN | 7.05e-05 | 0.120 |
| 11 | FAM171B | family with sequence similarity 171, member B | 1106888 | 9 | 9 | 9 | 1 | 2 | 1 | 3 | 1 | 2 | 0 | 1.10e-05 | 0.358 | 0.35 | 0.59 | 0.53 | 7.65e-05 | 0.120 |
| 12 | NRAS | neuroblastoma RAS viral (v-ras) oncogene homolog | 272817 | 4 | 4 | 3 | 0 | 0 | 1 | 0 | 2 | 1 | 0 | 0.000103 | 0.320 | 0.056 | 0.9 | 0.073 | 9.60e-05 | 0.133 |
| 13 | ACTRT1 | actin-related protein T1 | 510897 | 6 | 6 | 6 | 0 | 2 | 0 | 3 | 1 | 0 | 0 | 9.99e-05 | 0.207 | 0.042 | 0.8 | 0.08 | 0.000101 | 0.133 |
| 14 | EFEMP1 | EGF-containing fibulin-like extracellular matrix protein 1 | 684901 | 7 | 7 | 7 | 0 | 1 | 0 | 4 | 0 | 2 | 0 | 9.06e-05 | 0.310 | 0.21 | 0.053 | 0.094 | 0.000108 | 0.133 |
| 15 | IL21R | interleukin 21 receptor | 683909 | 8 | 8 | 8 | 0 | 1 | 1 | 1 | 2 | 3 | 0 | 1.13e-05 | 0.120 | 0.85 | 0.68 | 1 | 0.000140 | 0.161 |
| 16 | ANKRD35 | ankyrin repeat domain 35 | 1167148 | 9 | 9 | 9 | 0 | 1 | 3 | 1 | 3 | 1 | 0 | 4.21e-05 | 0.0474 | 0.23 | 0.61 | 0.29 | 0.000152 | 0.164 |
| 17 | C2orf71 | chromosome 2 open reading frame 71 | 1515916 | 3 | 3 | 1 | 1 | 0 | 0 | 0 | 0 | 3 | 0 | 0.269 | 1.000 | 0.000079 | 0.0062 | 0.000085 | 0.000266 | 0.259 |
| 18 | IL1RAPL1 | interleukin 1 receptor accessory protein-like 1 | 968517 | 6 | 6 | 6 | 1 | 1 | 0 | 1 | 3 | 1 | 0 | 0.00210 | 0.510 | 0.0066 | 0.62 | 0.011 | 0.000270 | 0.259 |
| 19 | PCDHB4 | protocadherin beta 4 | 890110 | 6 | 6 | 6 | 1 | 2 | 1 | 0 | 2 | 1 | 0 | 0.00290 | 0.337 | 0.1 | 0.0042 | 0.0089 | 0.000299 | 0.271 |
| 20 | C9orf171 | chromosome 9 open reading frame 171 | 364230 | 5 | 5 | 5 | 0 | 2 | 0 | 2 | 0 | 1 | 0 | 0.000498 | 0.318 | 0.35 | 0.015 | 0.063 | 0.000357 | 0.294 |
| 21 | CYP11B1 | cytochrome P450, family 11, subfamily B, polypeptide 1 | 674440 | 8 | 8 | 8 | 0 | 2 | 0 | 4 | 2 | 0 | 0 | 3.15e-05 | 0.138 | 0.69 | 0.78 | 1 | 0.000358 | 0.294 |
| 22 | SNTG1 | syntrophin, gamma 1 | 730950 | 7 | 7 | 7 | 1 | 0 | 1 | 2 | 1 | 3 | 0 | 7.66e-05 | 0.472 | 0.33 | 0.52 | 0.49 | 0.000422 | 0.317 |
| 23 | AIM2 | absent in melanoma 2 | 487784 | 6 | 6 | 6 | 0 | 0 | 0 | 2 | 4 | 0 | 0 | 0.000116 | 0.280 | 0.43 | 0.26 | 0.33 | 0.000423 | 0.317 |
| 24 | ITGA2B | integrin, alpha 2b (platelet glycoprotein IIb of IIb/IIIa complex, antigen CD41) | 821178 | 7 | 7 | 7 | 0 | 1 | 1 | 3 | 0 | 2 | 0 | 0.000580 | 0.0851 | 0.045 | 0.15 | 0.077 | 0.000494 | 0.335 |
| 25 | PTEN | phosphatase and tensin homolog (mutated in multiple advanced cancers 1) | 531048 | 5 | 5 | 5 | 0 | 0 | 1 | 1 | 0 | 3 | 0 | 0.000907 | 0.495 | 0.028 | 0.48 | 0.051 | 0.000512 | 0.335 |
| 26 | OR2F2 | olfactory receptor, family 2, subfamily F, member 2 | 421398 | 4 | 4 | 4 | 0 | 0 | 1 | 1 | 2 | 0 | 0 | 0.00354 | 0.280 | 0.046 | 0.039 | 0.013 | 0.000512 | 0.335 |
| 27 | EIF2B5 | eukaryotic translation initiation factor 2B, subunit 5 epsilon, 82kDa | 936424 | 7 | 7 | 7 | 1 | 3 | 1 | 1 | 1 | 1 | 0 | 0.000171 | 0.369 | 0.2 | 0.34 | 0.28 | 0.000524 | 0.335 |
| 28 | NLRP4 | NLR family, pyrin domain containing 4 | 1389518 | 9 | 8 | 9 | 0 | 7 | 0 | 2 | 0 | 0 | 0 | 0.000545 | 0.0214 | 0.1 | 0.12 | 0.1 | 0.000603 | 0.353 |
| 29 | C4orf35 | chromosome 4 open reading frame 35 | 538306 | 6 | 6 | 6 | 0 | 0 | 0 | 4 | 2 | 0 | 0 | 0.000120 | 0.321 | 0.65 | 0.18 | 0.46 | 0.000603 | 0.353 |
| 30 | PROKR2 | prokineticin receptor 2 | 519909 | 6 | 6 | 6 | 1 | 3 | 0 | 0 | 3 | 0 | 0 | 7.78e-05 | 0.439 | 0.61 | 0.72 | 0.76 | 0.000639 | 0.353 |
| 31 | CYP7B1 | cytochrome P450, family 7, subfamily B, polypeptide 1 | 632888 | 6 | 6 | 6 | 0 | 0 | 4 | 2 | 0 | 0 | 0 | 6.02e-05 | 0.149 | 0.76 | 0.72 | 1 | 0.000645 | 0.353 |
| 32 | VN1R5 | vomeronasal 1 receptor 5 | 440787 | 4 | 4 | 4 | 0 | 0 | 2 | 1 | 1 | 0 | 0 | 0.000599 | 0.237 | 0.046 | 0.88 | 0.1 | 0.000655 | 0.353 |
| 33 | ARHGEF9 | Cdc42 guanine nucleotide exchange factor (GEF) 9 | 719050 | 5 | 5 | 5 | 0 | 0 | 1 | 2 | 1 | 1 | 0 | 0.00404 | 0.249 | 0.015 | 0.33 | 0.021 | 0.000863 | 0.435 |
| 34 | MAGEA11 | melanoma antigen family A, 11 | 559256 | 5 | 5 | 5 | 1 | 0 | 0 | 4 | 1 | 0 | 0 | 0.000894 | 0.713 | NaN | NaN | NaN | 0.000894 | 0.435 |
| 35 | PPM1F | protein phosphatase 1F (PP2C domain containing) | 346726 | 5 | 5 | 4 | 0 | 0 | 1 | 3 | 1 | 0 | 0 | 0.000221 | 0.241 | 0.24 | 0.37 | 0.39 | 0.000895 | 0.435 |
In this analysis, COSMIC is used as a filter to increase power by restricting the territory of each gene. Cosmic version: v48.
Table 4. Get Full Table Significantly mutated genes (COSMIC territory only). To access the database please go to: COSMIC. Number of significant genes found: 40. Number of genes displayed: 10
| rank | gene | description | n | cos | n_cos | N_cos | cos_ev | p | q |
|---|---|---|---|---|---|---|---|---|---|
| 1 | TP53 | tumor protein p53 | 391 | 824 | 390 | 383984 | 98562 | 0 | 0 |
| 2 | RB1 | retinoblastoma 1 (including osteosarcoma) | 15 | 267 | 12 | 124422 | 30 | 0 | 0 |
| 3 | KRAS | v-Ki-ras2 Kirsten rat sarcoma viral oncogene homolog | 5 | 52 | 5 | 24232 | 72780 | 7.6e-10 | 1.1e-06 |
| 4 | NF1 | neurofibromin 1 (neurofibromatosis, von Recklinghausen disease, Watson disease) | 26 | 285 | 7 | 132810 | 8 | 3.6e-09 | 3.9e-06 |
| 5 | MYO3A | myosin IIIA | 9 | 14 | 3 | 6524 | 3 | 2e-07 | 0.00017 |
| 6 | CDC27 | cell division cycle 27 homolog (S. cerevisiae) | 5 | 3 | 2 | 1398 | 2 | 2.6e-06 | 0.0019 |
| 7 | ERBB2 | v-erb-b2 erythroblastic leukemia viral oncogene homolog 2, neuro/glioblastoma derived oncogene homolog (avian) | 5 | 42 | 3 | 19572 | 5 | 5.2e-06 | 0.0033 |
| 8 | NIPBL | Nipped-B homolog (Drosophila) | 10 | 7 | 2 | 3262 | 2 | 0.000014 | 0.0077 |
| 9 | NRAS | neuroblastoma RAS viral (v-ras) oncogene homolog | 4 | 33 | 2 | 15378 | 2596 | 0.00031 | 0.083 |
| 10 | PTEN | phosphatase and tensin homolog (mutated in multiple advanced cancers 1) | 5 | 767 | 5 | 357422 | 98 | 0.00034 | 0.083 |
Note:
n - number of (nonsilent) mutations in this gene across the individual set.
cos = number of unique mutated sites in this gene in COSMIC
n_cos = overlap between n and cos.
N_cos = number of individuals times cos.
cos_ev = total evidence: number of reports in COSMIC for mutations seen in this gene.
p = p-value for seeing the observed amount of overlap in this gene)
q = q-value, False Discovery Rate (Benjamini-Hochberg procedure)
Table 5. Get Full Table A Ranked List of Significantly Mutated Genesets. (Source: MSigDB GSEA Cannonical Pathway Set).Number of significant genesets found: 32. Number of genesets displayed: 10
| rank | geneset | description | genes | N_genes | mut_tally | N | n | npat | nsite | nsil | n1 | n2 | n3 | n4 | n5 | n6 | p_ns_s | p | q |
|---|---|---|---|---|---|---|---|---|---|---|---|---|---|---|---|---|---|---|---|
| 1 | HSA04110_CELL_CYCLE | Genes involved in cell cycle | ABL1, ANAPC1, ANAPC10, ANAPC11, ANAPC2, ANAPC4, ANAPC5, ANAPC7, ATM, ATR, BUB1, BUB1B, BUB3, CCNA1, CCNA2, CCNB1, CCNB2, CCNB3, CCND1, CCND2, CCND3, CCNE1, CCNE2, CCNH, CDC14A, CDC14B, CDC16, CDC2, CDC20, CDC23, CDC25A, CDC25B, CDC25C, CDC26, CDC27, CDC45L, CDC6, CDC7, CDK2, CDK4, CDK6, CDK7, CDKN1A, CDKN1B, CDKN1C, CDKN2A, CDKN2B, CDKN2C, CDKN2D, CHEK1, CHEK2, CREBBP, CUL1, DBF4, E2F1, E2F2, E2F3, EP300, ESPL1, FZR1, GADD45A, GADD45B, GADD45G, GSK3B, hCG_1982709, HDAC1, HDAC2, LOC440917, LOC728919, MAD1L1, MAD2L1, MAD2L2, MCM2, MCM3, MCM4, MCM5, MCM6, MCM7, MDM2, ORC1L, ORC2L, ORC3L, ORC4L, ORC5L, ORC6L, PCNA, PKMYT1, PLK1, PRKDC, PTTG1, PTTG2, RB1, RBL1, RBL2, RBX1, SFN, SKP1, SKP2, SMAD2, SMAD3, SMAD4, SMC1A, SMC1B, TFDP1, TGFB1, TGFB2, TGFB3, TP53, WEE1, YWHAB, YWHAE, YWHAG, YWHAH, YWHAQ, YWHAZ | 107 | ABL1(1), ANAPC1(1), ANAPC2(1), ANAPC4(1), ANAPC5(1), ATM(8), ATR(3), BUB1(2), BUB1B(1), BUB3(1), CCNA1(2), CCNA2(1), CCNB3(4), CCNH(1), CDC14A(1), CDC16(2), CDC20(4), CDC23(1), CDC25A(1), CDC25B(2), CDC27(5), CDC6(1), CDC7(1), CDKN1A(1), CDKN1B(1), CDKN2C(2), CHEK2(3), CREBBP(11), CUL1(2), DBF4(3), E2F2(2), E2F3(1), EP300(2), ESPL1(3), GADD45B(1), HDAC1(1), MAD1L1(1), MAD2L2(1), MCM2(3), MCM3(1), MCM4(2), MCM5(1), MCM6(1), ORC1L(2), ORC2L(2), PLK1(2), PRKDC(7), RB1(15), RBL1(1), RBL2(3), SKP2(2), SMAD4(1), SMC1A(5), SMC1B(4), TFDP1(3), TGFB2(1), TP53(391), YWHAB(1), YWHAE(2), YWHAG(1) | 87823394 | 532 | 403 | 316 | 32 | 84 | 70 | 99 | 113 | 166 | 0 | <1.00e-15 | <1.00e-15 | <3.08e-14 |
| 2 | CELL_CYCLE_KEGG | ABL1, ASK, ATM, BUB1, BUB1B, BUB3, CCNA1, CCNA2, CCNB1, CCNB2, CCNB3, CCND2, CCND3, CCNE1, CCNE2, CCNH, CDAN1, CDC14A, CDC14B, CDC14B, CDC14C, CDC2, CDC20, CDC25A, CDC25B, CDC25C, CDC45L, CDC6, CDC7, CDH1, CDK2, CDK4, CDKN1A, CDKN2A, CHEK1, CHEK2, DTX4, E2F1, E2F2, E2F3, E2F4, E2F5, E2F6, EP300, ESPL1, FLJ14001, GADD45A, GSK3B, HDAC1, HDAC2, HDAC3, HDAC4, HDAC5, HDAC6, HDAC7A, HDAC8, MAD1L1, MAD2L1, MAD2L2, MCM2, MCM3, MCM4, MCM5, MCM6, MCM7, MDM2, MPEG1, MPL, ORC1L, ORC2L, ORC3L, ORC4L, ORC5L, ORC6L, PCNA, PLK1, PRKDC, PTPRA, PTTG1, PTTG2, PTTG3, RB1, RBL1, SKP2, SMAD4, SMC1L1, TBC1D8, TFDP1, TGFB1, TP53, WEE1 | 82 | ABL1(1), ATM(8), BUB1(2), BUB1B(1), BUB3(1), CCNA1(2), CCNA2(1), CCNB3(4), CCNH(1), CDAN1(3), CDC14A(1), CDC20(4), CDC25A(1), CDC25B(2), CDC6(1), CDC7(1), CDH1(2), CDKN1A(1), CHEK2(3), DTX4(2), E2F2(2), E2F3(1), E2F4(1), E2F5(3), EP300(2), ESPL1(3), HDAC1(1), HDAC3(2), HDAC4(1), HDAC5(1), HDAC6(3), MAD1L1(1), MAD2L2(1), MCM2(3), MCM3(1), MCM4(2), MCM5(1), MCM6(1), MPEG1(1), MPL(1), ORC1L(2), ORC2L(2), PLK1(2), PRKDC(7), RB1(15), RBL1(1), SKP2(2), SMAD4(1), TBC1D8(4), TFDP1(3), TP53(391) | 72494429 | 504 | 399 | 288 | 27 | 82 | 68 | 86 | 109 | 159 | 0 | <1.00e-15 | <1.00e-15 | <3.08e-14 | |
| 3 | HSA04310_WNT_SIGNALING_PATHWAY | Genes involved in Wnt signaling pathway | APC, APC2, AXIN1, AXIN2, BTRC, CACYBP, CAMK2A, CAMK2B, CAMK2D, CAMK2G, CCND1, CCND2, CCND3, CER1, CHD8, CHP, CREBBP, CSNK1A1, CSNK1A1L, CSNK1E, CSNK2A1, CSNK2A2, CSNK2B, CTBP1, CTBP2, CTNNB1, CTNNBIP1, CUL1, CXXC4, DAAM1, DAAM2, DKK1, DKK2, DKK4, DVL1, DVL2, DVL3, EP300, FBXW11, FOSL1, FRAT1, FRAT2, FZD1, FZD10, FZD2, FZD3, FZD4, FZD5, FZD6, FZD7, FZD8, FZD9, GSK3B, JUN, LEF1, LOC652788, LRP5, LRP6, MAP3K7, MAPK10, MAPK8, MAPK9, MMP7, MYC, NFAT5, NFATC1, NFATC2, NFATC3, NFATC4, NKD1, NKD2, NLK, PLCB1, PLCB2, PLCB3, PLCB4, PORCN, PPARD, PPP2CA, PPP2CB, PPP2R1A, PPP2R1B, PPP2R2A, PPP2R2B, PPP2R2C, PPP3CA, PPP3CB, PPP3CC, PPP3R1, PPP3R2, PRICKLE1, PRICKLE2, PRKACA, PRKACB, PRKACG, PRKCA, PRKCB1, PRKCG, PRKX, PRKY, PSEN1, RAC1, RAC2, RAC3, RBX1, RHOA, ROCK1, ROCK2, RUVBL1, SENP2, SFRP1, SFRP2, SFRP4, SFRP5, SIAH1, SKP1, SMAD2, SMAD3, SMAD4, SOX17, TBL1X, TBL1XR1, TBL1Y, TCF7, TCF7L1, TCF7L2, TP53, VANGL1, VANGL2, WIF1, WNT1, WNT10A, WNT10B, WNT11, WNT16, WNT2, WNT2B, WNT3, WNT3A, WNT4, WNT5A, WNT5B, WNT6, WNT7A, WNT7B, WNT8A, WNT8B, WNT9A, WNT9B | 137 | APC(11), AXIN1(1), AXIN2(2), BTRC(1), CAMK2B(1), CAMK2D(2), CHD8(6), CHP(1), CREBBP(11), CSNK1A1L(1), CSNK1E(1), CSNK2A1(2), CTBP2(2), CTNNB1(2), CUL1(2), CXXC4(1), DAAM1(2), DAAM2(2), DKK1(1), DKK2(3), DVL3(1), EP300(2), FBXW11(1), FZD1(1), FZD3(1), FZD4(1), FZD5(2), FZD7(2), LEF1(1), LRP5(1), LRP6(3), MAP3K7(2), MAPK8(1), MAPK9(1), MMP7(1), NFAT5(4), NFATC1(1), NFATC2(3), NFATC4(2), NLK(1), PLCB1(6), PLCB2(3), PLCB3(2), PLCB4(3), PORCN(3), PPARD(3), PPP2CA(2), PPP2R1A(3), PPP2R1B(1), PPP2R2A(2), PPP2R2B(1), PPP3CA(1), PPP3CC(1), PPP3R2(1), PRICKLE1(4), PRICKLE2(4), PRKACA(1), PRKACB(1), PRKACG(1), PRKCA(2), PRKCG(2), RHOA(3), ROCK2(2), SENP2(1), SMAD4(1), TBL1X(1), TBL1XR1(2), TCF7L1(1), TCF7L2(2), TP53(391), VANGL2(1), WIF1(2), WNT11(2), WNT16(3), WNT2(1), WNT2B(3), WNT4(1), WNT6(2), WNT7A(3), WNT8A(1), WNT9A(1), WNT9B(1) | 98049024 | 559 | 399 | 342 | 36 | 89 | 83 | 116 | 115 | 156 | 0 | <1.00e-15 | <1.00e-15 | <3.08e-14 |
| 4 | HSA04115_P53_SIGNALING_PATHWAY | Genes involved in p53 signaling pathway | APAF1, ATM, ATR, BAI1, BAX, BBC3, BID, CASP3, CASP8, CASP9, CCNB1, CCNB2, CCNB3, CCND1, CCND2, CCND3, CCNE1, CCNE2, CCNG1, CCNG2, CD82, CDC2, CDK2, CDK4, CDK6, CDKN1A, CDKN2A, CHEK1, CHEK2, CYCS, DDB2, EI24, FAS, GADD45A, GADD45B, GADD45G, GTSE1, IGF1, IGFBP3, LRDD, MDM2, MDM4, P53AIP1, PERP, PMAIP1, PPM1D, PTEN, RCHY1, RFWD2, RPRM, RRM2, RRM2B, SCOTIN, SERPINB5, SERPINE1, SESN1, SESN2, SESN3, SFN, SIAH1, STEAP3, THBS1, TNFRSF10B, TP53, TP53I3, TP73, TSC2, ZMAT3 | 62 | APAF1(2), ATM(8), ATR(3), BAI1(2), CASP8(2), CASP9(2), CCNB3(4), CCNG2(1), CD82(1), CDKN1A(1), CHEK2(3), DDB2(1), EI24(1), GADD45B(1), GTSE1(1), MDM4(1), PERP(1), PTEN(5), RCHY1(1), RFWD2(1), RRM2B(2), SERPINB5(2), SERPINE1(2), SESN1(1), STEAP3(1), THBS1(3), TP53(391), TSC2(3), ZMAT3(2) | 39434553 | 449 | 396 | 233 | 15 | 73 | 62 | 72 | 101 | 141 | 0 | <1.00e-15 | <1.00e-15 | <3.08e-14 |
| 5 | HSA04210_APOPTOSIS | Genes involved in apoptosis | AIFM1, AKT1, AKT2, AKT3, APAF1, ATM, BAD, BAX, BCL2, BCL2L1, BID, BIRC2, BIRC3, BIRC4, CAPN1, CAPN2, CASP10, CASP3, CASP6, CASP7, CASP8, CASP9, CFLAR, CHP, CHUK, CSF2RB, CYCS, DFFA, DFFB, ENDOG, FADD, FAS, FASLG, IKBKB, IKBKG, IL1A, IL1B, IL1R1, IL1RAP, IL3, IL3RA, IRAK1, IRAK2, IRAK3, IRAK4, MAP3K14, MYD88, NFKB1, NFKB2, NFKBIA, NGFB, NTRK1, PIK3CA, PIK3CB, PIK3CD, PIK3CG, PIK3R1, PIK3R2, PIK3R3, PIK3R5, PPP3CA, PPP3CB, PPP3CC, PPP3R1, PPP3R2, PRKACA, PRKACB, PRKACG, PRKAR1A, PRKAR1B, PRKAR2A, PRKAR2B, RELA, RIPK1, TNF, TNFRSF10A, TNFRSF10B, TNFRSF10C, TNFRSF10D, TNFRSF1A, TNFSF10, TP53, TRADD, TRAF2 | 78 | AIFM1(2), APAF1(2), ATM(8), BIRC3(2), CASP6(2), CASP7(1), CASP8(2), CASP9(2), CHP(1), CHUK(1), CSF2RB(2), DFFB(1), FADD(1), IKBKB(2), IRAK1(3), IRAK2(1), IRAK3(2), IRAK4(2), MAP3K14(1), MYD88(1), NFKB1(2), NFKBIA(2), NTRK1(2), PIK3CA(3), PIK3CB(5), PIK3CD(2), PIK3CG(3), PIK3R1(2), PIK3R2(1), PIK3R5(2), PPP3CA(1), PPP3CC(1), PPP3R2(1), PRKACA(1), PRKACB(1), PRKACG(1), PRKAR1B(1), PRKAR2A(2), PRKAR2B(1), RELA(1), TNF(1), TNFRSF10A(2), TNFRSF1A(2), TNFSF10(1), TP53(391), TRAF2(1) | 52657574 | 472 | 395 | 256 | 28 | 72 | 66 | 84 | 107 | 143 | 0 | <1.00e-15 | <1.00e-15 | <3.08e-14 |
| 6 | ATRBRCAPATHWAY | BRCA1 and 2 block cell cycle progression in response to DNA damage and promote double-stranded break repair; mutations induce breast cancer susceptibility. | ATM, ATR, BRCA1, BRCA2, CHEK1, CHEK2, FANCA, FANCC, FANCD2, FANCE, FANCF, FANCG, HUS1, MRE11A, NBS1, RAD1, RAD17, RAD50, RAD51, RAD9A, TP53, TREX1 | 21 | ATM(8), ATR(3), BRCA1(19), BRCA2(13), CHEK2(3), FANCA(5), FANCC(1), FANCD2(1), FANCE(1), FANCF(2), FANCG(1), HUS1(1), MRE11A(1), RAD17(1), RAD50(1), RAD51(1), TP53(391) | 29545907 | 453 | 393 | 237 | 4 | 67 | 58 | 64 | 98 | 166 | 0 | <1.00e-15 | <1.00e-15 | <3.08e-14 |
| 7 | G1PATHWAY | CDK4/6-cyclin D and CDK2-cyclin E phosphorylate Rb, which allows the transcription of genes needed for the G1/S cell cycle transition. | ABL1, ATM, ATR, CCNA1, CCND1, CCNE1, CDC2, CDC25A, CDK2, CDK4, CDK6, CDKN1A, CDKN1B, CDKN2A, CDKN2B, DHFR, E2F1, GSK3B, HDAC1, MADH3, MADH4, RB1, SKP2, TFDP1, TGFB1, TGFB2, TGFB3, TP53 | 25 | ABL1(1), ATM(8), ATR(3), CCNA1(2), CDC25A(1), CDKN1A(1), CDKN1B(1), HDAC1(1), RB1(15), SKP2(2), TFDP1(3), TGFB2(1), TP53(391) | 19838703 | 430 | 393 | 214 | 6 | 65 | 60 | 66 | 91 | 148 | 0 | <1.00e-15 | <1.00e-15 | <3.08e-14 |
| 8 | ST_FAS_SIGNALING_PATHWAY | The Fas receptor induces apoptosis and NF-kB activation when bound to Fas ligand. | ADPRT, ALG2, BAK1, BAX, BFAR, BIRC4, BTK, CAD, CASP10, CASP3, CASP8, CASP8AP2, CD7, CDK2AP1, CSNK1A1, DAXX, DEDD, DEDD2, DFFA, DIABLO, EGFR, EPHB2, FADD, FAF1, FAIM2, FREQ, HRB, HSPB1, IL1A, IL8, MAP2K4, MAP2K7, MAP3K1, MAP3K5, MAPK1, MAPK10, MAPK8, MAPK8IP1, MAPK8IP2, MAPK8IP3, MAPK9, MCP, MET, NFAT5, NFKB1, NFKB2, NFKBIA, NFKBIB, NFKBIE, NFKBIL1, NFKBIL2, NR0B2, PFN1, PFN2, PTPN13, RALBP1, RIPK1, ROCK1, SMPD1, TNFRSF6, TNFRSF6B, TP53, TPX2, TRAF2, TUFM, VIL2 | 54 | ALG2(3), BFAR(2), BTK(2), CAD(6), CASP8(2), CASP8AP2(1), DAXX(3), EGFR(6), EPHB2(2), FADD(1), IL8(3), MAP2K4(2), MAP3K1(2), MAP3K5(5), MAPK8(1), MAPK8IP1(1), MAPK9(1), MET(4), NFAT5(4), NFKB1(2), NFKBIA(2), NFKBIB(1), NFKBIE(1), NFKBIL2(1), PTPN13(5), TP53(391), TPX2(1), TRAF2(1), TUFM(1) | 44230141 | 457 | 393 | 241 | 17 | 69 | 69 | 75 | 100 | 144 | 0 | <1.00e-15 | <1.00e-15 | <3.08e-14 |
| 9 | P53PATHWAY | p53 induces cell cycle arrest or apoptosis under conditions of DNA damage. | APAF1, ATM, BAX, BCL2, CCND1, CCNE1, CDK2, CDK4, CDKN1A, E2F1, GADD45A, MDM2, PCNA, RB1, TIMP3, TP53 | 16 | APAF1(2), ATM(8), CDKN1A(1), RB1(15), TP53(391) | 11939947 | 417 | 392 | 201 | 2 | 65 | 57 | 61 | 89 | 145 | 0 | <1.00e-15 | <1.00e-15 | <3.08e-14 |
| 10 | RBPATHWAY | The ATM protein kinase recognizes DNA damage and blocks cell cycle progression by phosphorylating chk1 and p53, which normally inhibits Rb to allow G1/S transitions. | ATM, CDC2, CDC25A, CDC25B, CDC25C, CDK2, CDK4, CHEK1, MYT1, RB1, TP53, WEE1, YWHAH | 12 | ATM(8), CDC25A(1), CDC25B(2), MYT1(1), RB1(15), TP53(391) | 11814157 | 418 | 392 | 202 | 4 | 64 | 56 | 64 | 88 | 146 | 0 | <1.00e-15 | <1.00e-15 | <3.08e-14 |
Table 6. Get Full Table A Ranked List of Significantly Mutated Genesets (Excluding Significantly Mutated Genes). Number of significant genesets found: 0. Number of genesets displayed: 10
| rank | geneset | description | genes | N_genes | mut_tally | N | n | npat | nsite | nsil | n1 | n2 | n3 | n4 | n5 | n6 | p_ns_s | p | q |
|---|---|---|---|---|---|---|---|---|---|---|---|---|---|---|---|---|---|---|---|
| 1 | FXRPATHWAY | The nuclear receptor transcription factors FXR and LXR are activated by cholesterol metabolites and regulate cholesterol homeostasis. | FABP6, LDLR, NR0B2, NR1H3, NR1H4, RXRA | 6 | LDLR(5), NR1H3(5), NR1H4(3), RXRA(2) | 3418440 | 15 | 15 | 15 | 0 | 2 | 2 | 4 | 3 | 4 | 0 | 0.013 | 0.00041 | 0.25 |
| 2 | FOLATE_BIOSYNTHESIS | ALPI, ALPL, ALPP, ALPP, ALPPL2, ALPPL2, DHFR, FPGS, GCH1, GGH, SPR | 9 | ALPI(2), ALPL(2), ALPP(2), FPGS(1), GCH1(1), SPR(2) | 3429581 | 10 | 10 | 10 | 1 | 3 | 3 | 2 | 1 | 1 | 0 | 0.091 | 0.032 | 1 | |
| 3 | SETPATHWAY | Cytotoxic T cells release perforin, which to allow entry into target cells of granzyme B, which activates caspases, and granzyme A, which induces caspase-independent apoptosis. | ANP32A, APEX1, CREBBP, DFFA, DFFB, GZMA, GZMB, HMGB2, NME1, PRF1, SET | 11 | APEX1(3), CREBBP(11), DFFB(1), GZMA(2), PRF1(1) | 6668804 | 18 | 18 | 18 | 2 | 2 | 1 | 3 | 4 | 8 | 0 | 0.26 | 0.035 | 1 |
| 4 | FOSBPATHWAY | FOSB gene expression and drug abuse | CDK5, FOSB, GRIA2, JUND, PPP1R1B | 4 | FOSB(2), GRIA2(6) | 2208351 | 8 | 8 | 8 | 1 | 0 | 0 | 1 | 5 | 2 | 0 | 0.58 | 0.036 | 1 |
| 5 | TUBBYPATHWAY | Tubby is activated by phospholipase C activity and hydrolysis of PIP2, after which it enters the nucleus and regulates transcription. | CHRM1, GNAQ, GNB1, GNGT1, HTR2C, PLCB1, TUB | 7 | GNAQ(1), HTR2C(6), PLCB1(6), TUB(1) | 4745469 | 14 | 13 | 14 | 1 | 2 | 4 | 6 | 2 | 0 | 0 | 0.063 | 0.046 | 1 |
| 6 | CARM1PATHWAY | The methyltransferase CARM1 interacts with transcription factors such as CBP/p300 and methylates histones H3 and H4. | CARM1, CREB1, CREBBP, EP300, NCOA3, PRKACB, PRKACG, PRKAR1A, PRKAR1B, PRKAR2A, PRKAR2B, RARA, RXRA | 13 | CARM1(3), CREBBP(11), EP300(2), NCOA3(5), PRKACB(1), PRKACG(1), PRKAR1B(1), PRKAR2A(2), PRKAR2B(1), RARA(1), RXRA(2) | 13212238 | 30 | 29 | 30 | 2 | 2 | 2 | 7 | 8 | 11 | 0 | 0.041 | 0.052 | 1 |
| 7 | FLUMAZENILPATHWAY | Flumazenil is a benzodiazepine receptor antagonist that may induce protective preconditioning in ischemic cardiomyocytes. | GABRA1, GABRA2, GABRA3, GABRA4, GABRA5, GABRA6, GPX1, PRKCE, SOD1 | 8 | GABRA1(4), GABRA2(3), GABRA3(2), GABRA4(4), GABRA5(2), PRKCE(1), SOD1(1) | 4480716 | 17 | 16 | 17 | 3 | 3 | 0 | 4 | 6 | 4 | 0 | 0.28 | 0.057 | 1 |
| 8 | PMLPATHWAY | Ring-shaped PML nuclear bodies regulate transcription and are required co-activators in p53- and DAXX-mediated apoptosis. | CREBBP, DAXX, HRAS, PAX3, PML, PRAM-1, RARA, RB1, SIRT1, SP100, TNF, TNFRSF1A, TNFRSF1B, TNFRSF6, TNFSF6, TP53, UBL1 | 11 | CREBBP(11), DAXX(3), PAX3(5), RARA(1), SP100(7), TNF(1), TNFRSF1A(2) | 10230269 | 30 | 29 | 30 | 4 | 3 | 2 | 10 | 5 | 10 | 0 | 0.12 | 0.058 | 1 |
| 9 | TCYTOTOXICPATHWAY | Cytotoxic T cells release perforin and granzyme to lyse foreign cell targets and express Fas ligand to promote Fas-induced apoptosis. | CD2, CD28, CD3D, CD3E, CD3G, CD3Z, CD8A, ICAM1, ITGAL, ITGB2, PTPRC, THY1, TRA@, TRB@ | 11 | CD2(3), CD3E(2), CD3G(1), CD8A(1), ICAM1(1), ITGAL(6), ITGB2(2), PTPRC(3) | 6899991 | 19 | 18 | 19 | 2 | 3 | 5 | 7 | 2 | 2 | 0 | 0.045 | 0.059 | 1 |
| 10 | TCRMOLECULE | T Cell Receptor and CD3 Complex | CD3D, CD3E, CD3G, CD3Z, TRA@, TRB@ | 3 | CD3E(2), CD3G(1) | 781618 | 3 | 3 | 3 | 1 | 0 | 0 | 2 | 0 | 1 | 0 | 0.79 | 0.061 | 1 |
In brief, we tabulate the number of mutations and the number of covered bases for each gene. The counts are broken down by mutation context category: four context categories that are discovered by MutSig, and one for indel and 'null' mutations, which include indels, nonsense mutations, splice-site mutations, and non-stop (read-through) mutations. For each gene, we calculate the probability of seeing the observed constellation of mutations, i.e. the product P1 x P2 x ... x Pm, or a more extreme one, given the background mutation rates calculated across the dataset. [1]
In addition to the links below, the full results of the analysis summarized in this report can also be downloaded programmatically using firehose_get, or interactively from either the Broad GDAC website or TCGA Data Coordination Center Portal.