This report serves to describe the mutational landscape and properties of a given individual set, as well as rank genes and genesets according to mutational significance. MutSig v2.0 was used to generate the results found in this report.
-
Working with individual set: READ-TP
-
Number of patients in set: 122
The input for this pipeline is a set of individuals with the following files associated for each:
-
An annotated .maf file describing the mutations called for the respective individual, and their properties.
-
A .wig file that contains information about the coverage of the sample.
-
MAF used for this analysis:READ-TP.final_analysis_set.maf
-
Blacklist used for this analysis: pancan_mutation_blacklist.v14.hg19.txt
-
Significantly mutated genes (q ≤ 0.1): 85
-
Mutations seen in COSMIC: 1468
-
Significantly mutated genes in COSMIC territory: 626
-
Significantly mutated genesets: 24
-
Significantly mutated genesets: (excluding sig. mutated genes):0
-
Read 38 MAFs of type "Broad"
-
Read 53 MAFs of type "Baylor-Illumina"
-
Read 35 MAFs of type "Baylor-SOLiD"
-
Total number of mutations in input MAFs: 41349
-
After removing 24 noncoding mutations: 41325
-
After collapsing adjacent/redundant mutations: 33492
-
Number of mutations before filtering: 33492
-
After removing 702 mutations outside gene set: 32790
-
After removing 229 mutations outside category set: 32561
-
After removing 1520 "impossible" mutations in
-
gene-patient-category bins of zero coverage: 30110
Table 1. Get Full Table Table representing breakdown of mutations by type.
| type | count |
|---|---|
| De_novo_Start_InFrame | 4 |
| De_novo_Start_OutOfFrame | 30 |
| Frame_Shift_Del | 607 |
| Frame_Shift_Ins | 311 |
| In_Frame_Del | 247 |
| In_Frame_Ins | 119 |
| Missense_Mutation | 21318 |
| Nonsense_Mutation | 2157 |
| Nonstop_Mutation | 16 |
| Silent | 7617 |
| Splice_Site | 135 |
| Total | 32561 |
Table 2. Get Full Table A breakdown of mutation rates per category discovered for this individual set.
| category | n | N | rate | rate_per_mb | relative_rate | exp_ns_s_ratio |
|---|---|---|---|---|---|---|
| *CpG->T | 6436 | 157111396 | 0.000041 | 41 | 5.5 | 2.2 |
| *Cp(A/C/T)->mut | 7899 | 1417529885 | 5.6e-06 | 5.6 | 0.75 | 3.4 |
| *CpG->(G/A) | 309 | 157111396 | 2e-06 | 2 | 0.26 | 2.8 |
| A->mut | 5393 | 1580983253 | 3.4e-06 | 3.4 | 0.46 | 3.8 |
| indel+null | 3283 | 3155624534 | 1e-06 | 1 | 0.14 | NaN |
| double_null | 183 | 3155624534 | 5.8e-08 | 0.058 | 0.0078 | NaN |
| Total | 23503 | 3155624534 | 7.4e-06 | 7.4 | 1 | 3.5 |
The x axis represents the samples. The y axis represents the exons, one row per exon, and they are sorted by average coverage across samples. For exons with exactly the same average coverage, they are sorted next by the %GC of the exon. (The secondary sort is especially useful for the zero-coverage exons at the bottom). If the figure is unpopulated, then full coverage is assumed (e.g. MutSig CV doesn't use WIGs and assumes full coverage).
Figure 1.
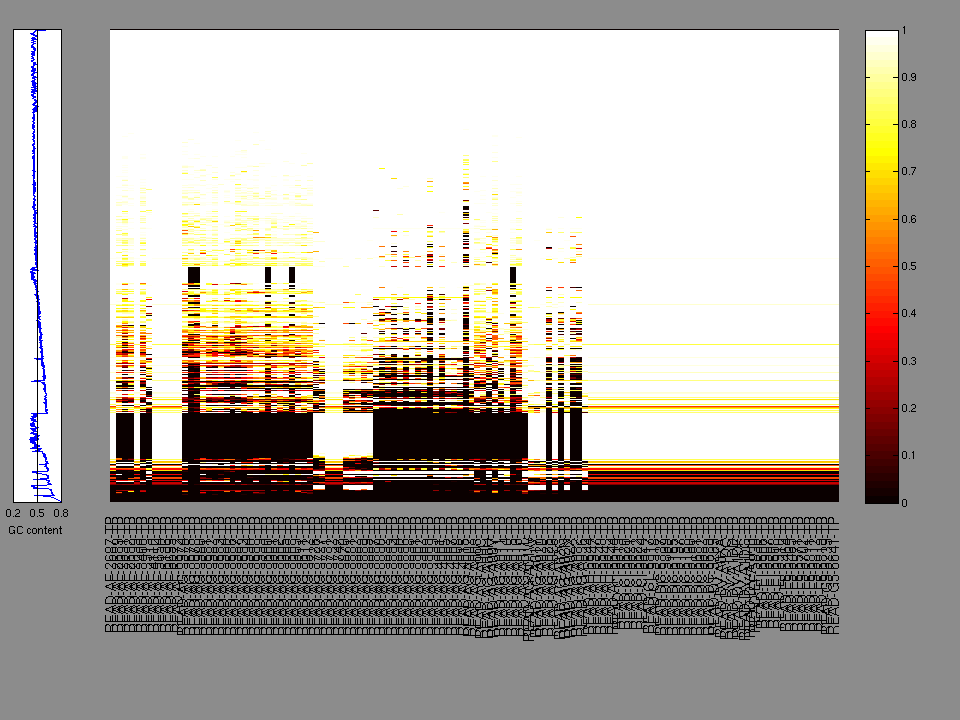
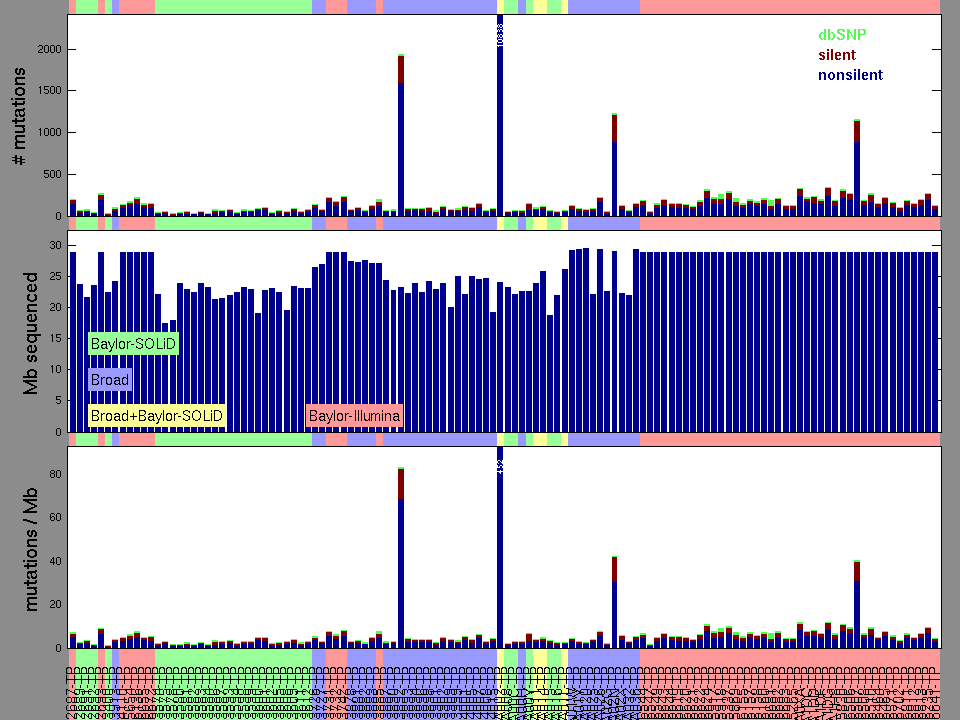
Figure 2. Patients counts and rates file used to generate this plot: READ-TP.patients.counts_and_rates.txt
The mutation spectrum is depicted in the lego plots below in which the 96 possible mutation types are subdivided into six large blocks, color-coded to reflect the base substitution type. Each large block is further subdivided into the 16 possible pairs of 5' and 3' neighbors, as listed in the 4x4 trinucleotide context legend. The height of each block corresponds to the mutation frequency for that kind of mutation (counts of mutations normalized by the base coverage in a given bin). The shape of the spectrum is a signature for dominant mutational mechanisms in different tumor types.
Figure 3. Get High-res Image SNV Mutation rate lego plot for entire set. Each bin is normalized by base coverage for that bin. Colors represent the six SNV types on the upper right. The three-base context for each mutation is labeled in the 4x4 legend on the lower right. The fractional breakdown of SNV counts is shown in the pie chart on the upper left. If this figure is blank, not enough information was provided in the MAF to generate it.
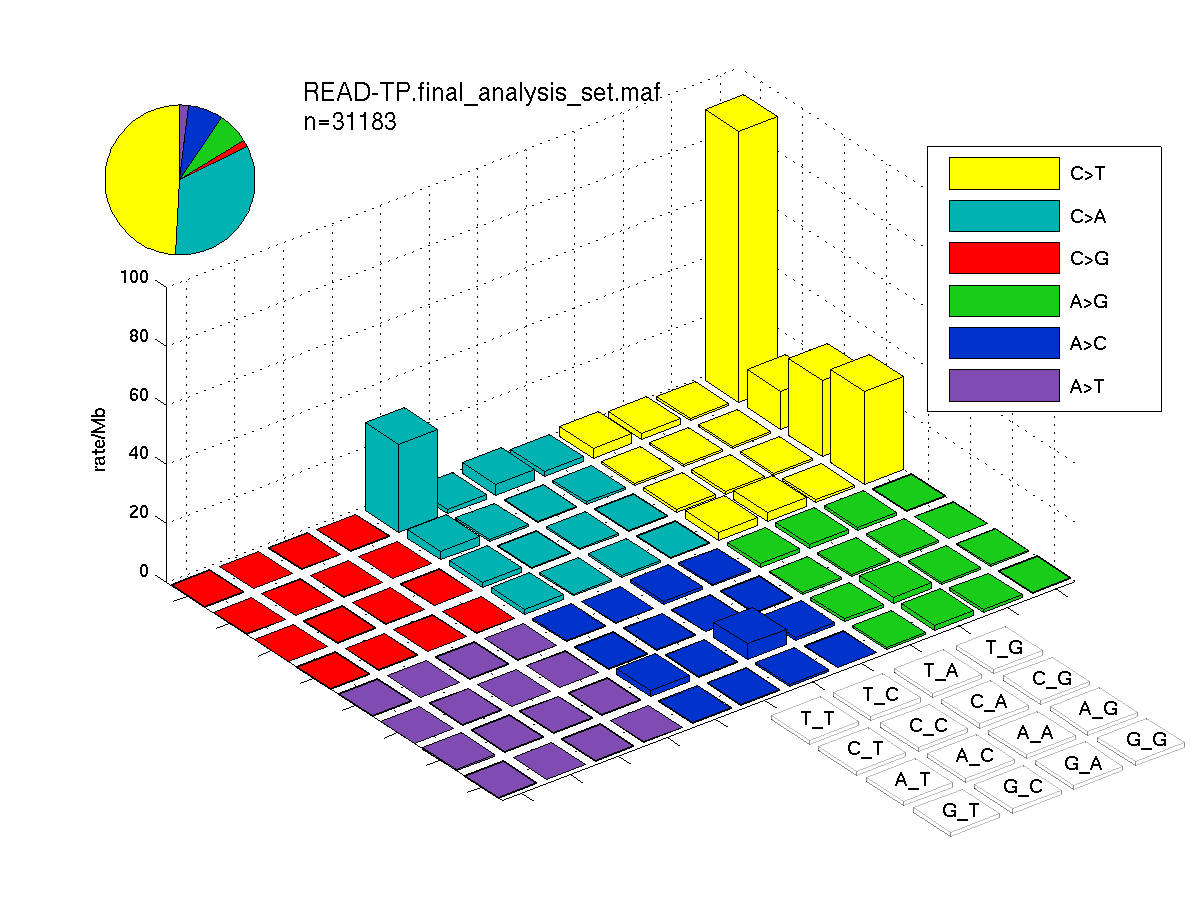
Figure 4. Get High-res Image SNV Mutation rate lego plots for 4 slices of mutation allele fraction (0<=AF<0.1, 0.1<=AF<0.25, 0.25<=AF<0.5, & 0.5<=AF) . The color code and three-base context legends are the same as the previous figure. If this figure is blank, not enough information was provided in the MAF to generate it.

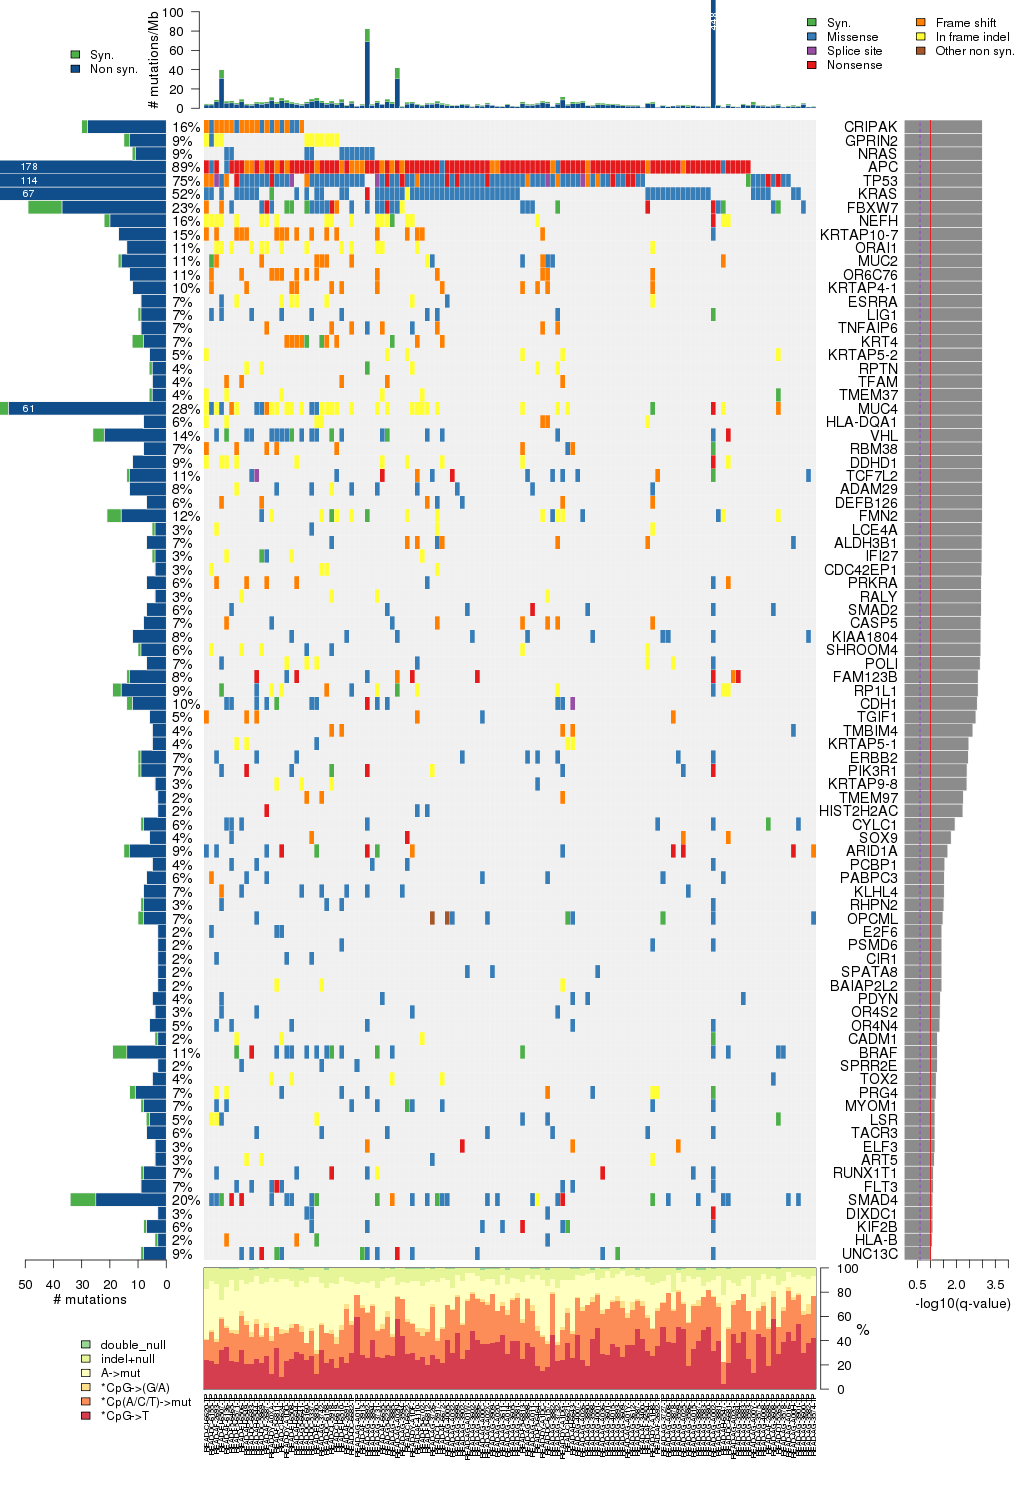
Figure 5. Get High-res Image The matrix in the center of the figure represents individual mutations in patient samples, color-coded by type of mutation, for the significantly mutated genes. The rate of synonymous and non-synonymous mutations is displayed at the top of the matrix. The barplot on the left of the matrix shows the number of mutations in each gene. The percentages represent the fraction of tumors with at least one mutation in the specified gene. The barplot to the right of the matrix displays the q-values for the most significantly mutated genes. The purple boxplots below the matrix (only displayed if required columns are present in the provided MAF) represent the distributions of allelic fractions observed in each sample. The plot at the bottom represents the base substitution distribution of individual samples, using the same categories that were used to calculate significance.
Column Descriptions:
-
N = number of sequenced bases in this gene across the individual set
-
n = number of (nonsilent) mutations in this gene across the individual set
-
npat = number of patients (individuals) with at least one nonsilent mutation
-
nsite = number of unique sites having a non-silent mutation
-
nsil = number of silent mutations in this gene across the individual set
-
n1 = number of nonsilent mutations of type: *CpG->T
-
n2 = number of nonsilent mutations of type: *Cp(A/C/T)->mut
-
n3 = number of nonsilent mutations of type: *CpG->(G/A)
-
n4 = number of nonsilent mutations of type: A->mut
-
n5 = number of nonsilent mutations of type: indel+null
-
n6 = number of nonsilent mutations of type: double_null
-
p_classic = p-value for the observed amount of nonsilent mutations being elevated in this gene
-
p_ns_s = p-value for the observed nonsilent/silent ratio being elevated in this gene
-
p_cons = p-value for enrichment of mutations at evolutionarily most-conserved sites in gene
-
p_joint = p-value for clustering + conservation
-
p = p-value (overall)
-
q = q-value, False Discovery Rate (Benjamini-Hochberg procedure)
Table 3. Get Full Table A Ranked List of Significantly Mutated Genes. Number of significant genes found: 85. Number of genes displayed: 35. Click on a gene name to display its stick figure depicting the distribution of mutations and mutation types across the chosen gene (this feature may not be available for all significant genes).
| rank | gene | description | N | n | npat | nsite | nsil | n1 | n2 | n3 | n4 | n5 | n6 | p_classic | p_ns_s | p_clust | p_cons | p_joint | p | q |
|---|---|---|---|---|---|---|---|---|---|---|---|---|---|---|---|---|---|---|---|---|
| 1 | CRIPAK | cysteine-rich PAK1 inhibitor | 97079 | 28 | 20 | 14 | 2 | 2 | 5 | 0 | 8 | 13 | 0 | 7.4e-15 | 0.15 | 2.8e-06 | 0.87 | 0.000013 | 0.000 | 0.000 |
| 2 | GPRIN2 | G protein regulated inducer of neurite outgrowth 2 | 80687 | 13 | 11 | 3 | 2 | 2 | 0 | 0 | 0 | 11 | 0 | 6.9e-15 | 0.9 | 1.8e-06 | 0.99 | 9.6e-06 | 0.000 | 0.000 |
| 3 | NRAS | neuroblastoma RAS viral (v-ras) oncogene homolog | 71479 | 11 | 11 | 6 | 1 | 0 | 7 | 0 | 4 | 0 | 0 | 7.6e-15 | 0.26 | 0.000041 | 0.23 | 0.000065 | 0.000 | 0.000 |
| 4 | APC | adenomatous polyposis coli | 1031596 | 153 | 108 | 120 | 25 | 1 | 10 | 0 | 39 | 64 | 39 | 9.6e-09 | 0.062 | 0 | 0.87 | 0 | <1.00e-15 | <8.41e-13 |
| 5 | TP53 | tumor protein p53 | 147570 | 109 | 91 | 71 | 5 | 39 | 17 | 3 | 24 | 26 | 0 | 1.1e-15 | 1.7e-07 | 0 | 0 | 0 | <1.00e-15 | <8.41e-13 |
| 6 | KRAS | v-Ki-ras2 Kirsten rat sarcoma viral oncogene homolog | 85759 | 63 | 63 | 14 | 4 | 0 | 57 | 0 | 4 | 2 | 0 | 3.7e-15 | 0.023 | 0 | 0.031 | 0 | <1.00e-15 | <8.41e-13 |
| 7 | FBXW7 | F-box and WD repeat domain containing 7 | 313861 | 37 | 28 | 32 | 12 | 10 | 6 | 1 | 11 | 8 | 1 | 1 | 0.83 | 2e-07 | 0.000072 | 0 | <1.00e-15 | <8.41e-13 |
| 8 | NEFH | neurofilament, heavy polypeptide 200kDa | 215689 | 20 | 20 | 5 | 2 | 0 | 0 | 0 | 0 | 20 | 0 | 2.4e-15 | 0.99 | 0 | 0.72 | 0 | <1.00e-15 | <8.41e-13 |
| 9 | KRTAP10-7 | keratin associated protein 10-7 | 64599 | 17 | 18 | 2 | 0 | 0 | 0 | 0 | 0 | 17 | 0 | 1.1e-14 | 1 | 0 | 0.3 | 0 | <1.00e-15 | <8.41e-13 |
| 10 | ORAI1 | ORAI calcium release-activated calcium modulator 1 | 69705 | 14 | 14 | 1 | 0 | 0 | 0 | 0 | 0 | 14 | 0 | 5e-15 | 1 | 0 | 0.57 | 0 | <1.00e-15 | <8.41e-13 |
| 11 | MUC2 | mucin 2, oligomeric mucus/gel-forming | 336936 | 16 | 13 | 8 | 1 | 2 | 3 | 0 | 2 | 9 | 0 | 1.3e-09 | 0.21 | 0 | 1 | 0 | <1.00e-15 | <8.41e-13 |
| 12 | OR6C76 | olfactory receptor, family 6, subfamily C, member 76 | 113109 | 13 | 13 | 1 | 0 | 0 | 0 | 0 | 0 | 13 | 0 | 1.1e-14 | 1 | 0 | 0.75 | 0 | <1.00e-15 | <8.41e-13 |
| 13 | KRTAP4-1 | keratin associated protein 4-1 | 24478 | 12 | 12 | 1 | 0 | 0 | 0 | 0 | 0 | 12 | 0 | 9.3e-15 | 1 | 0 | 0.43 | 0 | <1.00e-15 | <8.41e-13 |
| 14 | ESRRA | estrogen-related receptor alpha | 99563 | 9 | 9 | 3 | 0 | 1 | 1 | 0 | 0 | 7 | 0 | 1.5e-09 | 0.52 | 0.00024 | 8e-07 | 0 | <1.00e-15 | <8.41e-13 |
| 15 | LIG1 | ligase I, DNA, ATP-dependent | 312559 | 9 | 9 | 2 | 1 | 0 | 0 | 0 | 9 | 0 | 0 | 0.000051 | 0.45 | 0 | 0.84 | 0 | <1.00e-15 | <8.41e-13 |
| 16 | TNFAIP6 | tumor necrosis factor, alpha-induced protein 6 | 103218 | 9 | 9 | 3 | 0 | 0 | 0 | 0 | 2 | 7 | 0 | 3.6e-10 | 0.59 | 0 | 0.96 | 0 | <1.00e-15 | <8.41e-13 |
| 17 | KRT4 | keratin 4 | 209867 | 8 | 8 | 1 | 4 | 0 | 0 | 0 | 0 | 8 | 0 | 4.9e-07 | 1 | 0 | 0.68 | 0 | <1.00e-15 | <8.41e-13 |
| 18 | KRTAP5-2 | keratin associated protein 5-2 | 56623 | 6 | 6 | 1 | 0 | 0 | 0 | 0 | 0 | 6 | 0 | 2.2e-08 | 1 | 0 | 0.0042 | 0 | <1.00e-15 | <8.41e-13 |
| 19 | RPTN | repetin | 276471 | 5 | 5 | 1 | 1 | 0 | 0 | 0 | 0 | 5 | 0 | 0.0009 | 1 | 0 | 0.9 | 0 | <1.00e-15 | <8.41e-13 |
| 20 | TFAM | transcription factor A, mitochondrial | 89971 | 5 | 5 | 1 | 0 | 0 | 0 | 0 | 0 | 5 | 0 | 0.000016 | 1 | 0 | 1 | 0 | <1.00e-15 | <8.41e-13 |
| 21 | TMEM37 | transmembrane protein 37 | 61771 | 5 | 5 | 1 | 1 | 0 | 0 | 0 | 0 | 5 | 0 | 2.8e-06 | 1 | 0 | 0.22 | 0 | <1.00e-15 | <8.41e-13 |
| 22 | MUC4 | mucin 4, cell surface associated | 357584 | 56 | 34 | 28 | 5 | 0 | 1 | 2 | 4 | 47 | 2 | 2e-15 | 0.94 | NaN | NaN | NaN | 2.00e-15 | 1.60e-12 |
| 23 | HLA-DQA1 | major histocompatibility complex, class II, DQ alpha 1 | 52538 | 8 | 7 | 2 | 0 | 0 | 0 | 0 | 0 | 6 | 2 | 1.8e-12 | 1 | 4.6e-06 | 1 | 0.000053 | 3.66e-15 | 2.81e-12 |
| 24 | VHL | von Hippel-Lindau tumor suppressor | 38565 | 22 | 17 | 22 | 4 | 2 | 5 | 0 | 14 | 1 | 0 | 6.9e-15 | 0.24 | 0.38 | 0.0095 | 0.023 | 5.88e-15 | 4.33e-12 |
| 25 | RBM38 | RNA binding motif protein 38 | 19136 | 8 | 8 | 2 | 0 | 1 | 0 | 0 | 0 | 7 | 0 | 3.5e-14 | 0.58 | NaN | NaN | NaN | 3.49e-14 | 2.46e-11 |
| 26 | DDHD1 | DDHD domain containing 1 | 273284 | 12 | 11 | 3 | 0 | 0 | 0 | 0 | 1 | 11 | 0 | 5.1e-08 | 0.54 | 1.2e-06 | 0.99 | 0.000011 | 1.64e-11 | 1.12e-08 |
| 27 | TCF7L2 | transcription factor 7-like 2 (T-cell specific, HMG-box) | 213436 | 13 | 13 | 12 | 1 | 3 | 4 | 0 | 1 | 5 | 0 | 5.5e-12 | 0.054 | 0.21 | 0.13 | 0.17 | 2.72e-11 | 1.78e-08 |
| 28 | ADAM29 | ADAM metallopeptidase domain 29 | 296713 | 13 | 10 | 6 | 0 | 7 | 1 | 0 | 0 | 5 | 0 | 9.1e-09 | 0.13 | 0.0012 | 0.011 | 0.00027 | 6.82e-11 | 4.30e-08 |
| 29 | DEFB126 | defensin, beta 126 | 41372 | 7 | 7 | 3 | 0 | 0 | 2 | 0 | 0 | 5 | 0 | 3.3e-10 | 0.73 | 0.0083 | 0.074 | 0.009 | 8.19e-11 | 4.99e-08 |
| 30 | FMN2 | formin 2 | 424640 | 16 | 15 | 9 | 5 | 0 | 2 | 0 | 2 | 12 | 0 | 6.9e-08 | 0.99 | 0.000063 | 1 | 0.00012 | 2.28e-10 | 1.34e-07 |
| 31 | LCE4A | late cornified envelope 4A | 33027 | 4 | 4 | 3 | 1 | 0 | 1 | 0 | 0 | 3 | 0 | 1.9e-06 | 0.96 | 0.00024 | 0.33 | 0.001 | 4.11e-08 | 2.34e-05 |
| 32 | ALDH3B1 | aldehyde dehydrogenase 3 family, member B1 | 80008 | 7 | 8 | 4 | 0 | 0 | 0 | 1 | 1 | 5 | 0 | 2.6e-08 | 0.67 | 0.053 | 0.99 | 0.11 | 6.10e-08 | 3.37e-05 |
| 33 | IFI27 | interferon, alpha-inducible protein 27 | 40534 | 4 | 4 | 2 | 1 | 0 | 1 | 0 | 0 | 3 | 0 | 0.000011 | 0.93 | 0.000023 | 0.74 | 0.0003 | 6.69e-08 | 3.58e-05 |
| 34 | CDC42EP1 | CDC42 effector protein (Rho GTPase binding) 1 | 58050 | 4 | 4 | 1 | 0 | 0 | 0 | 0 | 0 | 4 | 0 | 0.00011 | 1 | 1.6e-06 | 0.99 | 0.000065 | 1.38e-07 | 7.18e-05 |
| 35 | PRKRA | protein kinase, interferon-inducible double stranded RNA dependent activator | 112731 | 7 | 7 | 3 | 0 | 0 | 2 | 0 | 0 | 5 | 0 | 3.8e-07 | 0.71 | 0.01 | 0.44 | 0.022 | 1.68e-07 | 8.31e-05 |
In this analysis, COSMIC is used as a filter to increase power by restricting the territory of each gene. Cosmic version: v48.
Table 4. Get Full Table Significantly mutated genes (COSMIC territory only). To access the database please go to: COSMIC. Number of significant genes found: 626. Number of genes displayed: 10
| rank | gene | description | n | cos | n_cos | N_cos | cos_ev | p | q |
|---|---|---|---|---|---|---|---|---|---|
| 1 | APC | adenomatous polyposis coli | 153 | 839 | 127 | 102358 | 3336 | 0 | 0 |
| 2 | TP53 | tumor protein p53 | 109 | 824 | 109 | 100528 | 37961 | 0 | 0 |
| 3 | LIG1 | ligase I, DNA, ATP-dependent | 9 | 2 | 9 | 244 | 9 | 1.3e-14 | 1.9e-11 |
| 4 | RHPN2 | rhophilin, Rho GTPase binding protein 2 | 8 | 4 | 7 | 488 | 12 | 2.6e-14 | 2.9e-11 |
| 5 | ADAM29 | ADAM metallopeptidase domain 29 | 13 | 5 | 6 | 610 | 7 | 3.3e-14 | 2.9e-11 |
| 6 | TAF1L | TAF1 RNA polymerase II, TATA box binding protein (TBP)-associated factor, 210kDa-like | 16 | 11 | 6 | 1342 | 8 | 7.2e-14 | 5.4e-11 |
| 7 | CSMD3 | CUB and Sushi multiple domains 3 | 29 | 22 | 7 | 2684 | 7 | 1.4e-13 | 9e-11 |
| 8 | NRAS | neuroblastoma RAS viral (v-ras) oncogene homolog | 11 | 33 | 10 | 4026 | 10215 | 2.1e-13 | 1.1e-10 |
| 9 | SYNE1 | spectrin repeat containing, nuclear envelope 1 | 40 | 22 | 6 | 2684 | 6 | 2.3e-13 | 1.1e-10 |
| 10 | KRAS | v-Ki-ras2 Kirsten rat sarcoma viral oncogene homolog | 63 | 52 | 62 | 6344 | 593044 | 3.2e-13 | 1.4e-10 |
Note:
n - number of (nonsilent) mutations in this gene across the individual set.
cos = number of unique mutated sites in this gene in COSMIC
n_cos = overlap between n and cos.
N_cos = number of individuals times cos.
cos_ev = total evidence: number of reports in COSMIC for mutations seen in this gene.
p = p-value for seeing the observed amount of overlap in this gene)
q = q-value, False Discovery Rate (Benjamini-Hochberg procedure)
Table 5. Get Full Table A Ranked List of Significantly Mutated Genesets. (Source: MSigDB GSEA Cannonical Pathway Set).Number of significant genesets found: 24. Number of genesets displayed: 10
| rank | geneset | description | genes | N_genes | mut_tally | N | n | npat | nsite | nsil | n1 | n2 | n3 | n4 | n5 | n6 | p_ns_s | p | q |
|---|---|---|---|---|---|---|---|---|---|---|---|---|---|---|---|---|---|---|---|
| 1 | P53HYPOXIAPATHWAY | Hypoxia induces p53 accumulation and consequent apoptosis with p53-mediated cell cycle arrest, which is present under conditions of DNA damage. | ABCB1, AKT1, ATM, BAX, CDKN1A, CPB2, CSNK1A1, CSNK1D, FHL2, GADD45A, HIC1, HIF1A, HSPA1A, HSPCA, IGFBP3, MAPK8, MDM2, NFKBIB, NQO1, TP53 | 17 | ABCB1(6), ATM(37), BAX(2), CPB2(1), CSNK1D(1), FHL2(1), HIF1A(2), IGFBP3(2), MAPK8(6), TP53(109) | 3403276 | 167 | 98 | 127 | 17 | 48 | 36 | 6 | 43 | 32 | 2 | 4.4e-06 | <1.00e-15 | <1.71e-13 |
| 2 | APOPTOSIS_GENMAPP | APAF1, BAK1, BCL2L7P1, BAX, BCL2, BCL2L1, BID, BIRC2, BIRC3, BIRC4, CASP2, CASP3, CASP6, CASP7, CASP8, CASP9, CYCS, FADD, FAS, FASLG, GZMB, IKBKG, JUN, MAP2K4, MAP3K1, MAP3K14, MAPK10, MCL1, MDM2, MYC, NFKB1, NFKBIA, PARP1, PRF1, RELA, RIPK1, TNF, TNFRSF1A, TNFRSF1B, TNFSF10, TP53, TRADD, TRAF1, TRAF2 | 41 | APAF1(4), BAX(2), BIRC2(2), BIRC3(7), CASP3(1), CASP6(1), CASP8(1), CASP9(1), FAS(2), GZMB(1), MAP2K4(4), MAP3K1(3), MAPK10(4), NFKB1(3), PARP1(1), PRF1(1), RELA(1), TNF(1), TNFSF10(1), TP53(109), TRAF1(2) | 6152577 | 152 | 95 | 112 | 15 | 50 | 30 | 4 | 31 | 37 | 0 | 3.8e-07 | <1.00e-15 | <1.71e-13 | |
| 3 | SA_G1_AND_S_PHASES | Cdk2, 4, and 6 bind cyclin D in G1, while cdk2/cyclin E promotes the G1/S transition. | ARF1, ARF3, CCND1, CDK2, CDK4, CDKN1A, CDKN1B, CDKN2A, CFL1, E2F1, E2F2, MDM2, NXT1, PRB1, TP53 | 15 | CDK4(1), CDKN1B(2), CDKN2A(2), PRB1(2), TP53(109) | 1293032 | 116 | 94 | 78 | 10 | 41 | 17 | 3 | 25 | 30 | 0 | 3.7e-06 | <1.00e-15 | <1.71e-13 |
| 4 | ST_GRANULE_CELL_SURVIVAL_PATHWAY | The survival and differentiation of granule cells in the brain is controlled by pro-growth PACAP and pro-apoptotic ceramides. | ADPRT, APC, ASAH1, CAMP, CASP3, CERK, CREB1, CREB3, CREB5, CXCL2, DAG1, EPHB2, FOS, GNAQ, IL8RB, ITPKA, ITPKB, JUN, MAP2K4, MAP2K7, MAPK1, MAPK10, MAPK8, MAPK8IP1, MAPK8IP2, MAPK8IP3, MAPK9, PACAP | 24 | APC(153), CASP3(1), CREB3(1), CREB5(3), DAG1(2), EPHB2(1), FOS(1), GNAQ(1), ITPKB(1), MAP2K4(4), MAP2K7(2), MAPK10(4), MAPK8(6), MAPK8IP1(1), MAPK8IP3(1), MAPK9(3) | 4369054 | 185 | 110 | 152 | 30 | 10 | 18 | 2 | 46 | 70 | 39 | 0.0013 | 1.11e-15 | 1.71e-13 |
| 5 | TERTPATHWAY | hTERC, the RNA subunit of telomerase, and hTERT, the catalytic protein subunit, are required for telomerase activity and are overexpressed in many cancers. | HDAC1, MAX, MYC, SP1, SP3, TP53, WT1, ZNF42 | 7 | SP1(1), SP3(3), TP53(109), WT1(4) | 1194152 | 117 | 92 | 79 | 7 | 42 | 18 | 3 | 27 | 27 | 0 | 2.1e-08 | 2.66e-15 | 2.85e-13 |
| 6 | TIDPATHWAY | On ligand binding, interferon gamma receptors stimulate JAK2 kinase to phosphorylate STAT transcription factors, which promote expression of interferon responsive genes. | DNAJA3, HSPA1A, IFNG, IFNGR1, IFNGR2, IKBKB, JAK2, LIN7A, NFKB1, NFKBIA, RB1, RELA, TIP-1, TNF, TNFRSF1A, TNFRSF1B, TP53, USH1C, WT1 | 17 | DNAJA3(1), IFNGR1(2), IFNGR2(1), IKBKB(2), JAK2(7), NFKB1(3), RB1(16), RELA(1), TNF(1), TP53(109), USH1C(4), WT1(4) | 3076498 | 151 | 95 | 112 | 25 | 49 | 26 | 3 | 41 | 31 | 1 | 0.0023 | 2.78e-15 | 2.85e-13 |
| 7 | CHEMICALPATHWAY | DNA damage promotes Bid cleavage, which stimulates mitochondrial cytochrome c release and consequent caspase activation, resulting in apoptosis. | ADPRT, AKT1, APAF1, ATM, BAD, BAX, BCL2, BCL2L1, BID, CASP3, CASP6, CASP7, CASP9, CYCS, EIF2S1, PRKCA, PRKCB1, PTK2, PXN, STAT1, TLN1, TP53 | 20 | APAF1(4), ATM(37), BAX(2), CASP3(1), CASP6(1), CASP9(1), PRKCA(3), STAT1(2), TLN1(2), TP53(109) | 4715253 | 162 | 97 | 121 | 17 | 43 | 36 | 5 | 43 | 33 | 2 | 7.2e-06 | 3.77e-15 | 3.04e-13 |
| 8 | ATMPATHWAY | The tumor-suppressing protein kinase ATM responds to radiation-induced DNA damage by blocking cell-cycle progression and activating DNA repair. | ABL1, ATM, BRCA1, CDKN1A, CHEK1, CHEK2, GADD45A, JUN, MAPK8, MDM2, MRE11A, NBS1, NFKB1, NFKBIA, RAD50, RAD51, RBBP8, RELA, TP53, TP73 | 19 | ABL1(4), ATM(37), BRCA1(3), CHEK1(1), CHEK2(3), MAPK8(6), MRE11A(5), NFKB1(3), RAD50(7), RBBP8(1), RELA(1), TP53(109) | 5081623 | 180 | 99 | 138 | 25 | 50 | 41 | 7 | 50 | 30 | 2 | 0.00042 | 4.11e-15 | 3.04e-13 |
| 9 | RNAPATHWAY | dsRNA-activated protein kinase phosphorylates elF2a, which generally inhibits translation, and activates NF-kB to provoke inflammation. | CHUK, DNAJC3, EIF2S1, EIF2S2, MAP3K14, NFKB1, NFKBIA, PRKR, RELA, TP53 | 9 | CHUK(4), NFKB1(3), RELA(1), TP53(109) | 1620736 | 117 | 93 | 79 | 10 | 43 | 18 | 3 | 27 | 26 | 0 | 0.000013 | 4.44e-15 | 3.04e-13 |
| 10 | PMLPATHWAY | Ring-shaped PML nuclear bodies regulate transcription and are required co-activators in p53- and DAXX-mediated apoptosis. | CREBBP, DAXX, HRAS, PAX3, PML, PRAM-1, RARA, RB1, SIRT1, SP100, TNF, TNFRSF1A, TNFRSF1B, TNFRSF6, TNFSF6, TP53, UBL1 | 13 | CREBBP(13), DAXX(4), PAX3(3), PML(1), RARA(1), RB1(16), SIRT1(1), SP100(1), TNF(1), TP53(109) | 3084344 | 150 | 96 | 109 | 21 | 51 | 19 | 5 | 43 | 32 | 0 | 0.000096 | 5.11e-15 | 3.15e-13 |
Table 6. Get Full Table A Ranked List of Significantly Mutated Genesets (Excluding Significantly Mutated Genes). Number of significant genesets found: 0. Number of genesets displayed: 10
| rank | geneset | description | genes | N_genes | mut_tally | N | n | npat | nsite | nsil | n1 | n2 | n3 | n4 | n5 | n6 | p_ns_s | p | q |
|---|---|---|---|---|---|---|---|---|---|---|---|---|---|---|---|---|---|---|---|
| 1 | ERBB4PATHWAY | ErbB4 (aka HER4) is a receptor tyrosine kinase that binds neuregulins as well as members of the EGF family, which also target EGF receptors. | ADAM17, ERBB4, NRG2, NRG3, PRKCA, PRKCB1, PSEN1 | 6 | ADAM17(2), ERBB4(9), NRG2(2), NRG3(4), PRKCA(3), PSEN1(1) | 1586122 | 21 | 16 | 21 | 3 | 6 | 7 | 2 | 3 | 3 | 0 | 0.12 | 0.03 | 1 |
| 2 | HSA00472_D_ARGININE_AND_D_ORNITHINE_METABOLISM | Genes involved in D-arginine and D-ornithine metabolism | DAO | 1 | DAO(4) | 129236 | 4 | 3 | 4 | 0 | 3 | 1 | 0 | 0 | 0 | 0 | 0.27 | 0.066 | 1 |
| 3 | HSP27PATHWAY | Hsp27 oligomers have molecular chaperone activity and protect heat-stressed cells against apoptosis. | ACTA1, APAF1, BCL2, CASP3, CASP9, CYCS, DAXX, FAS, FASLG, HSPB1, HSPB2, IL1A, MAPKAPK2, MAPKAPK3, TNF, TNFRSF6 | 14 | ACTA1(2), APAF1(4), CASP3(1), CASP9(1), DAXX(4), FAS(2), HSPB2(1), MAPKAPK2(1), TNF(1) | 1838947 | 17 | 14 | 16 | 1 | 1 | 3 | 0 | 11 | 2 | 0 | 0.12 | 0.067 | 1 |
| 4 | C21_STEROID_HORMONE_METABOLISM | AKR1C4, AKR1D1, CYP11A1, CYP11B1, CYP11B2, CYP17A1, CYP21A2, HSD11B1, HSD11B2, HSD3B1, HSD3B2 | 11 | AKR1C4(2), AKR1D1(1), CYP11A1(2), CYP11B1(4), CYP21A2(3), HSD3B1(1), HSD3B2(1) | 1477777 | 14 | 13 | 13 | 3 | 3 | 5 | 0 | 2 | 4 | 0 | 0.45 | 0.087 | 1 | |
| 5 | HSA00140_C21_STEROID_HORMONE_METABOLISM | Genes involved in C21-steroid hormone metabolism | AKR1C4, AKR1D1, CYP11A1, CYP11B1, CYP11B2, CYP17A1, CYP21A2, HSD11B1, HSD11B2, HSD3B1, HSD3B2 | 11 | AKR1C4(2), AKR1D1(1), CYP11A1(2), CYP11B1(4), CYP21A2(3), HSD3B1(1), HSD3B2(1) | 1477777 | 14 | 13 | 13 | 3 | 3 | 5 | 0 | 2 | 4 | 0 | 0.45 | 0.087 | 1 |
| 6 | GSPATHWAY | Activated G-protein coupled receptors stimulate cAMP production and thus activate protein kinase A, involved in a number of signal transduction pathways. | ADCY1, GNAS, GNB1, GNGT1, PRKACA, PRKAR1A | 6 | ADCY1(5), GNAS(4), GNGT1(1), PRKACA(1), PRKAR1A(5) | 974544 | 16 | 14 | 16 | 3 | 5 | 4 | 2 | 3 | 2 | 0 | 0.24 | 0.092 | 1 |
| 7 | PS1PATHWAY | Presenilin is required for gamma-secretase activity to activate Notch signaling; presenilin also inhibits beta-catenin in the Wnt/Frizzled pathway. | ADAM17, APC, AXIN1, BTRC, CTNNB1, DLL1, DVL1, FZD1, GSK3B, NOTCH1, PSEN1, RBPSUH, TCF1, WNT1 | 10 | ADAM17(2), AXIN1(2), BTRC(4), CTNNB1(21), DLL1(4), FZD1(2), GSK3B(1), NOTCH1(1), PSEN1(1) | 1902790 | 38 | 29 | 36 | 9 | 7 | 10 | 1 | 16 | 4 | 0 | 0.3 | 0.096 | 1 |
| 8 | BLOOD_GROUP_GLYCOLIPID_BIOSYNTHESIS_LACTOSERIES | ABO, FUT1, FUT2, FUT3, FUT5, FUT6, SIAT6, ST3GAL3 | 7 | ABO(2), FUT1(3), FUT2(1), FUT3(2), FUT6(1) | 660538 | 9 | 7 | 9 | 1 | 5 | 2 | 0 | 0 | 2 | 0 | 0.25 | 0.1 | 1 | |
| 9 | HSA00660_C5_BRANCHED_DIBASIC_ACID_METABOLISM | Genes involved in C5-branched dibasic acid metabolism | ILVBL, SUCLA2 | 2 | ILVBL(1), SUCLA2(3) | 352237 | 4 | 4 | 4 | 1 | 0 | 3 | 0 | 1 | 0 | 0 | 0.66 | 0.16 | 1 |
| 10 | BOTULINPATHWAY | Blockade of Neurotransmitter Relase by Botulinum Toxin | CHRM1, CHRNA1, SNAP25, STX1A, VAMP2 | 5 | CHRNA1(3), SNAP25(1), STX1A(1) | 555266 | 5 | 5 | 5 | 1 | 0 | 3 | 0 | 2 | 0 | 0 | 0.57 | 0.16 | 1 |
In brief, we tabulate the number of mutations and the number of covered bases for each gene. The counts are broken down by mutation context category: four context categories that are discovered by MutSig, and one for indel and 'null' mutations, which include indels, nonsense mutations, splice-site mutations, and non-stop (read-through) mutations. For each gene, we calculate the probability of seeing the observed constellation of mutations, i.e. the product P1 x P2 x ... x Pm, or a more extreme one, given the background mutation rates calculated across the dataset. [1]
In addition to the links below, the full results of the analysis summarized in this report can also be downloaded programmatically using firehose_get, or interactively from either the Broad GDAC website or TCGA Data Coordination Center Portal.