This pipeline computes the correlation between significant copy number variation (cnv focal) genes and selected clinical features.
Testing the association between copy number variation 66 focal events and 5 clinical features across 246 patients, 68 significant findings detected with Q value < 0.25.
-
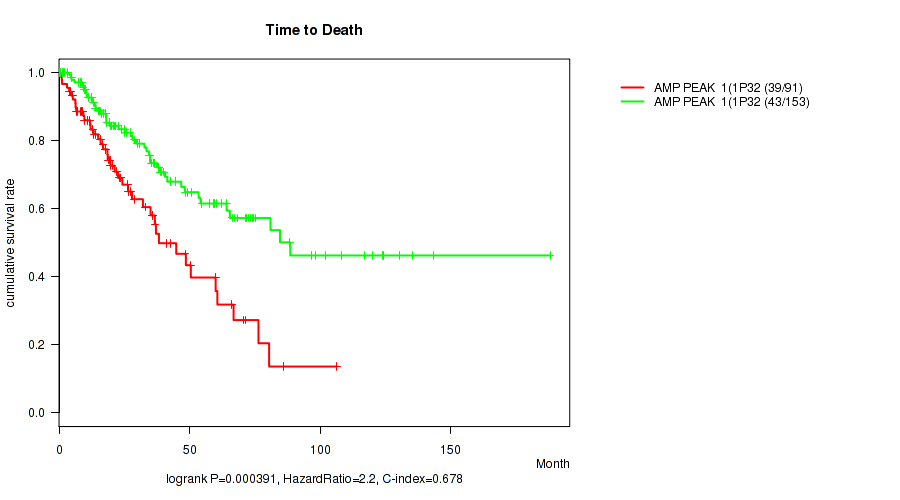
amp_1p32.1 cnv correlated to 'Time to Death' and 'YEARS_TO_BIRTH'.
-
amp_1q21.3 cnv correlated to 'YEARS_TO_BIRTH'.
-
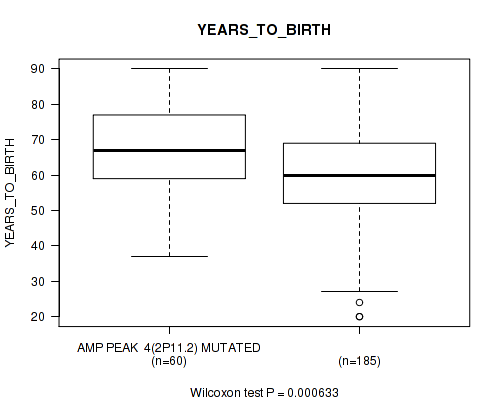
amp_2p11.2 cnv correlated to 'YEARS_TO_BIRTH'.
-
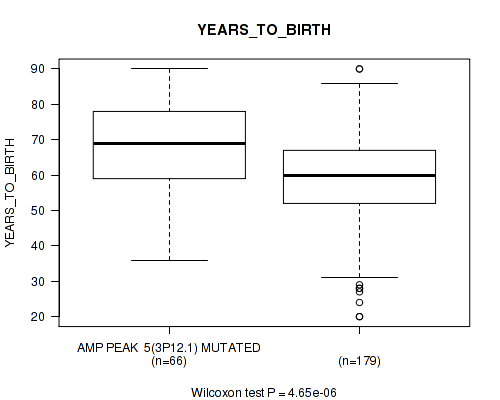
amp_3p12.1 cnv correlated to 'YEARS_TO_BIRTH'.
-
amp_4q12 cnv correlated to 'YEARS_TO_BIRTH'.
-
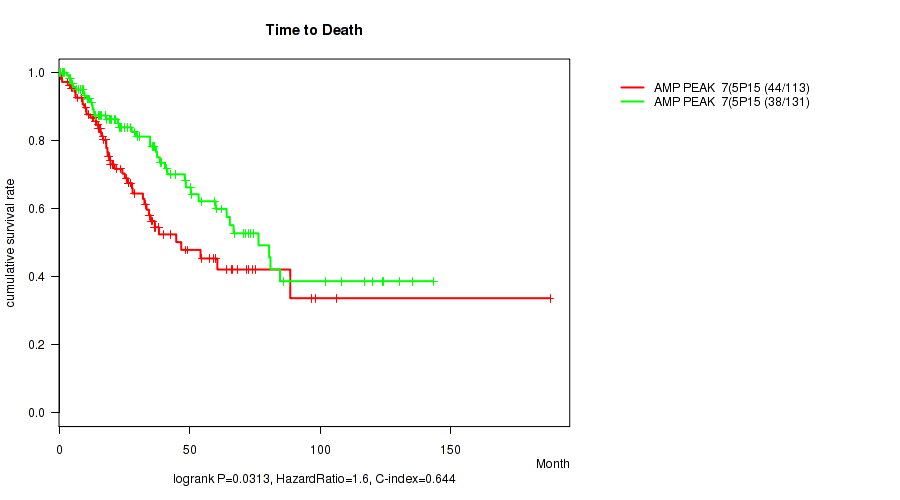
amp_5p15.33 cnv correlated to 'Time to Death' and 'YEARS_TO_BIRTH'.
-
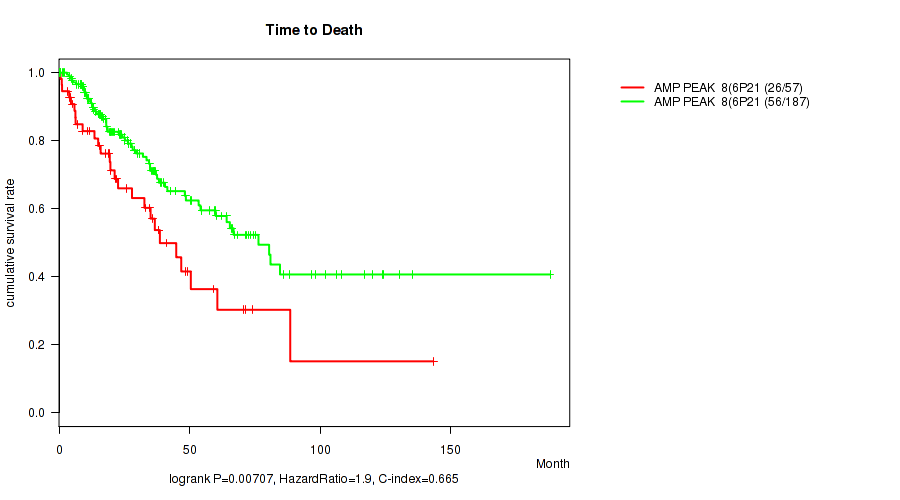
amp_6p21.1 cnv correlated to 'Time to Death'.
-
amp_7q31.2 cnv correlated to 'YEARS_TO_BIRTH'.
-
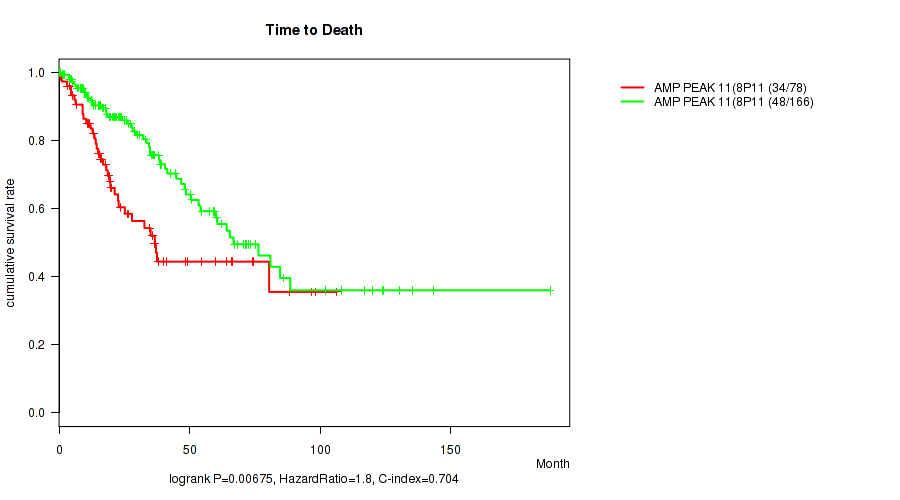
amp_8p11.22 cnv correlated to 'Time to Death' and 'YEARS_TO_BIRTH'.
-
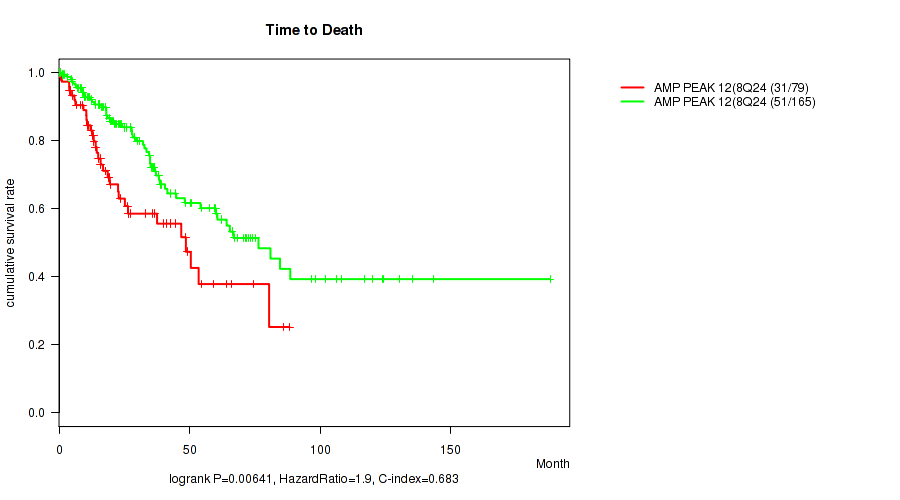
amp_8q24.21 cnv correlated to 'Time to Death'.
-
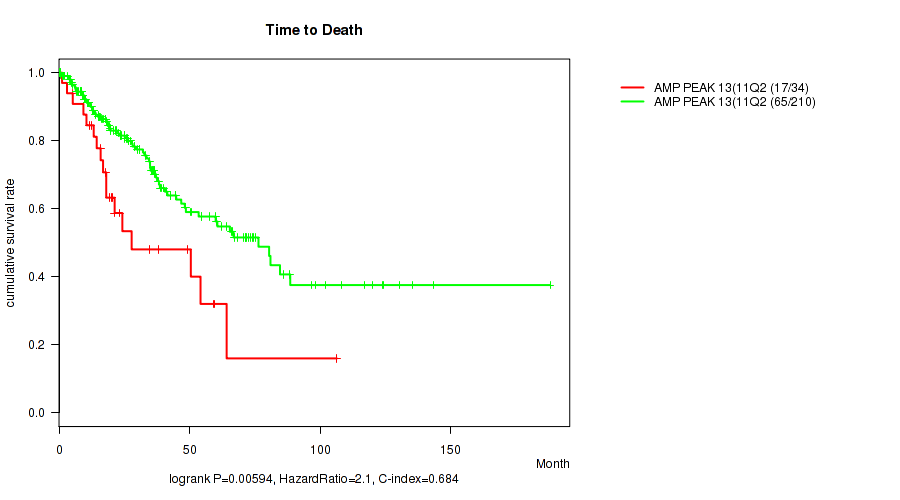
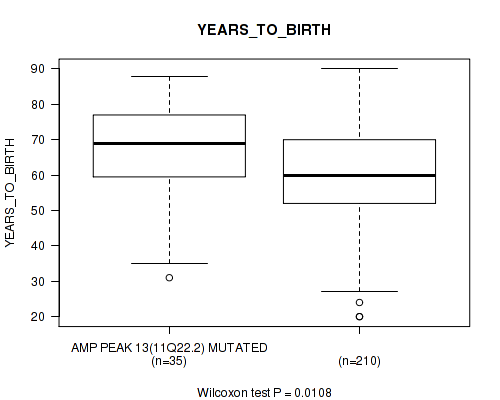
amp_11q22.2 cnv correlated to 'Time to Death' and 'YEARS_TO_BIRTH'.
-
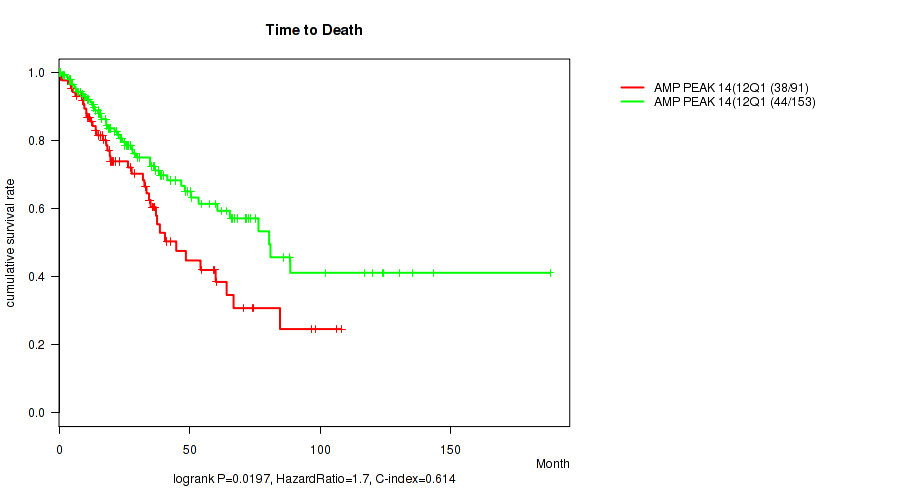
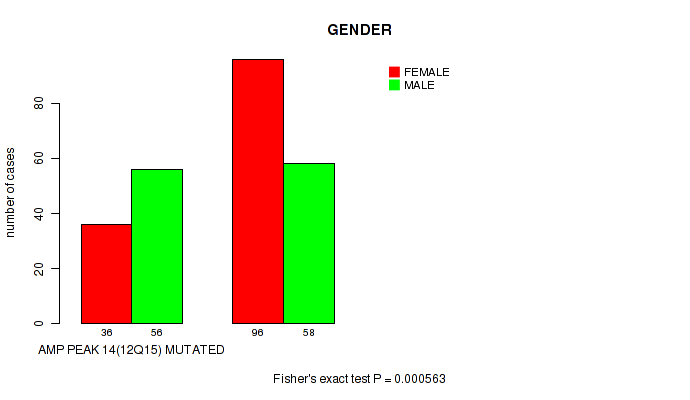
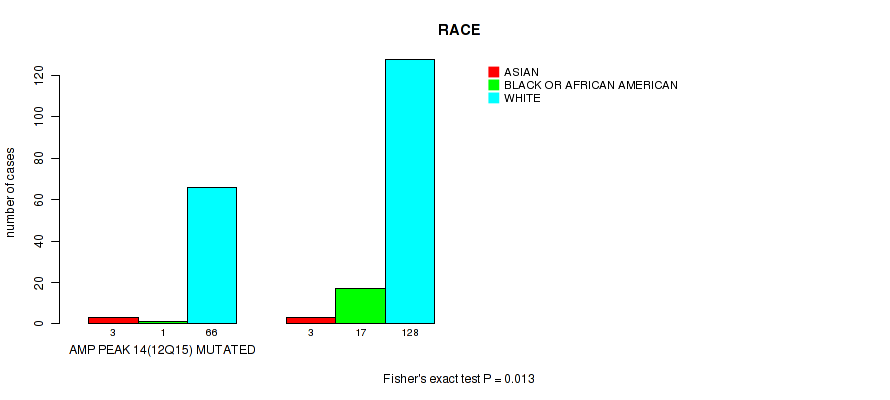
amp_12q15 cnv correlated to 'Time to Death', 'YEARS_TO_BIRTH', 'GENDER', and 'RACE'.
-
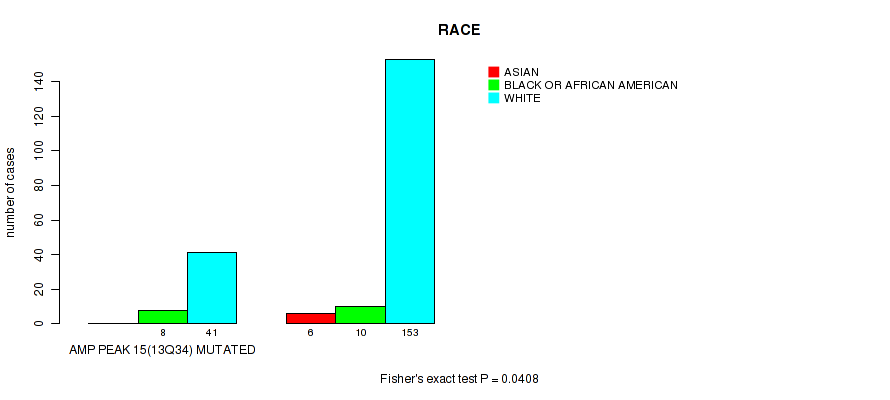
amp_13q34 cnv correlated to 'RACE'.
-
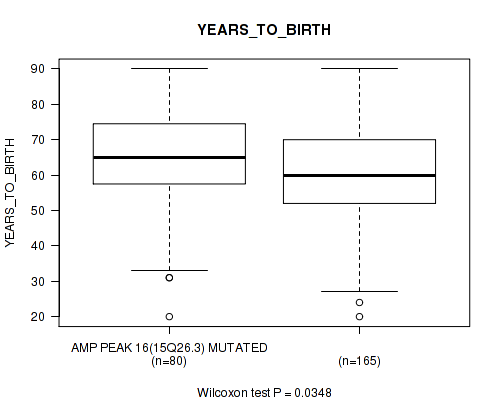
amp_15q26.3 cnv correlated to 'YEARS_TO_BIRTH'.
-
amp_17p12 cnv correlated to 'YEARS_TO_BIRTH'.
-
amp_17p11.2 cnv correlated to 'YEARS_TO_BIRTH'.
-
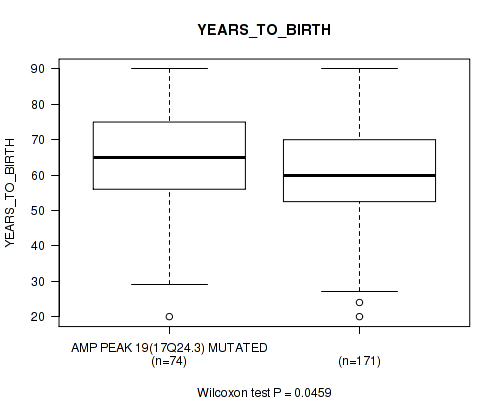
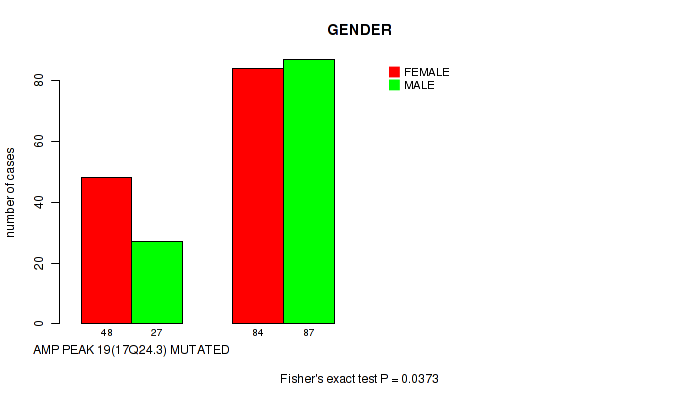
amp_17q24.3 cnv correlated to 'YEARS_TO_BIRTH' and 'GENDER'.
-
amp_19q12 cnv correlated to 'YEARS_TO_BIRTH'.
-
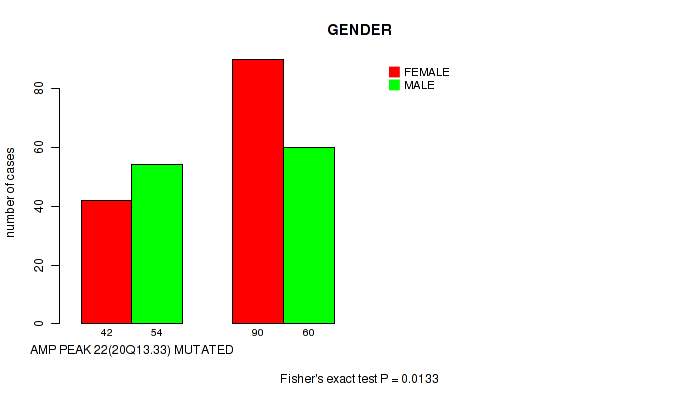
amp_20q13.33 cnv correlated to 'Time to Death', 'YEARS_TO_BIRTH', and 'GENDER'.
-
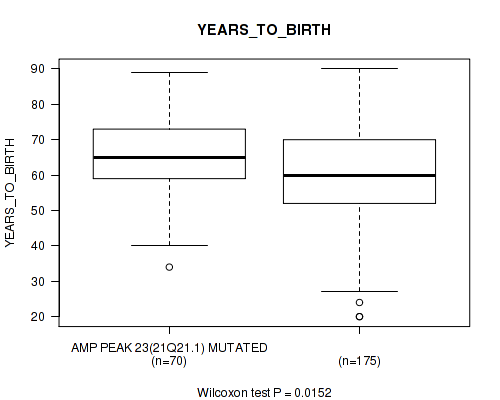
amp_21q21.1 cnv correlated to 'YEARS_TO_BIRTH'.
-
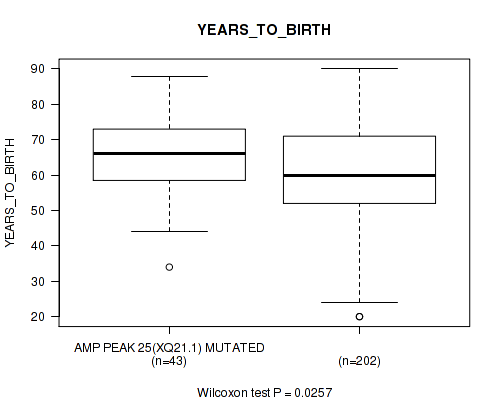
amp_xq21.1 cnv correlated to 'YEARS_TO_BIRTH'.
-
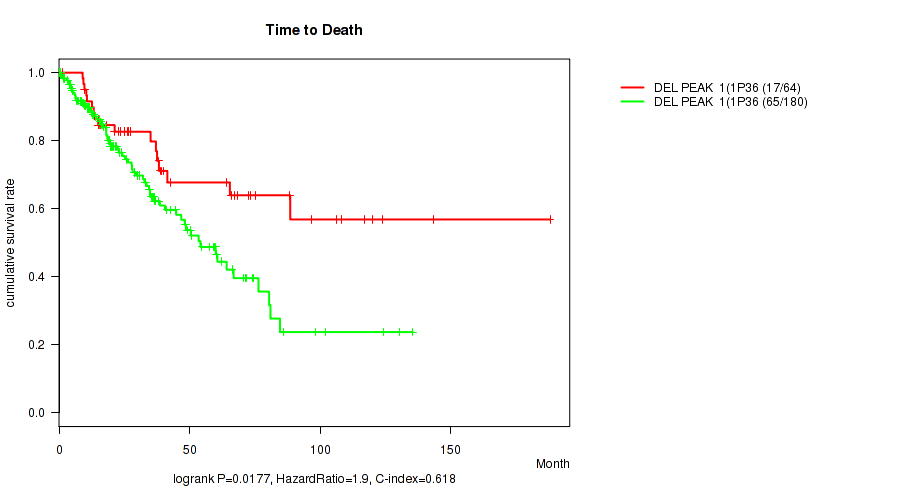
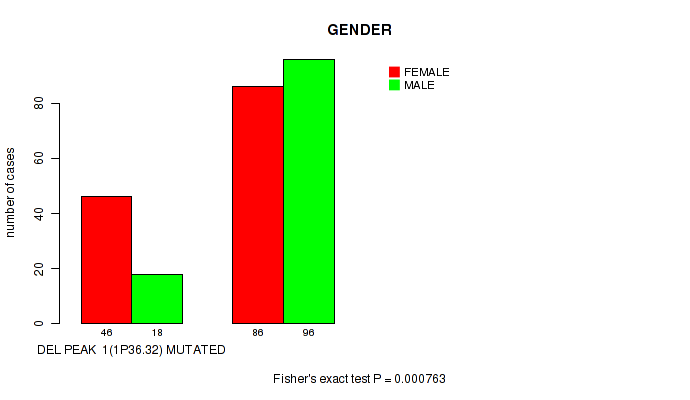
del_1p36.32 cnv correlated to 'Time to Death' and 'GENDER'.
-
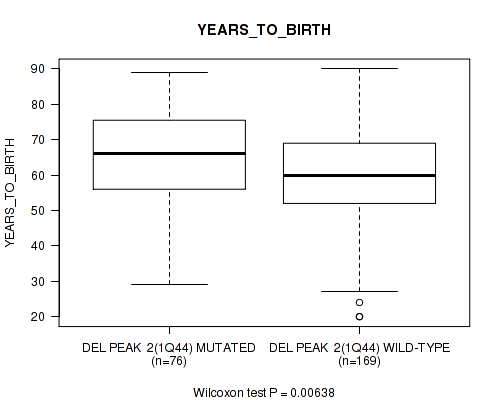
del_1q44 cnv correlated to 'YEARS_TO_BIRTH'.
-
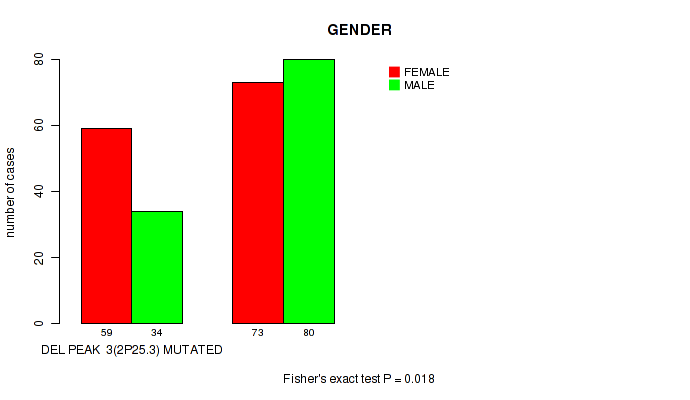
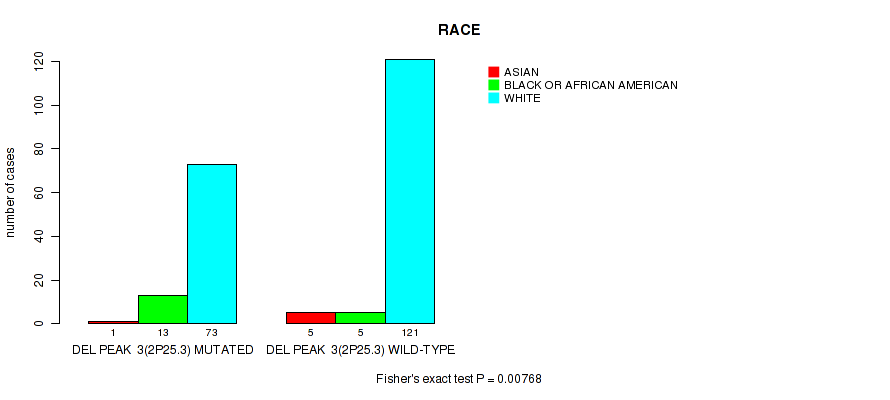
del_2p25.3 cnv correlated to 'GENDER' and 'RACE'.
-
del_2q37.3 cnv correlated to 'Time to Death' and 'YEARS_TO_BIRTH'.
-
del_2q37.3 cnv correlated to 'YEARS_TO_BIRTH'.
-
del_3q13.31 cnv correlated to 'YEARS_TO_BIRTH'.
-
del_4q35.1 cnv correlated to 'YEARS_TO_BIRTH'.
-
del_9p24.3 cnv correlated to 'YEARS_TO_BIRTH'.
-
del_9p21.3 cnv correlated to 'YEARS_TO_BIRTH'.
-
del_9q34.3 cnv correlated to 'RACE'.
-
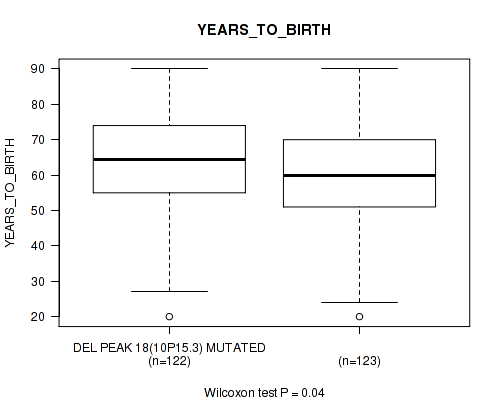
del_10p15.3 cnv correlated to 'YEARS_TO_BIRTH'.
-
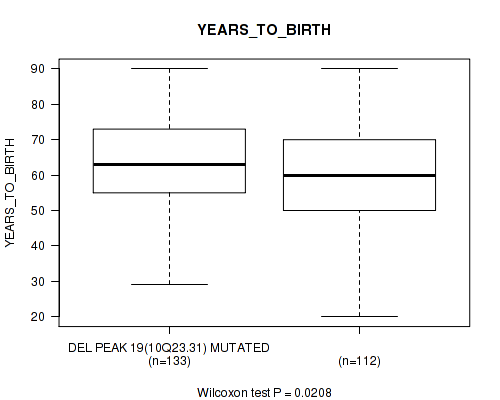
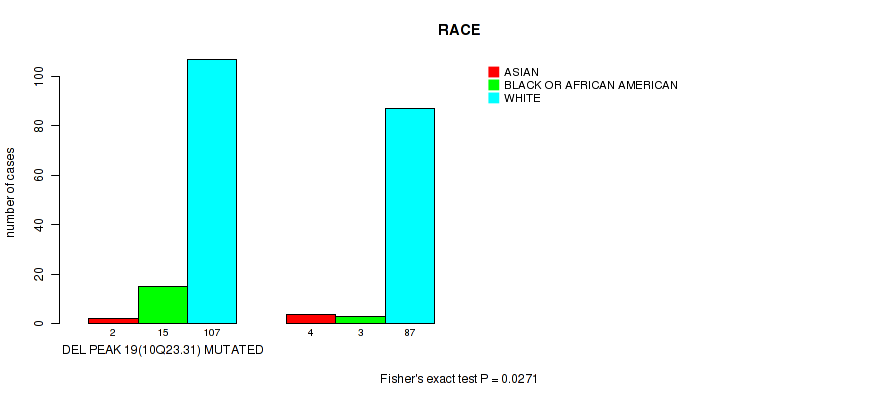
del_10q23.31 cnv correlated to 'YEARS_TO_BIRTH' and 'RACE'.
-
del_10q26.3 cnv correlated to 'YEARS_TO_BIRTH'.
-
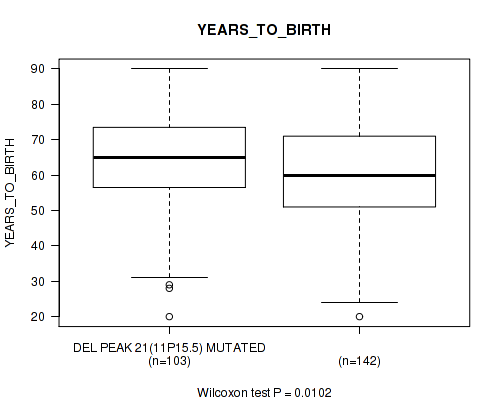
del_11p15.5 cnv correlated to 'YEARS_TO_BIRTH'.
-
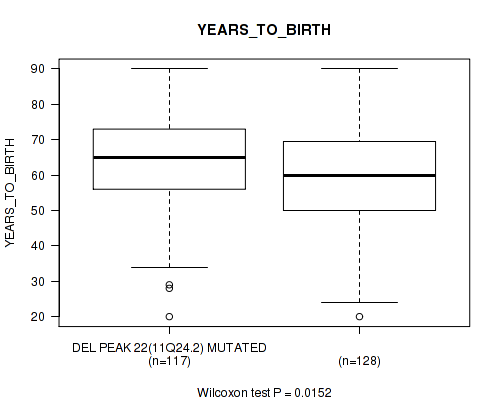
del_11q24.2 cnv correlated to 'YEARS_TO_BIRTH'.
-
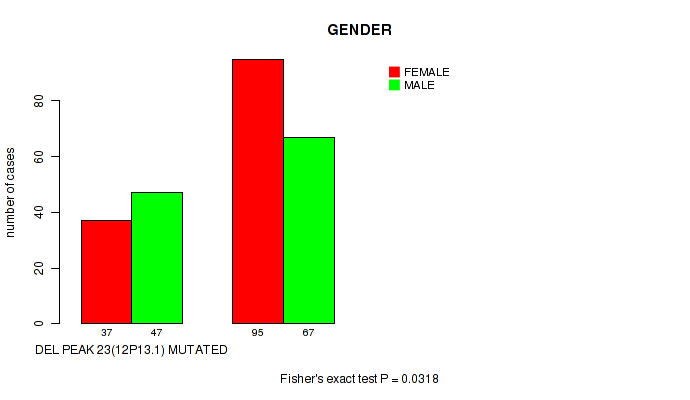
del_12p13.1 cnv correlated to 'GENDER'.
-
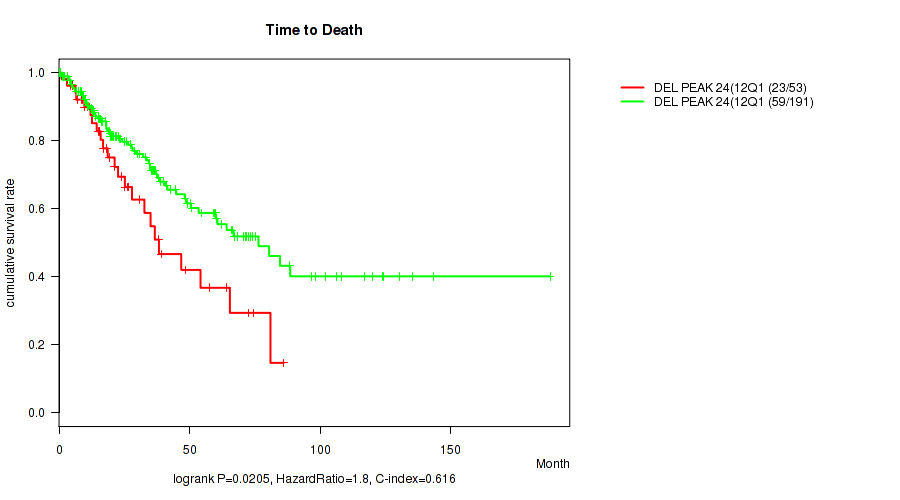
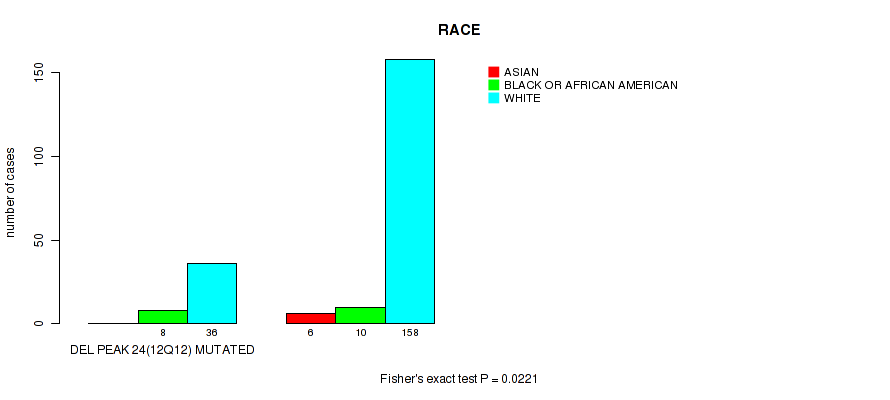
del_12q12 cnv correlated to 'Time to Death' and 'RACE'.
-
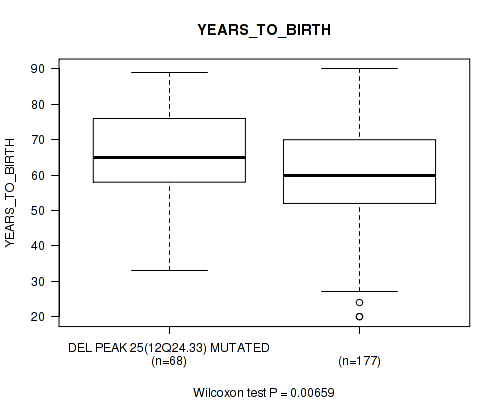
del_12q24.33 cnv correlated to 'YEARS_TO_BIRTH'.
-
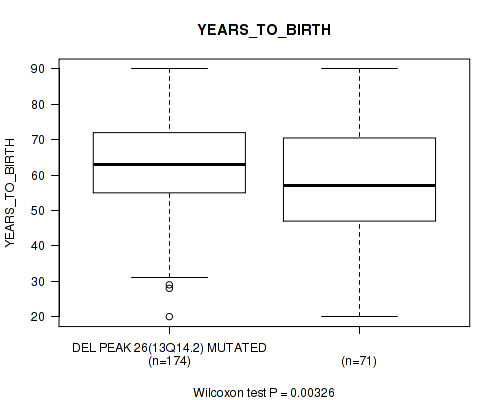
del_13q14.2 cnv correlated to 'YEARS_TO_BIRTH'.
-
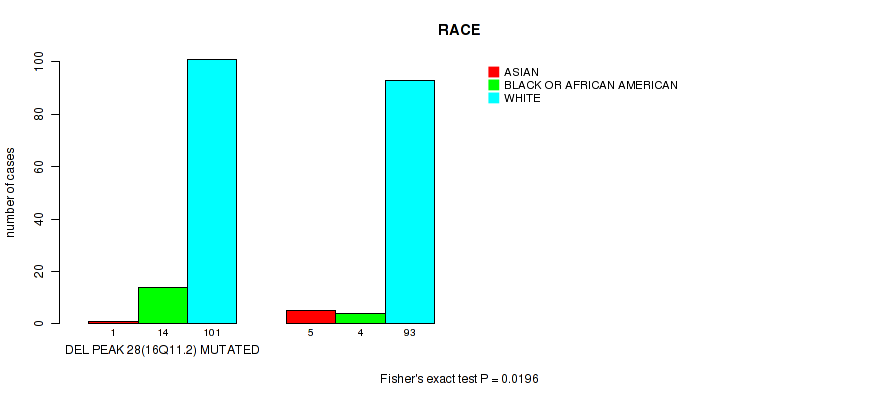
del_16q11.2 cnv correlated to 'RACE'.
-
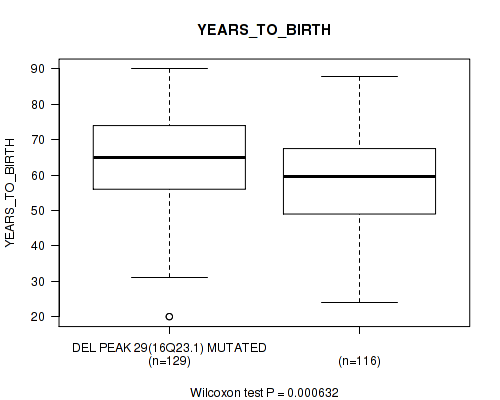
del_16q23.1 cnv correlated to 'YEARS_TO_BIRTH'.
-
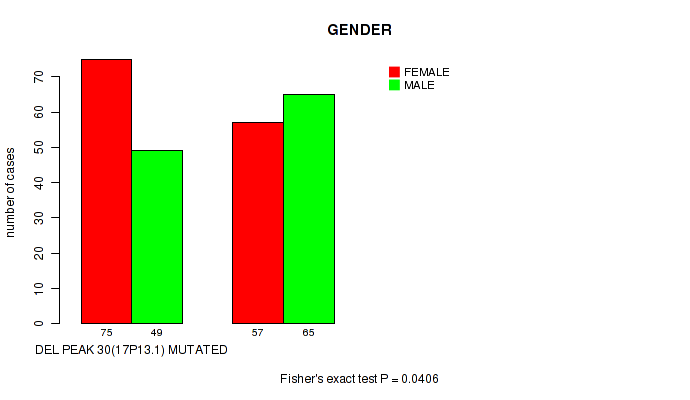
del_17p13.1 cnv correlated to 'GENDER'.
-
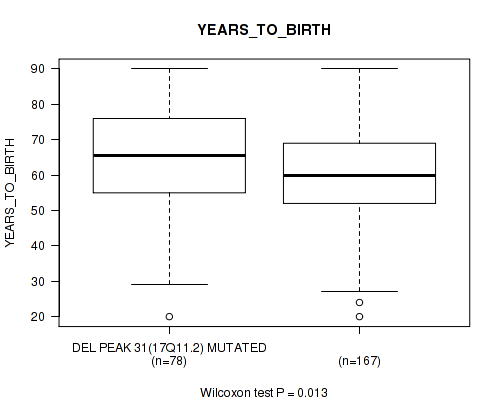
del_17q11.2 cnv correlated to 'YEARS_TO_BIRTH'.
-
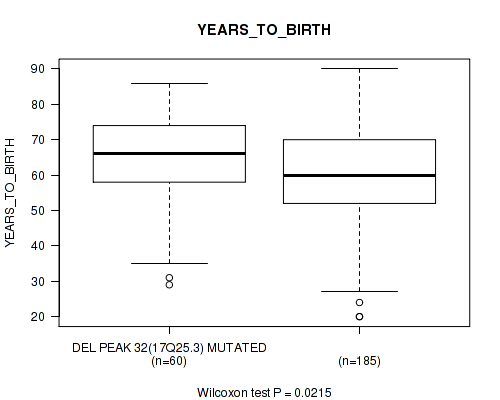
del_17q25.3 cnv correlated to 'YEARS_TO_BIRTH'.
-
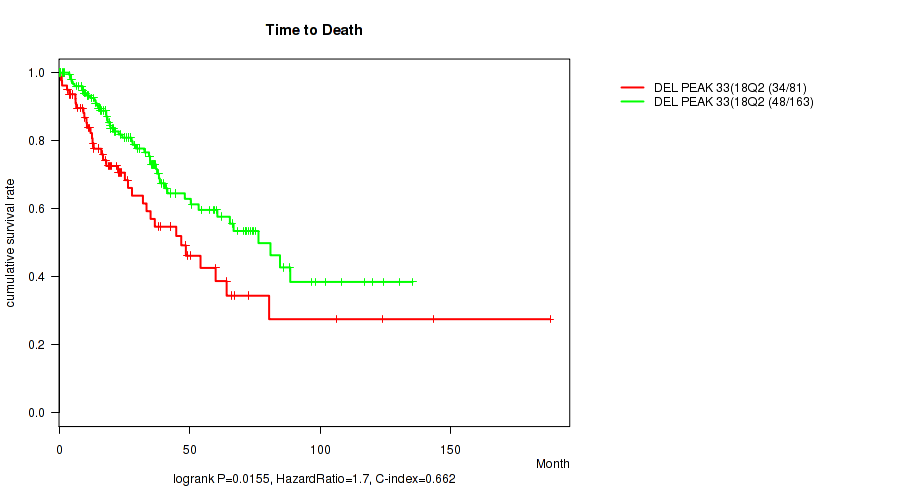
del_18q23 cnv correlated to 'Time to Death' and 'YEARS_TO_BIRTH'.
-
del_19p13.3 cnv correlated to 'GENDER'.
-
del_21q22.3 cnv correlated to 'YEARS_TO_BIRTH'.
-
del_xq21.1 cnv correlated to 'Time to Death' and 'GENDER'.
-
del_xq22.3 cnv correlated to 'Time to Death' and 'GENDER'.
Table 1. Get Full Table Overview of the association between significant copy number variation of 66 focal events and 5 clinical features. Shown in the table are P values (Q values). Thresholded by Q value < 0.25, 68 significant findings detected.
|
Clinical Features |
Time to Death |
YEARS TO BIRTH |
GENDER | RACE | ETHNICITY | ||
| nCNV (%) | nWild-Type | logrank test | Wilcoxon-test | Fisher's exact test | Fisher's exact test | Fisher's exact test | |
| amp 12q15 | 92 (37%) | 154 |
0.0197 (0.143) |
0.0101 (0.108) |
0.000563 (0.0223) |
0.013 (0.122) |
1 (1.00) |
| amp 20q13 33 | 96 (39%) | 150 |
0.0242 (0.154) |
0.000555 (0.0223) |
0.0133 (0.122) |
1 (1.00) |
1 (1.00) |
| amp 1p32 1 | 91 (37%) | 155 |
0.000391 (0.0223) |
0.000348 (0.0223) |
0.145 (0.457) |
0.136 (0.445) |
0.159 (0.46) |
| amp 5p15 33 | 114 (46%) | 132 |
0.0313 (0.178) |
0.00296 (0.061) |
0.201 (0.54) |
0.94 (1.00) |
1 (1.00) |
| amp 8p11 22 | 78 (32%) | 168 |
0.00675 (0.0857) |
0.00107 (0.0294) |
1 (1.00) |
0.112 (0.406) |
1 (1.00) |
| amp 11q22 2 | 35 (14%) | 211 |
0.00594 (0.0857) |
0.0108 (0.108) |
0.855 (1.00) |
0.308 (0.668) |
0.498 (0.787) |
| amp 17q24 3 | 75 (30%) | 171 |
0.539 (0.82) |
0.0459 (0.223) |
0.0373 (0.192) |
0.557 (0.836) |
1 (1.00) |
| del 1p36 32 | 64 (26%) | 182 |
0.0177 (0.138) |
0.131 (0.437) |
0.000763 (0.0229) |
0.674 (0.874) |
0.324 (0.668) |
| del 2p25 3 | 93 (38%) | 153 |
0.577 (0.857) |
0.0701 (0.322) |
0.018 (0.138) |
0.00768 (0.0905) |
0.0703 (0.322) |
| del 2q37 3 | 103 (42%) | 143 |
0.0347 (0.188) |
0.00847 (0.0964) |
1 (1.00) |
0.598 (0.865) |
0.385 (0.697) |
| del 10q23 31 | 133 (54%) | 113 |
0.222 (0.56) |
0.0208 (0.143) |
0.25 (0.592) |
0.0271 (0.162) |
0.163 (0.464) |
| del 12q12 | 53 (22%) | 193 |
0.0205 (0.143) |
0.138 (0.447) |
0.644 (0.868) |
0.0221 (0.144) |
0.586 (0.863) |
| del 18q23 | 82 (33%) | 164 |
0.0155 (0.131) |
0.0037 (0.0642) |
0.498 (0.787) |
1 (1.00) |
0.665 (0.868) |
| del xq21 1 | 111 (45%) | 135 |
0.00606 (0.0857) |
0.134 (0.443) |
0.0206 (0.143) |
0.412 (0.712) |
0.371 (0.695) |
| del xq22 3 | 120 (49%) | 126 |
0.0173 (0.138) |
0.972 (1.00) |
0.0303 (0.175) |
0.655 (0.868) |
0.369 (0.695) |
| amp 1q21 3 | 99 (40%) | 147 |
0.781 (0.954) |
0.0361 (0.192) |
0.0901 (0.362) |
0.94 (1.00) |
0.402 (0.71) |
| amp 2p11 2 | 60 (24%) | 186 |
0.465 (0.764) |
0.000633 (0.0223) |
0.298 (0.668) |
0.143 (0.452) |
1 (1.00) |
| amp 3p12 1 | 67 (27%) | 179 |
0.346 (0.685) |
4.65e-06 (0.000768) |
0.315 (0.668) |
0.797 (0.96) |
0.324 (0.668) |
| amp 4q12 | 75 (30%) | 171 |
0.496 (0.787) |
0.0223 (0.144) |
0.406 (0.712) |
0.557 (0.836) |
1 (1.00) |
| amp 6p21 1 | 58 (24%) | 188 |
0.00707 (0.0864) |
0.0732 (0.323) |
0.369 (0.695) |
0.124 (0.426) |
0.595 (0.865) |
| amp 7q31 2 | 75 (30%) | 171 |
0.125 (0.426) |
1.3e-06 (0.000429) |
1 (1.00) |
1 (1.00) |
0.647 (0.868) |
| amp 8q24 21 | 80 (33%) | 166 |
0.00641 (0.0857) |
0.377 (0.695) |
0.682 (0.88) |
0.171 (0.475) |
0.337 (0.683) |
| amp 13q34 | 51 (21%) | 195 |
0.58 (0.859) |
0.152 (0.46) |
0.0842 (0.347) |
0.0408 (0.201) |
0.591 (0.865) |
| amp 15q26 3 | 81 (33%) | 165 |
0.444 (0.736) |
0.0348 (0.188) |
0.224 (0.56) |
0.619 (0.868) |
0.351 (0.689) |
| amp 17p12 | 97 (39%) | 149 |
0.305 (0.668) |
0.025 (0.156) |
0.896 (1.00) |
0.723 (0.908) |
0.388 (0.699) |
| amp 17p11 2 | 99 (40%) | 147 |
0.323 (0.668) |
0.0276 (0.162) |
0.362 (0.695) |
0.444 (0.736) |
1 (1.00) |
| amp 19q12 | 90 (37%) | 156 |
0.167 (0.471) |
0.000677 (0.0223) |
0.289 (0.662) |
0.774 (0.949) |
0.653 (0.868) |
| amp 21q21 1 | 71 (29%) | 175 |
0.156 (0.46) |
0.0152 (0.131) |
0.0921 (0.362) |
0.622 (0.868) |
0.324 (0.668) |
| amp xq21 1 | 43 (17%) | 203 |
0.0777 (0.329) |
0.0257 (0.157) |
0.4 (0.71) |
0.415 (0.713) |
0.188 (0.513) |
| del 1q44 | 76 (31%) | 170 |
0.251 (0.592) |
0.00638 (0.0857) |
0.89 (1.00) |
0.24 (0.581) |
1 (1.00) |
| del 2q37 3 | 105 (43%) | 141 |
0.153 (0.46) |
0.00256 (0.0563) |
0.699 (0.896) |
0.573 (0.856) |
1 (1.00) |
| del 3q13 31 | 51 (21%) | 195 |
0.228 (0.562) |
0.0172 (0.138) |
0.529 (0.815) |
0.633 (0.868) |
1 (1.00) |
| del 4q35 1 | 91 (37%) | 155 |
0.109 (0.4) |
0.00194 (0.0457) |
0.598 (0.865) |
0.315 (0.668) |
0.159 (0.46) |
| del 9p24 3 | 96 (39%) | 150 |
0.322 (0.668) |
0.00191 (0.0457) |
0.793 (0.96) |
1 (1.00) |
0.651 (0.868) |
| del 9p21 3 | 112 (46%) | 134 |
0.0719 (0.323) |
0.00362 (0.0642) |
0.7 (0.896) |
0.535 (0.82) |
1 (1.00) |
| del 9q34 3 | 60 (24%) | 186 |
0.155 (0.46) |
0.257 (0.598) |
0.458 (0.755) |
0.0368 (0.192) |
1 (1.00) |
| del 10p15 3 | 123 (50%) | 123 |
0.723 (0.908) |
0.04 (0.201) |
0.159 (0.46) |
0.342 (0.685) |
0.192 (0.52) |
| del 10q26 3 | 128 (52%) | 118 |
0.521 (0.811) |
0.00447 (0.0738) |
0.443 (0.736) |
0.122 (0.422) |
0.168 (0.471) |
| del 11p15 5 | 104 (42%) | 142 |
0.38 (0.695) |
0.0102 (0.108) |
0.606 (0.868) |
0.636 (0.868) |
0.379 (0.695) |
| del 11q24 2 | 118 (48%) | 128 |
0.801 (0.961) |
0.0152 (0.131) |
0.609 (0.868) |
1 (1.00) |
0.372 (0.695) |
| del 12p13 1 | 84 (34%) | 162 |
0.61 (0.868) |
0.141 (0.451) |
0.0318 (0.178) |
0.711 (0.9) |
0.663 (0.868) |
| del 12q24 33 | 68 (28%) | 178 |
0.372 (0.695) |
0.00659 (0.0857) |
0.153 (0.46) |
0.393 (0.704) |
0.324 (0.668) |
| del 13q14 2 | 175 (71%) | 71 |
0.756 (0.938) |
0.00326 (0.0633) |
0.0921 (0.362) |
0.42 (0.718) |
0.101 (0.379) |
| del 16q11 2 | 125 (51%) | 121 |
0.774 (0.949) |
0.16 (0.46) |
0.0963 (0.37) |
0.0196 (0.143) |
1 (1.00) |
| del 16q23 1 | 130 (53%) | 116 |
0.226 (0.56) |
0.000632 (0.0223) |
0.0734 (0.323) |
0.241 (0.581) |
0.654 (0.868) |
| del 17p13 1 | 124 (50%) | 122 |
0.116 (0.418) |
0.477 (0.779) |
0.0406 (0.201) |
0.157 (0.46) |
1 (1.00) |
| del 17q11 2 | 78 (32%) | 168 |
0.256 (0.598) |
0.013 (0.122) |
0.493 (0.787) |
0.704 (0.897) |
1 (1.00) |
| del 17q25 3 | 61 (25%) | 185 |
0.104 (0.385) |
0.0215 (0.144) |
0.658 (0.868) |
0.602 (0.868) |
0.332 (0.675) |
| del 19p13 3 | 70 (28%) | 176 |
0.512 (0.801) |
0.707 (0.897) |
0.0105 (0.108) |
0.803 (0.961) |
0.326 (0.668) |
| del 21q22 3 | 65 (26%) | 181 |
0.984 (1.00) |
0.00053 (0.0223) |
0.885 (1.00) |
0.926 (1.00) |
1 (1.00) |
| amp 1q24 3 | 100 (41%) | 146 |
0.345 (0.685) |
0.215 (0.56) |
0.795 (0.96) |
0.523 (0.811) |
1 (1.00) |
| amp 6q25 1 | 73 (30%) | 173 |
0.425 (0.72) |
0.101 (0.379) |
0.0941 (0.365) |
0.867 (1.00) |
0.629 (0.868) |
| amp 19p13 2 | 101 (41%) | 145 |
0.539 (0.82) |
0.297 (0.668) |
0.12 (0.421) |
0.676 (0.874) |
0.651 (0.868) |
| amp xp21 2 | 94 (38%) | 152 |
0.657 (0.868) |
0.0802 (0.335) |
0.36 (0.695) |
0.827 (0.981) |
0.402 (0.71) |
| del 3p21 31 | 64 (26%) | 182 |
0.223 (0.56) |
0.381 (0.695) |
0.885 (1.00) |
0.665 (0.868) |
1 (1.00) |
| del 3q29 | 52 (21%) | 194 |
0.943 (1.00) |
0.767 (0.948) |
0.434 (0.731) |
0.303 (0.668) |
1 (1.00) |
| del 5p15 33 | 33 (13%) | 213 |
0.365 (0.695) |
0.936 (1.00) |
1 (1.00) |
1 (1.00) |
1 (1.00) |
| del 6p25 3 | 76 (31%) | 170 |
0.288 (0.662) |
0.655 (0.868) |
0.89 (1.00) |
0.658 (0.868) |
0.181 (0.499) |
| del 6q14 1 | 75 (30%) | 171 |
0.506 (0.795) |
0.293 (0.667) |
1 (1.00) |
0.813 (0.968) |
1 (1.00) |
| del 7q36 3 | 68 (28%) | 178 |
0.224 (0.56) |
0.496 (0.787) |
0.479 (0.779) |
0.426 (0.72) |
1 (1.00) |
| del 8p23 3 | 78 (32%) | 168 |
0.0907 (0.362) |
0.076 (0.327) |
0.493 (0.787) |
0.646 (0.868) |
1 (1.00) |
| del 14q24 1 | 77 (31%) | 169 |
0.343 (0.685) |
0.88 (1.00) |
0.216 (0.56) |
0.648 (0.868) |
0.325 (0.668) |
| del 19q13 43 | 102 (41%) | 144 |
0.0569 (0.272) |
0.411 (0.712) |
0.3 (0.668) |
0.225 (0.56) |
0.377 (0.695) |
| del 21q11 2 | 48 (20%) | 198 |
0.795 (0.96) |
0.128 (0.433) |
0.748 (0.932) |
0.554 (0.836) |
0.249 (0.592) |
| del 22q13 32 | 79 (32%) | 167 |
0.209 (0.555) |
0.218 (0.56) |
0.0764 (0.327) |
1 (1.00) |
1 (1.00) |
| del xp21 1 | 52 (21%) | 194 |
0.732 (0.914) |
0.0613 (0.289) |
0.12 (0.421) |
0.411 (0.712) |
0.239 (0.581) |
P value = 0.000391 (logrank test), Q value = 0.022
Table S1. Gene #1: 'amp_1p32.1' versus Clinical Feature #1: 'Time to Death'
| nPatients | nDeath | Duration Range (Median), Month | |
|---|---|---|---|
| ALL | 244 | 82 | 0.1 - 188.2 (23.3) |
| AMP PEAK 1(1P32.1) MUTATED | 91 | 39 | 0.5 - 106.5 (19.3) |
| AMP PEAK 1(1P32.1) WILD-TYPE | 153 | 43 | 0.1 - 188.2 (27.8) |
Figure S1. Get High-res Image Gene #1: 'amp_1p32.1' versus Clinical Feature #1: 'Time to Death'
P value = 0.000348 (Wilcoxon-test), Q value = 0.022
Table S2. Gene #1: 'amp_1p32.1' versus Clinical Feature #2: 'YEARS_TO_BIRTH'
| nPatients | Mean (Std.Dev) | |
|---|---|---|
| ALL | 245 | 61.3 (14.5) |
| AMP PEAK 1(1P32.1) MUTATED | 91 | 65.7 (12.9) |
| AMP PEAK 1(1P32.1) WILD-TYPE | 154 | 58.7 (14.8) |
Figure S2. Get High-res Image Gene #1: 'amp_1p32.1' versus Clinical Feature #2: 'YEARS_TO_BIRTH'

P value = 0.0361 (Wilcoxon-test), Q value = 0.19
Table S3. Gene #2: 'amp_1q21.3' versus Clinical Feature #2: 'YEARS_TO_BIRTH'
| nPatients | Mean (Std.Dev) | |
|---|---|---|
| ALL | 245 | 61.3 (14.5) |
| AMP PEAK 2(1Q21.3) MUTATED | 98 | 63.5 (12.6) |
| AMP PEAK 2(1Q21.3) WILD-TYPE | 147 | 59.9 (15.5) |
Figure S3. Get High-res Image Gene #2: 'amp_1q21.3' versus Clinical Feature #2: 'YEARS_TO_BIRTH'

P value = 0.000633 (Wilcoxon-test), Q value = 0.022
Table S4. Gene #4: 'amp_2p11.2' versus Clinical Feature #2: 'YEARS_TO_BIRTH'
| nPatients | Mean (Std.Dev) | |
|---|---|---|
| ALL | 245 | 61.3 (14.5) |
| AMP PEAK 4(2P11.2) MUTATED | 60 | 67.1 (12.2) |
| AMP PEAK 4(2P11.2) WILD-TYPE | 185 | 59.4 (14.7) |
Figure S4. Get High-res Image Gene #4: 'amp_2p11.2' versus Clinical Feature #2: 'YEARS_TO_BIRTH'
P value = 4.65e-06 (Wilcoxon-test), Q value = 0.00077
Table S5. Gene #5: 'amp_3p12.1' versus Clinical Feature #2: 'YEARS_TO_BIRTH'
| nPatients | Mean (Std.Dev) | |
|---|---|---|
| ALL | 245 | 61.3 (14.5) |
| AMP PEAK 5(3P12.1) MUTATED | 66 | 68.2 (13.4) |
| AMP PEAK 5(3P12.1) WILD-TYPE | 179 | 58.8 (14.1) |
Figure S5. Get High-res Image Gene #5: 'amp_3p12.1' versus Clinical Feature #2: 'YEARS_TO_BIRTH'
P value = 0.0223 (Wilcoxon-test), Q value = 0.14
Table S6. Gene #6: 'amp_4q12' versus Clinical Feature #2: 'YEARS_TO_BIRTH'
| nPatients | Mean (Std.Dev) | |
|---|---|---|
| ALL | 245 | 61.3 (14.5) |
| AMP PEAK 6(4Q12) MUTATED | 74 | 64.8 (11.7) |
| AMP PEAK 6(4Q12) WILD-TYPE | 171 | 59.8 (15.3) |
Figure S6. Get High-res Image Gene #6: 'amp_4q12' versus Clinical Feature #2: 'YEARS_TO_BIRTH'

P value = 0.0313 (logrank test), Q value = 0.18
Table S7. Gene #7: 'amp_5p15.33' versus Clinical Feature #1: 'Time to Death'
| nPatients | nDeath | Duration Range (Median), Month | |
|---|---|---|---|
| ALL | 244 | 82 | 0.1 - 188.2 (23.3) |
| AMP PEAK 7(5P15.33) MUTATED | 113 | 44 | 0.1 - 188.2 (20.3) |
| AMP PEAK 7(5P15.33) WILD-TYPE | 131 | 38 | 0.1 - 143.4 (25.1) |
Figure S7. Get High-res Image Gene #7: 'amp_5p15.33' versus Clinical Feature #1: 'Time to Death'
P value = 0.00296 (Wilcoxon-test), Q value = 0.061
Table S8. Gene #7: 'amp_5p15.33' versus Clinical Feature #2: 'YEARS_TO_BIRTH'
| nPatients | Mean (Std.Dev) | |
|---|---|---|
| ALL | 245 | 61.3 (14.5) |
| AMP PEAK 7(5P15.33) MUTATED | 113 | 64.3 (13.2) |
| AMP PEAK 7(5P15.33) WILD-TYPE | 132 | 58.7 (15.1) |
Figure S8. Get High-res Image Gene #7: 'amp_5p15.33' versus Clinical Feature #2: 'YEARS_TO_BIRTH'

P value = 0.00707 (logrank test), Q value = 0.086
Table S9. Gene #8: 'amp_6p21.1' versus Clinical Feature #1: 'Time to Death'
| nPatients | nDeath | Duration Range (Median), Month | |
|---|---|---|---|
| ALL | 244 | 82 | 0.1 - 188.2 (23.3) |
| AMP PEAK 8(6P21.1) MUTATED | 57 | 26 | 0.1 - 143.4 (19.9) |
| AMP PEAK 8(6P21.1) WILD-TYPE | 187 | 56 | 0.1 - 188.2 (25.1) |
Figure S9. Get High-res Image Gene #8: 'amp_6p21.1' versus Clinical Feature #1: 'Time to Death'
P value = 1.3e-06 (Wilcoxon-test), Q value = 0.00043
Table S10. Gene #10: 'amp_7q31.2' versus Clinical Feature #2: 'YEARS_TO_BIRTH'
| nPatients | Mean (Std.Dev) | |
|---|---|---|
| ALL | 245 | 61.3 (14.5) |
| AMP PEAK 10(7Q31.2) MUTATED | 75 | 67.6 (11.7) |
| AMP PEAK 10(7Q31.2) WILD-TYPE | 170 | 58.5 (14.8) |
Figure S10. Get High-res Image Gene #10: 'amp_7q31.2' versus Clinical Feature #2: 'YEARS_TO_BIRTH'

P value = 0.00675 (logrank test), Q value = 0.086
Table S11. Gene #11: 'amp_8p11.22' versus Clinical Feature #1: 'Time to Death'
| nPatients | nDeath | Duration Range (Median), Month | |
|---|---|---|---|
| ALL | 244 | 82 | 0.1 - 188.2 (23.3) |
| AMP PEAK 11(8P11.22) MUTATED | 78 | 34 | 0.1 - 106.5 (19.5) |
| AMP PEAK 11(8P11.22) WILD-TYPE | 166 | 48 | 0.1 - 188.2 (26.1) |
Figure S11. Get High-res Image Gene #11: 'amp_8p11.22' versus Clinical Feature #1: 'Time to Death'
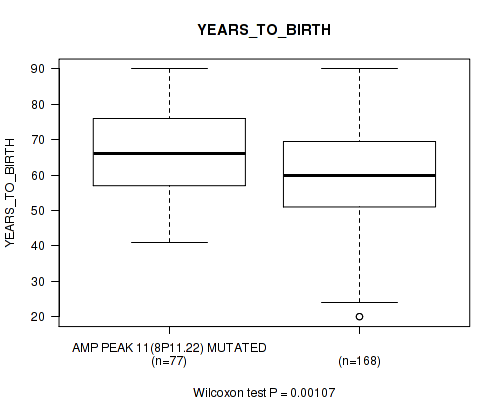
P value = 0.00107 (Wilcoxon-test), Q value = 0.029
Table S12. Gene #11: 'amp_8p11.22' versus Clinical Feature #2: 'YEARS_TO_BIRTH'
| nPatients | Mean (Std.Dev) | |
|---|---|---|
| ALL | 245 | 61.3 (14.5) |
| AMP PEAK 11(8P11.22) MUTATED | 77 | 66.1 (12.0) |
| AMP PEAK 11(8P11.22) WILD-TYPE | 168 | 59.1 (15.0) |
Figure S12. Get High-res Image Gene #11: 'amp_8p11.22' versus Clinical Feature #2: 'YEARS_TO_BIRTH'
P value = 0.00641 (logrank test), Q value = 0.086
Table S13. Gene #12: 'amp_8q24.21' versus Clinical Feature #1: 'Time to Death'
| nPatients | nDeath | Duration Range (Median), Month | |
|---|---|---|---|
| ALL | 244 | 82 | 0.1 - 188.2 (23.3) |
| AMP PEAK 12(8Q24.21) MUTATED | 79 | 31 | 0.1 - 88.3 (16.9) |
| AMP PEAK 12(8Q24.21) WILD-TYPE | 165 | 51 | 0.1 - 188.2 (27.8) |
Figure S13. Get High-res Image Gene #12: 'amp_8q24.21' versus Clinical Feature #1: 'Time to Death'
P value = 0.00594 (logrank test), Q value = 0.086
Table S14. Gene #13: 'amp_11q22.2' versus Clinical Feature #1: 'Time to Death'
| nPatients | nDeath | Duration Range (Median), Month | |
|---|---|---|---|
| ALL | 244 | 82 | 0.1 - 188.2 (23.3) |
| AMP PEAK 13(11Q22.2) MUTATED | 34 | 17 | 0.1 - 106.5 (18.7) |
| AMP PEAK 13(11Q22.2) WILD-TYPE | 210 | 65 | 0.1 - 188.2 (25.2) |
Figure S14. Get High-res Image Gene #13: 'amp_11q22.2' versus Clinical Feature #1: 'Time to Death'
P value = 0.0108 (Wilcoxon-test), Q value = 0.11
Table S15. Gene #13: 'amp_11q22.2' versus Clinical Feature #2: 'YEARS_TO_BIRTH'
| nPatients | Mean (Std.Dev) | |
|---|---|---|
| ALL | 245 | 61.3 (14.5) |
| AMP PEAK 13(11Q22.2) MUTATED | 35 | 66.7 (14.5) |
| AMP PEAK 13(11Q22.2) WILD-TYPE | 210 | 60.4 (14.3) |
Figure S15. Get High-res Image Gene #13: 'amp_11q22.2' versus Clinical Feature #2: 'YEARS_TO_BIRTH'
P value = 0.0197 (logrank test), Q value = 0.14
Table S16. Gene #14: 'amp_12q15' versus Clinical Feature #1: 'Time to Death'
| nPatients | nDeath | Duration Range (Median), Month | |
|---|---|---|---|
| ALL | 244 | 82 | 0.1 - 188.2 (23.3) |
| AMP PEAK 14(12Q15) MUTATED | 91 | 38 | 0.1 - 108.1 (20.1) |
| AMP PEAK 14(12Q15) WILD-TYPE | 153 | 44 | 0.1 - 188.2 (25.1) |
Figure S16. Get High-res Image Gene #14: 'amp_12q15' versus Clinical Feature #1: 'Time to Death'
P value = 0.0101 (Wilcoxon-test), Q value = 0.11
Table S17. Gene #14: 'amp_12q15' versus Clinical Feature #2: 'YEARS_TO_BIRTH'
| nPatients | Mean (Std.Dev) | |
|---|---|---|
| ALL | 245 | 61.3 (14.5) |
| AMP PEAK 14(12Q15) MUTATED | 92 | 64.3 (13.5) |
| AMP PEAK 14(12Q15) WILD-TYPE | 153 | 59.5 (14.8) |
Figure S17. Get High-res Image Gene #14: 'amp_12q15' versus Clinical Feature #2: 'YEARS_TO_BIRTH'

P value = 0.000563 (Fisher's exact test), Q value = 0.022
Table S18. Gene #14: 'amp_12q15' versus Clinical Feature #3: 'GENDER'
| nPatients | FEMALE | MALE |
|---|---|---|
| ALL | 132 | 114 |
| AMP PEAK 14(12Q15) MUTATED | 36 | 56 |
| AMP PEAK 14(12Q15) WILD-TYPE | 96 | 58 |
Figure S18. Get High-res Image Gene #14: 'amp_12q15' versus Clinical Feature #3: 'GENDER'
P value = 0.013 (Fisher's exact test), Q value = 0.12
Table S19. Gene #14: 'amp_12q15' versus Clinical Feature #4: 'RACE'
| nPatients | ASIAN | BLACK OR AFRICAN AMERICAN | WHITE |
|---|---|---|---|
| ALL | 6 | 18 | 194 |
| AMP PEAK 14(12Q15) MUTATED | 3 | 1 | 66 |
| AMP PEAK 14(12Q15) WILD-TYPE | 3 | 17 | 128 |
Figure S19. Get High-res Image Gene #14: 'amp_12q15' versus Clinical Feature #4: 'RACE'
P value = 0.0408 (Fisher's exact test), Q value = 0.2
Table S20. Gene #15: 'amp_13q34' versus Clinical Feature #4: 'RACE'
| nPatients | ASIAN | BLACK OR AFRICAN AMERICAN | WHITE |
|---|---|---|---|
| ALL | 6 | 18 | 194 |
| AMP PEAK 15(13Q34) MUTATED | 0 | 8 | 41 |
| AMP PEAK 15(13Q34) WILD-TYPE | 6 | 10 | 153 |
Figure S20. Get High-res Image Gene #15: 'amp_13q34' versus Clinical Feature #4: 'RACE'
P value = 0.0348 (Wilcoxon-test), Q value = 0.19
Table S21. Gene #16: 'amp_15q26.3' versus Clinical Feature #2: 'YEARS_TO_BIRTH'
| nPatients | Mean (Std.Dev) | |
|---|---|---|
| ALL | 245 | 61.3 (14.5) |
| AMP PEAK 16(15Q26.3) MUTATED | 80 | 63.7 (14.7) |
| AMP PEAK 16(15Q26.3) WILD-TYPE | 165 | 60.2 (14.3) |
Figure S21. Get High-res Image Gene #16: 'amp_15q26.3' versus Clinical Feature #2: 'YEARS_TO_BIRTH'
P value = 0.025 (Wilcoxon-test), Q value = 0.16
Table S22. Gene #17: 'amp_17p12' versus Clinical Feature #2: 'YEARS_TO_BIRTH'
| nPatients | Mean (Std.Dev) | |
|---|---|---|
| ALL | 245 | 61.3 (14.5) |
| AMP PEAK 17(17P12) MUTATED | 96 | 64.0 (13.9) |
| AMP PEAK 17(17P12) WILD-TYPE | 149 | 59.6 (14.7) |
Figure S22. Get High-res Image Gene #17: 'amp_17p12' versus Clinical Feature #2: 'YEARS_TO_BIRTH'

P value = 0.0276 (Wilcoxon-test), Q value = 0.16
Table S23. Gene #18: 'amp_17p11.2' versus Clinical Feature #2: 'YEARS_TO_BIRTH'
| nPatients | Mean (Std.Dev) | |
|---|---|---|
| ALL | 245 | 61.3 (14.5) |
| AMP PEAK 18(17P11.2) MUTATED | 98 | 63.8 (13.9) |
| AMP PEAK 18(17P11.2) WILD-TYPE | 147 | 59.6 (14.7) |
Figure S23. Get High-res Image Gene #18: 'amp_17p11.2' versus Clinical Feature #2: 'YEARS_TO_BIRTH'

P value = 0.0459 (Wilcoxon-test), Q value = 0.22
Table S24. Gene #19: 'amp_17q24.3' versus Clinical Feature #2: 'YEARS_TO_BIRTH'
| nPatients | Mean (Std.Dev) | |
|---|---|---|
| ALL | 245 | 61.3 (14.5) |
| AMP PEAK 19(17Q24.3) MUTATED | 74 | 64.1 (14.2) |
| AMP PEAK 19(17Q24.3) WILD-TYPE | 171 | 60.1 (14.5) |
Figure S24. Get High-res Image Gene #19: 'amp_17q24.3' versus Clinical Feature #2: 'YEARS_TO_BIRTH'
P value = 0.0373 (Fisher's exact test), Q value = 0.19
Table S25. Gene #19: 'amp_17q24.3' versus Clinical Feature #3: 'GENDER'
| nPatients | FEMALE | MALE |
|---|---|---|
| ALL | 132 | 114 |
| AMP PEAK 19(17Q24.3) MUTATED | 48 | 27 |
| AMP PEAK 19(17Q24.3) WILD-TYPE | 84 | 87 |
Figure S25. Get High-res Image Gene #19: 'amp_17q24.3' versus Clinical Feature #3: 'GENDER'
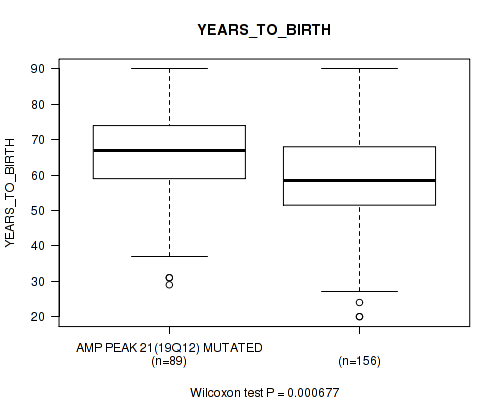
P value = 0.000677 (Wilcoxon-test), Q value = 0.022
Table S26. Gene #21: 'amp_19q12' versus Clinical Feature #2: 'YEARS_TO_BIRTH'
| nPatients | Mean (Std.Dev) | |
|---|---|---|
| ALL | 245 | 61.3 (14.5) |
| AMP PEAK 21(19Q12) MUTATED | 89 | 65.0 (13.0) |
| AMP PEAK 21(19Q12) WILD-TYPE | 156 | 59.2 (14.9) |
Figure S26. Get High-res Image Gene #21: 'amp_19q12' versus Clinical Feature #2: 'YEARS_TO_BIRTH'
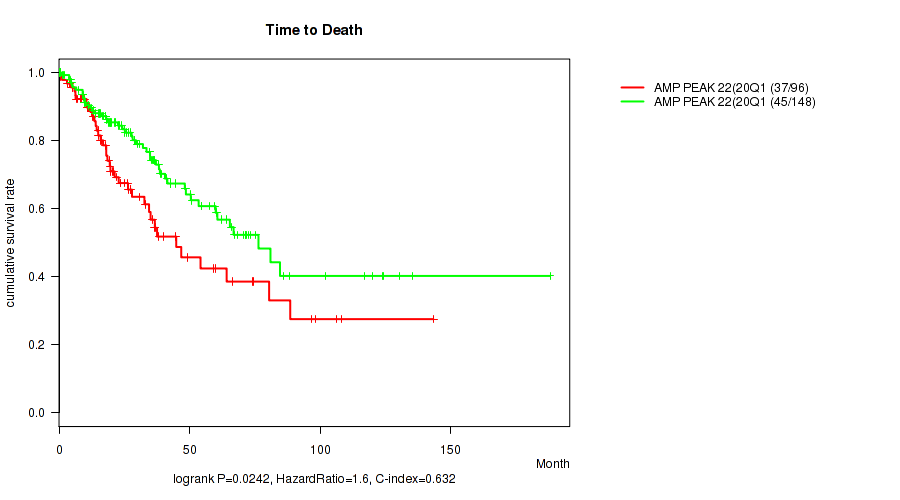
P value = 0.0242 (logrank test), Q value = 0.15
Table S27. Gene #22: 'amp_20q13.33' versus Clinical Feature #1: 'Time to Death'
| nPatients | nDeath | Duration Range (Median), Month | |
|---|---|---|---|
| ALL | 244 | 82 | 0.1 - 188.2 (23.3) |
| AMP PEAK 22(20Q13.33) MUTATED | 96 | 37 | 0.1 - 143.4 (19.3) |
| AMP PEAK 22(20Q13.33) WILD-TYPE | 148 | 45 | 0.1 - 188.2 (28.0) |
Figure S27. Get High-res Image Gene #22: 'amp_20q13.33' versus Clinical Feature #1: 'Time to Death'
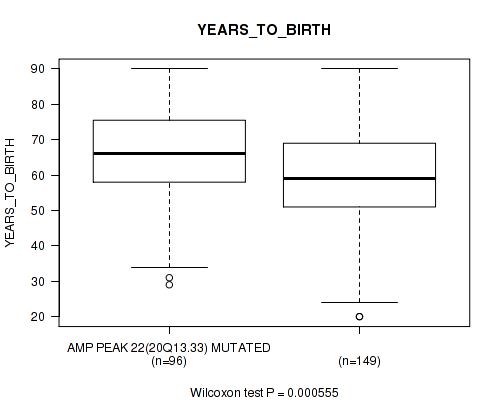
P value = 0.000555 (Wilcoxon-test), Q value = 0.022
Table S28. Gene #22: 'amp_20q13.33' versus Clinical Feature #2: 'YEARS_TO_BIRTH'
| nPatients | Mean (Std.Dev) | |
|---|---|---|
| ALL | 245 | 61.3 (14.5) |
| AMP PEAK 22(20Q13.33) MUTATED | 96 | 65.3 (13.5) |
| AMP PEAK 22(20Q13.33) WILD-TYPE | 149 | 58.8 (14.6) |
Figure S28. Get High-res Image Gene #22: 'amp_20q13.33' versus Clinical Feature #2: 'YEARS_TO_BIRTH'
P value = 0.0133 (Fisher's exact test), Q value = 0.12
Table S29. Gene #22: 'amp_20q13.33' versus Clinical Feature #3: 'GENDER'
| nPatients | FEMALE | MALE |
|---|---|---|
| ALL | 132 | 114 |
| AMP PEAK 22(20Q13.33) MUTATED | 42 | 54 |
| AMP PEAK 22(20Q13.33) WILD-TYPE | 90 | 60 |
Figure S29. Get High-res Image Gene #22: 'amp_20q13.33' versus Clinical Feature #3: 'GENDER'
P value = 0.0152 (Wilcoxon-test), Q value = 0.13
Table S30. Gene #23: 'amp_21q21.1' versus Clinical Feature #2: 'YEARS_TO_BIRTH'
| nPatients | Mean (Std.Dev) | |
|---|---|---|
| ALL | 245 | 61.3 (14.5) |
| AMP PEAK 23(21Q21.1) MUTATED | 70 | 64.8 (11.8) |
| AMP PEAK 23(21Q21.1) WILD-TYPE | 175 | 59.9 (15.2) |
Figure S30. Get High-res Image Gene #23: 'amp_21q21.1' versus Clinical Feature #2: 'YEARS_TO_BIRTH'
P value = 0.0257 (Wilcoxon-test), Q value = 0.16
Table S31. Gene #25: 'amp_xq21.1' versus Clinical Feature #2: 'YEARS_TO_BIRTH'
| nPatients | Mean (Std.Dev) | |
|---|---|---|
| ALL | 245 | 61.3 (14.5) |
| AMP PEAK 25(XQ21.1) MUTATED | 43 | 65.7 (11.1) |
| AMP PEAK 25(XQ21.1) WILD-TYPE | 202 | 60.4 (15.0) |
Figure S31. Get High-res Image Gene #25: 'amp_xq21.1' versus Clinical Feature #2: 'YEARS_TO_BIRTH'
P value = 0.0177 (logrank test), Q value = 0.14
Table S32. Gene #26: 'del_1p36.32' versus Clinical Feature #1: 'Time to Death'
| nPatients | nDeath | Duration Range (Median), Month | |
|---|---|---|---|
| ALL | 244 | 82 | 0.1 - 188.2 (23.3) |
| DEL PEAK 1(1P36.32) MUTATED | 64 | 17 | 0.1 - 188.2 (26.9) |
| DEL PEAK 1(1P36.32) WILD-TYPE | 180 | 65 | 0.1 - 135.5 (20.0) |
Figure S32. Get High-res Image Gene #26: 'del_1p36.32' versus Clinical Feature #1: 'Time to Death'
P value = 0.000763 (Fisher's exact test), Q value = 0.023
Table S33. Gene #26: 'del_1p36.32' versus Clinical Feature #3: 'GENDER'
| nPatients | FEMALE | MALE |
|---|---|---|
| ALL | 132 | 114 |
| DEL PEAK 1(1P36.32) MUTATED | 46 | 18 |
| DEL PEAK 1(1P36.32) WILD-TYPE | 86 | 96 |
Figure S33. Get High-res Image Gene #26: 'del_1p36.32' versus Clinical Feature #3: 'GENDER'
P value = 0.00638 (Wilcoxon-test), Q value = 0.086
Table S34. Gene #27: 'del_1q44' versus Clinical Feature #2: 'YEARS_TO_BIRTH'
| nPatients | Mean (Std.Dev) | |
|---|---|---|
| ALL | 245 | 61.3 (14.5) |
| DEL PEAK 2(1Q44) MUTATED | 76 | 65.0 (13.8) |
| DEL PEAK 2(1Q44) WILD-TYPE | 169 | 59.6 (14.5) |
Figure S34. Get High-res Image Gene #27: 'del_1q44' versus Clinical Feature #2: 'YEARS_TO_BIRTH'
P value = 0.018 (Fisher's exact test), Q value = 0.14
Table S35. Gene #28: 'del_2p25.3' versus Clinical Feature #3: 'GENDER'
| nPatients | FEMALE | MALE |
|---|---|---|
| ALL | 132 | 114 |
| DEL PEAK 3(2P25.3) MUTATED | 59 | 34 |
| DEL PEAK 3(2P25.3) WILD-TYPE | 73 | 80 |
Figure S35. Get High-res Image Gene #28: 'del_2p25.3' versus Clinical Feature #3: 'GENDER'
P value = 0.00768 (Fisher's exact test), Q value = 0.091
Table S36. Gene #28: 'del_2p25.3' versus Clinical Feature #4: 'RACE'
| nPatients | ASIAN | BLACK OR AFRICAN AMERICAN | WHITE |
|---|---|---|---|
| ALL | 6 | 18 | 194 |
| DEL PEAK 3(2P25.3) MUTATED | 1 | 13 | 73 |
| DEL PEAK 3(2P25.3) WILD-TYPE | 5 | 5 | 121 |
Figure S36. Get High-res Image Gene #28: 'del_2p25.3' versus Clinical Feature #4: 'RACE'
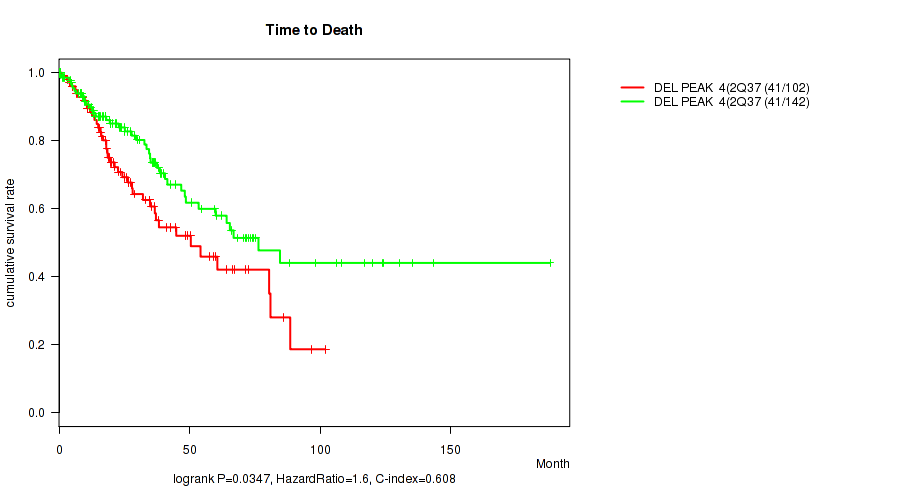
P value = 0.0347 (logrank test), Q value = 0.19
Table S37. Gene #29: 'del_2q37.3' versus Clinical Feature #1: 'Time to Death'
| nPatients | nDeath | Duration Range (Median), Month | |
|---|---|---|---|
| ALL | 244 | 82 | 0.1 - 188.2 (23.3) |
| DEL PEAK 4(2Q37.3) MUTATED | 102 | 41 | 0.1 - 102.0 (21.3) |
| DEL PEAK 4(2Q37.3) WILD-TYPE | 142 | 41 | 0.1 - 188.2 (25.2) |
Figure S37. Get High-res Image Gene #29: 'del_2q37.3' versus Clinical Feature #1: 'Time to Death'
P value = 0.00847 (Wilcoxon-test), Q value = 0.096
Table S38. Gene #29: 'del_2q37.3' versus Clinical Feature #2: 'YEARS_TO_BIRTH'
| nPatients | Mean (Std.Dev) | |
|---|---|---|
| ALL | 245 | 61.3 (14.5) |
| DEL PEAK 4(2Q37.3) MUTATED | 102 | 64.2 (13.9) |
| DEL PEAK 4(2Q37.3) WILD-TYPE | 143 | 59.3 (14.6) |
Figure S38. Get High-res Image Gene #29: 'del_2q37.3' versus Clinical Feature #2: 'YEARS_TO_BIRTH'

P value = 0.00256 (Wilcoxon-test), Q value = 0.056
Table S39. Gene #30: 'del_2q37.3' versus Clinical Feature #2: 'YEARS_TO_BIRTH'
| nPatients | Mean (Std.Dev) | |
|---|---|---|
| ALL | 245 | 61.3 (14.5) |
| DEL PEAK 5(2Q37.3) MUTATED | 104 | 64.5 (13.9) |
| DEL PEAK 5(2Q37.3) WILD-TYPE | 141 | 59.0 (14.5) |
Figure S39. Get High-res Image Gene #30: 'del_2q37.3' versus Clinical Feature #2: 'YEARS_TO_BIRTH'

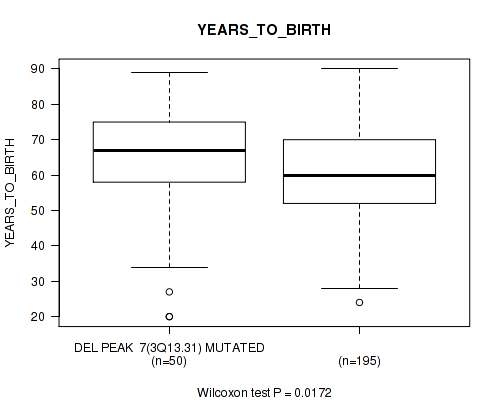
P value = 0.0172 (Wilcoxon-test), Q value = 0.14
Table S40. Gene #32: 'del_3q13.31' versus Clinical Feature #2: 'YEARS_TO_BIRTH'
| nPatients | Mean (Std.Dev) | |
|---|---|---|
| ALL | 245 | 61.3 (14.5) |
| DEL PEAK 7(3Q13.31) MUTATED | 50 | 64.7 (16.0) |
| DEL PEAK 7(3Q13.31) WILD-TYPE | 195 | 60.4 (14.0) |
Figure S40. Get High-res Image Gene #32: 'del_3q13.31' versus Clinical Feature #2: 'YEARS_TO_BIRTH'
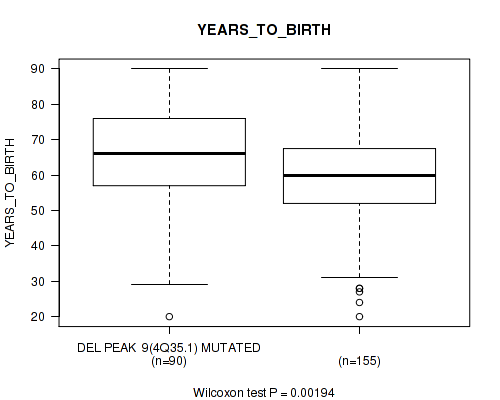
P value = 0.00194 (Wilcoxon-test), Q value = 0.046
Table S41. Gene #34: 'del_4q35.1' versus Clinical Feature #2: 'YEARS_TO_BIRTH'
| nPatients | Mean (Std.Dev) | |
|---|---|---|
| ALL | 245 | 61.3 (14.5) |
| DEL PEAK 9(4Q35.1) MUTATED | 90 | 64.8 (15.0) |
| DEL PEAK 9(4Q35.1) WILD-TYPE | 155 | 59.3 (13.8) |
Figure S41. Get High-res Image Gene #34: 'del_4q35.1' versus Clinical Feature #2: 'YEARS_TO_BIRTH'
P value = 0.00191 (Wilcoxon-test), Q value = 0.046
Table S42. Gene #40: 'del_9p24.3' versus Clinical Feature #2: 'YEARS_TO_BIRTH'
| nPatients | Mean (Std.Dev) | |
|---|---|---|
| ALL | 245 | 61.3 (14.5) |
| DEL PEAK 15(9P24.3) MUTATED | 96 | 65.0 (12.8) |
| DEL PEAK 15(9P24.3) WILD-TYPE | 149 | 58.9 (15.0) |
Figure S42. Get High-res Image Gene #40: 'del_9p24.3' versus Clinical Feature #2: 'YEARS_TO_BIRTH'

P value = 0.00362 (Wilcoxon-test), Q value = 0.064
Table S43. Gene #41: 'del_9p21.3' versus Clinical Feature #2: 'YEARS_TO_BIRTH'
| nPatients | Mean (Std.Dev) | |
|---|---|---|
| ALL | 245 | 61.3 (14.5) |
| DEL PEAK 16(9P21.3) MUTATED | 112 | 64.3 (13.3) |
| DEL PEAK 16(9P21.3) WILD-TYPE | 133 | 58.8 (15.0) |
Figure S43. Get High-res Image Gene #41: 'del_9p21.3' versus Clinical Feature #2: 'YEARS_TO_BIRTH'

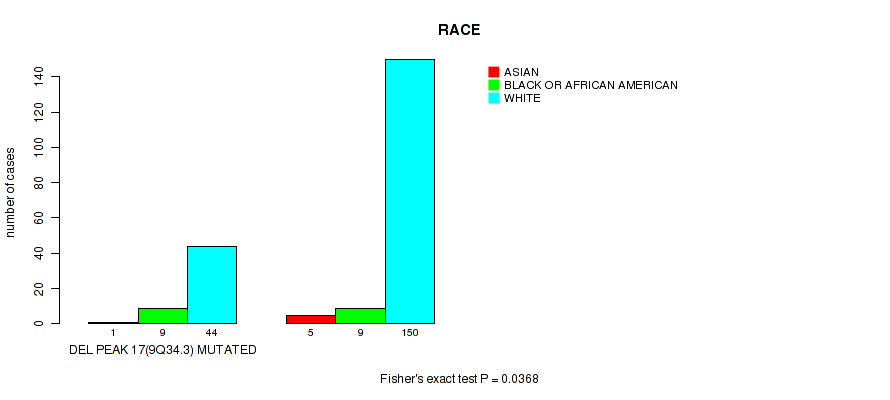
P value = 0.0368 (Fisher's exact test), Q value = 0.19
Table S44. Gene #42: 'del_9q34.3' versus Clinical Feature #4: 'RACE'
| nPatients | ASIAN | BLACK OR AFRICAN AMERICAN | WHITE |
|---|---|---|---|
| ALL | 6 | 18 | 194 |
| DEL PEAK 17(9Q34.3) MUTATED | 1 | 9 | 44 |
| DEL PEAK 17(9Q34.3) WILD-TYPE | 5 | 9 | 150 |
Figure S44. Get High-res Image Gene #42: 'del_9q34.3' versus Clinical Feature #4: 'RACE'
P value = 0.04 (Wilcoxon-test), Q value = 0.2
Table S45. Gene #43: 'del_10p15.3' versus Clinical Feature #2: 'YEARS_TO_BIRTH'
| nPatients | Mean (Std.Dev) | |
|---|---|---|
| ALL | 245 | 61.3 (14.5) |
| DEL PEAK 18(10P15.3) MUTATED | 122 | 63.0 (14.0) |
| DEL PEAK 18(10P15.3) WILD-TYPE | 123 | 59.6 (14.8) |
Figure S45. Get High-res Image Gene #43: 'del_10p15.3' versus Clinical Feature #2: 'YEARS_TO_BIRTH'
P value = 0.0208 (Wilcoxon-test), Q value = 0.14
Table S46. Gene #44: 'del_10q23.31' versus Clinical Feature #2: 'YEARS_TO_BIRTH'
| nPatients | Mean (Std.Dev) | |
|---|---|---|
| ALL | 245 | 61.3 (14.5) |
| DEL PEAK 19(10Q23.31) MUTATED | 133 | 63.4 (13.0) |
| DEL PEAK 19(10Q23.31) WILD-TYPE | 112 | 58.8 (15.8) |
Figure S46. Get High-res Image Gene #44: 'del_10q23.31' versus Clinical Feature #2: 'YEARS_TO_BIRTH'
P value = 0.0271 (Fisher's exact test), Q value = 0.16
Table S47. Gene #44: 'del_10q23.31' versus Clinical Feature #4: 'RACE'
| nPatients | ASIAN | BLACK OR AFRICAN AMERICAN | WHITE |
|---|---|---|---|
| ALL | 6 | 18 | 194 |
| DEL PEAK 19(10Q23.31) MUTATED | 2 | 15 | 107 |
| DEL PEAK 19(10Q23.31) WILD-TYPE | 4 | 3 | 87 |
Figure S47. Get High-res Image Gene #44: 'del_10q23.31' versus Clinical Feature #4: 'RACE'
P value = 0.00447 (Wilcoxon-test), Q value = 0.074
Table S48. Gene #45: 'del_10q26.3' versus Clinical Feature #2: 'YEARS_TO_BIRTH'
| nPatients | Mean (Std.Dev) | |
|---|---|---|
| ALL | 245 | 61.3 (14.5) |
| DEL PEAK 20(10Q26.3) MUTATED | 127 | 64.0 (12.7) |
| DEL PEAK 20(10Q26.3) WILD-TYPE | 118 | 58.4 (15.7) |
Figure S48. Get High-res Image Gene #45: 'del_10q26.3' versus Clinical Feature #2: 'YEARS_TO_BIRTH'

P value = 0.0102 (Wilcoxon-test), Q value = 0.11
Table S49. Gene #46: 'del_11p15.5' versus Clinical Feature #2: 'YEARS_TO_BIRTH'
| nPatients | Mean (Std.Dev) | |
|---|---|---|
| ALL | 245 | 61.3 (14.5) |
| DEL PEAK 21(11P15.5) MUTATED | 103 | 63.8 (14.5) |
| DEL PEAK 21(11P15.5) WILD-TYPE | 142 | 59.5 (14.3) |
Figure S49. Get High-res Image Gene #46: 'del_11p15.5' versus Clinical Feature #2: 'YEARS_TO_BIRTH'
P value = 0.0152 (Wilcoxon-test), Q value = 0.13
Table S50. Gene #47: 'del_11q24.2' versus Clinical Feature #2: 'YEARS_TO_BIRTH'
| nPatients | Mean (Std.Dev) | |
|---|---|---|
| ALL | 245 | 61.3 (14.5) |
| DEL PEAK 22(11Q24.2) MUTATED | 117 | 63.6 (13.6) |
| DEL PEAK 22(11Q24.2) WILD-TYPE | 128 | 59.2 (15.0) |
Figure S50. Get High-res Image Gene #47: 'del_11q24.2' versus Clinical Feature #2: 'YEARS_TO_BIRTH'
P value = 0.0318 (Fisher's exact test), Q value = 0.18
Table S51. Gene #48: 'del_12p13.1' versus Clinical Feature #3: 'GENDER'
| nPatients | FEMALE | MALE |
|---|---|---|
| ALL | 132 | 114 |
| DEL PEAK 23(12P13.1) MUTATED | 37 | 47 |
| DEL PEAK 23(12P13.1) WILD-TYPE | 95 | 67 |
Figure S51. Get High-res Image Gene #48: 'del_12p13.1' versus Clinical Feature #3: 'GENDER'
P value = 0.0205 (logrank test), Q value = 0.14
Table S52. Gene #49: 'del_12q12' versus Clinical Feature #1: 'Time to Death'
| nPatients | nDeath | Duration Range (Median), Month | |
|---|---|---|---|
| ALL | 244 | 82 | 0.1 - 188.2 (23.3) |
| DEL PEAK 24(12Q12) MUTATED | 53 | 23 | 0.1 - 86.1 (21.3) |
| DEL PEAK 24(12Q12) WILD-TYPE | 191 | 59 | 0.1 - 188.2 (24.3) |
Figure S52. Get High-res Image Gene #49: 'del_12q12' versus Clinical Feature #1: 'Time to Death'
P value = 0.0221 (Fisher's exact test), Q value = 0.14
Table S53. Gene #49: 'del_12q12' versus Clinical Feature #4: 'RACE'
| nPatients | ASIAN | BLACK OR AFRICAN AMERICAN | WHITE |
|---|---|---|---|
| ALL | 6 | 18 | 194 |
| DEL PEAK 24(12Q12) MUTATED | 0 | 8 | 36 |
| DEL PEAK 24(12Q12) WILD-TYPE | 6 | 10 | 158 |
Figure S53. Get High-res Image Gene #49: 'del_12q12' versus Clinical Feature #4: 'RACE'
P value = 0.00659 (Wilcoxon-test), Q value = 0.086
Table S54. Gene #50: 'del_12q24.33' versus Clinical Feature #2: 'YEARS_TO_BIRTH'
| nPatients | Mean (Std.Dev) | |
|---|---|---|
| ALL | 245 | 61.3 (14.5) |
| DEL PEAK 25(12Q24.33) MUTATED | 68 | 65.3 (12.7) |
| DEL PEAK 25(12Q24.33) WILD-TYPE | 177 | 59.8 (14.9) |
Figure S54. Get High-res Image Gene #50: 'del_12q24.33' versus Clinical Feature #2: 'YEARS_TO_BIRTH'
P value = 0.00326 (Wilcoxon-test), Q value = 0.063
Table S55. Gene #51: 'del_13q14.2' versus Clinical Feature #2: 'YEARS_TO_BIRTH'
| nPatients | Mean (Std.Dev) | |
|---|---|---|
| ALL | 245 | 61.3 (14.5) |
| DEL PEAK 26(13Q14.2) MUTATED | 174 | 63.1 (13.5) |
| DEL PEAK 26(13Q14.2) WILD-TYPE | 71 | 56.9 (15.9) |
Figure S55. Get High-res Image Gene #51: 'del_13q14.2' versus Clinical Feature #2: 'YEARS_TO_BIRTH'
P value = 0.0196 (Fisher's exact test), Q value = 0.14
Table S56. Gene #53: 'del_16q11.2' versus Clinical Feature #4: 'RACE'
| nPatients | ASIAN | BLACK OR AFRICAN AMERICAN | WHITE |
|---|---|---|---|
| ALL | 6 | 18 | 194 |
| DEL PEAK 28(16Q11.2) MUTATED | 1 | 14 | 101 |
| DEL PEAK 28(16Q11.2) WILD-TYPE | 5 | 4 | 93 |
Figure S56. Get High-res Image Gene #53: 'del_16q11.2' versus Clinical Feature #4: 'RACE'
P value = 0.000632 (Wilcoxon-test), Q value = 0.022
Table S57. Gene #54: 'del_16q23.1' versus Clinical Feature #2: 'YEARS_TO_BIRTH'
| nPatients | Mean (Std.Dev) | |
|---|---|---|
| ALL | 245 | 61.3 (14.5) |
| DEL PEAK 29(16Q23.1) MUTATED | 129 | 64.3 (13.6) |
| DEL PEAK 29(16Q23.1) WILD-TYPE | 116 | 58.0 (14.7) |
Figure S57. Get High-res Image Gene #54: 'del_16q23.1' versus Clinical Feature #2: 'YEARS_TO_BIRTH'
P value = 0.0406 (Fisher's exact test), Q value = 0.2
Table S58. Gene #55: 'del_17p13.1' versus Clinical Feature #3: 'GENDER'
| nPatients | FEMALE | MALE |
|---|---|---|
| ALL | 132 | 114 |
| DEL PEAK 30(17P13.1) MUTATED | 75 | 49 |
| DEL PEAK 30(17P13.1) WILD-TYPE | 57 | 65 |
Figure S58. Get High-res Image Gene #55: 'del_17p13.1' versus Clinical Feature #3: 'GENDER'
P value = 0.013 (Wilcoxon-test), Q value = 0.12
Table S59. Gene #56: 'del_17q11.2' versus Clinical Feature #2: 'YEARS_TO_BIRTH'
| nPatients | Mean (Std.Dev) | |
|---|---|---|
| ALL | 245 | 61.3 (14.5) |
| DEL PEAK 31(17Q11.2) MUTATED | 78 | 64.4 (14.7) |
| DEL PEAK 31(17Q11.2) WILD-TYPE | 167 | 59.9 (14.2) |
Figure S59. Get High-res Image Gene #56: 'del_17q11.2' versus Clinical Feature #2: 'YEARS_TO_BIRTH'
P value = 0.0215 (Wilcoxon-test), Q value = 0.14
Table S60. Gene #57: 'del_17q25.3' versus Clinical Feature #2: 'YEARS_TO_BIRTH'
| nPatients | Mean (Std.Dev) | |
|---|---|---|
| ALL | 245 | 61.3 (14.5) |
| DEL PEAK 32(17Q25.3) MUTATED | 60 | 64.6 (13.2) |
| DEL PEAK 32(17Q25.3) WILD-TYPE | 185 | 60.2 (14.8) |
Figure S60. Get High-res Image Gene #57: 'del_17q25.3' versus Clinical Feature #2: 'YEARS_TO_BIRTH'
P value = 0.0155 (logrank test), Q value = 0.13
Table S61. Gene #58: 'del_18q23' versus Clinical Feature #1: 'Time to Death'
| nPatients | nDeath | Duration Range (Median), Month | |
|---|---|---|---|
| ALL | 244 | 82 | 0.1 - 188.2 (23.3) |
| DEL PEAK 33(18Q23) MUTATED | 81 | 34 | 0.1 - 188.2 (19.3) |
| DEL PEAK 33(18Q23) WILD-TYPE | 163 | 48 | 0.1 - 135.5 (26.5) |
Figure S61. Get High-res Image Gene #58: 'del_18q23' versus Clinical Feature #1: 'Time to Death'
P value = 0.0037 (Wilcoxon-test), Q value = 0.064
Table S62. Gene #58: 'del_18q23' versus Clinical Feature #2: 'YEARS_TO_BIRTH'
| nPatients | Mean (Std.Dev) | |
|---|---|---|
| ALL | 245 | 61.3 (14.5) |
| DEL PEAK 33(18Q23) MUTATED | 82 | 64.8 (14.4) |
| DEL PEAK 33(18Q23) WILD-TYPE | 163 | 59.5 (14.3) |
Figure S62. Get High-res Image Gene #58: 'del_18q23' versus Clinical Feature #2: 'YEARS_TO_BIRTH'

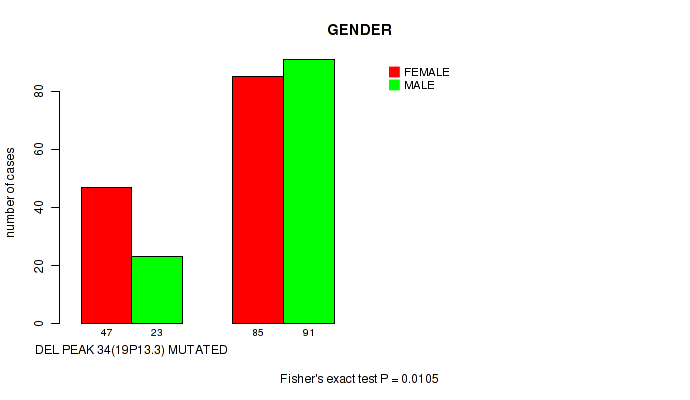
P value = 0.0105 (Fisher's exact test), Q value = 0.11
Table S63. Gene #59: 'del_19p13.3' versus Clinical Feature #3: 'GENDER'
| nPatients | FEMALE | MALE |
|---|---|---|
| ALL | 132 | 114 |
| DEL PEAK 34(19P13.3) MUTATED | 47 | 23 |
| DEL PEAK 34(19P13.3) WILD-TYPE | 85 | 91 |
Figure S63. Get High-res Image Gene #59: 'del_19p13.3' versus Clinical Feature #3: 'GENDER'
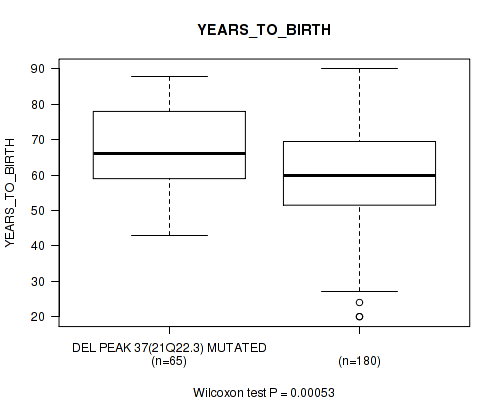
P value = 0.00053 (Wilcoxon-test), Q value = 0.022
Table S64. Gene #62: 'del_21q22.3' versus Clinical Feature #2: 'YEARS_TO_BIRTH'
| nPatients | Mean (Std.Dev) | |
|---|---|---|
| ALL | 245 | 61.3 (14.5) |
| DEL PEAK 37(21Q22.3) MUTATED | 65 | 66.7 (11.4) |
| DEL PEAK 37(21Q22.3) WILD-TYPE | 180 | 59.4 (15.0) |
Figure S64. Get High-res Image Gene #62: 'del_21q22.3' versus Clinical Feature #2: 'YEARS_TO_BIRTH'
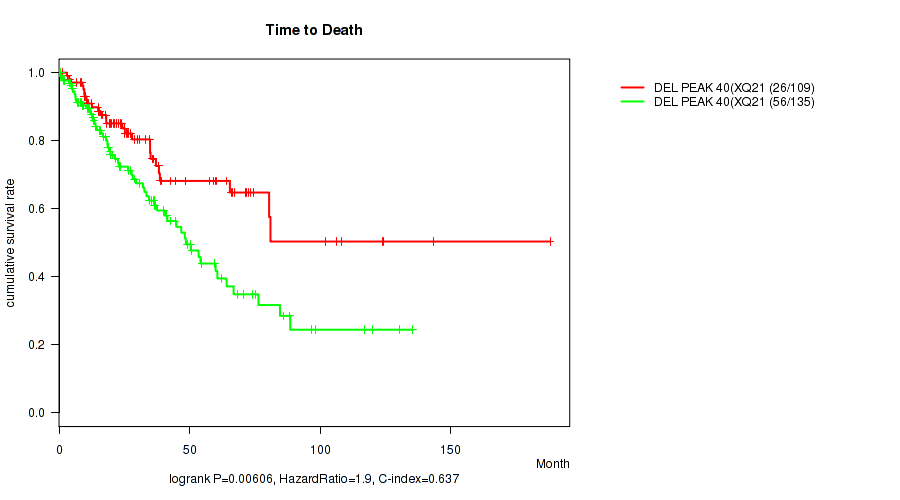
P value = 0.00606 (logrank test), Q value = 0.086
Table S65. Gene #65: 'del_xq21.1' versus Clinical Feature #1: 'Time to Death'
| nPatients | nDeath | Duration Range (Median), Month | |
|---|---|---|---|
| ALL | 244 | 82 | 0.1 - 188.2 (23.3) |
| DEL PEAK 40(XQ21.1) MUTATED | 109 | 26 | 0.1 - 188.2 (25.2) |
| DEL PEAK 40(XQ21.1) WILD-TYPE | 135 | 56 | 0.1 - 135.5 (20.3) |
Figure S65. Get High-res Image Gene #65: 'del_xq21.1' versus Clinical Feature #1: 'Time to Death'
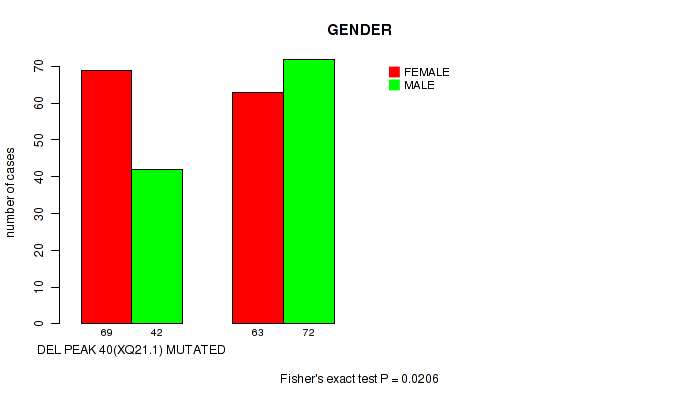
P value = 0.0206 (Fisher's exact test), Q value = 0.14
Table S66. Gene #65: 'del_xq21.1' versus Clinical Feature #3: 'GENDER'
| nPatients | FEMALE | MALE |
|---|---|---|
| ALL | 132 | 114 |
| DEL PEAK 40(XQ21.1) MUTATED | 69 | 42 |
| DEL PEAK 40(XQ21.1) WILD-TYPE | 63 | 72 |
Figure S66. Get High-res Image Gene #65: 'del_xq21.1' versus Clinical Feature #3: 'GENDER'
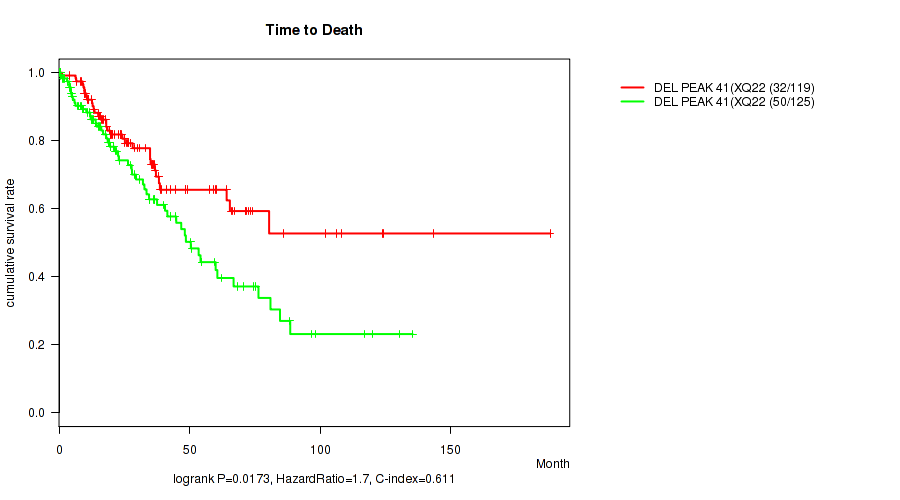
P value = 0.0173 (logrank test), Q value = 0.14
Table S67. Gene #66: 'del_xq22.3' versus Clinical Feature #1: 'Time to Death'
| nPatients | nDeath | Duration Range (Median), Month | |
|---|---|---|---|
| ALL | 244 | 82 | 0.1 - 188.2 (23.3) |
| DEL PEAK 41(XQ22.3) MUTATED | 119 | 32 | 0.1 - 188.2 (25.7) |
| DEL PEAK 41(XQ22.3) WILD-TYPE | 125 | 50 | 0.1 - 135.5 (19.5) |
Figure S67. Get High-res Image Gene #66: 'del_xq22.3' versus Clinical Feature #1: 'Time to Death'
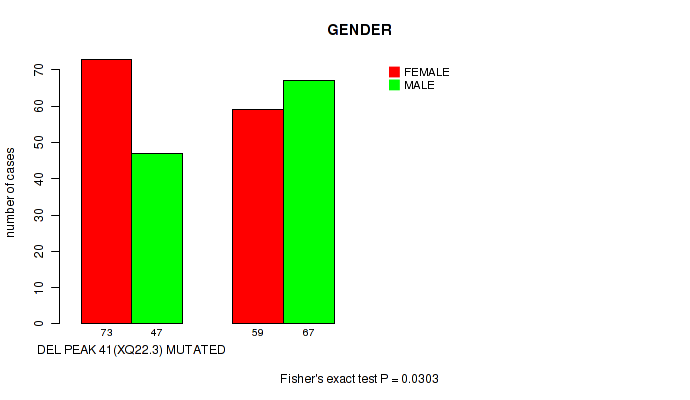
P value = 0.0303 (Fisher's exact test), Q value = 0.18
Table S68. Gene #66: 'del_xq22.3' versus Clinical Feature #3: 'GENDER'
| nPatients | FEMALE | MALE |
|---|---|---|
| ALL | 132 | 114 |
| DEL PEAK 41(XQ22.3) MUTATED | 73 | 47 |
| DEL PEAK 41(XQ22.3) WILD-TYPE | 59 | 67 |
Figure S68. Get High-res Image Gene #66: 'del_xq22.3' versus Clinical Feature #3: 'GENDER'
-
Copy number data file = all_lesions.txt from GISTIC pipeline
-
Processed Copy number data file = /xchip/cga/gdac-prod/tcga-gdac/jobResults/GDAC_Correlate_Genomic_Events_Preprocess/SARC-TP/15098582/transformed.cor.cli.txt
-
Clinical data file = /xchip/cga/gdac-prod/tcga-gdac/jobResults/Append_Data/SARC-TP/15087563/SARC-TP.merged_data.txt
-
Number of patients = 246
-
Number of significantly focal cnvs = 66
-
Number of selected clinical features = 5
-
Exclude genes that fewer than K tumors have mutations, K = 3
For survival clinical features, the Kaplan-Meier survival curves of tumors with and without gene mutations were plotted and the statistical significance P values were estimated by logrank test (Bland and Altman 2004) using the 'survdiff' function in R
For binary or multi-class clinical features (nominal or ordinal), two-tailed Fisher's exact tests (Fisher 1922) were used to estimate the P values using the 'fisher.test' function in R
For multiple hypothesis correction, Q value is the False Discovery Rate (FDR) analogue of the P value (Benjamini and Hochberg 1995), defined as the minimum FDR at which the test may be called significant. We used the 'Benjamini and Hochberg' method of 'p.adjust' function in R to convert P values into Q values.
In addition to the links below, the full results of the analysis summarized in this report can also be downloaded programmatically using firehose_get, or interactively from either the Broad GDAC website or TCGA Data Coordination Center Portal.