This pipeline computes the correlation between cancer subtypes identified by different molecular patterns and selected clinical features.
Testing the association between subtypes identified by 10 different clustering approaches and 5 clinical features across 250 patients, 19 significant findings detected with P value < 0.05 and Q value < 0.25.
-
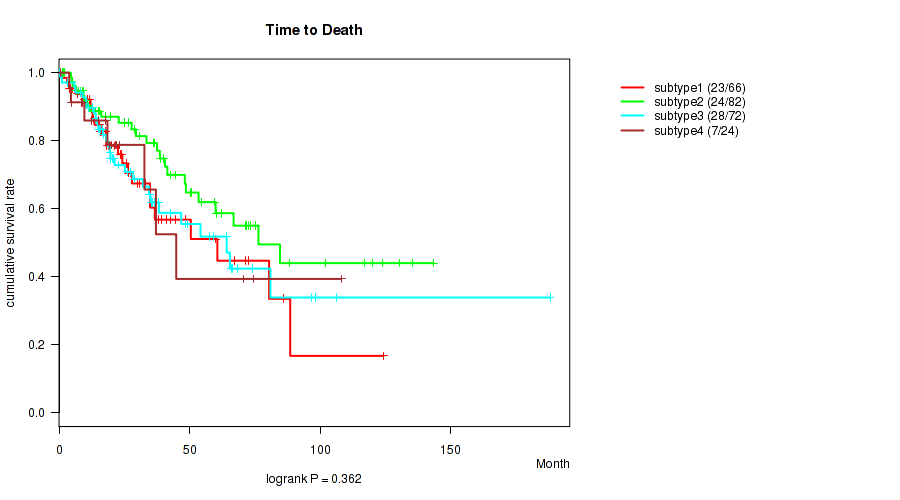
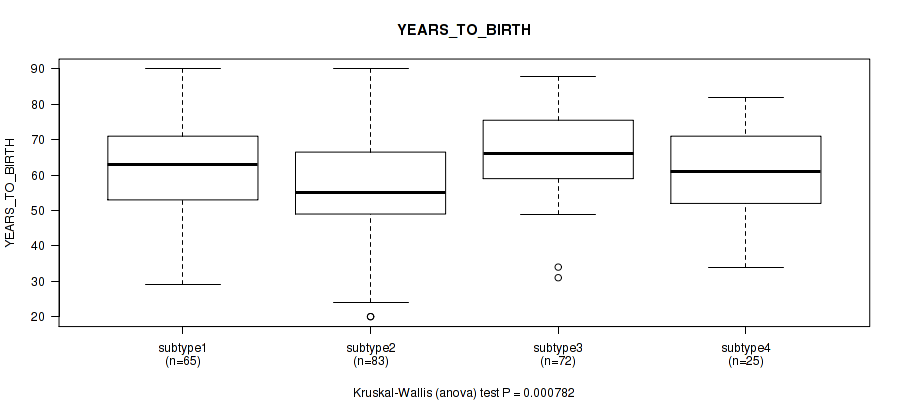
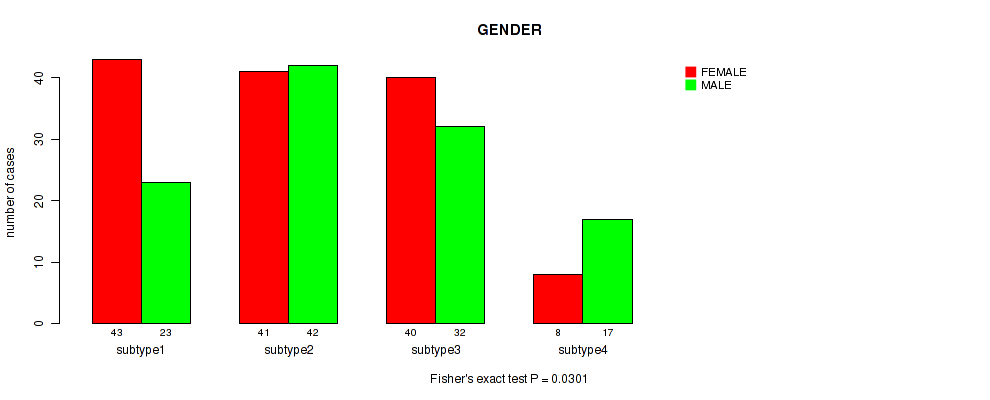
4 subtypes identified in current cancer cohort by 'Copy Number Ratio CNMF subtypes'. These subtypes correlate to 'YEARS_TO_BIRTH' and 'GENDER'.
-
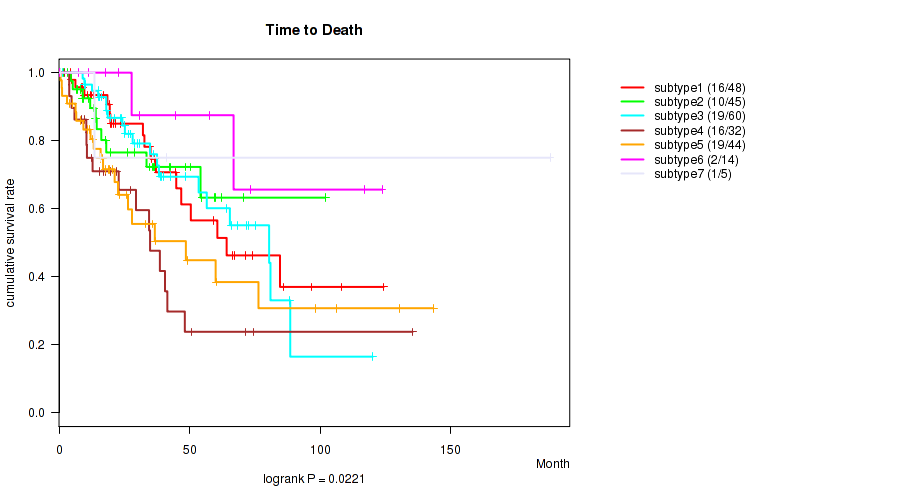
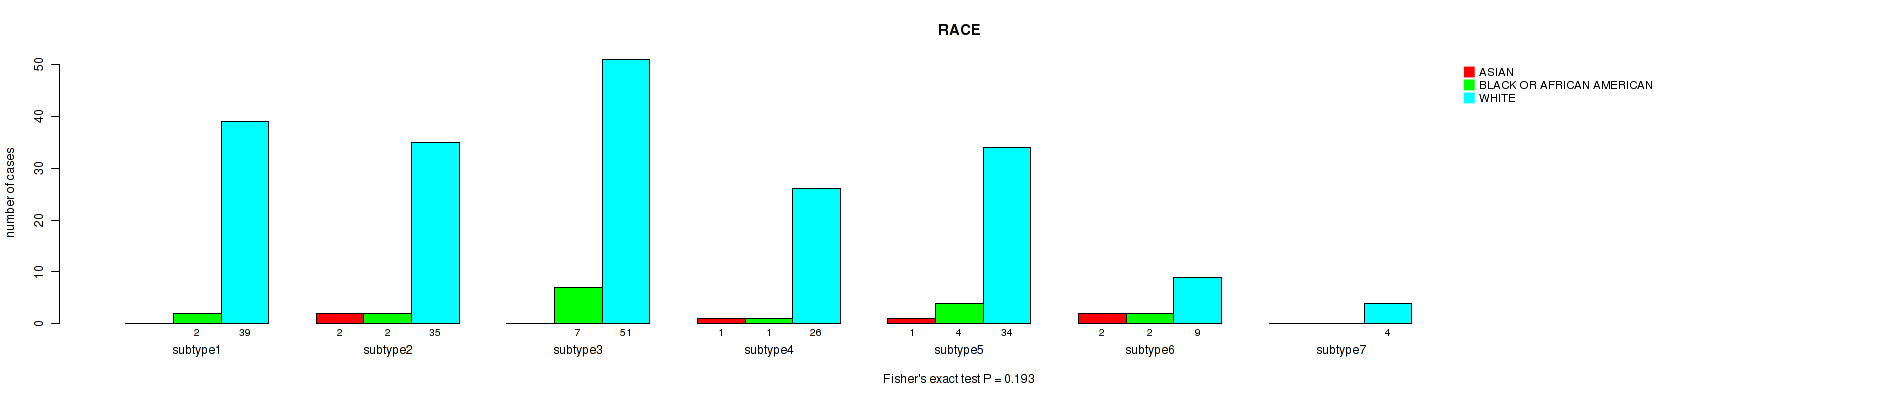
7 subtypes identified in current cancer cohort by 'METHLYATION CNMF'. These subtypes correlate to 'Time to Death', 'YEARS_TO_BIRTH', and 'GENDER'.
-
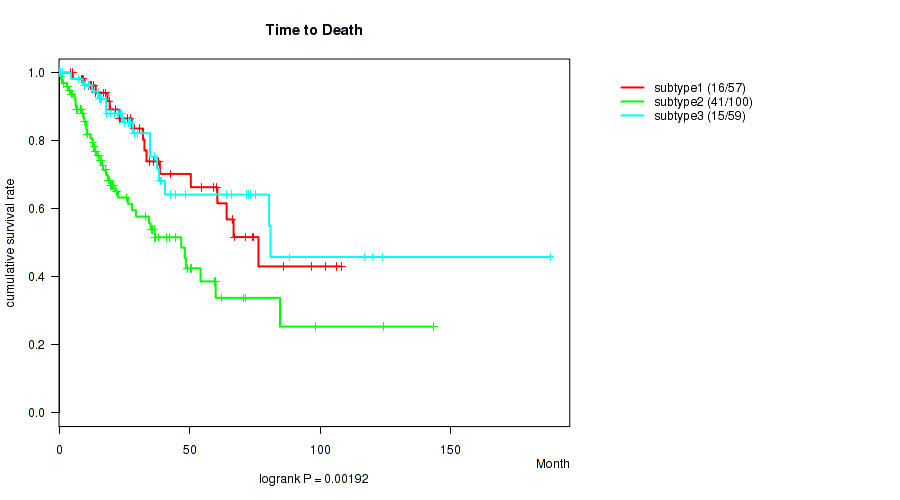
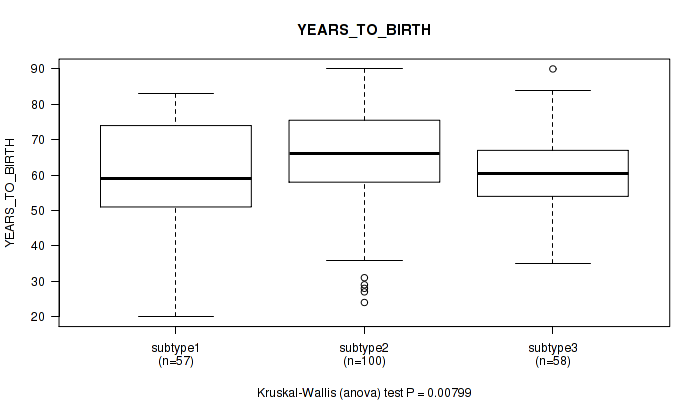
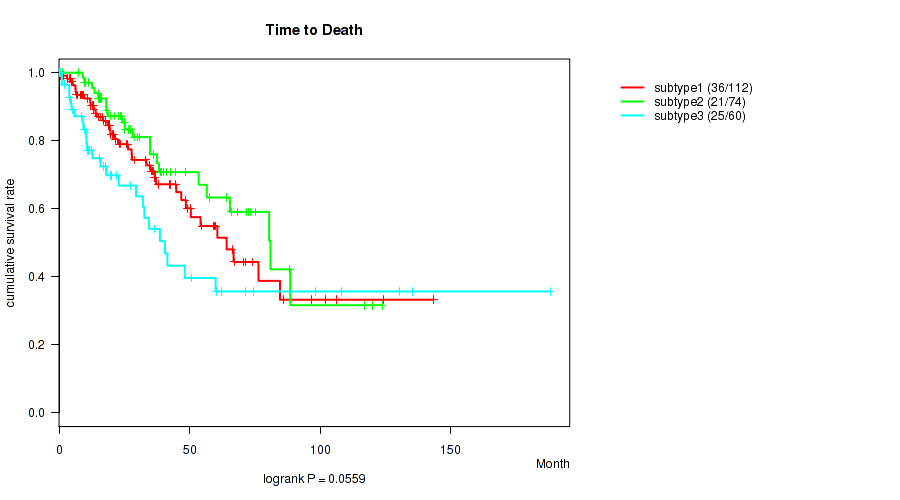
CNMF clustering analysis on RPPA data identified 3 subtypes that correlate to 'Time to Death' and 'YEARS_TO_BIRTH'.
-
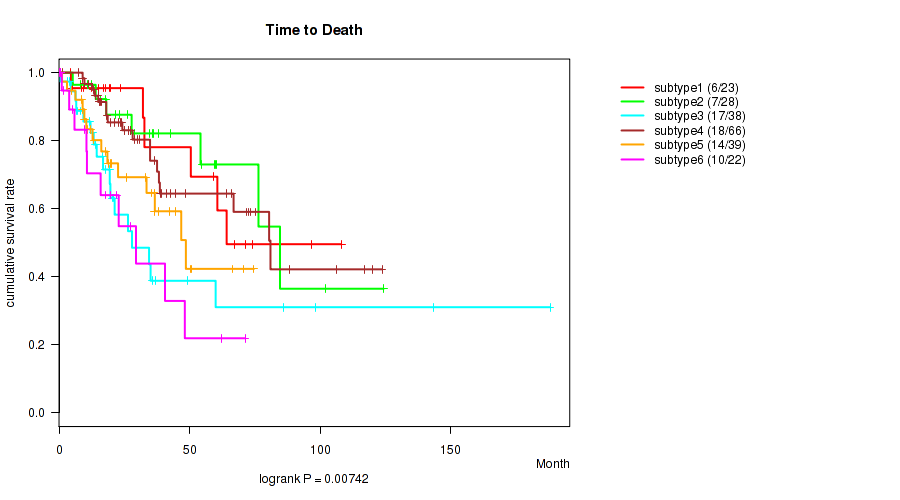
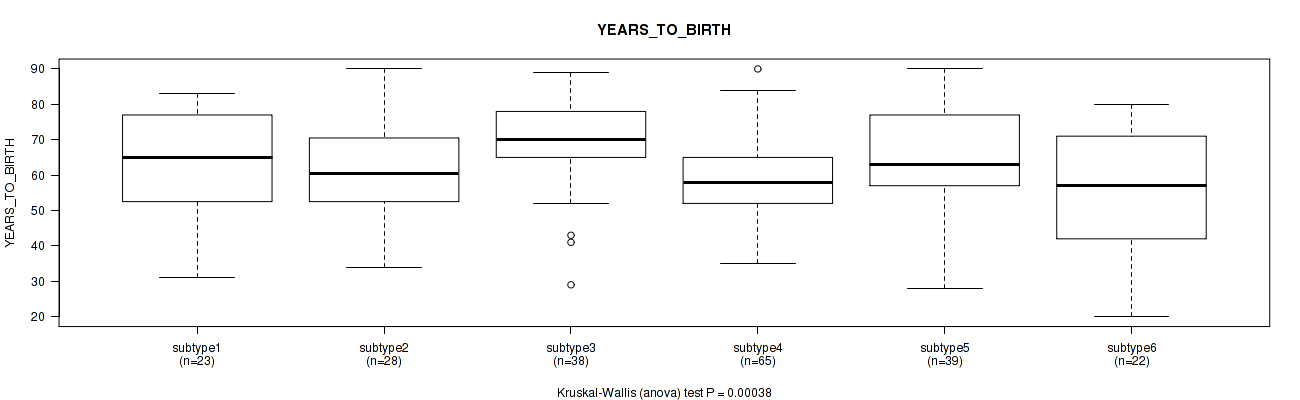
Consensus hierarchical clustering analysis on RPPA data identified 6 subtypes that correlate to 'Time to Death' and 'YEARS_TO_BIRTH'.
-
CNMF clustering analysis on sequencing-based mRNA expression data identified 3 subtypes that correlate to 'YEARS_TO_BIRTH' and 'GENDER'.
-
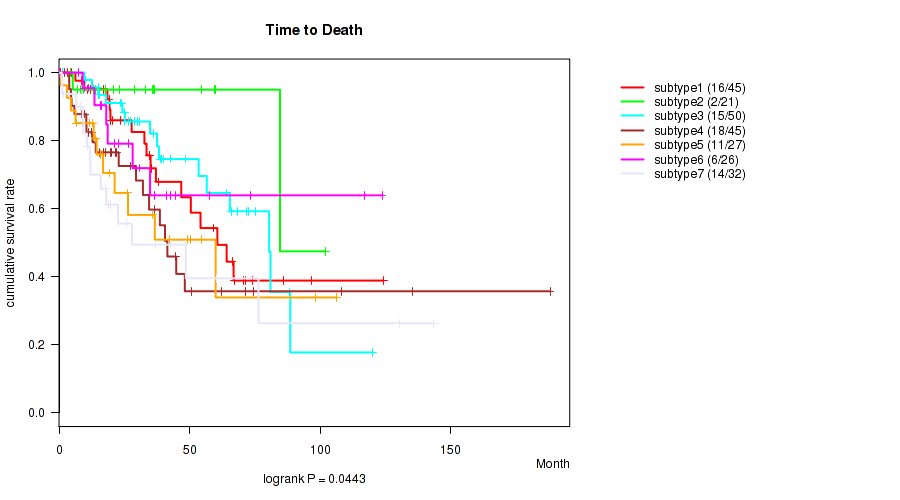
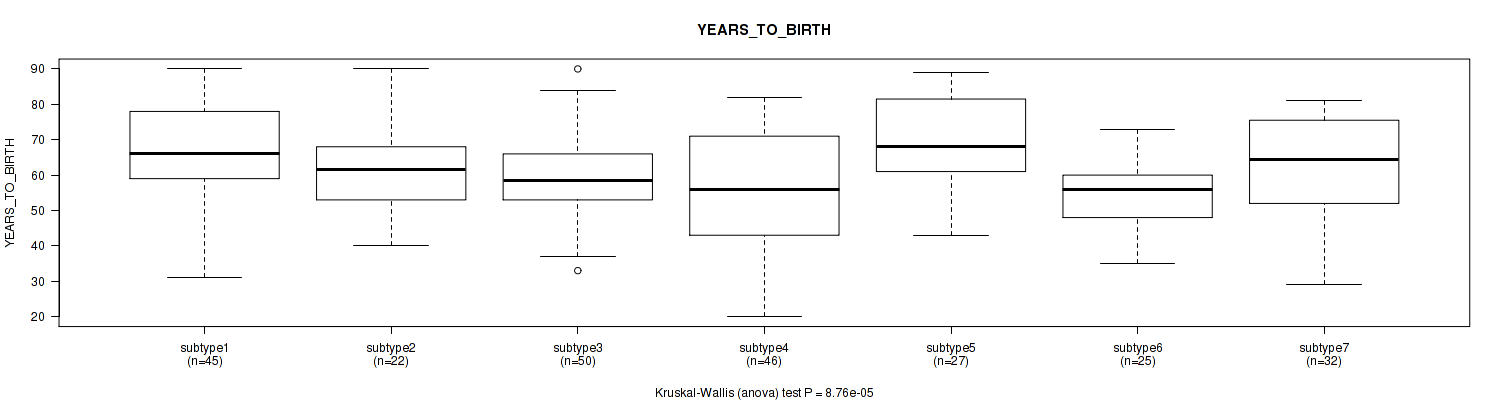
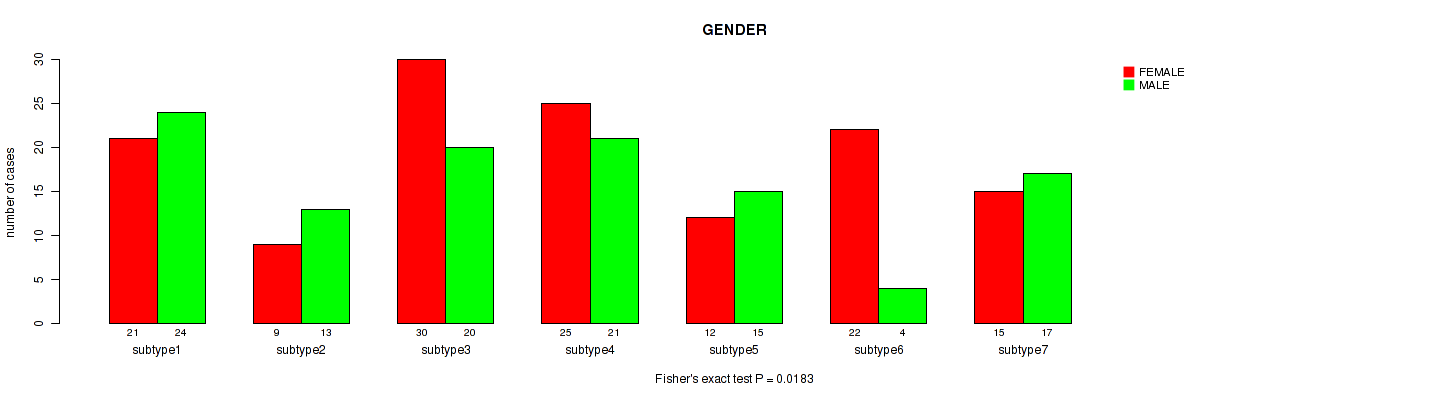
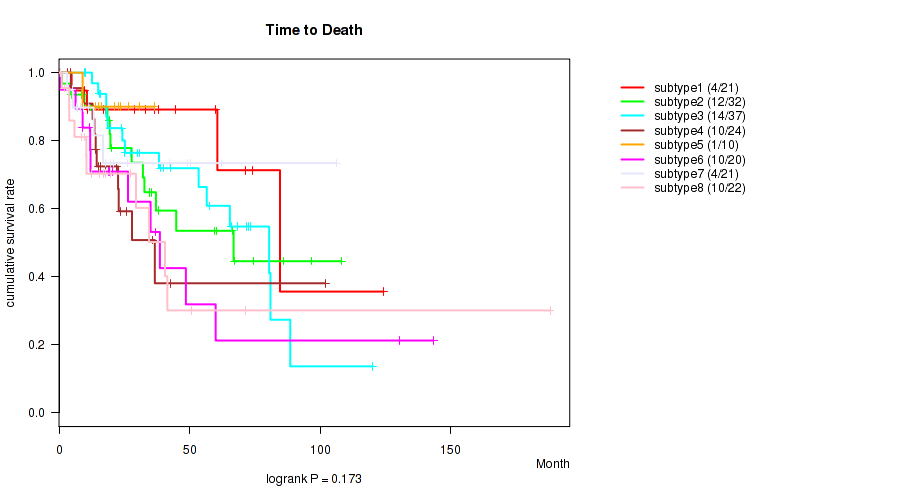
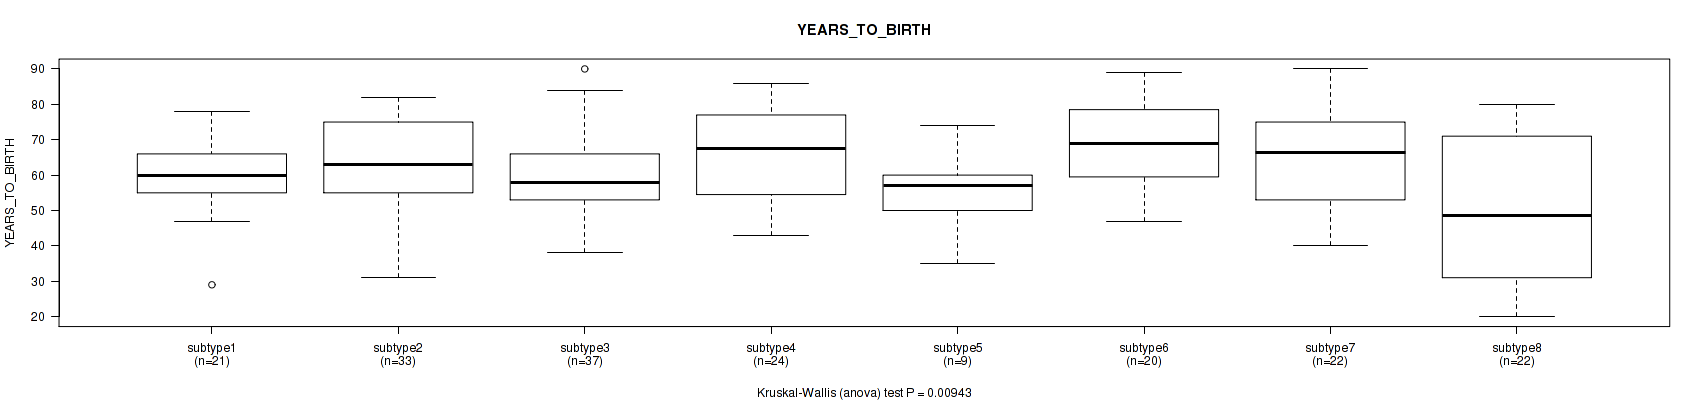
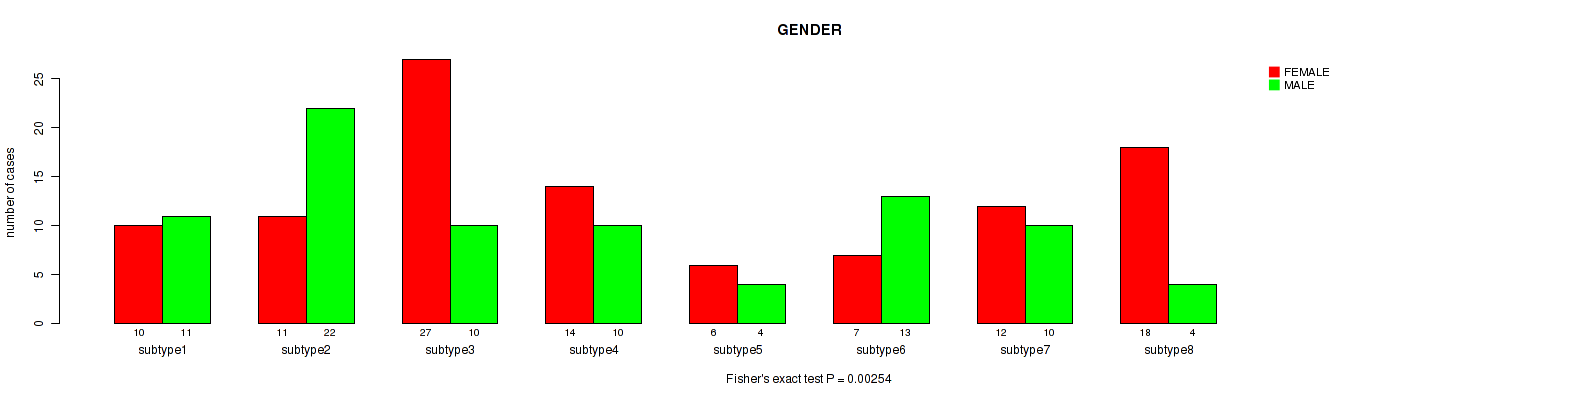
Consensus hierarchical clustering analysis on sequencing-based mRNA expression data identified 7 subtypes that correlate to 'Time to Death', 'YEARS_TO_BIRTH', and 'GENDER'.
-
3 subtypes identified in current cancer cohort by 'MIRSEQ CNMF'. These subtypes do not correlate to any clinical features.
-
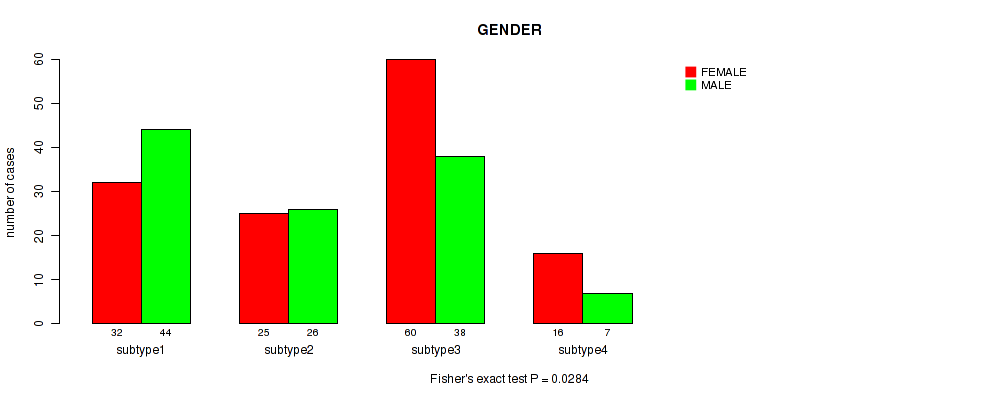
4 subtypes identified in current cancer cohort by 'MIRSEQ CHIERARCHICAL'. These subtypes correlate to 'YEARS_TO_BIRTH', 'GENDER', and 'ETHNICITY'.
-
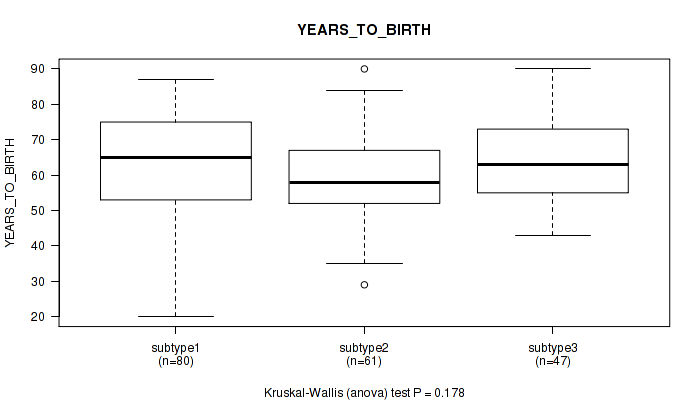
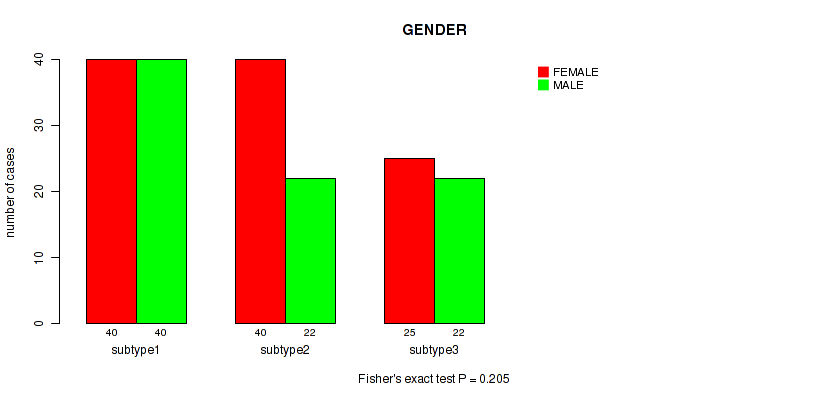
3 subtypes identified in current cancer cohort by 'MIRseq Mature CNMF subtypes'. These subtypes do not correlate to any clinical features.
-
8 subtypes identified in current cancer cohort by 'MIRseq Mature cHierClus subtypes'. These subtypes correlate to 'YEARS_TO_BIRTH' and 'GENDER'.
Table 1. Get Full Table Overview of the association between subtypes identified by 10 different clustering approaches and 5 clinical features. Shown in the table are P values (Q values). Thresholded by P value < 0.05 and Q value < 0.25, 19 significant findings detected.
|
Clinical Features |
Time to Death |
YEARS TO BIRTH |
GENDER | RACE | ETHNICITY |
| Statistical Tests | logrank test | Kruskal-Wallis (anova) | Fisher's exact test | Fisher's exact test | Fisher's exact test |
| Copy Number Ratio CNMF subtypes |
0.362 (0.441) |
0.000782 (0.00652) |
0.0301 (0.0836) |
0.653 (0.726) |
0.924 (0.943) |
| METHLYATION CNMF |
0.0221 (0.0691) |
0.000268 (0.00334) |
0.00021 (0.00334) |
0.193 (0.33) |
0.313 (0.4) |
| RPPA CNMF subtypes |
0.00192 (0.012) |
0.00799 (0.0333) |
0.0533 (0.124) |
0.991 (0.991) |
0.234 (0.334) |
| RPPA cHierClus subtypes |
0.00742 (0.0333) |
0.00038 (0.0038) |
0.0502 (0.124) |
0.726 (0.772) |
0.199 (0.33) |
| RNAseq CNMF subtypes |
0.0559 (0.124) |
0.000968 (0.00691) |
0.00258 (0.0129) |
0.824 (0.858) |
0.248 (0.34) |
| RNAseq cHierClus subtypes |
0.0443 (0.117) |
8.76e-05 (0.00334) |
0.0183 (0.0609) |
0.163 (0.318) |
0.391 (0.466) |
| MIRSEQ CNMF |
0.233 (0.334) |
0.178 (0.318) |
0.0572 (0.124) |
0.724 (0.772) |
0.135 (0.282) |
| MIRSEQ CHIERARCHICAL |
0.32 (0.4) |
0.00018 (0.00334) |
0.0284 (0.0836) |
0.645 (0.726) |
0.0136 (0.0486) |
| MIRseq Mature CNMF subtypes |
0.217 (0.334) |
0.178 (0.318) |
0.205 (0.33) |
0.499 (0.58) |
0.31 (0.4) |
| MIRseq Mature cHierClus subtypes |
0.173 (0.318) |
0.00943 (0.0363) |
0.00254 (0.0129) |
0.229 (0.334) |
0.251 (0.34) |
Table S1. Description of clustering approach #1: 'Copy Number Ratio CNMF subtypes'
| Cluster Labels | 1 | 2 | 3 | 4 |
|---|---|---|---|---|
| Number of samples | 66 | 83 | 72 | 25 |
P value = 0.362 (logrank test), Q value = 0.44
Table S2. Clustering Approach #1: 'Copy Number Ratio CNMF subtypes' versus Clinical Feature #1: 'Time to Death'
| nPatients | nDeath | Duration Range (Median), Month | |
|---|---|---|---|
| ALL | 244 | 82 | 0.1 - 188.2 (23.3) |
| subtype1 | 66 | 23 | 0.7 - 124.4 (20.6) |
| subtype2 | 82 | 24 | 0.1 - 143.4 (30.2) |
| subtype3 | 72 | 28 | 0.1 - 188.2 (25.7) |
| subtype4 | 24 | 7 | 0.5 - 108.1 (18.2) |
Figure S1. Get High-res Image Clustering Approach #1: 'Copy Number Ratio CNMF subtypes' versus Clinical Feature #1: 'Time to Death'
P value = 0.000782 (Kruskal-Wallis (anova)), Q value = 0.0065
Table S3. Clustering Approach #1: 'Copy Number Ratio CNMF subtypes' versus Clinical Feature #2: 'YEARS_TO_BIRTH'
| nPatients | Mean (Std.Dev) | |
|---|---|---|
| ALL | 245 | 61.3 (14.5) |
| subtype1 | 65 | 61.8 (14.3) |
| subtype2 | 83 | 56.8 (15.8) |
| subtype3 | 72 | 66.2 (11.7) |
| subtype4 | 25 | 61.0 (13.5) |
Figure S2. Get High-res Image Clustering Approach #1: 'Copy Number Ratio CNMF subtypes' versus Clinical Feature #2: 'YEARS_TO_BIRTH'
P value = 0.0301 (Fisher's exact test), Q value = 0.084
Table S4. Clustering Approach #1: 'Copy Number Ratio CNMF subtypes' versus Clinical Feature #3: 'GENDER'
| nPatients | FEMALE | MALE |
|---|---|---|
| ALL | 132 | 114 |
| subtype1 | 43 | 23 |
| subtype2 | 41 | 42 |
| subtype3 | 40 | 32 |
| subtype4 | 8 | 17 |
Figure S3. Get High-res Image Clustering Approach #1: 'Copy Number Ratio CNMF subtypes' versus Clinical Feature #3: 'GENDER'
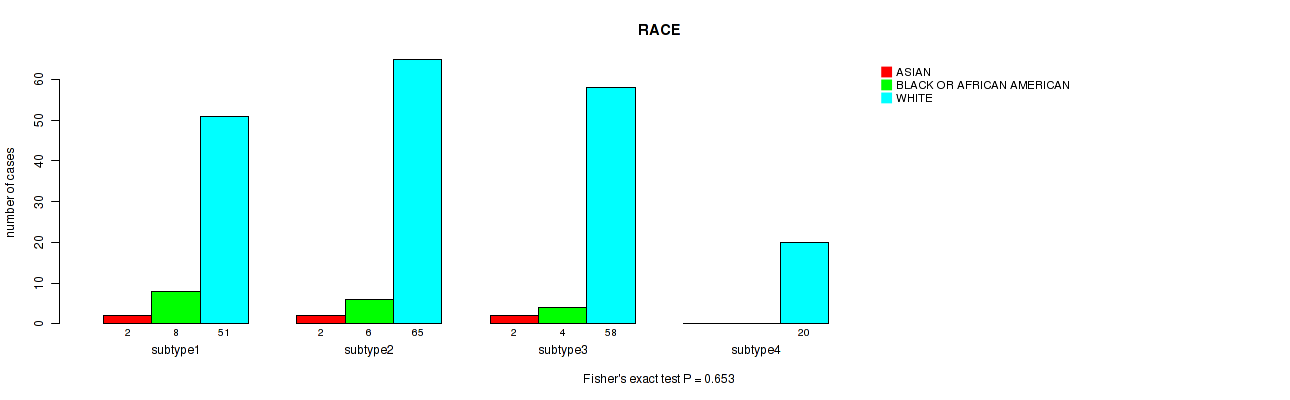
P value = 0.653 (Fisher's exact test), Q value = 0.73
Table S5. Clustering Approach #1: 'Copy Number Ratio CNMF subtypes' versus Clinical Feature #4: 'RACE'
| nPatients | ASIAN | BLACK OR AFRICAN AMERICAN | WHITE |
|---|---|---|---|
| ALL | 6 | 18 | 194 |
| subtype1 | 2 | 8 | 51 |
| subtype2 | 2 | 6 | 65 |
| subtype3 | 2 | 4 | 58 |
| subtype4 | 0 | 0 | 20 |
Figure S4. Get High-res Image Clustering Approach #1: 'Copy Number Ratio CNMF subtypes' versus Clinical Feature #4: 'RACE'
P value = 0.924 (Fisher's exact test), Q value = 0.94
Table S6. Clustering Approach #1: 'Copy Number Ratio CNMF subtypes' versus Clinical Feature #5: 'ETHNICITY'
| nPatients | HISPANIC OR LATINO | NOT HISPANIC OR LATINO |
|---|---|---|
| ALL | 5 | 191 |
| subtype1 | 1 | 58 |
| subtype2 | 2 | 58 |
| subtype3 | 2 | 55 |
| subtype4 | 0 | 20 |
Figure S5. Get High-res Image Clustering Approach #1: 'Copy Number Ratio CNMF subtypes' versus Clinical Feature #5: 'ETHNICITY'
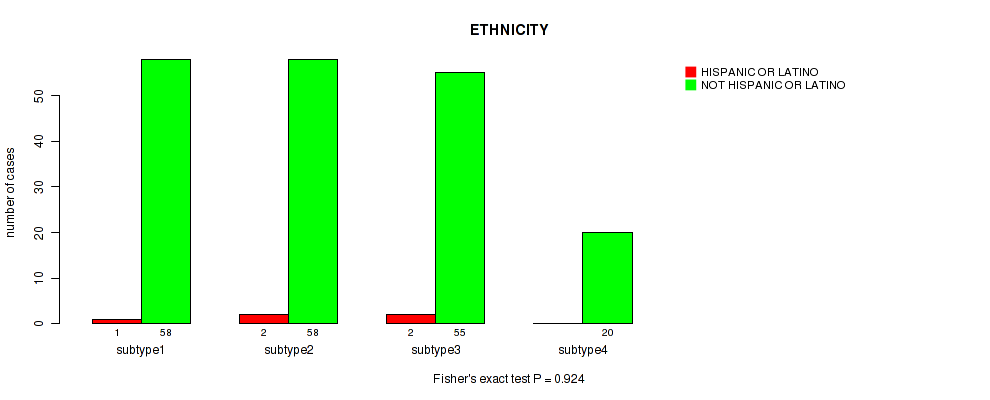
Table S7. Description of clustering approach #2: 'METHLYATION CNMF'
| Cluster Labels | 1 | 2 | 3 | 4 | 5 | 6 | 7 |
|---|---|---|---|---|---|---|---|
| Number of samples | 48 | 46 | 60 | 32 | 44 | 15 | 5 |
P value = 0.0221 (logrank test), Q value = 0.069
Table S8. Clustering Approach #2: 'METHLYATION CNMF' versus Clinical Feature #1: 'Time to Death'
| nPatients | nDeath | Duration Range (Median), Month | |
|---|---|---|---|
| ALL | 248 | 83 | 0.1 - 188.2 (23.3) |
| subtype1 | 48 | 16 | 4.3 - 124.4 (32.4) |
| subtype2 | 45 | 10 | 0.7 - 102.0 (17.9) |
| subtype3 | 60 | 19 | 0.1 - 120.2 (27.3) |
| subtype4 | 32 | 16 | 0.1 - 135.5 (17.3) |
| subtype5 | 44 | 19 | 0.6 - 143.4 (18.4) |
| subtype6 | 14 | 2 | 0.1 - 123.8 (29.4) |
| subtype7 | 5 | 1 | 0.5 - 188.2 (15.9) |
Figure S6. Get High-res Image Clustering Approach #2: 'METHLYATION CNMF' versus Clinical Feature #1: 'Time to Death'
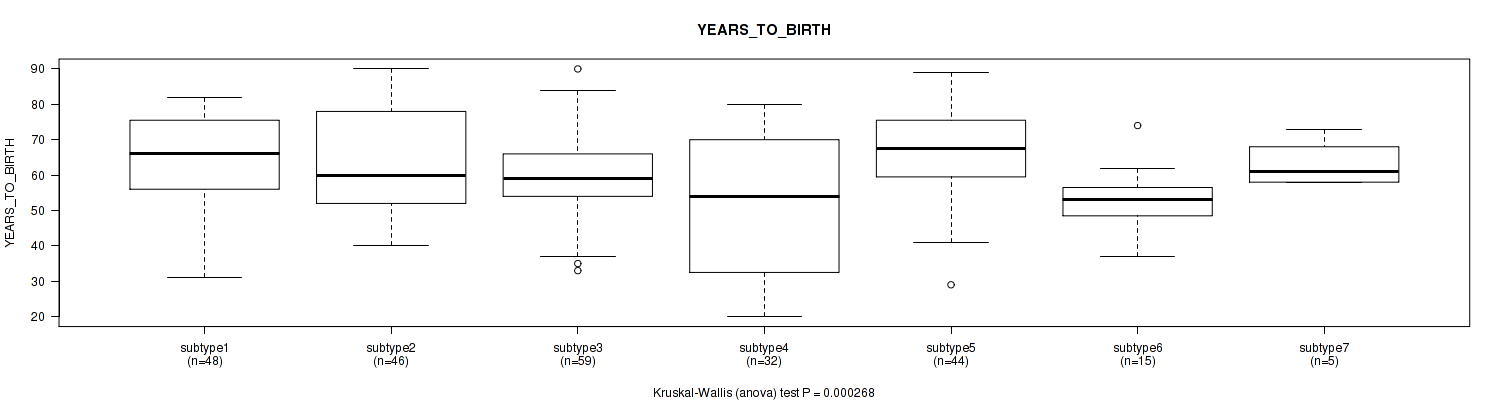
P value = 0.000268 (Kruskal-Wallis (anova)), Q value = 0.0033
Table S9. Clustering Approach #2: 'METHLYATION CNMF' versus Clinical Feature #2: 'YEARS_TO_BIRTH'
| nPatients | Mean (Std.Dev) | |
|---|---|---|
| ALL | 249 | 61.4 (14.4) |
| subtype1 | 48 | 64.1 (13.0) |
| subtype2 | 46 | 63.7 (14.5) |
| subtype3 | 59 | 59.9 (11.9) |
| subtype4 | 32 | 52.2 (19.4) |
| subtype5 | 44 | 67.0 (12.9) |
| subtype6 | 15 | 52.9 (8.6) |
| subtype7 | 5 | 63.6 (6.7) |
Figure S7. Get High-res Image Clustering Approach #2: 'METHLYATION CNMF' versus Clinical Feature #2: 'YEARS_TO_BIRTH'
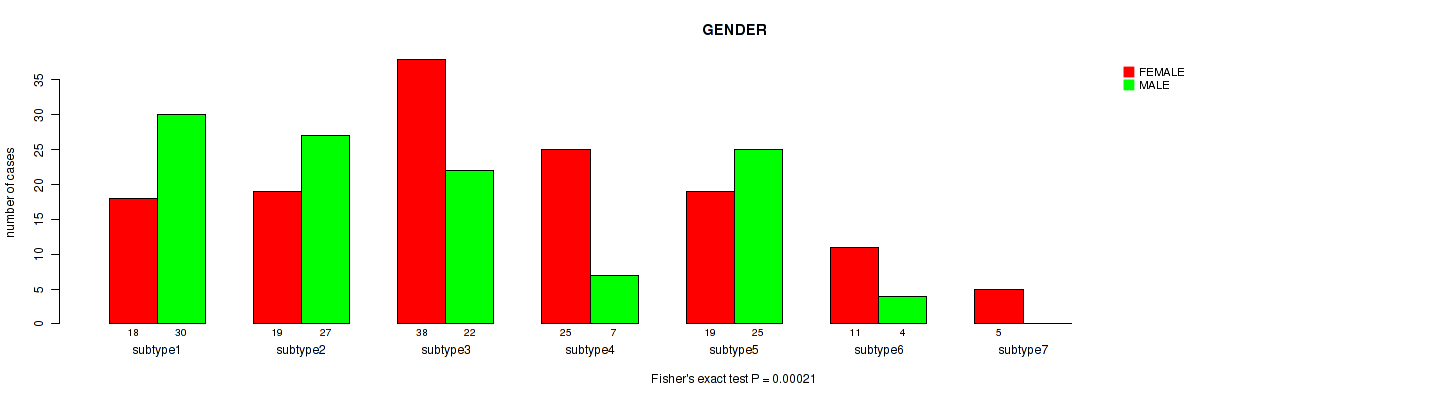
P value = 0.00021 (Fisher's exact test), Q value = 0.0033
Table S10. Clustering Approach #2: 'METHLYATION CNMF' versus Clinical Feature #3: 'GENDER'
| nPatients | FEMALE | MALE |
|---|---|---|
| ALL | 135 | 115 |
| subtype1 | 18 | 30 |
| subtype2 | 19 | 27 |
| subtype3 | 38 | 22 |
| subtype4 | 25 | 7 |
| subtype5 | 19 | 25 |
| subtype6 | 11 | 4 |
| subtype7 | 5 | 0 |
Figure S8. Get High-res Image Clustering Approach #2: 'METHLYATION CNMF' versus Clinical Feature #3: 'GENDER'
P value = 0.193 (Fisher's exact test), Q value = 0.33
Table S11. Clustering Approach #2: 'METHLYATION CNMF' versus Clinical Feature #4: 'RACE'
| nPatients | ASIAN | BLACK OR AFRICAN AMERICAN | WHITE |
|---|---|---|---|
| ALL | 6 | 18 | 198 |
| subtype1 | 0 | 2 | 39 |
| subtype2 | 2 | 2 | 35 |
| subtype3 | 0 | 7 | 51 |
| subtype4 | 1 | 1 | 26 |
| subtype5 | 1 | 4 | 34 |
| subtype6 | 2 | 2 | 9 |
| subtype7 | 0 | 0 | 4 |
Figure S9. Get High-res Image Clustering Approach #2: 'METHLYATION CNMF' versus Clinical Feature #4: 'RACE'
P value = 0.313 (Fisher's exact test), Q value = 0.4
Table S12. Clustering Approach #2: 'METHLYATION CNMF' versus Clinical Feature #5: 'ETHNICITY'
| nPatients | HISPANIC OR LATINO | NOT HISPANIC OR LATINO |
|---|---|---|
| ALL | 5 | 194 |
| subtype1 | 1 | 38 |
| subtype2 | 1 | 36 |
| subtype3 | 0 | 54 |
| subtype4 | 2 | 19 |
| subtype5 | 1 | 35 |
| subtype6 | 0 | 9 |
| subtype7 | 0 | 3 |
Figure S10. Get High-res Image Clustering Approach #2: 'METHLYATION CNMF' versus Clinical Feature #5: 'ETHNICITY'
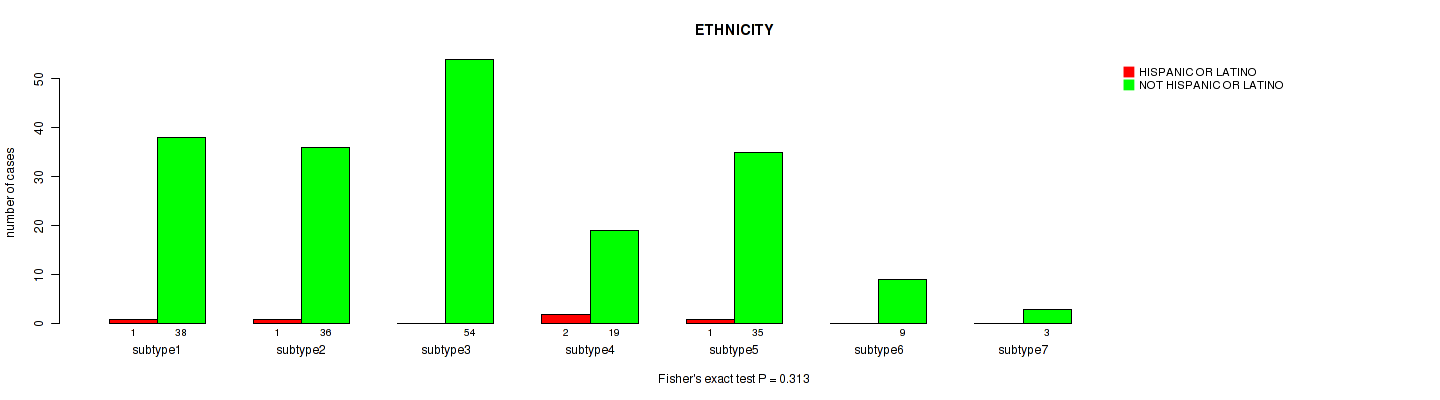
Table S13. Description of clustering approach #3: 'RPPA CNMF subtypes'
| Cluster Labels | 1 | 2 | 3 |
|---|---|---|---|
| Number of samples | 57 | 100 | 59 |
P value = 0.00192 (logrank test), Q value = 0.012
Table S14. Clustering Approach #3: 'RPPA CNMF subtypes' versus Clinical Feature #1: 'Time to Death'
| nPatients | nDeath | Duration Range (Median), Month | |
|---|---|---|---|
| ALL | 216 | 72 | 0.1 - 188.2 (21.8) |
| subtype1 | 57 | 16 | 4.3 - 108.1 (27.8) |
| subtype2 | 100 | 41 | 0.1 - 143.4 (17.7) |
| subtype3 | 59 | 15 | 0.1 - 188.2 (26.6) |
Figure S11. Get High-res Image Clustering Approach #3: 'RPPA CNMF subtypes' versus Clinical Feature #1: 'Time to Death'
P value = 0.00799 (Kruskal-Wallis (anova)), Q value = 0.033
Table S15. Clustering Approach #3: 'RPPA CNMF subtypes' versus Clinical Feature #2: 'YEARS_TO_BIRTH'
| nPatients | Mean (Std.Dev) | |
|---|---|---|
| ALL | 215 | 62.2 (14.2) |
| subtype1 | 57 | 59.9 (14.7) |
| subtype2 | 100 | 65.0 (14.8) |
| subtype3 | 58 | 59.7 (11.6) |
Figure S12. Get High-res Image Clustering Approach #3: 'RPPA CNMF subtypes' versus Clinical Feature #2: 'YEARS_TO_BIRTH'
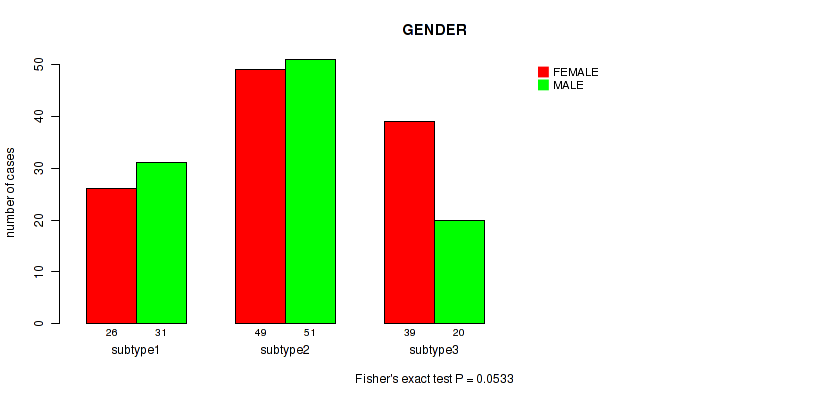
P value = 0.0533 (Fisher's exact test), Q value = 0.12
Table S16. Clustering Approach #3: 'RPPA CNMF subtypes' versus Clinical Feature #3: 'GENDER'
| nPatients | FEMALE | MALE |
|---|---|---|
| ALL | 114 | 102 |
| subtype1 | 26 | 31 |
| subtype2 | 49 | 51 |
| subtype3 | 39 | 20 |
Figure S13. Get High-res Image Clustering Approach #3: 'RPPA CNMF subtypes' versus Clinical Feature #3: 'GENDER'
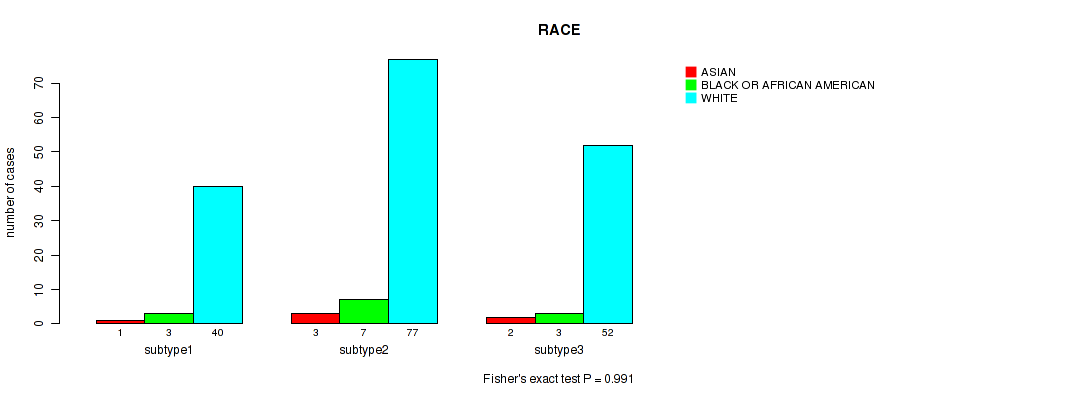
P value = 0.991 (Fisher's exact test), Q value = 0.99
Table S17. Clustering Approach #3: 'RPPA CNMF subtypes' versus Clinical Feature #4: 'RACE'
| nPatients | ASIAN | BLACK OR AFRICAN AMERICAN | WHITE |
|---|---|---|---|
| ALL | 6 | 13 | 169 |
| subtype1 | 1 | 3 | 40 |
| subtype2 | 3 | 7 | 77 |
| subtype3 | 2 | 3 | 52 |
Figure S14. Get High-res Image Clustering Approach #3: 'RPPA CNMF subtypes' versus Clinical Feature #4: 'RACE'
P value = 0.234 (Fisher's exact test), Q value = 0.33
Table S18. Clustering Approach #3: 'RPPA CNMF subtypes' versus Clinical Feature #5: 'ETHNICITY'
| nPatients | HISPANIC OR LATINO | NOT HISPANIC OR LATINO |
|---|---|---|
| ALL | 3 | 165 |
| subtype1 | 2 | 39 |
| subtype2 | 1 | 77 |
| subtype3 | 0 | 49 |
Figure S15. Get High-res Image Clustering Approach #3: 'RPPA CNMF subtypes' versus Clinical Feature #5: 'ETHNICITY'
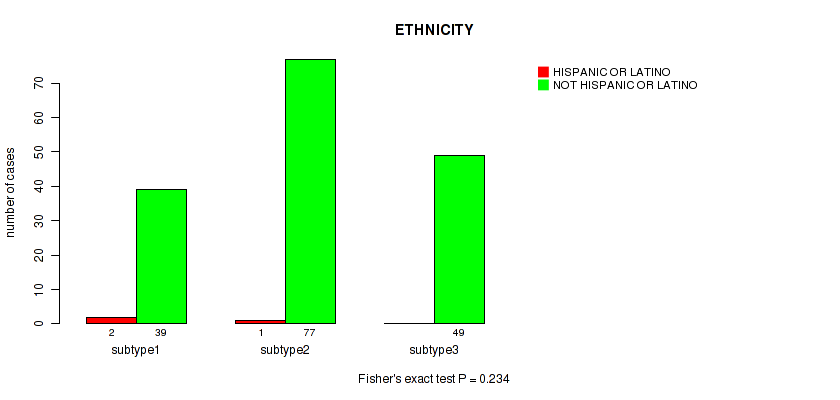
Table S19. Description of clustering approach #4: 'RPPA cHierClus subtypes'
| Cluster Labels | 1 | 2 | 3 | 4 | 5 | 6 |
|---|---|---|---|---|---|---|
| Number of samples | 23 | 28 | 38 | 66 | 39 | 22 |
P value = 0.00742 (logrank test), Q value = 0.033
Table S20. Clustering Approach #4: 'RPPA cHierClus subtypes' versus Clinical Feature #1: 'Time to Death'
| nPatients | nDeath | Duration Range (Median), Month | |
|---|---|---|---|
| ALL | 216 | 72 | 0.1 - 188.2 (21.8) |
| subtype1 | 23 | 6 | 4.3 - 108.1 (23.5) |
| subtype2 | 28 | 7 | 5.3 - 124.4 (31.8) |
| subtype3 | 38 | 17 | 0.6 - 188.2 (17.4) |
| subtype4 | 66 | 18 | 0.1 - 123.8 (26.5) |
| subtype5 | 39 | 14 | 0.7 - 74.7 (19.7) |
| subtype6 | 22 | 10 | 0.1 - 71.3 (13.3) |
Figure S16. Get High-res Image Clustering Approach #4: 'RPPA cHierClus subtypes' versus Clinical Feature #1: 'Time to Death'
P value = 0.00038 (Kruskal-Wallis (anova)), Q value = 0.0038
Table S21. Clustering Approach #4: 'RPPA cHierClus subtypes' versus Clinical Feature #2: 'YEARS_TO_BIRTH'
| nPatients | Mean (Std.Dev) | |
|---|---|---|
| ALL | 215 | 62.2 (14.2) |
| subtype1 | 23 | 63.2 (14.5) |
| subtype2 | 28 | 62.5 (12.9) |
| subtype3 | 38 | 69.5 (13.3) |
| subtype4 | 65 | 58.6 (11.3) |
| subtype5 | 39 | 64.8 (13.9) |
| subtype6 | 22 | 54.7 (18.8) |
Figure S17. Get High-res Image Clustering Approach #4: 'RPPA cHierClus subtypes' versus Clinical Feature #2: 'YEARS_TO_BIRTH'
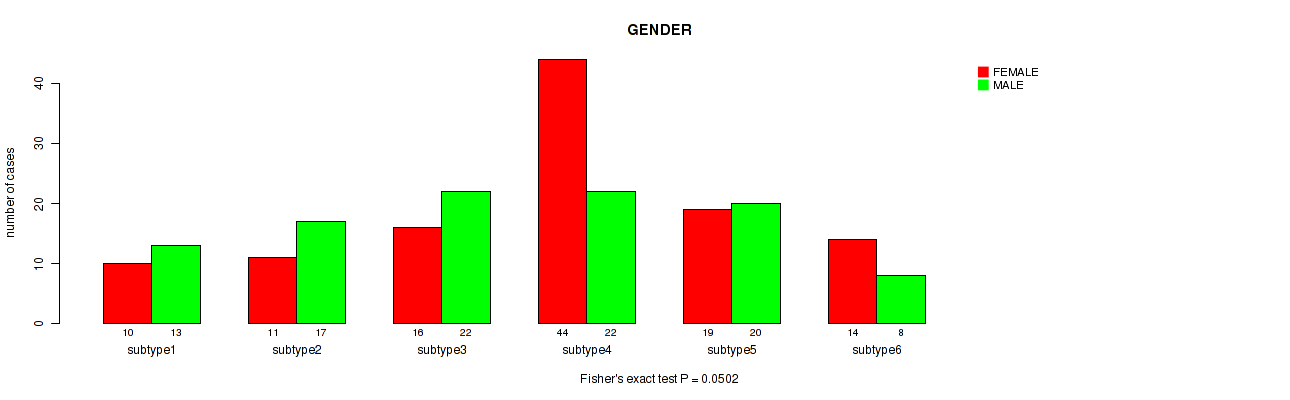
P value = 0.0502 (Fisher's exact test), Q value = 0.12
Table S22. Clustering Approach #4: 'RPPA cHierClus subtypes' versus Clinical Feature #3: 'GENDER'
| nPatients | FEMALE | MALE |
|---|---|---|
| ALL | 114 | 102 |
| subtype1 | 10 | 13 |
| subtype2 | 11 | 17 |
| subtype3 | 16 | 22 |
| subtype4 | 44 | 22 |
| subtype5 | 19 | 20 |
| subtype6 | 14 | 8 |
Figure S18. Get High-res Image Clustering Approach #4: 'RPPA cHierClus subtypes' versus Clinical Feature #3: 'GENDER'
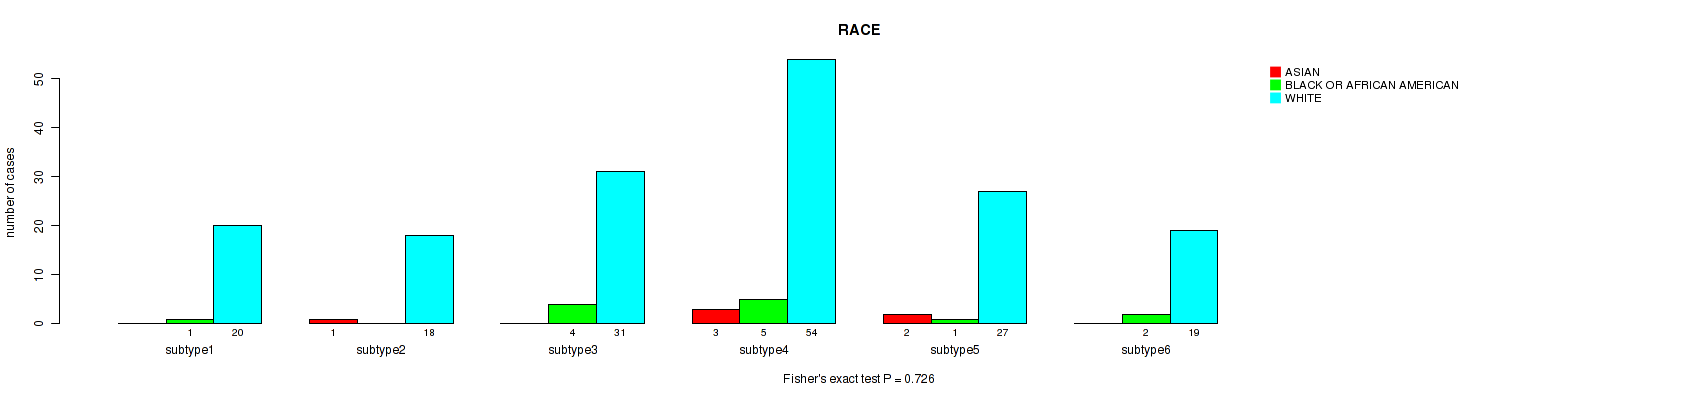
P value = 0.726 (Fisher's exact test), Q value = 0.77
Table S23. Clustering Approach #4: 'RPPA cHierClus subtypes' versus Clinical Feature #4: 'RACE'
| nPatients | ASIAN | BLACK OR AFRICAN AMERICAN | WHITE |
|---|---|---|---|
| ALL | 6 | 13 | 169 |
| subtype1 | 0 | 1 | 20 |
| subtype2 | 1 | 0 | 18 |
| subtype3 | 0 | 4 | 31 |
| subtype4 | 3 | 5 | 54 |
| subtype5 | 2 | 1 | 27 |
| subtype6 | 0 | 2 | 19 |
Figure S19. Get High-res Image Clustering Approach #4: 'RPPA cHierClus subtypes' versus Clinical Feature #4: 'RACE'
P value = 0.199 (Fisher's exact test), Q value = 0.33
Table S24. Clustering Approach #4: 'RPPA cHierClus subtypes' versus Clinical Feature #5: 'ETHNICITY'
| nPatients | HISPANIC OR LATINO | NOT HISPANIC OR LATINO |
|---|---|---|
| ALL | 3 | 165 |
| subtype1 | 1 | 19 |
| subtype2 | 0 | 18 |
| subtype3 | 2 | 30 |
| subtype4 | 0 | 56 |
| subtype5 | 0 | 26 |
| subtype6 | 0 | 16 |
Figure S20. Get High-res Image Clustering Approach #4: 'RPPA cHierClus subtypes' versus Clinical Feature #5: 'ETHNICITY'
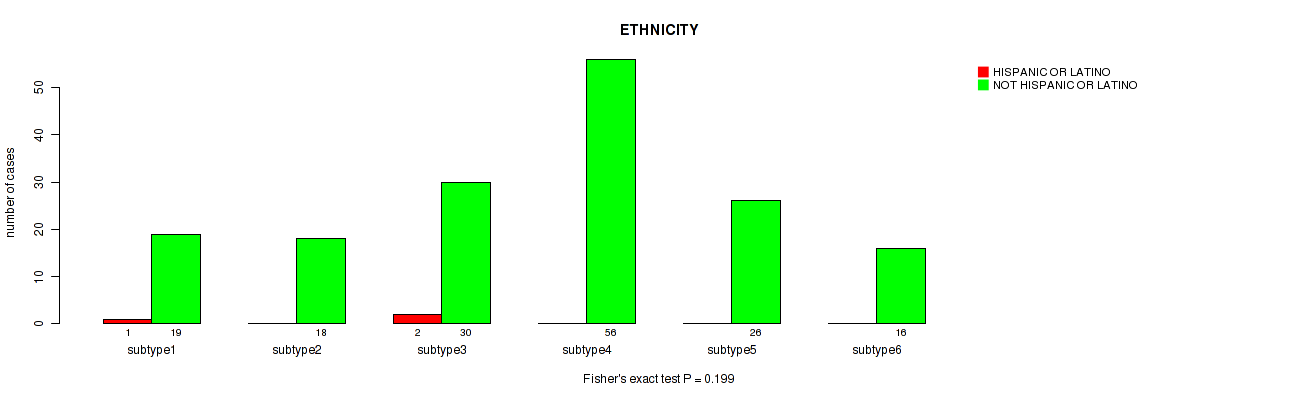
Table S25. Description of clustering approach #5: 'RNAseq CNMF subtypes'
| Cluster Labels | 1 | 2 | 3 |
|---|---|---|---|
| Number of samples | 113 | 74 | 61 |
P value = 0.0559 (logrank test), Q value = 0.12
Table S26. Clustering Approach #5: 'RNAseq CNMF subtypes' versus Clinical Feature #1: 'Time to Death'
| nPatients | nDeath | Duration Range (Median), Month | |
|---|---|---|---|
| ALL | 246 | 82 | 0.1 - 188.2 (23.3) |
| subtype1 | 112 | 36 | 0.6 - 143.4 (22.1) |
| subtype2 | 74 | 21 | 0.1 - 123.8 (27.8) |
| subtype3 | 60 | 25 | 0.1 - 188.2 (16.5) |
Figure S21. Get High-res Image Clustering Approach #5: 'RNAseq CNMF subtypes' versus Clinical Feature #1: 'Time to Death'
P value = 0.000968 (Kruskal-Wallis (anova)), Q value = 0.0069
Table S27. Clustering Approach #5: 'RNAseq CNMF subtypes' versus Clinical Feature #2: 'YEARS_TO_BIRTH'
| nPatients | Mean (Std.Dev) | |
|---|---|---|
| ALL | 247 | 61.2 (14.4) |
| subtype1 | 113 | 65.0 (13.3) |
| subtype2 | 73 | 58.2 (11.5) |
| subtype3 | 61 | 57.7 (17.5) |
Figure S22. Get High-res Image Clustering Approach #5: 'RNAseq CNMF subtypes' versus Clinical Feature #2: 'YEARS_TO_BIRTH'

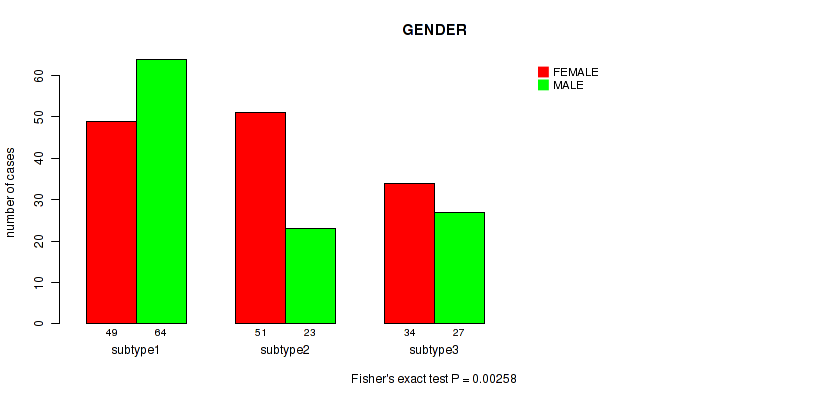
P value = 0.00258 (Fisher's exact test), Q value = 0.013
Table S28. Clustering Approach #5: 'RNAseq CNMF subtypes' versus Clinical Feature #3: 'GENDER'
| nPatients | FEMALE | MALE |
|---|---|---|
| ALL | 134 | 114 |
| subtype1 | 49 | 64 |
| subtype2 | 51 | 23 |
| subtype3 | 34 | 27 |
Figure S23. Get High-res Image Clustering Approach #5: 'RNAseq CNMF subtypes' versus Clinical Feature #3: 'GENDER'
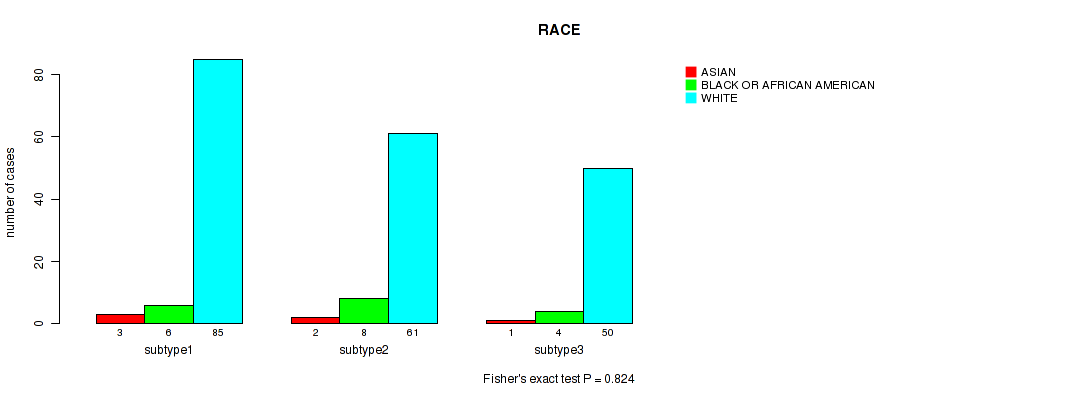
P value = 0.824 (Fisher's exact test), Q value = 0.86
Table S29. Clustering Approach #5: 'RNAseq CNMF subtypes' versus Clinical Feature #4: 'RACE'
| nPatients | ASIAN | BLACK OR AFRICAN AMERICAN | WHITE |
|---|---|---|---|
| ALL | 6 | 18 | 196 |
| subtype1 | 3 | 6 | 85 |
| subtype2 | 2 | 8 | 61 |
| subtype3 | 1 | 4 | 50 |
Figure S24. Get High-res Image Clustering Approach #5: 'RNAseq CNMF subtypes' versus Clinical Feature #4: 'RACE'
P value = 0.248 (Fisher's exact test), Q value = 0.34
Table S30. Clustering Approach #5: 'RNAseq CNMF subtypes' versus Clinical Feature #5: 'ETHNICITY'
| nPatients | HISPANIC OR LATINO | NOT HISPANIC OR LATINO |
|---|---|---|
| ALL | 5 | 193 |
| subtype1 | 3 | 86 |
| subtype2 | 0 | 63 |
| subtype3 | 2 | 44 |
Figure S25. Get High-res Image Clustering Approach #5: 'RNAseq CNMF subtypes' versus Clinical Feature #5: 'ETHNICITY'
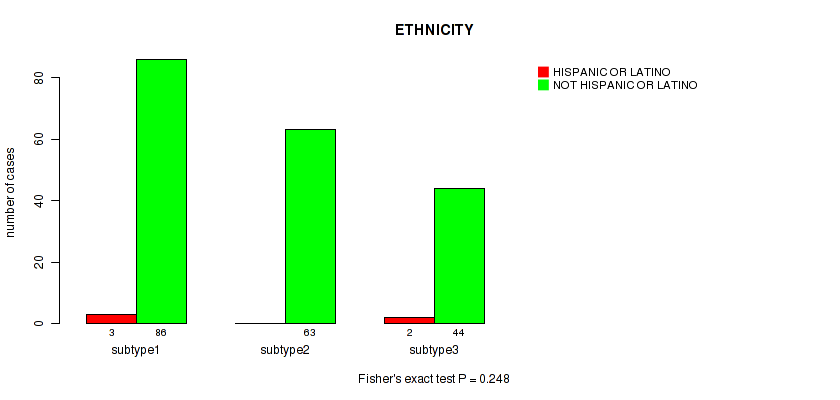
Table S31. Description of clustering approach #6: 'RNAseq cHierClus subtypes'
| Cluster Labels | 1 | 2 | 3 | 4 | 5 | 6 | 7 |
|---|---|---|---|---|---|---|---|
| Number of samples | 45 | 22 | 50 | 46 | 27 | 26 | 32 |
P value = 0.0443 (logrank test), Q value = 0.12
Table S32. Clustering Approach #6: 'RNAseq cHierClus subtypes' versus Clinical Feature #1: 'Time to Death'
| nPatients | nDeath | Duration Range (Median), Month | |
|---|---|---|---|
| ALL | 246 | 82 | 0.1 - 188.2 (23.3) |
| subtype1 | 45 | 16 | 0.7 - 124.4 (33.5) |
| subtype2 | 21 | 2 | 4.3 - 102.0 (23.1) |
| subtype3 | 50 | 15 | 0.1 - 120.2 (30.5) |
| subtype4 | 45 | 18 | 0.1 - 188.2 (19.8) |
| subtype5 | 27 | 11 | 0.6 - 106.5 (16.9) |
| subtype6 | 26 | 6 | 0.1 - 123.8 (22.0) |
| subtype7 | 32 | 14 | 1.1 - 143.4 (16.9) |
Figure S26. Get High-res Image Clustering Approach #6: 'RNAseq cHierClus subtypes' versus Clinical Feature #1: 'Time to Death'
P value = 8.76e-05 (Kruskal-Wallis (anova)), Q value = 0.0033
Table S33. Clustering Approach #6: 'RNAseq cHierClus subtypes' versus Clinical Feature #2: 'YEARS_TO_BIRTH'
| nPatients | Mean (Std.Dev) | |
|---|---|---|
| ALL | 247 | 61.2 (14.4) |
| subtype1 | 45 | 66.8 (12.6) |
| subtype2 | 22 | 61.7 (11.3) |
| subtype3 | 50 | 60.0 (12.0) |
| subtype4 | 46 | 54.9 (18.3) |
| subtype5 | 27 | 69.0 (13.3) |
| subtype6 | 25 | 54.3 (9.6) |
| subtype7 | 32 | 62.7 (13.7) |
Figure S27. Get High-res Image Clustering Approach #6: 'RNAseq cHierClus subtypes' versus Clinical Feature #2: 'YEARS_TO_BIRTH'
P value = 0.0183 (Fisher's exact test), Q value = 0.061
Table S34. Clustering Approach #6: 'RNAseq cHierClus subtypes' versus Clinical Feature #3: 'GENDER'
| nPatients | FEMALE | MALE |
|---|---|---|
| ALL | 134 | 114 |
| subtype1 | 21 | 24 |
| subtype2 | 9 | 13 |
| subtype3 | 30 | 20 |
| subtype4 | 25 | 21 |
| subtype5 | 12 | 15 |
| subtype6 | 22 | 4 |
| subtype7 | 15 | 17 |
Figure S28. Get High-res Image Clustering Approach #6: 'RNAseq cHierClus subtypes' versus Clinical Feature #3: 'GENDER'
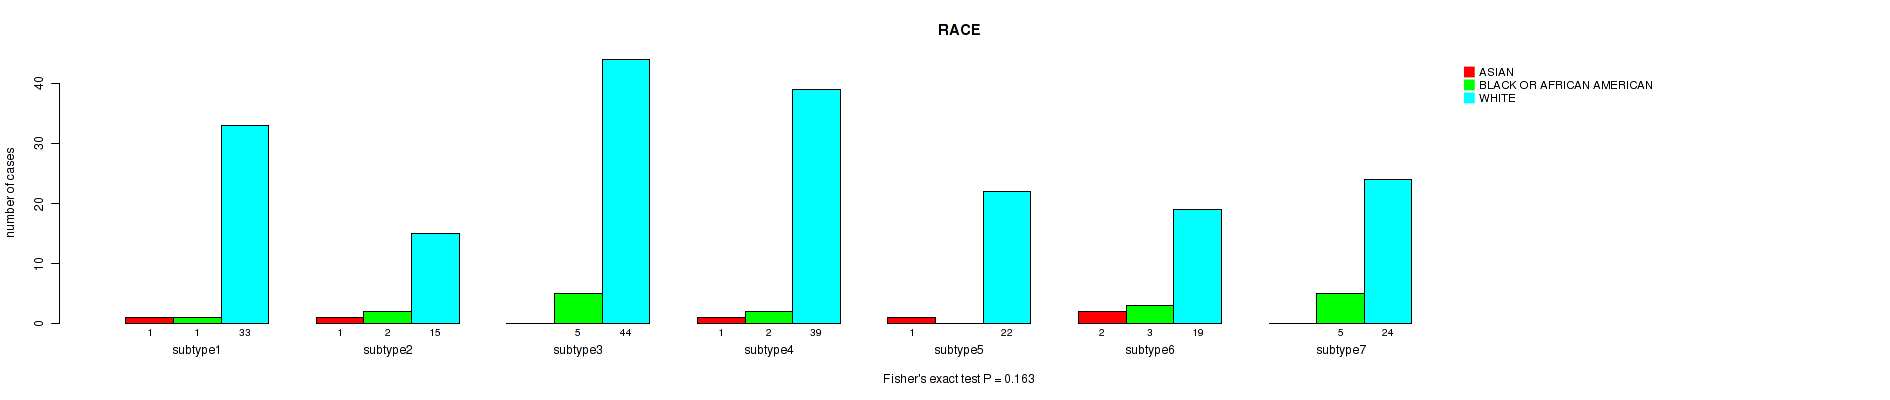
P value = 0.163 (Fisher's exact test), Q value = 0.32
Table S35. Clustering Approach #6: 'RNAseq cHierClus subtypes' versus Clinical Feature #4: 'RACE'
| nPatients | ASIAN | BLACK OR AFRICAN AMERICAN | WHITE |
|---|---|---|---|
| ALL | 6 | 18 | 196 |
| subtype1 | 1 | 1 | 33 |
| subtype2 | 1 | 2 | 15 |
| subtype3 | 0 | 5 | 44 |
| subtype4 | 1 | 2 | 39 |
| subtype5 | 1 | 0 | 22 |
| subtype6 | 2 | 3 | 19 |
| subtype7 | 0 | 5 | 24 |
Figure S29. Get High-res Image Clustering Approach #6: 'RNAseq cHierClus subtypes' versus Clinical Feature #4: 'RACE'
P value = 0.391 (Fisher's exact test), Q value = 0.47
Table S36. Clustering Approach #6: 'RNAseq cHierClus subtypes' versus Clinical Feature #5: 'ETHNICITY'
| nPatients | HISPANIC OR LATINO | NOT HISPANIC OR LATINO |
|---|---|---|
| ALL | 5 | 193 |
| subtype1 | 1 | 32 |
| subtype2 | 1 | 16 |
| subtype3 | 0 | 46 |
| subtype4 | 2 | 33 |
| subtype5 | 1 | 22 |
| subtype6 | 0 | 19 |
| subtype7 | 0 | 25 |
Figure S30. Get High-res Image Clustering Approach #6: 'RNAseq cHierClus subtypes' versus Clinical Feature #5: 'ETHNICITY'
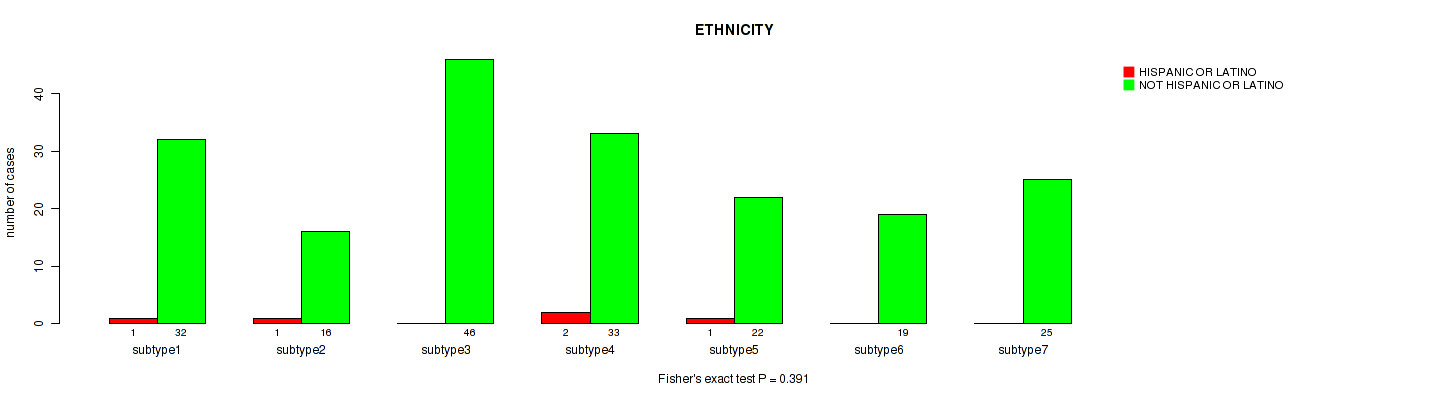
Table S37. Description of clustering approach #7: 'MIRSEQ CNMF'
| Cluster Labels | 1 | 2 | 3 |
|---|---|---|---|
| Number of samples | 104 | 49 | 95 |
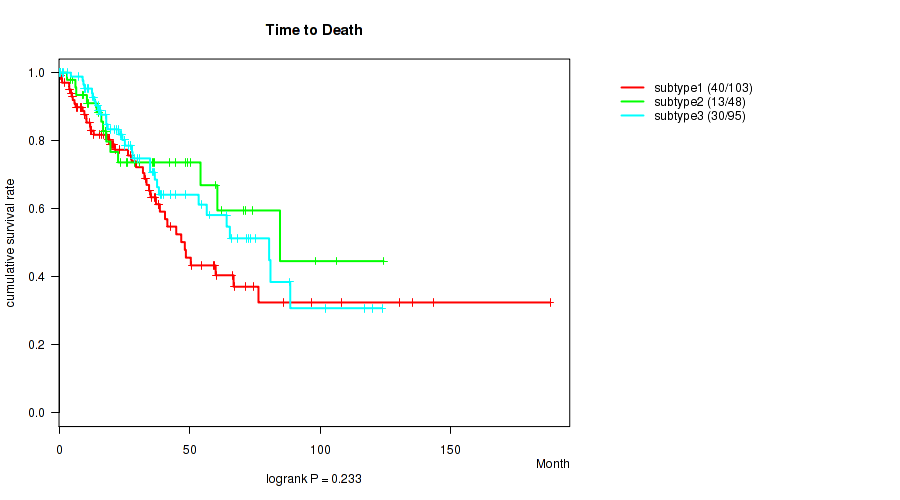
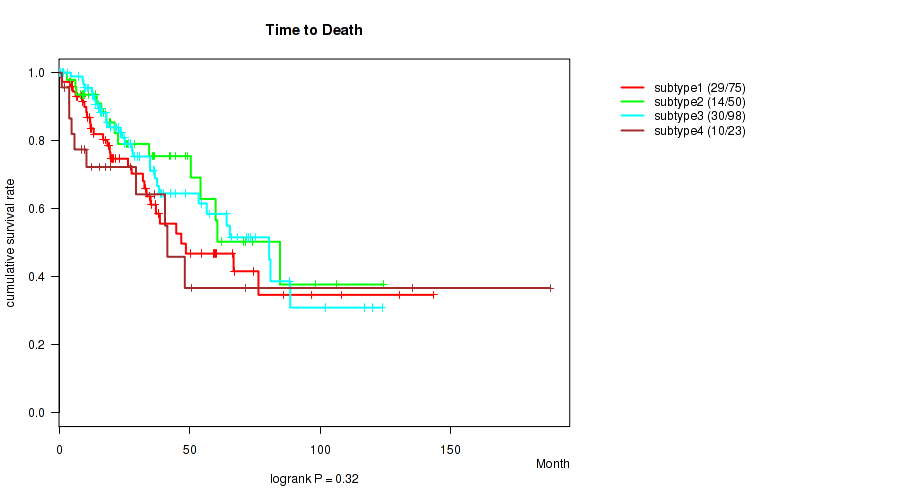
P value = 0.233 (logrank test), Q value = 0.33
Table S38. Clustering Approach #7: 'MIRSEQ CNMF' versus Clinical Feature #1: 'Time to Death'
| nPatients | nDeath | Duration Range (Median), Month | |
|---|---|---|---|
| ALL | 246 | 83 | 0.1 - 188.2 (23.3) |
| subtype1 | 103 | 40 | 0.5 - 188.2 (20.1) |
| subtype2 | 48 | 13 | 0.7 - 124.4 (23.1) |
| subtype3 | 95 | 30 | 0.1 - 123.8 (25.2) |
Figure S31. Get High-res Image Clustering Approach #7: 'MIRSEQ CNMF' versus Clinical Feature #1: 'Time to Death'
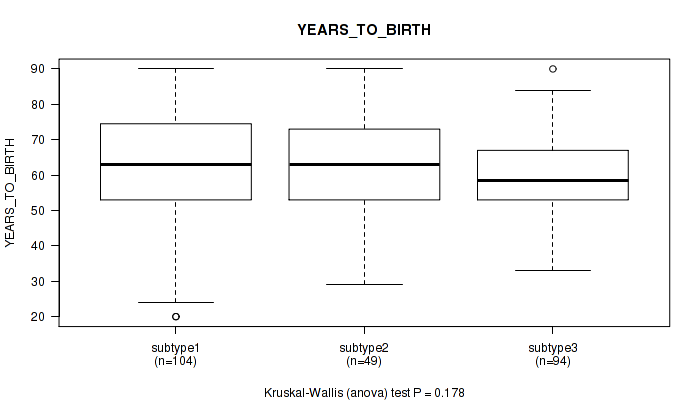
P value = 0.178 (Kruskal-Wallis (anova)), Q value = 0.32
Table S39. Clustering Approach #7: 'MIRSEQ CNMF' versus Clinical Feature #2: 'YEARS_TO_BIRTH'
| nPatients | Mean (Std.Dev) | |
|---|---|---|
| ALL | 247 | 61.3 (14.5) |
| subtype1 | 104 | 61.4 (16.5) |
| subtype2 | 49 | 64.0 (13.3) |
| subtype3 | 94 | 59.8 (12.4) |
Figure S32. Get High-res Image Clustering Approach #7: 'MIRSEQ CNMF' versus Clinical Feature #2: 'YEARS_TO_BIRTH'
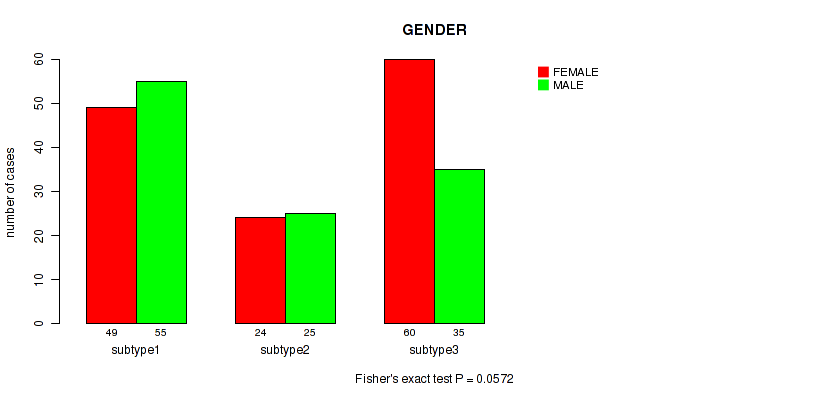
P value = 0.0572 (Fisher's exact test), Q value = 0.12
Table S40. Clustering Approach #7: 'MIRSEQ CNMF' versus Clinical Feature #3: 'GENDER'
| nPatients | FEMALE | MALE |
|---|---|---|
| ALL | 133 | 115 |
| subtype1 | 49 | 55 |
| subtype2 | 24 | 25 |
| subtype3 | 60 | 35 |
Figure S33. Get High-res Image Clustering Approach #7: 'MIRSEQ CNMF' versus Clinical Feature #3: 'GENDER'
P value = 0.724 (Fisher's exact test), Q value = 0.77
Table S41. Clustering Approach #7: 'MIRSEQ CNMF' versus Clinical Feature #4: 'RACE'
| nPatients | ASIAN | BLACK OR AFRICAN AMERICAN | WHITE |
|---|---|---|---|
| ALL | 6 | 18 | 197 |
| subtype1 | 1 | 6 | 80 |
| subtype2 | 1 | 4 | 39 |
| subtype3 | 4 | 8 | 78 |
Figure S34. Get High-res Image Clustering Approach #7: 'MIRSEQ CNMF' versus Clinical Feature #4: 'RACE'
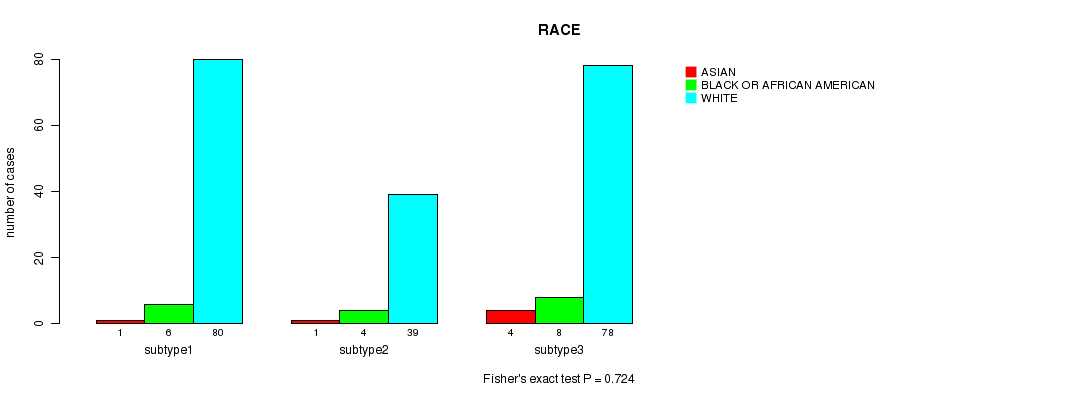
P value = 0.135 (Fisher's exact test), Q value = 0.28
Table S42. Clustering Approach #7: 'MIRSEQ CNMF' versus Clinical Feature #5: 'ETHNICITY'
| nPatients | HISPANIC OR LATINO | NOT HISPANIC OR LATINO |
|---|---|---|
| ALL | 5 | 193 |
| subtype1 | 3 | 73 |
| subtype2 | 2 | 42 |
| subtype3 | 0 | 78 |
Figure S35. Get High-res Image Clustering Approach #7: 'MIRSEQ CNMF' versus Clinical Feature #5: 'ETHNICITY'
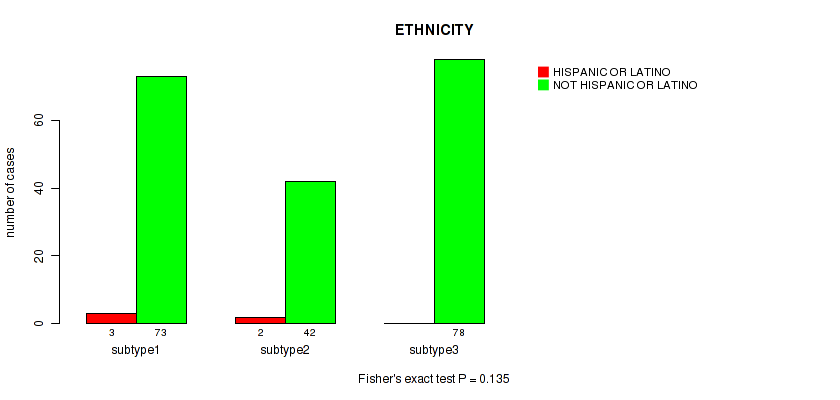
Table S43. Description of clustering approach #8: 'MIRSEQ CHIERARCHICAL'
| Cluster Labels | 1 | 2 | 3 | 4 |
|---|---|---|---|---|
| Number of samples | 76 | 51 | 98 | 23 |
P value = 0.32 (logrank test), Q value = 0.4
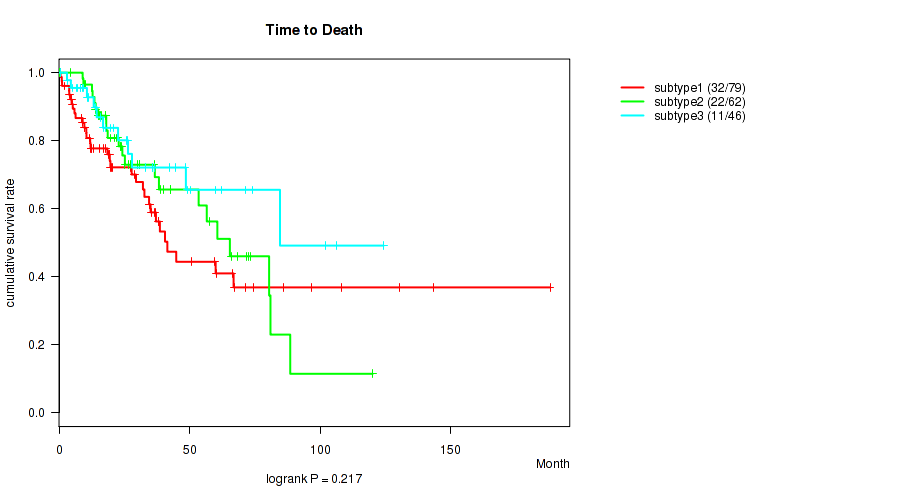
Table S44. Clustering Approach #8: 'MIRSEQ CHIERARCHICAL' versus Clinical Feature #1: 'Time to Death'
| nPatients | nDeath | Duration Range (Median), Month | |
|---|---|---|---|
| ALL | 246 | 83 | 0.1 - 188.2 (23.3) |
| subtype1 | 75 | 29 | 0.5 - 143.4 (20.3) |
| subtype2 | 50 | 14 | 0.1 - 124.4 (24.2) |
| subtype3 | 98 | 30 | 0.1 - 123.8 (25.1) |
| subtype4 | 23 | 10 | 1.1 - 188.2 (17.7) |
Figure S36. Get High-res Image Clustering Approach #8: 'MIRSEQ CHIERARCHICAL' versus Clinical Feature #1: 'Time to Death'
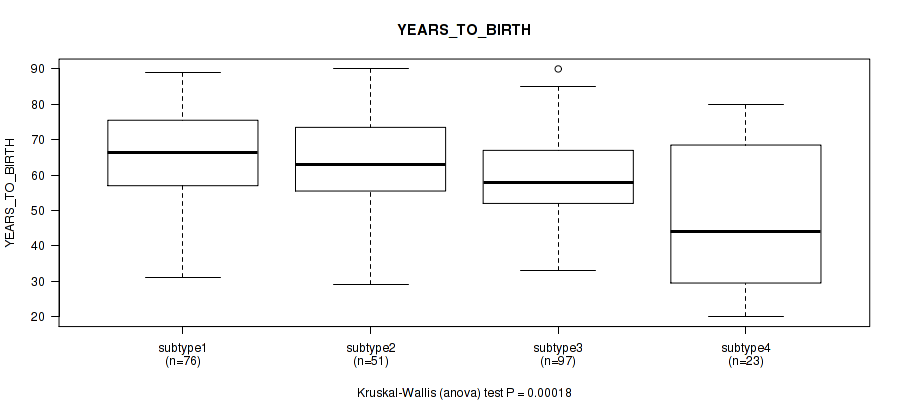
P value = 0.00018 (Kruskal-Wallis (anova)), Q value = 0.0033
Table S45. Clustering Approach #8: 'MIRSEQ CHIERARCHICAL' versus Clinical Feature #2: 'YEARS_TO_BIRTH'
| nPatients | Mean (Std.Dev) | |
|---|---|---|
| ALL | 247 | 61.3 (14.5) |
| subtype1 | 76 | 65.2 (13.1) |
| subtype2 | 51 | 64.8 (13.1) |
| subtype3 | 97 | 59.7 (12.6) |
| subtype4 | 23 | 47.8 (20.0) |
Figure S37. Get High-res Image Clustering Approach #8: 'MIRSEQ CHIERARCHICAL' versus Clinical Feature #2: 'YEARS_TO_BIRTH'
P value = 0.0284 (Fisher's exact test), Q value = 0.084
Table S46. Clustering Approach #8: 'MIRSEQ CHIERARCHICAL' versus Clinical Feature #3: 'GENDER'
| nPatients | FEMALE | MALE |
|---|---|---|
| ALL | 133 | 115 |
| subtype1 | 32 | 44 |
| subtype2 | 25 | 26 |
| subtype3 | 60 | 38 |
| subtype4 | 16 | 7 |
Figure S38. Get High-res Image Clustering Approach #8: 'MIRSEQ CHIERARCHICAL' versus Clinical Feature #3: 'GENDER'
P value = 0.645 (Fisher's exact test), Q value = 0.73
Table S47. Clustering Approach #8: 'MIRSEQ CHIERARCHICAL' versus Clinical Feature #4: 'RACE'
| nPatients | ASIAN | BLACK OR AFRICAN AMERICAN | WHITE |
|---|---|---|---|
| ALL | 6 | 18 | 197 |
| subtype1 | 1 | 2 | 57 |
| subtype2 | 1 | 5 | 40 |
| subtype3 | 4 | 9 | 80 |
| subtype4 | 0 | 2 | 20 |
Figure S39. Get High-res Image Clustering Approach #8: 'MIRSEQ CHIERARCHICAL' versus Clinical Feature #4: 'RACE'
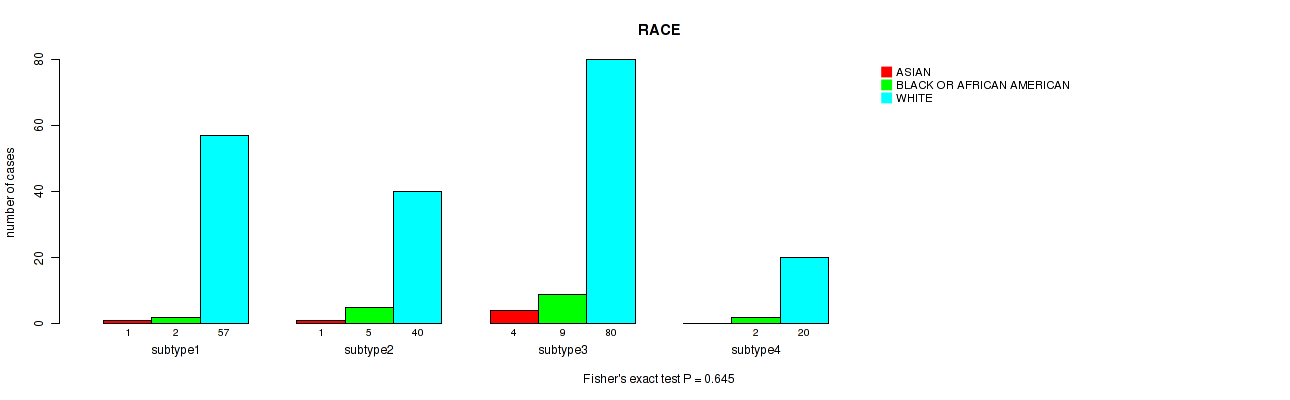
P value = 0.0136 (Fisher's exact test), Q value = 0.049
Table S48. Clustering Approach #8: 'MIRSEQ CHIERARCHICAL' versus Clinical Feature #5: 'ETHNICITY'
| nPatients | HISPANIC OR LATINO | NOT HISPANIC OR LATINO |
|---|---|---|
| ALL | 5 | 193 |
| subtype1 | 1 | 56 |
| subtype2 | 2 | 43 |
| subtype3 | 0 | 81 |
| subtype4 | 2 | 13 |
Figure S40. Get High-res Image Clustering Approach #8: 'MIRSEQ CHIERARCHICAL' versus Clinical Feature #5: 'ETHNICITY'
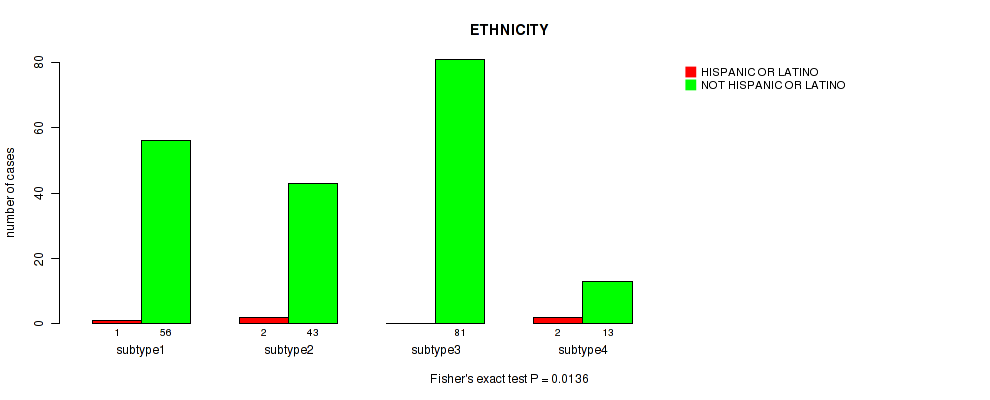
Table S49. Description of clustering approach #9: 'MIRseq Mature CNMF subtypes'
| Cluster Labels | 1 | 2 | 3 |
|---|---|---|---|
| Number of samples | 80 | 62 | 47 |
P value = 0.217 (logrank test), Q value = 0.33
Table S50. Clustering Approach #9: 'MIRseq Mature CNMF subtypes' versus Clinical Feature #1: 'Time to Death'
| nPatients | nDeath | Duration Range (Median), Month | |
|---|---|---|---|
| ALL | 187 | 65 | 0.1 - 188.2 (21.4) |
| subtype1 | 79 | 32 | 0.1 - 188.2 (19.4) |
| subtype2 | 62 | 22 | 0.1 - 120.2 (23.5) |
| subtype3 | 46 | 11 | 0.7 - 124.4 (21.8) |
Figure S41. Get High-res Image Clustering Approach #9: 'MIRseq Mature CNMF subtypes' versus Clinical Feature #1: 'Time to Death'
P value = 0.178 (Kruskal-Wallis (anova)), Q value = 0.32
Table S51. Clustering Approach #9: 'MIRseq Mature CNMF subtypes' versus Clinical Feature #2: 'YEARS_TO_BIRTH'
| nPatients | Mean (Std.Dev) | |
|---|---|---|
| ALL | 188 | 61.9 (14.5) |
| subtype1 | 80 | 61.0 (16.6) |
| subtype2 | 61 | 60.2 (12.3) |
| subtype3 | 47 | 65.5 (12.9) |
Figure S42. Get High-res Image Clustering Approach #9: 'MIRseq Mature CNMF subtypes' versus Clinical Feature #2: 'YEARS_TO_BIRTH'
P value = 0.205 (Fisher's exact test), Q value = 0.33
Table S52. Clustering Approach #9: 'MIRseq Mature CNMF subtypes' versus Clinical Feature #3: 'GENDER'
| nPatients | FEMALE | MALE |
|---|---|---|
| ALL | 105 | 84 |
| subtype1 | 40 | 40 |
| subtype2 | 40 | 22 |
| subtype3 | 25 | 22 |
Figure S43. Get High-res Image Clustering Approach #9: 'MIRseq Mature CNMF subtypes' versus Clinical Feature #3: 'GENDER'
P value = 0.499 (Fisher's exact test), Q value = 0.58
Table S53. Clustering Approach #9: 'MIRseq Mature CNMF subtypes' versus Clinical Feature #4: 'RACE'
| nPatients | ASIAN | BLACK OR AFRICAN AMERICAN | WHITE |
|---|---|---|---|
| ALL | 4 | 13 | 152 |
| subtype1 | 1 | 3 | 64 |
| subtype2 | 1 | 6 | 51 |
| subtype3 | 2 | 4 | 37 |
Figure S44. Get High-res Image Clustering Approach #9: 'MIRseq Mature CNMF subtypes' versus Clinical Feature #4: 'RACE'
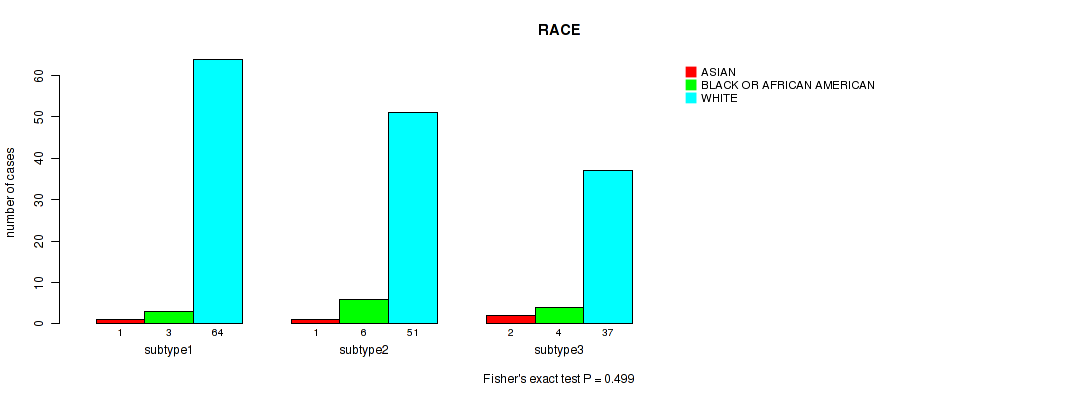
P value = 0.31 (Fisher's exact test), Q value = 0.4
Table S54. Clustering Approach #9: 'MIRseq Mature CNMF subtypes' versus Clinical Feature #5: 'ETHNICITY'
| nPatients | HISPANIC OR LATINO | NOT HISPANIC OR LATINO |
|---|---|---|
| ALL | 4 | 152 |
| subtype1 | 2 | 57 |
| subtype2 | 0 | 55 |
| subtype3 | 2 | 40 |
Figure S45. Get High-res Image Clustering Approach #9: 'MIRseq Mature CNMF subtypes' versus Clinical Feature #5: 'ETHNICITY'
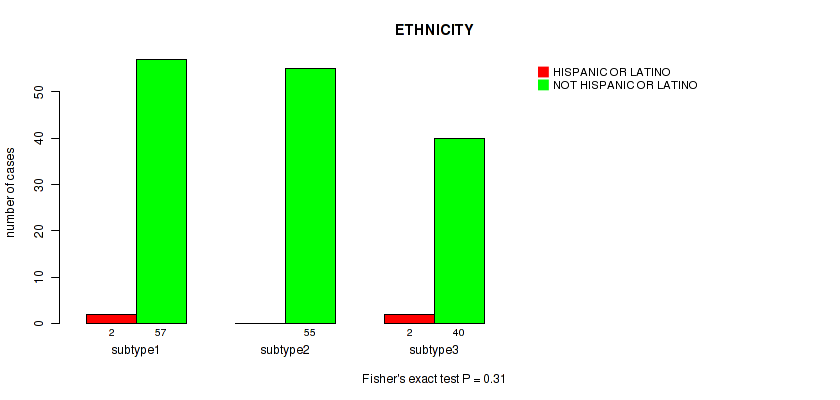
Table S55. Description of clustering approach #10: 'MIRseq Mature cHierClus subtypes'
| Cluster Labels | 1 | 2 | 3 | 4 | 5 | 6 | 7 | 8 |
|---|---|---|---|---|---|---|---|---|
| Number of samples | 21 | 33 | 37 | 24 | 10 | 20 | 22 | 22 |
P value = 0.173 (logrank test), Q value = 0.32
Table S56. Clustering Approach #10: 'MIRseq Mature cHierClus subtypes' versus Clinical Feature #1: 'Time to Death'
| nPatients | nDeath | Duration Range (Median), Month | |
|---|---|---|---|
| ALL | 187 | 65 | 0.1 - 188.2 (21.4) |
| subtype1 | 21 | 4 | 0.1 - 124.4 (33.1) |
| subtype2 | 32 | 12 | 0.5 - 108.1 (32.4) |
| subtype3 | 37 | 14 | 0.1 - 120.2 (29.9) |
| subtype4 | 24 | 10 | 0.1 - 102.0 (20.0) |
| subtype5 | 10 | 1 | 9.0 - 36.4 (22.0) |
| subtype6 | 20 | 10 | 0.6 - 143.4 (19.1) |
| subtype7 | 21 | 4 | 0.7 - 106.5 (13.3) |
| subtype8 | 22 | 10 | 1.1 - 188.2 (16.3) |
Figure S46. Get High-res Image Clustering Approach #10: 'MIRseq Mature cHierClus subtypes' versus Clinical Feature #1: 'Time to Death'
P value = 0.00943 (Kruskal-Wallis (anova)), Q value = 0.036
Table S57. Clustering Approach #10: 'MIRseq Mature cHierClus subtypes' versus Clinical Feature #2: 'YEARS_TO_BIRTH'
| nPatients | Mean (Std.Dev) | |
|---|---|---|
| ALL | 188 | 61.9 (14.5) |
| subtype1 | 21 | 60.3 (11.1) |
| subtype2 | 33 | 63.3 (13.1) |
| subtype3 | 37 | 60.6 (11.3) |
| subtype4 | 24 | 66.5 (13.0) |
| subtype5 | 9 | 54.6 (11.5) |
| subtype6 | 20 | 69.0 (12.7) |
| subtype7 | 22 | 66.6 (14.1) |
| subtype8 | 22 | 50.4 (20.7) |
Figure S47. Get High-res Image Clustering Approach #10: 'MIRseq Mature cHierClus subtypes' versus Clinical Feature #2: 'YEARS_TO_BIRTH'
P value = 0.00254 (Fisher's exact test), Q value = 0.013
Table S58. Clustering Approach #10: 'MIRseq Mature cHierClus subtypes' versus Clinical Feature #3: 'GENDER'
| nPatients | FEMALE | MALE |
|---|---|---|
| ALL | 105 | 84 |
| subtype1 | 10 | 11 |
| subtype2 | 11 | 22 |
| subtype3 | 27 | 10 |
| subtype4 | 14 | 10 |
| subtype5 | 6 | 4 |
| subtype6 | 7 | 13 |
| subtype7 | 12 | 10 |
| subtype8 | 18 | 4 |
Figure S48. Get High-res Image Clustering Approach #10: 'MIRseq Mature cHierClus subtypes' versus Clinical Feature #3: 'GENDER'
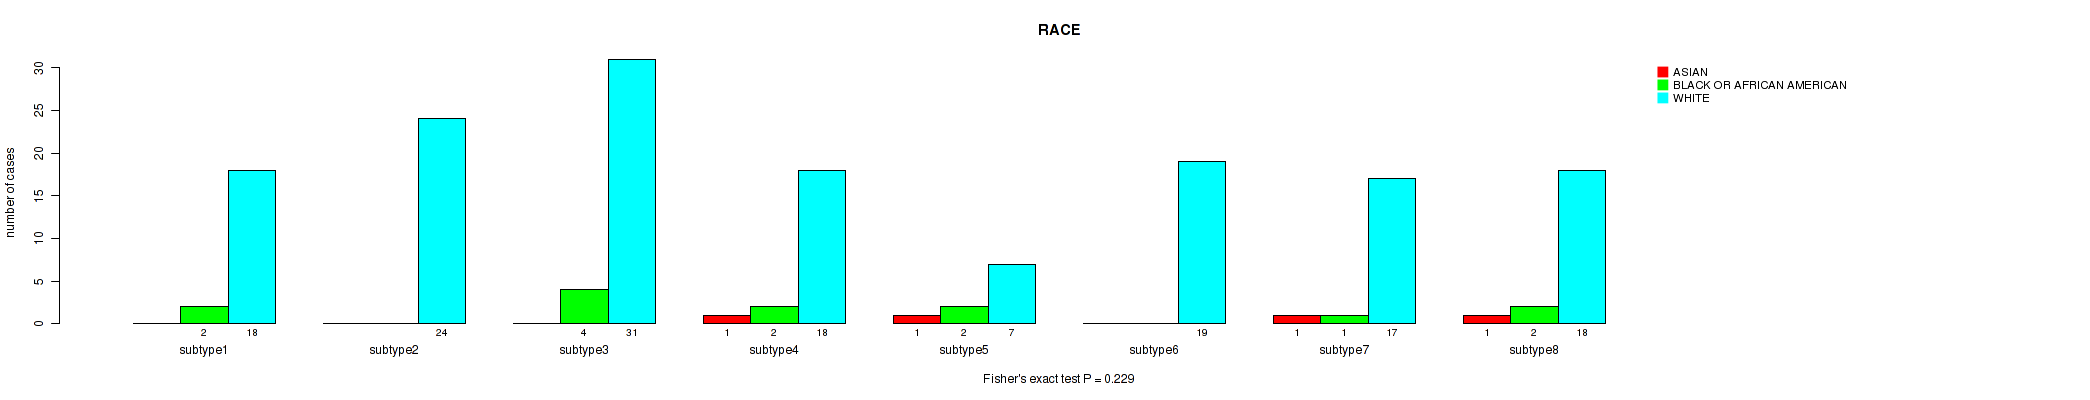
P value = 0.229 (Fisher's exact test), Q value = 0.33
Table S59. Clustering Approach #10: 'MIRseq Mature cHierClus subtypes' versus Clinical Feature #4: 'RACE'
| nPatients | ASIAN | BLACK OR AFRICAN AMERICAN | WHITE |
|---|---|---|---|
| ALL | 4 | 13 | 152 |
| subtype1 | 0 | 2 | 18 |
| subtype2 | 0 | 0 | 24 |
| subtype3 | 0 | 4 | 31 |
| subtype4 | 1 | 2 | 18 |
| subtype5 | 1 | 2 | 7 |
| subtype6 | 0 | 0 | 19 |
| subtype7 | 1 | 1 | 17 |
| subtype8 | 1 | 2 | 18 |
Figure S49. Get High-res Image Clustering Approach #10: 'MIRseq Mature cHierClus subtypes' versus Clinical Feature #4: 'RACE'
P value = 0.251 (Fisher's exact test), Q value = 0.34
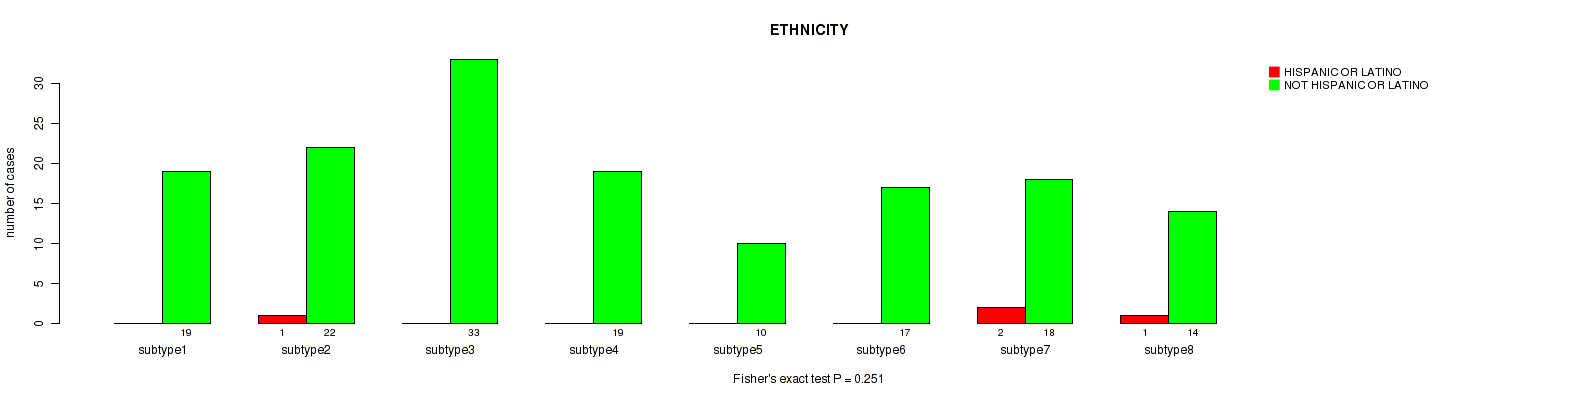
Table S60. Clustering Approach #10: 'MIRseq Mature cHierClus subtypes' versus Clinical Feature #5: 'ETHNICITY'
| nPatients | HISPANIC OR LATINO | NOT HISPANIC OR LATINO |
|---|---|---|
| ALL | 4 | 152 |
| subtype1 | 0 | 19 |
| subtype2 | 1 | 22 |
| subtype3 | 0 | 33 |
| subtype4 | 0 | 19 |
| subtype5 | 0 | 10 |
| subtype6 | 0 | 17 |
| subtype7 | 2 | 18 |
| subtype8 | 1 | 14 |
Figure S50. Get High-res Image Clustering Approach #10: 'MIRseq Mature cHierClus subtypes' versus Clinical Feature #5: 'ETHNICITY'
-
Cluster data file = /xchip/cga/gdac-prod/tcga-gdac/jobResults/GDAC_mergedClustering/SARC-TP/15111074/SARC-TP.mergedcluster.txt
-
Clinical data file = /xchip/cga/gdac-prod/tcga-gdac/jobResults/Append_Data/SARC-TP/15087563/SARC-TP.merged_data.txt
-
Number of patients = 250
-
Number of clustering approaches = 10
-
Number of selected clinical features = 5
-
Exclude small clusters that include fewer than K patients, K = 3
consensus non-negative matrix factorization clustering approach (Brunet et al. 2004)
Resampling-based clustering method (Monti et al. 2003)
For survival clinical features, the Kaplan-Meier survival curves of tumors with and without gene mutations were plotted and the statistical significance P values were estimated by logrank test (Bland and Altman 2004) using the 'survdiff' function in R
For binary clinical features, two-tailed Fisher's exact tests (Fisher 1922) were used to estimate the P values using the 'fisher.test' function in R
For multiple hypothesis correction, Q value is the False Discovery Rate (FDR) analogue of the P value (Benjamini and Hochberg 1995), defined as the minimum FDR at which the test may be called significant. We used the 'Benjamini and Hochberg' method of 'p.adjust' function in R to convert P values into Q values.
In addition to the links below, the full results of the analysis summarized in this report can also be downloaded programmatically using firehose_get, or interactively from either the Broad GDAC website or TCGA Data Coordination Center Portal.