This pipeline computes the correlation between cancer subtypes identified by different molecular patterns and selected clinical features.
Testing the association between subtypes identified by 10 different clustering approaches and 39 clinical features across 307 patients, 63 significant findings detected with P value < 0.05 and Q value < 0.25.
-
3 subtypes identified in current cancer cohort by 'Copy Number Ratio CNMF subtypes'. These subtypes correlate to 'YEARS_TO_BIRTH', 'NEOPLASM_HISTOLOGIC_GRADE', 'MENOPAUSE_STATUS', and 'AGE_AT_DIAGNOSIS'.
-
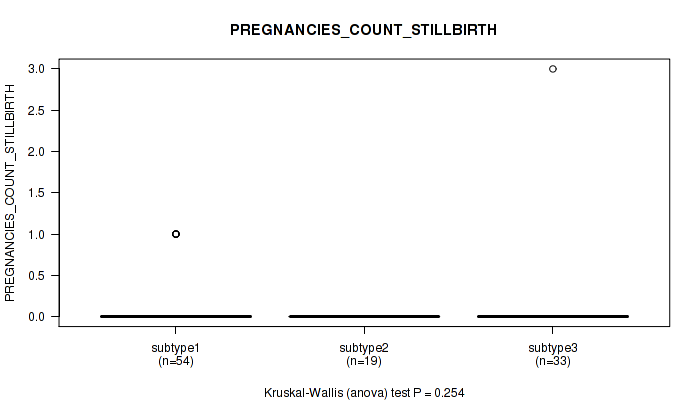
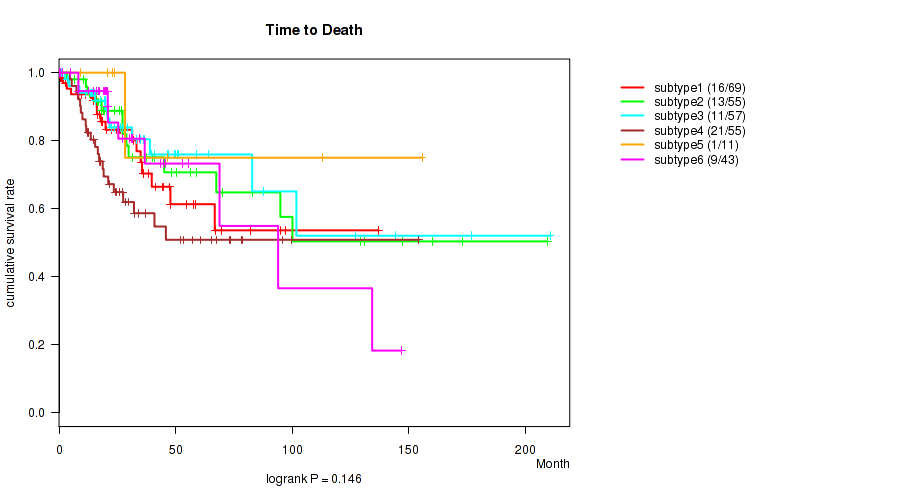
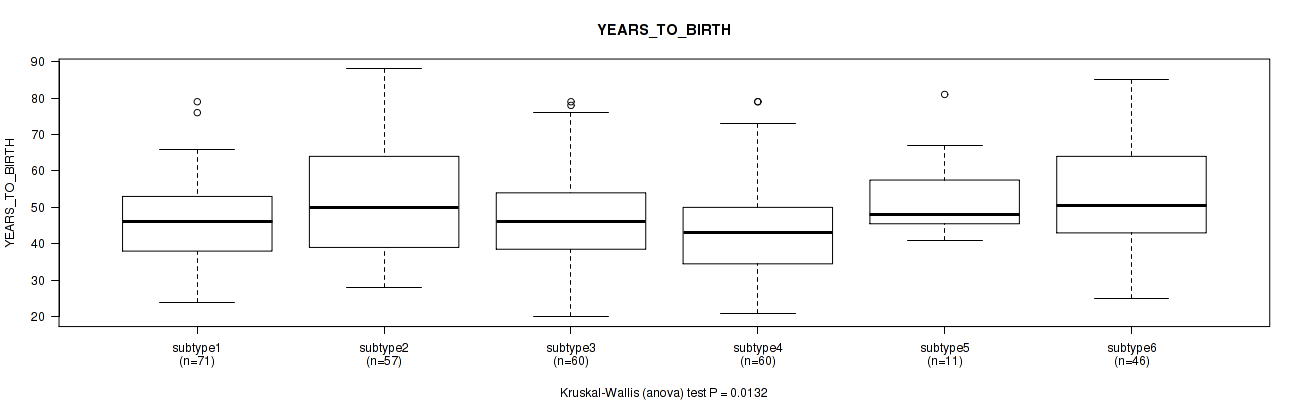
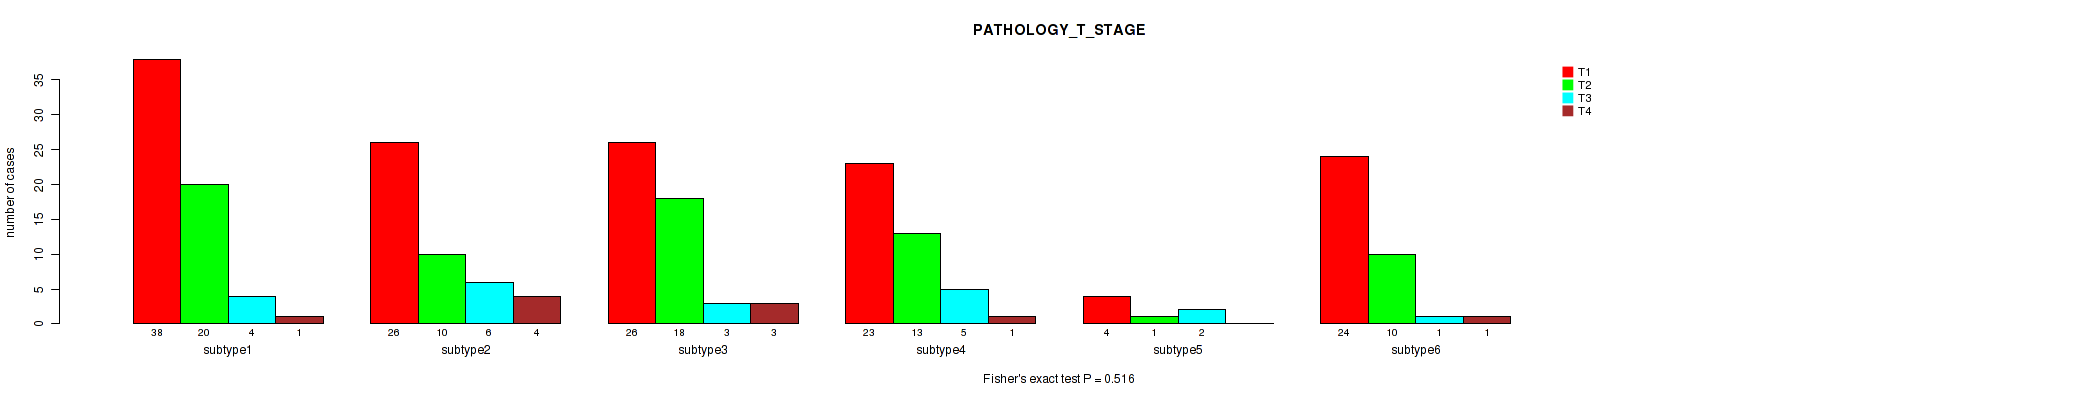
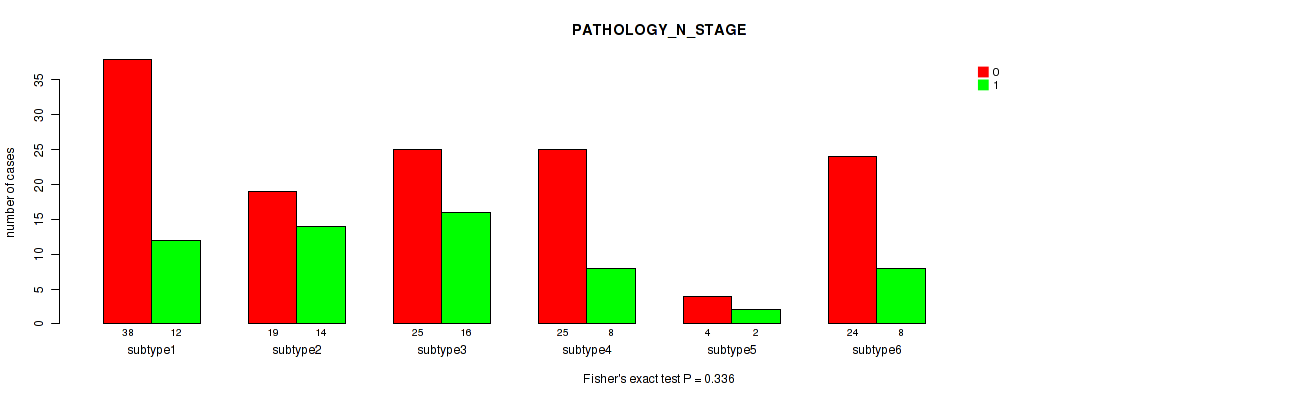
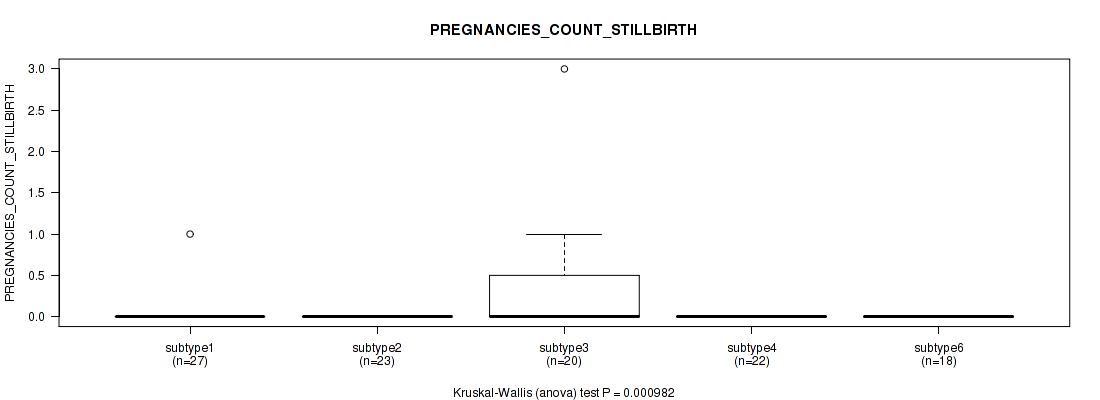
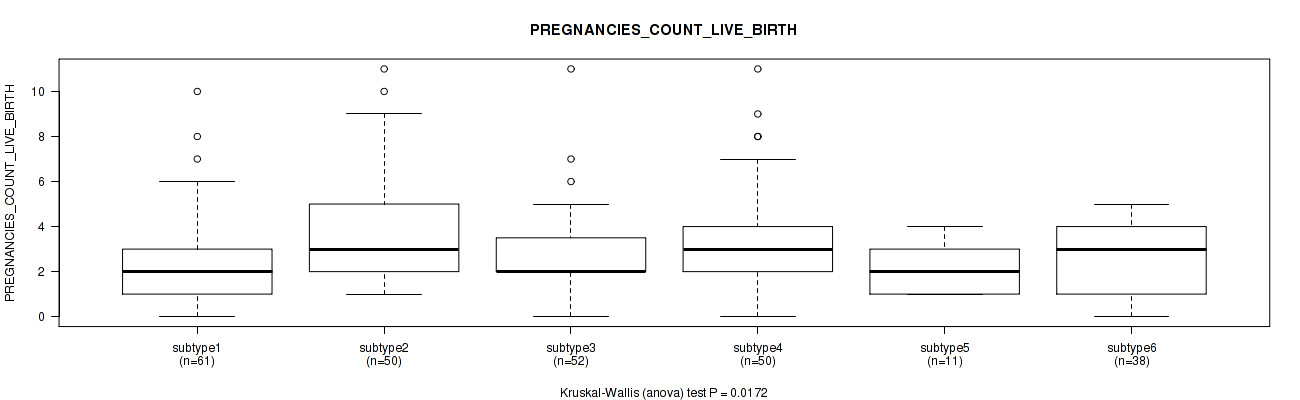
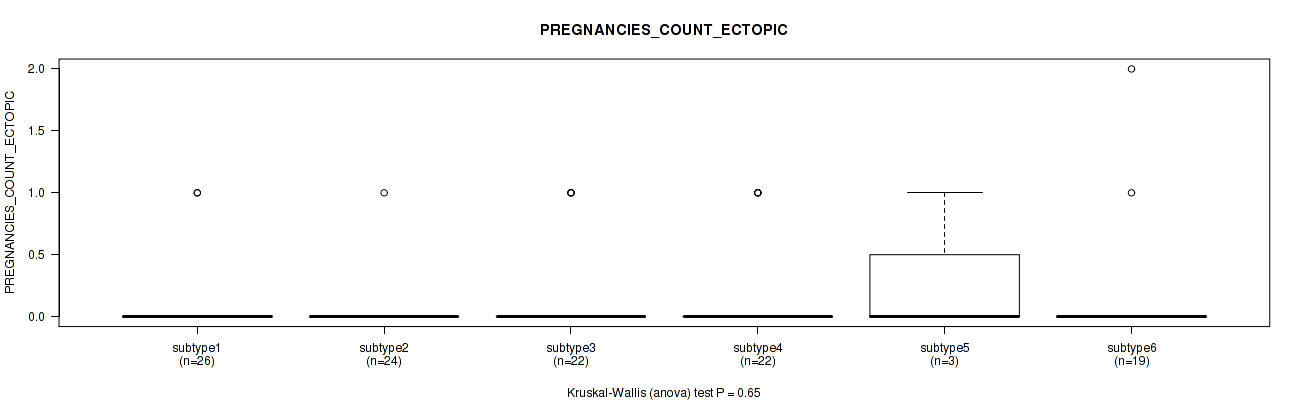
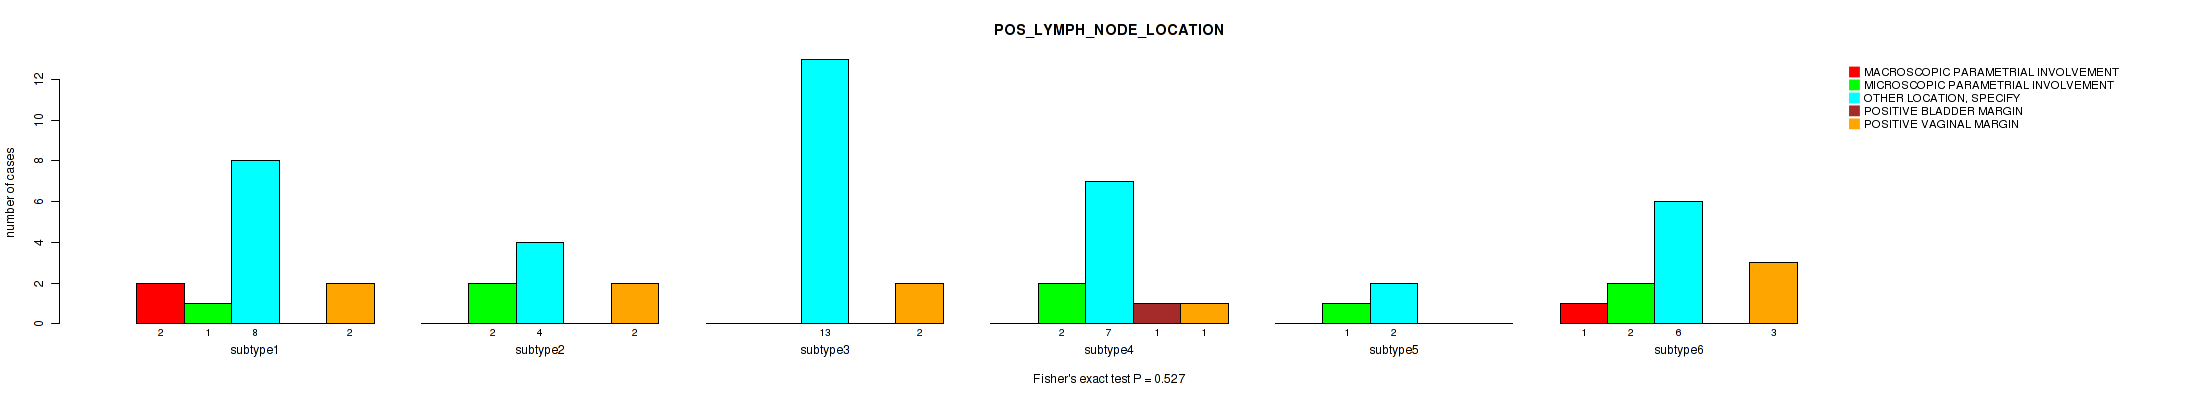
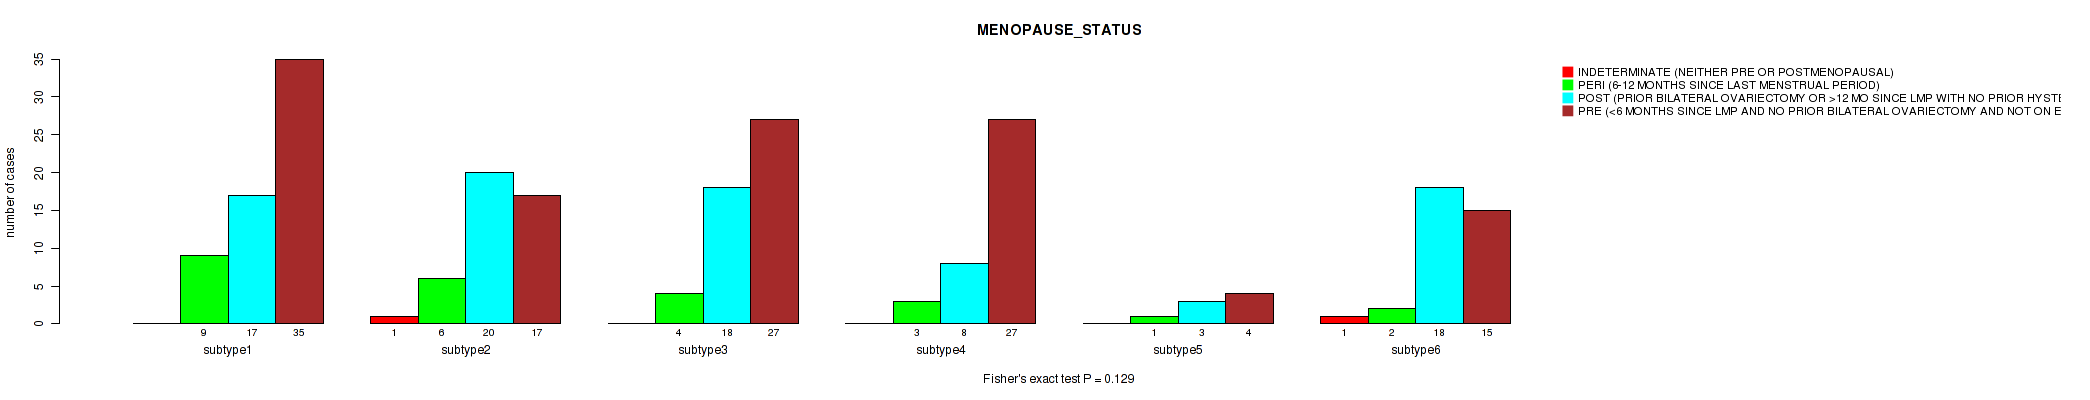
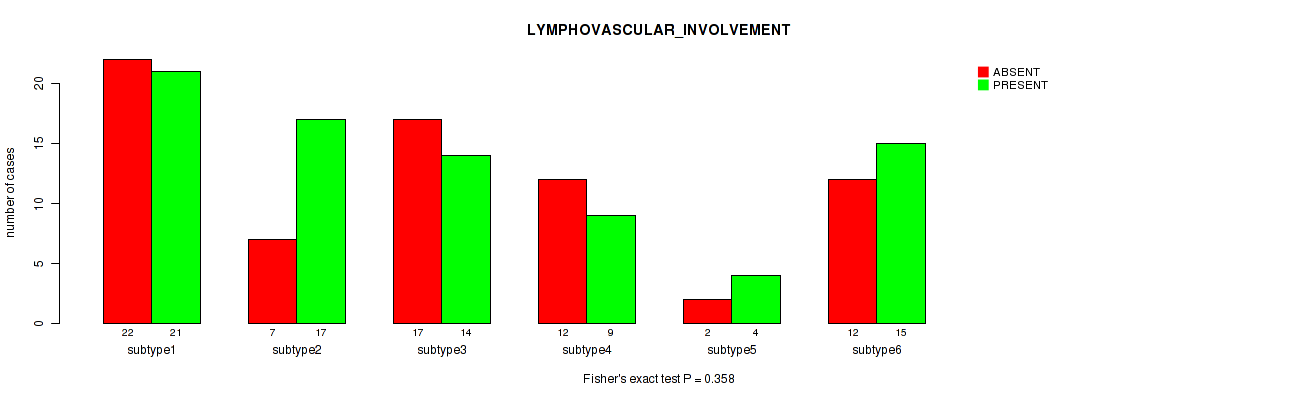
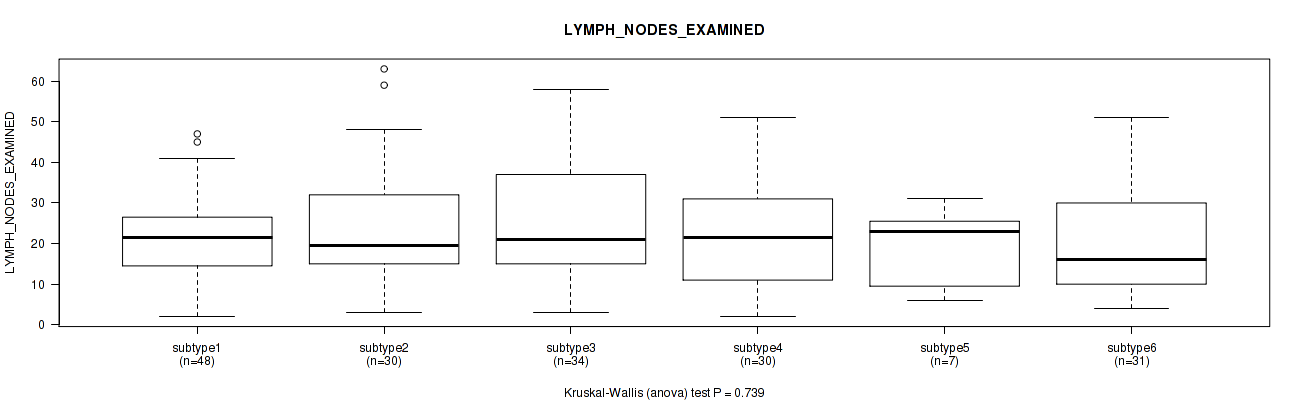
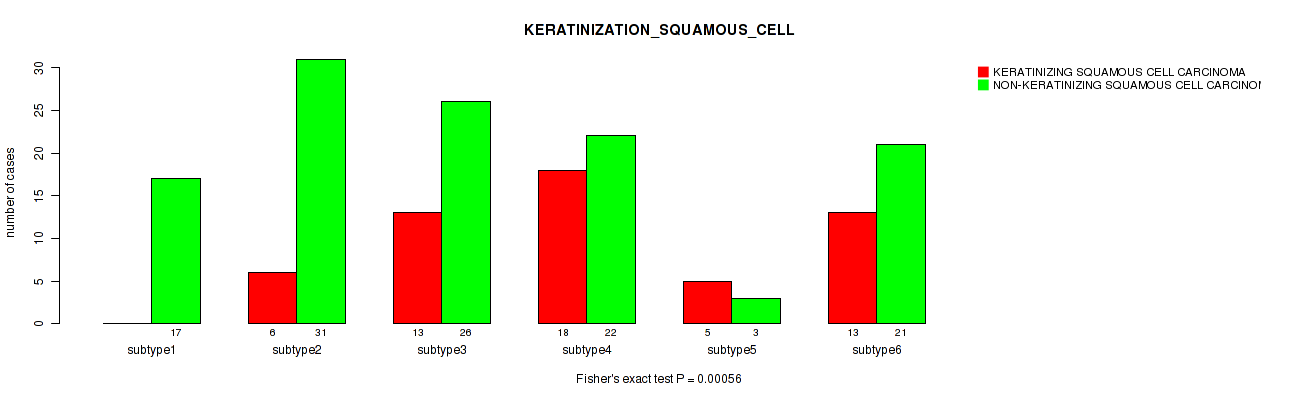
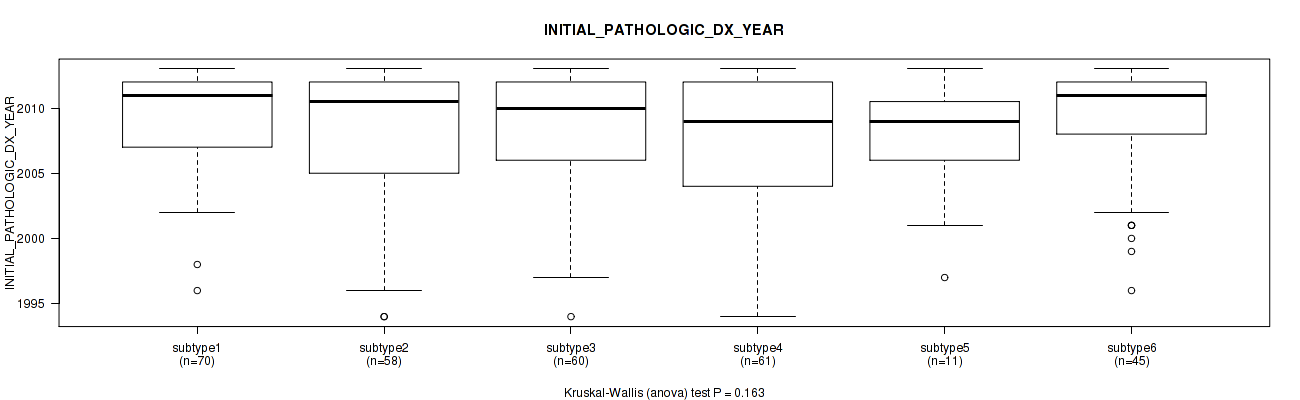
6 subtypes identified in current cancer cohort by 'METHLYATION CNMF'. These subtypes correlate to 'YEARS_TO_BIRTH', 'HISTOLOGICAL_TYPE', 'PREGNANCIES_COUNT_STILLBIRTH', 'PREGNANCIES_COUNT_LIVE_BIRTH', 'KERATINIZATION_SQUAMOUS_CELL', and 'AGE_AT_DIAGNOSIS'.
-
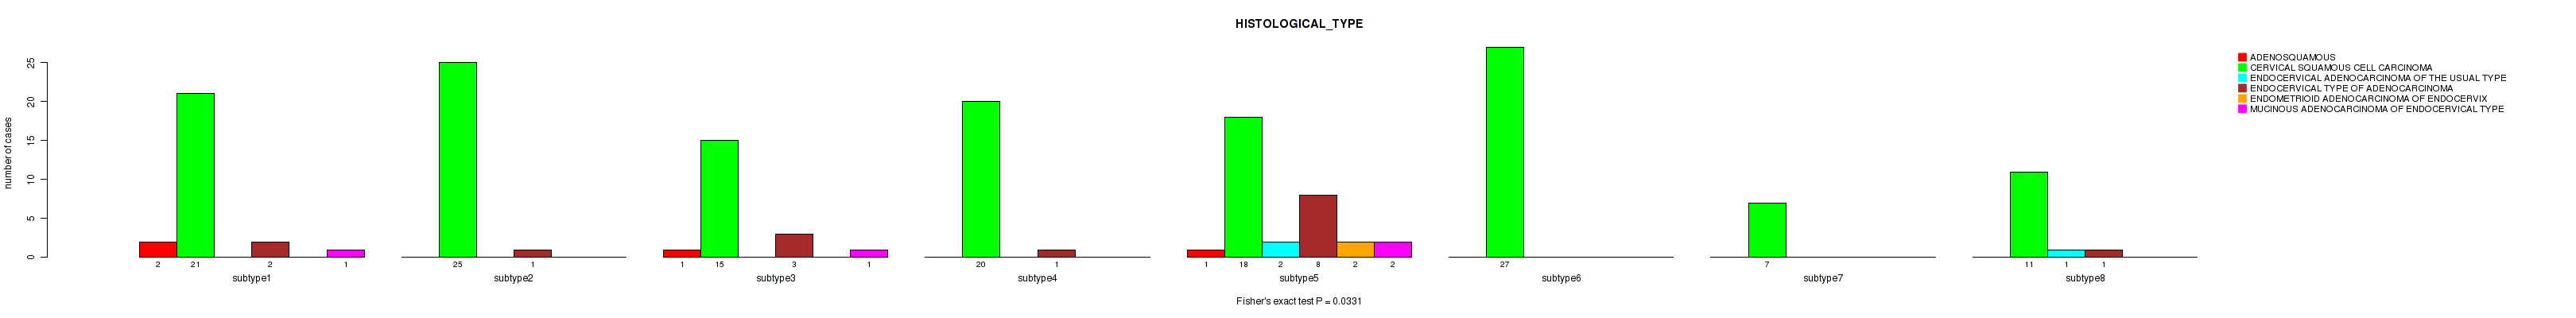
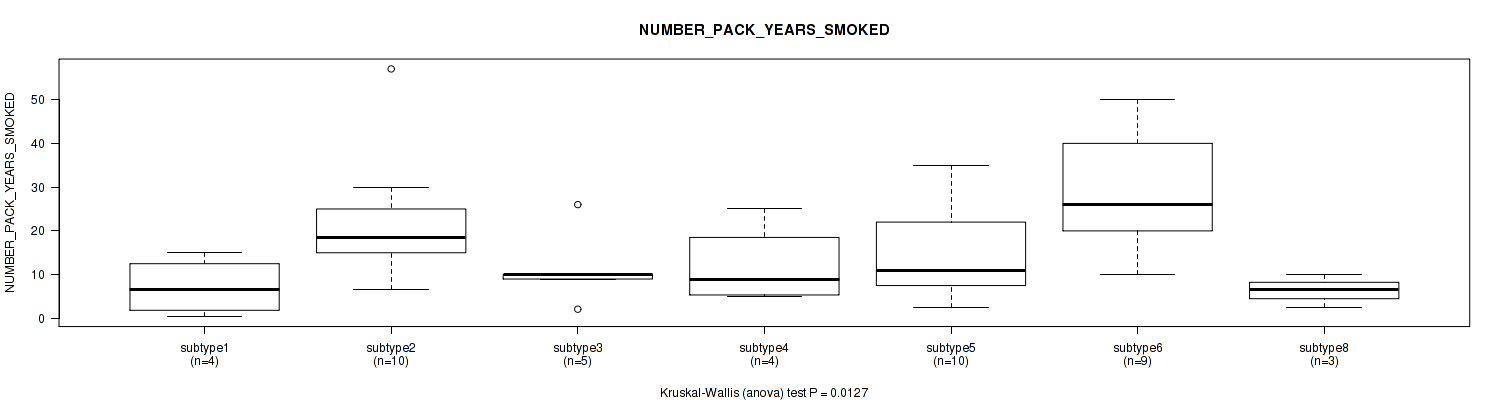
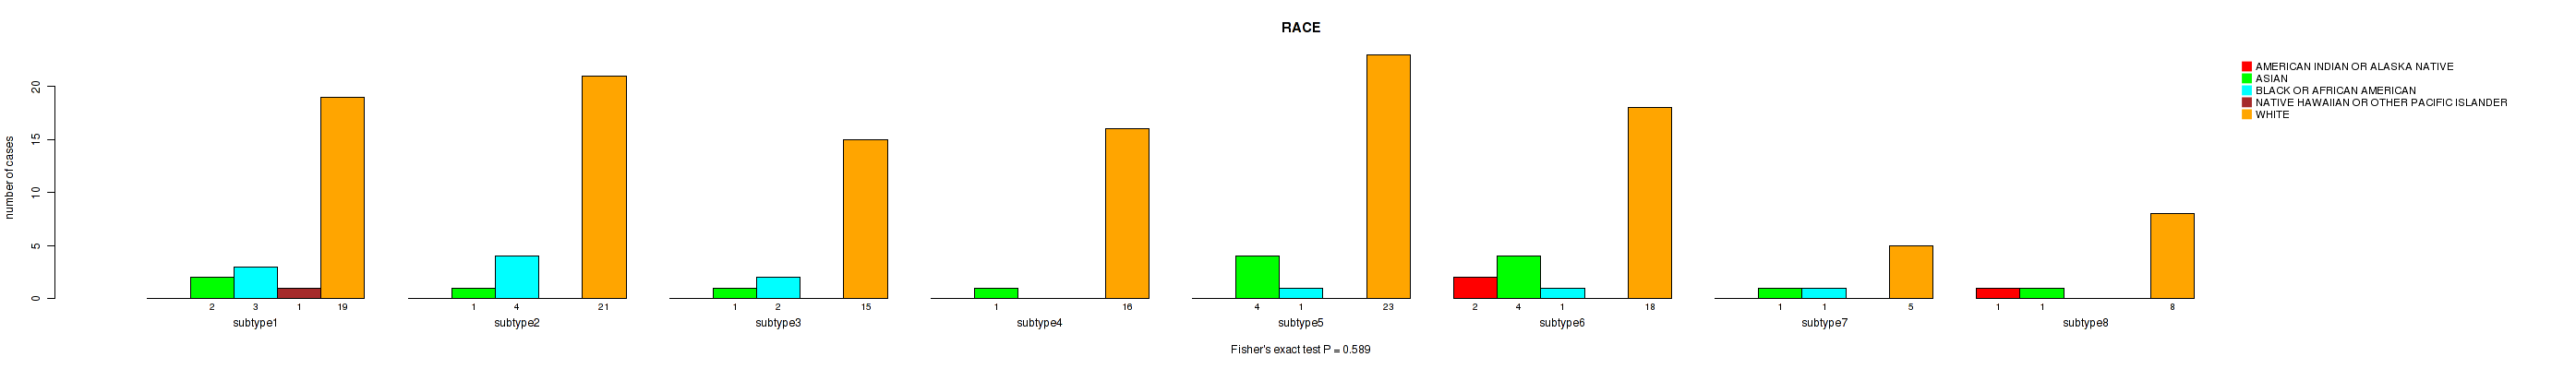
CNMF clustering analysis on RPPA data identified 8 subtypes that correlate to 'Time to Death', 'HISTOLOGICAL_TYPE', 'NUMBER_PACK_YEARS_SMOKED', 'TOBACCO_SMOKING_PACK_YEARS_SMOKED', 'PREGNANCIES_COUNT_TOTAL', and 'PREGNANCIES_COUNT_LIVE_BIRTH'.
-
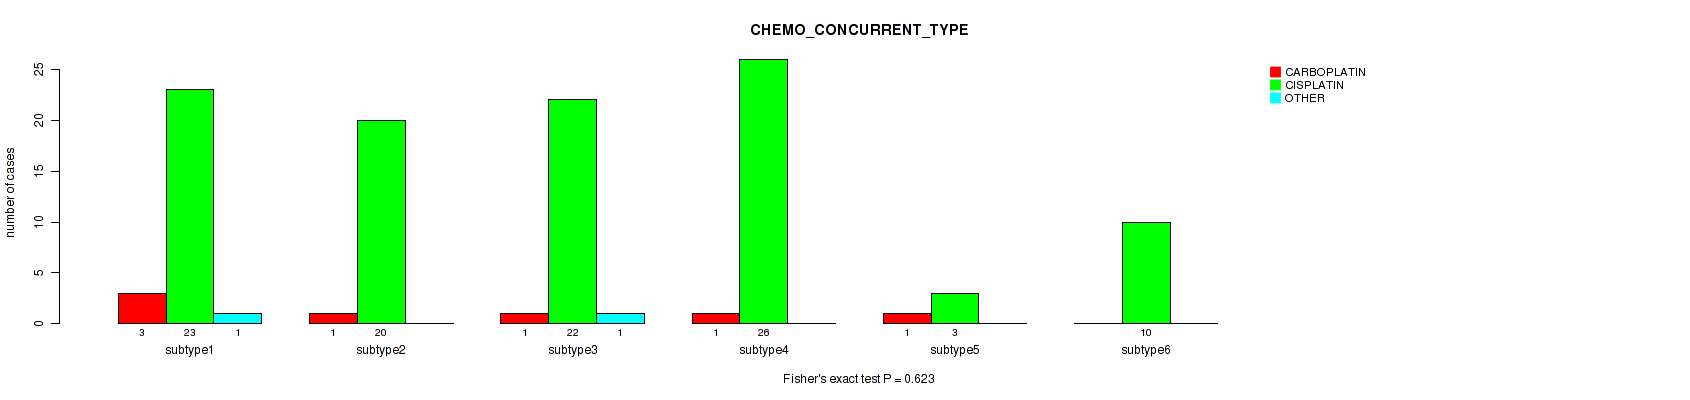
Consensus hierarchical clustering analysis on RPPA data identified 5 subtypes that correlate to 'HISTOLOGICAL_TYPE', 'KERATINIZATION_SQUAMOUS_CELL', and 'CHEMO_CONCURRENT_TYPE'.
-
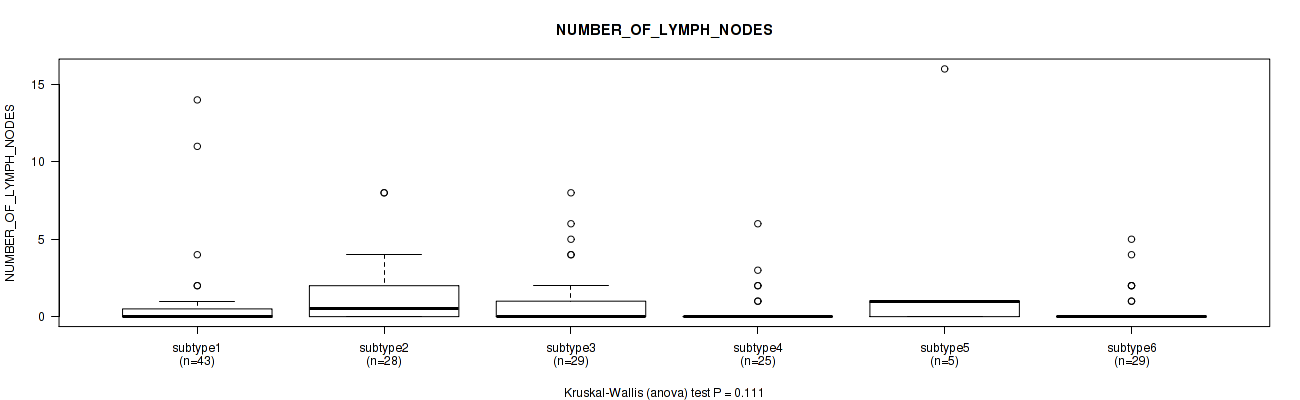
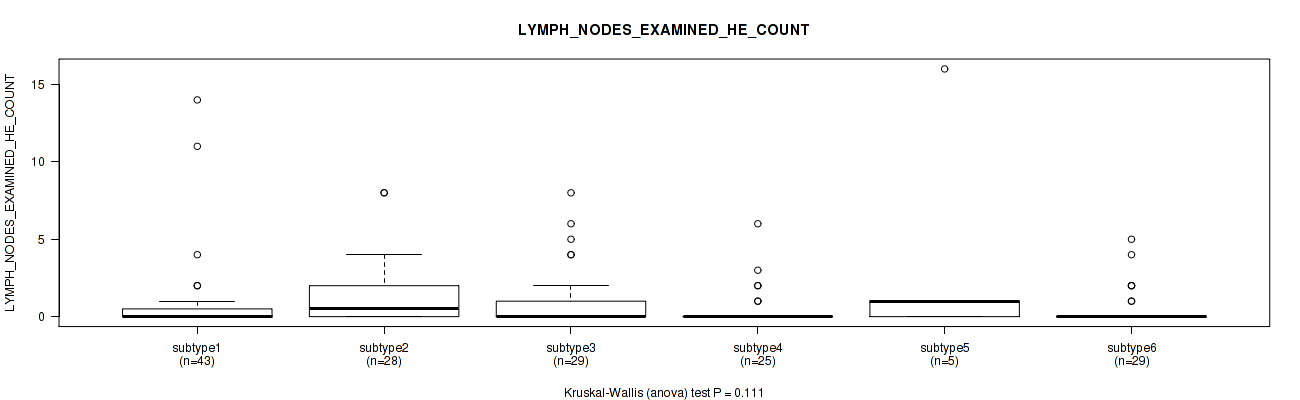
CNMF clustering analysis on sequencing-based mRNA expression data identified 4 subtypes that correlate to 'YEARS_TO_BIRTH', 'HISTOLOGICAL_TYPE', 'NUMBER_OF_LYMPH_NODES', 'RACE', 'NEOPLASM_HISTOLOGIC_GRADE', 'PREGNANCIES_COUNT_TOTAL', 'MENOPAUSE_STATUS', 'LYMPH_NODES_EXAMINED_HE_COUNT', 'KERATINIZATION_SQUAMOUS_CELL', and 'AGE_AT_DIAGNOSIS'.
-
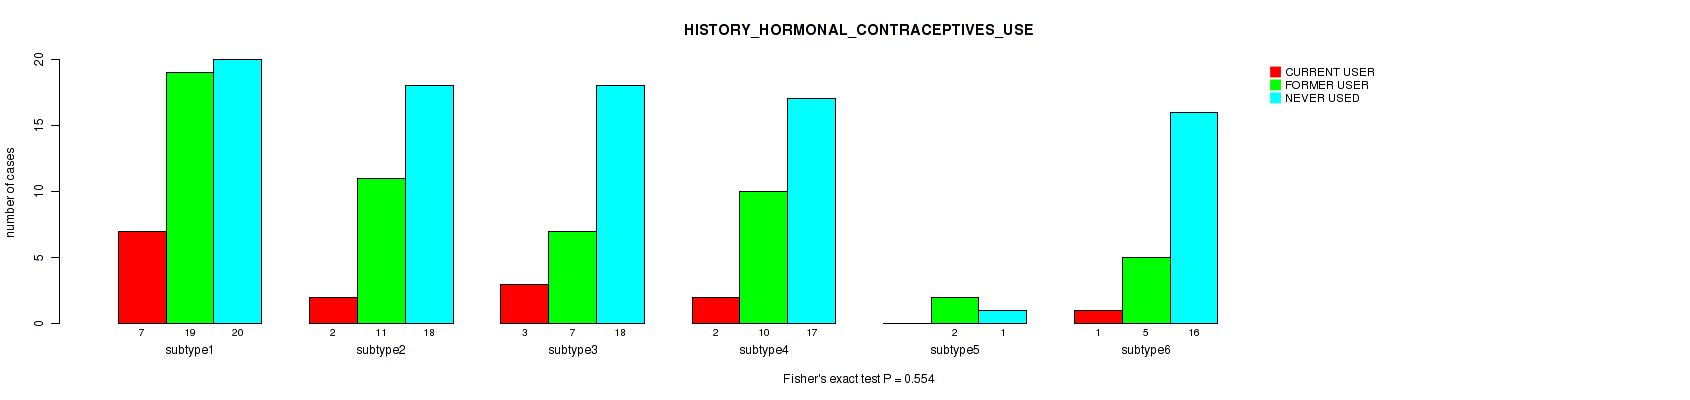
Consensus hierarchical clustering analysis on sequencing-based mRNA expression data identified 3 subtypes that correlate to 'Time to Death', 'YEARS_TO_BIRTH', 'HISTOLOGICAL_TYPE', 'NUMBER_OF_LYMPH_NODES', 'PREGNANCIES_COUNT_LIVE_BIRTH', 'LYMPH_NODES_EXAMINED_HE_COUNT', 'KERATINIZATION_SQUAMOUS_CELL', 'INITIAL_PATHOLOGIC_DX_YEAR', 'HISTORY_HORMONAL_CONTRACEPTIVES_USE', and 'AGE_AT_DIAGNOSIS'.
-
3 subtypes identified in current cancer cohort by 'MIRSEQ CNMF'. These subtypes correlate to 'HISTOLOGICAL_TYPE', 'NEOPLASM_HISTOLOGIC_GRADE', 'PREGNANCY_SPONTANEOUS_ABORTION_COUNT', 'INITIAL_PATHOLOGIC_DX_YEAR', and 'CLINICAL_STAGE'.
-
5 subtypes identified in current cancer cohort by 'MIRSEQ CHIERARCHICAL'. These subtypes correlate to 'YEARS_TO_BIRTH', 'PATHOLOGY_T_STAGE', 'HISTOLOGICAL_TYPE', 'NEOPLASM_HISTOLOGIC_GRADE', 'PREGNANCIES_COUNT_LIVE_BIRTH', 'MENOPAUSE_STATUS', 'INITIAL_PATHOLOGIC_DX_YEAR', 'AGE_AT_DIAGNOSIS', and 'CLINICAL_STAGE'.
-
3 subtypes identified in current cancer cohort by 'MIRseq Mature CNMF subtypes'. These subtypes correlate to 'HISTOLOGICAL_TYPE', 'NEOPLASM_HISTOLOGIC_GRADE', 'KERATINIZATION_SQUAMOUS_CELL', 'INITIAL_PATHOLOGIC_DX_YEAR', and 'CLINICAL_STAGE'.
-
4 subtypes identified in current cancer cohort by 'MIRseq Mature cHierClus subtypes'. These subtypes correlate to 'HISTOLOGICAL_TYPE', 'PREGNANCIES_COUNT_LIVE_BIRTH', 'KERATINIZATION_SQUAMOUS_CELL', 'INITIAL_PATHOLOGIC_DX_YEAR', and 'CHEMO_CONCURRENT_TYPE'.
Table 1. Get Full Table Overview of the association between subtypes identified by 10 different clustering approaches and 39 clinical features. Shown in the table are P values (Q values). Thresholded by P value < 0.05 and Q value < 0.25, 63 significant findings detected.
|
Clinical Features |
Statistical Tests |
Copy Number Ratio CNMF subtypes |
METHLYATION CNMF |
RPPA CNMF subtypes |
RPPA cHierClus subtypes |
RNAseq CNMF subtypes |
RNAseq cHierClus subtypes |
MIRSEQ CNMF |
MIRSEQ CHIERARCHICAL |
MIRseq Mature CNMF subtypes |
MIRseq Mature cHierClus subtypes |
| Time to Death | logrank test |
0.194 (0.517) |
0.146 (0.471) |
0.0162 (0.161) |
0.35 (0.674) |
0.429 (0.725) |
0.0258 (0.198) |
0.499 (0.749) |
0.607 (0.819) |
0.908 (0.957) |
0.938 (0.973) |
| YEARS TO BIRTH | Kruskal-Wallis (anova) |
0.0312 (0.21) |
0.0132 (0.147) |
0.0555 (0.293) |
0.0879 (0.389) |
1.03e-05 (0.000444) |
0.00802 (0.112) |
0.456 (0.737) |
0.000125 (0.00376) |
0.43 (0.725) |
0.894 (0.957) |
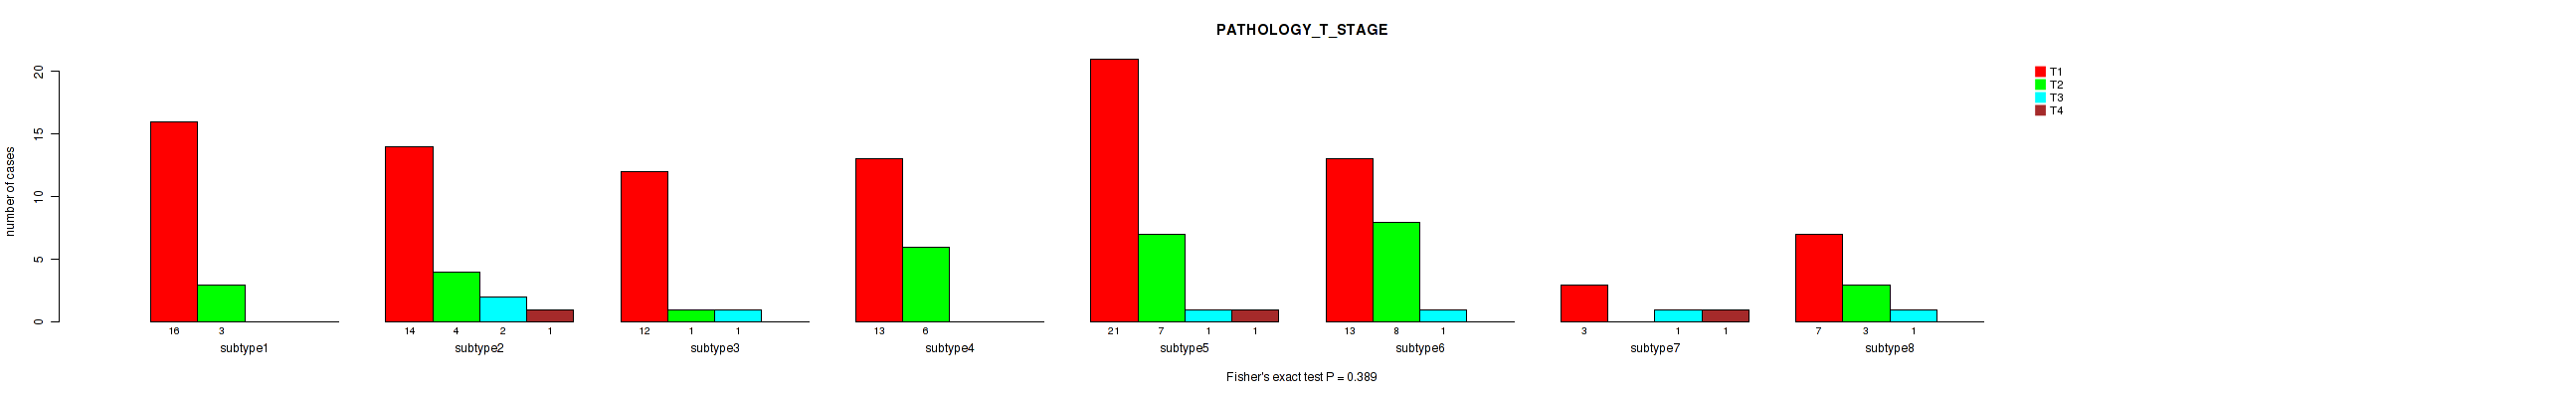
| PATHOLOGY T STAGE | Fisher's exact test |
0.194 (0.517) |
0.516 (0.759) |
0.389 (0.711) |
0.649 (0.826) |
0.613 (0.824) |
0.705 (0.854) |
0.446 (0.737) |
0.00365 (0.0678) |
0.402 (0.711) |
0.465 (0.737) |
| PATHOLOGY N STAGE | Fisher's exact test |
0.147 (0.471) |
0.336 (0.67) |
0.19 (0.517) |
0.21 (0.526) |
0.361 (0.687) |
0.351 (0.674) |
0.688 (0.846) |
0.229 (0.552) |
0.153 (0.479) |
0.189 (0.517) |
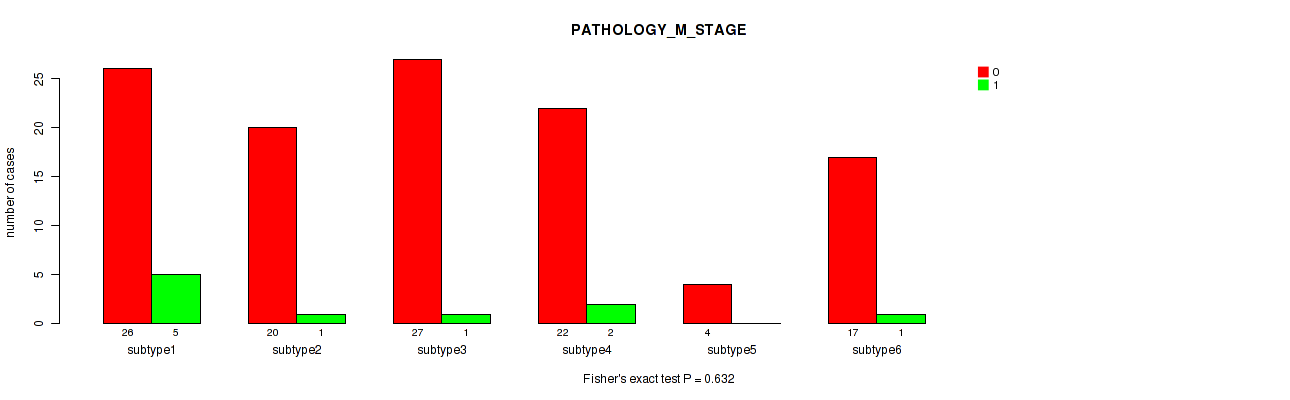
| PATHOLOGY M STAGE | Fisher's exact test |
0.48 (0.737) |
0.632 (0.826) |
0.641 (0.826) |
1 (1.00) |
0.248 (0.576) |
0.0512 (0.283) |
0.219 (0.54) |
0.35 (0.674) |
0.0637 (0.322) |
0.369 (0.689) |
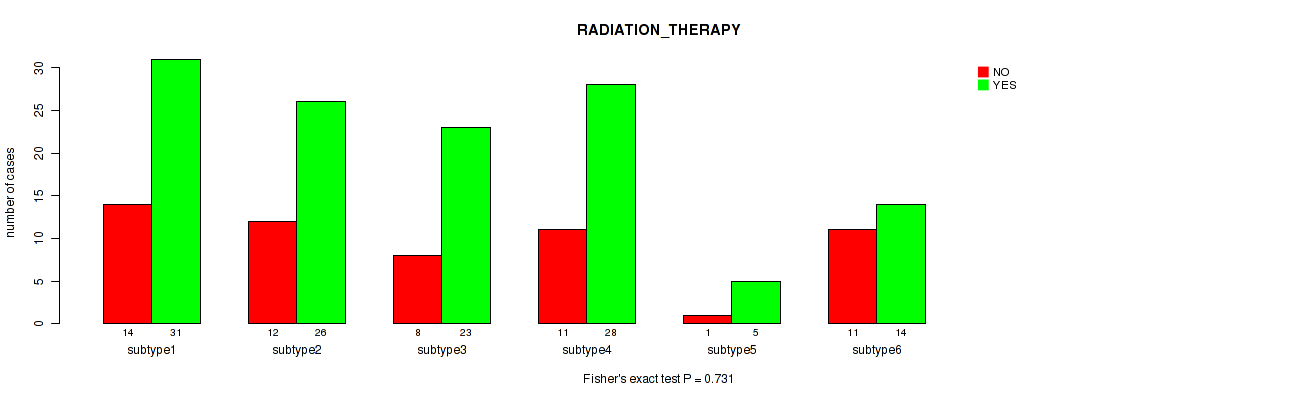
| RADIATION THERAPY | Fisher's exact test |
0.172 (0.508) |
0.731 (0.869) |
0.741 (0.873) |
0.422 (0.725) |
0.955 (0.988) |
0.917 (0.964) |
0.979 (1.00) |
0.417 (0.725) |
0.882 (0.955) |
0.25 (0.576) |
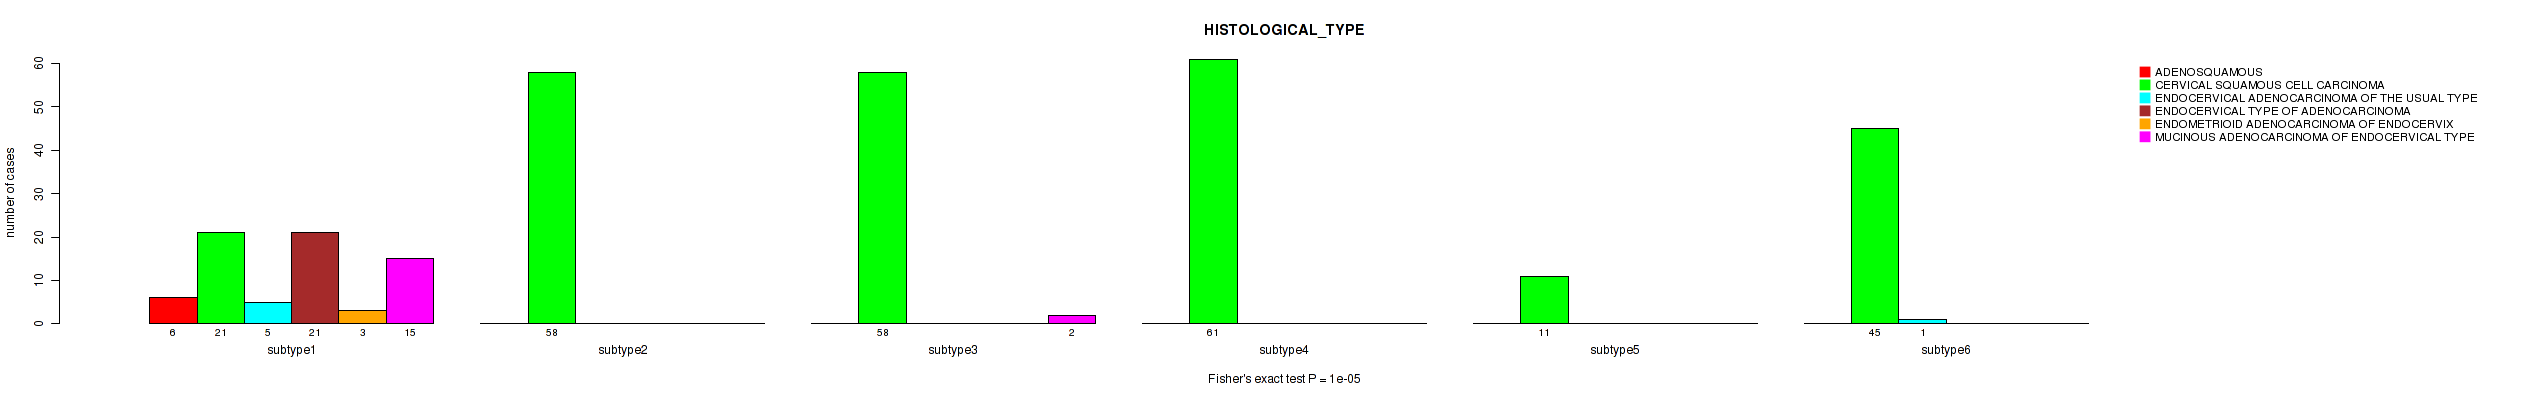
| HISTOLOGICAL TYPE | Fisher's exact test |
0.273 (0.593) |
1e-05 (0.000444) |
0.0331 (0.219) |
0.00417 (0.0739) |
1e-05 (0.000444) |
1e-05 (0.000444) |
1e-05 (0.000444) |
1e-05 (0.000444) |
2e-05 (0.000709) |
1e-05 (0.000444) |
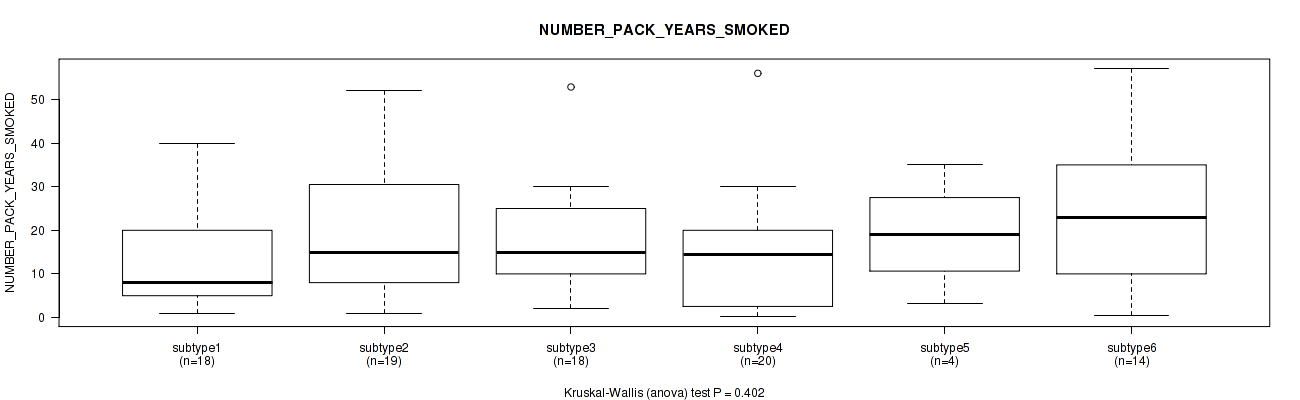
| NUMBER PACK YEARS SMOKED | Kruskal-Wallis (anova) |
0.475 (0.737) |
0.402 (0.711) |
0.0127 (0.146) |
0.54 (0.769) |
0.145 (0.471) |
0.437 (0.728) |
0.0518 (0.283) |
0.157 (0.482) |
0.193 (0.517) |
0.142 (0.471) |
| NUMBER OF LYMPH NODES | Kruskal-Wallis (anova) |
0.209 (0.526) |
0.111 (0.453) |
0.52 (0.759) |
0.177 (0.51) |
0.0109 (0.138) |
0.0308 (0.21) |
0.269 (0.589) |
0.134 (0.47) |
0.178 (0.51) |
0.0805 (0.369) |
| RACE | Fisher's exact test |
0.198 (0.518) |
0.568 (0.782) |
0.589 (0.8) |
0.208 (0.526) |
0.008 (0.112) |
0.307 (0.64) |
0.257 (0.58) |
0.331 (0.667) |
0.119 (0.459) |
0.484 (0.737) |
| ETHNICITY | Fisher's exact test |
0.528 (0.766) |
0.97 (0.996) |
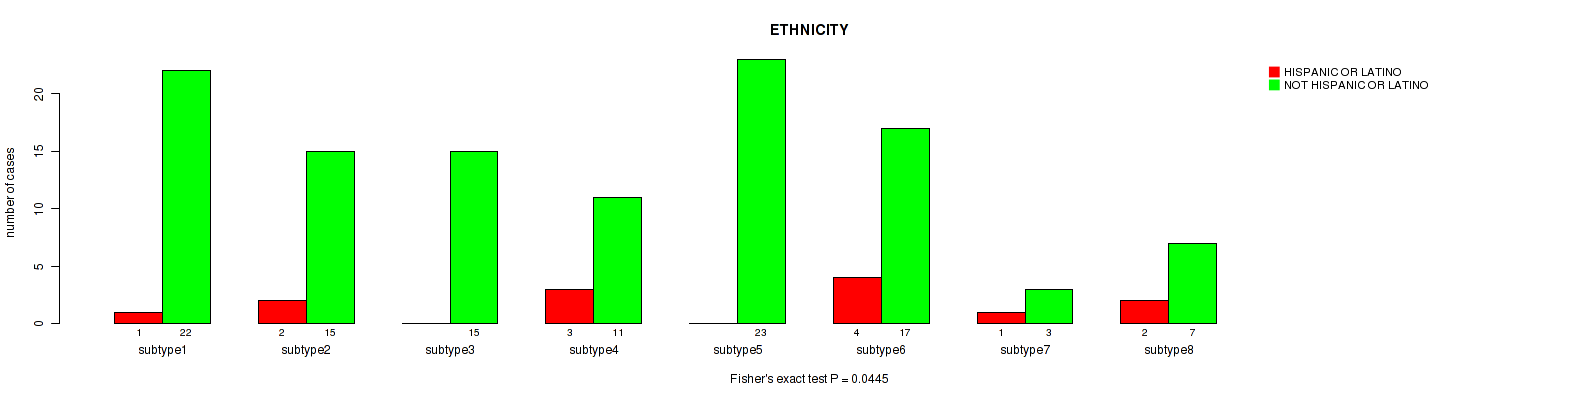
0.0445 (0.267) |
0.474 (0.737) |
0.251 (0.576) |
0.895 (0.957) |
0.601 (0.814) |
0.397 (0.711) |
0.143 (0.471) |
0.468 (0.737) |
| WEIGHT KG AT DIAGNOSIS | Kruskal-Wallis (anova) |
0.493 (0.745) |
0.0887 (0.389) |
0.534 (0.769) |
0.542 (0.769) |
0.651 (0.826) |
0.677 (0.843) |
0.729 (0.869) |
0.933 (0.973) |
0.669 (0.839) |
0.925 (0.97) |
| TUMOR STATUS | Fisher's exact test |
0.122 (0.459) |
0.45 (0.737) |
0.552 (0.772) |
0.455 (0.737) |
0.288 (0.611) |
0.274 (0.593) |
0.213 (0.529) |
0.508 (0.753) |
0.464 (0.737) |
0.493 (0.745) |
| NEOPLASM HISTOLOGIC GRADE | Fisher's exact test |
0.0272 (0.198) |
0.829 (0.934) |
0.206 (0.526) |
0.554 (0.772) |
0.00156 (0.0358) |
0.153 (0.479) |
0.00758 (0.112) |
0.0223 (0.181) |
0.0181 (0.168) |
0.0523 (0.283) |
| TOBACCO SMOKING YEAR STOPPED | Kruskal-Wallis (anova) |
0.193 (0.517) |
0.833 (0.935) |
0.196 (0.517) |
0.706 (0.854) |
0.855 (0.943) |
0.569 (0.782) |
0.313 (0.64) |
0.147 (0.471) |
0.312 (0.64) |
0.254 (0.576) |
| TOBACCO SMOKING PACK YEARS SMOKED | Kruskal-Wallis (anova) |
0.475 (0.737) |
0.402 (0.711) |
0.0127 (0.146) |
0.54 (0.769) |
0.145 (0.471) |
0.437 (0.728) |
0.0518 (0.283) |
0.157 (0.482) |
0.193 (0.517) |
0.142 (0.471) |
| TOBACCO SMOKING HISTORY | Fisher's exact test |
0.502 (0.75) |
0.238 (0.562) |
0.679 (0.843) |
0.701 (0.854) |
0.397 (0.711) |
0.313 (0.64) |
0.103 (0.442) |
0.367 (0.689) |
0.0428 (0.261) |
0.287 (0.611) |
| AGEBEGANSMOKINGINYEARS | Kruskal-Wallis (anova) |
0.332 (0.667) |
0.443 (0.736) |
0.887 (0.957) |
0.808 (0.923) |
0.431 (0.725) |
0.655 (0.826) |
0.846 (0.94) |
0.764 (0.89) |
0.685 (0.846) |
0.899 (0.957) |
| RADIATION THERAPY STATUS | Fisher's exact test |
0.262 (0.583) |
0.904 (0.957) |
0.857 (0.943) |
1 (1.00) |
0.735 (0.871) |
1 (1.00) |
0.393 (0.711) |
0.858 (0.943) |
1 (1.00) |
0.459 (0.737) |
| PREGNANCIES COUNT TOTAL | Kruskal-Wallis (anova) |
0.403 (0.711) |
0.261 (0.583) |
0.0312 (0.21) |
0.622 (0.826) |
0.0401 (0.248) |
0.0475 (0.276) |
0.698 (0.853) |
0.0673 (0.332) |
0.728 (0.869) |
0.135 (0.47) |
| PREGNANCIES COUNT STILLBIRTH | Kruskal-Wallis (anova) |
0.254 (0.576) |
0.000982 (0.0239) |
0.58 (0.791) |
0.224 (0.547) |
0.164 (0.491) |
0.574 (0.785) |
0.844 (0.94) |
0.481 (0.737) |
0.196 (0.517) |
0.193 (0.517) |
| PREGNANCY SPONTANEOUS ABORTION COUNT | Kruskal-Wallis (anova) |
0.834 (0.935) |
0.908 (0.957) |
0.0872 (0.389) |
0.809 (0.923) |
0.815 (0.924) |
0.13 (0.469) |
0.00548 (0.0928) |
0.179 (0.511) |
0.277 (0.598) |
0.128 (0.469) |
| PREGNANCIES COUNT LIVE BIRTH | Kruskal-Wallis (anova) |
0.477 (0.737) |
0.0172 (0.164) |
0.0127 (0.146) |
0.114 (0.455) |
0.0499 (0.283) |
0.0188 (0.17) |
0.787 (0.914) |
0.016 (0.161) |
0.72 (0.864) |
0.0205 (0.179) |
| PREGNANCY THERAPEUTIC ABORTION COUNT | Kruskal-Wallis (anova) |
0.865 (0.948) |
0.34 (0.67) |
0.152 (0.479) |
0.655 (0.826) |
0.792 (0.917) |
0.616 (0.825) |
0.497 (0.748) |
0.936 (0.973) |
0.668 (0.839) |
0.804 (0.922) |
| PREGNANCIES COUNT ECTOPIC | Kruskal-Wallis (anova) |
0.201 (0.52) |
0.65 (0.826) |
0.568 (0.782) |
0.638 (0.826) |
0.617 (0.825) |
0.855 (0.943) |
0.306 (0.64) |
0.958 (0.988) |
0.989 (1.00) |
0.629 (0.826) |
| POS LYMPH NODE LOCATION | Fisher's exact test |
0.717 (0.864) |
0.527 (0.766) |
0.42 (0.725) |
0.368 (0.689) |
0.43 (0.725) |
0.76 (0.89) |
0.707 (0.854) |
0.568 (0.782) |
0.802 (0.922) |
0.693 (0.85) |
| MENOPAUSE STATUS | Fisher's exact test |
0.00948 (0.127) |
0.129 (0.469) |
0.541 (0.769) |
0.763 (0.89) |
0.0243 (0.189) |
0.0463 (0.274) |
0.465 (0.737) |
0.0141 (0.149) |
0.241 (0.566) |
0.301 (0.635) |
| LYMPHOVASCULAR INVOLVEMENT | Fisher's exact test |
0.192 (0.517) |
0.358 (0.684) |
0.0813 (0.369) |
0.423 (0.725) |
0.639 (0.826) |
0.639 (0.826) |
0.635 (0.826) |
0.378 (0.701) |
0.871 (0.952) |
0.0807 (0.369) |
| LYMPH NODES EXAMINED HE COUNT | Kruskal-Wallis (anova) |
0.209 (0.526) |
0.111 (0.453) |
0.52 (0.759) |
0.177 (0.51) |
0.0109 (0.138) |
0.0308 (0.21) |
0.269 (0.589) |
0.134 (0.47) |
0.178 (0.51) |
0.0805 (0.369) |
| LYMPH NODES EXAMINED | Kruskal-Wallis (anova) |
0.471 (0.737) |
0.739 (0.873) |
0.0598 (0.307) |
0.236 (0.562) |
0.114 (0.455) |
0.342 (0.67) |
0.645 (0.826) |
0.319 (0.648) |
0.28 (0.6) |
0.746 (0.877) |
| KERATINIZATION SQUAMOUS CELL | Fisher's exact test |
1 (1.00) |
0.00056 (0.0156) |
0.896 (0.957) |
0.0395 (0.248) |
0.0275 (0.198) |
0.00364 (0.0678) |
0.107 (0.447) |
0.122 (0.459) |
0.0337 (0.219) |
0.0268 (0.198) |
| INITIAL PATHOLOGIC DX YEAR | Kruskal-Wallis (anova) |
0.39 (0.711) |
0.163 (0.491) |
0.879 (0.955) |
0.841 (0.94) |
0.266 (0.589) |
0.0135 (0.147) |
0.0032 (0.0678) |
0.0235 (0.187) |
3.4e-06 (0.000444) |
3.14e-08 (1.22e-05) |
| HISTORY HORMONAL CONTRACEPTIVES USE | Fisher's exact test |
0.391 (0.711) |
0.554 (0.772) |
0.804 (0.922) |
0.553 (0.772) |
0.11 (0.453) |
0.0343 (0.219) |
0.653 (0.826) |
0.313 (0.64) |
0.676 (0.843) |
0.347 (0.674) |
| HEIGHT CM AT DIAGNOSIS | Kruskal-Wallis (anova) |
0.0962 (0.417) |
0.132 (0.47) |
0.879 (0.955) |
0.167 (0.496) |
0.369 (0.689) |
0.146 (0.471) |
0.963 (0.991) |
0.686 (0.846) |
0.554 (0.772) |
0.929 (0.972) |
| CORPUS INVOLVEMENT | Fisher's exact test |
0.426 (0.725) |
0.405 (0.711) |
0.985 (1.00) |
0.456 (0.737) |
0.055 (0.293) |
0.337 (0.67) |
0.633 (0.826) |
0.34 (0.67) |
0.815 (0.924) |
0.484 (0.737) |
| CHEMO CONCURRENT TYPE | Fisher's exact test |
0.226 (0.547) |
0.623 (0.826) |
0.82 (0.927) |
0.00356 (0.0678) |
0.397 (0.711) |
0.117 (0.458) |
0.891 (0.957) |
0.46 (0.737) |
0.535 (0.769) |
0.0215 (0.179) |
| CERVIX SUV RESULTS | Kruskal-Wallis (anova) |
0.121 (0.459) |
0.0803 (0.369) |
0.231 (0.554) |
0.226 (0.547) |
0.141 (0.471) |
0.242 (0.566) |
0.479 (0.737) |
0.0797 (0.369) |
||
| AGE AT DIAGNOSIS | Kruskal-Wallis (anova) |
0.0214 (0.179) |
0.0165 (0.161) |
0.0592 (0.307) |
0.117 (0.458) |
1.58e-05 (0.000616) |
0.00655 (0.106) |
0.514 (0.759) |
9.35e-05 (0.00304) |
0.406 (0.711) |
0.906 (0.957) |
| CLINICAL STAGE | Fisher's exact test |
0.201 (0.52) |
0.0656 (0.328) |
0.507 (0.753) |
0.127 (0.469) |
0.0688 (0.336) |
0.105 (0.445) |
0.0215 (0.179) |
0.00066 (0.0172) |
0.00682 (0.106) |
0.163 (0.491) |
Table S1. Description of clustering approach #1: 'Copy Number Ratio CNMF subtypes'
| Cluster Labels | 1 | 2 | 3 |
|---|---|---|---|
| Number of samples | 129 | 73 | 93 |
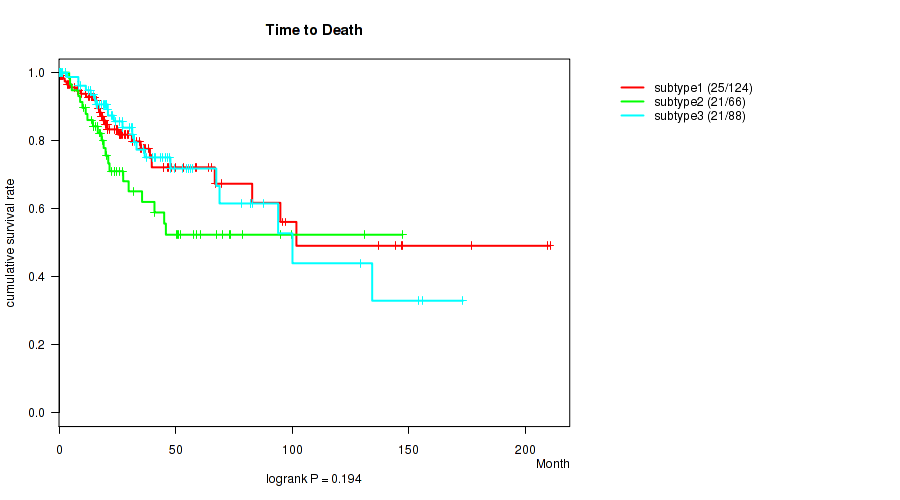
P value = 0.194 (logrank test), Q value = 0.52
Table S2. Clustering Approach #1: 'Copy Number Ratio CNMF subtypes' versus Clinical Feature #1: 'Time to Death'
| nPatients | nDeath | Duration Range (Median), Month | |
|---|---|---|---|
| ALL | 278 | 67 | 0.0 - 210.7 (23.2) |
| subtype1 | 124 | 25 | 0.1 - 210.7 (20.8) |
| subtype2 | 66 | 21 | 0.4 - 147.3 (20.7) |
| subtype3 | 88 | 21 | 0.0 - 173.3 (27.3) |
Figure S1. Get High-res Image Clustering Approach #1: 'Copy Number Ratio CNMF subtypes' versus Clinical Feature #1: 'Time to Death'
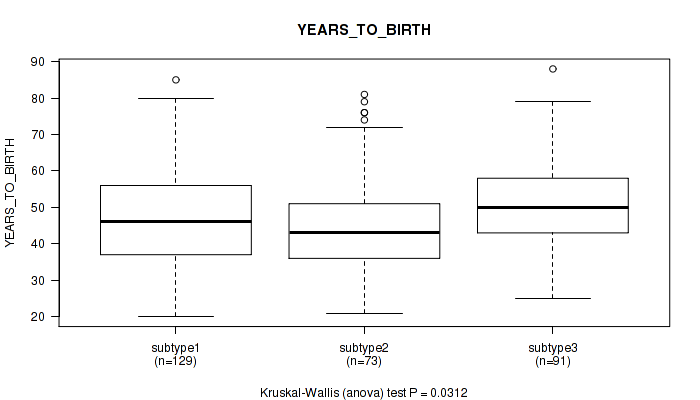
P value = 0.0312 (Kruskal-Wallis (anova)), Q value = 0.21
Table S3. Clustering Approach #1: 'Copy Number Ratio CNMF subtypes' versus Clinical Feature #2: 'YEARS_TO_BIRTH'
| nPatients | Mean (Std.Dev) | |
|---|---|---|
| ALL | 293 | 48.1 (13.8) |
| subtype1 | 129 | 47.7 (14.5) |
| subtype2 | 73 | 45.8 (14.4) |
| subtype3 | 91 | 50.5 (12.0) |
Figure S2. Get High-res Image Clustering Approach #1: 'Copy Number Ratio CNMF subtypes' versus Clinical Feature #2: 'YEARS_TO_BIRTH'
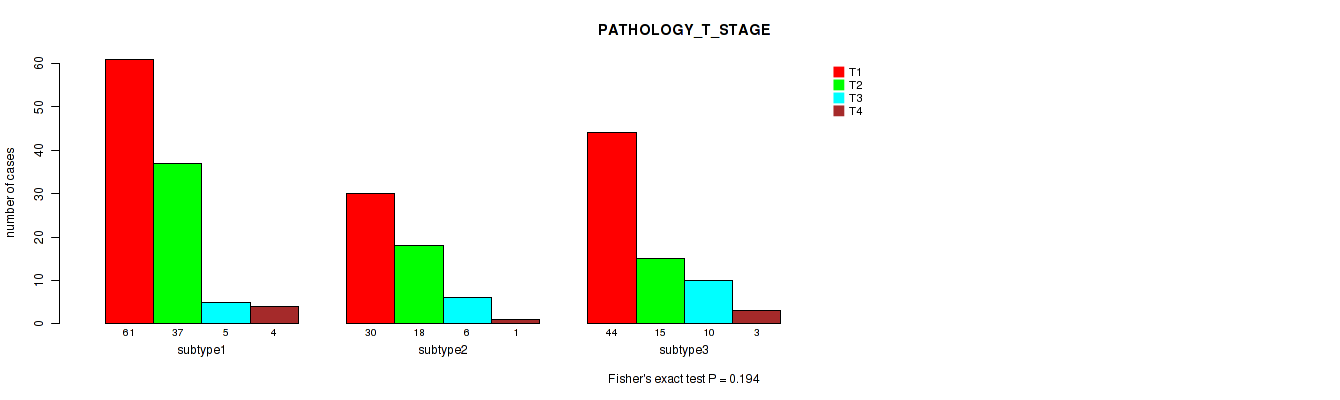
P value = 0.194 (Fisher's exact test), Q value = 0.52
Table S4. Clustering Approach #1: 'Copy Number Ratio CNMF subtypes' versus Clinical Feature #3: 'PATHOLOGY_T_STAGE'
| nPatients | T1 | T2 | T3 | T4 |
|---|---|---|---|---|
| ALL | 135 | 70 | 21 | 8 |
| subtype1 | 61 | 37 | 5 | 4 |
| subtype2 | 30 | 18 | 6 | 1 |
| subtype3 | 44 | 15 | 10 | 3 |
Figure S3. Get High-res Image Clustering Approach #1: 'Copy Number Ratio CNMF subtypes' versus Clinical Feature #3: 'PATHOLOGY_T_STAGE'
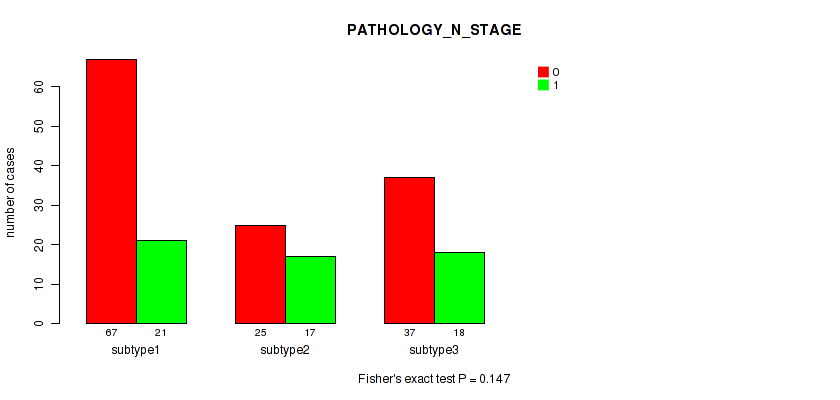
P value = 0.147 (Fisher's exact test), Q value = 0.47
Table S5. Clustering Approach #1: 'Copy Number Ratio CNMF subtypes' versus Clinical Feature #4: 'PATHOLOGY_N_STAGE'
| nPatients | 0 | 1 |
|---|---|---|
| ALL | 129 | 56 |
| subtype1 | 67 | 21 |
| subtype2 | 25 | 17 |
| subtype3 | 37 | 18 |
Figure S4. Get High-res Image Clustering Approach #1: 'Copy Number Ratio CNMF subtypes' versus Clinical Feature #4: 'PATHOLOGY_N_STAGE'
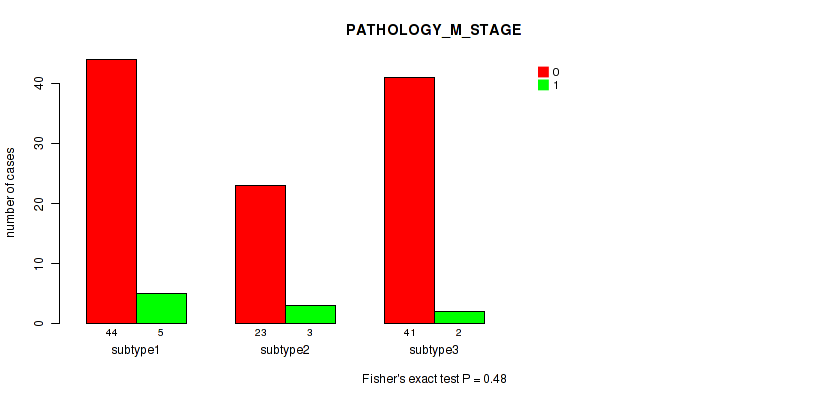
P value = 0.48 (Fisher's exact test), Q value = 0.74
Table S6. Clustering Approach #1: 'Copy Number Ratio CNMF subtypes' versus Clinical Feature #5: 'PATHOLOGY_M_STAGE'
| nPatients | 0 | 1 |
|---|---|---|
| ALL | 108 | 10 |
| subtype1 | 44 | 5 |
| subtype2 | 23 | 3 |
| subtype3 | 41 | 2 |
Figure S5. Get High-res Image Clustering Approach #1: 'Copy Number Ratio CNMF subtypes' versus Clinical Feature #5: 'PATHOLOGY_M_STAGE'
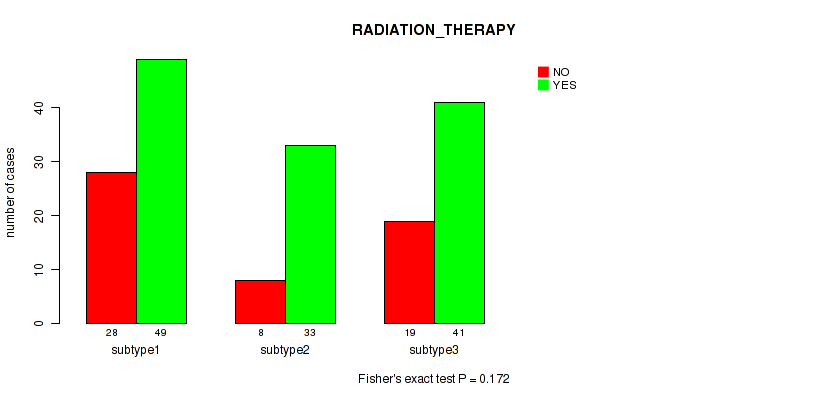
P value = 0.172 (Fisher's exact test), Q value = 0.51
Table S7. Clustering Approach #1: 'Copy Number Ratio CNMF subtypes' versus Clinical Feature #6: 'RADIATION_THERAPY'
| nPatients | NO | YES |
|---|---|---|
| ALL | 55 | 123 |
| subtype1 | 28 | 49 |
| subtype2 | 8 | 33 |
| subtype3 | 19 | 41 |
Figure S6. Get High-res Image Clustering Approach #1: 'Copy Number Ratio CNMF subtypes' versus Clinical Feature #6: 'RADIATION_THERAPY'
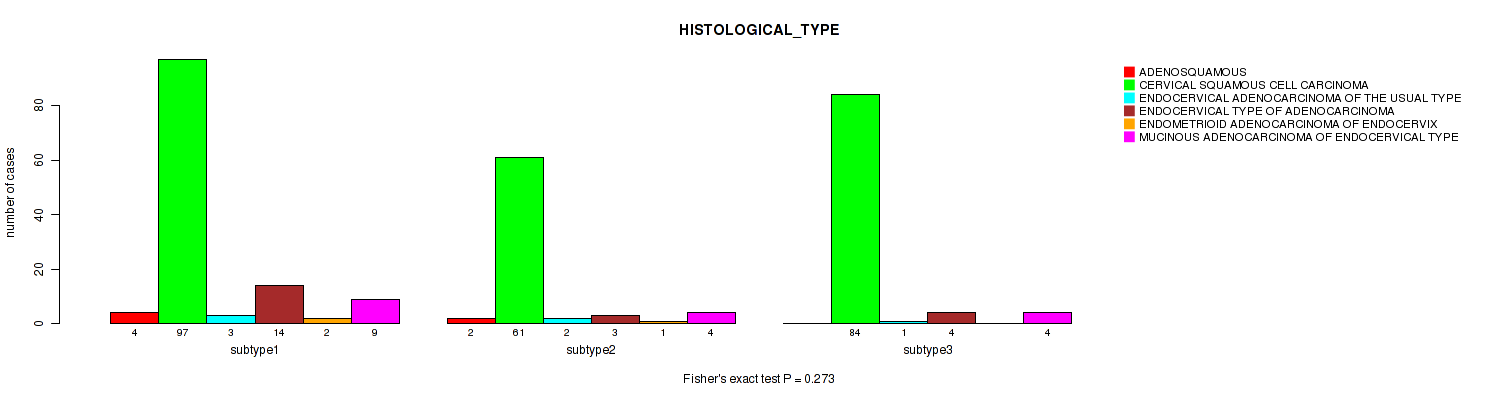
P value = 0.273 (Fisher's exact test), Q value = 0.59
Table S8. Clustering Approach #1: 'Copy Number Ratio CNMF subtypes' versus Clinical Feature #7: 'HISTOLOGICAL_TYPE'
| nPatients | ADENOSQUAMOUS | CERVICAL SQUAMOUS CELL CARCINOMA | ENDOCERVICAL ADENOCARCINOMA OF THE USUAL TYPE | ENDOCERVICAL TYPE OF ADENOCARCINOMA | ENDOMETRIOID ADENOCARCINOMA OF ENDOCERVIX | MUCINOUS ADENOCARCINOMA OF ENDOCERVICAL TYPE |
|---|---|---|---|---|---|---|
| ALL | 6 | 242 | 6 | 21 | 3 | 17 |
| subtype1 | 4 | 97 | 3 | 14 | 2 | 9 |
| subtype2 | 2 | 61 | 2 | 3 | 1 | 4 |
| subtype3 | 0 | 84 | 1 | 4 | 0 | 4 |
Figure S7. Get High-res Image Clustering Approach #1: 'Copy Number Ratio CNMF subtypes' versus Clinical Feature #7: 'HISTOLOGICAL_TYPE'
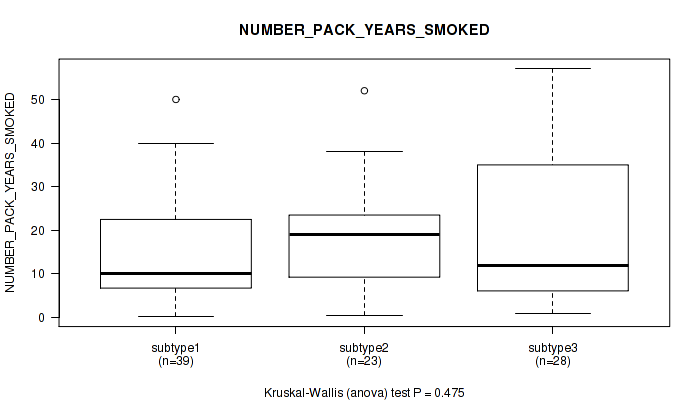
P value = 0.475 (Kruskal-Wallis (anova)), Q value = 0.74
Table S9. Clustering Approach #1: 'Copy Number Ratio CNMF subtypes' versus Clinical Feature #8: 'NUMBER_PACK_YEARS_SMOKED'
| nPatients | Mean (Std.Dev) | |
|---|---|---|
| ALL | 90 | 17.5 (14.3) |
| subtype1 | 39 | 14.9 (11.8) |
| subtype2 | 23 | 18.2 (12.8) |
| subtype3 | 28 | 20.5 (18.0) |
Figure S8. Get High-res Image Clustering Approach #1: 'Copy Number Ratio CNMF subtypes' versus Clinical Feature #8: 'NUMBER_PACK_YEARS_SMOKED'
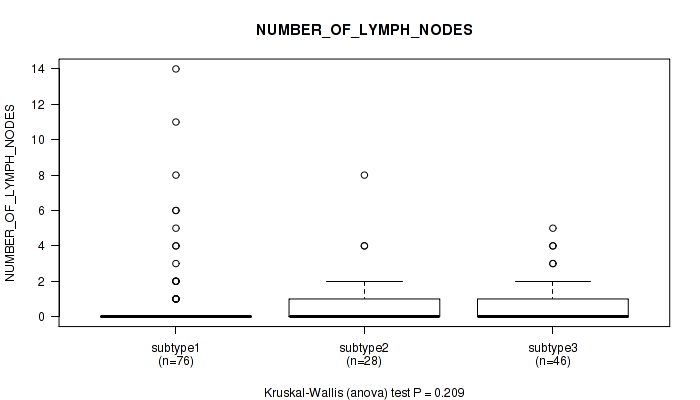
P value = 0.209 (Kruskal-Wallis (anova)), Q value = 0.53
Table S10. Clustering Approach #1: 'Copy Number Ratio CNMF subtypes' versus Clinical Feature #9: 'NUMBER_OF_LYMPH_NODES'
| nPatients | Mean (Std.Dev) | |
|---|---|---|
| ALL | 150 | 0.9 (2.1) |
| subtype1 | 76 | 1.0 (2.5) |
| subtype2 | 28 | 1.0 (1.8) |
| subtype3 | 46 | 0.8 (1.3) |
Figure S9. Get High-res Image Clustering Approach #1: 'Copy Number Ratio CNMF subtypes' versus Clinical Feature #9: 'NUMBER_OF_LYMPH_NODES'
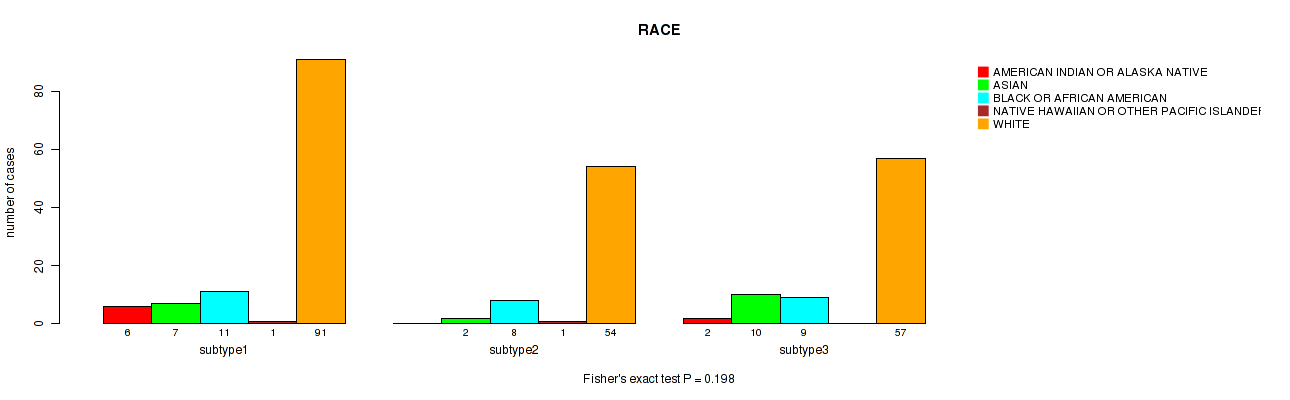
P value = 0.198 (Fisher's exact test), Q value = 0.52
Table S11. Clustering Approach #1: 'Copy Number Ratio CNMF subtypes' versus Clinical Feature #10: 'RACE'
| nPatients | AMERICAN INDIAN OR ALASKA NATIVE | ASIAN | BLACK OR AFRICAN AMERICAN | NATIVE HAWAIIAN OR OTHER PACIFIC ISLANDER | WHITE |
|---|---|---|---|---|---|
| ALL | 8 | 19 | 28 | 2 | 202 |
| subtype1 | 6 | 7 | 11 | 1 | 91 |
| subtype2 | 0 | 2 | 8 | 1 | 54 |
| subtype3 | 2 | 10 | 9 | 0 | 57 |
Figure S10. Get High-res Image Clustering Approach #1: 'Copy Number Ratio CNMF subtypes' versus Clinical Feature #10: 'RACE'
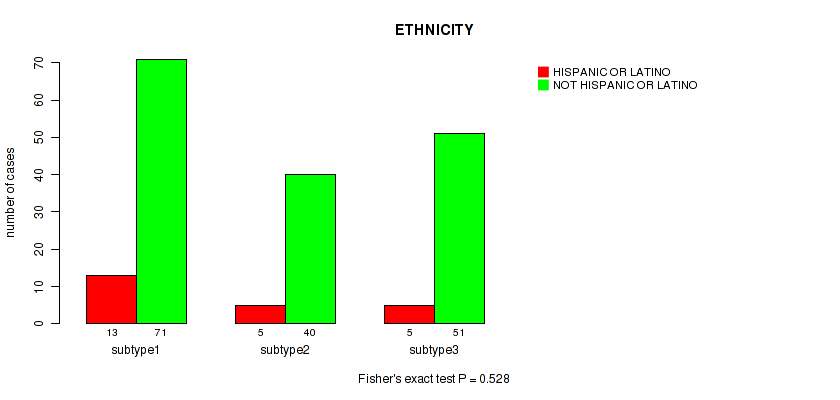
P value = 0.528 (Fisher's exact test), Q value = 0.77
Table S12. Clustering Approach #1: 'Copy Number Ratio CNMF subtypes' versus Clinical Feature #11: 'ETHNICITY'
| nPatients | HISPANIC OR LATINO | NOT HISPANIC OR LATINO |
|---|---|---|
| ALL | 23 | 162 |
| subtype1 | 13 | 71 |
| subtype2 | 5 | 40 |
| subtype3 | 5 | 51 |
Figure S11. Get High-res Image Clustering Approach #1: 'Copy Number Ratio CNMF subtypes' versus Clinical Feature #11: 'ETHNICITY'
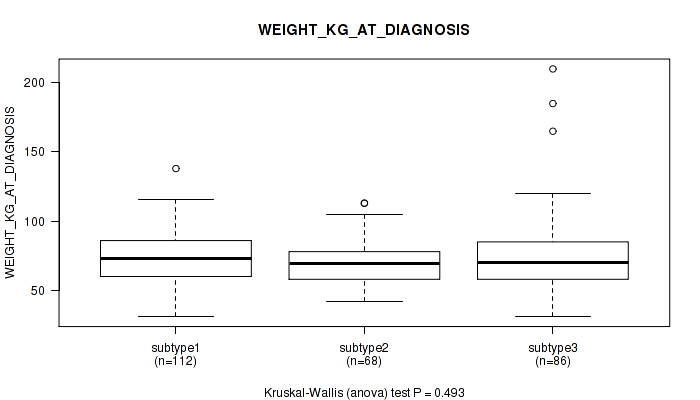
P value = 0.493 (Kruskal-Wallis (anova)), Q value = 0.75
Table S13. Clustering Approach #1: 'Copy Number Ratio CNMF subtypes' versus Clinical Feature #12: 'WEIGHT_KG_AT_DIAGNOSIS'
| nPatients | Mean (Std.Dev) | |
|---|---|---|
| ALL | 266 | 73.2 (21.6) |
| subtype1 | 112 | 73.8 (18.7) |
| subtype2 | 68 | 70.3 (16.7) |
| subtype3 | 86 | 74.8 (27.6) |
Figure S12. Get High-res Image Clustering Approach #1: 'Copy Number Ratio CNMF subtypes' versus Clinical Feature #12: 'WEIGHT_KG_AT_DIAGNOSIS'
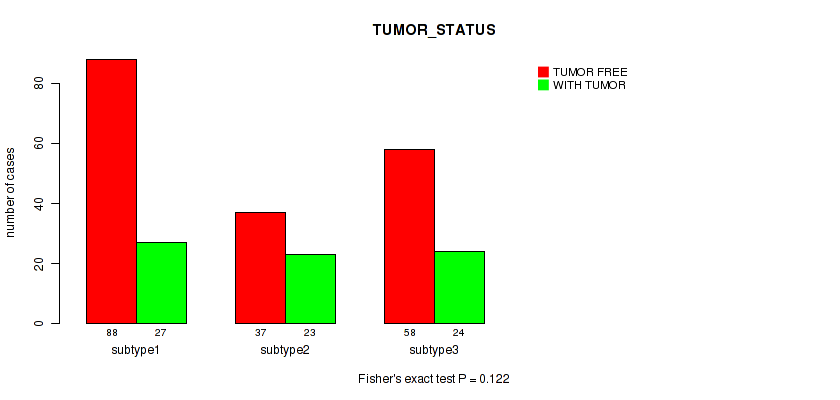
P value = 0.122 (Fisher's exact test), Q value = 0.46
Table S14. Clustering Approach #1: 'Copy Number Ratio CNMF subtypes' versus Clinical Feature #13: 'TUMOR_STATUS'
| nPatients | TUMOR FREE | WITH TUMOR |
|---|---|---|
| ALL | 183 | 74 |
| subtype1 | 88 | 27 |
| subtype2 | 37 | 23 |
| subtype3 | 58 | 24 |
Figure S13. Get High-res Image Clustering Approach #1: 'Copy Number Ratio CNMF subtypes' versus Clinical Feature #13: 'TUMOR_STATUS'
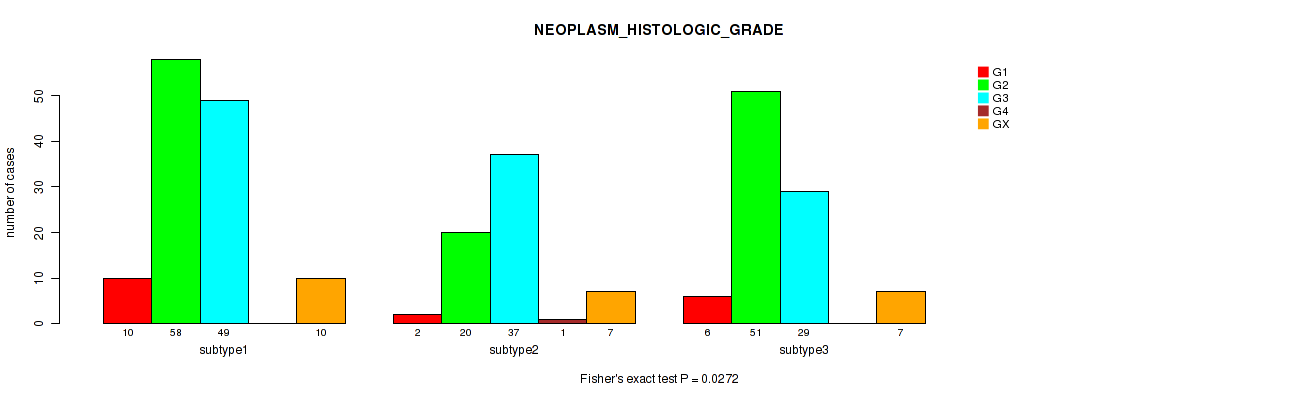
P value = 0.0272 (Fisher's exact test), Q value = 0.2
Table S15. Clustering Approach #1: 'Copy Number Ratio CNMF subtypes' versus Clinical Feature #14: 'NEOPLASM_HISTOLOGIC_GRADE'
| nPatients | G1 | G2 | G3 | G4 | GX |
|---|---|---|---|---|---|
| ALL | 18 | 129 | 115 | 1 | 24 |
| subtype1 | 10 | 58 | 49 | 0 | 10 |
| subtype2 | 2 | 20 | 37 | 1 | 7 |
| subtype3 | 6 | 51 | 29 | 0 | 7 |
Figure S14. Get High-res Image Clustering Approach #1: 'Copy Number Ratio CNMF subtypes' versus Clinical Feature #14: 'NEOPLASM_HISTOLOGIC_GRADE'
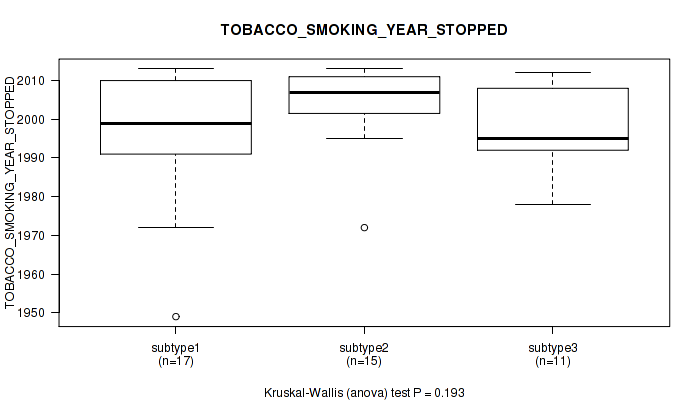
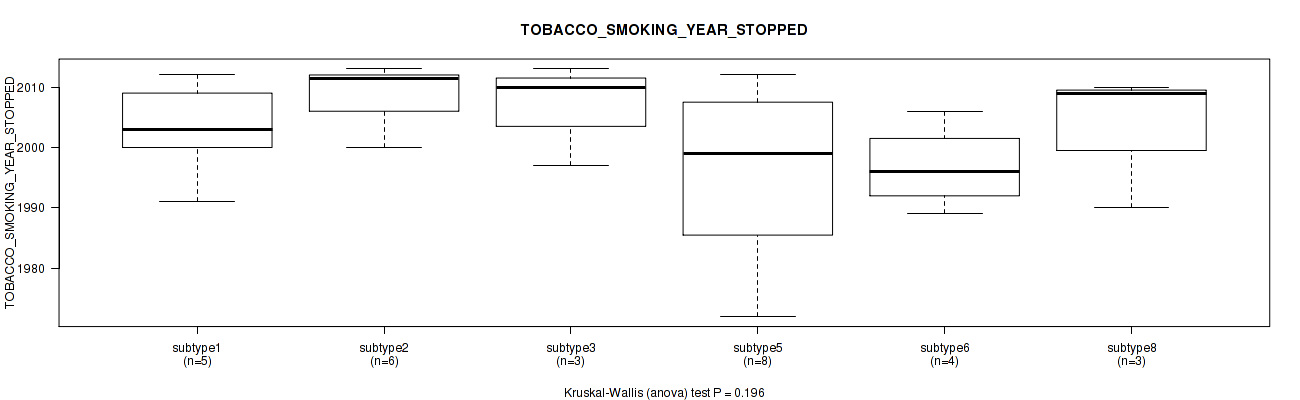
P value = 0.193 (Kruskal-Wallis (anova)), Q value = 0.52
Table S16. Clustering Approach #1: 'Copy Number Ratio CNMF subtypes' versus Clinical Feature #15: 'TOBACCO_SMOKING_YEAR_STOPPED'
| nPatients | Mean (Std.Dev) | |
|---|---|---|
| ALL | 43 | 1999.7 (13.6) |
| subtype1 | 17 | 1996.4 (16.8) |
| subtype2 | 15 | 2004.3 (10.6) |
| subtype3 | 11 | 1998.5 (11.1) |
Figure S15. Get High-res Image Clustering Approach #1: 'Copy Number Ratio CNMF subtypes' versus Clinical Feature #15: 'TOBACCO_SMOKING_YEAR_STOPPED'
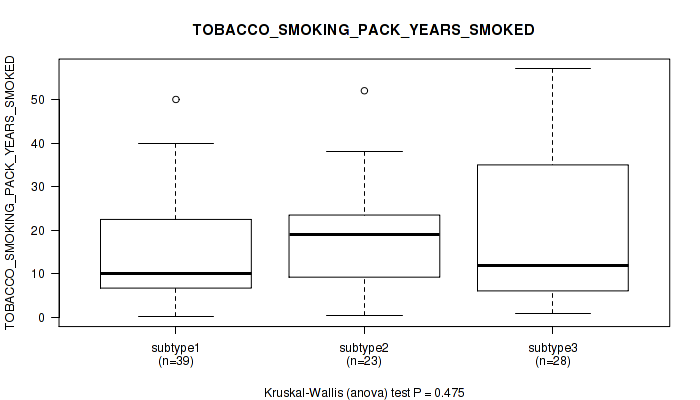
P value = 0.475 (Kruskal-Wallis (anova)), Q value = 0.74
Table S17. Clustering Approach #1: 'Copy Number Ratio CNMF subtypes' versus Clinical Feature #16: 'TOBACCO_SMOKING_PACK_YEARS_SMOKED'
| nPatients | Mean (Std.Dev) | |
|---|---|---|
| ALL | 90 | 17.5 (14.3) |
| subtype1 | 39 | 14.9 (11.8) |
| subtype2 | 23 | 18.2 (12.8) |
| subtype3 | 28 | 20.5 (18.0) |
Figure S16. Get High-res Image Clustering Approach #1: 'Copy Number Ratio CNMF subtypes' versus Clinical Feature #16: 'TOBACCO_SMOKING_PACK_YEARS_SMOKED'
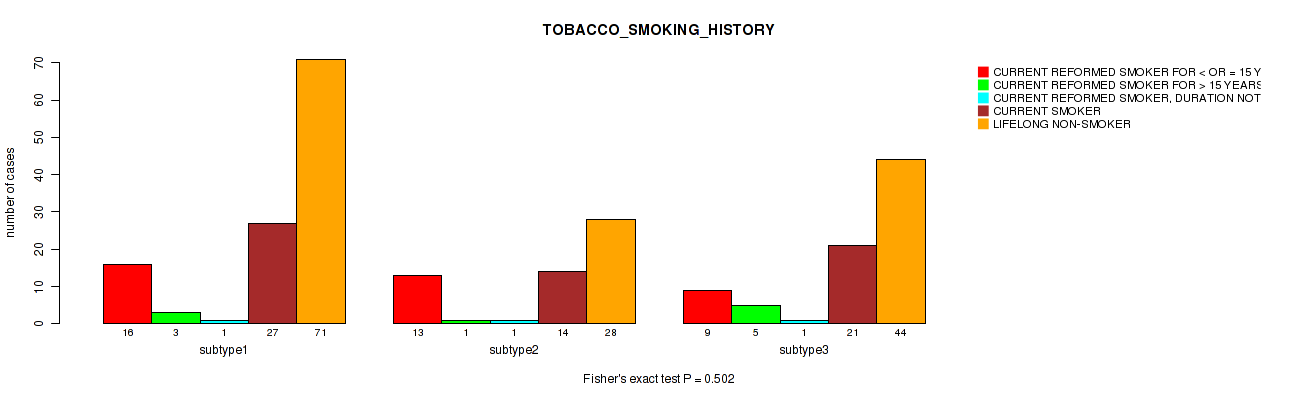
P value = 0.502 (Fisher's exact test), Q value = 0.75
Table S18. Clustering Approach #1: 'Copy Number Ratio CNMF subtypes' versus Clinical Feature #17: 'TOBACCO_SMOKING_HISTORY'
| nPatients | CURRENT REFORMED SMOKER FOR < OR = 15 YEARS | CURRENT REFORMED SMOKER FOR > 15 YEARS | CURRENT REFORMED SMOKER, DURATION NOT SPECIFIED | CURRENT SMOKER | LIFELONG NON-SMOKER |
|---|---|---|---|---|---|
| ALL | 38 | 9 | 3 | 62 | 143 |
| subtype1 | 16 | 3 | 1 | 27 | 71 |
| subtype2 | 13 | 1 | 1 | 14 | 28 |
| subtype3 | 9 | 5 | 1 | 21 | 44 |
Figure S17. Get High-res Image Clustering Approach #1: 'Copy Number Ratio CNMF subtypes' versus Clinical Feature #17: 'TOBACCO_SMOKING_HISTORY'
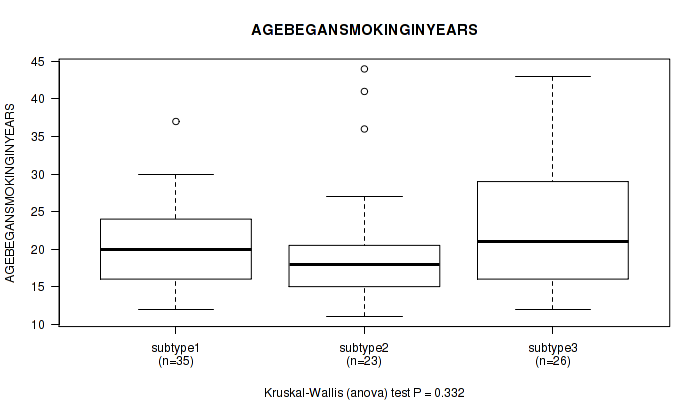
P value = 0.332 (Kruskal-Wallis (anova)), Q value = 0.67
Table S19. Clustering Approach #1: 'Copy Number Ratio CNMF subtypes' versus Clinical Feature #18: 'AGEBEGANSMOKINGINYEARS'
| nPatients | Mean (Std.Dev) | |
|---|---|---|
| ALL | 84 | 21.2 (7.7) |
| subtype1 | 35 | 20.2 (5.9) |
| subtype2 | 23 | 20.4 (8.8) |
| subtype3 | 26 | 23.3 (8.7) |
Figure S18. Get High-res Image Clustering Approach #1: 'Copy Number Ratio CNMF subtypes' versus Clinical Feature #18: 'AGEBEGANSMOKINGINYEARS'
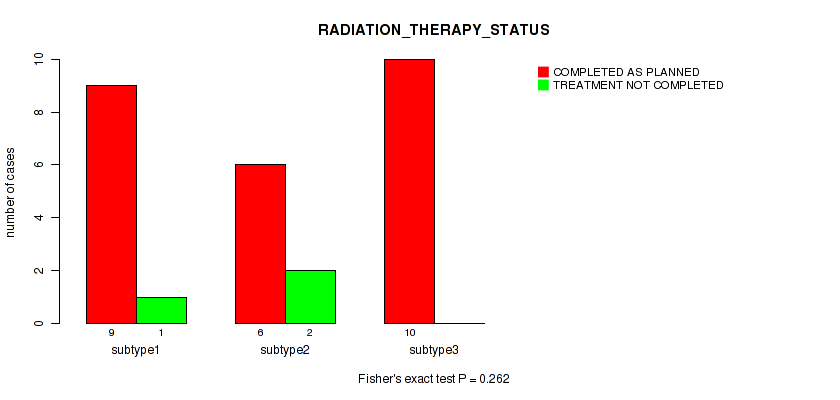
P value = 0.262 (Fisher's exact test), Q value = 0.58
Table S20. Clustering Approach #1: 'Copy Number Ratio CNMF subtypes' versus Clinical Feature #19: 'RADIATION_THERAPY_STATUS'
| nPatients | COMPLETED AS PLANNED | TREATMENT NOT COMPLETED |
|---|---|---|
| ALL | 25 | 3 |
| subtype1 | 9 | 1 |
| subtype2 | 6 | 2 |
| subtype3 | 10 | 0 |
Figure S19. Get High-res Image Clustering Approach #1: 'Copy Number Ratio CNMF subtypes' versus Clinical Feature #19: 'RADIATION_THERAPY_STATUS'
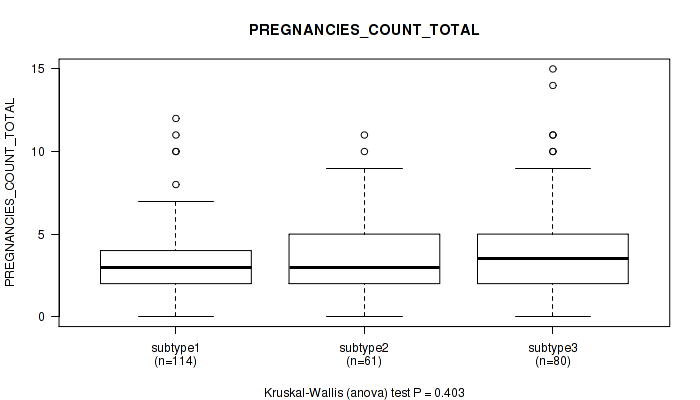
P value = 0.403 (Kruskal-Wallis (anova)), Q value = 0.71
Table S21. Clustering Approach #1: 'Copy Number Ratio CNMF subtypes' versus Clinical Feature #20: 'PREGNANCIES_COUNT_TOTAL'
| nPatients | Mean (Std.Dev) | |
|---|---|---|
| ALL | 255 | 3.6 (2.5) |
| subtype1 | 114 | 3.4 (2.2) |
| subtype2 | 61 | 3.5 (2.5) |
| subtype3 | 80 | 4.0 (2.9) |
Figure S20. Get High-res Image Clustering Approach #1: 'Copy Number Ratio CNMF subtypes' versus Clinical Feature #20: 'PREGNANCIES_COUNT_TOTAL'
P value = 0.254 (Kruskal-Wallis (anova)), Q value = 0.58
Table S22. Clustering Approach #1: 'Copy Number Ratio CNMF subtypes' versus Clinical Feature #21: 'PREGNANCIES_COUNT_STILLBIRTH'
| nPatients | Mean (Std.Dev) | |
|---|---|---|
| ALL | 106 | 0.1 (0.4) |
| subtype1 | 54 | 0.1 (0.3) |
| subtype2 | 19 | 0.0 (0.0) |
| subtype3 | 33 | 0.1 (0.5) |
Figure S21. Get High-res Image Clustering Approach #1: 'Copy Number Ratio CNMF subtypes' versus Clinical Feature #21: 'PREGNANCIES_COUNT_STILLBIRTH'
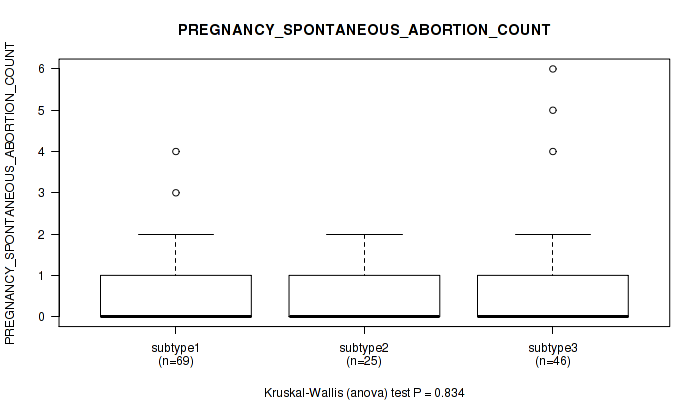
P value = 0.834 (Kruskal-Wallis (anova)), Q value = 0.93
Table S23. Clustering Approach #1: 'Copy Number Ratio CNMF subtypes' versus Clinical Feature #22: 'PREGNANCY_SPONTANEOUS_ABORTION_COUNT'
| nPatients | Mean (Std.Dev) | |
|---|---|---|
| ALL | 140 | 0.6 (1.0) |
| subtype1 | 69 | 0.5 (0.8) |
| subtype2 | 25 | 0.5 (0.7) |
| subtype3 | 46 | 0.7 (1.3) |
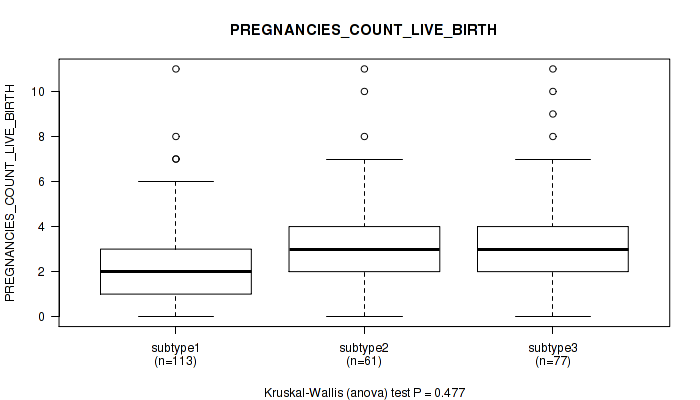
Figure S22. Get High-res Image Clustering Approach #1: 'Copy Number Ratio CNMF subtypes' versus Clinical Feature #22: 'PREGNANCY_SPONTANEOUS_ABORTION_COUNT'
P value = 0.477 (Kruskal-Wallis (anova)), Q value = 0.74
Table S24. Clustering Approach #1: 'Copy Number Ratio CNMF subtypes' versus Clinical Feature #23: 'PREGNANCIES_COUNT_LIVE_BIRTH'
| nPatients | Mean (Std.Dev) | |
|---|---|---|
| ALL | 251 | 2.8 (2.0) |
| subtype1 | 113 | 2.6 (1.8) |
| subtype2 | 61 | 3.0 (2.3) |
| subtype3 | 77 | 3.0 (2.1) |
Figure S23. Get High-res Image Clustering Approach #1: 'Copy Number Ratio CNMF subtypes' versus Clinical Feature #23: 'PREGNANCIES_COUNT_LIVE_BIRTH'
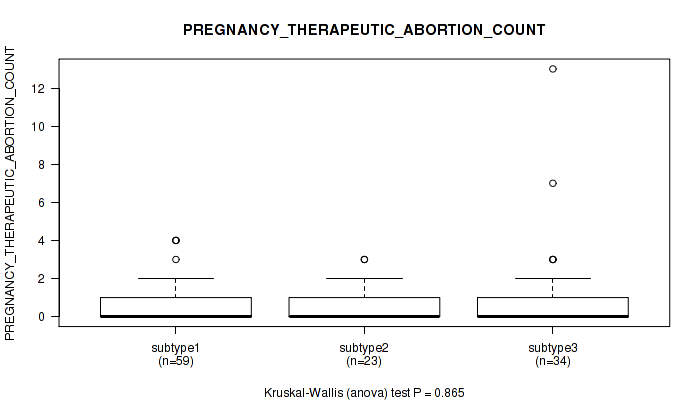
P value = 0.865 (Kruskal-Wallis (anova)), Q value = 0.95
Table S25. Clustering Approach #1: 'Copy Number Ratio CNMF subtypes' versus Clinical Feature #24: 'PREGNANCY_THERAPEUTIC_ABORTION_COUNT'
| nPatients | Mean (Std.Dev) | |
|---|---|---|
| ALL | 116 | 0.8 (1.6) |
| subtype1 | 59 | 0.6 (1.1) |
| subtype2 | 23 | 0.7 (1.0) |
| subtype3 | 34 | 1.2 (2.6) |
Figure S24. Get High-res Image Clustering Approach #1: 'Copy Number Ratio CNMF subtypes' versus Clinical Feature #24: 'PREGNANCY_THERAPEUTIC_ABORTION_COUNT'
P value = 0.201 (Kruskal-Wallis (anova)), Q value = 0.52
Table S26. Clustering Approach #1: 'Copy Number Ratio CNMF subtypes' versus Clinical Feature #25: 'PREGNANCIES_COUNT_ECTOPIC'
| nPatients | Mean (Std.Dev) | |
|---|---|---|
| ALL | 110 | 0.1 (0.4) |
| subtype1 | 54 | 0.1 (0.2) |
| subtype2 | 20 | 0.1 (0.4) |
| subtype3 | 36 | 0.2 (0.5) |
Figure S25. Get High-res Image Clustering Approach #1: 'Copy Number Ratio CNMF subtypes' versus Clinical Feature #25: 'PREGNANCIES_COUNT_ECTOPIC'

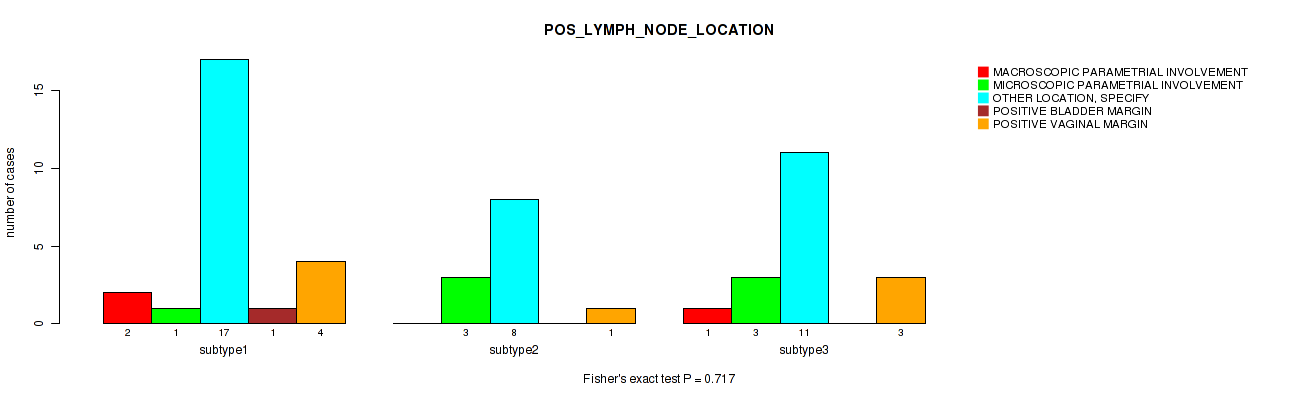
P value = 0.717 (Fisher's exact test), Q value = 0.86
Table S27. Clustering Approach #1: 'Copy Number Ratio CNMF subtypes' versus Clinical Feature #26: 'POS_LYMPH_NODE_LOCATION'
| nPatients | MACROSCOPIC PARAMETRIAL INVOLVEMENT | MICROSCOPIC PARAMETRIAL INVOLVEMENT | OTHER LOCATION, SPECIFY | POSITIVE BLADDER MARGIN | POSITIVE VAGINAL MARGIN |
|---|---|---|---|---|---|
| ALL | 3 | 7 | 36 | 1 | 8 |
| subtype1 | 2 | 1 | 17 | 1 | 4 |
| subtype2 | 0 | 3 | 8 | 0 | 1 |
| subtype3 | 1 | 3 | 11 | 0 | 3 |
Figure S26. Get High-res Image Clustering Approach #1: 'Copy Number Ratio CNMF subtypes' versus Clinical Feature #26: 'POS_LYMPH_NODE_LOCATION'
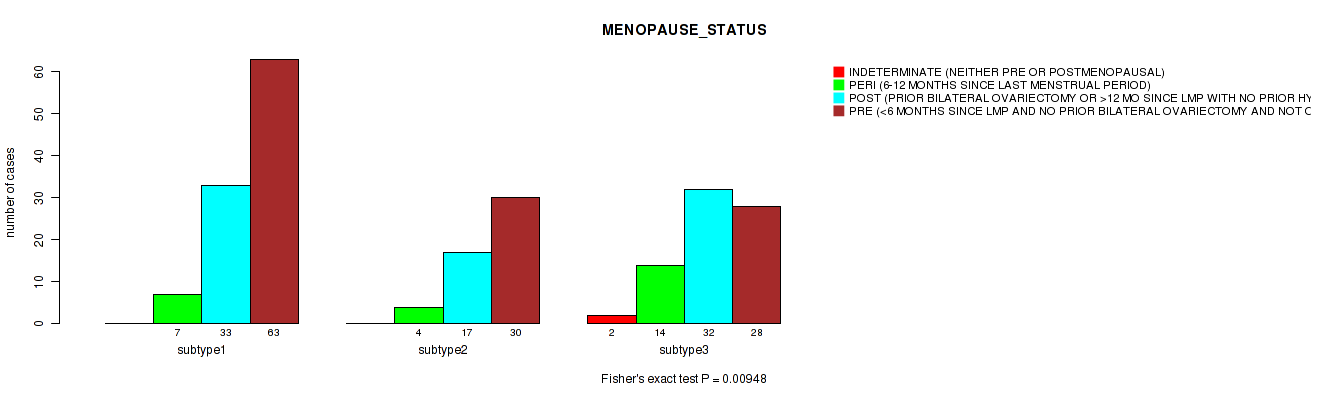
P value = 0.00948 (Fisher's exact test), Q value = 0.13
Table S28. Clustering Approach #1: 'Copy Number Ratio CNMF subtypes' versus Clinical Feature #27: 'MENOPAUSE_STATUS'
| nPatients | INDETERMINATE (NEITHER PRE OR POSTMENOPAUSAL) | PERI (6-12 MONTHS SINCE LAST MENSTRUAL PERIOD) | POST (PRIOR BILATERAL OVARIECTOMY OR >12 MO SINCE LMP WITH NO PRIOR HYSTERECTOMY) | PRE (<6 MONTHS SINCE LMP AND NO PRIOR BILATERAL OVARIECTOMY AND NOT ON ESTROGEN REPLACEMENT) |
|---|---|---|---|---|
| ALL | 2 | 25 | 82 | 121 |
| subtype1 | 0 | 7 | 33 | 63 |
| subtype2 | 0 | 4 | 17 | 30 |
| subtype3 | 2 | 14 | 32 | 28 |
Figure S27. Get High-res Image Clustering Approach #1: 'Copy Number Ratio CNMF subtypes' versus Clinical Feature #27: 'MENOPAUSE_STATUS'
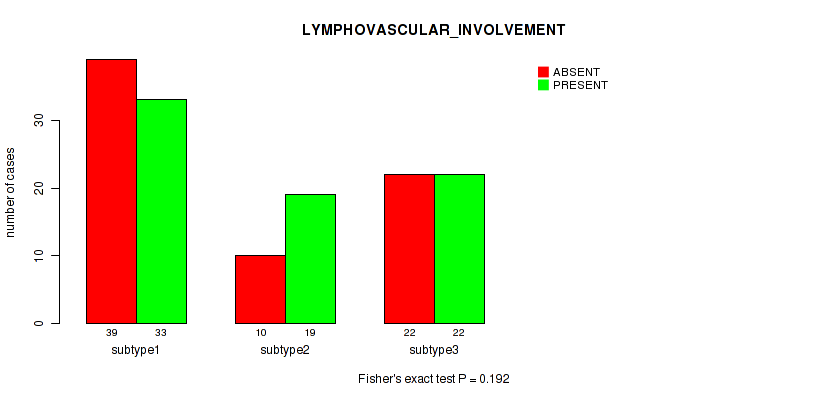
P value = 0.192 (Fisher's exact test), Q value = 0.52
Table S29. Clustering Approach #1: 'Copy Number Ratio CNMF subtypes' versus Clinical Feature #28: 'LYMPHOVASCULAR_INVOLVEMENT'
| nPatients | ABSENT | PRESENT |
|---|---|---|
| ALL | 71 | 74 |
| subtype1 | 39 | 33 |
| subtype2 | 10 | 19 |
| subtype3 | 22 | 22 |
Figure S28. Get High-res Image Clustering Approach #1: 'Copy Number Ratio CNMF subtypes' versus Clinical Feature #28: 'LYMPHOVASCULAR_INVOLVEMENT'
P value = 0.209 (Kruskal-Wallis (anova)), Q value = 0.53
Table S30. Clustering Approach #1: 'Copy Number Ratio CNMF subtypes' versus Clinical Feature #29: 'LYMPH_NODES_EXAMINED_HE_COUNT'
| nPatients | Mean (Std.Dev) | |
|---|---|---|
| ALL | 150 | 0.9 (2.1) |
| subtype1 | 76 | 1.0 (2.5) |
| subtype2 | 28 | 1.0 (1.8) |
| subtype3 | 46 | 0.8 (1.3) |
Figure S29. Get High-res Image Clustering Approach #1: 'Copy Number Ratio CNMF subtypes' versus Clinical Feature #29: 'LYMPH_NODES_EXAMINED_HE_COUNT'

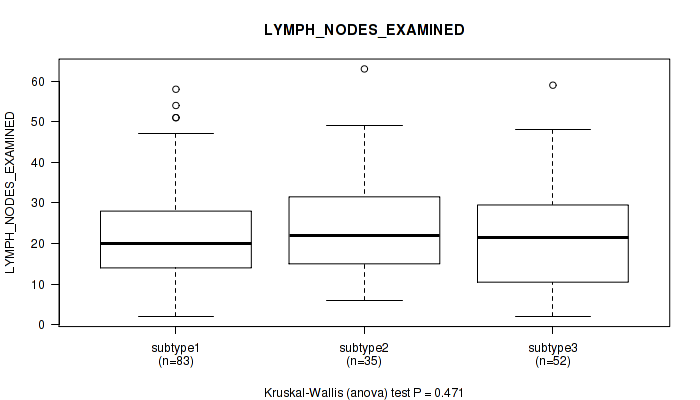
P value = 0.471 (Kruskal-Wallis (anova)), Q value = 0.74
Table S31. Clustering Approach #1: 'Copy Number Ratio CNMF subtypes' versus Clinical Feature #30: 'LYMPH_NODES_EXAMINED'
| nPatients | Mean (Std.Dev) | |
|---|---|---|
| ALL | 170 | 22.3 (12.8) |
| subtype1 | 83 | 21.6 (12.4) |
| subtype2 | 35 | 24.5 (12.6) |
| subtype3 | 52 | 22.1 (13.6) |
Figure S30. Get High-res Image Clustering Approach #1: 'Copy Number Ratio CNMF subtypes' versus Clinical Feature #30: 'LYMPH_NODES_EXAMINED'
P value = 1 (Fisher's exact test), Q value = 1
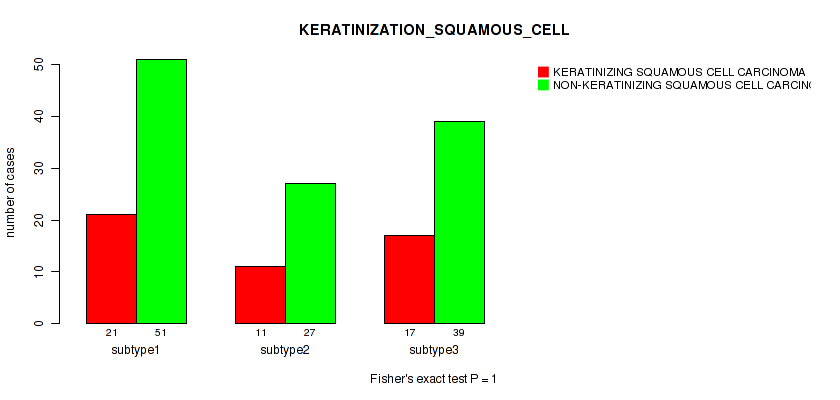
Table S32. Clustering Approach #1: 'Copy Number Ratio CNMF subtypes' versus Clinical Feature #31: 'KERATINIZATION_SQUAMOUS_CELL'
| nPatients | KERATINIZING SQUAMOUS CELL CARCINOMA | NON-KERATINIZING SQUAMOUS CELL CARCINOMA |
|---|---|---|
| ALL | 49 | 117 |
| subtype1 | 21 | 51 |
| subtype2 | 11 | 27 |
| subtype3 | 17 | 39 |
Figure S31. Get High-res Image Clustering Approach #1: 'Copy Number Ratio CNMF subtypes' versus Clinical Feature #31: 'KERATINIZATION_SQUAMOUS_CELL'
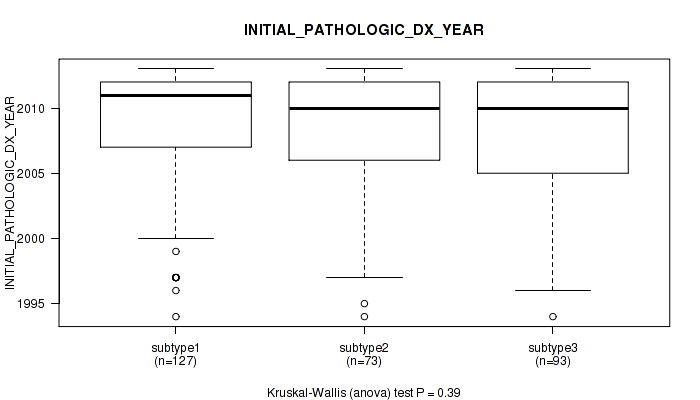
P value = 0.39 (Kruskal-Wallis (anova)), Q value = 0.71
Table S33. Clustering Approach #1: 'Copy Number Ratio CNMF subtypes' versus Clinical Feature #32: 'INITIAL_PATHOLOGIC_DX_YEAR'
| nPatients | Mean (Std.Dev) | |
|---|---|---|
| ALL | 293 | 2008.5 (4.6) |
| subtype1 | 127 | 2008.7 (4.8) |
| subtype2 | 73 | 2008.4 (4.4) |
| subtype3 | 93 | 2008.3 (4.7) |
Figure S32. Get High-res Image Clustering Approach #1: 'Copy Number Ratio CNMF subtypes' versus Clinical Feature #32: 'INITIAL_PATHOLOGIC_DX_YEAR'
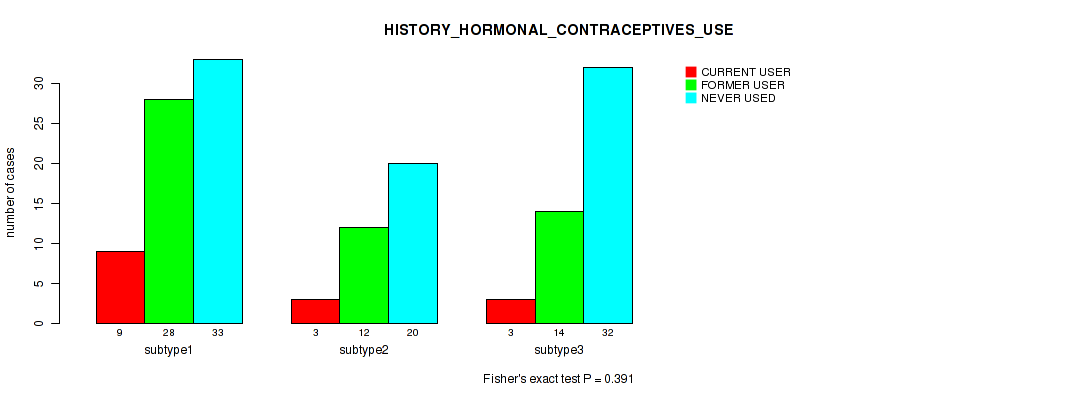
P value = 0.391 (Fisher's exact test), Q value = 0.71
Table S34. Clustering Approach #1: 'Copy Number Ratio CNMF subtypes' versus Clinical Feature #33: 'HISTORY_HORMONAL_CONTRACEPTIVES_USE'
| nPatients | CURRENT USER | FORMER USER | NEVER USED |
|---|---|---|---|
| ALL | 15 | 54 | 85 |
| subtype1 | 9 | 28 | 33 |
| subtype2 | 3 | 12 | 20 |
| subtype3 | 3 | 14 | 32 |
Figure S33. Get High-res Image Clustering Approach #1: 'Copy Number Ratio CNMF subtypes' versus Clinical Feature #33: 'HISTORY_HORMONAL_CONTRACEPTIVES_USE'
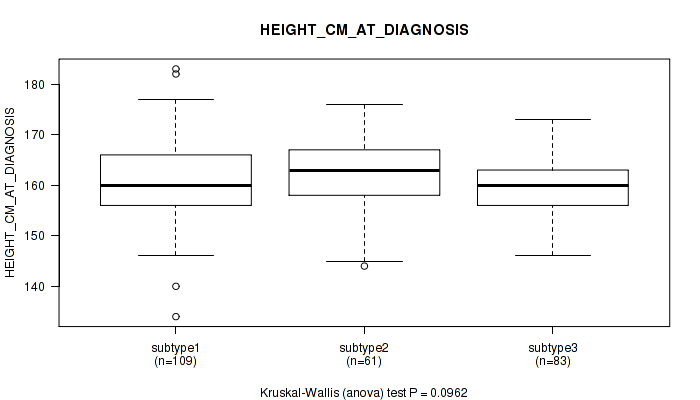
P value = 0.0962 (Kruskal-Wallis (anova)), Q value = 0.42
Table S35. Clustering Approach #1: 'Copy Number Ratio CNMF subtypes' versus Clinical Feature #34: 'HEIGHT_CM_AT_DIAGNOSIS'
| nPatients | Mean (Std.Dev) | |
|---|---|---|
| ALL | 253 | 161.1 (6.9) |
| subtype1 | 109 | 161.2 (7.9) |
| subtype2 | 61 | 162.3 (7.0) |
| subtype3 | 83 | 160.1 (5.2) |
Figure S34. Get High-res Image Clustering Approach #1: 'Copy Number Ratio CNMF subtypes' versus Clinical Feature #34: 'HEIGHT_CM_AT_DIAGNOSIS'
P value = 0.426 (Fisher's exact test), Q value = 0.73
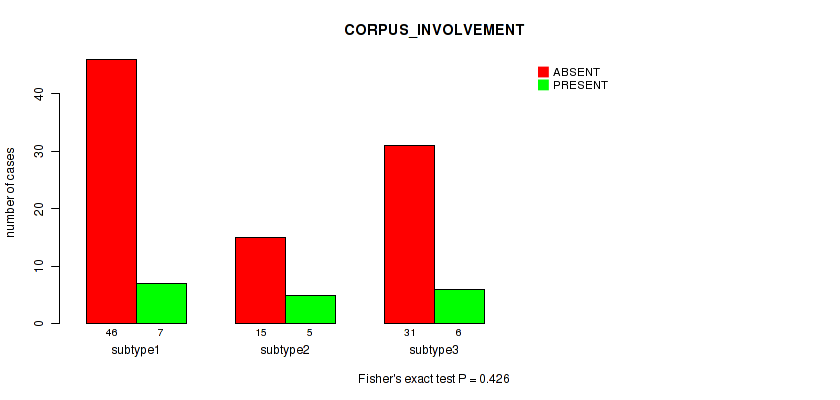
Table S36. Clustering Approach #1: 'Copy Number Ratio CNMF subtypes' versus Clinical Feature #35: 'CORPUS_INVOLVEMENT'
| nPatients | ABSENT | PRESENT |
|---|---|---|
| ALL | 92 | 18 |
| subtype1 | 46 | 7 |
| subtype2 | 15 | 5 |
| subtype3 | 31 | 6 |
Figure S35. Get High-res Image Clustering Approach #1: 'Copy Number Ratio CNMF subtypes' versus Clinical Feature #35: 'CORPUS_INVOLVEMENT'
P value = 0.226 (Fisher's exact test), Q value = 0.55
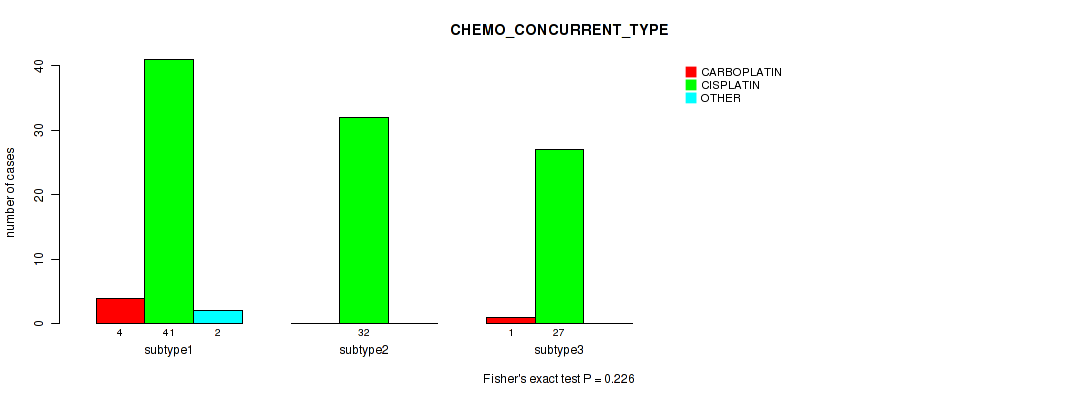
Table S37. Clustering Approach #1: 'Copy Number Ratio CNMF subtypes' versus Clinical Feature #36: 'CHEMO_CONCURRENT_TYPE'
| nPatients | CARBOPLATIN | CISPLATIN | OTHER |
|---|---|---|---|
| ALL | 5 | 100 | 2 |
| subtype1 | 4 | 41 | 2 |
| subtype2 | 0 | 32 | 0 |
| subtype3 | 1 | 27 | 0 |
Figure S36. Get High-res Image Clustering Approach #1: 'Copy Number Ratio CNMF subtypes' versus Clinical Feature #36: 'CHEMO_CONCURRENT_TYPE'
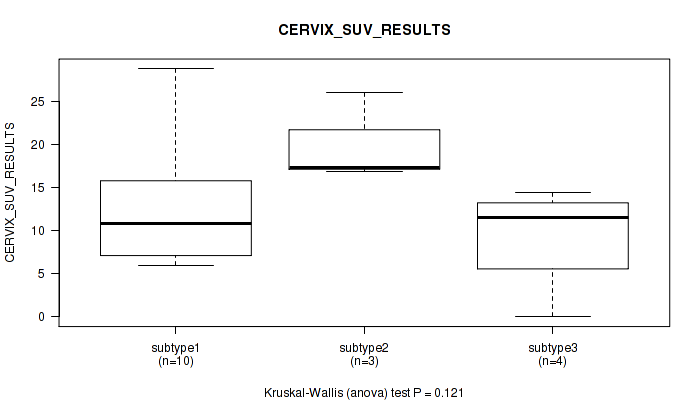
P value = 0.121 (Kruskal-Wallis (anova)), Q value = 0.46
Table S38. Clustering Approach #1: 'Copy Number Ratio CNMF subtypes' versus Clinical Feature #37: 'CERVIX_SUV_RESULTS'
| nPatients | Mean (Std.Dev) | |
|---|---|---|
| ALL | 17 | 13.2 (7.2) |
| subtype1 | 10 | 12.7 (7.0) |
| subtype2 | 3 | 20.1 (5.2) |
| subtype3 | 4 | 9.4 (6.4) |
Figure S37. Get High-res Image Clustering Approach #1: 'Copy Number Ratio CNMF subtypes' versus Clinical Feature #37: 'CERVIX_SUV_RESULTS'
P value = 0.0214 (Kruskal-Wallis (anova)), Q value = 0.18
Table S39. Clustering Approach #1: 'Copy Number Ratio CNMF subtypes' versus Clinical Feature #38: 'AGE_AT_DIAGNOSIS'
| nPatients | Mean (Std.Dev) | |
|---|---|---|
| ALL | 295 | 48.2 (13.8) |
| subtype1 | 129 | 47.7 (14.5) |
| subtype2 | 73 | 45.8 (14.4) |
| subtype3 | 93 | 50.7 (11.9) |
Figure S38. Get High-res Image Clustering Approach #1: 'Copy Number Ratio CNMF subtypes' versus Clinical Feature #38: 'AGE_AT_DIAGNOSIS'

P value = 0.201 (Fisher's exact test), Q value = 0.52
Table S40. Clustering Approach #1: 'Copy Number Ratio CNMF subtypes' versus Clinical Feature #39: 'CLINICAL_STAGE'
| nPatients | STAGE I | STAGE IA | STAGE IA1 | STAGE IA2 | STAGE IB | STAGE IB1 | STAGE IB2 | STAGE II | STAGE IIA | STAGE IIA1 | STAGE IIA2 | STAGE IIB | STAGE III | STAGE IIIA | STAGE IIIB | STAGE IVA | STAGE IVB |
|---|---|---|---|---|---|---|---|---|---|---|---|---|---|---|---|---|---|
| ALL | 5 | 1 | 1 | 1 | 34 | 77 | 37 | 4 | 8 | 5 | 7 | 44 | 1 | 3 | 42 | 7 | 12 |
| subtype1 | 1 | 0 | 1 | 0 | 12 | 40 | 17 | 1 | 5 | 2 | 5 | 17 | 1 | 1 | 16 | 2 | 7 |
| subtype2 | 2 | 0 | 0 | 1 | 9 | 13 | 10 | 0 | 2 | 3 | 2 | 17 | 0 | 0 | 11 | 1 | 1 |
| subtype3 | 2 | 1 | 0 | 0 | 13 | 24 | 10 | 3 | 1 | 0 | 0 | 10 | 0 | 2 | 15 | 4 | 4 |
Figure S39. Get High-res Image Clustering Approach #1: 'Copy Number Ratio CNMF subtypes' versus Clinical Feature #39: 'CLINICAL_STAGE'
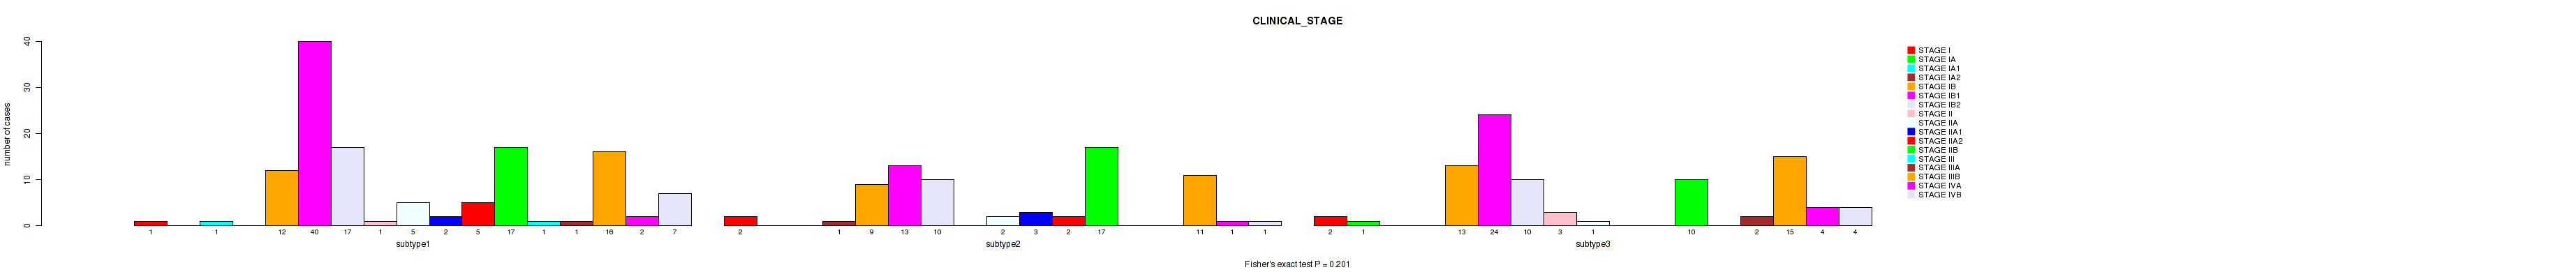
Table S41. Description of clustering approach #2: 'METHLYATION CNMF'
| Cluster Labels | 1 | 2 | 3 | 4 | 5 | 6 |
|---|---|---|---|---|---|---|
| Number of samples | 71 | 58 | 60 | 61 | 11 | 46 |
P value = 0.146 (logrank test), Q value = 0.47
Table S42. Clustering Approach #2: 'METHLYATION CNMF' versus Clinical Feature #1: 'Time to Death'
| nPatients | nDeath | Duration Range (Median), Month | |
|---|---|---|---|
| ALL | 290 | 71 | 0.0 - 210.7 (23.8) |
| subtype1 | 69 | 16 | 0.4 - 137.2 (20.4) |
| subtype2 | 55 | 13 | 0.3 - 209.6 (26.1) |
| subtype3 | 57 | 11 | 0.1 - 210.7 (26.3) |
| subtype4 | 55 | 21 | 0.0 - 154.3 (24.3) |
| subtype5 | 11 | 1 | 0.4 - 155.8 (23.7) |
| subtype6 | 43 | 9 | 0.1 - 146.9 (20.8) |
Figure S40. Get High-res Image Clustering Approach #2: 'METHLYATION CNMF' versus Clinical Feature #1: 'Time to Death'
P value = 0.0132 (Kruskal-Wallis (anova)), Q value = 0.15
Table S43. Clustering Approach #2: 'METHLYATION CNMF' versus Clinical Feature #2: 'YEARS_TO_BIRTH'
| nPatients | Mean (Std.Dev) | |
|---|---|---|
| ALL | 305 | 48.2 (13.8) |
| subtype1 | 71 | 46.8 (11.3) |
| subtype2 | 57 | 51.2 (15.5) |
| subtype3 | 60 | 48.0 (13.2) |
| subtype4 | 60 | 43.2 (13.8) |
| subtype5 | 11 | 53.0 (12.0) |
| subtype6 | 46 | 52.3 (14.4) |
Figure S41. Get High-res Image Clustering Approach #2: 'METHLYATION CNMF' versus Clinical Feature #2: 'YEARS_TO_BIRTH'
P value = 0.516 (Fisher's exact test), Q value = 0.76
Table S44. Clustering Approach #2: 'METHLYATION CNMF' versus Clinical Feature #3: 'PATHOLOGY_T_STAGE'
| nPatients | T1 | T2 | T3 | T4 |
|---|---|---|---|---|
| ALL | 141 | 72 | 21 | 10 |
| subtype1 | 38 | 20 | 4 | 1 |
| subtype2 | 26 | 10 | 6 | 4 |
| subtype3 | 26 | 18 | 3 | 3 |
| subtype4 | 23 | 13 | 5 | 1 |
| subtype5 | 4 | 1 | 2 | 0 |
| subtype6 | 24 | 10 | 1 | 1 |
Figure S42. Get High-res Image Clustering Approach #2: 'METHLYATION CNMF' versus Clinical Feature #3: 'PATHOLOGY_T_STAGE'
P value = 0.336 (Fisher's exact test), Q value = 0.67
Table S45. Clustering Approach #2: 'METHLYATION CNMF' versus Clinical Feature #4: 'PATHOLOGY_N_STAGE'
| nPatients | 0 | 1 |
|---|---|---|
| ALL | 135 | 60 |
| subtype1 | 38 | 12 |
| subtype2 | 19 | 14 |
| subtype3 | 25 | 16 |
| subtype4 | 25 | 8 |
| subtype5 | 4 | 2 |
| subtype6 | 24 | 8 |
Figure S43. Get High-res Image Clustering Approach #2: 'METHLYATION CNMF' versus Clinical Feature #4: 'PATHOLOGY_N_STAGE'
P value = 0.632 (Fisher's exact test), Q value = 0.83
Table S46. Clustering Approach #2: 'METHLYATION CNMF' versus Clinical Feature #5: 'PATHOLOGY_M_STAGE'
| nPatients | 0 | 1 |
|---|---|---|
| ALL | 116 | 10 |
| subtype1 | 26 | 5 |
| subtype2 | 20 | 1 |
| subtype3 | 27 | 1 |
| subtype4 | 22 | 2 |
| subtype5 | 4 | 0 |
| subtype6 | 17 | 1 |
Figure S44. Get High-res Image Clustering Approach #2: 'METHLYATION CNMF' versus Clinical Feature #5: 'PATHOLOGY_M_STAGE'
P value = 0.731 (Fisher's exact test), Q value = 0.87
Table S47. Clustering Approach #2: 'METHLYATION CNMF' versus Clinical Feature #6: 'RADIATION_THERAPY'
| nPatients | NO | YES |
|---|---|---|
| ALL | 57 | 127 |
| subtype1 | 14 | 31 |
| subtype2 | 12 | 26 |
| subtype3 | 8 | 23 |
| subtype4 | 11 | 28 |
| subtype5 | 1 | 5 |
| subtype6 | 11 | 14 |
Figure S45. Get High-res Image Clustering Approach #2: 'METHLYATION CNMF' versus Clinical Feature #6: 'RADIATION_THERAPY'
P value = 1e-05 (Fisher's exact test), Q value = 0.00044
Table S48. Clustering Approach #2: 'METHLYATION CNMF' versus Clinical Feature #7: 'HISTOLOGICAL_TYPE'
| nPatients | ADENOSQUAMOUS | CERVICAL SQUAMOUS CELL CARCINOMA | ENDOCERVICAL ADENOCARCINOMA OF THE USUAL TYPE | ENDOCERVICAL TYPE OF ADENOCARCINOMA | ENDOMETRIOID ADENOCARCINOMA OF ENDOCERVIX | MUCINOUS ADENOCARCINOMA OF ENDOCERVICAL TYPE |
|---|---|---|---|---|---|---|
| ALL | 6 | 254 | 6 | 21 | 3 | 17 |
| subtype1 | 6 | 21 | 5 | 21 | 3 | 15 |
| subtype2 | 0 | 58 | 0 | 0 | 0 | 0 |
| subtype3 | 0 | 58 | 0 | 0 | 0 | 2 |
| subtype4 | 0 | 61 | 0 | 0 | 0 | 0 |
| subtype5 | 0 | 11 | 0 | 0 | 0 | 0 |
| subtype6 | 0 | 45 | 1 | 0 | 0 | 0 |
Figure S46. Get High-res Image Clustering Approach #2: 'METHLYATION CNMF' versus Clinical Feature #7: 'HISTOLOGICAL_TYPE'
P value = 0.402 (Kruskal-Wallis (anova)), Q value = 0.71
Table S49. Clustering Approach #2: 'METHLYATION CNMF' versus Clinical Feature #8: 'NUMBER_PACK_YEARS_SMOKED'
| nPatients | Mean (Std.Dev) | |
|---|---|---|
| ALL | 93 | 17.4 (14.1) |
| subtype1 | 18 | 12.6 (11.3) |
| subtype2 | 19 | 20.4 (16.8) |
| subtype3 | 18 | 17.2 (12.5) |
| subtype4 | 20 | 15.1 (13.6) |
| subtype5 | 4 | 19.1 (13.0) |
| subtype6 | 14 | 22.5 (16.2) |
Figure S47. Get High-res Image Clustering Approach #2: 'METHLYATION CNMF' versus Clinical Feature #8: 'NUMBER_PACK_YEARS_SMOKED'
P value = 0.111 (Kruskal-Wallis (anova)), Q value = 0.45
Table S50. Clustering Approach #2: 'METHLYATION CNMF' versus Clinical Feature #9: 'NUMBER_OF_LYMPH_NODES'
| nPatients | Mean (Std.Dev) | |
|---|---|---|
| ALL | 159 | 1.0 (2.4) |
| subtype1 | 43 | 0.9 (2.7) |
| subtype2 | 28 | 1.5 (2.2) |
| subtype3 | 29 | 1.2 (2.1) |
| subtype4 | 25 | 0.6 (1.4) |
| subtype5 | 5 | 3.6 (6.9) |
| subtype6 | 29 | 0.6 (1.3) |
Figure S48. Get High-res Image Clustering Approach #2: 'METHLYATION CNMF' versus Clinical Feature #9: 'NUMBER_OF_LYMPH_NODES'
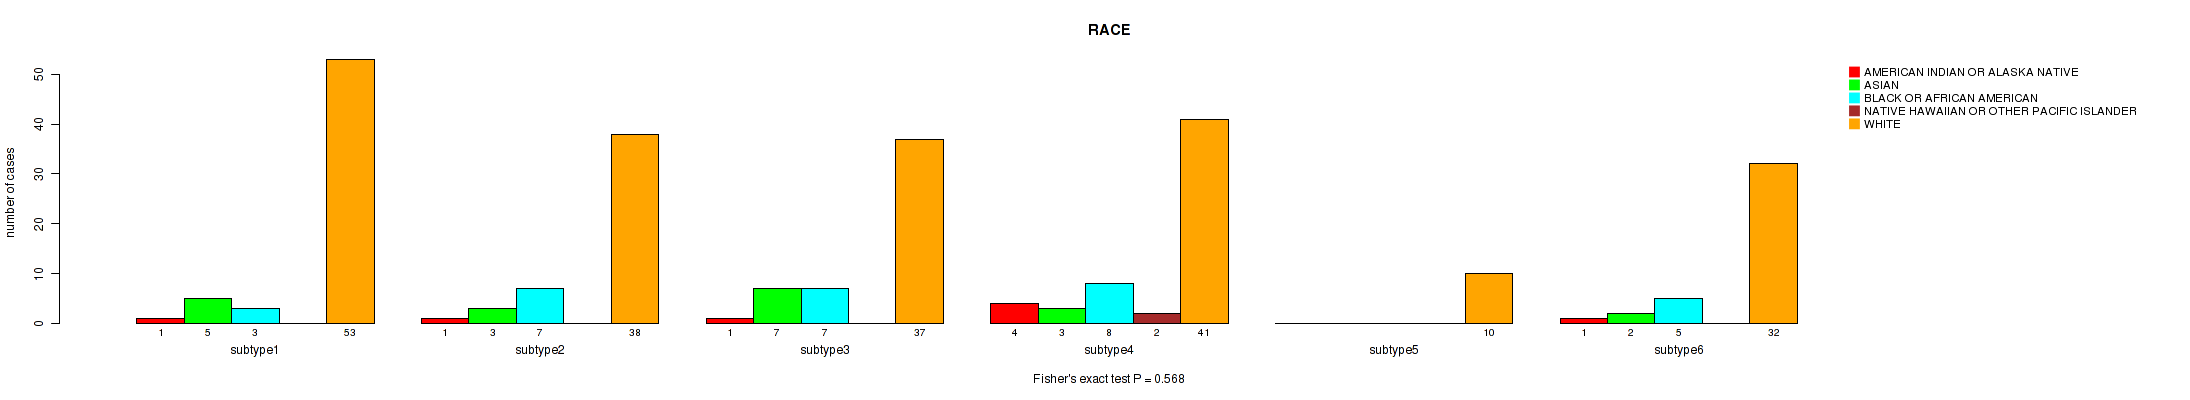
P value = 0.568 (Fisher's exact test), Q value = 0.78
Table S51. Clustering Approach #2: 'METHLYATION CNMF' versus Clinical Feature #10: 'RACE'
| nPatients | AMERICAN INDIAN OR ALASKA NATIVE | ASIAN | BLACK OR AFRICAN AMERICAN | NATIVE HAWAIIAN OR OTHER PACIFIC ISLANDER | WHITE |
|---|---|---|---|---|---|
| ALL | 8 | 20 | 30 | 2 | 211 |
| subtype1 | 1 | 5 | 3 | 0 | 53 |
| subtype2 | 1 | 3 | 7 | 0 | 38 |
| subtype3 | 1 | 7 | 7 | 0 | 37 |
| subtype4 | 4 | 3 | 8 | 2 | 41 |
| subtype5 | 0 | 0 | 0 | 0 | 10 |
| subtype6 | 1 | 2 | 5 | 0 | 32 |
Figure S49. Get High-res Image Clustering Approach #2: 'METHLYATION CNMF' versus Clinical Feature #10: 'RACE'
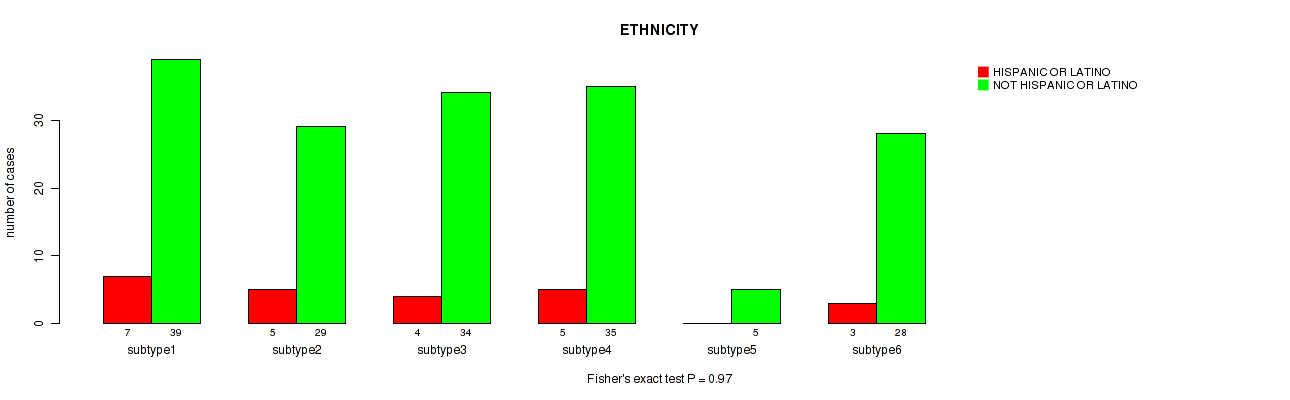
P value = 0.97 (Fisher's exact test), Q value = 1
Table S52. Clustering Approach #2: 'METHLYATION CNMF' versus Clinical Feature #11: 'ETHNICITY'
| nPatients | HISPANIC OR LATINO | NOT HISPANIC OR LATINO |
|---|---|---|
| ALL | 24 | 170 |
| subtype1 | 7 | 39 |
| subtype2 | 5 | 29 |
| subtype3 | 4 | 34 |
| subtype4 | 5 | 35 |
| subtype5 | 0 | 5 |
| subtype6 | 3 | 28 |
Figure S50. Get High-res Image Clustering Approach #2: 'METHLYATION CNMF' versus Clinical Feature #11: 'ETHNICITY'
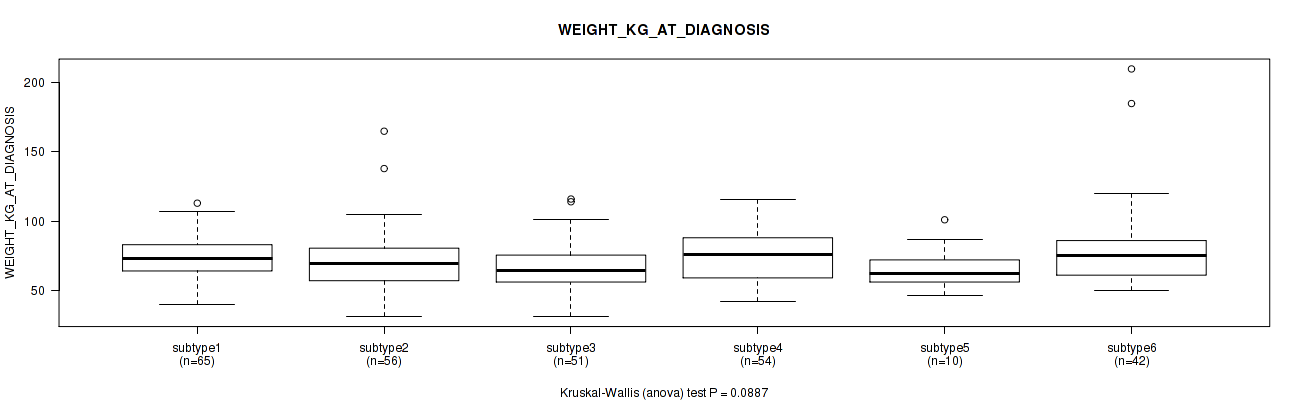
P value = 0.0887 (Kruskal-Wallis (anova)), Q value = 0.39
Table S53. Clustering Approach #2: 'METHLYATION CNMF' versus Clinical Feature #12: 'WEIGHT_KG_AT_DIAGNOSIS'
| nPatients | Mean (Std.Dev) | |
|---|---|---|
| ALL | 278 | 73.0 (21.5) |
| subtype1 | 65 | 73.7 (16.2) |
| subtype2 | 56 | 71.6 (22.2) |
| subtype3 | 51 | 67.4 (18.6) |
| subtype4 | 54 | 74.5 (18.9) |
| subtype5 | 10 | 66.8 (16.8) |
| subtype6 | 42 | 80.4 (31.7) |
Figure S51. Get High-res Image Clustering Approach #2: 'METHLYATION CNMF' versus Clinical Feature #12: 'WEIGHT_KG_AT_DIAGNOSIS'
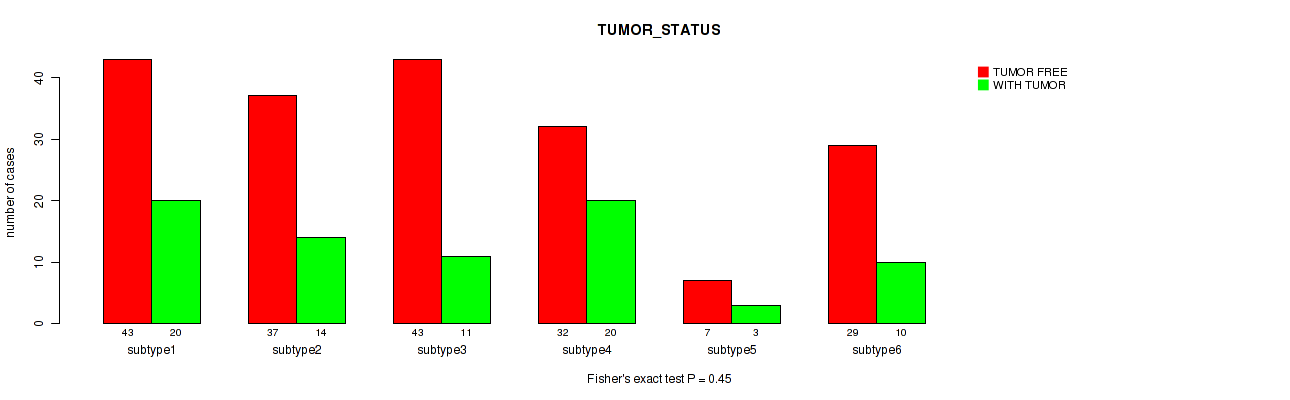
P value = 0.45 (Fisher's exact test), Q value = 0.74
Table S54. Clustering Approach #2: 'METHLYATION CNMF' versus Clinical Feature #13: 'TUMOR_STATUS'
| nPatients | TUMOR FREE | WITH TUMOR |
|---|---|---|
| ALL | 191 | 78 |
| subtype1 | 43 | 20 |
| subtype2 | 37 | 14 |
| subtype3 | 43 | 11 |
| subtype4 | 32 | 20 |
| subtype5 | 7 | 3 |
| subtype6 | 29 | 10 |
Figure S52. Get High-res Image Clustering Approach #2: 'METHLYATION CNMF' versus Clinical Feature #13: 'TUMOR_STATUS'
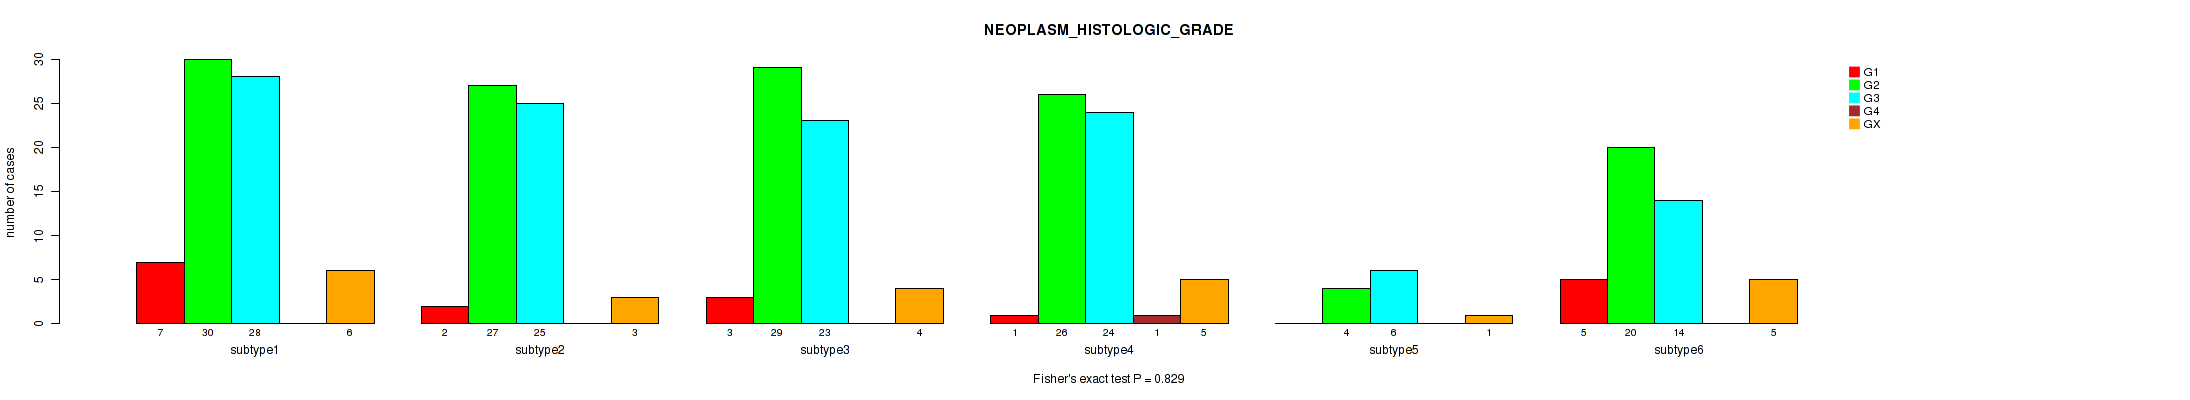
P value = 0.829 (Fisher's exact test), Q value = 0.93
Table S55. Clustering Approach #2: 'METHLYATION CNMF' versus Clinical Feature #14: 'NEOPLASM_HISTOLOGIC_GRADE'
| nPatients | G1 | G2 | G3 | G4 | GX |
|---|---|---|---|---|---|
| ALL | 18 | 136 | 120 | 1 | 24 |
| subtype1 | 7 | 30 | 28 | 0 | 6 |
| subtype2 | 2 | 27 | 25 | 0 | 3 |
| subtype3 | 3 | 29 | 23 | 0 | 4 |
| subtype4 | 1 | 26 | 24 | 1 | 5 |
| subtype5 | 0 | 4 | 6 | 0 | 1 |
| subtype6 | 5 | 20 | 14 | 0 | 5 |
Figure S53. Get High-res Image Clustering Approach #2: 'METHLYATION CNMF' versus Clinical Feature #14: 'NEOPLASM_HISTOLOGIC_GRADE'
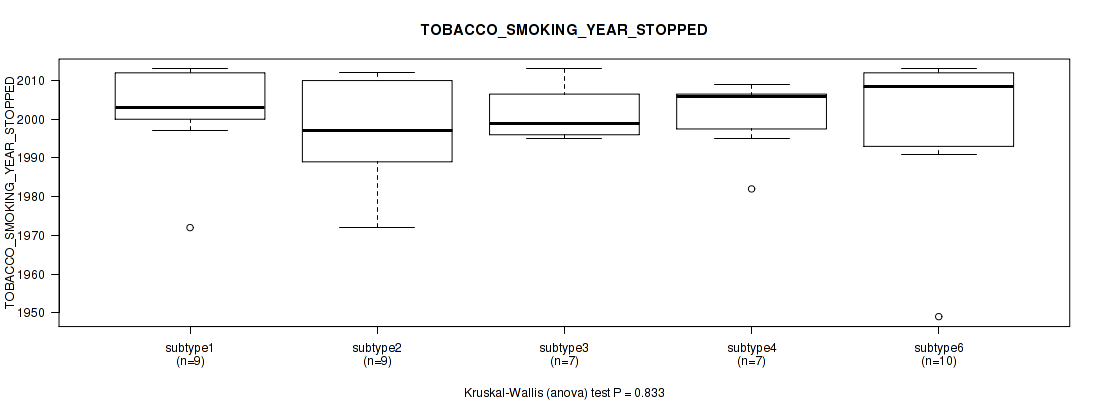
P value = 0.833 (Kruskal-Wallis (anova)), Q value = 0.93
Table S56. Clustering Approach #2: 'METHLYATION CNMF' versus Clinical Feature #15: 'TOBACCO_SMOKING_YEAR_STOPPED'
| nPatients | Mean (Std.Dev) | |
|---|---|---|
| ALL | 43 | 1999.7 (13.6) |
| subtype1 | 9 | 2002.1 (12.6) |
| subtype2 | 9 | 1997.7 (14.0) |
| subtype3 | 7 | 2001.7 (7.3) |
| subtype4 | 7 | 2000.7 (9.6) |
| subtype5 | 1 | 1978.0 (NA) |
| subtype6 | 10 | 1999.4 (19.7) |
Figure S54. Get High-res Image Clustering Approach #2: 'METHLYATION CNMF' versus Clinical Feature #15: 'TOBACCO_SMOKING_YEAR_STOPPED'
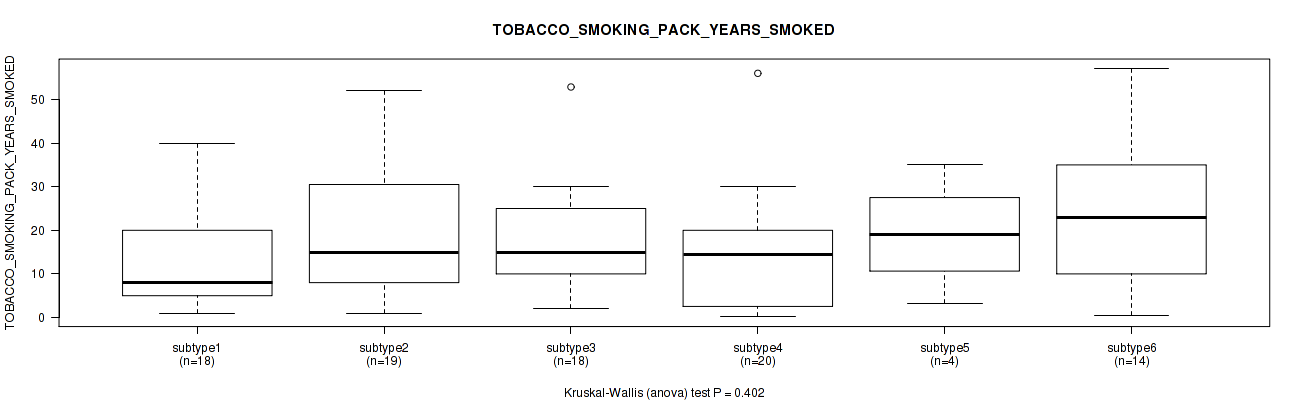
P value = 0.402 (Kruskal-Wallis (anova)), Q value = 0.71
Table S57. Clustering Approach #2: 'METHLYATION CNMF' versus Clinical Feature #16: 'TOBACCO_SMOKING_PACK_YEARS_SMOKED'
| nPatients | Mean (Std.Dev) | |
|---|---|---|
| ALL | 93 | 17.4 (14.1) |
| subtype1 | 18 | 12.6 (11.3) |
| subtype2 | 19 | 20.4 (16.8) |
| subtype3 | 18 | 17.2 (12.5) |
| subtype4 | 20 | 15.1 (13.6) |
| subtype5 | 4 | 19.1 (13.0) |
| subtype6 | 14 | 22.5 (16.2) |
Figure S55. Get High-res Image Clustering Approach #2: 'METHLYATION CNMF' versus Clinical Feature #16: 'TOBACCO_SMOKING_PACK_YEARS_SMOKED'
P value = 0.238 (Fisher's exact test), Q value = 0.56
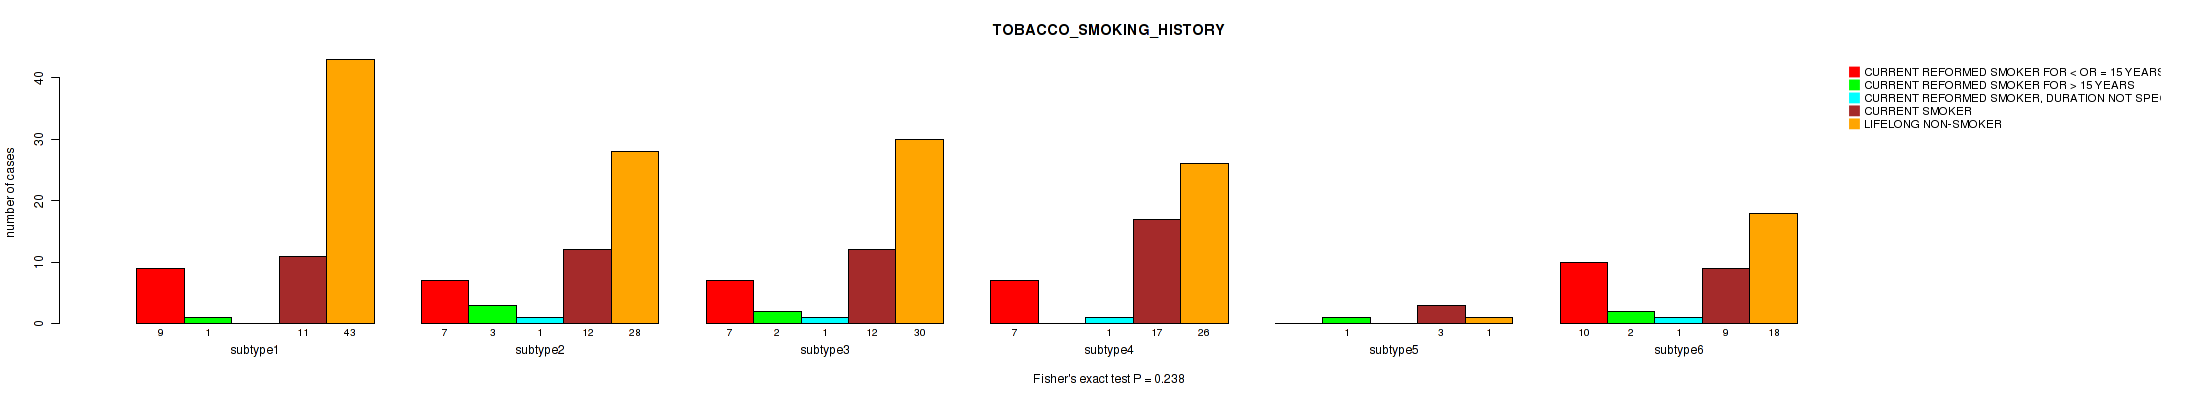
Table S58. Clustering Approach #2: 'METHLYATION CNMF' versus Clinical Feature #17: 'TOBACCO_SMOKING_HISTORY'
| nPatients | CURRENT REFORMED SMOKER FOR < OR = 15 YEARS | CURRENT REFORMED SMOKER FOR > 15 YEARS | CURRENT REFORMED SMOKER, DURATION NOT SPECIFIED | CURRENT SMOKER | LIFELONG NON-SMOKER |
|---|---|---|---|---|---|
| ALL | 40 | 9 | 4 | 64 | 146 |
| subtype1 | 9 | 1 | 0 | 11 | 43 |
| subtype2 | 7 | 3 | 1 | 12 | 28 |
| subtype3 | 7 | 2 | 1 | 12 | 30 |
| subtype4 | 7 | 0 | 1 | 17 | 26 |
| subtype5 | 0 | 1 | 0 | 3 | 1 |
| subtype6 | 10 | 2 | 1 | 9 | 18 |
Figure S56. Get High-res Image Clustering Approach #2: 'METHLYATION CNMF' versus Clinical Feature #17: 'TOBACCO_SMOKING_HISTORY'
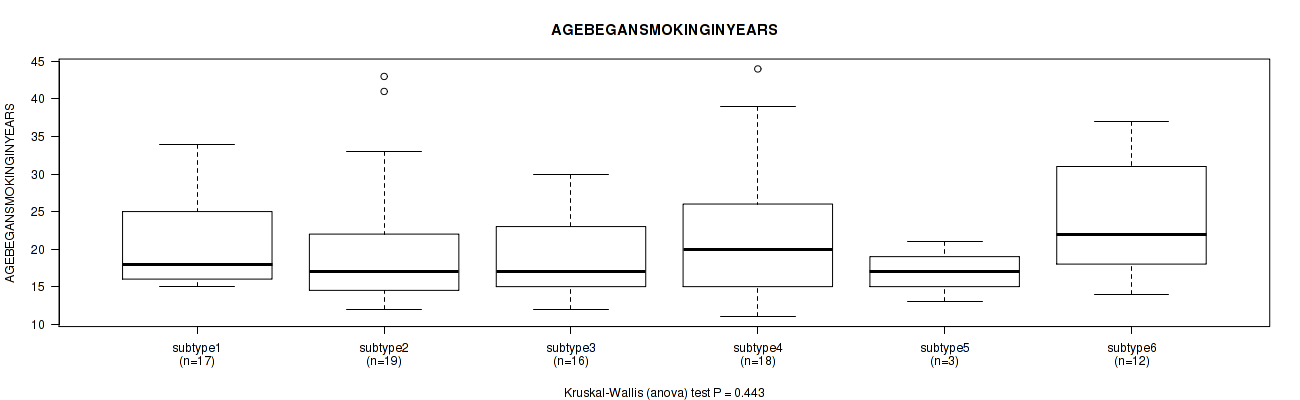
P value = 0.443 (Kruskal-Wallis (anova)), Q value = 0.74
Table S59. Clustering Approach #2: 'METHLYATION CNMF' versus Clinical Feature #18: 'AGEBEGANSMOKINGINYEARS'
| nPatients | Mean (Std.Dev) | |
|---|---|---|
| ALL | 85 | 21.1 (7.7) |
| subtype1 | 17 | 20.9 (5.7) |
| subtype2 | 19 | 20.6 (9.4) |
| subtype3 | 16 | 19.2 (5.2) |
| subtype4 | 18 | 22.3 (9.4) |
| subtype5 | 3 | 17.0 (4.0) |
| subtype6 | 12 | 24.2 (7.8) |
Figure S57. Get High-res Image Clustering Approach #2: 'METHLYATION CNMF' versus Clinical Feature #18: 'AGEBEGANSMOKINGINYEARS'
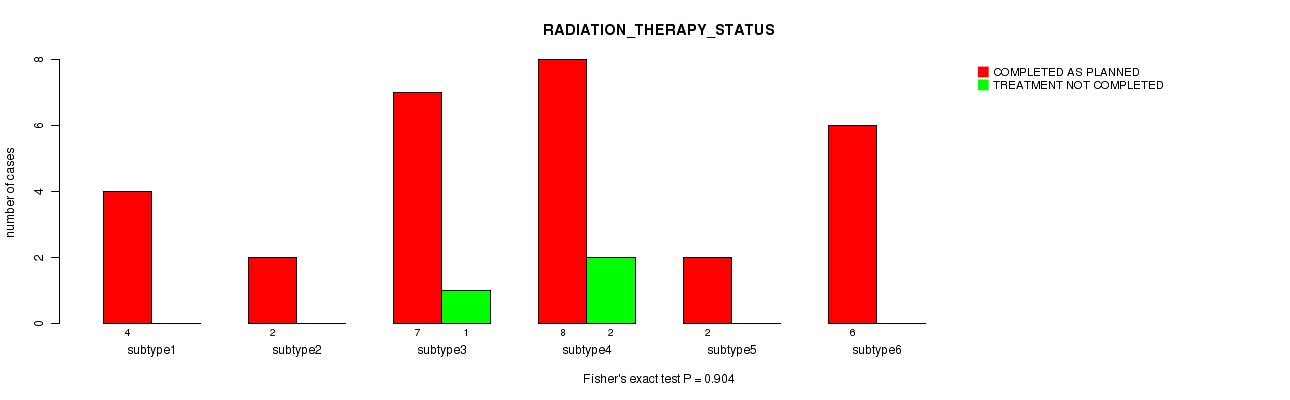
P value = 0.904 (Fisher's exact test), Q value = 0.96
Table S60. Clustering Approach #2: 'METHLYATION CNMF' versus Clinical Feature #19: 'RADIATION_THERAPY_STATUS'
| nPatients | COMPLETED AS PLANNED | TREATMENT NOT COMPLETED |
|---|---|---|
| ALL | 29 | 3 |
| subtype1 | 4 | 0 |
| subtype2 | 2 | 0 |
| subtype3 | 7 | 1 |
| subtype4 | 8 | 2 |
| subtype5 | 2 | 0 |
| subtype6 | 6 | 0 |
Figure S58. Get High-res Image Clustering Approach #2: 'METHLYATION CNMF' versus Clinical Feature #19: 'RADIATION_THERAPY_STATUS'
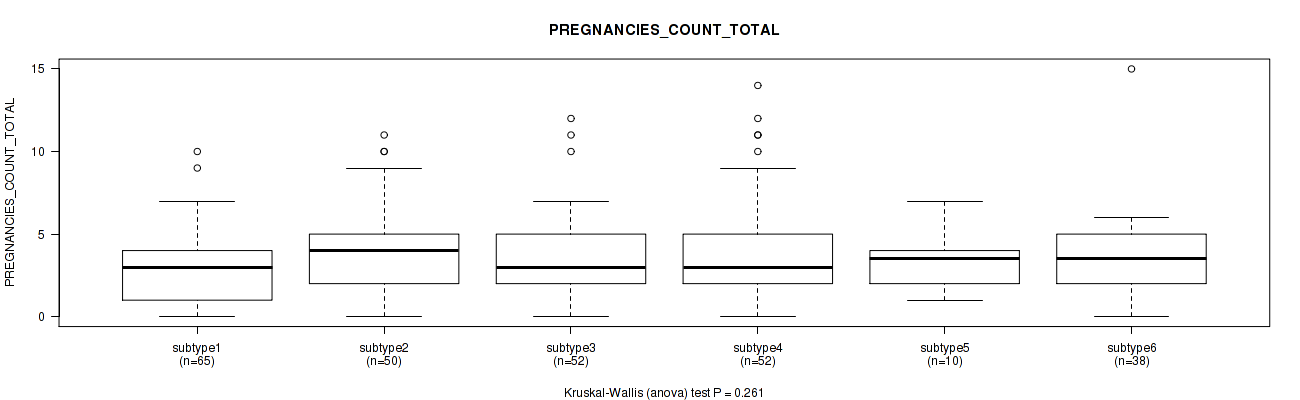
P value = 0.261 (Kruskal-Wallis (anova)), Q value = 0.58
Table S61. Clustering Approach #2: 'METHLYATION CNMF' versus Clinical Feature #20: 'PREGNANCIES_COUNT_TOTAL'
| nPatients | Mean (Std.Dev) | |
|---|---|---|
| ALL | 267 | 3.6 (2.6) |
| subtype1 | 65 | 3.0 (2.1) |
| subtype2 | 50 | 4.0 (2.5) |
| subtype3 | 52 | 3.6 (2.5) |
| subtype4 | 52 | 4.0 (3.3) |
| subtype5 | 10 | 3.3 (1.7) |
| subtype6 | 38 | 3.6 (2.5) |
Figure S59. Get High-res Image Clustering Approach #2: 'METHLYATION CNMF' versus Clinical Feature #20: 'PREGNANCIES_COUNT_TOTAL'
P value = 0.000982 (Kruskal-Wallis (anova)), Q value = 0.024
Table S62. Clustering Approach #2: 'METHLYATION CNMF' versus Clinical Feature #21: 'PREGNANCIES_COUNT_STILLBIRTH'
| nPatients | Mean (Std.Dev) | |
|---|---|---|
| ALL | 112 | 0.1 (0.3) |
| subtype1 | 27 | 0.0 (0.2) |
| subtype2 | 23 | 0.0 (0.0) |
| subtype3 | 20 | 0.3 (0.7) |
| subtype4 | 22 | 0.0 (0.0) |
| subtype5 | 2 | 0.0 (0.0) |
| subtype6 | 18 | 0.0 (0.0) |
Figure S60. Get High-res Image Clustering Approach #2: 'METHLYATION CNMF' versus Clinical Feature #21: 'PREGNANCIES_COUNT_STILLBIRTH'
P value = 0.908 (Kruskal-Wallis (anova)), Q value = 0.96
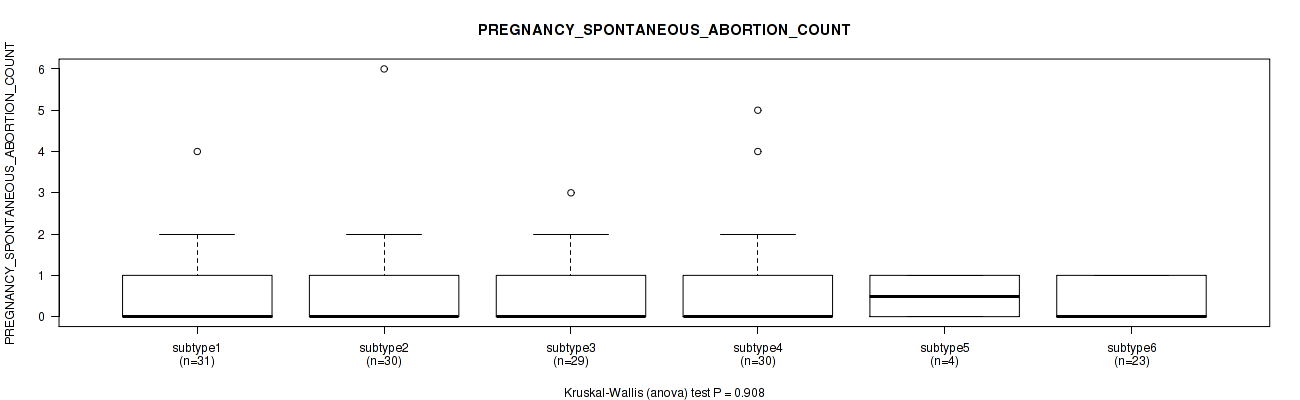
Table S63. Clustering Approach #2: 'METHLYATION CNMF' versus Clinical Feature #22: 'PREGNANCY_SPONTANEOUS_ABORTION_COUNT'
| nPatients | Mean (Std.Dev) | |
|---|---|---|
| ALL | 147 | 0.5 (0.9) |
| subtype1 | 31 | 0.6 (0.8) |
| subtype2 | 30 | 0.5 (1.2) |
| subtype3 | 29 | 0.5 (0.7) |
| subtype4 | 30 | 0.7 (1.2) |
| subtype5 | 4 | 0.5 (0.6) |
| subtype6 | 23 | 0.3 (0.5) |
Figure S61. Get High-res Image Clustering Approach #2: 'METHLYATION CNMF' versus Clinical Feature #22: 'PREGNANCY_SPONTANEOUS_ABORTION_COUNT'
P value = 0.0172 (Kruskal-Wallis (anova)), Q value = 0.16
Table S64. Clustering Approach #2: 'METHLYATION CNMF' versus Clinical Feature #23: 'PREGNANCIES_COUNT_LIVE_BIRTH'
| nPatients | Mean (Std.Dev) | |
|---|---|---|
| ALL | 262 | 2.8 (2.0) |
| subtype1 | 61 | 2.3 (1.9) |
| subtype2 | 50 | 3.6 (2.3) |
| subtype3 | 52 | 2.7 (1.9) |
| subtype4 | 50 | 3.2 (2.4) |
| subtype5 | 11 | 2.3 (1.2) |
| subtype6 | 38 | 2.6 (1.5) |
Figure S62. Get High-res Image Clustering Approach #2: 'METHLYATION CNMF' versus Clinical Feature #23: 'PREGNANCIES_COUNT_LIVE_BIRTH'
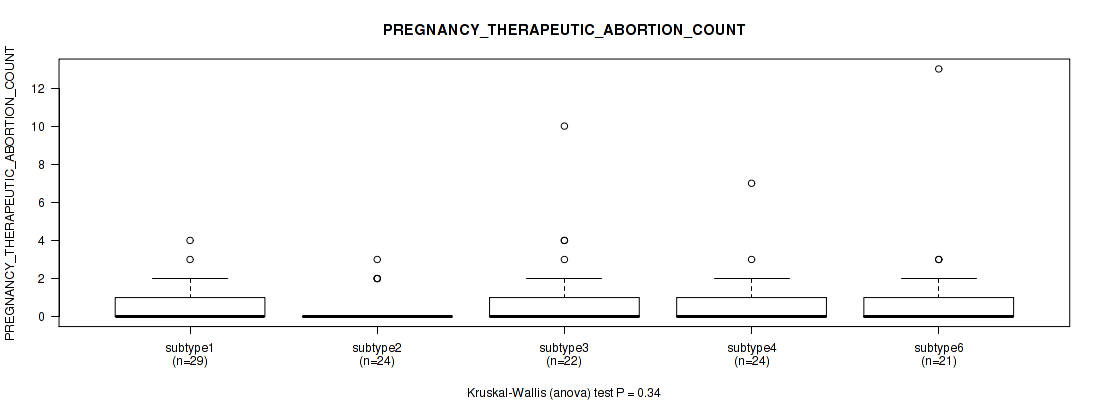
P value = 0.34 (Kruskal-Wallis (anova)), Q value = 0.67
Table S65. Clustering Approach #2: 'METHLYATION CNMF' versus Clinical Feature #24: 'PREGNANCY_THERAPEUTIC_ABORTION_COUNT'
| nPatients | Mean (Std.Dev) | |
|---|---|---|
| ALL | 122 | 0.9 (1.8) |
| subtype1 | 29 | 0.8 (1.0) |
| subtype2 | 24 | 0.4 (0.9) |
| subtype3 | 22 | 1.2 (2.4) |
| subtype4 | 24 | 0.8 (1.6) |
| subtype5 | 2 | 0.5 (0.7) |
| subtype6 | 21 | 1.2 (2.9) |
Figure S63. Get High-res Image Clustering Approach #2: 'METHLYATION CNMF' versus Clinical Feature #24: 'PREGNANCY_THERAPEUTIC_ABORTION_COUNT'
P value = 0.65 (Kruskal-Wallis (anova)), Q value = 0.83
Table S66. Clustering Approach #2: 'METHLYATION CNMF' versus Clinical Feature #25: 'PREGNANCIES_COUNT_ECTOPIC'
| nPatients | Mean (Std.Dev) | |
|---|---|---|
| ALL | 116 | 0.1 (0.3) |
| subtype1 | 26 | 0.1 (0.3) |
| subtype2 | 24 | 0.0 (0.2) |
| subtype3 | 22 | 0.1 (0.4) |
| subtype4 | 22 | 0.1 (0.4) |
| subtype5 | 3 | 0.3 (0.6) |
| subtype6 | 19 | 0.2 (0.5) |
Figure S64. Get High-res Image Clustering Approach #2: 'METHLYATION CNMF' versus Clinical Feature #25: 'PREGNANCIES_COUNT_ECTOPIC'
P value = 0.527 (Fisher's exact test), Q value = 0.77
Table S67. Clustering Approach #2: 'METHLYATION CNMF' versus Clinical Feature #26: 'POS_LYMPH_NODE_LOCATION'
| nPatients | MACROSCOPIC PARAMETRIAL INVOLVEMENT | MICROSCOPIC PARAMETRIAL INVOLVEMENT | OTHER LOCATION, SPECIFY | POSITIVE BLADDER MARGIN | POSITIVE VAGINAL MARGIN |
|---|---|---|---|---|---|
| ALL | 3 | 8 | 40 | 1 | 10 |
| subtype1 | 2 | 1 | 8 | 0 | 2 |
| subtype2 | 0 | 2 | 4 | 0 | 2 |
| subtype3 | 0 | 0 | 13 | 0 | 2 |
| subtype4 | 0 | 2 | 7 | 1 | 1 |
| subtype5 | 0 | 1 | 2 | 0 | 0 |
| subtype6 | 1 | 2 | 6 | 0 | 3 |
Figure S65. Get High-res Image Clustering Approach #2: 'METHLYATION CNMF' versus Clinical Feature #26: 'POS_LYMPH_NODE_LOCATION'
P value = 0.129 (Fisher's exact test), Q value = 0.47
Table S68. Clustering Approach #2: 'METHLYATION CNMF' versus Clinical Feature #27: 'MENOPAUSE_STATUS'
| nPatients | INDETERMINATE (NEITHER PRE OR POSTMENOPAUSAL) | PERI (6-12 MONTHS SINCE LAST MENSTRUAL PERIOD) | POST (PRIOR BILATERAL OVARIECTOMY OR >12 MO SINCE LMP WITH NO PRIOR HYSTERECTOMY) | PRE (<6 MONTHS SINCE LMP AND NO PRIOR BILATERAL OVARIECTOMY AND NOT ON ESTROGEN REPLACEMENT) |
|---|---|---|---|---|
| ALL | 2 | 25 | 84 | 125 |
| subtype1 | 0 | 9 | 17 | 35 |
| subtype2 | 1 | 6 | 20 | 17 |
| subtype3 | 0 | 4 | 18 | 27 |
| subtype4 | 0 | 3 | 8 | 27 |
| subtype5 | 0 | 1 | 3 | 4 |
| subtype6 | 1 | 2 | 18 | 15 |
Figure S66. Get High-res Image Clustering Approach #2: 'METHLYATION CNMF' versus Clinical Feature #27: 'MENOPAUSE_STATUS'
P value = 0.358 (Fisher's exact test), Q value = 0.68
Table S69. Clustering Approach #2: 'METHLYATION CNMF' versus Clinical Feature #28: 'LYMPHOVASCULAR_INVOLVEMENT'
| nPatients | ABSENT | PRESENT |
|---|---|---|
| ALL | 72 | 80 |
| subtype1 | 22 | 21 |
| subtype2 | 7 | 17 |
| subtype3 | 17 | 14 |
| subtype4 | 12 | 9 |
| subtype5 | 2 | 4 |
| subtype6 | 12 | 15 |
Figure S67. Get High-res Image Clustering Approach #2: 'METHLYATION CNMF' versus Clinical Feature #28: 'LYMPHOVASCULAR_INVOLVEMENT'
P value = 0.111 (Kruskal-Wallis (anova)), Q value = 0.45
Table S70. Clustering Approach #2: 'METHLYATION CNMF' versus Clinical Feature #29: 'LYMPH_NODES_EXAMINED_HE_COUNT'
| nPatients | Mean (Std.Dev) | |
|---|---|---|
| ALL | 159 | 1.0 (2.4) |
| subtype1 | 43 | 0.9 (2.7) |
| subtype2 | 28 | 1.5 (2.2) |
| subtype3 | 29 | 1.2 (2.1) |
| subtype4 | 25 | 0.6 (1.4) |
| subtype5 | 5 | 3.6 (6.9) |
| subtype6 | 29 | 0.6 (1.3) |
Figure S68. Get High-res Image Clustering Approach #2: 'METHLYATION CNMF' versus Clinical Feature #29: 'LYMPH_NODES_EXAMINED_HE_COUNT'
P value = 0.739 (Kruskal-Wallis (anova)), Q value = 0.87
Table S71. Clustering Approach #2: 'METHLYATION CNMF' versus Clinical Feature #30: 'LYMPH_NODES_EXAMINED'
| nPatients | Mean (Std.Dev) | |
|---|---|---|
| ALL | 180 | 22.3 (12.6) |
| subtype1 | 48 | 21.1 (10.1) |
| subtype2 | 30 | 23.6 (14.6) |
| subtype3 | 34 | 25.6 (13.8) |
| subtype4 | 30 | 21.5 (12.8) |
| subtype5 | 7 | 18.6 (10.0) |
| subtype6 | 31 | 20.8 (12.9) |
Figure S69. Get High-res Image Clustering Approach #2: 'METHLYATION CNMF' versus Clinical Feature #30: 'LYMPH_NODES_EXAMINED'
P value = 0.00056 (Fisher's exact test), Q value = 0.016
Table S72. Clustering Approach #2: 'METHLYATION CNMF' versus Clinical Feature #31: 'KERATINIZATION_SQUAMOUS_CELL'
| nPatients | KERATINIZING SQUAMOUS CELL CARCINOMA | NON-KERATINIZING SQUAMOUS CELL CARCINOMA |
|---|---|---|
| ALL | 55 | 120 |
| subtype1 | 0 | 17 |
| subtype2 | 6 | 31 |
| subtype3 | 13 | 26 |
| subtype4 | 18 | 22 |
| subtype5 | 5 | 3 |
| subtype6 | 13 | 21 |
Figure S70. Get High-res Image Clustering Approach #2: 'METHLYATION CNMF' versus Clinical Feature #31: 'KERATINIZATION_SQUAMOUS_CELL'
P value = 0.163 (Kruskal-Wallis (anova)), Q value = 0.49
Table S73. Clustering Approach #2: 'METHLYATION CNMF' versus Clinical Feature #32: 'INITIAL_PATHOLOGIC_DX_YEAR'
| nPatients | Mean (Std.Dev) | |
|---|---|---|
| ALL | 305 | 2008.3 (4.8) |
| subtype1 | 70 | 2009.3 (3.9) |
| subtype2 | 58 | 2008.1 (5.3) |
| subtype3 | 60 | 2008.2 (4.8) |
| subtype4 | 61 | 2007.2 (5.2) |
| subtype5 | 11 | 2007.5 (4.8) |
| subtype6 | 45 | 2008.9 (4.4) |
Figure S71. Get High-res Image Clustering Approach #2: 'METHLYATION CNMF' versus Clinical Feature #32: 'INITIAL_PATHOLOGIC_DX_YEAR'
P value = 0.554 (Fisher's exact test), Q value = 0.77
Table S74. Clustering Approach #2: 'METHLYATION CNMF' versus Clinical Feature #33: 'HISTORY_HORMONAL_CONTRACEPTIVES_USE'
| nPatients | CURRENT USER | FORMER USER | NEVER USED |
|---|---|---|---|
| ALL | 15 | 54 | 90 |
| subtype1 | 7 | 19 | 20 |
| subtype2 | 2 | 11 | 18 |
| subtype3 | 3 | 7 | 18 |
| subtype4 | 2 | 10 | 17 |
| subtype5 | 0 | 2 | 1 |
| subtype6 | 1 | 5 | 16 |
Figure S72. Get High-res Image Clustering Approach #2: 'METHLYATION CNMF' versus Clinical Feature #33: 'HISTORY_HORMONAL_CONTRACEPTIVES_USE'
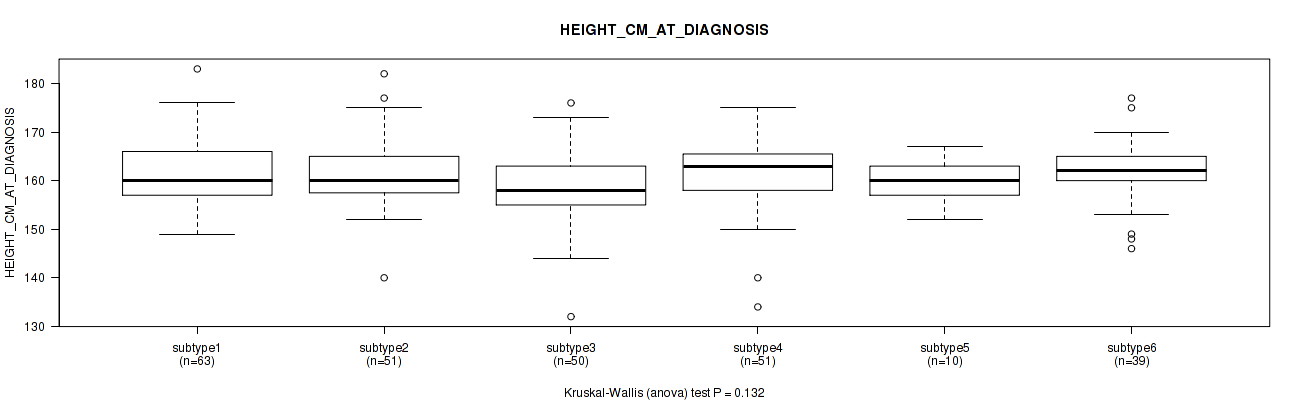
P value = 0.132 (Kruskal-Wallis (anova)), Q value = 0.47
Table S75. Clustering Approach #2: 'METHLYATION CNMF' versus Clinical Feature #34: 'HEIGHT_CM_AT_DIAGNOSIS'
| nPatients | Mean (Std.Dev) | |
|---|---|---|
| ALL | 264 | 161.0 (7.3) |
| subtype1 | 63 | 161.6 (7.0) |
| subtype2 | 51 | 161.5 (7.0) |
| subtype3 | 50 | 158.5 (8.1) |
| subtype4 | 51 | 161.4 (7.8) |
| subtype5 | 10 | 159.9 (4.8) |
| subtype6 | 39 | 162.2 (6.6) |
Figure S73. Get High-res Image Clustering Approach #2: 'METHLYATION CNMF' versus Clinical Feature #34: 'HEIGHT_CM_AT_DIAGNOSIS'
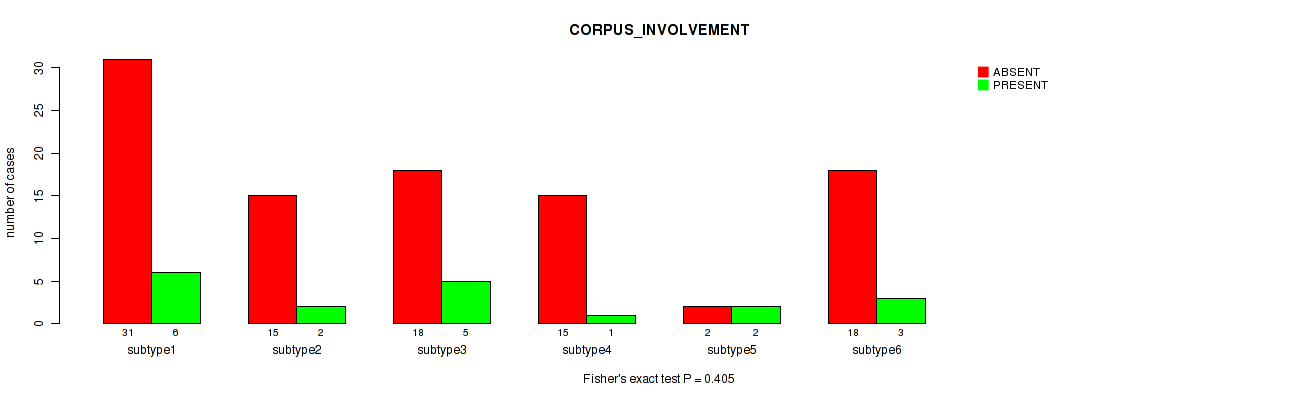
P value = 0.405 (Fisher's exact test), Q value = 0.71
Table S76. Clustering Approach #2: 'METHLYATION CNMF' versus Clinical Feature #35: 'CORPUS_INVOLVEMENT'
| nPatients | ABSENT | PRESENT |
|---|---|---|
| ALL | 99 | 19 |
| subtype1 | 31 | 6 |
| subtype2 | 15 | 2 |
| subtype3 | 18 | 5 |
| subtype4 | 15 | 1 |
| subtype5 | 2 | 2 |
| subtype6 | 18 | 3 |
Figure S74. Get High-res Image Clustering Approach #2: 'METHLYATION CNMF' versus Clinical Feature #35: 'CORPUS_INVOLVEMENT'
P value = 0.623 (Fisher's exact test), Q value = 0.83
Table S77. Clustering Approach #2: 'METHLYATION CNMF' versus Clinical Feature #36: 'CHEMO_CONCURRENT_TYPE'
| nPatients | CARBOPLATIN | CISPLATIN | OTHER |
|---|---|---|---|
| ALL | 7 | 104 | 2 |
| subtype1 | 3 | 23 | 1 |
| subtype2 | 1 | 20 | 0 |
| subtype3 | 1 | 22 | 1 |
| subtype4 | 1 | 26 | 0 |
| subtype5 | 1 | 3 | 0 |
| subtype6 | 0 | 10 | 0 |
Figure S75. Get High-res Image Clustering Approach #2: 'METHLYATION CNMF' versus Clinical Feature #36: 'CHEMO_CONCURRENT_TYPE'
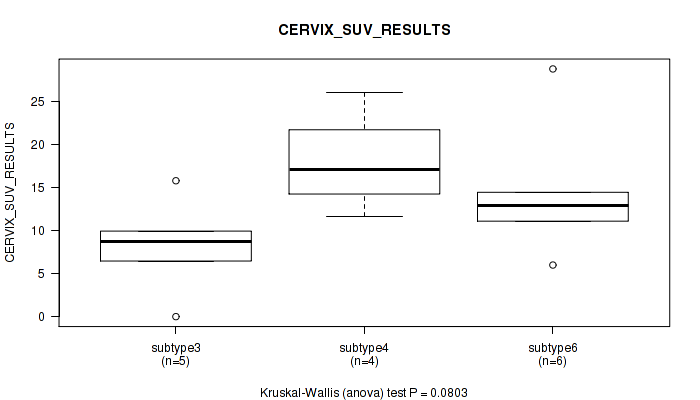
P value = 0.0803 (Kruskal-Wallis (anova)), Q value = 0.37
Table S78. Clustering Approach #2: 'METHLYATION CNMF' versus Clinical Feature #37: 'CERVIX_SUV_RESULTS'
| nPatients | Mean (Std.Dev) | |
|---|---|---|
| ALL | 17 | 13.2 (7.2) |
| subtype1 | 1 | 7.1 (NA) |
| subtype2 | 1 | 18.5 (NA) |
| subtype3 | 5 | 8.2 (5.7) |
| subtype4 | 4 | 18.0 (6.0) |
| subtype6 | 6 | 14.4 (7.7) |
Figure S76. Get High-res Image Clustering Approach #2: 'METHLYATION CNMF' versus Clinical Feature #37: 'CERVIX_SUV_RESULTS'
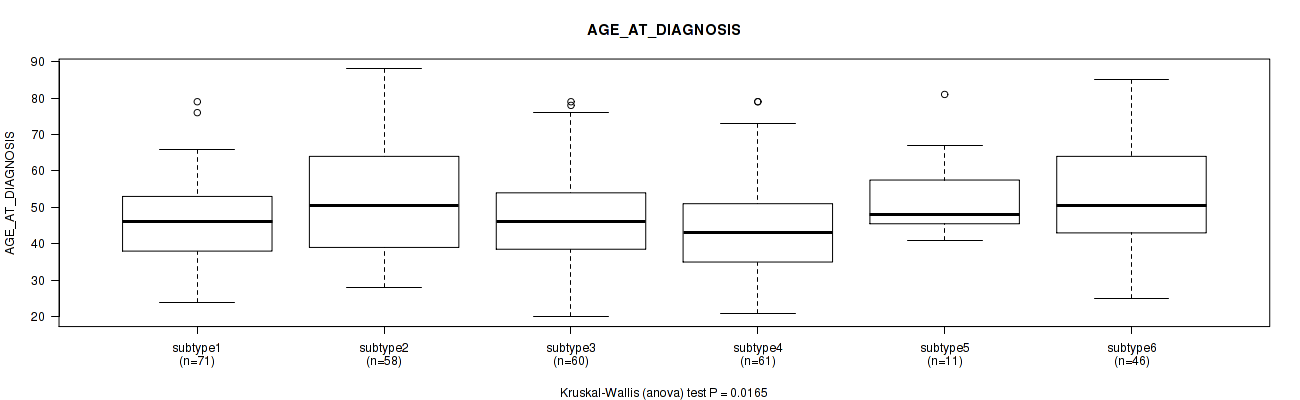
P value = 0.0165 (Kruskal-Wallis (anova)), Q value = 0.16
Table S79. Clustering Approach #2: 'METHLYATION CNMF' versus Clinical Feature #38: 'AGE_AT_DIAGNOSIS'
| nPatients | Mean (Std.Dev) | |
|---|---|---|
| ALL | 307 | 48.3 (13.8) |
| subtype1 | 71 | 46.8 (11.3) |
| subtype2 | 58 | 51.3 (15.3) |
| subtype3 | 60 | 48.0 (13.2) |
| subtype4 | 61 | 43.6 (13.9) |
| subtype5 | 11 | 53.0 (12.0) |
| subtype6 | 46 | 52.3 (14.4) |
Figure S77. Get High-res Image Clustering Approach #2: 'METHLYATION CNMF' versus Clinical Feature #38: 'AGE_AT_DIAGNOSIS'
P value = 0.0656 (Fisher's exact test), Q value = 0.33
Table S80. Clustering Approach #2: 'METHLYATION CNMF' versus Clinical Feature #39: 'CLINICAL_STAGE'
| nPatients | STAGE I | STAGE IA | STAGE IA1 | STAGE IA2 | STAGE IB | STAGE IB1 | STAGE IB2 | STAGE II | STAGE IIA | STAGE IIA1 | STAGE IIA2 | STAGE IIB | STAGE III | STAGE IIIA | STAGE IIIB | STAGE IVA | STAGE IVB |
|---|---|---|---|---|---|---|---|---|---|---|---|---|---|---|---|---|---|
| ALL | 5 | 1 | 1 | 1 | 38 | 78 | 39 | 5 | 9 | 5 | 7 | 44 | 1 | 3 | 42 | 9 | 12 |
| subtype1 | 1 | 0 | 0 | 0 | 5 | 26 | 11 | 1 | 3 | 1 | 2 | 9 | 0 | 0 | 7 | 0 | 5 |
| subtype2 | 0 | 0 | 0 | 0 | 6 | 13 | 6 | 1 | 0 | 0 | 1 | 6 | 1 | 1 | 10 | 4 | 4 |
| subtype3 | 0 | 1 | 0 | 0 | 8 | 18 | 4 | 1 | 1 | 2 | 0 | 10 | 0 | 0 | 11 | 3 | 1 |
| subtype4 | 2 | 0 | 0 | 0 | 13 | 9 | 6 | 0 | 4 | 1 | 1 | 12 | 0 | 2 | 8 | 1 | 1 |
| subtype5 | 1 | 0 | 0 | 1 | 1 | 2 | 1 | 0 | 0 | 1 | 0 | 2 | 0 | 0 | 2 | 0 | 0 |
| subtype6 | 1 | 0 | 1 | 0 | 5 | 10 | 11 | 2 | 1 | 0 | 3 | 5 | 0 | 0 | 4 | 1 | 1 |
Figure S78. Get High-res Image Clustering Approach #2: 'METHLYATION CNMF' versus Clinical Feature #39: 'CLINICAL_STAGE'

Table S81. Description of clustering approach #3: 'RPPA CNMF subtypes'
| Cluster Labels | 1 | 2 | 3 | 4 | 5 | 6 | 7 | 8 |
|---|---|---|---|---|---|---|---|---|
| Number of samples | 26 | 26 | 20 | 21 | 33 | 27 | 7 | 13 |
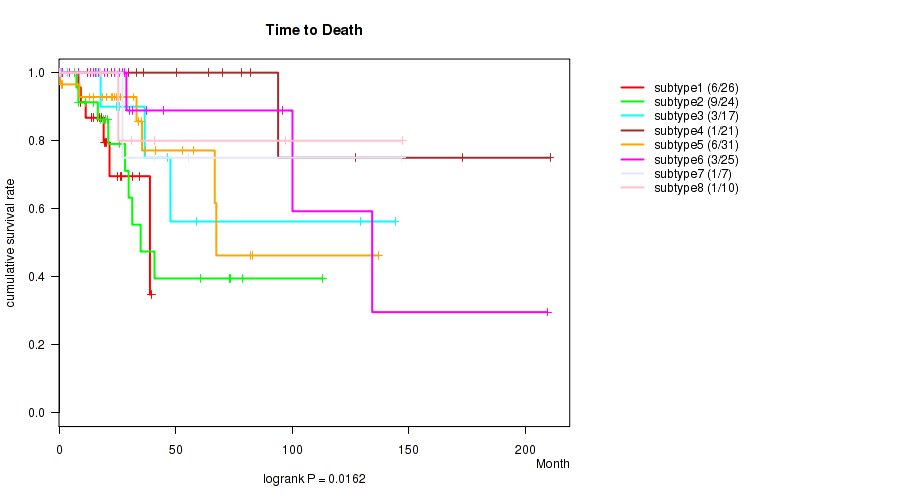
P value = 0.0162 (logrank test), Q value = 0.16
Table S82. Clustering Approach #3: 'RPPA CNMF subtypes' versus Clinical Feature #1: 'Time to Death'
| nPatients | nDeath | Duration Range (Median), Month | |
|---|---|---|---|
| ALL | 161 | 30 | 0.0 - 210.7 (23.8) |
| subtype1 | 26 | 6 | 0.6 - 39.5 (17.8) |
| subtype2 | 24 | 9 | 6.6 - 113.2 (21.0) |
| subtype3 | 17 | 3 | 0.0 - 144.2 (24.6) |
| subtype4 | 21 | 1 | 0.4 - 210.7 (33.3) |
| subtype5 | 31 | 6 | 0.1 - 137.2 (26.4) |
| subtype6 | 25 | 3 | 0.3 - 209.6 (25.9) |
| subtype7 | 7 | 1 | 12.5 - 146.9 (27.2) |
| subtype8 | 10 | 1 | 0.1 - 147.4 (21.6) |
Figure S79. Get High-res Image Clustering Approach #3: 'RPPA CNMF subtypes' versus Clinical Feature #1: 'Time to Death'
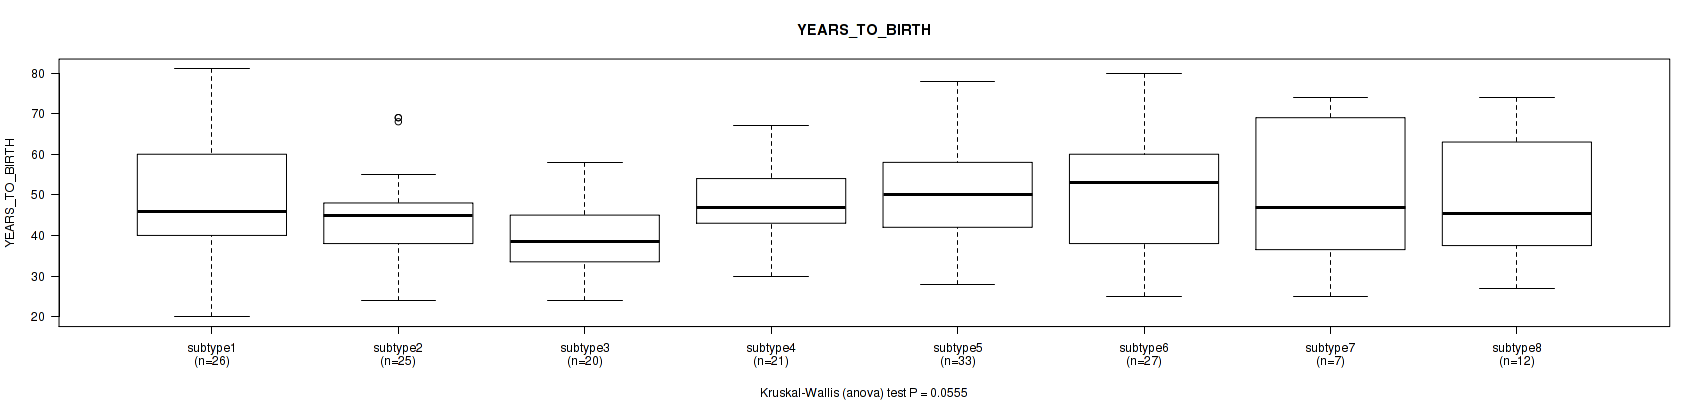
P value = 0.0555 (Kruskal-Wallis (anova)), Q value = 0.29
Table S83. Clustering Approach #3: 'RPPA CNMF subtypes' versus Clinical Feature #2: 'YEARS_TO_BIRTH'
| nPatients | Mean (Std.Dev) | |
|---|---|---|
| ALL | 171 | 47.5 (13.5) |
| subtype1 | 26 | 49.3 (15.5) |
| subtype2 | 25 | 44.4 (12.3) |
| subtype3 | 20 | 39.0 (9.5) |
| subtype4 | 21 | 47.4 (9.4) |
| subtype5 | 33 | 50.2 (12.1) |
| subtype6 | 27 | 50.5 (15.2) |
| subtype7 | 7 | 51.0 (20.3) |
| subtype8 | 12 | 49.0 (14.9) |
Figure S80. Get High-res Image Clustering Approach #3: 'RPPA CNMF subtypes' versus Clinical Feature #2: 'YEARS_TO_BIRTH'
P value = 0.389 (Fisher's exact test), Q value = 0.71
Table S84. Clustering Approach #3: 'RPPA CNMF subtypes' versus Clinical Feature #3: 'PATHOLOGY_T_STAGE'
| nPatients | T1 | T2 | T3 | T4 |
|---|---|---|---|---|
| ALL | 99 | 32 | 7 | 3 |
| subtype1 | 16 | 3 | 0 | 0 |
| subtype2 | 14 | 4 | 2 | 1 |
| subtype3 | 12 | 1 | 1 | 0 |
| subtype4 | 13 | 6 | 0 | 0 |
| subtype5 | 21 | 7 | 1 | 1 |
| subtype6 | 13 | 8 | 1 | 0 |
| subtype7 | 3 | 0 | 1 | 1 |
| subtype8 | 7 | 3 | 1 | 0 |
Figure S81. Get High-res Image Clustering Approach #3: 'RPPA CNMF subtypes' versus Clinical Feature #3: 'PATHOLOGY_T_STAGE'
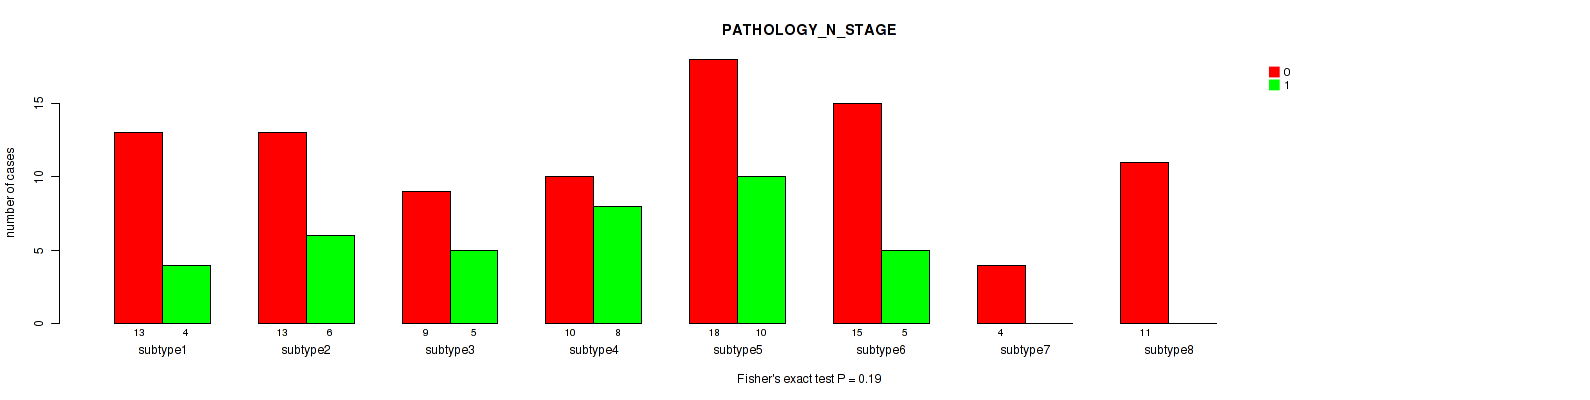
P value = 0.19 (Fisher's exact test), Q value = 0.52
Table S85. Clustering Approach #3: 'RPPA CNMF subtypes' versus Clinical Feature #4: 'PATHOLOGY_N_STAGE'
| nPatients | 0 | 1 |
|---|---|---|
| ALL | 93 | 38 |
| subtype1 | 13 | 4 |
| subtype2 | 13 | 6 |
| subtype3 | 9 | 5 |
| subtype4 | 10 | 8 |
| subtype5 | 18 | 10 |
| subtype6 | 15 | 5 |
| subtype7 | 4 | 0 |
| subtype8 | 11 | 0 |
Figure S82. Get High-res Image Clustering Approach #3: 'RPPA CNMF subtypes' versus Clinical Feature #4: 'PATHOLOGY_N_STAGE'
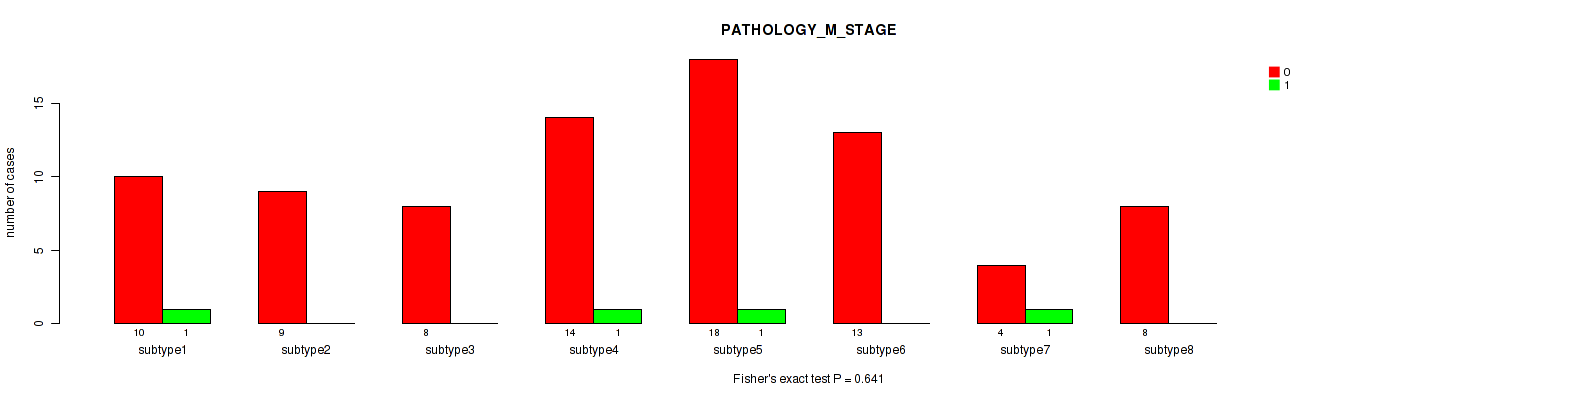
P value = 0.641 (Fisher's exact test), Q value = 0.83
Table S86. Clustering Approach #3: 'RPPA CNMF subtypes' versus Clinical Feature #5: 'PATHOLOGY_M_STAGE'
| nPatients | 0 | 1 |
|---|---|---|
| ALL | 84 | 4 |
| subtype1 | 10 | 1 |
| subtype2 | 9 | 0 |
| subtype3 | 8 | 0 |
| subtype4 | 14 | 1 |
| subtype5 | 18 | 1 |
| subtype6 | 13 | 0 |
| subtype7 | 4 | 1 |
| subtype8 | 8 | 0 |
Figure S83. Get High-res Image Clustering Approach #3: 'RPPA CNMF subtypes' versus Clinical Feature #5: 'PATHOLOGY_M_STAGE'
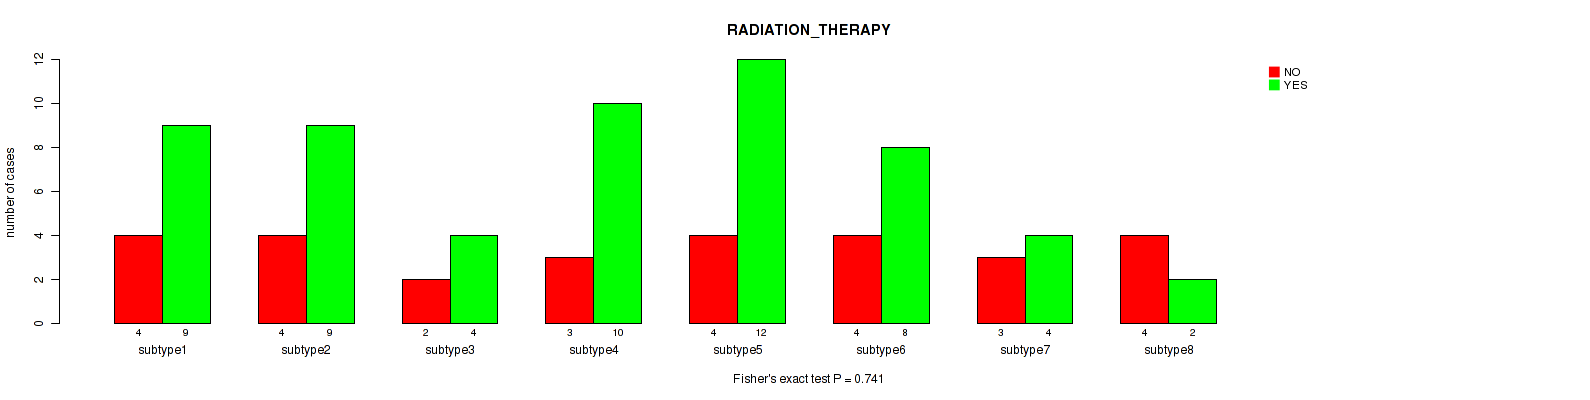
P value = 0.741 (Fisher's exact test), Q value = 0.87
Table S87. Clustering Approach #3: 'RPPA CNMF subtypes' versus Clinical Feature #6: 'RADIATION_THERAPY'
| nPatients | NO | YES |
|---|---|---|
| ALL | 28 | 58 |
| subtype1 | 4 | 9 |
| subtype2 | 4 | 9 |
| subtype3 | 2 | 4 |
| subtype4 | 3 | 10 |
| subtype5 | 4 | 12 |
| subtype6 | 4 | 8 |
| subtype7 | 3 | 4 |
| subtype8 | 4 | 2 |
Figure S84. Get High-res Image Clustering Approach #3: 'RPPA CNMF subtypes' versus Clinical Feature #6: 'RADIATION_THERAPY'
P value = 0.0331 (Fisher's exact test), Q value = 0.22
Table S88. Clustering Approach #3: 'RPPA CNMF subtypes' versus Clinical Feature #7: 'HISTOLOGICAL_TYPE'
| nPatients | ADENOSQUAMOUS | CERVICAL SQUAMOUS CELL CARCINOMA | ENDOCERVICAL ADENOCARCINOMA OF THE USUAL TYPE | ENDOCERVICAL TYPE OF ADENOCARCINOMA | ENDOMETRIOID ADENOCARCINOMA OF ENDOCERVIX | MUCINOUS ADENOCARCINOMA OF ENDOCERVICAL TYPE |
|---|---|---|---|---|---|---|
| ALL | 4 | 144 | 3 | 16 | 2 | 4 |
| subtype1 | 2 | 21 | 0 | 2 | 0 | 1 |
| subtype2 | 0 | 25 | 0 | 1 | 0 | 0 |
| subtype3 | 1 | 15 | 0 | 3 | 0 | 1 |
| subtype4 | 0 | 20 | 0 | 1 | 0 | 0 |
| subtype5 | 1 | 18 | 2 | 8 | 2 | 2 |
| subtype6 | 0 | 27 | 0 | 0 | 0 | 0 |
| subtype7 | 0 | 7 | 0 | 0 | 0 | 0 |
| subtype8 | 0 | 11 | 1 | 1 | 0 | 0 |
Figure S85. Get High-res Image Clustering Approach #3: 'RPPA CNMF subtypes' versus Clinical Feature #7: 'HISTOLOGICAL_TYPE'
P value = 0.0127 (Kruskal-Wallis (anova)), Q value = 0.15
Table S89. Clustering Approach #3: 'RPPA CNMF subtypes' versus Clinical Feature #8: 'NUMBER_PACK_YEARS_SMOKED'
| nPatients | Mean (Std.Dev) | |
|---|---|---|
| ALL | 45 | 17.7 (13.7) |
| subtype1 | 4 | 7.2 (6.6) |
| subtype2 | 10 | 21.8 (14.0) |
| subtype3 | 5 | 11.4 (8.8) |
| subtype4 | 4 | 11.9 (9.3) |
| subtype5 | 10 | 15.7 (11.9) |
| subtype6 | 9 | 29.9 (14.8) |
| subtype8 | 3 | 6.3 (3.8) |
Figure S86. Get High-res Image Clustering Approach #3: 'RPPA CNMF subtypes' versus Clinical Feature #8: 'NUMBER_PACK_YEARS_SMOKED'
P value = 0.52 (Kruskal-Wallis (anova)), Q value = 0.76
Table S90. Clustering Approach #3: 'RPPA CNMF subtypes' versus Clinical Feature #9: 'NUMBER_OF_LYMPH_NODES'
| nPatients | Mean (Std.Dev) | |
|---|---|---|
| ALL | 105 | 1.1 (2.7) |
| subtype1 | 13 | 0.8 (1.5) |
| subtype2 | 16 | 2.6 (5.1) |
| subtype3 | 11 | 1.6 (3.6) |
| subtype4 | 16 | 1.0 (1.5) |
| subtype5 | 25 | 0.7 (1.1) |
| subtype6 | 14 | 1.1 (2.3) |
| subtype7 | 3 | 0.0 (0.0) |
| subtype8 | 7 | 0.0 (0.0) |
Figure S87. Get High-res Image Clustering Approach #3: 'RPPA CNMF subtypes' versus Clinical Feature #9: 'NUMBER_OF_LYMPH_NODES'
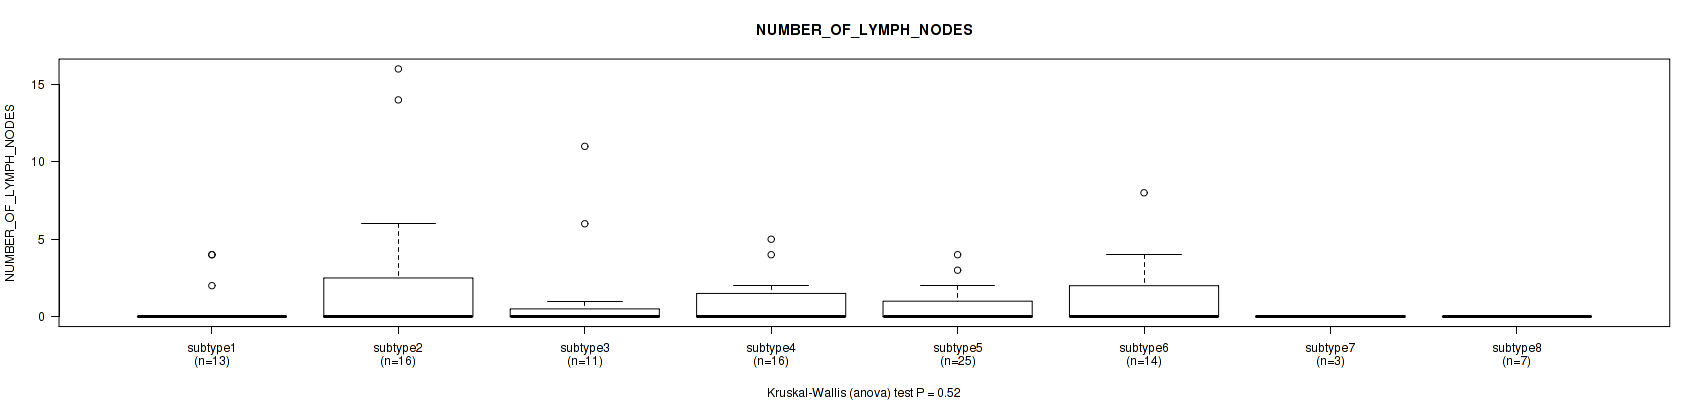
P value = 0.589 (Fisher's exact test), Q value = 0.8
Table S91. Clustering Approach #3: 'RPPA CNMF subtypes' versus Clinical Feature #10: 'RACE'
| nPatients | AMERICAN INDIAN OR ALASKA NATIVE | ASIAN | BLACK OR AFRICAN AMERICAN | NATIVE HAWAIIAN OR OTHER PACIFIC ISLANDER | WHITE |
|---|---|---|---|---|---|
| ALL | 3 | 15 | 12 | 1 | 125 |
| subtype1 | 0 | 2 | 3 | 1 | 19 |
| subtype2 | 0 | 1 | 4 | 0 | 21 |
| subtype3 | 0 | 1 | 2 | 0 | 15 |
| subtype4 | 0 | 1 | 0 | 0 | 16 |
| subtype5 | 0 | 4 | 1 | 0 | 23 |
| subtype6 | 2 | 4 | 1 | 0 | 18 |
| subtype7 | 0 | 1 | 1 | 0 | 5 |
| subtype8 | 1 | 1 | 0 | 0 | 8 |
Figure S88. Get High-res Image Clustering Approach #3: 'RPPA CNMF subtypes' versus Clinical Feature #10: 'RACE'
P value = 0.0445 (Fisher's exact test), Q value = 0.27
Table S92. Clustering Approach #3: 'RPPA CNMF subtypes' versus Clinical Feature #11: 'ETHNICITY'
| nPatients | HISPANIC OR LATINO | NOT HISPANIC OR LATINO |
|---|---|---|
| ALL | 13 | 113 |
| subtype1 | 1 | 22 |
| subtype2 | 2 | 15 |
| subtype3 | 0 | 15 |
| subtype4 | 3 | 11 |
| subtype5 | 0 | 23 |
| subtype6 | 4 | 17 |
| subtype7 | 1 | 3 |
| subtype8 | 2 | 7 |
Figure S89. Get High-res Image Clustering Approach #3: 'RPPA CNMF subtypes' versus Clinical Feature #11: 'ETHNICITY'
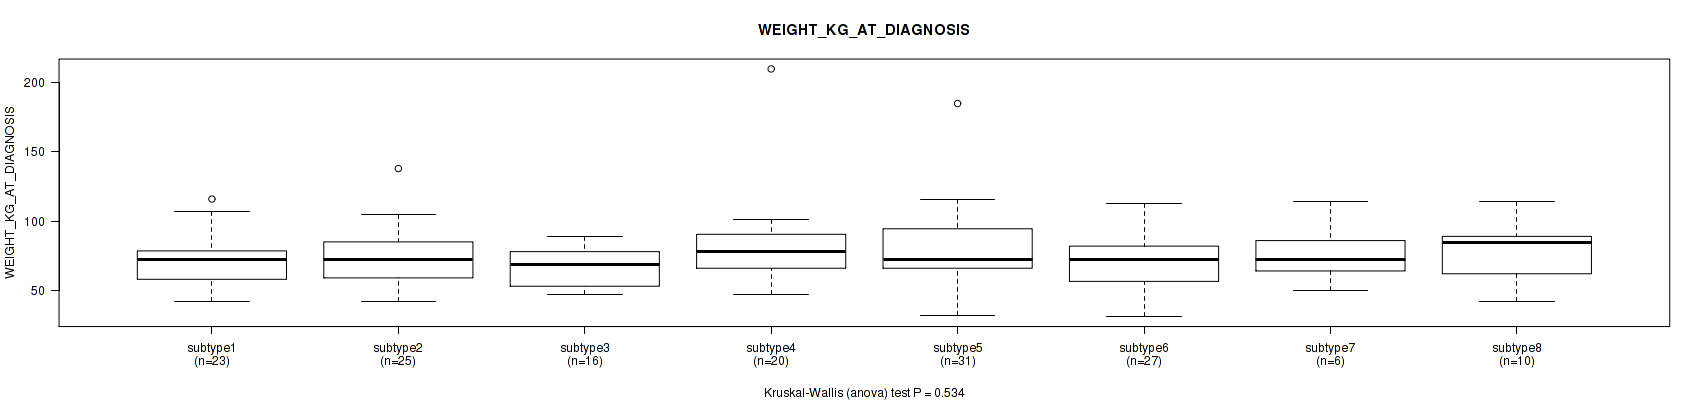
P value = 0.534 (Kruskal-Wallis (anova)), Q value = 0.77
Table S93. Clustering Approach #3: 'RPPA CNMF subtypes' versus Clinical Feature #12: 'WEIGHT_KG_AT_DIAGNOSIS'
| nPatients | Mean (Std.Dev) | |
|---|---|---|
| ALL | 158 | 74.7 (23.1) |
| subtype1 | 23 | 71.0 (18.8) |
| subtype2 | 25 | 73.7 (21.3) |
| subtype3 | 16 | 66.9 (14.0) |
| subtype4 | 20 | 83.0 (33.2) |
| subtype5 | 31 | 78.3 (27.6) |
| subtype6 | 27 | 70.9 (18.1) |
| subtype7 | 6 | 76.3 (22.0) |
| subtype8 | 10 | 78.9 (20.4) |
Figure S90. Get High-res Image Clustering Approach #3: 'RPPA CNMF subtypes' versus Clinical Feature #12: 'WEIGHT_KG_AT_DIAGNOSIS'
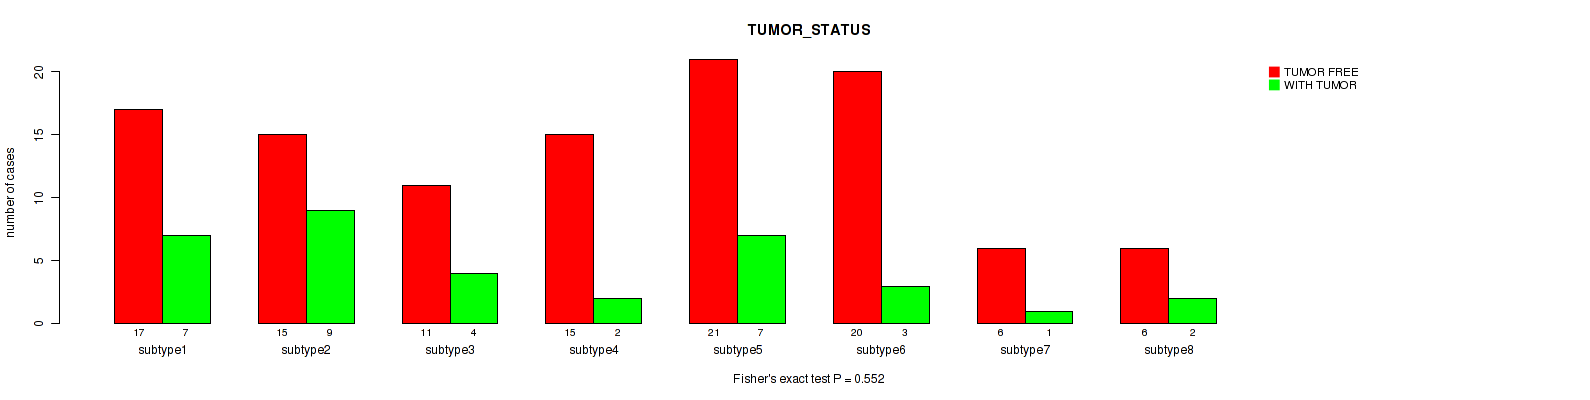
P value = 0.552 (Fisher's exact test), Q value = 0.77
Table S94. Clustering Approach #3: 'RPPA CNMF subtypes' versus Clinical Feature #13: 'TUMOR_STATUS'
| nPatients | TUMOR FREE | WITH TUMOR |
|---|---|---|
| ALL | 111 | 35 |
| subtype1 | 17 | 7 |
| subtype2 | 15 | 9 |
| subtype3 | 11 | 4 |
| subtype4 | 15 | 2 |
| subtype5 | 21 | 7 |
| subtype6 | 20 | 3 |
| subtype7 | 6 | 1 |
| subtype8 | 6 | 2 |
Figure S91. Get High-res Image Clustering Approach #3: 'RPPA CNMF subtypes' versus Clinical Feature #13: 'TUMOR_STATUS'
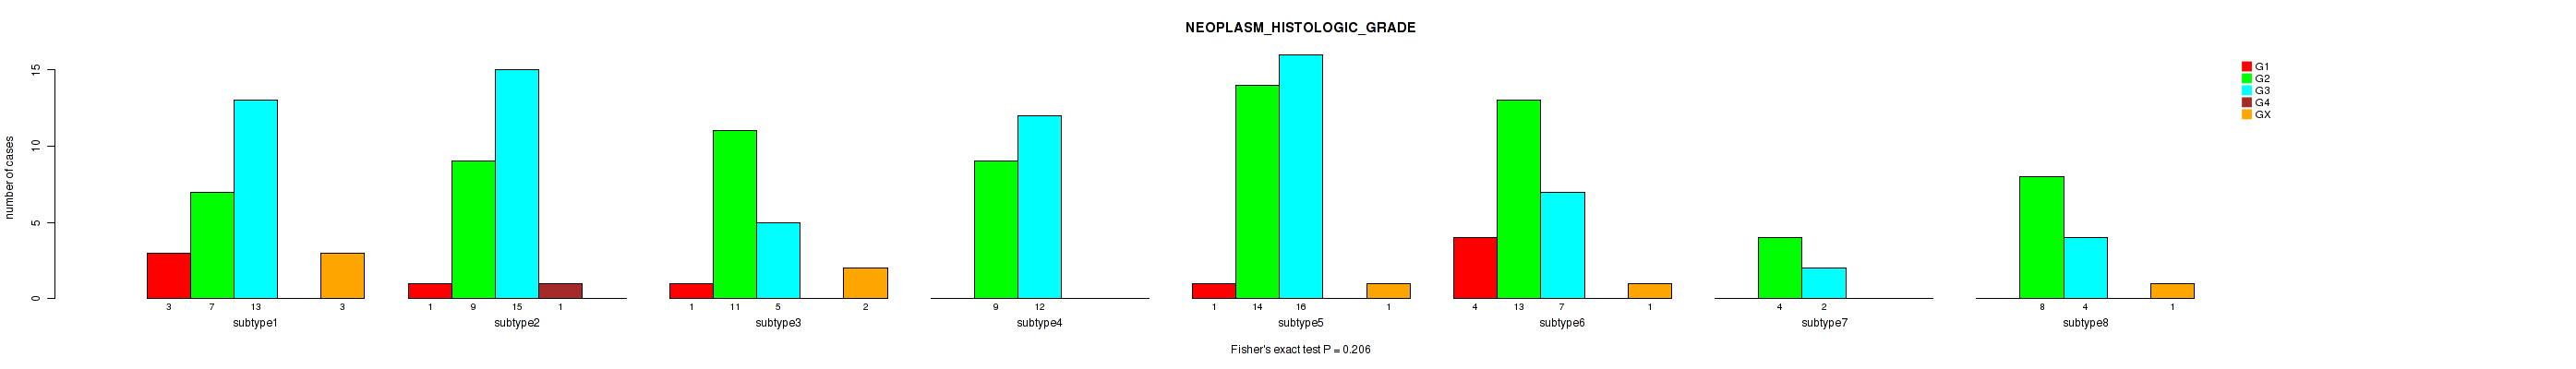
P value = 0.206 (Fisher's exact test), Q value = 0.53
Table S95. Clustering Approach #3: 'RPPA CNMF subtypes' versus Clinical Feature #14: 'NEOPLASM_HISTOLOGIC_GRADE'
| nPatients | G1 | G2 | G3 | G4 | GX |
|---|---|---|---|---|---|
| ALL | 10 | 75 | 74 | 1 | 8 |
| subtype1 | 3 | 7 | 13 | 0 | 3 |
| subtype2 | 1 | 9 | 15 | 1 | 0 |
| subtype3 | 1 | 11 | 5 | 0 | 2 |
| subtype4 | 0 | 9 | 12 | 0 | 0 |
| subtype5 | 1 | 14 | 16 | 0 | 1 |
| subtype6 | 4 | 13 | 7 | 0 | 1 |
| subtype7 | 0 | 4 | 2 | 0 | 0 |
| subtype8 | 0 | 8 | 4 | 0 | 1 |
Figure S92. Get High-res Image Clustering Approach #3: 'RPPA CNMF subtypes' versus Clinical Feature #14: 'NEOPLASM_HISTOLOGIC_GRADE'
P value = 0.196 (Kruskal-Wallis (anova)), Q value = 0.52
Table S96. Clustering Approach #3: 'RPPA CNMF subtypes' versus Clinical Feature #15: 'TOBACCO_SMOKING_YEAR_STOPPED'
| nPatients | Mean (Std.Dev) | |
|---|---|---|
| ALL | 31 | 2001.5 (10.7) |
| subtype1 | 5 | 2003.0 (8.2) |
| subtype2 | 6 | 2009.0 (5.1) |
| subtype3 | 3 | 2006.7 (8.5) |
| subtype4 | 2 | 1997.5 (13.4) |
| subtype5 | 8 | 1996.0 (14.7) |
| subtype6 | 4 | 1996.8 (7.0) |
| subtype8 | 3 | 2003.0 (11.3) |
Figure S93. Get High-res Image Clustering Approach #3: 'RPPA CNMF subtypes' versus Clinical Feature #15: 'TOBACCO_SMOKING_YEAR_STOPPED'
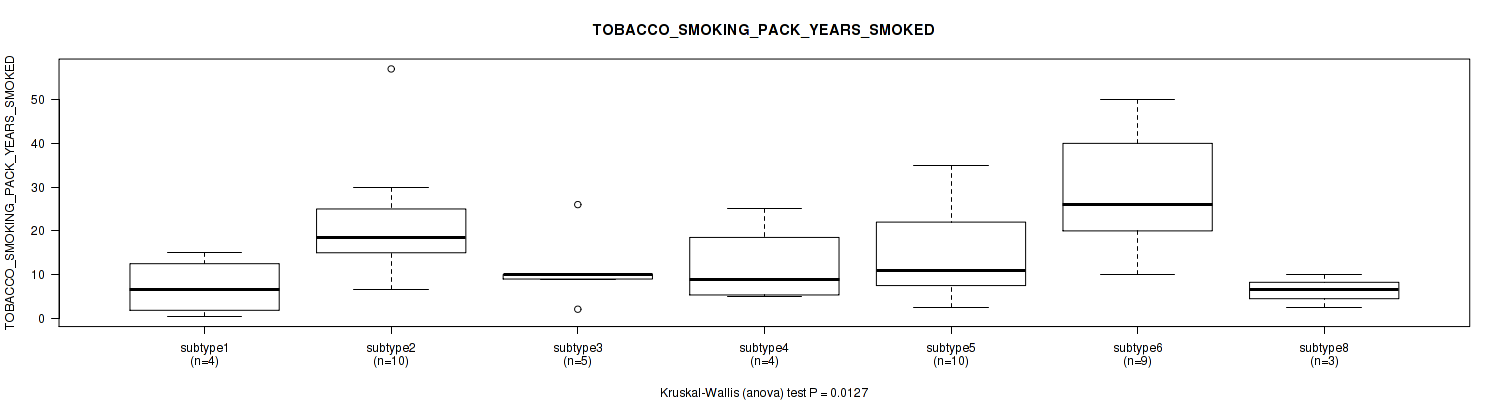
P value = 0.0127 (Kruskal-Wallis (anova)), Q value = 0.15
Table S97. Clustering Approach #3: 'RPPA CNMF subtypes' versus Clinical Feature #16: 'TOBACCO_SMOKING_PACK_YEARS_SMOKED'
| nPatients | Mean (Std.Dev) | |
|---|---|---|
| ALL | 45 | 17.7 (13.7) |
| subtype1 | 4 | 7.2 (6.6) |
| subtype2 | 10 | 21.8 (14.0) |
| subtype3 | 5 | 11.4 (8.8) |
| subtype4 | 4 | 11.9 (9.3) |
| subtype5 | 10 | 15.7 (11.9) |
| subtype6 | 9 | 29.9 (14.8) |
| subtype8 | 3 | 6.3 (3.8) |
Figure S94. Get High-res Image Clustering Approach #3: 'RPPA CNMF subtypes' versus Clinical Feature #16: 'TOBACCO_SMOKING_PACK_YEARS_SMOKED'
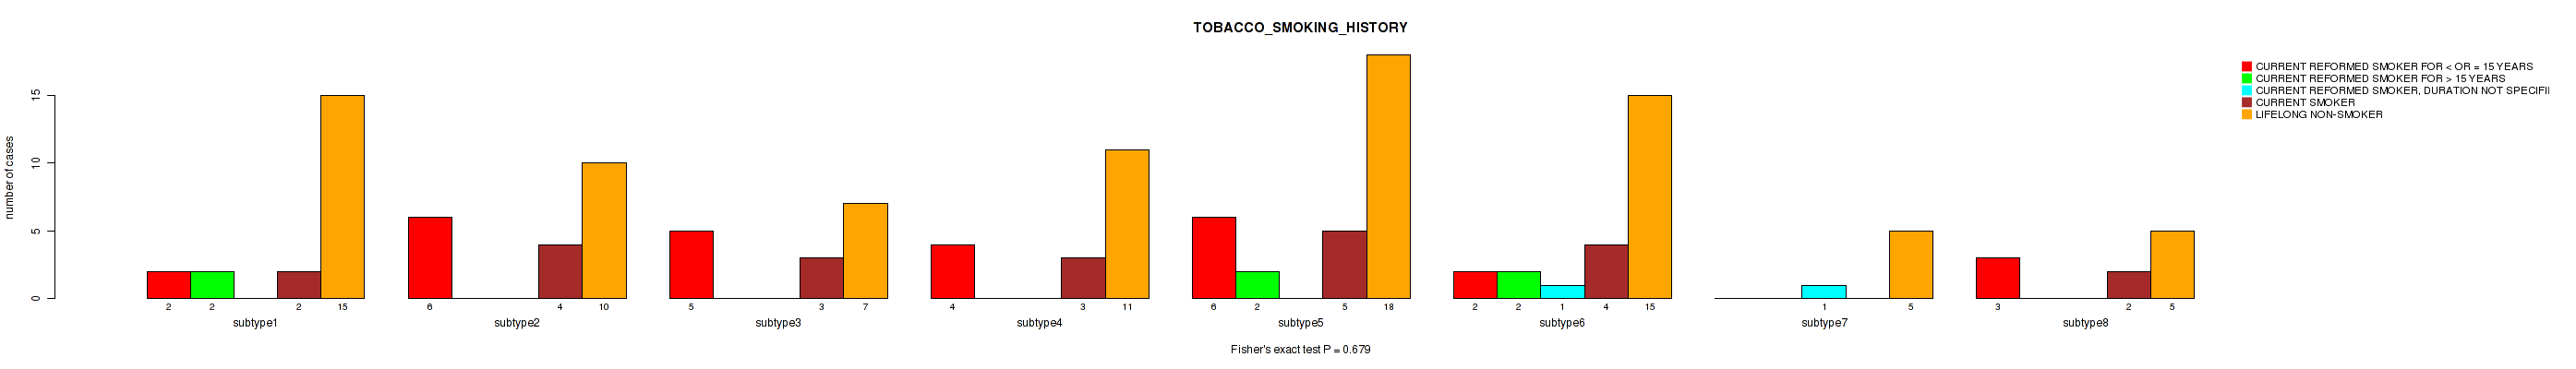
P value = 0.679 (Fisher's exact test), Q value = 0.84
Table S98. Clustering Approach #3: 'RPPA CNMF subtypes' versus Clinical Feature #17: 'TOBACCO_SMOKING_HISTORY'
| nPatients | CURRENT REFORMED SMOKER FOR < OR = 15 YEARS | CURRENT REFORMED SMOKER FOR > 15 YEARS | CURRENT REFORMED SMOKER, DURATION NOT SPECIFIED | CURRENT SMOKER | LIFELONG NON-SMOKER |
|---|---|---|---|---|---|
| ALL | 28 | 6 | 2 | 23 | 86 |
| subtype1 | 2 | 2 | 0 | 2 | 15 |
| subtype2 | 6 | 0 | 0 | 4 | 10 |
| subtype3 | 5 | 0 | 0 | 3 | 7 |
| subtype4 | 4 | 0 | 0 | 3 | 11 |
| subtype5 | 6 | 2 | 0 | 5 | 18 |
| subtype6 | 2 | 2 | 1 | 4 | 15 |
| subtype7 | 0 | 0 | 1 | 0 | 5 |
| subtype8 | 3 | 0 | 0 | 2 | 5 |
Figure S95. Get High-res Image Clustering Approach #3: 'RPPA CNMF subtypes' versus Clinical Feature #17: 'TOBACCO_SMOKING_HISTORY'
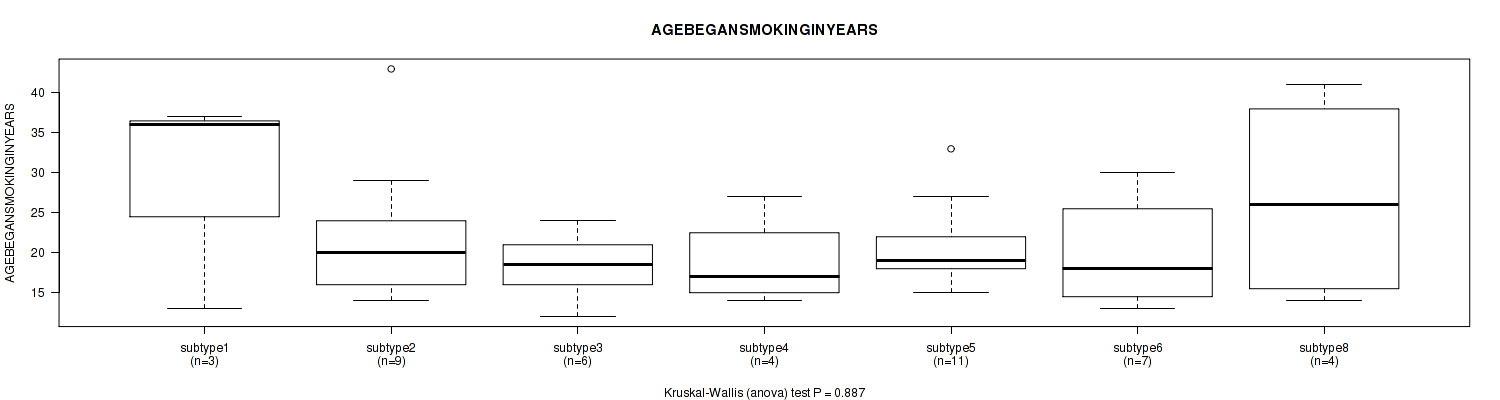
P value = 0.887 (Kruskal-Wallis (anova)), Q value = 0.96
Table S99. Clustering Approach #3: 'RPPA CNMF subtypes' versus Clinical Feature #18: 'AGEBEGANSMOKINGINYEARS'
| nPatients | Mean (Std.Dev) | |
|---|---|---|
| ALL | 44 | 21.5 (7.9) |
| subtype1 | 3 | 28.7 (13.6) |
| subtype2 | 9 | 22.1 (9.1) |
| subtype3 | 6 | 18.3 (4.4) |
| subtype4 | 4 | 18.8 (5.7) |
| subtype5 | 11 | 20.8 (5.2) |
| subtype6 | 7 | 20.1 (6.8) |
| subtype8 | 4 | 26.8 (13.3) |
Figure S96. Get High-res Image Clustering Approach #3: 'RPPA CNMF subtypes' versus Clinical Feature #18: 'AGEBEGANSMOKINGINYEARS'
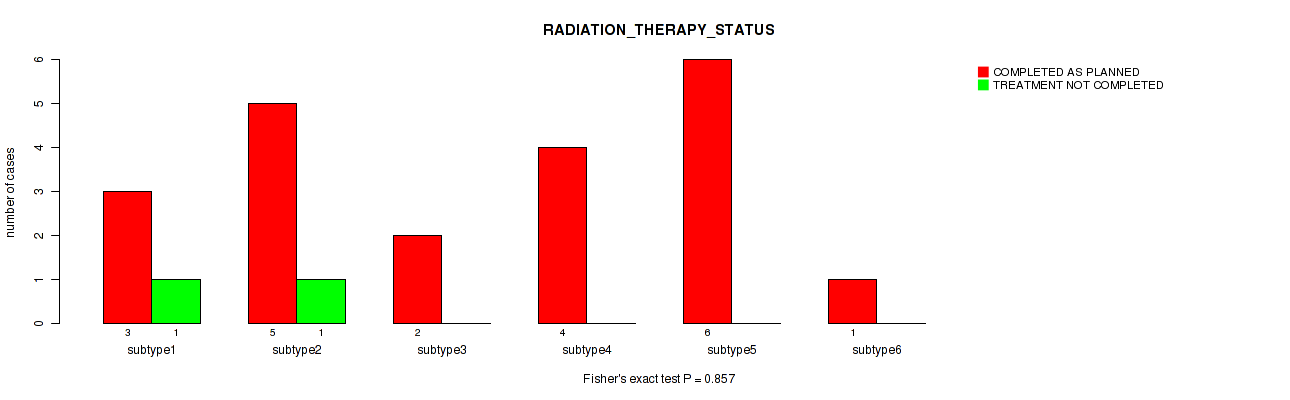
P value = 0.857 (Fisher's exact test), Q value = 0.94
Table S100. Clustering Approach #3: 'RPPA CNMF subtypes' versus Clinical Feature #19: 'RADIATION_THERAPY_STATUS'
| nPatients | COMPLETED AS PLANNED | TREATMENT NOT COMPLETED |
|---|---|---|
| ALL | 21 | 2 |
| subtype1 | 3 | 1 |
| subtype2 | 5 | 1 |
| subtype3 | 2 | 0 |
| subtype4 | 4 | 0 |
| subtype5 | 6 | 0 |
| subtype6 | 1 | 0 |
| subtype7 | 0 | 0 |
| subtype8 | 0 | 0 |
Figure S97. Get High-res Image Clustering Approach #3: 'RPPA CNMF subtypes' versus Clinical Feature #19: 'RADIATION_THERAPY_STATUS'
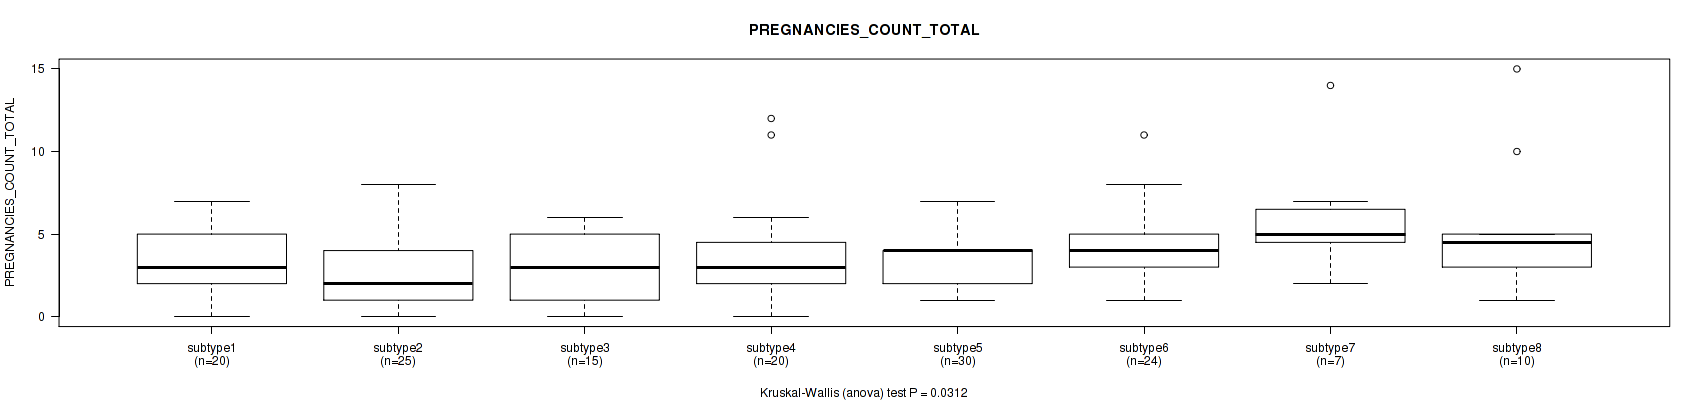
P value = 0.0312 (Kruskal-Wallis (anova)), Q value = 0.21
Table S101. Clustering Approach #3: 'RPPA CNMF subtypes' versus Clinical Feature #20: 'PREGNANCIES_COUNT_TOTAL'
| nPatients | Mean (Std.Dev) | |
|---|---|---|
| ALL | 151 | 3.6 (2.6) |
| subtype1 | 20 | 3.3 (1.9) |
| subtype2 | 25 | 2.6 (2.1) |
| subtype3 | 15 | 2.9 (2.1) |
| subtype4 | 20 | 3.6 (3.1) |
| subtype5 | 30 | 3.6 (1.8) |
| subtype6 | 24 | 4.1 (2.3) |
| subtype7 | 7 | 6.1 (3.8) |
| subtype8 | 10 | 5.3 (4.2) |
Figure S98. Get High-res Image Clustering Approach #3: 'RPPA CNMF subtypes' versus Clinical Feature #20: 'PREGNANCIES_COUNT_TOTAL'
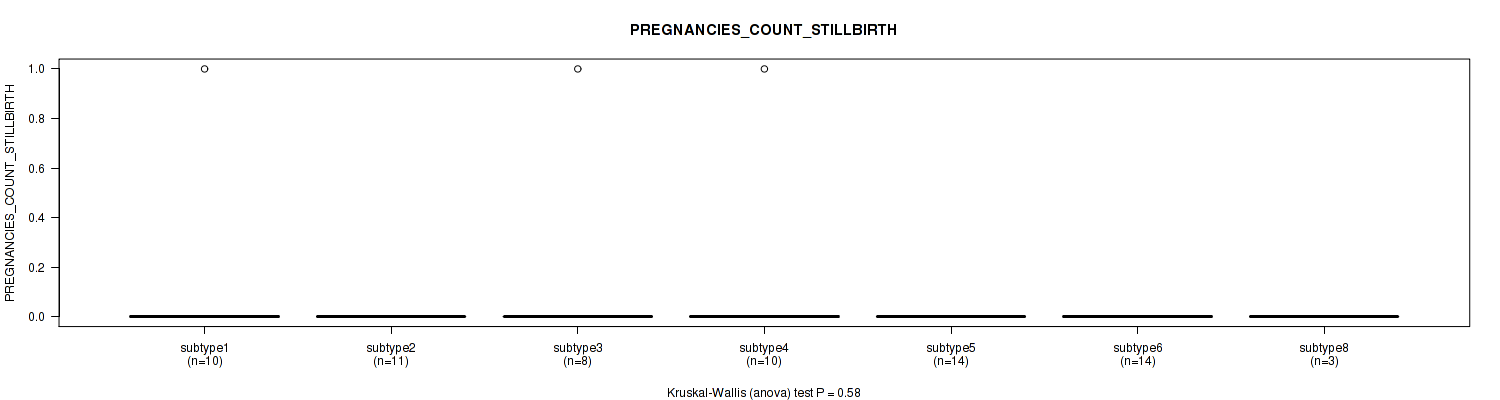
P value = 0.58 (Kruskal-Wallis (anova)), Q value = 0.79
Table S102. Clustering Approach #3: 'RPPA CNMF subtypes' versus Clinical Feature #21: 'PREGNANCIES_COUNT_STILLBIRTH'
| nPatients | Mean (Std.Dev) | |
|---|---|---|
| ALL | 72 | 0.0 (0.2) |
| subtype1 | 10 | 0.1 (0.3) |
| subtype2 | 11 | 0.0 (0.0) |
| subtype3 | 8 | 0.1 (0.4) |
| subtype4 | 10 | 0.1 (0.3) |
| subtype5 | 14 | 0.0 (0.0) |
| subtype6 | 14 | 0.0 (0.0) |
| subtype7 | 2 | 0.0 (0.0) |
| subtype8 | 3 | 0.0 (0.0) |
Figure S99. Get High-res Image Clustering Approach #3: 'RPPA CNMF subtypes' versus Clinical Feature #21: 'PREGNANCIES_COUNT_STILLBIRTH'
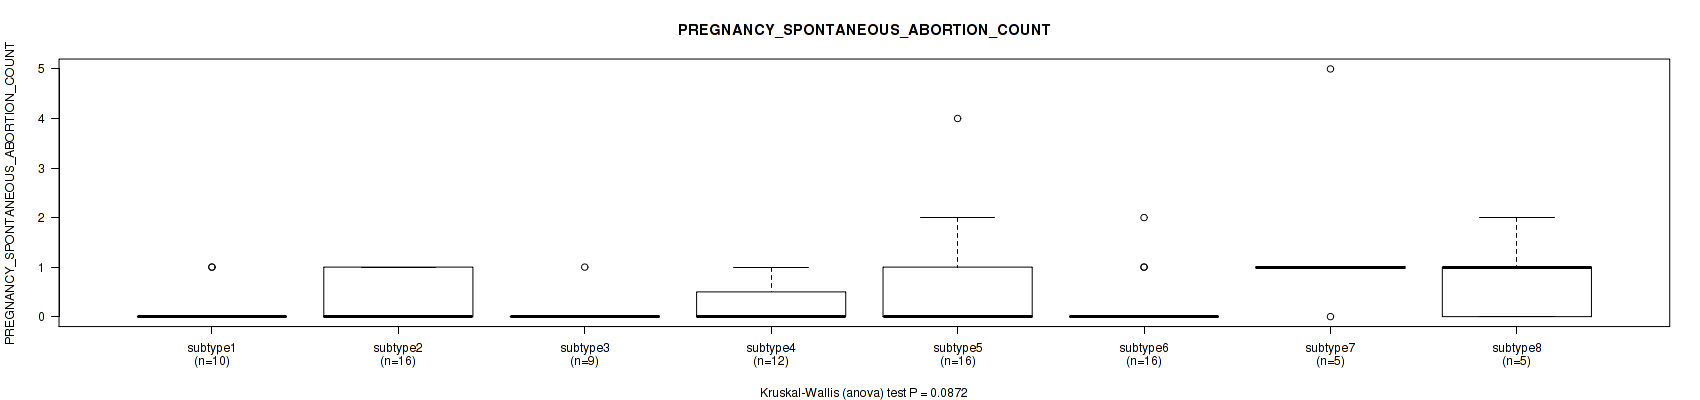
P value = 0.0872 (Kruskal-Wallis (anova)), Q value = 0.39
Table S103. Clustering Approach #3: 'RPPA CNMF subtypes' versus Clinical Feature #22: 'PREGNANCY_SPONTANEOUS_ABORTION_COUNT'
| nPatients | Mean (Std.Dev) | |
|---|---|---|
| ALL | 89 | 0.4 (0.8) |
| subtype1 | 10 | 0.2 (0.4) |
| subtype2 | 16 | 0.4 (0.5) |
| subtype3 | 9 | 0.1 (0.3) |
| subtype4 | 12 | 0.2 (0.5) |
| subtype5 | 16 | 0.6 (1.1) |
| subtype6 | 16 | 0.2 (0.6) |
| subtype7 | 5 | 1.6 (1.9) |
| subtype8 | 5 | 0.8 (0.8) |
Figure S100. Get High-res Image Clustering Approach #3: 'RPPA CNMF subtypes' versus Clinical Feature #22: 'PREGNANCY_SPONTANEOUS_ABORTION_COUNT'
P value = 0.0127 (Kruskal-Wallis (anova)), Q value = 0.15
Table S104. Clustering Approach #3: 'RPPA CNMF subtypes' versus Clinical Feature #23: 'PREGNANCIES_COUNT_LIVE_BIRTH'
| nPatients | Mean (Std.Dev) | |
|---|---|---|
| ALL | 151 | 2.6 (1.9) |
| subtype1 | 21 | 2.2 (1.8) |
| subtype2 | 24 | 2.0 (1.9) |
| subtype3 | 16 | 2.1 (1.7) |
| subtype4 | 19 | 2.8 (2.3) |
| subtype5 | 28 | 2.4 (1.4) |
| subtype6 | 26 | 3.2 (1.6) |
| subtype7 | 7 | 4.4 (2.4) |
| subtype8 | 10 | 3.3 (2.5) |
Figure S101. Get High-res Image Clustering Approach #3: 'RPPA CNMF subtypes' versus Clinical Feature #23: 'PREGNANCIES_COUNT_LIVE_BIRTH'
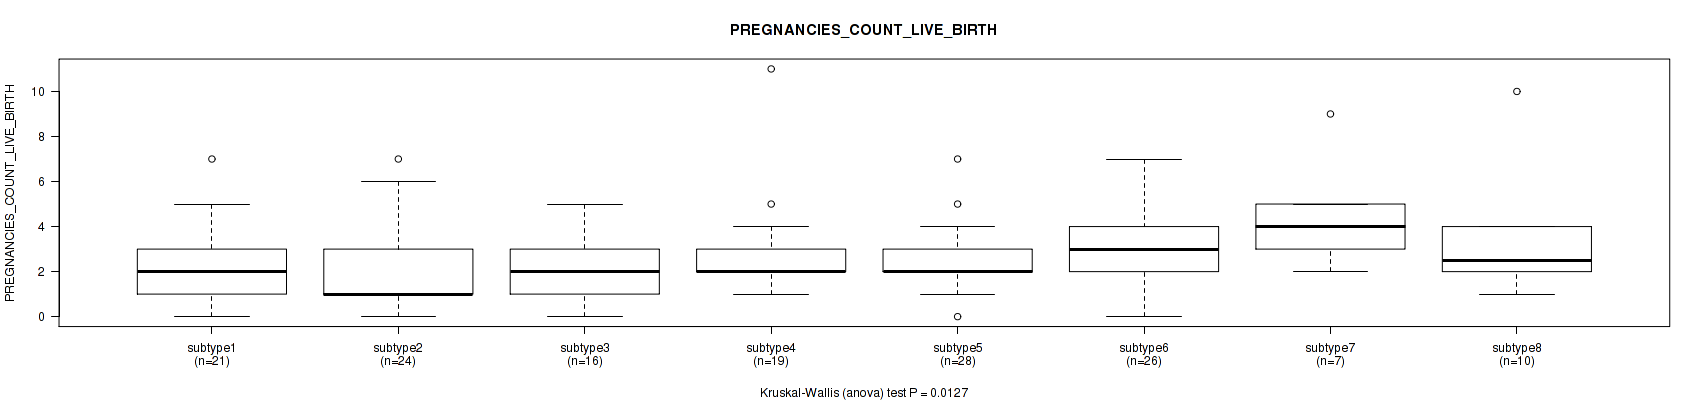
P value = 0.152 (Kruskal-Wallis (anova)), Q value = 0.48
Table S105. Clustering Approach #3: 'RPPA CNMF subtypes' versus Clinical Feature #24: 'PREGNANCY_THERAPEUTIC_ABORTION_COUNT'
| nPatients | Mean (Std.Dev) | |
|---|---|---|
| ALL | 81 | 1.1 (2.2) |
| subtype1 | 12 | 1.5 (1.4) |
| subtype2 | 11 | 0.3 (0.6) |
| subtype3 | 8 | 0.8 (1.4) |
| subtype4 | 10 | 1.0 (3.2) |
| subtype5 | 17 | 1.0 (1.2) |
| subtype6 | 15 | 1.1 (1.9) |
| subtype7 | 3 | 1.3 (1.5) |
| subtype8 | 5 | 3.2 (5.6) |
Figure S102. Get High-res Image Clustering Approach #3: 'RPPA CNMF subtypes' versus Clinical Feature #24: 'PREGNANCY_THERAPEUTIC_ABORTION_COUNT'
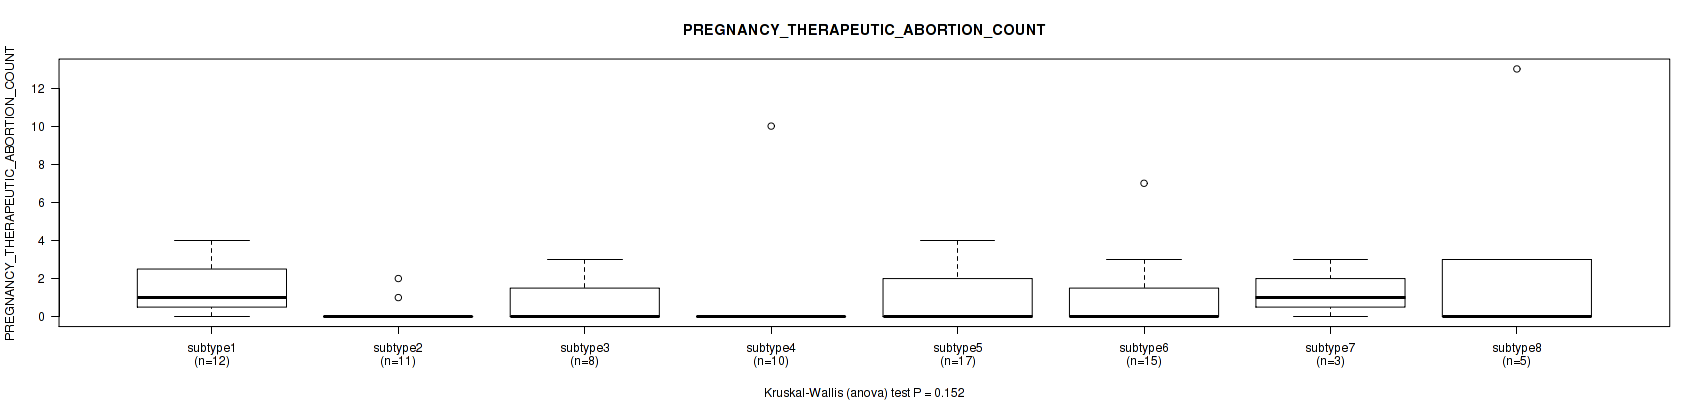
P value = 0.568 (Kruskal-Wallis (anova)), Q value = 0.78
Table S106. Clustering Approach #3: 'RPPA CNMF subtypes' versus Clinical Feature #25: 'PREGNANCIES_COUNT_ECTOPIC'
| nPatients | Mean (Std.Dev) | |
|---|---|---|
| ALL | 74 | 0.1 (0.4) |
| subtype1 | 11 | 0.2 (0.4) |
| subtype2 | 11 | 0.1 (0.3) |
| subtype3 | 8 | 0.0 (0.0) |
| subtype4 | 11 | 0.3 (0.6) |
| subtype5 | 14 | 0.1 (0.4) |
| subtype6 | 14 | 0.0 (0.0) |
| subtype7 | 2 | 0.0 (0.0) |
| subtype8 | 3 | 0.0 (0.0) |
Figure S103. Get High-res Image Clustering Approach #3: 'RPPA CNMF subtypes' versus Clinical Feature #25: 'PREGNANCIES_COUNT_ECTOPIC'
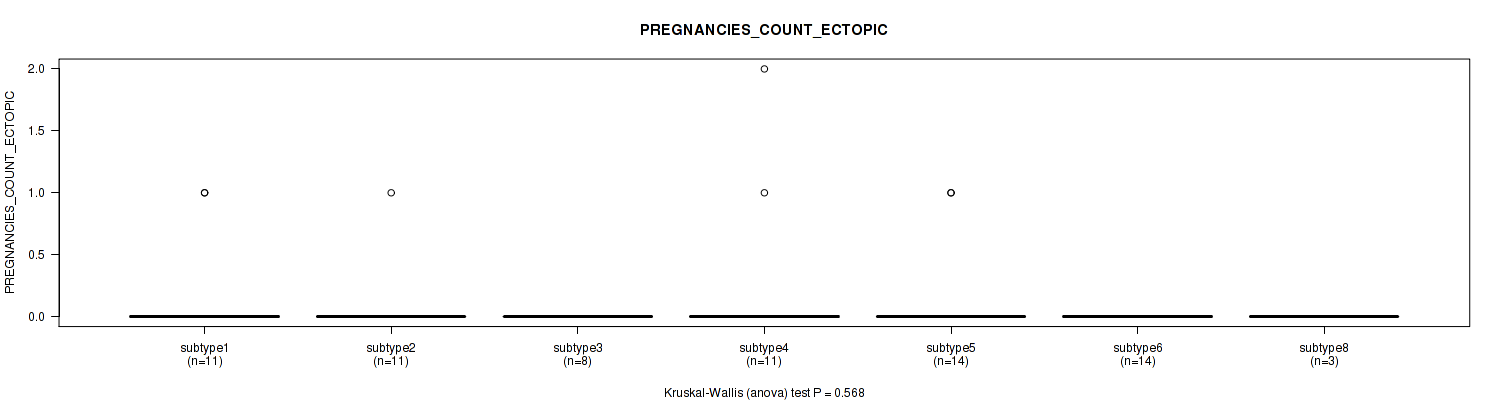
P value = 0.42 (Fisher's exact test), Q value = 0.73
Table S107. Clustering Approach #3: 'RPPA CNMF subtypes' versus Clinical Feature #26: 'POS_LYMPH_NODE_LOCATION'
| nPatients | MACROSCOPIC PARAMETRIAL INVOLVEMENT | MICROSCOPIC PARAMETRIAL INVOLVEMENT | OTHER LOCATION, SPECIFY | POSITIVE BLADDER MARGIN | POSITIVE VAGINAL MARGIN |
|---|---|---|---|---|---|
| ALL | 3 | 7 | 25 | 1 | 5 |
| subtype1 | 2 | 1 | 2 | 0 | 0 |
| subtype2 | 0 | 3 | 5 | 1 | 1 |
| subtype3 | 0 | 0 | 2 | 0 | 1 |
| subtype4 | 0 | 0 | 5 | 0 | 0 |
| subtype5 | 0 | 3 | 5 | 0 | 2 |
| subtype6 | 1 | 0 | 5 | 0 | 1 |
| subtype7 | 0 | 0 | 1 | 0 | 0 |
| subtype8 | 0 | 0 | 0 | 0 | 0 |
Figure S104. Get High-res Image Clustering Approach #3: 'RPPA CNMF subtypes' versus Clinical Feature #26: 'POS_LYMPH_NODE_LOCATION'
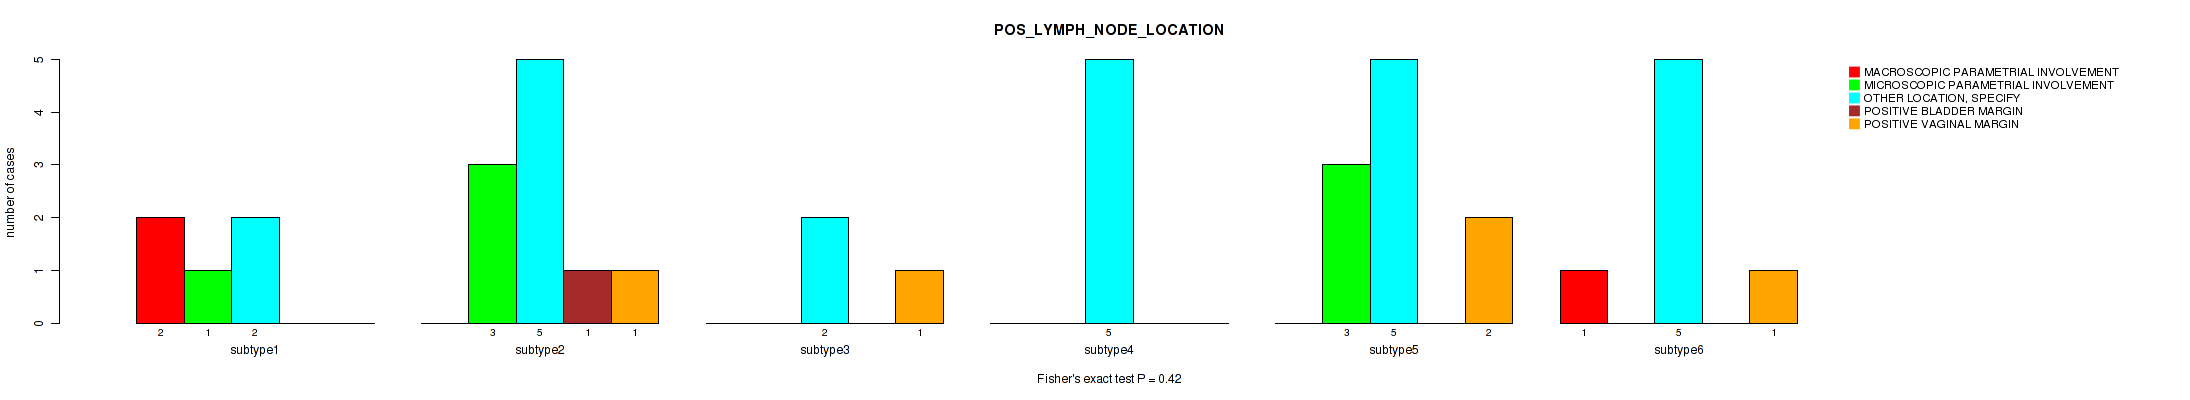
P value = 0.541 (Fisher's exact test), Q value = 0.77
Table S108. Clustering Approach #3: 'RPPA CNMF subtypes' versus Clinical Feature #27: 'MENOPAUSE_STATUS'
| nPatients | INDETERMINATE (NEITHER PRE OR POSTMENOPAUSAL) | PERI (6-12 MONTHS SINCE LAST MENSTRUAL PERIOD) | POST (PRIOR BILATERAL OVARIECTOMY OR >12 MO SINCE LMP WITH NO PRIOR HYSTERECTOMY) | PRE (<6 MONTHS SINCE LMP AND NO PRIOR BILATERAL OVARIECTOMY AND NOT ON ESTROGEN REPLACEMENT) |
|---|---|---|---|---|
| ALL | 2 | 13 | 46 | 79 |
| subtype1 | 0 | 2 | 8 | 14 |
| subtype2 | 0 | 2 | 4 | 13 |
| subtype3 | 0 | 0 | 2 | 13 |
| subtype4 | 0 | 1 | 7 | 10 |
| subtype5 | 1 | 5 | 9 | 14 |
| subtype6 | 1 | 2 | 10 | 9 |
| subtype7 | 0 | 1 | 2 | 2 |
| subtype8 | 0 | 0 | 4 | 4 |
Figure S105. Get High-res Image Clustering Approach #3: 'RPPA CNMF subtypes' versus Clinical Feature #27: 'MENOPAUSE_STATUS'
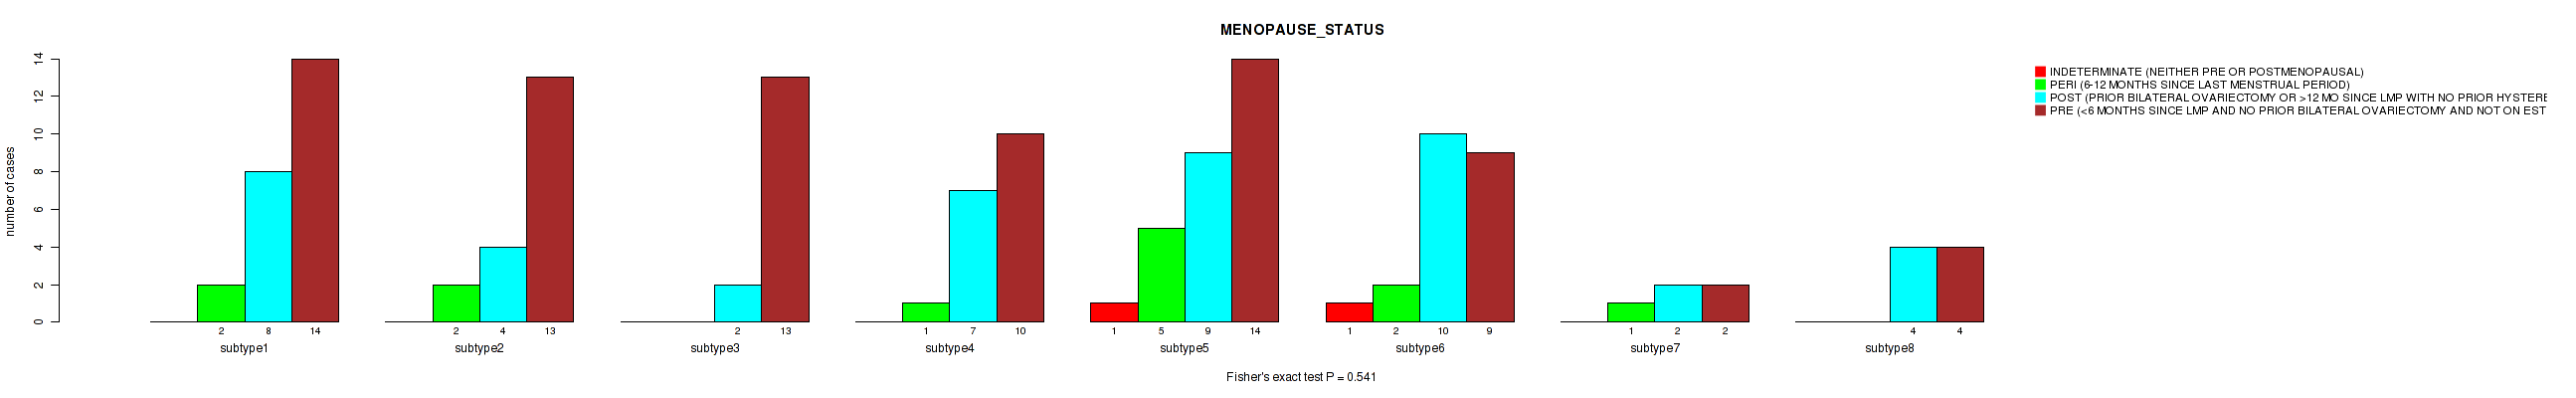
P value = 0.0813 (Fisher's exact test), Q value = 0.37
Table S109. Clustering Approach #3: 'RPPA CNMF subtypes' versus Clinical Feature #28: 'LYMPHOVASCULAR_INVOLVEMENT'
| nPatients | ABSENT | PRESENT |
|---|---|---|
| ALL | 52 | 60 |
| subtype1 | 9 | 7 |
| subtype2 | 5 | 11 |
| subtype3 | 7 | 5 |
| subtype4 | 6 | 8 |
| subtype5 | 7 | 19 |
| subtype6 | 9 | 7 |
| subtype7 | 1 | 1 |
| subtype8 | 8 | 2 |
Figure S106. Get High-res Image Clustering Approach #3: 'RPPA CNMF subtypes' versus Clinical Feature #28: 'LYMPHOVASCULAR_INVOLVEMENT'
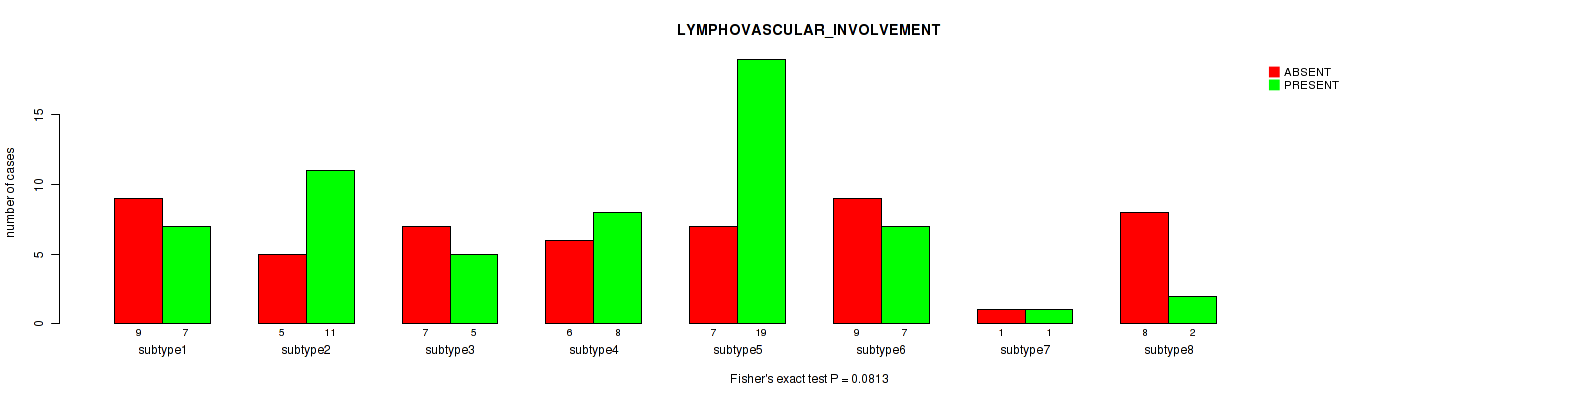
P value = 0.52 (Kruskal-Wallis (anova)), Q value = 0.76
Table S110. Clustering Approach #3: 'RPPA CNMF subtypes' versus Clinical Feature #29: 'LYMPH_NODES_EXAMINED_HE_COUNT'
| nPatients | Mean (Std.Dev) | |
|---|---|---|
| ALL | 105 | 1.1 (2.7) |
| subtype1 | 13 | 0.8 (1.5) |
| subtype2 | 16 | 2.6 (5.1) |
| subtype3 | 11 | 1.6 (3.6) |
| subtype4 | 16 | 1.0 (1.5) |
| subtype5 | 25 | 0.7 (1.1) |
| subtype6 | 14 | 1.1 (2.3) |
| subtype7 | 3 | 0.0 (0.0) |
| subtype8 | 7 | 0.0 (0.0) |
Figure S107. Get High-res Image Clustering Approach #3: 'RPPA CNMF subtypes' versus Clinical Feature #29: 'LYMPH_NODES_EXAMINED_HE_COUNT'
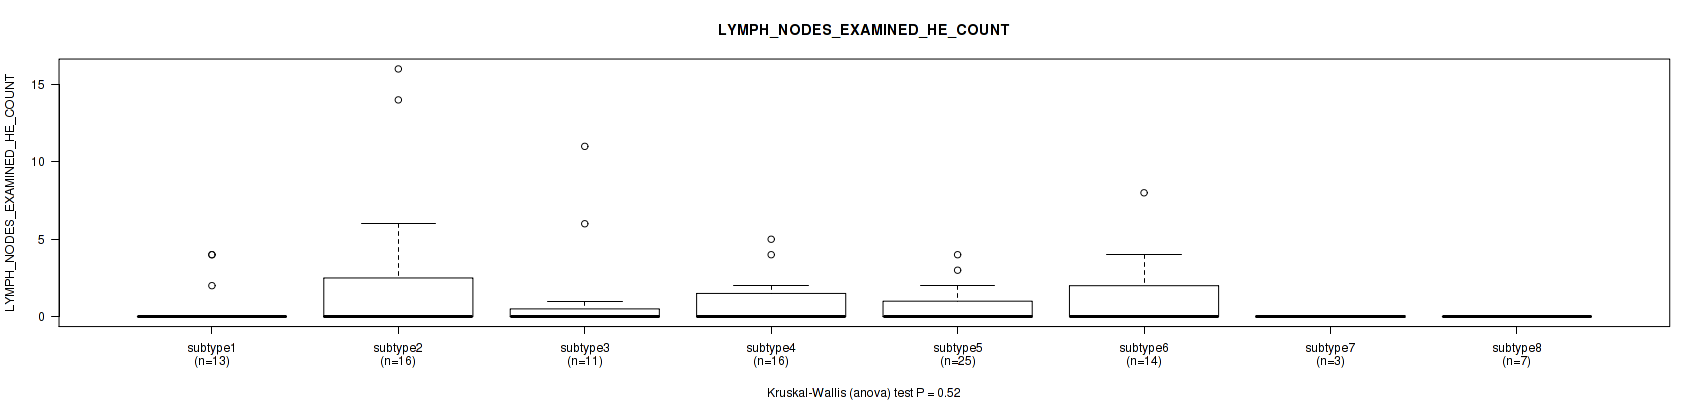
P value = 0.0598 (Kruskal-Wallis (anova)), Q value = 0.31
Table S111. Clustering Approach #3: 'RPPA CNMF subtypes' versus Clinical Feature #30: 'LYMPH_NODES_EXAMINED'
| nPatients | Mean (Std.Dev) | |
|---|---|---|
| ALL | 122 | 20.8 (11.9) |
| subtype1 | 17 | 18.6 (8.5) |
| subtype2 | 20 | 23.9 (11.2) |
| subtype3 | 13 | 25.1 (14.2) |
| subtype4 | 19 | 24.1 (13.4) |
| subtype5 | 26 | 21.0 (12.6) |
| subtype6 | 15 | 15.6 (9.4) |
| subtype7 | 3 | 9.3 (8.1) |
| subtype8 | 9 | 16.3 (9.6) |
Figure S108. Get High-res Image Clustering Approach #3: 'RPPA CNMF subtypes' versus Clinical Feature #30: 'LYMPH_NODES_EXAMINED'
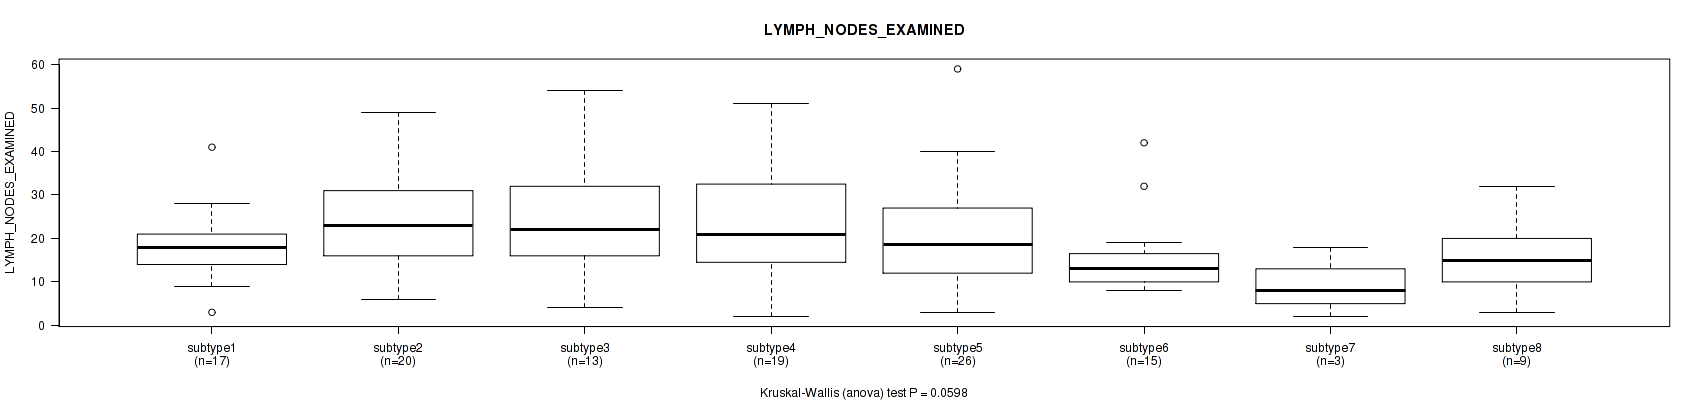
P value = 0.896 (Fisher's exact test), Q value = 0.96
Table S112. Clustering Approach #3: 'RPPA CNMF subtypes' versus Clinical Feature #31: 'KERATINIZATION_SQUAMOUS_CELL'
| nPatients | KERATINIZING SQUAMOUS CELL CARCINOMA | NON-KERATINIZING SQUAMOUS CELL CARCINOMA |
|---|---|---|
| ALL | 39 | 76 |
| subtype1 | 9 | 14 |
| subtype2 | 7 | 11 |
| subtype3 | 3 | 7 |
| subtype4 | 4 | 9 |
| subtype5 | 5 | 11 |
| subtype6 | 9 | 14 |
| subtype7 | 1 | 2 |
| subtype8 | 1 | 8 |
Figure S109. Get High-res Image Clustering Approach #3: 'RPPA CNMF subtypes' versus Clinical Feature #31: 'KERATINIZATION_SQUAMOUS_CELL'
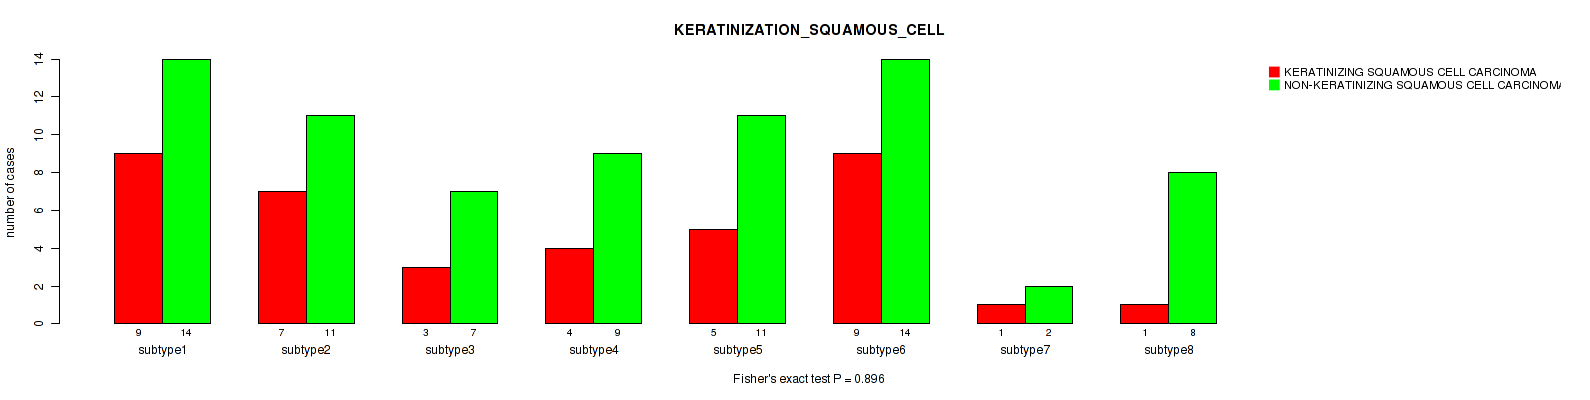
P value = 0.879 (Kruskal-Wallis (anova)), Q value = 0.96
Table S113. Clustering Approach #3: 'RPPA CNMF subtypes' versus Clinical Feature #32: 'INITIAL_PATHOLOGIC_DX_YEAR'
| nPatients | Mean (Std.Dev) | |
|---|---|---|
| ALL | 171 | 2008.3 (5.0) |
| subtype1 | 26 | 2009.3 (4.4) |
| subtype2 | 26 | 2007.6 (5.4) |
| subtype3 | 19 | 2007.2 (6.0) |
| subtype4 | 21 | 2007.3 (5.6) |
| subtype5 | 33 | 2008.6 (4.5) |
| subtype6 | 26 | 2008.4 (5.1) |
| subtype7 | 7 | 2008.4 (5.0) |
| subtype8 | 13 | 2009.2 (3.8) |
Figure S110. Get High-res Image Clustering Approach #3: 'RPPA CNMF subtypes' versus Clinical Feature #32: 'INITIAL_PATHOLOGIC_DX_YEAR'
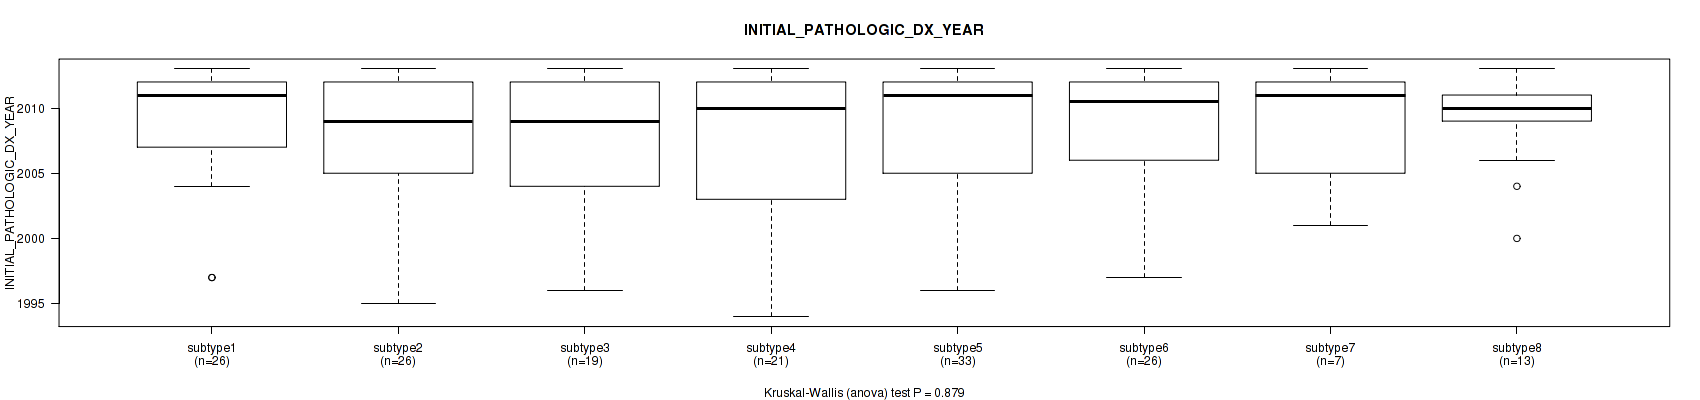
P value = 0.804 (Fisher's exact test), Q value = 0.92
Table S114. Clustering Approach #3: 'RPPA CNMF subtypes' versus Clinical Feature #33: 'HISTORY_HORMONAL_CONTRACEPTIVES_USE'
| nPatients | CURRENT USER | FORMER USER | NEVER USED |
|---|---|---|---|
| ALL | 5 | 32 | 51 |
| subtype1 | 0 | 4 | 7 |
| subtype2 | 1 | 7 | 8 |
| subtype3 | 2 | 3 | 3 |
| subtype4 | 1 | 4 | 8 |
| subtype5 | 1 | 9 | 10 |
| subtype6 | 0 | 4 | 9 |
| subtype7 | 0 | 0 | 3 |
| subtype8 | 0 | 1 | 3 |
Figure S111. Get High-res Image Clustering Approach #3: 'RPPA CNMF subtypes' versus Clinical Feature #33: 'HISTORY_HORMONAL_CONTRACEPTIVES_USE'
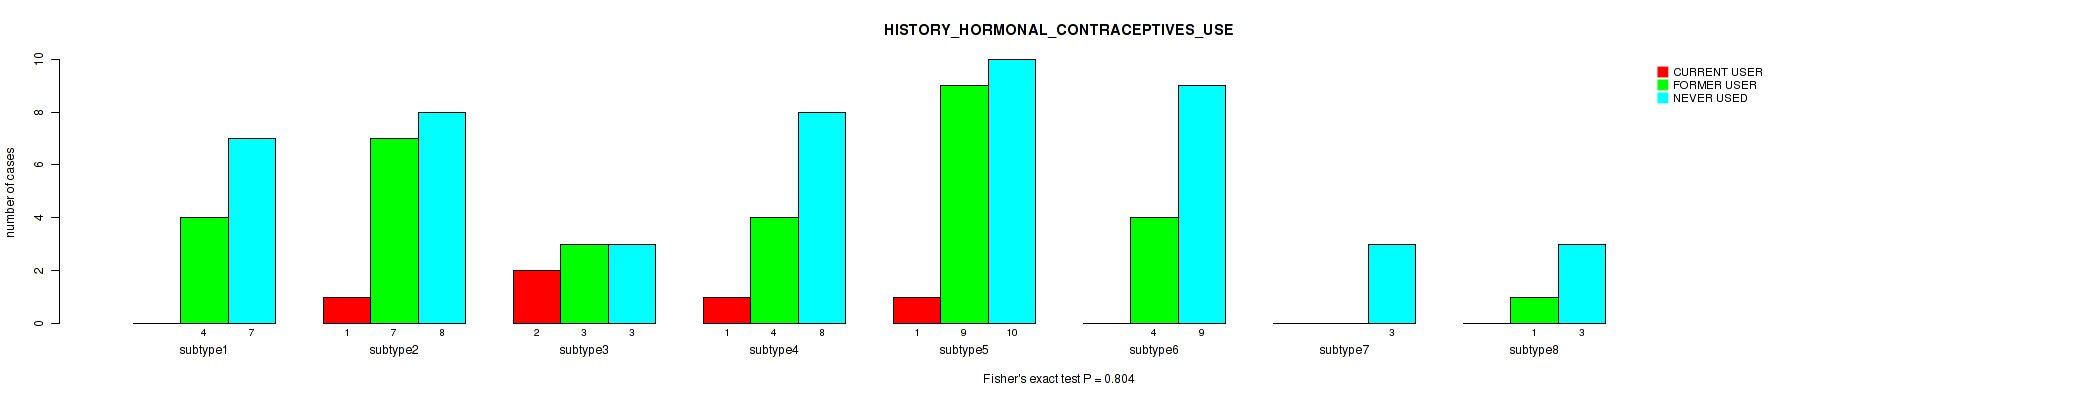
P value = 0.879 (Kruskal-Wallis (anova)), Q value = 0.96
Table S115. Clustering Approach #3: 'RPPA CNMF subtypes' versus Clinical Feature #34: 'HEIGHT_CM_AT_DIAGNOSIS'
| nPatients | Mean (Std.Dev) | |
|---|---|---|
| ALL | 153 | 161.7 (7.1) |
| subtype1 | 21 | 162.5 (6.4) |
| subtype2 | 25 | 162.0 (6.2) |
| subtype3 | 16 | 164.1 (6.4) |
| subtype4 | 20 | 161.3 (7.0) |
| subtype5 | 28 | 161.0 (7.5) |
| subtype6 | 26 | 161.1 (8.5) |
| subtype7 | 6 | 161.7 (5.5) |
| subtype8 | 11 | 159.6 (8.8) |
Figure S112. Get High-res Image Clustering Approach #3: 'RPPA CNMF subtypes' versus Clinical Feature #34: 'HEIGHT_CM_AT_DIAGNOSIS'
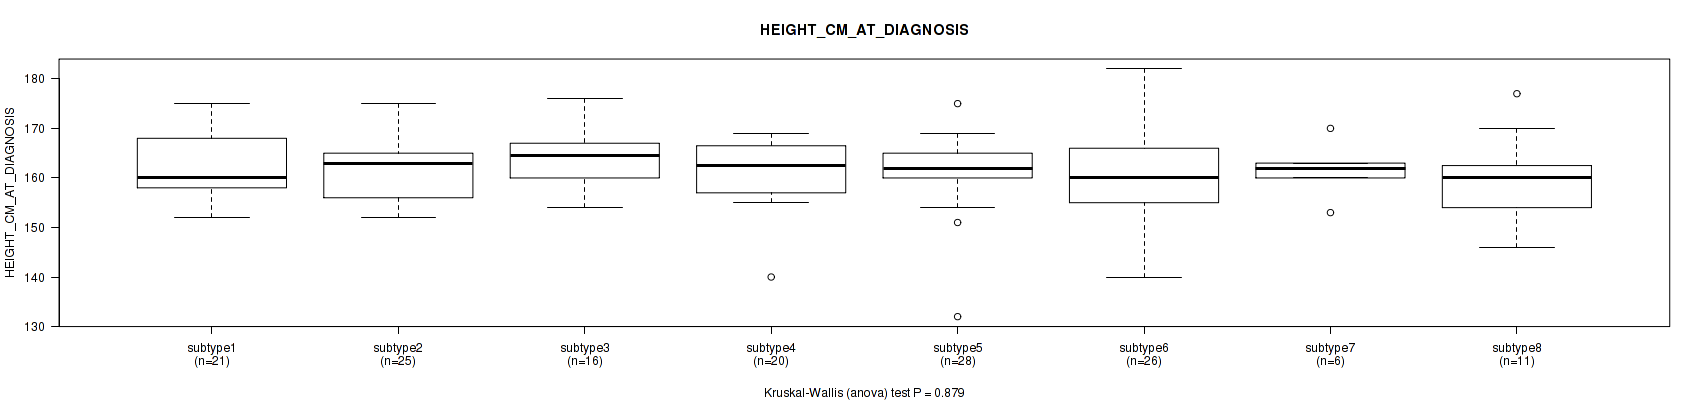
P value = 0.985 (Fisher's exact test), Q value = 1
Table S116. Clustering Approach #3: 'RPPA CNMF subtypes' versus Clinical Feature #35: 'CORPUS_INVOLVEMENT'
| nPatients | ABSENT | PRESENT |
|---|---|---|
| ALL | 84 | 12 |
| subtype1 | 11 | 1 |
| subtype2 | 10 | 1 |
| subtype3 | 10 | 1 |
| subtype4 | 11 | 2 |
| subtype5 | 20 | 3 |
| subtype6 | 13 | 2 |
| subtype7 | 2 | 0 |
| subtype8 | 7 | 2 |
Figure S113. Get High-res Image Clustering Approach #3: 'RPPA CNMF subtypes' versus Clinical Feature #35: 'CORPUS_INVOLVEMENT'
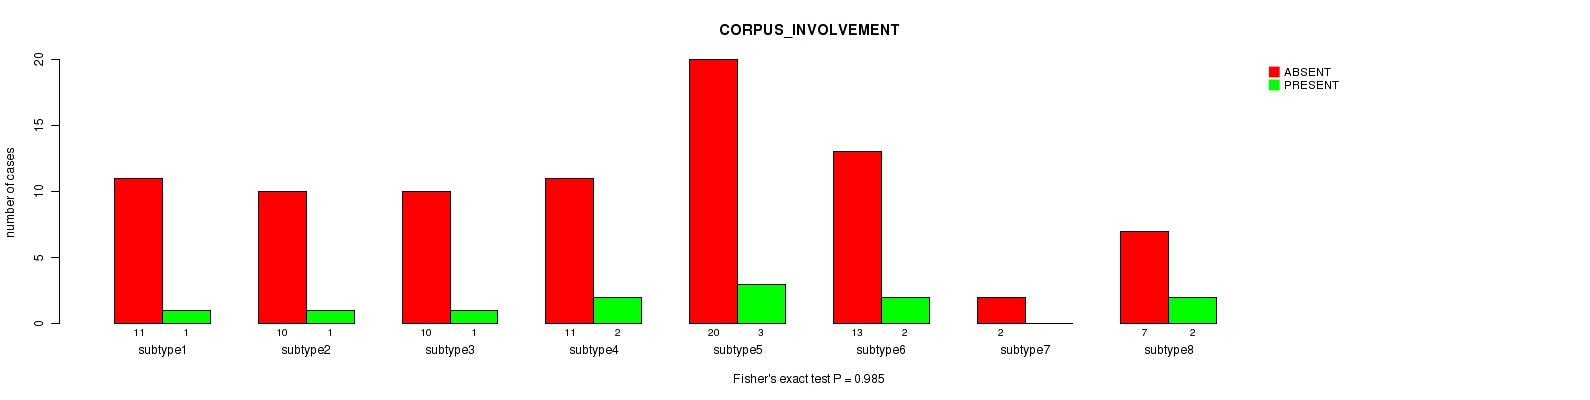
P value = 0.82 (Fisher's exact test), Q value = 0.93
Table S117. Clustering Approach #3: 'RPPA CNMF subtypes' versus Clinical Feature #36: 'CHEMO_CONCURRENT_TYPE'
| nPatients | CARBOPLATIN | CISPLATIN | OTHER |
|---|---|---|---|
| ALL | 3 | 48 | 1 |
| subtype1 | 0 | 9 | 1 |
| subtype2 | 1 | 8 | 0 |
| subtype3 | 0 | 3 | 0 |
| subtype4 | 0 | 10 | 0 |
| subtype5 | 1 | 8 | 0 |
| subtype6 | 1 | 6 | 0 |
| subtype7 | 0 | 3 | 0 |
| subtype8 | 0 | 1 | 0 |
Figure S114. Get High-res Image Clustering Approach #3: 'RPPA CNMF subtypes' versus Clinical Feature #36: 'CHEMO_CONCURRENT_TYPE'
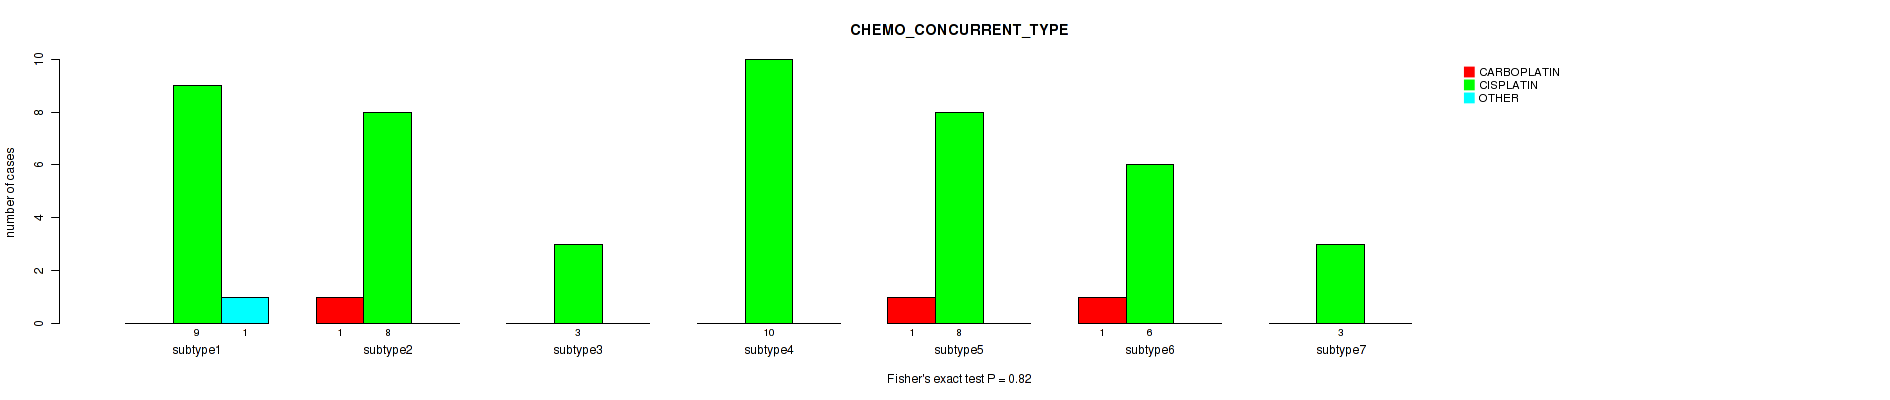
P value = 0.0592 (Kruskal-Wallis (anova)), Q value = 0.31
Table S118. Clustering Approach #3: 'RPPA CNMF subtypes' versus Clinical Feature #38: 'AGE_AT_DIAGNOSIS'
| nPatients | Mean (Std.Dev) | |
|---|---|---|
| ALL | 173 | 47.7 (13.5) |
| subtype1 | 26 | 49.3 (15.5) |
| subtype2 | 26 | 44.9 (12.3) |
| subtype3 | 20 | 39.0 (9.5) |
| subtype4 | 21 | 47.4 (9.4) |
| subtype5 | 33 | 50.2 (12.1) |
| subtype6 | 27 | 50.5 (15.2) |
| subtype7 | 7 | 51.0 (20.3) |
| subtype8 | 13 | 50.1 (14.8) |
Figure S115. Get High-res Image Clustering Approach #3: 'RPPA CNMF subtypes' versus Clinical Feature #38: 'AGE_AT_DIAGNOSIS'
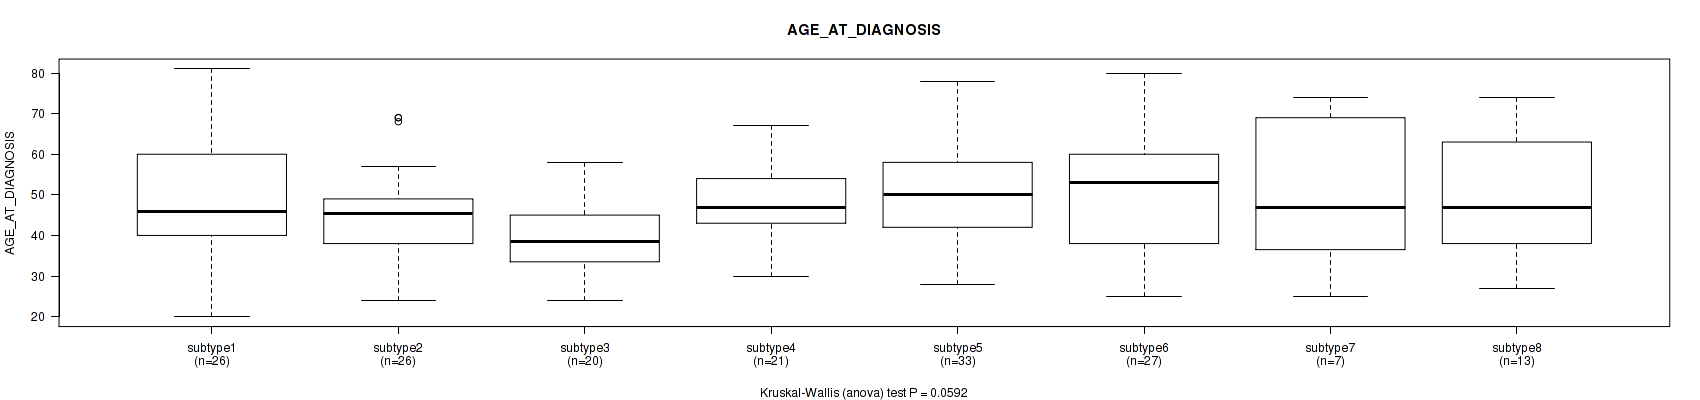
P value = 0.507 (Fisher's exact test), Q value = 0.75
Table S119. Clustering Approach #3: 'RPPA CNMF subtypes' versus Clinical Feature #39: 'CLINICAL_STAGE'
| nPatients | STAGE I | STAGE IA | STAGE IA1 | STAGE IA2 | STAGE IB | STAGE IB1 | STAGE IB2 | STAGE II | STAGE IIA | STAGE IIA1 | STAGE IIA2 | STAGE IIB | STAGE III | STAGE IIIA | STAGE IIIB | STAGE IVA | STAGE IVB |
|---|---|---|---|---|---|---|---|---|---|---|---|---|---|---|---|---|---|
| ALL | 4 | 1 | 1 | 1 | 27 | 48 | 28 | 4 | 5 | 4 | 4 | 16 | 1 | 1 | 19 | 4 | 2 |
| subtype1 | 2 | 1 | 1 | 0 | 3 | 5 | 8 | 0 | 0 | 0 | 0 | 2 | 0 | 0 | 3 | 0 | 1 |
| subtype2 | 0 | 0 | 0 | 0 | 5 | 5 | 6 | 0 | 0 | 1 | 2 | 3 | 0 | 0 | 2 | 1 | 0 |
| subtype3 | 0 | 0 | 0 | 0 | 3 | 7 | 3 | 0 | 1 | 0 | 0 | 3 | 0 | 0 | 2 | 0 | 0 |
| subtype4 | 0 | 0 | 0 | 1 | 5 | 9 | 0 | 2 | 0 | 0 | 0 | 3 | 0 | 0 | 1 | 0 | 0 |
| subtype5 | 1 | 0 | 0 | 0 | 4 | 10 | 6 | 0 | 1 | 1 | 1 | 1 | 0 | 0 | 5 | 1 | 1 |
| subtype6 | 0 | 0 | 0 | 0 | 3 | 7 | 3 | 1 | 1 | 2 | 0 | 3 | 1 | 0 | 5 | 1 | 0 |
| subtype7 | 0 | 0 | 0 | 0 | 3 | 1 | 0 | 0 | 1 | 0 | 0 | 0 | 0 | 1 | 0 | 1 | 0 |
| subtype8 | 1 | 0 | 0 | 0 | 1 | 4 | 2 | 1 | 1 | 0 | 1 | 1 | 0 | 0 | 1 | 0 | 0 |
Figure S116. Get High-res Image Clustering Approach #3: 'RPPA CNMF subtypes' versus Clinical Feature #39: 'CLINICAL_STAGE'

Table S120. Description of clustering approach #4: 'RPPA cHierClus subtypes'
| Cluster Labels | 1 | 2 | 3 | 4 | 5 |
|---|---|---|---|---|---|
| Number of samples | 32 | 49 | 51 | 23 | 18 |
P value = 0.35 (logrank test), Q value = 0.67
Table S121. Clustering Approach #4: 'RPPA cHierClus subtypes' versus Clinical Feature #1: 'Time to Death'
| nPatients | nDeath | Duration Range (Median), Month | |
|---|---|---|---|
| ALL | 161 | 30 | 0.0 - 210.7 (23.8) |
| subtype1 | 30 | 6 | 0.4 - 144.2 (18.6) |
| subtype2 | 46 | 7 | 0.1 - 210.7 (22.8) |
| subtype3 | 48 | 8 | 0.3 - 209.6 (26.7) |
| subtype4 | 20 | 6 | 0.0 - 78.7 (25.3) |
| subtype5 | 17 | 3 | 0.1 - 147.4 (24.8) |
Figure S117. Get High-res Image Clustering Approach #4: 'RPPA cHierClus subtypes' versus Clinical Feature #1: 'Time to Death'
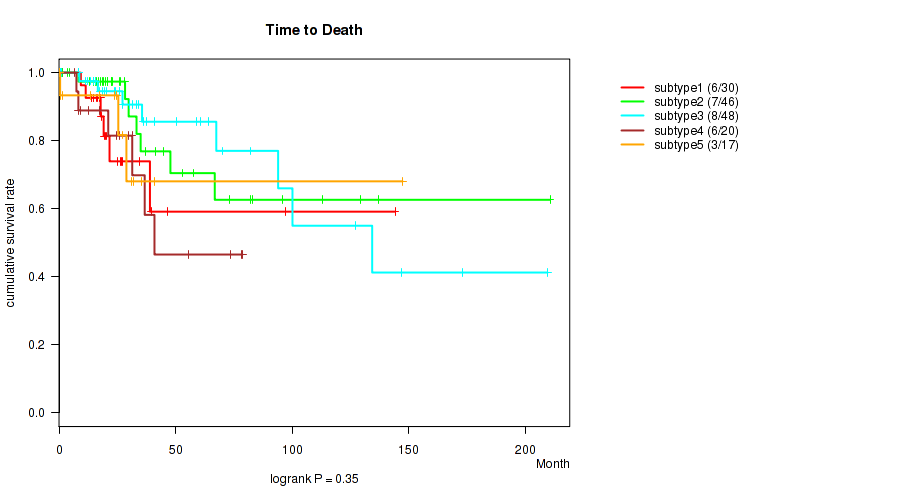
P value = 0.0879 (Kruskal-Wallis (anova)), Q value = 0.39
Table S122. Clustering Approach #4: 'RPPA cHierClus subtypes' versus Clinical Feature #2: 'YEARS_TO_BIRTH'
| nPatients | Mean (Std.Dev) | |
|---|---|---|
| ALL | 171 | 47.5 (13.5) |
| subtype1 | 31 | 44.2 (14.4) |
| subtype2 | 48 | 47.5 (13.5) |
| subtype3 | 51 | 48.9 (13.4) |
| subtype4 | 23 | 44.2 (12.3) |
| subtype5 | 18 | 53.8 (12.1) |
Figure S118. Get High-res Image Clustering Approach #4: 'RPPA cHierClus subtypes' versus Clinical Feature #2: 'YEARS_TO_BIRTH'
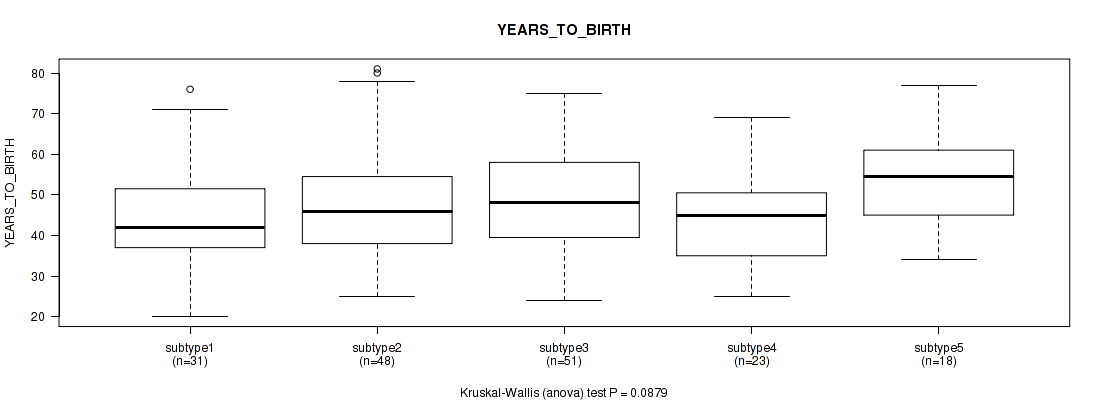
P value = 0.649 (Fisher's exact test), Q value = 0.83
Table S123. Clustering Approach #4: 'RPPA cHierClus subtypes' versus Clinical Feature #3: 'PATHOLOGY_T_STAGE'
| nPatients | T1 | T2 | T3 | T4 |
|---|---|---|---|---|
| ALL | 99 | 32 | 7 | 3 |
| subtype1 | 19 | 4 | 0 | 0 |
| subtype2 | 31 | 9 | 2 | 0 |
| subtype3 | 24 | 11 | 4 | 2 |
| subtype4 | 13 | 3 | 1 | 1 |
| subtype5 | 12 | 5 | 0 | 0 |
Figure S119. Get High-res Image Clustering Approach #4: 'RPPA cHierClus subtypes' versus Clinical Feature #3: 'PATHOLOGY_T_STAGE'
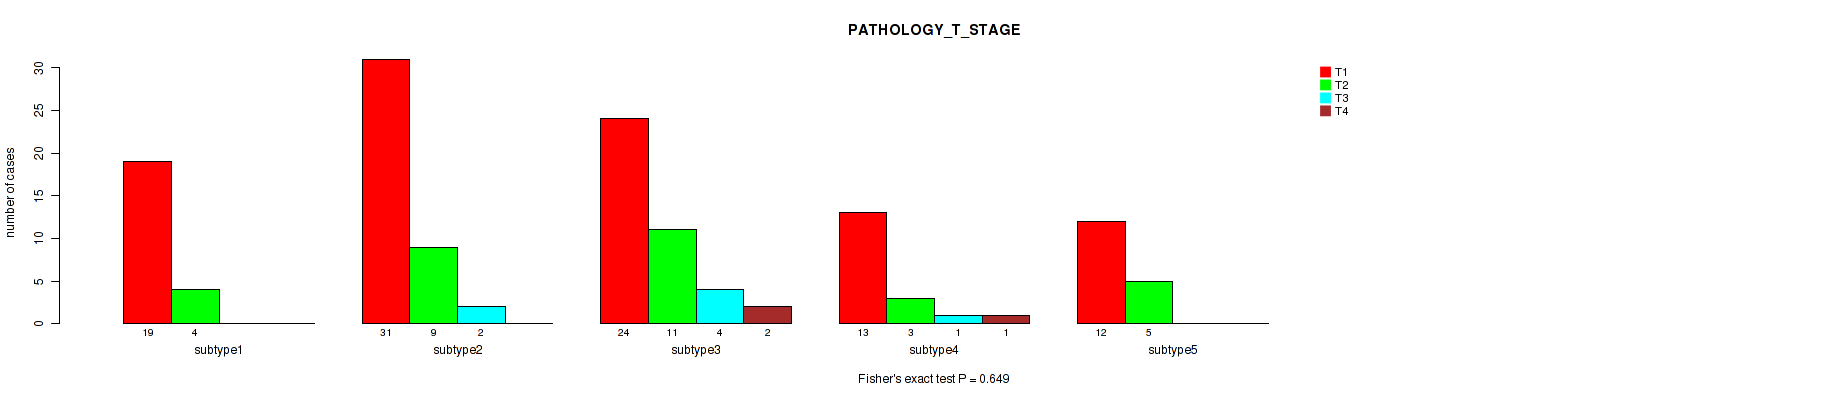
P value = 0.21 (Fisher's exact test), Q value = 0.53
Table S124. Clustering Approach #4: 'RPPA cHierClus subtypes' versus Clinical Feature #4: 'PATHOLOGY_N_STAGE'
| nPatients | 0 | 1 |
|---|---|---|
| ALL | 93 | 38 |
| subtype1 | 17 | 4 |
| subtype2 | 30 | 12 |
| subtype3 | 19 | 14 |
| subtype4 | 13 | 6 |
| subtype5 | 14 | 2 |
Figure S120. Get High-res Image Clustering Approach #4: 'RPPA cHierClus subtypes' versus Clinical Feature #4: 'PATHOLOGY_N_STAGE'
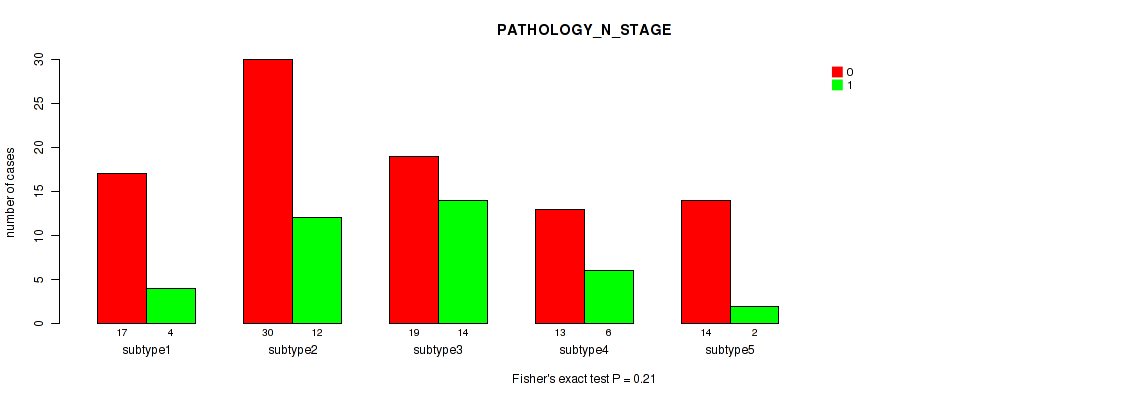
P value = 1 (Fisher's exact test), Q value = 1
Table S125. Clustering Approach #4: 'RPPA cHierClus subtypes' versus Clinical Feature #5: 'PATHOLOGY_M_STAGE'
| nPatients | 0 | 1 |
|---|---|---|
| ALL | 84 | 4 |
| subtype1 | 12 | 1 |
| subtype2 | 24 | 1 |
| subtype3 | 26 | 1 |
| subtype4 | 12 | 1 |
| subtype5 | 10 | 0 |
Figure S121. Get High-res Image Clustering Approach #4: 'RPPA cHierClus subtypes' versus Clinical Feature #5: 'PATHOLOGY_M_STAGE'
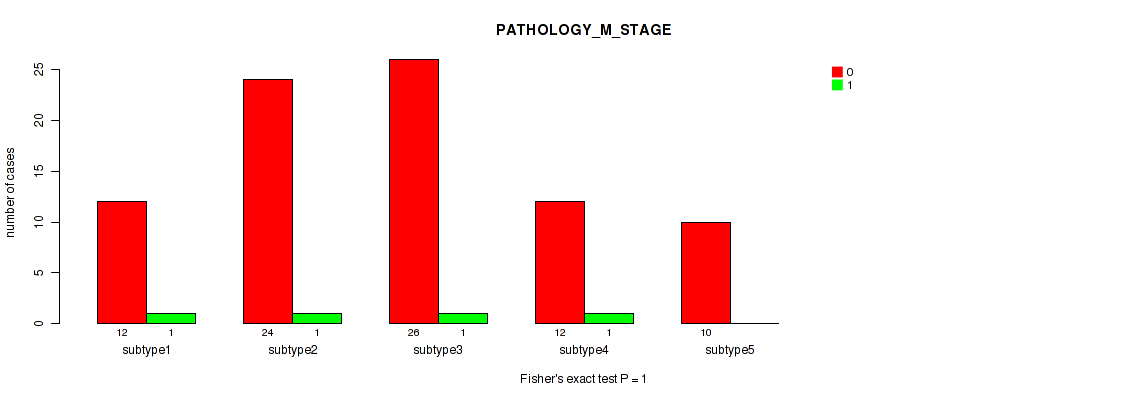
P value = 0.422 (Fisher's exact test), Q value = 0.73
Table S126. Clustering Approach #4: 'RPPA cHierClus subtypes' versus Clinical Feature #6: 'RADIATION_THERAPY'
| nPatients | NO | YES |
|---|---|---|
| ALL | 28 | 58 |
| subtype1 | 7 | 10 |
| subtype2 | 10 | 15 |
| subtype3 | 6 | 24 |
| subtype4 | 3 | 6 |
| subtype5 | 2 | 3 |
Figure S122. Get High-res Image Clustering Approach #4: 'RPPA cHierClus subtypes' versus Clinical Feature #6: 'RADIATION_THERAPY'
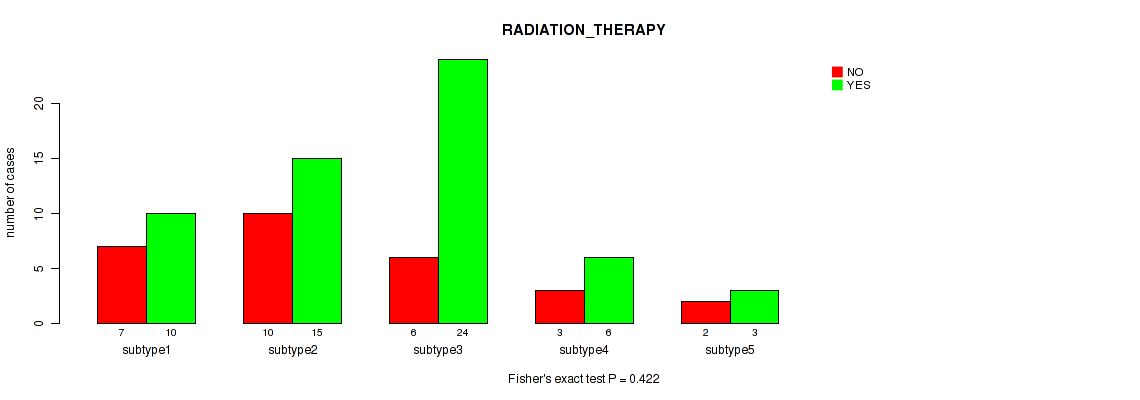
P value = 0.00417 (Fisher's exact test), Q value = 0.074
Table S127. Clustering Approach #4: 'RPPA cHierClus subtypes' versus Clinical Feature #7: 'HISTOLOGICAL_TYPE'
| nPatients | ADENOSQUAMOUS | CERVICAL SQUAMOUS CELL CARCINOMA | ENDOCERVICAL ADENOCARCINOMA OF THE USUAL TYPE | ENDOCERVICAL TYPE OF ADENOCARCINOMA | ENDOMETRIOID ADENOCARCINOMA OF ENDOCERVIX | MUCINOUS ADENOCARCINOMA OF ENDOCERVICAL TYPE |
|---|---|---|---|---|---|---|
| ALL | 4 | 144 | 3 | 16 | 2 | 4 |
| subtype1 | 2 | 26 | 1 | 2 | 0 | 1 |
| subtype2 | 2 | 35 | 1 | 8 | 2 | 1 |
| subtype3 | 0 | 49 | 0 | 1 | 0 | 1 |
| subtype4 | 0 | 23 | 0 | 0 | 0 | 0 |
| subtype5 | 0 | 11 | 1 | 5 | 0 | 1 |
Figure S123. Get High-res Image Clustering Approach #4: 'RPPA cHierClus subtypes' versus Clinical Feature #7: 'HISTOLOGICAL_TYPE'
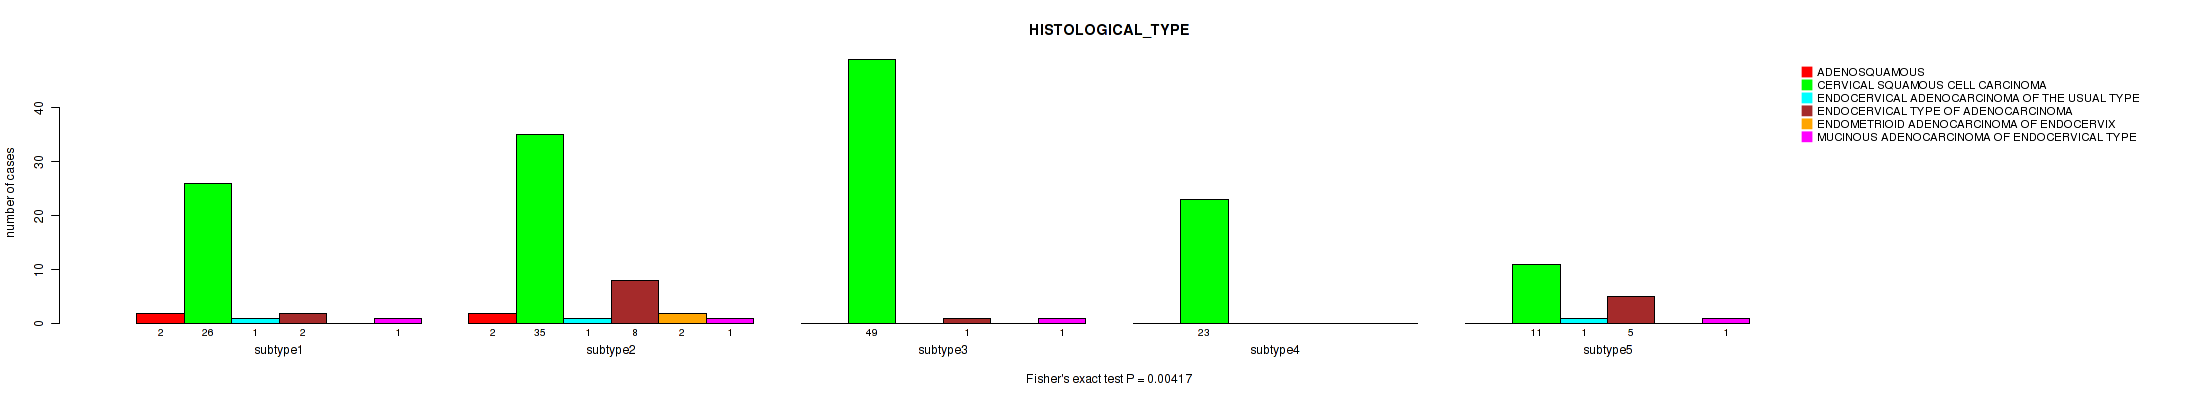
P value = 0.54 (Kruskal-Wallis (anova)), Q value = 0.77
Table S128. Clustering Approach #4: 'RPPA cHierClus subtypes' versus Clinical Feature #8: 'NUMBER_PACK_YEARS_SMOKED'
| nPatients | Mean (Std.Dev) | |
|---|---|---|
| ALL | 45 | 17.7 (13.7) |
| subtype1 | 8 | 10.9 (7.4) |
| subtype2 | 15 | 17.3 (10.7) |
| subtype3 | 14 | 20.8 (16.6) |
| subtype4 | 6 | 20.6 (20.0) |
| subtype5 | 2 | 18.0 (11.3) |
Figure S124. Get High-res Image Clustering Approach #4: 'RPPA cHierClus subtypes' versus Clinical Feature #8: 'NUMBER_PACK_YEARS_SMOKED'
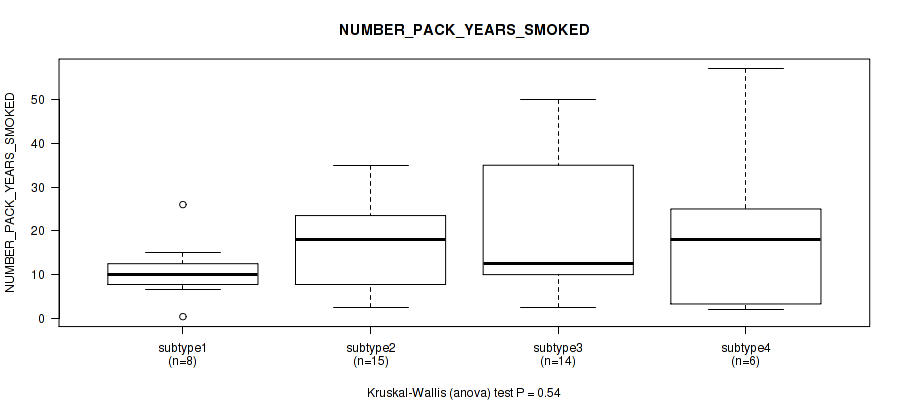
P value = 0.177 (Kruskal-Wallis (anova)), Q value = 0.51
Table S129. Clustering Approach #4: 'RPPA cHierClus subtypes' versus Clinical Feature #9: 'NUMBER_OF_LYMPH_NODES'
| nPatients | Mean (Std.Dev) | |
|---|---|---|
| ALL | 105 | 1.1 (2.7) |
| subtype1 | 16 | 1.3 (2.9) |
| subtype2 | 39 | 1.3 (3.5) |
| subtype3 | 25 | 1.2 (1.6) |
| subtype4 | 14 | 0.6 (1.6) |
| subtype5 | 11 | 0.7 (2.4) |
Figure S125. Get High-res Image Clustering Approach #4: 'RPPA cHierClus subtypes' versus Clinical Feature #9: 'NUMBER_OF_LYMPH_NODES'
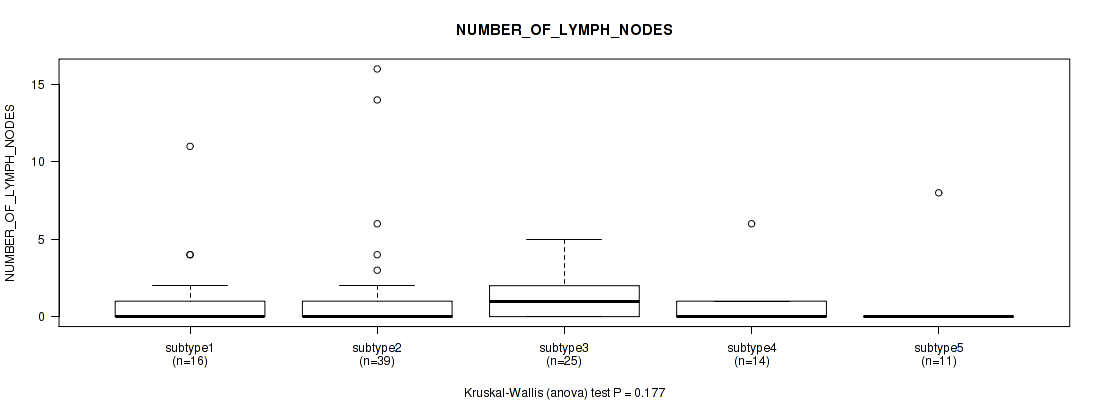
P value = 0.208 (Fisher's exact test), Q value = 0.53
Table S130. Clustering Approach #4: 'RPPA cHierClus subtypes' versus Clinical Feature #10: 'RACE'
| nPatients | AMERICAN INDIAN OR ALASKA NATIVE | ASIAN | BLACK OR AFRICAN AMERICAN | NATIVE HAWAIIAN OR OTHER PACIFIC ISLANDER | WHITE |
|---|---|---|---|---|---|
| ALL | 3 | 15 | 12 | 1 | 125 |
| subtype1 | 0 | 4 | 3 | 1 | 23 |
| subtype2 | 2 | 1 | 2 | 0 | 37 |
| subtype3 | 1 | 4 | 3 | 0 | 37 |
| subtype4 | 0 | 2 | 4 | 0 | 15 |
| subtype5 | 0 | 4 | 0 | 0 | 13 |
Figure S126. Get High-res Image Clustering Approach #4: 'RPPA cHierClus subtypes' versus Clinical Feature #10: 'RACE'
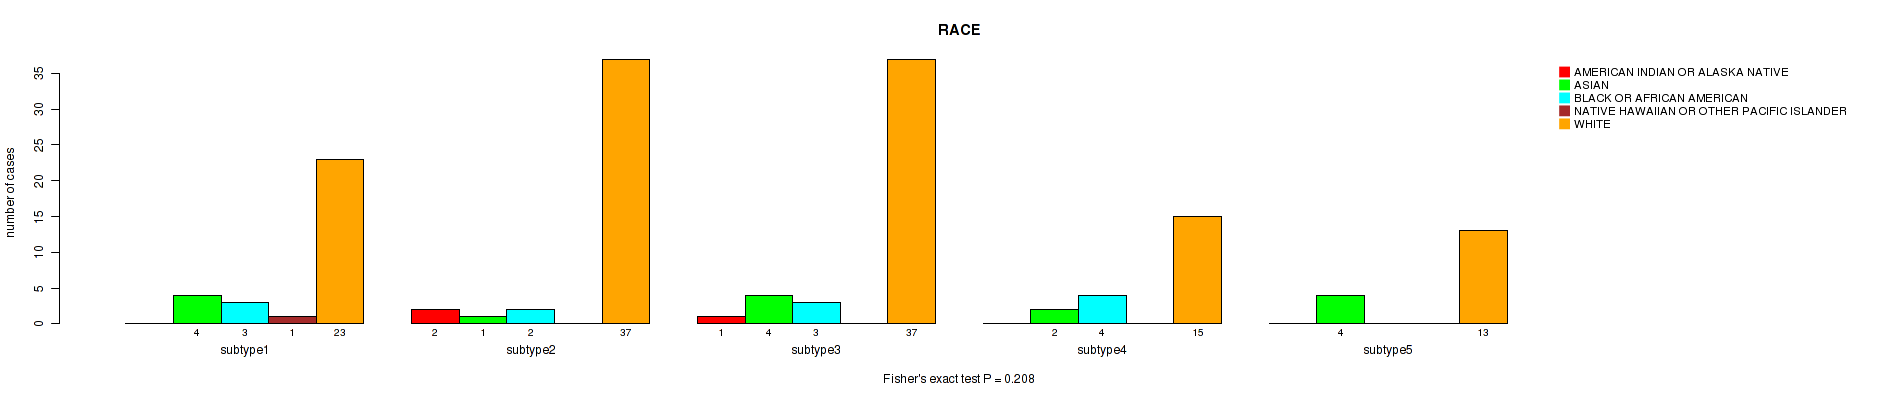
P value = 0.474 (Fisher's exact test), Q value = 0.74
Table S131. Clustering Approach #4: 'RPPA cHierClus subtypes' versus Clinical Feature #11: 'ETHNICITY'
| nPatients | HISPANIC OR LATINO | NOT HISPANIC OR LATINO |
|---|---|---|
| ALL | 13 | 113 |
| subtype1 | 1 | 28 |
| subtype2 | 3 | 29 |
| subtype3 | 6 | 29 |
| subtype4 | 1 | 14 |
| subtype5 | 2 | 13 |
Figure S127. Get High-res Image Clustering Approach #4: 'RPPA cHierClus subtypes' versus Clinical Feature #11: 'ETHNICITY'
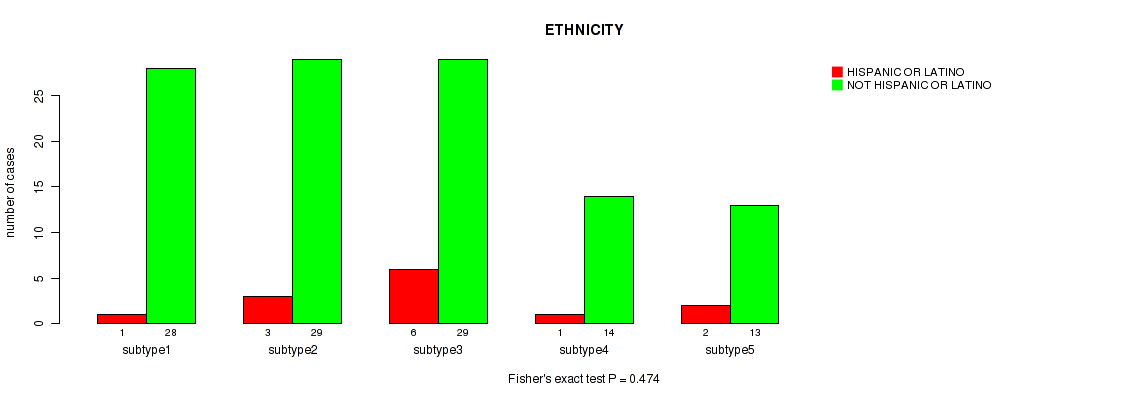
P value = 0.542 (Kruskal-Wallis (anova)), Q value = 0.77
Table S132. Clustering Approach #4: 'RPPA cHierClus subtypes' versus Clinical Feature #12: 'WEIGHT_KG_AT_DIAGNOSIS'
| nPatients | Mean (Std.Dev) | |
|---|---|---|
| ALL | 158 | 74.7 (23.1) |
| subtype1 | 27 | 68.4 (19.0) |
| subtype2 | 45 | 76.0 (20.0) |
| subtype3 | 48 | 76.6 (27.3) |
| subtype4 | 20 | 72.6 (12.8) |
| subtype5 | 18 | 77.8 (31.8) |
Figure S128. Get High-res Image Clustering Approach #4: 'RPPA cHierClus subtypes' versus Clinical Feature #12: 'WEIGHT_KG_AT_DIAGNOSIS'
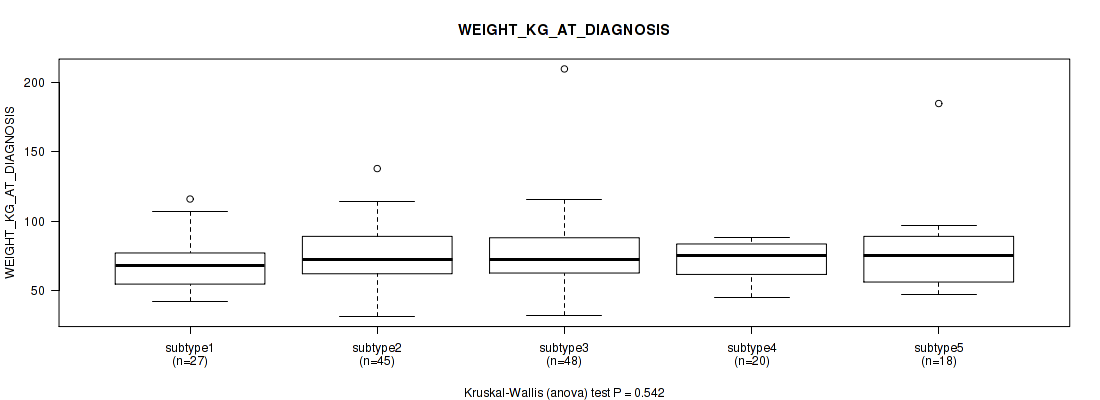
P value = 0.455 (Fisher's exact test), Q value = 0.74
Table S133. Clustering Approach #4: 'RPPA cHierClus subtypes' versus Clinical Feature #13: 'TUMOR_STATUS'
| nPatients | TUMOR FREE | WITH TUMOR |
|---|---|---|
| ALL | 111 | 35 |
| subtype1 | 23 | 6 |
| subtype2 | 33 | 8 |
| subtype3 | 34 | 9 |
| subtype4 | 12 | 7 |
| subtype5 | 9 | 5 |
Figure S129. Get High-res Image Clustering Approach #4: 'RPPA cHierClus subtypes' versus Clinical Feature #13: 'TUMOR_STATUS'
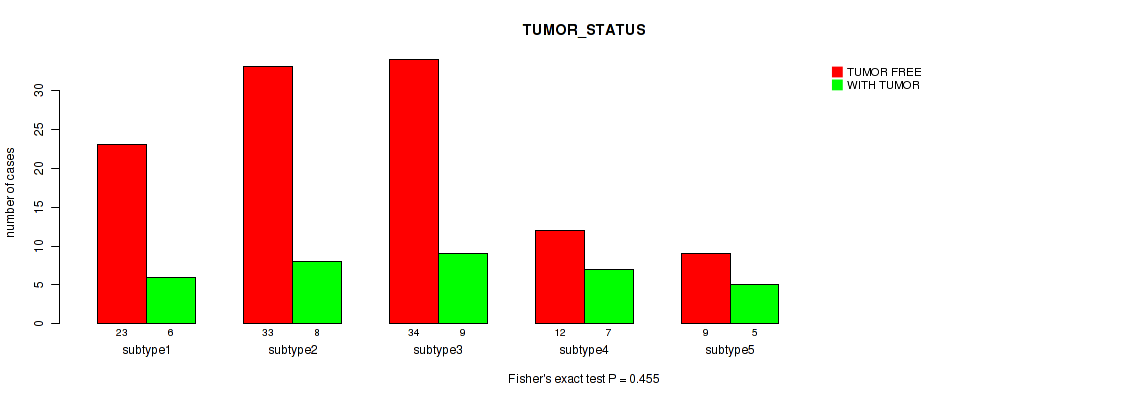
P value = 0.554 (Fisher's exact test), Q value = 0.77
Table S134. Clustering Approach #4: 'RPPA cHierClus subtypes' versus Clinical Feature #14: 'NEOPLASM_HISTOLOGIC_GRADE'
| nPatients | G1 | G2 | G3 | G4 | GX |
|---|---|---|---|---|---|
| ALL | 10 | 75 | 74 | 1 | 8 |
| subtype1 | 2 | 15 | 12 | 0 | 3 |
| subtype2 | 5 | 16 | 26 | 0 | 2 |
| subtype3 | 2 | 26 | 17 | 0 | 2 |
| subtype4 | 1 | 9 | 10 | 1 | 1 |
| subtype5 | 0 | 9 | 9 | 0 | 0 |
Figure S130. Get High-res Image Clustering Approach #4: 'RPPA cHierClus subtypes' versus Clinical Feature #14: 'NEOPLASM_HISTOLOGIC_GRADE'
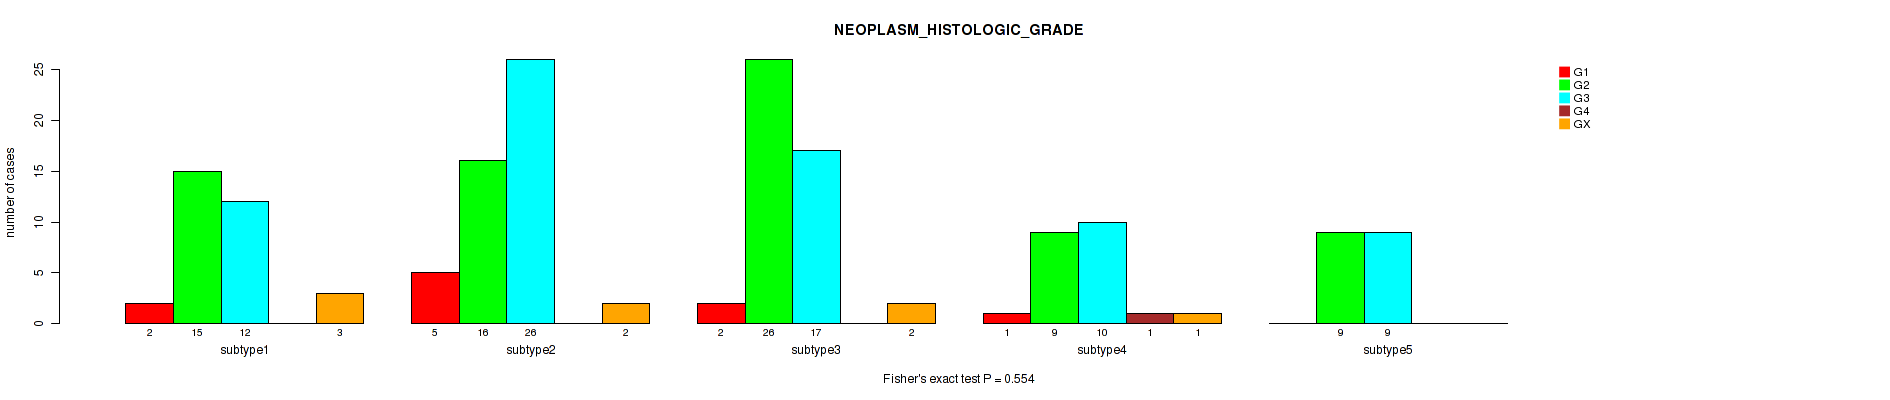
P value = 0.706 (Kruskal-Wallis (anova)), Q value = 0.85
Table S135. Clustering Approach #4: 'RPPA cHierClus subtypes' versus Clinical Feature #15: 'TOBACCO_SMOKING_YEAR_STOPPED'
| nPatients | Mean (Std.Dev) | |
|---|---|---|
| ALL | 31 | 2001.5 (10.7) |
| subtype1 | 6 | 2002.2 (8.0) |
| subtype2 | 11 | 2000.3 (14.3) |
| subtype3 | 10 | 2004.3 (8.2) |
| subtype4 | 1 | 2000.0 (NA) |
| subtype5 | 3 | 1996.3 (11.8) |
Figure S131. Get High-res Image Clustering Approach #4: 'RPPA cHierClus subtypes' versus Clinical Feature #15: 'TOBACCO_SMOKING_YEAR_STOPPED'
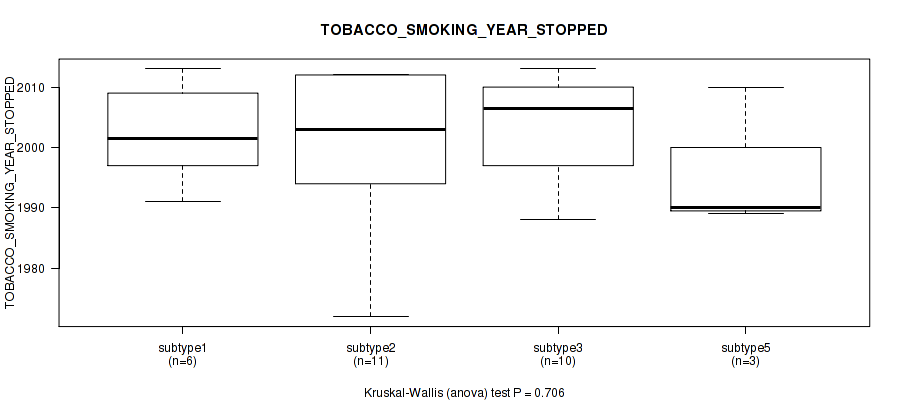
P value = 0.54 (Kruskal-Wallis (anova)), Q value = 0.77
Table S136. Clustering Approach #4: 'RPPA cHierClus subtypes' versus Clinical Feature #16: 'TOBACCO_SMOKING_PACK_YEARS_SMOKED'
| nPatients | Mean (Std.Dev) | |
|---|---|---|
| ALL | 45 | 17.7 (13.7) |
| subtype1 | 8 | 10.9 (7.4) |
| subtype2 | 15 | 17.3 (10.7) |
| subtype3 | 14 | 20.8 (16.6) |
| subtype4 | 6 | 20.6 (20.0) |
| subtype5 | 2 | 18.0 (11.3) |
Figure S132. Get High-res Image Clustering Approach #4: 'RPPA cHierClus subtypes' versus Clinical Feature #16: 'TOBACCO_SMOKING_PACK_YEARS_SMOKED'
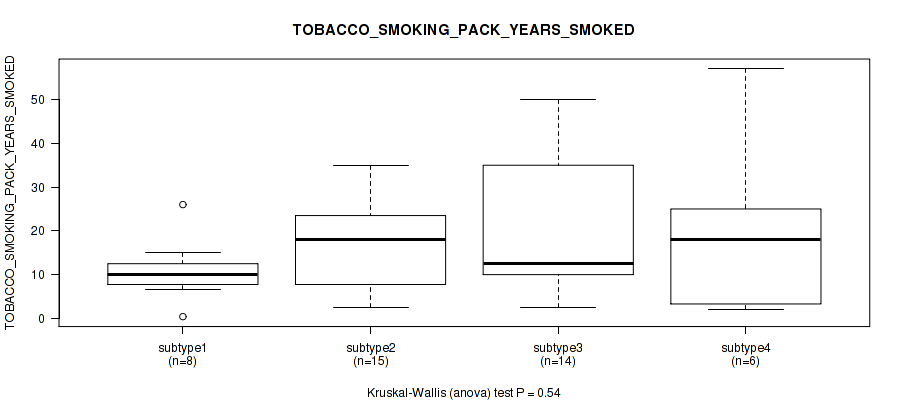
P value = 0.701 (Fisher's exact test), Q value = 0.85
Table S137. Clustering Approach #4: 'RPPA cHierClus subtypes' versus Clinical Feature #17: 'TOBACCO_SMOKING_HISTORY'
| nPatients | CURRENT REFORMED SMOKER FOR < OR = 15 YEARS | CURRENT REFORMED SMOKER FOR > 15 YEARS | CURRENT REFORMED SMOKER, DURATION NOT SPECIFIED | CURRENT SMOKER | LIFELONG NON-SMOKER |
|---|---|---|---|---|---|
| ALL | 28 | 6 | 2 | 23 | 86 |
| subtype1 | 3 | 2 | 0 | 4 | 18 |
| subtype2 | 10 | 2 | 0 | 6 | 21 |
| subtype3 | 11 | 1 | 1 | 7 | 24 |
| subtype4 | 2 | 0 | 1 | 5 | 11 |
| subtype5 | 2 | 1 | 0 | 1 | 12 |
Figure S133. Get High-res Image Clustering Approach #4: 'RPPA cHierClus subtypes' versus Clinical Feature #17: 'TOBACCO_SMOKING_HISTORY'
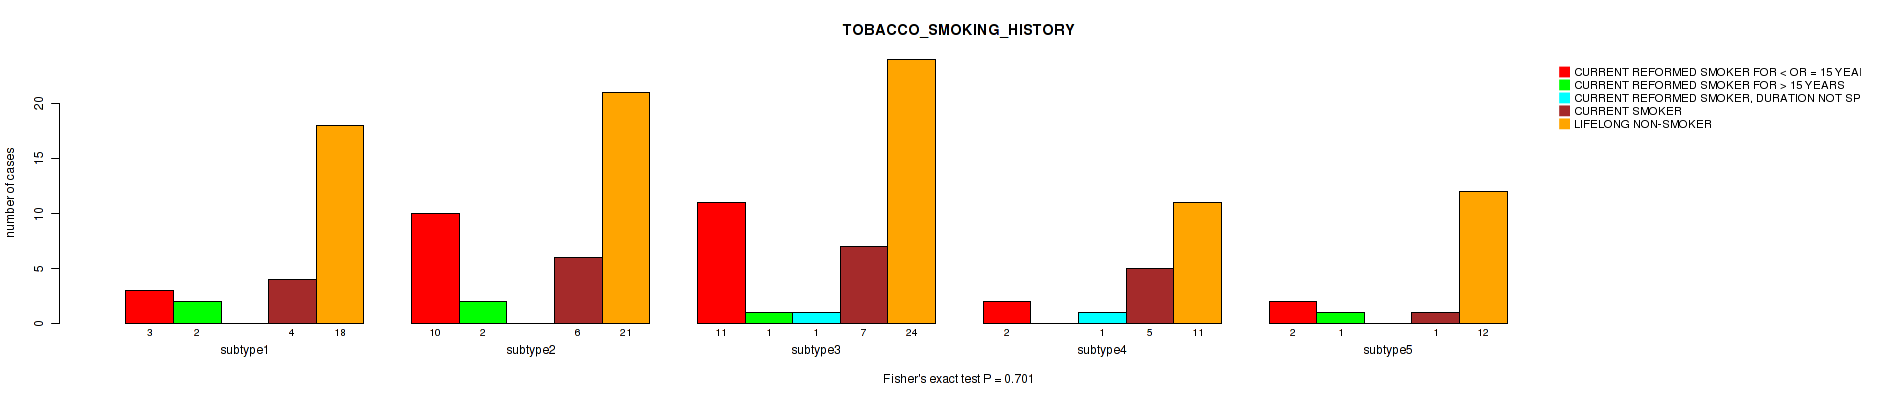
P value = 0.808 (Kruskal-Wallis (anova)), Q value = 0.92
Table S138. Clustering Approach #4: 'RPPA cHierClus subtypes' versus Clinical Feature #18: 'AGEBEGANSMOKINGINYEARS'
| nPatients | Mean (Std.Dev) | |
|---|---|---|
| ALL | 44 | 21.5 (7.9) |
| subtype1 | 7 | 23.4 (9.6) |
| subtype2 | 14 | 20.9 (7.1) |
| subtype3 | 15 | 20.5 (7.9) |
| subtype4 | 5 | 21.4 (5.9) |
| subtype5 | 3 | 25.3 (13.6) |
Figure S134. Get High-res Image Clustering Approach #4: 'RPPA cHierClus subtypes' versus Clinical Feature #18: 'AGEBEGANSMOKINGINYEARS'
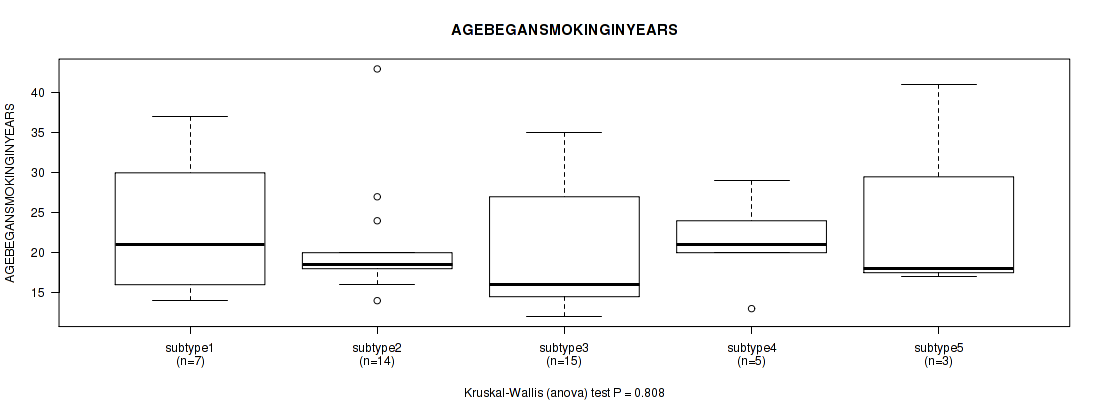
P value = 1 (Fisher's exact test), Q value = 1
Table S139. Clustering Approach #4: 'RPPA cHierClus subtypes' versus Clinical Feature #19: 'RADIATION_THERAPY_STATUS'
| nPatients | COMPLETED AS PLANNED | TREATMENT NOT COMPLETED |
|---|---|---|
| ALL | 21 | 2 |
| subtype1 | 5 | 1 |
| subtype2 | 6 | 0 |
| subtype3 | 7 | 1 |
| subtype4 | 3 | 0 |
| subtype5 | 0 | 0 |
Figure S135. Get High-res Image Clustering Approach #4: 'RPPA cHierClus subtypes' versus Clinical Feature #19: 'RADIATION_THERAPY_STATUS'
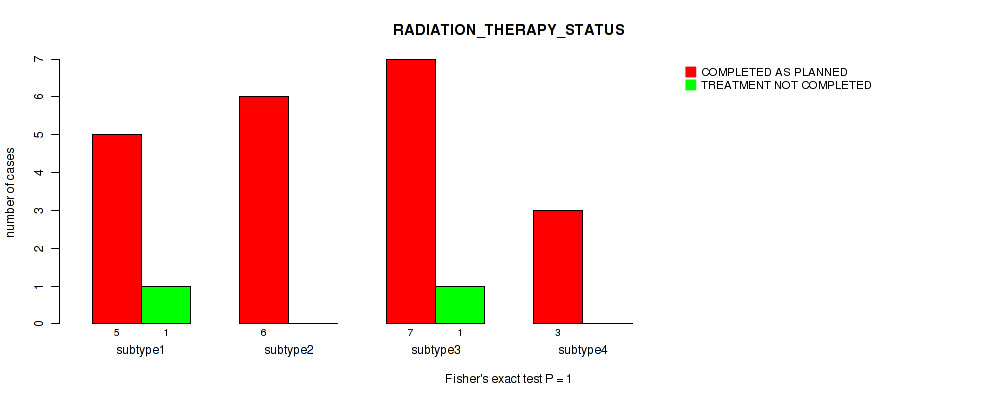
P value = 0.622 (Kruskal-Wallis (anova)), Q value = 0.83
Table S140. Clustering Approach #4: 'RPPA cHierClus subtypes' versus Clinical Feature #20: 'PREGNANCIES_COUNT_TOTAL'
| nPatients | Mean (Std.Dev) | |
|---|---|---|
| ALL | 151 | 3.6 (2.6) |
| subtype1 | 25 | 3.3 (2.1) |
| subtype2 | 41 | 3.3 (1.7) |
| subtype3 | 49 | 3.9 (2.9) |
| subtype4 | 21 | 3.3 (2.9) |
| subtype5 | 15 | 4.8 (3.6) |
Figure S136. Get High-res Image Clustering Approach #4: 'RPPA cHierClus subtypes' versus Clinical Feature #20: 'PREGNANCIES_COUNT_TOTAL'
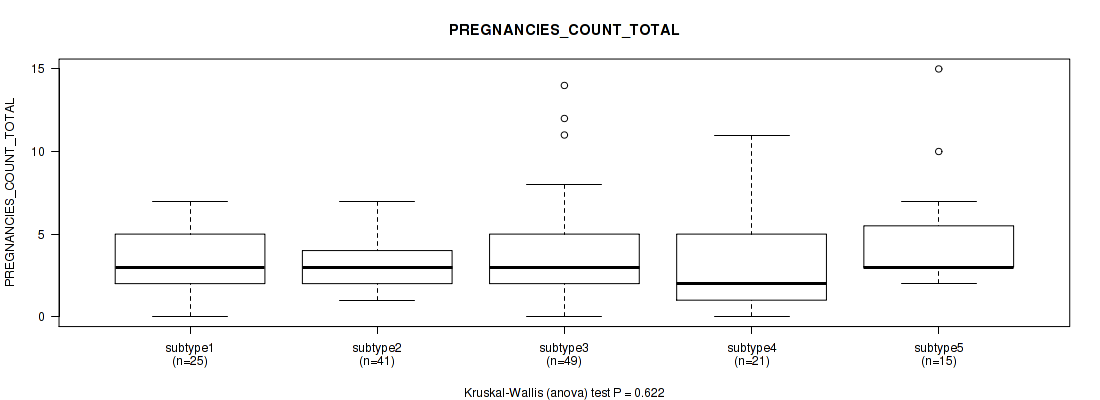
P value = 0.224 (Kruskal-Wallis (anova)), Q value = 0.55
Table S141. Clustering Approach #4: 'RPPA cHierClus subtypes' versus Clinical Feature #21: 'PREGNANCIES_COUNT_STILLBIRTH'
| nPatients | Mean (Std.Dev) | |
|---|---|---|
| ALL | 72 | 0.0 (0.2) |
| subtype1 | 13 | 0.2 (0.4) |
| subtype2 | 21 | 0.0 (0.2) |
| subtype3 | 22 | 0.0 (0.0) |
| subtype4 | 11 | 0.0 (0.0) |
| subtype5 | 5 | 0.0 (0.0) |
Figure S137. Get High-res Image Clustering Approach #4: 'RPPA cHierClus subtypes' versus Clinical Feature #21: 'PREGNANCIES_COUNT_STILLBIRTH'
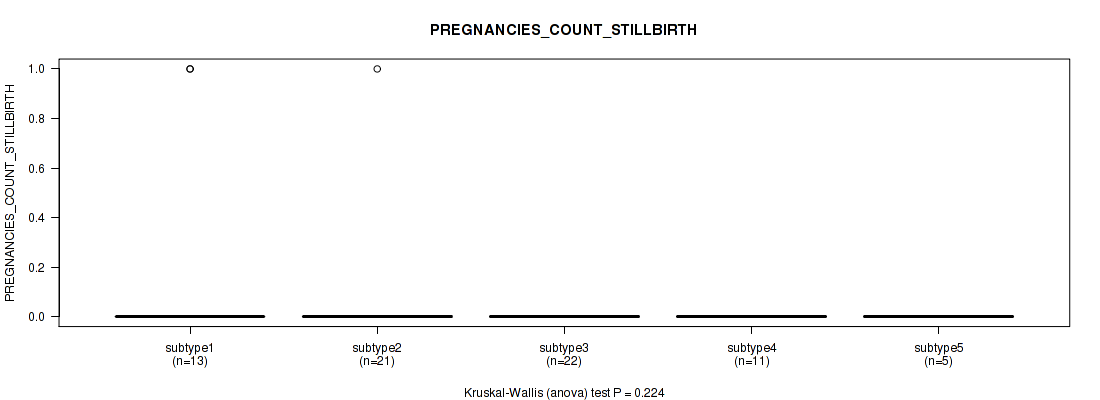
P value = 0.809 (Kruskal-Wallis (anova)), Q value = 0.92
Table S142. Clustering Approach #4: 'RPPA cHierClus subtypes' versus Clinical Feature #22: 'PREGNANCY_SPONTANEOUS_ABORTION_COUNT'
| nPatients | Mean (Std.Dev) | |
|---|---|---|
| ALL | 89 | 0.4 (0.8) |
| subtype1 | 15 | 0.3 (0.6) |
| subtype2 | 25 | 0.4 (0.9) |
| subtype3 | 28 | 0.6 (1.1) |
| subtype4 | 14 | 0.4 (0.5) |
| subtype5 | 7 | 0.4 (0.5) |
Figure S138. Get High-res Image Clustering Approach #4: 'RPPA cHierClus subtypes' versus Clinical Feature #22: 'PREGNANCY_SPONTANEOUS_ABORTION_COUNT'
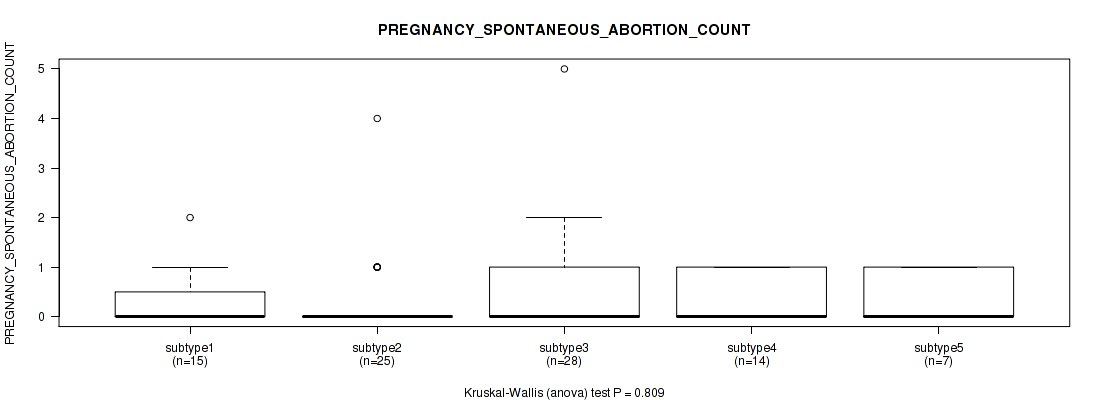
P value = 0.114 (Kruskal-Wallis (anova)), Q value = 0.46
Table S143. Clustering Approach #4: 'RPPA cHierClus subtypes' versus Clinical Feature #23: 'PREGNANCIES_COUNT_LIVE_BIRTH'
| nPatients | Mean (Std.Dev) | |
|---|---|---|
| ALL | 151 | 2.6 (1.9) |
| subtype1 | 26 | 2.3 (1.7) |
| subtype2 | 40 | 2.4 (1.4) |
| subtype3 | 48 | 2.9 (1.8) |
| subtype4 | 21 | 2.4 (2.6) |
| subtype5 | 16 | 3.3 (2.3) |
Figure S139. Get High-res Image Clustering Approach #4: 'RPPA cHierClus subtypes' versus Clinical Feature #23: 'PREGNANCIES_COUNT_LIVE_BIRTH'
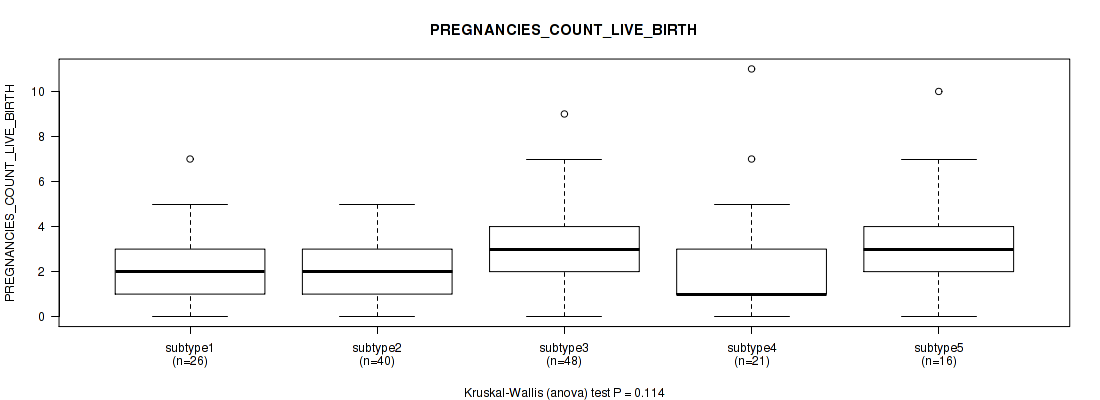
P value = 0.655 (Kruskal-Wallis (anova)), Q value = 0.83
Table S144. Clustering Approach #4: 'RPPA cHierClus subtypes' versus Clinical Feature #24: 'PREGNANCY_THERAPEUTIC_ABORTION_COUNT'
| nPatients | Mean (Std.Dev) | |
|---|---|---|
| ALL | 81 | 1.1 (2.2) |
| subtype1 | 16 | 1.1 (1.5) |
| subtype2 | 23 | 0.7 (1.2) |
| subtype3 | 23 | 1.2 (2.5) |
| subtype4 | 12 | 0.9 (1.2) |
| subtype5 | 7 | 2.6 (4.7) |
Figure S140. Get High-res Image Clustering Approach #4: 'RPPA cHierClus subtypes' versus Clinical Feature #24: 'PREGNANCY_THERAPEUTIC_ABORTION_COUNT'
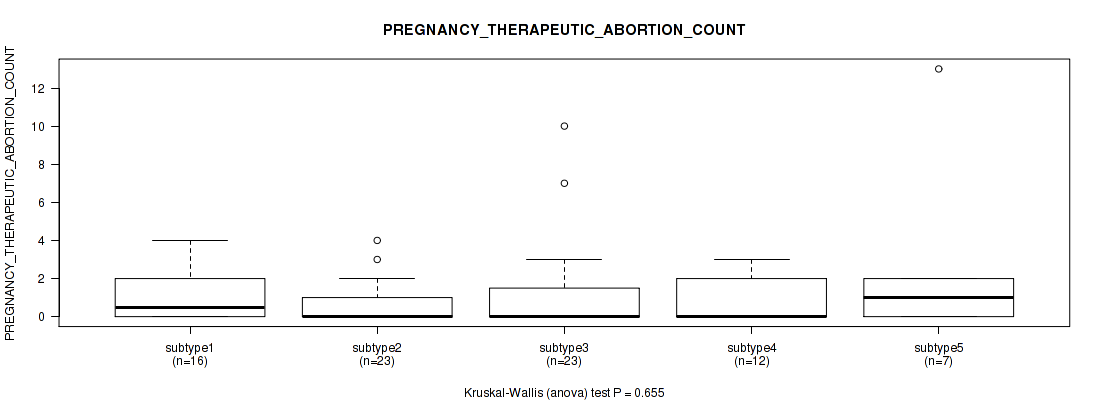
P value = 0.638 (Kruskal-Wallis (anova)), Q value = 0.83
Table S145. Clustering Approach #4: 'RPPA cHierClus subtypes' versus Clinical Feature #25: 'PREGNANCIES_COUNT_ECTOPIC'
| nPatients | Mean (Std.Dev) | |
|---|---|---|
| ALL | 74 | 0.1 (0.4) |
| subtype1 | 12 | 0.0 (0.0) |
| subtype2 | 23 | 0.1 (0.3) |
| subtype3 | 22 | 0.1 (0.5) |
| subtype4 | 12 | 0.2 (0.4) |
| subtype5 | 5 | 0.2 (0.4) |
Figure S141. Get High-res Image Clustering Approach #4: 'RPPA cHierClus subtypes' versus Clinical Feature #25: 'PREGNANCIES_COUNT_ECTOPIC'
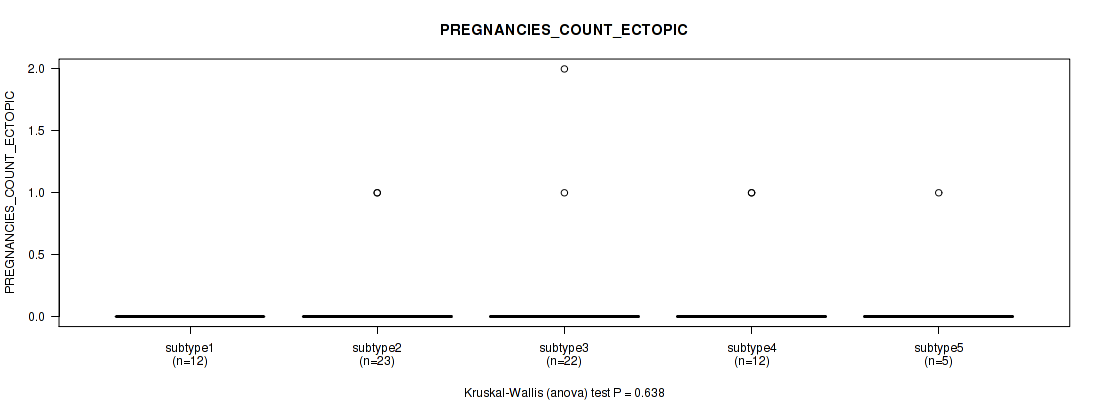
P value = 0.368 (Fisher's exact test), Q value = 0.69
Table S146. Clustering Approach #4: 'RPPA cHierClus subtypes' versus Clinical Feature #26: 'POS_LYMPH_NODE_LOCATION'
| nPatients | MACROSCOPIC PARAMETRIAL INVOLVEMENT | MICROSCOPIC PARAMETRIAL INVOLVEMENT | OTHER LOCATION, SPECIFY | POSITIVE BLADDER MARGIN | POSITIVE VAGINAL MARGIN |
|---|---|---|---|---|---|
| ALL | 3 | 7 | 25 | 1 | 5 |
| subtype1 | 2 | 1 | 3 | 0 | 0 |
| subtype2 | 1 | 4 | 10 | 0 | 2 |
| subtype3 | 0 | 2 | 7 | 0 | 1 |
| subtype4 | 0 | 0 | 3 | 1 | 2 |
| subtype5 | 0 | 0 | 2 | 0 | 0 |
Figure S142. Get High-res Image Clustering Approach #4: 'RPPA cHierClus subtypes' versus Clinical Feature #26: 'POS_LYMPH_NODE_LOCATION'
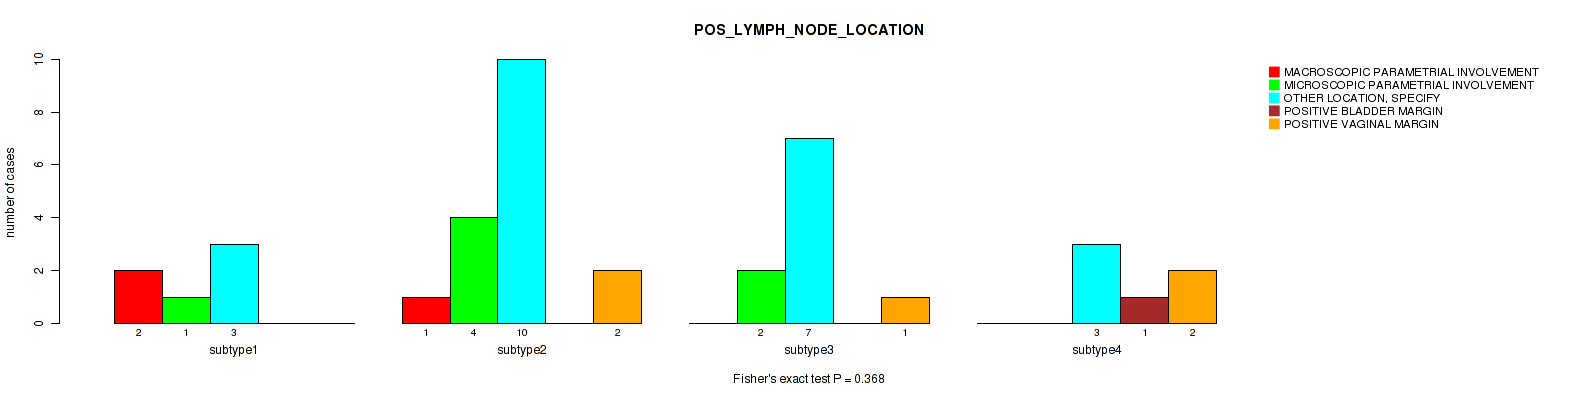
P value = 0.763 (Fisher's exact test), Q value = 0.89
Table S147. Clustering Approach #4: 'RPPA cHierClus subtypes' versus Clinical Feature #27: 'MENOPAUSE_STATUS'
| nPatients | INDETERMINATE (NEITHER PRE OR POSTMENOPAUSAL) | PERI (6-12 MONTHS SINCE LAST MENSTRUAL PERIOD) | POST (PRIOR BILATERAL OVARIECTOMY OR >12 MO SINCE LMP WITH NO PRIOR HYSTERECTOMY) | PRE (<6 MONTHS SINCE LMP AND NO PRIOR BILATERAL OVARIECTOMY AND NOT ON ESTROGEN REPLACEMENT) |
|---|---|---|---|---|
| ALL | 2 | 13 | 46 | 79 |
| subtype1 | 0 | 2 | 7 | 19 |
| subtype2 | 0 | 3 | 15 | 23 |
| subtype3 | 2 | 6 | 13 | 18 |
| subtype4 | 0 | 1 | 5 | 12 |
| subtype5 | 0 | 1 | 6 | 7 |
Figure S143. Get High-res Image Clustering Approach #4: 'RPPA cHierClus subtypes' versus Clinical Feature #27: 'MENOPAUSE_STATUS'
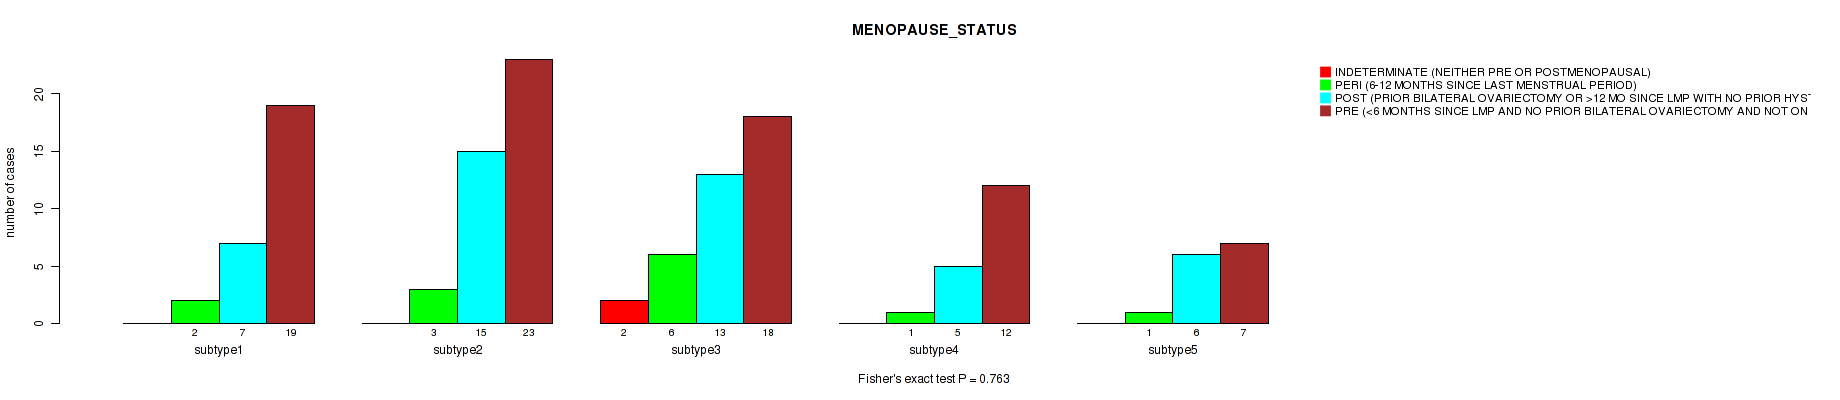
P value = 0.423 (Fisher's exact test), Q value = 0.73
Table S148. Clustering Approach #4: 'RPPA cHierClus subtypes' versus Clinical Feature #28: 'LYMPHOVASCULAR_INVOLVEMENT'
| nPatients | ABSENT | PRESENT |
|---|---|---|
| ALL | 52 | 60 |
| subtype1 | 13 | 8 |
| subtype2 | 13 | 22 |
| subtype3 | 12 | 17 |
| subtype4 | 6 | 6 |
| subtype5 | 8 | 7 |
Figure S144. Get High-res Image Clustering Approach #4: 'RPPA cHierClus subtypes' versus Clinical Feature #28: 'LYMPHOVASCULAR_INVOLVEMENT'
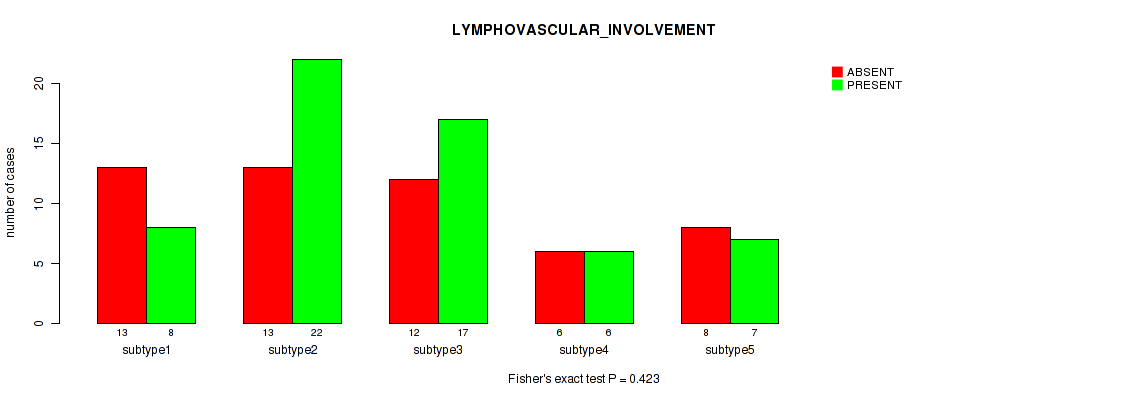
P value = 0.177 (Kruskal-Wallis (anova)), Q value = 0.51
Table S149. Clustering Approach #4: 'RPPA cHierClus subtypes' versus Clinical Feature #29: 'LYMPH_NODES_EXAMINED_HE_COUNT'
| nPatients | Mean (Std.Dev) | |
|---|---|---|
| ALL | 105 | 1.1 (2.7) |
| subtype1 | 16 | 1.3 (2.9) |
| subtype2 | 39 | 1.3 (3.5) |
| subtype3 | 25 | 1.2 (1.6) |
| subtype4 | 14 | 0.6 (1.6) |
| subtype5 | 11 | 0.7 (2.4) |
Figure S145. Get High-res Image Clustering Approach #4: 'RPPA cHierClus subtypes' versus Clinical Feature #29: 'LYMPH_NODES_EXAMINED_HE_COUNT'
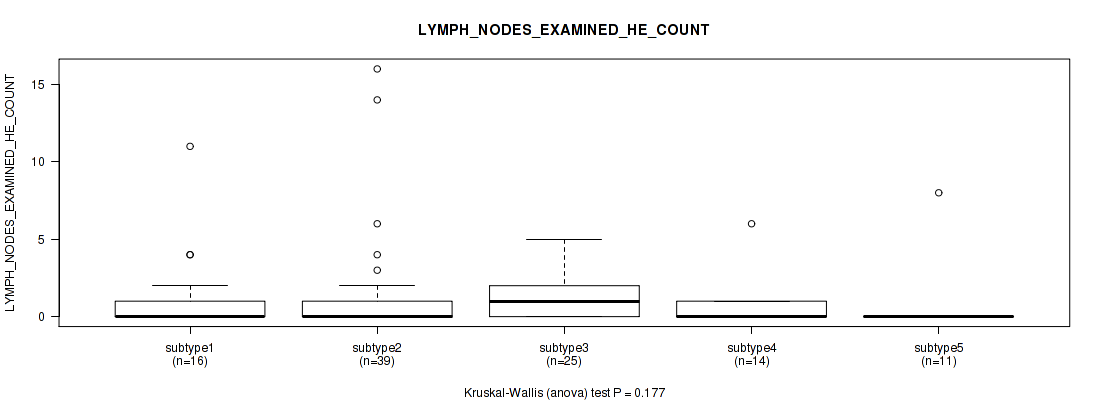
P value = 0.236 (Kruskal-Wallis (anova)), Q value = 0.56
Table S150. Clustering Approach #4: 'RPPA cHierClus subtypes' versus Clinical Feature #30: 'LYMPH_NODES_EXAMINED'
| nPatients | Mean (Std.Dev) | |
|---|---|---|
| ALL | 122 | 20.8 (11.9) |
| subtype1 | 22 | 18.4 (9.4) |
| subtype2 | 45 | 24.2 (12.6) |
| subtype3 | 26 | 19.3 (10.9) |
| subtype4 | 16 | 19.6 (14.9) |
| subtype5 | 13 | 17.3 (8.9) |
Figure S146. Get High-res Image Clustering Approach #4: 'RPPA cHierClus subtypes' versus Clinical Feature #30: 'LYMPH_NODES_EXAMINED'
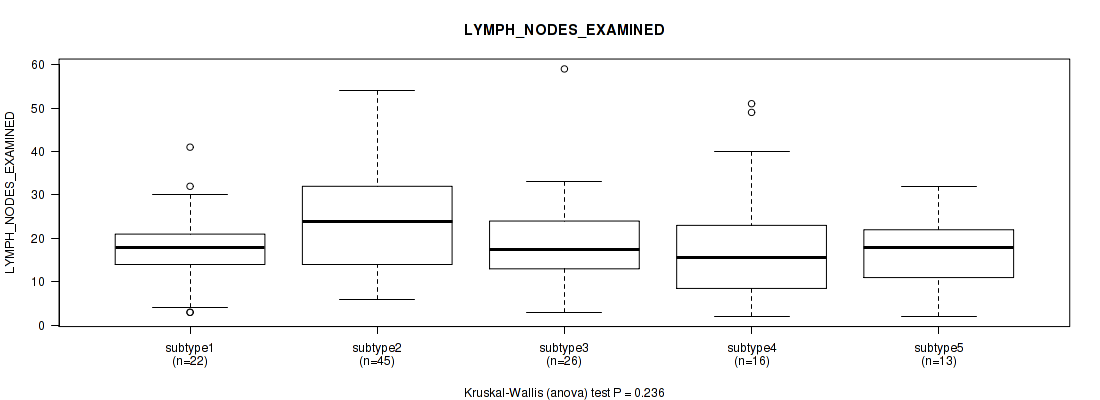
P value = 0.0395 (Fisher's exact test), Q value = 0.25
Table S151. Clustering Approach #4: 'RPPA cHierClus subtypes' versus Clinical Feature #31: 'KERATINIZATION_SQUAMOUS_CELL'
| nPatients | KERATINIZING SQUAMOUS CELL CARCINOMA | NON-KERATINIZING SQUAMOUS CELL CARCINOMA |
|---|---|---|
| ALL | 39 | 76 |
| subtype1 | 7 | 18 |
| subtype2 | 16 | 14 |
| subtype3 | 10 | 25 |
| subtype4 | 6 | 11 |
| subtype5 | 0 | 8 |
Figure S147. Get High-res Image Clustering Approach #4: 'RPPA cHierClus subtypes' versus Clinical Feature #31: 'KERATINIZATION_SQUAMOUS_CELL'
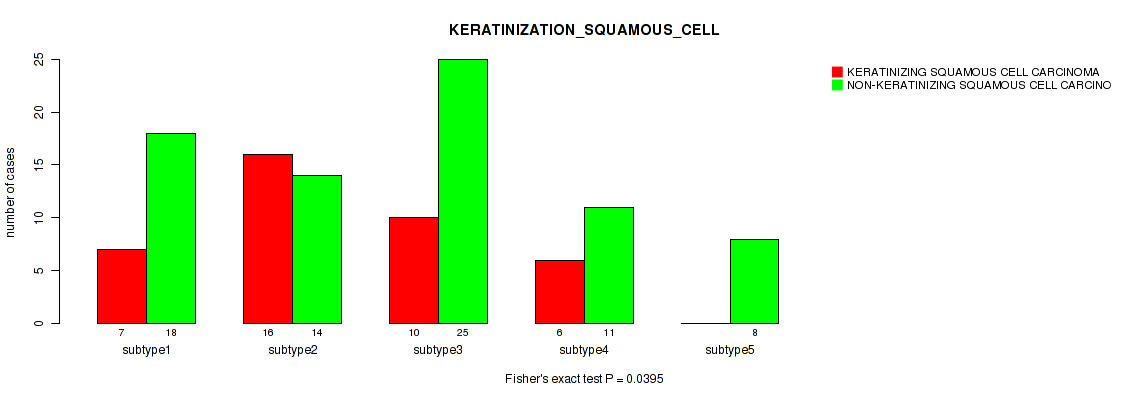
P value = 0.841 (Kruskal-Wallis (anova)), Q value = 0.94
Table S152. Clustering Approach #4: 'RPPA cHierClus subtypes' versus Clinical Feature #32: 'INITIAL_PATHOLOGIC_DX_YEAR'
| nPatients | Mean (Std.Dev) | |
|---|---|---|
| ALL | 171 | 2008.3 (5.0) |
| subtype1 | 32 | 2008.3 (5.5) |
| subtype2 | 47 | 2008.6 (4.4) |
| subtype3 | 51 | 2008.1 (5.2) |
| subtype4 | 23 | 2007.1 (5.6) |
| subtype5 | 18 | 2009.2 (3.8) |
Figure S148. Get High-res Image Clustering Approach #4: 'RPPA cHierClus subtypes' versus Clinical Feature #32: 'INITIAL_PATHOLOGIC_DX_YEAR'
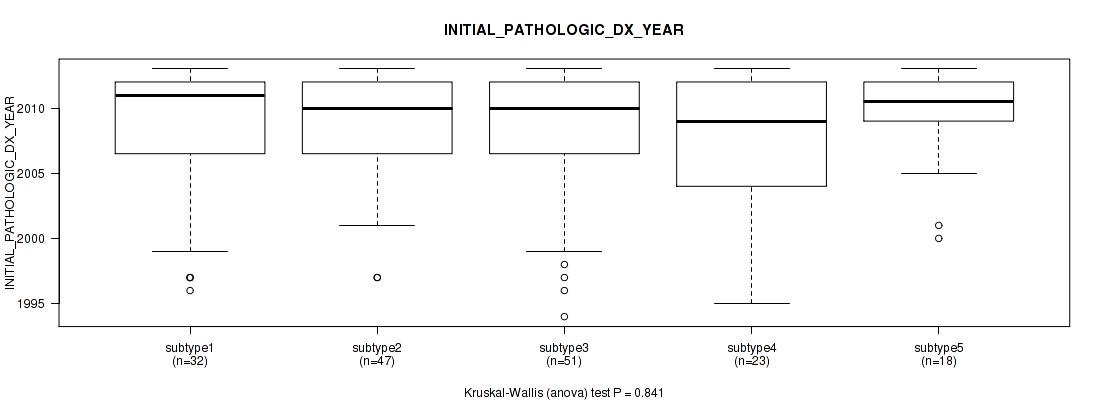
P value = 0.553 (Fisher's exact test), Q value = 0.77
Table S153. Clustering Approach #4: 'RPPA cHierClus subtypes' versus Clinical Feature #33: 'HISTORY_HORMONAL_CONTRACEPTIVES_USE'
| nPatients | CURRENT USER | FORMER USER | NEVER USED |
|---|---|---|---|
| ALL | 5 | 32 | 51 |
| subtype1 | 0 | 4 | 8 |
| subtype2 | 3 | 12 | 13 |
| subtype3 | 1 | 6 | 18 |
| subtype4 | 0 | 6 | 8 |
| subtype5 | 1 | 4 | 4 |
Figure S149. Get High-res Image Clustering Approach #4: 'RPPA cHierClus subtypes' versus Clinical Feature #33: 'HISTORY_HORMONAL_CONTRACEPTIVES_USE'
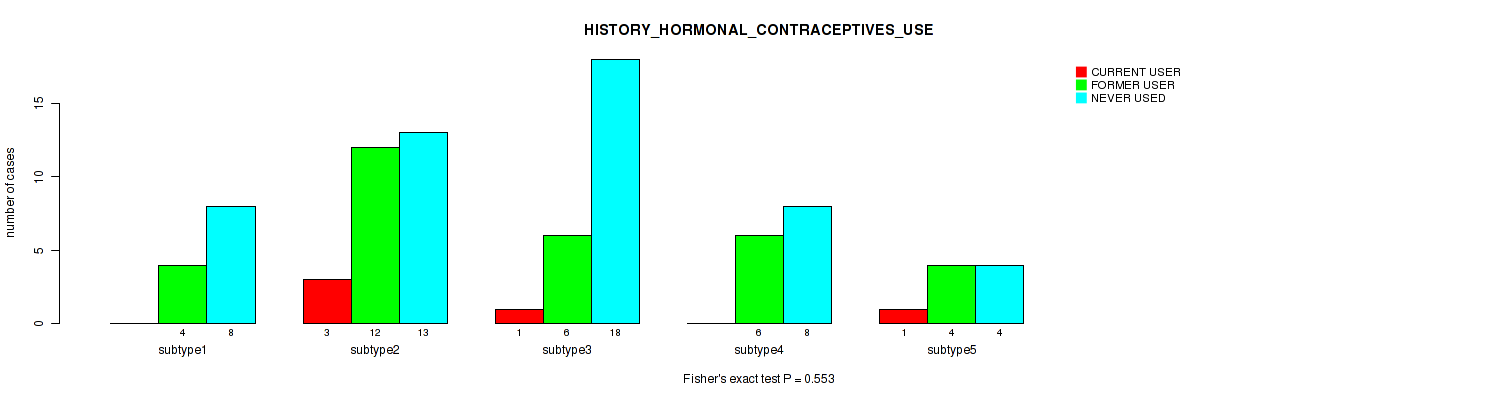
P value = 0.167 (Kruskal-Wallis (anova)), Q value = 0.5
Table S154. Clustering Approach #4: 'RPPA cHierClus subtypes' versus Clinical Feature #34: 'HEIGHT_CM_AT_DIAGNOSIS'
| nPatients | Mean (Std.Dev) | |
|---|---|---|
| ALL | 153 | 161.7 (7.1) |
| subtype1 | 26 | 162.4 (6.5) |
| subtype2 | 43 | 162.3 (5.7) |
| subtype3 | 46 | 160.1 (8.7) |
| subtype4 | 20 | 164.4 (6.1) |
| subtype5 | 18 | 160.3 (7.2) |
Figure S150. Get High-res Image Clustering Approach #4: 'RPPA cHierClus subtypes' versus Clinical Feature #34: 'HEIGHT_CM_AT_DIAGNOSIS'
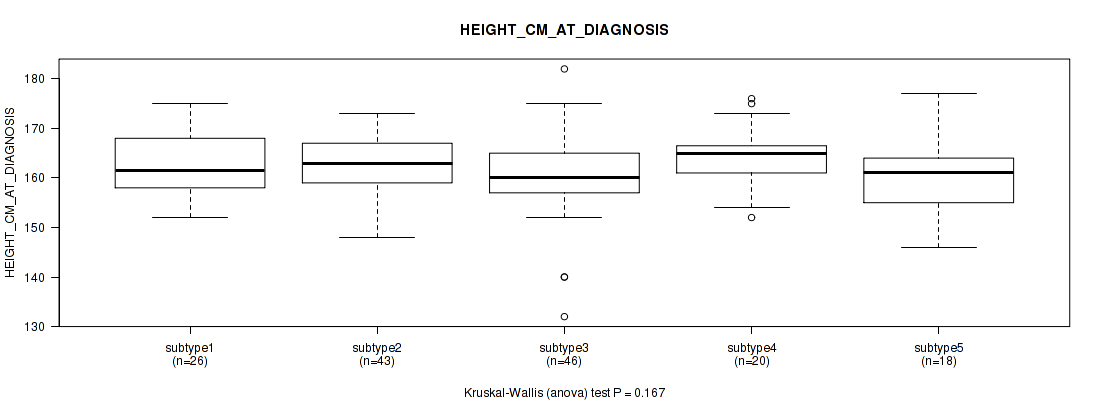
P value = 0.456 (Fisher's exact test), Q value = 0.74
Table S155. Clustering Approach #4: 'RPPA cHierClus subtypes' versus Clinical Feature #35: 'CORPUS_INVOLVEMENT'
| nPatients | ABSENT | PRESENT |
|---|---|---|
| ALL | 84 | 12 |
| subtype1 | 16 | 1 |
| subtype2 | 24 | 3 |
| subtype3 | 25 | 3 |
| subtype4 | 9 | 1 |
| subtype5 | 10 | 4 |
Figure S151. Get High-res Image Clustering Approach #4: 'RPPA cHierClus subtypes' versus Clinical Feature #35: 'CORPUS_INVOLVEMENT'
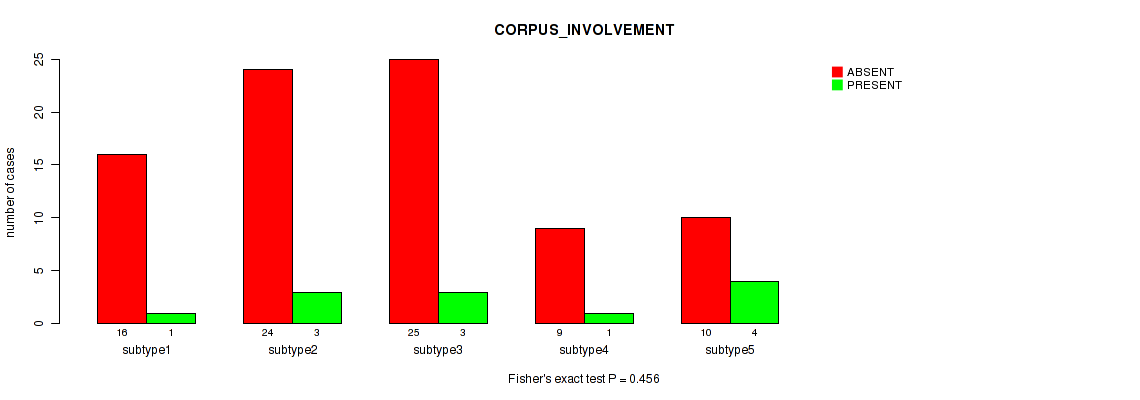
P value = 0.00356 (Fisher's exact test), Q value = 0.068
Table S156. Clustering Approach #4: 'RPPA cHierClus subtypes' versus Clinical Feature #36: 'CHEMO_CONCURRENT_TYPE'
| nPatients | CARBOPLATIN | CISPLATIN | OTHER |
|---|---|---|---|
| ALL | 3 | 48 | 1 |
| subtype1 | 0 | 9 | 1 |
| subtype2 | 1 | 10 | 0 |
| subtype3 | 0 | 22 | 0 |
| subtype4 | 0 | 6 | 0 |
| subtype5 | 2 | 1 | 0 |
Figure S152. Get High-res Image Clustering Approach #4: 'RPPA cHierClus subtypes' versus Clinical Feature #36: 'CHEMO_CONCURRENT_TYPE'
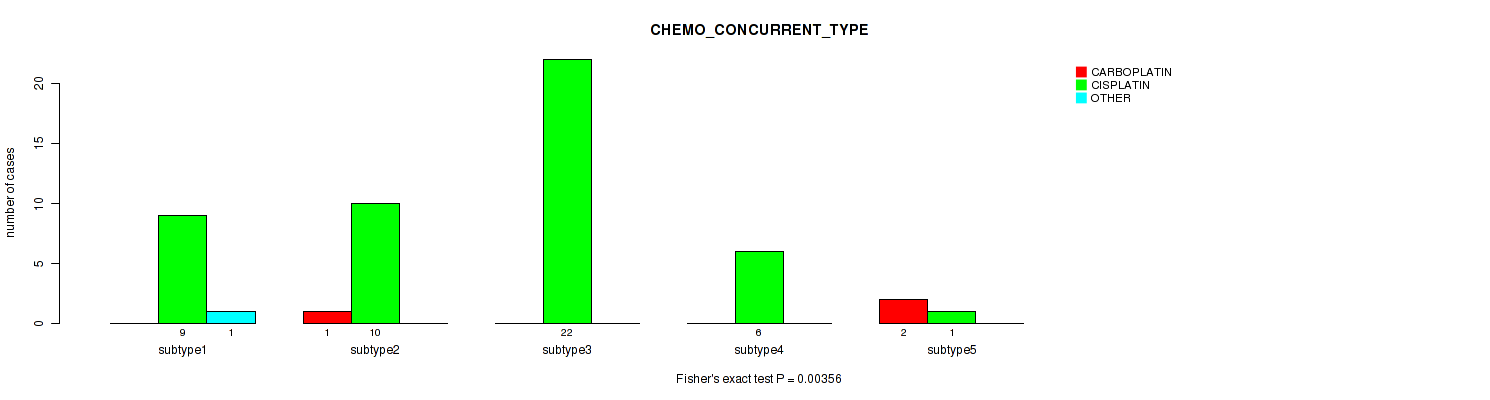
P value = 0.117 (Kruskal-Wallis (anova)), Q value = 0.46
Table S157. Clustering Approach #4: 'RPPA cHierClus subtypes' versus Clinical Feature #38: 'AGE_AT_DIAGNOSIS'
| nPatients | Mean (Std.Dev) | |
|---|---|---|
| ALL | 173 | 47.7 (13.5) |
| subtype1 | 32 | 44.8 (14.5) |
| subtype2 | 49 | 47.7 (13.5) |
| subtype3 | 51 | 48.9 (13.4) |
| subtype4 | 23 | 44.2 (12.3) |
| subtype5 | 18 | 53.8 (12.1) |
Figure S153. Get High-res Image Clustering Approach #4: 'RPPA cHierClus subtypes' versus Clinical Feature #38: 'AGE_AT_DIAGNOSIS'
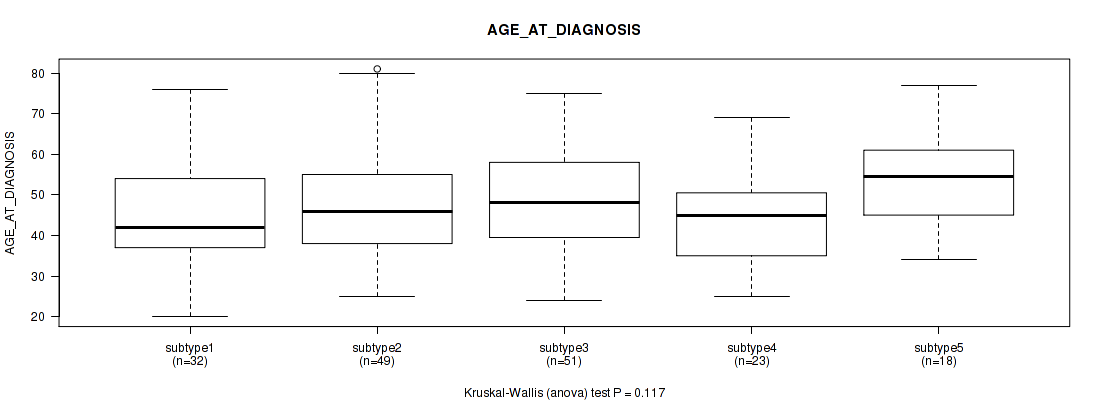
P value = 0.127 (Fisher's exact test), Q value = 0.47
Table S158. Clustering Approach #4: 'RPPA cHierClus subtypes' versus Clinical Feature #39: 'CLINICAL_STAGE'
| nPatients | STAGE I | STAGE IA | STAGE IA1 | STAGE IA2 | STAGE IB | STAGE IB1 | STAGE IB2 | STAGE II | STAGE IIA | STAGE IIA1 | STAGE IIA2 | STAGE IIB | STAGE III | STAGE IIIA | STAGE IIIB | STAGE IVA | STAGE IVB |
|---|---|---|---|---|---|---|---|---|---|---|---|---|---|---|---|---|---|
| ALL | 4 | 1 | 1 | 1 | 27 | 48 | 28 | 4 | 5 | 4 | 4 | 16 | 1 | 1 | 19 | 4 | 2 |
| subtype1 | 1 | 1 | 1 | 0 | 4 | 7 | 9 | 0 | 1 | 0 | 0 | 3 | 0 | 0 | 3 | 0 | 1 |
| subtype2 | 1 | 0 | 0 | 0 | 8 | 20 | 8 | 0 | 1 | 1 | 2 | 3 | 0 | 0 | 3 | 0 | 1 |
| subtype3 | 1 | 0 | 0 | 1 | 8 | 10 | 4 | 2 | 1 | 0 | 0 | 8 | 1 | 1 | 10 | 3 | 0 |
| subtype4 | 1 | 0 | 0 | 0 | 5 | 5 | 3 | 0 | 1 | 1 | 1 | 2 | 0 | 0 | 3 | 1 | 0 |
| subtype5 | 0 | 0 | 0 | 0 | 2 | 6 | 4 | 2 | 1 | 2 | 1 | 0 | 0 | 0 | 0 | 0 | 0 |
Figure S154. Get High-res Image Clustering Approach #4: 'RPPA cHierClus subtypes' versus Clinical Feature #39: 'CLINICAL_STAGE'

Table S159. Description of clustering approach #5: 'RNAseq CNMF subtypes'
| Cluster Labels | 1 | 2 | 3 | 4 |
|---|---|---|---|---|
| Number of samples | 58 | 105 | 69 | 72 |
P value = 0.429 (logrank test), Q value = 0.73
Table S160. Clustering Approach #5: 'RNAseq CNMF subtypes' versus Clinical Feature #1: 'Time to Death'
| nPatients | nDeath | Duration Range (Median), Month | |
|---|---|---|---|
| ALL | 287 | 71 | 0.0 - 210.7 (23.8) |
| subtype1 | 54 | 12 | 0.1 - 146.9 (21.8) |
| subtype2 | 99 | 23 | 0.2 - 210.7 (26.1) |
| subtype3 | 68 | 15 | 0.4 - 147.4 (25.0) |
| subtype4 | 66 | 21 | 0.0 - 154.3 (19.4) |
Figure S155. Get High-res Image Clustering Approach #5: 'RNAseq CNMF subtypes' versus Clinical Feature #1: 'Time to Death'
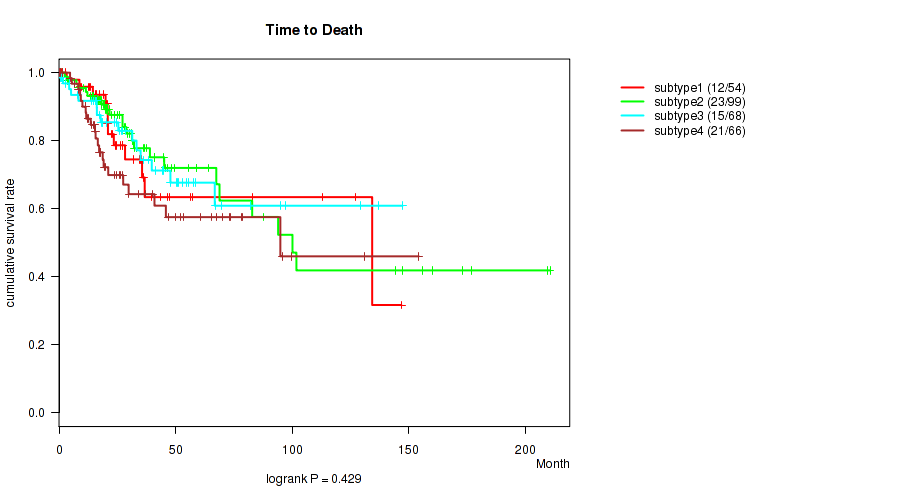
P value = 1.03e-05 (Kruskal-Wallis (anova)), Q value = 0.00044
Table S161. Clustering Approach #5: 'RNAseq CNMF subtypes' versus Clinical Feature #2: 'YEARS_TO_BIRTH'
| nPatients | Mean (Std.Dev) | |
|---|---|---|
| ALL | 302 | 48.2 (13.9) |
| subtype1 | 58 | 53.4 (12.7) |
| subtype2 | 104 | 50.7 (14.9) |
| subtype3 | 69 | 46.2 (12.1) |
| subtype4 | 71 | 42.0 (12.3) |
Figure S156. Get High-res Image Clustering Approach #5: 'RNAseq CNMF subtypes' versus Clinical Feature #2: 'YEARS_TO_BIRTH'
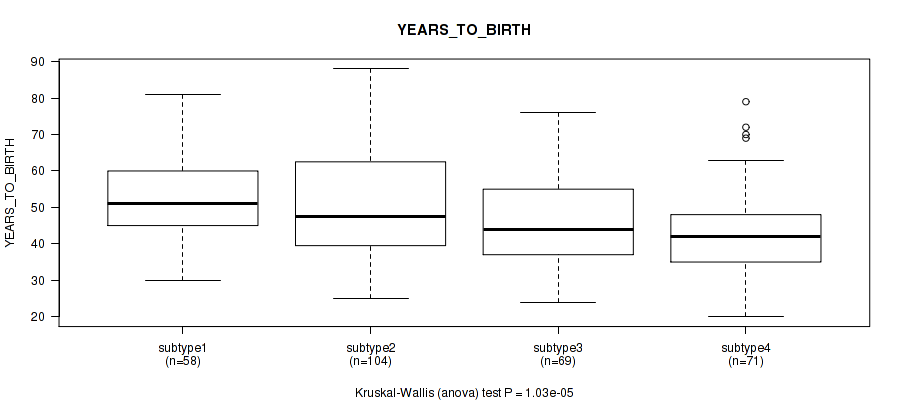
P value = 0.613 (Fisher's exact test), Q value = 0.82
Table S162. Clustering Approach #5: 'RNAseq CNMF subtypes' versus Clinical Feature #3: 'PATHOLOGY_T_STAGE'
| nPatients | T1 | T2 | T3 | T4 |
|---|---|---|---|---|
| ALL | 140 | 71 | 20 | 10 |
| subtype1 | 23 | 14 | 6 | 3 |
| subtype2 | 48 | 27 | 7 | 4 |
| subtype3 | 40 | 14 | 2 | 1 |
| subtype4 | 29 | 16 | 5 | 2 |
Figure S157. Get High-res Image Clustering Approach #5: 'RNAseq CNMF subtypes' versus Clinical Feature #3: 'PATHOLOGY_T_STAGE'
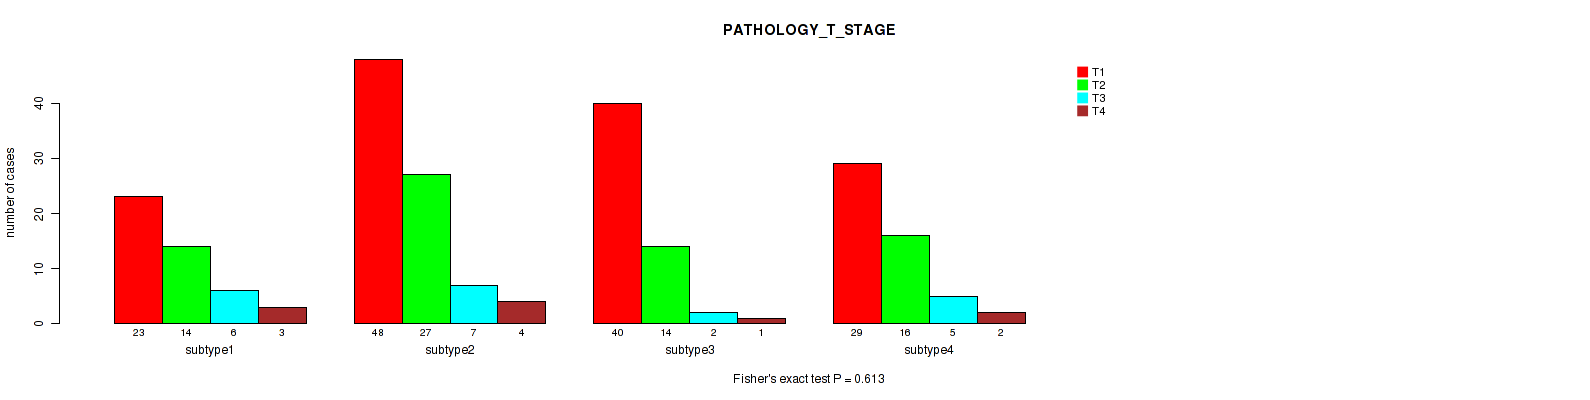
P value = 0.361 (Fisher's exact test), Q value = 0.69
Table S163. Clustering Approach #5: 'RNAseq CNMF subtypes' versus Clinical Feature #4: 'PATHOLOGY_N_STAGE'
| nPatients | 0 | 1 |
|---|---|---|
| ALL | 133 | 60 |
| subtype1 | 23 | 12 |
| subtype2 | 46 | 27 |
| subtype3 | 35 | 10 |
| subtype4 | 29 | 11 |
Figure S158. Get High-res Image Clustering Approach #5: 'RNAseq CNMF subtypes' versus Clinical Feature #4: 'PATHOLOGY_N_STAGE'
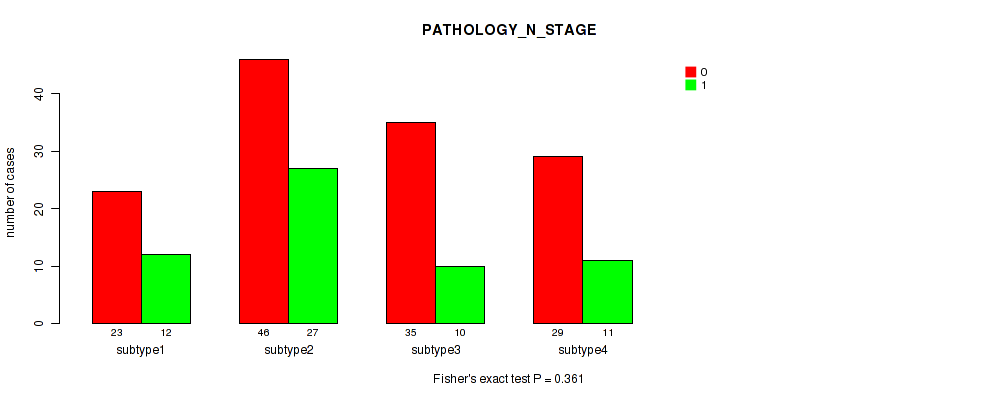
P value = 0.248 (Fisher's exact test), Q value = 0.58
Table S164. Clustering Approach #5: 'RNAseq CNMF subtypes' versus Clinical Feature #5: 'PATHOLOGY_M_STAGE'
| nPatients | 0 | 1 |
|---|---|---|
| ALL | 116 | 10 |
| subtype1 | 24 | 4 |
| subtype2 | 43 | 1 |
| subtype3 | 23 | 2 |
| subtype4 | 26 | 3 |
Figure S159. Get High-res Image Clustering Approach #5: 'RNAseq CNMF subtypes' versus Clinical Feature #5: 'PATHOLOGY_M_STAGE'
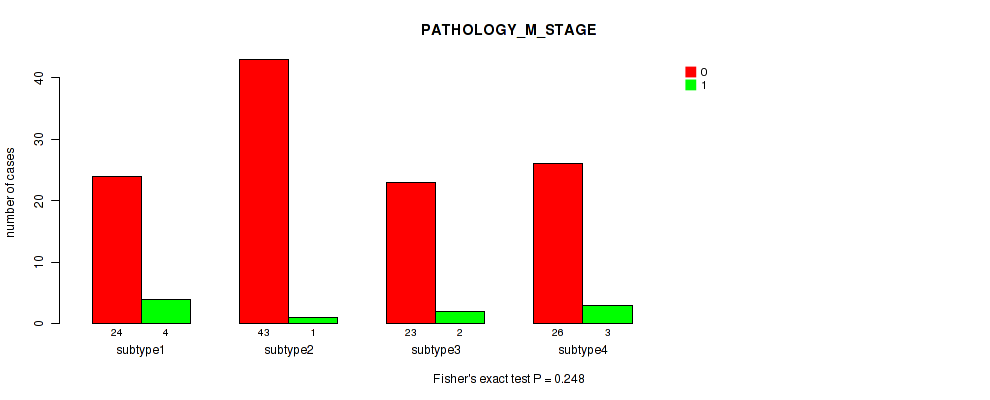
P value = 0.955 (Fisher's exact test), Q value = 0.99
Table S165. Clustering Approach #5: 'RNAseq CNMF subtypes' versus Clinical Feature #6: 'RADIATION_THERAPY'
| nPatients | NO | YES |
|---|---|---|
| ALL | 57 | 125 |
| subtype1 | 9 | 24 |
| subtype2 | 18 | 38 |
| subtype3 | 15 | 30 |
| subtype4 | 15 | 33 |
Figure S160. Get High-res Image Clustering Approach #5: 'RNAseq CNMF subtypes' versus Clinical Feature #6: 'RADIATION_THERAPY'
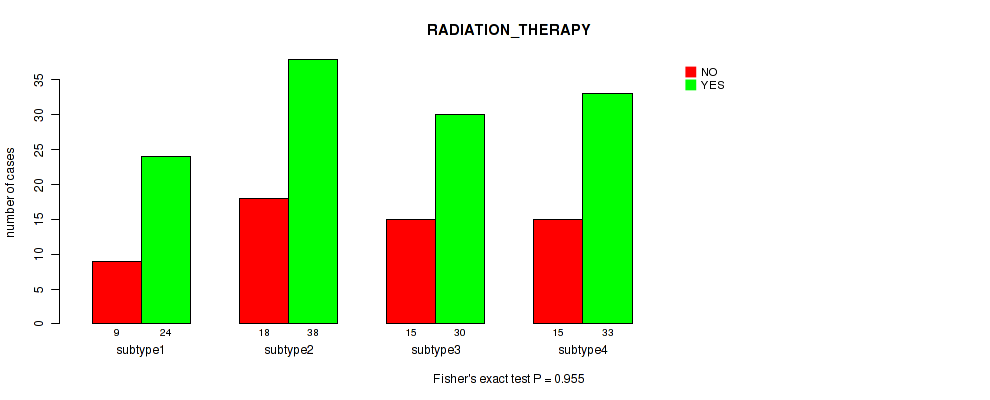
P value = 1e-05 (Fisher's exact test), Q value = 0.00044
Table S166. Clustering Approach #5: 'RNAseq CNMF subtypes' versus Clinical Feature #7: 'HISTOLOGICAL_TYPE'
| nPatients | ADENOSQUAMOUS | CERVICAL SQUAMOUS CELL CARCINOMA | ENDOCERVICAL ADENOCARCINOMA OF THE USUAL TYPE | ENDOCERVICAL TYPE OF ADENOCARCINOMA | ENDOMETRIOID ADENOCARCINOMA OF ENDOCERVIX | MUCINOUS ADENOCARCINOMA OF ENDOCERVICAL TYPE |
|---|---|---|---|---|---|---|
| ALL | 5 | 252 | 6 | 21 | 3 | 17 |
| subtype1 | 3 | 47 | 2 | 3 | 1 | 2 |
| subtype2 | 0 | 105 | 0 | 0 | 0 | 0 |
| subtype3 | 2 | 28 | 4 | 18 | 2 | 15 |
| subtype4 | 0 | 72 | 0 | 0 | 0 | 0 |
Figure S161. Get High-res Image Clustering Approach #5: 'RNAseq CNMF subtypes' versus Clinical Feature #7: 'HISTOLOGICAL_TYPE'
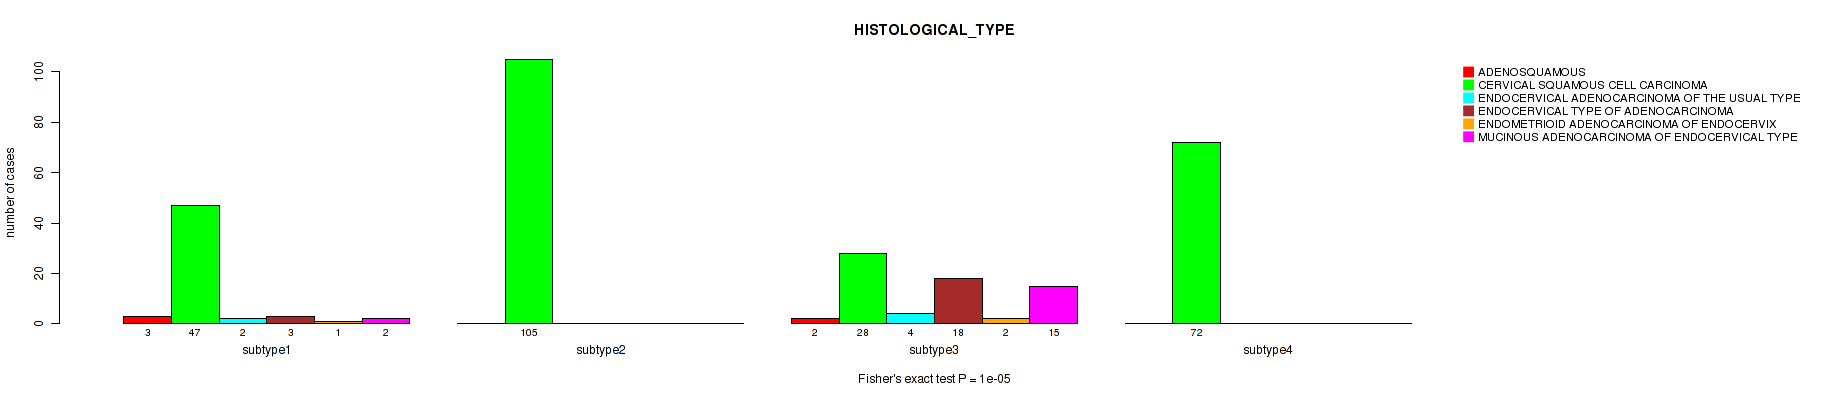
P value = 0.145 (Kruskal-Wallis (anova)), Q value = 0.47
Table S167. Clustering Approach #5: 'RNAseq CNMF subtypes' versus Clinical Feature #8: 'NUMBER_PACK_YEARS_SMOKED'
| nPatients | Mean (Std.Dev) | |
|---|---|---|
| ALL | 93 | 17.4 (14.1) |
| subtype1 | 17 | 20.5 (15.7) |
| subtype2 | 38 | 20.7 (16.0) |
| subtype3 | 17 | 12.3 (10.6) |
| subtype4 | 21 | 13.0 (9.3) |
Figure S162. Get High-res Image Clustering Approach #5: 'RNAseq CNMF subtypes' versus Clinical Feature #8: 'NUMBER_PACK_YEARS_SMOKED'
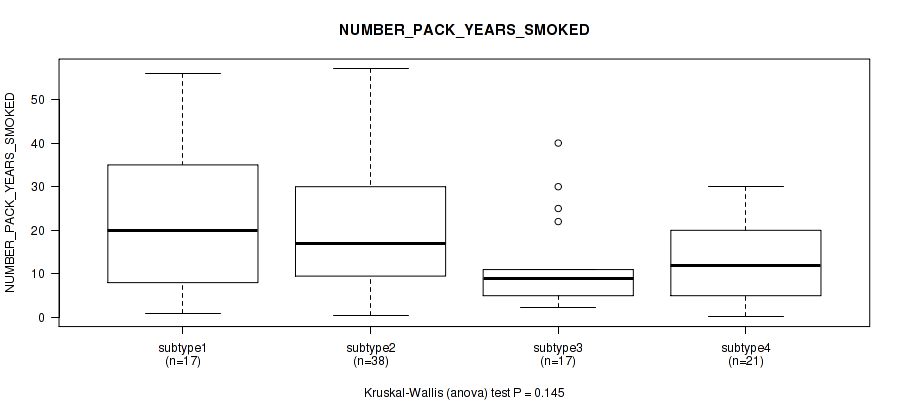
P value = 0.0109 (Kruskal-Wallis (anova)), Q value = 0.14
Table S168. Clustering Approach #5: 'RNAseq CNMF subtypes' versus Clinical Feature #9: 'NUMBER_OF_LYMPH_NODES'
| nPatients | Mean (Std.Dev) | |
|---|---|---|
| ALL | 159 | 1.0 (2.4) |
| subtype1 | 28 | 1.4 (3.1) |
| subtype2 | 60 | 1.4 (2.3) |
| subtype3 | 44 | 0.8 (2.7) |
| subtype4 | 27 | 0.3 (0.6) |
Figure S163. Get High-res Image Clustering Approach #5: 'RNAseq CNMF subtypes' versus Clinical Feature #9: 'NUMBER_OF_LYMPH_NODES'
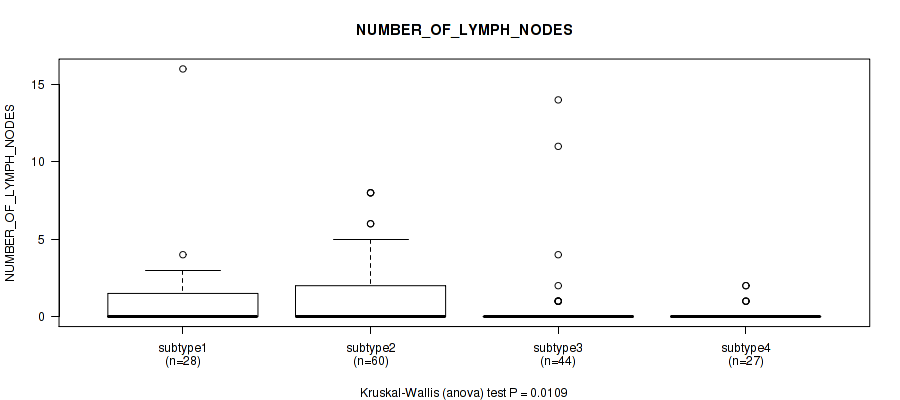
P value = 0.008 (Fisher's exact test), Q value = 0.11
Table S169. Clustering Approach #5: 'RNAseq CNMF subtypes' versus Clinical Feature #10: 'RACE'
| nPatients | AMERICAN INDIAN OR ALASKA NATIVE | ASIAN | BLACK OR AFRICAN AMERICAN | NATIVE HAWAIIAN OR OTHER PACIFIC ISLANDER | WHITE |
|---|---|---|---|---|---|
| ALL | 7 | 20 | 30 | 2 | 209 |
| subtype1 | 2 | 7 | 7 | 0 | 36 |
| subtype2 | 1 | 7 | 11 | 0 | 71 |
| subtype3 | 0 | 2 | 1 | 0 | 55 |
| subtype4 | 4 | 4 | 11 | 2 | 47 |
Figure S164. Get High-res Image Clustering Approach #5: 'RNAseq CNMF subtypes' versus Clinical Feature #10: 'RACE'
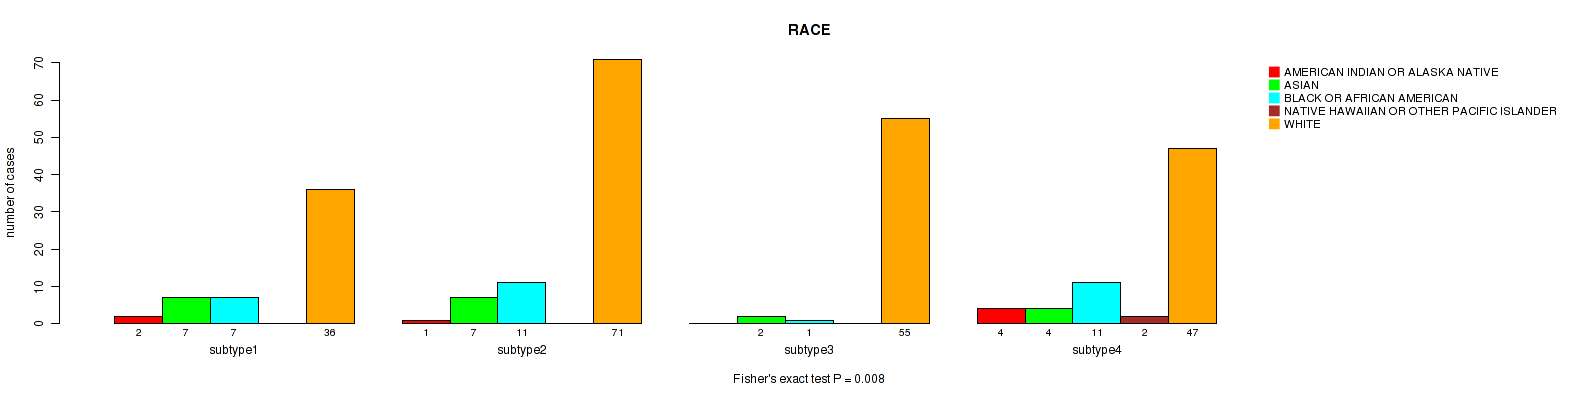
P value = 0.251 (Fisher's exact test), Q value = 0.58
Table S170. Clustering Approach #5: 'RNAseq CNMF subtypes' versus Clinical Feature #11: 'ETHNICITY'
| nPatients | HISPANIC OR LATINO | NOT HISPANIC OR LATINO |
|---|---|---|
| ALL | 24 | 168 |
| subtype1 | 2 | 39 |
| subtype2 | 8 | 58 |
| subtype3 | 5 | 32 |
| subtype4 | 9 | 39 |
Figure S165. Get High-res Image Clustering Approach #5: 'RNAseq CNMF subtypes' versus Clinical Feature #11: 'ETHNICITY'
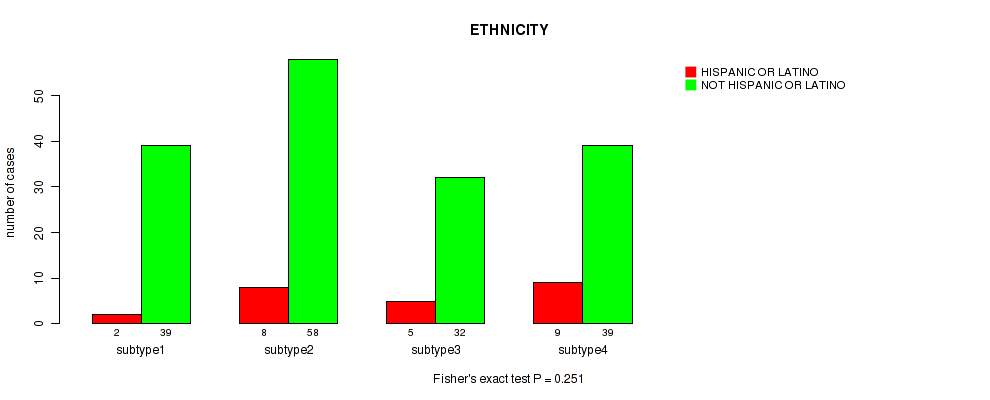
P value = 0.651 (Kruskal-Wallis (anova)), Q value = 0.83
Table S171. Clustering Approach #5: 'RNAseq CNMF subtypes' versus Clinical Feature #12: 'WEIGHT_KG_AT_DIAGNOSIS'
| nPatients | Mean (Std.Dev) | |
|---|---|---|
| ALL | 275 | 72.9 (21.5) |
| subtype1 | 53 | 72.1 (25.2) |
| subtype2 | 94 | 73.3 (24.9) |
| subtype3 | 63 | 73.3 (15.8) |
| subtype4 | 65 | 72.4 (17.9) |
Figure S166. Get High-res Image Clustering Approach #5: 'RNAseq CNMF subtypes' versus Clinical Feature #12: 'WEIGHT_KG_AT_DIAGNOSIS'
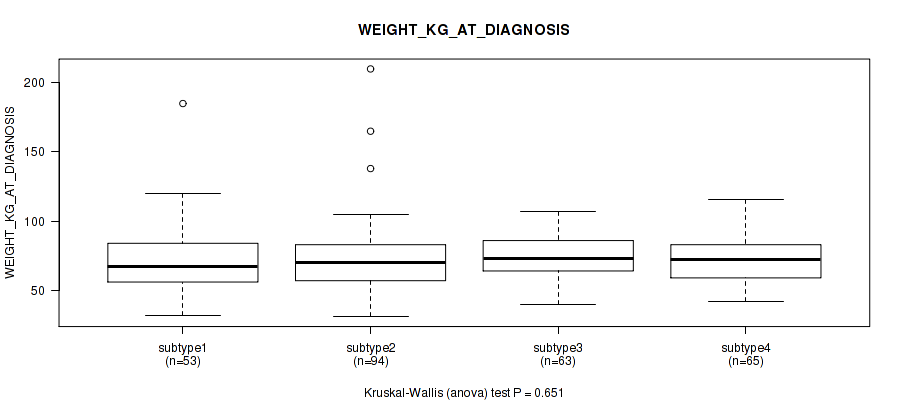
P value = 0.288 (Fisher's exact test), Q value = 0.61
Table S172. Clustering Approach #5: 'RNAseq CNMF subtypes' versus Clinical Feature #13: 'TUMOR_STATUS'
| nPatients | TUMOR FREE | WITH TUMOR |
|---|---|---|
| ALL | 189 | 78 |
| subtype1 | 33 | 20 |
| subtype2 | 70 | 21 |
| subtype3 | 43 | 17 |
| subtype4 | 43 | 20 |
Figure S167. Get High-res Image Clustering Approach #5: 'RNAseq CNMF subtypes' versus Clinical Feature #13: 'TUMOR_STATUS'
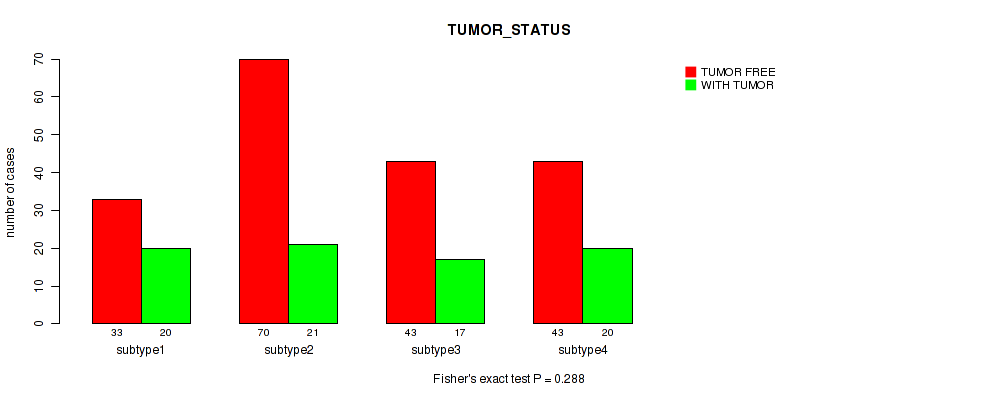
P value = 0.00156 (Fisher's exact test), Q value = 0.036
Table S173. Clustering Approach #5: 'RNAseq CNMF subtypes' versus Clinical Feature #14: 'NEOPLASM_HISTOLOGIC_GRADE'
| nPatients | G1 | G2 | G3 | G4 | GX |
|---|---|---|---|---|---|
| ALL | 18 | 135 | 118 | 1 | 24 |
| subtype1 | 2 | 22 | 30 | 0 | 2 |
| subtype2 | 7 | 62 | 28 | 0 | 6 |
| subtype3 | 7 | 30 | 25 | 0 | 7 |
| subtype4 | 2 | 21 | 35 | 1 | 9 |
Figure S168. Get High-res Image Clustering Approach #5: 'RNAseq CNMF subtypes' versus Clinical Feature #14: 'NEOPLASM_HISTOLOGIC_GRADE'
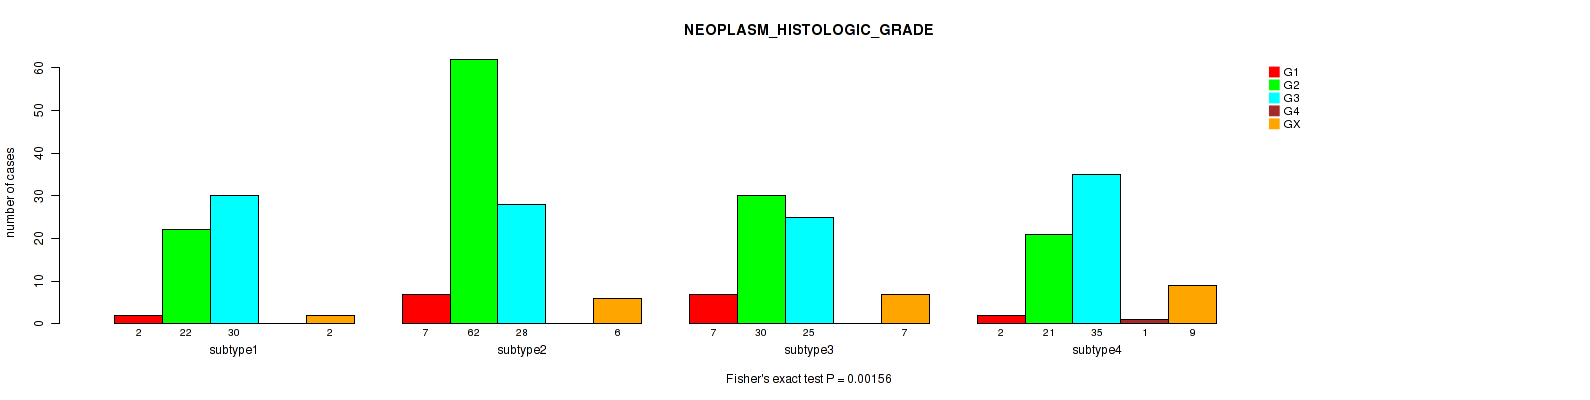
P value = 0.855 (Kruskal-Wallis (anova)), Q value = 0.94
Table S174. Clustering Approach #5: 'RNAseq CNMF subtypes' versus Clinical Feature #15: 'TOBACCO_SMOKING_YEAR_STOPPED'
| nPatients | Mean (Std.Dev) | |
|---|---|---|
| ALL | 43 | 1999.7 (13.6) |
| subtype1 | 7 | 1999.1 (12.7) |
| subtype2 | 17 | 1997.5 (16.6) |
| subtype3 | 11 | 2001.5 (12.6) |
| subtype4 | 8 | 2002.2 (9.9) |
Figure S169. Get High-res Image Clustering Approach #5: 'RNAseq CNMF subtypes' versus Clinical Feature #15: 'TOBACCO_SMOKING_YEAR_STOPPED'
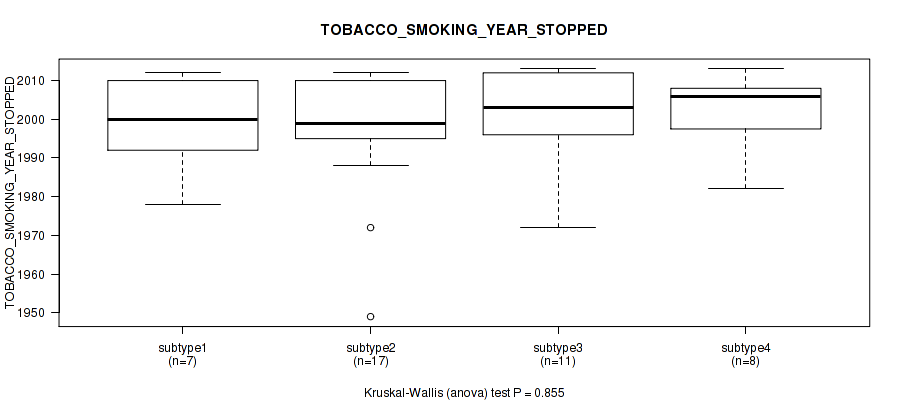
P value = 0.145 (Kruskal-Wallis (anova)), Q value = 0.47
Table S175. Clustering Approach #5: 'RNAseq CNMF subtypes' versus Clinical Feature #16: 'TOBACCO_SMOKING_PACK_YEARS_SMOKED'
| nPatients | Mean (Std.Dev) | |
|---|---|---|
| ALL | 93 | 17.4 (14.1) |
| subtype1 | 17 | 20.5 (15.7) |
| subtype2 | 38 | 20.7 (16.0) |
| subtype3 | 17 | 12.3 (10.6) |
| subtype4 | 21 | 13.0 (9.3) |
Figure S170. Get High-res Image Clustering Approach #5: 'RNAseq CNMF subtypes' versus Clinical Feature #16: 'TOBACCO_SMOKING_PACK_YEARS_SMOKED'
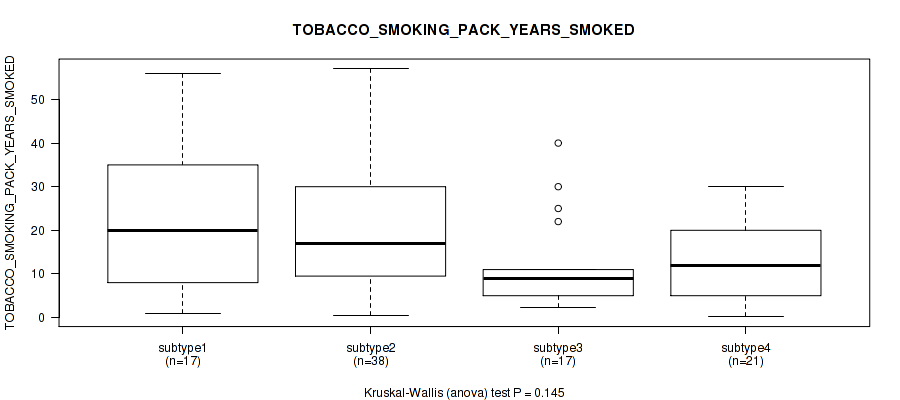
P value = 0.397 (Fisher's exact test), Q value = 0.71
Table S176. Clustering Approach #5: 'RNAseq CNMF subtypes' versus Clinical Feature #17: 'TOBACCO_SMOKING_HISTORY'
| nPatients | CURRENT REFORMED SMOKER FOR < OR = 15 YEARS | CURRENT REFORMED SMOKER FOR > 15 YEARS | CURRENT REFORMED SMOKER, DURATION NOT SPECIFIED | CURRENT SMOKER | LIFELONG NON-SMOKER |
|---|---|---|---|---|---|
| ALL | 40 | 9 | 4 | 64 | 144 |
| subtype1 | 7 | 3 | 1 | 14 | 22 |
| subtype2 | 14 | 5 | 2 | 25 | 48 |
| subtype3 | 11 | 1 | 0 | 9 | 39 |
| subtype4 | 8 | 0 | 1 | 16 | 35 |
Figure S171. Get High-res Image Clustering Approach #5: 'RNAseq CNMF subtypes' versus Clinical Feature #17: 'TOBACCO_SMOKING_HISTORY'
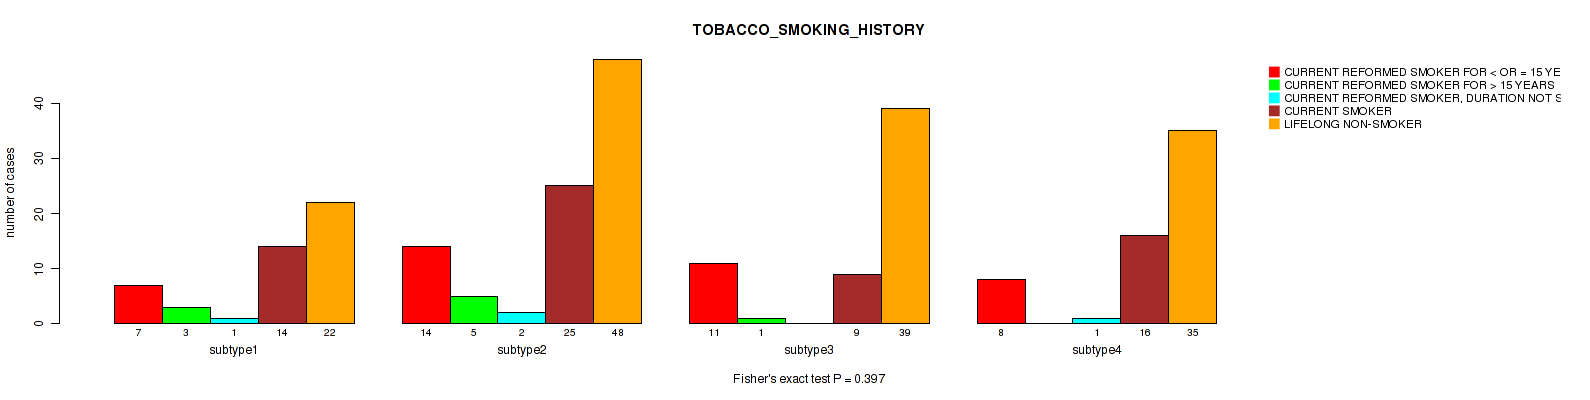
P value = 0.431 (Kruskal-Wallis (anova)), Q value = 0.73
Table S177. Clustering Approach #5: 'RNAseq CNMF subtypes' versus Clinical Feature #18: 'AGEBEGANSMOKINGINYEARS'
| nPatients | Mean (Std.Dev) | |
|---|---|---|
| ALL | 85 | 21.1 (7.7) |
| subtype1 | 15 | 22.9 (7.9) |
| subtype2 | 37 | 21.6 (8.3) |
| subtype3 | 15 | 19.9 (4.4) |
| subtype4 | 18 | 19.7 (8.5) |
Figure S172. Get High-res Image Clustering Approach #5: 'RNAseq CNMF subtypes' versus Clinical Feature #18: 'AGEBEGANSMOKINGINYEARS'
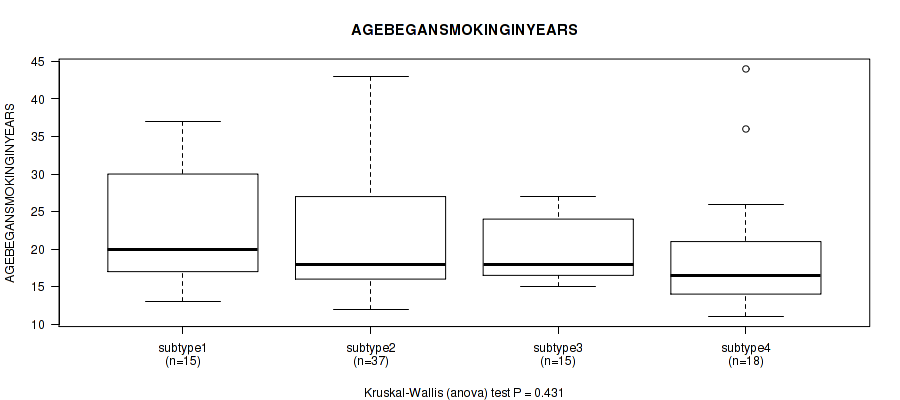
P value = 0.735 (Fisher's exact test), Q value = 0.87
Table S178. Clustering Approach #5: 'RNAseq CNMF subtypes' versus Clinical Feature #19: 'RADIATION_THERAPY_STATUS'
| nPatients | COMPLETED AS PLANNED | TREATMENT NOT COMPLETED |
|---|---|---|
| ALL | 29 | 3 |
| subtype1 | 7 | 0 |
| subtype2 | 10 | 1 |
| subtype3 | 4 | 0 |
| subtype4 | 8 | 2 |
Figure S173. Get High-res Image Clustering Approach #5: 'RNAseq CNMF subtypes' versus Clinical Feature #19: 'RADIATION_THERAPY_STATUS'
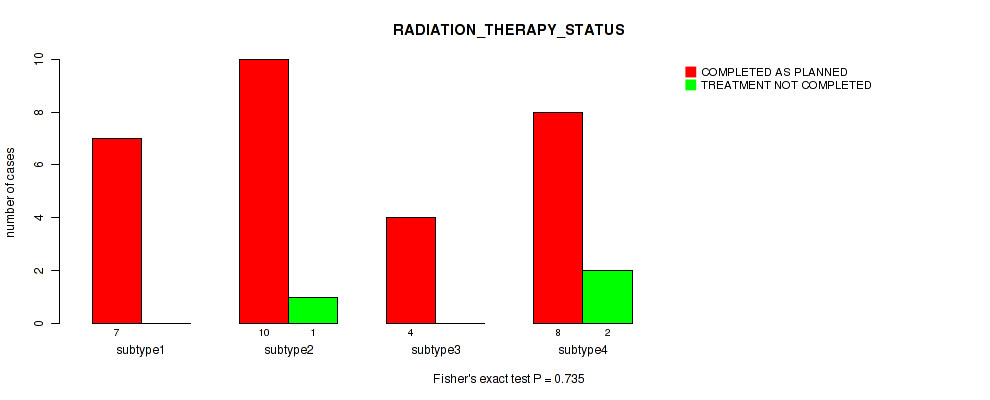
P value = 0.0401 (Kruskal-Wallis (anova)), Q value = 0.25
Table S179. Clustering Approach #5: 'RNAseq CNMF subtypes' versus Clinical Feature #20: 'PREGNANCIES_COUNT_TOTAL'
| nPatients | Mean (Std.Dev) | |
|---|---|---|
| ALL | 264 | 3.6 (2.6) |
| subtype1 | 49 | 3.6 (2.6) |
| subtype2 | 92 | 4.1 (2.7) |
| subtype3 | 61 | 3.0 (2.1) |
| subtype4 | 62 | 3.7 (2.8) |
Figure S174. Get High-res Image Clustering Approach #5: 'RNAseq CNMF subtypes' versus Clinical Feature #20: 'PREGNANCIES_COUNT_TOTAL'
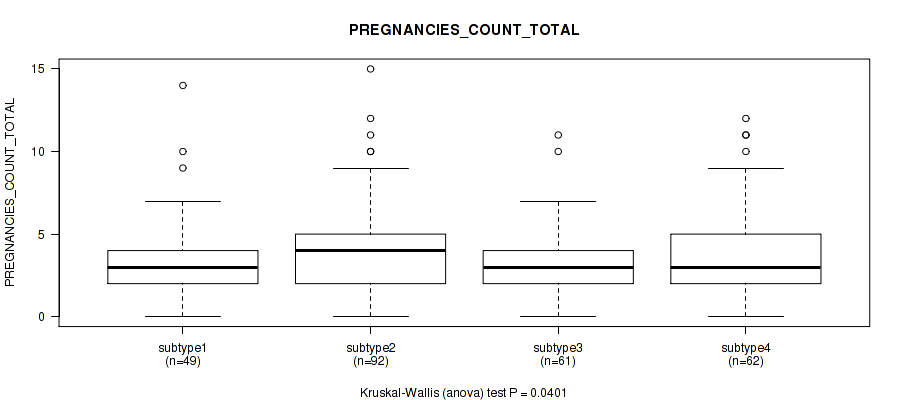
P value = 0.164 (Kruskal-Wallis (anova)), Q value = 0.49
Table S180. Clustering Approach #5: 'RNAseq CNMF subtypes' versus Clinical Feature #21: 'PREGNANCIES_COUNT_STILLBIRTH'
| nPatients | Mean (Std.Dev) | |
|---|---|---|
| ALL | 112 | 0.1 (0.3) |
| subtype1 | 18 | 0.0 (0.0) |
| subtype2 | 46 | 0.2 (0.5) |
| subtype3 | 26 | 0.0 (0.2) |
| subtype4 | 22 | 0.0 (0.0) |
Figure S175. Get High-res Image Clustering Approach #5: 'RNAseq CNMF subtypes' versus Clinical Feature #21: 'PREGNANCIES_COUNT_STILLBIRTH'

P value = 0.815 (Kruskal-Wallis (anova)), Q value = 0.92
Table S181. Clustering Approach #5: 'RNAseq CNMF subtypes' versus Clinical Feature #22: 'PREGNANCY_SPONTANEOUS_ABORTION_COUNT'
| nPatients | Mean (Std.Dev) | |
|---|---|---|
| ALL | 147 | 0.5 (0.9) |
| subtype1 | 23 | 0.5 (1.1) |
| subtype2 | 63 | 0.5 (1.0) |
| subtype3 | 28 | 0.5 (0.8) |
| subtype4 | 33 | 0.6 (0.9) |
Figure S176. Get High-res Image Clustering Approach #5: 'RNAseq CNMF subtypes' versus Clinical Feature #22: 'PREGNANCY_SPONTANEOUS_ABORTION_COUNT'
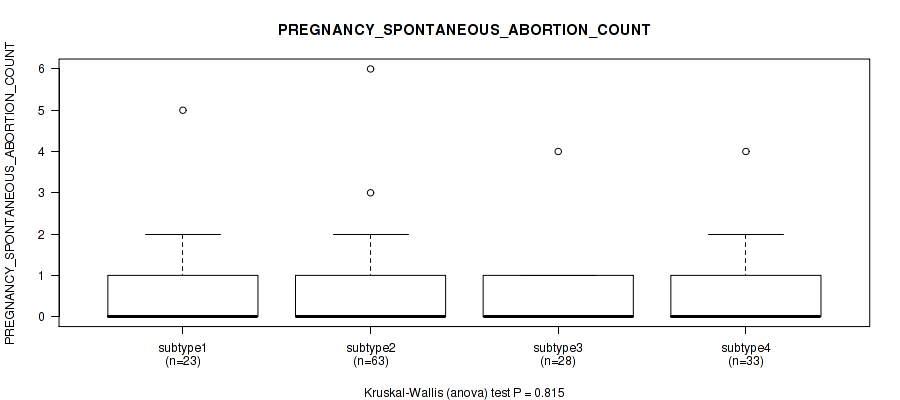
P value = 0.0499 (Kruskal-Wallis (anova)), Q value = 0.28
Table S182. Clustering Approach #5: 'RNAseq CNMF subtypes' versus Clinical Feature #23: 'PREGNANCIES_COUNT_LIVE_BIRTH'
| nPatients | Mean (Std.Dev) | |
|---|---|---|
| ALL | 260 | 2.9 (2.1) |
| subtype1 | 49 | 2.7 (2.0) |
| subtype2 | 91 | 3.0 (1.8) |
| subtype3 | 59 | 2.4 (2.1) |
| subtype4 | 61 | 3.1 (2.4) |
Figure S177. Get High-res Image Clustering Approach #5: 'RNAseq CNMF subtypes' versus Clinical Feature #23: 'PREGNANCIES_COUNT_LIVE_BIRTH'
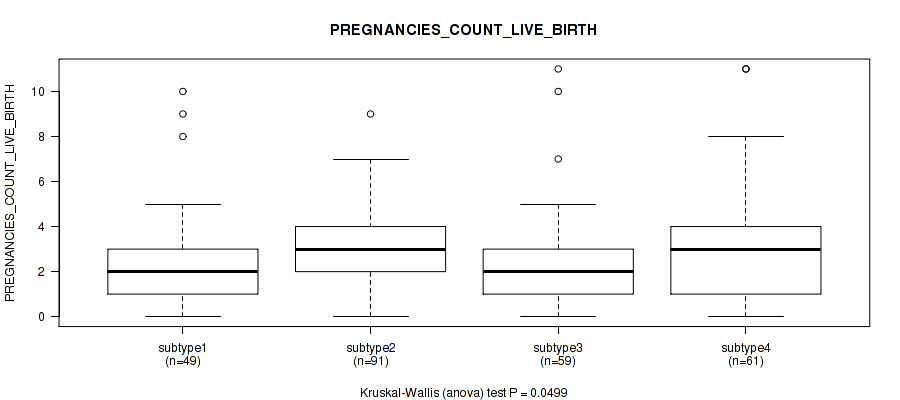
P value = 0.792 (Kruskal-Wallis (anova)), Q value = 0.92
Table S183. Clustering Approach #5: 'RNAseq CNMF subtypes' versus Clinical Feature #24: 'PREGNANCY_THERAPEUTIC_ABORTION_COUNT'
| nPatients | Mean (Std.Dev) | |
|---|---|---|
| ALL | 122 | 0.9 (1.8) |
| subtype1 | 20 | 0.8 (1.4) |
| subtype2 | 51 | 1.2 (2.5) |
| subtype3 | 27 | 0.6 (0.8) |
| subtype4 | 24 | 0.5 (0.9) |
Figure S178. Get High-res Image Clustering Approach #5: 'RNAseq CNMF subtypes' versus Clinical Feature #24: 'PREGNANCY_THERAPEUTIC_ABORTION_COUNT'
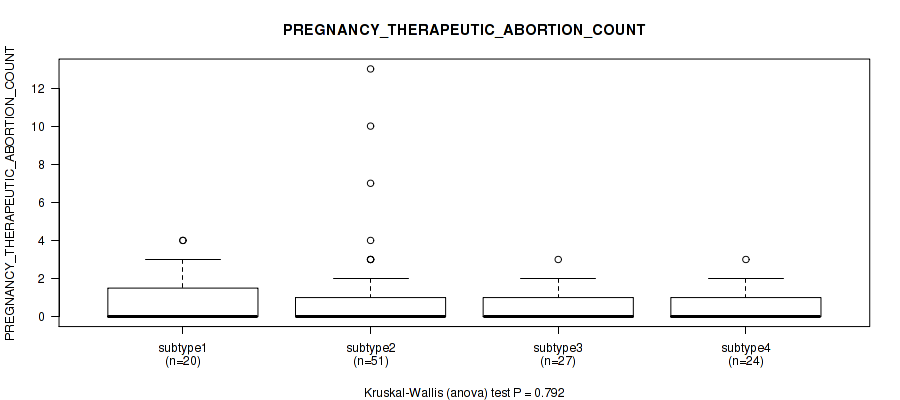
P value = 0.617 (Kruskal-Wallis (anova)), Q value = 0.82
Table S184. Clustering Approach #5: 'RNAseq CNMF subtypes' versus Clinical Feature #25: 'PREGNANCIES_COUNT_ECTOPIC'
| nPatients | Mean (Std.Dev) | |
|---|---|---|
| ALL | 116 | 0.1 (0.3) |
| subtype1 | 19 | 0.2 (0.4) |
| subtype2 | 49 | 0.1 (0.4) |
| subtype3 | 26 | 0.1 (0.3) |
| subtype4 | 22 | 0.0 (0.2) |
Figure S179. Get High-res Image Clustering Approach #5: 'RNAseq CNMF subtypes' versus Clinical Feature #25: 'PREGNANCIES_COUNT_ECTOPIC'
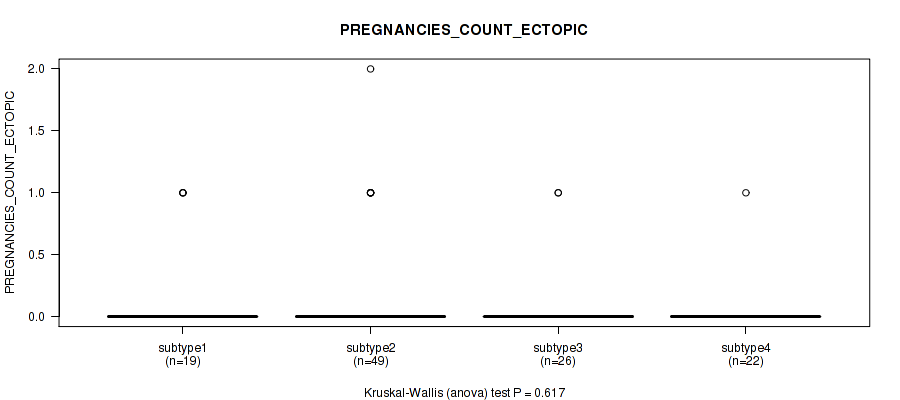
P value = 0.43 (Fisher's exact test), Q value = 0.73
Table S185. Clustering Approach #5: 'RNAseq CNMF subtypes' versus Clinical Feature #26: 'POS_LYMPH_NODE_LOCATION'
| nPatients | MACROSCOPIC PARAMETRIAL INVOLVEMENT | MICROSCOPIC PARAMETRIAL INVOLVEMENT | OTHER LOCATION, SPECIFY | POSITIVE BLADDER MARGIN | POSITIVE VAGINAL MARGIN |
|---|---|---|---|---|---|
| ALL | 3 | 8 | 40 | 1 | 10 |
| subtype1 | 2 | 1 | 4 | 0 | 3 |
| subtype2 | 0 | 2 | 17 | 1 | 4 |
| subtype3 | 1 | 2 | 10 | 0 | 2 |
| subtype4 | 0 | 3 | 9 | 0 | 1 |
Figure S180. Get High-res Image Clustering Approach #5: 'RNAseq CNMF subtypes' versus Clinical Feature #26: 'POS_LYMPH_NODE_LOCATION'
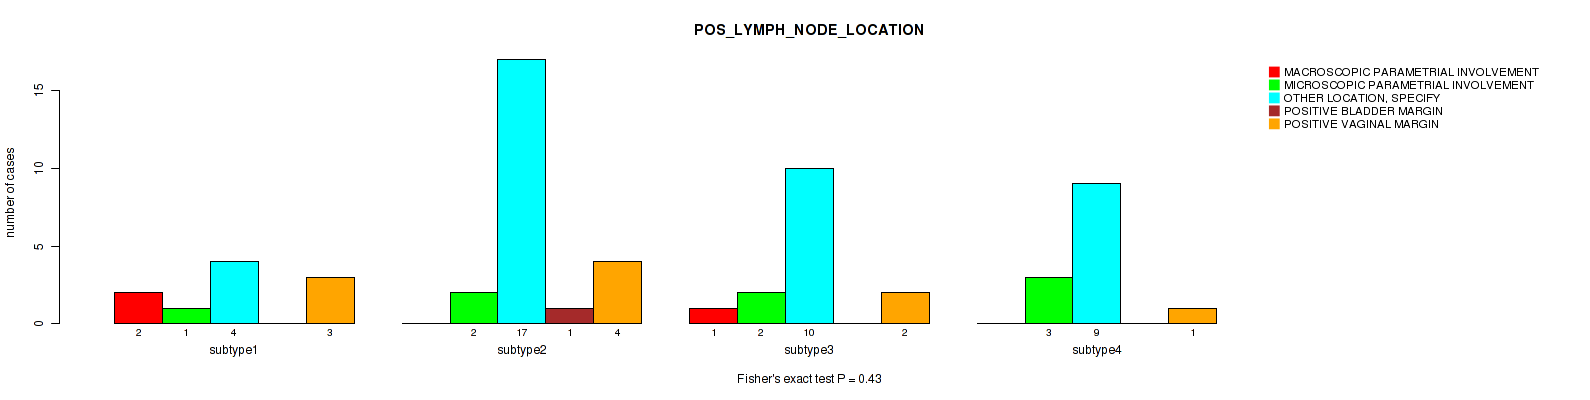
P value = 0.0243 (Fisher's exact test), Q value = 0.19
Table S186. Clustering Approach #5: 'RNAseq CNMF subtypes' versus Clinical Feature #27: 'MENOPAUSE_STATUS'
| nPatients | INDETERMINATE (NEITHER PRE OR POSTMENOPAUSAL) | PERI (6-12 MONTHS SINCE LAST MENSTRUAL PERIOD) | POST (PRIOR BILATERAL OVARIECTOMY OR >12 MO SINCE LMP WITH NO PRIOR HYSTERECTOMY) | PRE (<6 MONTHS SINCE LMP AND NO PRIOR BILATERAL OVARIECTOMY AND NOT ON ESTROGEN REPLACEMENT) |
|---|---|---|---|---|
| ALL | 2 | 25 | 82 | 124 |
| subtype1 | 0 | 6 | 21 | 21 |
| subtype2 | 2 | 8 | 35 | 38 |
| subtype3 | 0 | 7 | 19 | 30 |
| subtype4 | 0 | 4 | 7 | 35 |
Figure S181. Get High-res Image Clustering Approach #5: 'RNAseq CNMF subtypes' versus Clinical Feature #27: 'MENOPAUSE_STATUS'
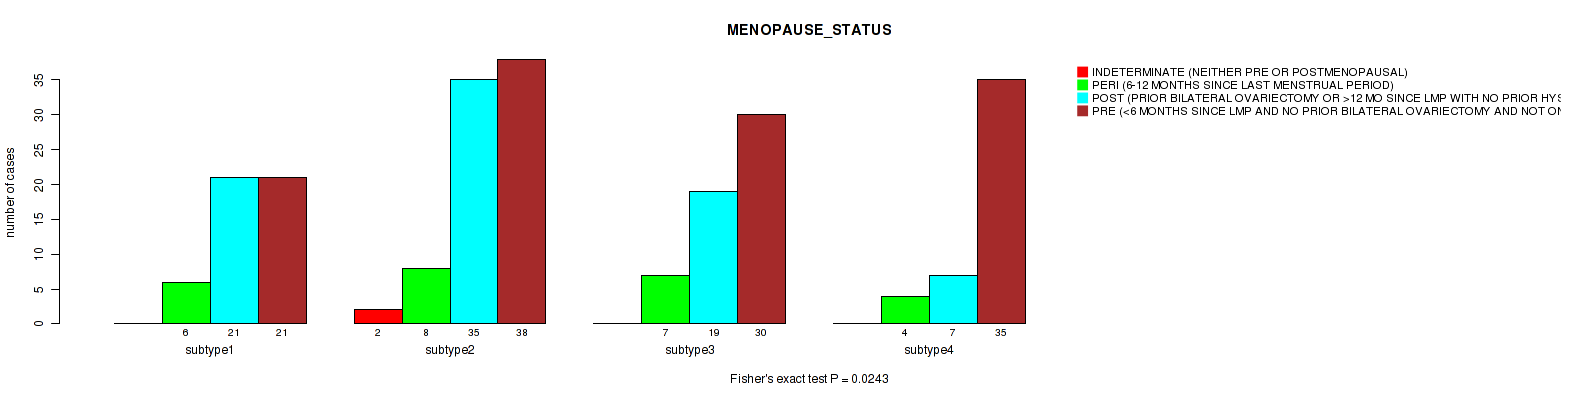
P value = 0.639 (Fisher's exact test), Q value = 0.83
Table S187. Clustering Approach #5: 'RNAseq CNMF subtypes' versus Clinical Feature #28: 'LYMPHOVASCULAR_INVOLVEMENT'
| nPatients | ABSENT | PRESENT |
|---|---|---|
| ALL | 71 | 79 |
| subtype1 | 13 | 19 |
| subtype2 | 26 | 29 |
| subtype3 | 18 | 21 |
| subtype4 | 14 | 10 |
Figure S182. Get High-res Image Clustering Approach #5: 'RNAseq CNMF subtypes' versus Clinical Feature #28: 'LYMPHOVASCULAR_INVOLVEMENT'
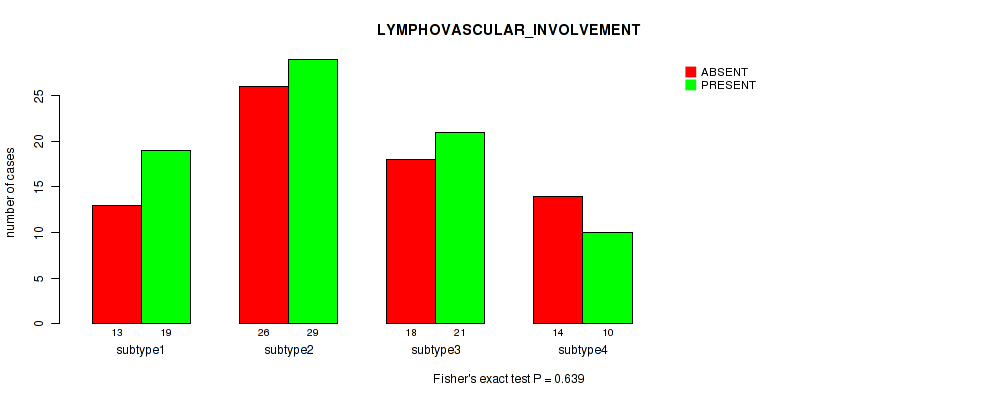
P value = 0.0109 (Kruskal-Wallis (anova)), Q value = 0.14
Table S188. Clustering Approach #5: 'RNAseq CNMF subtypes' versus Clinical Feature #29: 'LYMPH_NODES_EXAMINED_HE_COUNT'
| nPatients | Mean (Std.Dev) | |
|---|---|---|
| ALL | 159 | 1.0 (2.4) |
| subtype1 | 28 | 1.4 (3.1) |
| subtype2 | 60 | 1.4 (2.3) |
| subtype3 | 44 | 0.8 (2.7) |
| subtype4 | 27 | 0.3 (0.6) |
Figure S183. Get High-res Image Clustering Approach #5: 'RNAseq CNMF subtypes' versus Clinical Feature #29: 'LYMPH_NODES_EXAMINED_HE_COUNT'
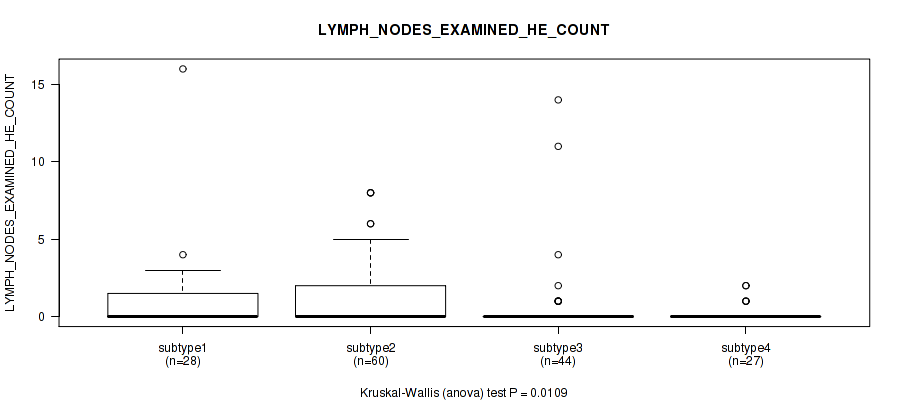
P value = 0.114 (Kruskal-Wallis (anova)), Q value = 0.46
Table S189. Clustering Approach #5: 'RNAseq CNMF subtypes' versus Clinical Feature #30: 'LYMPH_NODES_EXAMINED'
| nPatients | Mean (Std.Dev) | |
|---|---|---|
| ALL | 178 | 22.4 (12.6) |
| subtype1 | 33 | 18.5 (11.6) |
| subtype2 | 63 | 23.0 (14.6) |
| subtype3 | 49 | 24.0 (11.1) |
| subtype4 | 33 | 22.6 (11.2) |
Figure S184. Get High-res Image Clustering Approach #5: 'RNAseq CNMF subtypes' versus Clinical Feature #30: 'LYMPH_NODES_EXAMINED'
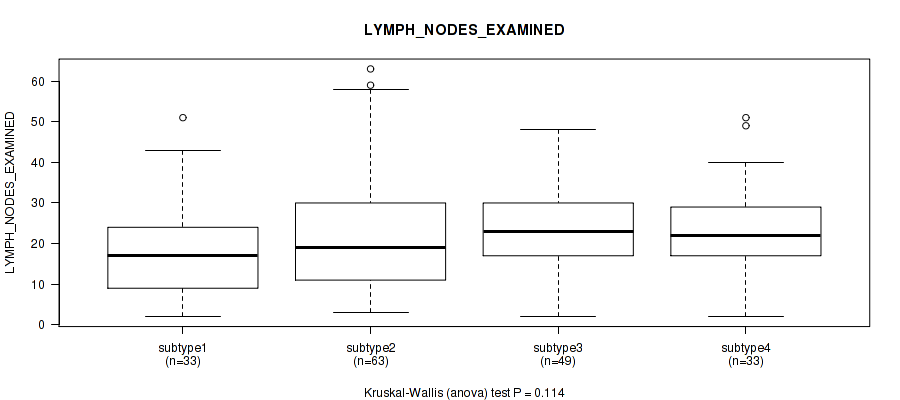
P value = 0.0275 (Fisher's exact test), Q value = 0.2
Table S190. Clustering Approach #5: 'RNAseq CNMF subtypes' versus Clinical Feature #31: 'KERATINIZATION_SQUAMOUS_CELL'
| nPatients | KERATINIZING SQUAMOUS CELL CARCINOMA | NON-KERATINIZING SQUAMOUS CELL CARCINOMA |
|---|---|---|
| ALL | 55 | 119 |
| subtype1 | 15 | 21 |
| subtype2 | 21 | 54 |
| subtype3 | 1 | 16 |
| subtype4 | 18 | 28 |
Figure S185. Get High-res Image Clustering Approach #5: 'RNAseq CNMF subtypes' versus Clinical Feature #31: 'KERATINIZATION_SQUAMOUS_CELL'
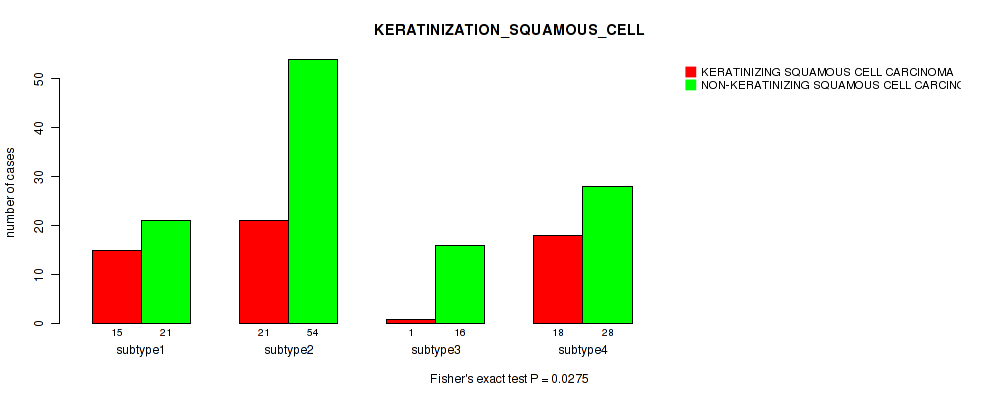
P value = 0.266 (Kruskal-Wallis (anova)), Q value = 0.59
Table S191. Clustering Approach #5: 'RNAseq CNMF subtypes' versus Clinical Feature #32: 'INITIAL_PATHOLOGIC_DX_YEAR'
| nPatients | Mean (Std.Dev) | |
|---|---|---|
| ALL | 302 | 2008.3 (4.8) |
| subtype1 | 58 | 2009.2 (4.0) |
| subtype2 | 104 | 2008.1 (5.4) |
| subtype3 | 68 | 2008.7 (4.1) |
| subtype4 | 72 | 2007.6 (4.9) |
Figure S186. Get High-res Image Clustering Approach #5: 'RNAseq CNMF subtypes' versus Clinical Feature #32: 'INITIAL_PATHOLOGIC_DX_YEAR'
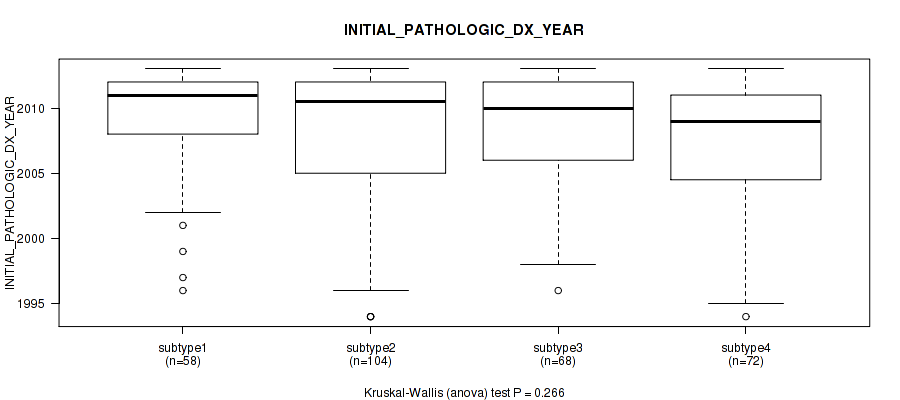
P value = 0.11 (Fisher's exact test), Q value = 0.45
Table S192. Clustering Approach #5: 'RNAseq CNMF subtypes' versus Clinical Feature #33: 'HISTORY_HORMONAL_CONTRACEPTIVES_USE'
| nPatients | CURRENT USER | FORMER USER | NEVER USED |
|---|---|---|---|
| ALL | 15 | 53 | 89 |
| subtype1 | 0 | 12 | 20 |
| subtype2 | 3 | 15 | 31 |
| subtype3 | 8 | 15 | 18 |
| subtype4 | 4 | 11 | 20 |
Figure S187. Get High-res Image Clustering Approach #5: 'RNAseq CNMF subtypes' versus Clinical Feature #33: 'HISTORY_HORMONAL_CONTRACEPTIVES_USE'
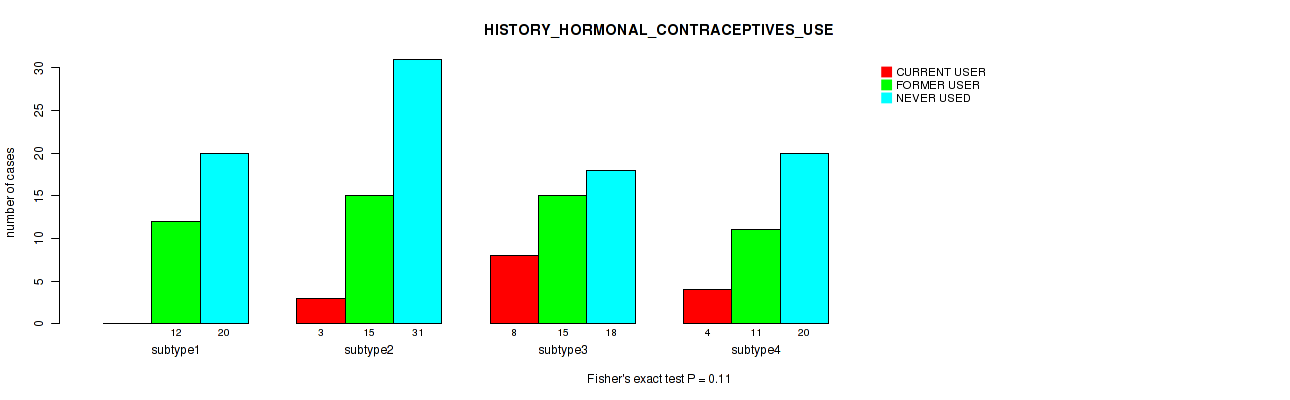
P value = 0.369 (Kruskal-Wallis (anova)), Q value = 0.69
Table S193. Clustering Approach #5: 'RNAseq CNMF subtypes' versus Clinical Feature #34: 'HEIGHT_CM_AT_DIAGNOSIS'
| nPatients | Mean (Std.Dev) | |
|---|---|---|
| ALL | 261 | 161.0 (7.1) |
| subtype1 | 50 | 159.8 (6.7) |
| subtype2 | 89 | 160.4 (7.3) |
| subtype3 | 61 | 162.2 (7.3) |
| subtype4 | 61 | 161.6 (6.9) |
Figure S188. Get High-res Image Clustering Approach #5: 'RNAseq CNMF subtypes' versus Clinical Feature #34: 'HEIGHT_CM_AT_DIAGNOSIS'
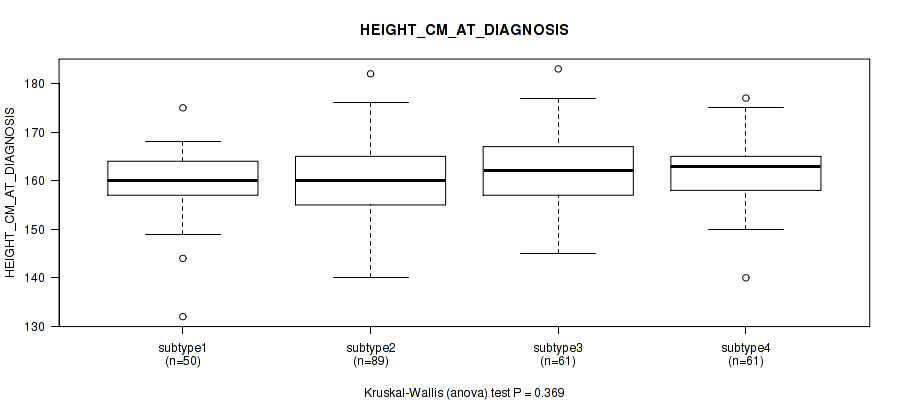
P value = 0.055 (Fisher's exact test), Q value = 0.29
Table S194. Clustering Approach #5: 'RNAseq CNMF subtypes' versus Clinical Feature #35: 'CORPUS_INVOLVEMENT'
| nPatients | ABSENT | PRESENT |
|---|---|---|
| ALL | 99 | 19 |
| subtype1 | 18 | 5 |
| subtype2 | 32 | 10 |
| subtype3 | 28 | 4 |
| subtype4 | 21 | 0 |
Figure S189. Get High-res Image Clustering Approach #5: 'RNAseq CNMF subtypes' versus Clinical Feature #35: 'CORPUS_INVOLVEMENT'
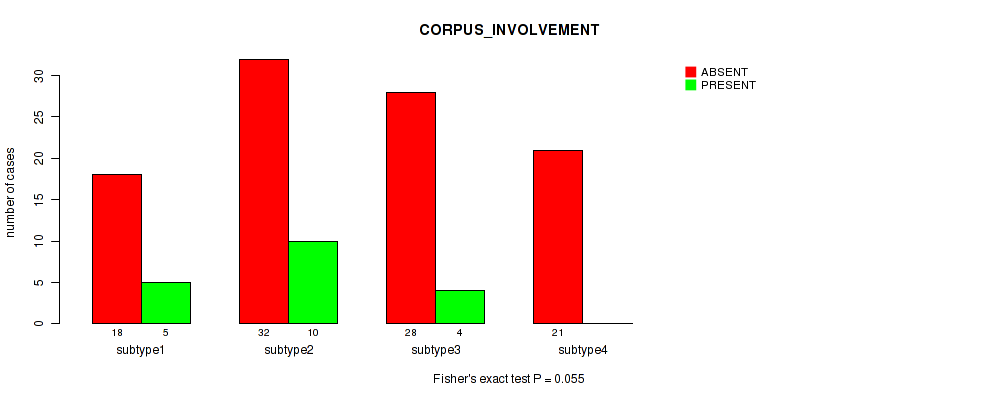
P value = 0.397 (Fisher's exact test), Q value = 0.71
Table S195. Clustering Approach #5: 'RNAseq CNMF subtypes' versus Clinical Feature #36: 'CHEMO_CONCURRENT_TYPE'
| nPatients | CARBOPLATIN | CISPLATIN | OTHER |
|---|---|---|---|
| ALL | 7 | 102 | 2 |
| subtype1 | 3 | 16 | 0 |
| subtype2 | 2 | 34 | 0 |
| subtype3 | 1 | 20 | 1 |
| subtype4 | 1 | 32 | 1 |
Figure S190. Get High-res Image Clustering Approach #5: 'RNAseq CNMF subtypes' versus Clinical Feature #36: 'CHEMO_CONCURRENT_TYPE'
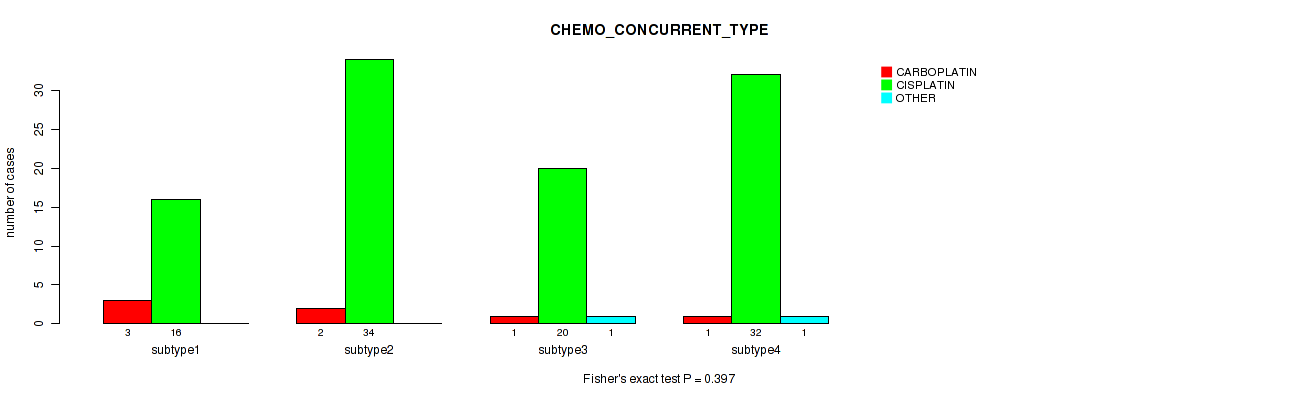
P value = 0.231 (Kruskal-Wallis (anova)), Q value = 0.55
Table S196. Clustering Approach #5: 'RNAseq CNMF subtypes' versus Clinical Feature #37: 'CERVIX_SUV_RESULTS'
| nPatients | Mean (Std.Dev) | |
|---|---|---|
| ALL | 17 | 13.2 (7.2) |
| subtype1 | 3 | 13.4 (1.3) |
| subtype2 | 9 | 11.7 (8.4) |
| subtype3 | 1 | 7.1 (NA) |
| subtype4 | 4 | 18.0 (6.0) |
Figure S191. Get High-res Image Clustering Approach #5: 'RNAseq CNMF subtypes' versus Clinical Feature #37: 'CERVIX_SUV_RESULTS'
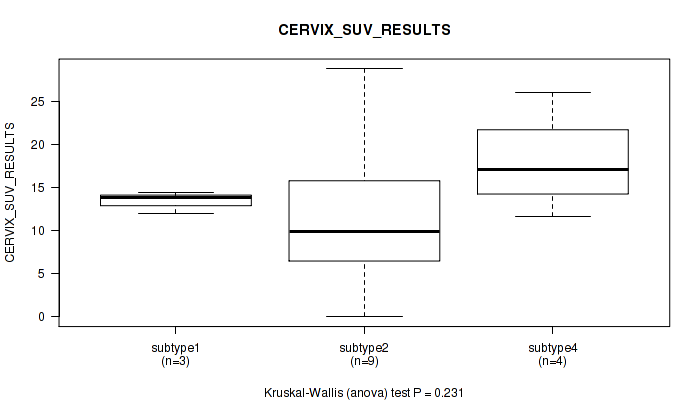
P value = 1.58e-05 (Kruskal-Wallis (anova)), Q value = 0.00062
Table S197. Clustering Approach #5: 'RNAseq CNMF subtypes' versus Clinical Feature #38: 'AGE_AT_DIAGNOSIS'
| nPatients | Mean (Std.Dev) | |
|---|---|---|
| ALL | 304 | 48.2 (13.8) |
| subtype1 | 58 | 53.4 (12.7) |
| subtype2 | 105 | 50.8 (14.8) |
| subtype3 | 69 | 46.2 (12.1) |
| subtype4 | 72 | 42.3 (12.5) |
Figure S192. Get High-res Image Clustering Approach #5: 'RNAseq CNMF subtypes' versus Clinical Feature #38: 'AGE_AT_DIAGNOSIS'
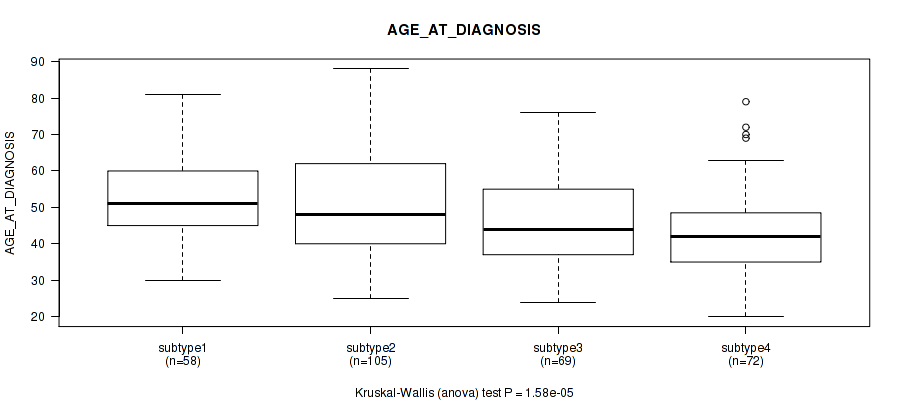
P value = 0.0688 (Fisher's exact test), Q value = 0.34
Table S198. Clustering Approach #5: 'RNAseq CNMF subtypes' versus Clinical Feature #39: 'CLINICAL_STAGE'
| nPatients | STAGE I | STAGE IA | STAGE IA1 | STAGE IA2 | STAGE IB | STAGE IB1 | STAGE IB2 | STAGE II | STAGE IIA | STAGE IIA1 | STAGE IIA2 | STAGE IIB | STAGE III | STAGE IIIA | STAGE IIIB | STAGE IVA | STAGE IVB |
|---|---|---|---|---|---|---|---|---|---|---|---|---|---|---|---|---|---|
| ALL | 5 | 1 | 1 | 1 | 38 | 77 | 39 | 5 | 9 | 5 | 7 | 43 | 1 | 2 | 42 | 9 | 12 |
| subtype1 | 1 | 1 | 1 | 0 | 5 | 13 | 8 | 1 | 1 | 1 | 4 | 6 | 0 | 1 | 9 | 2 | 3 |
| subtype2 | 1 | 0 | 0 | 1 | 15 | 22 | 10 | 4 | 2 | 2 | 2 | 13 | 1 | 0 | 19 | 4 | 5 |
| subtype3 | 1 | 0 | 0 | 0 | 5 | 31 | 10 | 0 | 2 | 0 | 0 | 10 | 0 | 0 | 5 | 1 | 3 |
| subtype4 | 2 | 0 | 0 | 0 | 13 | 11 | 11 | 0 | 4 | 2 | 1 | 14 | 0 | 1 | 9 | 2 | 1 |
Figure S193. Get High-res Image Clustering Approach #5: 'RNAseq CNMF subtypes' versus Clinical Feature #39: 'CLINICAL_STAGE'

Table S199. Description of clustering approach #6: 'RNAseq cHierClus subtypes'
| Cluster Labels | 1 | 2 | 3 |
|---|---|---|---|
| Number of samples | 72 | 195 | 37 |
P value = 0.0258 (logrank test), Q value = 0.2
Table S200. Clustering Approach #6: 'RNAseq cHierClus subtypes' versus Clinical Feature #1: 'Time to Death'
| nPatients | nDeath | Duration Range (Median), Month | |
|---|---|---|---|
| ALL | 287 | 71 | 0.0 - 210.7 (23.8) |
| subtype1 | 70 | 17 | 0.4 - 137.2 (20.6) |
| subtype2 | 182 | 41 | 0.1 - 210.7 (24.8) |
| subtype3 | 35 | 13 | 0.0 - 99.9 (17.2) |
Figure S194. Get High-res Image Clustering Approach #6: 'RNAseq cHierClus subtypes' versus Clinical Feature #1: 'Time to Death'
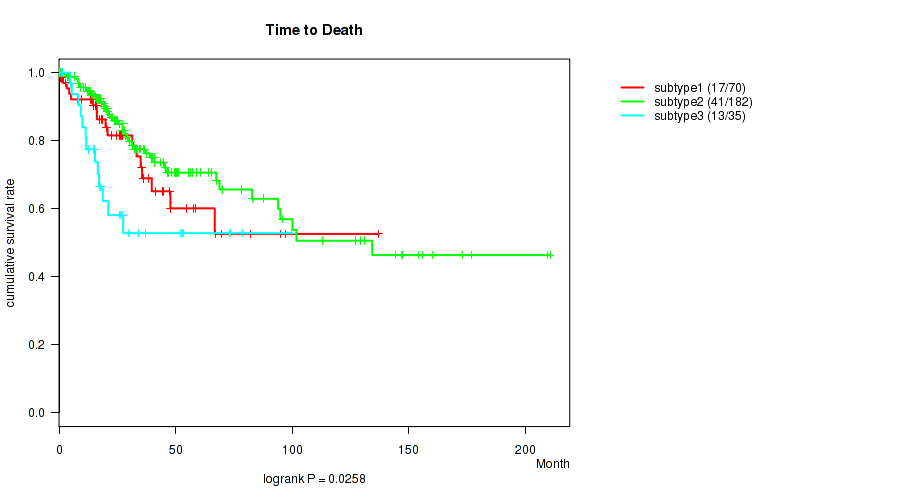
P value = 0.00802 (Kruskal-Wallis (anova)), Q value = 0.11
Table S201. Clustering Approach #6: 'RNAseq cHierClus subtypes' versus Clinical Feature #2: 'YEARS_TO_BIRTH'
| nPatients | Mean (Std.Dev) | |
|---|---|---|
| ALL | 302 | 48.2 (13.9) |
| subtype1 | 72 | 47.6 (11.6) |
| subtype2 | 193 | 49.7 (14.5) |
| subtype3 | 37 | 41.4 (12.7) |
Figure S195. Get High-res Image Clustering Approach #6: 'RNAseq cHierClus subtypes' versus Clinical Feature #2: 'YEARS_TO_BIRTH'

P value = 0.705 (Fisher's exact test), Q value = 0.85
Table S202. Clustering Approach #6: 'RNAseq cHierClus subtypes' versus Clinical Feature #3: 'PATHOLOGY_T_STAGE'
| nPatients | T1 | T2 | T3 | T4 |
|---|---|---|---|---|
| ALL | 140 | 71 | 20 | 10 |
| subtype1 | 39 | 20 | 3 | 2 |
| subtype2 | 86 | 42 | 16 | 8 |
| subtype3 | 15 | 9 | 1 | 0 |
Figure S196. Get High-res Image Clustering Approach #6: 'RNAseq cHierClus subtypes' versus Clinical Feature #3: 'PATHOLOGY_T_STAGE'
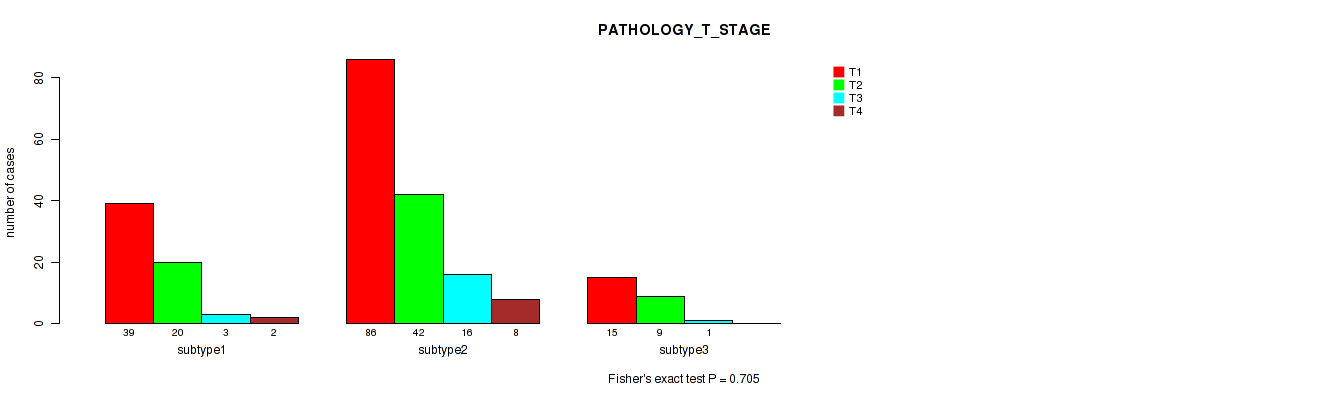
P value = 0.351 (Fisher's exact test), Q value = 0.67
Table S203. Clustering Approach #6: 'RNAseq cHierClus subtypes' versus Clinical Feature #4: 'PATHOLOGY_N_STAGE'
| nPatients | 0 | 1 |
|---|---|---|
| ALL | 133 | 60 |
| subtype1 | 38 | 13 |
| subtype2 | 78 | 42 |
| subtype3 | 17 | 5 |
Figure S197. Get High-res Image Clustering Approach #6: 'RNAseq cHierClus subtypes' versus Clinical Feature #4: 'PATHOLOGY_N_STAGE'
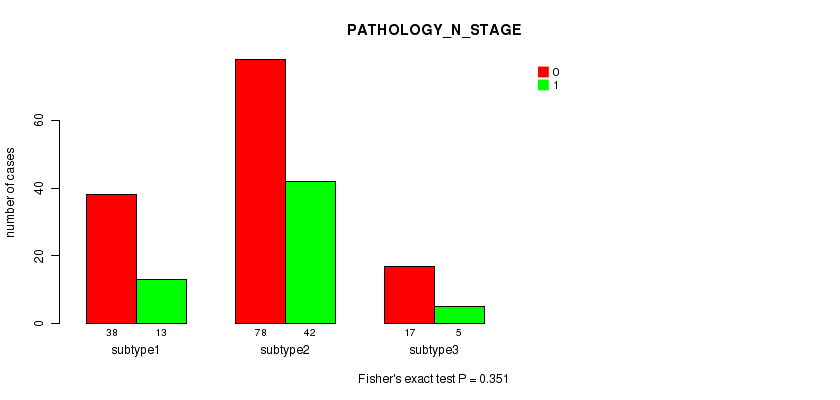
P value = 0.0512 (Fisher's exact test), Q value = 0.28
Table S204. Clustering Approach #6: 'RNAseq cHierClus subtypes' versus Clinical Feature #5: 'PATHOLOGY_M_STAGE'
| nPatients | 0 | 1 |
|---|---|---|
| ALL | 116 | 10 |
| subtype1 | 27 | 5 |
| subtype2 | 77 | 3 |
| subtype3 | 12 | 2 |
Figure S198. Get High-res Image Clustering Approach #6: 'RNAseq cHierClus subtypes' versus Clinical Feature #5: 'PATHOLOGY_M_STAGE'
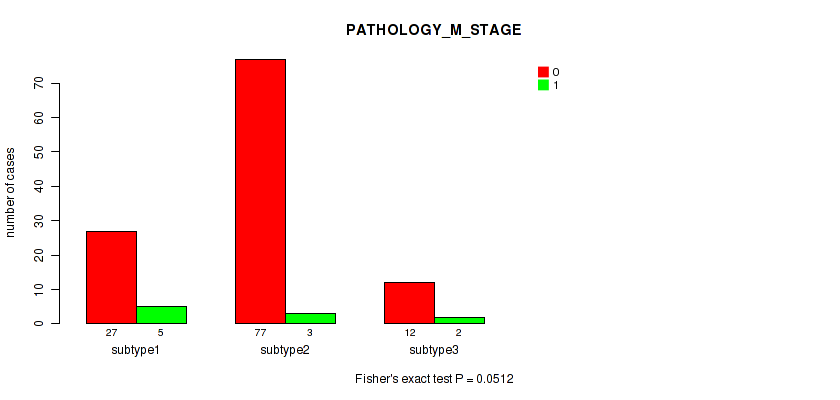
P value = 0.917 (Fisher's exact test), Q value = 0.96
Table S205. Clustering Approach #6: 'RNAseq cHierClus subtypes' versus Clinical Feature #6: 'RADIATION_THERAPY'
| nPatients | NO | YES |
|---|---|---|
| ALL | 57 | 125 |
| subtype1 | 14 | 33 |
| subtype2 | 37 | 77 |
| subtype3 | 6 | 15 |
Figure S199. Get High-res Image Clustering Approach #6: 'RNAseq cHierClus subtypes' versus Clinical Feature #6: 'RADIATION_THERAPY'
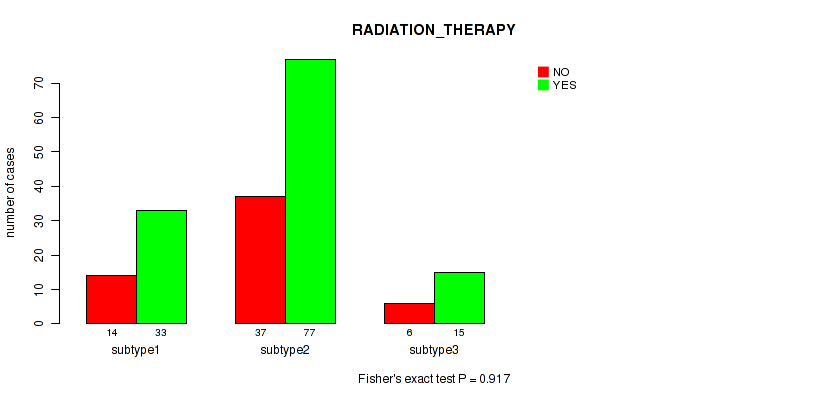
P value = 1e-05 (Fisher's exact test), Q value = 0.00044
Table S206. Clustering Approach #6: 'RNAseq cHierClus subtypes' versus Clinical Feature #7: 'HISTOLOGICAL_TYPE'
| nPatients | ADENOSQUAMOUS | CERVICAL SQUAMOUS CELL CARCINOMA | ENDOCERVICAL ADENOCARCINOMA OF THE USUAL TYPE | ENDOCERVICAL TYPE OF ADENOCARCINOMA | ENDOMETRIOID ADENOCARCINOMA OF ENDOCERVIX | MUCINOUS ADENOCARCINOMA OF ENDOCERVICAL TYPE |
|---|---|---|---|---|---|---|
| ALL | 5 | 252 | 6 | 21 | 3 | 17 |
| subtype1 | 5 | 22 | 5 | 21 | 3 | 16 |
| subtype2 | 0 | 193 | 1 | 0 | 0 | 1 |
| subtype3 | 0 | 37 | 0 | 0 | 0 | 0 |
Figure S200. Get High-res Image Clustering Approach #6: 'RNAseq cHierClus subtypes' versus Clinical Feature #7: 'HISTOLOGICAL_TYPE'
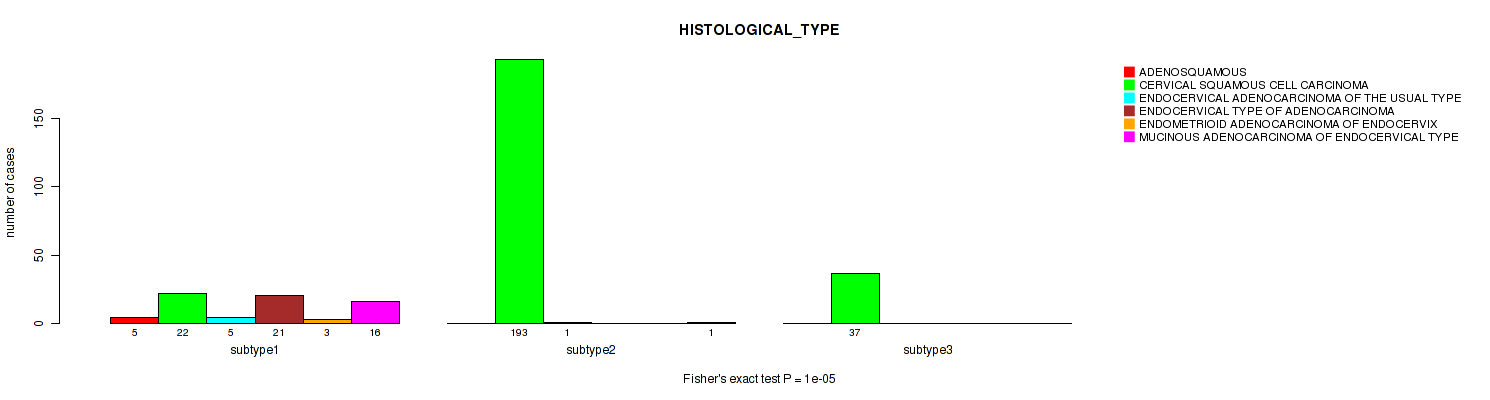
P value = 0.437 (Kruskal-Wallis (anova)), Q value = 0.73
Table S207. Clustering Approach #6: 'RNAseq cHierClus subtypes' versus Clinical Feature #8: 'NUMBER_PACK_YEARS_SMOKED'
| nPatients | Mean (Std.Dev) | |
|---|---|---|
| ALL | 93 | 17.4 (14.1) |
| subtype1 | 18 | 14.2 (12.0) |
| subtype2 | 63 | 19.0 (15.2) |
| subtype3 | 12 | 13.8 (9.9) |
Figure S201. Get High-res Image Clustering Approach #6: 'RNAseq cHierClus subtypes' versus Clinical Feature #8: 'NUMBER_PACK_YEARS_SMOKED'
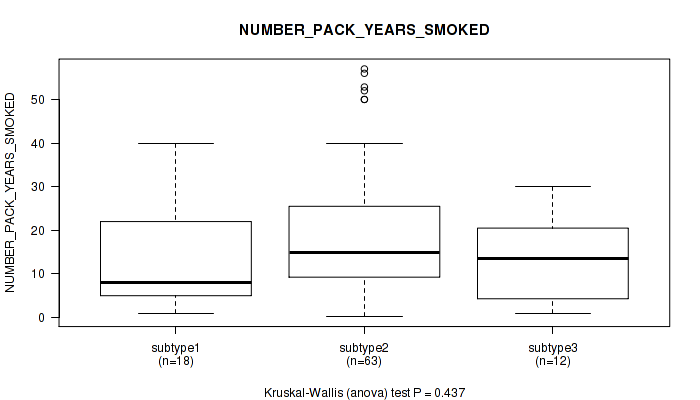
P value = 0.0308 (Kruskal-Wallis (anova)), Q value = 0.21
Table S208. Clustering Approach #6: 'RNAseq cHierClus subtypes' versus Clinical Feature #9: 'NUMBER_OF_LYMPH_NODES'
| nPatients | Mean (Std.Dev) | |
|---|---|---|
| ALL | 159 | 1.0 (2.4) |
| subtype1 | 44 | 0.7 (2.2) |
| subtype2 | 97 | 1.4 (2.6) |
| subtype3 | 18 | 0.2 (0.5) |
Figure S202. Get High-res Image Clustering Approach #6: 'RNAseq cHierClus subtypes' versus Clinical Feature #9: 'NUMBER_OF_LYMPH_NODES'
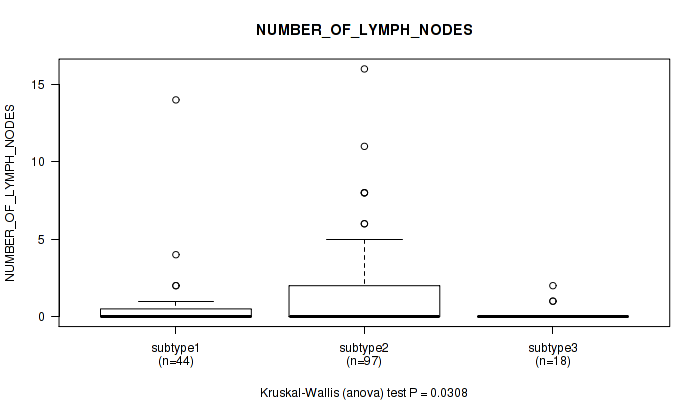
P value = 0.307 (Fisher's exact test), Q value = 0.64
Table S209. Clustering Approach #6: 'RNAseq cHierClus subtypes' versus Clinical Feature #10: 'RACE'
| nPatients | AMERICAN INDIAN OR ALASKA NATIVE | ASIAN | BLACK OR AFRICAN AMERICAN | NATIVE HAWAIIAN OR OTHER PACIFIC ISLANDER | WHITE |
|---|---|---|---|---|---|
| ALL | 7 | 20 | 30 | 2 | 209 |
| subtype1 | 1 | 6 | 3 | 0 | 53 |
| subtype2 | 4 | 13 | 20 | 2 | 130 |
| subtype3 | 2 | 1 | 7 | 0 | 26 |
Figure S203. Get High-res Image Clustering Approach #6: 'RNAseq cHierClus subtypes' versus Clinical Feature #10: 'RACE'
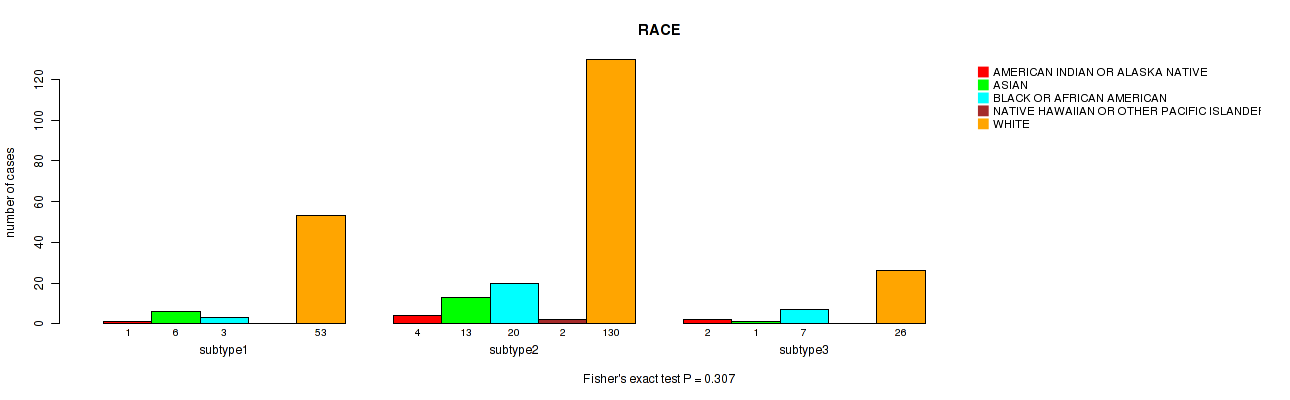
P value = 0.895 (Fisher's exact test), Q value = 0.96
Table S210. Clustering Approach #6: 'RNAseq cHierClus subtypes' versus Clinical Feature #11: 'ETHNICITY'
| nPatients | HISPANIC OR LATINO | NOT HISPANIC OR LATINO |
|---|---|---|
| ALL | 24 | 168 |
| subtype1 | 6 | 38 |
| subtype2 | 16 | 108 |
| subtype3 | 2 | 22 |
Figure S204. Get High-res Image Clustering Approach #6: 'RNAseq cHierClus subtypes' versus Clinical Feature #11: 'ETHNICITY'
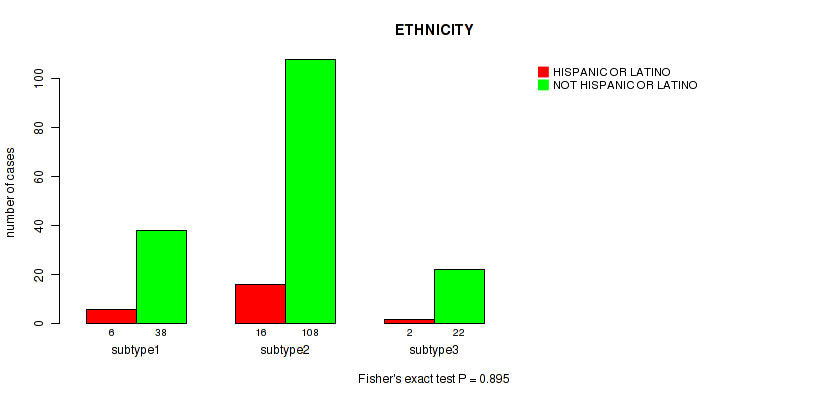
P value = 0.677 (Kruskal-Wallis (anova)), Q value = 0.84
Table S211. Clustering Approach #6: 'RNAseq cHierClus subtypes' versus Clinical Feature #12: 'WEIGHT_KG_AT_DIAGNOSIS'
| nPatients | Mean (Std.Dev) | |
|---|---|---|
| ALL | 275 | 72.9 (21.5) |
| subtype1 | 66 | 72.5 (17.0) |
| subtype2 | 177 | 72.9 (23.6) |
| subtype3 | 32 | 73.6 (17.6) |
Figure S205. Get High-res Image Clustering Approach #6: 'RNAseq cHierClus subtypes' versus Clinical Feature #12: 'WEIGHT_KG_AT_DIAGNOSIS'
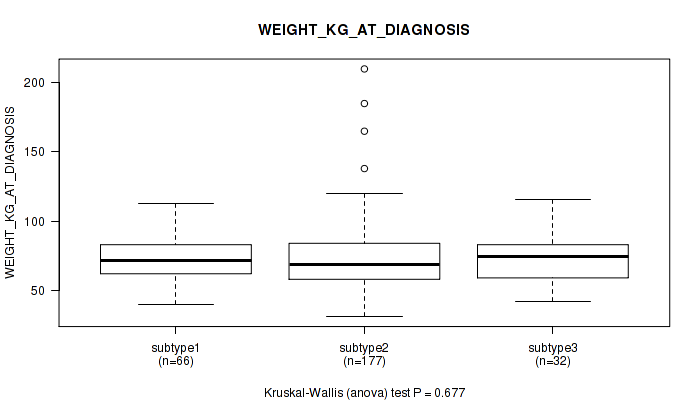
P value = 0.274 (Fisher's exact test), Q value = 0.59
Table S212. Clustering Approach #6: 'RNAseq cHierClus subtypes' versus Clinical Feature #13: 'TUMOR_STATUS'
| nPatients | TUMOR FREE | WITH TUMOR |
|---|---|---|
| ALL | 189 | 78 |
| subtype1 | 42 | 22 |
| subtype2 | 126 | 44 |
| subtype3 | 21 | 12 |
Figure S206. Get High-res Image Clustering Approach #6: 'RNAseq cHierClus subtypes' versus Clinical Feature #13: 'TUMOR_STATUS'
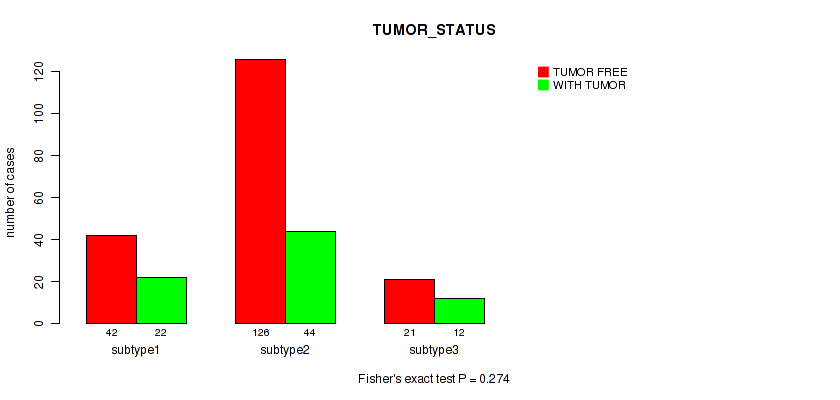
P value = 0.153 (Fisher's exact test), Q value = 0.48
Table S213. Clustering Approach #6: 'RNAseq cHierClus subtypes' versus Clinical Feature #14: 'NEOPLASM_HISTOLOGIC_GRADE'
| nPatients | G1 | G2 | G3 | G4 | GX |
|---|---|---|---|---|---|
| ALL | 18 | 135 | 118 | 1 | 24 |
| subtype1 | 7 | 30 | 29 | 0 | 6 |
| subtype2 | 10 | 93 | 69 | 0 | 16 |
| subtype3 | 1 | 12 | 20 | 1 | 2 |
Figure S207. Get High-res Image Clustering Approach #6: 'RNAseq cHierClus subtypes' versus Clinical Feature #14: 'NEOPLASM_HISTOLOGIC_GRADE'
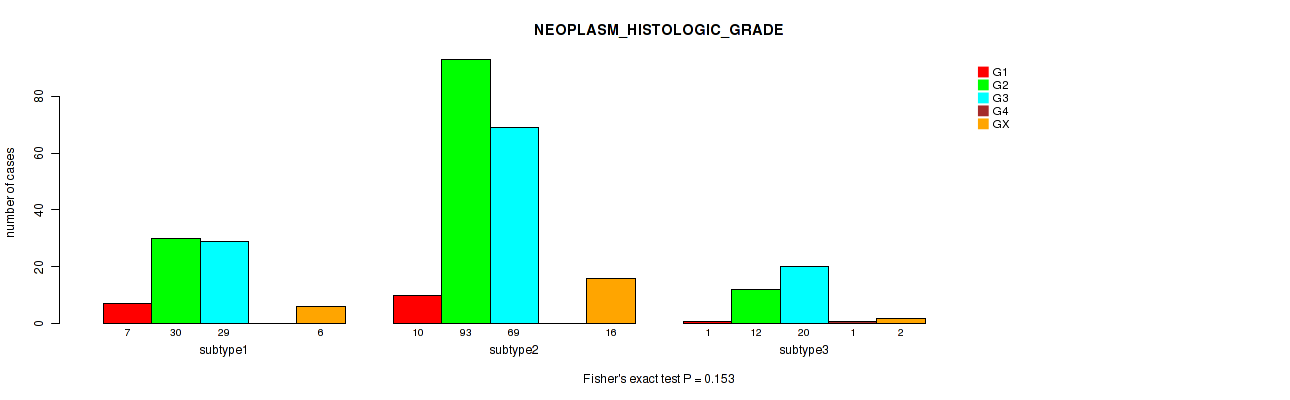
P value = 0.569 (Kruskal-Wallis (anova)), Q value = 0.78
Table S214. Clustering Approach #6: 'RNAseq cHierClus subtypes' versus Clinical Feature #15: 'TOBACCO_SMOKING_YEAR_STOPPED'
| nPatients | Mean (Std.Dev) | |
|---|---|---|
| ALL | 43 | 1999.7 (13.6) |
| subtype1 | 9 | 2002.1 (12.6) |
| subtype2 | 30 | 1999.1 (14.8) |
| subtype3 | 4 | 1999.0 (5.2) |
Figure S208. Get High-res Image Clustering Approach #6: 'RNAseq cHierClus subtypes' versus Clinical Feature #15: 'TOBACCO_SMOKING_YEAR_STOPPED'
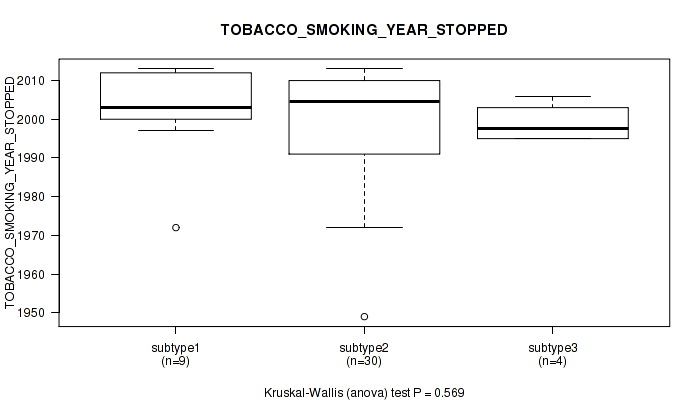
P value = 0.437 (Kruskal-Wallis (anova)), Q value = 0.73
Table S215. Clustering Approach #6: 'RNAseq cHierClus subtypes' versus Clinical Feature #16: 'TOBACCO_SMOKING_PACK_YEARS_SMOKED'
| nPatients | Mean (Std.Dev) | |
|---|---|---|
| ALL | 93 | 17.4 (14.1) |
| subtype1 | 18 | 14.2 (12.0) |
| subtype2 | 63 | 19.0 (15.2) |
| subtype3 | 12 | 13.8 (9.9) |
Figure S209. Get High-res Image Clustering Approach #6: 'RNAseq cHierClus subtypes' versus Clinical Feature #16: 'TOBACCO_SMOKING_PACK_YEARS_SMOKED'
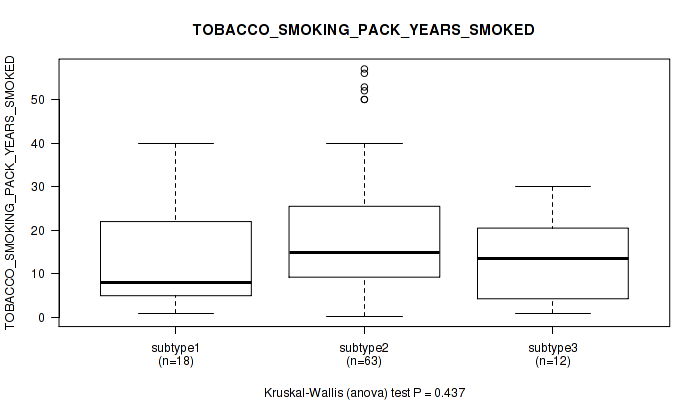
P value = 0.313 (Fisher's exact test), Q value = 0.64
Table S216. Clustering Approach #6: 'RNAseq cHierClus subtypes' versus Clinical Feature #17: 'TOBACCO_SMOKING_HISTORY'
| nPatients | CURRENT REFORMED SMOKER FOR < OR = 15 YEARS | CURRENT REFORMED SMOKER FOR > 15 YEARS | CURRENT REFORMED SMOKER, DURATION NOT SPECIFIED | CURRENT SMOKER | LIFELONG NON-SMOKER |
|---|---|---|---|---|---|
| ALL | 40 | 9 | 4 | 64 | 144 |
| subtype1 | 9 | 1 | 0 | 11 | 44 |
| subtype2 | 27 | 8 | 3 | 43 | 85 |
| subtype3 | 4 | 0 | 1 | 10 | 15 |
Figure S210. Get High-res Image Clustering Approach #6: 'RNAseq cHierClus subtypes' versus Clinical Feature #17: 'TOBACCO_SMOKING_HISTORY'
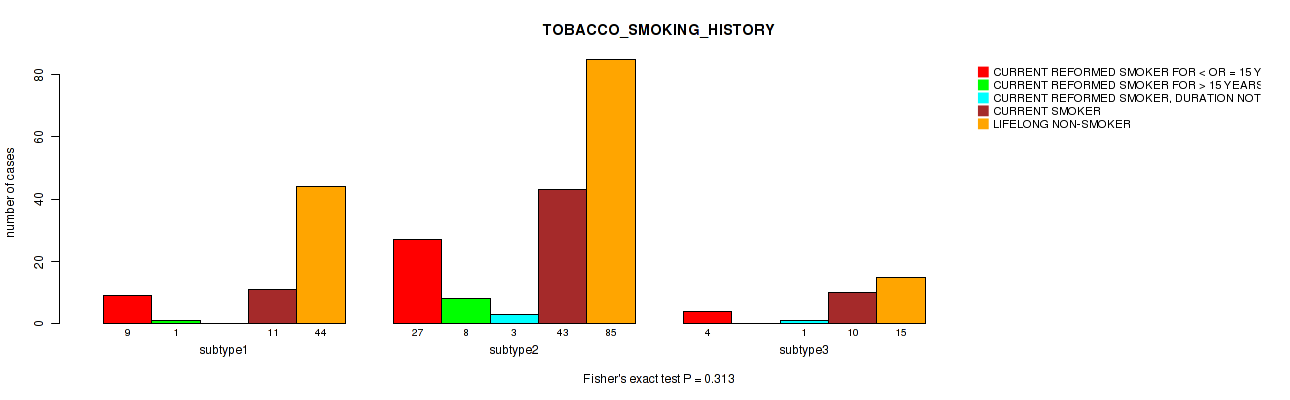
P value = 0.655 (Kruskal-Wallis (anova)), Q value = 0.83
Table S217. Clustering Approach #6: 'RNAseq cHierClus subtypes' versus Clinical Feature #18: 'AGEBEGANSMOKINGINYEARS'
| nPatients | Mean (Std.Dev) | |
|---|---|---|
| ALL | 85 | 21.1 (7.7) |
| subtype1 | 17 | 20.8 (5.7) |
| subtype2 | 56 | 21.5 (8.1) |
| subtype3 | 12 | 19.8 (8.3) |
Figure S211. Get High-res Image Clustering Approach #6: 'RNAseq cHierClus subtypes' versus Clinical Feature #18: 'AGEBEGANSMOKINGINYEARS'
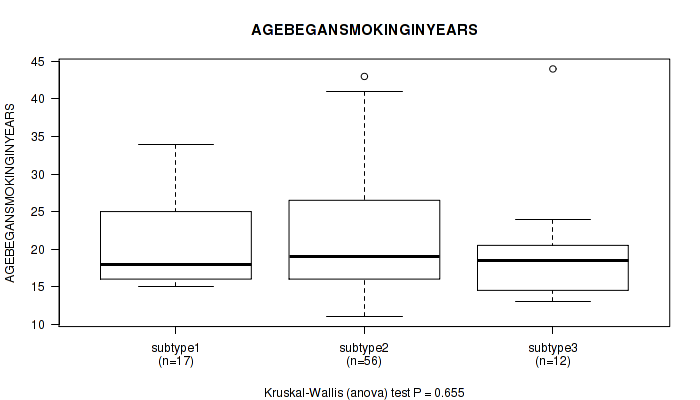
P value = 1 (Fisher's exact test), Q value = 1
Table S218. Clustering Approach #6: 'RNAseq cHierClus subtypes' versus Clinical Feature #19: 'RADIATION_THERAPY_STATUS'
| nPatients | COMPLETED AS PLANNED | TREATMENT NOT COMPLETED |
|---|---|---|
| ALL | 29 | 3 |
| subtype1 | 3 | 0 |
| subtype2 | 20 | 2 |
| subtype3 | 6 | 1 |
Figure S212. Get High-res Image Clustering Approach #6: 'RNAseq cHierClus subtypes' versus Clinical Feature #19: 'RADIATION_THERAPY_STATUS'
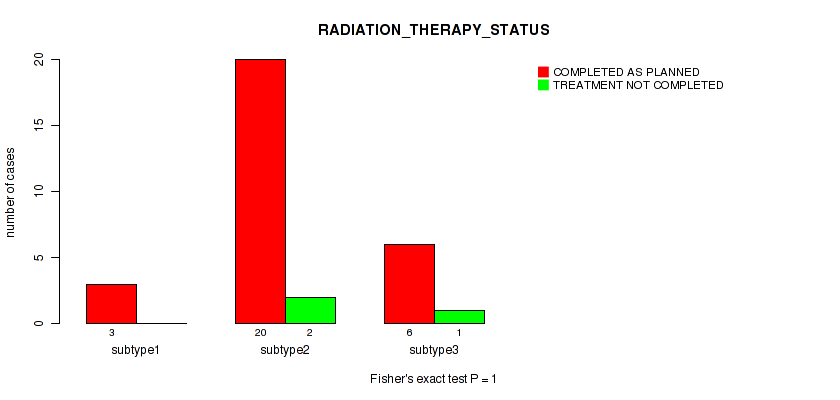
P value = 0.0475 (Kruskal-Wallis (anova)), Q value = 0.28
Table S219. Clustering Approach #6: 'RNAseq cHierClus subtypes' versus Clinical Feature #20: 'PREGNANCIES_COUNT_TOTAL'
| nPatients | Mean (Std.Dev) | |
|---|---|---|
| ALL | 264 | 3.6 (2.6) |
| subtype1 | 65 | 3.0 (2.0) |
| subtype2 | 167 | 3.8 (2.7) |
| subtype3 | 32 | 4.0 (2.8) |
Figure S213. Get High-res Image Clustering Approach #6: 'RNAseq cHierClus subtypes' versus Clinical Feature #20: 'PREGNANCIES_COUNT_TOTAL'
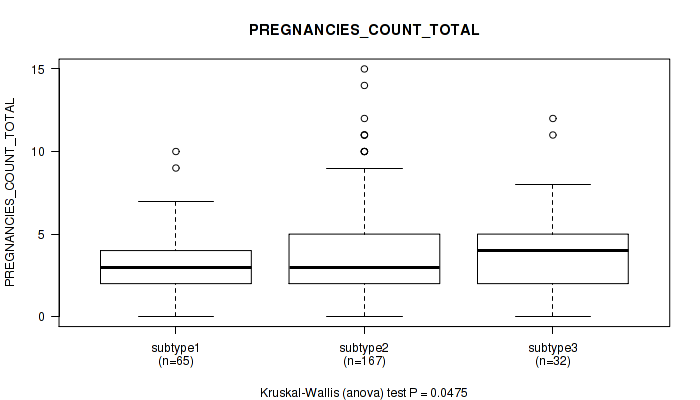
P value = 0.574 (Kruskal-Wallis (anova)), Q value = 0.78
Table S220. Clustering Approach #6: 'RNAseq cHierClus subtypes' versus Clinical Feature #21: 'PREGNANCIES_COUNT_STILLBIRTH'
| nPatients | Mean (Std.Dev) | |
|---|---|---|
| ALL | 112 | 0.1 (0.3) |
| subtype1 | 25 | 0.0 (0.2) |
| subtype2 | 74 | 0.1 (0.4) |
| subtype3 | 13 | 0.0 (0.0) |
Figure S214. Get High-res Image Clustering Approach #6: 'RNAseq cHierClus subtypes' versus Clinical Feature #21: 'PREGNANCIES_COUNT_STILLBIRTH'
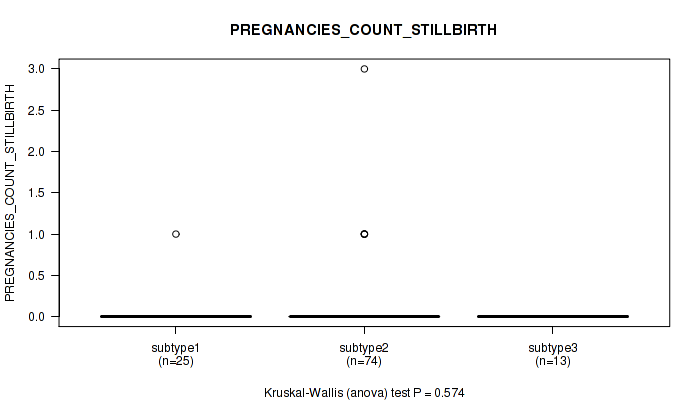
P value = 0.13 (Kruskal-Wallis (anova)), Q value = 0.47
Table S221. Clustering Approach #6: 'RNAseq cHierClus subtypes' versus Clinical Feature #22: 'PREGNANCY_SPONTANEOUS_ABORTION_COUNT'
| nPatients | Mean (Std.Dev) | |
|---|---|---|
| ALL | 147 | 0.5 (0.9) |
| subtype1 | 29 | 0.6 (0.9) |
| subtype2 | 98 | 0.5 (0.9) |
| subtype3 | 20 | 0.8 (1.1) |
Figure S215. Get High-res Image Clustering Approach #6: 'RNAseq cHierClus subtypes' versus Clinical Feature #22: 'PREGNANCY_SPONTANEOUS_ABORTION_COUNT'
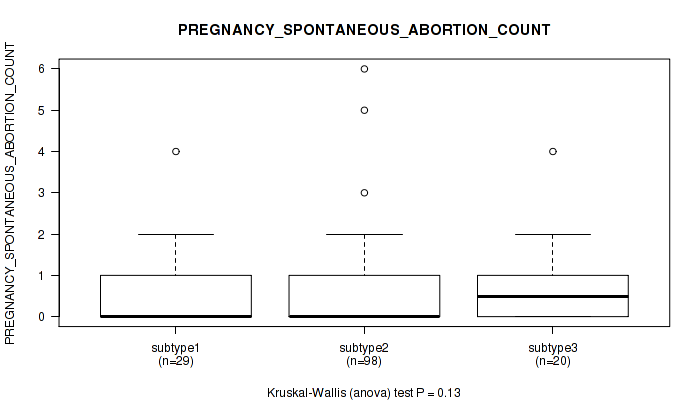
P value = 0.0188 (Kruskal-Wallis (anova)), Q value = 0.17
Table S222. Clustering Approach #6: 'RNAseq cHierClus subtypes' versus Clinical Feature #23: 'PREGNANCIES_COUNT_LIVE_BIRTH'
| nPatients | Mean (Std.Dev) | |
|---|---|---|
| ALL | 260 | 2.9 (2.1) |
| subtype1 | 63 | 2.3 (1.8) |
| subtype2 | 165 | 3.0 (2.0) |
| subtype3 | 32 | 3.2 (2.4) |
Figure S216. Get High-res Image Clustering Approach #6: 'RNAseq cHierClus subtypes' versus Clinical Feature #23: 'PREGNANCIES_COUNT_LIVE_BIRTH'
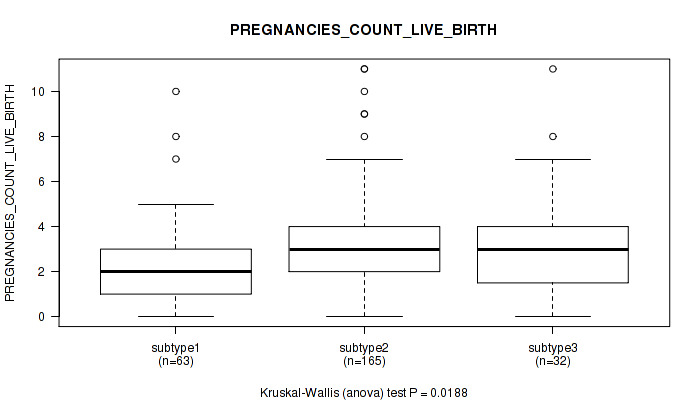
P value = 0.616 (Kruskal-Wallis (anova)), Q value = 0.82
Table S223. Clustering Approach #6: 'RNAseq cHierClus subtypes' versus Clinical Feature #24: 'PREGNANCY_THERAPEUTIC_ABORTION_COUNT'
| nPatients | Mean (Std.Dev) | |
|---|---|---|
| ALL | 122 | 0.9 (1.8) |
| subtype1 | 27 | 0.7 (1.0) |
| subtype2 | 80 | 0.9 (2.1) |
| subtype3 | 15 | 0.6 (1.0) |
Figure S217. Get High-res Image Clustering Approach #6: 'RNAseq cHierClus subtypes' versus Clinical Feature #24: 'PREGNANCY_THERAPEUTIC_ABORTION_COUNT'
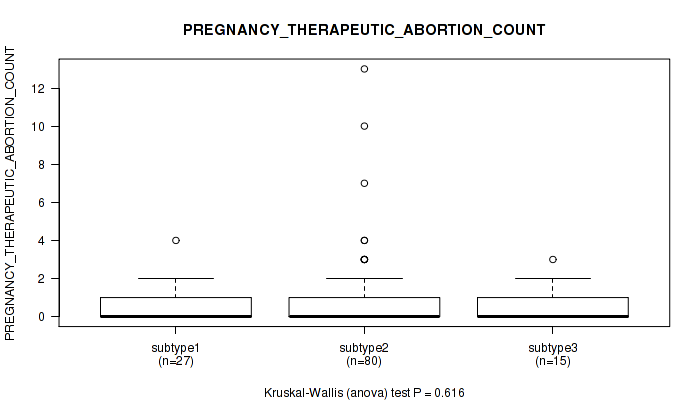
P value = 0.855 (Kruskal-Wallis (anova)), Q value = 0.94
Table S224. Clustering Approach #6: 'RNAseq cHierClus subtypes' versus Clinical Feature #25: 'PREGNANCIES_COUNT_ECTOPIC'
| nPatients | Mean (Std.Dev) | |
|---|---|---|
| ALL | 116 | 0.1 (0.3) |
| subtype1 | 24 | 0.1 (0.3) |
| subtype2 | 79 | 0.1 (0.4) |
| subtype3 | 13 | 0.1 (0.3) |
Figure S218. Get High-res Image Clustering Approach #6: 'RNAseq cHierClus subtypes' versus Clinical Feature #25: 'PREGNANCIES_COUNT_ECTOPIC'

P value = 0.76 (Fisher's exact test), Q value = 0.89
Table S225. Clustering Approach #6: 'RNAseq cHierClus subtypes' versus Clinical Feature #26: 'POS_LYMPH_NODE_LOCATION'
| nPatients | MACROSCOPIC PARAMETRIAL INVOLVEMENT | MICROSCOPIC PARAMETRIAL INVOLVEMENT | OTHER LOCATION, SPECIFY | POSITIVE BLADDER MARGIN | POSITIVE VAGINAL MARGIN |
|---|---|---|---|---|---|
| ALL | 3 | 8 | 40 | 1 | 10 |
| subtype1 | 2 | 1 | 9 | 0 | 2 |
| subtype2 | 1 | 5 | 26 | 1 | 7 |
| subtype3 | 0 | 2 | 5 | 0 | 1 |
Figure S219. Get High-res Image Clustering Approach #6: 'RNAseq cHierClus subtypes' versus Clinical Feature #26: 'POS_LYMPH_NODE_LOCATION'
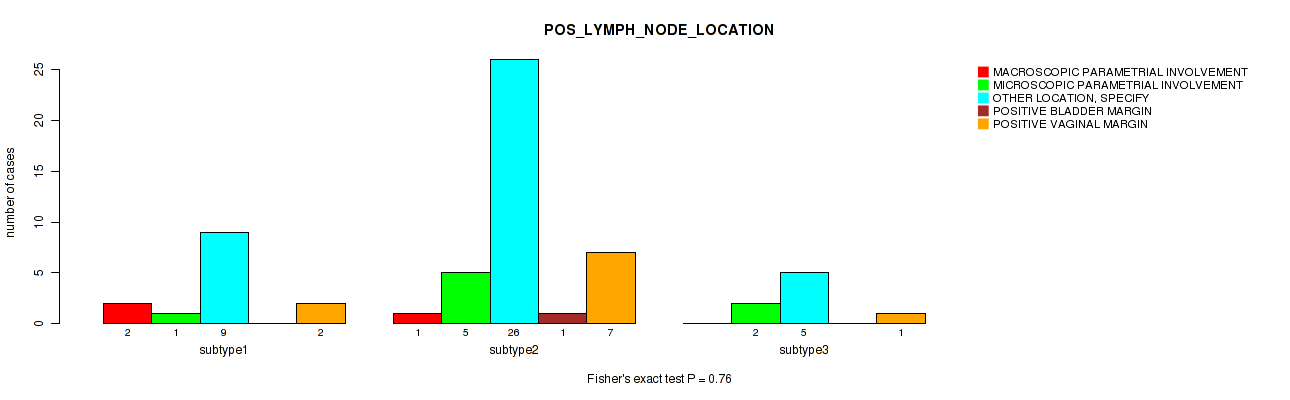
P value = 0.0463 (Fisher's exact test), Q value = 0.27
Table S226. Clustering Approach #6: 'RNAseq cHierClus subtypes' versus Clinical Feature #27: 'MENOPAUSE_STATUS'
| nPatients | INDETERMINATE (NEITHER PRE OR POSTMENOPAUSAL) | PERI (6-12 MONTHS SINCE LAST MENSTRUAL PERIOD) | POST (PRIOR BILATERAL OVARIECTOMY OR >12 MO SINCE LMP WITH NO PRIOR HYSTERECTOMY) | PRE (<6 MONTHS SINCE LMP AND NO PRIOR BILATERAL OVARIECTOMY AND NOT ON ESTROGEN REPLACEMENT) |
|---|---|---|---|---|
| ALL | 2 | 25 | 82 | 124 |
| subtype1 | 0 | 8 | 19 | 34 |
| subtype2 | 2 | 15 | 61 | 72 |
| subtype3 | 0 | 2 | 2 | 18 |
Figure S220. Get High-res Image Clustering Approach #6: 'RNAseq cHierClus subtypes' versus Clinical Feature #27: 'MENOPAUSE_STATUS'
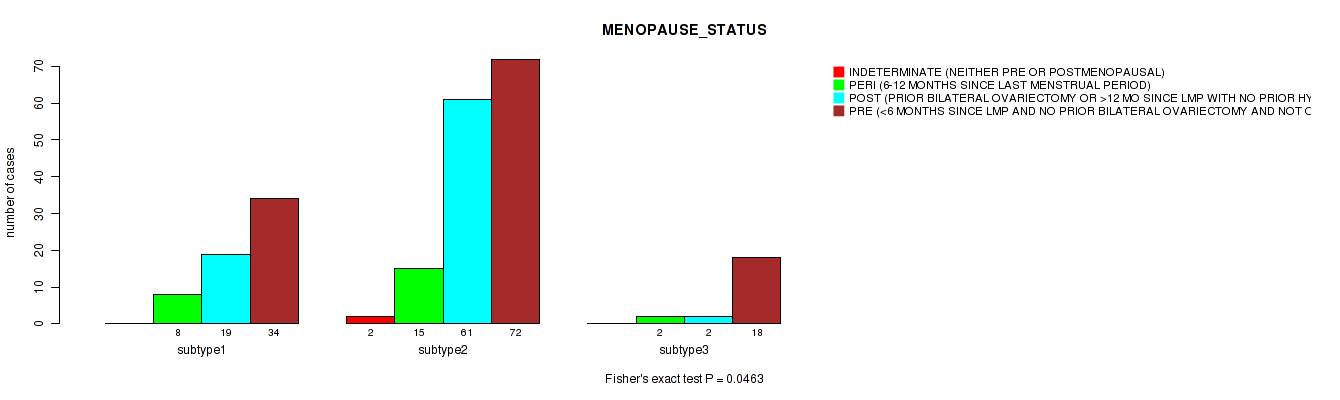
P value = 0.639 (Fisher's exact test), Q value = 0.83
Table S227. Clustering Approach #6: 'RNAseq cHierClus subtypes' versus Clinical Feature #28: 'LYMPHOVASCULAR_INVOLVEMENT'
| nPatients | ABSENT | PRESENT |
|---|---|---|
| ALL | 71 | 79 |
| subtype1 | 23 | 21 |
| subtype2 | 39 | 50 |
| subtype3 | 9 | 8 |
Figure S221. Get High-res Image Clustering Approach #6: 'RNAseq cHierClus subtypes' versus Clinical Feature #28: 'LYMPHOVASCULAR_INVOLVEMENT'
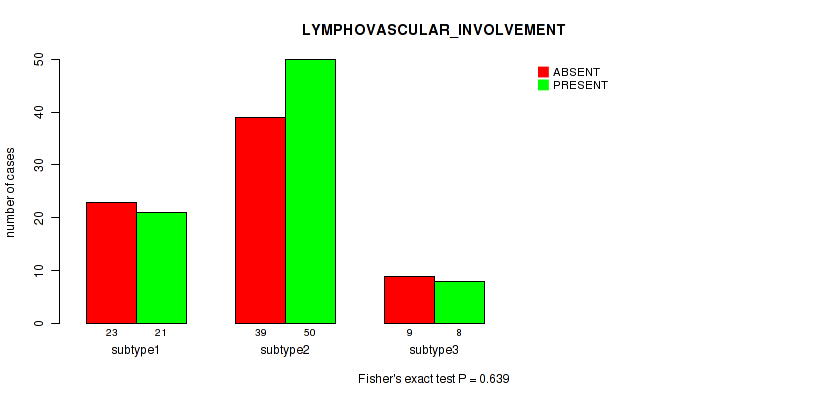
P value = 0.0308 (Kruskal-Wallis (anova)), Q value = 0.21
Table S228. Clustering Approach #6: 'RNAseq cHierClus subtypes' versus Clinical Feature #29: 'LYMPH_NODES_EXAMINED_HE_COUNT'
| nPatients | Mean (Std.Dev) | |
|---|---|---|
| ALL | 159 | 1.0 (2.4) |
| subtype1 | 44 | 0.7 (2.2) |
| subtype2 | 97 | 1.4 (2.6) |
| subtype3 | 18 | 0.2 (0.5) |
Figure S222. Get High-res Image Clustering Approach #6: 'RNAseq cHierClus subtypes' versus Clinical Feature #29: 'LYMPH_NODES_EXAMINED_HE_COUNT'
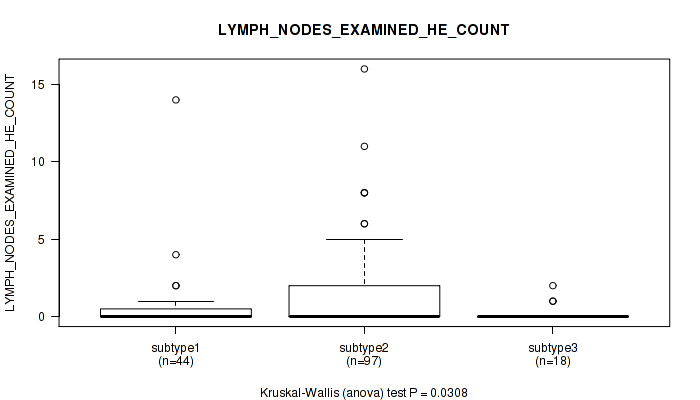
P value = 0.342 (Kruskal-Wallis (anova)), Q value = 0.67
Table S229. Clustering Approach #6: 'RNAseq cHierClus subtypes' versus Clinical Feature #30: 'LYMPH_NODES_EXAMINED'
| nPatients | Mean (Std.Dev) | |
|---|---|---|
| ALL | 178 | 22.4 (12.6) |
| subtype1 | 48 | 21.2 (10.2) |
| subtype2 | 109 | 22.2 (13.4) |
| subtype3 | 21 | 25.7 (13.0) |
Figure S223. Get High-res Image Clustering Approach #6: 'RNAseq cHierClus subtypes' versus Clinical Feature #30: 'LYMPH_NODES_EXAMINED'
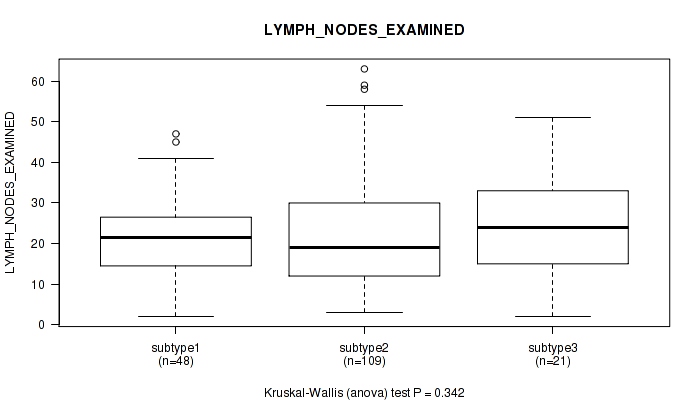
P value = 0.00364 (Fisher's exact test), Q value = 0.068
Table S230. Clustering Approach #6: 'RNAseq cHierClus subtypes' versus Clinical Feature #31: 'KERATINIZATION_SQUAMOUS_CELL'
| nPatients | KERATINIZING SQUAMOUS CELL CARCINOMA | NON-KERATINIZING SQUAMOUS CELL CARCINOMA |
|---|---|---|
| ALL | 55 | 119 |
| subtype1 | 0 | 17 |
| subtype2 | 47 | 89 |
| subtype3 | 8 | 13 |
Figure S224. Get High-res Image Clustering Approach #6: 'RNAseq cHierClus subtypes' versus Clinical Feature #31: 'KERATINIZATION_SQUAMOUS_CELL'
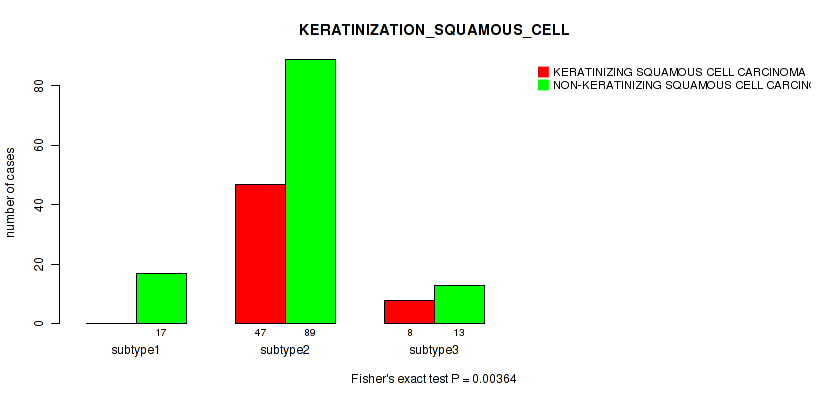
P value = 0.0135 (Kruskal-Wallis (anova)), Q value = 0.15
Table S231. Clustering Approach #6: 'RNAseq cHierClus subtypes' versus Clinical Feature #32: 'INITIAL_PATHOLOGIC_DX_YEAR'
| nPatients | Mean (Std.Dev) | |
|---|---|---|
| ALL | 302 | 2008.3 (4.8) |
| subtype1 | 71 | 2009.5 (3.5) |
| subtype2 | 194 | 2008.2 (4.8) |
| subtype3 | 37 | 2006.4 (5.8) |
Figure S225. Get High-res Image Clustering Approach #6: 'RNAseq cHierClus subtypes' versus Clinical Feature #32: 'INITIAL_PATHOLOGIC_DX_YEAR'
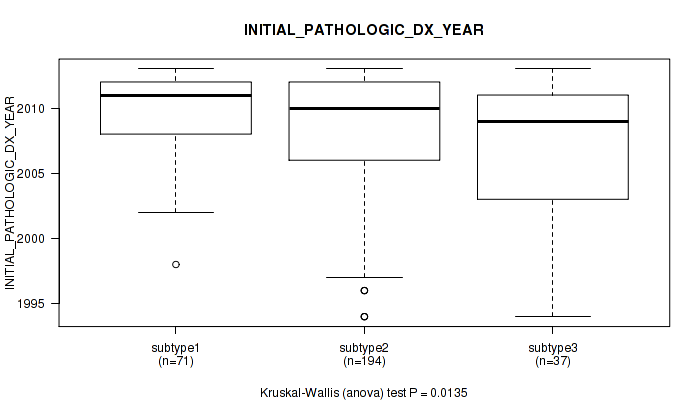
P value = 0.0343 (Fisher's exact test), Q value = 0.22
Table S232. Clustering Approach #6: 'RNAseq cHierClus subtypes' versus Clinical Feature #33: 'HISTORY_HORMONAL_CONTRACEPTIVES_USE'
| nPatients | CURRENT USER | FORMER USER | NEVER USED |
|---|---|---|---|
| ALL | 15 | 53 | 89 |
| subtype1 | 7 | 17 | 21 |
| subtype2 | 4 | 32 | 59 |
| subtype3 | 4 | 4 | 9 |
Figure S226. Get High-res Image Clustering Approach #6: 'RNAseq cHierClus subtypes' versus Clinical Feature #33: 'HISTORY_HORMONAL_CONTRACEPTIVES_USE'
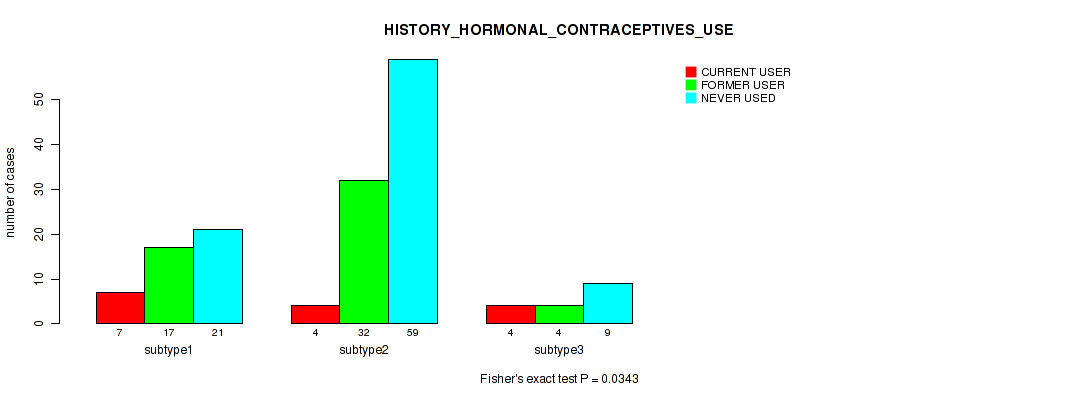
P value = 0.146 (Kruskal-Wallis (anova)), Q value = 0.47
Table S233. Clustering Approach #6: 'RNAseq cHierClus subtypes' versus Clinical Feature #34: 'HEIGHT_CM_AT_DIAGNOSIS'
| nPatients | Mean (Std.Dev) | |
|---|---|---|
| ALL | 261 | 161.0 (7.1) |
| subtype1 | 64 | 161.1 (6.9) |
| subtype2 | 167 | 160.5 (7.2) |
| subtype3 | 30 | 163.5 (6.8) |
Figure S227. Get High-res Image Clustering Approach #6: 'RNAseq cHierClus subtypes' versus Clinical Feature #34: 'HEIGHT_CM_AT_DIAGNOSIS'
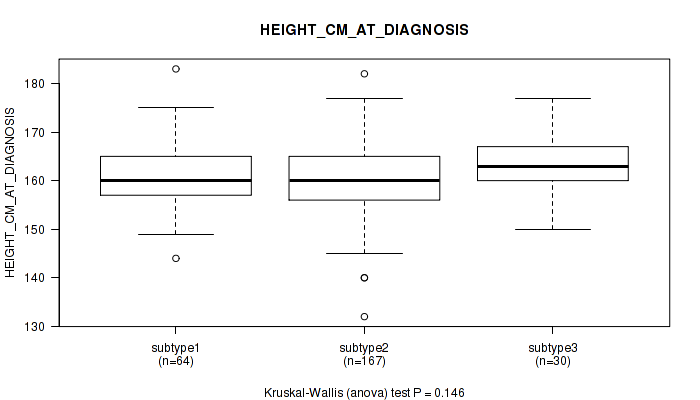
P value = 0.337 (Fisher's exact test), Q value = 0.67
Table S234. Clustering Approach #6: 'RNAseq cHierClus subtypes' versus Clinical Feature #35: 'CORPUS_INVOLVEMENT'
| nPatients | ABSENT | PRESENT |
|---|---|---|
| ALL | 99 | 19 |
| subtype1 | 31 | 6 |
| subtype2 | 56 | 13 |
| subtype3 | 12 | 0 |
Figure S228. Get High-res Image Clustering Approach #6: 'RNAseq cHierClus subtypes' versus Clinical Feature #35: 'CORPUS_INVOLVEMENT'
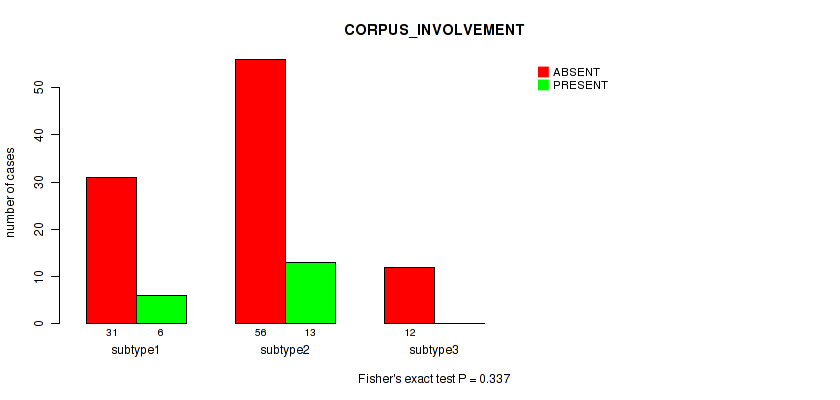
P value = 0.117 (Fisher's exact test), Q value = 0.46
Table S235. Clustering Approach #6: 'RNAseq cHierClus subtypes' versus Clinical Feature #36: 'CHEMO_CONCURRENT_TYPE'
| nPatients | CARBOPLATIN | CISPLATIN | OTHER |
|---|---|---|---|
| ALL | 7 | 102 | 2 |
| subtype1 | 3 | 22 | 1 |
| subtype2 | 4 | 67 | 0 |
| subtype3 | 0 | 13 | 1 |
Figure S229. Get High-res Image Clustering Approach #6: 'RNAseq cHierClus subtypes' versus Clinical Feature #36: 'CHEMO_CONCURRENT_TYPE'
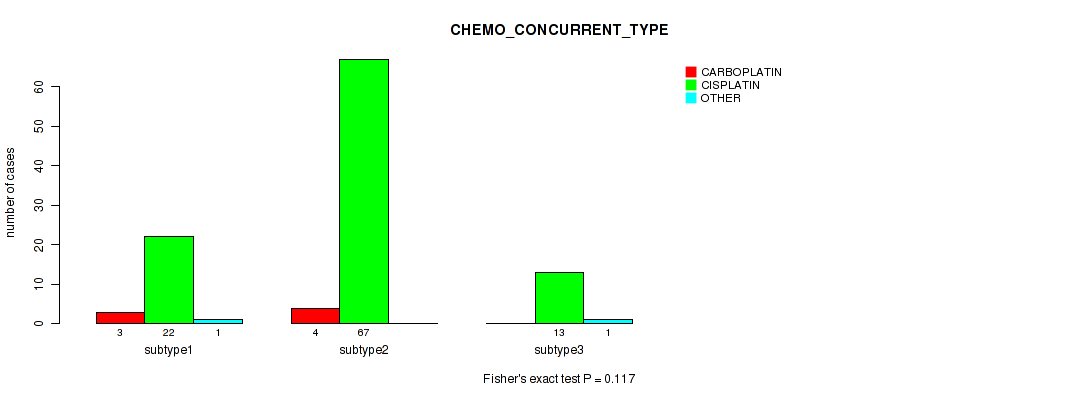
P value = 0.226 (Kruskal-Wallis (anova)), Q value = 0.55
Table S236. Clustering Approach #6: 'RNAseq cHierClus subtypes' versus Clinical Feature #37: 'CERVIX_SUV_RESULTS'
| nPatients | Mean (Std.Dev) | |
|---|---|---|
| ALL | 17 | 13.2 (7.2) |
| subtype1 | 1 | 7.1 (NA) |
| subtype2 | 13 | 12.5 (7.0) |
| subtype3 | 3 | 18.4 (7.3) |
Figure S230. Get High-res Image Clustering Approach #6: 'RNAseq cHierClus subtypes' versus Clinical Feature #37: 'CERVIX_SUV_RESULTS'
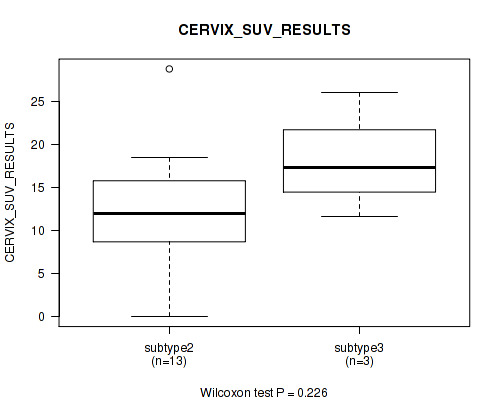
P value = 0.00655 (Kruskal-Wallis (anova)), Q value = 0.11
Table S237. Clustering Approach #6: 'RNAseq cHierClus subtypes' versus Clinical Feature #38: 'AGE_AT_DIAGNOSIS'
| nPatients | Mean (Std.Dev) | |
|---|---|---|
| ALL | 304 | 48.2 (13.8) |
| subtype1 | 72 | 47.6 (11.6) |
| subtype2 | 195 | 49.8 (14.4) |
| subtype3 | 37 | 41.4 (12.7) |
Figure S231. Get High-res Image Clustering Approach #6: 'RNAseq cHierClus subtypes' versus Clinical Feature #38: 'AGE_AT_DIAGNOSIS'
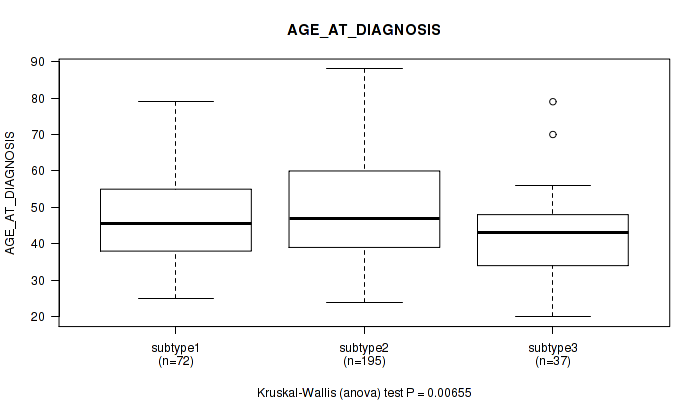
P value = 0.105 (Fisher's exact test), Q value = 0.44
Table S238. Clustering Approach #6: 'RNAseq cHierClus subtypes' versus Clinical Feature #39: 'CLINICAL_STAGE'
| nPatients | STAGE I | STAGE IA | STAGE IA1 | STAGE IA2 | STAGE IB | STAGE IB1 | STAGE IB2 | STAGE II | STAGE IIA | STAGE IIA1 | STAGE IIA2 | STAGE IIB | STAGE III | STAGE IIIA | STAGE IIIB | STAGE IVA | STAGE IVB |
|---|---|---|---|---|---|---|---|---|---|---|---|---|---|---|---|---|---|
| ALL | 5 | 1 | 1 | 1 | 38 | 77 | 39 | 5 | 9 | 5 | 7 | 43 | 1 | 2 | 42 | 9 | 12 |
| subtype1 | 1 | 0 | 0 | 0 | 6 | 28 | 10 | 1 | 3 | 1 | 2 | 8 | 0 | 0 | 6 | 1 | 5 |
| subtype2 | 4 | 1 | 1 | 1 | 24 | 44 | 20 | 4 | 3 | 2 | 4 | 30 | 1 | 2 | 33 | 8 | 7 |
| subtype3 | 0 | 0 | 0 | 0 | 8 | 5 | 9 | 0 | 3 | 2 | 1 | 5 | 0 | 0 | 3 | 0 | 0 |
Figure S232. Get High-res Image Clustering Approach #6: 'RNAseq cHierClus subtypes' versus Clinical Feature #39: 'CLINICAL_STAGE'
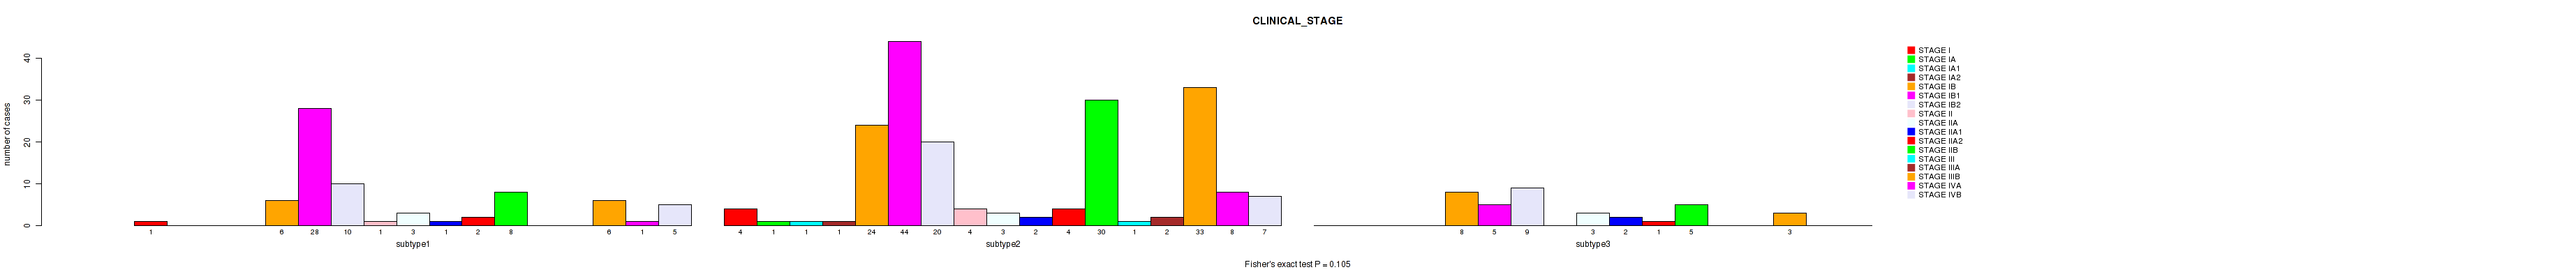
Table S239. Description of clustering approach #7: 'MIRSEQ CNMF'
| Cluster Labels | 1 | 2 | 3 |
|---|---|---|---|
| Number of samples | 103 | 80 | 124 |
P value = 0.499 (logrank test), Q value = 0.75
Table S240. Clustering Approach #7: 'MIRSEQ CNMF' versus Clinical Feature #1: 'Time to Death'
| nPatients | nDeath | Duration Range (Median), Month | |
|---|---|---|---|
| ALL | 290 | 71 | 0.0 - 210.7 (23.8) |
| subtype1 | 99 | 25 | 0.3 - 160.4 (24.3) |
| subtype2 | 77 | 15 | 0.1 - 210.7 (21.0) |
| subtype3 | 114 | 31 | 0.0 - 209.6 (24.3) |
Figure S233. Get High-res Image Clustering Approach #7: 'MIRSEQ CNMF' versus Clinical Feature #1: 'Time to Death'
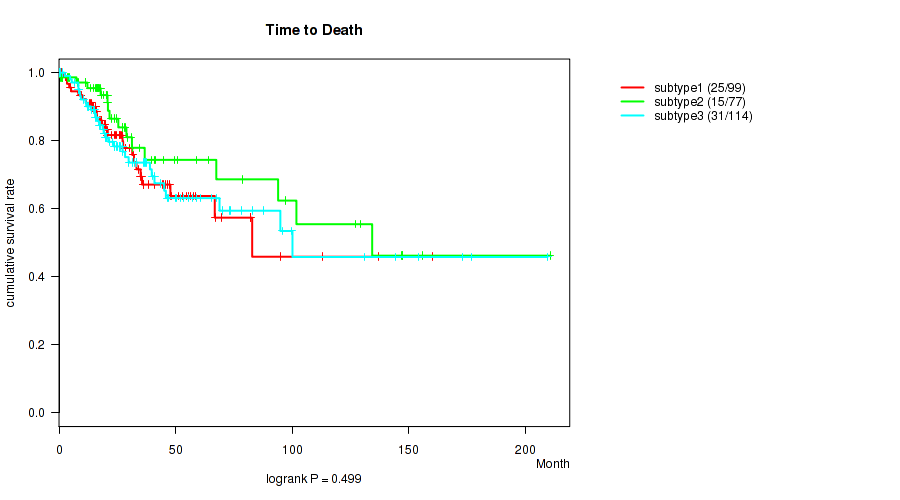
P value = 0.456 (Kruskal-Wallis (anova)), Q value = 0.74
Table S241. Clustering Approach #7: 'MIRSEQ CNMF' versus Clinical Feature #2: 'YEARS_TO_BIRTH'
| nPatients | Mean (Std.Dev) | |
|---|---|---|
| ALL | 305 | 48.2 (13.8) |
| subtype1 | 103 | 47.8 (12.4) |
| subtype2 | 80 | 49.7 (13.5) |
| subtype3 | 122 | 47.5 (15.1) |
Figure S234. Get High-res Image Clustering Approach #7: 'MIRSEQ CNMF' versus Clinical Feature #2: 'YEARS_TO_BIRTH'
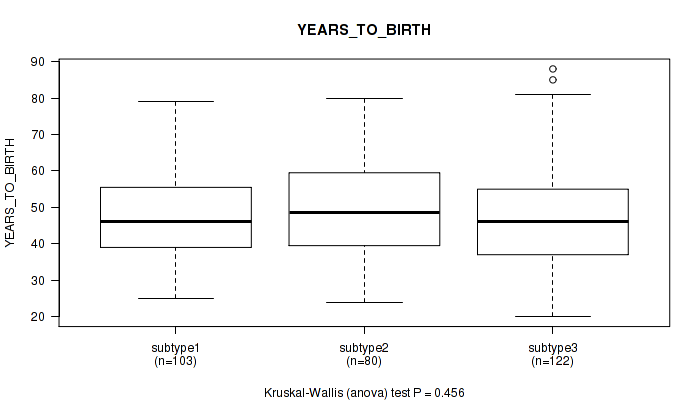
P value = 0.446 (Fisher's exact test), Q value = 0.74
Table S242. Clustering Approach #7: 'MIRSEQ CNMF' versus Clinical Feature #3: 'PATHOLOGY_T_STAGE'
| nPatients | T1 | T2 | T3 | T4 |
|---|---|---|---|---|
| ALL | 141 | 72 | 21 | 10 |
| subtype1 | 50 | 29 | 10 | 5 |
| subtype2 | 45 | 16 | 3 | 1 |
| subtype3 | 46 | 27 | 8 | 4 |
Figure S235. Get High-res Image Clustering Approach #7: 'MIRSEQ CNMF' versus Clinical Feature #3: 'PATHOLOGY_T_STAGE'
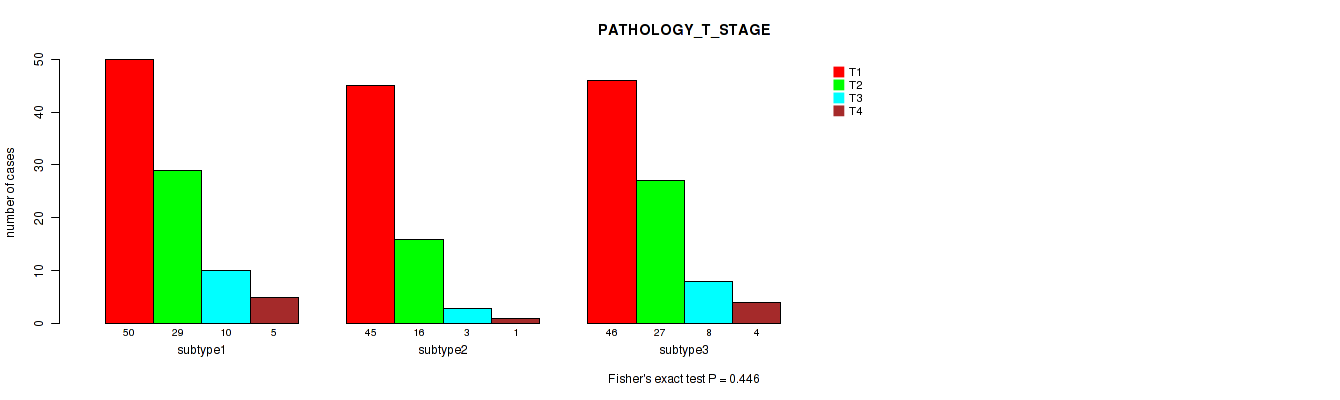
P value = 0.688 (Fisher's exact test), Q value = 0.85
Table S243. Clustering Approach #7: 'MIRSEQ CNMF' versus Clinical Feature #4: 'PATHOLOGY_N_STAGE'
| nPatients | 0 | 1 |
|---|---|---|
| ALL | 135 | 60 |
| subtype1 | 46 | 19 |
| subtype2 | 41 | 22 |
| subtype3 | 48 | 19 |
Figure S236. Get High-res Image Clustering Approach #7: 'MIRSEQ CNMF' versus Clinical Feature #4: 'PATHOLOGY_N_STAGE'
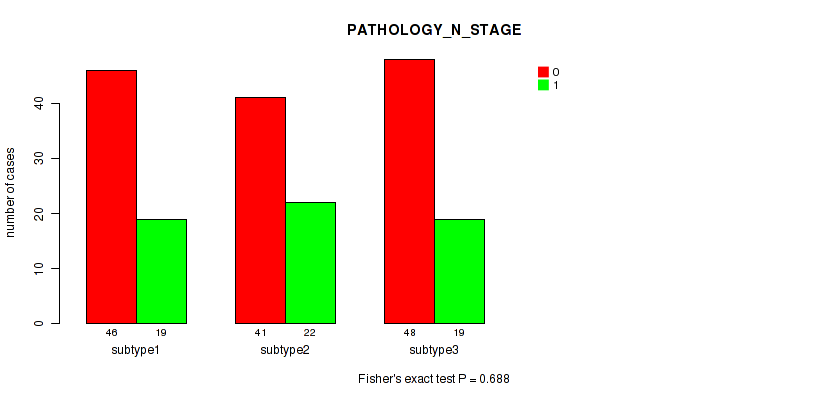
P value = 0.219 (Fisher's exact test), Q value = 0.54
Table S244. Clustering Approach #7: 'MIRSEQ CNMF' versus Clinical Feature #5: 'PATHOLOGY_M_STAGE'
| nPatients | 0 | 1 |
|---|---|---|
| ALL | 116 | 10 |
| subtype1 | 38 | 6 |
| subtype2 | 35 | 1 |
| subtype3 | 43 | 3 |
Figure S237. Get High-res Image Clustering Approach #7: 'MIRSEQ CNMF' versus Clinical Feature #5: 'PATHOLOGY_M_STAGE'
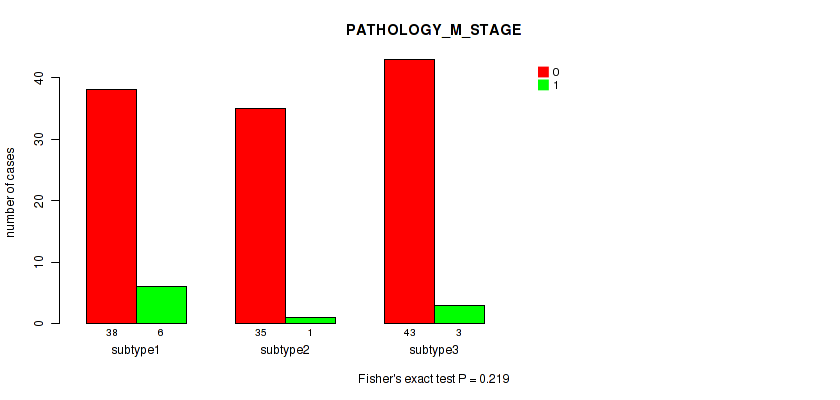
P value = 0.979 (Fisher's exact test), Q value = 1
Table S245. Clustering Approach #7: 'MIRSEQ CNMF' versus Clinical Feature #6: 'RADIATION_THERAPY'
| nPatients | NO | YES |
|---|---|---|
| ALL | 57 | 127 |
| subtype1 | 23 | 49 |
| subtype2 | 13 | 30 |
| subtype3 | 21 | 48 |
Figure S238. Get High-res Image Clustering Approach #7: 'MIRSEQ CNMF' versus Clinical Feature #6: 'RADIATION_THERAPY'
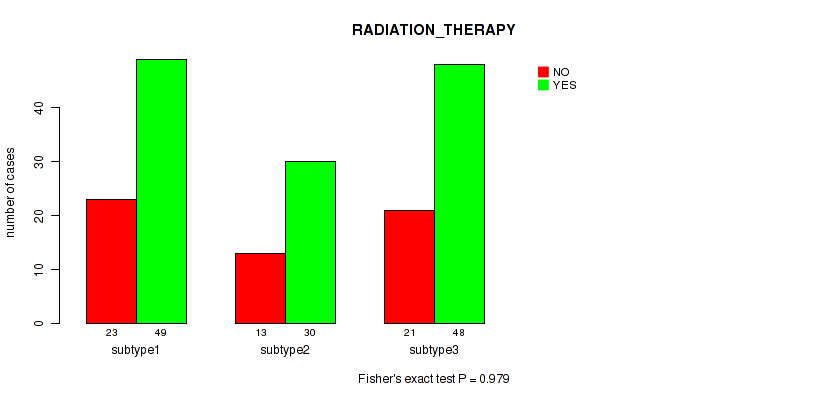
P value = 1e-05 (Fisher's exact test), Q value = 0.00044
Table S246. Clustering Approach #7: 'MIRSEQ CNMF' versus Clinical Feature #7: 'HISTOLOGICAL_TYPE'
| nPatients | ADENOSQUAMOUS | CERVICAL SQUAMOUS CELL CARCINOMA | ENDOCERVICAL ADENOCARCINOMA OF THE USUAL TYPE | ENDOCERVICAL TYPE OF ADENOCARCINOMA | ENDOMETRIOID ADENOCARCINOMA OF ENDOCERVIX | MUCINOUS ADENOCARCINOMA OF ENDOCERVICAL TYPE |
|---|---|---|---|---|---|---|
| ALL | 6 | 254 | 6 | 21 | 3 | 17 |
| subtype1 | 5 | 61 | 5 | 17 | 3 | 12 |
| subtype2 | 1 | 70 | 1 | 4 | 0 | 4 |
| subtype3 | 0 | 123 | 0 | 0 | 0 | 1 |
Figure S239. Get High-res Image Clustering Approach #7: 'MIRSEQ CNMF' versus Clinical Feature #7: 'HISTOLOGICAL_TYPE'
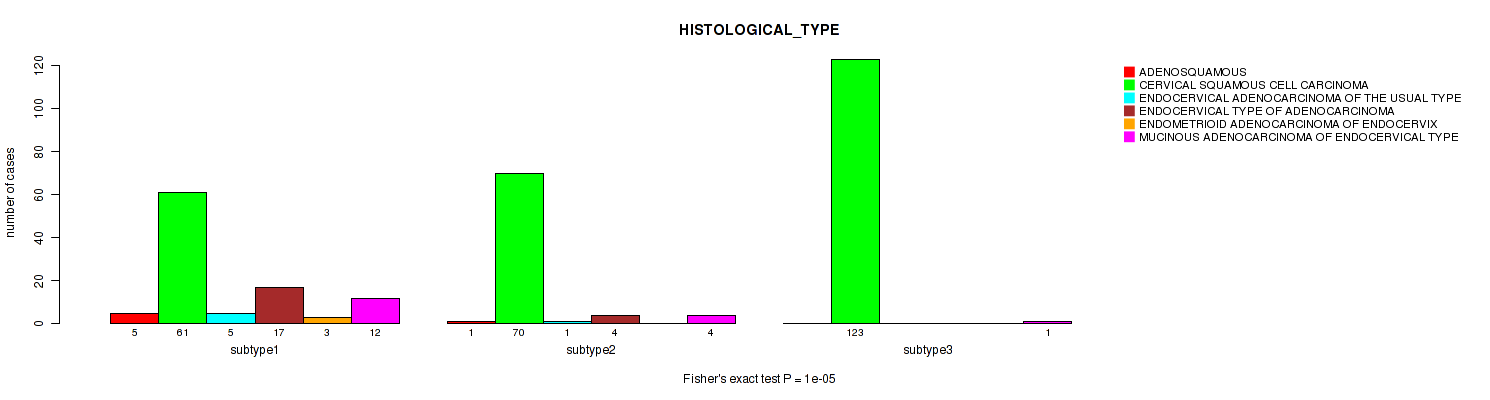
P value = 0.0518 (Kruskal-Wallis (anova)), Q value = 0.28
Table S247. Clustering Approach #7: 'MIRSEQ CNMF' versus Clinical Feature #8: 'NUMBER_PACK_YEARS_SMOKED'
| nPatients | Mean (Std.Dev) | |
|---|---|---|
| ALL | 93 | 17.4 (14.1) |
| subtype1 | 25 | 13.2 (10.5) |
| subtype2 | 27 | 22.2 (14.5) |
| subtype3 | 41 | 16.8 (15.1) |
Figure S240. Get High-res Image Clustering Approach #7: 'MIRSEQ CNMF' versus Clinical Feature #8: 'NUMBER_PACK_YEARS_SMOKED'
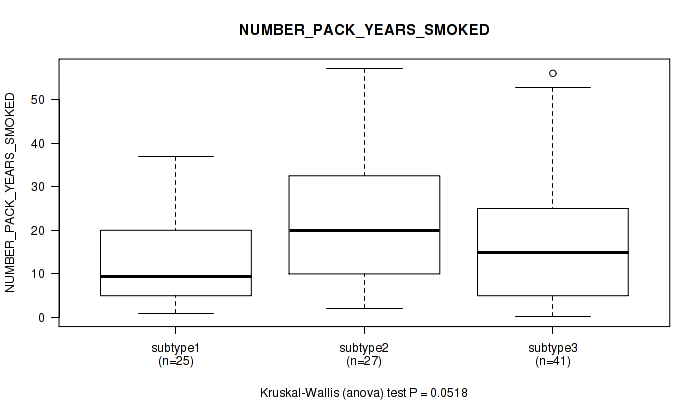
P value = 0.269 (Kruskal-Wallis (anova)), Q value = 0.59
Table S248. Clustering Approach #7: 'MIRSEQ CNMF' versus Clinical Feature #9: 'NUMBER_OF_LYMPH_NODES'
| nPatients | Mean (Std.Dev) | |
|---|---|---|
| ALL | 159 | 1.0 (2.4) |
| subtype1 | 55 | 0.8 (2.2) |
| subtype2 | 56 | 1.4 (2.5) |
| subtype3 | 48 | 0.9 (2.4) |
Figure S241. Get High-res Image Clustering Approach #7: 'MIRSEQ CNMF' versus Clinical Feature #9: 'NUMBER_OF_LYMPH_NODES'
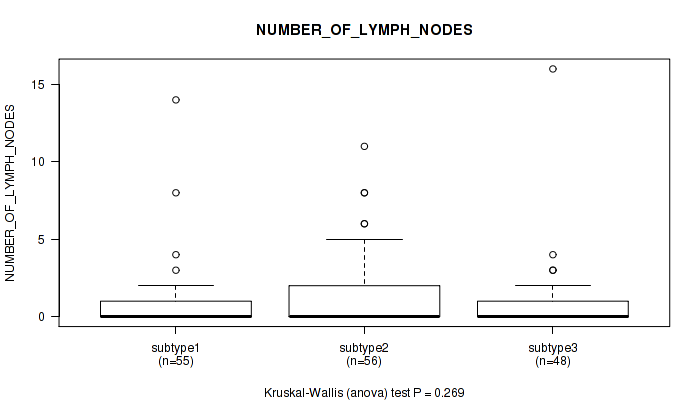
P value = 0.257 (Fisher's exact test), Q value = 0.58
Table S249. Clustering Approach #7: 'MIRSEQ CNMF' versus Clinical Feature #10: 'RACE'
| nPatients | AMERICAN INDIAN OR ALASKA NATIVE | ASIAN | BLACK OR AFRICAN AMERICAN | NATIVE HAWAIIAN OR OTHER PACIFIC ISLANDER | WHITE |
|---|---|---|---|---|---|
| ALL | 8 | 20 | 30 | 2 | 211 |
| subtype1 | 1 | 8 | 9 | 0 | 68 |
| subtype2 | 1 | 8 | 7 | 0 | 55 |
| subtype3 | 6 | 4 | 14 | 2 | 88 |
Figure S242. Get High-res Image Clustering Approach #7: 'MIRSEQ CNMF' versus Clinical Feature #10: 'RACE'
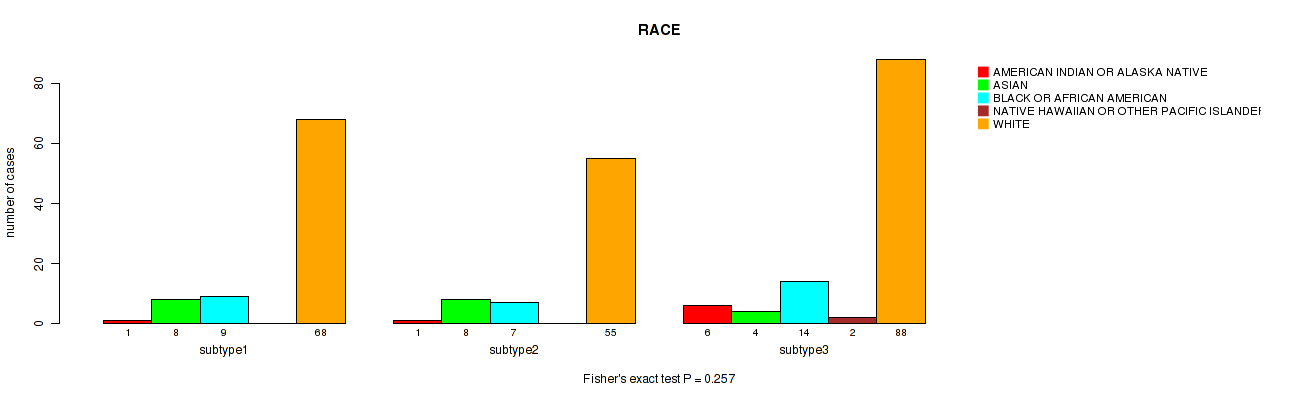
P value = 0.601 (Fisher's exact test), Q value = 0.81
Table S250. Clustering Approach #7: 'MIRSEQ CNMF' versus Clinical Feature #11: 'ETHNICITY'
| nPatients | HISPANIC OR LATINO | NOT HISPANIC OR LATINO |
|---|---|---|
| ALL | 24 | 170 |
| subtype1 | 7 | 53 |
| subtype2 | 5 | 50 |
| subtype3 | 12 | 67 |
Figure S243. Get High-res Image Clustering Approach #7: 'MIRSEQ CNMF' versus Clinical Feature #11: 'ETHNICITY'
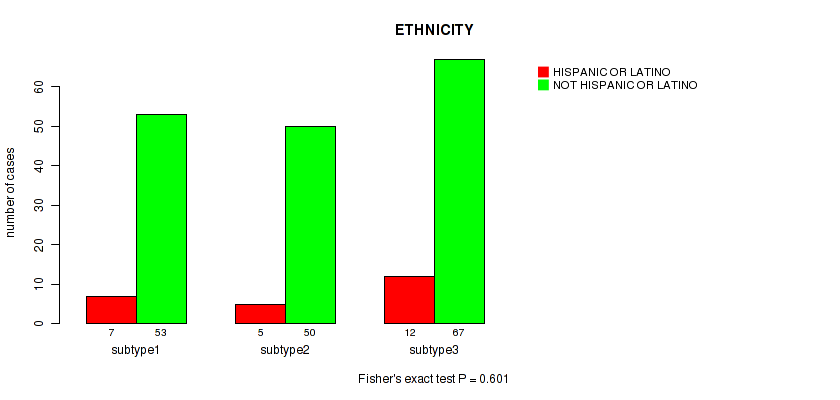
P value = 0.729 (Kruskal-Wallis (anova)), Q value = 0.87
Table S251. Clustering Approach #7: 'MIRSEQ CNMF' versus Clinical Feature #12: 'WEIGHT_KG_AT_DIAGNOSIS'
| nPatients | Mean (Std.Dev) | |
|---|---|---|
| ALL | 278 | 73.0 (21.5) |
| subtype1 | 97 | 73.6 (20.4) |
| subtype2 | 70 | 73.4 (27.6) |
| subtype3 | 111 | 72.3 (18.0) |
Figure S244. Get High-res Image Clustering Approach #7: 'MIRSEQ CNMF' versus Clinical Feature #12: 'WEIGHT_KG_AT_DIAGNOSIS'
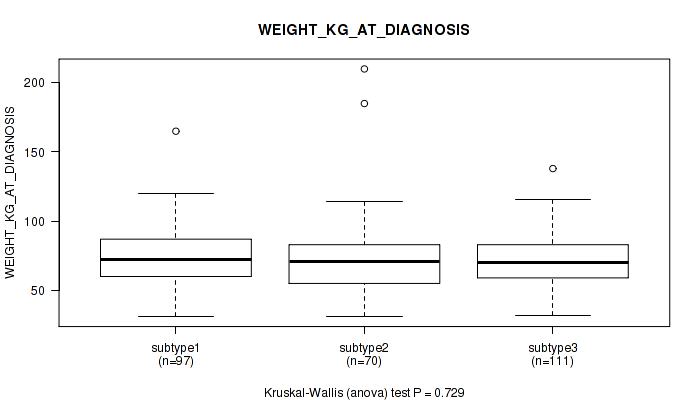
P value = 0.213 (Fisher's exact test), Q value = 0.53
Table S252. Clustering Approach #7: 'MIRSEQ CNMF' versus Clinical Feature #13: 'TUMOR_STATUS'
| nPatients | TUMOR FREE | WITH TUMOR |
|---|---|---|
| ALL | 191 | 78 |
| subtype1 | 62 | 31 |
| subtype2 | 56 | 15 |
| subtype3 | 73 | 32 |
Figure S245. Get High-res Image Clustering Approach #7: 'MIRSEQ CNMF' versus Clinical Feature #13: 'TUMOR_STATUS'
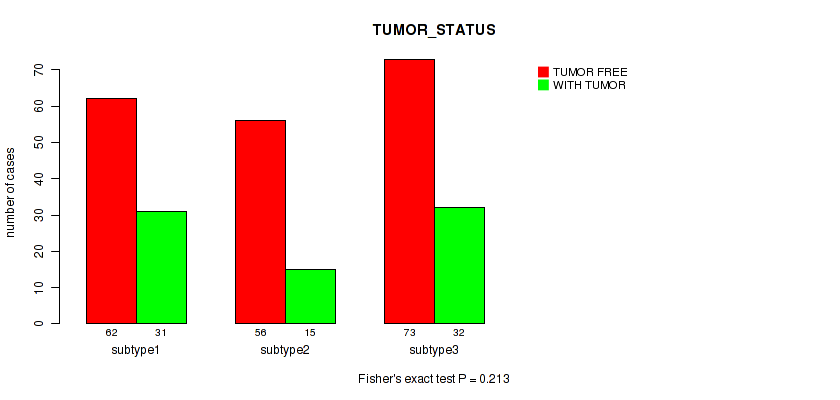
P value = 0.00758 (Fisher's exact test), Q value = 0.11
Table S253. Clustering Approach #7: 'MIRSEQ CNMF' versus Clinical Feature #14: 'NEOPLASM_HISTOLOGIC_GRADE'
| nPatients | G1 | G2 | G3 | G4 | GX |
|---|---|---|---|---|---|
| ALL | 18 | 136 | 120 | 1 | 24 |
| subtype1 | 8 | 40 | 43 | 0 | 11 |
| subtype2 | 8 | 41 | 28 | 1 | 1 |
| subtype3 | 2 | 55 | 49 | 0 | 12 |
Figure S246. Get High-res Image Clustering Approach #7: 'MIRSEQ CNMF' versus Clinical Feature #14: 'NEOPLASM_HISTOLOGIC_GRADE'
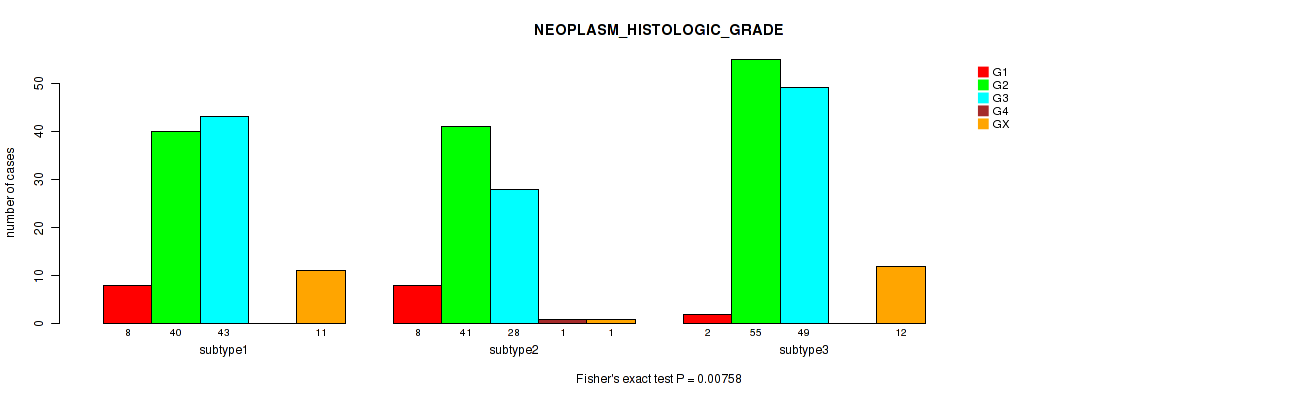
P value = 0.313 (Kruskal-Wallis (anova)), Q value = 0.64
Table S254. Clustering Approach #7: 'MIRSEQ CNMF' versus Clinical Feature #15: 'TOBACCO_SMOKING_YEAR_STOPPED'
| nPatients | Mean (Std.Dev) | |
|---|---|---|
| ALL | 43 | 1999.7 (13.6) |
| subtype1 | 12 | 2002.5 (11.3) |
| subtype2 | 11 | 1996.2 (11.8) |
| subtype3 | 20 | 2000.0 (15.9) |
Figure S247. Get High-res Image Clustering Approach #7: 'MIRSEQ CNMF' versus Clinical Feature #15: 'TOBACCO_SMOKING_YEAR_STOPPED'
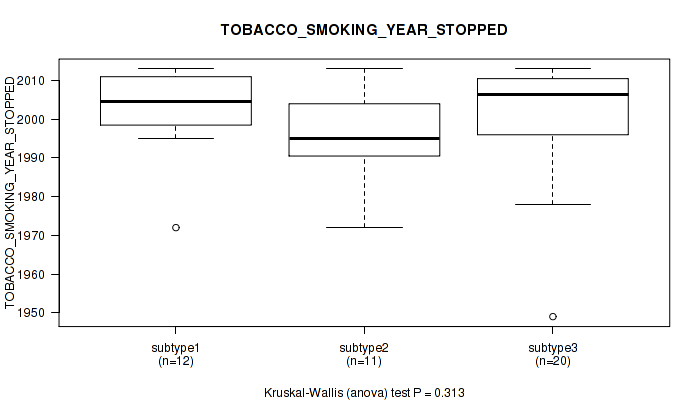
P value = 0.0518 (Kruskal-Wallis (anova)), Q value = 0.28
Table S255. Clustering Approach #7: 'MIRSEQ CNMF' versus Clinical Feature #16: 'TOBACCO_SMOKING_PACK_YEARS_SMOKED'
| nPatients | Mean (Std.Dev) | |
|---|---|---|
| ALL | 93 | 17.4 (14.1) |
| subtype1 | 25 | 13.2 (10.5) |
| subtype2 | 27 | 22.2 (14.5) |
| subtype3 | 41 | 16.8 (15.1) |
Figure S248. Get High-res Image Clustering Approach #7: 'MIRSEQ CNMF' versus Clinical Feature #16: 'TOBACCO_SMOKING_PACK_YEARS_SMOKED'
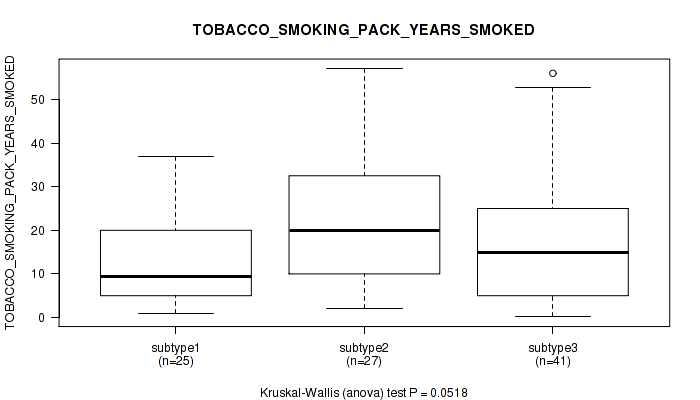
P value = 0.103 (Fisher's exact test), Q value = 0.44
Table S256. Clustering Approach #7: 'MIRSEQ CNMF' versus Clinical Feature #17: 'TOBACCO_SMOKING_HISTORY'
| nPatients | CURRENT REFORMED SMOKER FOR < OR = 15 YEARS | CURRENT REFORMED SMOKER FOR > 15 YEARS | CURRENT REFORMED SMOKER, DURATION NOT SPECIFIED | CURRENT SMOKER | LIFELONG NON-SMOKER |
|---|---|---|---|---|---|
| ALL | 40 | 9 | 4 | 64 | 146 |
| subtype1 | 13 | 1 | 0 | 17 | 61 |
| subtype2 | 9 | 4 | 3 | 19 | 35 |
| subtype3 | 18 | 4 | 1 | 28 | 50 |
Figure S249. Get High-res Image Clustering Approach #7: 'MIRSEQ CNMF' versus Clinical Feature #17: 'TOBACCO_SMOKING_HISTORY'
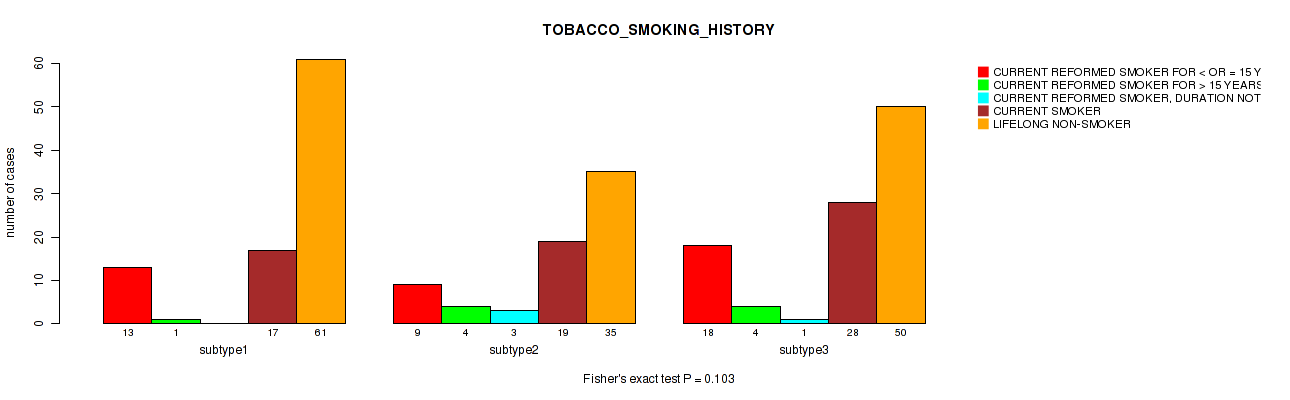
P value = 0.846 (Kruskal-Wallis (anova)), Q value = 0.94
Table S257. Clustering Approach #7: 'MIRSEQ CNMF' versus Clinical Feature #18: 'AGEBEGANSMOKINGINYEARS'
| nPatients | Mean (Std.Dev) | |
|---|---|---|
| ALL | 85 | 21.1 (7.7) |
| subtype1 | 23 | 20.7 (7.2) |
| subtype2 | 24 | 21.0 (6.2) |
| subtype3 | 38 | 21.5 (8.9) |
Figure S250. Get High-res Image Clustering Approach #7: 'MIRSEQ CNMF' versus Clinical Feature #18: 'AGEBEGANSMOKINGINYEARS'
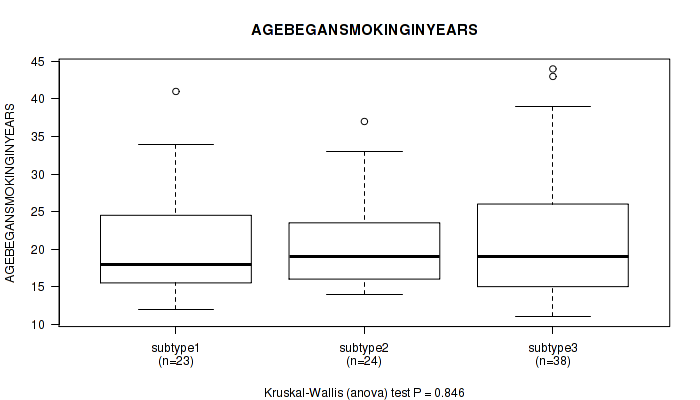
P value = 0.393 (Fisher's exact test), Q value = 0.71
Table S258. Clustering Approach #7: 'MIRSEQ CNMF' versus Clinical Feature #19: 'RADIATION_THERAPY_STATUS'
| nPatients | COMPLETED AS PLANNED | TREATMENT NOT COMPLETED |
|---|---|---|
| ALL | 29 | 3 |
| subtype1 | 8 | 0 |
| subtype2 | 6 | 0 |
| subtype3 | 15 | 3 |
Figure S251. Get High-res Image Clustering Approach #7: 'MIRSEQ CNMF' versus Clinical Feature #19: 'RADIATION_THERAPY_STATUS'
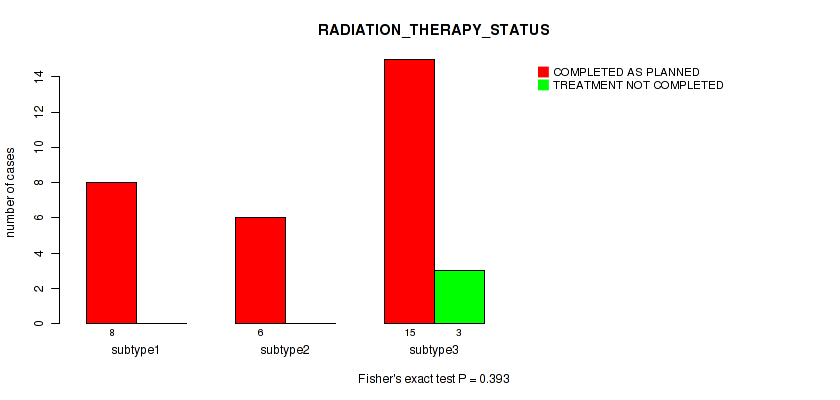
P value = 0.698 (Kruskal-Wallis (anova)), Q value = 0.85
Table S259. Clustering Approach #7: 'MIRSEQ CNMF' versus Clinical Feature #20: 'PREGNANCIES_COUNT_TOTAL'
| nPatients | Mean (Std.Dev) | |
|---|---|---|
| ALL | 267 | 3.6 (2.6) |
| subtype1 | 91 | 3.6 (2.9) |
| subtype2 | 72 | 3.6 (2.3) |
| subtype3 | 104 | 3.6 (2.5) |
Figure S252. Get High-res Image Clustering Approach #7: 'MIRSEQ CNMF' versus Clinical Feature #20: 'PREGNANCIES_COUNT_TOTAL'
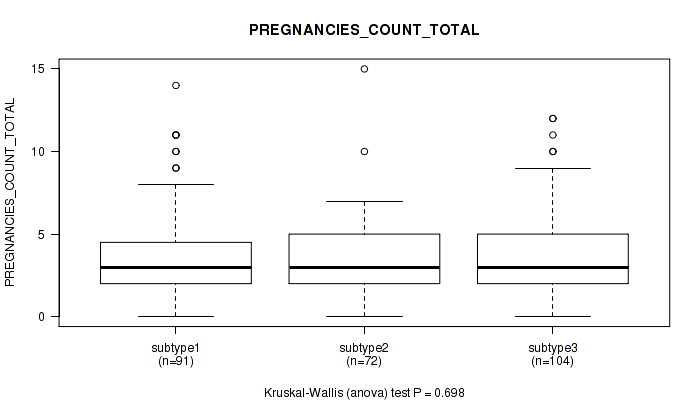
P value = 0.844 (Kruskal-Wallis (anova)), Q value = 0.94
Table S260. Clustering Approach #7: 'MIRSEQ CNMF' versus Clinical Feature #21: 'PREGNANCIES_COUNT_STILLBIRTH'
| nPatients | Mean (Std.Dev) | |
|---|---|---|
| ALL | 112 | 0.1 (0.3) |
| subtype1 | 30 | 0.0 (0.2) |
| subtype2 | 34 | 0.1 (0.5) |
| subtype3 | 48 | 0.1 (0.2) |
Figure S253. Get High-res Image Clustering Approach #7: 'MIRSEQ CNMF' versus Clinical Feature #21: 'PREGNANCIES_COUNT_STILLBIRTH'
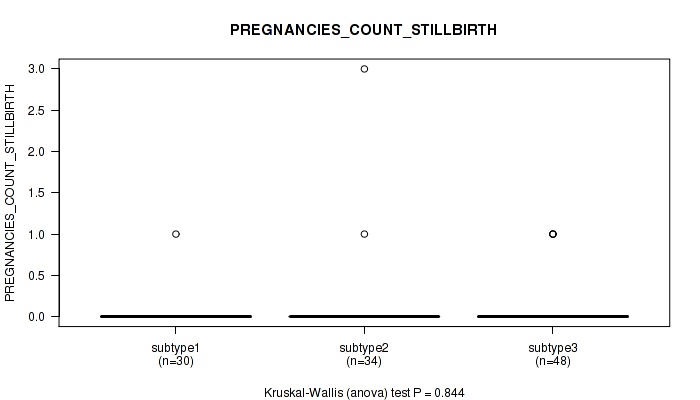
P value = 0.00548 (Kruskal-Wallis (anova)), Q value = 0.093
Table S261. Clustering Approach #7: 'MIRSEQ CNMF' versus Clinical Feature #22: 'PREGNANCY_SPONTANEOUS_ABORTION_COUNT'
| nPatients | Mean (Std.Dev) | |
|---|---|---|
| ALL | 147 | 0.5 (0.9) |
| subtype1 | 41 | 0.9 (1.2) |
| subtype2 | 44 | 0.4 (0.8) |
| subtype3 | 62 | 0.4 (0.8) |
Figure S254. Get High-res Image Clustering Approach #7: 'MIRSEQ CNMF' versus Clinical Feature #22: 'PREGNANCY_SPONTANEOUS_ABORTION_COUNT'
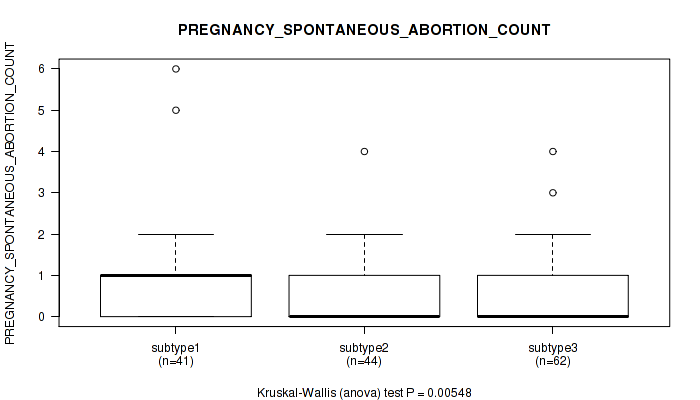
P value = 0.787 (Kruskal-Wallis (anova)), Q value = 0.91
Table S262. Clustering Approach #7: 'MIRSEQ CNMF' versus Clinical Feature #23: 'PREGNANCIES_COUNT_LIVE_BIRTH'
| nPatients | Mean (Std.Dev) | |
|---|---|---|
| ALL | 262 | 2.8 (2.0) |
| subtype1 | 87 | 2.9 (2.5) |
| subtype2 | 71 | 2.7 (1.7) |
| subtype3 | 104 | 2.8 (1.9) |
Figure S255. Get High-res Image Clustering Approach #7: 'MIRSEQ CNMF' versus Clinical Feature #23: 'PREGNANCIES_COUNT_LIVE_BIRTH'
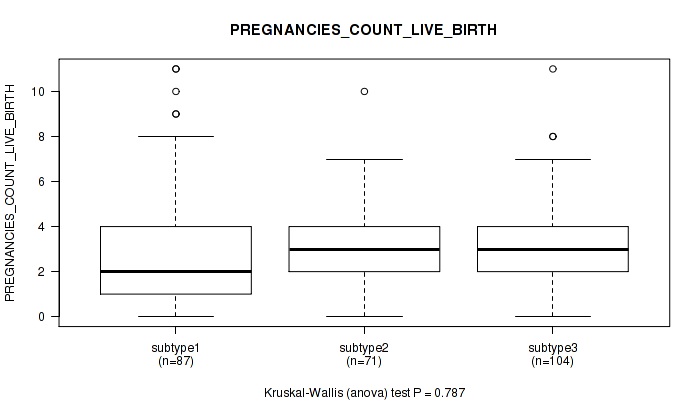
P value = 0.497 (Kruskal-Wallis (anova)), Q value = 0.75
Table S263. Clustering Approach #7: 'MIRSEQ CNMF' versus Clinical Feature #24: 'PREGNANCY_THERAPEUTIC_ABORTION_COUNT'
| nPatients | Mean (Std.Dev) | |
|---|---|---|
| ALL | 122 | 0.9 (1.8) |
| subtype1 | 33 | 0.8 (1.4) |
| subtype2 | 38 | 1.1 (2.3) |
| subtype3 | 51 | 0.7 (1.6) |
Figure S256. Get High-res Image Clustering Approach #7: 'MIRSEQ CNMF' versus Clinical Feature #24: 'PREGNANCY_THERAPEUTIC_ABORTION_COUNT'
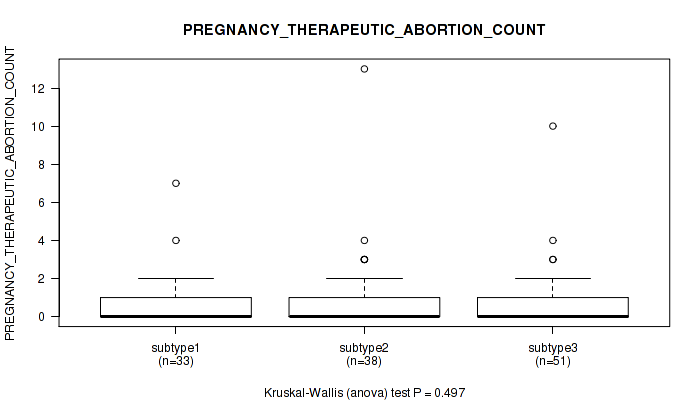
P value = 0.306 (Kruskal-Wallis (anova)), Q value = 0.64
Table S264. Clustering Approach #7: 'MIRSEQ CNMF' versus Clinical Feature #25: 'PREGNANCIES_COUNT_ECTOPIC'
| nPatients | Mean (Std.Dev) | |
|---|---|---|
| ALL | 116 | 0.1 (0.3) |
| subtype1 | 30 | 0.1 (0.3) |
| subtype2 | 36 | 0.2 (0.5) |
| subtype3 | 50 | 0.1 (0.3) |
Figure S257. Get High-res Image Clustering Approach #7: 'MIRSEQ CNMF' versus Clinical Feature #25: 'PREGNANCIES_COUNT_ECTOPIC'

P value = 0.707 (Fisher's exact test), Q value = 0.85
Table S265. Clustering Approach #7: 'MIRSEQ CNMF' versus Clinical Feature #26: 'POS_LYMPH_NODE_LOCATION'
| nPatients | MACROSCOPIC PARAMETRIAL INVOLVEMENT | MICROSCOPIC PARAMETRIAL INVOLVEMENT | OTHER LOCATION, SPECIFY | POSITIVE BLADDER MARGIN | POSITIVE VAGINAL MARGIN |
|---|---|---|---|---|---|
| ALL | 3 | 8 | 40 | 1 | 10 |
| subtype1 | 2 | 2 | 9 | 0 | 2 |
| subtype2 | 1 | 2 | 15 | 1 | 5 |
| subtype3 | 0 | 4 | 16 | 0 | 3 |
Figure S258. Get High-res Image Clustering Approach #7: 'MIRSEQ CNMF' versus Clinical Feature #26: 'POS_LYMPH_NODE_LOCATION'
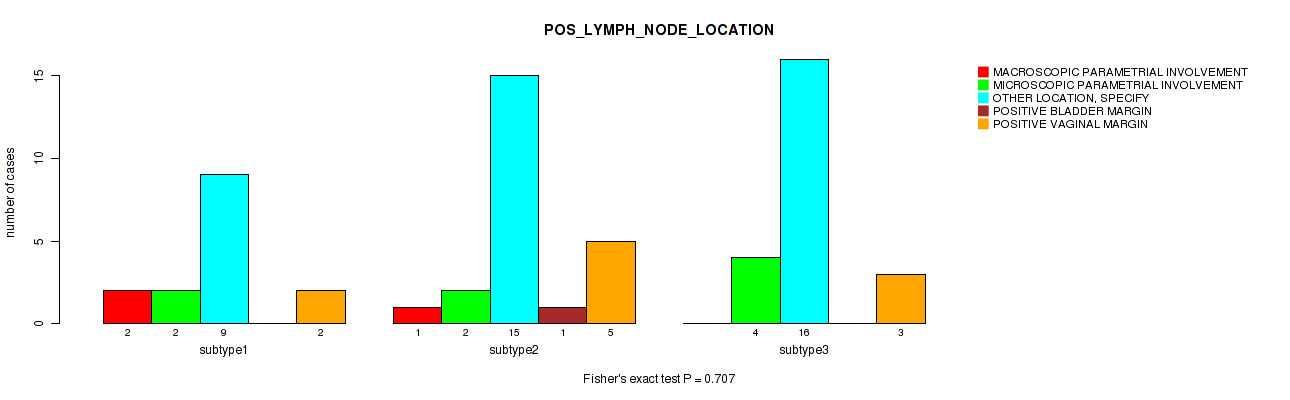
P value = 0.465 (Fisher's exact test), Q value = 0.74
Table S266. Clustering Approach #7: 'MIRSEQ CNMF' versus Clinical Feature #27: 'MENOPAUSE_STATUS'
| nPatients | INDETERMINATE (NEITHER PRE OR POSTMENOPAUSAL) | PERI (6-12 MONTHS SINCE LAST MENSTRUAL PERIOD) | POST (PRIOR BILATERAL OVARIECTOMY OR >12 MO SINCE LMP WITH NO PRIOR HYSTERECTOMY) | PRE (<6 MONTHS SINCE LMP AND NO PRIOR BILATERAL OVARIECTOMY AND NOT ON ESTROGEN REPLACEMENT) |
|---|---|---|---|---|
| ALL | 2 | 25 | 84 | 125 |
| subtype1 | 1 | 12 | 26 | 44 |
| subtype2 | 1 | 6 | 26 | 29 |
| subtype3 | 0 | 7 | 32 | 52 |
Figure S259. Get High-res Image Clustering Approach #7: 'MIRSEQ CNMF' versus Clinical Feature #27: 'MENOPAUSE_STATUS'
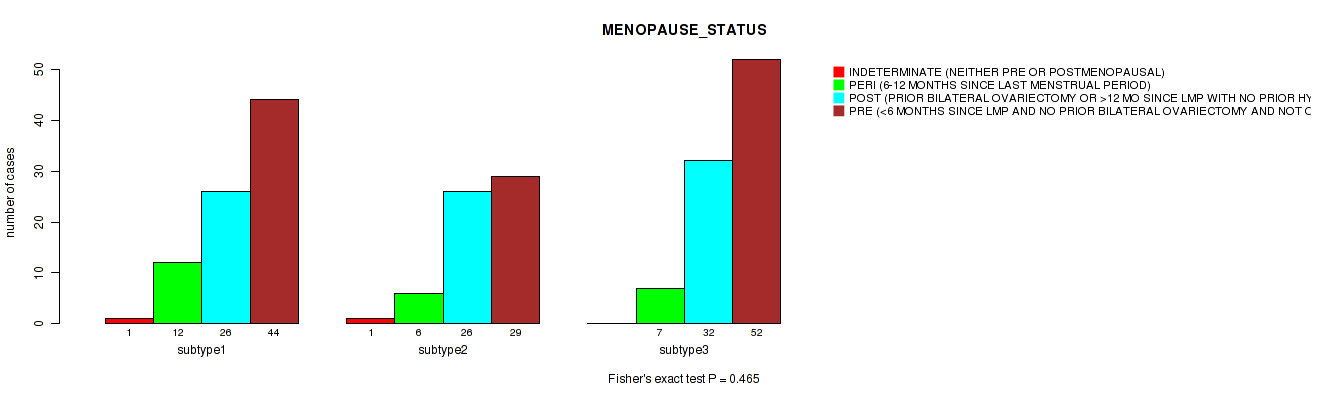
P value = 0.635 (Fisher's exact test), Q value = 0.83
Table S267. Clustering Approach #7: 'MIRSEQ CNMF' versus Clinical Feature #28: 'LYMPHOVASCULAR_INVOLVEMENT'
| nPatients | ABSENT | PRESENT |
|---|---|---|
| ALL | 72 | 80 |
| subtype1 | 24 | 30 |
| subtype2 | 23 | 28 |
| subtype3 | 25 | 22 |
Figure S260. Get High-res Image Clustering Approach #7: 'MIRSEQ CNMF' versus Clinical Feature #28: 'LYMPHOVASCULAR_INVOLVEMENT'
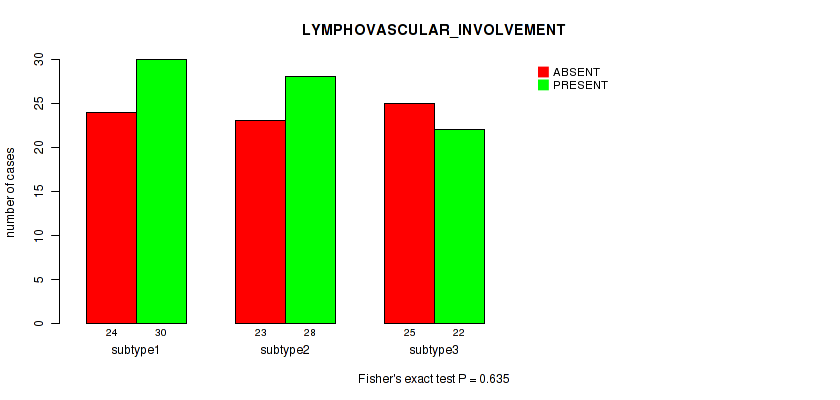
P value = 0.269 (Kruskal-Wallis (anova)), Q value = 0.59
Table S268. Clustering Approach #7: 'MIRSEQ CNMF' versus Clinical Feature #29: 'LYMPH_NODES_EXAMINED_HE_COUNT'
| nPatients | Mean (Std.Dev) | |
|---|---|---|
| ALL | 159 | 1.0 (2.4) |
| subtype1 | 55 | 0.8 (2.2) |
| subtype2 | 56 | 1.4 (2.5) |
| subtype3 | 48 | 0.9 (2.4) |
Figure S261. Get High-res Image Clustering Approach #7: 'MIRSEQ CNMF' versus Clinical Feature #29: 'LYMPH_NODES_EXAMINED_HE_COUNT'
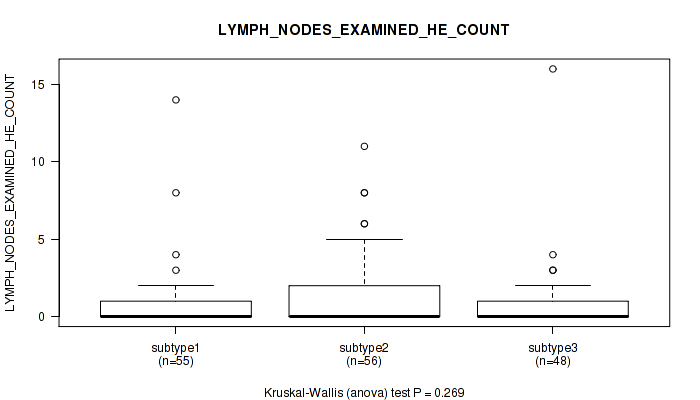
P value = 0.645 (Kruskal-Wallis (anova)), Q value = 0.83
Table S269. Clustering Approach #7: 'MIRSEQ CNMF' versus Clinical Feature #30: 'LYMPH_NODES_EXAMINED'
| nPatients | Mean (Std.Dev) | |
|---|---|---|
| ALL | 180 | 22.3 (12.6) |
| subtype1 | 60 | 20.7 (11.0) |
| subtype2 | 62 | 24.3 (14.3) |
| subtype3 | 58 | 21.7 (12.0) |
Figure S262. Get High-res Image Clustering Approach #7: 'MIRSEQ CNMF' versus Clinical Feature #30: 'LYMPH_NODES_EXAMINED'
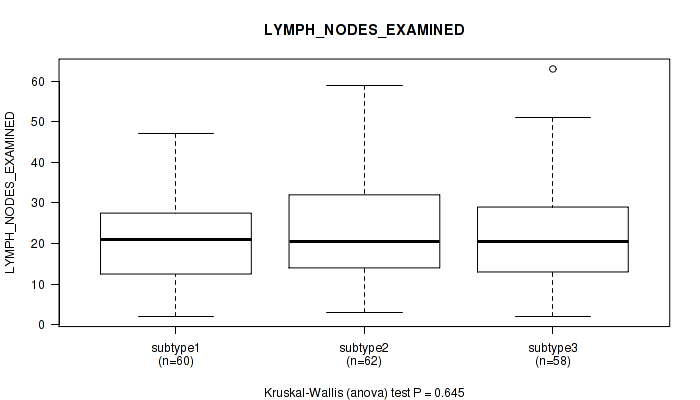
P value = 0.107 (Fisher's exact test), Q value = 0.45
Table S270. Clustering Approach #7: 'MIRSEQ CNMF' versus Clinical Feature #31: 'KERATINIZATION_SQUAMOUS_CELL'
| nPatients | KERATINIZING SQUAMOUS CELL CARCINOMA | NON-KERATINIZING SQUAMOUS CELL CARCINOMA |
|---|---|---|
| ALL | 55 | 120 |
| subtype1 | 6 | 29 |
| subtype2 | 19 | 32 |
| subtype3 | 30 | 59 |
Figure S263. Get High-res Image Clustering Approach #7: 'MIRSEQ CNMF' versus Clinical Feature #31: 'KERATINIZATION_SQUAMOUS_CELL'
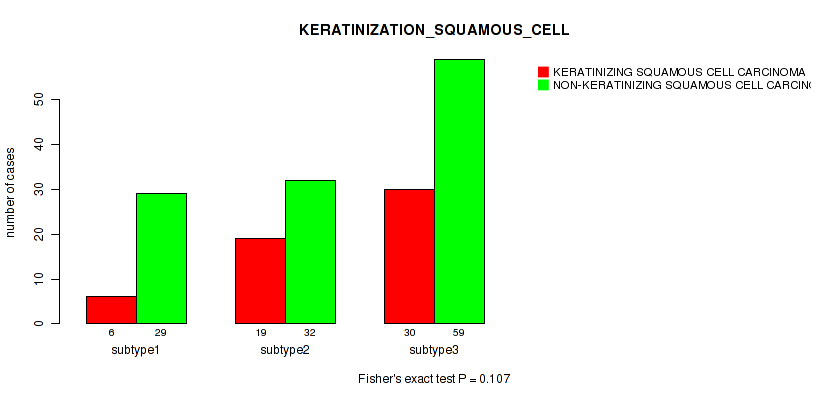
P value = 0.0032 (Kruskal-Wallis (anova)), Q value = 0.068
Table S271. Clustering Approach #7: 'MIRSEQ CNMF' versus Clinical Feature #32: 'INITIAL_PATHOLOGIC_DX_YEAR'
| nPatients | Mean (Std.Dev) | |
|---|---|---|
| ALL | 305 | 2008.3 (4.8) |
| subtype1 | 102 | 2009.4 (4.3) |
| subtype2 | 79 | 2008.1 (4.7) |
| subtype3 | 124 | 2007.6 (5.0) |
Figure S264. Get High-res Image Clustering Approach #7: 'MIRSEQ CNMF' versus Clinical Feature #32: 'INITIAL_PATHOLOGIC_DX_YEAR'
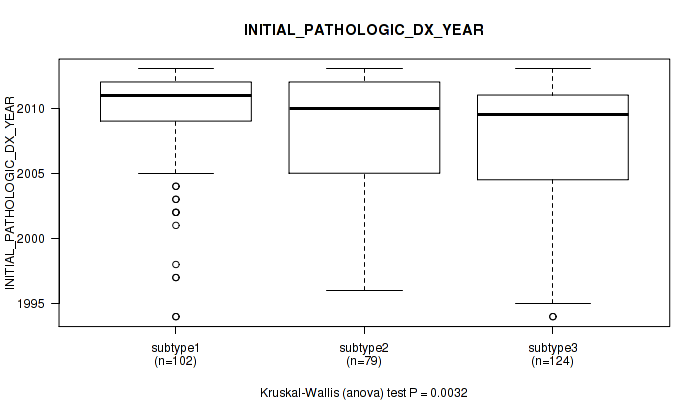
P value = 0.653 (Fisher's exact test), Q value = 0.83
Table S272. Clustering Approach #7: 'MIRSEQ CNMF' versus Clinical Feature #33: 'HISTORY_HORMONAL_CONTRACEPTIVES_USE'
| nPatients | CURRENT USER | FORMER USER | NEVER USED |
|---|---|---|---|
| ALL | 15 | 54 | 90 |
| subtype1 | 8 | 20 | 34 |
| subtype2 | 3 | 16 | 20 |
| subtype3 | 4 | 18 | 36 |
Figure S265. Get High-res Image Clustering Approach #7: 'MIRSEQ CNMF' versus Clinical Feature #33: 'HISTORY_HORMONAL_CONTRACEPTIVES_USE'
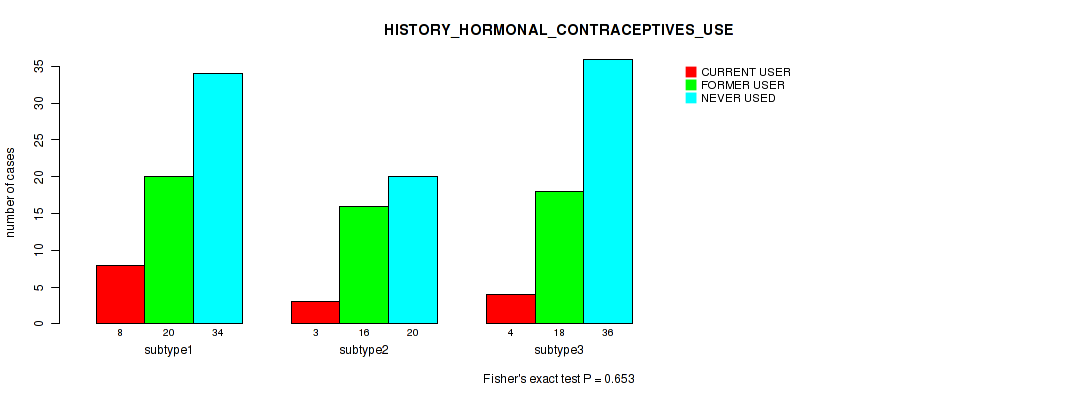
P value = 0.963 (Kruskal-Wallis (anova)), Q value = 0.99
Table S273. Clustering Approach #7: 'MIRSEQ CNMF' versus Clinical Feature #34: 'HEIGHT_CM_AT_DIAGNOSIS'
| nPatients | Mean (Std.Dev) | |
|---|---|---|
| ALL | 264 | 161.0 (7.3) |
| subtype1 | 92 | 161.1 (7.3) |
| subtype2 | 65 | 161.3 (7.8) |
| subtype3 | 107 | 160.6 (7.0) |
Figure S266. Get High-res Image Clustering Approach #7: 'MIRSEQ CNMF' versus Clinical Feature #34: 'HEIGHT_CM_AT_DIAGNOSIS'
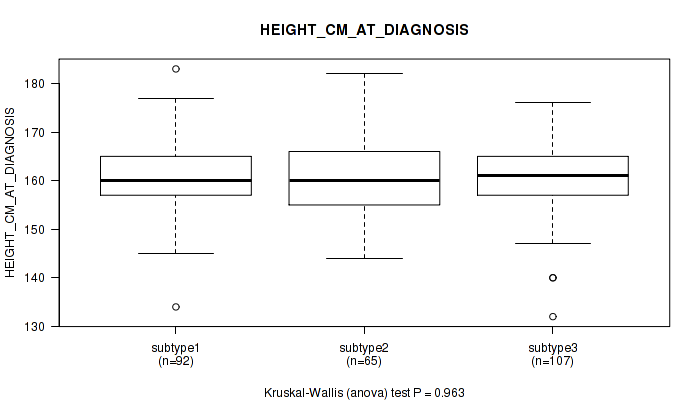
P value = 0.633 (Fisher's exact test), Q value = 0.83
Table S274. Clustering Approach #7: 'MIRSEQ CNMF' versus Clinical Feature #35: 'CORPUS_INVOLVEMENT'
| nPatients | ABSENT | PRESENT |
|---|---|---|
| ALL | 99 | 19 |
| subtype1 | 34 | 8 |
| subtype2 | 33 | 7 |
| subtype3 | 32 | 4 |
Figure S267. Get High-res Image Clustering Approach #7: 'MIRSEQ CNMF' versus Clinical Feature #35: 'CORPUS_INVOLVEMENT'
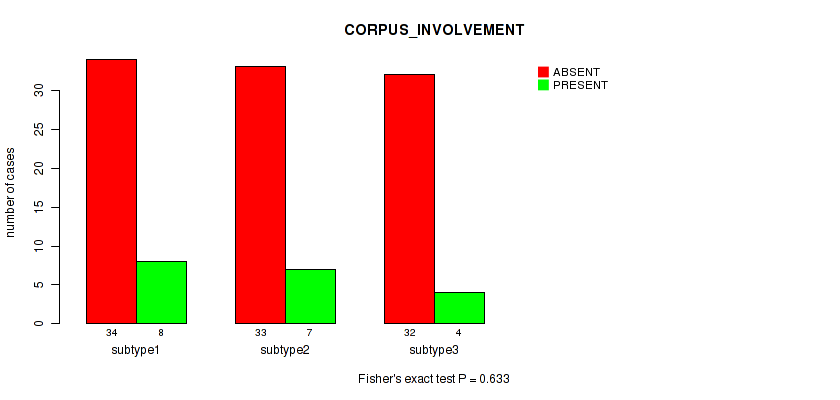
P value = 0.891 (Fisher's exact test), Q value = 0.96
Table S275. Clustering Approach #7: 'MIRSEQ CNMF' versus Clinical Feature #36: 'CHEMO_CONCURRENT_TYPE'
| nPatients | CARBOPLATIN | CISPLATIN | OTHER |
|---|---|---|---|
| ALL | 7 | 104 | 2 |
| subtype1 | 3 | 36 | 0 |
| subtype2 | 1 | 19 | 0 |
| subtype3 | 3 | 49 | 2 |
Figure S268. Get High-res Image Clustering Approach #7: 'MIRSEQ CNMF' versus Clinical Feature #36: 'CHEMO_CONCURRENT_TYPE'
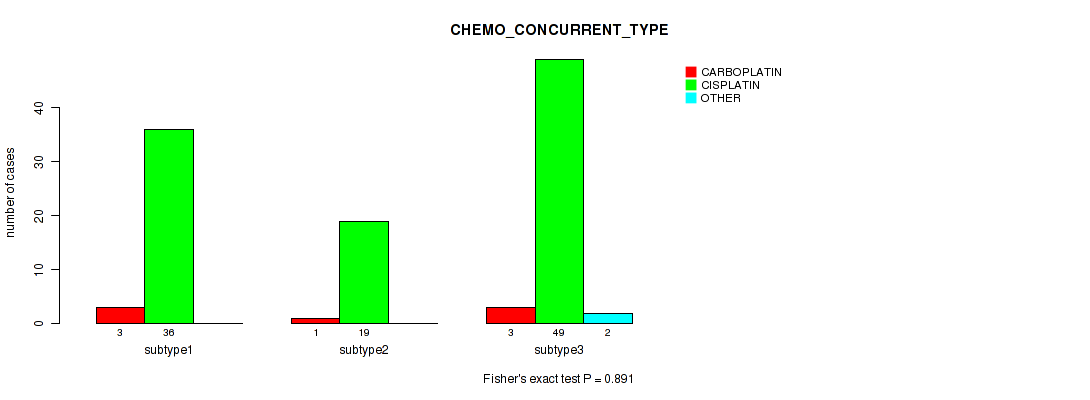
P value = 0.141 (Kruskal-Wallis (anova)), Q value = 0.47
Table S276. Clustering Approach #7: 'MIRSEQ CNMF' versus Clinical Feature #37: 'CERVIX_SUV_RESULTS'
| nPatients | Mean (Std.Dev) | |
|---|---|---|
| ALL | 17 | 13.2 (7.2) |
| subtype1 | 2 | 10.8 (5.2) |
| subtype2 | 6 | 9.5 (5.7) |
| subtype3 | 9 | 16.3 (7.5) |
Figure S269. Get High-res Image Clustering Approach #7: 'MIRSEQ CNMF' versus Clinical Feature #37: 'CERVIX_SUV_RESULTS'
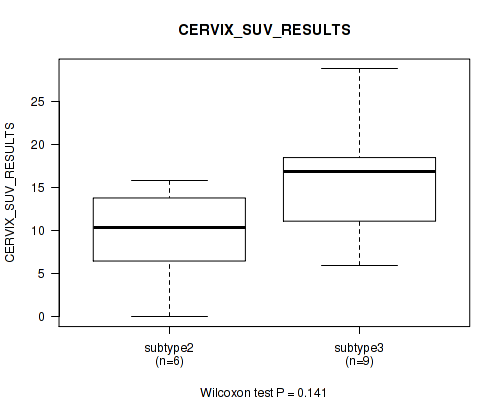
P value = 0.514 (Kruskal-Wallis (anova)), Q value = 0.76
Table S277. Clustering Approach #7: 'MIRSEQ CNMF' versus Clinical Feature #38: 'AGE_AT_DIAGNOSIS'
| nPatients | Mean (Std.Dev) | |
|---|---|---|
| ALL | 307 | 48.3 (13.8) |
| subtype1 | 103 | 47.8 (12.4) |
| subtype2 | 80 | 49.7 (13.5) |
| subtype3 | 124 | 47.8 (15.1) |
Figure S270. Get High-res Image Clustering Approach #7: 'MIRSEQ CNMF' versus Clinical Feature #38: 'AGE_AT_DIAGNOSIS'
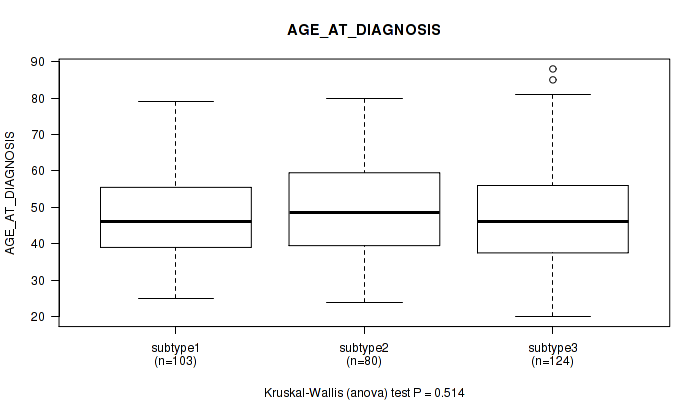
P value = 0.0215 (Fisher's exact test), Q value = 0.18
Table S278. Clustering Approach #7: 'MIRSEQ CNMF' versus Clinical Feature #39: 'CLINICAL_STAGE'
| nPatients | STAGE I | STAGE IA | STAGE IA1 | STAGE IA2 | STAGE IB | STAGE IB1 | STAGE IB2 | STAGE II | STAGE IIA | STAGE IIA1 | STAGE IIA2 | STAGE IIB | STAGE III | STAGE IIIA | STAGE IIIB | STAGE IVA | STAGE IVB |
|---|---|---|---|---|---|---|---|---|---|---|---|---|---|---|---|---|---|
| ALL | 5 | 1 | 1 | 1 | 38 | 78 | 39 | 5 | 9 | 5 | 7 | 44 | 1 | 3 | 42 | 9 | 12 |
| subtype1 | 2 | 0 | 0 | 0 | 8 | 30 | 15 | 1 | 3 | 1 | 5 | 11 | 0 | 2 | 13 | 4 | 8 |
| subtype2 | 0 | 1 | 1 | 1 | 9 | 28 | 10 | 1 | 3 | 2 | 2 | 7 | 0 | 0 | 10 | 2 | 1 |
| subtype3 | 3 | 0 | 0 | 0 | 21 | 20 | 14 | 3 | 3 | 2 | 0 | 26 | 1 | 1 | 19 | 3 | 3 |
Figure S271. Get High-res Image Clustering Approach #7: 'MIRSEQ CNMF' versus Clinical Feature #39: 'CLINICAL_STAGE'
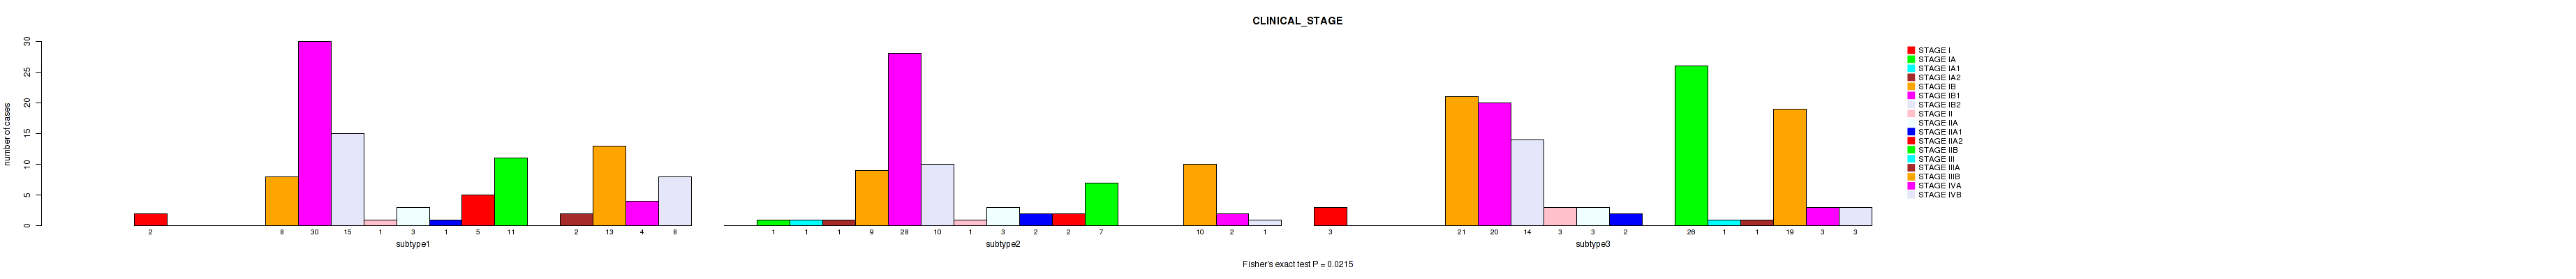
Table S279. Description of clustering approach #8: 'MIRSEQ CHIERARCHICAL'
| Cluster Labels | 1 | 2 | 3 | 4 | 5 |
|---|---|---|---|---|---|
| Number of samples | 60 | 102 | 74 | 26 | 45 |
P value = 0.607 (logrank test), Q value = 0.82
Table S280. Clustering Approach #8: 'MIRSEQ CHIERARCHICAL' versus Clinical Feature #1: 'Time to Death'
| nPatients | nDeath | Duration Range (Median), Month | |
|---|---|---|---|
| ALL | 290 | 71 | 0.0 - 210.7 (23.8) |
| subtype1 | 59 | 15 | 0.5 - 137.2 (18.8) |
| subtype2 | 96 | 21 | 0.0 - 160.4 (20.9) |
| subtype3 | 69 | 16 | 0.1 - 210.7 (31.4) |
| subtype4 | 22 | 7 | 3.0 - 209.6 (26.8) |
| subtype5 | 44 | 12 | 0.1 - 144.2 (17.9) |
Figure S272. Get High-res Image Clustering Approach #8: 'MIRSEQ CHIERARCHICAL' versus Clinical Feature #1: 'Time to Death'
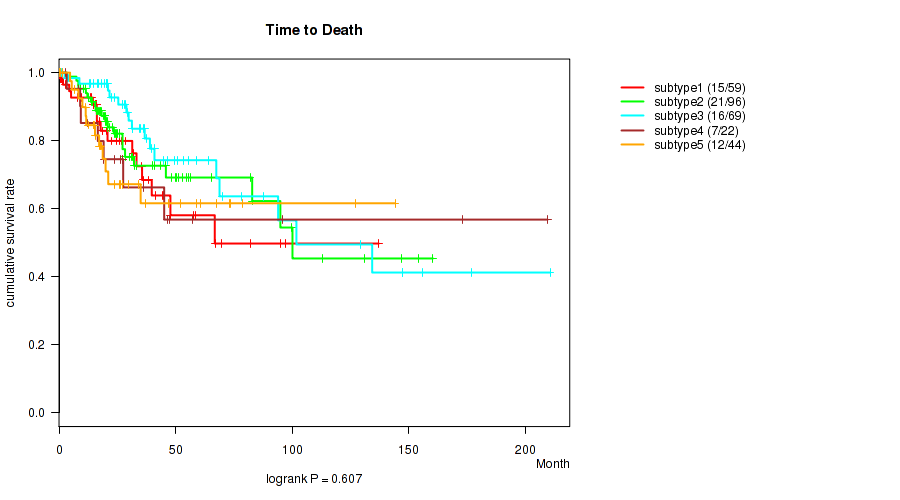
P value = 0.000125 (Kruskal-Wallis (anova)), Q value = 0.0038
Table S281. Clustering Approach #8: 'MIRSEQ CHIERARCHICAL' versus Clinical Feature #2: 'YEARS_TO_BIRTH'
| nPatients | Mean (Std.Dev) | |
|---|---|---|
| ALL | 305 | 48.2 (13.8) |
| subtype1 | 60 | 46.5 (12.5) |
| subtype2 | 101 | 50.4 (14.3) |
| subtype3 | 74 | 51.2 (14.1) |
| subtype4 | 25 | 49.9 (11.3) |
| subtype5 | 45 | 39.7 (11.6) |
Figure S273. Get High-res Image Clustering Approach #8: 'MIRSEQ CHIERARCHICAL' versus Clinical Feature #2: 'YEARS_TO_BIRTH'
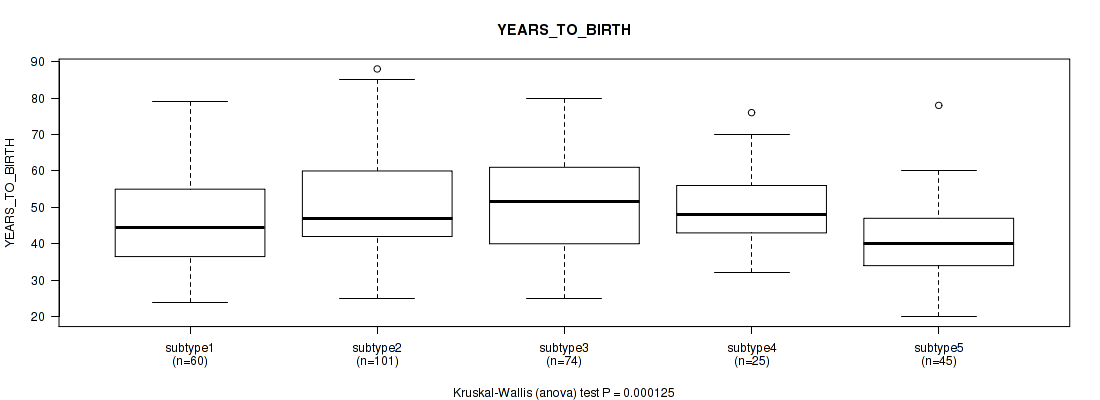
P value = 0.00365 (Fisher's exact test), Q value = 0.068
Table S282. Clustering Approach #8: 'MIRSEQ CHIERARCHICAL' versus Clinical Feature #3: 'PATHOLOGY_T_STAGE'
| nPatients | T1 | T2 | T3 | T4 |
|---|---|---|---|---|
| ALL | 141 | 72 | 21 | 10 |
| subtype1 | 35 | 13 | 2 | 1 |
| subtype2 | 32 | 29 | 12 | 6 |
| subtype3 | 47 | 11 | 2 | 1 |
| subtype4 | 8 | 9 | 2 | 1 |
| subtype5 | 19 | 10 | 3 | 1 |
Figure S274. Get High-res Image Clustering Approach #8: 'MIRSEQ CHIERARCHICAL' versus Clinical Feature #3: 'PATHOLOGY_T_STAGE'
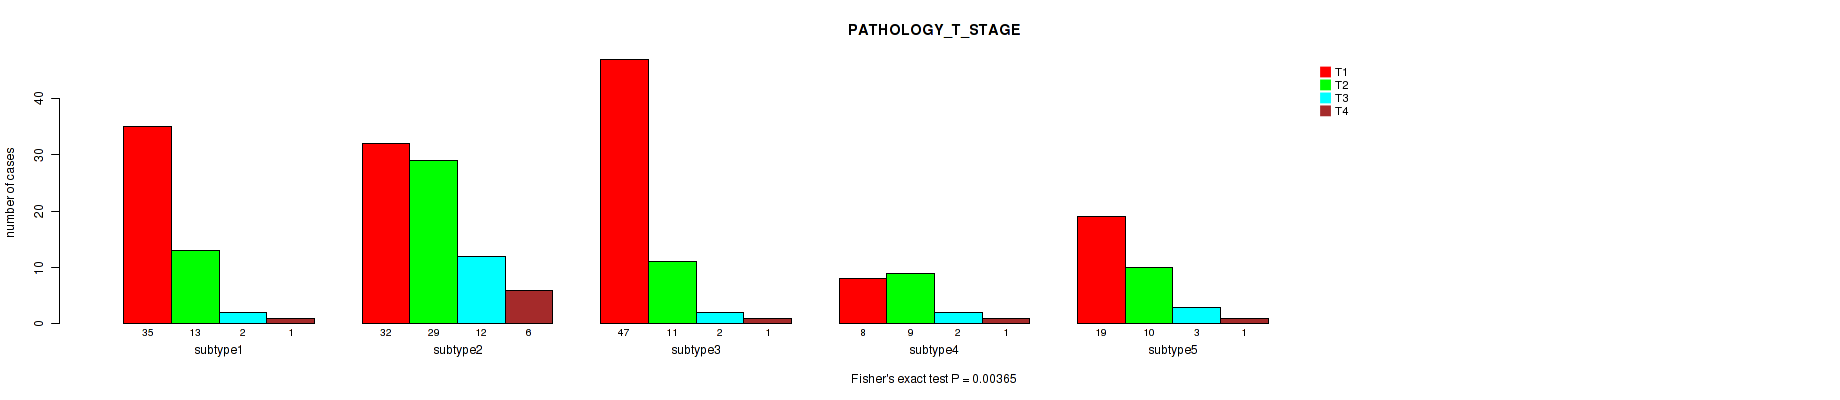
P value = 0.229 (Fisher's exact test), Q value = 0.55
Table S283. Clustering Approach #8: 'MIRSEQ CHIERARCHICAL' versus Clinical Feature #4: 'PATHOLOGY_N_STAGE'
| nPatients | 0 | 1 |
|---|---|---|
| ALL | 135 | 60 |
| subtype1 | 32 | 10 |
| subtype2 | 33 | 22 |
| subtype3 | 38 | 20 |
| subtype4 | 11 | 2 |
| subtype5 | 21 | 6 |
Figure S275. Get High-res Image Clustering Approach #8: 'MIRSEQ CHIERARCHICAL' versus Clinical Feature #4: 'PATHOLOGY_N_STAGE'
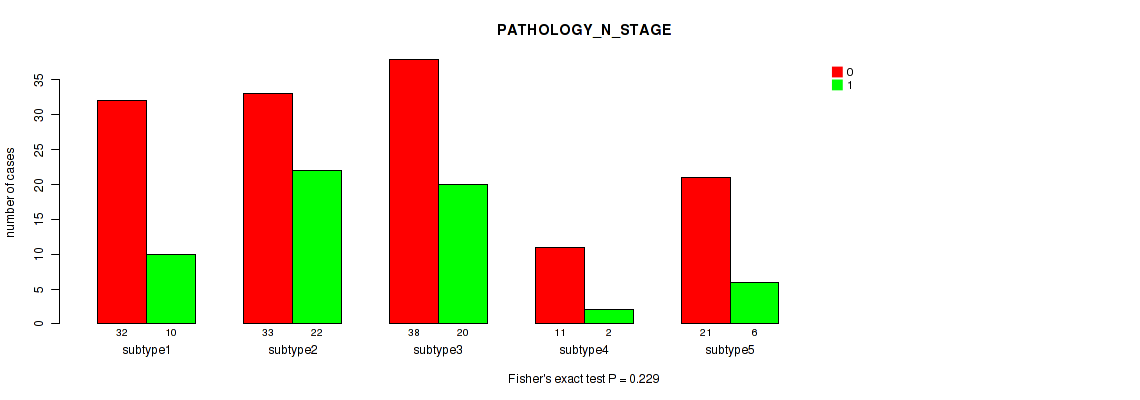
P value = 0.35 (Fisher's exact test), Q value = 0.67
Table S284. Clustering Approach #8: 'MIRSEQ CHIERARCHICAL' versus Clinical Feature #5: 'PATHOLOGY_M_STAGE'
| nPatients | 0 | 1 |
|---|---|---|
| ALL | 116 | 10 |
| subtype1 | 18 | 2 |
| subtype2 | 29 | 2 |
| subtype3 | 38 | 1 |
| subtype4 | 12 | 2 |
| subtype5 | 19 | 3 |
Figure S276. Get High-res Image Clustering Approach #8: 'MIRSEQ CHIERARCHICAL' versus Clinical Feature #5: 'PATHOLOGY_M_STAGE'
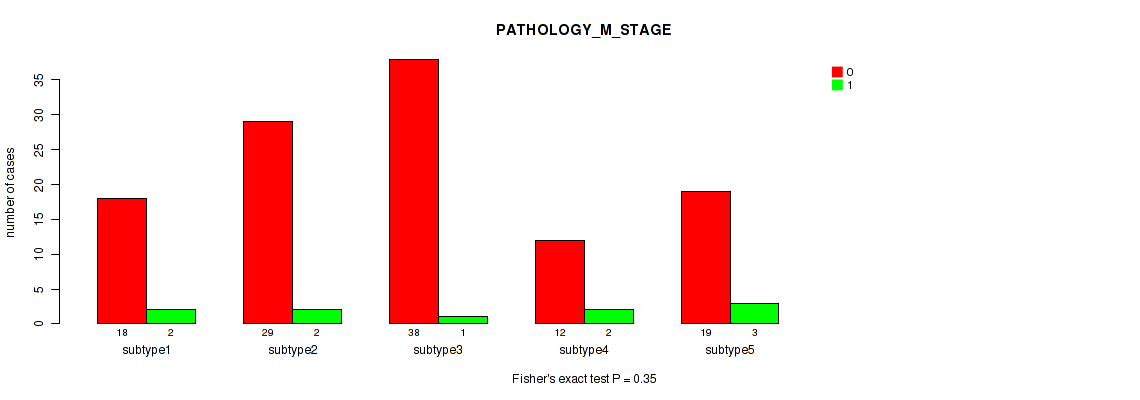
P value = 0.417 (Fisher's exact test), Q value = 0.73
Table S285. Clustering Approach #8: 'MIRSEQ CHIERARCHICAL' versus Clinical Feature #6: 'RADIATION_THERAPY'
| nPatients | NO | YES |
|---|---|---|
| ALL | 57 | 127 |
| subtype1 | 11 | 28 |
| subtype2 | 18 | 50 |
| subtype3 | 14 | 19 |
| subtype4 | 7 | 10 |
| subtype5 | 7 | 20 |
Figure S277. Get High-res Image Clustering Approach #8: 'MIRSEQ CHIERARCHICAL' versus Clinical Feature #6: 'RADIATION_THERAPY'
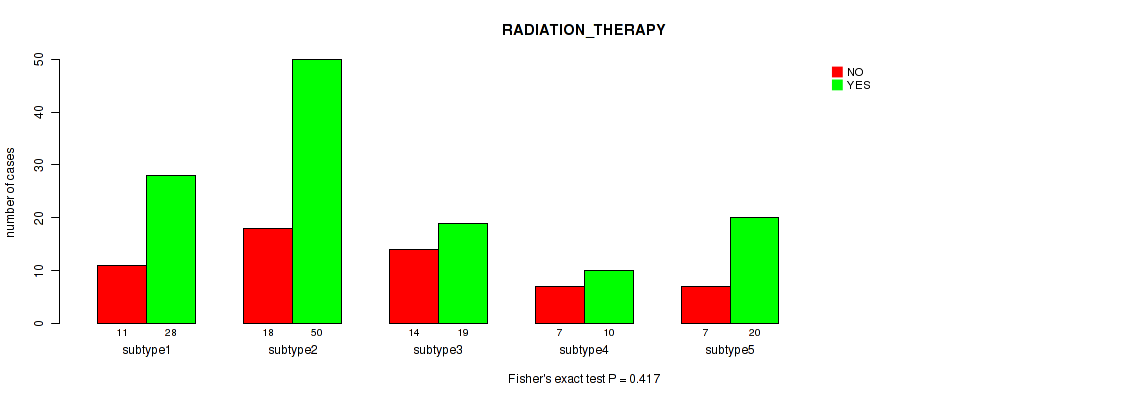
P value = 1e-05 (Fisher's exact test), Q value = 0.00044
Table S286. Clustering Approach #8: 'MIRSEQ CHIERARCHICAL' versus Clinical Feature #7: 'HISTOLOGICAL_TYPE'
| nPatients | ADENOSQUAMOUS | CERVICAL SQUAMOUS CELL CARCINOMA | ENDOCERVICAL ADENOCARCINOMA OF THE USUAL TYPE | ENDOCERVICAL TYPE OF ADENOCARCINOMA | ENDOMETRIOID ADENOCARCINOMA OF ENDOCERVIX | MUCINOUS ADENOCARCINOMA OF ENDOCERVICAL TYPE |
|---|---|---|---|---|---|---|
| ALL | 6 | 254 | 6 | 21 | 3 | 17 |
| subtype1 | 5 | 13 | 4 | 19 | 3 | 16 |
| subtype2 | 1 | 99 | 1 | 1 | 0 | 0 |
| subtype3 | 0 | 74 | 0 | 0 | 0 | 0 |
| subtype4 | 0 | 24 | 1 | 0 | 0 | 1 |
| subtype5 | 0 | 44 | 0 | 1 | 0 | 0 |
Figure S278. Get High-res Image Clustering Approach #8: 'MIRSEQ CHIERARCHICAL' versus Clinical Feature #7: 'HISTOLOGICAL_TYPE'
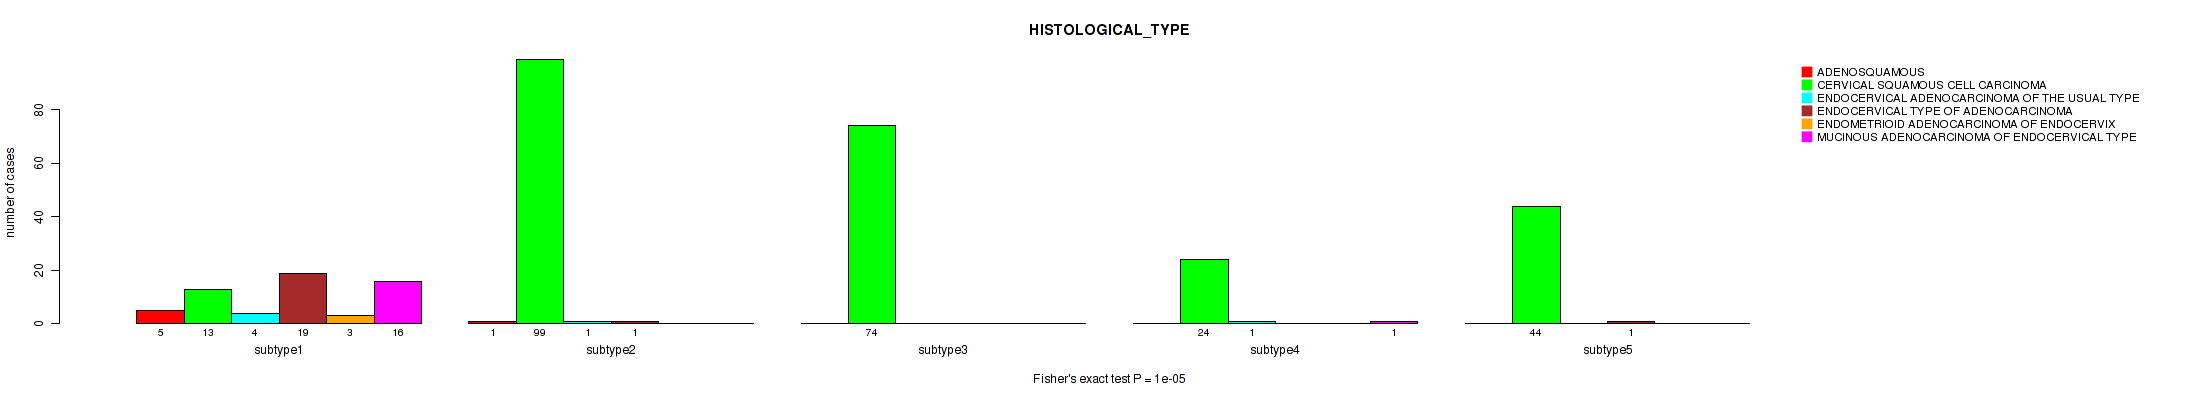
P value = 0.157 (Kruskal-Wallis (anova)), Q value = 0.48
Table S287. Clustering Approach #8: 'MIRSEQ CHIERARCHICAL' versus Clinical Feature #8: 'NUMBER_PACK_YEARS_SMOKED'
| nPatients | Mean (Std.Dev) | |
|---|---|---|
| ALL | 93 | 17.4 (14.1) |
| subtype1 | 18 | 14.7 (11.6) |
| subtype2 | 36 | 19.9 (17.8) |
| subtype3 | 21 | 20.2 (10.9) |
| subtype4 | 5 | 7.7 (8.3) |
| subtype5 | 13 | 13.4 (9.5) |
Figure S279. Get High-res Image Clustering Approach #8: 'MIRSEQ CHIERARCHICAL' versus Clinical Feature #8: 'NUMBER_PACK_YEARS_SMOKED'
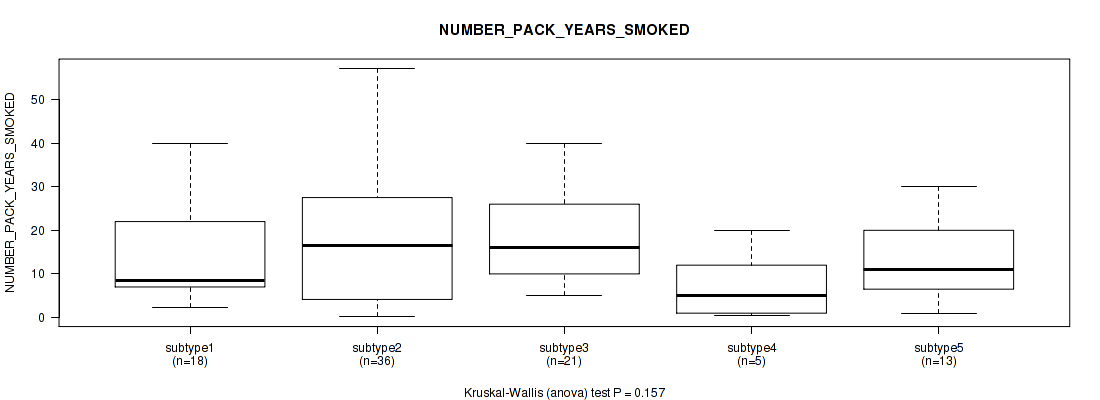
P value = 0.134 (Kruskal-Wallis (anova)), Q value = 0.47
Table S288. Clustering Approach #8: 'MIRSEQ CHIERARCHICAL' versus Clinical Feature #9: 'NUMBER_OF_LYMPH_NODES'
| nPatients | Mean (Std.Dev) | |
|---|---|---|
| ALL | 159 | 1.0 (2.4) |
| subtype1 | 40 | 0.6 (1.9) |
| subtype2 | 40 | 1.7 (3.1) |
| subtype3 | 50 | 1.0 (1.9) |
| subtype4 | 8 | 0.4 (0.7) |
| subtype5 | 21 | 0.9 (3.1) |
Figure S280. Get High-res Image Clustering Approach #8: 'MIRSEQ CHIERARCHICAL' versus Clinical Feature #9: 'NUMBER_OF_LYMPH_NODES'
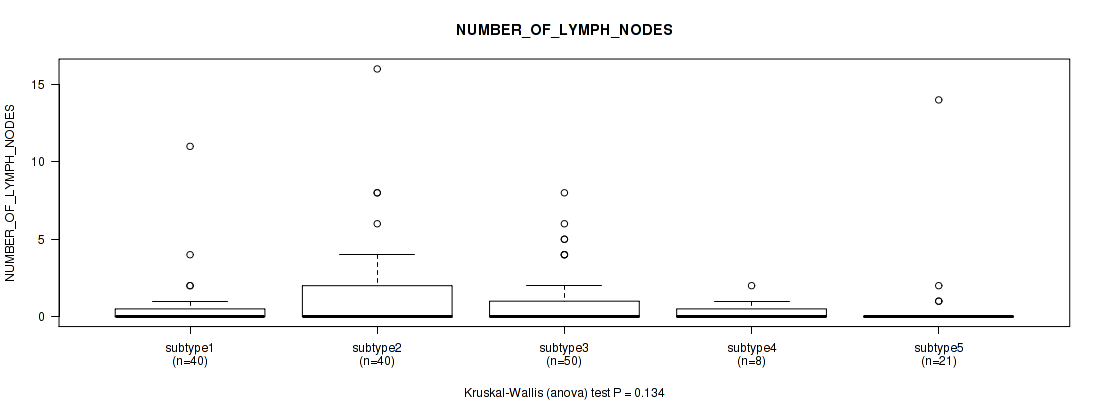
P value = 0.331 (Fisher's exact test), Q value = 0.67
Table S289. Clustering Approach #8: 'MIRSEQ CHIERARCHICAL' versus Clinical Feature #10: 'RACE'
| nPatients | AMERICAN INDIAN OR ALASKA NATIVE | ASIAN | BLACK OR AFRICAN AMERICAN | NATIVE HAWAIIAN OR OTHER PACIFIC ISLANDER | WHITE |
|---|---|---|---|---|---|
| ALL | 8 | 20 | 30 | 2 | 211 |
| subtype1 | 0 | 5 | 2 | 0 | 45 |
| subtype2 | 3 | 5 | 13 | 0 | 66 |
| subtype3 | 1 | 6 | 7 | 0 | 51 |
| subtype4 | 1 | 2 | 3 | 1 | 17 |
| subtype5 | 3 | 2 | 5 | 1 | 32 |
Figure S281. Get High-res Image Clustering Approach #8: 'MIRSEQ CHIERARCHICAL' versus Clinical Feature #10: 'RACE'
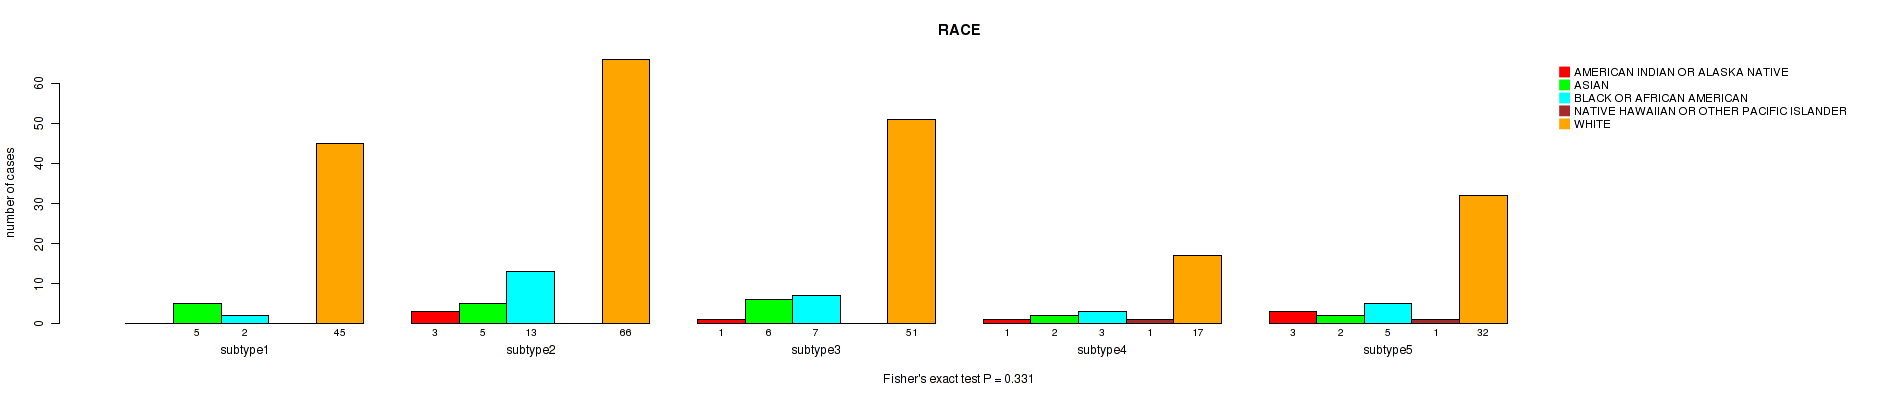
P value = 0.397 (Fisher's exact test), Q value = 0.71
Table S290. Clustering Approach #8: 'MIRSEQ CHIERARCHICAL' versus Clinical Feature #11: 'ETHNICITY'
| nPatients | HISPANIC OR LATINO | NOT HISPANIC OR LATINO |
|---|---|---|
| ALL | 24 | 170 |
| subtype1 | 4 | 31 |
| subtype2 | 10 | 52 |
| subtype3 | 3 | 50 |
| subtype4 | 3 | 16 |
| subtype5 | 4 | 21 |
Figure S282. Get High-res Image Clustering Approach #8: 'MIRSEQ CHIERARCHICAL' versus Clinical Feature #11: 'ETHNICITY'
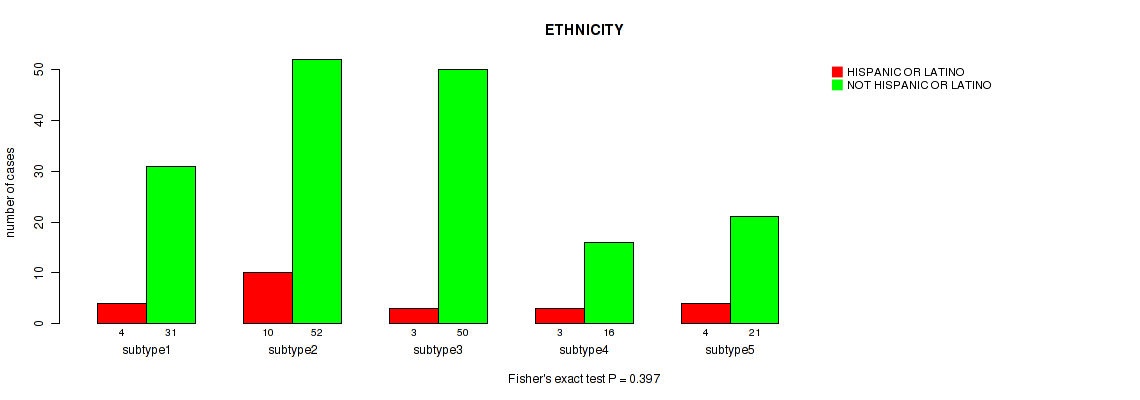
P value = 0.933 (Kruskal-Wallis (anova)), Q value = 0.97
Table S291. Clustering Approach #8: 'MIRSEQ CHIERARCHICAL' versus Clinical Feature #12: 'WEIGHT_KG_AT_DIAGNOSIS'
| nPatients | Mean (Std.Dev) | |
|---|---|---|
| ALL | 278 | 73.0 (21.5) |
| subtype1 | 54 | 71.7 (16.8) |
| subtype2 | 96 | 72.8 (20.3) |
| subtype3 | 65 | 75.2 (28.7) |
| subtype4 | 24 | 68.6 (17.0) |
| subtype5 | 39 | 74.6 (19.2) |
Figure S283. Get High-res Image Clustering Approach #8: 'MIRSEQ CHIERARCHICAL' versus Clinical Feature #12: 'WEIGHT_KG_AT_DIAGNOSIS'
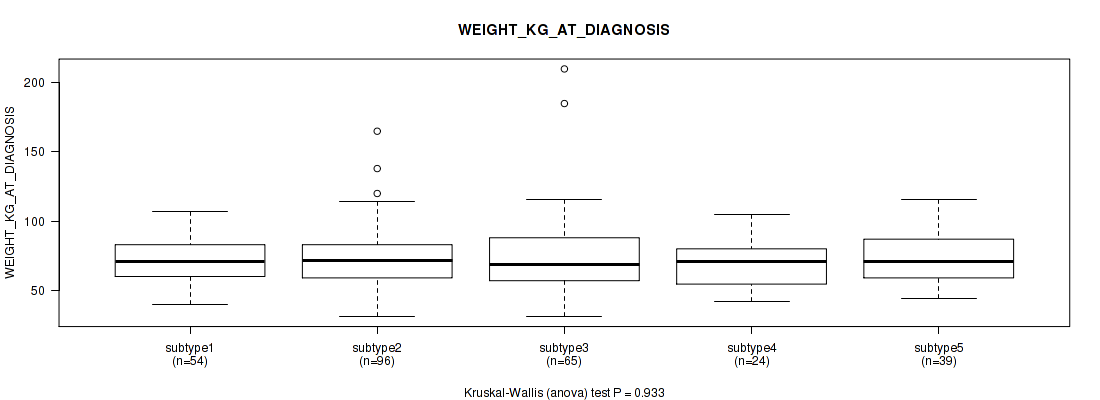
P value = 0.508 (Fisher's exact test), Q value = 0.75
Table S292. Clustering Approach #8: 'MIRSEQ CHIERARCHICAL' versus Clinical Feature #13: 'TUMOR_STATUS'
| nPatients | TUMOR FREE | WITH TUMOR |
|---|---|---|
| ALL | 191 | 78 |
| subtype1 | 38 | 17 |
| subtype2 | 64 | 25 |
| subtype3 | 50 | 15 |
| subtype4 | 12 | 9 |
| subtype5 | 27 | 12 |
Figure S284. Get High-res Image Clustering Approach #8: 'MIRSEQ CHIERARCHICAL' versus Clinical Feature #13: 'TUMOR_STATUS'
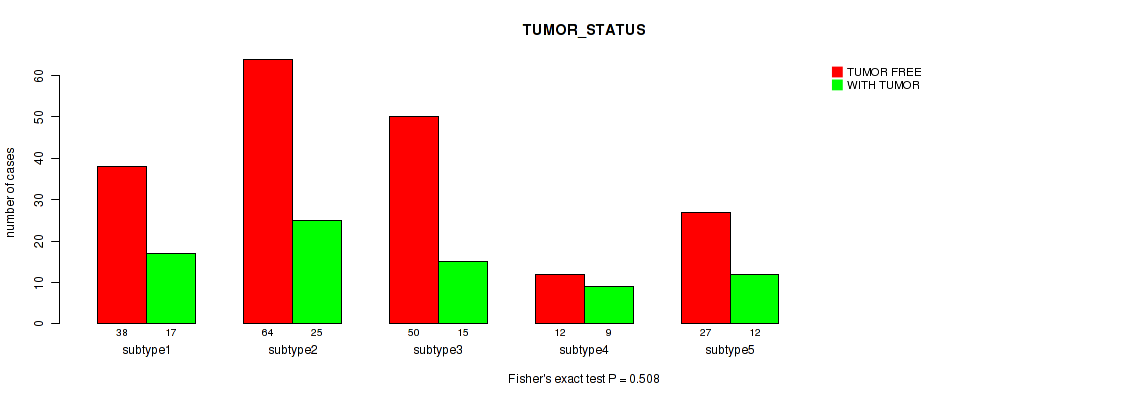
P value = 0.0223 (Fisher's exact test), Q value = 0.18
Table S293. Clustering Approach #8: 'MIRSEQ CHIERARCHICAL' versus Clinical Feature #14: 'NEOPLASM_HISTOLOGIC_GRADE'
| nPatients | G1 | G2 | G3 | G4 | GX |
|---|---|---|---|---|---|
| ALL | 18 | 136 | 120 | 1 | 24 |
| subtype1 | 6 | 27 | 21 | 0 | 6 |
| subtype2 | 4 | 46 | 38 | 0 | 8 |
| subtype3 | 6 | 39 | 28 | 0 | 1 |
| subtype4 | 0 | 14 | 9 | 0 | 3 |
| subtype5 | 2 | 10 | 24 | 1 | 6 |
Figure S285. Get High-res Image Clustering Approach #8: 'MIRSEQ CHIERARCHICAL' versus Clinical Feature #14: 'NEOPLASM_HISTOLOGIC_GRADE'
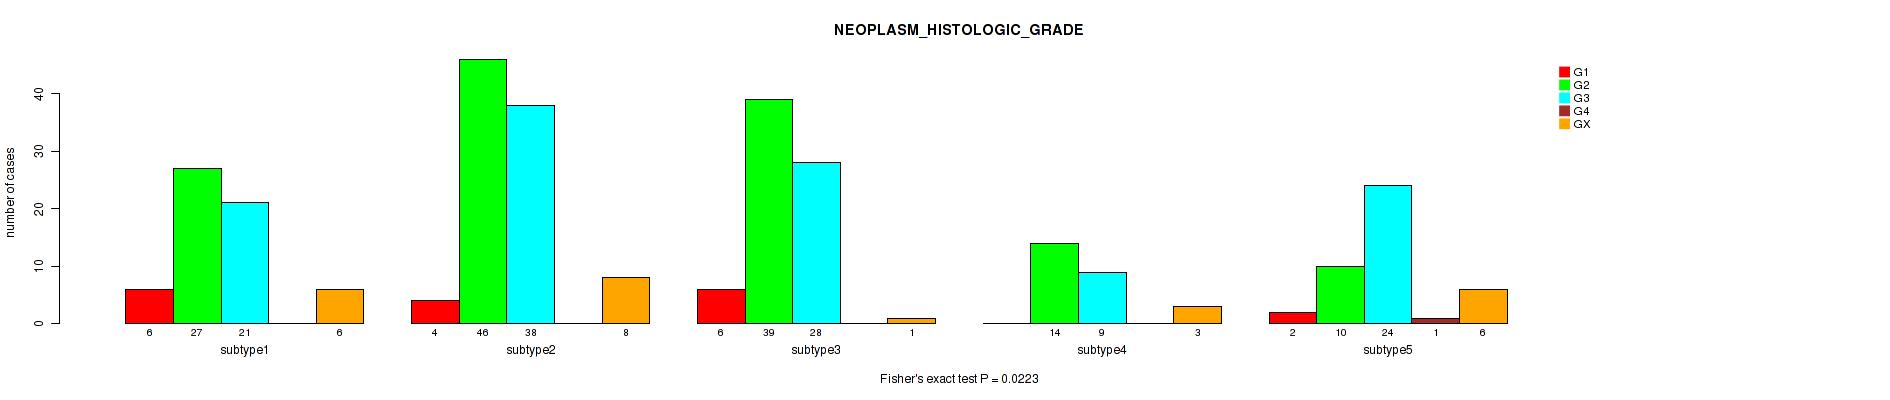
P value = 0.147 (Kruskal-Wallis (anova)), Q value = 0.47
Table S294. Clustering Approach #8: 'MIRSEQ CHIERARCHICAL' versus Clinical Feature #15: 'TOBACCO_SMOKING_YEAR_STOPPED'
| nPatients | Mean (Std.Dev) | |
|---|---|---|
| ALL | 43 | 1999.7 (13.6) |
| subtype1 | 9 | 2002.1 (12.6) |
| subtype2 | 16 | 2001.1 (17.6) |
| subtype3 | 8 | 1992.9 (10.7) |
| subtype4 | 3 | 1998.0 (10.5) |
| subtype5 | 7 | 2002.0 (7.7) |
Figure S286. Get High-res Image Clustering Approach #8: 'MIRSEQ CHIERARCHICAL' versus Clinical Feature #15: 'TOBACCO_SMOKING_YEAR_STOPPED'
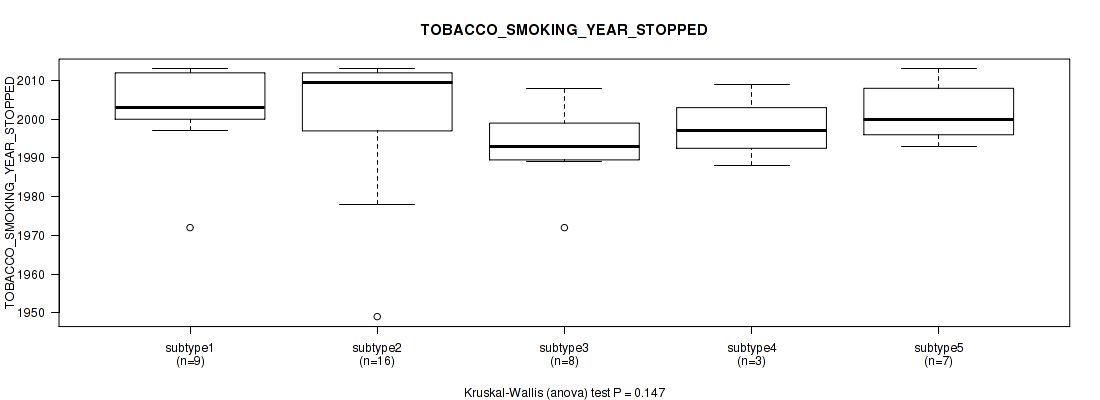
P value = 0.157 (Kruskal-Wallis (anova)), Q value = 0.48
Table S295. Clustering Approach #8: 'MIRSEQ CHIERARCHICAL' versus Clinical Feature #16: 'TOBACCO_SMOKING_PACK_YEARS_SMOKED'
| nPatients | Mean (Std.Dev) | |
|---|---|---|
| ALL | 93 | 17.4 (14.1) |
| subtype1 | 18 | 14.7 (11.6) |
| subtype2 | 36 | 19.9 (17.8) |
| subtype3 | 21 | 20.2 (10.9) |
| subtype4 | 5 | 7.7 (8.3) |
| subtype5 | 13 | 13.4 (9.5) |
Figure S287. Get High-res Image Clustering Approach #8: 'MIRSEQ CHIERARCHICAL' versus Clinical Feature #16: 'TOBACCO_SMOKING_PACK_YEARS_SMOKED'
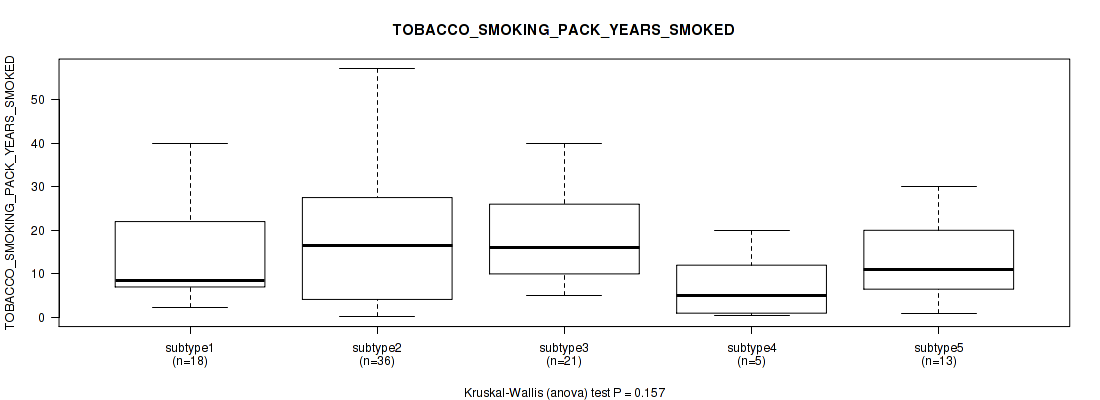
P value = 0.367 (Fisher's exact test), Q value = 0.69
Table S296. Clustering Approach #8: 'MIRSEQ CHIERARCHICAL' versus Clinical Feature #17: 'TOBACCO_SMOKING_HISTORY'
| nPatients | CURRENT REFORMED SMOKER FOR < OR = 15 YEARS | CURRENT REFORMED SMOKER FOR > 15 YEARS | CURRENT REFORMED SMOKER, DURATION NOT SPECIFIED | CURRENT SMOKER | LIFELONG NON-SMOKER |
|---|---|---|---|---|---|
| ALL | 40 | 9 | 4 | 64 | 146 |
| subtype1 | 9 | 1 | 0 | 11 | 34 |
| subtype2 | 16 | 2 | 1 | 21 | 45 |
| subtype3 | 4 | 6 | 2 | 17 | 34 |
| subtype4 | 3 | 0 | 0 | 5 | 14 |
| subtype5 | 8 | 0 | 1 | 10 | 19 |
Figure S288. Get High-res Image Clustering Approach #8: 'MIRSEQ CHIERARCHICAL' versus Clinical Feature #17: 'TOBACCO_SMOKING_HISTORY'
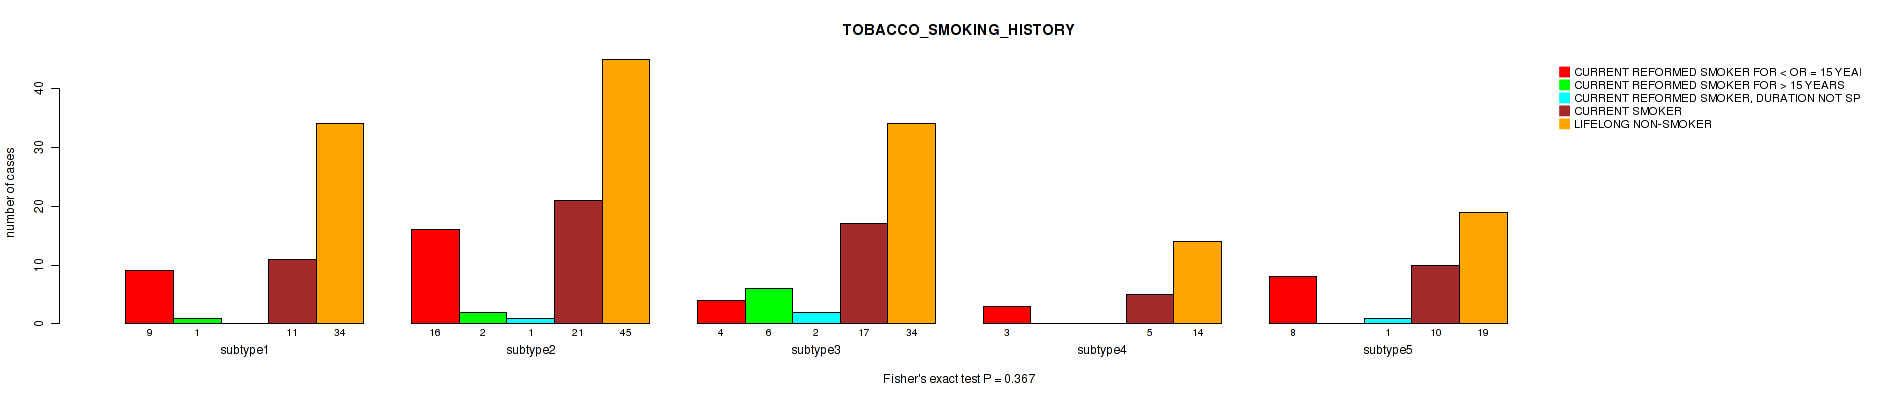
P value = 0.764 (Kruskal-Wallis (anova)), Q value = 0.89
Table S297. Clustering Approach #8: 'MIRSEQ CHIERARCHICAL' versus Clinical Feature #18: 'AGEBEGANSMOKINGINYEARS'
| nPatients | Mean (Std.Dev) | |
|---|---|---|
| ALL | 85 | 21.1 (7.7) |
| subtype1 | 17 | 19.8 (4.7) |
| subtype2 | 32 | 21.9 (8.9) |
| subtype3 | 16 | 21.6 (6.9) |
| subtype4 | 5 | 24.8 (10.1) |
| subtype5 | 15 | 19.5 (8.0) |
Figure S289. Get High-res Image Clustering Approach #8: 'MIRSEQ CHIERARCHICAL' versus Clinical Feature #18: 'AGEBEGANSMOKINGINYEARS'
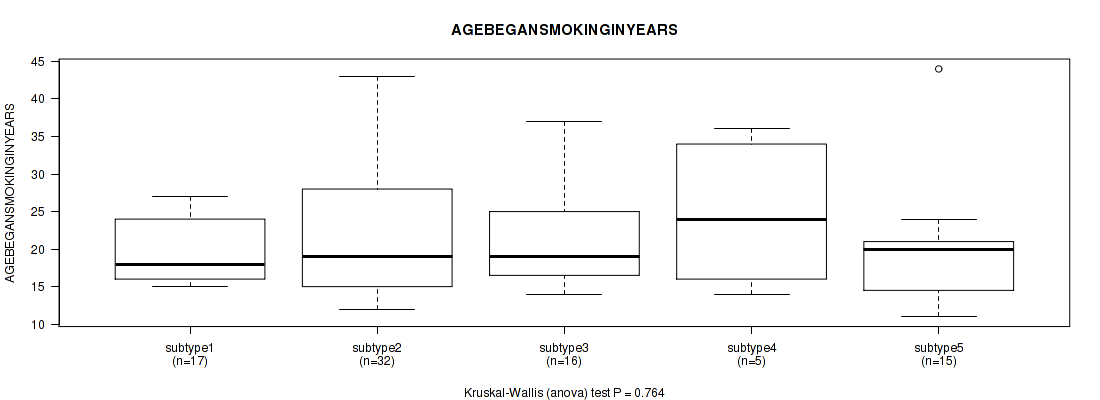
P value = 0.858 (Fisher's exact test), Q value = 0.94
Table S298. Clustering Approach #8: 'MIRSEQ CHIERARCHICAL' versus Clinical Feature #19: 'RADIATION_THERAPY_STATUS'
| nPatients | COMPLETED AS PLANNED | TREATMENT NOT COMPLETED |
|---|---|---|
| ALL | 29 | 3 |
| subtype1 | 3 | 0 |
| subtype2 | 7 | 0 |
| subtype3 | 9 | 1 |
| subtype4 | 2 | 0 |
| subtype5 | 8 | 2 |
Figure S290. Get High-res Image Clustering Approach #8: 'MIRSEQ CHIERARCHICAL' versus Clinical Feature #19: 'RADIATION_THERAPY_STATUS'
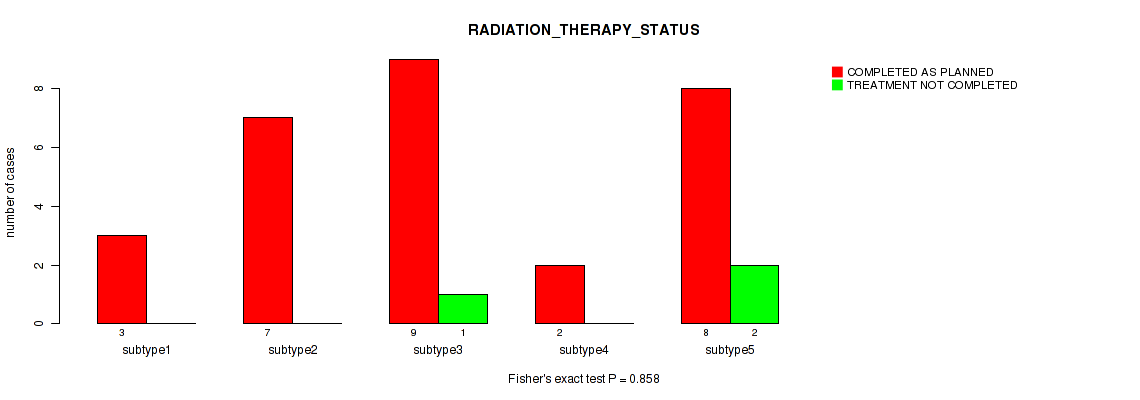
P value = 0.0673 (Kruskal-Wallis (anova)), Q value = 0.33
Table S299. Clustering Approach #8: 'MIRSEQ CHIERARCHICAL' versus Clinical Feature #20: 'PREGNANCIES_COUNT_TOTAL'
| nPatients | Mean (Std.Dev) | |
|---|---|---|
| ALL | 267 | 3.6 (2.6) |
| subtype1 | 54 | 2.9 (1.9) |
| subtype2 | 88 | 4.2 (3.2) |
| subtype3 | 63 | 3.6 (2.0) |
| subtype4 | 20 | 3.7 (2.2) |
| subtype5 | 42 | 3.2 (2.6) |
Figure S291. Get High-res Image Clustering Approach #8: 'MIRSEQ CHIERARCHICAL' versus Clinical Feature #20: 'PREGNANCIES_COUNT_TOTAL'
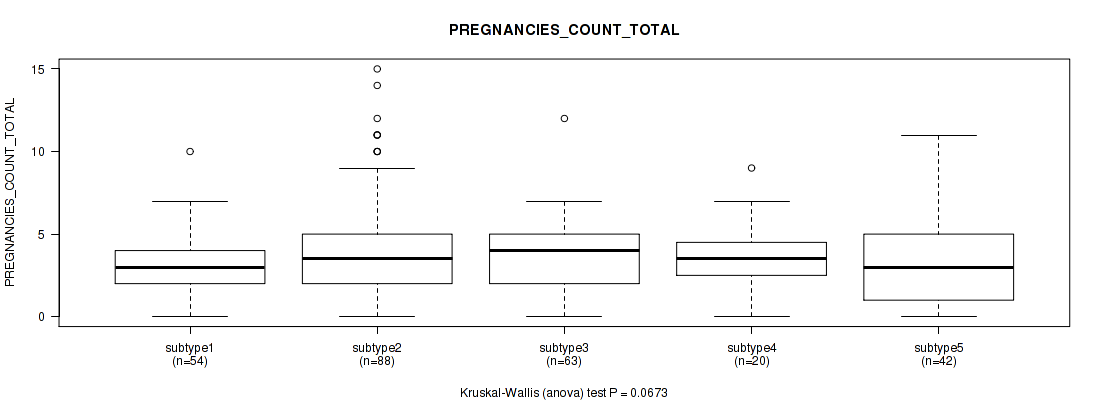
P value = 0.481 (Kruskal-Wallis (anova)), Q value = 0.74
Table S300. Clustering Approach #8: 'MIRSEQ CHIERARCHICAL' versus Clinical Feature #21: 'PREGNANCIES_COUNT_STILLBIRTH'
| nPatients | Mean (Std.Dev) | |
|---|---|---|
| ALL | 112 | 0.1 (0.3) |
| subtype1 | 20 | 0.1 (0.2) |
| subtype2 | 27 | 0.0 (0.2) |
| subtype3 | 39 | 0.2 (0.5) |
| subtype4 | 9 | 0.0 (0.0) |
| subtype5 | 17 | 0.0 (0.0) |
Figure S292. Get High-res Image Clustering Approach #8: 'MIRSEQ CHIERARCHICAL' versus Clinical Feature #21: 'PREGNANCIES_COUNT_STILLBIRTH'
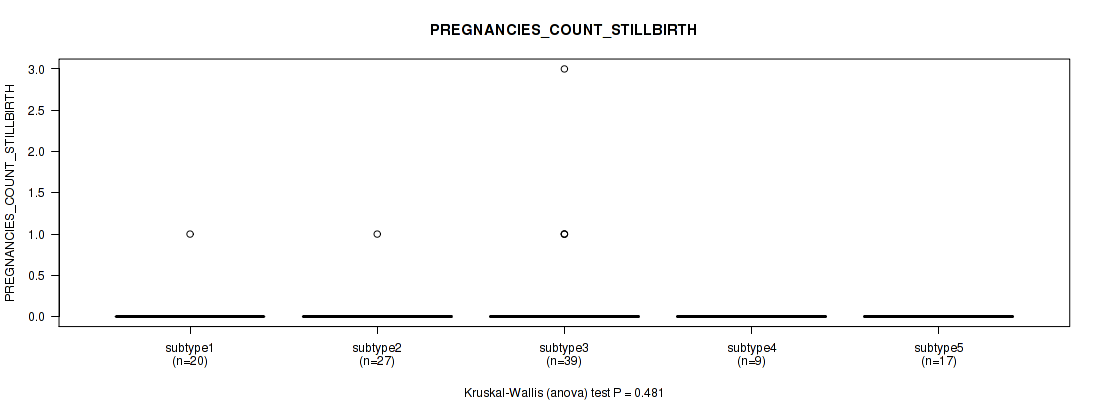
P value = 0.179 (Kruskal-Wallis (anova)), Q value = 0.51
Table S301. Clustering Approach #8: 'MIRSEQ CHIERARCHICAL' versus Clinical Feature #22: 'PREGNANCY_SPONTANEOUS_ABORTION_COUNT'
| nPatients | Mean (Std.Dev) | |
|---|---|---|
| ALL | 147 | 0.5 (0.9) |
| subtype1 | 23 | 0.7 (0.9) |
| subtype2 | 41 | 0.7 (1.3) |
| subtype3 | 47 | 0.4 (0.7) |
| subtype4 | 12 | 0.3 (0.7) |
| subtype5 | 24 | 0.5 (0.7) |
Figure S293. Get High-res Image Clustering Approach #8: 'MIRSEQ CHIERARCHICAL' versus Clinical Feature #22: 'PREGNANCY_SPONTANEOUS_ABORTION_COUNT'
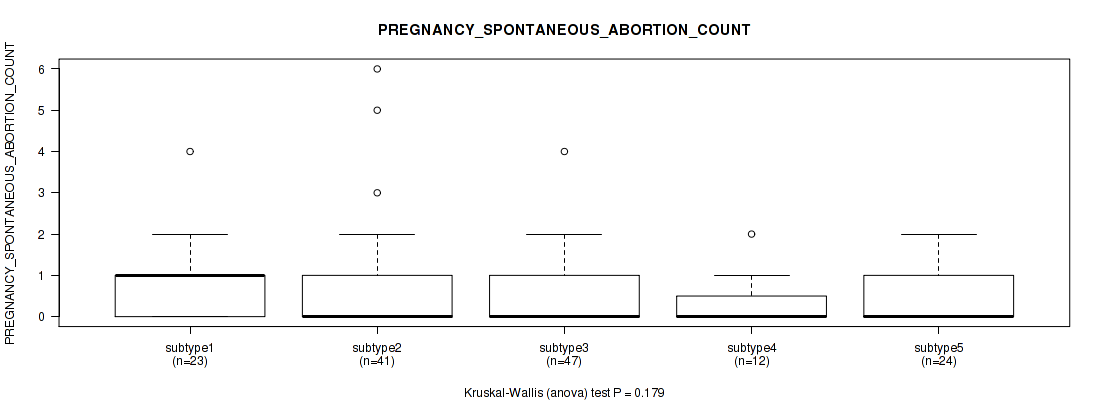
P value = 0.016 (Kruskal-Wallis (anova)), Q value = 0.16
Table S302. Clustering Approach #8: 'MIRSEQ CHIERARCHICAL' versus Clinical Feature #23: 'PREGNANCIES_COUNT_LIVE_BIRTH'
| nPatients | Mean (Std.Dev) | |
|---|---|---|
| ALL | 262 | 2.8 (2.0) |
| subtype1 | 52 | 2.2 (1.8) |
| subtype2 | 83 | 3.3 (2.4) |
| subtype3 | 66 | 2.7 (1.6) |
| subtype4 | 21 | 3.2 (1.9) |
| subtype5 | 40 | 2.6 (2.2) |
Figure S294. Get High-res Image Clustering Approach #8: 'MIRSEQ CHIERARCHICAL' versus Clinical Feature #23: 'PREGNANCIES_COUNT_LIVE_BIRTH'
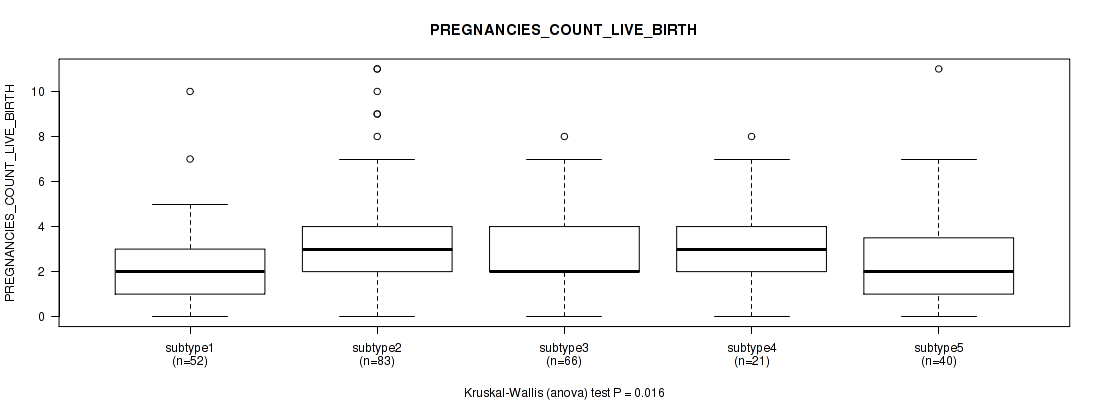
P value = 0.936 (Kruskal-Wallis (anova)), Q value = 0.97
Table S303. Clustering Approach #8: 'MIRSEQ CHIERARCHICAL' versus Clinical Feature #24: 'PREGNANCY_THERAPEUTIC_ABORTION_COUNT'
| nPatients | Mean (Std.Dev) | |
|---|---|---|
| ALL | 122 | 0.9 (1.8) |
| subtype1 | 22 | 0.5 (0.7) |
| subtype2 | 31 | 1.5 (3.1) |
| subtype3 | 41 | 0.7 (1.1) |
| subtype4 | 9 | 0.7 (1.4) |
| subtype5 | 19 | 0.6 (0.9) |
Figure S295. Get High-res Image Clustering Approach #8: 'MIRSEQ CHIERARCHICAL' versus Clinical Feature #24: 'PREGNANCY_THERAPEUTIC_ABORTION_COUNT'
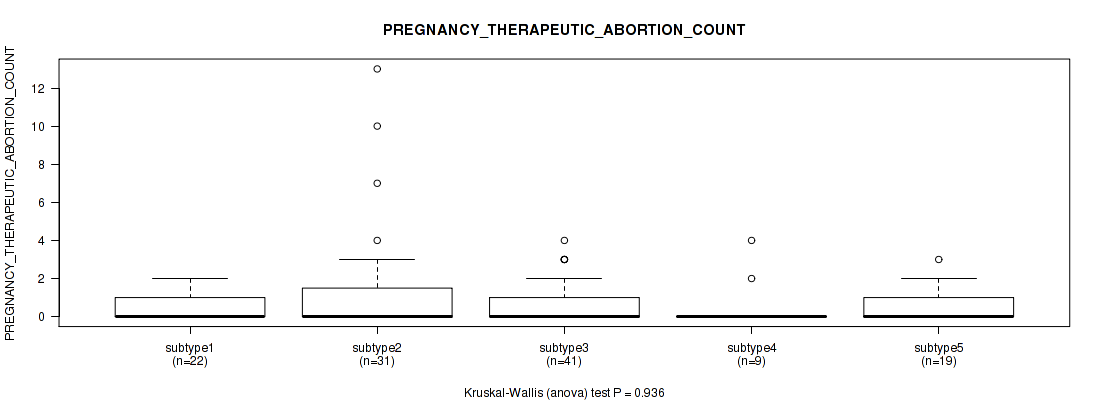
P value = 0.958 (Kruskal-Wallis (anova)), Q value = 0.99
Table S304. Clustering Approach #8: 'MIRSEQ CHIERARCHICAL' versus Clinical Feature #25: 'PREGNANCIES_COUNT_ECTOPIC'
| nPatients | Mean (Std.Dev) | |
|---|---|---|
| ALL | 116 | 0.1 (0.3) |
| subtype1 | 19 | 0.1 (0.3) |
| subtype2 | 30 | 0.1 (0.3) |
| subtype3 | 41 | 0.1 (0.4) |
| subtype4 | 9 | 0.1 (0.3) |
| subtype5 | 17 | 0.1 (0.2) |
Figure S296. Get High-res Image Clustering Approach #8: 'MIRSEQ CHIERARCHICAL' versus Clinical Feature #25: 'PREGNANCIES_COUNT_ECTOPIC'
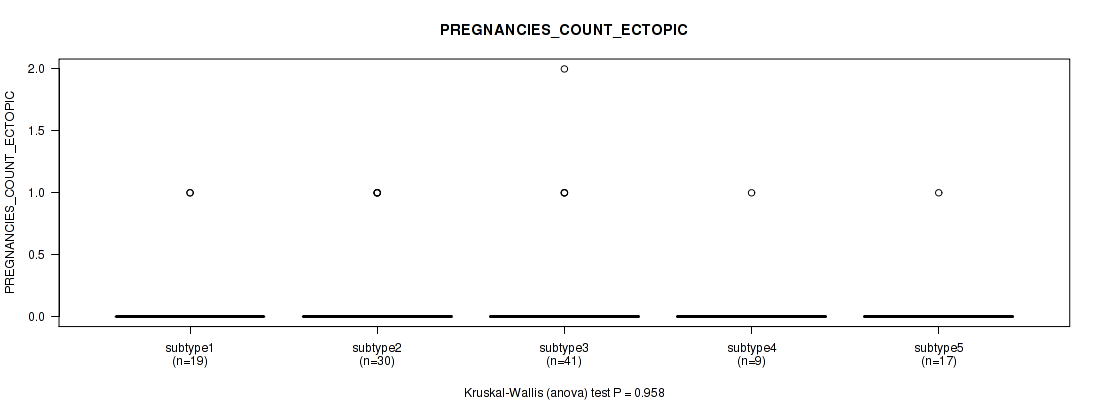
P value = 0.568 (Fisher's exact test), Q value = 0.78
Table S305. Clustering Approach #8: 'MIRSEQ CHIERARCHICAL' versus Clinical Feature #26: 'POS_LYMPH_NODE_LOCATION'
| nPatients | MACROSCOPIC PARAMETRIAL INVOLVEMENT | MICROSCOPIC PARAMETRIAL INVOLVEMENT | OTHER LOCATION, SPECIFY | POSITIVE BLADDER MARGIN | POSITIVE VAGINAL MARGIN |
|---|---|---|---|---|---|
| ALL | 3 | 8 | 40 | 1 | 10 |
| subtype1 | 2 | 0 | 7 | 0 | 2 |
| subtype2 | 0 | 3 | 8 | 1 | 4 |
| subtype3 | 1 | 3 | 16 | 0 | 3 |
| subtype4 | 0 | 0 | 2 | 0 | 0 |
| subtype5 | 0 | 2 | 7 | 0 | 1 |
Figure S297. Get High-res Image Clustering Approach #8: 'MIRSEQ CHIERARCHICAL' versus Clinical Feature #26: 'POS_LYMPH_NODE_LOCATION'
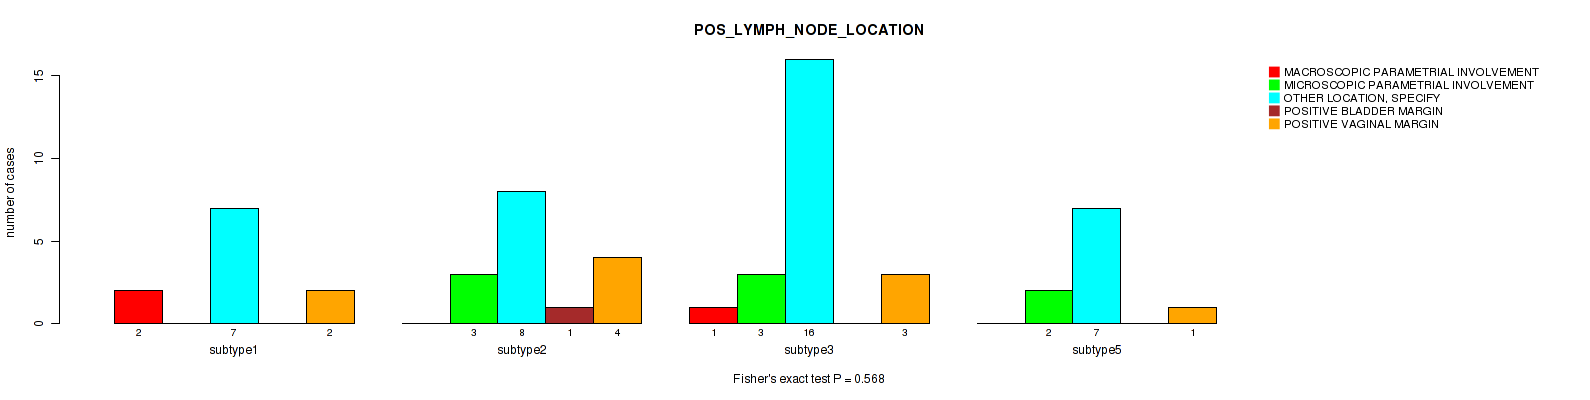
P value = 0.0141 (Fisher's exact test), Q value = 0.15
Table S306. Clustering Approach #8: 'MIRSEQ CHIERARCHICAL' versus Clinical Feature #27: 'MENOPAUSE_STATUS'
| nPatients | INDETERMINATE (NEITHER PRE OR POSTMENOPAUSAL) | PERI (6-12 MONTHS SINCE LAST MENSTRUAL PERIOD) | POST (PRIOR BILATERAL OVARIECTOMY OR >12 MO SINCE LMP WITH NO PRIOR HYSTERECTOMY) | PRE (<6 MONTHS SINCE LMP AND NO PRIOR BILATERAL OVARIECTOMY AND NOT ON ESTROGEN REPLACEMENT) |
|---|---|---|---|---|
| ALL | 2 | 25 | 84 | 125 |
| subtype1 | 0 | 5 | 16 | 30 |
| subtype2 | 1 | 9 | 29 | 37 |
| subtype3 | 1 | 5 | 30 | 23 |
| subtype4 | 0 | 4 | 5 | 9 |
| subtype5 | 0 | 2 | 4 | 26 |
Figure S298. Get High-res Image Clustering Approach #8: 'MIRSEQ CHIERARCHICAL' versus Clinical Feature #27: 'MENOPAUSE_STATUS'
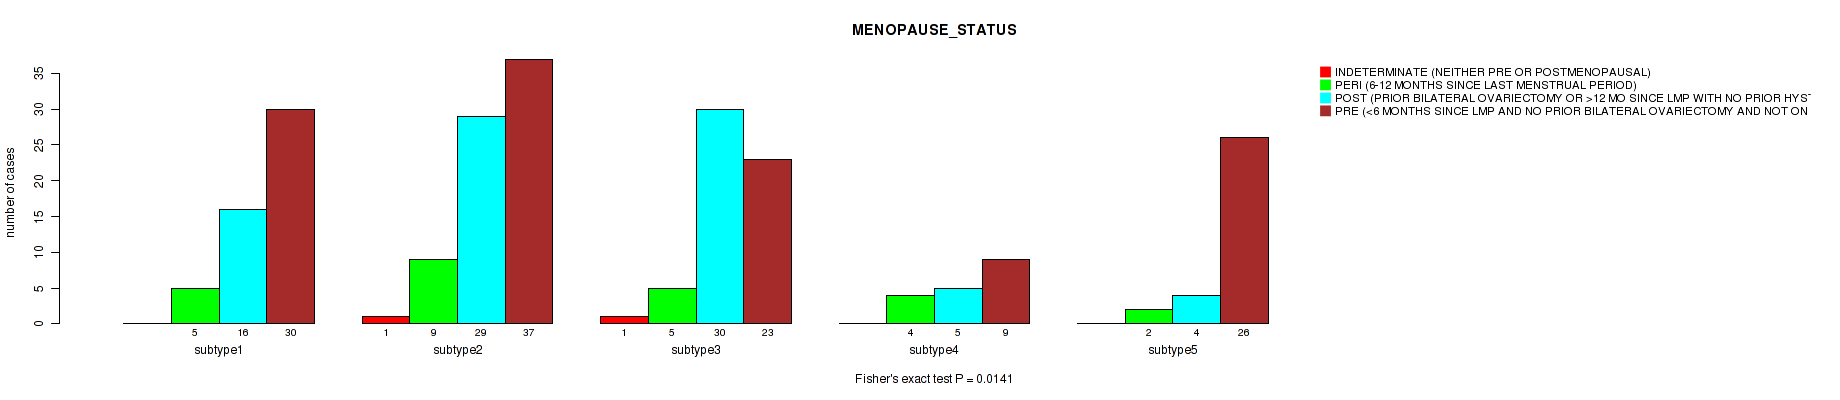
P value = 0.378 (Fisher's exact test), Q value = 0.7
Table S307. Clustering Approach #8: 'MIRSEQ CHIERARCHICAL' versus Clinical Feature #28: 'LYMPHOVASCULAR_INVOLVEMENT'
| nPatients | ABSENT | PRESENT |
|---|---|---|
| ALL | 72 | 80 |
| subtype1 | 21 | 16 |
| subtype2 | 17 | 24 |
| subtype3 | 19 | 29 |
| subtype4 | 5 | 3 |
| subtype5 | 10 | 8 |
Figure S299. Get High-res Image Clustering Approach #8: 'MIRSEQ CHIERARCHICAL' versus Clinical Feature #28: 'LYMPHOVASCULAR_INVOLVEMENT'
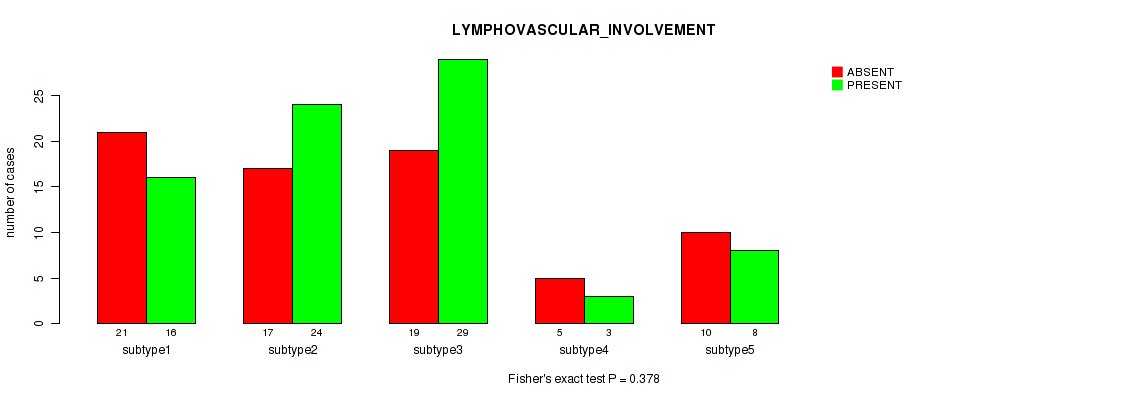
P value = 0.134 (Kruskal-Wallis (anova)), Q value = 0.47
Table S308. Clustering Approach #8: 'MIRSEQ CHIERARCHICAL' versus Clinical Feature #29: 'LYMPH_NODES_EXAMINED_HE_COUNT'
| nPatients | Mean (Std.Dev) | |
|---|---|---|
| ALL | 159 | 1.0 (2.4) |
| subtype1 | 40 | 0.6 (1.9) |
| subtype2 | 40 | 1.7 (3.1) |
| subtype3 | 50 | 1.0 (1.9) |
| subtype4 | 8 | 0.4 (0.7) |
| subtype5 | 21 | 0.9 (3.1) |
Figure S300. Get High-res Image Clustering Approach #8: 'MIRSEQ CHIERARCHICAL' versus Clinical Feature #29: 'LYMPH_NODES_EXAMINED_HE_COUNT'
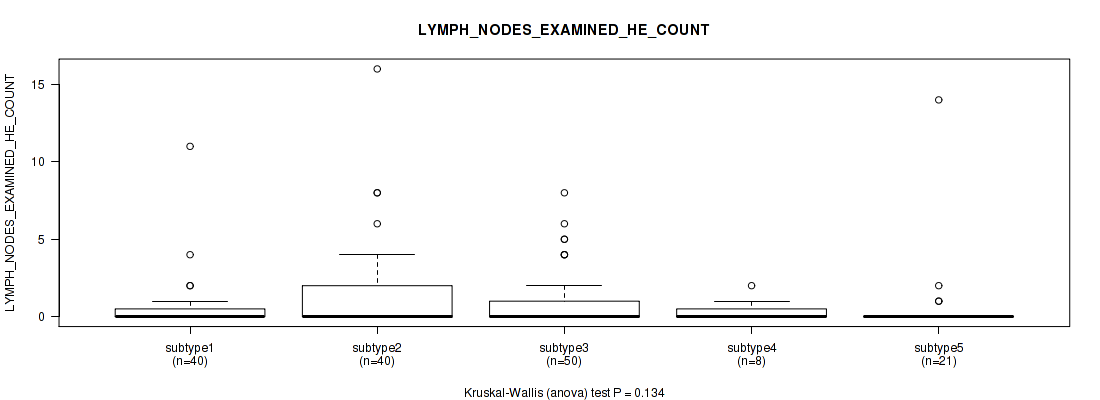
P value = 0.319 (Kruskal-Wallis (anova)), Q value = 0.65
Table S309. Clustering Approach #8: 'MIRSEQ CHIERARCHICAL' versus Clinical Feature #30: 'LYMPH_NODES_EXAMINED'
| nPatients | Mean (Std.Dev) | |
|---|---|---|
| ALL | 180 | 22.3 (12.6) |
| subtype1 | 43 | 21.8 (10.6) |
| subtype2 | 48 | 20.6 (12.0) |
| subtype3 | 55 | 24.6 (14.6) |
| subtype4 | 10 | 15.9 (8.3) |
| subtype5 | 24 | 23.8 (12.7) |
Figure S301. Get High-res Image Clustering Approach #8: 'MIRSEQ CHIERARCHICAL' versus Clinical Feature #30: 'LYMPH_NODES_EXAMINED'
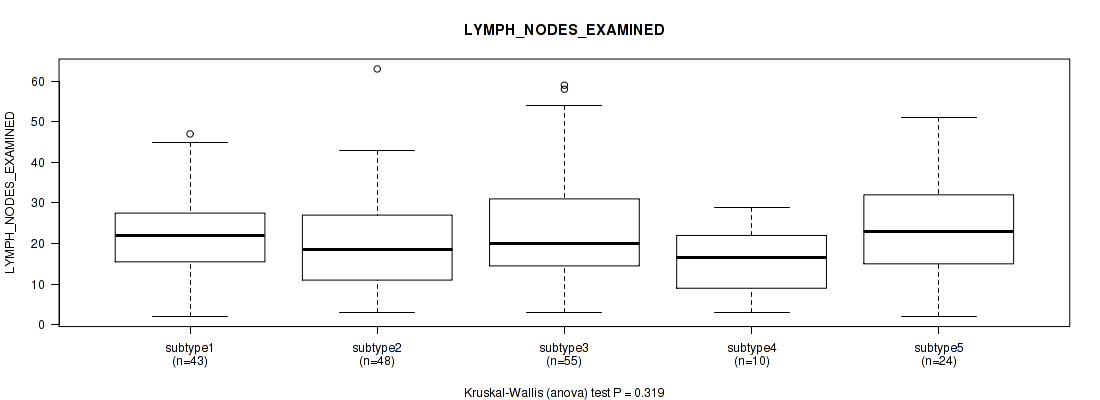
P value = 0.122 (Fisher's exact test), Q value = 0.46
Table S310. Clustering Approach #8: 'MIRSEQ CHIERARCHICAL' versus Clinical Feature #31: 'KERATINIZATION_SQUAMOUS_CELL'
| nPatients | KERATINIZING SQUAMOUS CELL CARCINOMA | NON-KERATINIZING SQUAMOUS CELL CARCINOMA |
|---|---|---|
| ALL | 55 | 120 |
| subtype1 | 0 | 11 |
| subtype2 | 21 | 46 |
| subtype3 | 20 | 34 |
| subtype4 | 4 | 12 |
| subtype5 | 10 | 17 |
Figure S302. Get High-res Image Clustering Approach #8: 'MIRSEQ CHIERARCHICAL' versus Clinical Feature #31: 'KERATINIZATION_SQUAMOUS_CELL'
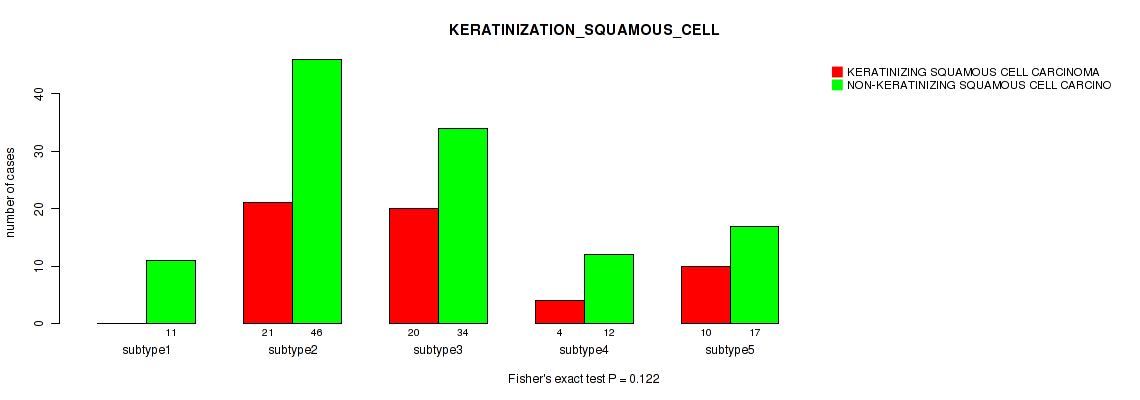
P value = 0.0235 (Kruskal-Wallis (anova)), Q value = 0.19
Table S311. Clustering Approach #8: 'MIRSEQ CHIERARCHICAL' versus Clinical Feature #32: 'INITIAL_PATHOLOGIC_DX_YEAR'
| nPatients | Mean (Std.Dev) | |
|---|---|---|
| ALL | 305 | 2008.3 (4.8) |
| subtype1 | 59 | 2009.4 (4.0) |
| subtype2 | 102 | 2008.9 (4.3) |
| subtype3 | 73 | 2007.3 (5.0) |
| subtype4 | 26 | 2008.0 (5.9) |
| subtype5 | 45 | 2007.5 (5.1) |
Figure S303. Get High-res Image Clustering Approach #8: 'MIRSEQ CHIERARCHICAL' versus Clinical Feature #32: 'INITIAL_PATHOLOGIC_DX_YEAR'
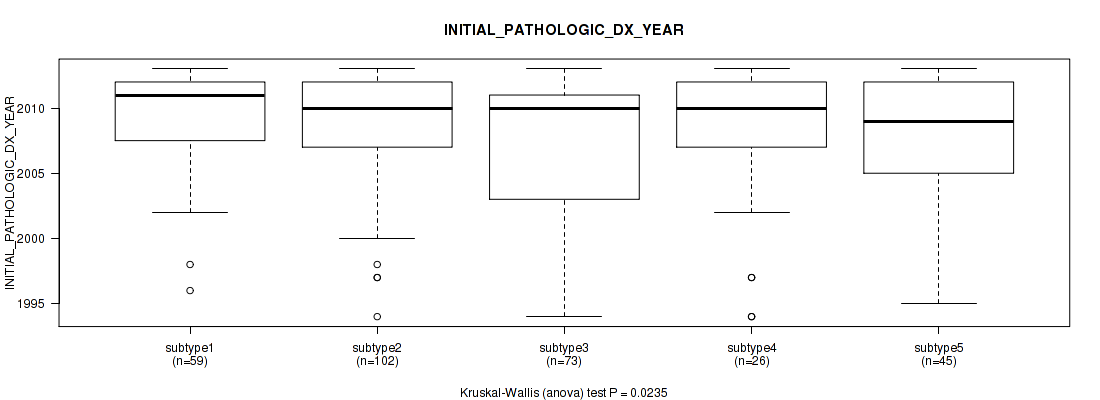
P value = 0.313 (Fisher's exact test), Q value = 0.64
Table S312. Clustering Approach #8: 'MIRSEQ CHIERARCHICAL' versus Clinical Feature #33: 'HISTORY_HORMONAL_CONTRACEPTIVES_USE'
| nPatients | CURRENT USER | FORMER USER | NEVER USED |
|---|---|---|---|
| ALL | 15 | 54 | 90 |
| subtype1 | 6 | 14 | 18 |
| subtype2 | 4 | 17 | 33 |
| subtype3 | 1 | 14 | 19 |
| subtype4 | 0 | 5 | 7 |
| subtype5 | 4 | 4 | 13 |
Figure S304. Get High-res Image Clustering Approach #8: 'MIRSEQ CHIERARCHICAL' versus Clinical Feature #33: 'HISTORY_HORMONAL_CONTRACEPTIVES_USE'
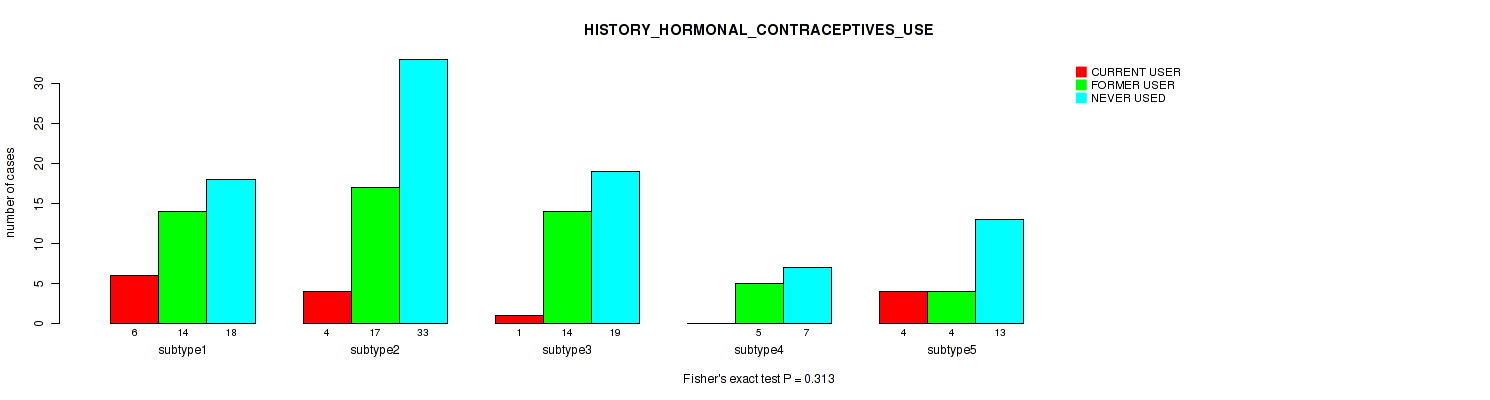
P value = 0.686 (Kruskal-Wallis (anova)), Q value = 0.85
Table S313. Clustering Approach #8: 'MIRSEQ CHIERARCHICAL' versus Clinical Feature #34: 'HEIGHT_CM_AT_DIAGNOSIS'
| nPatients | Mean (Std.Dev) | |
|---|---|---|
| ALL | 264 | 161.0 (7.3) |
| subtype1 | 52 | 161.1 (7.2) |
| subtype2 | 92 | 160.7 (7.6) |
| subtype3 | 62 | 160.5 (7.5) |
| subtype4 | 21 | 160.1 (7.4) |
| subtype5 | 37 | 162.7 (6.3) |
Figure S305. Get High-res Image Clustering Approach #8: 'MIRSEQ CHIERARCHICAL' versus Clinical Feature #34: 'HEIGHT_CM_AT_DIAGNOSIS'
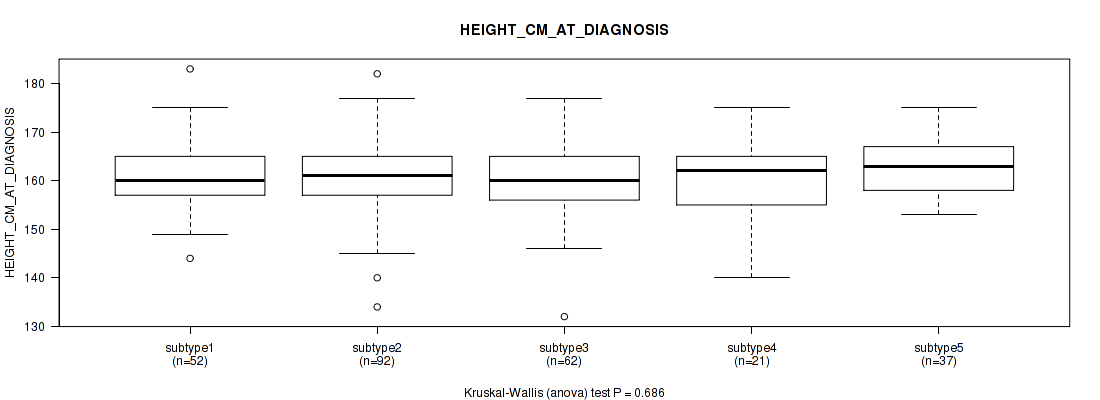
P value = 0.34 (Fisher's exact test), Q value = 0.67
Table S314. Clustering Approach #8: 'MIRSEQ CHIERARCHICAL' versus Clinical Feature #35: 'CORPUS_INVOLVEMENT'
| nPatients | ABSENT | PRESENT |
|---|---|---|
| ALL | 99 | 19 |
| subtype1 | 27 | 4 |
| subtype2 | 22 | 5 |
| subtype3 | 32 | 8 |
| subtype4 | 5 | 2 |
| subtype5 | 13 | 0 |
Figure S306. Get High-res Image Clustering Approach #8: 'MIRSEQ CHIERARCHICAL' versus Clinical Feature #35: 'CORPUS_INVOLVEMENT'
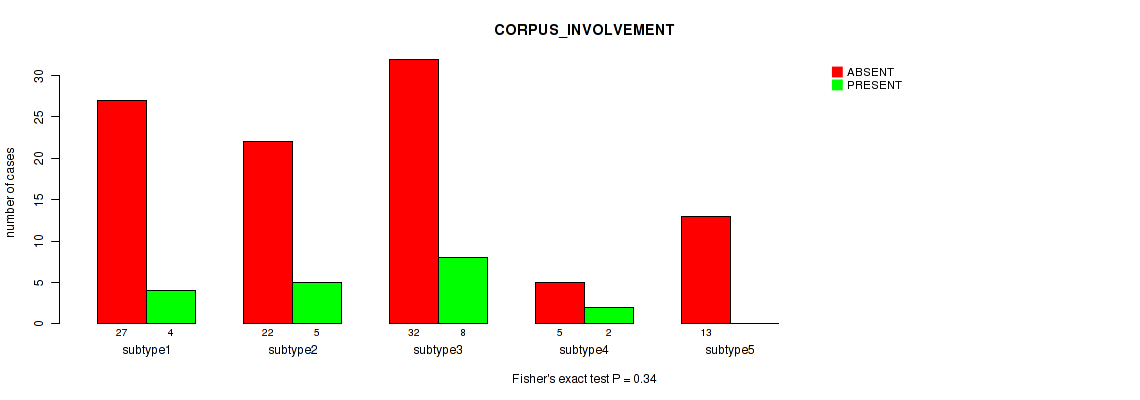
P value = 0.46 (Fisher's exact test), Q value = 0.74
Table S315. Clustering Approach #8: 'MIRSEQ CHIERARCHICAL' versus Clinical Feature #36: 'CHEMO_CONCURRENT_TYPE'
| nPatients | CARBOPLATIN | CISPLATIN | OTHER |
|---|---|---|---|
| ALL | 7 | 104 | 2 |
| subtype1 | 2 | 18 | 1 |
| subtype2 | 2 | 36 | 0 |
| subtype3 | 2 | 20 | 0 |
| subtype4 | 1 | 8 | 0 |
| subtype5 | 0 | 22 | 1 |
Figure S307. Get High-res Image Clustering Approach #8: 'MIRSEQ CHIERARCHICAL' versus Clinical Feature #36: 'CHEMO_CONCURRENT_TYPE'
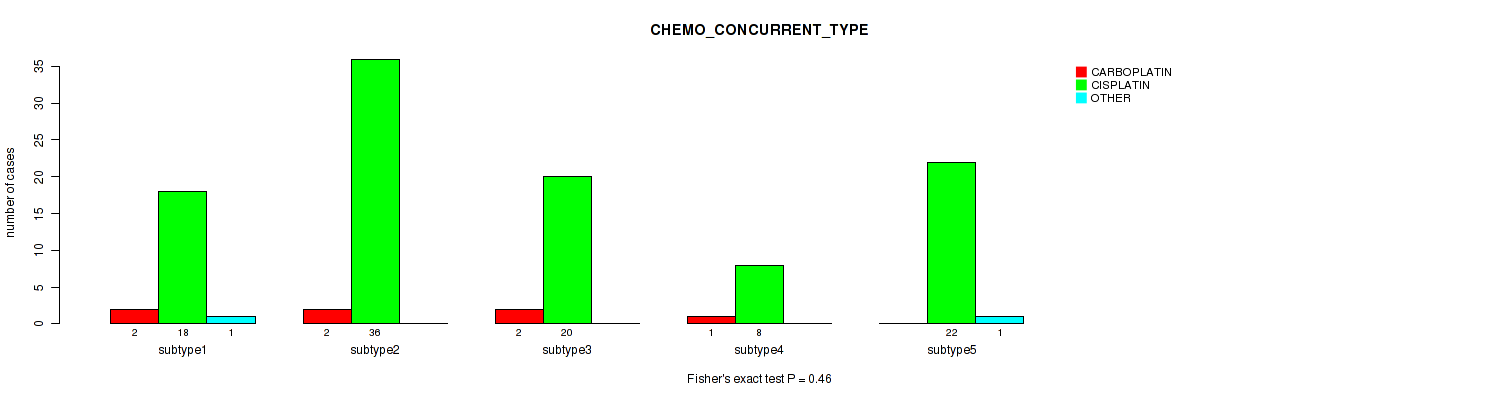
P value = 0.242 (Kruskal-Wallis (anova)), Q value = 0.57
Table S316. Clustering Approach #8: 'MIRSEQ CHIERARCHICAL' versus Clinical Feature #37: 'CERVIX_SUV_RESULTS'
| nPatients | Mean (Std.Dev) | |
|---|---|---|
| ALL | 17 | 13.2 (7.2) |
| subtype1 | 1 | 7.1 (NA) |
| subtype2 | 5 | 15.8 (8.6) |
| subtype3 | 8 | 10.5 (5.5) |
| subtype5 | 3 | 18.4 (7.3) |
Figure S308. Get High-res Image Clustering Approach #8: 'MIRSEQ CHIERARCHICAL' versus Clinical Feature #37: 'CERVIX_SUV_RESULTS'
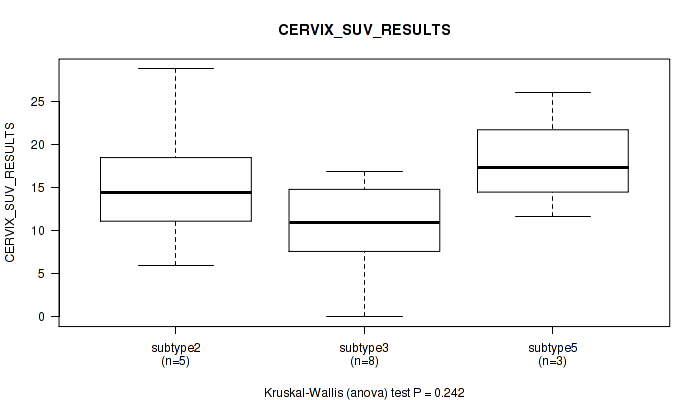
P value = 9.35e-05 (Kruskal-Wallis (anova)), Q value = 0.003
Table S317. Clustering Approach #8: 'MIRSEQ CHIERARCHICAL' versus Clinical Feature #38: 'AGE_AT_DIAGNOSIS'
| nPatients | Mean (Std.Dev) | |
|---|---|---|
| ALL | 307 | 48.3 (13.8) |
| subtype1 | 60 | 46.5 (12.5) |
| subtype2 | 102 | 50.4 (14.3) |
| subtype3 | 74 | 51.2 (14.1) |
| subtype4 | 26 | 50.4 (11.4) |
| subtype5 | 45 | 39.7 (11.6) |
Figure S309. Get High-res Image Clustering Approach #8: 'MIRSEQ CHIERARCHICAL' versus Clinical Feature #38: 'AGE_AT_DIAGNOSIS'
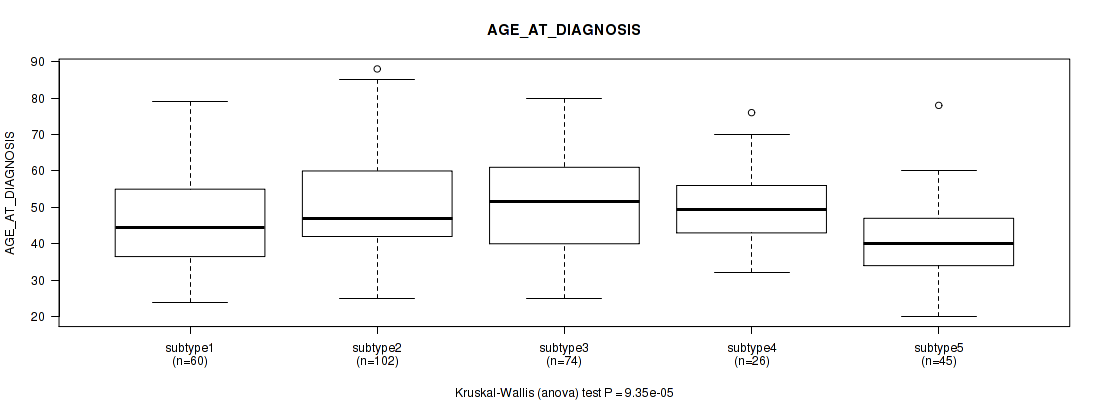
P value = 0.00066 (Fisher's exact test), Q value = 0.017
Table S318. Clustering Approach #8: 'MIRSEQ CHIERARCHICAL' versus Clinical Feature #39: 'CLINICAL_STAGE'
| nPatients | STAGE I | STAGE IA | STAGE IA1 | STAGE IA2 | STAGE IB | STAGE IB1 | STAGE IB2 | STAGE II | STAGE IIA | STAGE IIA1 | STAGE IIA2 | STAGE IIB | STAGE III | STAGE IIIA | STAGE IIIB | STAGE IVA | STAGE IVB |
|---|---|---|---|---|---|---|---|---|---|---|---|---|---|---|---|---|---|
| ALL | 5 | 1 | 1 | 1 | 38 | 78 | 39 | 5 | 9 | 5 | 7 | 44 | 1 | 3 | 42 | 9 | 12 |
| subtype1 | 1 | 0 | 0 | 0 | 5 | 26 | 9 | 1 | 2 | 1 | 0 | 5 | 0 | 0 | 6 | 1 | 3 |
| subtype2 | 2 | 0 | 0 | 0 | 7 | 17 | 12 | 3 | 1 | 0 | 3 | 18 | 0 | 3 | 19 | 5 | 6 |
| subtype3 | 0 | 1 | 1 | 1 | 13 | 25 | 8 | 1 | 2 | 1 | 1 | 5 | 0 | 0 | 11 | 2 | 1 |
| subtype4 | 2 | 0 | 0 | 0 | 6 | 1 | 2 | 0 | 1 | 1 | 2 | 5 | 1 | 0 | 3 | 0 | 2 |
| subtype5 | 0 | 0 | 0 | 0 | 7 | 9 | 8 | 0 | 3 | 2 | 1 | 11 | 0 | 0 | 3 | 1 | 0 |
Figure S310. Get High-res Image Clustering Approach #8: 'MIRSEQ CHIERARCHICAL' versus Clinical Feature #39: 'CLINICAL_STAGE'

Table S319. Description of clustering approach #9: 'MIRseq Mature CNMF subtypes'
| Cluster Labels | 1 | 2 | 3 |
|---|---|---|---|
| Number of samples | 129 | 78 | 87 |
P value = 0.908 (logrank test), Q value = 0.96
Table S320. Clustering Approach #9: 'MIRseq Mature CNMF subtypes' versus Clinical Feature #1: 'Time to Death'
| nPatients | nDeath | Duration Range (Median), Month | |
|---|---|---|---|
| ALL | 280 | 68 | 0.0 - 210.7 (24.0) |
| subtype1 | 123 | 25 | 0.0 - 210.7 (20.5) |
| subtype2 | 74 | 17 | 0.1 - 147.4 (20.8) |
| subtype3 | 83 | 26 | 0.1 - 177.0 (33.3) |
Figure S311. Get High-res Image Clustering Approach #9: 'MIRseq Mature CNMF subtypes' versus Clinical Feature #1: 'Time to Death'
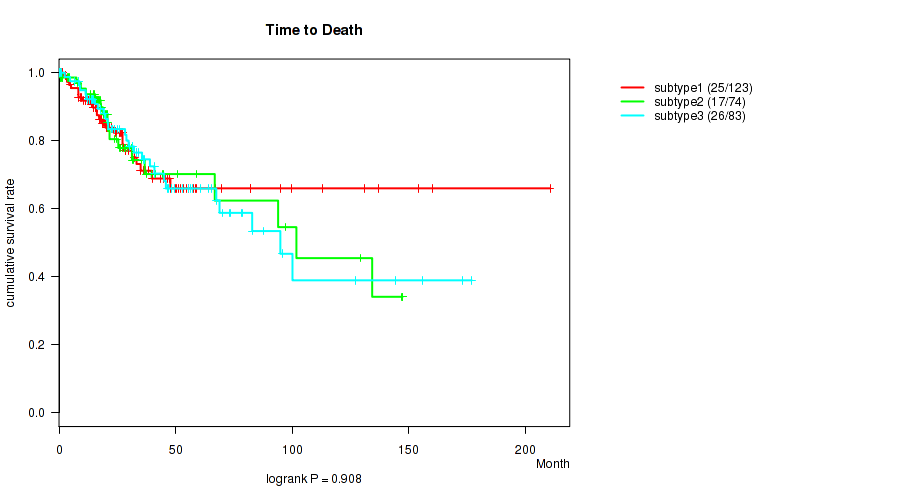
P value = 0.43 (Kruskal-Wallis (anova)), Q value = 0.73
Table S321. Clustering Approach #9: 'MIRseq Mature CNMF subtypes' versus Clinical Feature #2: 'YEARS_TO_BIRTH'
| nPatients | Mean (Std.Dev) | |
|---|---|---|
| ALL | 293 | 48.2 (13.8) |
| subtype1 | 129 | 49.0 (13.2) |
| subtype2 | 77 | 48.9 (14.2) |
| subtype3 | 87 | 46.4 (14.4) |
Figure S312. Get High-res Image Clustering Approach #9: 'MIRseq Mature CNMF subtypes' versus Clinical Feature #2: 'YEARS_TO_BIRTH'
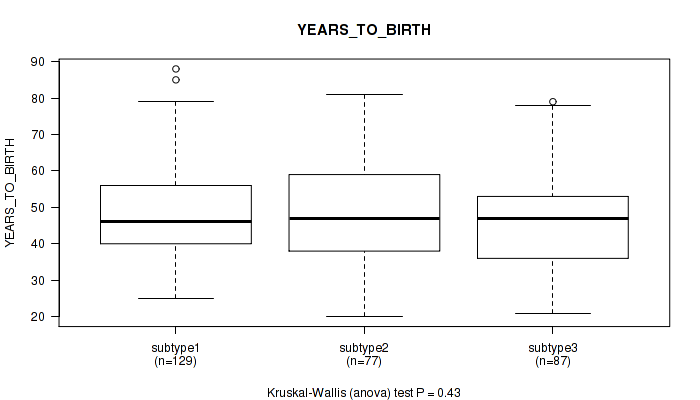
P value = 0.402 (Fisher's exact test), Q value = 0.71
Table S322. Clustering Approach #9: 'MIRseq Mature CNMF subtypes' versus Clinical Feature #3: 'PATHOLOGY_T_STAGE'
| nPatients | T1 | T2 | T3 | T4 |
|---|---|---|---|---|
| ALL | 136 | 68 | 19 | 9 |
| subtype1 | 53 | 33 | 12 | 6 |
| subtype2 | 39 | 15 | 3 | 1 |
| subtype3 | 44 | 20 | 4 | 2 |
Figure S313. Get High-res Image Clustering Approach #9: 'MIRseq Mature CNMF subtypes' versus Clinical Feature #3: 'PATHOLOGY_T_STAGE'
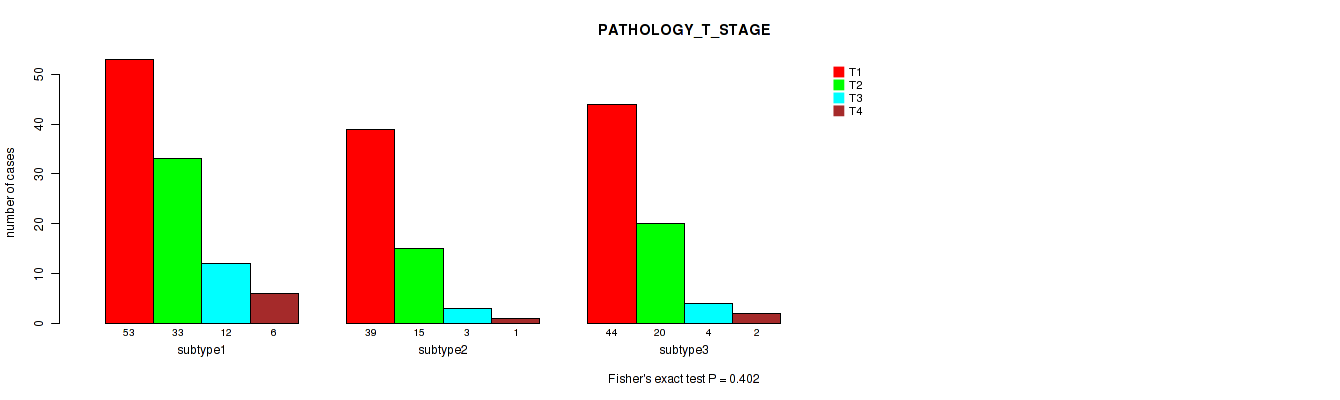
P value = 0.153 (Fisher's exact test), Q value = 0.48
Table S323. Clustering Approach #9: 'MIRseq Mature CNMF subtypes' versus Clinical Feature #4: 'PATHOLOGY_N_STAGE'
| nPatients | 0 | 1 |
|---|---|---|
| ALL | 130 | 57 |
| subtype1 | 52 | 16 |
| subtype2 | 41 | 17 |
| subtype3 | 37 | 24 |
Figure S314. Get High-res Image Clustering Approach #9: 'MIRseq Mature CNMF subtypes' versus Clinical Feature #4: 'PATHOLOGY_N_STAGE'
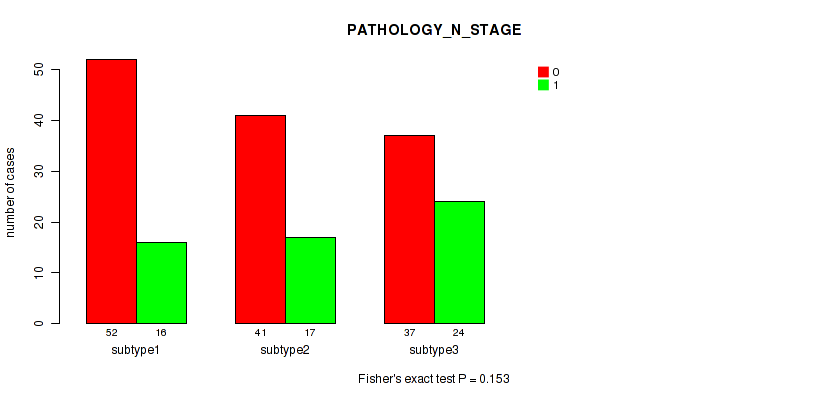
P value = 0.0637 (Fisher's exact test), Q value = 0.32
Table S324. Clustering Approach #9: 'MIRseq Mature CNMF subtypes' versus Clinical Feature #5: 'PATHOLOGY_M_STAGE'
| nPatients | 0 | 1 |
|---|---|---|
| ALL | 112 | 9 |
| subtype1 | 40 | 7 |
| subtype2 | 32 | 1 |
| subtype3 | 40 | 1 |
Figure S315. Get High-res Image Clustering Approach #9: 'MIRseq Mature CNMF subtypes' versus Clinical Feature #5: 'PATHOLOGY_M_STAGE'
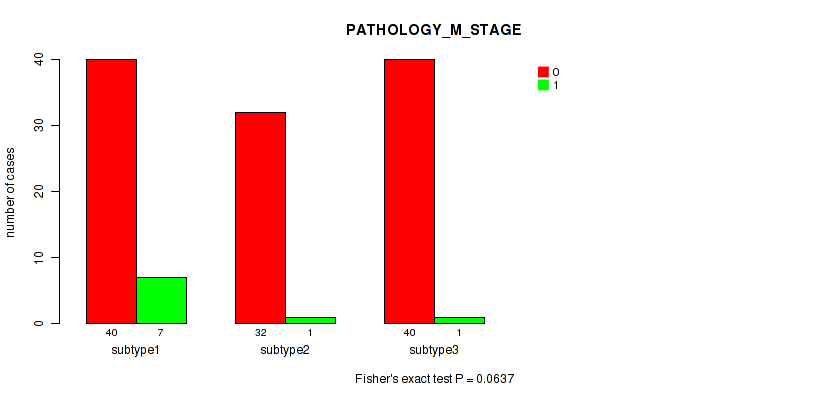
P value = 0.882 (Fisher's exact test), Q value = 0.96
Table S325. Clustering Approach #9: 'MIRseq Mature CNMF subtypes' versus Clinical Feature #6: 'RADIATION_THERAPY'
| nPatients | NO | YES |
|---|---|---|
| ALL | 54 | 123 |
| subtype1 | 31 | 65 |
| subtype2 | 11 | 27 |
| subtype3 | 12 | 31 |
Figure S316. Get High-res Image Clustering Approach #9: 'MIRseq Mature CNMF subtypes' versus Clinical Feature #6: 'RADIATION_THERAPY'
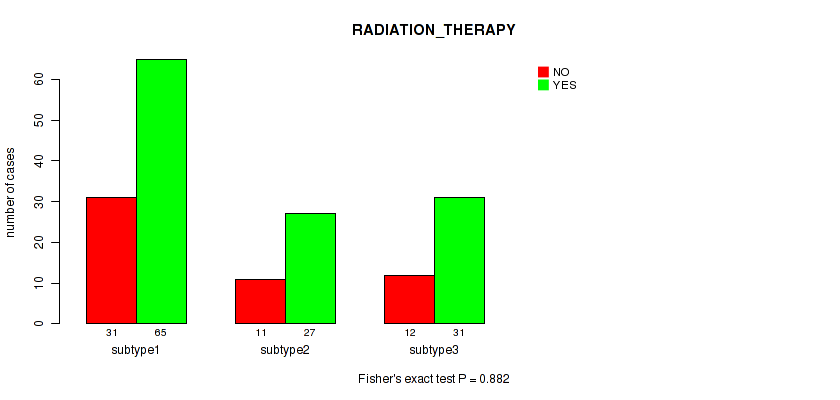
P value = 2e-05 (Fisher's exact test), Q value = 0.00071
Table S326. Clustering Approach #9: 'MIRseq Mature CNMF subtypes' versus Clinical Feature #7: 'HISTOLOGICAL_TYPE'
| nPatients | ADENOSQUAMOUS | CERVICAL SQUAMOUS CELL CARCINOMA | ENDOCERVICAL ADENOCARCINOMA OF THE USUAL TYPE | ENDOCERVICAL TYPE OF ADENOCARCINOMA | ENDOMETRIOID ADENOCARCINOMA OF ENDOCERVIX | MUCINOUS ADENOCARCINOMA OF ENDOCERVICAL TYPE |
|---|---|---|---|---|---|---|
| ALL | 6 | 242 | 6 | 20 | 3 | 17 |
| subtype1 | 5 | 90 | 4 | 14 | 3 | 13 |
| subtype2 | 1 | 65 | 2 | 6 | 0 | 4 |
| subtype3 | 0 | 87 | 0 | 0 | 0 | 0 |
Figure S317. Get High-res Image Clustering Approach #9: 'MIRseq Mature CNMF subtypes' versus Clinical Feature #7: 'HISTOLOGICAL_TYPE'
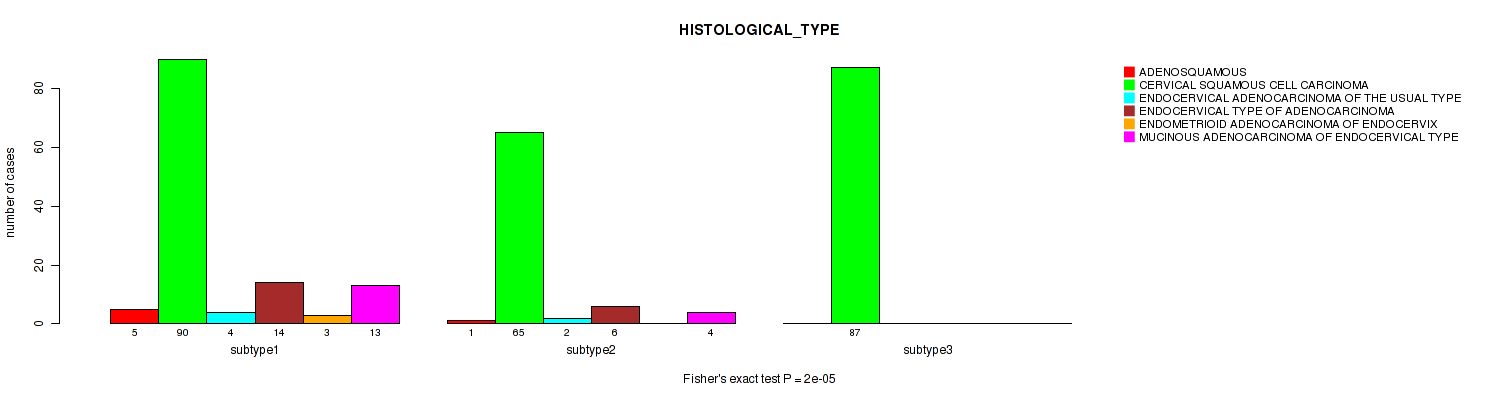
P value = 0.193 (Kruskal-Wallis (anova)), Q value = 0.52
Table S327. Clustering Approach #9: 'MIRseq Mature CNMF subtypes' versus Clinical Feature #8: 'NUMBER_PACK_YEARS_SMOKED'
| nPatients | Mean (Std.Dev) | |
|---|---|---|
| ALL | 88 | 17.2 (14.0) |
| subtype1 | 31 | 14.5 (14.3) |
| subtype2 | 23 | 19.6 (12.2) |
| subtype3 | 34 | 18.0 (14.9) |
Figure S318. Get High-res Image Clustering Approach #9: 'MIRseq Mature CNMF subtypes' versus Clinical Feature #8: 'NUMBER_PACK_YEARS_SMOKED'
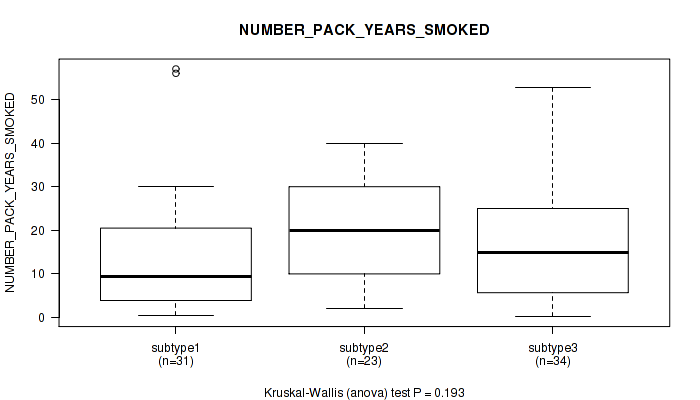
P value = 0.178 (Kruskal-Wallis (anova)), Q value = 0.51
Table S328. Clustering Approach #9: 'MIRseq Mature CNMF subtypes' versus Clinical Feature #9: 'NUMBER_OF_LYMPH_NODES'
| nPatients | Mean (Std.Dev) | |
|---|---|---|
| ALL | 155 | 1.0 (2.3) |
| subtype1 | 52 | 0.7 (2.1) |
| subtype2 | 49 | 1.2 (2.3) |
| subtype3 | 54 | 1.2 (2.7) |
Figure S319. Get High-res Image Clustering Approach #9: 'MIRseq Mature CNMF subtypes' versus Clinical Feature #9: 'NUMBER_OF_LYMPH_NODES'
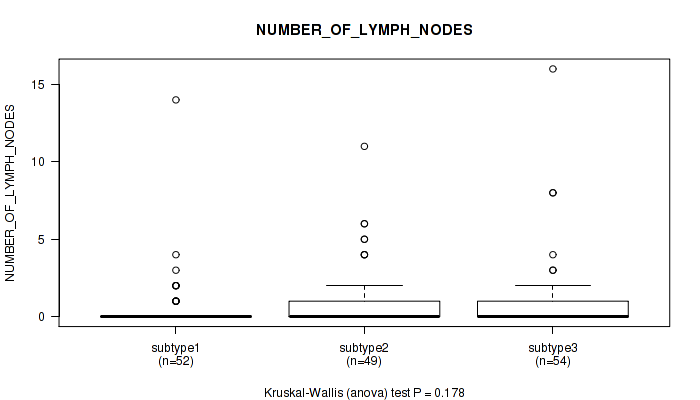
P value = 0.119 (Fisher's exact test), Q value = 0.46
Table S329. Clustering Approach #9: 'MIRseq Mature CNMF subtypes' versus Clinical Feature #10: 'RACE'
| nPatients | AMERICAN INDIAN OR ALASKA NATIVE | ASIAN | BLACK OR AFRICAN AMERICAN | NATIVE HAWAIIAN OR OTHER PACIFIC ISLANDER | WHITE |
|---|---|---|---|---|---|
| ALL | 7 | 19 | 27 | 2 | 205 |
| subtype1 | 5 | 9 | 15 | 0 | 82 |
| subtype2 | 1 | 7 | 3 | 0 | 58 |
| subtype3 | 1 | 3 | 9 | 2 | 65 |
Figure S320. Get High-res Image Clustering Approach #9: 'MIRseq Mature CNMF subtypes' versus Clinical Feature #10: 'RACE'
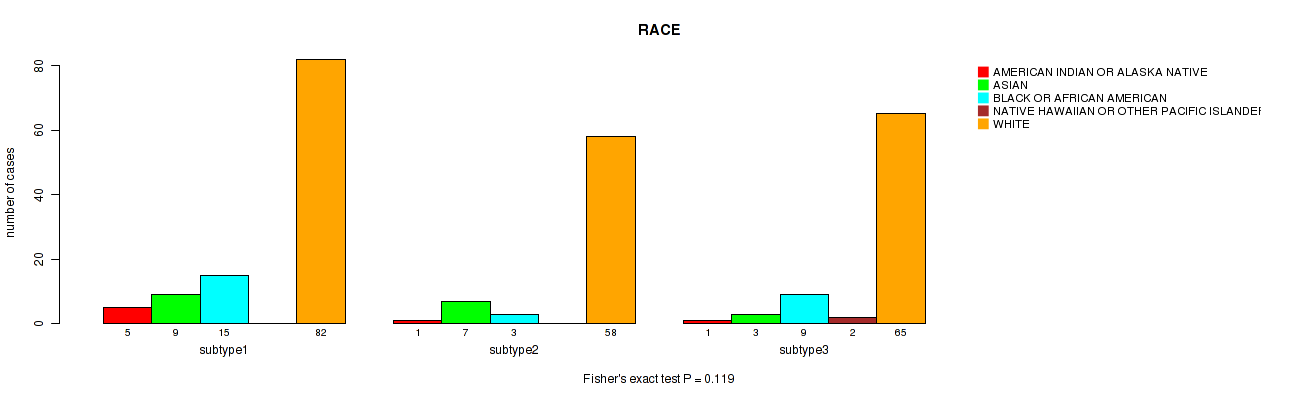
P value = 0.143 (Fisher's exact test), Q value = 0.47
Table S330. Clustering Approach #9: 'MIRseq Mature CNMF subtypes' versus Clinical Feature #11: 'ETHNICITY'
| nPatients | HISPANIC OR LATINO | NOT HISPANIC OR LATINO |
|---|---|---|
| ALL | 24 | 161 |
| subtype1 | 14 | 64 |
| subtype2 | 3 | 48 |
| subtype3 | 7 | 49 |
Figure S321. Get High-res Image Clustering Approach #9: 'MIRseq Mature CNMF subtypes' versus Clinical Feature #11: 'ETHNICITY'
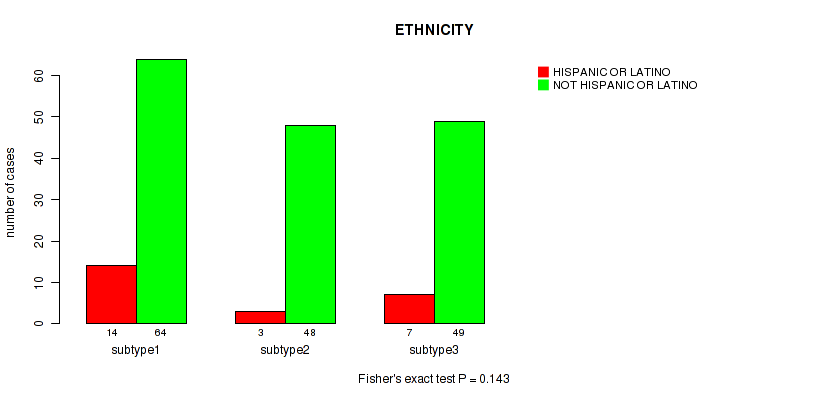
P value = 0.669 (Kruskal-Wallis (anova)), Q value = 0.84
Table S331. Clustering Approach #9: 'MIRseq Mature CNMF subtypes' versus Clinical Feature #12: 'WEIGHT_KG_AT_DIAGNOSIS'
| nPatients | Mean (Std.Dev) | |
|---|---|---|
| ALL | 266 | 72.9 (21.4) |
| subtype1 | 118 | 72.0 (19.4) |
| subtype2 | 70 | 73.9 (27.9) |
| subtype3 | 78 | 73.5 (17.6) |
Figure S322. Get High-res Image Clustering Approach #9: 'MIRseq Mature CNMF subtypes' versus Clinical Feature #12: 'WEIGHT_KG_AT_DIAGNOSIS'
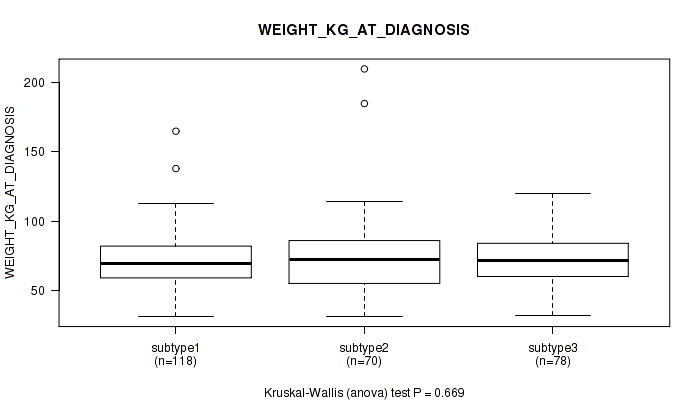
P value = 0.464 (Fisher's exact test), Q value = 0.74
Table S332. Clustering Approach #9: 'MIRseq Mature CNMF subtypes' versus Clinical Feature #13: 'TUMOR_STATUS'
| nPatients | TUMOR FREE | WITH TUMOR |
|---|---|---|
| ALL | 186 | 74 |
| subtype1 | 77 | 36 |
| subtype2 | 53 | 16 |
| subtype3 | 56 | 22 |
Figure S323. Get High-res Image Clustering Approach #9: 'MIRseq Mature CNMF subtypes' versus Clinical Feature #13: 'TUMOR_STATUS'
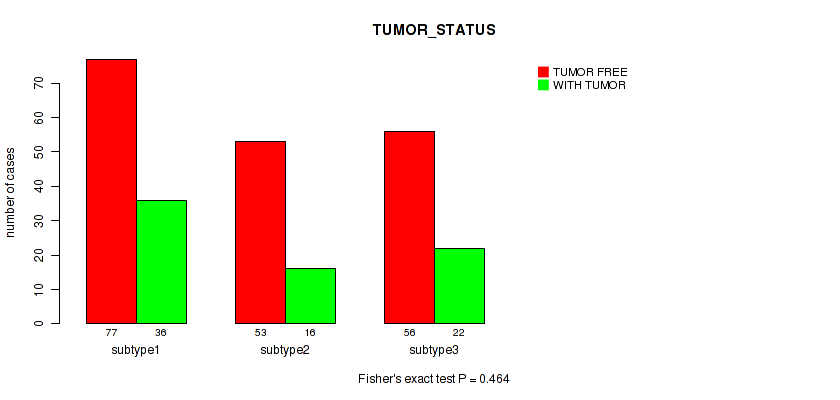
P value = 0.0181 (Fisher's exact test), Q value = 0.17
Table S333. Clustering Approach #9: 'MIRseq Mature CNMF subtypes' versus Clinical Feature #14: 'NEOPLASM_HISTOLOGIC_GRADE'
| nPatients | G1 | G2 | G3 | G4 | GX |
|---|---|---|---|---|---|
| ALL | 16 | 128 | 118 | 1 | 23 |
| subtype1 | 6 | 47 | 60 | 0 | 13 |
| subtype2 | 8 | 42 | 25 | 0 | 2 |
| subtype3 | 2 | 39 | 33 | 1 | 8 |
Figure S324. Get High-res Image Clustering Approach #9: 'MIRseq Mature CNMF subtypes' versus Clinical Feature #14: 'NEOPLASM_HISTOLOGIC_GRADE'
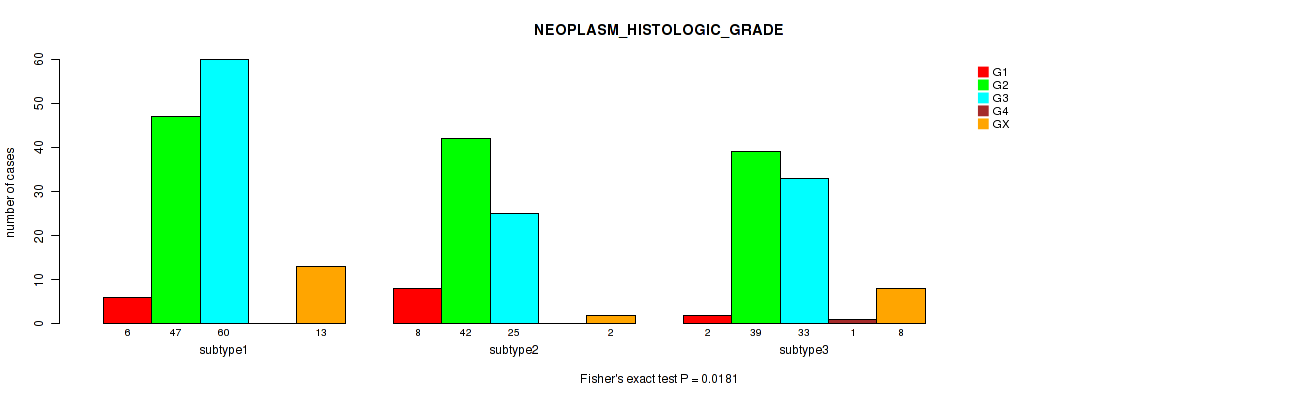
P value = 0.312 (Kruskal-Wallis (anova)), Q value = 0.64
Table S334. Clustering Approach #9: 'MIRseq Mature CNMF subtypes' versus Clinical Feature #15: 'TOBACCO_SMOKING_YEAR_STOPPED'
| nPatients | Mean (Std.Dev) | |
|---|---|---|
| ALL | 41 | 2000.0 (13.9) |
| subtype1 | 17 | 2002.4 (15.5) |
| subtype2 | 9 | 1996.2 (16.2) |
| subtype3 | 15 | 1999.5 (10.5) |
Figure S325. Get High-res Image Clustering Approach #9: 'MIRseq Mature CNMF subtypes' versus Clinical Feature #15: 'TOBACCO_SMOKING_YEAR_STOPPED'
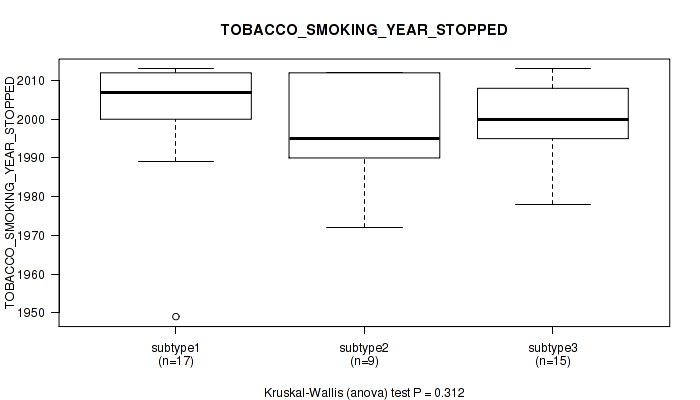
P value = 0.193 (Kruskal-Wallis (anova)), Q value = 0.52
Table S335. Clustering Approach #9: 'MIRseq Mature CNMF subtypes' versus Clinical Feature #16: 'TOBACCO_SMOKING_PACK_YEARS_SMOKED'
| nPatients | Mean (Std.Dev) | |
|---|---|---|
| ALL | 88 | 17.2 (14.0) |
| subtype1 | 31 | 14.5 (14.3) |
| subtype2 | 23 | 19.6 (12.2) |
| subtype3 | 34 | 18.0 (14.9) |
Figure S326. Get High-res Image Clustering Approach #9: 'MIRseq Mature CNMF subtypes' versus Clinical Feature #16: 'TOBACCO_SMOKING_PACK_YEARS_SMOKED'
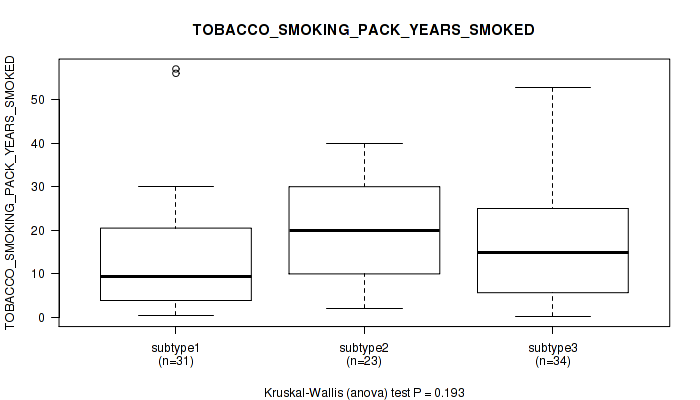
P value = 0.0428 (Fisher's exact test), Q value = 0.26
Table S336. Clustering Approach #9: 'MIRseq Mature CNMF subtypes' versus Clinical Feature #17: 'TOBACCO_SMOKING_HISTORY'
| nPatients | CURRENT REFORMED SMOKER FOR < OR = 15 YEARS | CURRENT REFORMED SMOKER FOR > 15 YEARS | CURRENT REFORMED SMOKER, DURATION NOT SPECIFIED | CURRENT SMOKER | LIFELONG NON-SMOKER |
|---|---|---|---|---|---|
| ALL | 39 | 8 | 4 | 61 | 143 |
| subtype1 | 17 | 2 | 1 | 18 | 71 |
| subtype2 | 7 | 3 | 3 | 18 | 35 |
| subtype3 | 15 | 3 | 0 | 25 | 37 |
Figure S327. Get High-res Image Clustering Approach #9: 'MIRseq Mature CNMF subtypes' versus Clinical Feature #17: 'TOBACCO_SMOKING_HISTORY'
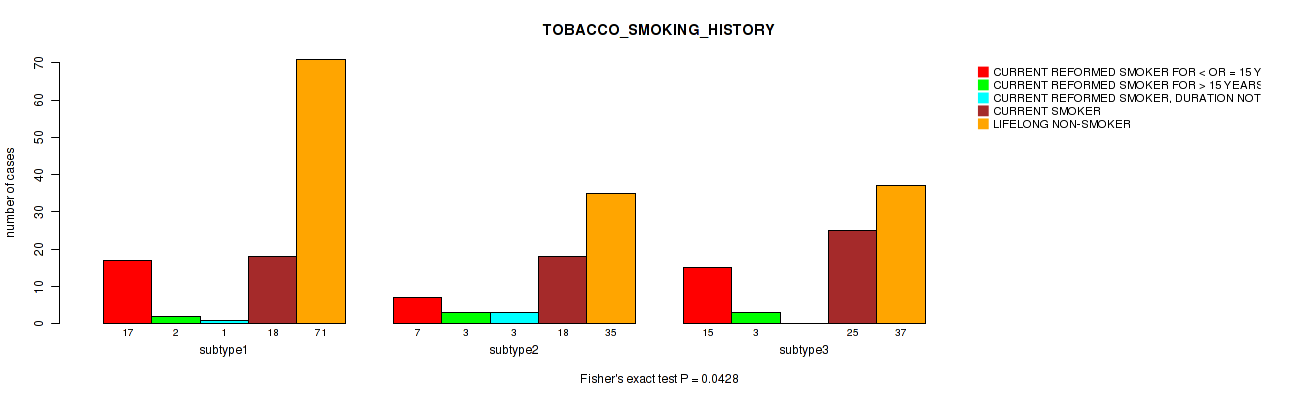
P value = 0.685 (Kruskal-Wallis (anova)), Q value = 0.85
Table S337. Clustering Approach #9: 'MIRseq Mature CNMF subtypes' versus Clinical Feature #18: 'AGEBEGANSMOKINGINYEARS'
| nPatients | Mean (Std.Dev) | |
|---|---|---|
| ALL | 80 | 20.9 (7.6) |
| subtype1 | 31 | 21.5 (7.4) |
| subtype2 | 19 | 20.7 (7.2) |
| subtype3 | 30 | 20.4 (8.2) |
Figure S328. Get High-res Image Clustering Approach #9: 'MIRseq Mature CNMF subtypes' versus Clinical Feature #18: 'AGEBEGANSMOKINGINYEARS'
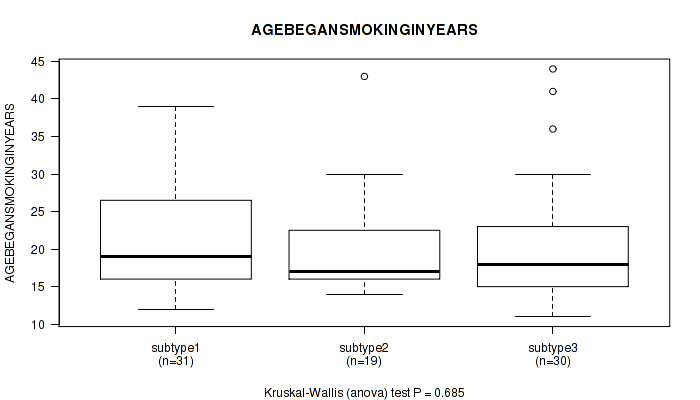
P value = 1 (Fisher's exact test), Q value = 1
Table S338. Clustering Approach #9: 'MIRseq Mature CNMF subtypes' versus Clinical Feature #19: 'RADIATION_THERAPY_STATUS'
| nPatients | COMPLETED AS PLANNED | TREATMENT NOT COMPLETED |
|---|---|---|
| ALL | 27 | 3 |
| subtype1 | 3 | 0 |
| subtype2 | 5 | 0 |
| subtype3 | 19 | 3 |
Figure S329. Get High-res Image Clustering Approach #9: 'MIRseq Mature CNMF subtypes' versus Clinical Feature #19: 'RADIATION_THERAPY_STATUS'
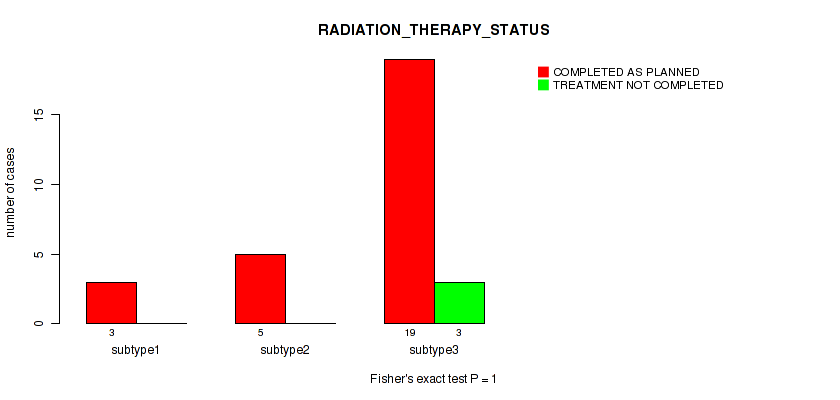
P value = 0.728 (Kruskal-Wallis (anova)), Q value = 0.87
Table S339. Clustering Approach #9: 'MIRseq Mature CNMF subtypes' versus Clinical Feature #20: 'PREGNANCIES_COUNT_TOTAL'
| nPatients | Mean (Std.Dev) | |
|---|---|---|
| ALL | 257 | 3.6 (2.5) |
| subtype1 | 110 | 3.5 (2.7) |
| subtype2 | 69 | 3.6 (2.2) |
| subtype3 | 78 | 3.6 (2.6) |
Figure S330. Get High-res Image Clustering Approach #9: 'MIRseq Mature CNMF subtypes' versus Clinical Feature #20: 'PREGNANCIES_COUNT_TOTAL'
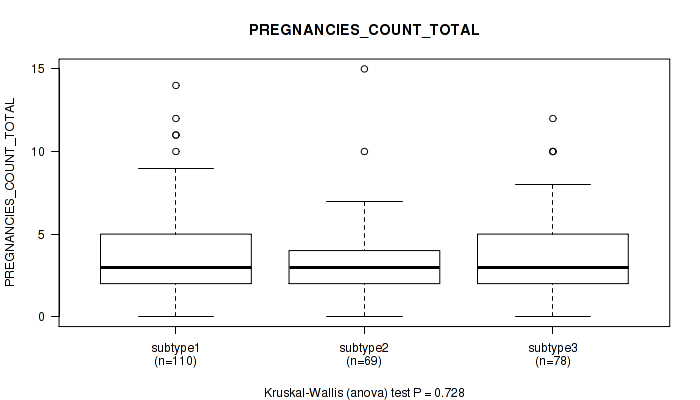
P value = 0.196 (Kruskal-Wallis (anova)), Q value = 0.52
Table S340. Clustering Approach #9: 'MIRseq Mature CNMF subtypes' versus Clinical Feature #21: 'PREGNANCIES_COUNT_STILLBIRTH'
| nPatients | Mean (Std.Dev) | |
|---|---|---|
| ALL | 107 | 0.1 (0.3) |
| subtype1 | 32 | 0.0 (0.2) |
| subtype2 | 29 | 0.0 (0.0) |
| subtype3 | 46 | 0.1 (0.5) |
Figure S331. Get High-res Image Clustering Approach #9: 'MIRseq Mature CNMF subtypes' versus Clinical Feature #21: 'PREGNANCIES_COUNT_STILLBIRTH'
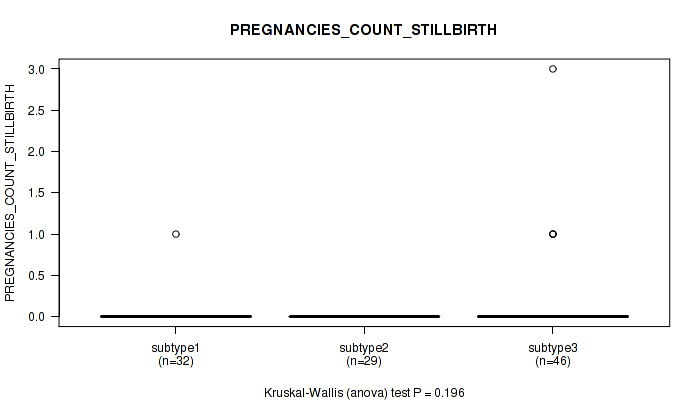
P value = 0.277 (Kruskal-Wallis (anova)), Q value = 0.6
Table S341. Clustering Approach #9: 'MIRseq Mature CNMF subtypes' versus Clinical Feature #22: 'PREGNANCY_SPONTANEOUS_ABORTION_COUNT'
| nPatients | Mean (Std.Dev) | |
|---|---|---|
| ALL | 143 | 0.6 (1.0) |
| subtype1 | 49 | 0.8 (1.2) |
| subtype2 | 40 | 0.4 (0.7) |
| subtype3 | 54 | 0.5 (0.8) |
Figure S332. Get High-res Image Clustering Approach #9: 'MIRseq Mature CNMF subtypes' versus Clinical Feature #22: 'PREGNANCY_SPONTANEOUS_ABORTION_COUNT'
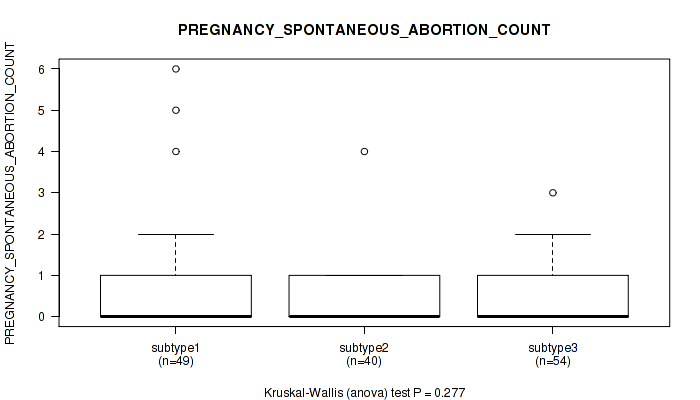
P value = 0.72 (Kruskal-Wallis (anova)), Q value = 0.86
Table S342. Clustering Approach #9: 'MIRseq Mature CNMF subtypes' versus Clinical Feature #23: 'PREGNANCIES_COUNT_LIVE_BIRTH'
| nPatients | Mean (Std.Dev) | |
|---|---|---|
| ALL | 252 | 2.8 (2.0) |
| subtype1 | 108 | 3.0 (2.3) |
| subtype2 | 68 | 2.8 (1.7) |
| subtype3 | 76 | 2.6 (1.9) |
Figure S333. Get High-res Image Clustering Approach #9: 'MIRseq Mature CNMF subtypes' versus Clinical Feature #23: 'PREGNANCIES_COUNT_LIVE_BIRTH'
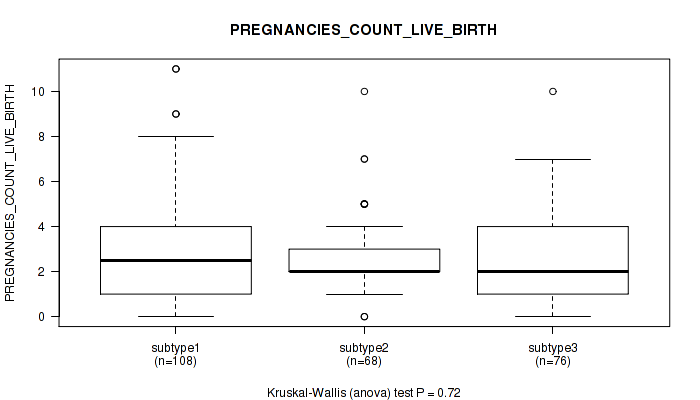
P value = 0.668 (Kruskal-Wallis (anova)), Q value = 0.84
Table S343. Clustering Approach #9: 'MIRseq Mature CNMF subtypes' versus Clinical Feature #24: 'PREGNANCY_THERAPEUTIC_ABORTION_COUNT'
| nPatients | Mean (Std.Dev) | |
|---|---|---|
| ALL | 116 | 0.8 (1.8) |
| subtype1 | 35 | 0.5 (0.9) |
| subtype2 | 34 | 1.1 (2.4) |
| subtype3 | 47 | 0.8 (1.7) |
Figure S334. Get High-res Image Clustering Approach #9: 'MIRseq Mature CNMF subtypes' versus Clinical Feature #24: 'PREGNANCY_THERAPEUTIC_ABORTION_COUNT'

P value = 0.989 (Kruskal-Wallis (anova)), Q value = 1
Table S344. Clustering Approach #9: 'MIRseq Mature CNMF subtypes' versus Clinical Feature #25: 'PREGNANCIES_COUNT_ECTOPIC'
| nPatients | Mean (Std.Dev) | |
|---|---|---|
| ALL | 112 | 0.1 (0.3) |
| subtype1 | 35 | 0.1 (0.3) |
| subtype2 | 30 | 0.1 (0.4) |
| subtype3 | 47 | 0.1 (0.3) |
Figure S335. Get High-res Image Clustering Approach #9: 'MIRseq Mature CNMF subtypes' versus Clinical Feature #25: 'PREGNANCIES_COUNT_ECTOPIC'
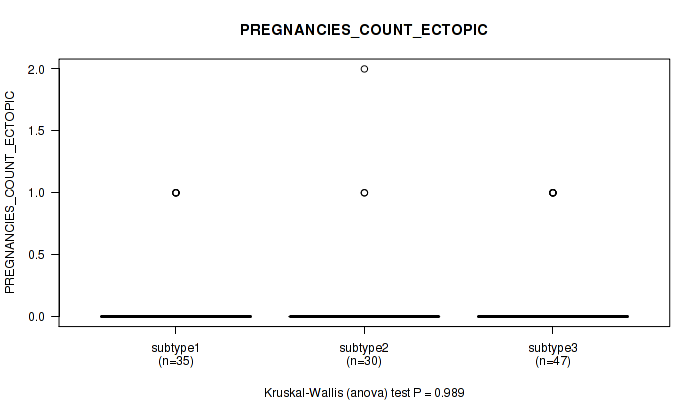
P value = 0.802 (Fisher's exact test), Q value = 0.92
Table S345. Clustering Approach #9: 'MIRseq Mature CNMF subtypes' versus Clinical Feature #26: 'POS_LYMPH_NODE_LOCATION'
| nPatients | MACROSCOPIC PARAMETRIAL INVOLVEMENT | MICROSCOPIC PARAMETRIAL INVOLVEMENT | OTHER LOCATION, SPECIFY | POSITIVE BLADDER MARGIN | POSITIVE VAGINAL MARGIN |
|---|---|---|---|---|---|
| ALL | 2 | 7 | 39 | 1 | 10 |
| subtype1 | 1 | 1 | 9 | 0 | 2 |
| subtype2 | 1 | 2 | 11 | 1 | 4 |
| subtype3 | 0 | 4 | 19 | 0 | 4 |
Figure S336. Get High-res Image Clustering Approach #9: 'MIRseq Mature CNMF subtypes' versus Clinical Feature #26: 'POS_LYMPH_NODE_LOCATION'
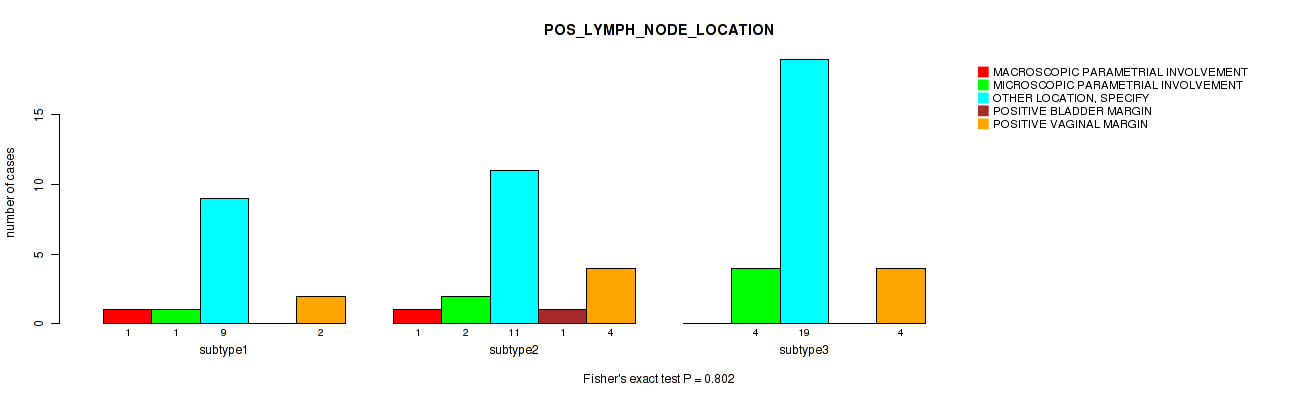
P value = 0.241 (Fisher's exact test), Q value = 0.57
Table S346. Clustering Approach #9: 'MIRseq Mature CNMF subtypes' versus Clinical Feature #27: 'MENOPAUSE_STATUS'
| nPatients | INDETERMINATE (NEITHER PRE OR POSTMENOPAUSAL) | PERI (6-12 MONTHS SINCE LAST MENSTRUAL PERIOD) | POST (PRIOR BILATERAL OVARIECTOMY OR >12 MO SINCE LMP WITH NO PRIOR HYSTERECTOMY) | PRE (<6 MONTHS SINCE LMP AND NO PRIOR BILATERAL OVARIECTOMY AND NOT ON ESTROGEN REPLACEMENT) |
|---|---|---|---|---|
| ALL | 2 | 25 | 78 | 120 |
| subtype1 | 0 | 15 | 30 | 52 |
| subtype2 | 0 | 6 | 23 | 30 |
| subtype3 | 2 | 4 | 25 | 38 |
Figure S337. Get High-res Image Clustering Approach #9: 'MIRseq Mature CNMF subtypes' versus Clinical Feature #27: 'MENOPAUSE_STATUS'
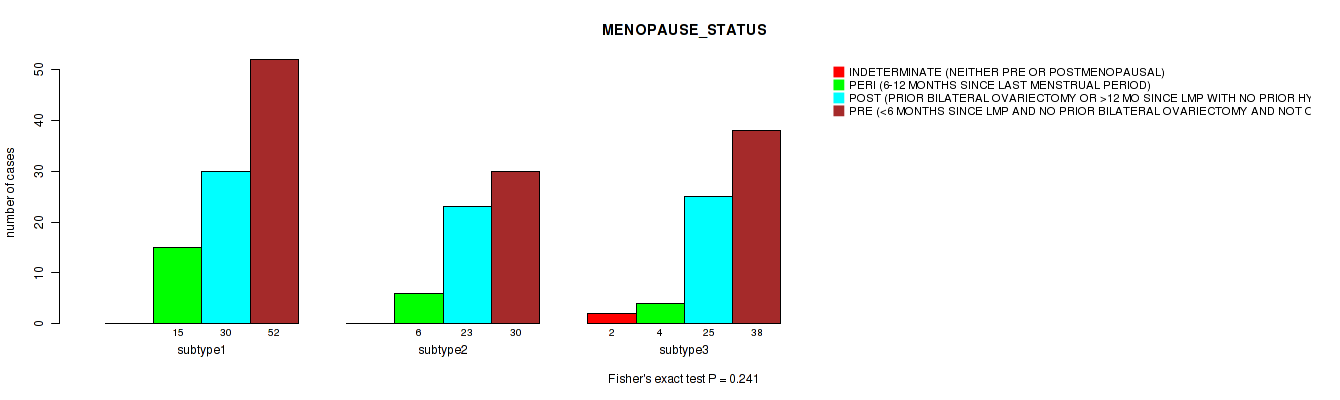
P value = 0.871 (Fisher's exact test), Q value = 0.95
Table S347. Clustering Approach #9: 'MIRseq Mature CNMF subtypes' versus Clinical Feature #28: 'LYMPHOVASCULAR_INVOLVEMENT'
| nPatients | ABSENT | PRESENT |
|---|---|---|
| ALL | 69 | 74 |
| subtype1 | 23 | 24 |
| subtype2 | 24 | 23 |
| subtype3 | 22 | 27 |
Figure S338. Get High-res Image Clustering Approach #9: 'MIRseq Mature CNMF subtypes' versus Clinical Feature #28: 'LYMPHOVASCULAR_INVOLVEMENT'
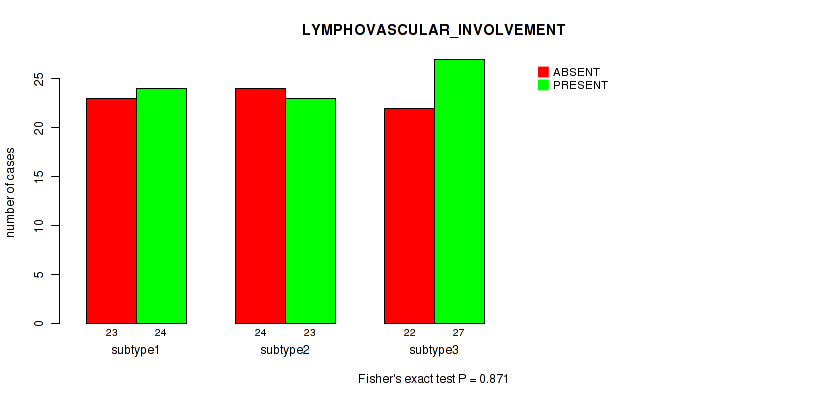
P value = 0.178 (Kruskal-Wallis (anova)), Q value = 0.51
Table S348. Clustering Approach #9: 'MIRseq Mature CNMF subtypes' versus Clinical Feature #29: 'LYMPH_NODES_EXAMINED_HE_COUNT'
| nPatients | Mean (Std.Dev) | |
|---|---|---|
| ALL | 155 | 1.0 (2.3) |
| subtype1 | 52 | 0.7 (2.1) |
| subtype2 | 49 | 1.2 (2.3) |
| subtype3 | 54 | 1.2 (2.7) |
Figure S339. Get High-res Image Clustering Approach #9: 'MIRseq Mature CNMF subtypes' versus Clinical Feature #29: 'LYMPH_NODES_EXAMINED_HE_COUNT'
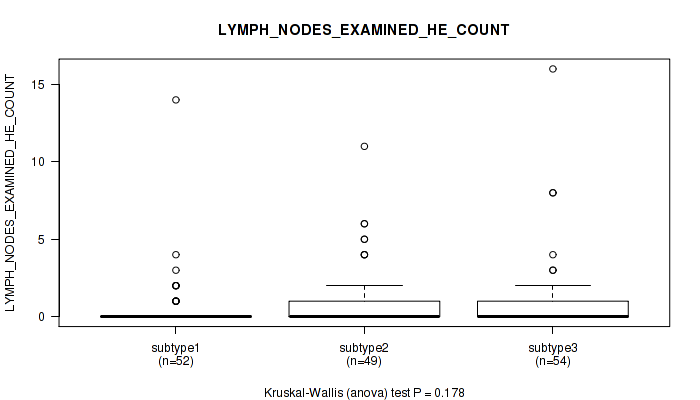
P value = 0.28 (Kruskal-Wallis (anova)), Q value = 0.6
Table S349. Clustering Approach #9: 'MIRseq Mature CNMF subtypes' versus Clinical Feature #30: 'LYMPH_NODES_EXAMINED'
| nPatients | Mean (Std.Dev) | |
|---|---|---|
| ALL | 172 | 22.7 (12.6) |
| subtype1 | 60 | 21.9 (12.7) |
| subtype2 | 55 | 24.9 (12.8) |
| subtype3 | 57 | 21.4 (12.4) |
Figure S340. Get High-res Image Clustering Approach #9: 'MIRseq Mature CNMF subtypes' versus Clinical Feature #30: 'LYMPH_NODES_EXAMINED'
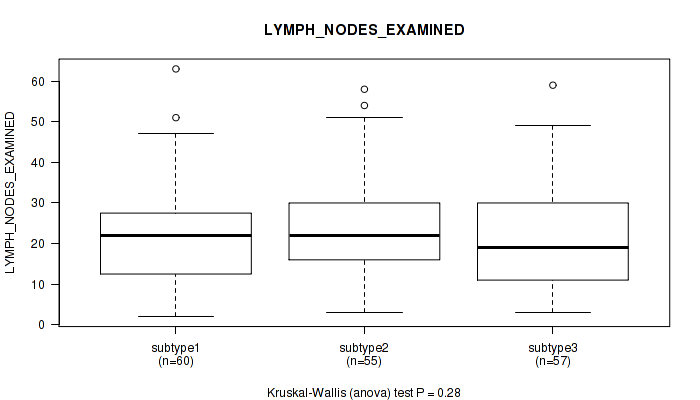
P value = 0.0337 (Fisher's exact test), Q value = 0.22
Table S350. Clustering Approach #9: 'MIRseq Mature CNMF subtypes' versus Clinical Feature #31: 'KERATINIZATION_SQUAMOUS_CELL'
| nPatients | KERATINIZING SQUAMOUS CELL CARCINOMA | NON-KERATINIZING SQUAMOUS CELL CARCINOMA |
|---|---|---|
| ALL | 52 | 114 |
| subtype1 | 10 | 45 |
| subtype2 | 18 | 30 |
| subtype3 | 24 | 39 |
Figure S341. Get High-res Image Clustering Approach #9: 'MIRseq Mature CNMF subtypes' versus Clinical Feature #31: 'KERATINIZATION_SQUAMOUS_CELL'
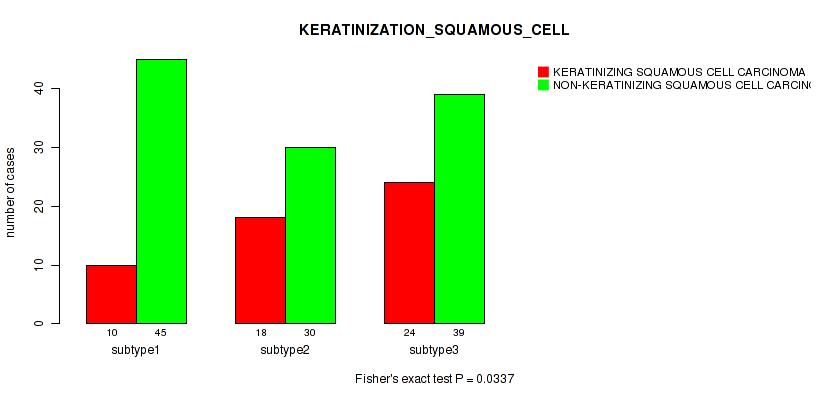
P value = 3.4e-06 (Kruskal-Wallis (anova)), Q value = 0.00044
Table S351. Clustering Approach #9: 'MIRseq Mature CNMF subtypes' versus Clinical Feature #32: 'INITIAL_PATHOLOGIC_DX_YEAR'
| nPatients | Mean (Std.Dev) | |
|---|---|---|
| ALL | 292 | 2008.3 (4.8) |
| subtype1 | 128 | 2009.5 (4.1) |
| subtype2 | 77 | 2008.4 (4.7) |
| subtype3 | 87 | 2006.5 (5.2) |
Figure S342. Get High-res Image Clustering Approach #9: 'MIRseq Mature CNMF subtypes' versus Clinical Feature #32: 'INITIAL_PATHOLOGIC_DX_YEAR'
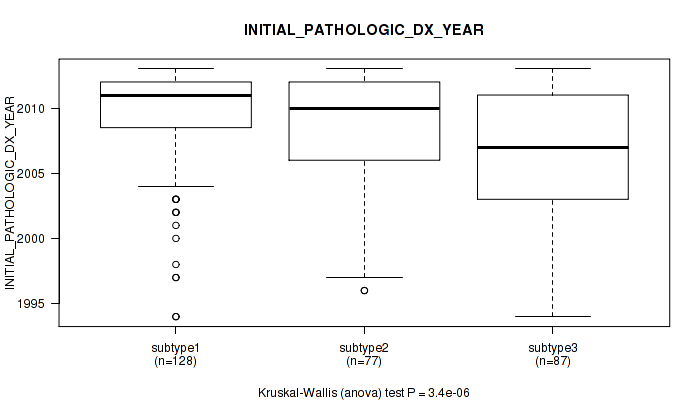
P value = 0.676 (Fisher's exact test), Q value = 0.84
Table S352. Clustering Approach #9: 'MIRseq Mature CNMF subtypes' versus Clinical Feature #33: 'HISTORY_HORMONAL_CONTRACEPTIVES_USE'
| nPatients | CURRENT USER | FORMER USER | NEVER USED |
|---|---|---|---|
| ALL | 15 | 54 | 85 |
| subtype1 | 6 | 22 | 44 |
| subtype2 | 4 | 16 | 18 |
| subtype3 | 5 | 16 | 23 |
Figure S343. Get High-res Image Clustering Approach #9: 'MIRseq Mature CNMF subtypes' versus Clinical Feature #33: 'HISTORY_HORMONAL_CONTRACEPTIVES_USE'
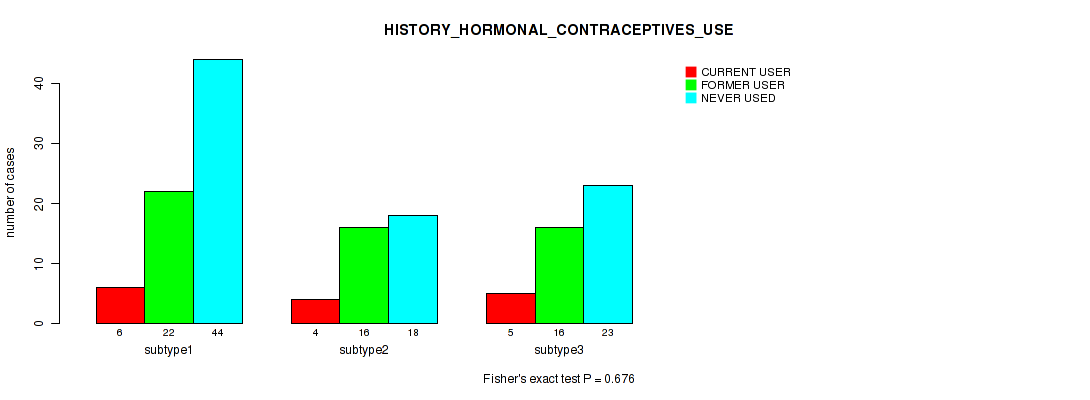
P value = 0.554 (Kruskal-Wallis (anova)), Q value = 0.77
Table S353. Clustering Approach #9: 'MIRseq Mature CNMF subtypes' versus Clinical Feature #34: 'HEIGHT_CM_AT_DIAGNOSIS'
| nPatients | Mean (Std.Dev) | |
|---|---|---|
| ALL | 253 | 160.8 (7.3) |
| subtype1 | 115 | 160.5 (6.8) |
| subtype2 | 65 | 161.3 (7.4) |
| subtype3 | 73 | 160.9 (8.1) |
Figure S344. Get High-res Image Clustering Approach #9: 'MIRseq Mature CNMF subtypes' versus Clinical Feature #34: 'HEIGHT_CM_AT_DIAGNOSIS'
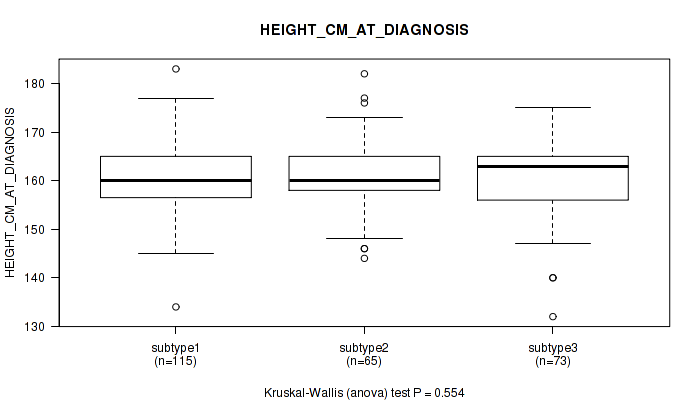
P value = 0.815 (Fisher's exact test), Q value = 0.92
Table S354. Clustering Approach #9: 'MIRseq Mature CNMF subtypes' versus Clinical Feature #35: 'CORPUS_INVOLVEMENT'
| nPatients | ABSENT | PRESENT |
|---|---|---|
| ALL | 95 | 19 |
| subtype1 | 29 | 5 |
| subtype2 | 30 | 5 |
| subtype3 | 36 | 9 |
Figure S345. Get High-res Image Clustering Approach #9: 'MIRseq Mature CNMF subtypes' versus Clinical Feature #35: 'CORPUS_INVOLVEMENT'
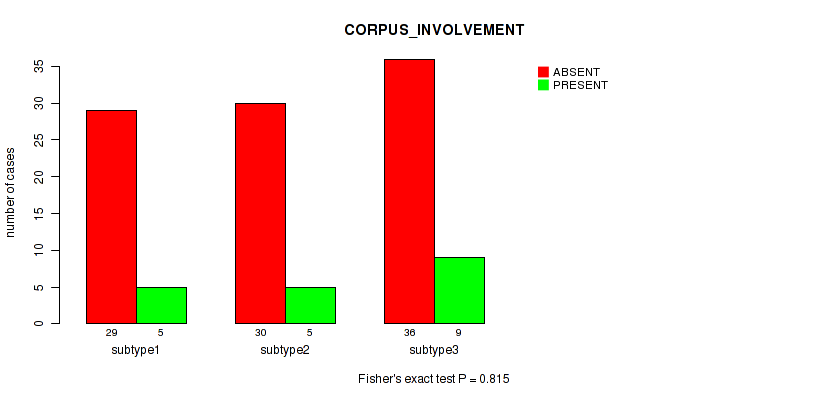
P value = 0.535 (Fisher's exact test), Q value = 0.77
Table S355. Clustering Approach #9: 'MIRseq Mature CNMF subtypes' versus Clinical Feature #36: 'CHEMO_CONCURRENT_TYPE'
| nPatients | CARBOPLATIN | CISPLATIN | OTHER |
|---|---|---|---|
| ALL | 7 | 102 | 2 |
| subtype1 | 4 | 52 | 1 |
| subtype2 | 0 | 17 | 1 |
| subtype3 | 3 | 33 | 0 |
Figure S346. Get High-res Image Clustering Approach #9: 'MIRseq Mature CNMF subtypes' versus Clinical Feature #36: 'CHEMO_CONCURRENT_TYPE'
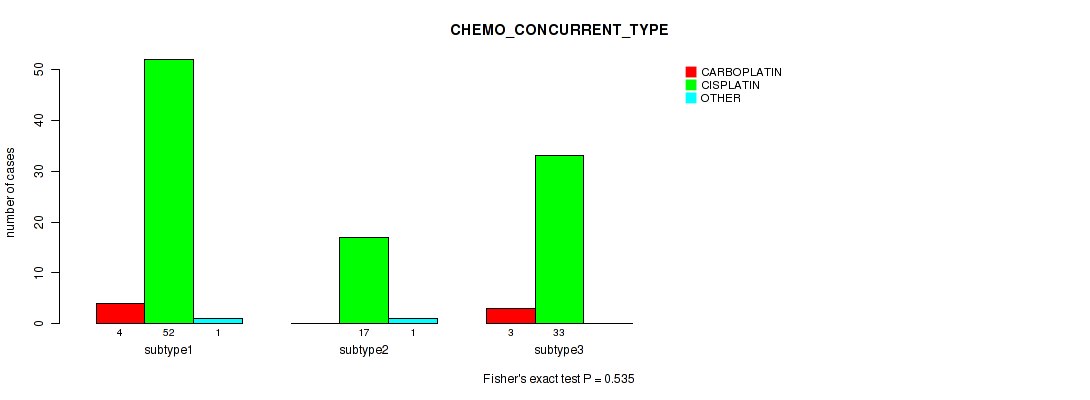
P value = 0.479 (Kruskal-Wallis (anova)), Q value = 0.74
Table S356. Clustering Approach #9: 'MIRseq Mature CNMF subtypes' versus Clinical Feature #37: 'CERVIX_SUV_RESULTS'
| nPatients | Mean (Std.Dev) | |
|---|---|---|
| ALL | 16 | 13.0 (7.3) |
| subtype1 | 4 | 18.3 (10.8) |
| subtype2 | 6 | 10.5 (4.0) |
| subtype3 | 6 | 11.9 (6.6) |
Figure S347. Get High-res Image Clustering Approach #9: 'MIRseq Mature CNMF subtypes' versus Clinical Feature #37: 'CERVIX_SUV_RESULTS'
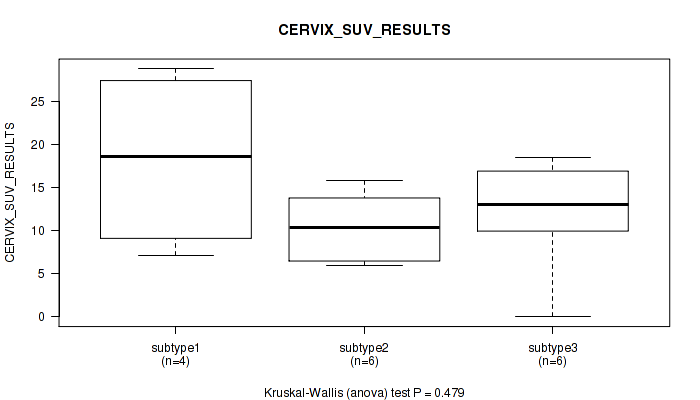
P value = 0.406 (Kruskal-Wallis (anova)), Q value = 0.71
Table S357. Clustering Approach #9: 'MIRseq Mature CNMF subtypes' versus Clinical Feature #38: 'AGE_AT_DIAGNOSIS'
| nPatients | Mean (Std.Dev) | |
|---|---|---|
| ALL | 294 | 48.2 (13.8) |
| subtype1 | 129 | 49.0 (13.2) |
| subtype2 | 78 | 49.1 (14.1) |
| subtype3 | 87 | 46.4 (14.4) |
Figure S348. Get High-res Image Clustering Approach #9: 'MIRseq Mature CNMF subtypes' versus Clinical Feature #38: 'AGE_AT_DIAGNOSIS'
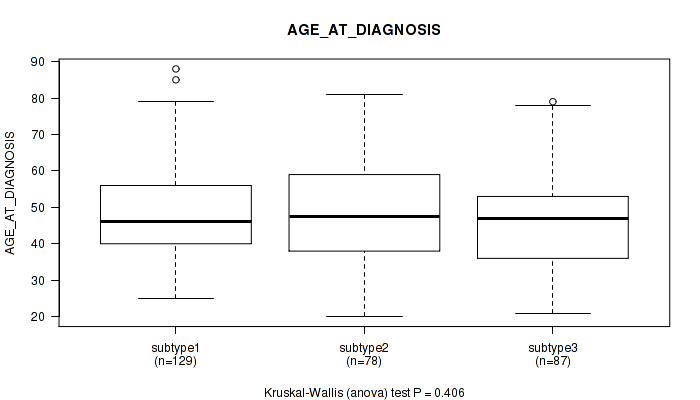
P value = 0.00682 (Fisher's exact test), Q value = 0.11
Table S358. Clustering Approach #9: 'MIRseq Mature CNMF subtypes' versus Clinical Feature #39: 'CLINICAL_STAGE'
| nPatients | STAGE I | STAGE IA | STAGE IA2 | STAGE IB | STAGE IB1 | STAGE IB2 | STAGE II | STAGE IIA | STAGE IIA1 | STAGE IIA2 | STAGE IIB | STAGE IIIA | STAGE IIIB | STAGE IVA | STAGE IVB |
|---|---|---|---|---|---|---|---|---|---|---|---|---|---|---|---|
| ALL | 5 | 1 | 1 | 37 | 76 | 37 | 5 | 8 | 5 | 7 | 42 | 3 | 41 | 8 | 11 |
| subtype1 | 3 | 0 | 0 | 9 | 35 | 18 | 2 | 4 | 0 | 4 | 19 | 3 | 16 | 3 | 9 |
| subtype2 | 0 | 1 | 1 | 6 | 24 | 12 | 2 | 3 | 3 | 2 | 8 | 0 | 9 | 3 | 1 |
| subtype3 | 2 | 0 | 0 | 22 | 17 | 7 | 1 | 1 | 2 | 1 | 15 | 0 | 16 | 2 | 1 |
Figure S349. Get High-res Image Clustering Approach #9: 'MIRseq Mature CNMF subtypes' versus Clinical Feature #39: 'CLINICAL_STAGE'
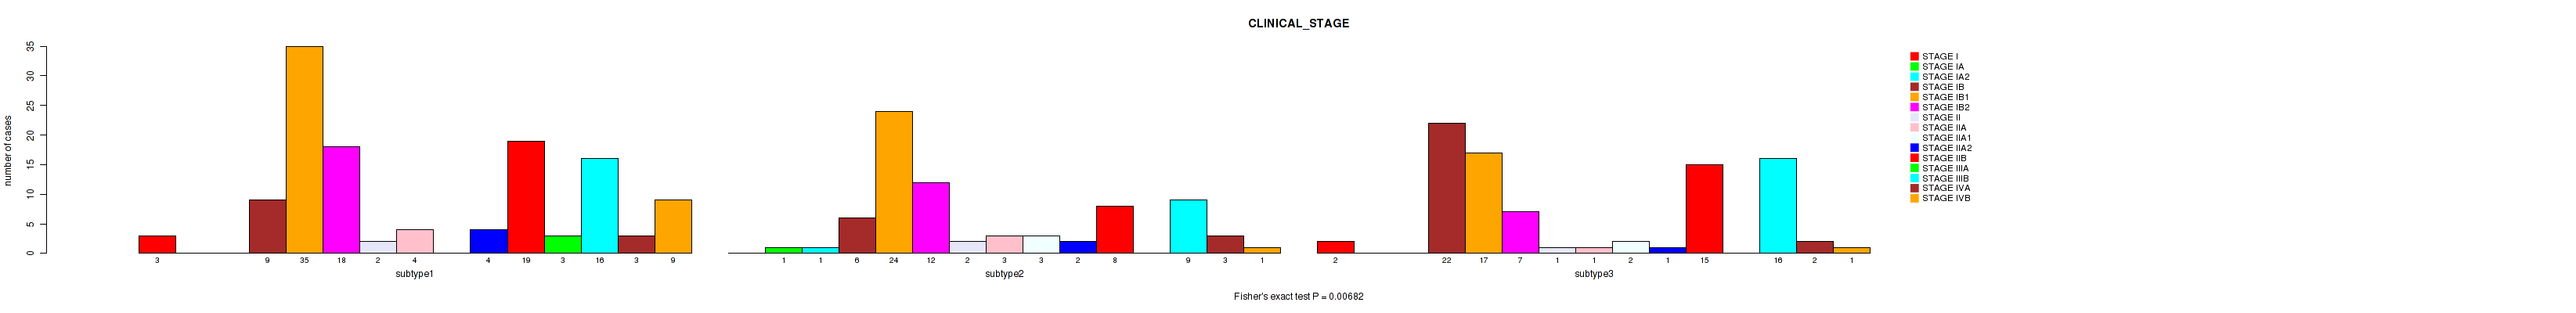
Table S359. Description of clustering approach #10: 'MIRseq Mature cHierClus subtypes'
| Cluster Labels | 1 | 2 | 3 | 4 |
|---|---|---|---|---|
| Number of samples | 64 | 50 | 31 | 149 |
P value = 0.938 (logrank test), Q value = 0.97
Table S360. Clustering Approach #10: 'MIRseq Mature cHierClus subtypes' versus Clinical Feature #1: 'Time to Death'
| nPatients | nDeath | Duration Range (Median), Month | |
|---|---|---|---|
| ALL | 280 | 68 | 0.0 - 210.7 (24.0) |
| subtype1 | 62 | 15 | 0.4 - 137.2 (20.2) |
| subtype2 | 46 | 10 | 0.1 - 147.4 (21.3) |
| subtype3 | 31 | 12 | 1.2 - 177.0 (36.8) |
| subtype4 | 141 | 31 | 0.0 - 210.7 (21.4) |
Figure S350. Get High-res Image Clustering Approach #10: 'MIRseq Mature cHierClus subtypes' versus Clinical Feature #1: 'Time to Death'
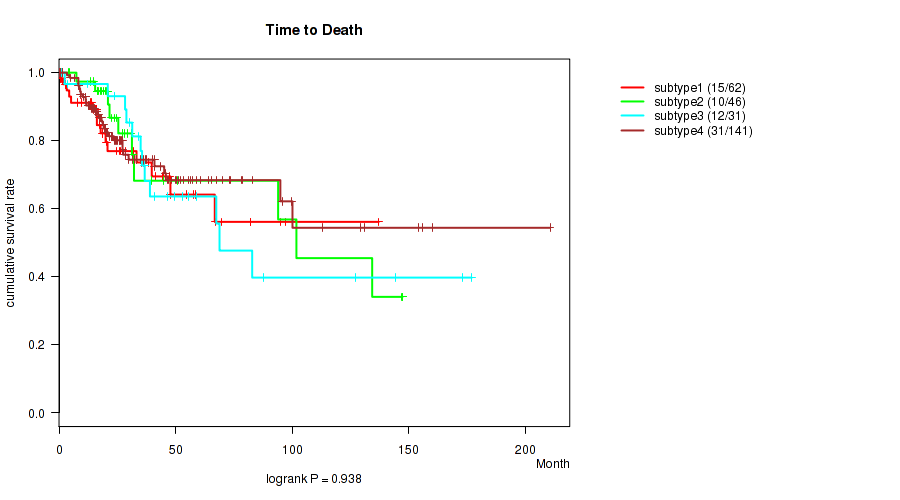
P value = 0.894 (Kruskal-Wallis (anova)), Q value = 0.96
Table S361. Clustering Approach #10: 'MIRseq Mature cHierClus subtypes' versus Clinical Feature #2: 'YEARS_TO_BIRTH'
| nPatients | Mean (Std.Dev) | |
|---|---|---|
| ALL | 293 | 48.2 (13.8) |
| subtype1 | 64 | 47.6 (12.1) |
| subtype2 | 50 | 49.4 (14.2) |
| subtype3 | 31 | 48.9 (14.4) |
| subtype4 | 148 | 47.9 (14.3) |
Figure S351. Get High-res Image Clustering Approach #10: 'MIRseq Mature cHierClus subtypes' versus Clinical Feature #2: 'YEARS_TO_BIRTH'
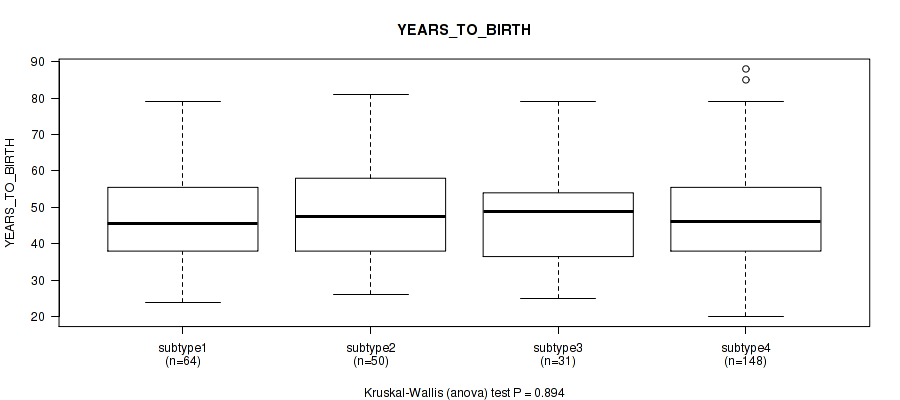
P value = 0.465 (Fisher's exact test), Q value = 0.74
Table S362. Clustering Approach #10: 'MIRseq Mature cHierClus subtypes' versus Clinical Feature #3: 'PATHOLOGY_T_STAGE'
| nPatients | T1 | T2 | T3 | T4 |
|---|---|---|---|---|
| ALL | 136 | 68 | 19 | 9 |
| subtype1 | 33 | 19 | 2 | 2 |
| subtype2 | 26 | 8 | 3 | 1 |
| subtype3 | 18 | 5 | 1 | 0 |
| subtype4 | 59 | 36 | 13 | 6 |
Figure S352. Get High-res Image Clustering Approach #10: 'MIRseq Mature cHierClus subtypes' versus Clinical Feature #3: 'PATHOLOGY_T_STAGE'
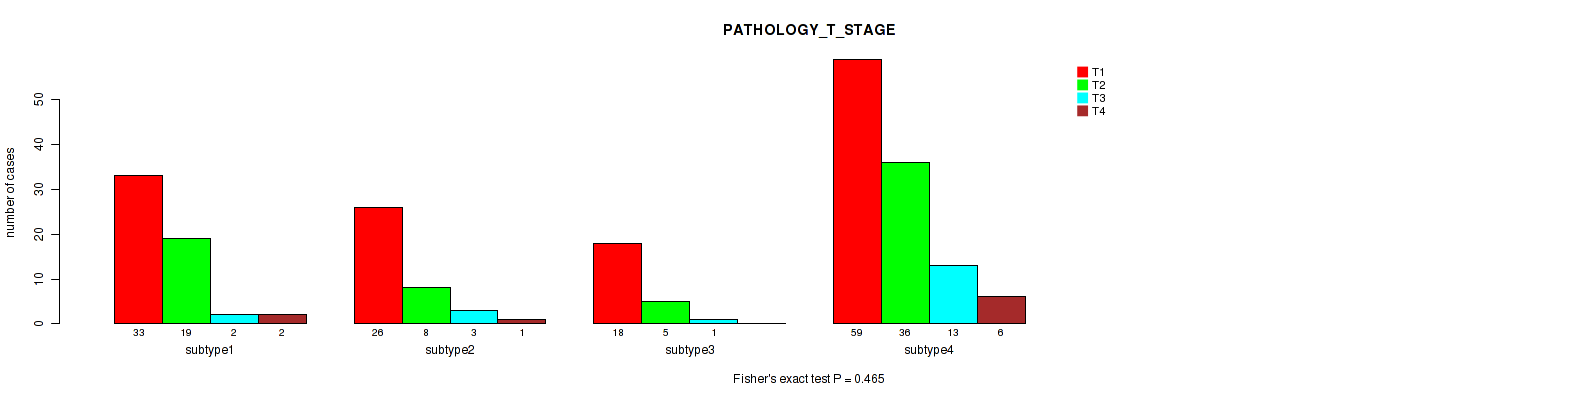
P value = 0.189 (Fisher's exact test), Q value = 0.52
Table S363. Clustering Approach #10: 'MIRseq Mature cHierClus subtypes' versus Clinical Feature #4: 'PATHOLOGY_N_STAGE'
| nPatients | 0 | 1 |
|---|---|---|
| ALL | 130 | 57 |
| subtype1 | 35 | 9 |
| subtype2 | 25 | 11 |
| subtype3 | 13 | 11 |
| subtype4 | 57 | 26 |
Figure S353. Get High-res Image Clustering Approach #10: 'MIRseq Mature cHierClus subtypes' versus Clinical Feature #4: 'PATHOLOGY_N_STAGE'
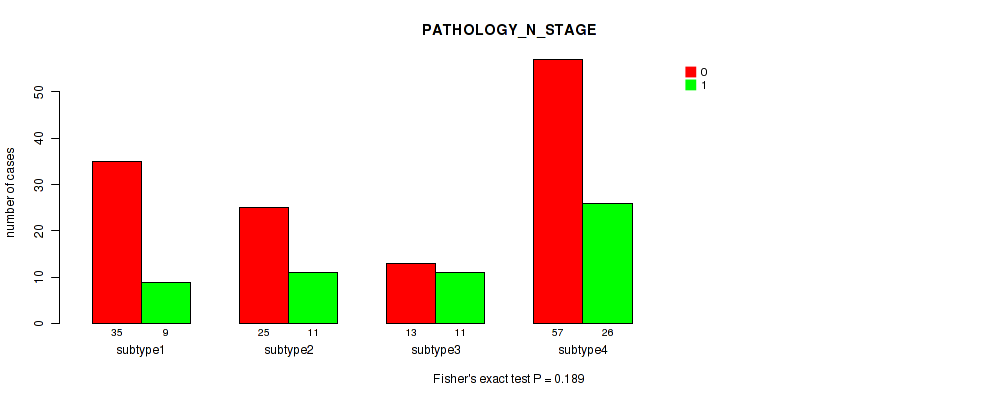
P value = 0.369 (Fisher's exact test), Q value = 0.69
Table S364. Clustering Approach #10: 'MIRseq Mature cHierClus subtypes' versus Clinical Feature #5: 'PATHOLOGY_M_STAGE'
| nPatients | 0 | 1 |
|---|---|---|
| ALL | 112 | 9 |
| subtype1 | 22 | 4 |
| subtype2 | 24 | 1 |
| subtype3 | 15 | 0 |
| subtype4 | 51 | 4 |
Figure S354. Get High-res Image Clustering Approach #10: 'MIRseq Mature cHierClus subtypes' versus Clinical Feature #5: 'PATHOLOGY_M_STAGE'
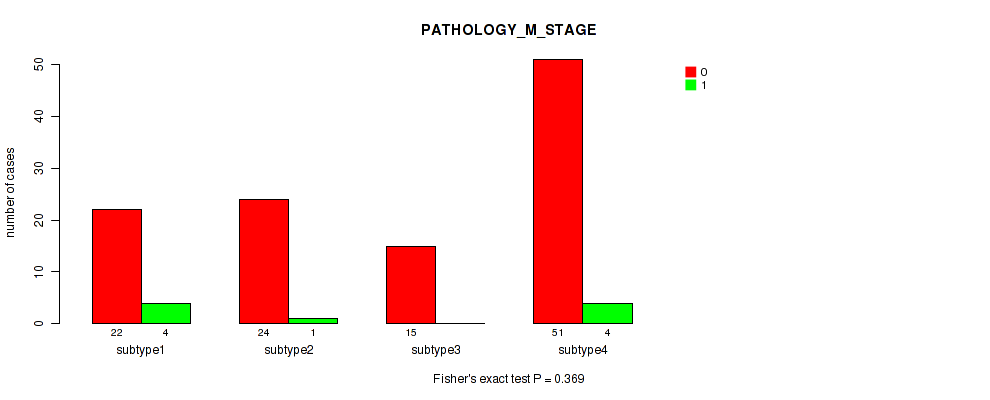
P value = 0.25 (Fisher's exact test), Q value = 0.58
Table S365. Clustering Approach #10: 'MIRseq Mature cHierClus subtypes' versus Clinical Feature #6: 'RADIATION_THERAPY'
| nPatients | NO | YES |
|---|---|---|
| ALL | 54 | 123 |
| subtype1 | 14 | 29 |
| subtype2 | 8 | 18 |
| subtype3 | 4 | 2 |
| subtype4 | 28 | 74 |
Figure S355. Get High-res Image Clustering Approach #10: 'MIRseq Mature cHierClus subtypes' versus Clinical Feature #6: 'RADIATION_THERAPY'
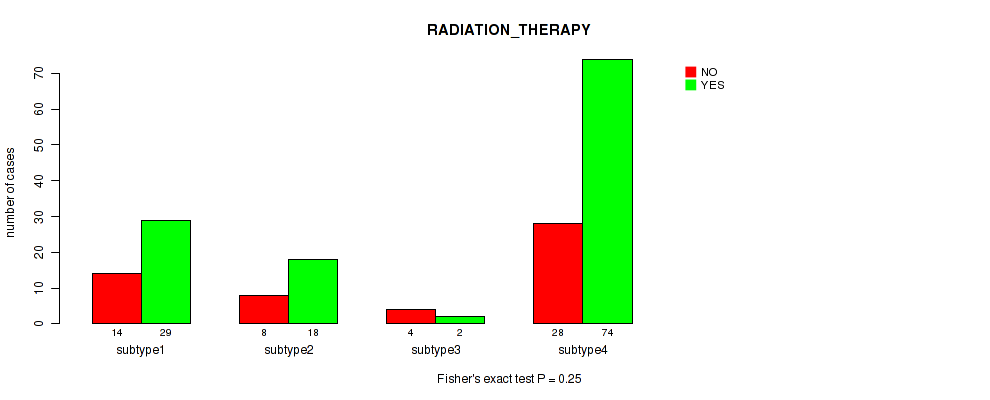
P value = 1e-05 (Fisher's exact test), Q value = 0.00044
Table S366. Clustering Approach #10: 'MIRseq Mature cHierClus subtypes' versus Clinical Feature #7: 'HISTOLOGICAL_TYPE'
| nPatients | ADENOSQUAMOUS | CERVICAL SQUAMOUS CELL CARCINOMA | ENDOCERVICAL ADENOCARCINOMA OF THE USUAL TYPE | ENDOCERVICAL TYPE OF ADENOCARCINOMA | ENDOMETRIOID ADENOCARCINOMA OF ENDOCERVIX | MUCINOUS ADENOCARCINOMA OF ENDOCERVICAL TYPE |
|---|---|---|---|---|---|---|
| ALL | 6 | 242 | 6 | 20 | 3 | 17 |
| subtype1 | 4 | 16 | 5 | 19 | 3 | 17 |
| subtype2 | 1 | 49 | 0 | 0 | 0 | 0 |
| subtype3 | 0 | 30 | 0 | 1 | 0 | 0 |
| subtype4 | 1 | 147 | 1 | 0 | 0 | 0 |
Figure S356. Get High-res Image Clustering Approach #10: 'MIRseq Mature cHierClus subtypes' versus Clinical Feature #7: 'HISTOLOGICAL_TYPE'
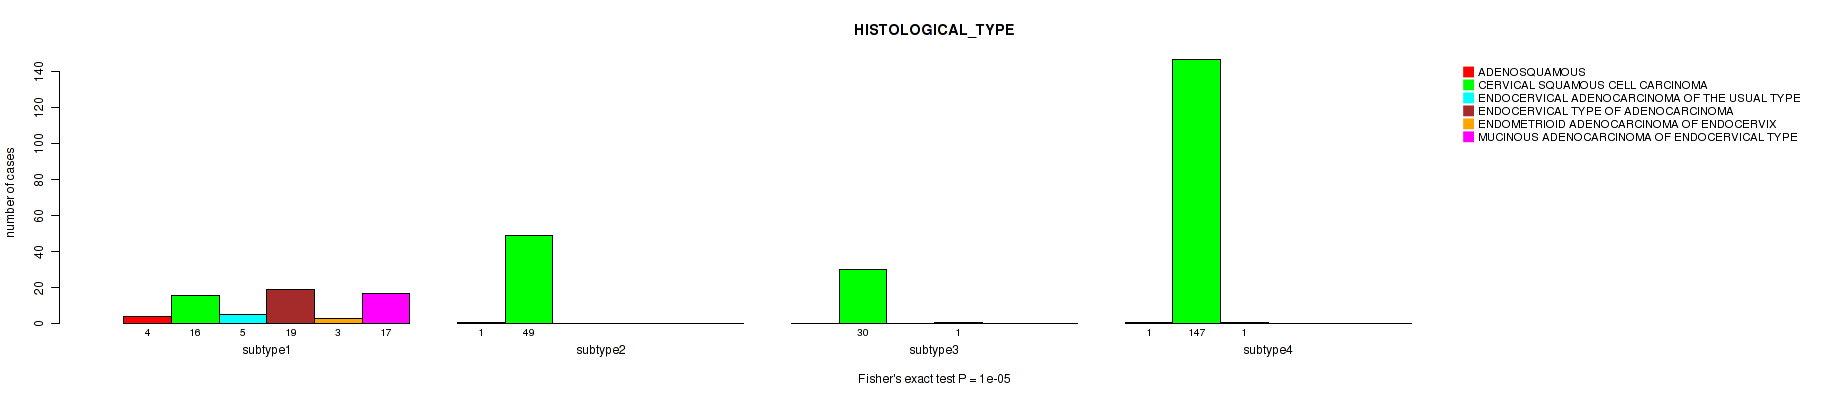
P value = 0.142 (Kruskal-Wallis (anova)), Q value = 0.47
Table S367. Clustering Approach #10: 'MIRseq Mature cHierClus subtypes' versus Clinical Feature #8: 'NUMBER_PACK_YEARS_SMOKED'
| nPatients | Mean (Std.Dev) | |
|---|---|---|
| ALL | 88 | 17.2 (14.0) |
| subtype1 | 17 | 13.1 (11.1) |
| subtype2 | 13 | 21.9 (12.2) |
| subtype3 | 10 | 19.5 (9.9) |
| subtype4 | 48 | 16.9 (15.8) |
Figure S357. Get High-res Image Clustering Approach #10: 'MIRseq Mature cHierClus subtypes' versus Clinical Feature #8: 'NUMBER_PACK_YEARS_SMOKED'
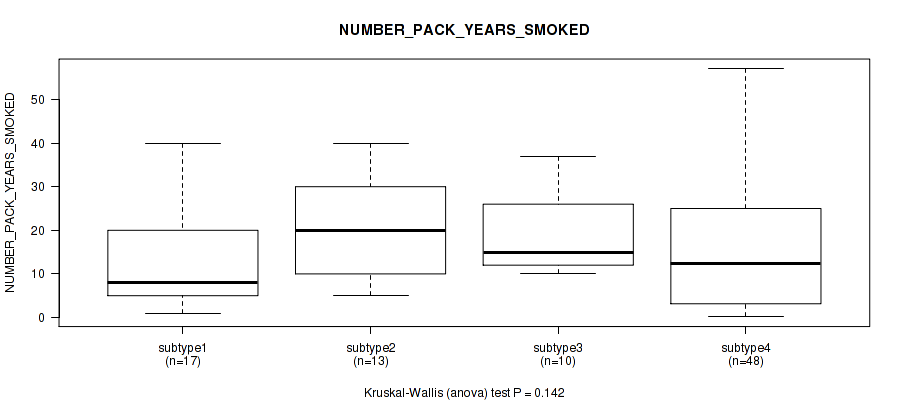
P value = 0.0805 (Kruskal-Wallis (anova)), Q value = 0.37
Table S368. Clustering Approach #10: 'MIRseq Mature cHierClus subtypes' versus Clinical Feature #9: 'NUMBER_OF_LYMPH_NODES'
| nPatients | Mean (Std.Dev) | |
|---|---|---|
| ALL | 155 | 1.0 (2.3) |
| subtype1 | 39 | 0.6 (1.9) |
| subtype2 | 28 | 1.1 (1.9) |
| subtype3 | 25 | 2.4 (4.5) |
| subtype4 | 63 | 0.6 (1.1) |
Figure S358. Get High-res Image Clustering Approach #10: 'MIRseq Mature cHierClus subtypes' versus Clinical Feature #9: 'NUMBER_OF_LYMPH_NODES'
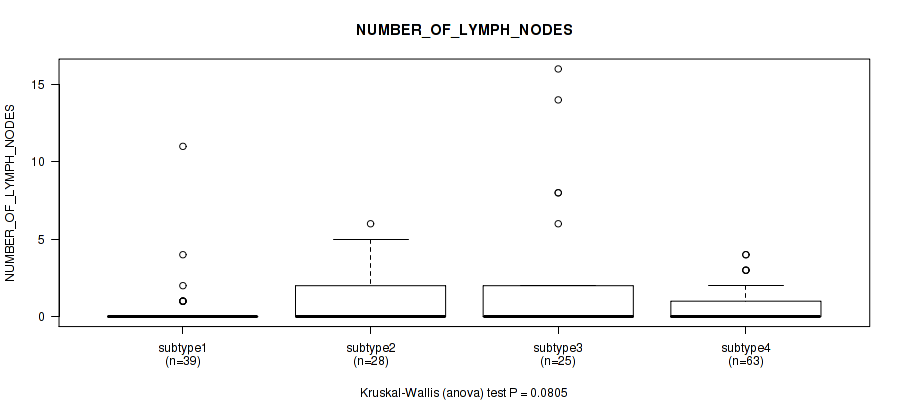
P value = 0.484 (Fisher's exact test), Q value = 0.74
Table S369. Clustering Approach #10: 'MIRseq Mature cHierClus subtypes' versus Clinical Feature #10: 'RACE'
| nPatients | AMERICAN INDIAN OR ALASKA NATIVE | ASIAN | BLACK OR AFRICAN AMERICAN | NATIVE HAWAIIAN OR OTHER PACIFIC ISLANDER | WHITE |
|---|---|---|---|---|---|
| ALL | 7 | 19 | 27 | 2 | 205 |
| subtype1 | 1 | 6 | 3 | 0 | 45 |
| subtype2 | 1 | 5 | 2 | 0 | 35 |
| subtype3 | 0 | 2 | 3 | 0 | 26 |
| subtype4 | 5 | 6 | 19 | 2 | 99 |
Figure S359. Get High-res Image Clustering Approach #10: 'MIRseq Mature cHierClus subtypes' versus Clinical Feature #10: 'RACE'
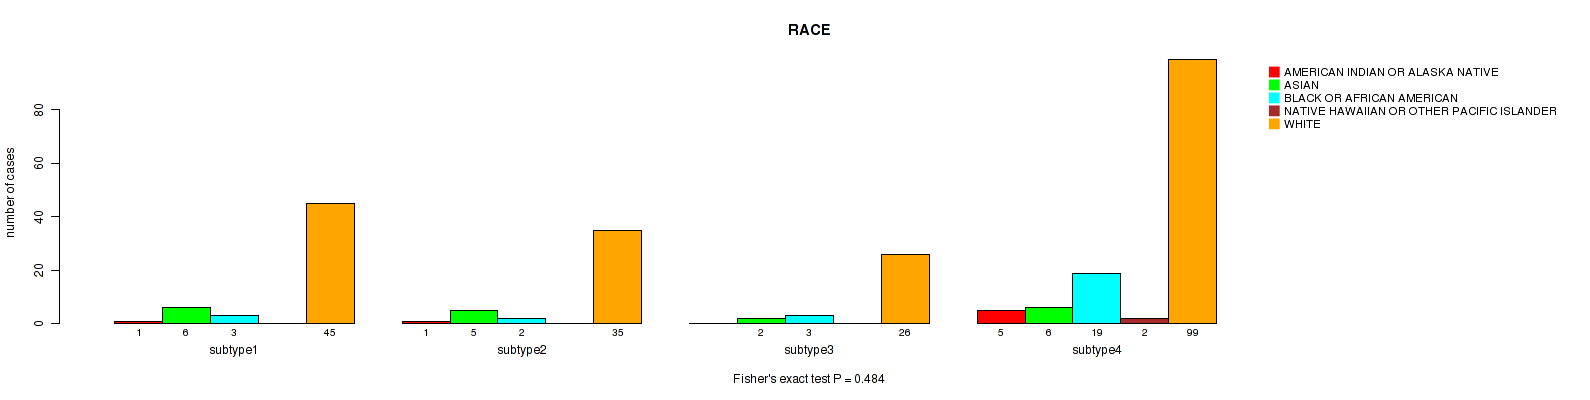
P value = 0.468 (Fisher's exact test), Q value = 0.74
Table S370. Clustering Approach #10: 'MIRseq Mature cHierClus subtypes' versus Clinical Feature #11: 'ETHNICITY'
| nPatients | HISPANIC OR LATINO | NOT HISPANIC OR LATINO |
|---|---|---|
| ALL | 24 | 161 |
| subtype1 | 6 | 33 |
| subtype2 | 3 | 31 |
| subtype3 | 1 | 22 |
| subtype4 | 14 | 75 |
Figure S360. Get High-res Image Clustering Approach #10: 'MIRseq Mature cHierClus subtypes' versus Clinical Feature #11: 'ETHNICITY'
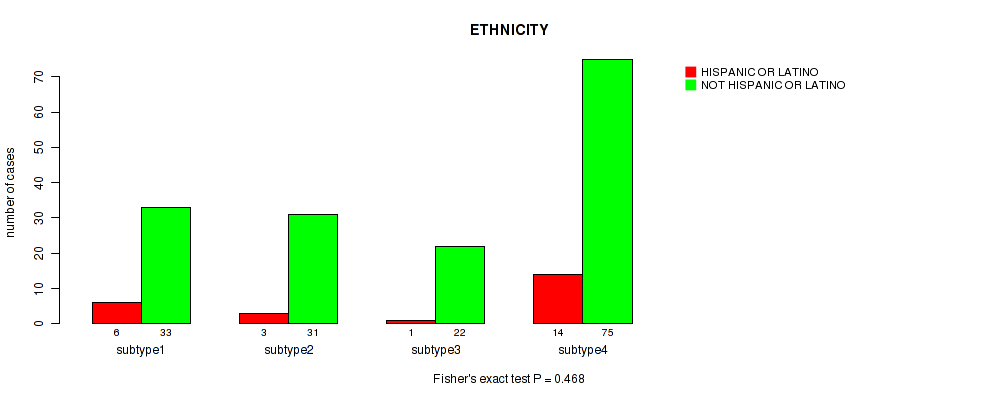
P value = 0.925 (Kruskal-Wallis (anova)), Q value = 0.97
Table S371. Clustering Approach #10: 'MIRseq Mature cHierClus subtypes' versus Clinical Feature #12: 'WEIGHT_KG_AT_DIAGNOSIS'
| nPatients | Mean (Std.Dev) | |
|---|---|---|
| ALL | 266 | 72.9 (21.4) |
| subtype1 | 58 | 72.4 (16.8) |
| subtype2 | 45 | 75.3 (32.9) |
| subtype3 | 28 | 71.8 (17.7) |
| subtype4 | 135 | 72.6 (19.2) |
Figure S361. Get High-res Image Clustering Approach #10: 'MIRseq Mature cHierClus subtypes' versus Clinical Feature #12: 'WEIGHT_KG_AT_DIAGNOSIS'
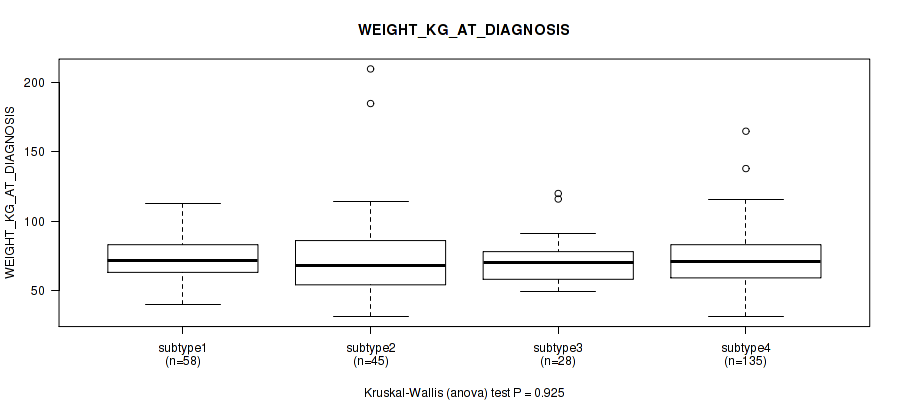
P value = 0.493 (Fisher's exact test), Q value = 0.75
Table S372. Clustering Approach #10: 'MIRseq Mature cHierClus subtypes' versus Clinical Feature #13: 'TUMOR_STATUS'
| nPatients | TUMOR FREE | WITH TUMOR |
|---|---|---|
| ALL | 186 | 74 |
| subtype1 | 39 | 19 |
| subtype2 | 33 | 10 |
| subtype3 | 19 | 11 |
| subtype4 | 95 | 34 |
Figure S362. Get High-res Image Clustering Approach #10: 'MIRseq Mature cHierClus subtypes' versus Clinical Feature #13: 'TUMOR_STATUS'
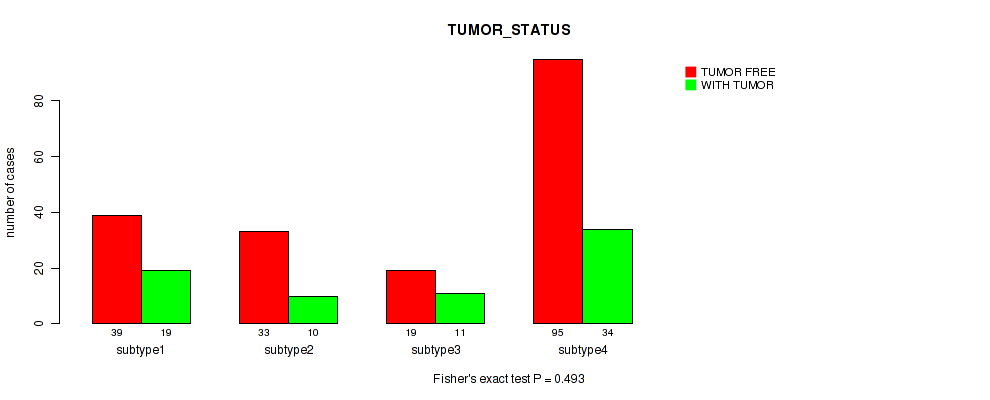
P value = 0.0523 (Fisher's exact test), Q value = 0.28
Table S373. Clustering Approach #10: 'MIRseq Mature cHierClus subtypes' versus Clinical Feature #14: 'NEOPLASM_HISTOLOGIC_GRADE'
| nPatients | G1 | G2 | G3 | G4 | GX |
|---|---|---|---|---|---|
| ALL | 16 | 128 | 118 | 1 | 23 |
| subtype1 | 6 | 28 | 24 | 0 | 6 |
| subtype2 | 5 | 28 | 14 | 0 | 2 |
| subtype3 | 0 | 17 | 14 | 0 | 0 |
| subtype4 | 5 | 55 | 66 | 1 | 15 |
Figure S363. Get High-res Image Clustering Approach #10: 'MIRseq Mature cHierClus subtypes' versus Clinical Feature #14: 'NEOPLASM_HISTOLOGIC_GRADE'
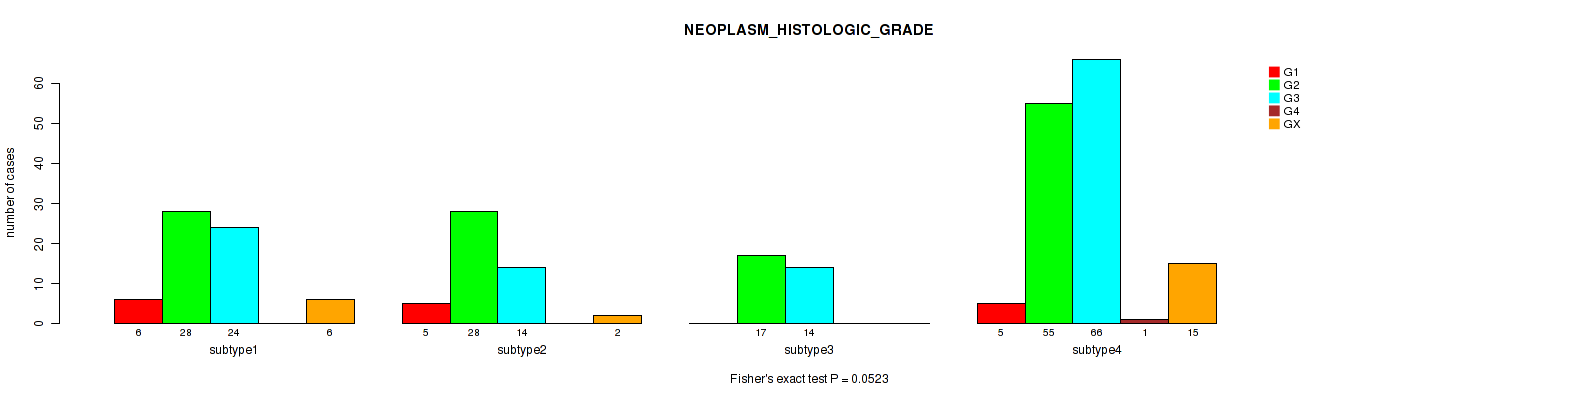
P value = 0.254 (Kruskal-Wallis (anova)), Q value = 0.58
Table S374. Clustering Approach #10: 'MIRseq Mature cHierClus subtypes' versus Clinical Feature #15: 'TOBACCO_SMOKING_YEAR_STOPPED'
| nPatients | Mean (Std.Dev) | |
|---|---|---|
| ALL | 41 | 2000.0 (13.9) |
| subtype1 | 8 | 2000.9 (12.9) |
| subtype2 | 5 | 1995.4 (15.9) |
| subtype3 | 5 | 1995.6 (5.4) |
| subtype4 | 23 | 2001.6 (15.3) |
Figure S364. Get High-res Image Clustering Approach #10: 'MIRseq Mature cHierClus subtypes' versus Clinical Feature #15: 'TOBACCO_SMOKING_YEAR_STOPPED'
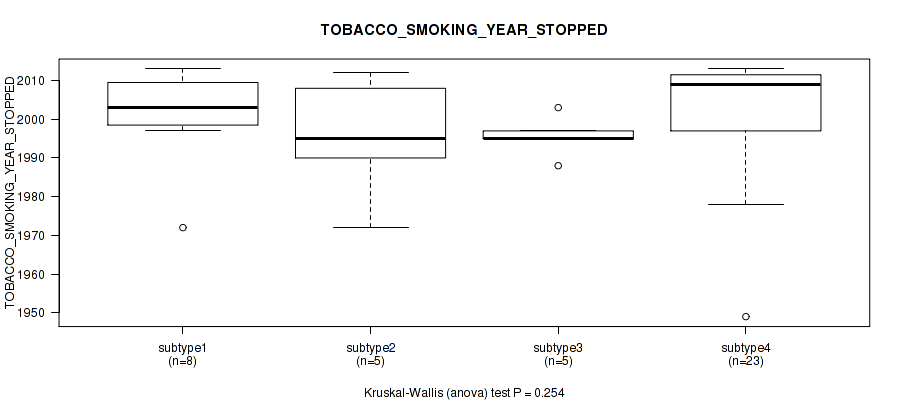
P value = 0.142 (Kruskal-Wallis (anova)), Q value = 0.47
Table S375. Clustering Approach #10: 'MIRseq Mature cHierClus subtypes' versus Clinical Feature #16: 'TOBACCO_SMOKING_PACK_YEARS_SMOKED'
| nPatients | Mean (Std.Dev) | |
|---|---|---|
| ALL | 88 | 17.2 (14.0) |
| subtype1 | 17 | 13.1 (11.1) |
| subtype2 | 13 | 21.9 (12.2) |
| subtype3 | 10 | 19.5 (9.9) |
| subtype4 | 48 | 16.9 (15.8) |
Figure S365. Get High-res Image Clustering Approach #10: 'MIRseq Mature cHierClus subtypes' versus Clinical Feature #16: 'TOBACCO_SMOKING_PACK_YEARS_SMOKED'
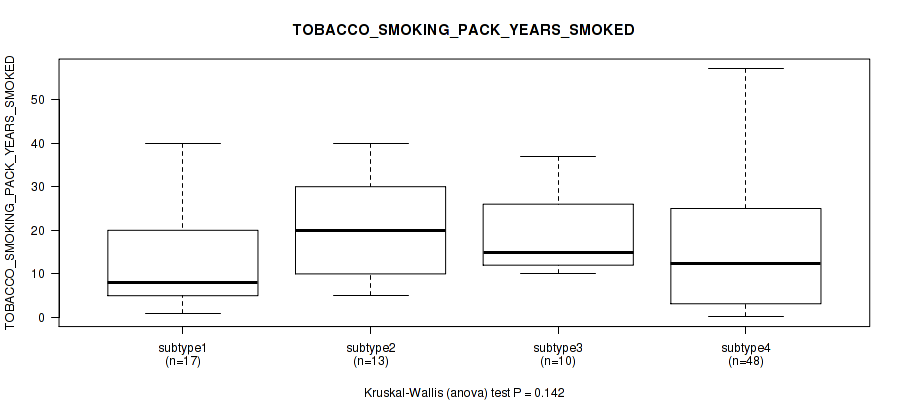
P value = 0.287 (Fisher's exact test), Q value = 0.61
Table S376. Clustering Approach #10: 'MIRseq Mature cHierClus subtypes' versus Clinical Feature #17: 'TOBACCO_SMOKING_HISTORY'
| nPatients | CURRENT REFORMED SMOKER FOR < OR = 15 YEARS | CURRENT REFORMED SMOKER FOR > 15 YEARS | CURRENT REFORMED SMOKER, DURATION NOT SPECIFIED | CURRENT SMOKER | LIFELONG NON-SMOKER |
|---|---|---|---|---|---|
| ALL | 39 | 8 | 4 | 61 | 143 |
| subtype1 | 8 | 1 | 0 | 11 | 38 |
| subtype2 | 3 | 2 | 2 | 11 | 22 |
| subtype3 | 8 | 2 | 0 | 5 | 14 |
| subtype4 | 20 | 3 | 2 | 34 | 69 |
Figure S366. Get High-res Image Clustering Approach #10: 'MIRseq Mature cHierClus subtypes' versus Clinical Feature #17: 'TOBACCO_SMOKING_HISTORY'
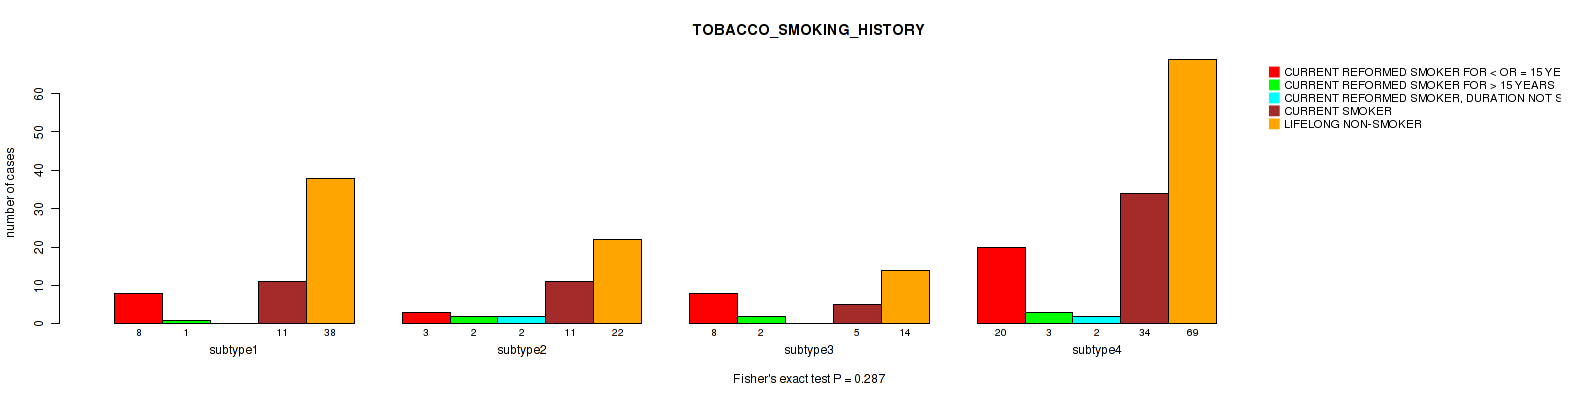
P value = 0.899 (Kruskal-Wallis (anova)), Q value = 0.96
Table S377. Clustering Approach #10: 'MIRseq Mature cHierClus subtypes' versus Clinical Feature #18: 'AGEBEGANSMOKINGINYEARS'
| nPatients | Mean (Std.Dev) | |
|---|---|---|
| ALL | 80 | 20.9 (7.6) |
| subtype1 | 16 | 21.0 (5.8) |
| subtype2 | 10 | 19.9 (5.0) |
| subtype3 | 8 | 19.9 (5.2) |
| subtype4 | 46 | 21.2 (8.9) |
Figure S367. Get High-res Image Clustering Approach #10: 'MIRseq Mature cHierClus subtypes' versus Clinical Feature #18: 'AGEBEGANSMOKINGINYEARS'
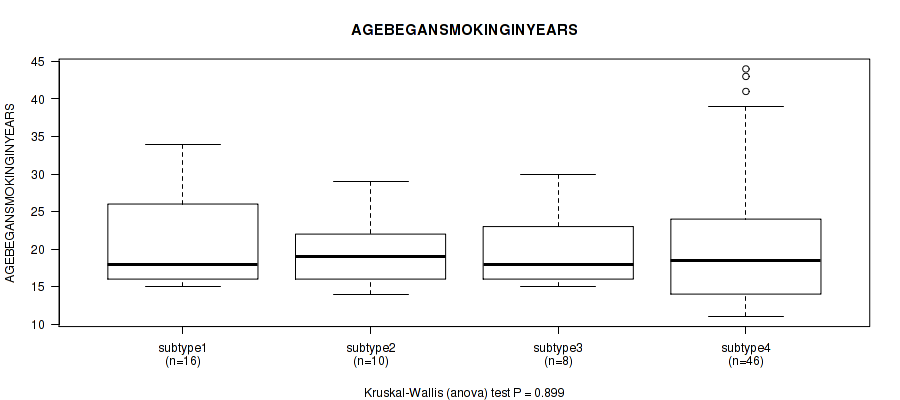
P value = 0.459 (Fisher's exact test), Q value = 0.74
Table S378. Clustering Approach #10: 'MIRseq Mature cHierClus subtypes' versus Clinical Feature #19: 'RADIATION_THERAPY_STATUS'
| nPatients | COMPLETED AS PLANNED | TREATMENT NOT COMPLETED |
|---|---|---|
| ALL | 27 | 3 |
| subtype1 | 1 | 0 |
| subtype2 | 2 | 0 |
| subtype3 | 17 | 1 |
| subtype4 | 7 | 2 |
Figure S368. Get High-res Image Clustering Approach #10: 'MIRseq Mature cHierClus subtypes' versus Clinical Feature #19: 'RADIATION_THERAPY_STATUS'
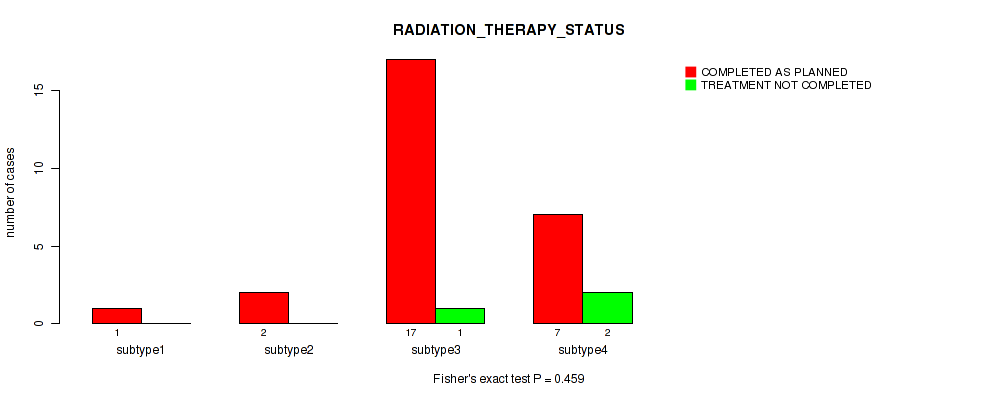
P value = 0.135 (Kruskal-Wallis (anova)), Q value = 0.47
Table S379. Clustering Approach #10: 'MIRseq Mature cHierClus subtypes' versus Clinical Feature #20: 'PREGNANCIES_COUNT_TOTAL'
| nPatients | Mean (Std.Dev) | |
|---|---|---|
| ALL | 257 | 3.6 (2.5) |
| subtype1 | 58 | 3.0 (2.0) |
| subtype2 | 42 | 3.5 (2.5) |
| subtype3 | 30 | 3.3 (1.9) |
| subtype4 | 127 | 4.0 (2.8) |
Figure S369. Get High-res Image Clustering Approach #10: 'MIRseq Mature cHierClus subtypes' versus Clinical Feature #20: 'PREGNANCIES_COUNT_TOTAL'
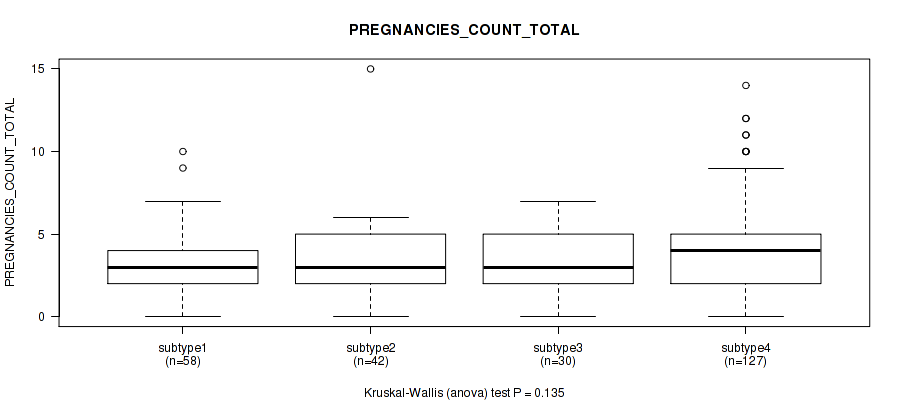
P value = 0.193 (Kruskal-Wallis (anova)), Q value = 0.52
Table S380. Clustering Approach #10: 'MIRseq Mature cHierClus subtypes' versus Clinical Feature #21: 'PREGNANCIES_COUNT_STILLBIRTH'
| nPatients | Mean (Std.Dev) | |
|---|---|---|
| ALL | 107 | 0.1 (0.3) |
| subtype1 | 21 | 0.0 (0.0) |
| subtype2 | 19 | 0.0 (0.0) |
| subtype3 | 26 | 0.2 (0.6) |
| subtype4 | 41 | 0.0 (0.2) |
Figure S370. Get High-res Image Clustering Approach #10: 'MIRseq Mature cHierClus subtypes' versus Clinical Feature #21: 'PREGNANCIES_COUNT_STILLBIRTH'
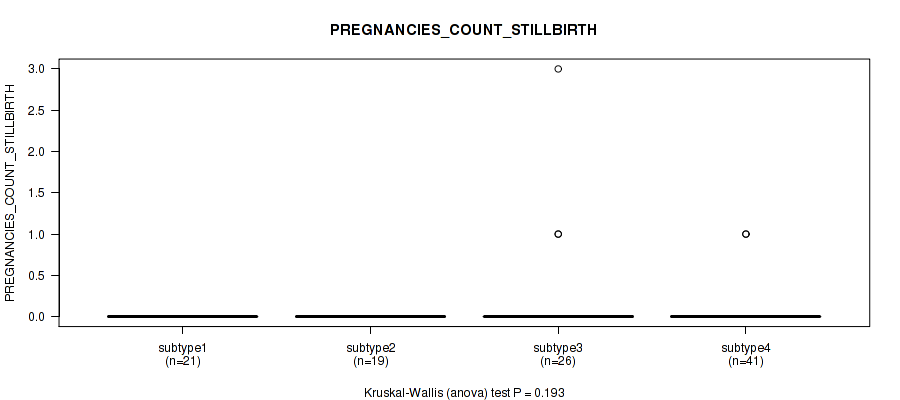
P value = 0.128 (Kruskal-Wallis (anova)), Q value = 0.47
Table S381. Clustering Approach #10: 'MIRseq Mature cHierClus subtypes' versus Clinical Feature #22: 'PREGNANCY_SPONTANEOUS_ABORTION_COUNT'
| nPatients | Mean (Std.Dev) | |
|---|---|---|
| ALL | 143 | 0.6 (1.0) |
| subtype1 | 26 | 0.6 (0.9) |
| subtype2 | 26 | 0.3 (0.5) |
| subtype3 | 27 | 0.4 (0.7) |
| subtype4 | 64 | 0.7 (1.2) |
Figure S371. Get High-res Image Clustering Approach #10: 'MIRseq Mature cHierClus subtypes' versus Clinical Feature #22: 'PREGNANCY_SPONTANEOUS_ABORTION_COUNT'
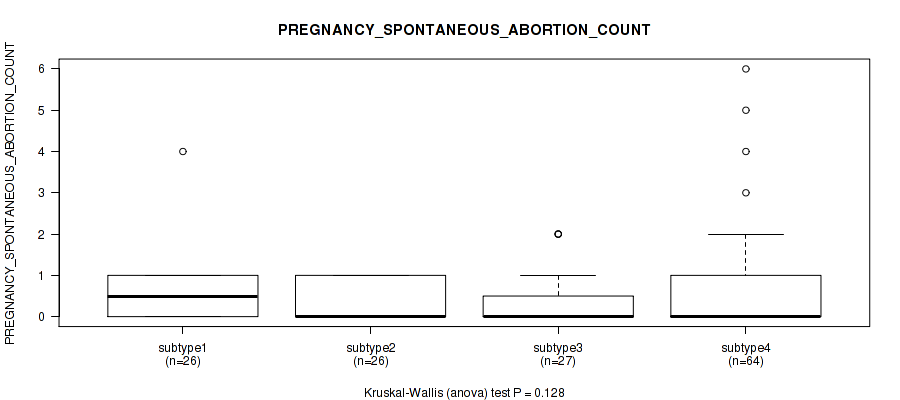
P value = 0.0205 (Kruskal-Wallis (anova)), Q value = 0.18
Table S382. Clustering Approach #10: 'MIRseq Mature cHierClus subtypes' versus Clinical Feature #23: 'PREGNANCIES_COUNT_LIVE_BIRTH'
| nPatients | Mean (Std.Dev) | |
|---|---|---|
| ALL | 252 | 2.8 (2.0) |
| subtype1 | 55 | 2.4 (1.9) |
| subtype2 | 42 | 2.6 (1.3) |
| subtype3 | 31 | 2.2 (1.6) |
| subtype4 | 124 | 3.2 (2.3) |
Figure S372. Get High-res Image Clustering Approach #10: 'MIRseq Mature cHierClus subtypes' versus Clinical Feature #23: 'PREGNANCIES_COUNT_LIVE_BIRTH'
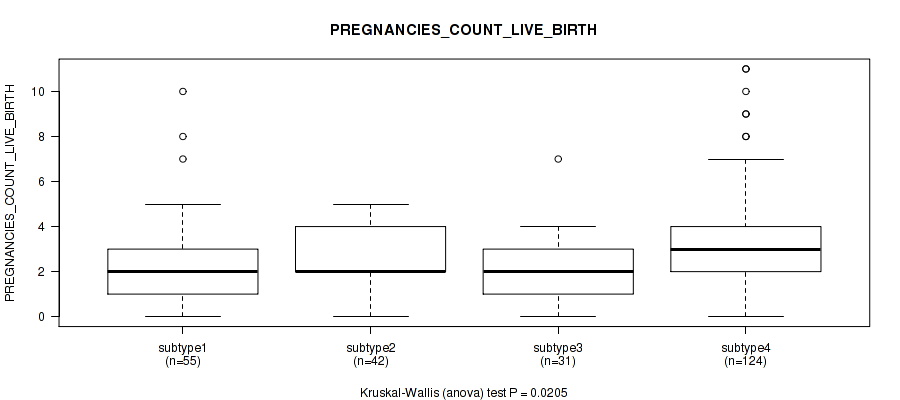
P value = 0.804 (Kruskal-Wallis (anova)), Q value = 0.92
Table S383. Clustering Approach #10: 'MIRseq Mature cHierClus subtypes' versus Clinical Feature #24: 'PREGNANCY_THERAPEUTIC_ABORTION_COUNT'
| nPatients | Mean (Std.Dev) | |
|---|---|---|
| ALL | 116 | 0.8 (1.8) |
| subtype1 | 23 | 0.7 (1.0) |
| subtype2 | 23 | 1.3 (2.8) |
| subtype3 | 25 | 0.6 (1.0) |
| subtype4 | 45 | 0.7 (1.7) |
Figure S373. Get High-res Image Clustering Approach #10: 'MIRseq Mature cHierClus subtypes' versus Clinical Feature #24: 'PREGNANCY_THERAPEUTIC_ABORTION_COUNT'
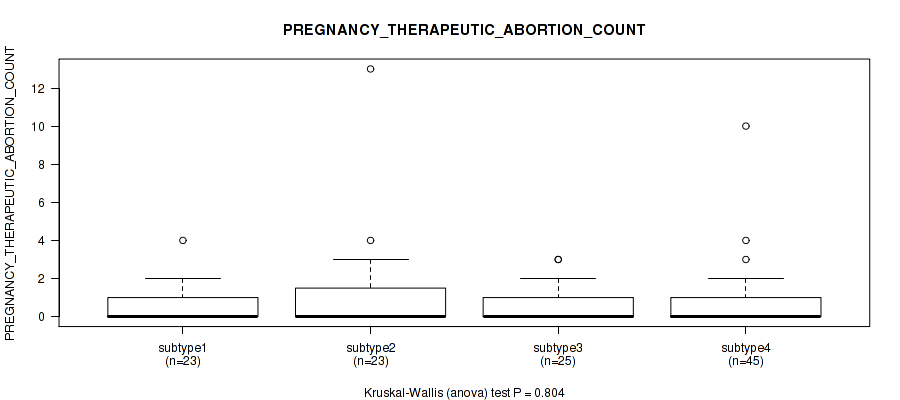
P value = 0.629 (Kruskal-Wallis (anova)), Q value = 0.83
Table S384. Clustering Approach #10: 'MIRseq Mature cHierClus subtypes' versus Clinical Feature #25: 'PREGNANCIES_COUNT_ECTOPIC'
| nPatients | Mean (Std.Dev) | |
|---|---|---|
| ALL | 112 | 0.1 (0.3) |
| subtype1 | 21 | 0.0 (0.2) |
| subtype2 | 21 | 0.2 (0.5) |
| subtype3 | 26 | 0.1 (0.3) |
| subtype4 | 44 | 0.1 (0.3) |
Figure S374. Get High-res Image Clustering Approach #10: 'MIRseq Mature cHierClus subtypes' versus Clinical Feature #25: 'PREGNANCIES_COUNT_ECTOPIC'
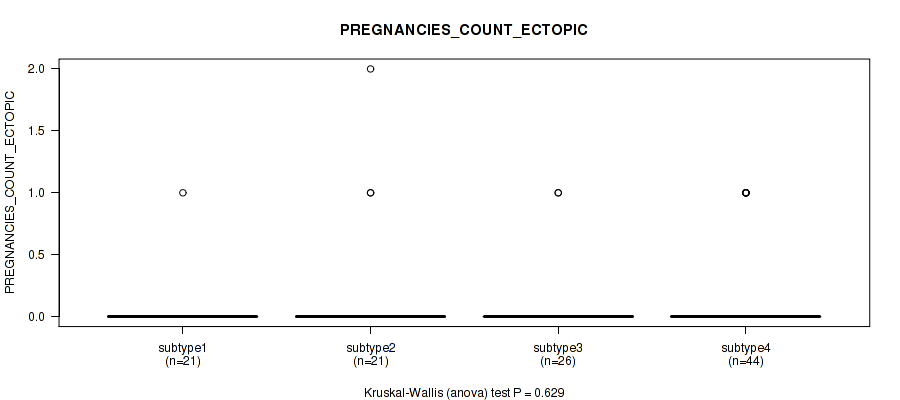
P value = 0.693 (Fisher's exact test), Q value = 0.85
Table S385. Clustering Approach #10: 'MIRseq Mature cHierClus subtypes' versus Clinical Feature #26: 'POS_LYMPH_NODE_LOCATION'
| nPatients | MACROSCOPIC PARAMETRIAL INVOLVEMENT | MICROSCOPIC PARAMETRIAL INVOLVEMENT | OTHER LOCATION, SPECIFY | POSITIVE BLADDER MARGIN | POSITIVE VAGINAL MARGIN |
|---|---|---|---|---|---|
| ALL | 2 | 7 | 39 | 1 | 10 |
| subtype1 | 1 | 1 | 7 | 0 | 2 |
| subtype2 | 1 | 1 | 6 | 1 | 1 |
| subtype3 | 0 | 2 | 14 | 0 | 2 |
| subtype4 | 0 | 3 | 12 | 0 | 5 |
Figure S375. Get High-res Image Clustering Approach #10: 'MIRseq Mature cHierClus subtypes' versus Clinical Feature #26: 'POS_LYMPH_NODE_LOCATION'
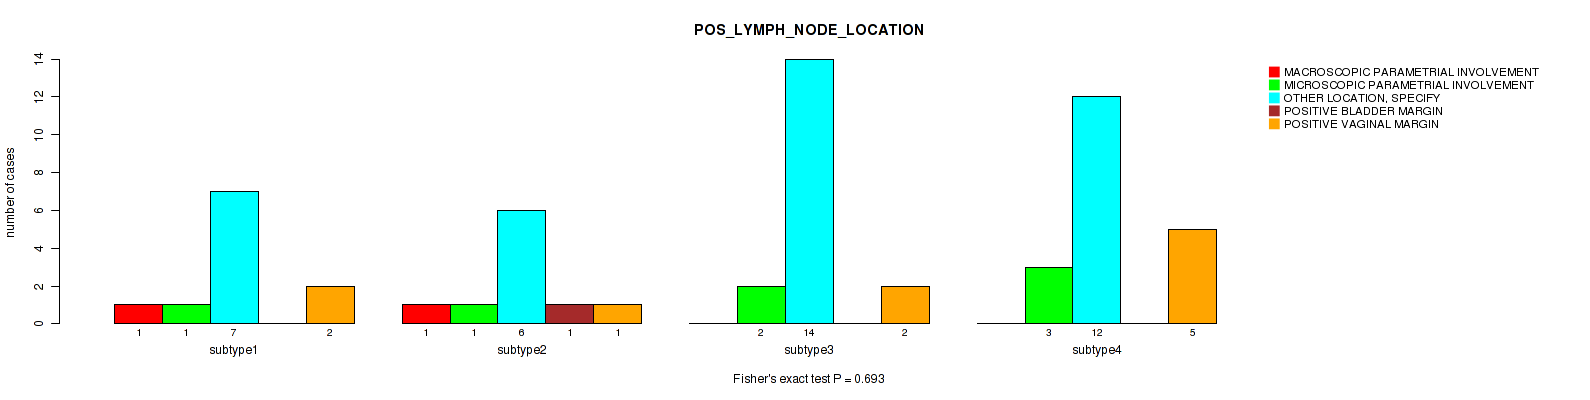
P value = 0.301 (Fisher's exact test), Q value = 0.64
Table S386. Clustering Approach #10: 'MIRseq Mature cHierClus subtypes' versus Clinical Feature #27: 'MENOPAUSE_STATUS'
| nPatients | INDETERMINATE (NEITHER PRE OR POSTMENOPAUSAL) | PERI (6-12 MONTHS SINCE LAST MENSTRUAL PERIOD) | POST (PRIOR BILATERAL OVARIECTOMY OR >12 MO SINCE LMP WITH NO PRIOR HYSTERECTOMY) | PRE (<6 MONTHS SINCE LMP AND NO PRIOR BILATERAL OVARIECTOMY AND NOT ON ESTROGEN REPLACEMENT) |
|---|---|---|---|---|
| ALL | 2 | 25 | 78 | 120 |
| subtype1 | 0 | 7 | 17 | 30 |
| subtype2 | 0 | 4 | 15 | 18 |
| subtype3 | 2 | 1 | 12 | 14 |
| subtype4 | 0 | 13 | 34 | 58 |
Figure S376. Get High-res Image Clustering Approach #10: 'MIRseq Mature cHierClus subtypes' versus Clinical Feature #27: 'MENOPAUSE_STATUS'
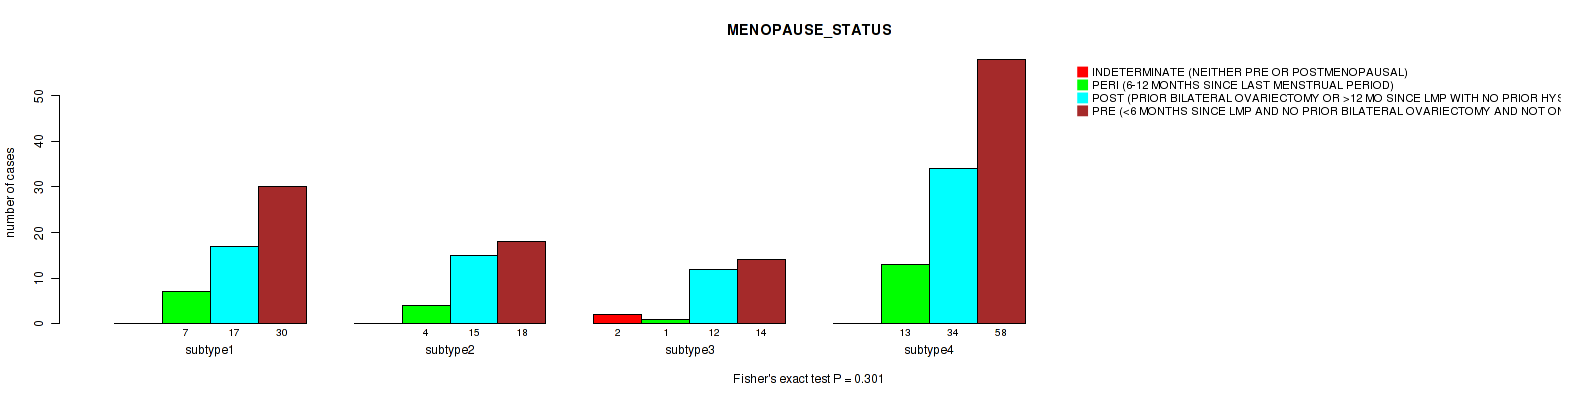
P value = 0.0807 (Fisher's exact test), Q value = 0.37
Table S387. Clustering Approach #10: 'MIRseq Mature cHierClus subtypes' versus Clinical Feature #28: 'LYMPHOVASCULAR_INVOLVEMENT'
| nPatients | ABSENT | PRESENT |
|---|---|---|
| ALL | 69 | 74 |
| subtype1 | 21 | 16 |
| subtype2 | 14 | 15 |
| subtype3 | 6 | 18 |
| subtype4 | 28 | 25 |
Figure S377. Get High-res Image Clustering Approach #10: 'MIRseq Mature cHierClus subtypes' versus Clinical Feature #28: 'LYMPHOVASCULAR_INVOLVEMENT'
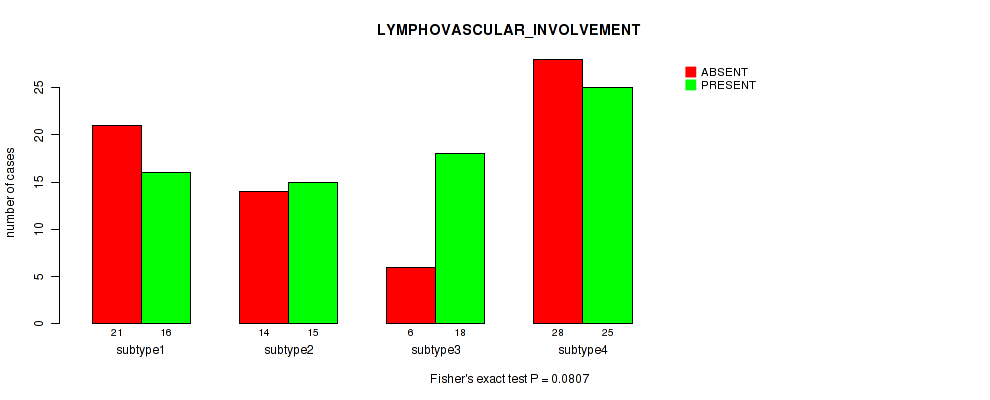
P value = 0.0805 (Kruskal-Wallis (anova)), Q value = 0.37
Table S388. Clustering Approach #10: 'MIRseq Mature cHierClus subtypes' versus Clinical Feature #29: 'LYMPH_NODES_EXAMINED_HE_COUNT'
| nPatients | Mean (Std.Dev) | |
|---|---|---|
| ALL | 155 | 1.0 (2.3) |
| subtype1 | 39 | 0.6 (1.9) |
| subtype2 | 28 | 1.1 (1.9) |
| subtype3 | 25 | 2.4 (4.5) |
| subtype4 | 63 | 0.6 (1.1) |
Figure S378. Get High-res Image Clustering Approach #10: 'MIRseq Mature cHierClus subtypes' versus Clinical Feature #29: 'LYMPH_NODES_EXAMINED_HE_COUNT'
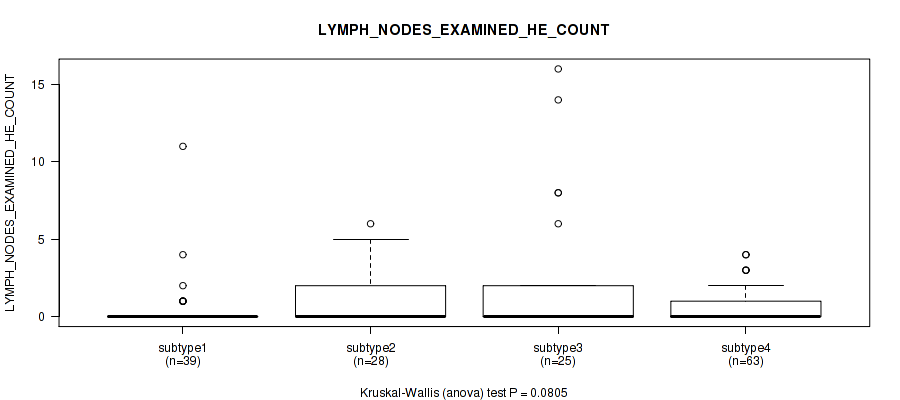
P value = 0.746 (Kruskal-Wallis (anova)), Q value = 0.88
Table S389. Clustering Approach #10: 'MIRseq Mature cHierClus subtypes' versus Clinical Feature #30: 'LYMPH_NODES_EXAMINED'
| nPatients | Mean (Std.Dev) | |
|---|---|---|
| ALL | 172 | 22.7 (12.6) |
| subtype1 | 43 | 21.3 (10.6) |
| subtype2 | 33 | 21.7 (12.2) |
| subtype3 | 25 | 26.1 (15.2) |
| subtype4 | 71 | 22.8 (13.0) |
Figure S379. Get High-res Image Clustering Approach #10: 'MIRseq Mature cHierClus subtypes' versus Clinical Feature #30: 'LYMPH_NODES_EXAMINED'
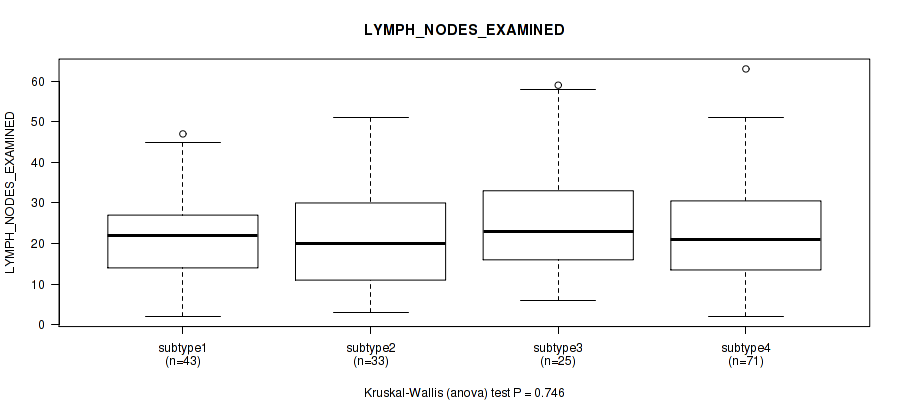
P value = 0.0268 (Fisher's exact test), Q value = 0.2
Table S390. Clustering Approach #10: 'MIRseq Mature cHierClus subtypes' versus Clinical Feature #31: 'KERATINIZATION_SQUAMOUS_CELL'
| nPatients | KERATINIZING SQUAMOUS CELL CARCINOMA | NON-KERATINIZING SQUAMOUS CELL CARCINOMA |
|---|---|---|
| ALL | 52 | 114 |
| subtype1 | 0 | 12 |
| subtype2 | 14 | 21 |
| subtype3 | 9 | 12 |
| subtype4 | 29 | 69 |
Figure S380. Get High-res Image Clustering Approach #10: 'MIRseq Mature cHierClus subtypes' versus Clinical Feature #31: 'KERATINIZATION_SQUAMOUS_CELL'
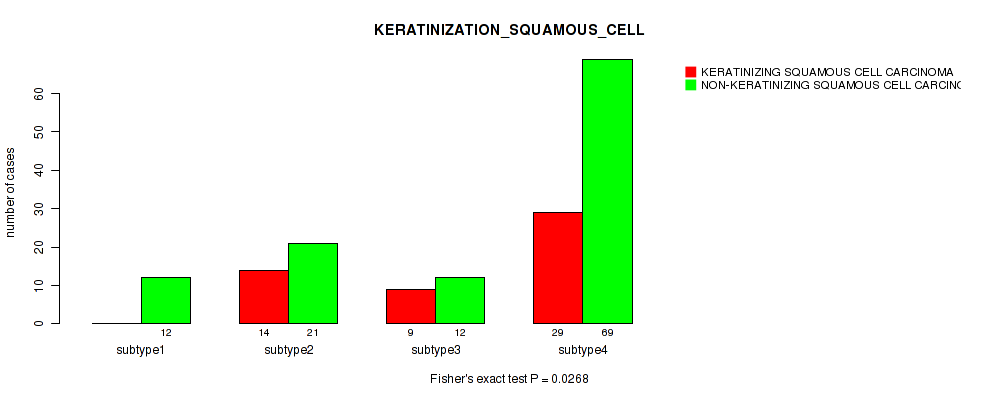
P value = 3.14e-08 (Kruskal-Wallis (anova)), Q value = 1.2e-05
Table S391. Clustering Approach #10: 'MIRseq Mature cHierClus subtypes' versus Clinical Feature #32: 'INITIAL_PATHOLOGIC_DX_YEAR'
| nPatients | Mean (Std.Dev) | |
|---|---|---|
| ALL | 292 | 2008.3 (4.8) |
| subtype1 | 63 | 2009.6 (3.6) |
| subtype2 | 49 | 2009.3 (3.9) |
| subtype3 | 31 | 2003.0 (5.1) |
| subtype4 | 149 | 2008.5 (4.7) |
Figure S381. Get High-res Image Clustering Approach #10: 'MIRseq Mature cHierClus subtypes' versus Clinical Feature #32: 'INITIAL_PATHOLOGIC_DX_YEAR'
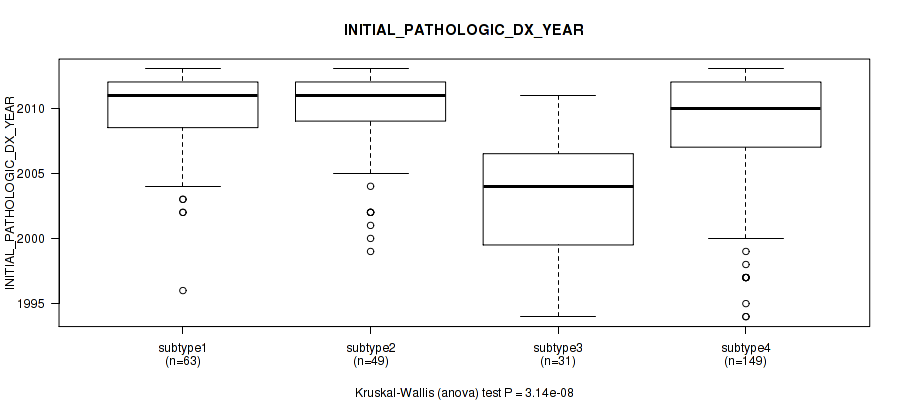
P value = 0.347 (Fisher's exact test), Q value = 0.67
Table S392. Clustering Approach #10: 'MIRseq Mature cHierClus subtypes' versus Clinical Feature #33: 'HISTORY_HORMONAL_CONTRACEPTIVES_USE'
| nPatients | CURRENT USER | FORMER USER | NEVER USED |
|---|---|---|---|
| ALL | 15 | 54 | 85 |
| subtype1 | 7 | 14 | 21 |
| subtype2 | 0 | 10 | 11 |
| subtype3 | 0 | 5 | 10 |
| subtype4 | 8 | 25 | 43 |
Figure S382. Get High-res Image Clustering Approach #10: 'MIRseq Mature cHierClus subtypes' versus Clinical Feature #33: 'HISTORY_HORMONAL_CONTRACEPTIVES_USE'
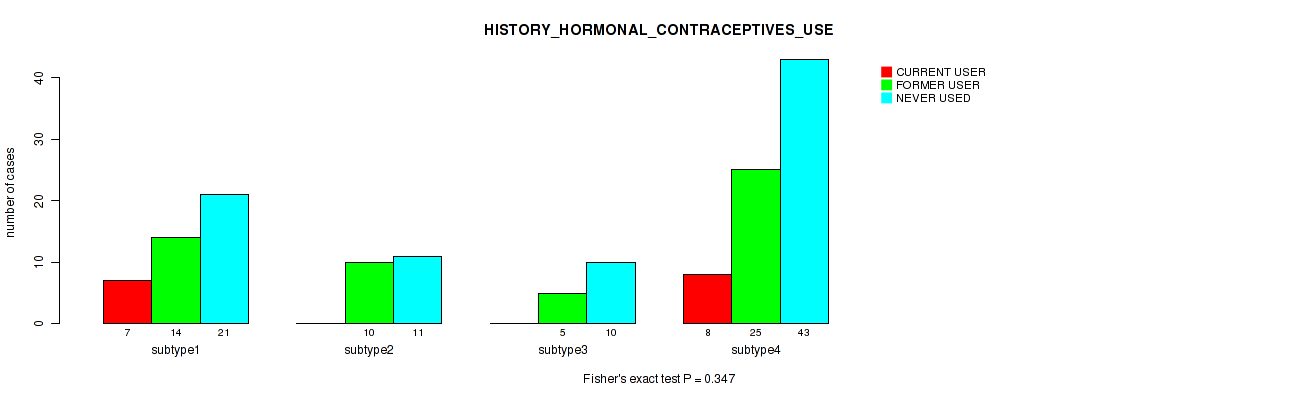
P value = 0.929 (Kruskal-Wallis (anova)), Q value = 0.97
Table S393. Clustering Approach #10: 'MIRseq Mature cHierClus subtypes' versus Clinical Feature #34: 'HEIGHT_CM_AT_DIAGNOSIS'
| nPatients | Mean (Std.Dev) | |
|---|---|---|
| ALL | 253 | 160.8 (7.3) |
| subtype1 | 57 | 160.9 (7.1) |
| subtype2 | 42 | 161.7 (7.9) |
| subtype3 | 25 | 160.8 (8.0) |
| subtype4 | 129 | 160.5 (7.1) |
Figure S383. Get High-res Image Clustering Approach #10: 'MIRseq Mature cHierClus subtypes' versus Clinical Feature #34: 'HEIGHT_CM_AT_DIAGNOSIS'
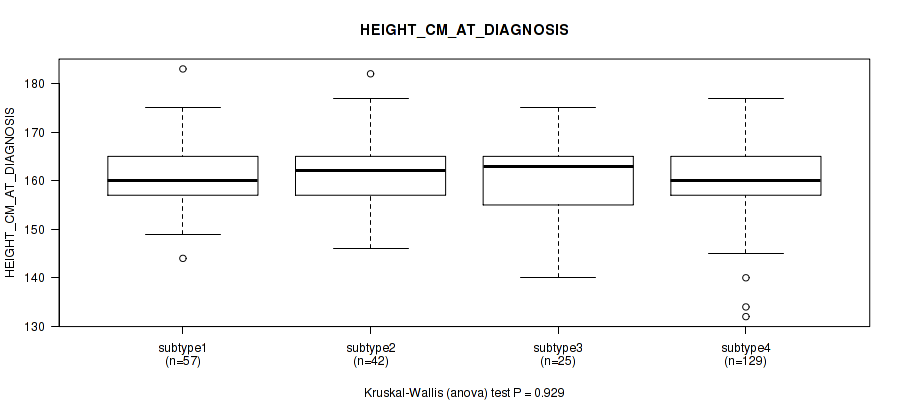
P value = 0.484 (Fisher's exact test), Q value = 0.74
Table S394. Clustering Approach #10: 'MIRseq Mature cHierClus subtypes' versus Clinical Feature #35: 'CORPUS_INVOLVEMENT'
| nPatients | ABSENT | PRESENT |
|---|---|---|
| ALL | 95 | 19 |
| subtype1 | 27 | 5 |
| subtype2 | 18 | 4 |
| subtype3 | 17 | 6 |
| subtype4 | 33 | 4 |
Figure S384. Get High-res Image Clustering Approach #10: 'MIRseq Mature cHierClus subtypes' versus Clinical Feature #35: 'CORPUS_INVOLVEMENT'
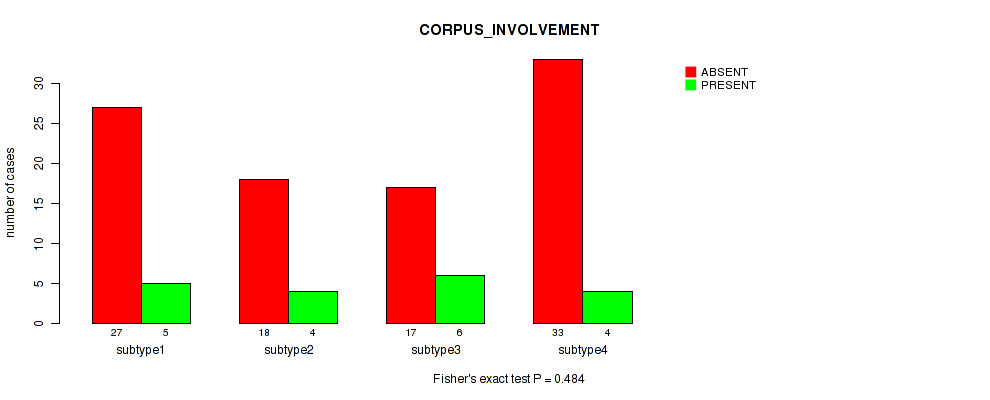
P value = 0.0215 (Fisher's exact test), Q value = 0.18
Table S395. Clustering Approach #10: 'MIRseq Mature cHierClus subtypes' versus Clinical Feature #36: 'CHEMO_CONCURRENT_TYPE'
| nPatients | CARBOPLATIN | CISPLATIN | OTHER |
|---|---|---|---|
| ALL | 7 | 102 | 2 |
| subtype1 | 3 | 19 | 1 |
| subtype2 | 0 | 12 | 0 |
| subtype3 | 3 | 9 | 0 |
| subtype4 | 1 | 62 | 1 |
Figure S385. Get High-res Image Clustering Approach #10: 'MIRseq Mature cHierClus subtypes' versus Clinical Feature #36: 'CHEMO_CONCURRENT_TYPE'
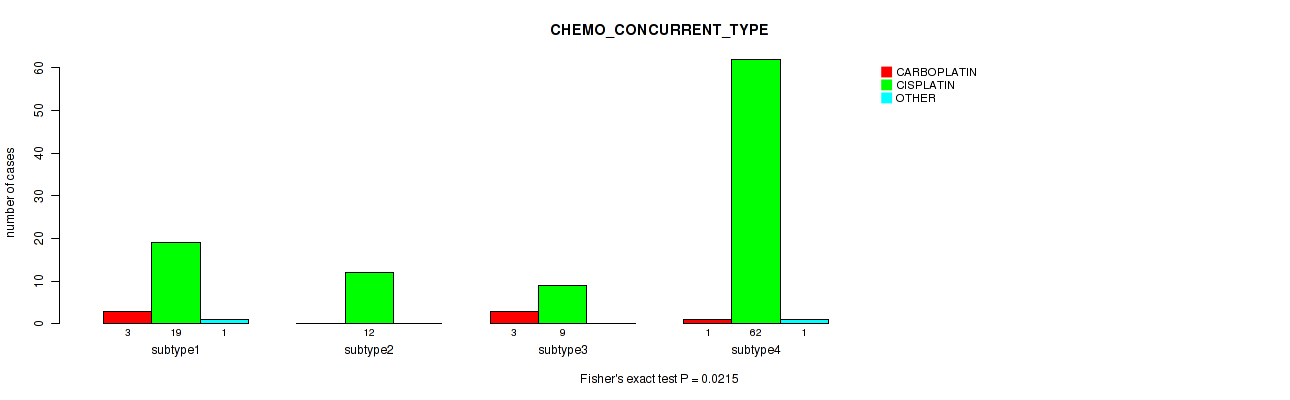
P value = 0.0797 (Kruskal-Wallis (anova)), Q value = 0.37
Table S396. Clustering Approach #10: 'MIRseq Mature cHierClus subtypes' versus Clinical Feature #37: 'CERVIX_SUV_RESULTS'
| nPatients | Mean (Std.Dev) | |
|---|---|---|
| ALL | 16 | 13.0 (7.3) |
| subtype1 | 1 | 7.1 (NA) |
| subtype2 | 6 | 9.0 (5.9) |
| subtype3 | 3 | 11.0 (3.0) |
| subtype4 | 6 | 18.8 (7.3) |
Figure S386. Get High-res Image Clustering Approach #10: 'MIRseq Mature cHierClus subtypes' versus Clinical Feature #37: 'CERVIX_SUV_RESULTS'
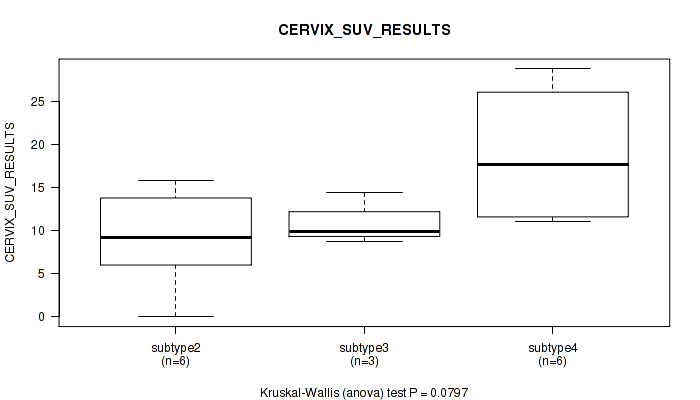
P value = 0.906 (Kruskal-Wallis (anova)), Q value = 0.96
Table S397. Clustering Approach #10: 'MIRseq Mature cHierClus subtypes' versus Clinical Feature #38: 'AGE_AT_DIAGNOSIS'
| nPatients | Mean (Std.Dev) | |
|---|---|---|
| ALL | 294 | 48.2 (13.8) |
| subtype1 | 64 | 47.6 (12.1) |
| subtype2 | 50 | 49.4 (14.2) |
| subtype3 | 31 | 48.9 (14.4) |
| subtype4 | 149 | 48.0 (14.3) |
Figure S387. Get High-res Image Clustering Approach #10: 'MIRseq Mature cHierClus subtypes' versus Clinical Feature #38: 'AGE_AT_DIAGNOSIS'

P value = 0.163 (Fisher's exact test), Q value = 0.49
Table S398. Clustering Approach #10: 'MIRseq Mature cHierClus subtypes' versus Clinical Feature #39: 'CLINICAL_STAGE'
| nPatients | STAGE I | STAGE IA | STAGE IA2 | STAGE IB | STAGE IB1 | STAGE IB2 | STAGE II | STAGE IIA | STAGE IIA1 | STAGE IIA2 | STAGE IIB | STAGE IIIA | STAGE IIIB | STAGE IVA | STAGE IVB |
|---|---|---|---|---|---|---|---|---|---|---|---|---|---|---|---|
| ALL | 5 | 1 | 1 | 37 | 76 | 37 | 5 | 8 | 5 | 7 | 42 | 3 | 41 | 8 | 11 |
| subtype1 | 1 | 0 | 0 | 6 | 23 | 10 | 1 | 3 | 1 | 2 | 7 | 0 | 5 | 1 | 4 |
| subtype2 | 0 | 1 | 1 | 4 | 17 | 5 | 1 | 2 | 1 | 1 | 6 | 0 | 7 | 2 | 1 |
| subtype3 | 0 | 0 | 0 | 12 | 5 | 4 | 0 | 1 | 1 | 0 | 2 | 0 | 6 | 0 | 0 |
| subtype4 | 4 | 0 | 0 | 15 | 31 | 18 | 3 | 2 | 2 | 4 | 27 | 3 | 23 | 5 | 6 |
Figure S388. Get High-res Image Clustering Approach #10: 'MIRseq Mature cHierClus subtypes' versus Clinical Feature #39: 'CLINICAL_STAGE'

-
Cluster data file = /xchip/cga/gdac-prod/tcga-gdac/jobResults/GDAC_mergedClustering/CESC-TP/20124378/CESC-TP.mergedcluster.txt
-
Clinical data file = /xchip/cga/gdac-prod/tcga-gdac/jobResults/Append_Data/CESC-TP/19775059/CESC-TP.merged_data.txt
-
Number of patients = 307
-
Number of clustering approaches = 10
-
Number of selected clinical features = 39
-
Exclude small clusters that include fewer than K patients, K = 3
consensus non-negative matrix factorization clustering approach (Brunet et al. 2004)
Resampling-based clustering method (Monti et al. 2003)
For survival clinical features, the Kaplan-Meier survival curves of tumors with and without gene mutations were plotted and the statistical significance P values were estimated by logrank test (Bland and Altman 2004) using the 'survdiff' function in R
For binary clinical features, two-tailed Fisher's exact tests (Fisher 1922) were used to estimate the P values using the 'fisher.test' function in R
For multiple hypothesis correction, Q value is the False Discovery Rate (FDR) analogue of the P value (Benjamini and Hochberg 1995), defined as the minimum FDR at which the test may be called significant. We used the 'Benjamini and Hochberg' method of 'p.adjust' function in R to convert P values into Q values.
In addition to the links below, the full results of the analysis summarized in this report can also be downloaded programmatically using firehose_get, or interactively from either the Broad GDAC website or TCGA Data Coordination Center Portal.