This pipeline computes the correlation between significantly recurrent gene mutations and selected clinical features.
Testing the association between mutation status of 49 genes and 13 clinical features across 510 patients, 17 significant findings detected with Q value < 0.25.
-
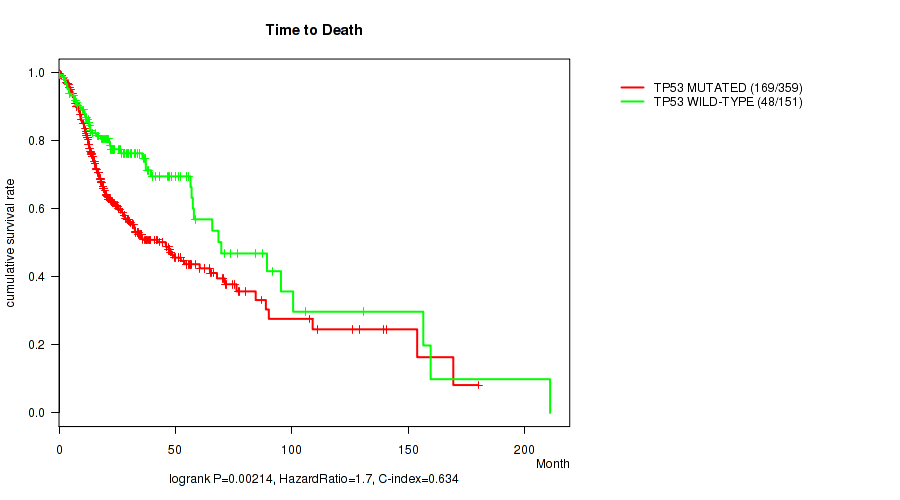
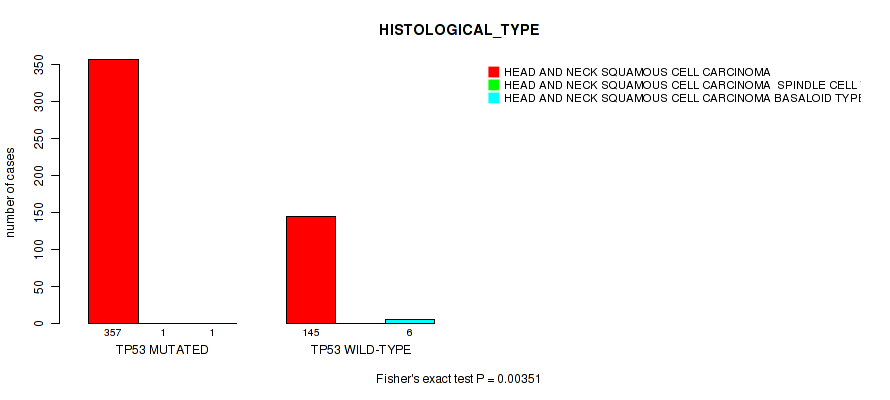
TP53 mutation correlated to 'Time to Death' and 'HISTOLOGICAL_TYPE'.
-
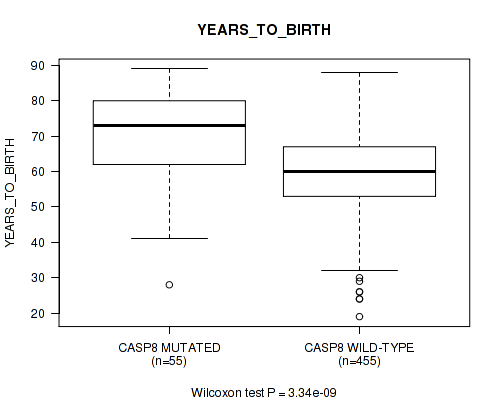
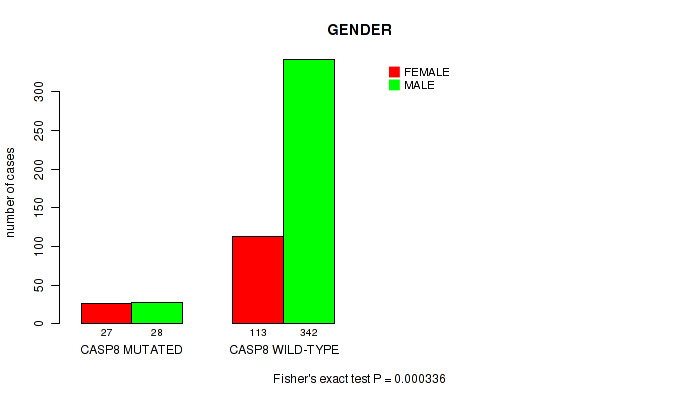
CASP8 mutation correlated to 'YEARS_TO_BIRTH' and 'GENDER'.
-
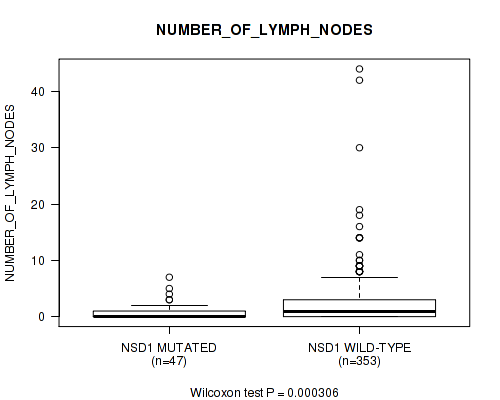
NSD1 mutation correlated to 'NUMBER_OF_LYMPH_NODES'.
-
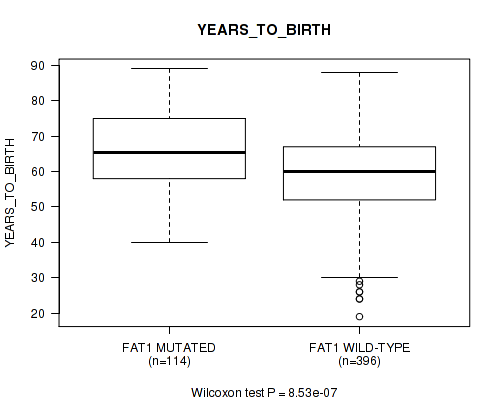
FAT1 mutation correlated to 'YEARS_TO_BIRTH'.
-
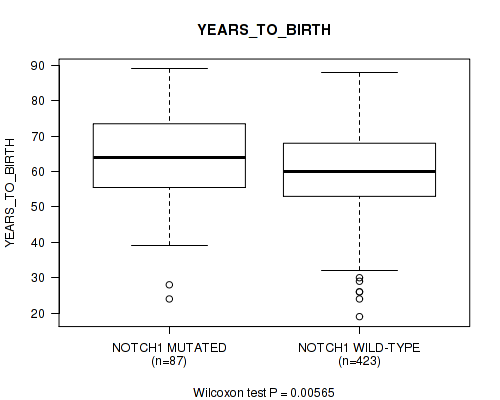
NOTCH1 mutation correlated to 'YEARS_TO_BIRTH'.
-
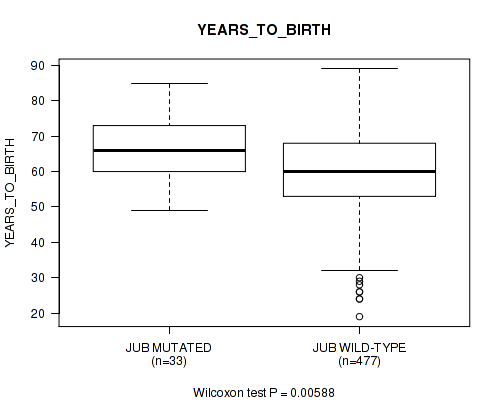
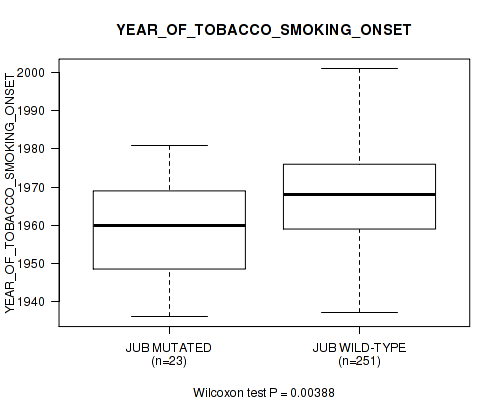
JUB mutation correlated to 'YEARS_TO_BIRTH' and 'YEAR_OF_TOBACCO_SMOKING_ONSET'.
-
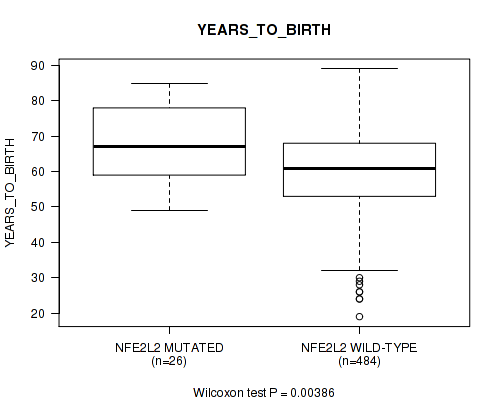
NFE2L2 mutation correlated to 'YEARS_TO_BIRTH'.
-
FBXW7 mutation correlated to 'YEARS_TO_BIRTH'.
-
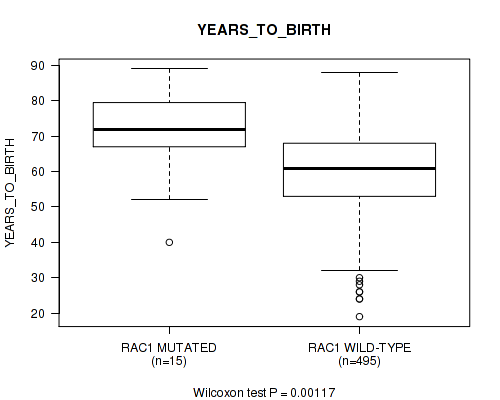
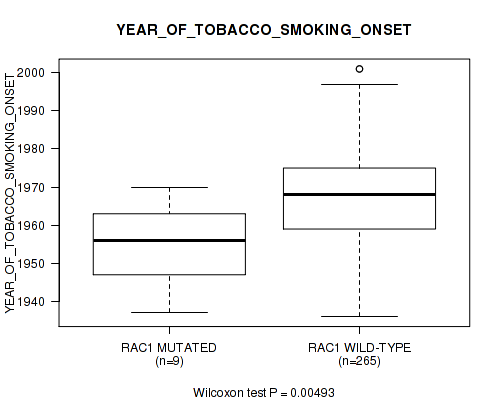
RAC1 mutation correlated to 'YEARS_TO_BIRTH' and 'YEAR_OF_TOBACCO_SMOKING_ONSET'.
-
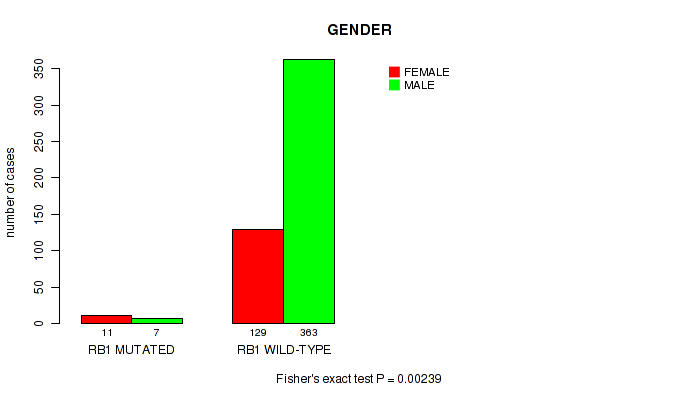
RB1 mutation correlated to 'GENDER'.
-
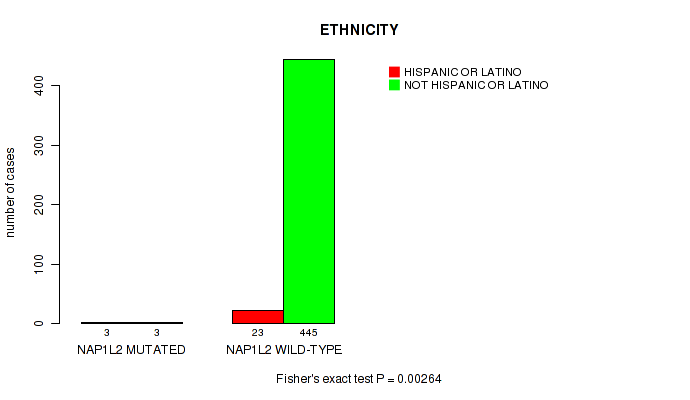
NAP1L2 mutation correlated to 'ETHNICITY'.
-
MLL4 mutation correlated to 'YEARS_TO_BIRTH'.
-
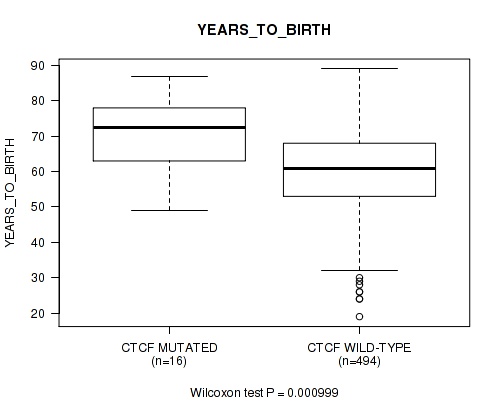
CTCF mutation correlated to 'YEARS_TO_BIRTH'.
Table 1. Get Full Table Overview of the association between mutation status of 49 genes and 13 clinical features. Shown in the table are P values (Q values). Thresholded by Q value < 0.25, 17 significant findings detected.
|
Clinical Features |
Time to Death |
YEARS TO BIRTH |
PATHOLOGIC STAGE |
PATHOLOGY T STAGE |
PATHOLOGY N STAGE |
GENDER |
RADIATION THERAPY |
HISTOLOGICAL TYPE |
NUMBER PACK YEARS SMOKED |
YEAR OF TOBACCO SMOKING ONSET |
NUMBER OF LYMPH NODES |
RACE | ETHNICITY | ||
| nMutated (%) | nWild-Type | logrank test | Wilcoxon-test | Fisher's exact test | Fisher's exact test | Fisher's exact test | Fisher's exact test | Fisher's exact test | Fisher's exact test | Wilcoxon-test | Wilcoxon-test | Wilcoxon-test | Fisher's exact test | Fisher's exact test | |
| TP53 | 359 (70%) | 151 |
0.00214 (0.187) |
0.314 (1.00) |
0.428 (1.00) |
0.0256 (0.562) |
0.65 (1.00) |
0.828 (1.00) |
0.503 (1.00) |
0.00351 (0.19) |
0.0355 (0.62) |
0.957 (1.00) |
0.653 (1.00) |
0.551 (1.00) |
0.123 (0.866) |
| CASP8 | 55 (11%) | 455 |
0.0517 (0.701) |
3.34e-09 (2.13e-06) |
0.808 (1.00) |
0.381 (1.00) |
0.0715 (0.759) |
0.000336 (0.0535) |
0.257 (1.00) |
1 (1.00) |
0.0857 (0.773) |
0.0146 (0.386) |
0.0186 (0.455) |
0.722 (1.00) |
0.517 (1.00) |
| JUB | 33 (6%) | 477 |
0.0551 (0.716) |
0.00588 (0.234) |
0.642 (1.00) |
0.646 (1.00) |
0.248 (1.00) |
1 (1.00) |
0.543 (1.00) |
1 (1.00) |
0.264 (1.00) |
0.00388 (0.19) |
0.491 (1.00) |
0.193 (0.932) |
0.676 (1.00) |
| RAC1 | 15 (3%) | 495 |
0.458 (1.00) |
0.00117 (0.124) |
0.196 (0.932) |
0.185 (0.932) |
0.38 (1.00) |
0.00737 (0.261) |
1 (1.00) |
1 (1.00) |
0.67 (1.00) |
0.00493 (0.224) |
0.189 (0.932) |
0.31 (1.00) |
1 (1.00) |
| NSD1 | 63 (12%) | 447 |
0.0593 (0.726) |
0.0389 (0.62) |
0.102 (0.809) |
0.518 (1.00) |
0.0368 (0.62) |
0.0697 (0.758) |
0.879 (1.00) |
1 (1.00) |
0.158 (0.883) |
0.549 (1.00) |
0.000306 (0.0535) |
0.681 (1.00) |
0.349 (1.00) |
| FAT1 | 114 (22%) | 396 |
0.634 (1.00) |
8.53e-07 (0.000272) |
0.755 (1.00) |
0.0378 (0.62) |
0.325 (1.00) |
0.0125 (0.362) |
1 (1.00) |
1 (1.00) |
0.15 (0.883) |
0.0168 (0.427) |
0.358 (1.00) |
0.604 (1.00) |
0.472 (1.00) |
| NOTCH1 | 87 (17%) | 423 |
0.221 (0.957) |
0.00565 (0.234) |
0.883 (1.00) |
0.458 (1.00) |
0.461 (1.00) |
0.0656 (0.758) |
0.036 (0.62) |
0.677 (1.00) |
0.0802 (0.773) |
0.252 (1.00) |
0.204 (0.938) |
0.862 (1.00) |
0.195 (0.932) |
| NFE2L2 | 26 (5%) | 484 |
0.387 (1.00) |
0.00386 (0.19) |
0.647 (1.00) |
0.851 (1.00) |
0.592 (1.00) |
0.112 (0.846) |
0.0757 (0.773) |
1 (1.00) |
0.648 (1.00) |
0.463 (1.00) |
0.342 (1.00) |
0.321 (1.00) |
0.343 (1.00) |
| FBXW7 | 33 (6%) | 477 |
0.294 (1.00) |
0.00655 (0.246) |
0.774 (1.00) |
0.399 (1.00) |
0.346 (1.00) |
0.156 (0.883) |
0.427 (1.00) |
1 (1.00) |
0.367 (1.00) |
0.894 (1.00) |
0.187 (0.932) |
0.882 (1.00) |
0.668 (1.00) |
| RB1 | 18 (4%) | 492 |
0.0605 (0.728) |
0.567 (1.00) |
0.142 (0.883) |
0.239 (0.99) |
0.579 (1.00) |
0.00239 (0.187) |
1 (1.00) |
1 (1.00) |
0.718 (1.00) |
0.303 (1.00) |
0.215 (0.943) |
0.314 (1.00) |
1 (1.00) |
| NAP1L2 | 7 (1%) | 503 |
0.337 (1.00) |
0.905 (1.00) |
0.239 (0.99) |
0.671 (1.00) |
0.146 (0.883) |
1 (1.00) |
1 (1.00) |
0.106 (0.826) |
0.543 (1.00) |
0.844 (1.00) |
0.46 (1.00) |
0.47 (1.00) |
0.00264 (0.187) |
| MLL4 | 20 (4%) | 490 |
0.438 (1.00) |
0.00378 (0.19) |
0.202 (0.937) |
0.985 (1.00) |
0.0667 (0.758) |
0.0789 (0.773) |
0.795 (1.00) |
1 (1.00) |
0.688 (1.00) |
0.0562 (0.716) |
0.0968 (0.784) |
0.531 (1.00) |
1 (1.00) |
| CTCF | 16 (3%) | 494 |
0.0696 (0.758) |
0.000999 (0.124) |
0.119 (0.866) |
1 (1.00) |
0.431 (1.00) |
0.0488 (0.676) |
1 (1.00) |
1 (1.00) |
0.657 (1.00) |
0.0418 (0.62) |
0.319 (1.00) |
0.425 (1.00) |
1 (1.00) |
| CDKN2A | 112 (22%) | 398 |
0.818 (1.00) |
0.134 (0.883) |
0.152 (0.883) |
0.835 (1.00) |
0.505 (1.00) |
1 (1.00) |
0.537 (1.00) |
0.498 (1.00) |
0.372 (1.00) |
0.566 (1.00) |
0.449 (1.00) |
0.755 (1.00) |
0.631 (1.00) |
| HLA-B | 24 (5%) | 486 |
0.899 (1.00) |
0.195 (0.932) |
0.753 (1.00) |
0.342 (1.00) |
0.038 (0.62) |
0.157 (0.883) |
0.166 (0.889) |
0.321 (1.00) |
0.205 (0.938) |
0.144 (0.883) |
0.303 (1.00) |
0.514 (1.00) |
0.614 (1.00) |
| MLL2 | 78 (15%) | 432 |
0.0661 (0.758) |
0.356 (1.00) |
0.399 (1.00) |
0.2 (0.937) |
0.935 (1.00) |
0.891 (1.00) |
0.887 (1.00) |
0.663 (1.00) |
0.354 (1.00) |
0.933 (1.00) |
0.828 (1.00) |
0.158 (0.883) |
0.402 (1.00) |
| TGFBR2 | 23 (5%) | 487 |
0.732 (1.00) |
0.0582 (0.726) |
0.91 (1.00) |
0.727 (1.00) |
0.55 (1.00) |
1 (1.00) |
0.342 (1.00) |
1 (1.00) |
0.386 (1.00) |
0.0911 (0.773) |
0.408 (1.00) |
0.59 (1.00) |
1 (1.00) |
| ZNF750 | 19 (4%) | 491 |
0.927 (1.00) |
0.371 (1.00) |
0.281 (1.00) |
0.711 (1.00) |
0.538 (1.00) |
0.304 (1.00) |
1 (1.00) |
1 (1.00) |
0.524 (1.00) |
0.51 (1.00) |
0.0702 (0.758) |
0.407 (1.00) |
0.615 (1.00) |
| EPHA2 | 24 (5%) | 486 |
0.247 (1.00) |
0.0851 (0.773) |
0.885 (1.00) |
0.648 (1.00) |
0.491 (1.00) |
0.49 (1.00) |
0.342 (1.00) |
1 (1.00) |
0.0443 (0.627) |
0.164 (0.883) |
0.955 (1.00) |
0.501 (1.00) |
1 (1.00) |
| HLA-A | 22 (4%) | 488 |
0.733 (1.00) |
0.0894 (0.773) |
0.869 (1.00) |
0.0864 (0.773) |
0.338 (1.00) |
1 (1.00) |
0.13 (0.872) |
1 (1.00) |
0.232 (0.988) |
0.0135 (0.373) |
0.739 (1.00) |
0.814 (1.00) |
0.614 (1.00) |
| HRAS | 29 (6%) | 481 |
0.409 (1.00) |
0.291 (1.00) |
0.447 (1.00) |
0.879 (1.00) |
0.128 (0.872) |
0.0897 (0.773) |
0.272 (1.00) |
1 (1.00) |
0.875 (1.00) |
0.589 (1.00) |
0.128 (0.872) |
0.578 (1.00) |
0.392 (1.00) |
| PIK3CA | 94 (18%) | 416 |
0.666 (1.00) |
0.689 (1.00) |
0.459 (1.00) |
0.278 (1.00) |
0.181 (0.932) |
0.0408 (0.62) |
1 (1.00) |
0.476 (1.00) |
0.971 (1.00) |
0.599 (1.00) |
0.349 (1.00) |
0.0289 (0.613) |
1 (1.00) |
| EP300 | 39 (8%) | 471 |
0.289 (1.00) |
0.73 (1.00) |
0.94 (1.00) |
0.699 (1.00) |
0.515 (1.00) |
0.455 (1.00) |
1 (1.00) |
1 (1.00) |
0.201 (0.937) |
0.741 (1.00) |
0.822 (1.00) |
0.74 (1.00) |
0.445 (1.00) |
| PTEN | 14 (3%) | 496 |
0.284 (1.00) |
0.318 (1.00) |
0.908 (1.00) |
0.292 (1.00) |
0.463 (1.00) |
1 (1.00) |
1 (1.00) |
1 (1.00) |
0.455 (1.00) |
0.162 (0.883) |
0.518 (1.00) |
0.738 (1.00) |
1 (1.00) |
| RASA1 | 17 (3%) | 493 |
0.816 (1.00) |
0.782 (1.00) |
0.756 (1.00) |
0.462 (1.00) |
0.959 (1.00) |
0.58 (1.00) |
0.783 (1.00) |
1 (1.00) |
0.451 (1.00) |
0.973 (1.00) |
0.756 (1.00) |
1 (1.00) |
0.238 (0.99) |
| MAPK1 | 9 (2%) | 501 |
0.213 (0.943) |
0.952 (1.00) |
0.864 (1.00) |
0.38 (1.00) |
0.61 (1.00) |
0.711 (1.00) |
1 (1.00) |
1 (1.00) |
0.439 (1.00) |
0.887 (1.00) |
0.233 (0.988) |
1 (1.00) |
|
| KEAP1 | 22 (4%) | 488 |
0.931 (1.00) |
0.0972 (0.784) |
0.109 (0.84) |
0.00791 (0.265) |
0.382 (1.00) |
0.15 (0.883) |
0.0252 (0.562) |
0.0416 (0.62) |
0.114 (0.846) |
0.346 (1.00) |
0.823 (1.00) |
0.484 (1.00) |
0.614 (1.00) |
| KDM6A | 17 (3%) | 493 |
0.344 (1.00) |
0.054 (0.716) |
0.373 (1.00) |
0.264 (1.00) |
0.806 (1.00) |
1 (1.00) |
0.388 (1.00) |
1 (1.00) |
0.169 (0.899) |
0.194 (0.932) |
0.91 (1.00) |
0.286 (1.00) |
0.615 (1.00) |
| RHOA | 10 (2%) | 500 |
0.484 (1.00) |
0.395 (1.00) |
1 (1.00) |
0.416 (1.00) |
0.0331 (0.62) |
0.473 (1.00) |
0.725 (1.00) |
0.145 (0.883) |
0.651 (1.00) |
0.613 (1.00) |
0.315 (1.00) |
1 (1.00) |
1 (1.00) |
| CREBBP | 35 (7%) | 475 |
0.557 (1.00) |
0.0332 (0.62) |
0.744 (1.00) |
0.72 (1.00) |
0.886 (1.00) |
0.561 (1.00) |
0.678 (1.00) |
0.437 (1.00) |
0.805 (1.00) |
0.0438 (0.627) |
0.638 (1.00) |
0.163 (0.883) |
1 (1.00) |
| NUDT11 | 8 (2%) | 502 |
0.432 (1.00) |
0.566 (1.00) |
0.644 (1.00) |
0.881 (1.00) |
0.528 (1.00) |
0.114 (0.846) |
0.303 (1.00) |
1 (1.00) |
0.53 (1.00) |
0.559 (1.00) |
0.341 (1.00) |
1 (1.00) |
0.365 (1.00) |
| EMG1 | 4 (1%) | 506 |
0.286 (1.00) |
0.492 (1.00) |
1 (1.00) |
0.595 (1.00) |
0.334 (1.00) |
0.303 (1.00) |
0.613 (1.00) |
1 (1.00) |
0.66 (1.00) |
1 (1.00) |
1 (1.00) |
||
| SMAD4 | 13 (3%) | 497 |
0.549 (1.00) |
0.302 (1.00) |
0.737 (1.00) |
1 (1.00) |
0.588 (1.00) |
1 (1.00) |
0.525 (1.00) |
1 (1.00) |
0.378 (1.00) |
0.146 (0.883) |
0.865 (1.00) |
1 (1.00) |
1 (1.00) |
| CUL3 | 14 (3%) | 496 |
0.543 (1.00) |
0.259 (1.00) |
0.215 (0.943) |
0.0404 (0.62) |
0.619 (1.00) |
0.369 (1.00) |
0.759 (1.00) |
1 (1.00) |
0.77 (1.00) |
0.162 (0.883) |
0.21 (0.943) |
0.181 (0.932) |
1 (1.00) |
| TIGD4 | 7 (1%) | 503 |
0.287 (1.00) |
0.176 (0.92) |
0.27 (1.00) |
0.778 (1.00) |
0.192 (0.932) |
0.68 (1.00) |
0.662 (1.00) |
1 (1.00) |
0.546 (1.00) |
0.439 (1.00) |
0.176 (0.92) |
0.529 (1.00) |
1 (1.00) |
| MYH9 | 22 (4%) | 488 |
0.766 (1.00) |
0.604 (1.00) |
0.91 (1.00) |
0.962 (1.00) |
0.762 (1.00) |
0.464 (1.00) |
0.797 (1.00) |
0.3 (1.00) |
0.482 (1.00) |
0.355 (1.00) |
0.613 (1.00) |
0.53 (1.00) |
0.28 (1.00) |
| C3ORF59 | 11 (2%) | 499 |
0.884 (1.00) |
0.502 (1.00) |
0.952 (1.00) |
0.758 (1.00) |
0.361 (1.00) |
1 (1.00) |
0.725 (1.00) |
1 (1.00) |
0.944 (1.00) |
0.699 (1.00) |
0.51 (1.00) |
0.698 (1.00) |
1 (1.00) |
| HUWE1 | 45 (9%) | 465 |
0.285 (1.00) |
0.344 (1.00) |
0.824 (1.00) |
0.525 (1.00) |
0.451 (1.00) |
0.0236 (0.558) |
1 (1.00) |
1 (1.00) |
0.269 (1.00) |
0.5 (1.00) |
0.569 (1.00) |
0.074 (0.773) |
0.28 (1.00) |
| SLC9A6 | 5 (1%) | 505 |
0.00975 (0.296) |
0.792 (1.00) |
0.324 (1.00) |
0.465 (1.00) |
0.106 (0.826) |
0.13 (0.872) |
0.662 (1.00) |
1 (1.00) |
0.825 (1.00) |
0.138 (0.883) |
1 (1.00) |
1 (1.00) |
|
| ZNF623 | 11 (2%) | 499 |
0.272 (1.00) |
0.979 (1.00) |
0.952 (1.00) |
0.758 (1.00) |
0.652 (1.00) |
0.504 (1.00) |
0.505 (1.00) |
1 (1.00) |
0.937 (1.00) |
0.927 (1.00) |
0.219 (0.957) |
0.407 (1.00) |
1 (1.00) |
| NCOR1 | 18 (4%) | 492 |
0.747 (1.00) |
0.274 (1.00) |
0.716 (1.00) |
0.523 (1.00) |
0.738 (1.00) |
0.594 (1.00) |
0.572 (1.00) |
1 (1.00) |
0.852 (1.00) |
0.408 (1.00) |
0.363 (1.00) |
0.78 (1.00) |
0.259 (1.00) |
| PTPN14 | 15 (3%) | 495 |
0.0903 (0.773) |
0.807 (1.00) |
0.49 (1.00) |
0.785 (1.00) |
0.333 (1.00) |
1 (1.00) |
0.556 (1.00) |
1 (1.00) |
0.365 (1.00) |
0.539 (1.00) |
0.432 (1.00) |
0.0867 (0.773) |
0.577 (1.00) |
| ITGB1 | 13 (3%) | 497 |
0.407 (1.00) |
0.124 (0.866) |
0.208 (0.943) |
0.222 (0.957) |
0.559 (1.00) |
0.759 (1.00) |
0.505 (1.00) |
1 (1.00) |
0.745 (1.00) |
0.95 (1.00) |
0.532 (1.00) |
1 (1.00) |
0.524 (1.00) |
| IRS4 | 17 (3%) | 493 |
0.794 (1.00) |
0.929 (1.00) |
0.692 (1.00) |
0.759 (1.00) |
0.419 (1.00) |
0.266 (1.00) |
0.555 (1.00) |
1 (1.00) |
0.753 (1.00) |
0.983 (1.00) |
0.154 (0.883) |
0.546 (1.00) |
0.196 (0.932) |
| SRPX | 7 (1%) | 503 |
0.406 (1.00) |
0.329 (1.00) |
0.432 (1.00) |
0.862 (1.00) |
0.152 (0.883) |
0.0939 (0.784) |
1 (1.00) |
1 (1.00) |
0.635 (1.00) |
0.774 (1.00) |
0.0785 (0.773) |
1 (1.00) |
1 (1.00) |
| KIAA1949 | 6 (1%) | 504 |
0.238 (0.99) |
0.566 (1.00) |
0.0382 (0.62) |
0.248 (1.00) |
0.334 (1.00) |
1 (1.00) |
1 (1.00) |
1 (1.00) |
0.643 (1.00) |
0.247 (1.00) |
1 (1.00) |
1 (1.00) |
|
| NOTCH2 | 20 (4%) | 490 |
0.692 (1.00) |
0.153 (0.883) |
0.31 (1.00) |
0.811 (1.00) |
0.773 (1.00) |
0.00878 (0.28) |
0.783 (1.00) |
1 (1.00) |
0.211 (0.943) |
0.141 (0.883) |
0.542 (1.00) |
1 (1.00) |
0.617 (1.00) |
| GAGE2A | 5 (1%) | 505 |
0.6 (1.00) |
0.815 (1.00) |
0.151 (0.883) |
0.63 (1.00) |
0.0814 (0.773) |
0.329 (1.00) |
0.123 (0.866) |
1 (1.00) |
0.613 (1.00) |
0.0953 (0.784) |
1 (1.00) |
||
| LCP1 | 15 (3%) | 495 |
0.926 (1.00) |
0.66 (1.00) |
0.26 (1.00) |
0.0825 (0.773) |
1 (1.00) |
1 (1.00) |
0.121 (0.866) |
1 (1.00) |
0.726 (1.00) |
0.374 (1.00) |
0.628 (1.00) |
0.725 (1.00) |
0.577 (1.00) |
P value = 0.00214 (logrank test), Q value = 0.19
Table S1. Gene #1: 'TP53 MUTATION STATUS' versus Clinical Feature #1: 'Time to Death'
| nPatients | nDeath | Duration Range (Median), Month | |
|---|---|---|---|
| ALL | 510 | 217 | 0.1 - 211.0 (21.1) |
| TP53 MUTATED | 359 | 169 | 0.1 - 180.2 (20.6) |
| TP53 WILD-TYPE | 151 | 48 | 0.1 - 211.0 (22.3) |
Figure S1. Get High-res Image Gene #1: 'TP53 MUTATION STATUS' versus Clinical Feature #1: 'Time to Death'
P value = 0.00351 (Fisher's exact test), Q value = 0.19
Table S2. Gene #1: 'TP53 MUTATION STATUS' versus Clinical Feature #8: 'HISTOLOGICAL_TYPE'
| nPatients | HEAD AND NECK SQUAMOUS CELL CARCINOMA | HEAD AND NECK SQUAMOUS CELL CARCINOMA SPINDLE CELL VARIANT | HEAD AND NECK SQUAMOUS CELL CARCINOMA BASALOID TYPE |
|---|---|---|---|
| ALL | 502 | 1 | 7 |
| TP53 MUTATED | 357 | 1 | 1 |
| TP53 WILD-TYPE | 145 | 0 | 6 |
Figure S2. Get High-res Image Gene #1: 'TP53 MUTATION STATUS' versus Clinical Feature #8: 'HISTOLOGICAL_TYPE'
P value = 3.34e-09 (Wilcoxon-test), Q value = 2.1e-06
Table S3. Gene #3: 'CASP8 MUTATION STATUS' versus Clinical Feature #2: 'YEARS_TO_BIRTH'
| nPatients | Mean (Std.Dev) | |
|---|---|---|
| ALL | 510 | 61.0 (12.0) |
| CASP8 MUTATED | 55 | 70.2 (13.2) |
| CASP8 WILD-TYPE | 455 | 59.9 (11.4) |
Figure S3. Get High-res Image Gene #3: 'CASP8 MUTATION STATUS' versus Clinical Feature #2: 'YEARS_TO_BIRTH'
P value = 0.000336 (Fisher's exact test), Q value = 0.054
Table S4. Gene #3: 'CASP8 MUTATION STATUS' versus Clinical Feature #6: 'GENDER'
| nPatients | FEMALE | MALE |
|---|---|---|
| ALL | 140 | 370 |
| CASP8 MUTATED | 27 | 28 |
| CASP8 WILD-TYPE | 113 | 342 |
Figure S4. Get High-res Image Gene #3: 'CASP8 MUTATION STATUS' versus Clinical Feature #6: 'GENDER'
P value = 0.000306 (Wilcoxon-test), Q value = 0.054
Table S5. Gene #4: 'NSD1 MUTATION STATUS' versus Clinical Feature #11: 'NUMBER_OF_LYMPH_NODES'
| nPatients | Mean (Std.Dev) | |
|---|---|---|
| ALL | 400 | 2.2 (4.3) |
| NSD1 MUTATED | 47 | 0.8 (1.5) |
| NSD1 WILD-TYPE | 353 | 2.4 (4.5) |
Figure S5. Get High-res Image Gene #4: 'NSD1 MUTATION STATUS' versus Clinical Feature #11: 'NUMBER_OF_LYMPH_NODES'
P value = 8.53e-07 (Wilcoxon-test), Q value = 0.00027
Table S6. Gene #8: 'FAT1 MUTATION STATUS' versus Clinical Feature #2: 'YEARS_TO_BIRTH'
| nPatients | Mean (Std.Dev) | |
|---|---|---|
| ALL | 510 | 61.0 (12.0) |
| FAT1 MUTATED | 114 | 66.1 (11.4) |
| FAT1 WILD-TYPE | 396 | 59.5 (11.8) |
Figure S6. Get High-res Image Gene #8: 'FAT1 MUTATION STATUS' versus Clinical Feature #2: 'YEARS_TO_BIRTH'
P value = 0.00565 (Wilcoxon-test), Q value = 0.23
Table S7. Gene #9: 'NOTCH1 MUTATION STATUS' versus Clinical Feature #2: 'YEARS_TO_BIRTH'
| nPatients | Mean (Std.Dev) | |
|---|---|---|
| ALL | 510 | 61.0 (12.0) |
| NOTCH1 MUTATED | 87 | 64.3 (13.3) |
| NOTCH1 WILD-TYPE | 423 | 60.3 (11.6) |
Figure S7. Get High-res Image Gene #9: 'NOTCH1 MUTATION STATUS' versus Clinical Feature #2: 'YEARS_TO_BIRTH'
P value = 0.00588 (Wilcoxon-test), Q value = 0.23
Table S8. Gene #10: 'JUB MUTATION STATUS' versus Clinical Feature #2: 'YEARS_TO_BIRTH'
| nPatients | Mean (Std.Dev) | |
|---|---|---|
| ALL | 510 | 61.0 (12.0) |
| JUB MUTATED | 33 | 66.8 (10.5) |
| JUB WILD-TYPE | 477 | 60.6 (12.0) |
Figure S8. Get High-res Image Gene #10: 'JUB MUTATION STATUS' versus Clinical Feature #2: 'YEARS_TO_BIRTH'
P value = 0.00388 (Wilcoxon-test), Q value = 0.19
Table S9. Gene #10: 'JUB MUTATION STATUS' versus Clinical Feature #10: 'YEAR_OF_TOBACCO_SMOKING_ONSET'
| nPatients | Mean (Std.Dev) | |
|---|---|---|
| ALL | 274 | 1967.0 (12.6) |
| JUB MUTATED | 23 | 1958.7 (12.5) |
| JUB WILD-TYPE | 251 | 1967.8 (12.4) |
Figure S9. Get High-res Image Gene #10: 'JUB MUTATION STATUS' versus Clinical Feature #10: 'YEAR_OF_TOBACCO_SMOKING_ONSET'
P value = 0.00386 (Wilcoxon-test), Q value = 0.19
Table S10. Gene #11: 'NFE2L2 MUTATION STATUS' versus Clinical Feature #2: 'YEARS_TO_BIRTH'
| nPatients | Mean (Std.Dev) | |
|---|---|---|
| ALL | 510 | 61.0 (12.0) |
| NFE2L2 MUTATED | 26 | 68.1 (11.2) |
| NFE2L2 WILD-TYPE | 484 | 60.6 (11.9) |
Figure S10. Get High-res Image Gene #11: 'NFE2L2 MUTATION STATUS' versus Clinical Feature #2: 'YEARS_TO_BIRTH'
P value = 0.00655 (Wilcoxon-test), Q value = 0.25
Table S11. Gene #12: 'FBXW7 MUTATION STATUS' versus Clinical Feature #2: 'YEARS_TO_BIRTH'
| nPatients | Mean (Std.Dev) | |
|---|---|---|
| ALL | 510 | 61.0 (12.0) |
| FBXW7 MUTATED | 33 | 67.5 (13.8) |
| FBXW7 WILD-TYPE | 477 | 60.6 (11.7) |
Figure S11. Get High-res Image Gene #12: 'FBXW7 MUTATION STATUS' versus Clinical Feature #2: 'YEARS_TO_BIRTH'

P value = 0.00117 (Wilcoxon-test), Q value = 0.12
Table S12. Gene #14: 'RAC1 MUTATION STATUS' versus Clinical Feature #2: 'YEARS_TO_BIRTH'
| nPatients | Mean (Std.Dev) | |
|---|---|---|
| ALL | 510 | 61.0 (12.0) |
| RAC1 MUTATED | 15 | 70.8 (12.6) |
| RAC1 WILD-TYPE | 495 | 60.7 (11.9) |
Figure S12. Get High-res Image Gene #14: 'RAC1 MUTATION STATUS' versus Clinical Feature #2: 'YEARS_TO_BIRTH'
P value = 0.00493 (Wilcoxon-test), Q value = 0.22
Table S13. Gene #14: 'RAC1 MUTATION STATUS' versus Clinical Feature #10: 'YEAR_OF_TOBACCO_SMOKING_ONSET'
| nPatients | Mean (Std.Dev) | |
|---|---|---|
| ALL | 274 | 1967.0 (12.6) |
| RAC1 MUTATED | 9 | 1954.9 (11.1) |
| RAC1 WILD-TYPE | 265 | 1967.4 (12.5) |
Figure S13. Get High-res Image Gene #14: 'RAC1 MUTATION STATUS' versus Clinical Feature #10: 'YEAR_OF_TOBACCO_SMOKING_ONSET'
P value = 0.00239 (Fisher's exact test), Q value = 0.19
Table S14. Gene #20: 'RB1 MUTATION STATUS' versus Clinical Feature #6: 'GENDER'
| nPatients | FEMALE | MALE |
|---|---|---|
| ALL | 140 | 370 |
| RB1 MUTATED | 11 | 7 |
| RB1 WILD-TYPE | 129 | 363 |
Figure S14. Get High-res Image Gene #20: 'RB1 MUTATION STATUS' versus Clinical Feature #6: 'GENDER'
P value = 0.00264 (Fisher's exact test), Q value = 0.19
Table S15. Gene #24: 'NAP1L2 MUTATION STATUS' versus Clinical Feature #13: 'ETHNICITY'
| nPatients | HISPANIC OR LATINO | NOT HISPANIC OR LATINO |
|---|---|---|
| ALL | 26 | 448 |
| NAP1L2 MUTATED | 3 | 3 |
| NAP1L2 WILD-TYPE | 23 | 445 |
Figure S15. Get High-res Image Gene #24: 'NAP1L2 MUTATION STATUS' versus Clinical Feature #13: 'ETHNICITY'
P value = 0.00378 (Wilcoxon-test), Q value = 0.19
Table S16. Gene #39: 'MLL4 MUTATION STATUS' versus Clinical Feature #2: 'YEARS_TO_BIRTH'
| nPatients | Mean (Std.Dev) | |
|---|---|---|
| ALL | 510 | 61.0 (12.0) |
| MLL4 MUTATED | 20 | 68.8 (12.6) |
| MLL4 WILD-TYPE | 490 | 60.7 (11.9) |
Figure S16. Get High-res Image Gene #39: 'MLL4 MUTATION STATUS' versus Clinical Feature #2: 'YEARS_TO_BIRTH'

P value = 0.000999 (Wilcoxon-test), Q value = 0.12
Table S17. Gene #40: 'CTCF MUTATION STATUS' versus Clinical Feature #2: 'YEARS_TO_BIRTH'
| nPatients | Mean (Std.Dev) | |
|---|---|---|
| ALL | 510 | 61.0 (12.0) |
| CTCF MUTATED | 16 | 71.2 (11.1) |
| CTCF WILD-TYPE | 494 | 60.7 (11.9) |
Figure S17. Get High-res Image Gene #40: 'CTCF MUTATION STATUS' versus Clinical Feature #2: 'YEARS_TO_BIRTH'
-
Mutation data file = sample_sig_gene_table.txt from Mutsig_2CV pipeline
-
Processed Mutation data file = /xchip/cga/gdac-prod/tcga-gdac/jobResults/GDAC_Correlate_Genomic_Events_Preprocess/HNSC-TP/20203267/transformed.cor.cli.txt
-
Clinical data file = /xchip/cga/gdac-prod/tcga-gdac/jobResults/Append_Data/HNSC-TP/19775211/HNSC-TP.merged_data.txt
-
Number of patients = 510
-
Number of significantly mutated genes = 49
-
Number of selected clinical features = 13
-
Exclude genes that fewer than K tumors have mutations, K = 3
For survival clinical features, the Kaplan-Meier survival curves of tumors with and without gene mutations were plotted and the statistical significance P values were estimated by logrank test (Bland and Altman 2004) using the 'survdiff' function in R
For binary or multi-class clinical features (nominal or ordinal), two-tailed Fisher's exact tests (Fisher 1922) were used to estimate the P values using the 'fisher.test' function in R
For multiple hypothesis correction, Q value is the False Discovery Rate (FDR) analogue of the P value (Benjamini and Hochberg 1995), defined as the minimum FDR at which the test may be called significant. We used the 'Benjamini and Hochberg' method of 'p.adjust' function in R to convert P values into Q values.
In addition to the links below, the full results of the analysis summarized in this report can also be downloaded programmatically using firehose_get, or interactively from either the Broad GDAC website or TCGA Data Coordination Center Portal.