This pipeline computes the correlation between significant copy number variation (cnv focal) genes and selected clinical features.
Testing the association between copy number variation 52 focal events and 8 clinical features across 512 patients, 145 significant findings detected with Q value < 0.25.
-
amp_1q22 cnv correlated to 'YEARS_TO_BIRTH'.
-
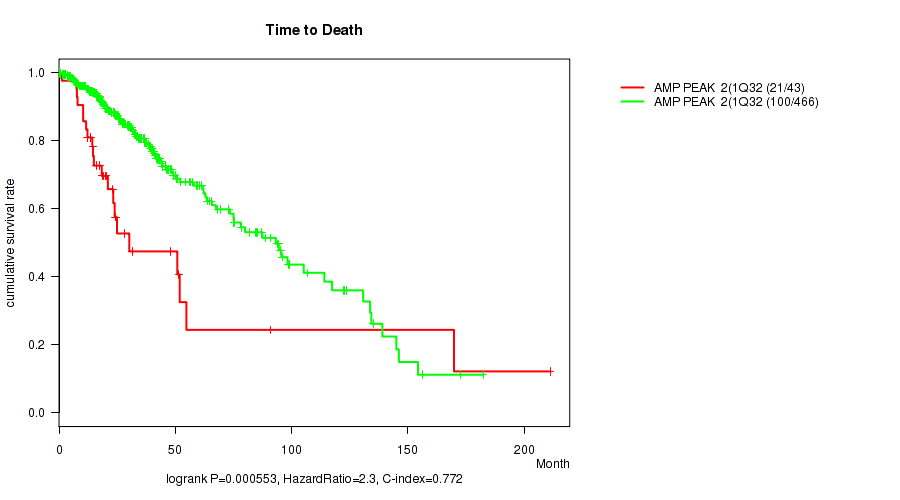
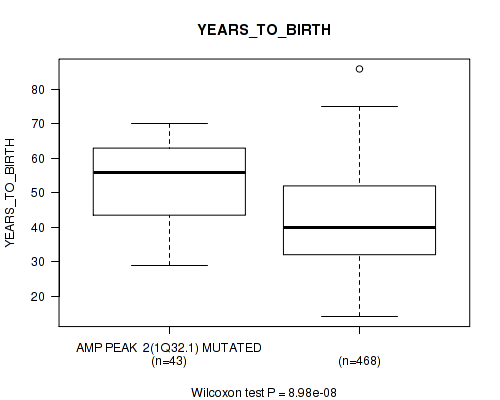
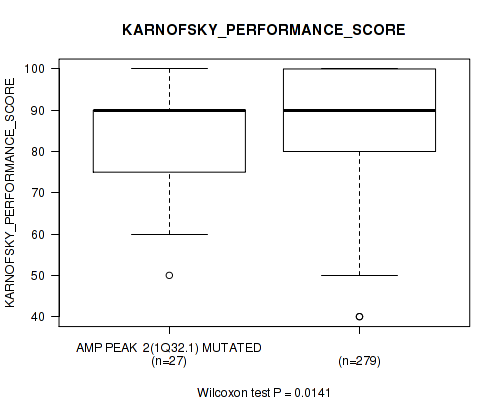
amp_1q32.1 cnv correlated to 'Time to Death', 'YEARS_TO_BIRTH', 'RADIATION_THERAPY', and 'KARNOFSKY_PERFORMANCE_SCORE'.
-
amp_2p24.3 cnv correlated to 'Time to Death'.
-
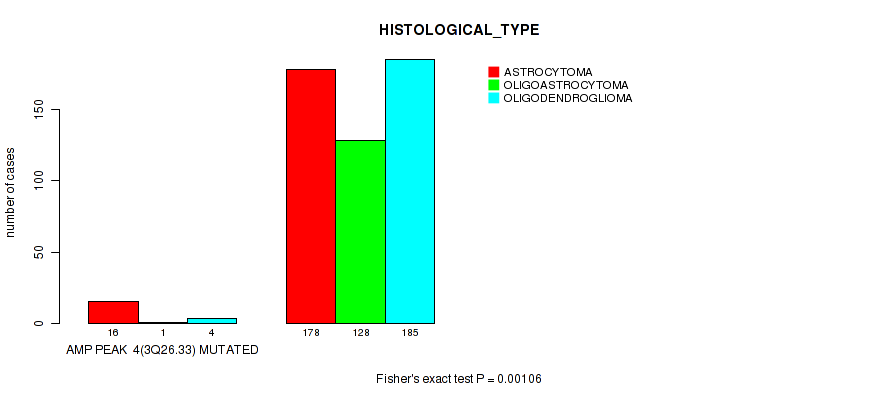
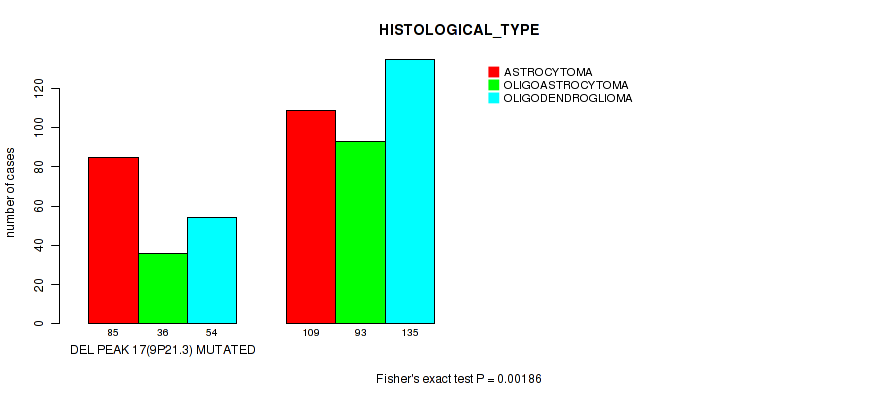
amp_3q26.33 cnv correlated to 'Time to Death', 'YEARS_TO_BIRTH', 'KARNOFSKY_PERFORMANCE_SCORE', and 'HISTOLOGICAL_TYPE'.
-
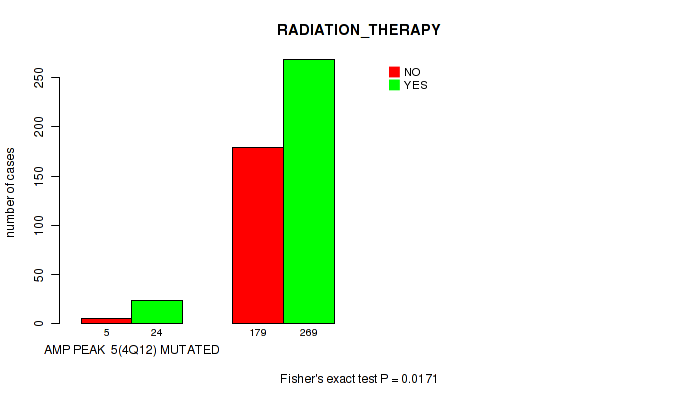
amp_4q12 cnv correlated to 'Time to Death', 'RADIATION_THERAPY', and 'HISTOLOGICAL_TYPE'.
-
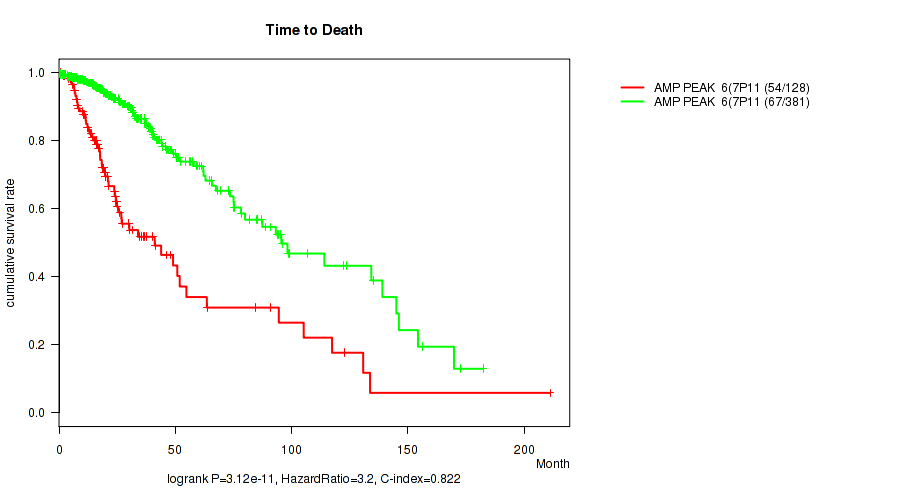
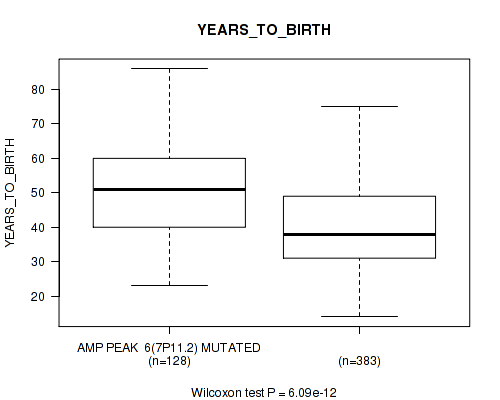
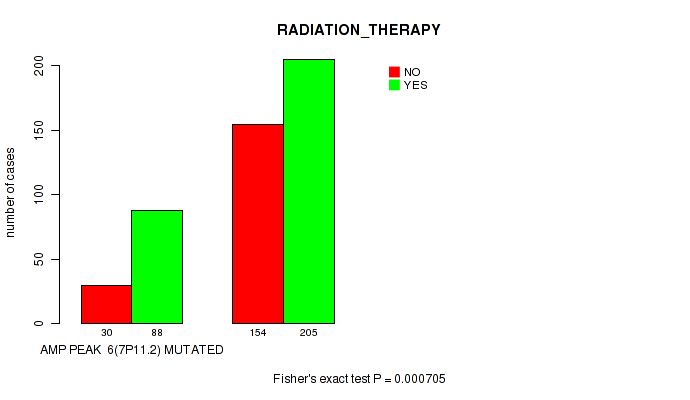
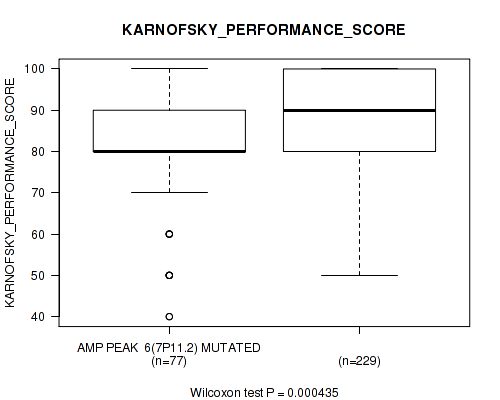
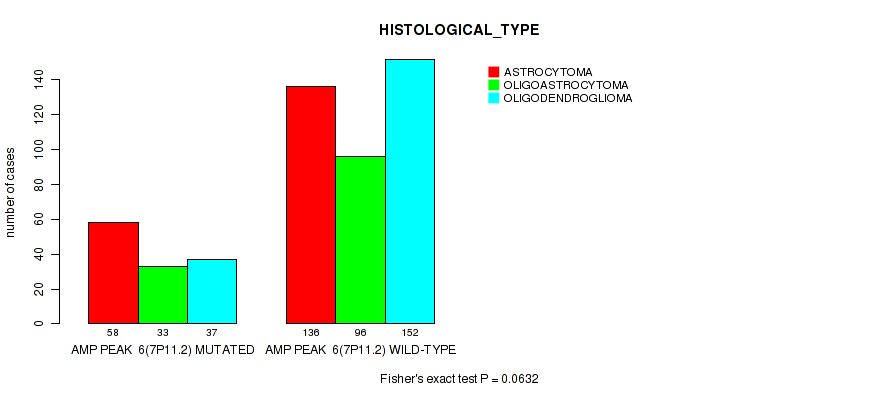
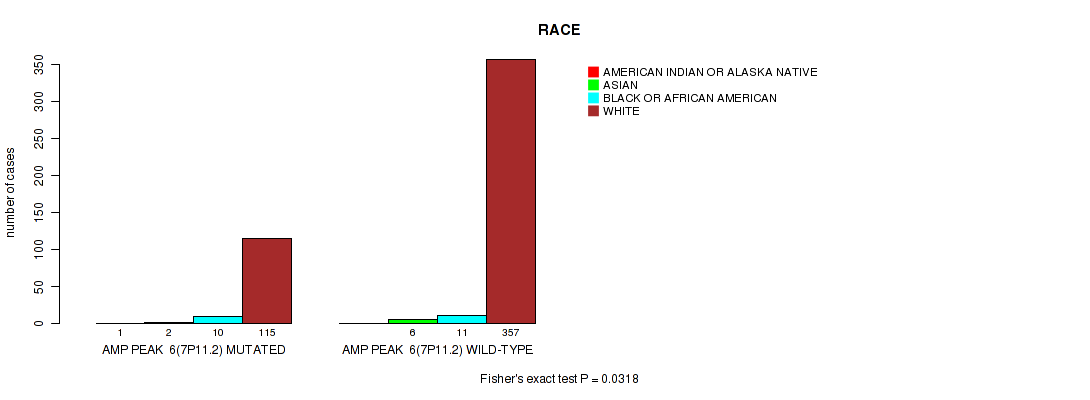
amp_7p11.2 cnv correlated to 'Time to Death', 'YEARS_TO_BIRTH', 'RADIATION_THERAPY', 'KARNOFSKY_PERFORMANCE_SCORE', 'HISTOLOGICAL_TYPE', and 'RACE'.
-
amp_7q31.2 cnv correlated to 'Time to Death', 'YEARS_TO_BIRTH', 'GENDER', 'RADIATION_THERAPY', 'KARNOFSKY_PERFORMANCE_SCORE', 'HISTOLOGICAL_TYPE', and 'RACE'.
-
amp_7q32.3 cnv correlated to 'Time to Death', 'YEARS_TO_BIRTH', 'GENDER', 'RADIATION_THERAPY', 'KARNOFSKY_PERFORMANCE_SCORE', 'HISTOLOGICAL_TYPE', and 'RACE'.
-
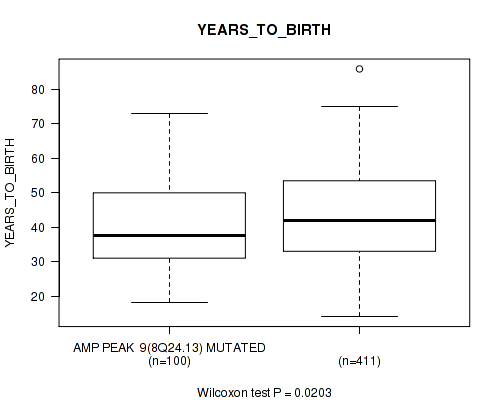
amp_8q24.13 cnv correlated to 'YEARS_TO_BIRTH', 'RADIATION_THERAPY', and 'HISTOLOGICAL_TYPE'.
-
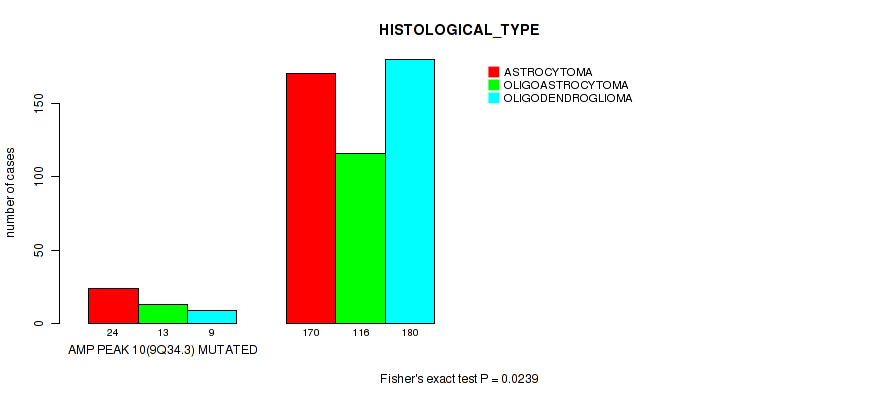
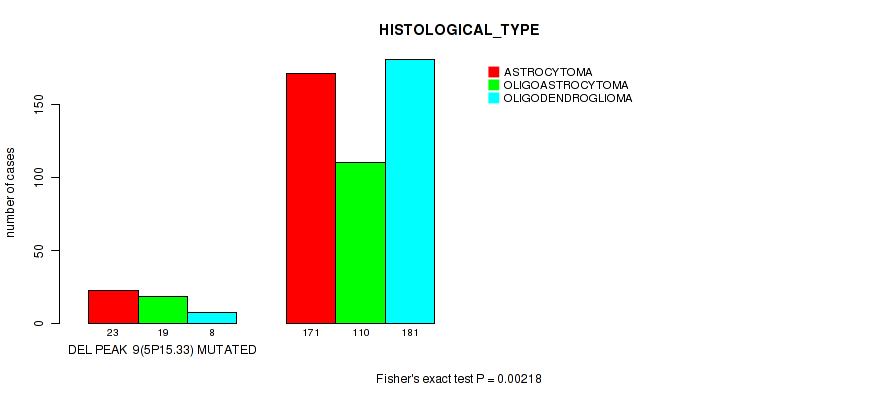
amp_9q34.3 cnv correlated to 'RADIATION_THERAPY' and 'HISTOLOGICAL_TYPE'.
-
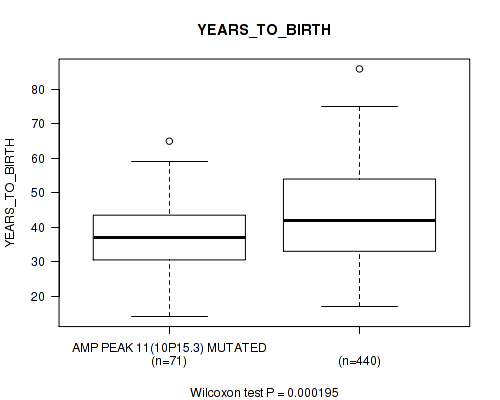
amp_10p15.3 cnv correlated to 'YEARS_TO_BIRTH', 'RADIATION_THERAPY', and 'HISTOLOGICAL_TYPE'.
-
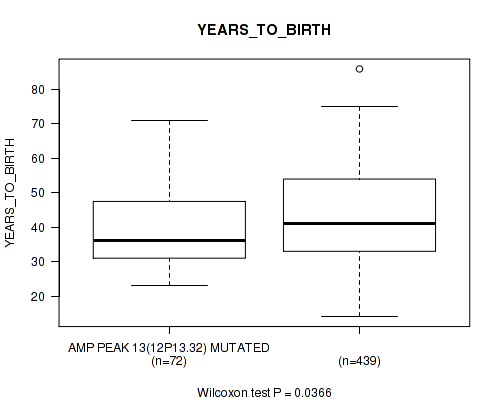
amp_12p13.32 cnv correlated to 'YEARS_TO_BIRTH' and 'RADIATION_THERAPY'.
-
amp_12q14.1 cnv correlated to 'Time to Death', 'YEARS_TO_BIRTH', 'RADIATION_THERAPY', and 'HISTOLOGICAL_TYPE'.
-
amp_13q34 cnv correlated to 'KARNOFSKY_PERFORMANCE_SCORE'.
-
amp_15q26.3 cnv correlated to 'Time to Death'.
-
amp_17q25.1 cnv correlated to 'Time to Death' and 'YEARS_TO_BIRTH'.
-
amp_19p13.3 cnv correlated to 'YEARS_TO_BIRTH', 'RADIATION_THERAPY', and 'HISTOLOGICAL_TYPE'.
-
amp_19p13.2 cnv correlated to 'YEARS_TO_BIRTH', 'RADIATION_THERAPY', and 'HISTOLOGICAL_TYPE'.
-
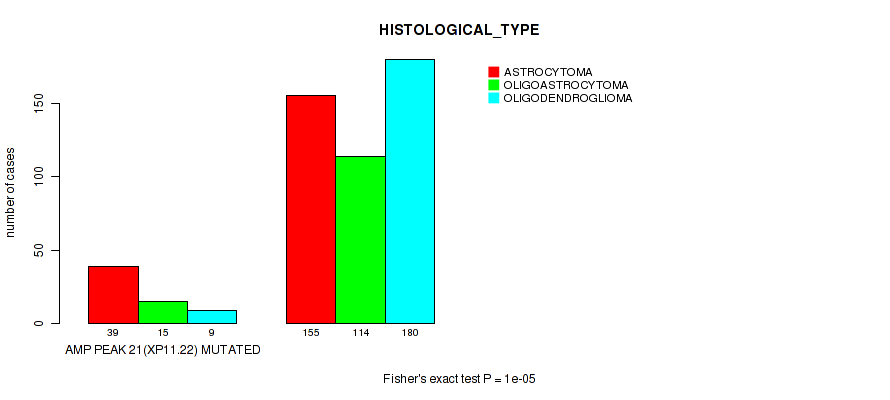
amp_xp11.22 cnv correlated to 'RADIATION_THERAPY' and 'HISTOLOGICAL_TYPE'.
-
amp_xp11.22 cnv correlated to 'RADIATION_THERAPY' and 'HISTOLOGICAL_TYPE'.
-
del_1p36.32 cnv correlated to 'Time to Death', 'YEARS_TO_BIRTH', 'RADIATION_THERAPY', and 'HISTOLOGICAL_TYPE'.
-
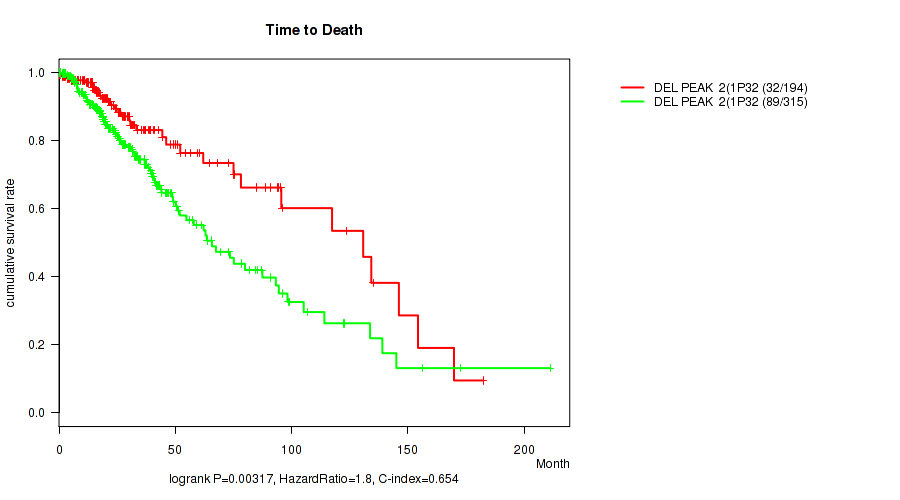
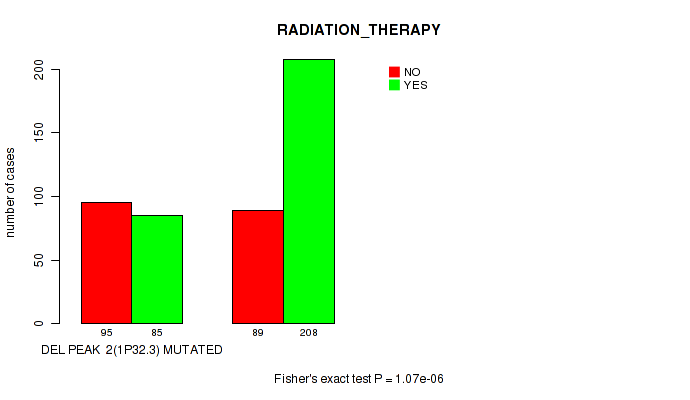
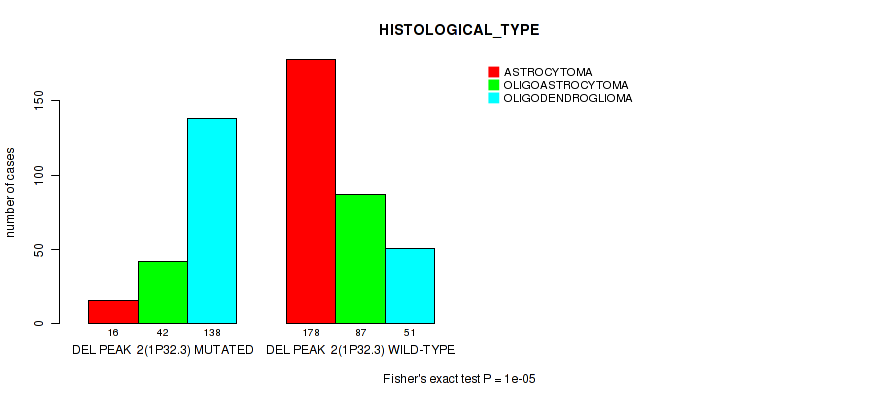
del_1p32.3 cnv correlated to 'Time to Death', 'YEARS_TO_BIRTH', 'RADIATION_THERAPY', and 'HISTOLOGICAL_TYPE'.
-
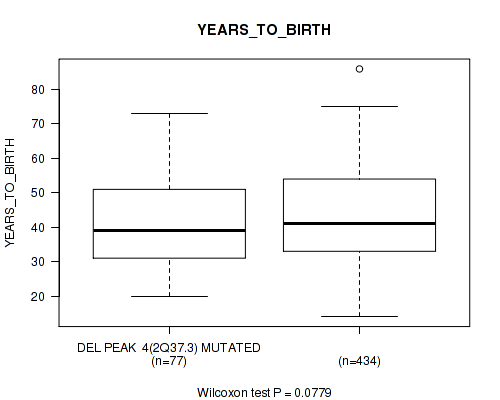
del_2q37.3 cnv correlated to 'YEARS_TO_BIRTH', 'RADIATION_THERAPY', and 'HISTOLOGICAL_TYPE'.
-
del_3p21.31 cnv correlated to 'RADIATION_THERAPY' and 'KARNOFSKY_PERFORMANCE_SCORE'.
-
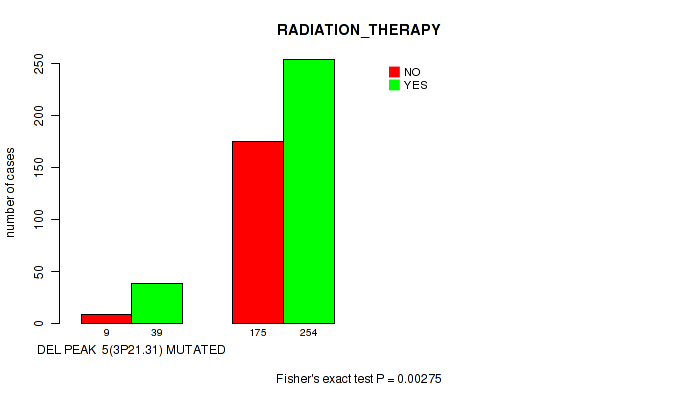
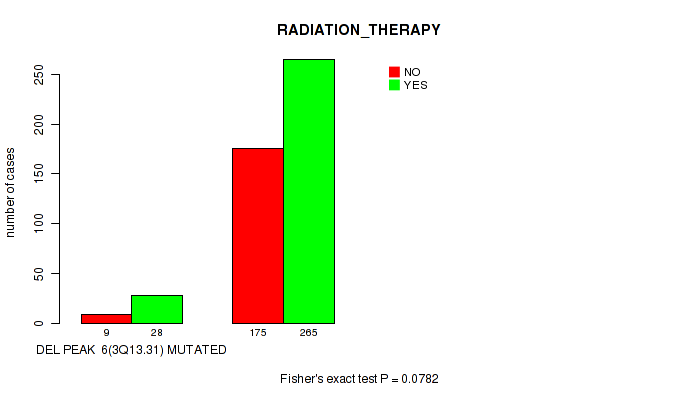
del_3q13.31 cnv correlated to 'Time to Death' and 'RADIATION_THERAPY'.
-
del_3q29 cnv correlated to 'Time to Death' and 'KARNOFSKY_PERFORMANCE_SCORE'.
-
del_5p15.33 cnv correlated to 'RADIATION_THERAPY' and 'HISTOLOGICAL_TYPE'.
-
del_5q34 cnv correlated to 'RADIATION_THERAPY' and 'HISTOLOGICAL_TYPE'.
-
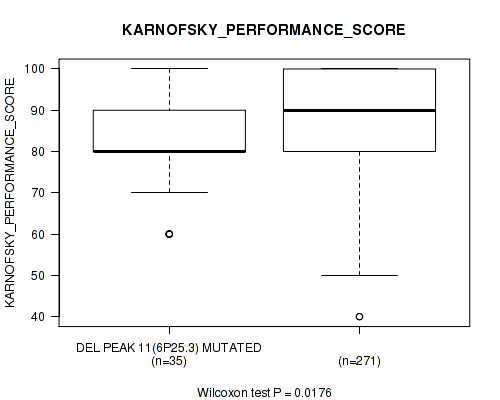
del_6p25.3 cnv correlated to 'Time to Death' and 'KARNOFSKY_PERFORMANCE_SCORE'.
-
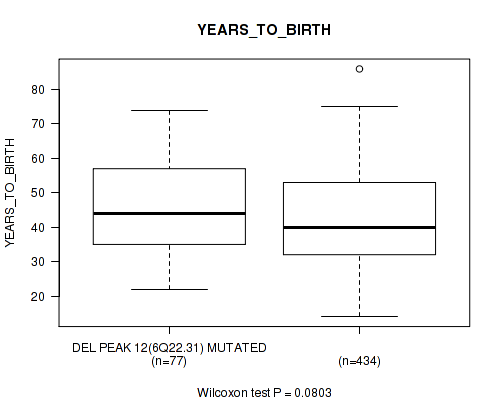
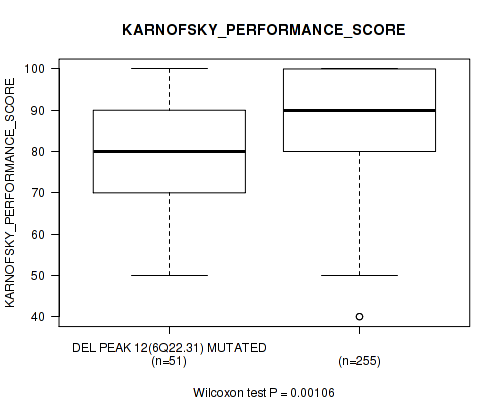
del_6q22.31 cnv correlated to 'Time to Death', 'YEARS_TO_BIRTH', 'RADIATION_THERAPY', 'KARNOFSKY_PERFORMANCE_SCORE', and 'HISTOLOGICAL_TYPE'.
-
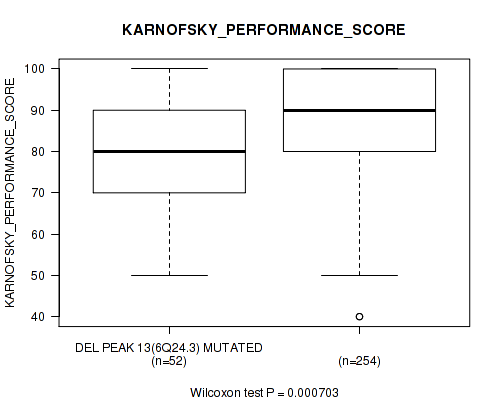
del_6q24.3 cnv correlated to 'Time to Death', 'RADIATION_THERAPY', 'KARNOFSKY_PERFORMANCE_SCORE', and 'HISTOLOGICAL_TYPE'.
-
del_9p23 cnv correlated to 'Time to Death', 'YEARS_TO_BIRTH', 'RADIATION_THERAPY', 'KARNOFSKY_PERFORMANCE_SCORE', and 'HISTOLOGICAL_TYPE'.
-
del_9p21.3 cnv correlated to 'Time to Death', 'YEARS_TO_BIRTH', 'RADIATION_THERAPY', 'KARNOFSKY_PERFORMANCE_SCORE', and 'HISTOLOGICAL_TYPE'.
-
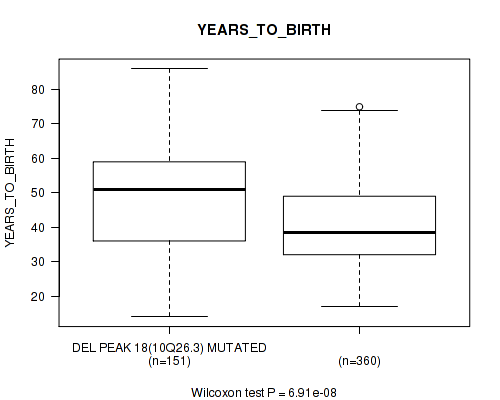
del_10q26.3 cnv correlated to 'Time to Death', 'YEARS_TO_BIRTH', 'GENDER', 'RADIATION_THERAPY', 'KARNOFSKY_PERFORMANCE_SCORE', and 'HISTOLOGICAL_TYPE'.
-
del_11p15.5 cnv correlated to 'YEARS_TO_BIRTH', 'RADIATION_THERAPY', and 'HISTOLOGICAL_TYPE'.
-
del_11p15.1 cnv correlated to 'Time to Death', 'RADIATION_THERAPY', 'KARNOFSKY_PERFORMANCE_SCORE', and 'HISTOLOGICAL_TYPE'.
-
del_12p13.1 cnv correlated to 'Time to Death'.
-
del_12q12 cnv correlated to 'RADIATION_THERAPY', 'HISTOLOGICAL_TYPE', and 'ETHNICITY'.
-
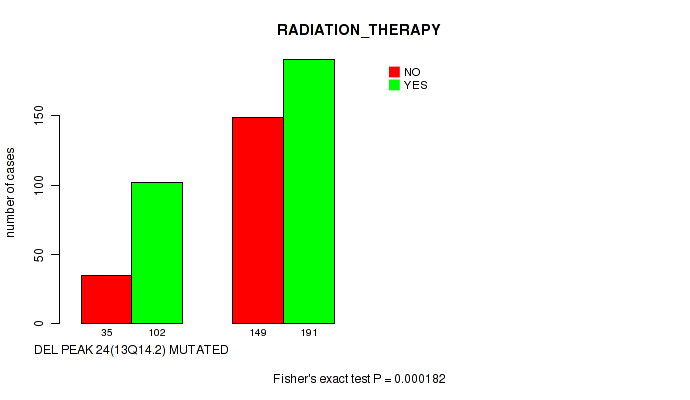
del_13q14.2 cnv correlated to 'Time to Death', 'RADIATION_THERAPY', and 'KARNOFSKY_PERFORMANCE_SCORE'.
-
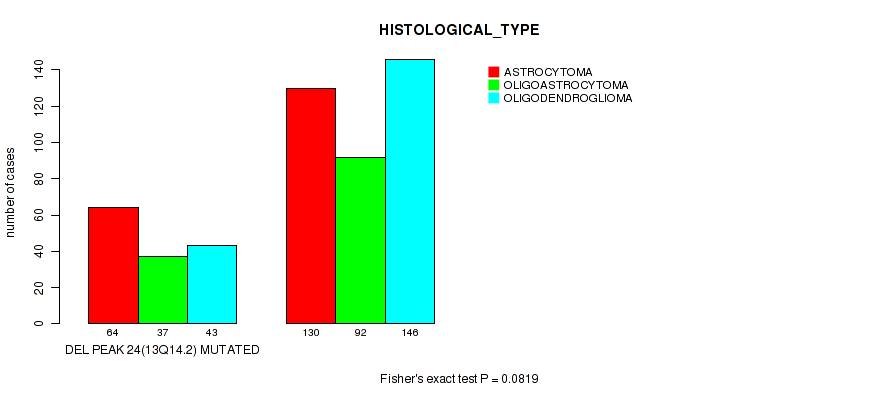
del_13q14.2 cnv correlated to 'Time to Death', 'RADIATION_THERAPY', 'KARNOFSKY_PERFORMANCE_SCORE', and 'HISTOLOGICAL_TYPE'.
-
del_13q34 cnv correlated to 'Time to Death' and 'RADIATION_THERAPY'.
-
del_14q24.3 cnv correlated to 'Time to Death' and 'YEARS_TO_BIRTH'.
-
del_18q23 cnv correlated to 'YEARS_TO_BIRTH'.
-
del_19q13.41 cnv correlated to 'Time to Death', 'YEARS_TO_BIRTH', 'RADIATION_THERAPY', and 'HISTOLOGICAL_TYPE'.
-
del_19q13.42 cnv correlated to 'Time to Death', 'RADIATION_THERAPY', and 'HISTOLOGICAL_TYPE'.
-
del_22q13.31 cnv correlated to 'Time to Death', 'YEARS_TO_BIRTH', 'RADIATION_THERAPY', 'KARNOFSKY_PERFORMANCE_SCORE', and 'HISTOLOGICAL_TYPE'.
-
del_xq21.1 cnv correlated to 'Time to Death'.
Table 1. Get Full Table Overview of the association between significant copy number variation of 52 focal events and 8 clinical features. Shown in the table are P values (Q values). Thresholded by Q value < 0.25, 145 significant findings detected.
|
Clinical Features |
Time to Death |
YEARS TO BIRTH |
GENDER |
RADIATION THERAPY |
KARNOFSKY PERFORMANCE SCORE |
HISTOLOGICAL TYPE |
RACE | ETHNICITY | ||
| nCNV (%) | nWild-Type | logrank test | Wilcoxon-test | Fisher's exact test | Fisher's exact test | Wilcoxon-test | Fisher's exact test | Fisher's exact test | Fisher's exact test | |
| amp 7q31 2 | 174 (34%) | 338 |
4.64e-05 (0.000536) |
4.58e-08 (2.72e-06) |
0.0495 (0.16) |
0.0027 (0.0154) |
0.0282 (0.101) |
0.0515 (0.165) |
0.00979 (0.0448) |
0.447 (0.694) |
| amp 7q32 3 | 182 (36%) | 330 |
2.23e-05 (0.000265) |
7.84e-09 (5.43e-07) |
0.0325 (0.115) |
0.00116 (0.00723) |
0.04 (0.133) |
0.0576 (0.18) |
0.0177 (0.07) |
0.346 (0.582) |
| amp 7p11 2 | 128 (25%) | 384 |
3.12e-11 (3.25e-09) |
6.09e-12 (8.44e-10) |
0.307 (0.536) |
0.000705 (0.00473) |
0.000435 (0.00348) |
0.0632 (0.193) |
0.0318 (0.113) |
1 (1.00) |
| del 10q26 3 | 151 (29%) | 361 |
1.71e-14 (7.11e-12) |
6.91e-08 (3.59e-06) |
0.0641 (0.193) |
4.78e-06 (0.000117) |
0.0168 (0.069) |
2e-05 (0.000245) |
0.238 (0.454) |
0.845 (0.935) |
| del 6q22 31 | 77 (15%) | 435 |
4.4e-06 (0.000114) |
0.0803 (0.234) |
0.385 (0.629) |
0.00682 (0.0334) |
0.00106 (0.00668) |
7e-05 (0.000747) |
0.124 (0.31) |
1 (1.00) |
| del 9p23 | 149 (29%) | 363 |
1.97e-06 (5.45e-05) |
0.000504 (0.00381) |
0.494 (0.724) |
0.000111 (0.0011) |
0.000101 (0.00102) |
0.00841 (0.0398) |
0.678 (0.842) |
1 (1.00) |
| del 9p21 3 | 175 (34%) | 337 |
6.21e-13 (1.29e-10) |
9.28e-08 (3.86e-06) |
0.191 (0.401) |
1.42e-06 (4.54e-05) |
1.26e-05 (0.000181) |
0.00186 (0.0112) |
0.49 (0.721) |
0.565 (0.773) |
| del 22q13 31 | 77 (15%) | 435 |
1e-05 (0.000149) |
0.000444 (0.00348) |
0.62 (0.801) |
0.00782 (0.0374) |
0.0542 (0.171) |
0.00088 (0.00572) |
0.155 (0.353) |
0.603 (0.794) |
| amp 1q32 1 | 43 (8%) | 469 |
0.000553 (0.00408) |
8.98e-08 (3.86e-06) |
1 (1.00) |
0.0641 (0.193) |
0.0141 (0.0619) |
0.153 (0.352) |
0.149 (0.352) |
0.0964 (0.265) |
| amp 3q26 33 | 21 (4%) | 491 |
1.55e-06 (4.6e-05) |
0.043 (0.141) |
0.825 (0.928) |
0.461 (0.697) |
0.0406 (0.134) |
0.00106 (0.00668) |
0.129 (0.319) |
0.629 (0.801) |
| amp 12q14 1 | 37 (7%) | 475 |
2.8e-10 (2.33e-08) |
0.00148 (0.00906) |
0.865 (0.945) |
0.0192 (0.0752) |
0.152 (0.352) |
0.0228 (0.0869) |
0.27 (0.497) |
0.498 (0.726) |
| del 1p36 32 | 206 (40%) | 306 |
0.0262 (0.0946) |
8.3e-07 (3.14e-05) |
0.587 (0.787) |
1.48e-05 (0.000205) |
0.444 (0.694) |
1e-05 (0.000149) |
0.282 (0.508) |
1 (1.00) |
| del 1p32 3 | 196 (38%) | 316 |
0.00317 (0.0173) |
5.46e-06 (0.000126) |
0.784 (0.903) |
1.07e-06 (3.7e-05) |
0.211 (0.422) |
1e-05 (0.000149) |
0.396 (0.642) |
0.852 (0.94) |
| del 6q24 3 | 81 (16%) | 431 |
1.7e-05 (0.000228) |
0.386 (0.629) |
0.18 (0.394) |
0.0251 (0.0925) |
0.000703 (0.00473) |
0.00012 (0.00113) |
0.144 (0.347) |
1 (1.00) |
| del 11p15 1 | 72 (14%) | 440 |
0.00718 (0.0347) |
0.236 (0.454) |
0.0959 (0.265) |
0.00682 (0.0334) |
0.0542 (0.171) |
0.00022 (0.00183) |
0.717 (0.865) |
1 (1.00) |
| del 13q14 2 | 144 (28%) | 368 |
0.0334 (0.116) |
0.933 (0.996) |
0.237 (0.454) |
0.000182 (0.00161) |
0.00625 (0.0317) |
0.0819 (0.236) |
0.116 (0.296) |
0.426 (0.677) |
| del 19q13 41 | 267 (52%) | 245 |
0.00299 (0.0166) |
0.0589 (0.183) |
0.478 (0.71) |
0.000337 (0.00275) |
0.624 (0.801) |
1e-05 (0.000149) |
0.423 (0.674) |
0.717 (0.865) |
| amp 4q12 | 30 (6%) | 482 |
0.000578 (0.00408) |
0.197 (0.404) |
0.706 (0.864) |
0.0171 (0.0691) |
0.151 (0.352) |
0.00074 (0.00489) |
1 (1.00) |
0.711 (0.864) |
| amp 8q24 13 | 100 (20%) | 412 |
0.224 (0.439) |
0.0203 (0.0782) |
0.316 (0.547) |
0.00663 (0.0332) |
0.894 (0.963) |
0.00401 (0.0214) |
0.623 (0.801) |
0.245 (0.463) |
| amp 10p15 3 | 71 (14%) | 441 |
0.499 (0.726) |
0.000195 (0.00169) |
0.159 (0.358) |
0.0596 (0.184) |
0.258 (0.482) |
1e-05 (0.000149) |
0.838 (0.932) |
0.174 (0.386) |
| amp 19p13 3 | 129 (25%) | 383 |
0.442 (0.694) |
0.0347 (0.119) |
0.539 (0.75) |
0.00489 (0.0254) |
0.511 (0.734) |
1e-05 (0.000149) |
0.722 (0.865) |
0.294 (0.523) |
| amp 19p13 2 | 122 (24%) | 390 |
0.987 (1.00) |
0.00919 (0.0425) |
0.144 (0.347) |
0.011 (0.0491) |
0.974 (1.00) |
1e-05 (0.000149) |
0.62 (0.801) |
0.201 (0.411) |
| del 2q37 3 | 77 (15%) | 435 |
0.642 (0.809) |
0.0779 (0.229) |
0.456 (0.696) |
0.0169 (0.069) |
0.37 (0.617) |
0.01 (0.0453) |
0.733 (0.874) |
0.322 (0.553) |
| del 11p15 5 | 104 (20%) | 408 |
0.103 (0.275) |
0.014 (0.0619) |
0.0979 (0.266) |
0.00346 (0.0187) |
0.153 (0.352) |
1e-05 (0.000149) |
0.454 (0.696) |
0.822 (0.928) |
| del 12q12 | 72 (14%) | 440 |
0.903 (0.966) |
0.522 (0.734) |
0.898 (0.963) |
0.0151 (0.064) |
0.629 (0.801) |
7e-05 (0.000747) |
0.462 (0.697) |
0.0679 (0.202) |
| del 13q14 2 | 142 (28%) | 370 |
0.0373 (0.126) |
0.941 (1.00) |
0.234 (0.454) |
0.000161 (0.00148) |
0.00578 (0.0297) |
0.104 (0.275) |
0.109 (0.284) |
0.542 (0.752) |
| del 19q13 42 | 278 (54%) | 234 |
0.000117 (0.00113) |
0.257 (0.482) |
0.722 (0.865) |
0.000467 (0.0036) |
0.608 (0.795) |
1e-05 (0.000149) |
0.385 (0.629) |
1 (1.00) |
| amp 9q34 3 | 46 (9%) | 466 |
0.823 (0.928) |
0.71 (0.864) |
0.0899 (0.254) |
0.00485 (0.0254) |
0.521 (0.734) |
0.0239 (0.0895) |
0.0993 (0.268) |
0.193 (0.401) |
| amp 12p13 32 | 72 (14%) | 440 |
0.265 (0.493) |
0.0366 (0.125) |
0.127 (0.316) |
0.0169 (0.069) |
0.576 (0.778) |
0.123 (0.31) |
0.838 (0.932) |
0.6 (0.794) |
| amp 17q25 1 | 43 (8%) | 469 |
0.026 (0.0946) |
0.0334 (0.116) |
0.525 (0.735) |
0.742 (0.879) |
0.189 (0.401) |
0.303 (0.531) |
0.153 (0.352) |
0.318 (0.549) |
| amp xp11 22 | 48 (9%) | 464 |
0.18 (0.394) |
0.887 (0.961) |
0.761 (0.887) |
0.000632 (0.00438) |
0.639 (0.809) |
0.00239 (0.0138) |
0.276 (0.503) |
0.193 (0.401) |
| amp xp11 22 | 63 (12%) | 449 |
0.397 (0.642) |
0.719 (0.865) |
0.343 (0.581) |
0.000578 (0.00408) |
0.465 (0.699) |
1e-05 (0.000149) |
0.678 (0.842) |
0.569 (0.773) |
| del 3p21 31 | 49 (10%) | 463 |
0.188 (0.401) |
0.84 (0.932) |
0.764 (0.887) |
0.00275 (0.0154) |
0.0242 (0.0898) |
0.557 (0.765) |
0.787 (0.903) |
0.218 (0.433) |
| del 3q13 31 | 39 (8%) | 473 |
0.0168 (0.069) |
0.839 (0.932) |
0.738 (0.878) |
0.0782 (0.229) |
0.191 (0.401) |
0.549 (0.756) |
0.6 (0.794) |
1 (1.00) |
| del 3q29 | 47 (9%) | 465 |
0.0392 (0.132) |
0.972 (1.00) |
0.878 (0.954) |
0.107 (0.282) |
0.066 (0.198) |
0.0888 (0.253) |
0.488 (0.72) |
0.516 (0.734) |
| del 5p15 33 | 50 (10%) | 462 |
0.571 (0.774) |
0.373 (0.617) |
0.766 (0.887) |
0.000101 (0.00102) |
0.133 (0.327) |
0.00218 (0.013) |
0.789 (0.903) |
0.759 (0.887) |
| del 5q34 | 64 (12%) | 448 |
0.11 (0.284) |
0.696 (0.855) |
0.505 (0.732) |
0.000578 (0.00408) |
0.518 (0.734) |
2e-05 (0.000245) |
0.258 (0.482) |
0.407 (0.653) |
| del 6p25 3 | 50 (10%) | 462 |
0.000202 (0.00172) |
0.373 (0.617) |
1 (1.00) |
0.186 (0.401) |
0.0176 (0.07) |
0.325 (0.557) |
0.173 (0.386) |
0.228 (0.445) |
| del 13q34 | 110 (21%) | 402 |
0.0149 (0.0638) |
0.482 (0.714) |
0.449 (0.694) |
0.00905 (0.0423) |
0.206 (0.415) |
0.897 (0.963) |
0.277 (0.503) |
0.826 (0.928) |
| del 14q24 3 | 121 (24%) | 391 |
1.76e-05 (0.000228) |
0.0144 (0.0623) |
0.0948 (0.265) |
0.152 (0.352) |
0.214 (0.425) |
0.412 (0.66) |
0.184 (0.4) |
1 (1.00) |
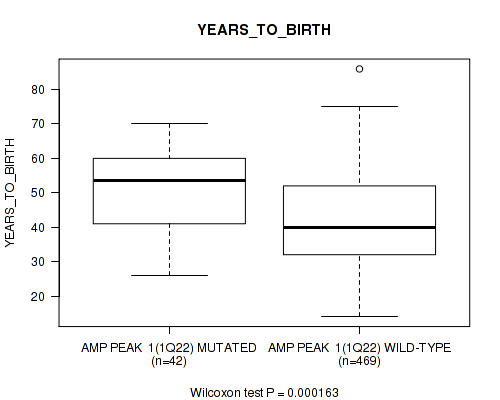
| amp 1q22 | 42 (8%) | 470 |
0.189 (0.401) |
0.000163 (0.00148) |
1 (1.00) |
0.241 (0.458) |
0.456 (0.696) |
0.221 (0.436) |
0.209 (0.42) |
0.0963 (0.265) |
| amp 2p24 3 | 24 (5%) | 488 |
0.0237 (0.0895) |
0.803 (0.915) |
1 (1.00) |
0.655 (0.821) |
0.626 (0.801) |
0.206 (0.415) |
0.749 (0.882) |
0.159 (0.358) |
| amp 13q34 | 22 (4%) | 490 |
0.568 (0.773) |
0.765 (0.887) |
0.828 (0.928) |
1 (1.00) |
0.0455 (0.148) |
0.621 (0.801) |
0.733 (0.874) |
0.644 (0.809) |
| amp 15q26 3 | 19 (4%) | 493 |
6.15e-05 (0.000691) |
0.953 (1.00) |
0.818 (0.928) |
0.339 (0.578) |
0.194 (0.401) |
0.11 (0.284) |
0.697 (0.855) |
0.343 (0.581) |
| del 12p13 1 | 38 (7%) | 474 |
0.00222 (0.013) |
0.349 (0.585) |
1 (1.00) |
0.859 (0.943) |
0.584 (0.786) |
0.113 (0.29) |
1 (1.00) |
0.155 (0.353) |
| del 18q23 | 78 (15%) | 434 |
0.877 (0.954) |
0.0196 (0.0763) |
0.267 (0.493) |
0.604 (0.794) |
0.861 (0.943) |
0.238 (0.454) |
0.196 (0.403) |
0.445 (0.694) |
| del xq21 1 | 78 (15%) | 434 |
0.083 (0.238) |
0.1 (0.269) |
0.459 (0.696) |
0.149 (0.352) |
0.778 (0.899) |
0.591 (0.791) |
0.468 (0.7) |
1 (1.00) |
| amp 11q24 1 | 87 (17%) | 425 |
0.521 (0.734) |
0.527 (0.735) |
0.478 (0.71) |
1 (1.00) |
0.744 (0.879) |
0.509 (0.734) |
0.618 (0.801) |
1 (1.00) |
| del 1q43 | 30 (6%) | 482 |
0.862 (0.943) |
0.137 (0.334) |
0.188 (0.401) |
0.117 (0.296) |
0.593 (0.791) |
0.374 (0.617) |
0.311 (0.541) |
1 (1.00) |
| del 4q34 3 | 138 (27%) | 374 |
0.522 (0.734) |
0.144 (0.347) |
0.548 (0.756) |
0.456 (0.696) |
0.694 (0.855) |
0.791 (0.903) |
0.666 (0.832) |
0.681 (0.843) |
| del 7p22 3 | 23 (4%) | 489 |
0.0968 (0.265) |
0.75 (0.882) |
0.522 (0.734) |
0.177 (0.392) |
0.605 (0.794) |
0.891 (0.963) |
0.293 (0.523) |
0.644 (0.809) |
| del 8q24 3 | 29 (6%) | 483 |
0.276 (0.503) |
0.438 (0.693) |
0.447 (0.694) |
0.3 (0.529) |
0.298 (0.528) |
0.282 (0.508) |
0.29 (0.52) |
0.405 (0.653) |
P value = 0.000163 (Wilcoxon-test), Q value = 0.0015
Table S1. Gene #1: 'amp_1q22' versus Clinical Feature #2: 'YEARS_TO_BIRTH'
| nPatients | Mean (Std.Dev) | |
|---|---|---|
| ALL | 511 | 43.0 (13.3) |
| AMP PEAK 1(1Q22) MUTATED | 42 | 50.4 (12.8) |
| AMP PEAK 1(1Q22) WILD-TYPE | 469 | 42.3 (13.2) |
Figure S1. Get High-res Image Gene #1: 'amp_1q22' versus Clinical Feature #2: 'YEARS_TO_BIRTH'
P value = 0.000553 (logrank test), Q value = 0.0041
Table S2. Gene #2: 'amp_1q32.1' versus Clinical Feature #1: 'Time to Death'
| nPatients | nDeath | Duration Range (Median), Month | |
|---|---|---|---|
| ALL | 509 | 121 | 0.0 - 211.2 (20.8) |
| AMP PEAK 2(1Q32.1) MUTATED | 43 | 21 | 0.2 - 211.2 (19.1) |
| AMP PEAK 2(1Q32.1) WILD-TYPE | 466 | 100 | 0.0 - 182.3 (21.3) |
Figure S2. Get High-res Image Gene #2: 'amp_1q32.1' versus Clinical Feature #1: 'Time to Death'
P value = 8.98e-08 (Wilcoxon-test), Q value = 3.9e-06
Table S3. Gene #2: 'amp_1q32.1' versus Clinical Feature #2: 'YEARS_TO_BIRTH'
| nPatients | Mean (Std.Dev) | |
|---|---|---|
| ALL | 511 | 43.0 (13.3) |
| AMP PEAK 2(1Q32.1) MUTATED | 43 | 53.7 (11.9) |
| AMP PEAK 2(1Q32.1) WILD-TYPE | 468 | 42.0 (13.0) |
Figure S3. Get High-res Image Gene #2: 'amp_1q32.1' versus Clinical Feature #2: 'YEARS_TO_BIRTH'
P value = 0.0641 (Fisher's exact test), Q value = 0.19
Table S4. Gene #2: 'amp_1q32.1' versus Clinical Feature #4: 'RADIATION_THERAPY'
| nPatients | NO | YES |
|---|---|---|
| ALL | 184 | 293 |
| AMP PEAK 2(1Q32.1) MUTATED | 10 | 31 |
| AMP PEAK 2(1Q32.1) WILD-TYPE | 174 | 262 |
Figure S4. Get High-res Image Gene #2: 'amp_1q32.1' versus Clinical Feature #4: 'RADIATION_THERAPY'

P value = 0.0141 (Wilcoxon-test), Q value = 0.062
Table S5. Gene #2: 'amp_1q32.1' versus Clinical Feature #5: 'KARNOFSKY_PERFORMANCE_SCORE'
| nPatients | Mean (Std.Dev) | |
|---|---|---|
| ALL | 306 | 86.6 (12.6) |
| AMP PEAK 2(1Q32.1) MUTATED | 27 | 81.5 (12.6) |
| AMP PEAK 2(1Q32.1) WILD-TYPE | 279 | 87.1 (12.5) |
Figure S5. Get High-res Image Gene #2: 'amp_1q32.1' versus Clinical Feature #5: 'KARNOFSKY_PERFORMANCE_SCORE'
P value = 0.0237 (logrank test), Q value = 0.089
Table S6. Gene #3: 'amp_2p24.3' versus Clinical Feature #1: 'Time to Death'
| nPatients | nDeath | Duration Range (Median), Month | |
|---|---|---|---|
| ALL | 509 | 121 | 0.0 - 211.2 (20.8) |
| AMP PEAK 3(2P24.3) MUTATED | 24 | 10 | 0.1 - 94.5 (20.4) |
| AMP PEAK 3(2P24.3) WILD-TYPE | 485 | 111 | 0.0 - 211.2 (21.0) |
Figure S6. Get High-res Image Gene #3: 'amp_2p24.3' versus Clinical Feature #1: 'Time to Death'
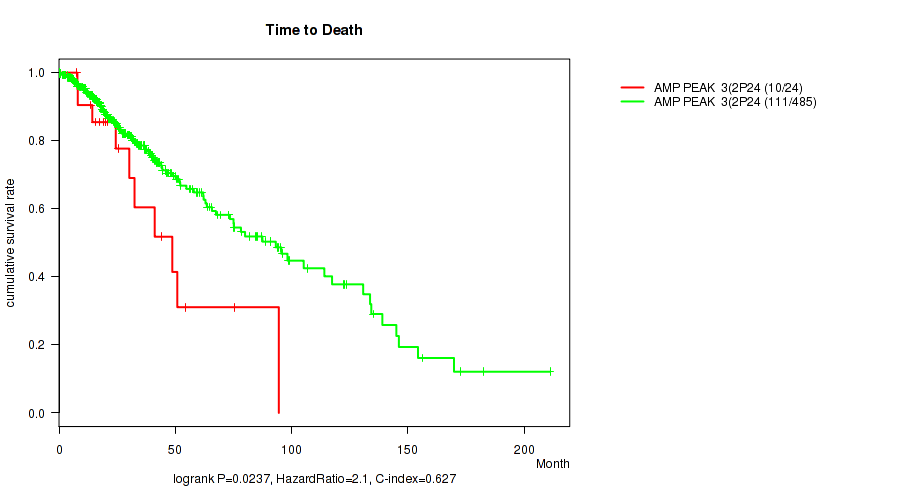
P value = 1.55e-06 (logrank test), Q value = 4.6e-05
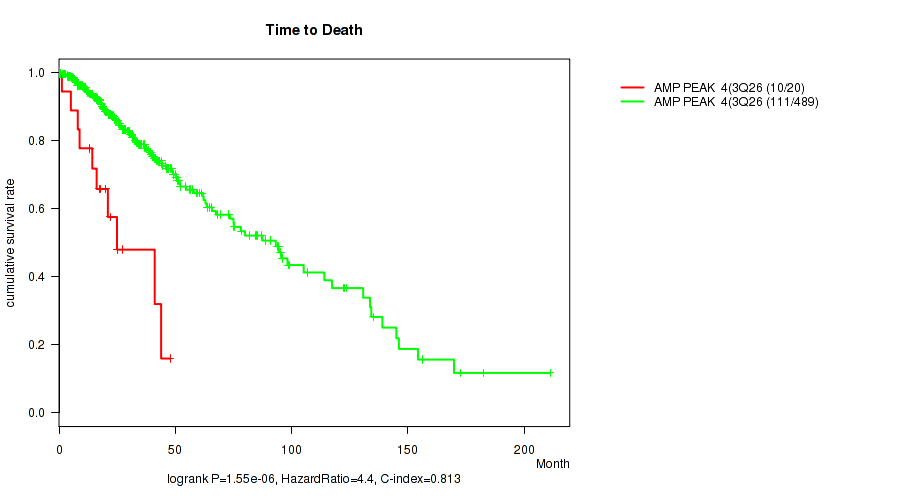
Table S7. Gene #4: 'amp_3q26.33' versus Clinical Feature #1: 'Time to Death'
| nPatients | nDeath | Duration Range (Median), Month | |
|---|---|---|---|
| ALL | 509 | 121 | 0.0 - 211.2 (20.8) |
| AMP PEAK 4(3Q26.33) MUTATED | 20 | 10 | 0.2 - 47.8 (17.6) |
| AMP PEAK 4(3Q26.33) WILD-TYPE | 489 | 111 | 0.0 - 211.2 (21.3) |
Figure S7. Get High-res Image Gene #4: 'amp_3q26.33' versus Clinical Feature #1: 'Time to Death'
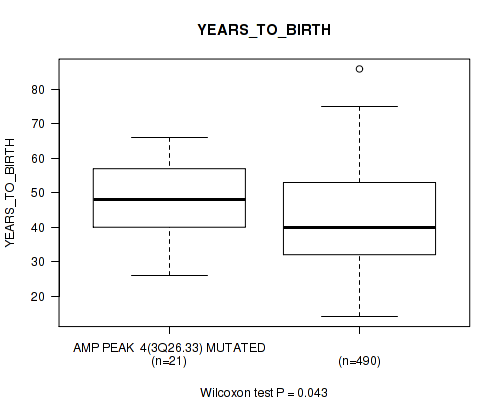
P value = 0.043 (Wilcoxon-test), Q value = 0.14
Table S8. Gene #4: 'amp_3q26.33' versus Clinical Feature #2: 'YEARS_TO_BIRTH'
| nPatients | Mean (Std.Dev) | |
|---|---|---|
| ALL | 511 | 43.0 (13.3) |
| AMP PEAK 4(3Q26.33) MUTATED | 21 | 48.3 (12.0) |
| AMP PEAK 4(3Q26.33) WILD-TYPE | 490 | 42.8 (13.4) |
Figure S8. Get High-res Image Gene #4: 'amp_3q26.33' versus Clinical Feature #2: 'YEARS_TO_BIRTH'
P value = 0.0406 (Wilcoxon-test), Q value = 0.13
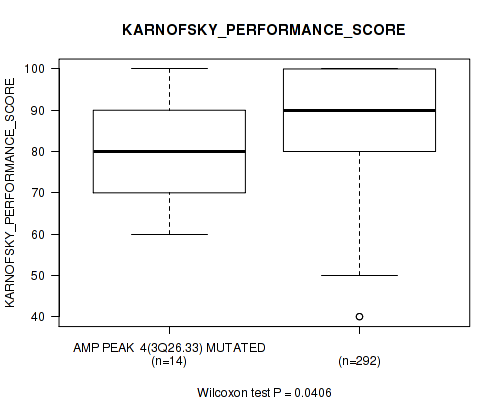
Table S9. Gene #4: 'amp_3q26.33' versus Clinical Feature #5: 'KARNOFSKY_PERFORMANCE_SCORE'
| nPatients | Mean (Std.Dev) | |
|---|---|---|
| ALL | 306 | 86.6 (12.6) |
| AMP PEAK 4(3Q26.33) MUTATED | 14 | 81.4 (11.0) |
| AMP PEAK 4(3Q26.33) WILD-TYPE | 292 | 86.9 (12.6) |
Figure S9. Get High-res Image Gene #4: 'amp_3q26.33' versus Clinical Feature #5: 'KARNOFSKY_PERFORMANCE_SCORE'
P value = 0.00106 (Fisher's exact test), Q value = 0.0067
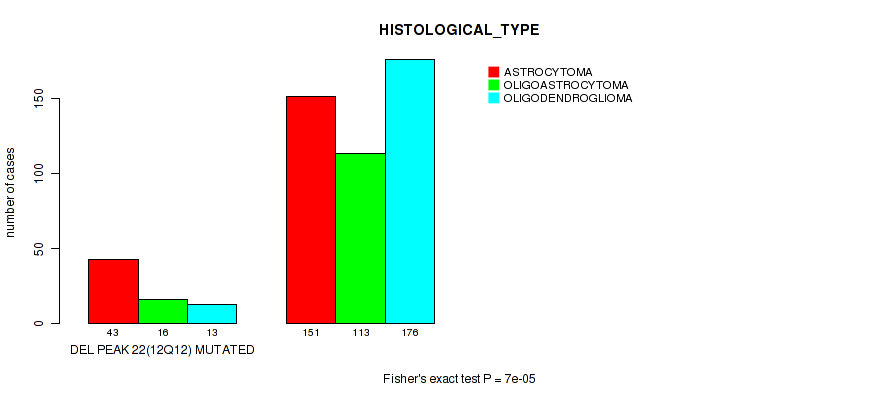
Table S10. Gene #4: 'amp_3q26.33' versus Clinical Feature #6: 'HISTOLOGICAL_TYPE'
| nPatients | ASTROCYTOMA | OLIGOASTROCYTOMA | OLIGODENDROGLIOMA |
|---|---|---|---|
| ALL | 194 | 129 | 189 |
| AMP PEAK 4(3Q26.33) MUTATED | 16 | 1 | 4 |
| AMP PEAK 4(3Q26.33) WILD-TYPE | 178 | 128 | 185 |
Figure S10. Get High-res Image Gene #4: 'amp_3q26.33' versus Clinical Feature #6: 'HISTOLOGICAL_TYPE'
P value = 0.000578 (logrank test), Q value = 0.0041
Table S11. Gene #5: 'amp_4q12' versus Clinical Feature #1: 'Time to Death'
| nPatients | nDeath | Duration Range (Median), Month | |
|---|---|---|---|
| ALL | 509 | 121 | 0.0 - 211.2 (20.8) |
| AMP PEAK 5(4Q12) MUTATED | 30 | 12 | 2.8 - 60.3 (20.1) |
| AMP PEAK 5(4Q12) WILD-TYPE | 479 | 109 | 0.0 - 211.2 (21.0) |
Figure S11. Get High-res Image Gene #5: 'amp_4q12' versus Clinical Feature #1: 'Time to Death'

P value = 0.0171 (Fisher's exact test), Q value = 0.069
Table S12. Gene #5: 'amp_4q12' versus Clinical Feature #4: 'RADIATION_THERAPY'
| nPatients | NO | YES |
|---|---|---|
| ALL | 184 | 293 |
| AMP PEAK 5(4Q12) MUTATED | 5 | 24 |
| AMP PEAK 5(4Q12) WILD-TYPE | 179 | 269 |
Figure S12. Get High-res Image Gene #5: 'amp_4q12' versus Clinical Feature #4: 'RADIATION_THERAPY'
P value = 0.00074 (Fisher's exact test), Q value = 0.0049
Table S13. Gene #5: 'amp_4q12' versus Clinical Feature #6: 'HISTOLOGICAL_TYPE'
| nPatients | ASTROCYTOMA | OLIGOASTROCYTOMA | OLIGODENDROGLIOMA |
|---|---|---|---|
| ALL | 194 | 129 | 189 |
| AMP PEAK 5(4Q12) MUTATED | 21 | 2 | 7 |
| AMP PEAK 5(4Q12) WILD-TYPE | 173 | 127 | 182 |
Figure S13. Get High-res Image Gene #5: 'amp_4q12' versus Clinical Feature #6: 'HISTOLOGICAL_TYPE'

P value = 3.12e-11 (logrank test), Q value = 3.2e-09
Table S14. Gene #6: 'amp_7p11.2' versus Clinical Feature #1: 'Time to Death'
| nPatients | nDeath | Duration Range (Median), Month | |
|---|---|---|---|
| ALL | 509 | 121 | 0.0 - 211.2 (20.8) |
| AMP PEAK 6(7P11.2) MUTATED | 128 | 54 | 0.1 - 211.2 (18.0) |
| AMP PEAK 6(7P11.2) WILD-TYPE | 381 | 67 | 0.0 - 182.3 (23.2) |
Figure S14. Get High-res Image Gene #6: 'amp_7p11.2' versus Clinical Feature #1: 'Time to Death'
P value = 6.09e-12 (Wilcoxon-test), Q value = 8.4e-10
Table S15. Gene #6: 'amp_7p11.2' versus Clinical Feature #2: 'YEARS_TO_BIRTH'
| nPatients | Mean (Std.Dev) | |
|---|---|---|
| ALL | 511 | 43.0 (13.3) |
| AMP PEAK 6(7P11.2) MUTATED | 128 | 50.1 (13.1) |
| AMP PEAK 6(7P11.2) WILD-TYPE | 383 | 40.6 (12.6) |
Figure S15. Get High-res Image Gene #6: 'amp_7p11.2' versus Clinical Feature #2: 'YEARS_TO_BIRTH'
P value = 0.000705 (Fisher's exact test), Q value = 0.0047
Table S16. Gene #6: 'amp_7p11.2' versus Clinical Feature #4: 'RADIATION_THERAPY'
| nPatients | NO | YES |
|---|---|---|
| ALL | 184 | 293 |
| AMP PEAK 6(7P11.2) MUTATED | 30 | 88 |
| AMP PEAK 6(7P11.2) WILD-TYPE | 154 | 205 |
Figure S16. Get High-res Image Gene #6: 'amp_7p11.2' versus Clinical Feature #4: 'RADIATION_THERAPY'
P value = 0.000435 (Wilcoxon-test), Q value = 0.0035
Table S17. Gene #6: 'amp_7p11.2' versus Clinical Feature #5: 'KARNOFSKY_PERFORMANCE_SCORE'
| nPatients | Mean (Std.Dev) | |
|---|---|---|
| ALL | 306 | 86.6 (12.6) |
| AMP PEAK 6(7P11.2) MUTATED | 77 | 81.8 (15.1) |
| AMP PEAK 6(7P11.2) WILD-TYPE | 229 | 88.3 (11.2) |
Figure S17. Get High-res Image Gene #6: 'amp_7p11.2' versus Clinical Feature #5: 'KARNOFSKY_PERFORMANCE_SCORE'
P value = 0.0632 (Fisher's exact test), Q value = 0.19
Table S18. Gene #6: 'amp_7p11.2' versus Clinical Feature #6: 'HISTOLOGICAL_TYPE'
| nPatients | ASTROCYTOMA | OLIGOASTROCYTOMA | OLIGODENDROGLIOMA |
|---|---|---|---|
| ALL | 194 | 129 | 189 |
| AMP PEAK 6(7P11.2) MUTATED | 58 | 33 | 37 |
| AMP PEAK 6(7P11.2) WILD-TYPE | 136 | 96 | 152 |
Figure S18. Get High-res Image Gene #6: 'amp_7p11.2' versus Clinical Feature #6: 'HISTOLOGICAL_TYPE'
P value = 0.0318 (Fisher's exact test), Q value = 0.11
Table S19. Gene #6: 'amp_7p11.2' versus Clinical Feature #7: 'RACE'
| nPatients | AMERICAN INDIAN OR ALASKA NATIVE | ASIAN | BLACK OR AFRICAN AMERICAN | WHITE |
|---|---|---|---|---|
| ALL | 1 | 8 | 21 | 472 |
| AMP PEAK 6(7P11.2) MUTATED | 1 | 2 | 10 | 115 |
| AMP PEAK 6(7P11.2) WILD-TYPE | 0 | 6 | 11 | 357 |
Figure S19. Get High-res Image Gene #6: 'amp_7p11.2' versus Clinical Feature #7: 'RACE'
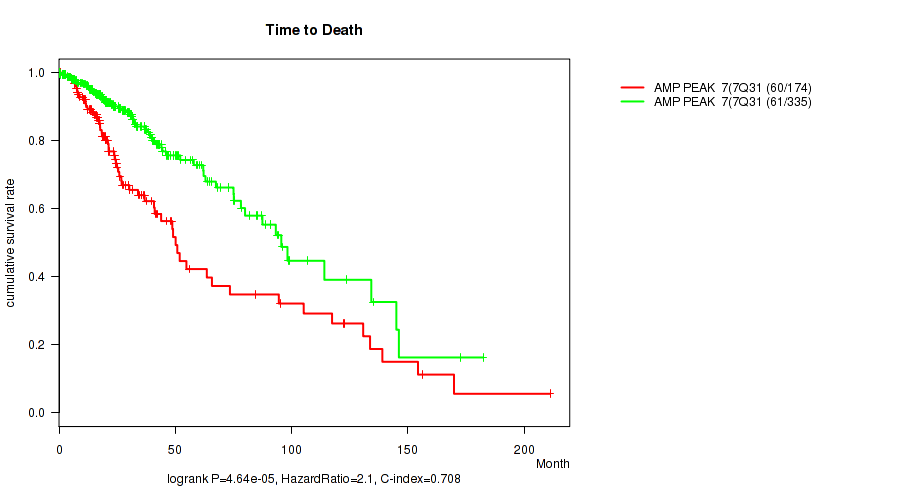
P value = 4.64e-05 (logrank test), Q value = 0.00054
Table S20. Gene #7: 'amp_7q31.2' versus Clinical Feature #1: 'Time to Death'
| nPatients | nDeath | Duration Range (Median), Month | |
|---|---|---|---|
| ALL | 509 | 121 | 0.0 - 211.2 (20.8) |
| AMP PEAK 7(7Q31.2) MUTATED | 174 | 60 | 0.1 - 211.2 (18.5) |
| AMP PEAK 7(7Q31.2) WILD-TYPE | 335 | 61 | 0.0 - 182.3 (23.5) |
Figure S20. Get High-res Image Gene #7: 'amp_7q31.2' versus Clinical Feature #1: 'Time to Death'
P value = 4.58e-08 (Wilcoxon-test), Q value = 2.7e-06
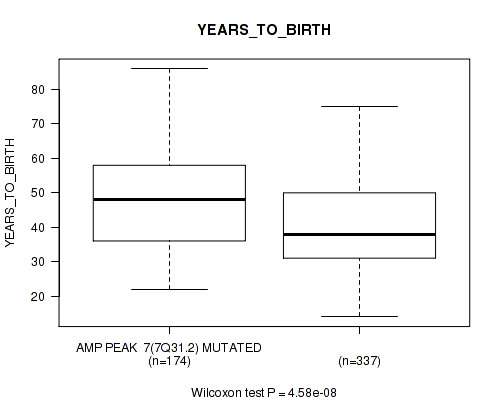
Table S21. Gene #7: 'amp_7q31.2' versus Clinical Feature #2: 'YEARS_TO_BIRTH'
| nPatients | Mean (Std.Dev) | |
|---|---|---|
| ALL | 511 | 43.0 (13.3) |
| AMP PEAK 7(7Q31.2) MUTATED | 174 | 47.5 (13.3) |
| AMP PEAK 7(7Q31.2) WILD-TYPE | 337 | 40.6 (12.8) |
Figure S21. Get High-res Image Gene #7: 'amp_7q31.2' versus Clinical Feature #2: 'YEARS_TO_BIRTH'
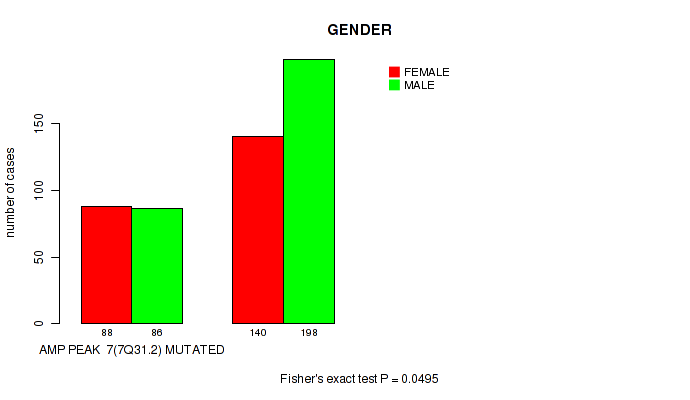
P value = 0.0495 (Fisher's exact test), Q value = 0.16
Table S22. Gene #7: 'amp_7q31.2' versus Clinical Feature #3: 'GENDER'
| nPatients | FEMALE | MALE |
|---|---|---|
| ALL | 228 | 284 |
| AMP PEAK 7(7Q31.2) MUTATED | 88 | 86 |
| AMP PEAK 7(7Q31.2) WILD-TYPE | 140 | 198 |
Figure S22. Get High-res Image Gene #7: 'amp_7q31.2' versus Clinical Feature #3: 'GENDER'
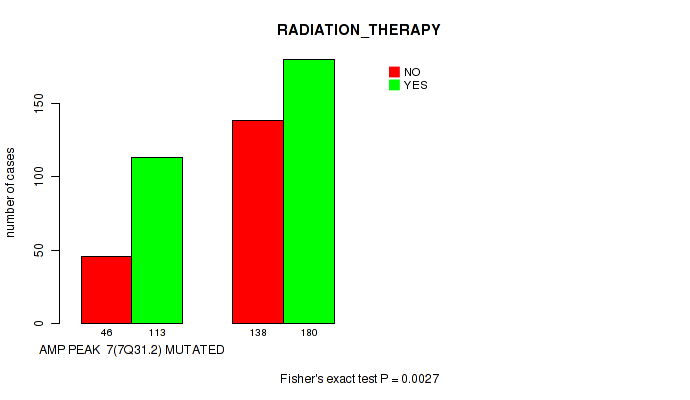
P value = 0.0027 (Fisher's exact test), Q value = 0.015
Table S23. Gene #7: 'amp_7q31.2' versus Clinical Feature #4: 'RADIATION_THERAPY'
| nPatients | NO | YES |
|---|---|---|
| ALL | 184 | 293 |
| AMP PEAK 7(7Q31.2) MUTATED | 46 | 113 |
| AMP PEAK 7(7Q31.2) WILD-TYPE | 138 | 180 |
Figure S23. Get High-res Image Gene #7: 'amp_7q31.2' versus Clinical Feature #4: 'RADIATION_THERAPY'
P value = 0.0282 (Wilcoxon-test), Q value = 0.1
Table S24. Gene #7: 'amp_7q31.2' versus Clinical Feature #5: 'KARNOFSKY_PERFORMANCE_SCORE'
| nPatients | Mean (Std.Dev) | |
|---|---|---|
| ALL | 306 | 86.6 (12.6) |
| AMP PEAK 7(7Q31.2) MUTATED | 102 | 83.8 (14.8) |
| AMP PEAK 7(7Q31.2) WILD-TYPE | 204 | 88.0 (11.1) |
Figure S24. Get High-res Image Gene #7: 'amp_7q31.2' versus Clinical Feature #5: 'KARNOFSKY_PERFORMANCE_SCORE'

P value = 0.0515 (Fisher's exact test), Q value = 0.16
Table S25. Gene #7: 'amp_7q31.2' versus Clinical Feature #6: 'HISTOLOGICAL_TYPE'
| nPatients | ASTROCYTOMA | OLIGOASTROCYTOMA | OLIGODENDROGLIOMA |
|---|---|---|---|
| ALL | 194 | 129 | 189 |
| AMP PEAK 7(7Q31.2) MUTATED | 75 | 47 | 52 |
| AMP PEAK 7(7Q31.2) WILD-TYPE | 119 | 82 | 137 |
Figure S25. Get High-res Image Gene #7: 'amp_7q31.2' versus Clinical Feature #6: 'HISTOLOGICAL_TYPE'
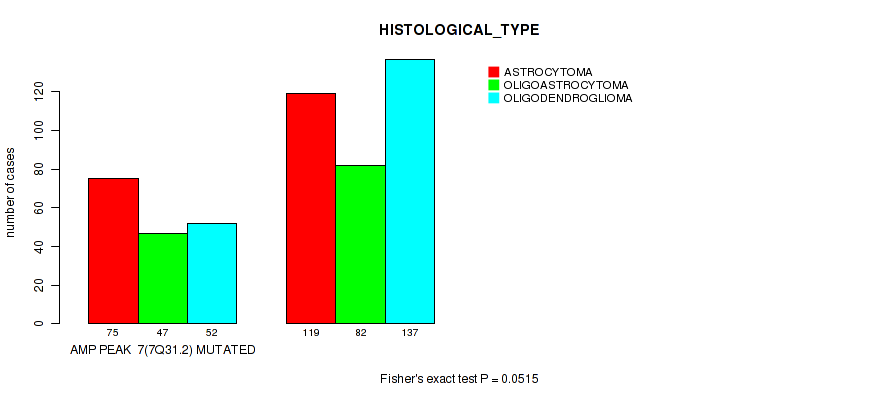
P value = 0.00979 (Fisher's exact test), Q value = 0.045
Table S26. Gene #7: 'amp_7q31.2' versus Clinical Feature #7: 'RACE'
| nPatients | AMERICAN INDIAN OR ALASKA NATIVE | ASIAN | BLACK OR AFRICAN AMERICAN | WHITE |
|---|---|---|---|---|
| ALL | 1 | 8 | 21 | 472 |
| AMP PEAK 7(7Q31.2) MUTATED | 1 | 4 | 13 | 156 |
| AMP PEAK 7(7Q31.2) WILD-TYPE | 0 | 4 | 8 | 316 |
Figure S26. Get High-res Image Gene #7: 'amp_7q31.2' versus Clinical Feature #7: 'RACE'

P value = 2.23e-05 (logrank test), Q value = 0.00027
Table S27. Gene #8: 'amp_7q32.3' versus Clinical Feature #1: 'Time to Death'
| nPatients | nDeath | Duration Range (Median), Month | |
|---|---|---|---|
| ALL | 509 | 121 | 0.0 - 211.2 (20.8) |
| AMP PEAK 8(7Q32.3) MUTATED | 182 | 63 | 0.1 - 211.2 (18.5) |
| AMP PEAK 8(7Q32.3) WILD-TYPE | 327 | 58 | 0.0 - 182.3 (23.6) |
Figure S27. Get High-res Image Gene #8: 'amp_7q32.3' versus Clinical Feature #1: 'Time to Death'
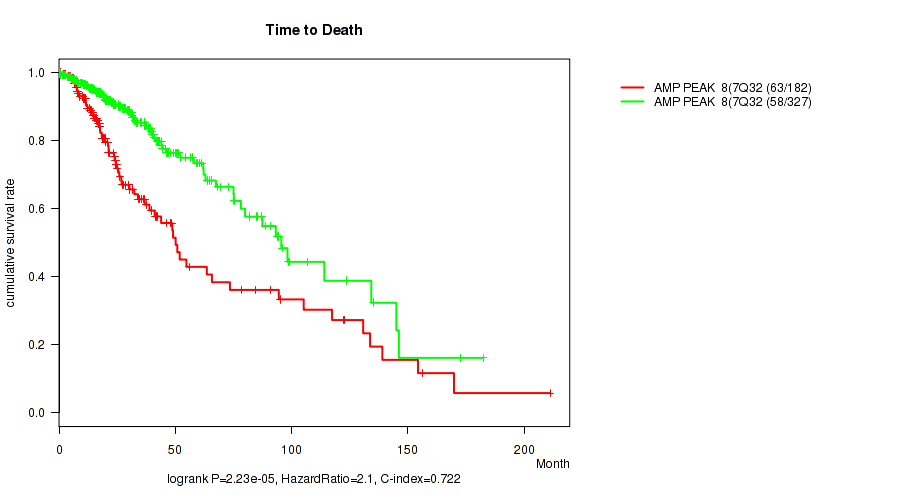
P value = 7.84e-09 (Wilcoxon-test), Q value = 5.4e-07
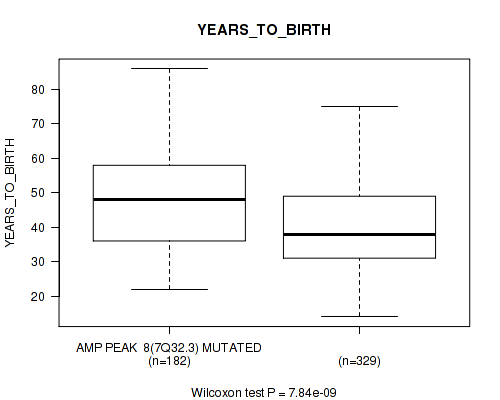
Table S28. Gene #8: 'amp_7q32.3' versus Clinical Feature #2: 'YEARS_TO_BIRTH'
| nPatients | Mean (Std.Dev) | |
|---|---|---|
| ALL | 511 | 43.0 (13.3) |
| AMP PEAK 8(7Q32.3) MUTATED | 182 | 47.6 (13.1) |
| AMP PEAK 8(7Q32.3) WILD-TYPE | 329 | 40.5 (12.8) |
Figure S28. Get High-res Image Gene #8: 'amp_7q32.3' versus Clinical Feature #2: 'YEARS_TO_BIRTH'
P value = 0.0325 (Fisher's exact test), Q value = 0.11
Table S29. Gene #8: 'amp_7q32.3' versus Clinical Feature #3: 'GENDER'
| nPatients | FEMALE | MALE |
|---|---|---|
| ALL | 228 | 284 |
| AMP PEAK 8(7Q32.3) MUTATED | 93 | 89 |
| AMP PEAK 8(7Q32.3) WILD-TYPE | 135 | 195 |
Figure S29. Get High-res Image Gene #8: 'amp_7q32.3' versus Clinical Feature #3: 'GENDER'
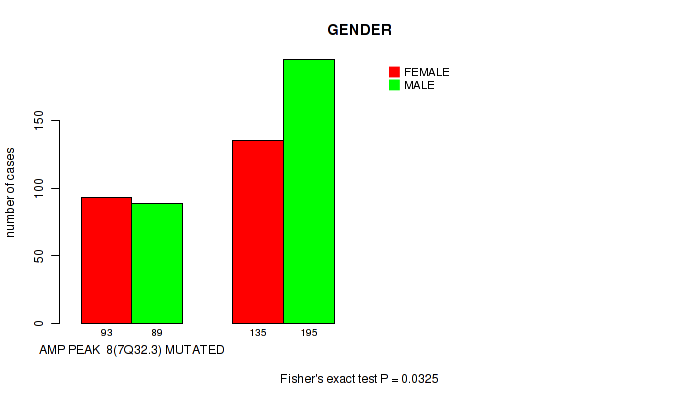
P value = 0.00116 (Fisher's exact test), Q value = 0.0072
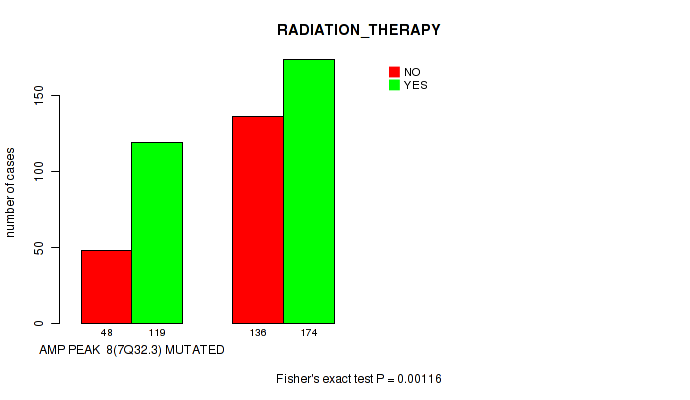
Table S30. Gene #8: 'amp_7q32.3' versus Clinical Feature #4: 'RADIATION_THERAPY'
| nPatients | NO | YES |
|---|---|---|
| ALL | 184 | 293 |
| AMP PEAK 8(7Q32.3) MUTATED | 48 | 119 |
| AMP PEAK 8(7Q32.3) WILD-TYPE | 136 | 174 |
Figure S30. Get High-res Image Gene #8: 'amp_7q32.3' versus Clinical Feature #4: 'RADIATION_THERAPY'
P value = 0.04 (Wilcoxon-test), Q value = 0.13
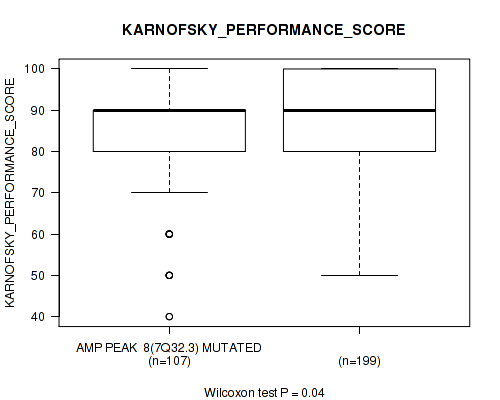
Table S31. Gene #8: 'amp_7q32.3' versus Clinical Feature #5: 'KARNOFSKY_PERFORMANCE_SCORE'
| nPatients | Mean (Std.Dev) | |
|---|---|---|
| ALL | 306 | 86.6 (12.6) |
| AMP PEAK 8(7Q32.3) MUTATED | 107 | 84.1 (14.6) |
| AMP PEAK 8(7Q32.3) WILD-TYPE | 199 | 88.0 (11.1) |
Figure S31. Get High-res Image Gene #8: 'amp_7q32.3' versus Clinical Feature #5: 'KARNOFSKY_PERFORMANCE_SCORE'
P value = 0.0576 (Fisher's exact test), Q value = 0.18
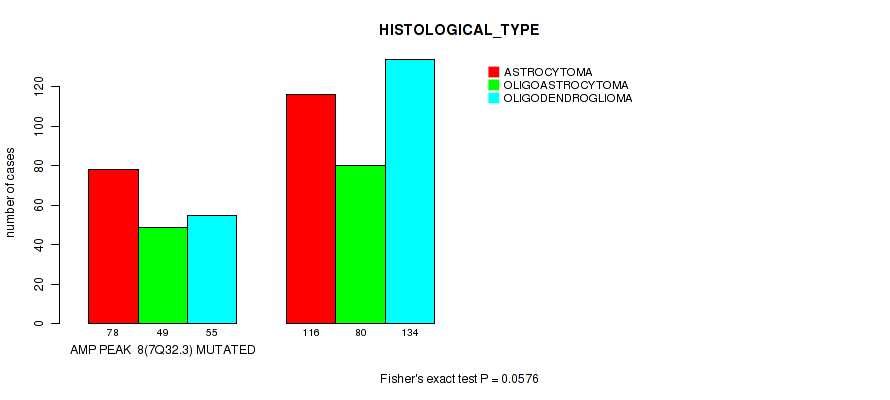
Table S32. Gene #8: 'amp_7q32.3' versus Clinical Feature #6: 'HISTOLOGICAL_TYPE'
| nPatients | ASTROCYTOMA | OLIGOASTROCYTOMA | OLIGODENDROGLIOMA |
|---|---|---|---|
| ALL | 194 | 129 | 189 |
| AMP PEAK 8(7Q32.3) MUTATED | 78 | 49 | 55 |
| AMP PEAK 8(7Q32.3) WILD-TYPE | 116 | 80 | 134 |
Figure S32. Get High-res Image Gene #8: 'amp_7q32.3' versus Clinical Feature #6: 'HISTOLOGICAL_TYPE'
P value = 0.0177 (Fisher's exact test), Q value = 0.07
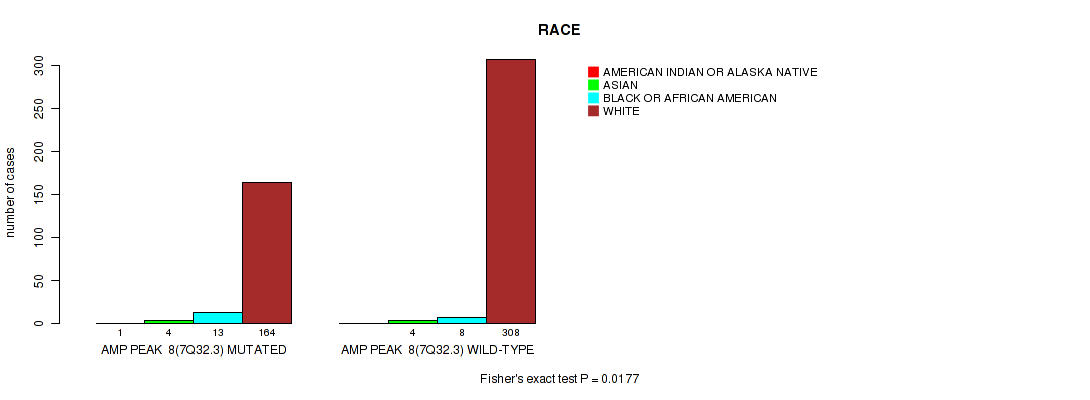
Table S33. Gene #8: 'amp_7q32.3' versus Clinical Feature #7: 'RACE'
| nPatients | AMERICAN INDIAN OR ALASKA NATIVE | ASIAN | BLACK OR AFRICAN AMERICAN | WHITE |
|---|---|---|---|---|
| ALL | 1 | 8 | 21 | 472 |
| AMP PEAK 8(7Q32.3) MUTATED | 1 | 4 | 13 | 164 |
| AMP PEAK 8(7Q32.3) WILD-TYPE | 0 | 4 | 8 | 308 |
Figure S33. Get High-res Image Gene #8: 'amp_7q32.3' versus Clinical Feature #7: 'RACE'
P value = 0.0203 (Wilcoxon-test), Q value = 0.078
Table S34. Gene #9: 'amp_8q24.13' versus Clinical Feature #2: 'YEARS_TO_BIRTH'
| nPatients | Mean (Std.Dev) | |
|---|---|---|
| ALL | 511 | 43.0 (13.3) |
| AMP PEAK 9(8Q24.13) MUTATED | 100 | 40.4 (13.0) |
| AMP PEAK 9(8Q24.13) WILD-TYPE | 411 | 43.6 (13.4) |
Figure S34. Get High-res Image Gene #9: 'amp_8q24.13' versus Clinical Feature #2: 'YEARS_TO_BIRTH'
P value = 0.00663 (Fisher's exact test), Q value = 0.033
Table S35. Gene #9: 'amp_8q24.13' versus Clinical Feature #4: 'RADIATION_THERAPY'
| nPatients | NO | YES |
|---|---|---|
| ALL | 184 | 293 |
| AMP PEAK 9(8Q24.13) MUTATED | 25 | 70 |
| AMP PEAK 9(8Q24.13) WILD-TYPE | 159 | 223 |
Figure S35. Get High-res Image Gene #9: 'amp_8q24.13' versus Clinical Feature #4: 'RADIATION_THERAPY'
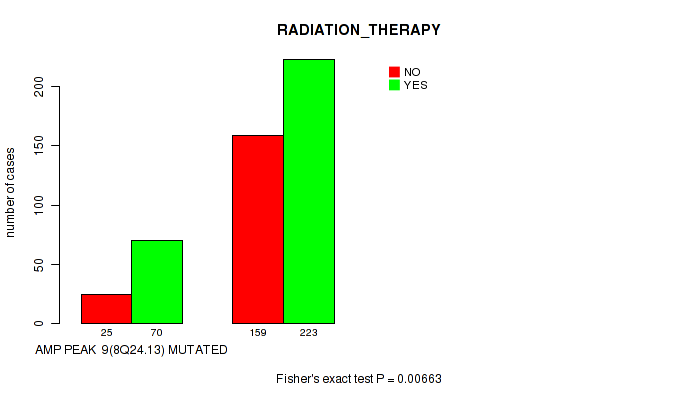
P value = 0.00401 (Fisher's exact test), Q value = 0.021
Table S36. Gene #9: 'amp_8q24.13' versus Clinical Feature #6: 'HISTOLOGICAL_TYPE'
| nPatients | ASTROCYTOMA | OLIGOASTROCYTOMA | OLIGODENDROGLIOMA |
|---|---|---|---|
| ALL | 194 | 129 | 189 |
| AMP PEAK 9(8Q24.13) MUTATED | 48 | 29 | 23 |
| AMP PEAK 9(8Q24.13) WILD-TYPE | 146 | 100 | 166 |
Figure S36. Get High-res Image Gene #9: 'amp_8q24.13' versus Clinical Feature #6: 'HISTOLOGICAL_TYPE'
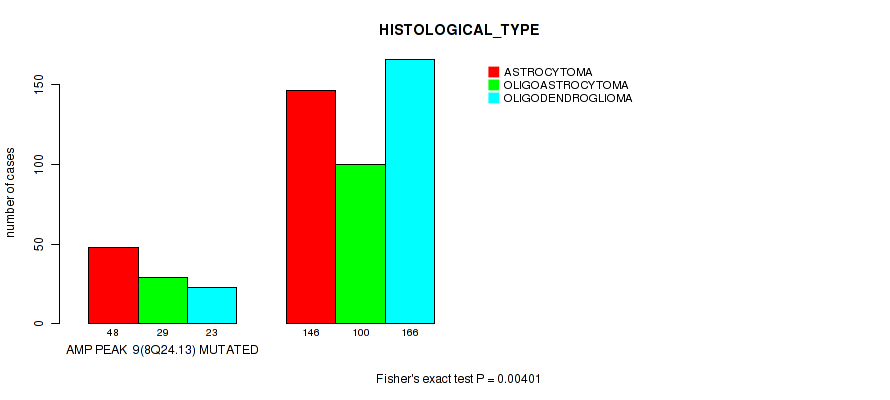
P value = 0.00485 (Fisher's exact test), Q value = 0.025
Table S37. Gene #10: 'amp_9q34.3' versus Clinical Feature #4: 'RADIATION_THERAPY'
| nPatients | NO | YES |
|---|---|---|
| ALL | 184 | 293 |
| AMP PEAK 10(9Q34.3) MUTATED | 8 | 35 |
| AMP PEAK 10(9Q34.3) WILD-TYPE | 176 | 258 |
Figure S37. Get High-res Image Gene #10: 'amp_9q34.3' versus Clinical Feature #4: 'RADIATION_THERAPY'
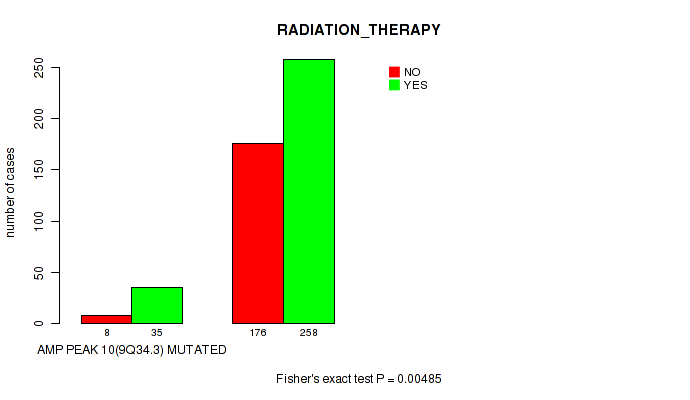
P value = 0.0239 (Fisher's exact test), Q value = 0.089
Table S38. Gene #10: 'amp_9q34.3' versus Clinical Feature #6: 'HISTOLOGICAL_TYPE'
| nPatients | ASTROCYTOMA | OLIGOASTROCYTOMA | OLIGODENDROGLIOMA |
|---|---|---|---|
| ALL | 194 | 129 | 189 |
| AMP PEAK 10(9Q34.3) MUTATED | 24 | 13 | 9 |
| AMP PEAK 10(9Q34.3) WILD-TYPE | 170 | 116 | 180 |
Figure S38. Get High-res Image Gene #10: 'amp_9q34.3' versus Clinical Feature #6: 'HISTOLOGICAL_TYPE'
P value = 0.000195 (Wilcoxon-test), Q value = 0.0017
Table S39. Gene #11: 'amp_10p15.3' versus Clinical Feature #2: 'YEARS_TO_BIRTH'
| nPatients | Mean (Std.Dev) | |
|---|---|---|
| ALL | 511 | 43.0 (13.3) |
| AMP PEAK 11(10P15.3) MUTATED | 71 | 37.0 (10.3) |
| AMP PEAK 11(10P15.3) WILD-TYPE | 440 | 44.0 (13.5) |
Figure S39. Get High-res Image Gene #11: 'amp_10p15.3' versus Clinical Feature #2: 'YEARS_TO_BIRTH'
P value = 0.0596 (Fisher's exact test), Q value = 0.18
Table S40. Gene #11: 'amp_10p15.3' versus Clinical Feature #4: 'RADIATION_THERAPY'
| nPatients | NO | YES |
|---|---|---|
| ALL | 184 | 293 |
| AMP PEAK 11(10P15.3) MUTATED | 19 | 49 |
| AMP PEAK 11(10P15.3) WILD-TYPE | 165 | 244 |
Figure S40. Get High-res Image Gene #11: 'amp_10p15.3' versus Clinical Feature #4: 'RADIATION_THERAPY'

P value = 1e-05 (Fisher's exact test), Q value = 0.00015
Table S41. Gene #11: 'amp_10p15.3' versus Clinical Feature #6: 'HISTOLOGICAL_TYPE'
| nPatients | ASTROCYTOMA | OLIGOASTROCYTOMA | OLIGODENDROGLIOMA |
|---|---|---|---|
| ALL | 194 | 129 | 189 |
| AMP PEAK 11(10P15.3) MUTATED | 38 | 24 | 9 |
| AMP PEAK 11(10P15.3) WILD-TYPE | 156 | 105 | 180 |
Figure S41. Get High-res Image Gene #11: 'amp_10p15.3' versus Clinical Feature #6: 'HISTOLOGICAL_TYPE'
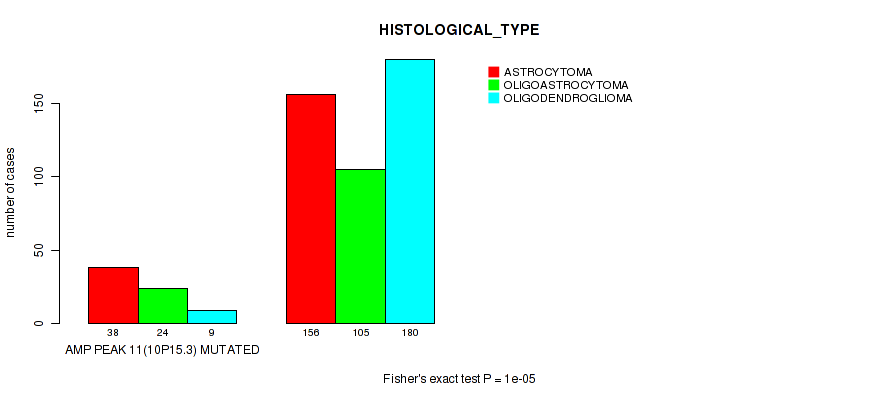
P value = 0.0366 (Wilcoxon-test), Q value = 0.12
Table S42. Gene #13: 'amp_12p13.32' versus Clinical Feature #2: 'YEARS_TO_BIRTH'
| nPatients | Mean (Std.Dev) | |
|---|---|---|
| ALL | 511 | 43.0 (13.3) |
| AMP PEAK 13(12P13.32) MUTATED | 72 | 40.4 (12.9) |
| AMP PEAK 13(12P13.32) WILD-TYPE | 439 | 43.4 (13.4) |
Figure S42. Get High-res Image Gene #13: 'amp_12p13.32' versus Clinical Feature #2: 'YEARS_TO_BIRTH'
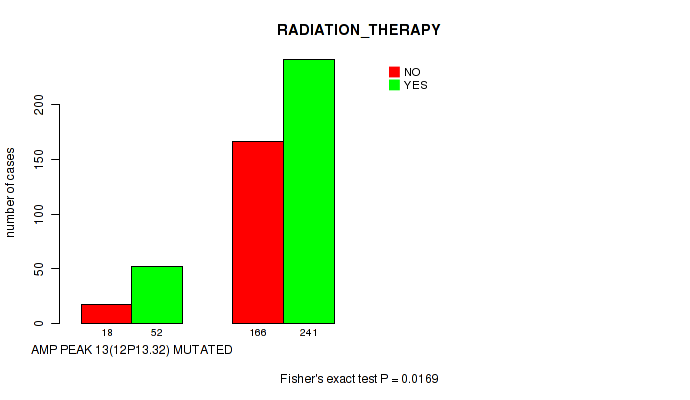
P value = 0.0169 (Fisher's exact test), Q value = 0.069
Table S43. Gene #13: 'amp_12p13.32' versus Clinical Feature #4: 'RADIATION_THERAPY'
| nPatients | NO | YES |
|---|---|---|
| ALL | 184 | 293 |
| AMP PEAK 13(12P13.32) MUTATED | 18 | 52 |
| AMP PEAK 13(12P13.32) WILD-TYPE | 166 | 241 |
Figure S43. Get High-res Image Gene #13: 'amp_12p13.32' versus Clinical Feature #4: 'RADIATION_THERAPY'
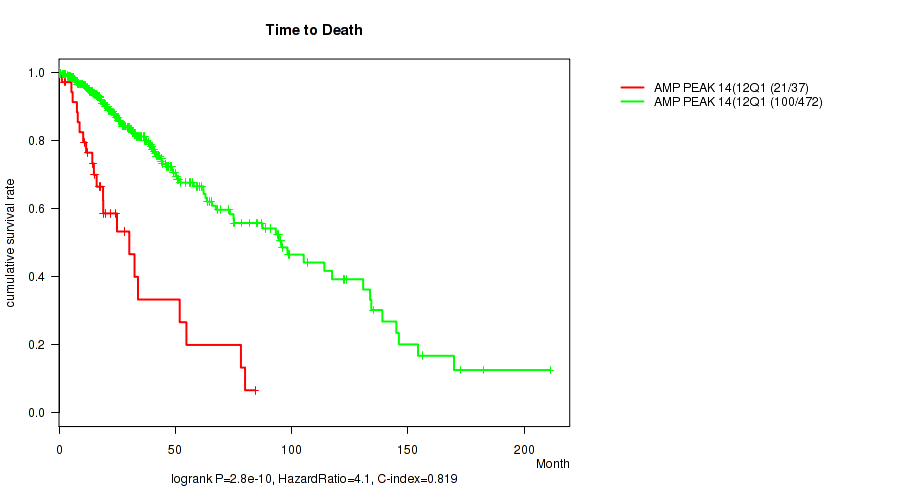
P value = 2.8e-10 (logrank test), Q value = 2.3e-08
Table S44. Gene #14: 'amp_12q14.1' versus Clinical Feature #1: 'Time to Death'
| nPatients | nDeath | Duration Range (Median), Month | |
|---|---|---|---|
| ALL | 509 | 121 | 0.0 - 211.2 (20.8) |
| AMP PEAK 14(12Q14.1) MUTATED | 37 | 21 | 0.2 - 84.3 (17.5) |
| AMP PEAK 14(12Q14.1) WILD-TYPE | 472 | 100 | 0.0 - 211.2 (21.4) |
Figure S44. Get High-res Image Gene #14: 'amp_12q14.1' versus Clinical Feature #1: 'Time to Death'
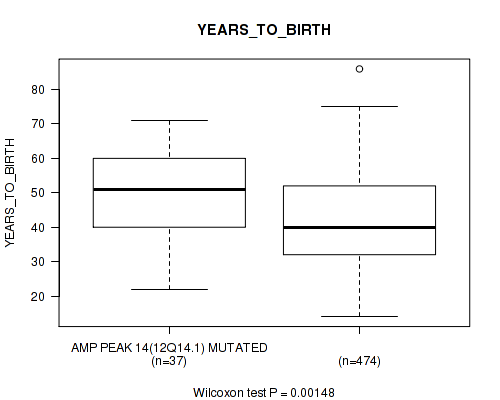
P value = 0.00148 (Wilcoxon-test), Q value = 0.0091
Table S45. Gene #14: 'amp_12q14.1' versus Clinical Feature #2: 'YEARS_TO_BIRTH'
| nPatients | Mean (Std.Dev) | |
|---|---|---|
| ALL | 511 | 43.0 (13.3) |
| AMP PEAK 14(12Q14.1) MUTATED | 37 | 50.2 (14.3) |
| AMP PEAK 14(12Q14.1) WILD-TYPE | 474 | 42.4 (13.1) |
Figure S45. Get High-res Image Gene #14: 'amp_12q14.1' versus Clinical Feature #2: 'YEARS_TO_BIRTH'
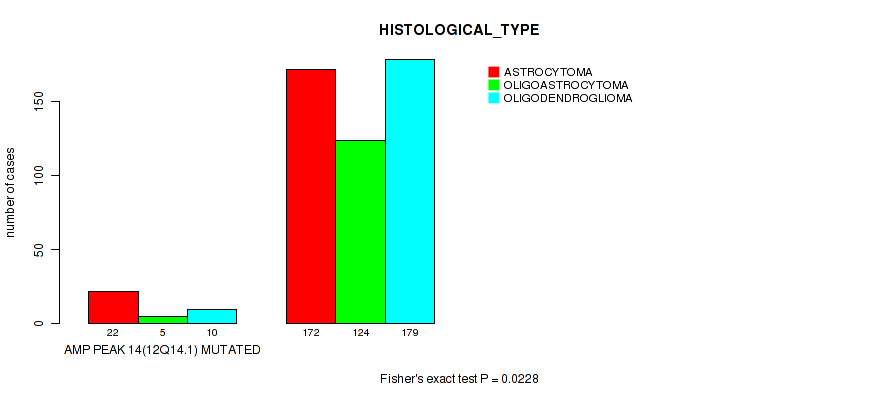
P value = 0.0192 (Fisher's exact test), Q value = 0.075
Table S46. Gene #14: 'amp_12q14.1' versus Clinical Feature #4: 'RADIATION_THERAPY'
| nPatients | NO | YES |
|---|---|---|
| ALL | 184 | 293 |
| AMP PEAK 14(12Q14.1) MUTATED | 7 | 28 |
| AMP PEAK 14(12Q14.1) WILD-TYPE | 177 | 265 |
Figure S46. Get High-res Image Gene #14: 'amp_12q14.1' versus Clinical Feature #4: 'RADIATION_THERAPY'

P value = 0.0228 (Fisher's exact test), Q value = 0.087
Table S47. Gene #14: 'amp_12q14.1' versus Clinical Feature #6: 'HISTOLOGICAL_TYPE'
| nPatients | ASTROCYTOMA | OLIGOASTROCYTOMA | OLIGODENDROGLIOMA |
|---|---|---|---|
| ALL | 194 | 129 | 189 |
| AMP PEAK 14(12Q14.1) MUTATED | 22 | 5 | 10 |
| AMP PEAK 14(12Q14.1) WILD-TYPE | 172 | 124 | 179 |
Figure S47. Get High-res Image Gene #14: 'amp_12q14.1' versus Clinical Feature #6: 'HISTOLOGICAL_TYPE'
P value = 0.0455 (Wilcoxon-test), Q value = 0.15
Table S48. Gene #15: 'amp_13q34' versus Clinical Feature #5: 'KARNOFSKY_PERFORMANCE_SCORE'
| nPatients | Mean (Std.Dev) | |
|---|---|---|
| ALL | 306 | 86.6 (12.6) |
| AMP PEAK 15(13Q34) MUTATED | 14 | 77.1 (18.6) |
| AMP PEAK 15(13Q34) WILD-TYPE | 292 | 87.1 (12.1) |
Figure S48. Get High-res Image Gene #15: 'amp_13q34' versus Clinical Feature #5: 'KARNOFSKY_PERFORMANCE_SCORE'
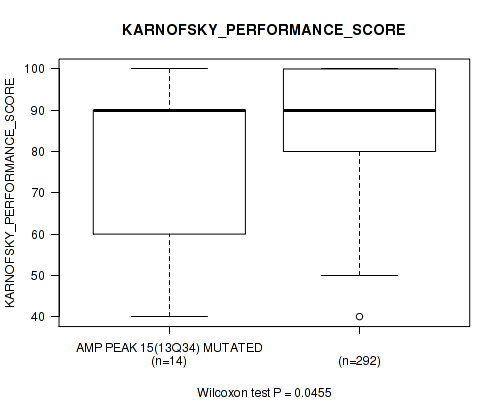
P value = 6.15e-05 (logrank test), Q value = 0.00069
Table S49. Gene #16: 'amp_15q26.3' versus Clinical Feature #1: 'Time to Death'
| nPatients | nDeath | Duration Range (Median), Month | |
|---|---|---|---|
| ALL | 509 | 121 | 0.0 - 211.2 (20.8) |
| AMP PEAK 16(15Q26.3) MUTATED | 19 | 11 | 2.4 - 51.9 (24.9) |
| AMP PEAK 16(15Q26.3) WILD-TYPE | 490 | 110 | 0.0 - 211.2 (20.8) |
Figure S49. Get High-res Image Gene #16: 'amp_15q26.3' versus Clinical Feature #1: 'Time to Death'
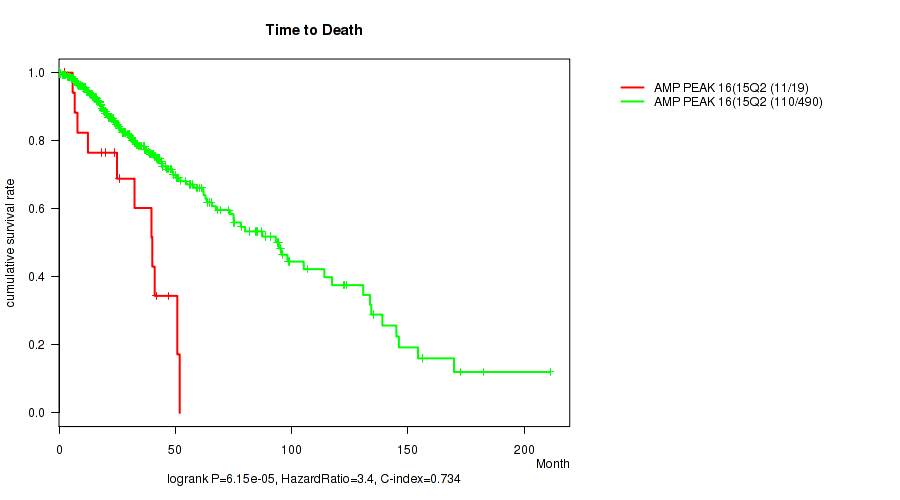
P value = 0.026 (logrank test), Q value = 0.095
Table S50. Gene #17: 'amp_17q25.1' versus Clinical Feature #1: 'Time to Death'
| nPatients | nDeath | Duration Range (Median), Month | |
|---|---|---|---|
| ALL | 509 | 121 | 0.0 - 211.2 (20.8) |
| AMP PEAK 17(17Q25.1) MUTATED | 43 | 14 | 0.2 - 85.5 (21.0) |
| AMP PEAK 17(17Q25.1) WILD-TYPE | 466 | 107 | 0.0 - 211.2 (20.8) |
Figure S50. Get High-res Image Gene #17: 'amp_17q25.1' versus Clinical Feature #1: 'Time to Death'
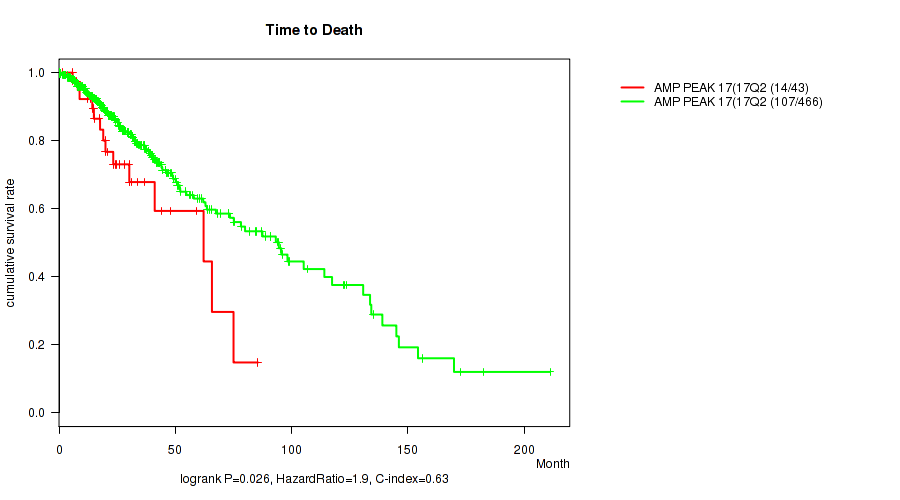
P value = 0.0334 (Wilcoxon-test), Q value = 0.12
Table S51. Gene #17: 'amp_17q25.1' versus Clinical Feature #2: 'YEARS_TO_BIRTH'
| nPatients | Mean (Std.Dev) | |
|---|---|---|
| ALL | 511 | 43.0 (13.3) |
| AMP PEAK 17(17Q25.1) MUTATED | 43 | 46.7 (12.4) |
| AMP PEAK 17(17Q25.1) WILD-TYPE | 468 | 42.7 (13.4) |
Figure S51. Get High-res Image Gene #17: 'amp_17q25.1' versus Clinical Feature #2: 'YEARS_TO_BIRTH'
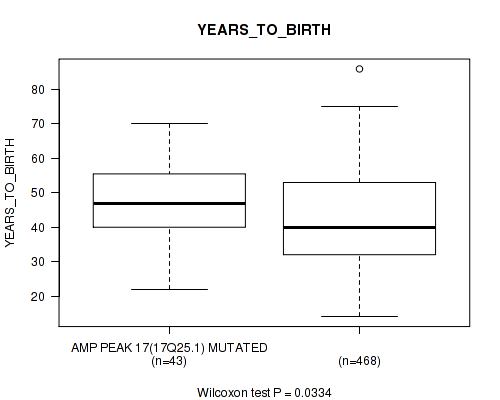
P value = 0.0347 (Wilcoxon-test), Q value = 0.12
Table S52. Gene #18: 'amp_19p13.3' versus Clinical Feature #2: 'YEARS_TO_BIRTH'
| nPatients | Mean (Std.Dev) | |
|---|---|---|
| ALL | 511 | 43.0 (13.3) |
| AMP PEAK 18(19P13.3) MUTATED | 128 | 45.1 (13.8) |
| AMP PEAK 18(19P13.3) WILD-TYPE | 383 | 42.3 (13.1) |
Figure S52. Get High-res Image Gene #18: 'amp_19p13.3' versus Clinical Feature #2: 'YEARS_TO_BIRTH'

P value = 0.00489 (Fisher's exact test), Q value = 0.025
Table S53. Gene #18: 'amp_19p13.3' versus Clinical Feature #4: 'RADIATION_THERAPY'
| nPatients | NO | YES |
|---|---|---|
| ALL | 184 | 293 |
| AMP PEAK 18(19P13.3) MUTATED | 60 | 61 |
| AMP PEAK 18(19P13.3) WILD-TYPE | 124 | 232 |
Figure S53. Get High-res Image Gene #18: 'amp_19p13.3' versus Clinical Feature #4: 'RADIATION_THERAPY'

P value = 1e-05 (Fisher's exact test), Q value = 0.00015
Table S54. Gene #18: 'amp_19p13.3' versus Clinical Feature #6: 'HISTOLOGICAL_TYPE'
| nPatients | ASTROCYTOMA | OLIGOASTROCYTOMA | OLIGODENDROGLIOMA |
|---|---|---|---|
| ALL | 194 | 129 | 189 |
| AMP PEAK 18(19P13.3) MUTATED | 26 | 29 | 74 |
| AMP PEAK 18(19P13.3) WILD-TYPE | 168 | 100 | 115 |
Figure S54. Get High-res Image Gene #18: 'amp_19p13.3' versus Clinical Feature #6: 'HISTOLOGICAL_TYPE'
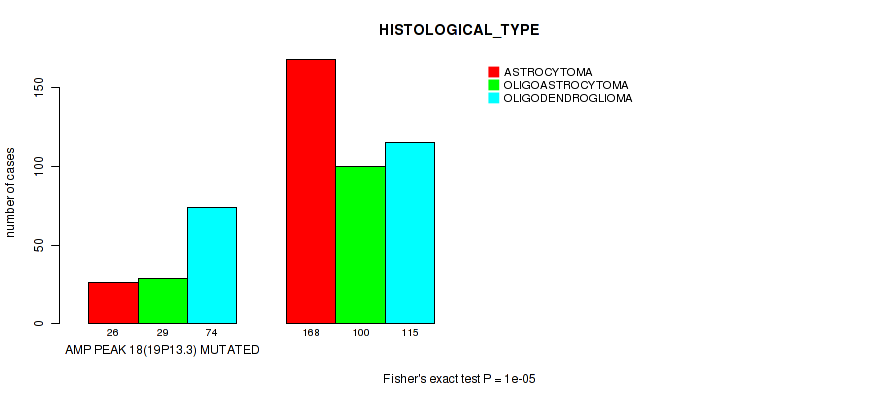
P value = 0.00919 (Wilcoxon-test), Q value = 0.042
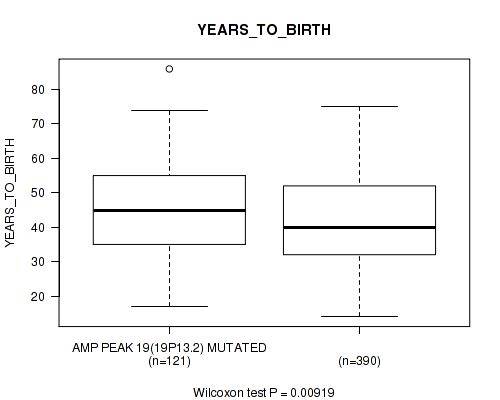
Table S55. Gene #19: 'amp_19p13.2' versus Clinical Feature #2: 'YEARS_TO_BIRTH'
| nPatients | Mean (Std.Dev) | |
|---|---|---|
| ALL | 511 | 43.0 (13.3) |
| AMP PEAK 19(19P13.2) MUTATED | 121 | 45.9 (13.7) |
| AMP PEAK 19(19P13.2) WILD-TYPE | 390 | 42.1 (13.1) |
Figure S55. Get High-res Image Gene #19: 'amp_19p13.2' versus Clinical Feature #2: 'YEARS_TO_BIRTH'
P value = 0.011 (Fisher's exact test), Q value = 0.049
Table S56. Gene #19: 'amp_19p13.2' versus Clinical Feature #4: 'RADIATION_THERAPY'
| nPatients | NO | YES |
|---|---|---|
| ALL | 184 | 293 |
| AMP PEAK 19(19P13.2) MUTATED | 56 | 58 |
| AMP PEAK 19(19P13.2) WILD-TYPE | 128 | 235 |
Figure S56. Get High-res Image Gene #19: 'amp_19p13.2' versus Clinical Feature #4: 'RADIATION_THERAPY'
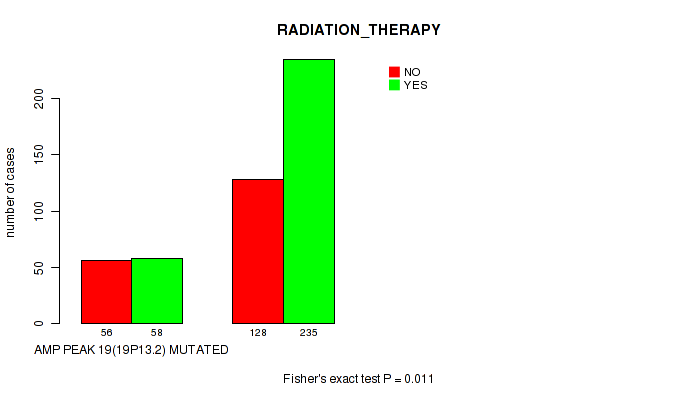
P value = 1e-05 (Fisher's exact test), Q value = 0.00015
Table S57. Gene #19: 'amp_19p13.2' versus Clinical Feature #6: 'HISTOLOGICAL_TYPE'
| nPatients | ASTROCYTOMA | OLIGOASTROCYTOMA | OLIGODENDROGLIOMA |
|---|---|---|---|
| ALL | 194 | 129 | 189 |
| AMP PEAK 19(19P13.2) MUTATED | 24 | 25 | 73 |
| AMP PEAK 19(19P13.2) WILD-TYPE | 170 | 104 | 116 |
Figure S57. Get High-res Image Gene #19: 'amp_19p13.2' versus Clinical Feature #6: 'HISTOLOGICAL_TYPE'
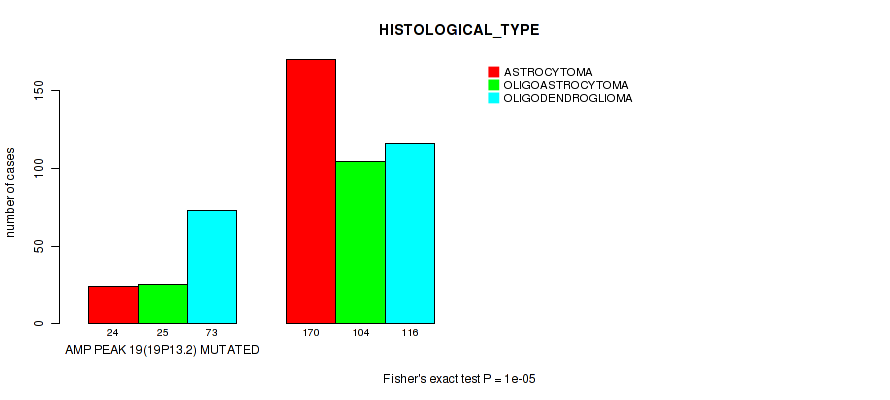
P value = 0.000632 (Fisher's exact test), Q value = 0.0044
Table S58. Gene #20: 'amp_xp11.22' versus Clinical Feature #4: 'RADIATION_THERAPY'
| nPatients | NO | YES |
|---|---|---|
| ALL | 184 | 293 |
| AMP PEAK 20(XP11.22) MUTATED | 7 | 38 |
| AMP PEAK 20(XP11.22) WILD-TYPE | 177 | 255 |
Figure S58. Get High-res Image Gene #20: 'amp_xp11.22' versus Clinical Feature #4: 'RADIATION_THERAPY'

P value = 0.00239 (Fisher's exact test), Q value = 0.014
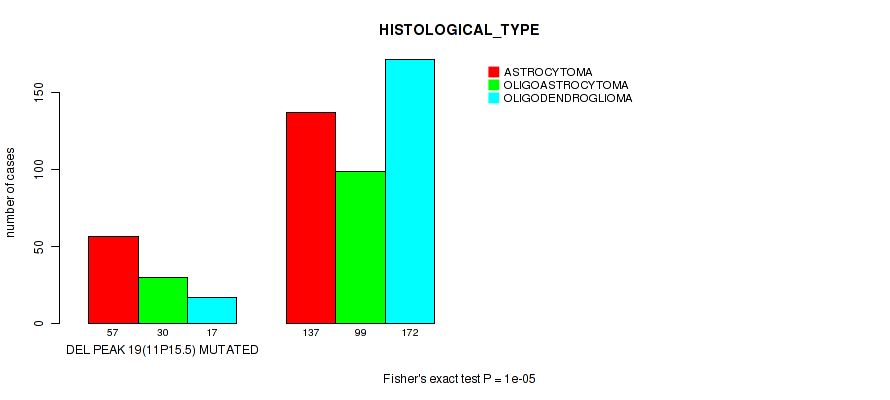
Table S59. Gene #20: 'amp_xp11.22' versus Clinical Feature #6: 'HISTOLOGICAL_TYPE'
| nPatients | ASTROCYTOMA | OLIGOASTROCYTOMA | OLIGODENDROGLIOMA |
|---|---|---|---|
| ALL | 194 | 129 | 189 |
| AMP PEAK 20(XP11.22) MUTATED | 28 | 12 | 8 |
| AMP PEAK 20(XP11.22) WILD-TYPE | 166 | 117 | 181 |
Figure S59. Get High-res Image Gene #20: 'amp_xp11.22' versus Clinical Feature #6: 'HISTOLOGICAL_TYPE'

P value = 0.000578 (Fisher's exact test), Q value = 0.0041
Table S60. Gene #21: 'amp_xp11.22' versus Clinical Feature #4: 'RADIATION_THERAPY'
| nPatients | NO | YES |
|---|---|---|
| ALL | 184 | 293 |
| AMP PEAK 21(XP11.22) MUTATED | 11 | 48 |
| AMP PEAK 21(XP11.22) WILD-TYPE | 173 | 245 |
Figure S60. Get High-res Image Gene #21: 'amp_xp11.22' versus Clinical Feature #4: 'RADIATION_THERAPY'

P value = 1e-05 (Fisher's exact test), Q value = 0.00015
Table S61. Gene #21: 'amp_xp11.22' versus Clinical Feature #6: 'HISTOLOGICAL_TYPE'
| nPatients | ASTROCYTOMA | OLIGOASTROCYTOMA | OLIGODENDROGLIOMA |
|---|---|---|---|
| ALL | 194 | 129 | 189 |
| AMP PEAK 21(XP11.22) MUTATED | 39 | 15 | 9 |
| AMP PEAK 21(XP11.22) WILD-TYPE | 155 | 114 | 180 |
Figure S61. Get High-res Image Gene #21: 'amp_xp11.22' versus Clinical Feature #6: 'HISTOLOGICAL_TYPE'
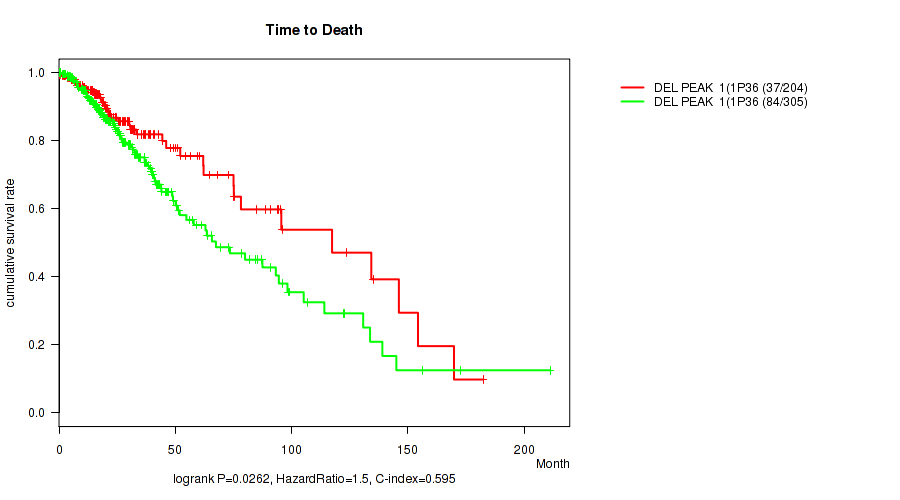
P value = 0.0262 (logrank test), Q value = 0.095
Table S62. Gene #22: 'del_1p36.32' versus Clinical Feature #1: 'Time to Death'
| nPatients | nDeath | Duration Range (Median), Month | |
|---|---|---|---|
| ALL | 509 | 121 | 0.0 - 211.2 (20.8) |
| DEL PEAK 1(1P36.32) MUTATED | 204 | 37 | 0.1 - 182.3 (20.6) |
| DEL PEAK 1(1P36.32) WILD-TYPE | 305 | 84 | 0.0 - 211.2 (21.0) |
Figure S62. Get High-res Image Gene #22: 'del_1p36.32' versus Clinical Feature #1: 'Time to Death'
P value = 8.3e-07 (Wilcoxon-test), Q value = 3.1e-05
Table S63. Gene #22: 'del_1p36.32' versus Clinical Feature #2: 'YEARS_TO_BIRTH'
| nPatients | Mean (Std.Dev) | |
|---|---|---|
| ALL | 511 | 43.0 (13.3) |
| DEL PEAK 1(1P36.32) MUTATED | 205 | 46.3 (12.8) |
| DEL PEAK 1(1P36.32) WILD-TYPE | 306 | 40.7 (13.3) |
Figure S63. Get High-res Image Gene #22: 'del_1p36.32' versus Clinical Feature #2: 'YEARS_TO_BIRTH'

P value = 1.48e-05 (Fisher's exact test), Q value = 0.00021
Table S64. Gene #22: 'del_1p36.32' versus Clinical Feature #4: 'RADIATION_THERAPY'
| nPatients | NO | YES |
|---|---|---|
| ALL | 184 | 293 |
| DEL PEAK 1(1P36.32) MUTATED | 97 | 95 |
| DEL PEAK 1(1P36.32) WILD-TYPE | 87 | 198 |
Figure S64. Get High-res Image Gene #22: 'del_1p36.32' versus Clinical Feature #4: 'RADIATION_THERAPY'
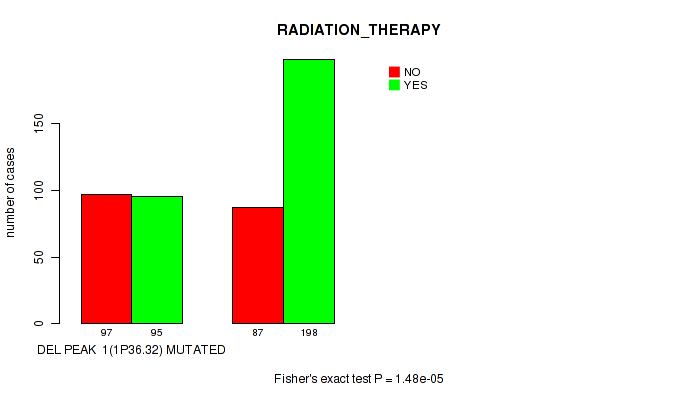
P value = 1e-05 (Fisher's exact test), Q value = 0.00015
Table S65. Gene #22: 'del_1p36.32' versus Clinical Feature #6: 'HISTOLOGICAL_TYPE'
| nPatients | ASTROCYTOMA | OLIGOASTROCYTOMA | OLIGODENDROGLIOMA |
|---|---|---|---|
| ALL | 194 | 129 | 189 |
| DEL PEAK 1(1P36.32) MUTATED | 22 | 46 | 138 |
| DEL PEAK 1(1P36.32) WILD-TYPE | 172 | 83 | 51 |
Figure S65. Get High-res Image Gene #22: 'del_1p36.32' versus Clinical Feature #6: 'HISTOLOGICAL_TYPE'
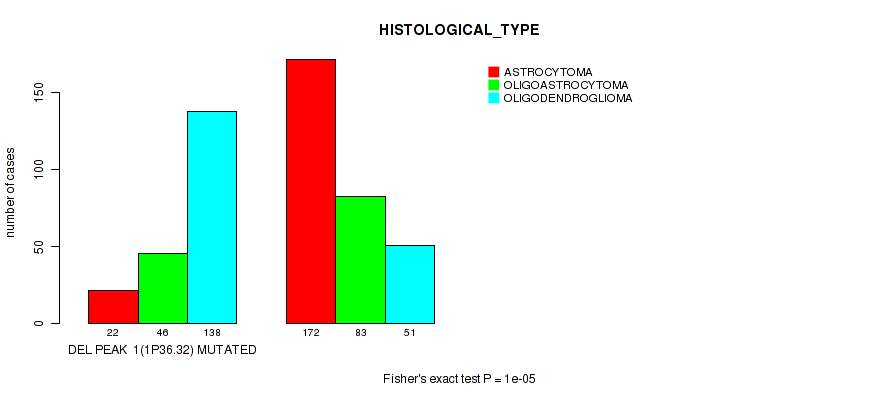
P value = 0.00317 (logrank test), Q value = 0.017
Table S66. Gene #23: 'del_1p32.3' versus Clinical Feature #1: 'Time to Death'
| nPatients | nDeath | Duration Range (Median), Month | |
|---|---|---|---|
| ALL | 509 | 121 | 0.0 - 211.2 (20.8) |
| DEL PEAK 2(1P32.3) MUTATED | 194 | 32 | 0.1 - 182.3 (21.4) |
| DEL PEAK 2(1P32.3) WILD-TYPE | 315 | 89 | 0.0 - 211.2 (20.8) |
Figure S66. Get High-res Image Gene #23: 'del_1p32.3' versus Clinical Feature #1: 'Time to Death'
P value = 5.46e-06 (Wilcoxon-test), Q value = 0.00013
Table S67. Gene #23: 'del_1p32.3' versus Clinical Feature #2: 'YEARS_TO_BIRTH'
| nPatients | Mean (Std.Dev) | |
|---|---|---|
| ALL | 511 | 43.0 (13.3) |
| DEL PEAK 2(1P32.3) MUTATED | 195 | 46.3 (13.1) |
| DEL PEAK 2(1P32.3) WILD-TYPE | 316 | 40.9 (13.1) |
Figure S67. Get High-res Image Gene #23: 'del_1p32.3' versus Clinical Feature #2: 'YEARS_TO_BIRTH'

P value = 1.07e-06 (Fisher's exact test), Q value = 3.7e-05
Table S68. Gene #23: 'del_1p32.3' versus Clinical Feature #4: 'RADIATION_THERAPY'
| nPatients | NO | YES |
|---|---|---|
| ALL | 184 | 293 |
| DEL PEAK 2(1P32.3) MUTATED | 95 | 85 |
| DEL PEAK 2(1P32.3) WILD-TYPE | 89 | 208 |
Figure S68. Get High-res Image Gene #23: 'del_1p32.3' versus Clinical Feature #4: 'RADIATION_THERAPY'
P value = 1e-05 (Fisher's exact test), Q value = 0.00015
Table S69. Gene #23: 'del_1p32.3' versus Clinical Feature #6: 'HISTOLOGICAL_TYPE'
| nPatients | ASTROCYTOMA | OLIGOASTROCYTOMA | OLIGODENDROGLIOMA |
|---|---|---|---|
| ALL | 194 | 129 | 189 |
| DEL PEAK 2(1P32.3) MUTATED | 16 | 42 | 138 |
| DEL PEAK 2(1P32.3) WILD-TYPE | 178 | 87 | 51 |
Figure S69. Get High-res Image Gene #23: 'del_1p32.3' versus Clinical Feature #6: 'HISTOLOGICAL_TYPE'
P value = 0.0779 (Wilcoxon-test), Q value = 0.23
Table S70. Gene #25: 'del_2q37.3' versus Clinical Feature #2: 'YEARS_TO_BIRTH'
| nPatients | Mean (Std.Dev) | |
|---|---|---|
| ALL | 511 | 43.0 (13.3) |
| DEL PEAK 4(2Q37.3) MUTATED | 77 | 40.8 (13.3) |
| DEL PEAK 4(2Q37.3) WILD-TYPE | 434 | 43.4 (13.3) |
Figure S70. Get High-res Image Gene #25: 'del_2q37.3' versus Clinical Feature #2: 'YEARS_TO_BIRTH'
P value = 0.0169 (Fisher's exact test), Q value = 0.069
Table S71. Gene #25: 'del_2q37.3' versus Clinical Feature #4: 'RADIATION_THERAPY'
| nPatients | NO | YES |
|---|---|---|
| ALL | 184 | 293 |
| DEL PEAK 4(2Q37.3) MUTATED | 18 | 53 |
| DEL PEAK 4(2Q37.3) WILD-TYPE | 166 | 240 |
Figure S71. Get High-res Image Gene #25: 'del_2q37.3' versus Clinical Feature #4: 'RADIATION_THERAPY'

P value = 0.01 (Fisher's exact test), Q value = 0.045
Table S72. Gene #25: 'del_2q37.3' versus Clinical Feature #6: 'HISTOLOGICAL_TYPE'
| nPatients | ASTROCYTOMA | OLIGOASTROCYTOMA | OLIGODENDROGLIOMA |
|---|---|---|---|
| ALL | 194 | 129 | 189 |
| DEL PEAK 4(2Q37.3) MUTATED | 37 | 23 | 17 |
| DEL PEAK 4(2Q37.3) WILD-TYPE | 157 | 106 | 172 |
Figure S72. Get High-res Image Gene #25: 'del_2q37.3' versus Clinical Feature #6: 'HISTOLOGICAL_TYPE'
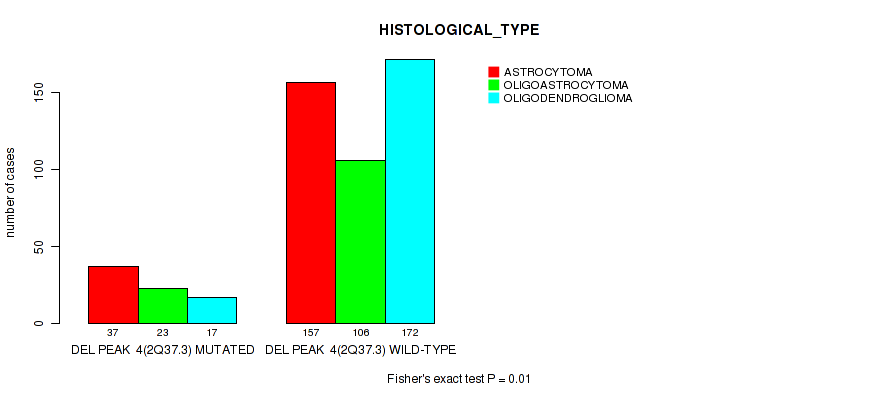
P value = 0.00275 (Fisher's exact test), Q value = 0.015
Table S73. Gene #26: 'del_3p21.31' versus Clinical Feature #4: 'RADIATION_THERAPY'
| nPatients | NO | YES |
|---|---|---|
| ALL | 184 | 293 |
| DEL PEAK 5(3P21.31) MUTATED | 9 | 39 |
| DEL PEAK 5(3P21.31) WILD-TYPE | 175 | 254 |
Figure S73. Get High-res Image Gene #26: 'del_3p21.31' versus Clinical Feature #4: 'RADIATION_THERAPY'
P value = 0.0242 (Wilcoxon-test), Q value = 0.09
Table S74. Gene #26: 'del_3p21.31' versus Clinical Feature #5: 'KARNOFSKY_PERFORMANCE_SCORE'
| nPatients | Mean (Std.Dev) | |
|---|---|---|
| ALL | 306 | 86.6 (12.6) |
| DEL PEAK 5(3P21.31) MUTATED | 32 | 81.2 (15.4) |
| DEL PEAK 5(3P21.31) WILD-TYPE | 274 | 87.3 (12.1) |
Figure S74. Get High-res Image Gene #26: 'del_3p21.31' versus Clinical Feature #5: 'KARNOFSKY_PERFORMANCE_SCORE'

P value = 0.0168 (logrank test), Q value = 0.069
Table S75. Gene #27: 'del_3q13.31' versus Clinical Feature #1: 'Time to Death'
| nPatients | nDeath | Duration Range (Median), Month | |
|---|---|---|---|
| ALL | 509 | 121 | 0.0 - 211.2 (20.8) |
| DEL PEAK 6(3Q13.31) MUTATED | 39 | 16 | 0.2 - 117.4 (23.2) |
| DEL PEAK 6(3Q13.31) WILD-TYPE | 470 | 105 | 0.0 - 211.2 (20.7) |
Figure S75. Get High-res Image Gene #27: 'del_3q13.31' versus Clinical Feature #1: 'Time to Death'
P value = 0.0782 (Fisher's exact test), Q value = 0.23
Table S76. Gene #27: 'del_3q13.31' versus Clinical Feature #4: 'RADIATION_THERAPY'
| nPatients | NO | YES |
|---|---|---|
| ALL | 184 | 293 |
| DEL PEAK 6(3Q13.31) MUTATED | 9 | 28 |
| DEL PEAK 6(3Q13.31) WILD-TYPE | 175 | 265 |
Figure S76. Get High-res Image Gene #27: 'del_3q13.31' versus Clinical Feature #4: 'RADIATION_THERAPY'
P value = 0.0392 (logrank test), Q value = 0.13
Table S77. Gene #28: 'del_3q29' versus Clinical Feature #1: 'Time to Death'
| nPatients | nDeath | Duration Range (Median), Month | |
|---|---|---|---|
| ALL | 509 | 121 | 0.0 - 211.2 (20.8) |
| DEL PEAK 7(3Q29) MUTATED | 47 | 18 | 0.0 - 122.5 (24.2) |
| DEL PEAK 7(3Q29) WILD-TYPE | 462 | 103 | 0.1 - 211.2 (20.6) |
Figure S77. Get High-res Image Gene #28: 'del_3q29' versus Clinical Feature #1: 'Time to Death'

P value = 0.066 (Wilcoxon-test), Q value = 0.2
Table S78. Gene #28: 'del_3q29' versus Clinical Feature #5: 'KARNOFSKY_PERFORMANCE_SCORE'
| nPatients | Mean (Std.Dev) | |
|---|---|---|
| ALL | 306 | 86.6 (12.6) |
| DEL PEAK 7(3Q29) MUTATED | 33 | 82.7 (14.2) |
| DEL PEAK 7(3Q29) WILD-TYPE | 273 | 87.1 (12.3) |
Figure S78. Get High-res Image Gene #28: 'del_3q29' versus Clinical Feature #5: 'KARNOFSKY_PERFORMANCE_SCORE'

P value = 0.000101 (Fisher's exact test), Q value = 0.001
Table S79. Gene #30: 'del_5p15.33' versus Clinical Feature #4: 'RADIATION_THERAPY'
| nPatients | NO | YES |
|---|---|---|
| ALL | 184 | 293 |
| DEL PEAK 9(5P15.33) MUTATED | 6 | 40 |
| DEL PEAK 9(5P15.33) WILD-TYPE | 178 | 253 |
Figure S79. Get High-res Image Gene #30: 'del_5p15.33' versus Clinical Feature #4: 'RADIATION_THERAPY'

P value = 0.00218 (Fisher's exact test), Q value = 0.013
Table S80. Gene #30: 'del_5p15.33' versus Clinical Feature #6: 'HISTOLOGICAL_TYPE'
| nPatients | ASTROCYTOMA | OLIGOASTROCYTOMA | OLIGODENDROGLIOMA |
|---|---|---|---|
| ALL | 194 | 129 | 189 |
| DEL PEAK 9(5P15.33) MUTATED | 23 | 19 | 8 |
| DEL PEAK 9(5P15.33) WILD-TYPE | 171 | 110 | 181 |
Figure S80. Get High-res Image Gene #30: 'del_5p15.33' versus Clinical Feature #6: 'HISTOLOGICAL_TYPE'
P value = 0.000578 (Fisher's exact test), Q value = 0.0041
Table S81. Gene #31: 'del_5q34' versus Clinical Feature #4: 'RADIATION_THERAPY'
| nPatients | NO | YES |
|---|---|---|
| ALL | 184 | 293 |
| DEL PEAK 10(5Q34) MUTATED | 11 | 48 |
| DEL PEAK 10(5Q34) WILD-TYPE | 173 | 245 |
Figure S81. Get High-res Image Gene #31: 'del_5q34' versus Clinical Feature #4: 'RADIATION_THERAPY'
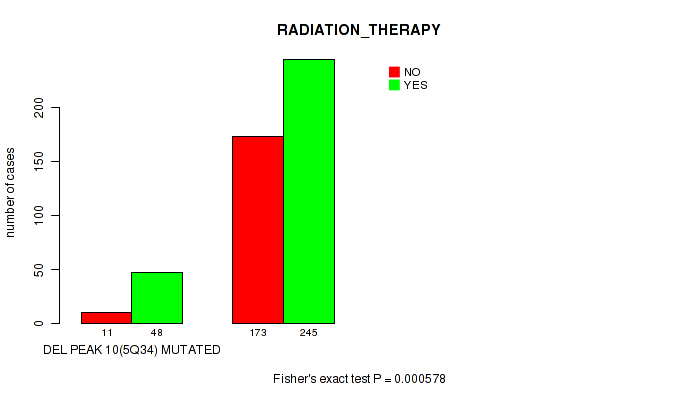
P value = 2e-05 (Fisher's exact test), Q value = 0.00024
Table S82. Gene #31: 'del_5q34' versus Clinical Feature #6: 'HISTOLOGICAL_TYPE'
| nPatients | ASTROCYTOMA | OLIGOASTROCYTOMA | OLIGODENDROGLIOMA |
|---|---|---|---|
| ALL | 194 | 129 | 189 |
| DEL PEAK 10(5Q34) MUTATED | 41 | 13 | 10 |
| DEL PEAK 10(5Q34) WILD-TYPE | 153 | 116 | 179 |
Figure S82. Get High-res Image Gene #31: 'del_5q34' versus Clinical Feature #6: 'HISTOLOGICAL_TYPE'

P value = 0.000202 (logrank test), Q value = 0.0017
Table S83. Gene #32: 'del_6p25.3' versus Clinical Feature #1: 'Time to Death'
| nPatients | nDeath | Duration Range (Median), Month | |
|---|---|---|---|
| ALL | 509 | 121 | 0.0 - 211.2 (20.8) |
| DEL PEAK 11(6P25.3) MUTATED | 49 | 21 | 0.2 - 145.1 (19.2) |
| DEL PEAK 11(6P25.3) WILD-TYPE | 460 | 100 | 0.0 - 211.2 (21.0) |
Figure S83. Get High-res Image Gene #32: 'del_6p25.3' versus Clinical Feature #1: 'Time to Death'
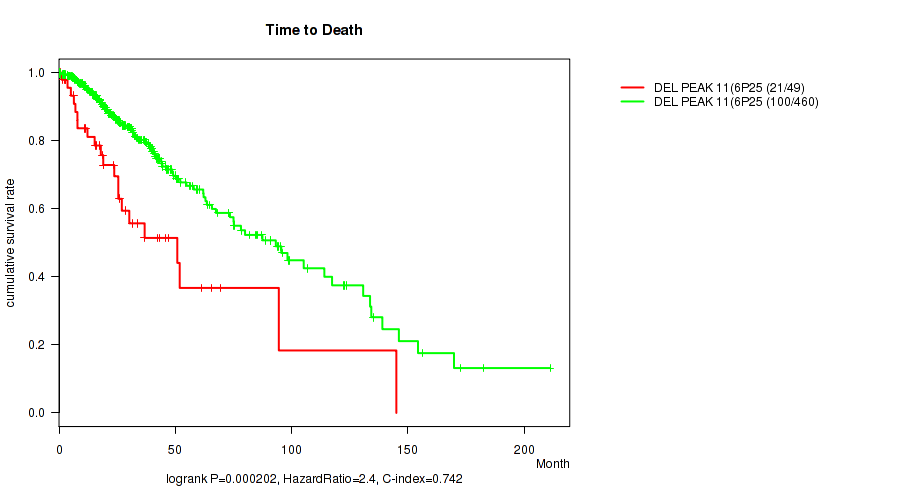
P value = 0.0176 (Wilcoxon-test), Q value = 0.07
Table S84. Gene #32: 'del_6p25.3' versus Clinical Feature #5: 'KARNOFSKY_PERFORMANCE_SCORE'
| nPatients | Mean (Std.Dev) | |
|---|---|---|
| ALL | 306 | 86.6 (12.6) |
| DEL PEAK 11(6P25.3) MUTATED | 35 | 82.6 (12.4) |
| DEL PEAK 11(6P25.3) WILD-TYPE | 271 | 87.2 (12.5) |
Figure S84. Get High-res Image Gene #32: 'del_6p25.3' versus Clinical Feature #5: 'KARNOFSKY_PERFORMANCE_SCORE'
P value = 4.4e-06 (logrank test), Q value = 0.00011
Table S85. Gene #33: 'del_6q22.31' versus Clinical Feature #1: 'Time to Death'
| nPatients | nDeath | Duration Range (Median), Month | |
|---|---|---|---|
| ALL | 509 | 121 | 0.0 - 211.2 (20.8) |
| DEL PEAK 12(6Q22.31) MUTATED | 76 | 28 | 0.1 - 117.4 (18.0) |
| DEL PEAK 12(6Q22.31) WILD-TYPE | 433 | 93 | 0.0 - 211.2 (21.5) |
Figure S85. Get High-res Image Gene #33: 'del_6q22.31' versus Clinical Feature #1: 'Time to Death'

P value = 0.0803 (Wilcoxon-test), Q value = 0.23
Table S86. Gene #33: 'del_6q22.31' versus Clinical Feature #2: 'YEARS_TO_BIRTH'
| nPatients | Mean (Std.Dev) | |
|---|---|---|
| ALL | 511 | 43.0 (13.3) |
| DEL PEAK 12(6Q22.31) MUTATED | 77 | 45.5 (13.8) |
| DEL PEAK 12(6Q22.31) WILD-TYPE | 434 | 42.5 (13.2) |
Figure S86. Get High-res Image Gene #33: 'del_6q22.31' versus Clinical Feature #2: 'YEARS_TO_BIRTH'
P value = 0.00682 (Fisher's exact test), Q value = 0.033
Table S87. Gene #33: 'del_6q22.31' versus Clinical Feature #4: 'RADIATION_THERAPY'
| nPatients | NO | YES |
|---|---|---|
| ALL | 184 | 293 |
| DEL PEAK 12(6Q22.31) MUTATED | 16 | 52 |
| DEL PEAK 12(6Q22.31) WILD-TYPE | 168 | 241 |
Figure S87. Get High-res Image Gene #33: 'del_6q22.31' versus Clinical Feature #4: 'RADIATION_THERAPY'

P value = 0.00106 (Wilcoxon-test), Q value = 0.0067
Table S88. Gene #33: 'del_6q22.31' versus Clinical Feature #5: 'KARNOFSKY_PERFORMANCE_SCORE'
| nPatients | Mean (Std.Dev) | |
|---|---|---|
| ALL | 306 | 86.6 (12.6) |
| DEL PEAK 12(6Q22.31) MUTATED | 51 | 81.4 (13.7) |
| DEL PEAK 12(6Q22.31) WILD-TYPE | 255 | 87.7 (12.1) |
Figure S88. Get High-res Image Gene #33: 'del_6q22.31' versus Clinical Feature #5: 'KARNOFSKY_PERFORMANCE_SCORE'
P value = 7e-05 (Fisher's exact test), Q value = 0.00075
Table S89. Gene #33: 'del_6q22.31' versus Clinical Feature #6: 'HISTOLOGICAL_TYPE'
| nPatients | ASTROCYTOMA | OLIGOASTROCYTOMA | OLIGODENDROGLIOMA |
|---|---|---|---|
| ALL | 194 | 129 | 189 |
| DEL PEAK 12(6Q22.31) MUTATED | 47 | 11 | 19 |
| DEL PEAK 12(6Q22.31) WILD-TYPE | 147 | 118 | 170 |
Figure S89. Get High-res Image Gene #33: 'del_6q22.31' versus Clinical Feature #6: 'HISTOLOGICAL_TYPE'

P value = 1.7e-05 (logrank test), Q value = 0.00023
Table S90. Gene #34: 'del_6q24.3' versus Clinical Feature #1: 'Time to Death'
| nPatients | nDeath | Duration Range (Median), Month | |
|---|---|---|---|
| ALL | 509 | 121 | 0.0 - 211.2 (20.8) |
| DEL PEAK 13(6Q24.3) MUTATED | 80 | 29 | 0.0 - 130.8 (18.0) |
| DEL PEAK 13(6Q24.3) WILD-TYPE | 429 | 92 | 0.1 - 211.2 (21.5) |
Figure S90. Get High-res Image Gene #34: 'del_6q24.3' versus Clinical Feature #1: 'Time to Death'
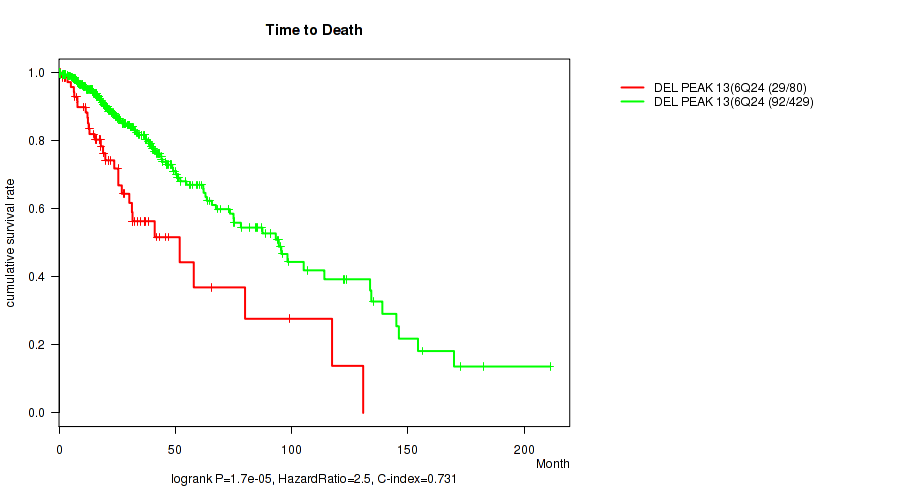
P value = 0.0251 (Fisher's exact test), Q value = 0.092
Table S91. Gene #34: 'del_6q24.3' versus Clinical Feature #4: 'RADIATION_THERAPY'
| nPatients | NO | YES |
|---|---|---|
| ALL | 184 | 293 |
| DEL PEAK 13(6Q24.3) MUTATED | 19 | 53 |
| DEL PEAK 13(6Q24.3) WILD-TYPE | 165 | 240 |
Figure S91. Get High-res Image Gene #34: 'del_6q24.3' versus Clinical Feature #4: 'RADIATION_THERAPY'

P value = 0.000703 (Wilcoxon-test), Q value = 0.0047
Table S92. Gene #34: 'del_6q24.3' versus Clinical Feature #5: 'KARNOFSKY_PERFORMANCE_SCORE'
| nPatients | Mean (Std.Dev) | |
|---|---|---|
| ALL | 306 | 86.6 (12.6) |
| DEL PEAK 13(6Q24.3) MUTATED | 52 | 81.3 (13.6) |
| DEL PEAK 13(6Q24.3) WILD-TYPE | 254 | 87.7 (12.1) |
Figure S92. Get High-res Image Gene #34: 'del_6q24.3' versus Clinical Feature #5: 'KARNOFSKY_PERFORMANCE_SCORE'
P value = 0.00012 (Fisher's exact test), Q value = 0.0011
Table S93. Gene #34: 'del_6q24.3' versus Clinical Feature #6: 'HISTOLOGICAL_TYPE'
| nPatients | ASTROCYTOMA | OLIGOASTROCYTOMA | OLIGODENDROGLIOMA |
|---|---|---|---|
| ALL | 194 | 129 | 189 |
| DEL PEAK 13(6Q24.3) MUTATED | 48 | 12 | 21 |
| DEL PEAK 13(6Q24.3) WILD-TYPE | 146 | 117 | 168 |
Figure S93. Get High-res Image Gene #34: 'del_6q24.3' versus Clinical Feature #6: 'HISTOLOGICAL_TYPE'
P value = 1.97e-06 (logrank test), Q value = 5.5e-05
Table S94. Gene #37: 'del_9p23' versus Clinical Feature #1: 'Time to Death'
| nPatients | nDeath | Duration Range (Median), Month | |
|---|---|---|---|
| ALL | 509 | 121 | 0.0 - 211.2 (20.8) |
| DEL PEAK 16(9P23) MUTATED | 148 | 52 | 0.1 - 169.8 (20.4) |
| DEL PEAK 16(9P23) WILD-TYPE | 361 | 69 | 0.0 - 211.2 (21.3) |
Figure S94. Get High-res Image Gene #37: 'del_9p23' versus Clinical Feature #1: 'Time to Death'
P value = 0.000504 (Wilcoxon-test), Q value = 0.0038
Table S95. Gene #37: 'del_9p23' versus Clinical Feature #2: 'YEARS_TO_BIRTH'
| nPatients | Mean (Std.Dev) | |
|---|---|---|
| ALL | 511 | 43.0 (13.3) |
| DEL PEAK 16(9P23) MUTATED | 148 | 46.2 (13.5) |
| DEL PEAK 16(9P23) WILD-TYPE | 363 | 41.7 (13.1) |
Figure S95. Get High-res Image Gene #37: 'del_9p23' versus Clinical Feature #2: 'YEARS_TO_BIRTH'
P value = 0.000111 (Fisher's exact test), Q value = 0.0011
Table S96. Gene #37: 'del_9p23' versus Clinical Feature #4: 'RADIATION_THERAPY'
| nPatients | NO | YES |
|---|---|---|
| ALL | 184 | 293 |
| DEL PEAK 16(9P23) MUTATED | 34 | 102 |
| DEL PEAK 16(9P23) WILD-TYPE | 150 | 191 |
Figure S96. Get High-res Image Gene #37: 'del_9p23' versus Clinical Feature #4: 'RADIATION_THERAPY'
P value = 0.000101 (Wilcoxon-test), Q value = 0.001
Table S97. Gene #37: 'del_9p23' versus Clinical Feature #5: 'KARNOFSKY_PERFORMANCE_SCORE'
| nPatients | Mean (Std.Dev) | |
|---|---|---|
| ALL | 306 | 86.6 (12.6) |
| DEL PEAK 16(9P23) MUTATED | 96 | 82.6 (13.6) |
| DEL PEAK 16(9P23) WILD-TYPE | 210 | 88.5 (11.6) |
Figure S97. Get High-res Image Gene #37: 'del_9p23' versus Clinical Feature #5: 'KARNOFSKY_PERFORMANCE_SCORE'
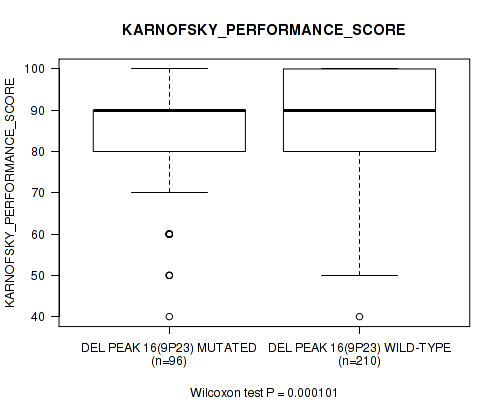
P value = 0.00841 (Fisher's exact test), Q value = 0.04
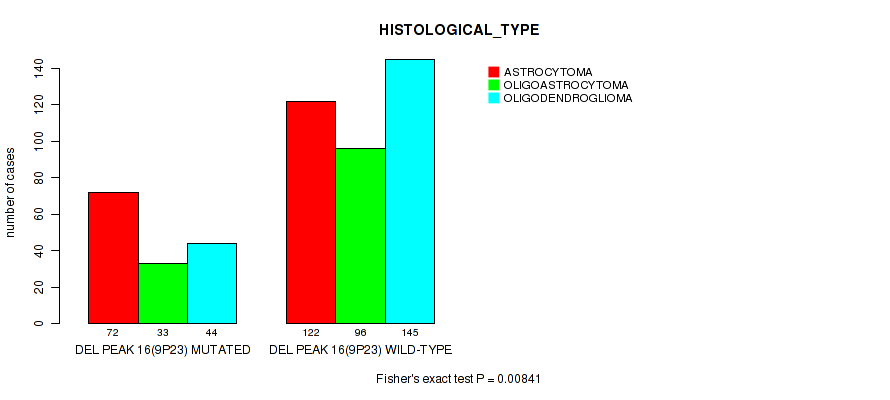
Table S98. Gene #37: 'del_9p23' versus Clinical Feature #6: 'HISTOLOGICAL_TYPE'
| nPatients | ASTROCYTOMA | OLIGOASTROCYTOMA | OLIGODENDROGLIOMA |
|---|---|---|---|
| ALL | 194 | 129 | 189 |
| DEL PEAK 16(9P23) MUTATED | 72 | 33 | 44 |
| DEL PEAK 16(9P23) WILD-TYPE | 122 | 96 | 145 |
Figure S98. Get High-res Image Gene #37: 'del_9p23' versus Clinical Feature #6: 'HISTOLOGICAL_TYPE'
P value = 6.21e-13 (logrank test), Q value = 1.3e-10
Table S99. Gene #38: 'del_9p21.3' versus Clinical Feature #1: 'Time to Death'
| nPatients | nDeath | Duration Range (Median), Month | |
|---|---|---|---|
| ALL | 509 | 121 | 0.0 - 211.2 (20.8) |
| DEL PEAK 17(9P21.3) MUTATED | 174 | 67 | 0.1 - 169.8 (19.3) |
| DEL PEAK 17(9P21.3) WILD-TYPE | 335 | 54 | 0.0 - 211.2 (22.5) |
Figure S99. Get High-res Image Gene #38: 'del_9p21.3' versus Clinical Feature #1: 'Time to Death'

P value = 9.28e-08 (Wilcoxon-test), Q value = 3.9e-06
Table S100. Gene #38: 'del_9p21.3' versus Clinical Feature #2: 'YEARS_TO_BIRTH'
| nPatients | Mean (Std.Dev) | |
|---|---|---|
| ALL | 511 | 43.0 (13.3) |
| DEL PEAK 17(9P21.3) MUTATED | 174 | 47.6 (14.0) |
| DEL PEAK 17(9P21.3) WILD-TYPE | 337 | 40.6 (12.4) |
Figure S100. Get High-res Image Gene #38: 'del_9p21.3' versus Clinical Feature #2: 'YEARS_TO_BIRTH'

P value = 1.42e-06 (Fisher's exact test), Q value = 4.5e-05
Table S101. Gene #38: 'del_9p21.3' versus Clinical Feature #4: 'RADIATION_THERAPY'
| nPatients | NO | YES |
|---|---|---|
| ALL | 184 | 293 |
| DEL PEAK 17(9P21.3) MUTATED | 37 | 121 |
| DEL PEAK 17(9P21.3) WILD-TYPE | 147 | 172 |
Figure S101. Get High-res Image Gene #38: 'del_9p21.3' versus Clinical Feature #4: 'RADIATION_THERAPY'
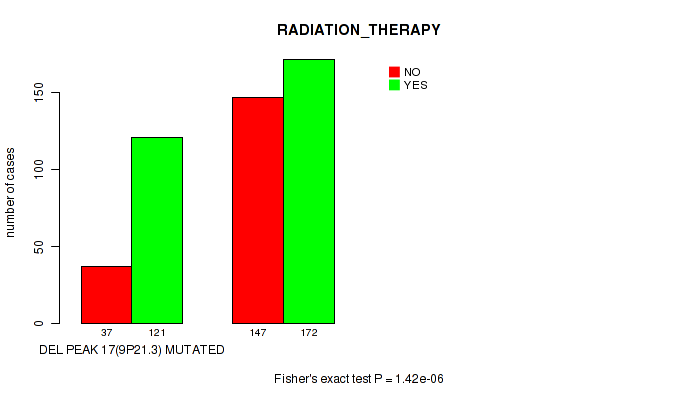
P value = 1.26e-05 (Wilcoxon-test), Q value = 0.00018
Table S102. Gene #38: 'del_9p21.3' versus Clinical Feature #5: 'KARNOFSKY_PERFORMANCE_SCORE'
| nPatients | Mean (Std.Dev) | |
|---|---|---|
| ALL | 306 | 86.6 (12.6) |
| DEL PEAK 17(9P21.3) MUTATED | 105 | 82.1 (14.3) |
| DEL PEAK 17(9P21.3) WILD-TYPE | 201 | 89.0 (10.9) |
Figure S102. Get High-res Image Gene #38: 'del_9p21.3' versus Clinical Feature #5: 'KARNOFSKY_PERFORMANCE_SCORE'
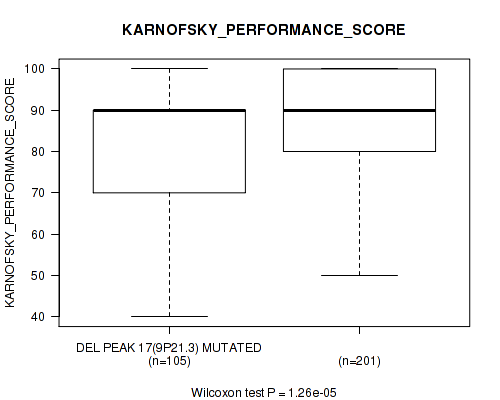
P value = 0.00186 (Fisher's exact test), Q value = 0.011
Table S103. Gene #38: 'del_9p21.3' versus Clinical Feature #6: 'HISTOLOGICAL_TYPE'
| nPatients | ASTROCYTOMA | OLIGOASTROCYTOMA | OLIGODENDROGLIOMA |
|---|---|---|---|
| ALL | 194 | 129 | 189 |
| DEL PEAK 17(9P21.3) MUTATED | 85 | 36 | 54 |
| DEL PEAK 17(9P21.3) WILD-TYPE | 109 | 93 | 135 |
Figure S103. Get High-res Image Gene #38: 'del_9p21.3' versus Clinical Feature #6: 'HISTOLOGICAL_TYPE'
P value = 1.71e-14 (logrank test), Q value = 7.1e-12
Table S104. Gene #39: 'del_10q26.3' versus Clinical Feature #1: 'Time to Death'
| nPatients | nDeath | Duration Range (Median), Month | |
|---|---|---|---|
| ALL | 509 | 121 | 0.0 - 211.2 (20.8) |
| DEL PEAK 18(10Q26.3) MUTATED | 150 | 67 | 0.1 - 172.8 (17.9) |
| DEL PEAK 18(10Q26.3) WILD-TYPE | 359 | 54 | 0.0 - 211.2 (23.8) |
Figure S104. Get High-res Image Gene #39: 'del_10q26.3' versus Clinical Feature #1: 'Time to Death'
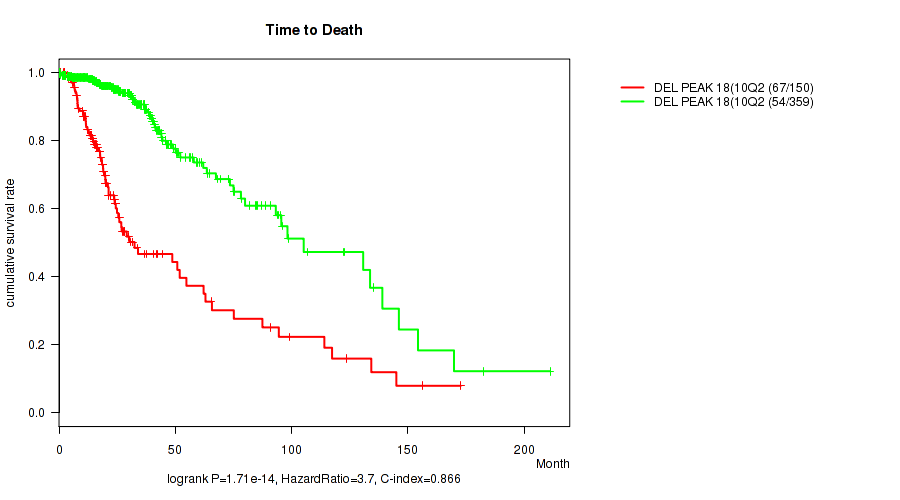
P value = 6.91e-08 (Wilcoxon-test), Q value = 3.6e-06
Table S105. Gene #39: 'del_10q26.3' versus Clinical Feature #2: 'YEARS_TO_BIRTH'
| nPatients | Mean (Std.Dev) | |
|---|---|---|
| ALL | 511 | 43.0 (13.3) |
| DEL PEAK 18(10Q26.3) MUTATED | 151 | 48.1 (13.9) |
| DEL PEAK 18(10Q26.3) WILD-TYPE | 360 | 40.8 (12.5) |
Figure S105. Get High-res Image Gene #39: 'del_10q26.3' versus Clinical Feature #2: 'YEARS_TO_BIRTH'
P value = 0.0641 (Fisher's exact test), Q value = 0.19
Table S106. Gene #39: 'del_10q26.3' versus Clinical Feature #3: 'GENDER'
| nPatients | FEMALE | MALE |
|---|---|---|
| ALL | 228 | 284 |
| DEL PEAK 18(10Q26.3) MUTATED | 77 | 74 |
| DEL PEAK 18(10Q26.3) WILD-TYPE | 151 | 210 |
Figure S106. Get High-res Image Gene #39: 'del_10q26.3' versus Clinical Feature #3: 'GENDER'
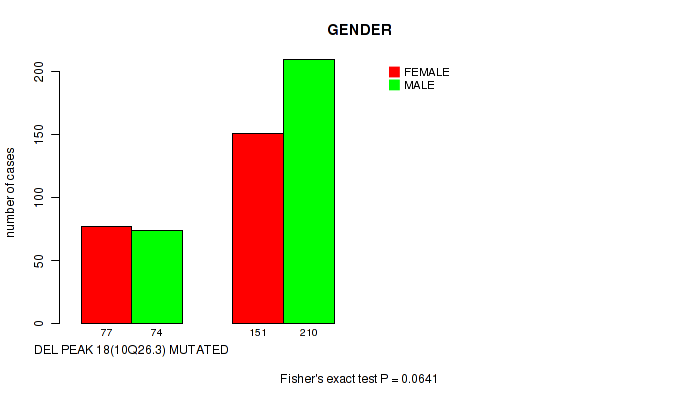
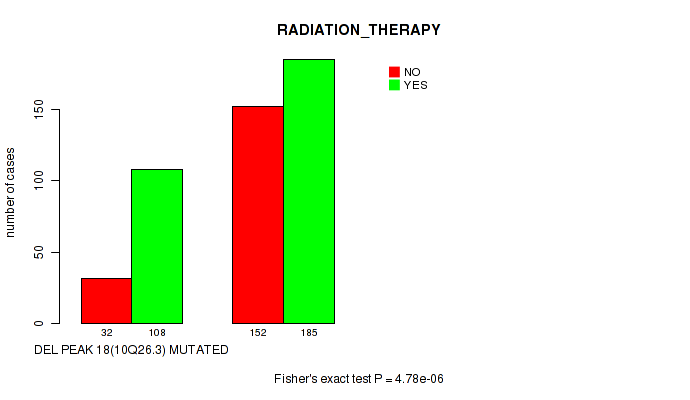
P value = 4.78e-06 (Fisher's exact test), Q value = 0.00012
Table S107. Gene #39: 'del_10q26.3' versus Clinical Feature #4: 'RADIATION_THERAPY'
| nPatients | NO | YES |
|---|---|---|
| ALL | 184 | 293 |
| DEL PEAK 18(10Q26.3) MUTATED | 32 | 108 |
| DEL PEAK 18(10Q26.3) WILD-TYPE | 152 | 185 |
Figure S107. Get High-res Image Gene #39: 'del_10q26.3' versus Clinical Feature #4: 'RADIATION_THERAPY'
P value = 0.0168 (Wilcoxon-test), Q value = 0.069
Table S108. Gene #39: 'del_10q26.3' versus Clinical Feature #5: 'KARNOFSKY_PERFORMANCE_SCORE'
| nPatients | Mean (Std.Dev) | |
|---|---|---|
| ALL | 306 | 86.6 (12.6) |
| DEL PEAK 18(10Q26.3) MUTATED | 90 | 83.3 (15.0) |
| DEL PEAK 18(10Q26.3) WILD-TYPE | 216 | 88.0 (11.2) |
Figure S108. Get High-res Image Gene #39: 'del_10q26.3' versus Clinical Feature #5: 'KARNOFSKY_PERFORMANCE_SCORE'

P value = 2e-05 (Fisher's exact test), Q value = 0.00024
Table S109. Gene #39: 'del_10q26.3' versus Clinical Feature #6: 'HISTOLOGICAL_TYPE'
| nPatients | ASTROCYTOMA | OLIGOASTROCYTOMA | OLIGODENDROGLIOMA |
|---|---|---|---|
| ALL | 194 | 129 | 189 |
| DEL PEAK 18(10Q26.3) MUTATED | 81 | 33 | 37 |
| DEL PEAK 18(10Q26.3) WILD-TYPE | 113 | 96 | 152 |
Figure S109. Get High-res Image Gene #39: 'del_10q26.3' versus Clinical Feature #6: 'HISTOLOGICAL_TYPE'
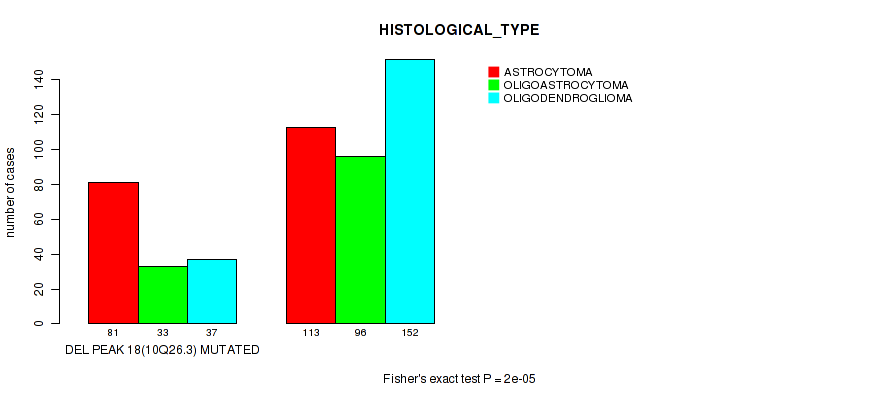
P value = 0.014 (Wilcoxon-test), Q value = 0.062
Table S110. Gene #40: 'del_11p15.5' versus Clinical Feature #2: 'YEARS_TO_BIRTH'
| nPatients | Mean (Std.Dev) | |
|---|---|---|
| ALL | 511 | 43.0 (13.3) |
| DEL PEAK 19(11P15.5) MUTATED | 104 | 40.1 (11.4) |
| DEL PEAK 19(11P15.5) WILD-TYPE | 407 | 43.7 (13.7) |
Figure S110. Get High-res Image Gene #40: 'del_11p15.5' versus Clinical Feature #2: 'YEARS_TO_BIRTH'
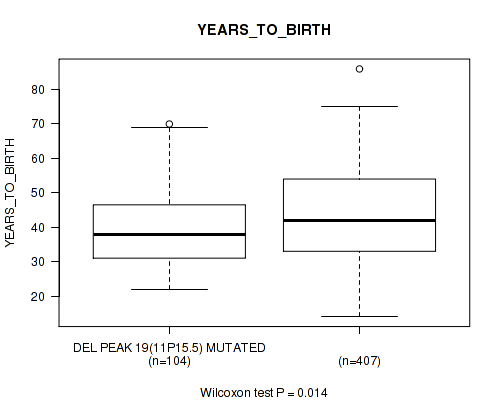
P value = 0.00346 (Fisher's exact test), Q value = 0.019
Table S111. Gene #40: 'del_11p15.5' versus Clinical Feature #4: 'RADIATION_THERAPY'
| nPatients | NO | YES |
|---|---|---|
| ALL | 184 | 293 |
| DEL PEAK 19(11P15.5) MUTATED | 25 | 73 |
| DEL PEAK 19(11P15.5) WILD-TYPE | 159 | 220 |
Figure S111. Get High-res Image Gene #40: 'del_11p15.5' versus Clinical Feature #4: 'RADIATION_THERAPY'
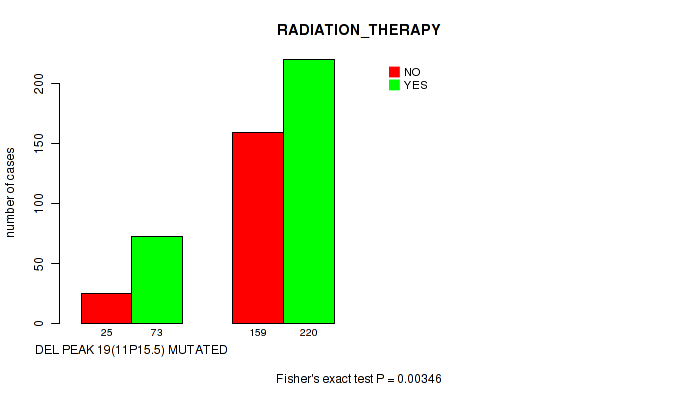
P value = 1e-05 (Fisher's exact test), Q value = 0.00015
Table S112. Gene #40: 'del_11p15.5' versus Clinical Feature #6: 'HISTOLOGICAL_TYPE'
| nPatients | ASTROCYTOMA | OLIGOASTROCYTOMA | OLIGODENDROGLIOMA |
|---|---|---|---|
| ALL | 194 | 129 | 189 |
| DEL PEAK 19(11P15.5) MUTATED | 57 | 30 | 17 |
| DEL PEAK 19(11P15.5) WILD-TYPE | 137 | 99 | 172 |
Figure S112. Get High-res Image Gene #40: 'del_11p15.5' versus Clinical Feature #6: 'HISTOLOGICAL_TYPE'
P value = 0.00718 (logrank test), Q value = 0.035
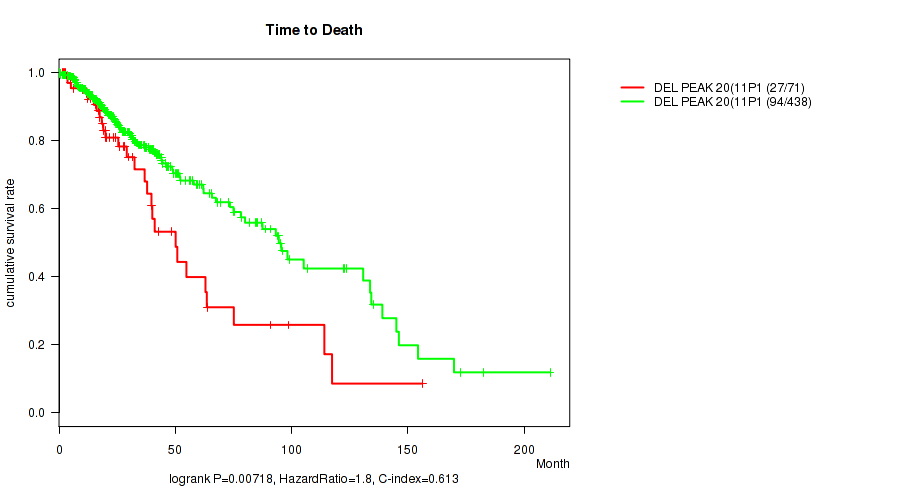
Table S113. Gene #41: 'del_11p15.1' versus Clinical Feature #1: 'Time to Death'
| nPatients | nDeath | Duration Range (Median), Month | |
|---|---|---|---|
| ALL | 509 | 121 | 0.0 - 211.2 (20.8) |
| DEL PEAK 20(11P15.1) MUTATED | 71 | 27 | 0.2 - 156.2 (20.5) |
| DEL PEAK 20(11P15.1) WILD-TYPE | 438 | 94 | 0.0 - 211.2 (20.9) |
Figure S113. Get High-res Image Gene #41: 'del_11p15.1' versus Clinical Feature #1: 'Time to Death'
P value = 0.00682 (Fisher's exact test), Q value = 0.033
Table S114. Gene #41: 'del_11p15.1' versus Clinical Feature #4: 'RADIATION_THERAPY'
| nPatients | NO | YES |
|---|---|---|
| ALL | 184 | 293 |
| DEL PEAK 20(11P15.1) MUTATED | 16 | 52 |
| DEL PEAK 20(11P15.1) WILD-TYPE | 168 | 241 |
Figure S114. Get High-res Image Gene #41: 'del_11p15.1' versus Clinical Feature #4: 'RADIATION_THERAPY'

P value = 0.0542 (Wilcoxon-test), Q value = 0.17
Table S115. Gene #41: 'del_11p15.1' versus Clinical Feature #5: 'KARNOFSKY_PERFORMANCE_SCORE'
| nPatients | Mean (Std.Dev) | |
|---|---|---|
| ALL | 306 | 86.6 (12.6) |
| DEL PEAK 20(11P15.1) MUTATED | 53 | 84.5 (11.5) |
| DEL PEAK 20(11P15.1) WILD-TYPE | 253 | 87.1 (12.8) |
Figure S115. Get High-res Image Gene #41: 'del_11p15.1' versus Clinical Feature #5: 'KARNOFSKY_PERFORMANCE_SCORE'

P value = 0.00022 (Fisher's exact test), Q value = 0.0018
Table S116. Gene #41: 'del_11p15.1' versus Clinical Feature #6: 'HISTOLOGICAL_TYPE'
| nPatients | ASTROCYTOMA | OLIGOASTROCYTOMA | OLIGODENDROGLIOMA |
|---|---|---|---|
| ALL | 194 | 129 | 189 |
| DEL PEAK 20(11P15.1) MUTATED | 43 | 15 | 14 |
| DEL PEAK 20(11P15.1) WILD-TYPE | 151 | 114 | 175 |
Figure S116. Get High-res Image Gene #41: 'del_11p15.1' versus Clinical Feature #6: 'HISTOLOGICAL_TYPE'
P value = 0.00222 (logrank test), Q value = 0.013
Table S117. Gene #42: 'del_12p13.1' versus Clinical Feature #1: 'Time to Death'
| nPatients | nDeath | Duration Range (Median), Month | |
|---|---|---|---|
| ALL | 509 | 121 | 0.0 - 211.2 (20.8) |
| DEL PEAK 21(12P13.1) MUTATED | 37 | 14 | 0.1 - 95.1 (20.7) |
| DEL PEAK 21(12P13.1) WILD-TYPE | 472 | 107 | 0.0 - 211.2 (20.9) |
Figure S117. Get High-res Image Gene #42: 'del_12p13.1' versus Clinical Feature #1: 'Time to Death'
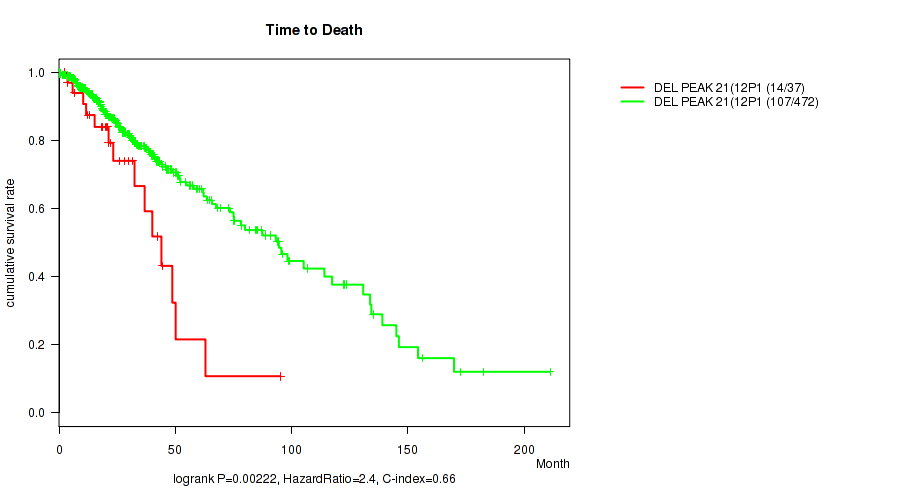
P value = 0.0151 (Fisher's exact test), Q value = 0.064
Table S118. Gene #43: 'del_12q12' versus Clinical Feature #4: 'RADIATION_THERAPY'
| nPatients | NO | YES |
|---|---|---|
| ALL | 184 | 293 |
| DEL PEAK 22(12Q12) MUTATED | 17 | 51 |
| DEL PEAK 22(12Q12) WILD-TYPE | 167 | 242 |
Figure S118. Get High-res Image Gene #43: 'del_12q12' versus Clinical Feature #4: 'RADIATION_THERAPY'

P value = 7e-05 (Fisher's exact test), Q value = 0.00075
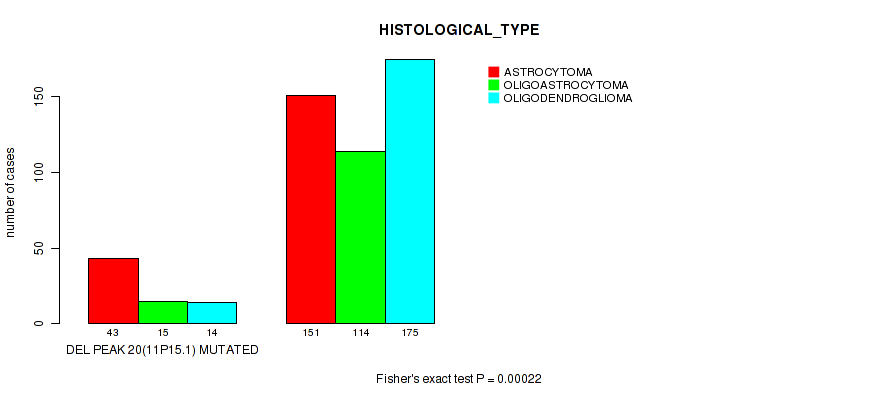
Table S119. Gene #43: 'del_12q12' versus Clinical Feature #6: 'HISTOLOGICAL_TYPE'
| nPatients | ASTROCYTOMA | OLIGOASTROCYTOMA | OLIGODENDROGLIOMA |
|---|---|---|---|
| ALL | 194 | 129 | 189 |
| DEL PEAK 22(12Q12) MUTATED | 43 | 16 | 13 |
| DEL PEAK 22(12Q12) WILD-TYPE | 151 | 113 | 176 |
Figure S119. Get High-res Image Gene #43: 'del_12q12' versus Clinical Feature #6: 'HISTOLOGICAL_TYPE'
P value = 0.0679 (Fisher's exact test), Q value = 0.2
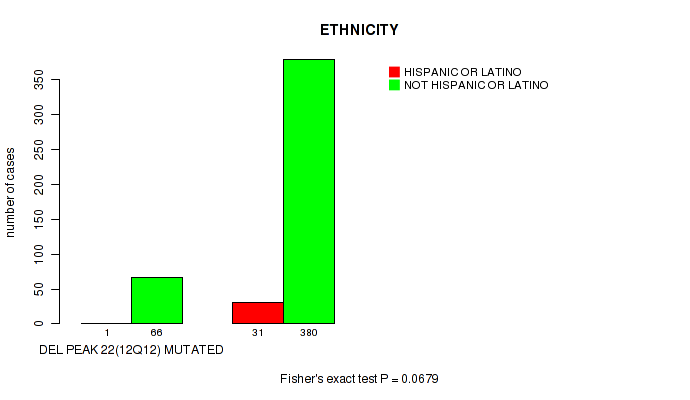
Table S120. Gene #43: 'del_12q12' versus Clinical Feature #8: 'ETHNICITY'
| nPatients | HISPANIC OR LATINO | NOT HISPANIC OR LATINO |
|---|---|---|
| ALL | 32 | 446 |
| DEL PEAK 22(12Q12) MUTATED | 1 | 66 |
| DEL PEAK 22(12Q12) WILD-TYPE | 31 | 380 |
Figure S120. Get High-res Image Gene #43: 'del_12q12' versus Clinical Feature #8: 'ETHNICITY'
P value = 0.0373 (logrank test), Q value = 0.13
Table S121. Gene #44: 'del_13q14.2' versus Clinical Feature #1: 'Time to Death'
| nPatients | nDeath | Duration Range (Median), Month | |
|---|---|---|---|
| ALL | 509 | 121 | 0.0 - 211.2 (20.8) |
| DEL PEAK 23(13Q14.2) MUTATED | 141 | 46 | 0.1 - 211.2 (20.0) |
| DEL PEAK 23(13Q14.2) WILD-TYPE | 368 | 75 | 0.0 - 182.3 (22.2) |
Figure S121. Get High-res Image Gene #44: 'del_13q14.2' versus Clinical Feature #1: 'Time to Death'
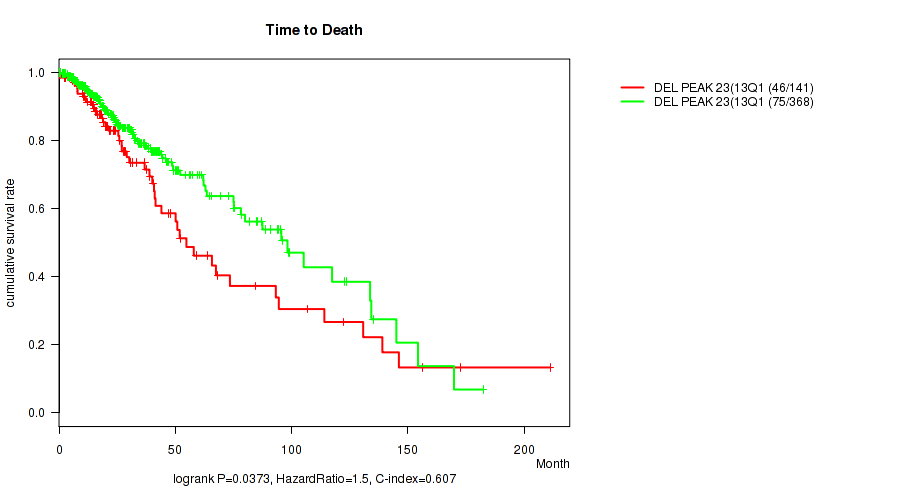
P value = 0.000161 (Fisher's exact test), Q value = 0.0015
Table S122. Gene #44: 'del_13q14.2' versus Clinical Feature #4: 'RADIATION_THERAPY'
| nPatients | NO | YES |
|---|---|---|
| ALL | 184 | 293 |
| DEL PEAK 23(13Q14.2) MUTATED | 34 | 101 |
| DEL PEAK 23(13Q14.2) WILD-TYPE | 150 | 192 |
Figure S122. Get High-res Image Gene #44: 'del_13q14.2' versus Clinical Feature #4: 'RADIATION_THERAPY'
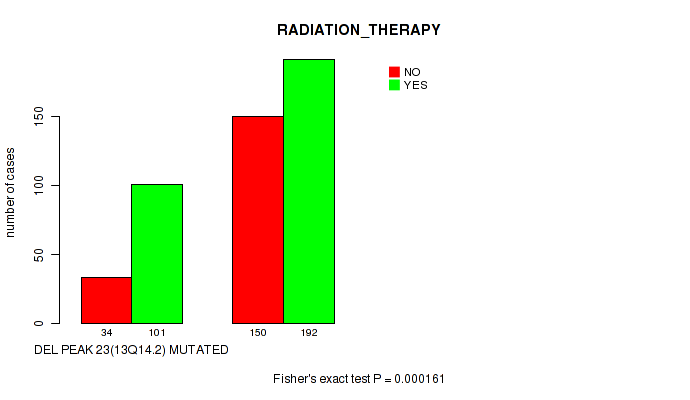
P value = 0.00578 (Wilcoxon-test), Q value = 0.03
Table S123. Gene #44: 'del_13q14.2' versus Clinical Feature #5: 'KARNOFSKY_PERFORMANCE_SCORE'
| nPatients | Mean (Std.Dev) | |
|---|---|---|
| ALL | 306 | 86.6 (12.6) |
| DEL PEAK 23(13Q14.2) MUTATED | 90 | 83.6 (13.5) |
| DEL PEAK 23(13Q14.2) WILD-TYPE | 216 | 87.9 (12.0) |
Figure S123. Get High-res Image Gene #44: 'del_13q14.2' versus Clinical Feature #5: 'KARNOFSKY_PERFORMANCE_SCORE'

P value = 0.0334 (logrank test), Q value = 0.12
Table S124. Gene #45: 'del_13q14.2' versus Clinical Feature #1: 'Time to Death'
| nPatients | nDeath | Duration Range (Median), Month | |
|---|---|---|---|
| ALL | 509 | 121 | 0.0 - 211.2 (20.8) |
| DEL PEAK 24(13Q14.2) MUTATED | 143 | 47 | 0.1 - 211.2 (20.0) |
| DEL PEAK 24(13Q14.2) WILD-TYPE | 366 | 74 | 0.0 - 182.3 (21.7) |
Figure S124. Get High-res Image Gene #45: 'del_13q14.2' versus Clinical Feature #1: 'Time to Death'

P value = 0.000182 (Fisher's exact test), Q value = 0.0016
Table S125. Gene #45: 'del_13q14.2' versus Clinical Feature #4: 'RADIATION_THERAPY'
| nPatients | NO | YES |
|---|---|---|
| ALL | 184 | 293 |
| DEL PEAK 24(13Q14.2) MUTATED | 35 | 102 |
| DEL PEAK 24(13Q14.2) WILD-TYPE | 149 | 191 |
Figure S125. Get High-res Image Gene #45: 'del_13q14.2' versus Clinical Feature #4: 'RADIATION_THERAPY'
P value = 0.00625 (Wilcoxon-test), Q value = 0.032
Table S126. Gene #45: 'del_13q14.2' versus Clinical Feature #5: 'KARNOFSKY_PERFORMANCE_SCORE'
| nPatients | Mean (Std.Dev) | |
|---|---|---|
| ALL | 306 | 86.6 (12.6) |
| DEL PEAK 24(13Q14.2) MUTATED | 91 | 83.6 (13.5) |
| DEL PEAK 24(13Q14.2) WILD-TYPE | 215 | 87.9 (12.0) |
Figure S126. Get High-res Image Gene #45: 'del_13q14.2' versus Clinical Feature #5: 'KARNOFSKY_PERFORMANCE_SCORE'
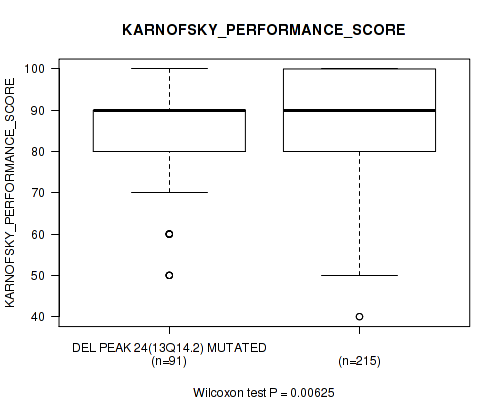
P value = 0.0819 (Fisher's exact test), Q value = 0.24
Table S127. Gene #45: 'del_13q14.2' versus Clinical Feature #6: 'HISTOLOGICAL_TYPE'
| nPatients | ASTROCYTOMA | OLIGOASTROCYTOMA | OLIGODENDROGLIOMA |
|---|---|---|---|
| ALL | 194 | 129 | 189 |
| DEL PEAK 24(13Q14.2) MUTATED | 64 | 37 | 43 |
| DEL PEAK 24(13Q14.2) WILD-TYPE | 130 | 92 | 146 |
Figure S127. Get High-res Image Gene #45: 'del_13q14.2' versus Clinical Feature #6: 'HISTOLOGICAL_TYPE'
P value = 0.0149 (logrank test), Q value = 0.064
Table S128. Gene #46: 'del_13q34' versus Clinical Feature #1: 'Time to Death'
| nPatients | nDeath | Duration Range (Median), Month | |
|---|---|---|---|
| ALL | 509 | 121 | 0.0 - 211.2 (20.8) |
| DEL PEAK 25(13Q34) MUTATED | 110 | 38 | 0.1 - 211.2 (18.9) |
| DEL PEAK 25(13Q34) WILD-TYPE | 399 | 83 | 0.0 - 182.3 (22.6) |
Figure S128. Get High-res Image Gene #46: 'del_13q34' versus Clinical Feature #1: 'Time to Death'
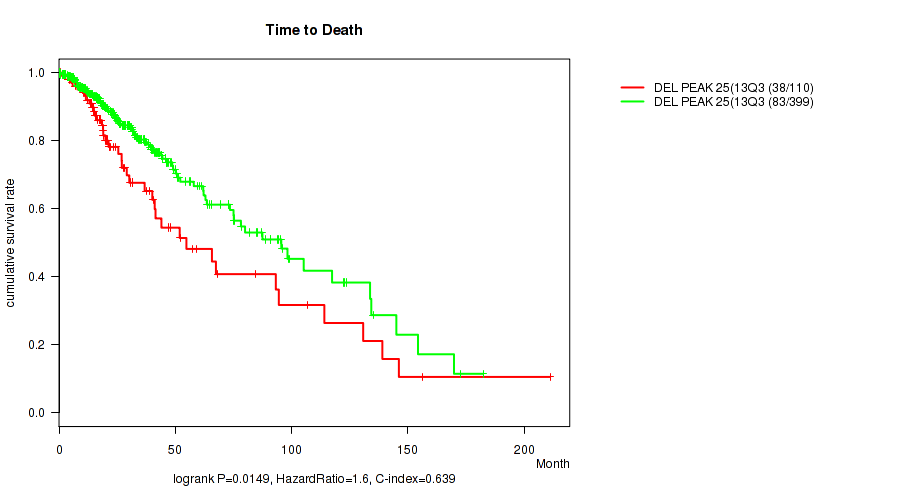
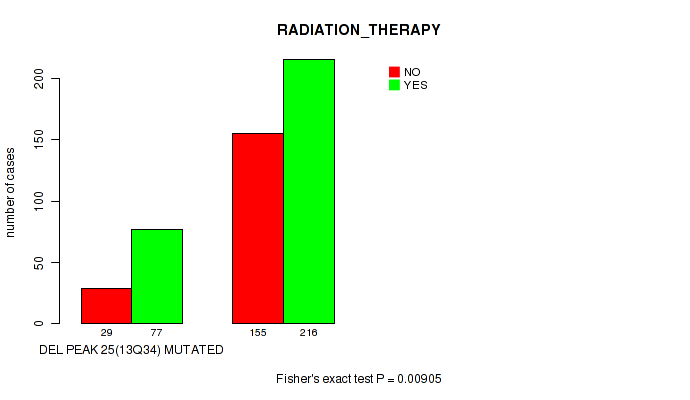
P value = 0.00905 (Fisher's exact test), Q value = 0.042
Table S129. Gene #46: 'del_13q34' versus Clinical Feature #4: 'RADIATION_THERAPY'
| nPatients | NO | YES |
|---|---|---|
| ALL | 184 | 293 |
| DEL PEAK 25(13Q34) MUTATED | 29 | 77 |
| DEL PEAK 25(13Q34) WILD-TYPE | 155 | 216 |
Figure S129. Get High-res Image Gene #46: 'del_13q34' versus Clinical Feature #4: 'RADIATION_THERAPY'
P value = 1.76e-05 (logrank test), Q value = 0.00023
Table S130. Gene #47: 'del_14q24.3' versus Clinical Feature #1: 'Time to Death'
| nPatients | nDeath | Duration Range (Median), Month | |
|---|---|---|---|
| ALL | 509 | 121 | 0.0 - 211.2 (20.8) |
| DEL PEAK 26(14Q24.3) MUTATED | 120 | 45 | 0.1 - 130.8 (21.4) |
| DEL PEAK 26(14Q24.3) WILD-TYPE | 389 | 76 | 0.0 - 211.2 (20.7) |
Figure S130. Get High-res Image Gene #47: 'del_14q24.3' versus Clinical Feature #1: 'Time to Death'
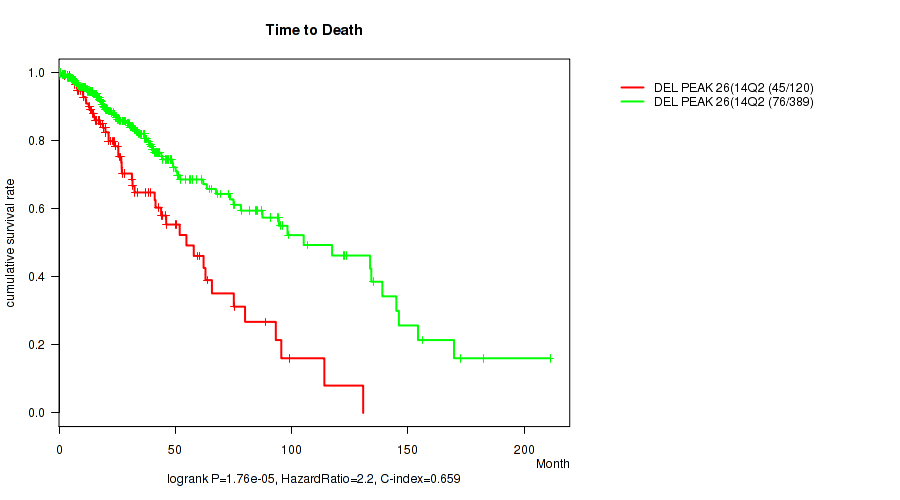
P value = 0.0144 (Wilcoxon-test), Q value = 0.062
Table S131. Gene #47: 'del_14q24.3' versus Clinical Feature #2: 'YEARS_TO_BIRTH'
| nPatients | Mean (Std.Dev) | |
|---|---|---|
| ALL | 511 | 43.0 (13.3) |
| DEL PEAK 26(14Q24.3) MUTATED | 121 | 45.6 (13.0) |
| DEL PEAK 26(14Q24.3) WILD-TYPE | 390 | 42.2 (13.4) |
Figure S131. Get High-res Image Gene #47: 'del_14q24.3' versus Clinical Feature #2: 'YEARS_TO_BIRTH'

P value = 0.0196 (Wilcoxon-test), Q value = 0.076
Table S132. Gene #48: 'del_18q23' versus Clinical Feature #2: 'YEARS_TO_BIRTH'
| nPatients | Mean (Std.Dev) | |
|---|---|---|
| ALL | 511 | 43.0 (13.3) |
| DEL PEAK 27(18Q23) MUTATED | 78 | 46.7 (14.6) |
| DEL PEAK 27(18Q23) WILD-TYPE | 433 | 42.3 (13.0) |
Figure S132. Get High-res Image Gene #48: 'del_18q23' versus Clinical Feature #2: 'YEARS_TO_BIRTH'

P value = 0.00299 (logrank test), Q value = 0.017
Table S133. Gene #49: 'del_19q13.41' versus Clinical Feature #1: 'Time to Death'
| nPatients | nDeath | Duration Range (Median), Month | |
|---|---|---|---|
| ALL | 509 | 121 | 0.0 - 211.2 (20.8) |
| DEL PEAK 28(19Q13.41) MUTATED | 264 | 49 | 0.0 - 182.3 (21.5) |
| DEL PEAK 28(19Q13.41) WILD-TYPE | 245 | 72 | 0.1 - 211.2 (20.5) |
Figure S133. Get High-res Image Gene #49: 'del_19q13.41' versus Clinical Feature #1: 'Time to Death'
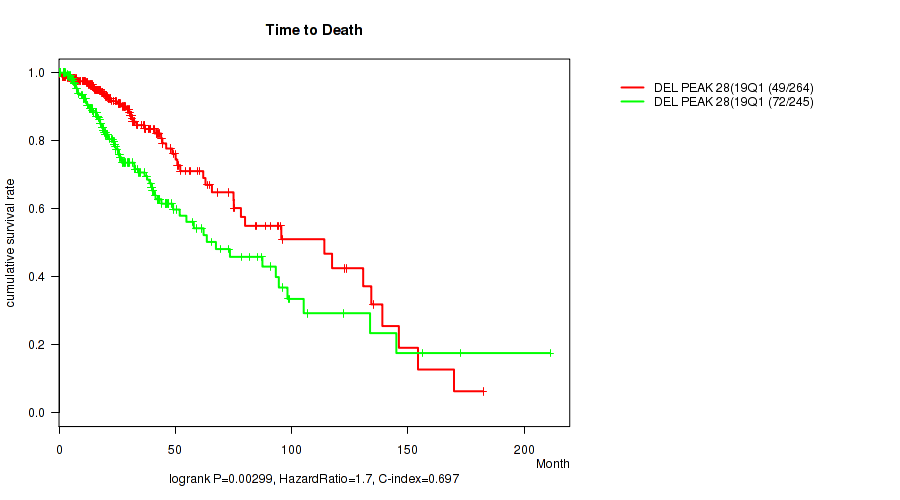
P value = 0.0589 (Wilcoxon-test), Q value = 0.18
Table S134. Gene #49: 'del_19q13.41' versus Clinical Feature #2: 'YEARS_TO_BIRTH'
| nPatients | Mean (Std.Dev) | |
|---|---|---|
| ALL | 511 | 43.0 (13.3) |
| DEL PEAK 28(19Q13.41) MUTATED | 266 | 43.9 (12.6) |
| DEL PEAK 28(19Q13.41) WILD-TYPE | 245 | 42.0 (14.1) |
Figure S134. Get High-res Image Gene #49: 'del_19q13.41' versus Clinical Feature #2: 'YEARS_TO_BIRTH'

P value = 0.000337 (Fisher's exact test), Q value = 0.0028
Table S135. Gene #49: 'del_19q13.41' versus Clinical Feature #4: 'RADIATION_THERAPY'
| nPatients | NO | YES |
|---|---|---|
| ALL | 184 | 293 |
| DEL PEAK 28(19Q13.41) MUTATED | 115 | 133 |
| DEL PEAK 28(19Q13.41) WILD-TYPE | 69 | 160 |
Figure S135. Get High-res Image Gene #49: 'del_19q13.41' versus Clinical Feature #4: 'RADIATION_THERAPY'
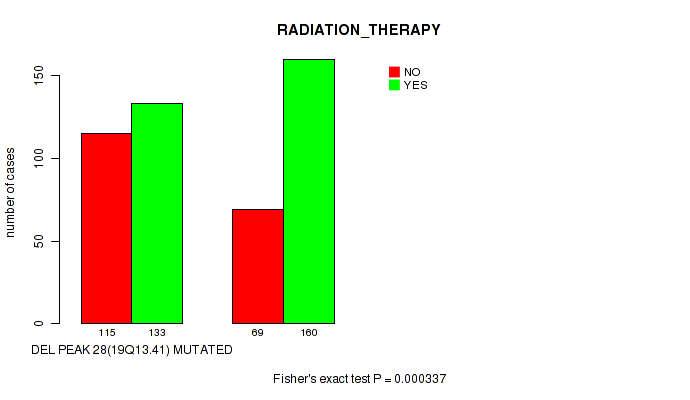
P value = 1e-05 (Fisher's exact test), Q value = 0.00015
Table S136. Gene #49: 'del_19q13.41' versus Clinical Feature #6: 'HISTOLOGICAL_TYPE'
| nPatients | ASTROCYTOMA | OLIGOASTROCYTOMA | OLIGODENDROGLIOMA |
|---|---|---|---|
| ALL | 194 | 129 | 189 |
| DEL PEAK 28(19Q13.41) MUTATED | 54 | 60 | 153 |
| DEL PEAK 28(19Q13.41) WILD-TYPE | 140 | 69 | 36 |
Figure S136. Get High-res Image Gene #49: 'del_19q13.41' versus Clinical Feature #6: 'HISTOLOGICAL_TYPE'
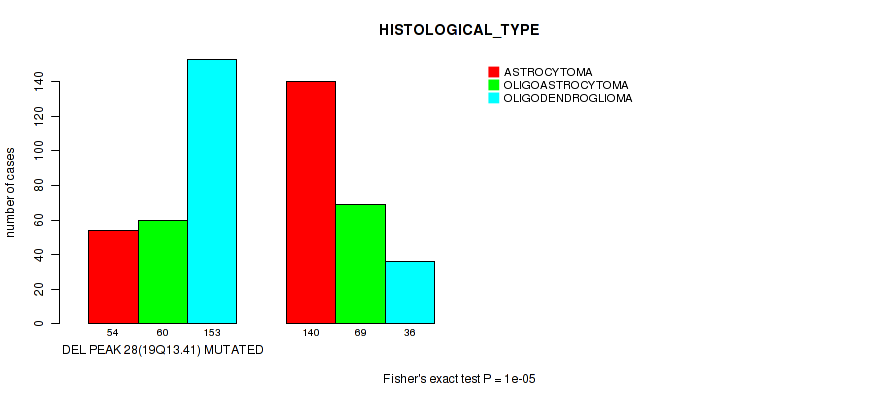
P value = 0.000117 (logrank test), Q value = 0.0011
Table S137. Gene #50: 'del_19q13.42' versus Clinical Feature #1: 'Time to Death'
| nPatients | nDeath | Duration Range (Median), Month | |
|---|---|---|---|
| ALL | 509 | 121 | 0.0 - 211.2 (20.8) |
| DEL PEAK 29(19Q13.42) MUTATED | 275 | 51 | 0.0 - 182.3 (22.3) |
| DEL PEAK 29(19Q13.42) WILD-TYPE | 234 | 70 | 0.1 - 211.2 (20.0) |
Figure S137. Get High-res Image Gene #50: 'del_19q13.42' versus Clinical Feature #1: 'Time to Death'
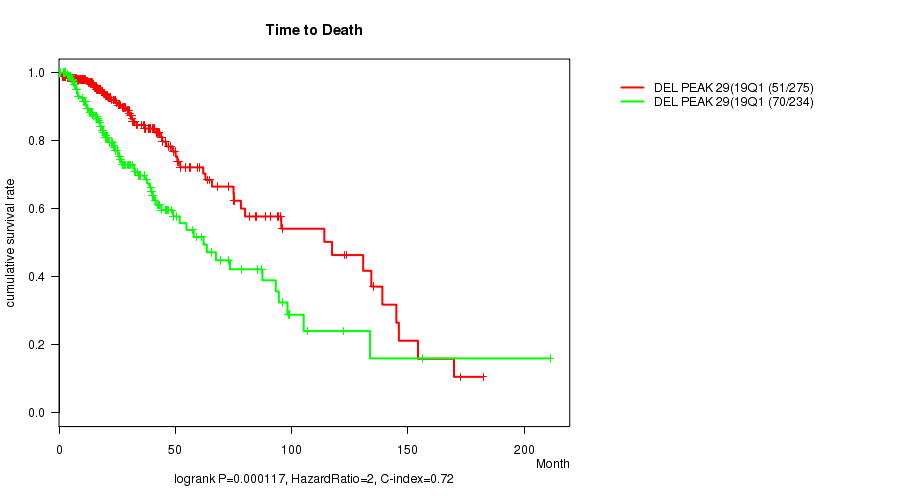
P value = 0.000467 (Fisher's exact test), Q value = 0.0036
Table S138. Gene #50: 'del_19q13.42' versus Clinical Feature #4: 'RADIATION_THERAPY'
| nPatients | NO | YES |
|---|---|---|
| ALL | 184 | 293 |
| DEL PEAK 29(19Q13.42) MUTATED | 119 | 141 |
| DEL PEAK 29(19Q13.42) WILD-TYPE | 65 | 152 |
Figure S138. Get High-res Image Gene #50: 'del_19q13.42' versus Clinical Feature #4: 'RADIATION_THERAPY'
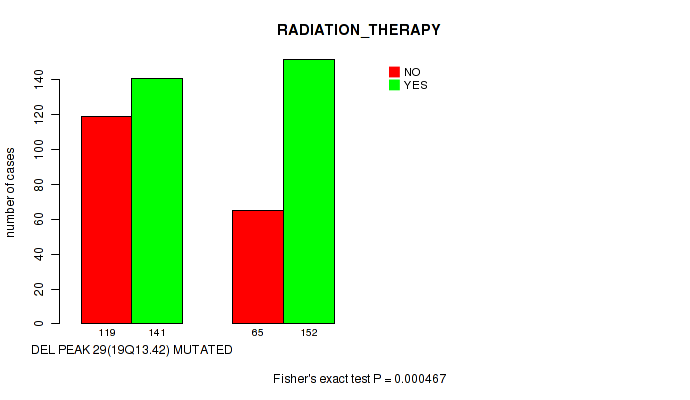
P value = 1e-05 (Fisher's exact test), Q value = 0.00015
Table S139. Gene #50: 'del_19q13.42' versus Clinical Feature #6: 'HISTOLOGICAL_TYPE'
| nPatients | ASTROCYTOMA | OLIGOASTROCYTOMA | OLIGODENDROGLIOMA |
|---|---|---|---|
| ALL | 194 | 129 | 189 |
| DEL PEAK 29(19Q13.42) MUTATED | 60 | 64 | 154 |
| DEL PEAK 29(19Q13.42) WILD-TYPE | 134 | 65 | 35 |
Figure S139. Get High-res Image Gene #50: 'del_19q13.42' versus Clinical Feature #6: 'HISTOLOGICAL_TYPE'
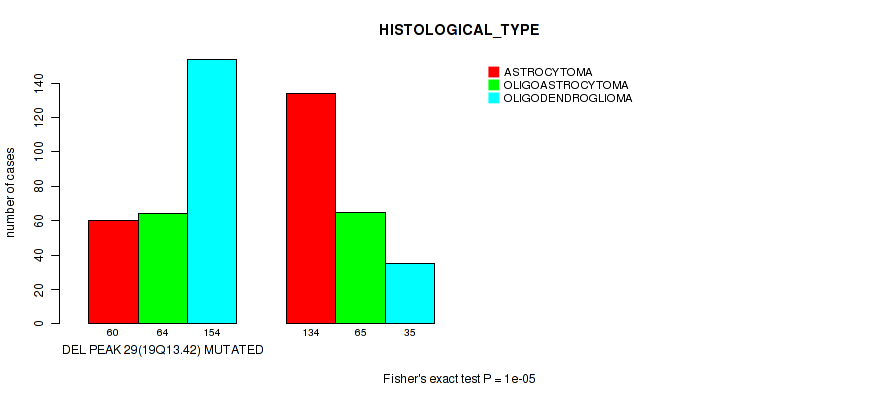
P value = 1e-05 (logrank test), Q value = 0.00015
Table S140. Gene #51: 'del_22q13.31' versus Clinical Feature #1: 'Time to Death'
| nPatients | nDeath | Duration Range (Median), Month | |
|---|---|---|---|
| ALL | 509 | 121 | 0.0 - 211.2 (20.8) |
| DEL PEAK 30(22Q13.31) MUTATED | 77 | 34 | 0.1 - 156.2 (20.5) |
| DEL PEAK 30(22Q13.31) WILD-TYPE | 432 | 87 | 0.0 - 211.2 (20.9) |
Figure S140. Get High-res Image Gene #51: 'del_22q13.31' versus Clinical Feature #1: 'Time to Death'
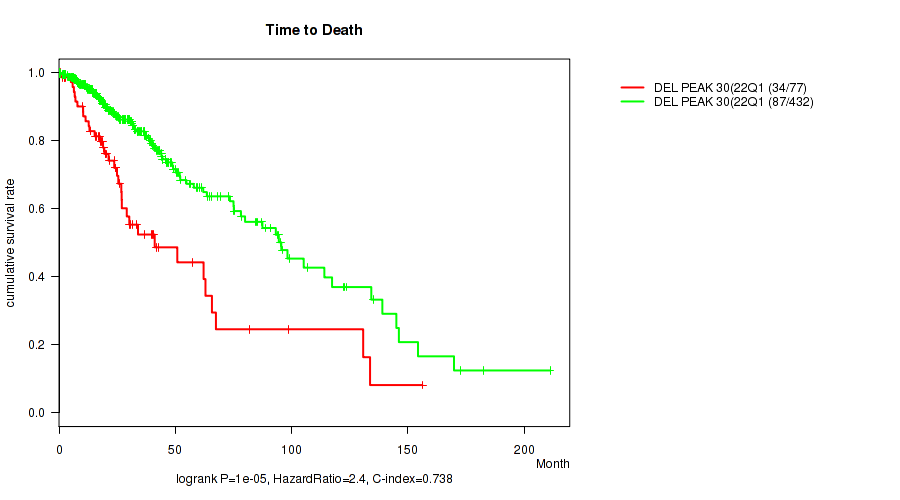
P value = 0.000444 (Wilcoxon-test), Q value = 0.0035
Table S141. Gene #51: 'del_22q13.31' versus Clinical Feature #2: 'YEARS_TO_BIRTH'
| nPatients | Mean (Std.Dev) | |
|---|---|---|
| ALL | 511 | 43.0 (13.3) |
| DEL PEAK 30(22Q13.31) MUTATED | 77 | 48.4 (14.5) |
| DEL PEAK 30(22Q13.31) WILD-TYPE | 434 | 42.0 (12.9) |
Figure S141. Get High-res Image Gene #51: 'del_22q13.31' versus Clinical Feature #2: 'YEARS_TO_BIRTH'
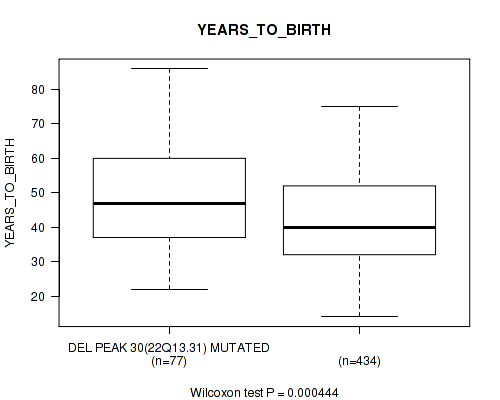
P value = 0.00782 (Fisher's exact test), Q value = 0.037
Table S142. Gene #51: 'del_22q13.31' versus Clinical Feature #4: 'RADIATION_THERAPY'
| nPatients | NO | YES |
|---|---|---|
| ALL | 184 | 293 |
| DEL PEAK 30(22Q13.31) MUTATED | 17 | 53 |
| DEL PEAK 30(22Q13.31) WILD-TYPE | 167 | 240 |
Figure S142. Get High-res Image Gene #51: 'del_22q13.31' versus Clinical Feature #4: 'RADIATION_THERAPY'

P value = 0.0542 (Wilcoxon-test), Q value = 0.17
Table S143. Gene #51: 'del_22q13.31' versus Clinical Feature #5: 'KARNOFSKY_PERFORMANCE_SCORE'
| nPatients | Mean (Std.Dev) | |
|---|---|---|
| ALL | 306 | 86.6 (12.6) |
| DEL PEAK 30(22Q13.31) MUTATED | 49 | 83.3 (14.3) |
| DEL PEAK 30(22Q13.31) WILD-TYPE | 257 | 87.3 (12.1) |
Figure S143. Get High-res Image Gene #51: 'del_22q13.31' versus Clinical Feature #5: 'KARNOFSKY_PERFORMANCE_SCORE'
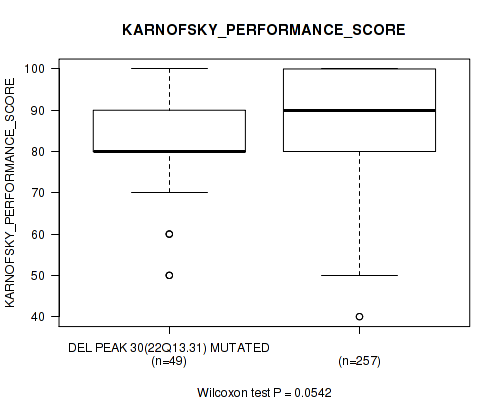
P value = 0.00088 (Fisher's exact test), Q value = 0.0057
Table S144. Gene #51: 'del_22q13.31' versus Clinical Feature #6: 'HISTOLOGICAL_TYPE'
| nPatients | ASTROCYTOMA | OLIGOASTROCYTOMA | OLIGODENDROGLIOMA |
|---|---|---|---|
| ALL | 194 | 129 | 189 |
| DEL PEAK 30(22Q13.31) MUTATED | 44 | 15 | 18 |
| DEL PEAK 30(22Q13.31) WILD-TYPE | 150 | 114 | 171 |
Figure S144. Get High-res Image Gene #51: 'del_22q13.31' versus Clinical Feature #6: 'HISTOLOGICAL_TYPE'

P value = 0.083 (logrank test), Q value = 0.24
Table S145. Gene #52: 'del_xq21.1' versus Clinical Feature #1: 'Time to Death'
| nPatients | nDeath | Duration Range (Median), Month | |
|---|---|---|---|
| ALL | 509 | 121 | 0.0 - 211.2 (20.8) |
| DEL PEAK 31(XQ21.1) MUTATED | 77 | 25 | 0.1 - 156.2 (19.0) |
| DEL PEAK 31(XQ21.1) WILD-TYPE | 432 | 96 | 0.0 - 211.2 (21.4) |
Figure S145. Get High-res Image Gene #52: 'del_xq21.1' versus Clinical Feature #1: 'Time to Death'
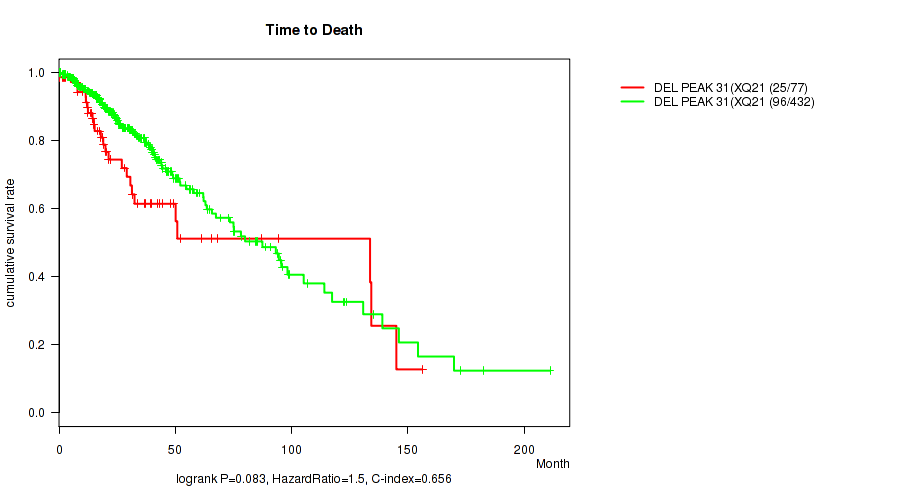
-
Copy number data file = all_lesions.txt from GISTIC pipeline
-
Processed Copy number data file = /xchip/cga/gdac-prod/tcga-gdac/jobResults/GDAC_Correlate_Genomic_Events_Preprocess/LGG-TP/19781933/transformed.cor.cli.txt
-
Clinical data file = /xchip/cga/gdac-prod/tcga-gdac/jobResults/Append_Data/LGG-TP/19775312/LGG-TP.merged_data.txt
-
Number of patients = 512
-
Number of significantly focal cnvs = 52
-
Number of selected clinical features = 8
-
Exclude genes that fewer than K tumors have mutations, K = 3
For survival clinical features, the Kaplan-Meier survival curves of tumors with and without gene mutations were plotted and the statistical significance P values were estimated by logrank test (Bland and Altman 2004) using the 'survdiff' function in R
For binary or multi-class clinical features (nominal or ordinal), two-tailed Fisher's exact tests (Fisher 1922) were used to estimate the P values using the 'fisher.test' function in R
For multiple hypothesis correction, Q value is the False Discovery Rate (FDR) analogue of the P value (Benjamini and Hochberg 1995), defined as the minimum FDR at which the test may be called significant. We used the 'Benjamini and Hochberg' method of 'p.adjust' function in R to convert P values into Q values.
In addition to the links below, the full results of the analysis summarized in this report can also be downloaded programmatically using firehose_get, or interactively from either the Broad GDAC website or TCGA Data Coordination Center Portal.