This pipeline computes the correlation between significant arm-level copy number variations (cnvs) and selected clinical features.
Testing the association between copy number variation 82 arm-level events and 12 clinical features across 362 patients, 20 significant findings detected with Q value < 0.25.
-
2p gain cnv correlated to 'GENDER'.
-
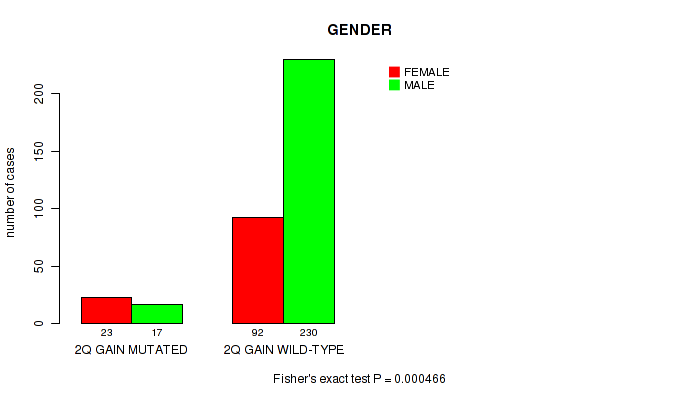
2q gain cnv correlated to 'GENDER'.
-
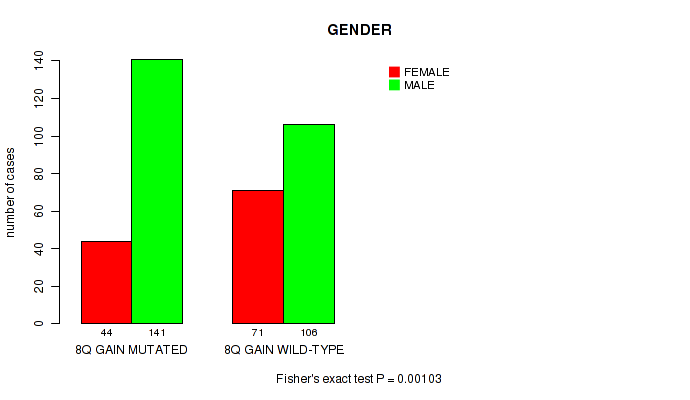
8q gain cnv correlated to 'GENDER'.
-
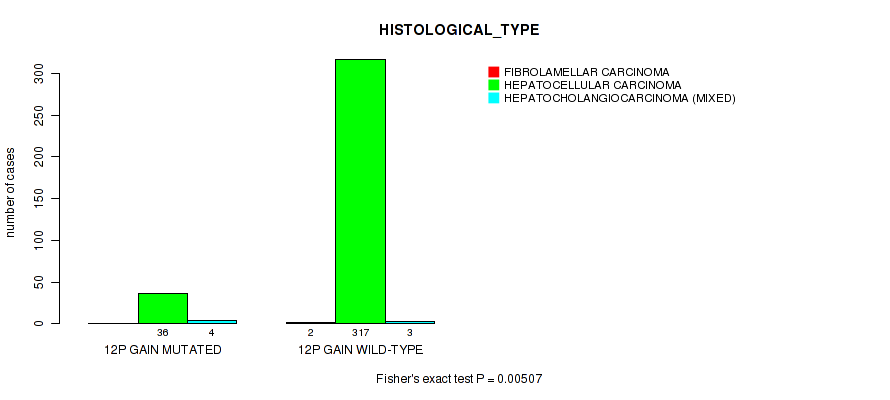
12p gain cnv correlated to 'HISTOLOGICAL_TYPE'.
-
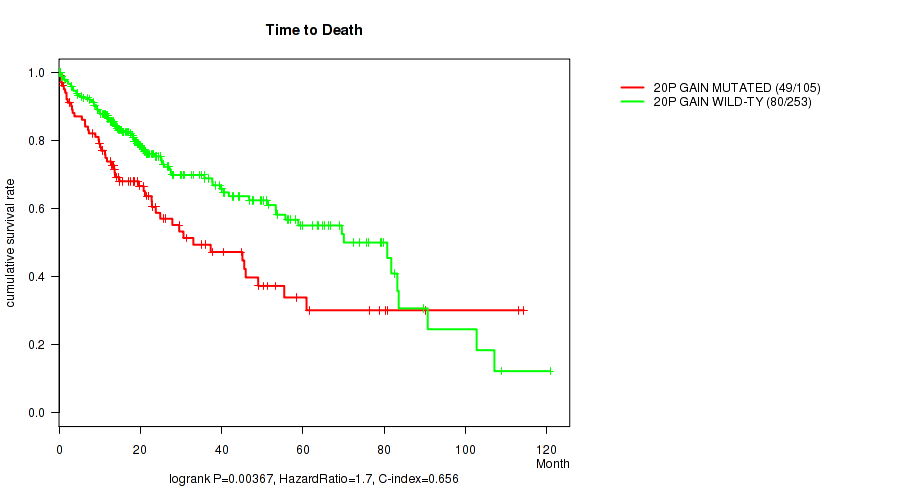
20p gain cnv correlated to 'Time to Death'.
-
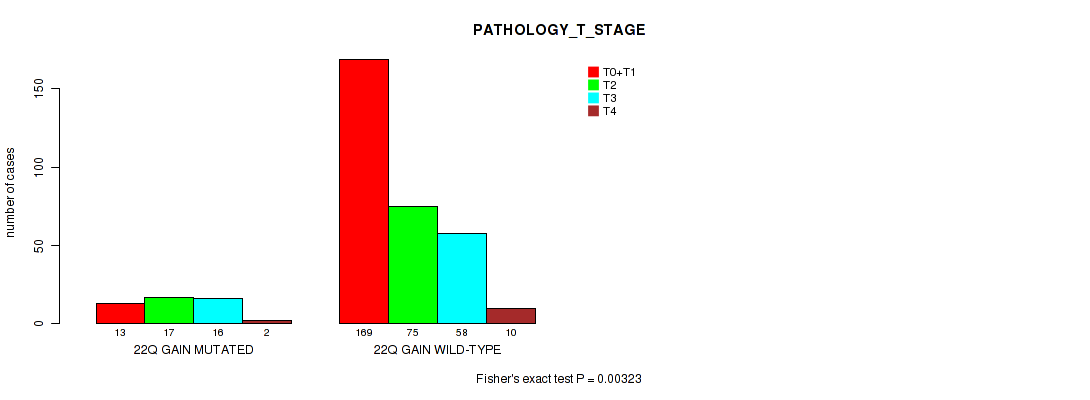
22q gain cnv correlated to 'PATHOLOGY_T_STAGE'.
-
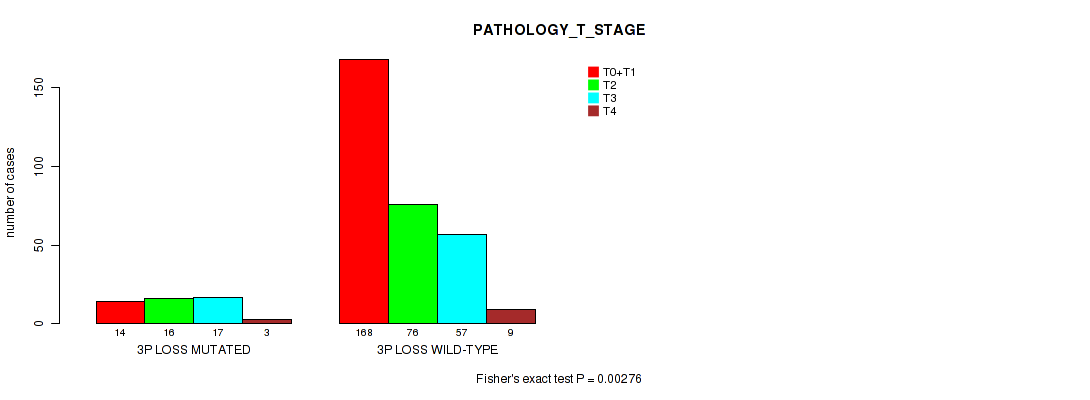
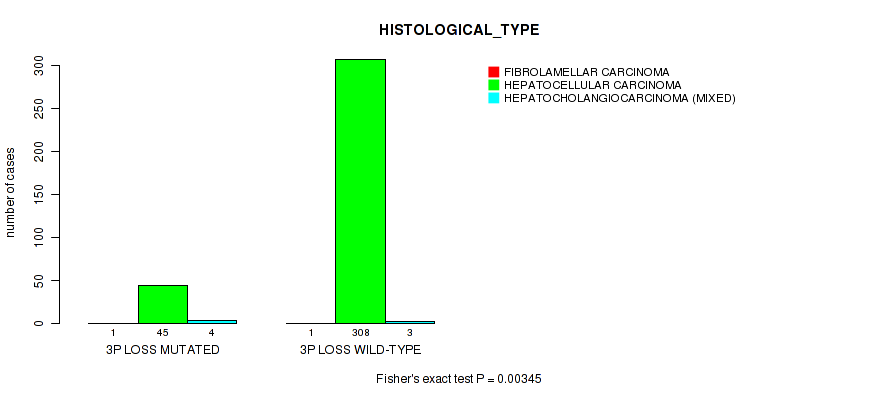
3p loss cnv correlated to 'PATHOLOGY_T_STAGE' and 'HISTOLOGICAL_TYPE'.
-
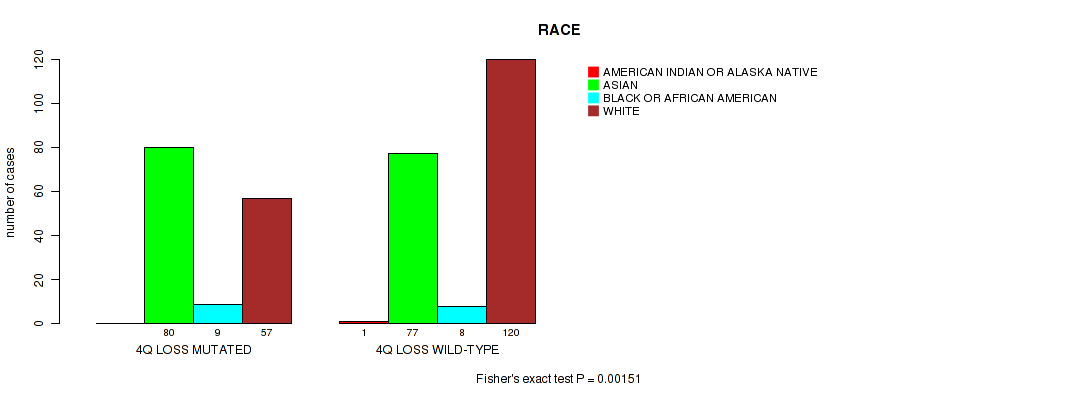
4q loss cnv correlated to 'RACE'.
-
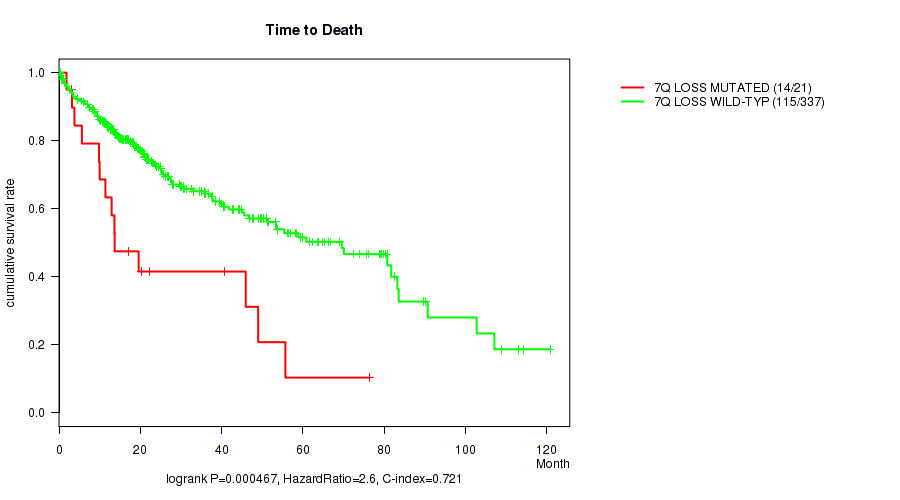
7q loss cnv correlated to 'Time to Death'.
-
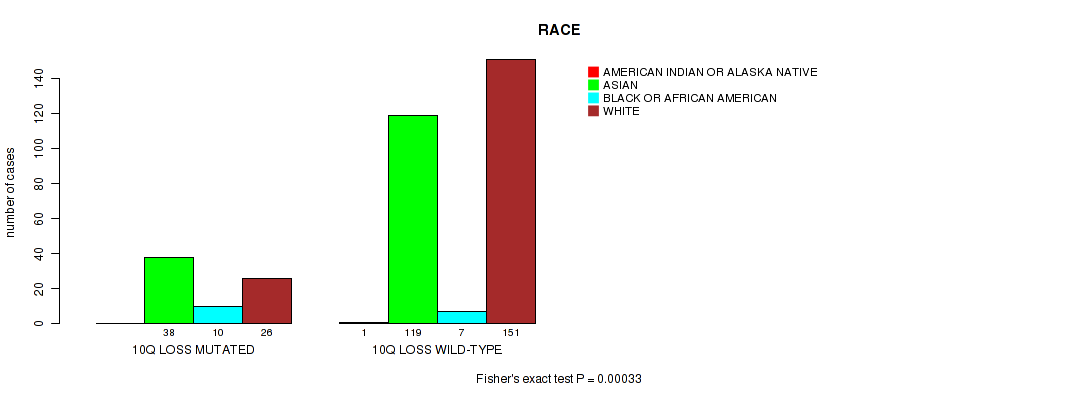
10q loss cnv correlated to 'RACE'.
-
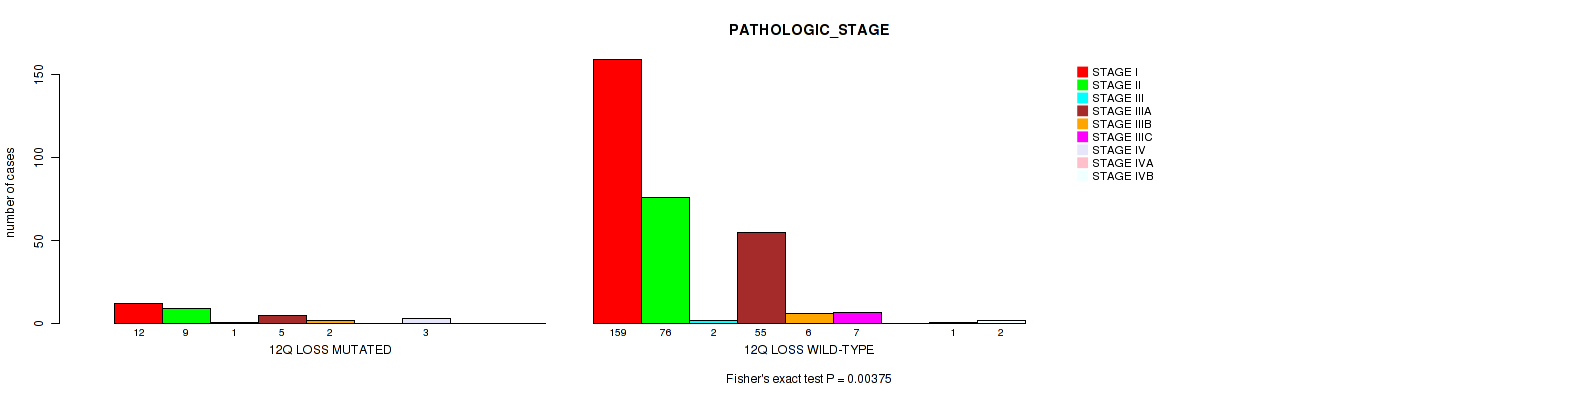
12q loss cnv correlated to 'PATHOLOGIC_STAGE'.
-
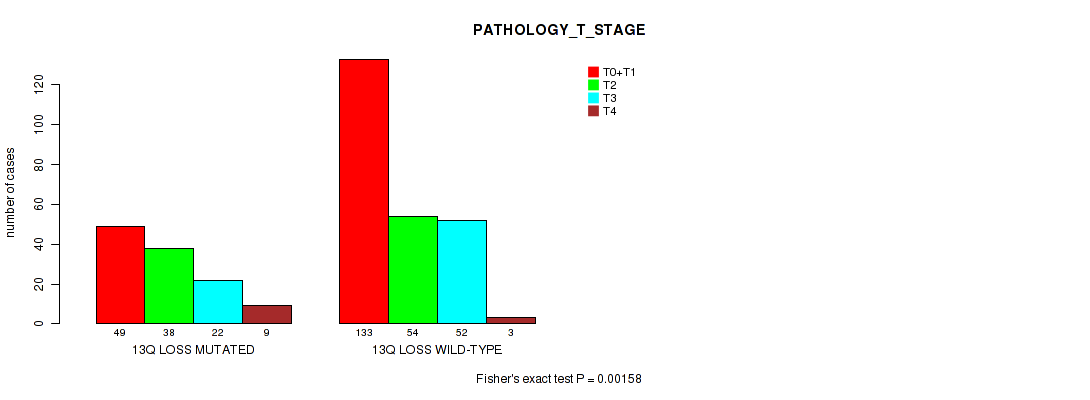
13q loss cnv correlated to 'PATHOLOGY_T_STAGE'.
-
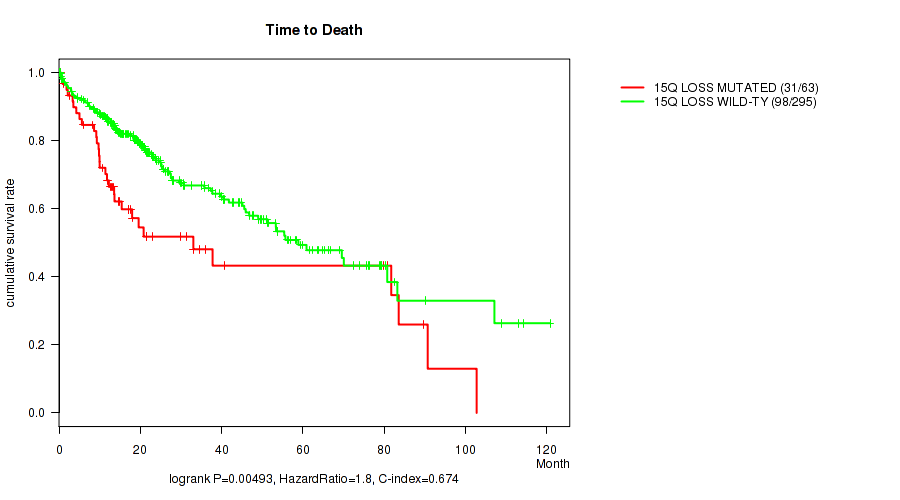
15q loss cnv correlated to 'Time to Death'.
-
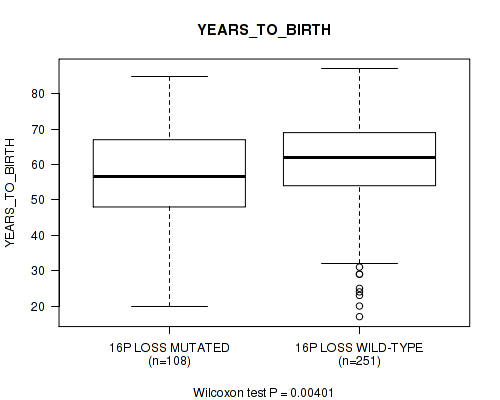
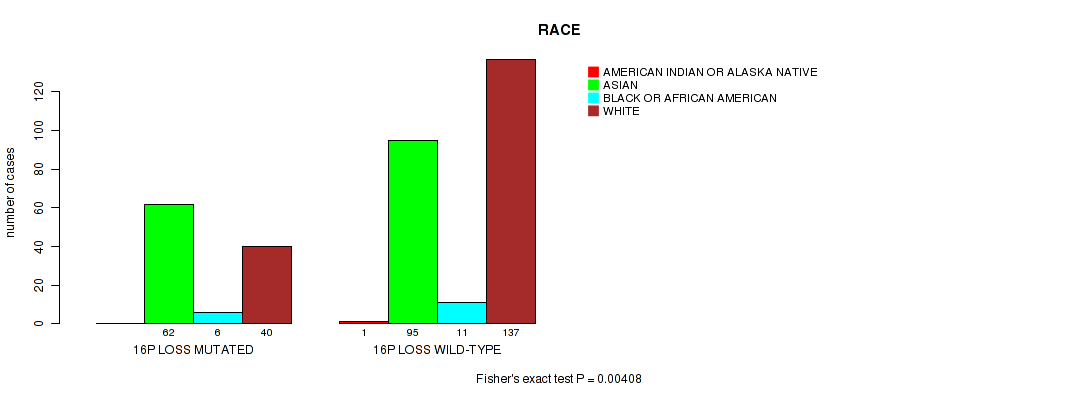
16p loss cnv correlated to 'YEARS_TO_BIRTH' and 'RACE'.
-
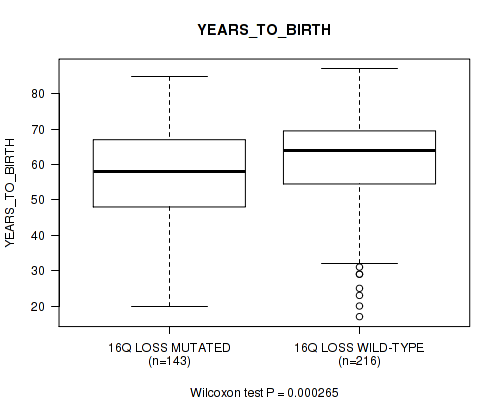
16q loss cnv correlated to 'YEARS_TO_BIRTH' and 'RACE'.
-
17p loss cnv correlated to 'PATHOLOGIC_STAGE'.
-
xp loss cnv correlated to 'GENDER'.
Table 1. Get Full Table Overview of the association between significant copy number variation of 82 arm-level events and 12 clinical features. Shown in the table are P values (Q values). Thresholded by Q value < 0.25, 20 significant findings detected.
|
Clinical Features |
Time to Death |
YEARS TO BIRTH |
PATHOLOGIC STAGE |
PATHOLOGY T STAGE |
PATHOLOGY N STAGE |
PATHOLOGY M STAGE |
GENDER |
RADIATION THERAPY |
HISTOLOGICAL TYPE |
RESIDUAL TUMOR |
RACE | ETHNICITY | ||
| nCNV (%) | nWild-Type | logrank test | Wilcoxon-test | Fisher's exact test | Fisher's exact test | Fisher's exact test | Fisher's exact test | Fisher's exact test | Fisher's exact test | Fisher's exact test | Fisher's exact test | Fisher's exact test | Fisher's exact test | |
| 3p loss | 50 (14%) | 312 |
0.716 (1.00) |
0.165 (0.659) |
0.0134 (0.355) |
0.00276 (0.227) |
0.361 (0.811) |
0.444 (0.86) |
0.328 (0.798) |
0.599 (0.956) |
0.00345 (0.227) |
0.388 (0.823) |
0.971 (1.00) |
1 (1.00) |
| 16p loss | 109 (30%) | 253 |
0.0601 (0.58) |
0.00401 (0.227) |
0.296 (0.772) |
0.386 (0.823) |
0.251 (0.736) |
0.607 (0.956) |
0.325 (0.797) |
0.11 (0.601) |
1 (1.00) |
0.131 (0.625) |
0.00408 (0.227) |
0.23 (0.736) |
| 16q loss | 144 (40%) | 218 |
0.0944 (0.58) |
0.000265 (0.0766) |
0.103 (0.601) |
0.0828 (0.58) |
0.579 (0.954) |
1 (1.00) |
0.357 (0.811) |
0.708 (1.00) |
0.732 (1.00) |
0.633 (0.966) |
2e-05 (0.0197) |
0.392 (0.823) |
| 2p gain | 44 (12%) | 318 |
0.136 (0.625) |
0.108 (0.601) |
0.0898 (0.58) |
0.0855 (0.58) |
0.043 (0.549) |
0.0727 (0.58) |
9.35e-05 (0.046) |
1 (1.00) |
0.39 (0.823) |
0.0724 (0.58) |
0.275 (0.748) |
0.675 (0.999) |
| 2q gain | 40 (11%) | 322 |
0.141 (0.63) |
0.441 (0.858) |
0.153 (0.647) |
0.143 (0.63) |
0.335 (0.801) |
0.0727 (0.58) |
0.000466 (0.0766) |
1 (1.00) |
0.349 (0.809) |
0.219 (0.736) |
0.718 (1.00) |
0.653 (0.98) |
| 8q gain | 185 (51%) | 177 |
0.879 (1.00) |
0.133 (0.625) |
0.211 (0.729) |
0.337 (0.801) |
0.595 (0.956) |
1 (1.00) |
0.00103 (0.127) |
0.121 (0.613) |
0.637 (0.966) |
1 (1.00) |
0.0331 (0.477) |
1 (1.00) |
| 12p gain | 40 (11%) | 322 |
0.0526 (0.58) |
0.436 (0.856) |
0.228 (0.736) |
0.0816 (0.58) |
1 (1.00) |
1 (1.00) |
0.28 (0.748) |
1 (1.00) |
0.00507 (0.249) |
0.772 (1.00) |
0.963 (1.00) |
1 (1.00) |
| 20p gain | 107 (30%) | 255 |
0.00367 (0.227) |
0.0274 (0.456) |
0.0854 (0.58) |
0.118 (0.61) |
1 (1.00) |
0.0924 (0.58) |
0.219 (0.736) |
0.678 (0.999) |
1 (1.00) |
0.328 (0.798) |
0.814 (1.00) |
1 (1.00) |
| 22q gain | 48 (13%) | 314 |
0.622 (0.963) |
0.905 (1.00) |
0.0241 (0.443) |
0.00323 (0.227) |
0.326 (0.797) |
1 (1.00) |
0.244 (0.736) |
0.6 (0.956) |
0.424 (0.852) |
0.312 (0.786) |
0.939 (1.00) |
1 (1.00) |
| 4q loss | 146 (40%) | 216 |
0.198 (0.704) |
0.00536 (0.251) |
0.332 (0.8) |
0.515 (0.914) |
0.57 (0.949) |
0.324 (0.797) |
0.25 (0.736) |
0.707 (1.00) |
0.735 (1.00) |
0.438 (0.856) |
0.00151 (0.155) |
0.396 (0.829) |
| 7q loss | 21 (6%) | 341 |
0.000467 (0.0766) |
0.421 (0.851) |
0.949 (1.00) |
0.881 (1.00) |
1 (1.00) |
1 (1.00) |
0.0147 (0.358) |
0.346 (0.808) |
1 (1.00) |
0.13 (0.625) |
0.142 (0.63) |
0.546 (0.936) |
| 10q loss | 74 (20%) | 288 |
0.102 (0.601) |
0.943 (1.00) |
0.353 (0.809) |
0.196 (0.702) |
0.485 (0.899) |
0.583 (0.955) |
0.576 (0.954) |
1 (1.00) |
0.0286 (0.456) |
0.444 (0.86) |
0.00033 (0.0766) |
1 (1.00) |
| 12q loss | 33 (9%) | 329 |
0.218 (0.736) |
0.0873 (0.58) |
0.00375 (0.227) |
0.498 (0.91) |
1 (1.00) |
0.0566 (0.58) |
0.696 (1.00) |
1 (1.00) |
0.58 (0.954) |
0.0937 (0.58) |
0.209 (0.726) |
0.344 (0.805) |
| 13q loss | 118 (33%) | 244 |
0.181 (0.69) |
0.56 (0.944) |
0.0711 (0.58) |
0.00158 (0.155) |
1 (1.00) |
0.6 (0.956) |
0.12 (0.613) |
0.434 (0.856) |
0.248 (0.736) |
0.0815 (0.58) |
0.916 (1.00) |
1 (1.00) |
| 15q loss | 65 (18%) | 297 |
0.00493 (0.249) |
0.807 (1.00) |
0.0289 (0.456) |
0.00945 (0.321) |
0.086 (0.58) |
0.583 (0.955) |
0.884 (1.00) |
1 (1.00) |
0.742 (1.00) |
0.78 (1.00) |
0.207 (0.724) |
0.71 (1.00) |
| 17p loss | 179 (49%) | 183 |
0.00862 (0.314) |
0.552 (0.941) |
0.00092 (0.127) |
0.0118 (0.342) |
0.247 (0.736) |
0.622 (0.963) |
1 (1.00) |
1 (1.00) |
0.638 (0.966) |
0.282 (0.753) |
0.302 (0.773) |
0.412 (0.844) |
| xp loss | 92 (25%) | 270 |
0.291 (0.766) |
0.0766 (0.58) |
0.789 (1.00) |
0.464 (0.874) |
1 (1.00) |
1 (1.00) |
0.00416 (0.227) |
0.379 (0.823) |
0.419 (0.851) |
0.392 (0.823) |
0.513 (0.913) |
1 (1.00) |
| 1p gain | 56 (15%) | 306 |
0.799 (1.00) |
0.136 (0.625) |
0.454 (0.863) |
0.12 (0.613) |
1 (1.00) |
1 (1.00) |
0.161 (0.658) |
1 (1.00) |
1 (1.00) |
0.259 (0.744) |
0.0765 (0.58) |
0.234 (0.736) |
| 1q gain | 220 (61%) | 142 |
0.966 (1.00) |
0.51 (0.911) |
0.51 (0.911) |
0.611 (0.956) |
0.56 (0.944) |
0.3 (0.773) |
0.563 (0.944) |
0.709 (1.00) |
0.133 (0.625) |
0.647 (0.974) |
0.147 (0.632) |
1 (1.00) |
| 3p gain | 35 (10%) | 327 |
0.244 (0.736) |
0.539 (0.936) |
0.325 (0.797) |
0.794 (1.00) |
0.25 (0.736) |
0.351 (0.809) |
0.13 (0.625) |
1 (1.00) |
1 (1.00) |
0.241 (0.736) |
0.776 (1.00) |
0.373 (0.821) |
| 3q gain | 38 (10%) | 324 |
0.0473 (0.574) |
0.727 (1.00) |
0.332 (0.8) |
0.782 (1.00) |
0.269 (0.744) |
0.362 (0.811) |
0.145 (0.63) |
1 (1.00) |
0.635 (0.966) |
0.275 (0.748) |
0.629 (0.966) |
0.153 (0.647) |
| 4p gain | 26 (7%) | 336 |
0.121 (0.613) |
0.704 (1.00) |
0.632 (0.966) |
0.59 (0.956) |
1 (1.00) |
1 (1.00) |
0.125 (0.618) |
1 (1.00) |
1 (1.00) |
0.878 (1.00) |
1 (1.00) |
0.61 (0.956) |
| 4q gain | 7 (2%) | 355 |
0.931 (1.00) |
0.24 (0.736) |
0.759 (1.00) |
0.68 (0.999) |
1 (1.00) |
1 (1.00) |
1 (1.00) |
1 (1.00) |
1 (1.00) |
0.17 (0.662) |
0.579 (0.954) |
0.238 (0.736) |
| 5p gain | 135 (37%) | 227 |
0.07 (0.58) |
0.116 (0.603) |
0.337 (0.801) |
0.0721 (0.58) |
0.554 (0.942) |
1 (1.00) |
0.726 (1.00) |
0.108 (0.601) |
0.732 (1.00) |
0.834 (1.00) |
0.933 (1.00) |
1 (1.00) |
| 5q gain | 107 (30%) | 255 |
0.246 (0.736) |
0.067 (0.58) |
0.92 (1.00) |
0.358 (0.811) |
0.563 (0.944) |
1 (1.00) |
0.107 (0.601) |
0.0264 (0.456) |
1 (1.00) |
0.677 (0.999) |
0.822 (1.00) |
0.54 (0.936) |
| 6p gain | 114 (31%) | 248 |
0.292 (0.766) |
0.157 (0.654) |
0.541 (0.936) |
0.231 (0.736) |
0.555 (0.942) |
0.596 (0.956) |
0.332 (0.8) |
0.438 (0.856) |
0.715 (1.00) |
0.61 (0.956) |
0.285 (0.757) |
0.363 (0.811) |
| 6q gain | 64 (18%) | 298 |
0.302 (0.773) |
0.738 (1.00) |
0.196 (0.702) |
0.233 (0.736) |
1 (1.00) |
0.14 (0.63) |
0.237 (0.736) |
1 (1.00) |
1 (1.00) |
0.244 (0.736) |
0.348 (0.809) |
0.0639 (0.58) |
| 7p gain | 109 (30%) | 253 |
0.813 (1.00) |
0.0159 (0.372) |
0.382 (0.823) |
0.741 (1.00) |
0.196 (0.702) |
1 (1.00) |
0.325 (0.797) |
1 (1.00) |
0.709 (1.00) |
0.777 (1.00) |
0.26 (0.744) |
0.548 (0.936) |
| 7q gain | 109 (30%) | 253 |
0.606 (0.956) |
0.00712 (0.292) |
0.375 (0.822) |
0.456 (0.866) |
0.201 (0.712) |
1 (1.00) |
1 (1.00) |
0.437 (0.856) |
0.705 (1.00) |
0.97 (1.00) |
0.109 (0.601) |
0.234 (0.736) |
| 8p gain | 78 (22%) | 284 |
0.758 (1.00) |
0.0909 (0.58) |
0.984 (1.00) |
0.879 (1.00) |
1 (1.00) |
1 (1.00) |
0.0391 (0.506) |
0.164 (0.659) |
0.372 (0.821) |
0.128 (0.623) |
0.142 (0.63) |
0.488 (0.899) |
| 9p gain | 19 (5%) | 343 |
0.854 (1.00) |
0.205 (0.722) |
0.0806 (0.58) |
0.123 (0.613) |
1 (1.00) |
0.222 (0.736) |
0.321 (0.796) |
1 (1.00) |
0.0746 (0.58) |
0.206 (0.724) |
0.301 (0.773) |
0.488 (0.899) |
| 9q gain | 21 (6%) | 341 |
0.718 (1.00) |
0.144 (0.63) |
0.126 (0.618) |
0.0922 (0.58) |
1 (1.00) |
0.234 (0.736) |
0.0514 (0.58) |
1 (1.00) |
0.418 (0.851) |
0.252 (0.736) |
0.706 (1.00) |
0.546 (0.936) |
| 10p gain | 61 (17%) | 301 |
0.19 (0.699) |
0.00988 (0.324) |
0.0897 (0.58) |
0.0901 (0.58) |
1 (1.00) |
0.14 (0.63) |
1 (1.00) |
0.321 (0.796) |
0.378 (0.823) |
0.85 (1.00) |
0.354 (0.809) |
0.253 (0.736) |
| 10q gain | 37 (10%) | 325 |
0.812 (1.00) |
0.136 (0.625) |
0.102 (0.601) |
0.0917 (0.58) |
1 (1.00) |
0.0605 (0.58) |
0.457 (0.866) |
0.499 (0.91) |
0.625 (0.965) |
0.914 (1.00) |
0.961 (1.00) |
0.144 (0.63) |
| 11p gain | 17 (5%) | 345 |
0.452 (0.863) |
0.807 (1.00) |
0.386 (0.823) |
0.252 (0.736) |
1 (1.00) |
0.196 (0.702) |
0.428 (0.854) |
1 (1.00) |
1 (1.00) |
0.0139 (0.358) |
0.85 (1.00) |
1 (1.00) |
| 11q gain | 18 (5%) | 344 |
0.38 (0.823) |
0.634 (0.966) |
0.239 (0.736) |
0.088 (0.58) |
1 (1.00) |
0.222 (0.736) |
0.298 (0.773) |
1 (1.00) |
1 (1.00) |
0.0205 (0.421) |
0.723 (1.00) |
1 (1.00) |
| 12q gain | 46 (13%) | 316 |
0.887 (1.00) |
0.401 (0.833) |
0.0584 (0.58) |
0.064 (0.58) |
0.353 (0.809) |
1 (1.00) |
0.309 (0.779) |
0.603 (0.956) |
0.0612 (0.58) |
0.427 (0.854) |
1 (1.00) |
0.67 (0.995) |
| 13q gain | 23 (6%) | 339 |
0.233 (0.736) |
0.952 (1.00) |
0.131 (0.625) |
0.644 (0.971) |
0.21 (0.726) |
0.247 (0.736) |
0.105 (0.601) |
0.374 (0.821) |
1 (1.00) |
0.235 (0.736) |
0.544 (0.936) |
0.184 (0.692) |
| 14q gain | 23 (6%) | 339 |
0.525 (0.927) |
0.461 (0.872) |
0.498 (0.91) |
0.54 (0.936) |
1 (1.00) |
0.196 (0.702) |
0.248 (0.736) |
1 (1.00) |
0.107 (0.601) |
0.0915 (0.58) |
0.189 (0.699) |
0.565 (0.945) |
| 15q gain | 33 (9%) | 329 |
0.508 (0.911) |
0.994 (1.00) |
0.444 (0.86) |
0.351 (0.809) |
1 (1.00) |
1 (1.00) |
0.696 (1.00) |
1 (1.00) |
0.192 (0.7) |
0.903 (1.00) |
0.603 (0.956) |
0.344 (0.805) |
| 16p gain | 29 (8%) | 333 |
0.389 (0.823) |
0.144 (0.63) |
0.313 (0.786) |
0.251 (0.736) |
1 (1.00) |
1 (1.00) |
1 (1.00) |
0.105 (0.601) |
0.0818 (0.58) |
0.575 (0.954) |
0.386 (0.823) |
0.61 (0.956) |
| 16q gain | 15 (4%) | 347 |
0.701 (1.00) |
0.0495 (0.58) |
0.254 (0.737) |
0.166 (0.659) |
1 (1.00) |
1 (1.00) |
0.783 (1.00) |
0.271 (0.744) |
0.0232 (0.438) |
0.355 (0.809) |
0.229 (0.736) |
0.399 (0.831) |
| 17p gain | 30 (8%) | 332 |
0.834 (1.00) |
0.568 (0.949) |
0.212 (0.73) |
0.163 (0.659) |
1 (1.00) |
1 (1.00) |
1 (1.00) |
1 (1.00) |
0.544 (0.936) |
0.0853 (0.58) |
0.276 (0.748) |
0.612 (0.956) |
| 17q gain | 93 (26%) | 269 |
0.604 (0.956) |
0.499 (0.91) |
0.434 (0.856) |
0.186 (0.692) |
0.576 (0.954) |
0.266 (0.744) |
0.0949 (0.58) |
1 (1.00) |
0.825 (1.00) |
0.0594 (0.58) |
0.0879 (0.58) |
1 (1.00) |
| 18p gain | 35 (10%) | 327 |
0.823 (1.00) |
0.42 (0.851) |
0.115 (0.601) |
0.16 (0.658) |
1 (1.00) |
0.34 (0.802) |
0.849 (1.00) |
1 (1.00) |
1 (1.00) |
0.0942 (0.58) |
0.0629 (0.58) |
1 (1.00) |
| 18q gain | 27 (7%) | 335 |
0.77 (1.00) |
0.153 (0.647) |
0.0586 (0.58) |
0.161 (0.658) |
1 (1.00) |
0.271 (0.744) |
0.668 (0.994) |
1 (1.00) |
1 (1.00) |
0.0361 (0.489) |
0.184 (0.692) |
1 (1.00) |
| 19p gain | 54 (15%) | 308 |
0.379 (0.823) |
0.501 (0.91) |
0.0798 (0.58) |
0.913 (1.00) |
0.396 (0.829) |
0.0124 (0.348) |
0.0388 (0.506) |
1 (1.00) |
0.481 (0.895) |
0.106 (0.601) |
0.262 (0.744) |
0.424 (0.852) |
| 19q gain | 70 (19%) | 292 |
0.364 (0.811) |
0.27 (0.744) |
0.173 (0.674) |
0.773 (1.00) |
0.47 (0.878) |
0.0248 (0.443) |
0.317 (0.791) |
1 (1.00) |
0.757 (1.00) |
0.165 (0.659) |
0.681 (0.999) |
0.302 (0.773) |
| 20q gain | 111 (31%) | 251 |
0.0221 (0.427) |
0.0387 (0.506) |
0.187 (0.694) |
0.111 (0.601) |
1 (1.00) |
0.598 (0.956) |
0.541 (0.936) |
0.679 (0.999) |
1 (1.00) |
0.35 (0.809) |
0.887 (1.00) |
0.762 (1.00) |
| 21q gain | 26 (7%) | 336 |
0.476 (0.889) |
0.663 (0.99) |
0.0177 (0.396) |
0.011 (0.342) |
1 (1.00) |
1 (1.00) |
0.827 (1.00) |
1 (1.00) |
0.493 (0.905) |
0.02 (0.421) |
0.338 (0.801) |
1 (1.00) |
| xp gain | 41 (11%) | 321 |
0.693 (1.00) |
0.404 (0.835) |
0.965 (1.00) |
0.782 (1.00) |
1 (1.00) |
1 (1.00) |
1 (1.00) |
0.176 (0.681) |
1 (1.00) |
0.429 (0.854) |
0.19 (0.699) |
1 (1.00) |
| xq gain | 63 (17%) | 299 |
0.409 (0.839) |
0.671 (0.996) |
0.996 (1.00) |
0.989 (1.00) |
1 (1.00) |
1 (1.00) |
0.18 (0.688) |
0.0971 (0.586) |
0.735 (1.00) |
0.854 (1.00) |
0.25 (0.736) |
0.707 (1.00) |
| 1p loss | 81 (22%) | 281 |
0.683 (1) |
0.335 (0.801) |
0.5 (0.91) |
0.362 (0.811) |
0.544 (0.936) |
0.0554 (0.58) |
0.279 (0.748) |
0.355 (0.809) |
0.289 (0.762) |
0.331 (0.8) |
0.791 (1.00) |
1 (1.00) |
| 1q loss | 22 (6%) | 340 |
0.0462 (0.572) |
0.51 (0.911) |
0.48 (0.894) |
0.339 (0.802) |
0.168 (0.659) |
1 (1.00) |
0.641 (0.969) |
1 (1.00) |
0.437 (0.856) |
0.276 (0.748) |
0.652 (0.979) |
1 (1.00) |
| 2p loss | 31 (9%) | 331 |
0.751 (1.00) |
0.797 (1.00) |
0.717 (1.00) |
0.634 (0.966) |
1 (1.00) |
1 (1.00) |
0.315 (0.787) |
0.452 (0.863) |
0.557 (0.943) |
0.234 (0.736) |
0.714 (1.00) |
0.612 (0.956) |
| 2q loss | 36 (10%) | 326 |
0.748 (1.00) |
0.25 (0.736) |
0.95 (1.00) |
0.959 (1.00) |
1 (1.00) |
1 (1.00) |
0.707 (1.00) |
0.511 (0.911) |
0.614 (0.957) |
0.125 (0.618) |
0.719 (1.00) |
1 (1.00) |
| 3q loss | 38 (10%) | 324 |
0.268 (0.744) |
0.147 (0.632) |
0.11 (0.601) |
0.0509 (0.58) |
0.288 (0.762) |
1 (1.00) |
0.467 (0.877) |
1 (1.00) |
0.063 (0.58) |
0.595 (0.956) |
0.963 (1.00) |
1 (1.00) |
| 4p loss | 106 (29%) | 256 |
0.449 (0.863) |
0.0801 (0.58) |
0.0363 (0.489) |
0.136 (0.625) |
0.191 (0.699) |
0.0864 (0.58) |
0.108 (0.601) |
1 (1.00) |
1 (1.00) |
0.419 (0.851) |
0.0519 (0.58) |
0.0663 (0.58) |
| 5p loss | 28 (8%) | 334 |
0.305 (0.777) |
0.0506 (0.58) |
0.397 (0.829) |
0.227 (0.736) |
0.25 (0.736) |
1 (1.00) |
0.528 (0.932) |
0.401 (0.833) |
0.0284 (0.456) |
0.889 (1.00) |
0.262 (0.744) |
1 (1.00) |
| 5q loss | 39 (11%) | 323 |
0.107 (0.601) |
0.0594 (0.58) |
0.222 (0.736) |
0.0144 (0.358) |
0.298 (0.773) |
1 (1.00) |
0.856 (1.00) |
0.522 (0.923) |
0.0149 (0.358) |
0.917 (1.00) |
0.57 (0.949) |
1 (1.00) |
| 6p loss | 27 (7%) | 335 |
0.892 (1.00) |
0.621 (0.963) |
0.177 (0.685) |
0.327 (0.798) |
0.23 (0.736) |
0.294 (0.771) |
0.0298 (0.458) |
1 (1.00) |
1 (1.00) |
1 (1.00) |
0.183 (0.692) |
1 (1.00) |
| 6q loss | 91 (25%) | 271 |
0.51 (0.911) |
0.0115 (0.342) |
0.315 (0.787) |
0.702 (1.00) |
0.168 (0.659) |
0.305 (0.777) |
0.0197 (0.421) |
0.201 (0.712) |
0.415 (0.85) |
1 (1.00) |
0.628 (0.966) |
1 (1.00) |
| 7p loss | 16 (4%) | 346 |
0.0937 (0.58) |
0.511 (0.911) |
0.965 (1.00) |
0.829 (1.00) |
1 (1.00) |
1 (1.00) |
0.166 (0.659) |
0.271 (0.744) |
1 (1.00) |
0.387 (0.823) |
0.759 (1.00) |
0.445 (0.86) |
| 8p loss | 186 (51%) | 176 |
0.681 (0.999) |
0.18 (0.688) |
0.246 (0.736) |
0.592 (0.956) |
0.116 (0.603) |
1 (1.00) |
0.91 (1.00) |
1 (1.00) |
0.0252 (0.443) |
0.563 (0.944) |
0.0922 (0.58) |
1 (1.00) |
| 8q loss | 42 (12%) | 320 |
0.597 (0.956) |
0.917 (1.00) |
0.427 (0.854) |
0.611 (0.956) |
0.279 (0.748) |
0.404 (0.835) |
0.0532 (0.58) |
1 (1.00) |
0.672 (0.996) |
0.548 (0.936) |
0.657 (0.984) |
1 (1.00) |
| 9p loss | 115 (32%) | 247 |
0.111 (0.601) |
0.0292 (0.456) |
0.267 (0.744) |
0.801 (1.00) |
0.246 (0.736) |
0.105 (0.601) |
0.0704 (0.58) |
1 (1.00) |
1 (1.00) |
0.43 (0.854) |
0.186 (0.692) |
0.236 (0.736) |
| 9q loss | 105 (29%) | 257 |
0.114 (0.601) |
0.806 (1.00) |
0.0727 (0.58) |
0.563 (0.944) |
0.0205 (0.421) |
0.0674 (0.58) |
0.214 (0.733) |
1 (1.00) |
1 (1.00) |
0.303 (0.773) |
0.735 (1.00) |
0.358 (0.811) |
| 10p loss | 44 (12%) | 318 |
0.285 (0.757) |
0.168 (0.659) |
0.154 (0.647) |
0.307 (0.777) |
0.279 (0.748) |
1 (1.00) |
0.863 (1.00) |
0.603 (0.956) |
0.0555 (0.58) |
0.605 (0.956) |
0.21 (0.726) |
1 (1.00) |
| 11p loss | 61 (17%) | 301 |
0.486 (0.899) |
0.698 (1.00) |
0.00814 (0.308) |
0.013 (0.355) |
0.0757 (0.58) |
0.544 (0.936) |
0.764 (1.00) |
1 (1.00) |
0.0672 (0.58) |
0.601 (0.956) |
0.827 (1.00) |
0.242 (0.736) |
| 11q loss | 70 (19%) | 292 |
0.555 (0.942) |
0.453 (0.863) |
0.0357 (0.489) |
0.0886 (0.58) |
0.112 (0.601) |
1 (1.00) |
1 (1.00) |
1 (1.00) |
0.0969 (0.586) |
0.489 (0.9) |
0.919 (1.00) |
0.0808 (0.58) |
| 12p loss | 61 (17%) | 301 |
0.505 (0.911) |
0.446 (0.86) |
0.0174 (0.396) |
0.366 (0.813) |
0.0757 (0.58) |
0.157 (0.654) |
0.547 (0.936) |
0.606 (0.956) |
1 (1.00) |
0.25 (0.736) |
0.432 (0.855) |
0.465 (0.874) |
| 14q loss | 106 (29%) | 256 |
0.0593 (0.58) |
0.115 (0.601) |
0.0453 (0.572) |
0.00688 (0.292) |
1 (1.00) |
0.598 (0.956) |
0.266 (0.744) |
1 (1.00) |
0.36 (0.811) |
0.707 (1.00) |
0.0738 (0.58) |
0.534 (0.936) |
| 17q loss | 37 (10%) | 325 |
0.0593 (0.58) |
0.134 (0.625) |
0.00685 (0.292) |
0.137 (0.625) |
0.0245 (0.443) |
0.373 (0.821) |
0.264 (0.744) |
1 (1.00) |
0.0117 (0.342) |
1 (1.00) |
0.137 (0.625) |
0.373 (0.821) |
| 18p loss | 72 (20%) | 290 |
0.766 (1.00) |
0.423 (0.852) |
0.734 (1.00) |
0.739 (1.00) |
0.508 (0.911) |
1 (1.00) |
0.259 (0.744) |
0.133 (0.625) |
0.00916 (0.321) |
0.837 (1.00) |
0.77 (1.00) |
0.729 (1.00) |
| 18q loss | 77 (21%) | 285 |
0.788 (1.00) |
0.948 (1.00) |
0.716 (1.00) |
1 (1.00) |
0.529 (0.932) |
0.228 (0.736) |
0.337 (0.801) |
0.0342 (0.48) |
0.0465 (0.572) |
0.26 (0.744) |
1 (1.00) |
0.159 (0.657) |
| 19p loss | 54 (15%) | 308 |
0.0787 (0.58) |
0.0218 (0.427) |
0.618 (0.961) |
0.507 (0.911) |
0.405 (0.835) |
1 (1.00) |
0.115 (0.601) |
0.6 (0.956) |
0.482 (0.895) |
0.388 (0.823) |
0.0561 (0.58) |
0.431 (0.854) |
| 19q loss | 38 (10%) | 324 |
0.122 (0.613) |
0.0313 (0.467) |
0.249 (0.736) |
0.379 (0.823) |
0.307 (0.777) |
1 (1.00) |
0.145 (0.63) |
1 (1.00) |
0.636 (0.966) |
0.364 (0.811) |
0.0625 (0.58) |
0.638 (0.966) |
| 20p loss | 24 (7%) | 338 |
0.867 (1.00) |
0.148 (0.634) |
0.184 (0.692) |
0.453 (0.863) |
1 (1.00) |
0.271 (0.744) |
0.825 (1.00) |
0.388 (0.823) |
0.0577 (0.58) |
0.668 (0.994) |
0.652 (0.979) |
0.599 (0.956) |
| 20q loss | 12 (3%) | 350 |
0.341 (0.804) |
0.421 (0.851) |
0.266 (0.744) |
0.696 (1.00) |
1 (1.00) |
1 (1.00) |
0.531 (0.932) |
0.222 (0.736) |
0.0837 (0.58) |
0.255 (0.737) |
0.448 (0.862) |
0.349 (0.809) |
| 21q loss | 108 (30%) | 254 |
0.0334 (0.477) |
0.272 (0.744) |
0.389 (0.823) |
0.914 (1.00) |
0.221 (0.736) |
0.102 (0.601) |
0.0841 (0.58) |
1 (1.00) |
0.114 (0.601) |
0.521 (0.923) |
0.661 (0.989) |
0.535 (0.936) |
| 22q loss | 66 (18%) | 296 |
0.406 (0.835) |
0.277 (0.748) |
0.127 (0.621) |
0.0325 (0.477) |
1 (1.00) |
0.577 (0.954) |
0.383 (0.823) |
0.614 (0.957) |
0.0278 (0.456) |
0.0217 (0.427) |
0.00791 (0.308) |
0.0601 (0.58) |
| xq loss | 68 (19%) | 294 |
0.794 (1.00) |
0.0661 (0.58) |
0.834 (1.00) |
0.468 (0.877) |
0.462 (0.872) |
0.583 (0.955) |
0.0303 (0.458) |
0.626 (0.966) |
0.158 (0.656) |
0.636 (0.966) |
0.162 (0.658) |
1 (1.00) |
P value = 9.35e-05 (Fisher's exact test), Q value = 0.046
Table S1. Gene #3: '2p gain' versus Clinical Feature #7: 'GENDER'
| nPatients | FEMALE | MALE |
|---|---|---|
| ALL | 115 | 247 |
| 2P GAIN MUTATED | 26 | 18 |
| 2P GAIN WILD-TYPE | 89 | 229 |
Figure S1. Get High-res Image Gene #3: '2p gain' versus Clinical Feature #7: 'GENDER'

P value = 0.000466 (Fisher's exact test), Q value = 0.077
Table S2. Gene #4: '2q gain' versus Clinical Feature #7: 'GENDER'
| nPatients | FEMALE | MALE |
|---|---|---|
| ALL | 115 | 247 |
| 2Q GAIN MUTATED | 23 | 17 |
| 2Q GAIN WILD-TYPE | 92 | 230 |
Figure S2. Get High-res Image Gene #4: '2q gain' versus Clinical Feature #7: 'GENDER'
P value = 0.00103 (Fisher's exact test), Q value = 0.13
Table S3. Gene #16: '8q gain' versus Clinical Feature #7: 'GENDER'
| nPatients | FEMALE | MALE |
|---|---|---|
| ALL | 115 | 247 |
| 8Q GAIN MUTATED | 44 | 141 |
| 8Q GAIN WILD-TYPE | 71 | 106 |
Figure S3. Get High-res Image Gene #16: '8q gain' versus Clinical Feature #7: 'GENDER'
P value = 0.00507 (Fisher's exact test), Q value = 0.25
Table S4. Gene #23: '12p gain' versus Clinical Feature #9: 'HISTOLOGICAL_TYPE'
| nPatients | FIBROLAMELLAR CARCINOMA | HEPATOCELLULAR CARCINOMA | HEPATOCHOLANGIOCARCINOMA (MIXED) |
|---|---|---|---|
| ALL | 2 | 353 | 7 |
| 12P GAIN MUTATED | 0 | 36 | 4 |
| 12P GAIN WILD-TYPE | 2 | 317 | 3 |
Figure S4. Get High-res Image Gene #23: '12p gain' versus Clinical Feature #9: 'HISTOLOGICAL_TYPE'
P value = 0.00367 (logrank test), Q value = 0.23
Table S5. Gene #36: '20p gain' versus Clinical Feature #1: 'Time to Death'
| nPatients | nDeath | Duration Range (Median), Month | |
|---|---|---|---|
| ALL | 358 | 129 | 0.0 - 120.8 (19.8) |
| 20P GAIN MUTATED | 105 | 49 | 0.3 - 114.3 (17.6) |
| 20P GAIN WILD-TYPE | 253 | 80 | 0.0 - 120.8 (20.4) |
Figure S5. Get High-res Image Gene #36: '20p gain' versus Clinical Feature #1: 'Time to Death'
P value = 0.00323 (Fisher's exact test), Q value = 0.23
Table S6. Gene #39: '22q gain' versus Clinical Feature #4: 'PATHOLOGY_T_STAGE'
| nPatients | T0+T1 | T2 | T3 | T4 |
|---|---|---|---|---|
| ALL | 182 | 92 | 74 | 12 |
| 22Q GAIN MUTATED | 13 | 17 | 16 | 2 |
| 22Q GAIN WILD-TYPE | 169 | 75 | 58 | 10 |
Figure S6. Get High-res Image Gene #39: '22q gain' versus Clinical Feature #4: 'PATHOLOGY_T_STAGE'
P value = 0.00276 (Fisher's exact test), Q value = 0.23
Table S7. Gene #46: '3p loss' versus Clinical Feature #4: 'PATHOLOGY_T_STAGE'
| nPatients | T0+T1 | T2 | T3 | T4 |
|---|---|---|---|---|
| ALL | 182 | 92 | 74 | 12 |
| 3P LOSS MUTATED | 14 | 16 | 17 | 3 |
| 3P LOSS WILD-TYPE | 168 | 76 | 57 | 9 |
Figure S7. Get High-res Image Gene #46: '3p loss' versus Clinical Feature #4: 'PATHOLOGY_T_STAGE'
P value = 0.00345 (Fisher's exact test), Q value = 0.23
Table S8. Gene #46: '3p loss' versus Clinical Feature #9: 'HISTOLOGICAL_TYPE'
| nPatients | FIBROLAMELLAR CARCINOMA | HEPATOCELLULAR CARCINOMA | HEPATOCHOLANGIOCARCINOMA (MIXED) |
|---|---|---|---|
| ALL | 2 | 353 | 7 |
| 3P LOSS MUTATED | 1 | 45 | 4 |
| 3P LOSS WILD-TYPE | 1 | 308 | 3 |
Figure S8. Get High-res Image Gene #46: '3p loss' versus Clinical Feature #9: 'HISTOLOGICAL_TYPE'
P value = 0.00151 (Fisher's exact test), Q value = 0.16
Table S9. Gene #49: '4q loss' versus Clinical Feature #11: 'RACE'
| nPatients | AMERICAN INDIAN OR ALASKA NATIVE | ASIAN | BLACK OR AFRICAN AMERICAN | WHITE |
|---|---|---|---|---|
| ALL | 1 | 157 | 17 | 177 |
| 4Q LOSS MUTATED | 0 | 80 | 9 | 57 |
| 4Q LOSS WILD-TYPE | 1 | 77 | 8 | 120 |
Figure S9. Get High-res Image Gene #49: '4q loss' versus Clinical Feature #11: 'RACE'
P value = 0.000467 (logrank test), Q value = 0.077
Table S10. Gene #55: '7q loss' versus Clinical Feature #1: 'Time to Death'
| nPatients | nDeath | Duration Range (Median), Month | |
|---|---|---|---|
| ALL | 358 | 129 | 0.0 - 120.8 (19.8) |
| 7Q LOSS MUTATED | 21 | 14 | 0.2 - 76.4 (13.6) |
| 7Q LOSS WILD-TYPE | 337 | 115 | 0.0 - 120.8 (20.0) |
Figure S10. Get High-res Image Gene #55: '7q loss' versus Clinical Feature #1: 'Time to Death'
P value = 0.00033 (Fisher's exact test), Q value = 0.077
Table S11. Gene #61: '10q loss' versus Clinical Feature #11: 'RACE'
| nPatients | AMERICAN INDIAN OR ALASKA NATIVE | ASIAN | BLACK OR AFRICAN AMERICAN | WHITE |
|---|---|---|---|---|
| ALL | 1 | 157 | 17 | 177 |
| 10Q LOSS MUTATED | 0 | 38 | 10 | 26 |
| 10Q LOSS WILD-TYPE | 1 | 119 | 7 | 151 |
Figure S11. Get High-res Image Gene #61: '10q loss' versus Clinical Feature #11: 'RACE'
P value = 0.00375 (Fisher's exact test), Q value = 0.23
Table S12. Gene #65: '12q loss' versus Clinical Feature #3: 'PATHOLOGIC_STAGE'
| nPatients | STAGE I | STAGE II | STAGE III | STAGE IIIA | STAGE IIIB | STAGE IIIC | STAGE IV | STAGE IVA | STAGE IVB |
|---|---|---|---|---|---|---|---|---|---|
| ALL | 171 | 85 | 3 | 60 | 8 | 7 | 3 | 1 | 2 |
| 12Q LOSS MUTATED | 12 | 9 | 1 | 5 | 2 | 0 | 3 | 0 | 0 |
| 12Q LOSS WILD-TYPE | 159 | 76 | 2 | 55 | 6 | 7 | 0 | 1 | 2 |
Figure S12. Get High-res Image Gene #65: '12q loss' versus Clinical Feature #3: 'PATHOLOGIC_STAGE'
P value = 0.00158 (Fisher's exact test), Q value = 0.16
Table S13. Gene #66: '13q loss' versus Clinical Feature #4: 'PATHOLOGY_T_STAGE'
| nPatients | T0+T1 | T2 | T3 | T4 |
|---|---|---|---|---|
| ALL | 182 | 92 | 74 | 12 |
| 13Q LOSS MUTATED | 49 | 38 | 22 | 9 |
| 13Q LOSS WILD-TYPE | 133 | 54 | 52 | 3 |
Figure S13. Get High-res Image Gene #66: '13q loss' versus Clinical Feature #4: 'PATHOLOGY_T_STAGE'
P value = 0.00493 (logrank test), Q value = 0.25
Table S14. Gene #68: '15q loss' versus Clinical Feature #1: 'Time to Death'
| nPatients | nDeath | Duration Range (Median), Month | |
|---|---|---|---|
| ALL | 358 | 129 | 0.0 - 120.8 (19.8) |
| 15Q LOSS MUTATED | 63 | 31 | 0.2 - 102.7 (13.4) |
| 15Q LOSS WILD-TYPE | 295 | 98 | 0.0 - 120.8 (20.9) |
Figure S14. Get High-res Image Gene #68: '15q loss' versus Clinical Feature #1: 'Time to Death'
P value = 0.00401 (Wilcoxon-test), Q value = 0.23
Table S15. Gene #69: '16p loss' versus Clinical Feature #2: 'YEARS_TO_BIRTH'
| nPatients | Mean (Std.Dev) | |
|---|---|---|
| ALL | 359 | 59.7 (12.7) |
| 16P LOSS MUTATED | 108 | 57.1 (12.9) |
| 16P LOSS WILD-TYPE | 251 | 60.8 (12.5) |
Figure S15. Get High-res Image Gene #69: '16p loss' versus Clinical Feature #2: 'YEARS_TO_BIRTH'
P value = 0.00408 (Fisher's exact test), Q value = 0.23
Table S16. Gene #69: '16p loss' versus Clinical Feature #11: 'RACE'
| nPatients | AMERICAN INDIAN OR ALASKA NATIVE | ASIAN | BLACK OR AFRICAN AMERICAN | WHITE |
|---|---|---|---|---|
| ALL | 1 | 157 | 17 | 177 |
| 16P LOSS MUTATED | 0 | 62 | 6 | 40 |
| 16P LOSS WILD-TYPE | 1 | 95 | 11 | 137 |
Figure S16. Get High-res Image Gene #69: '16p loss' versus Clinical Feature #11: 'RACE'
P value = 0.000265 (Wilcoxon-test), Q value = 0.077
Table S17. Gene #70: '16q loss' versus Clinical Feature #2: 'YEARS_TO_BIRTH'
| nPatients | Mean (Std.Dev) | |
|---|---|---|
| ALL | 359 | 59.7 (12.7) |
| 16Q LOSS MUTATED | 143 | 56.9 (12.9) |
| 16Q LOSS WILD-TYPE | 216 | 61.6 (12.3) |
Figure S17. Get High-res Image Gene #70: '16q loss' versus Clinical Feature #2: 'YEARS_TO_BIRTH'
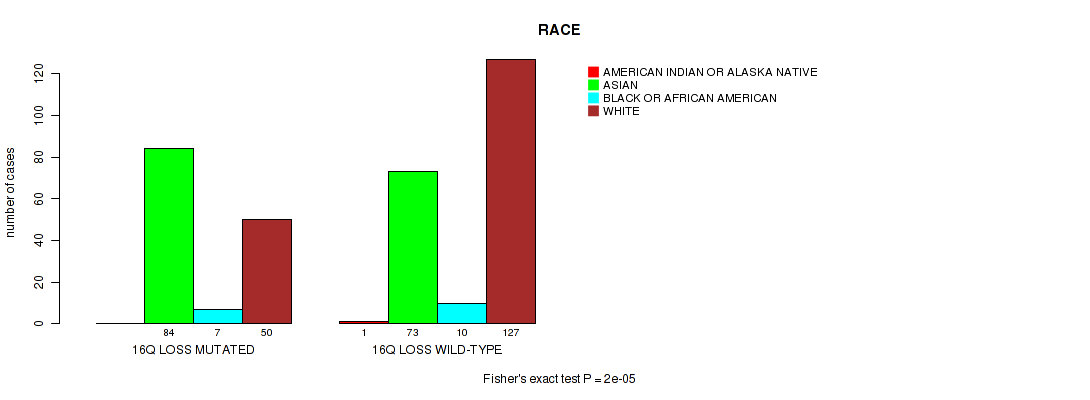
P value = 2e-05 (Fisher's exact test), Q value = 0.02
Table S18. Gene #70: '16q loss' versus Clinical Feature #11: 'RACE'
| nPatients | AMERICAN INDIAN OR ALASKA NATIVE | ASIAN | BLACK OR AFRICAN AMERICAN | WHITE |
|---|---|---|---|---|
| ALL | 1 | 157 | 17 | 177 |
| 16Q LOSS MUTATED | 0 | 84 | 7 | 50 |
| 16Q LOSS WILD-TYPE | 1 | 73 | 10 | 127 |
Figure S18. Get High-res Image Gene #70: '16q loss' versus Clinical Feature #11: 'RACE'
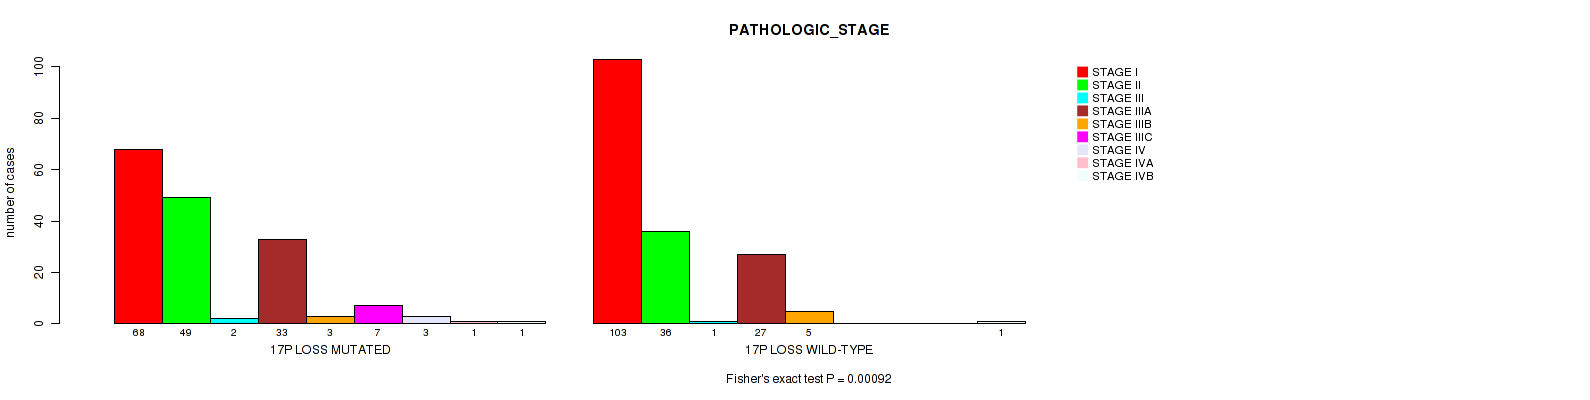
P value = 0.00092 (Fisher's exact test), Q value = 0.13
Table S19. Gene #71: '17p loss' versus Clinical Feature #3: 'PATHOLOGIC_STAGE'
| nPatients | STAGE I | STAGE II | STAGE III | STAGE IIIA | STAGE IIIB | STAGE IIIC | STAGE IV | STAGE IVA | STAGE IVB |
|---|---|---|---|---|---|---|---|---|---|
| ALL | 171 | 85 | 3 | 60 | 8 | 7 | 3 | 1 | 2 |
| 17P LOSS MUTATED | 68 | 49 | 2 | 33 | 3 | 7 | 3 | 1 | 1 |
| 17P LOSS WILD-TYPE | 103 | 36 | 1 | 27 | 5 | 0 | 0 | 0 | 1 |
Figure S19. Get High-res Image Gene #71: '17p loss' versus Clinical Feature #3: 'PATHOLOGIC_STAGE'
P value = 0.00416 (Fisher's exact test), Q value = 0.23
Table S20. Gene #81: 'xp loss' versus Clinical Feature #7: 'GENDER'
| nPatients | FEMALE | MALE |
|---|---|---|
| ALL | 115 | 247 |
| XP LOSS MUTATED | 18 | 74 |
| XP LOSS WILD-TYPE | 97 | 173 |
Figure S20. Get High-res Image Gene #81: 'xp loss' versus Clinical Feature #7: 'GENDER'

-
Copy number data file = broad_values_by_arm.txt from GISTIC pipeline
-
Processed Copy number data file = /xchip/cga/gdac-prod/tcga-gdac/jobResults/GDAC_Correlate_Genomic_Events_Preprocess/LIHC-TP/19782291/transformed.cor.cli.txt
-
Clinical data file = /xchip/cga/gdac-prod/tcga-gdac/jobResults/Append_Data/LIHC-TP/19775332/LIHC-TP.merged_data.txt
-
Number of patients = 362
-
Number of significantly arm-level cnvs = 82
-
Number of selected clinical features = 12
-
Exclude regions that fewer than K tumors have mutations, K = 3
For survival clinical features, the Kaplan-Meier survival curves of tumors with and without gene mutations were plotted and the statistical significance P values were estimated by logrank test (Bland and Altman 2004) using the 'survdiff' function in R
For binary or multi-class clinical features (nominal or ordinal), two-tailed Fisher's exact tests (Fisher 1922) were used to estimate the P values using the 'fisher.test' function in R
For multiple hypothesis correction, Q value is the False Discovery Rate (FDR) analogue of the P value (Benjamini and Hochberg 1995), defined as the minimum FDR at which the test may be called significant. We used the 'Benjamini and Hochberg' method of 'p.adjust' function in R to convert P values into Q values.
In addition to the links below, the full results of the analysis summarized in this report can also be downloaded programmatically using firehose_get, or interactively from either the Broad GDAC website or TCGA Data Coordination Center Portal.