This pipeline computes the correlation between cancer subtypes identified by different molecular patterns and selected clinical features.
Testing the association between subtypes identified by 8 different clustering approaches and 12 clinical features across 368 patients, 34 significant findings detected with P value < 0.05 and Q value < 0.25.
-
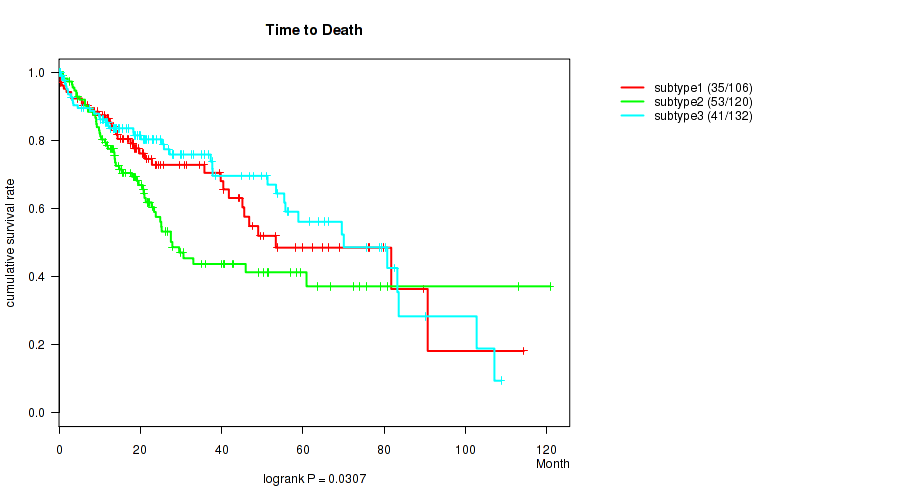
3 subtypes identified in current cancer cohort by 'Copy Number Ratio CNMF subtypes'. These subtypes correlate to 'Time to Death', 'GENDER', and 'RACE'.
-
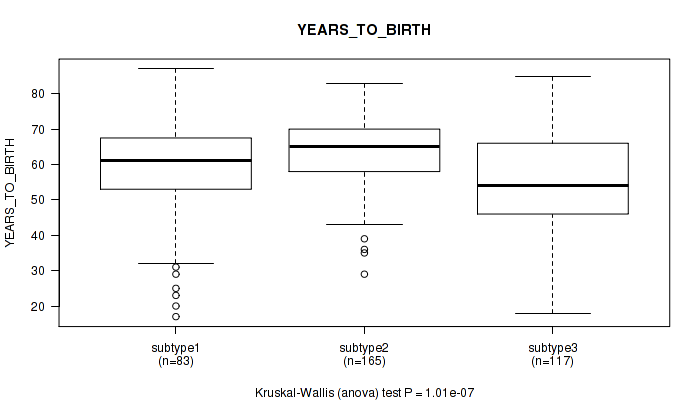
3 subtypes identified in current cancer cohort by 'METHLYATION CNMF'. These subtypes correlate to 'YEARS_TO_BIRTH', 'GENDER', and 'RACE'.
-
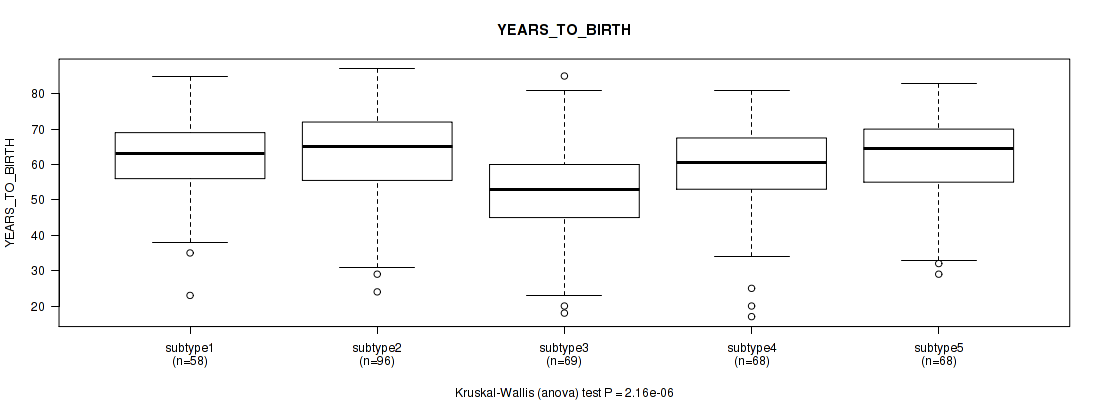
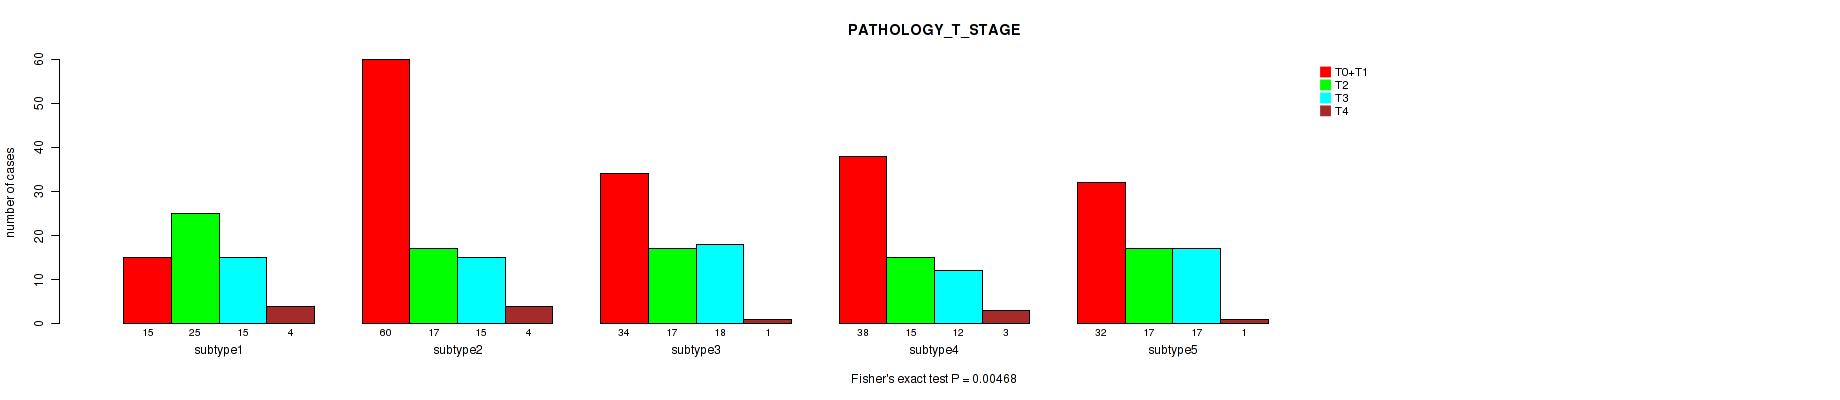
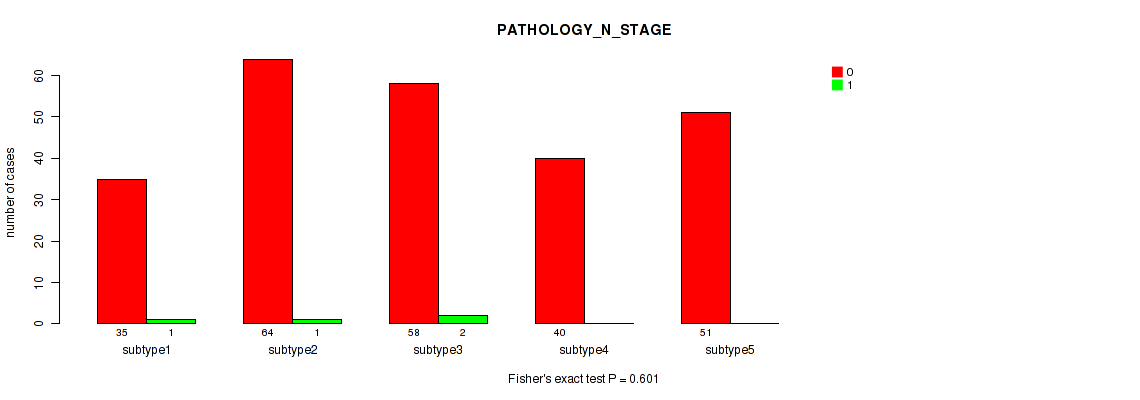
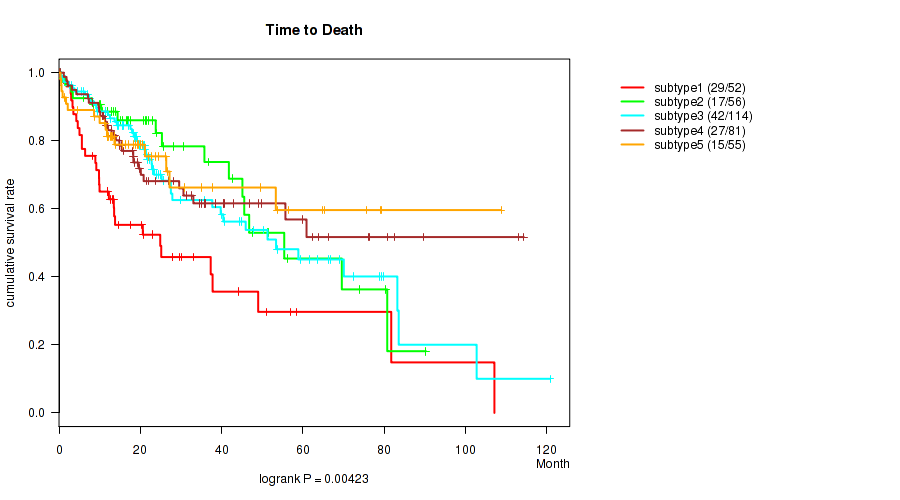
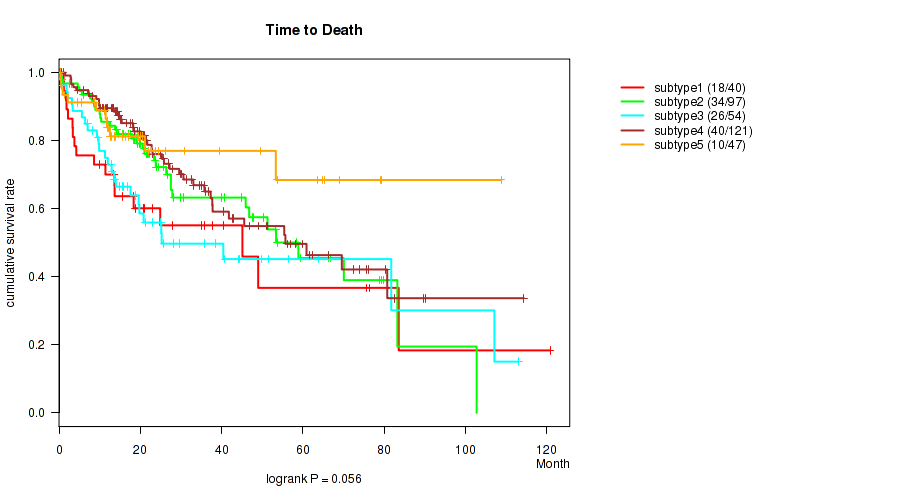
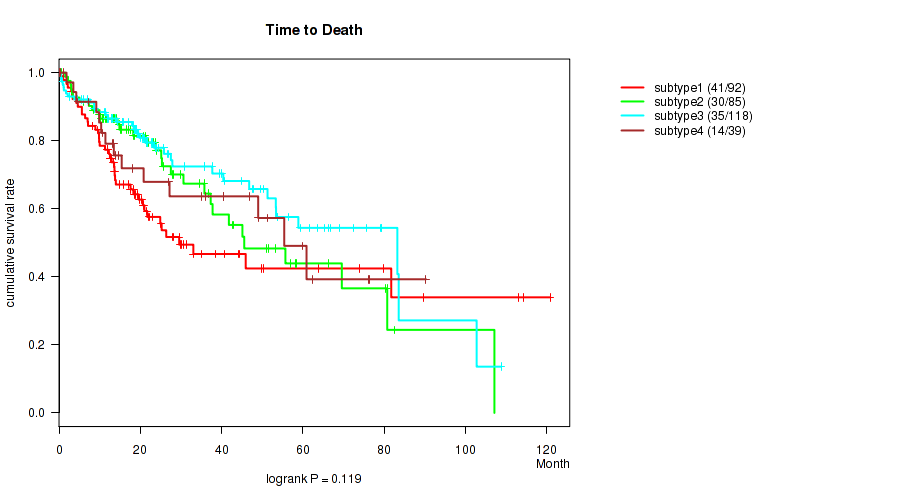
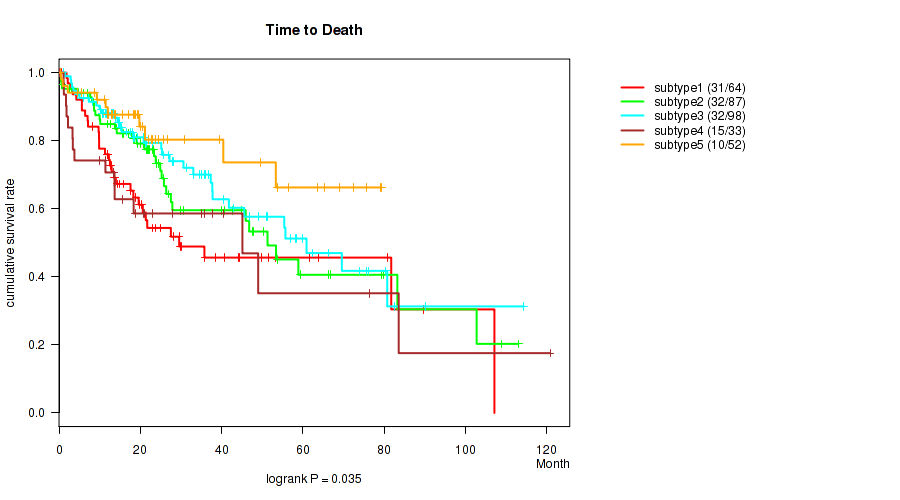
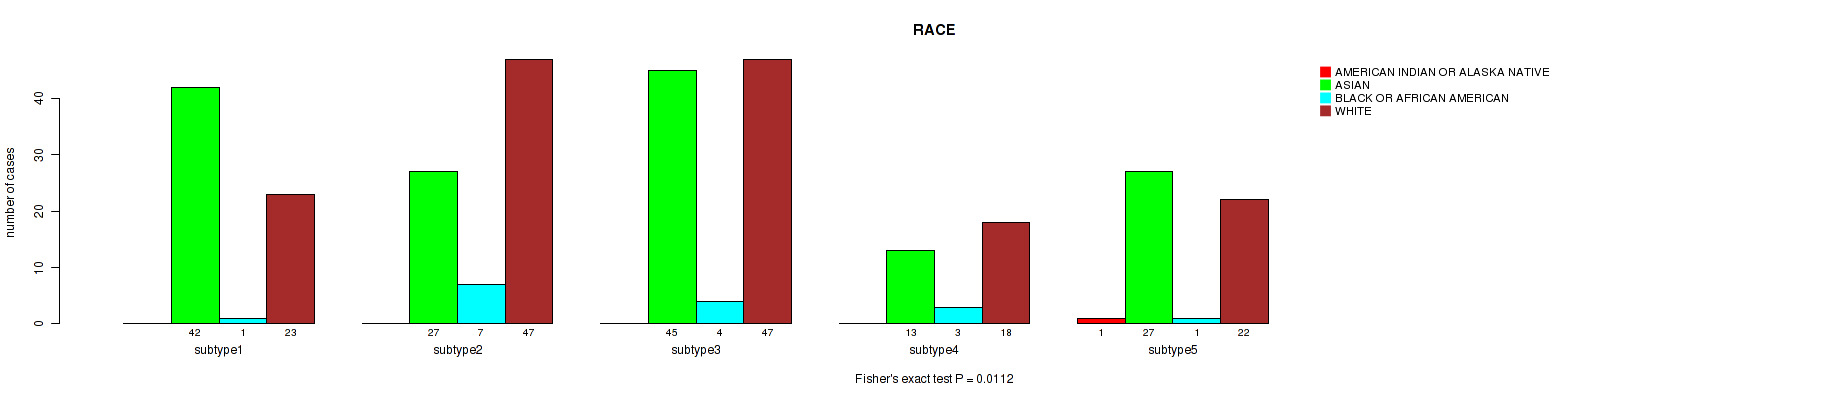
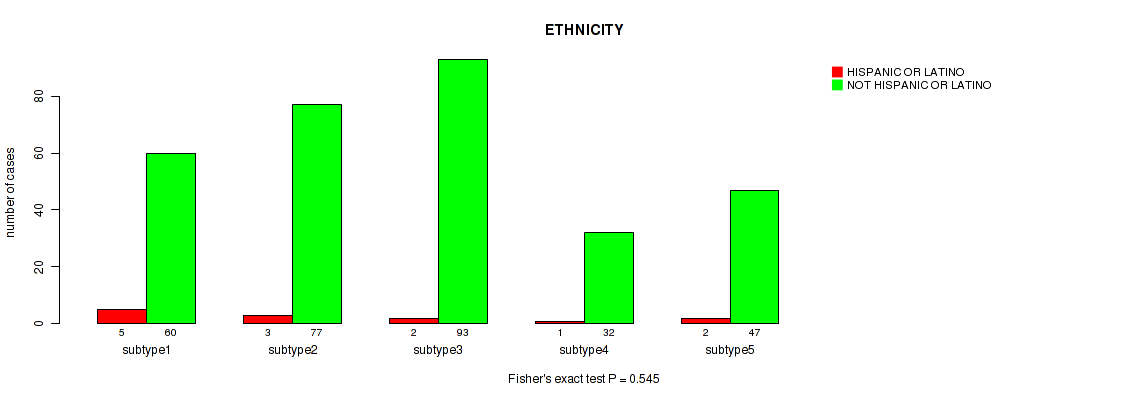
CNMF clustering analysis on sequencing-based mRNA expression data identified 5 subtypes that correlate to 'Time to Death', 'YEARS_TO_BIRTH', 'PATHOLOGIC_STAGE', 'PATHOLOGY_T_STAGE', 'GENDER', 'RADIATION_THERAPY', 'HISTOLOGICAL_TYPE', 'RESIDUAL_TUMOR', and 'RACE'.
-
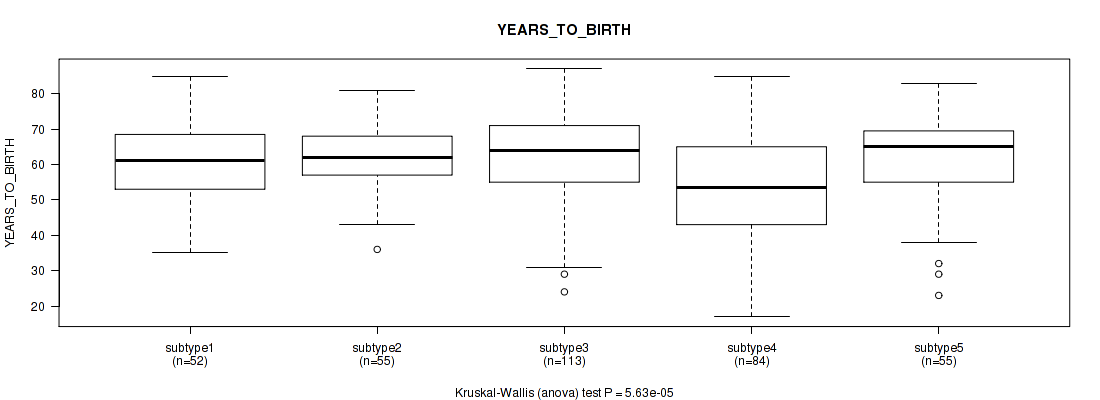
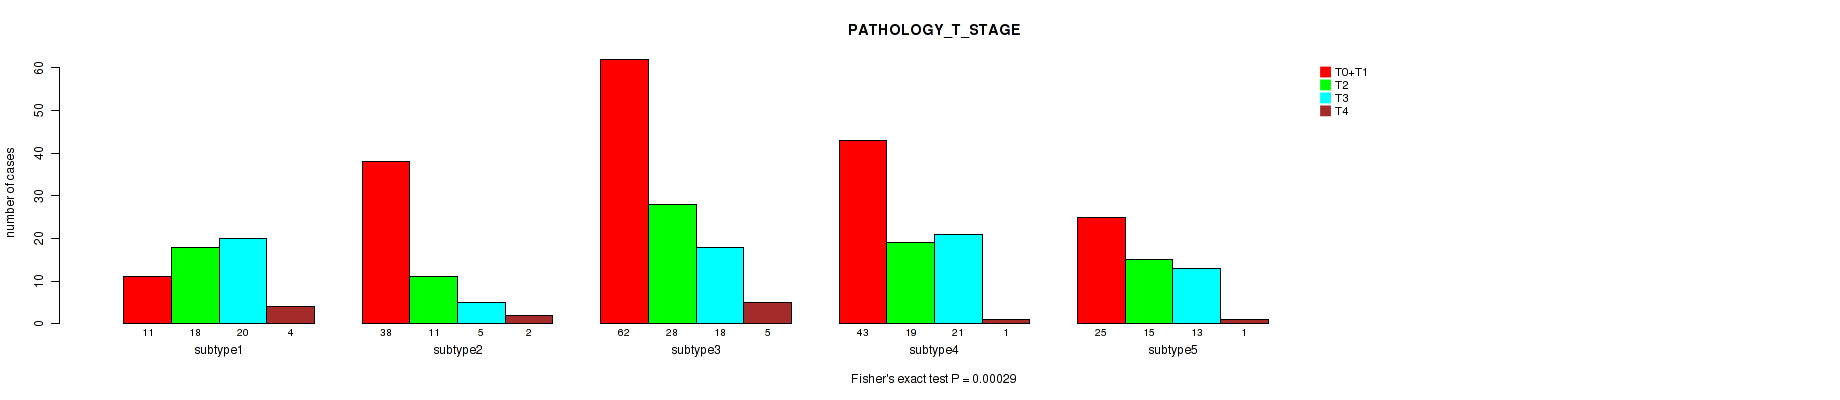
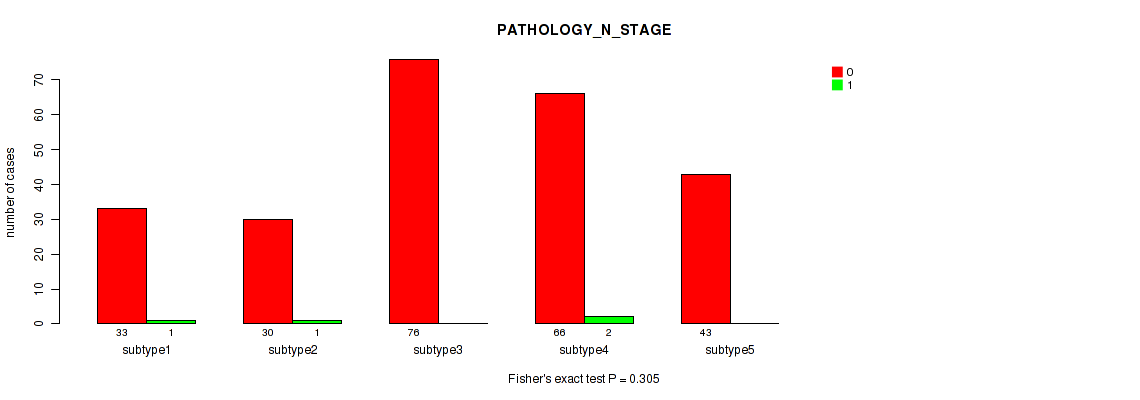
Consensus hierarchical clustering analysis on sequencing-based mRNA expression data identified 5 subtypes that correlate to 'Time to Death', 'YEARS_TO_BIRTH', 'PATHOLOGIC_STAGE', 'PATHOLOGY_T_STAGE', 'GENDER', 'HISTOLOGICAL_TYPE', 'RESIDUAL_TUMOR', and 'RACE'.
-
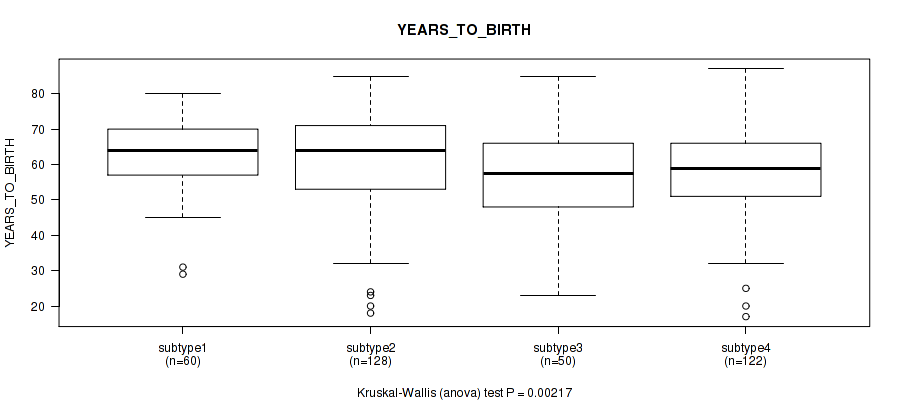
4 subtypes identified in current cancer cohort by 'MIRSEQ CNMF'. These subtypes correlate to 'YEARS_TO_BIRTH'.
-
5 subtypes identified in current cancer cohort by 'MIRSEQ CHIERARCHICAL'. These subtypes correlate to 'YEARS_TO_BIRTH' and 'GENDER'.
-
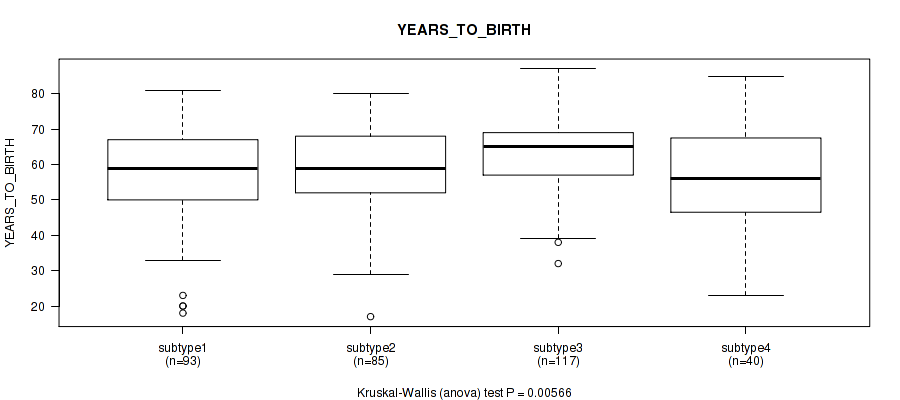
4 subtypes identified in current cancer cohort by 'MIRseq Mature CNMF subtypes'. These subtypes correlate to 'YEARS_TO_BIRTH', 'PATHOLOGIC_STAGE', 'PATHOLOGY_T_STAGE', and 'GENDER'.
-
5 subtypes identified in current cancer cohort by 'MIRseq Mature cHierClus subtypes'. These subtypes correlate to 'Time to Death', 'YEARS_TO_BIRTH', 'GENDER', and 'RACE'.
Table 1. Get Full Table Overview of the association between subtypes identified by 8 different clustering approaches and 12 clinical features. Shown in the table are P values (Q values). Thresholded by P value < 0.05 and Q value < 0.25, 34 significant findings detected.
|
Clinical Features |
Statistical Tests |
Copy Number Ratio CNMF subtypes |
METHLYATION CNMF |
RNAseq CNMF subtypes |
RNAseq cHierClus subtypes |
MIRSEQ CNMF |
MIRSEQ CHIERARCHICAL |
MIRseq Mature CNMF subtypes |
MIRseq Mature cHierClus subtypes |
| Time to Death | logrank test |
0.0307 (0.0951) |
0.523 (0.707) |
0.00809 (0.0393) |
0.00423 (0.029) |
0.473 (0.668) |
0.056 (0.145) |
0.119 (0.278) |
0.035 (0.103) |
| YEARS TO BIRTH | Kruskal-Wallis (anova) |
0.227 (0.42) |
1.01e-07 (9.69e-06) |
2.16e-06 (0.000104) |
5.63e-05 (0.000823) |
0.00217 (0.017) |
3.28e-05 (0.000629) |
0.00566 (0.0331) |
1.91e-05 (0.00048) |
| PATHOLOGIC STAGE | Fisher's exact test |
0.257 (0.448) |
0.878 (0.937) |
0.0356 (0.103) |
0.0023 (0.017) |
0.148 (0.321) |
0.946 (0.987) |
0.00032 (0.00341) |
0.0744 (0.188) |
| PATHOLOGY T STAGE | Fisher's exact test |
0.179 (0.357) |
0.837 (0.93) |
0.00468 (0.03) |
0.00029 (0.00341) |
0.852 (0.93) |
0.863 (0.931) |
0.00901 (0.0412) |
0.0953 (0.235) |
| PATHOLOGY N STAGE | Fisher's exact test |
1 (1.00) |
1 (1.00) |
0.601 (0.779) |
0.305 (0.476) |
0.677 (0.812) |
1 (1.00) |
0.159 (0.325) |
0.944 (0.987) |
| PATHOLOGY M STAGE | Fisher's exact test |
1 (1.00) |
0.273 (0.453) |
0.635 (0.784) |
0.473 (0.668) |
0.236 (0.427) |
0.308 (0.476) |
0.289 (0.462) |
0.15 (0.321) |
| GENDER | Fisher's exact test |
0.0269 (0.0891) |
0.0259 (0.0888) |
2e-05 (0.00048) |
6e-05 (0.000823) |
0.228 (0.42) |
0.0162 (0.0623) |
0.0144 (0.0601) |
0.0395 (0.112) |
| RADIATION THERAPY | Fisher's exact test |
0.716 (0.839) |
0.483 (0.672) |
0.0299 (0.0951) |
0.281 (0.457) |
0.637 (0.784) |
0.0521 (0.139) |
0.757 (0.876) |
0.0521 (0.139) |
| HISTOLOGICAL TYPE | Fisher's exact test |
0.669 (0.812) |
0.156 (0.325) |
0.00819 (0.0393) |
0.00187 (0.0163) |
0.102 (0.245) |
0.851 (0.93) |
0.123 (0.28) |
0.628 (0.784) |
| RESIDUAL TUMOR | Fisher's exact test |
0.261 (0.448) |
0.517 (0.707) |
0.00714 (0.0381) |
0.0222 (0.082) |
0.835 (0.93) |
0.356 (0.543) |
0.182 (0.357) |
0.194 (0.372) |
| RACE | Fisher's exact test |
0.0249 (0.0886) |
0.00136 (0.0131) |
0.00586 (0.0331) |
0.0154 (0.0615) |
0.42 (0.621) |
0.138 (0.309) |
0.817 (0.93) |
0.0112 (0.0487) |
| ETHNICITY | Fisher's exact test |
0.266 (0.448) |
0.442 (0.642) |
0.699 (0.829) |
0.256 (0.448) |
0.4 (0.6) |
0.63 (0.784) |
0.54 (0.717) |
0.545 (0.717) |
Table S1. Description of clustering approach #1: 'Copy Number Ratio CNMF subtypes'
| Cluster Labels | 1 | 2 | 3 |
|---|---|---|---|
| Number of samples | 106 | 122 | 134 |
P value = 0.0307 (logrank test), Q value = 0.095
Table S2. Clustering Approach #1: 'Copy Number Ratio CNMF subtypes' versus Clinical Feature #1: 'Time to Death'
| nPatients | nDeath | Duration Range (Median), Month | |
|---|---|---|---|
| ALL | 358 | 129 | 0.0 - 120.8 (19.8) |
| subtype1 | 106 | 35 | 0.3 - 114.3 (18.9) |
| subtype2 | 120 | 53 | 0.0 - 120.8 (18.4) |
| subtype3 | 132 | 41 | 0.2 - 108.8 (21.1) |
Figure S1. Get High-res Image Clustering Approach #1: 'Copy Number Ratio CNMF subtypes' versus Clinical Feature #1: 'Time to Death'
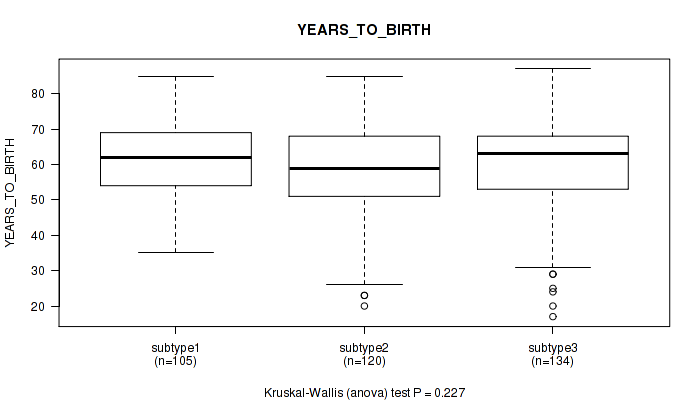
P value = 0.227 (Kruskal-Wallis (anova)), Q value = 0.42
Table S3. Clustering Approach #1: 'Copy Number Ratio CNMF subtypes' versus Clinical Feature #2: 'YEARS_TO_BIRTH'
| nPatients | Mean (Std.Dev) | |
|---|---|---|
| ALL | 359 | 59.7 (12.7) |
| subtype1 | 105 | 61.4 (11.2) |
| subtype2 | 120 | 58.3 (13.0) |
| subtype3 | 134 | 59.6 (13.6) |
Figure S2. Get High-res Image Clustering Approach #1: 'Copy Number Ratio CNMF subtypes' versus Clinical Feature #2: 'YEARS_TO_BIRTH'
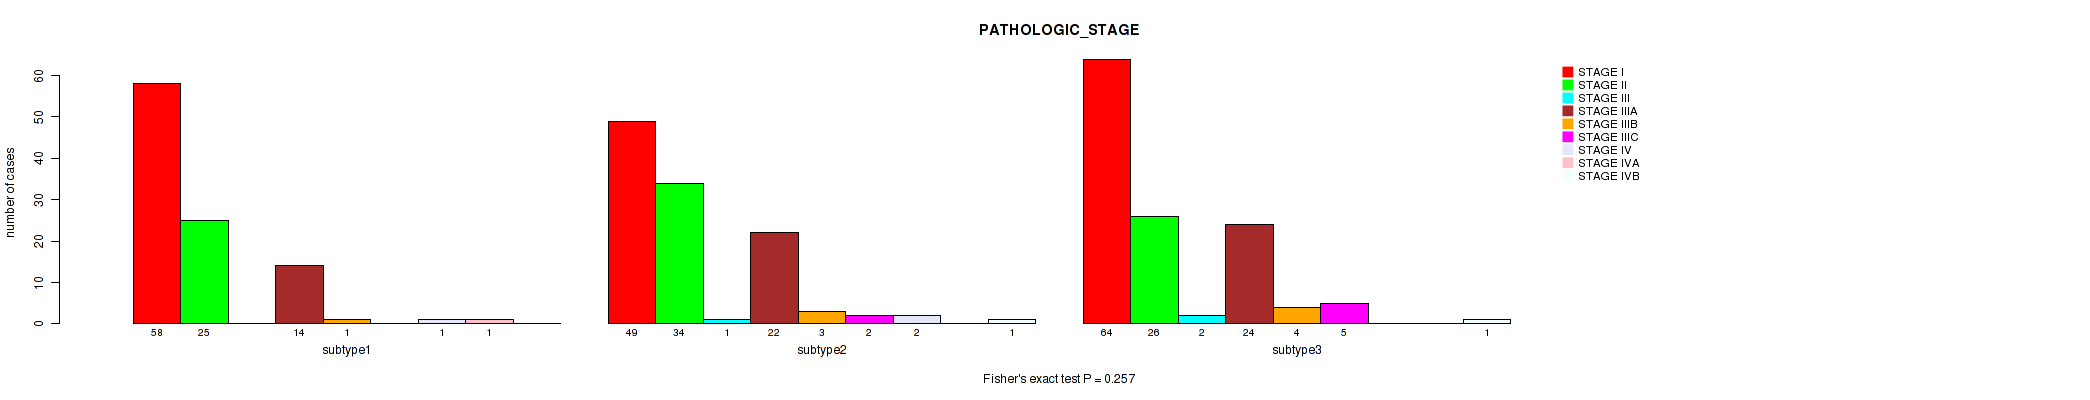
P value = 0.257 (Fisher's exact test), Q value = 0.45
Table S4. Clustering Approach #1: 'Copy Number Ratio CNMF subtypes' versus Clinical Feature #3: 'PATHOLOGIC_STAGE'
| nPatients | STAGE I | STAGE II | STAGE III | STAGE IIIA | STAGE IIIB | STAGE IIIC | STAGE IV | STAGE IVA | STAGE IVB |
|---|---|---|---|---|---|---|---|---|---|
| ALL | 171 | 85 | 3 | 60 | 8 | 7 | 3 | 1 | 2 |
| subtype1 | 58 | 25 | 0 | 14 | 1 | 0 | 1 | 1 | 0 |
| subtype2 | 49 | 34 | 1 | 22 | 3 | 2 | 2 | 0 | 1 |
| subtype3 | 64 | 26 | 2 | 24 | 4 | 5 | 0 | 0 | 1 |
Figure S3. Get High-res Image Clustering Approach #1: 'Copy Number Ratio CNMF subtypes' versus Clinical Feature #3: 'PATHOLOGIC_STAGE'
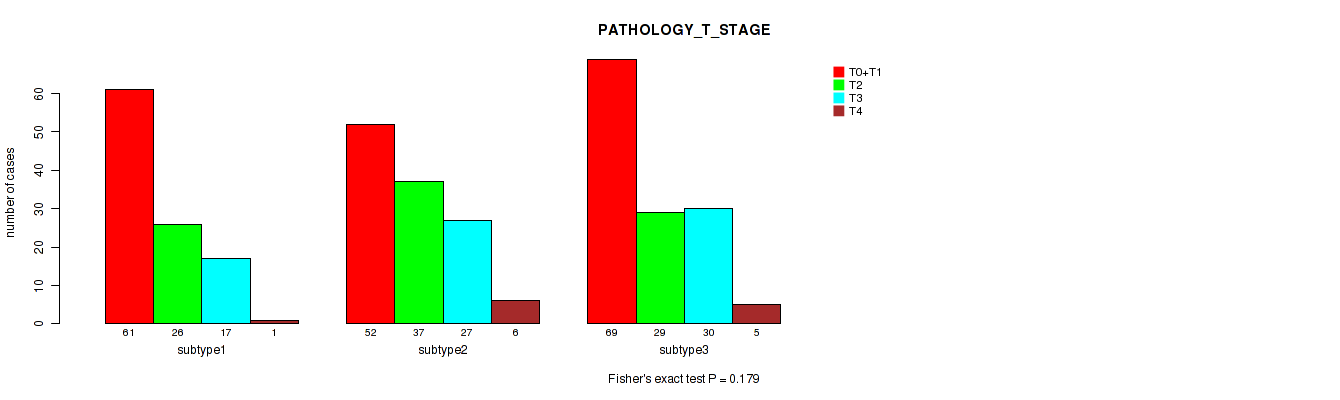
P value = 0.179 (Fisher's exact test), Q value = 0.36
Table S5. Clustering Approach #1: 'Copy Number Ratio CNMF subtypes' versus Clinical Feature #4: 'PATHOLOGY_T_STAGE'
| nPatients | T0+T1 | T2 | T3 | T4 |
|---|---|---|---|---|
| ALL | 182 | 92 | 74 | 12 |
| subtype1 | 61 | 26 | 17 | 1 |
| subtype2 | 52 | 37 | 27 | 6 |
| subtype3 | 69 | 29 | 30 | 5 |
Figure S4. Get High-res Image Clustering Approach #1: 'Copy Number Ratio CNMF subtypes' versus Clinical Feature #4: 'PATHOLOGY_T_STAGE'
P value = 1 (Fisher's exact test), Q value = 1
Table S6. Clustering Approach #1: 'Copy Number Ratio CNMF subtypes' versus Clinical Feature #5: 'PATHOLOGY_N_STAGE'
| nPatients | 0 | 1 |
|---|---|---|
| ALL | 250 | 3 |
| subtype1 | 73 | 1 |
| subtype2 | 87 | 1 |
| subtype3 | 90 | 1 |
Figure S5. Get High-res Image Clustering Approach #1: 'Copy Number Ratio CNMF subtypes' versus Clinical Feature #5: 'PATHOLOGY_N_STAGE'
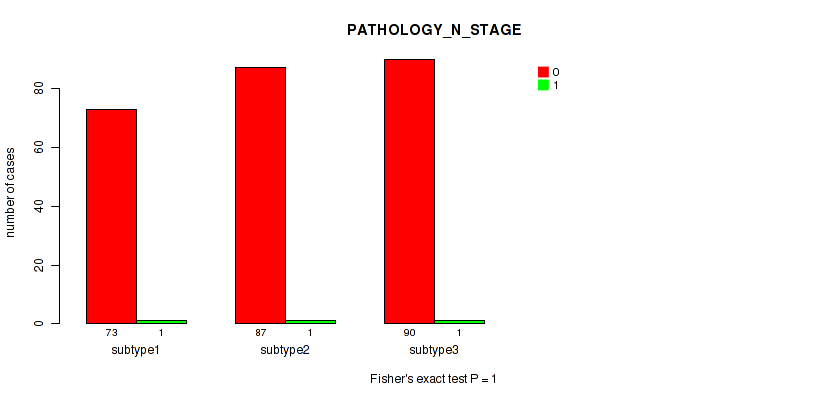
P value = 1 (Fisher's exact test), Q value = 1
Table S7. Clustering Approach #1: 'Copy Number Ratio CNMF subtypes' versus Clinical Feature #6: 'PATHOLOGY_M_STAGE'
| nPatients | 0 | 1 |
|---|---|---|
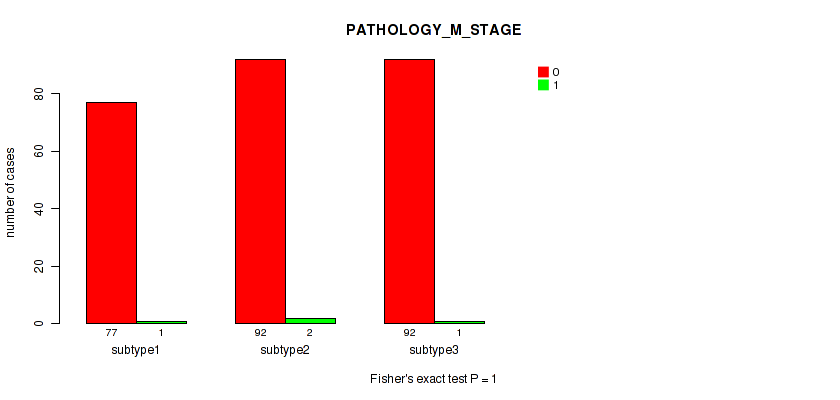
| ALL | 261 | 4 |
| subtype1 | 77 | 1 |
| subtype2 | 92 | 2 |
| subtype3 | 92 | 1 |
Figure S6. Get High-res Image Clustering Approach #1: 'Copy Number Ratio CNMF subtypes' versus Clinical Feature #6: 'PATHOLOGY_M_STAGE'
P value = 0.0269 (Fisher's exact test), Q value = 0.089
Table S8. Clustering Approach #1: 'Copy Number Ratio CNMF subtypes' versus Clinical Feature #7: 'GENDER'
| nPatients | FEMALE | MALE |
|---|---|---|
| ALL | 115 | 247 |
| subtype1 | 23 | 83 |
| subtype2 | 44 | 78 |
| subtype3 | 48 | 86 |
Figure S7. Get High-res Image Clustering Approach #1: 'Copy Number Ratio CNMF subtypes' versus Clinical Feature #7: 'GENDER'
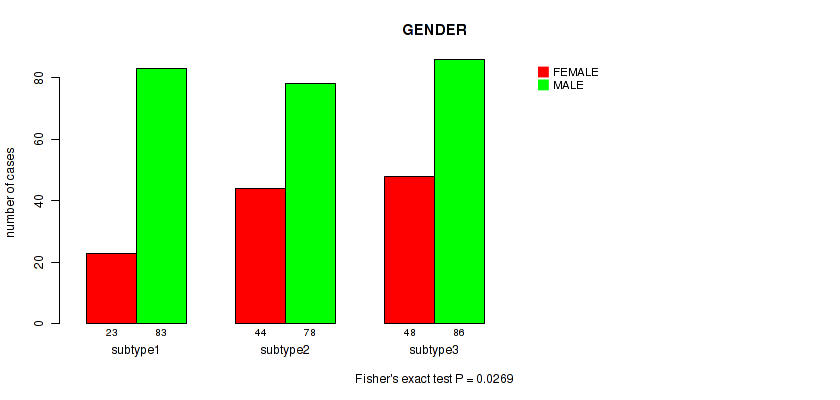
P value = 0.716 (Fisher's exact test), Q value = 0.84
Table S9. Clustering Approach #1: 'Copy Number Ratio CNMF subtypes' versus Clinical Feature #8: 'RADIATION_THERAPY'
| nPatients | NO | YES |
|---|---|---|
| ALL | 336 | 7 |
| subtype1 | 95 | 3 |
| subtype2 | 114 | 2 |
| subtype3 | 127 | 2 |
Figure S8. Get High-res Image Clustering Approach #1: 'Copy Number Ratio CNMF subtypes' versus Clinical Feature #8: 'RADIATION_THERAPY'
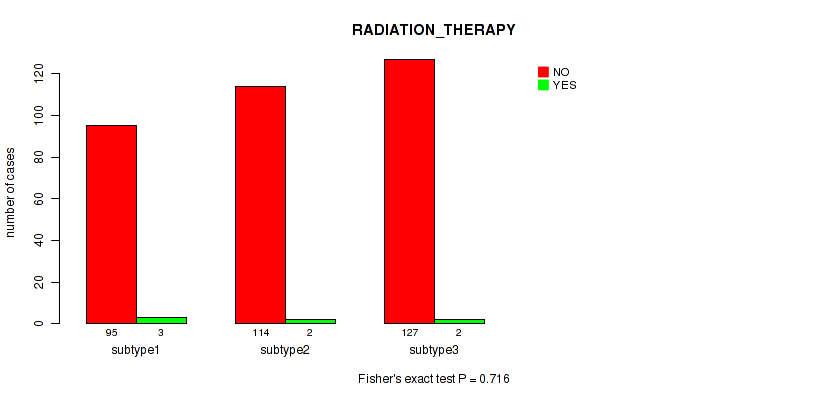
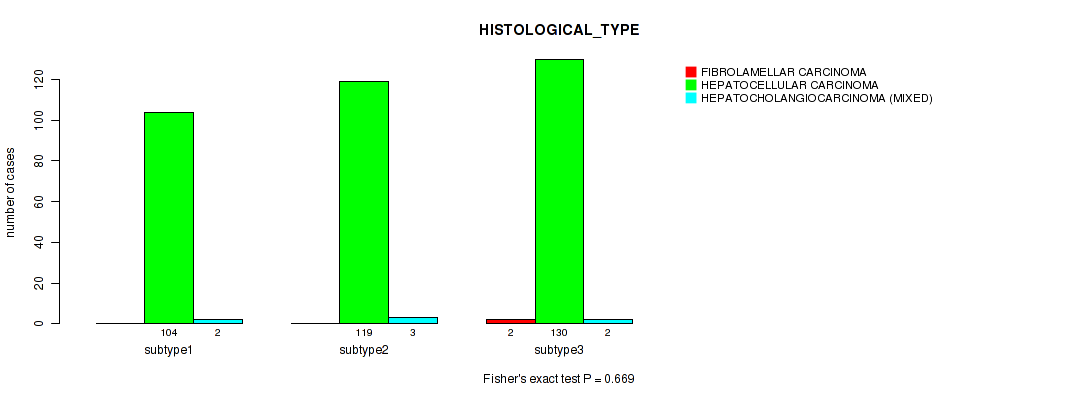
P value = 0.669 (Fisher's exact test), Q value = 0.81
Table S10. Clustering Approach #1: 'Copy Number Ratio CNMF subtypes' versus Clinical Feature #9: 'HISTOLOGICAL_TYPE'
| nPatients | FIBROLAMELLAR CARCINOMA | HEPATOCELLULAR CARCINOMA | HEPATOCHOLANGIOCARCINOMA (MIXED) |
|---|---|---|---|
| ALL | 2 | 353 | 7 |
| subtype1 | 0 | 104 | 2 |
| subtype2 | 0 | 119 | 3 |
| subtype3 | 2 | 130 | 2 |
Figure S9. Get High-res Image Clustering Approach #1: 'Copy Number Ratio CNMF subtypes' versus Clinical Feature #9: 'HISTOLOGICAL_TYPE'
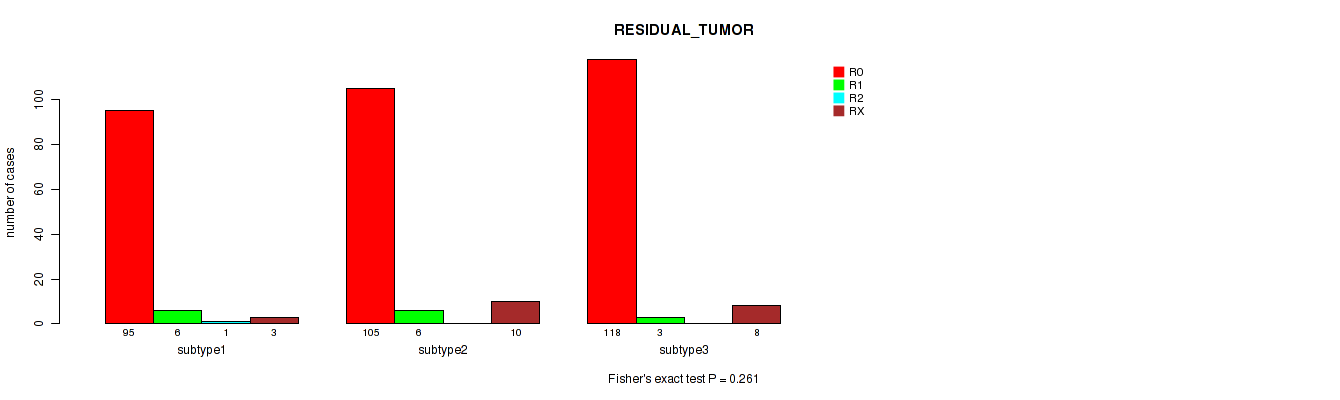
P value = 0.261 (Fisher's exact test), Q value = 0.45
Table S11. Clustering Approach #1: 'Copy Number Ratio CNMF subtypes' versus Clinical Feature #10: 'RESIDUAL_TUMOR'
| nPatients | R0 | R1 | R2 | RX |
|---|---|---|---|---|
| ALL | 318 | 15 | 1 | 21 |
| subtype1 | 95 | 6 | 1 | 3 |
| subtype2 | 105 | 6 | 0 | 10 |
| subtype3 | 118 | 3 | 0 | 8 |
Figure S10. Get High-res Image Clustering Approach #1: 'Copy Number Ratio CNMF subtypes' versus Clinical Feature #10: 'RESIDUAL_TUMOR'
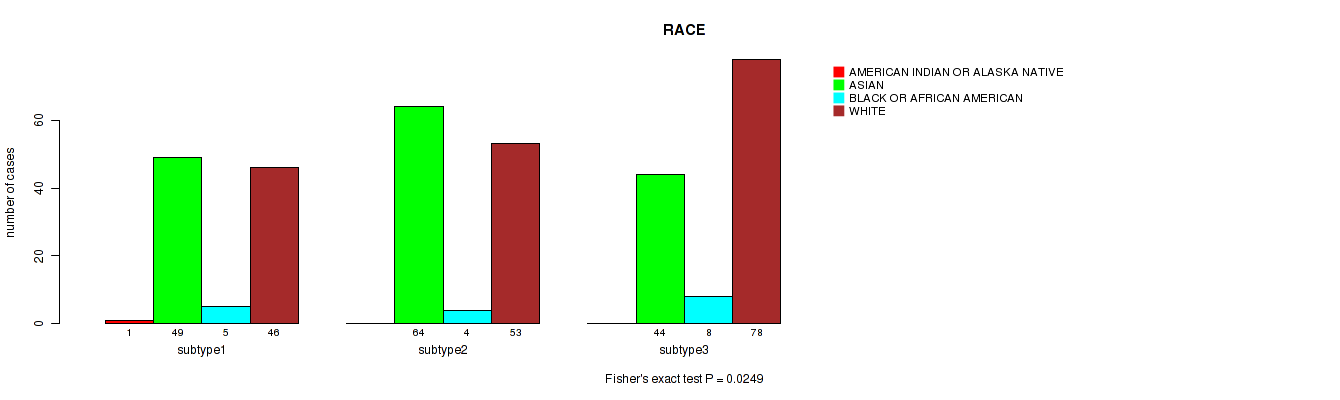
P value = 0.0249 (Fisher's exact test), Q value = 0.089
Table S12. Clustering Approach #1: 'Copy Number Ratio CNMF subtypes' versus Clinical Feature #11: 'RACE'
| nPatients | AMERICAN INDIAN OR ALASKA NATIVE | ASIAN | BLACK OR AFRICAN AMERICAN | WHITE |
|---|---|---|---|---|
| ALL | 1 | 157 | 17 | 177 |
| subtype1 | 1 | 49 | 5 | 46 |
| subtype2 | 0 | 64 | 4 | 53 |
| subtype3 | 0 | 44 | 8 | 78 |
Figure S11. Get High-res Image Clustering Approach #1: 'Copy Number Ratio CNMF subtypes' versus Clinical Feature #11: 'RACE'
P value = 0.266 (Fisher's exact test), Q value = 0.45
Table S13. Clustering Approach #1: 'Copy Number Ratio CNMF subtypes' versus Clinical Feature #12: 'ETHNICITY'
| nPatients | HISPANIC OR LATINO | NOT HISPANIC OR LATINO |
|---|---|---|
| ALL | 13 | 332 |
| subtype1 | 5 | 96 |
| subtype2 | 6 | 113 |
| subtype3 | 2 | 123 |
Figure S12. Get High-res Image Clustering Approach #1: 'Copy Number Ratio CNMF subtypes' versus Clinical Feature #12: 'ETHNICITY'
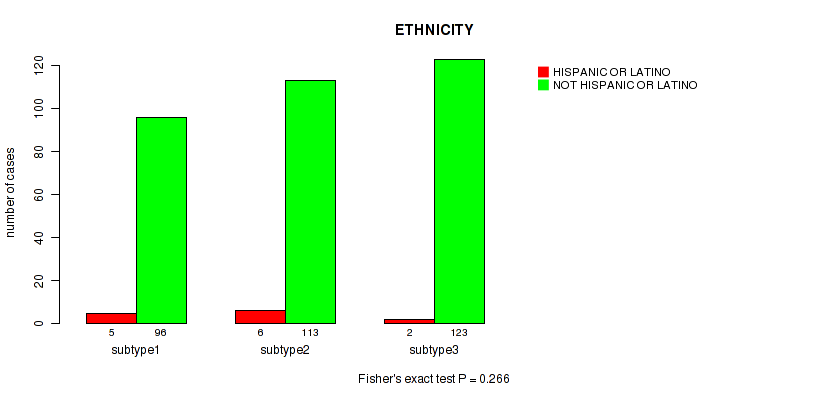
Table S14. Description of clustering approach #2: 'METHLYATION CNMF'
| Cluster Labels | 1 | 2 | 3 |
|---|---|---|---|
| Number of samples | 83 | 167 | 118 |
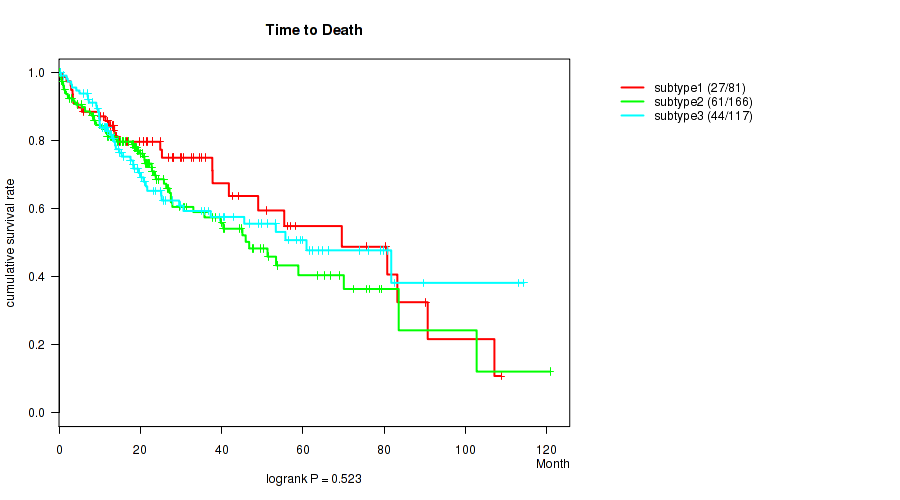
P value = 0.523 (logrank test), Q value = 0.71
Table S15. Clustering Approach #2: 'METHLYATION CNMF' versus Clinical Feature #1: 'Time to Death'
| nPatients | nDeath | Duration Range (Median), Month | |
|---|---|---|---|
| ALL | 364 | 132 | 0.0 - 120.8 (19.8) |
| subtype1 | 81 | 27 | 0.2 - 108.8 (20.8) |
| subtype2 | 166 | 61 | 0.0 - 120.8 (19.6) |
| subtype3 | 117 | 44 | 0.3 - 114.3 (18.5) |
Figure S13. Get High-res Image Clustering Approach #2: 'METHLYATION CNMF' versus Clinical Feature #1: 'Time to Death'
P value = 1.01e-07 (Kruskal-Wallis (anova)), Q value = 9.7e-06
Table S16. Clustering Approach #2: 'METHLYATION CNMF' versus Clinical Feature #2: 'YEARS_TO_BIRTH'
| nPatients | Mean (Std.Dev) | |
|---|---|---|
| ALL | 365 | 59.6 (13.0) |
| subtype1 | 83 | 58.3 (13.9) |
| subtype2 | 165 | 63.7 (10.0) |
| subtype3 | 117 | 54.7 (14.3) |
Figure S14. Get High-res Image Clustering Approach #2: 'METHLYATION CNMF' versus Clinical Feature #2: 'YEARS_TO_BIRTH'
P value = 0.878 (Fisher's exact test), Q value = 0.94
Table S17. Clustering Approach #2: 'METHLYATION CNMF' versus Clinical Feature #3: 'PATHOLOGIC_STAGE'
| nPatients | STAGE I | STAGE II | STAGE III | STAGE IIIA | STAGE IIIB | STAGE IIIC | STAGE IV | STAGE IVA | STAGE IVB |
|---|---|---|---|---|---|---|---|---|---|
| ALL | 172 | 85 | 3 | 63 | 8 | 9 | 3 | 1 | 2 |
| subtype1 | 39 | 16 | 0 | 17 | 3 | 4 | 0 | 0 | 0 |
| subtype2 | 80 | 40 | 2 | 25 | 4 | 3 | 1 | 1 | 1 |
| subtype3 | 53 | 29 | 1 | 21 | 1 | 2 | 2 | 0 | 1 |
Figure S15. Get High-res Image Clustering Approach #2: 'METHLYATION CNMF' versus Clinical Feature #3: 'PATHOLOGIC_STAGE'
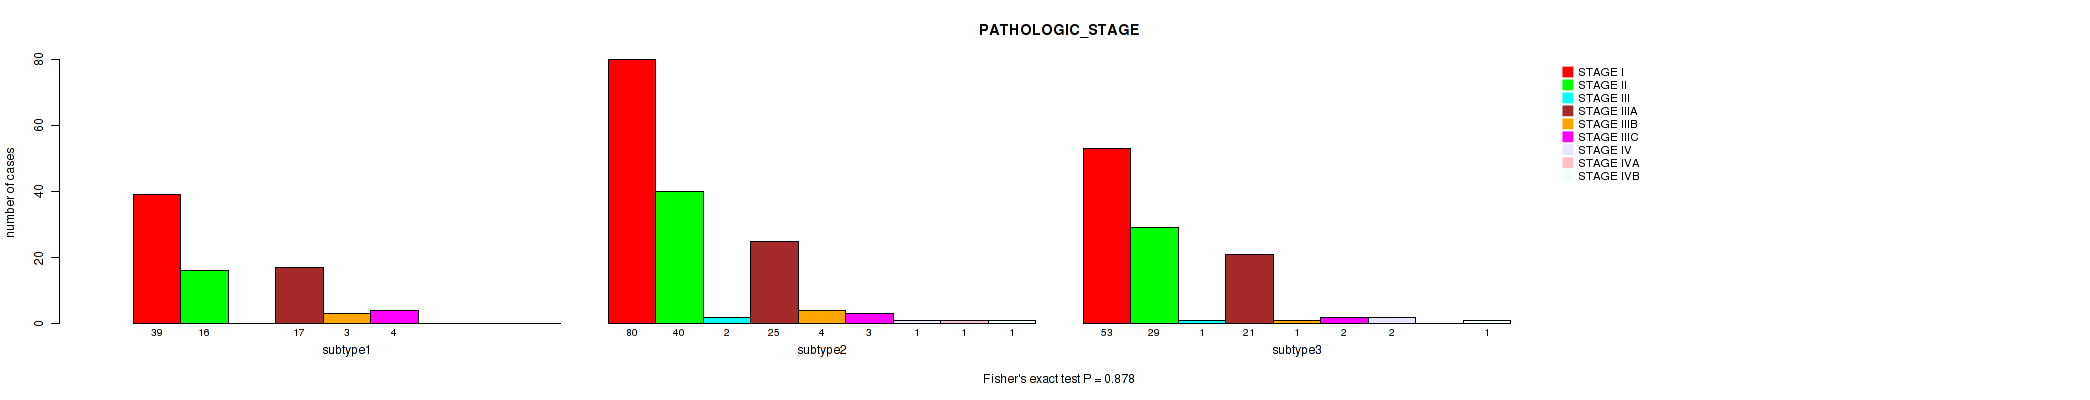
P value = 0.837 (Fisher's exact test), Q value = 0.93
Table S18. Clustering Approach #2: 'METHLYATION CNMF' versus Clinical Feature #4: 'PATHOLOGY_T_STAGE'
| nPatients | T0+T1 | T2 | T3 | T4 |
|---|---|---|---|---|
| ALL | 183 | 92 | 78 | 13 |
| subtype1 | 41 | 18 | 20 | 3 |
| subtype2 | 86 | 43 | 30 | 7 |
| subtype3 | 56 | 31 | 28 | 3 |
Figure S16. Get High-res Image Clustering Approach #2: 'METHLYATION CNMF' versus Clinical Feature #4: 'PATHOLOGY_T_STAGE'
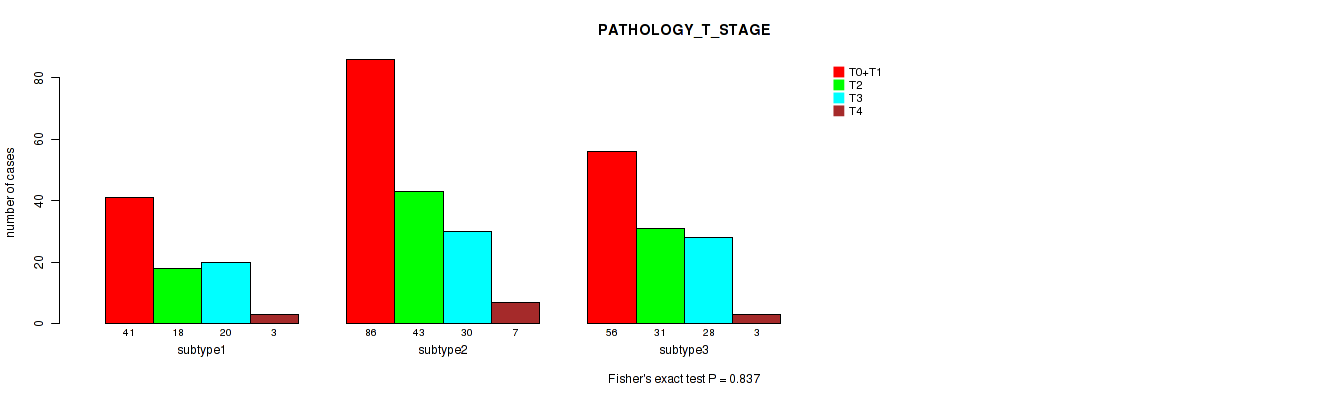
P value = 1 (Fisher's exact test), Q value = 1
Table S19. Clustering Approach #2: 'METHLYATION CNMF' versus Clinical Feature #5: 'PATHOLOGY_N_STAGE'
| nPatients | 0 | 1 |
|---|---|---|
| ALL | 253 | 4 |
| subtype1 | 56 | 1 |
| subtype2 | 112 | 2 |
| subtype3 | 85 | 1 |
Figure S17. Get High-res Image Clustering Approach #2: 'METHLYATION CNMF' versus Clinical Feature #5: 'PATHOLOGY_N_STAGE'
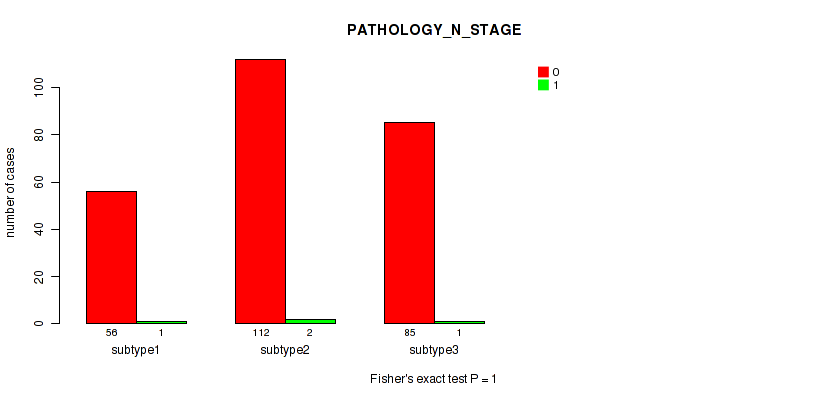
P value = 0.273 (Fisher's exact test), Q value = 0.45
Table S20. Clustering Approach #2: 'METHLYATION CNMF' versus Clinical Feature #6: 'PATHOLOGY_M_STAGE'
| nPatients | 0 | 1 |
|---|---|---|
| ALL | 267 | 4 |
| subtype1 | 58 | 0 |
| subtype2 | 120 | 1 |
| subtype3 | 89 | 3 |
Figure S18. Get High-res Image Clustering Approach #2: 'METHLYATION CNMF' versus Clinical Feature #6: 'PATHOLOGY_M_STAGE'
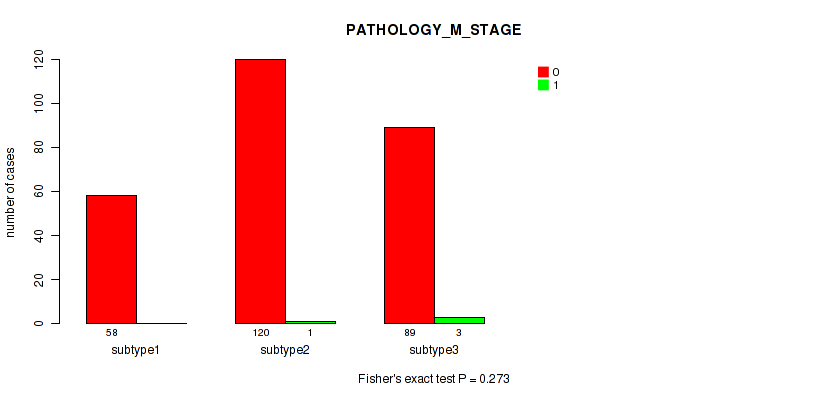
P value = 0.0259 (Fisher's exact test), Q value = 0.089
Table S21. Clustering Approach #2: 'METHLYATION CNMF' versus Clinical Feature #7: 'GENDER'
| nPatients | FEMALE | MALE |
|---|---|---|
| ALL | 118 | 250 |
| subtype1 | 29 | 54 |
| subtype2 | 42 | 125 |
| subtype3 | 47 | 71 |
Figure S19. Get High-res Image Clustering Approach #2: 'METHLYATION CNMF' versus Clinical Feature #7: 'GENDER'
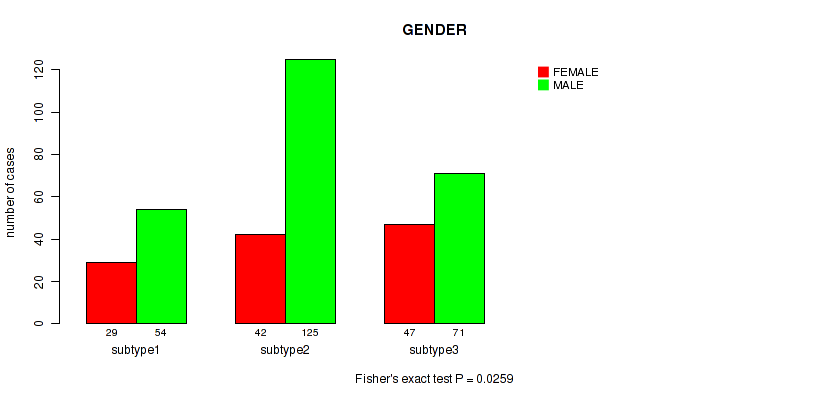
P value = 0.483 (Fisher's exact test), Q value = 0.67
Table S22. Clustering Approach #2: 'METHLYATION CNMF' versus Clinical Feature #8: 'RADIATION_THERAPY'
| nPatients | NO | YES |
|---|---|---|
| ALL | 342 | 7 |
| subtype1 | 77 | 1 |
| subtype2 | 158 | 2 |
| subtype3 | 107 | 4 |
Figure S20. Get High-res Image Clustering Approach #2: 'METHLYATION CNMF' versus Clinical Feature #8: 'RADIATION_THERAPY'
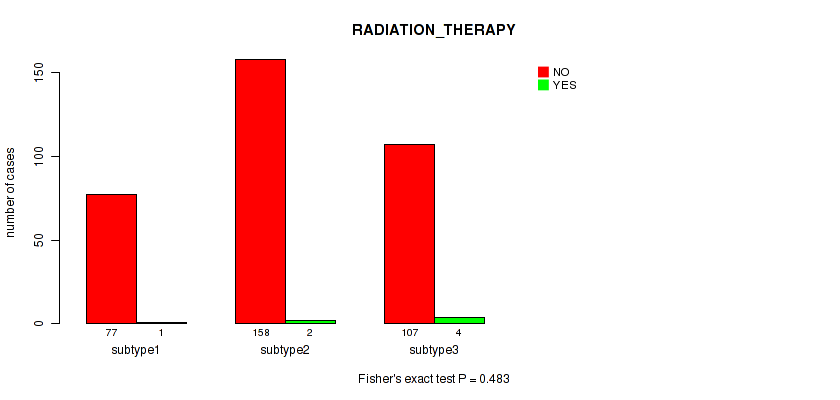
P value = 0.156 (Fisher's exact test), Q value = 0.33
Table S23. Clustering Approach #2: 'METHLYATION CNMF' versus Clinical Feature #9: 'HISTOLOGICAL_TYPE'
| nPatients | FIBROLAMELLAR CARCINOMA | HEPATOCELLULAR CARCINOMA | HEPATOCHOLANGIOCARCINOMA (MIXED) |
|---|---|---|---|
| ALL | 2 | 359 | 7 |
| subtype1 | 2 | 79 | 2 |
| subtype2 | 0 | 165 | 2 |
| subtype3 | 0 | 115 | 3 |
Figure S21. Get High-res Image Clustering Approach #2: 'METHLYATION CNMF' versus Clinical Feature #9: 'HISTOLOGICAL_TYPE'
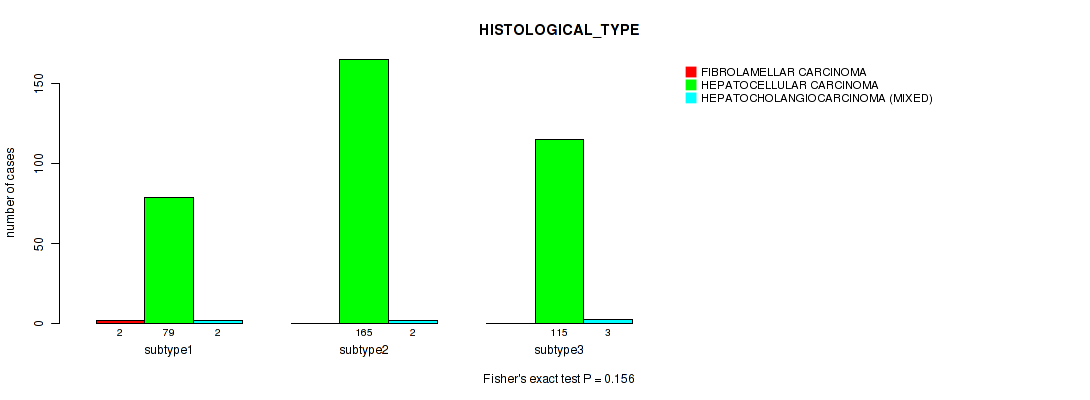
P value = 0.517 (Fisher's exact test), Q value = 0.71
Table S24. Clustering Approach #2: 'METHLYATION CNMF' versus Clinical Feature #10: 'RESIDUAL_TUMOR'
| nPatients | R0 | R1 | R2 | RX |
|---|---|---|---|---|
| ALL | 323 | 15 | 1 | 22 |
| subtype1 | 68 | 3 | 0 | 8 |
| subtype2 | 150 | 6 | 0 | 8 |
| subtype3 | 105 | 6 | 1 | 6 |
Figure S22. Get High-res Image Clustering Approach #2: 'METHLYATION CNMF' versus Clinical Feature #10: 'RESIDUAL_TUMOR'

P value = 0.00136 (Fisher's exact test), Q value = 0.013
Table S25. Clustering Approach #2: 'METHLYATION CNMF' versus Clinical Feature #11: 'RACE'
| nPatients | AMERICAN INDIAN OR ALASKA NATIVE | ASIAN | BLACK OR AFRICAN AMERICAN | WHITE |
|---|---|---|---|---|
| ALL | 1 | 160 | 17 | 180 |
| subtype1 | 0 | 26 | 8 | 46 |
| subtype2 | 1 | 68 | 8 | 86 |
| subtype3 | 0 | 66 | 1 | 48 |
Figure S23. Get High-res Image Clustering Approach #2: 'METHLYATION CNMF' versus Clinical Feature #11: 'RACE'
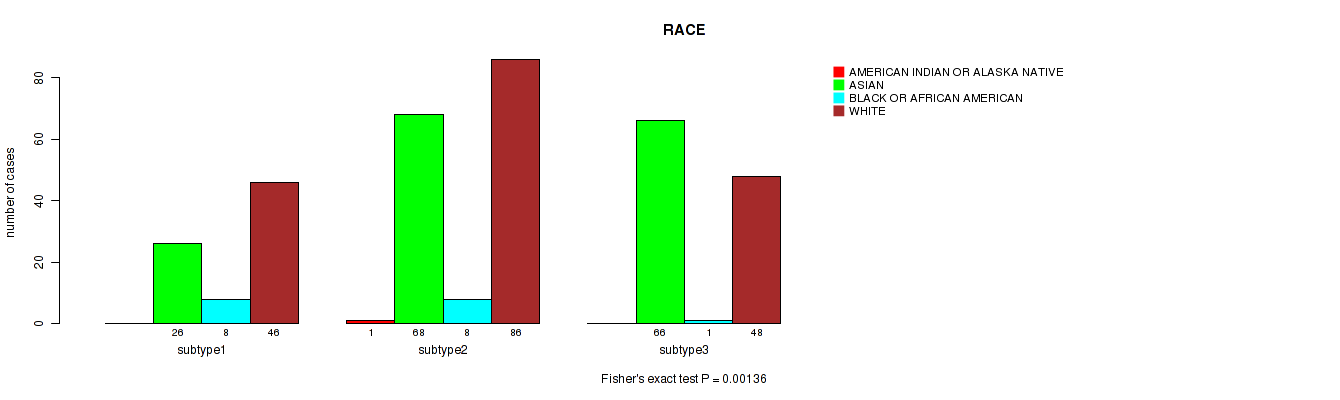
P value = 0.442 (Fisher's exact test), Q value = 0.64
Table S26. Clustering Approach #2: 'METHLYATION CNMF' versus Clinical Feature #12: 'ETHNICITY'
| nPatients | HISPANIC OR LATINO | NOT HISPANIC OR LATINO |
|---|---|---|
| ALL | 14 | 337 |
| subtype1 | 2 | 77 |
| subtype2 | 5 | 151 |
| subtype3 | 7 | 109 |
Figure S24. Get High-res Image Clustering Approach #2: 'METHLYATION CNMF' versus Clinical Feature #12: 'ETHNICITY'
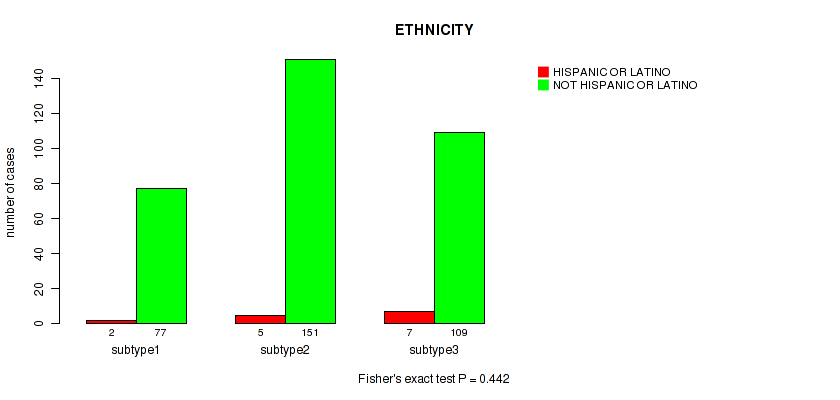
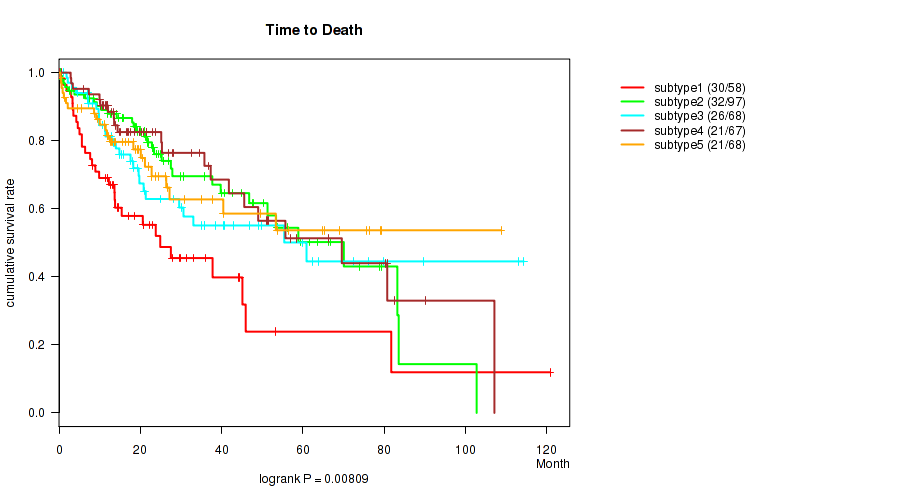
Table S27. Description of clustering approach #3: 'RNAseq CNMF subtypes'
| Cluster Labels | 1 | 2 | 3 | 4 | 5 |
|---|---|---|---|---|---|
| Number of samples | 59 | 97 | 70 | 68 | 68 |
P value = 0.00809 (logrank test), Q value = 0.039
Table S28. Clustering Approach #3: 'RNAseq CNMF subtypes' versus Clinical Feature #1: 'Time to Death'
| nPatients | nDeath | Duration Range (Median), Month | |
|---|---|---|---|
| ALL | 358 | 130 | 0.0 - 120.8 (19.4) |
| subtype1 | 58 | 30 | 0.2 - 120.8 (13.7) |
| subtype2 | 97 | 32 | 0.3 - 102.7 (22.1) |
| subtype3 | 68 | 26 | 1.0 - 114.3 (18.2) |
| subtype4 | 67 | 21 | 0.0 - 107.1 (19.8) |
| subtype5 | 68 | 21 | 0.4 - 108.8 (19.0) |
Figure S25. Get High-res Image Clustering Approach #3: 'RNAseq CNMF subtypes' versus Clinical Feature #1: 'Time to Death'
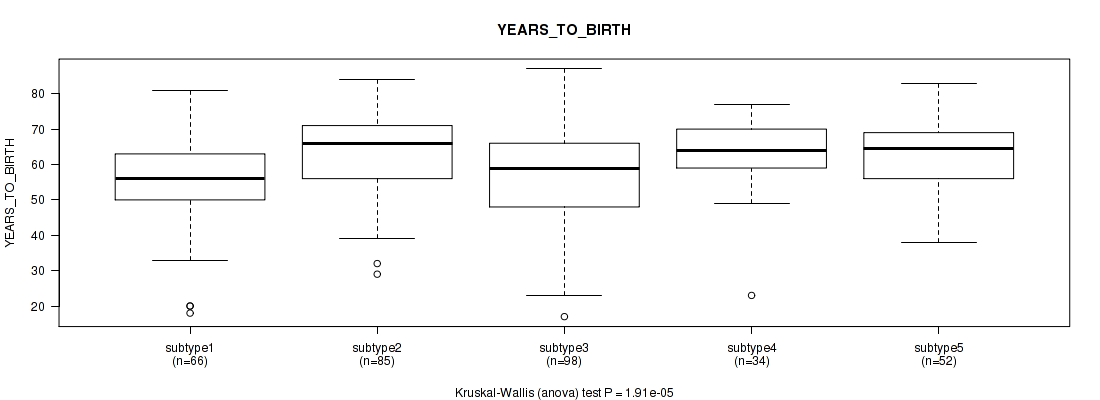
P value = 2.16e-06 (Kruskal-Wallis (anova)), Q value = 1e-04
Table S29. Clustering Approach #3: 'RNAseq CNMF subtypes' versus Clinical Feature #2: 'YEARS_TO_BIRTH'
| nPatients | Mean (Std.Dev) | |
|---|---|---|
| ALL | 359 | 59.6 (13.0) |
| subtype1 | 58 | 61.6 (11.5) |
| subtype2 | 96 | 62.8 (12.5) |
| subtype3 | 69 | 52.4 (13.8) |
| subtype4 | 68 | 58.6 (12.8) |
| subtype5 | 68 | 61.6 (11.7) |
Figure S26. Get High-res Image Clustering Approach #3: 'RNAseq CNMF subtypes' versus Clinical Feature #2: 'YEARS_TO_BIRTH'
P value = 0.0356 (Fisher's exact test), Q value = 0.1
Table S30. Clustering Approach #3: 'RNAseq CNMF subtypes' versus Clinical Feature #3: 'PATHOLOGIC_STAGE'
| nPatients | STAGE I | STAGE II | STAGE III | STAGE IIIA | STAGE IIIB | STAGE IIIC | STAGE IV | STAGE IVA | STAGE IVB |
|---|---|---|---|---|---|---|---|---|---|
| ALL | 168 | 84 | 3 | 63 | 7 | 9 | 3 | 1 | 2 |
| subtype1 | 15 | 21 | 0 | 12 | 3 | 3 | 1 | 0 | 0 |
| subtype2 | 56 | 16 | 1 | 12 | 2 | 0 | 0 | 1 | 1 |
| subtype3 | 31 | 17 | 1 | 14 | 1 | 2 | 1 | 0 | 1 |
| subtype4 | 35 | 13 | 0 | 10 | 0 | 3 | 1 | 0 | 0 |
| subtype5 | 31 | 17 | 1 | 15 | 1 | 1 | 0 | 0 | 0 |
Figure S27. Get High-res Image Clustering Approach #3: 'RNAseq CNMF subtypes' versus Clinical Feature #3: 'PATHOLOGIC_STAGE'
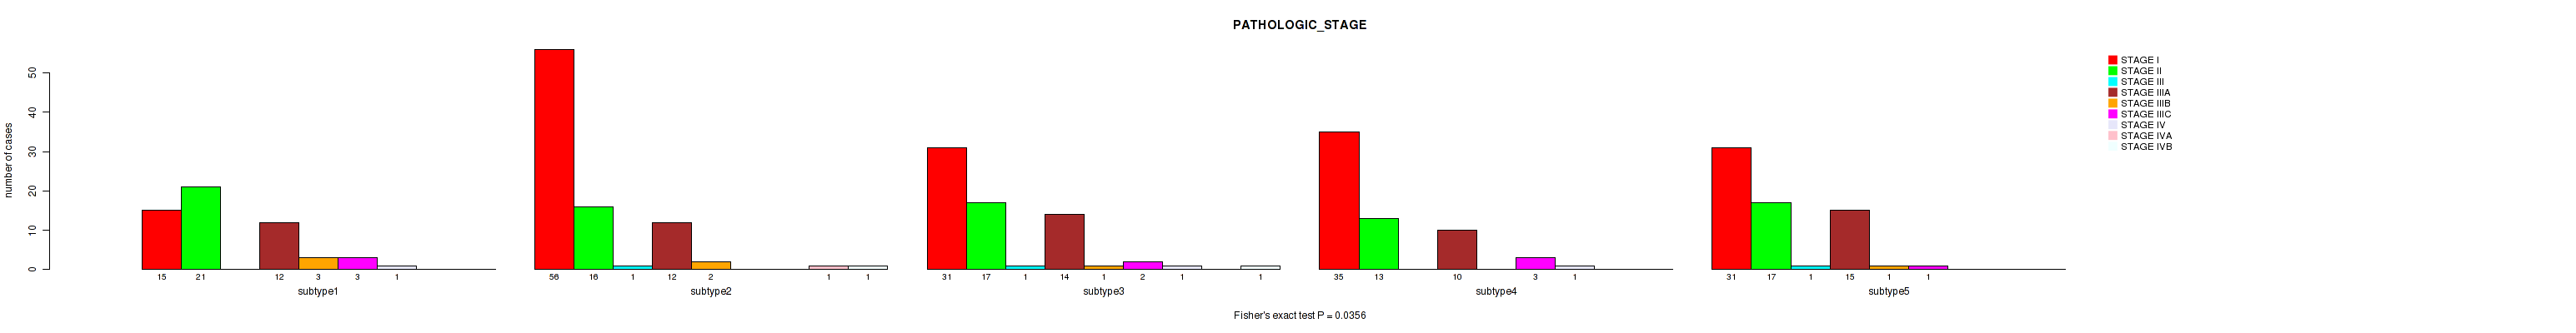
P value = 0.00468 (Fisher's exact test), Q value = 0.03
Table S31. Clustering Approach #3: 'RNAseq CNMF subtypes' versus Clinical Feature #4: 'PATHOLOGY_T_STAGE'
| nPatients | T0+T1 | T2 | T3 | T4 |
|---|---|---|---|---|
| ALL | 179 | 91 | 77 | 13 |
| subtype1 | 15 | 25 | 15 | 4 |
| subtype2 | 60 | 17 | 15 | 4 |
| subtype3 | 34 | 17 | 18 | 1 |
| subtype4 | 38 | 15 | 12 | 3 |
| subtype5 | 32 | 17 | 17 | 1 |
Figure S28. Get High-res Image Clustering Approach #3: 'RNAseq CNMF subtypes' versus Clinical Feature #4: 'PATHOLOGY_T_STAGE'
P value = 0.601 (Fisher's exact test), Q value = 0.78
Table S32. Clustering Approach #3: 'RNAseq CNMF subtypes' versus Clinical Feature #5: 'PATHOLOGY_N_STAGE'
| nPatients | 0 | 1 |
|---|---|---|
| ALL | 248 | 4 |
| subtype1 | 35 | 1 |
| subtype2 | 64 | 1 |
| subtype3 | 58 | 2 |
| subtype4 | 40 | 0 |
| subtype5 | 51 | 0 |
Figure S29. Get High-res Image Clustering Approach #3: 'RNAseq CNMF subtypes' versus Clinical Feature #5: 'PATHOLOGY_N_STAGE'
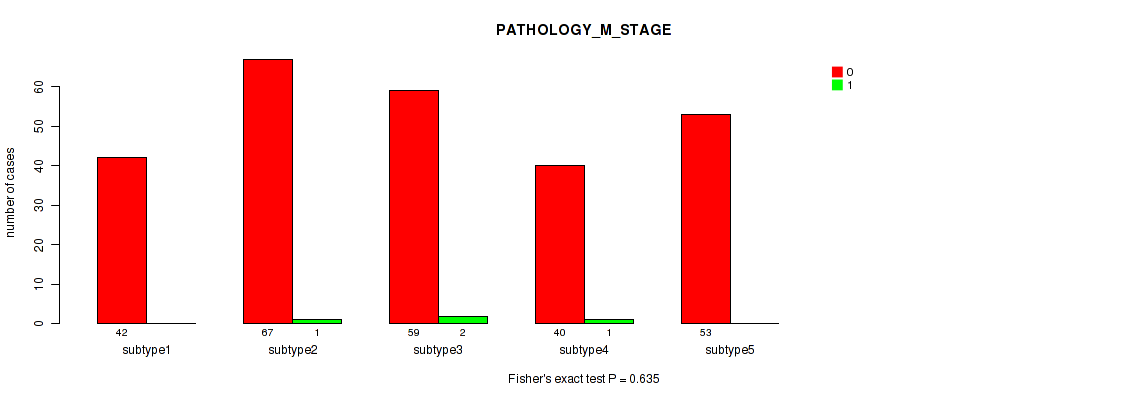
P value = 0.635 (Fisher's exact test), Q value = 0.78
Table S33. Clustering Approach #3: 'RNAseq CNMF subtypes' versus Clinical Feature #6: 'PATHOLOGY_M_STAGE'
| nPatients | 0 | 1 |
|---|---|---|
| ALL | 261 | 4 |
| subtype1 | 42 | 0 |
| subtype2 | 67 | 1 |
| subtype3 | 59 | 2 |
| subtype4 | 40 | 1 |
| subtype5 | 53 | 0 |
Figure S30. Get High-res Image Clustering Approach #3: 'RNAseq CNMF subtypes' versus Clinical Feature #6: 'PATHOLOGY_M_STAGE'
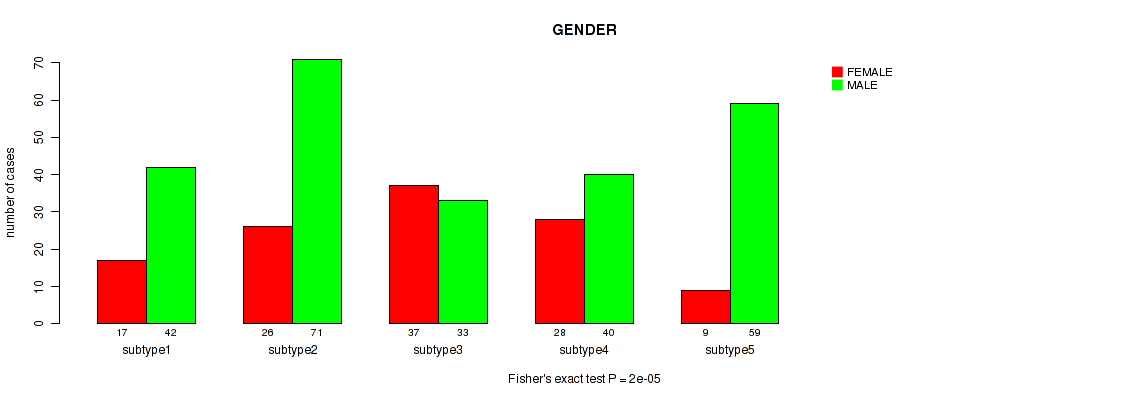
P value = 2e-05 (Fisher's exact test), Q value = 0.00048
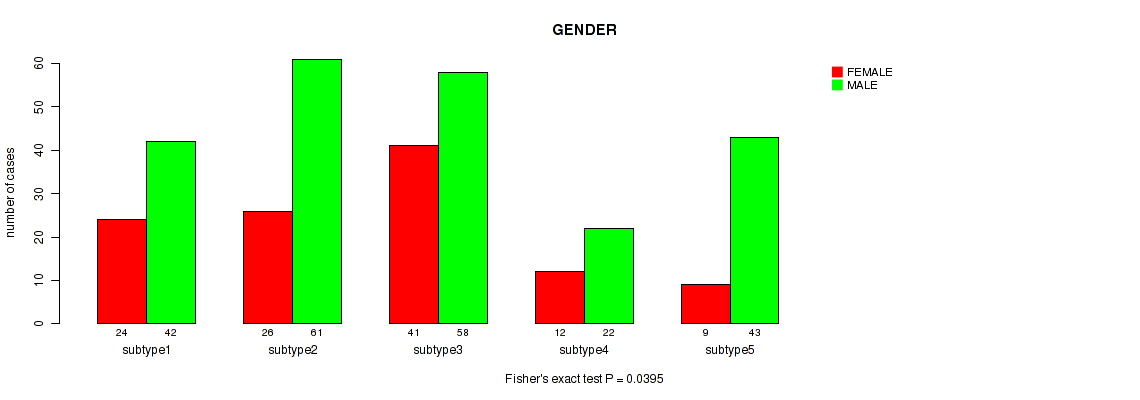
Table S34. Clustering Approach #3: 'RNAseq CNMF subtypes' versus Clinical Feature #7: 'GENDER'
| nPatients | FEMALE | MALE |
|---|---|---|
| ALL | 117 | 245 |
| subtype1 | 17 | 42 |
| subtype2 | 26 | 71 |
| subtype3 | 37 | 33 |
| subtype4 | 28 | 40 |
| subtype5 | 9 | 59 |
Figure S31. Get High-res Image Clustering Approach #3: 'RNAseq CNMF subtypes' versus Clinical Feature #7: 'GENDER'
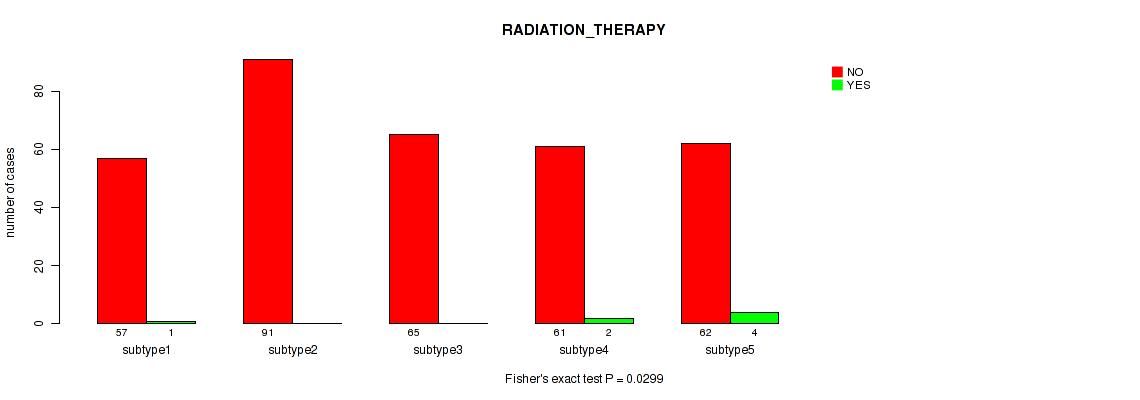
P value = 0.0299 (Fisher's exact test), Q value = 0.095
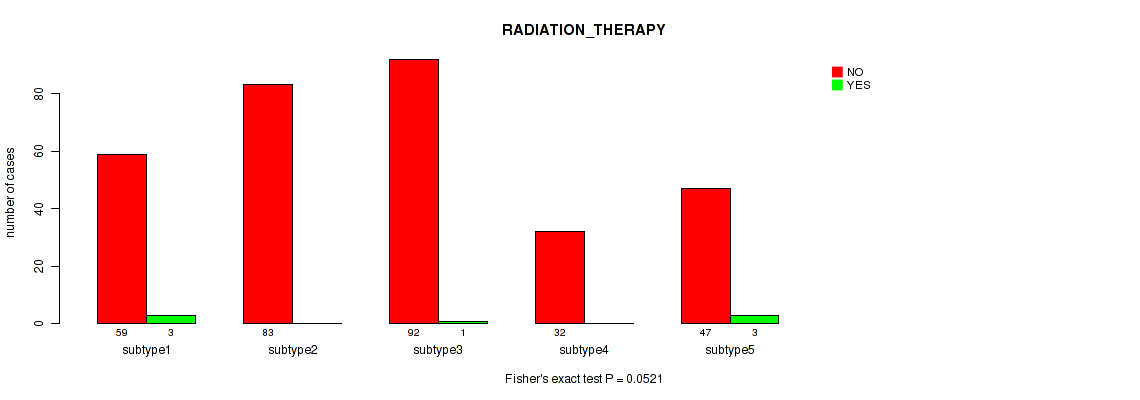
Table S35. Clustering Approach #3: 'RNAseq CNMF subtypes' versus Clinical Feature #8: 'RADIATION_THERAPY'
| nPatients | NO | YES |
|---|---|---|
| ALL | 336 | 7 |
| subtype1 | 57 | 1 |
| subtype2 | 91 | 0 |
| subtype3 | 65 | 0 |
| subtype4 | 61 | 2 |
| subtype5 | 62 | 4 |
Figure S32. Get High-res Image Clustering Approach #3: 'RNAseq CNMF subtypes' versus Clinical Feature #8: 'RADIATION_THERAPY'
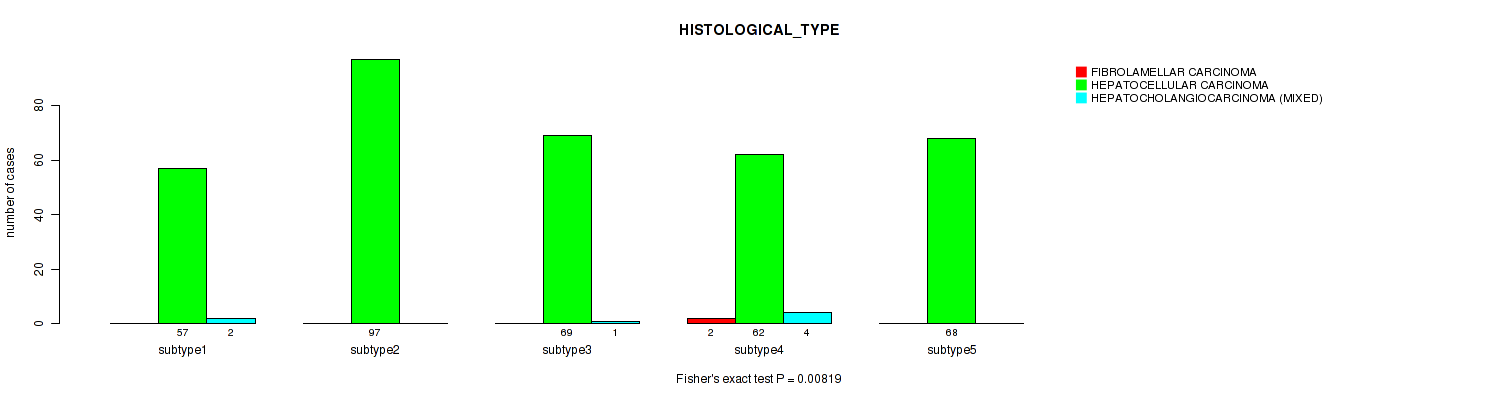
P value = 0.00819 (Fisher's exact test), Q value = 0.039
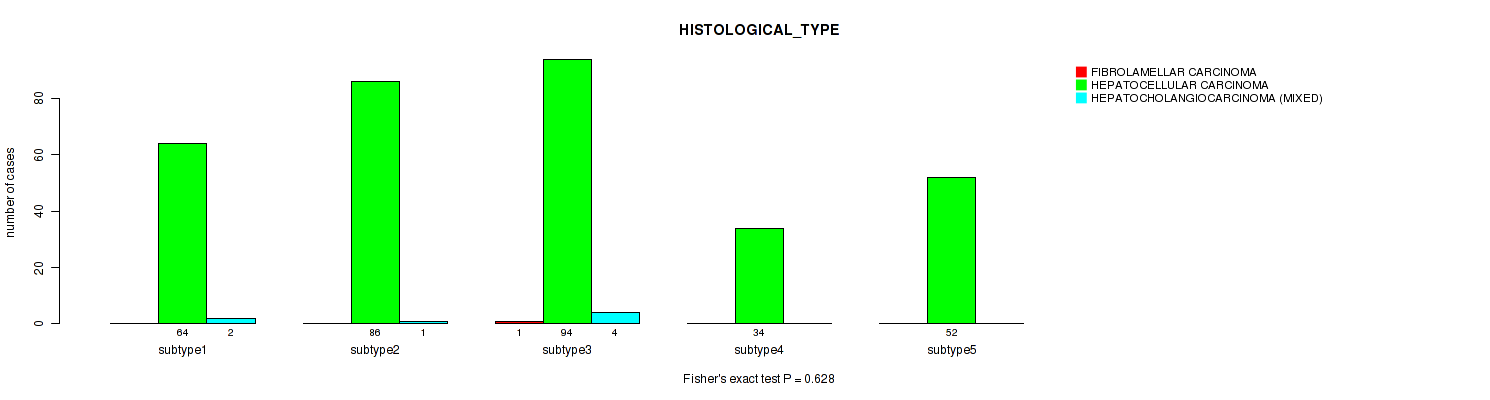
Table S36. Clustering Approach #3: 'RNAseq CNMF subtypes' versus Clinical Feature #9: 'HISTOLOGICAL_TYPE'
| nPatients | FIBROLAMELLAR CARCINOMA | HEPATOCELLULAR CARCINOMA | HEPATOCHOLANGIOCARCINOMA (MIXED) |
|---|---|---|---|
| ALL | 2 | 353 | 7 |
| subtype1 | 0 | 57 | 2 |
| subtype2 | 0 | 97 | 0 |
| subtype3 | 0 | 69 | 1 |
| subtype4 | 2 | 62 | 4 |
| subtype5 | 0 | 68 | 0 |
Figure S33. Get High-res Image Clustering Approach #3: 'RNAseq CNMF subtypes' versus Clinical Feature #9: 'HISTOLOGICAL_TYPE'
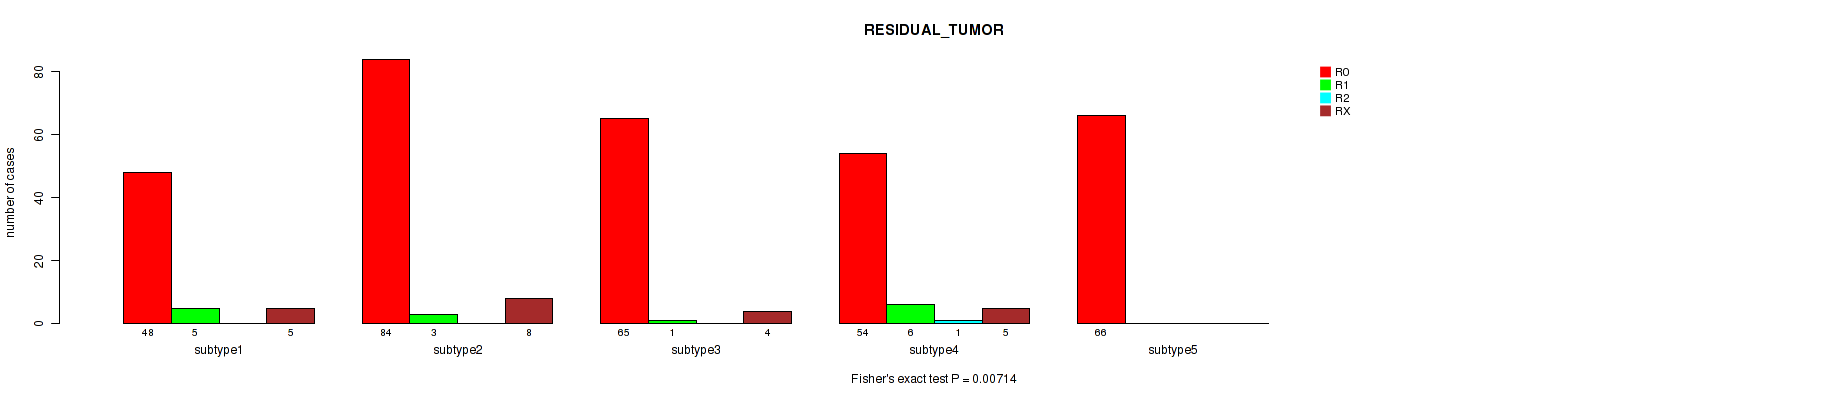
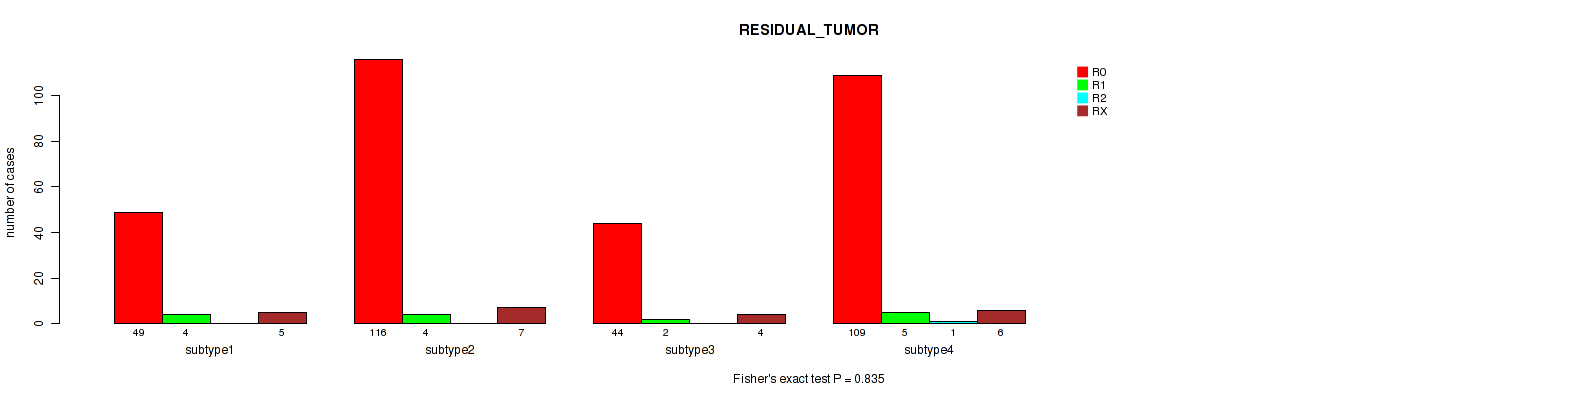
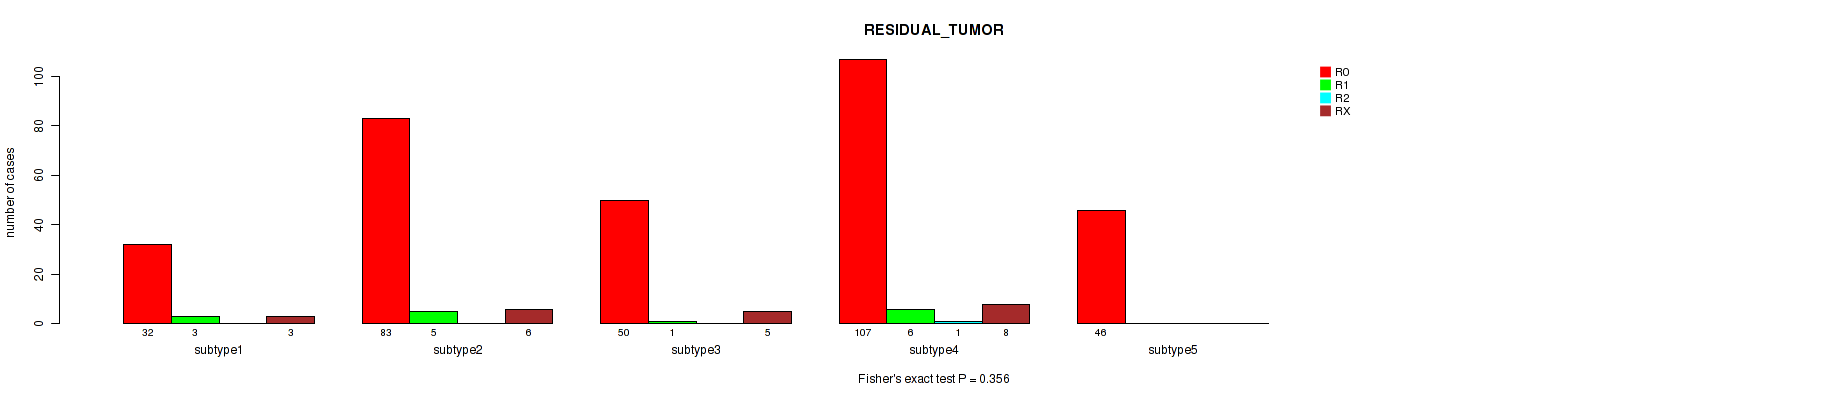
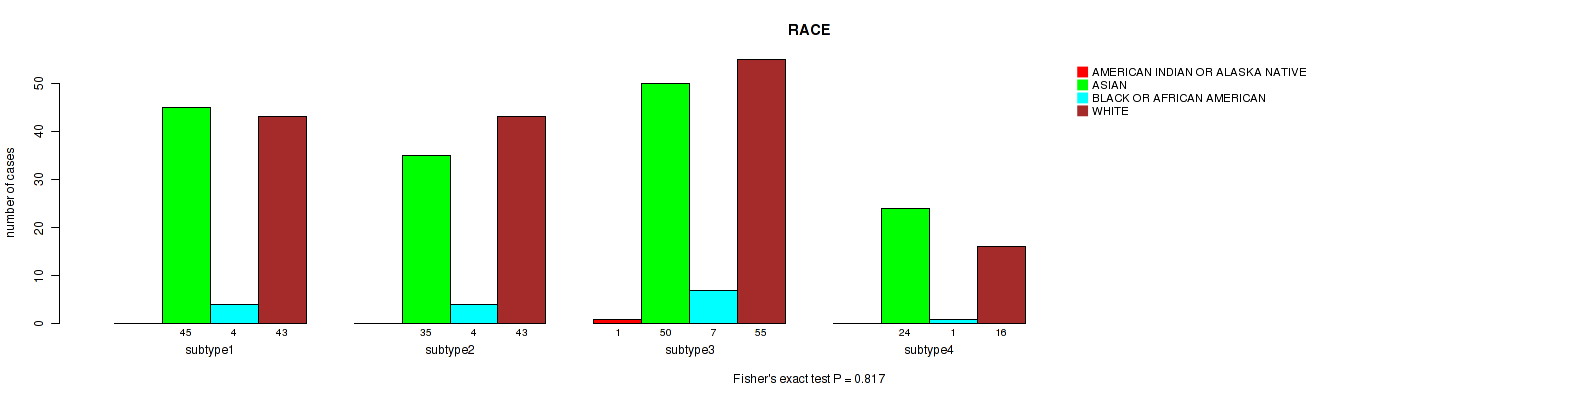
P value = 0.00714 (Fisher's exact test), Q value = 0.038
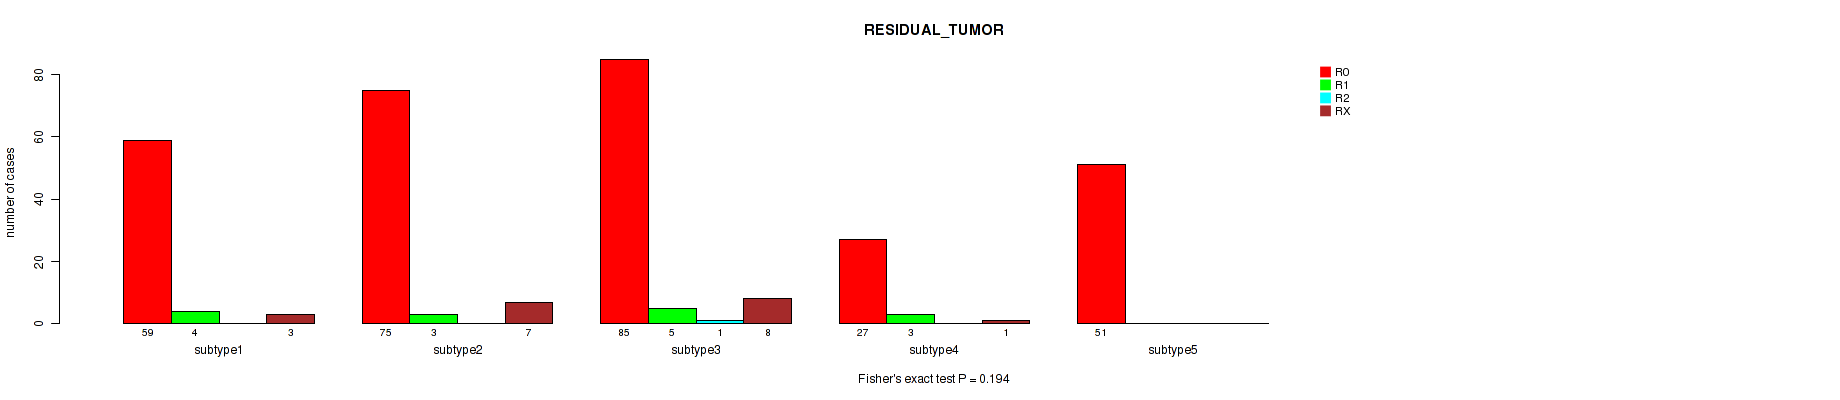
Table S37. Clustering Approach #3: 'RNAseq CNMF subtypes' versus Clinical Feature #10: 'RESIDUAL_TUMOR'
| nPatients | R0 | R1 | R2 | RX |
|---|---|---|---|---|
| ALL | 317 | 15 | 1 | 22 |
| subtype1 | 48 | 5 | 0 | 5 |
| subtype2 | 84 | 3 | 0 | 8 |
| subtype3 | 65 | 1 | 0 | 4 |
| subtype4 | 54 | 6 | 1 | 5 |
| subtype5 | 66 | 0 | 0 | 0 |
Figure S34. Get High-res Image Clustering Approach #3: 'RNAseq CNMF subtypes' versus Clinical Feature #10: 'RESIDUAL_TUMOR'
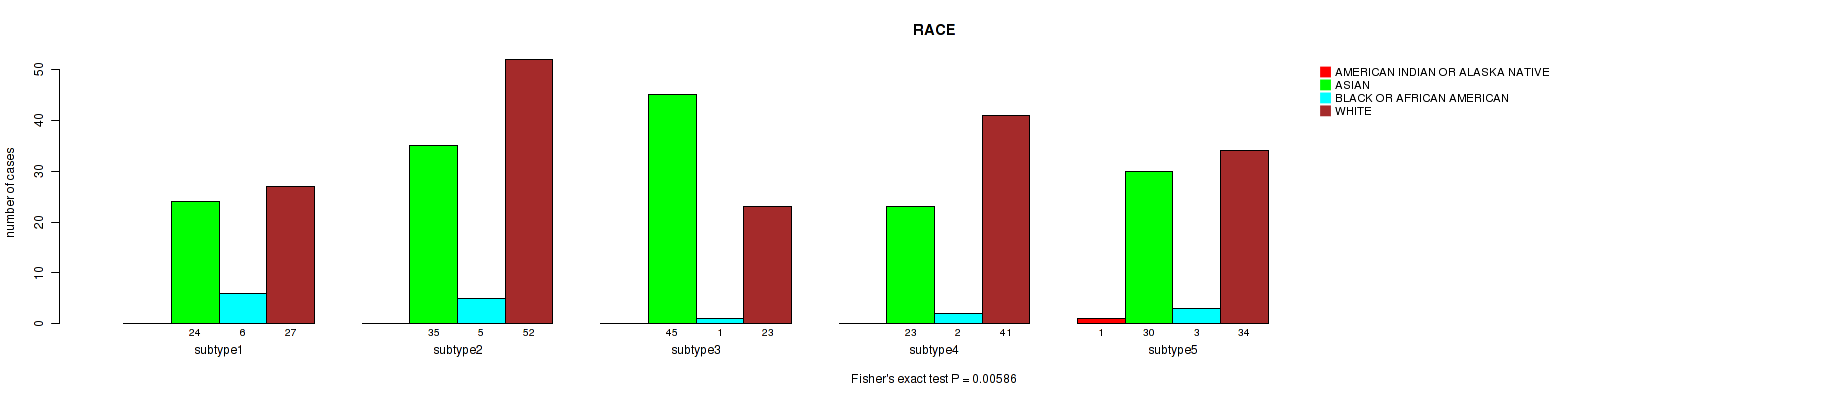
P value = 0.00586 (Fisher's exact test), Q value = 0.033
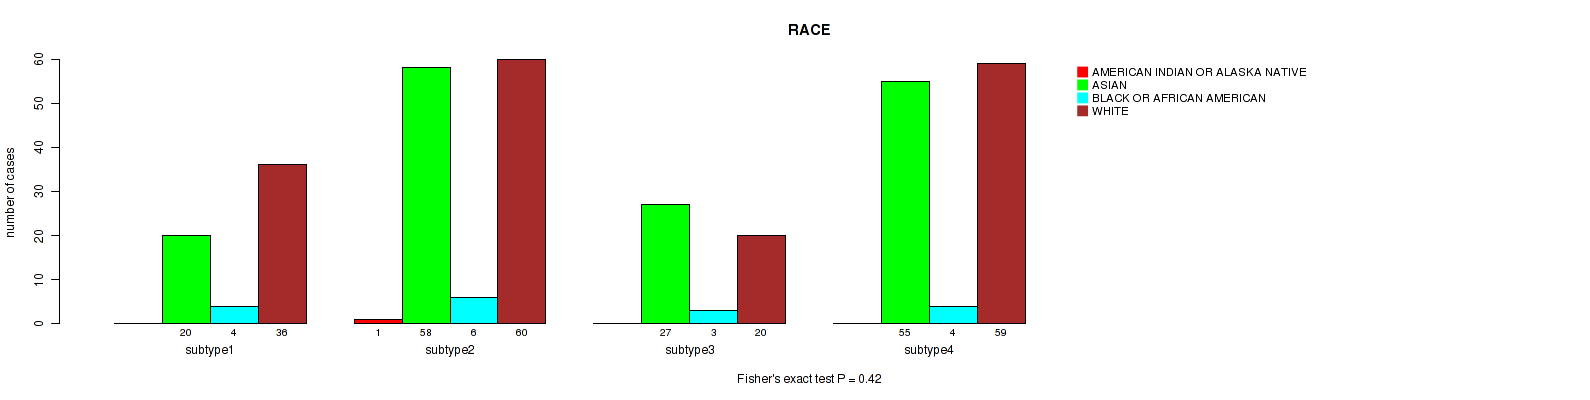
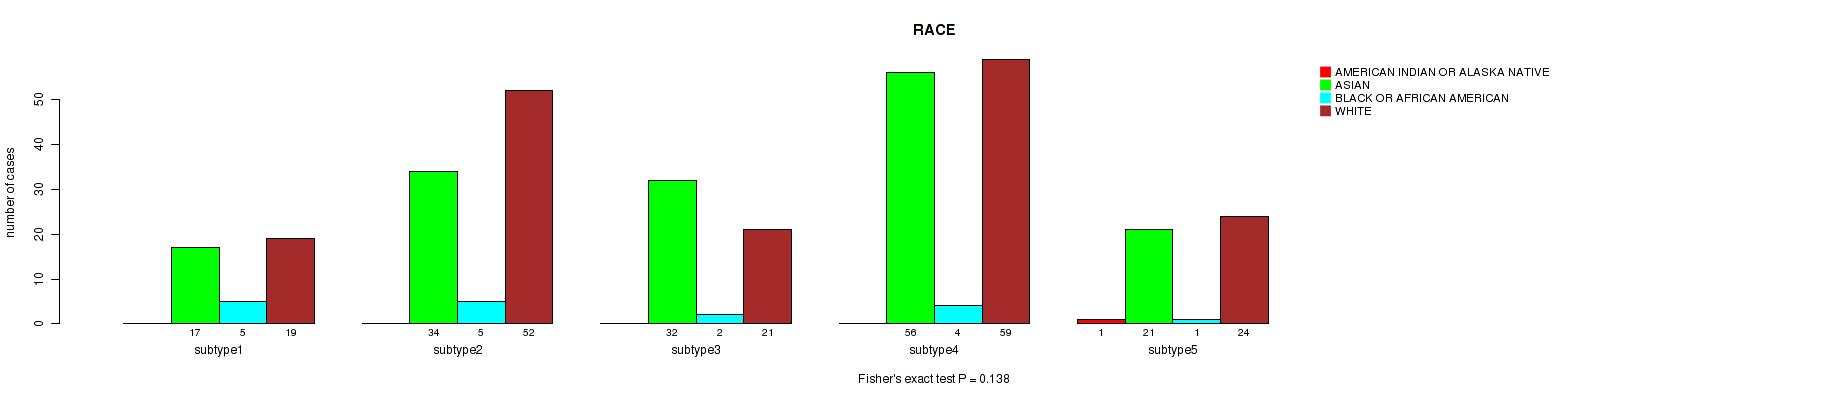
Table S38. Clustering Approach #3: 'RNAseq CNMF subtypes' versus Clinical Feature #11: 'RACE'
| nPatients | AMERICAN INDIAN OR ALASKA NATIVE | ASIAN | BLACK OR AFRICAN AMERICAN | WHITE |
|---|---|---|---|---|
| ALL | 1 | 157 | 17 | 177 |
| subtype1 | 0 | 24 | 6 | 27 |
| subtype2 | 0 | 35 | 5 | 52 |
| subtype3 | 0 | 45 | 1 | 23 |
| subtype4 | 0 | 23 | 2 | 41 |
| subtype5 | 1 | 30 | 3 | 34 |
Figure S35. Get High-res Image Clustering Approach #3: 'RNAseq CNMF subtypes' versus Clinical Feature #11: 'RACE'
P value = 0.699 (Fisher's exact test), Q value = 0.83
Table S39. Clustering Approach #3: 'RNAseq CNMF subtypes' versus Clinical Feature #12: 'ETHNICITY'
| nPatients | HISPANIC OR LATINO | NOT HISPANIC OR LATINO |
|---|---|---|
| ALL | 14 | 331 |
| subtype1 | 3 | 51 |
| subtype2 | 5 | 86 |
| subtype3 | 2 | 67 |
| subtype4 | 3 | 62 |
| subtype5 | 1 | 65 |
Figure S36. Get High-res Image Clustering Approach #3: 'RNAseq CNMF subtypes' versus Clinical Feature #12: 'ETHNICITY'
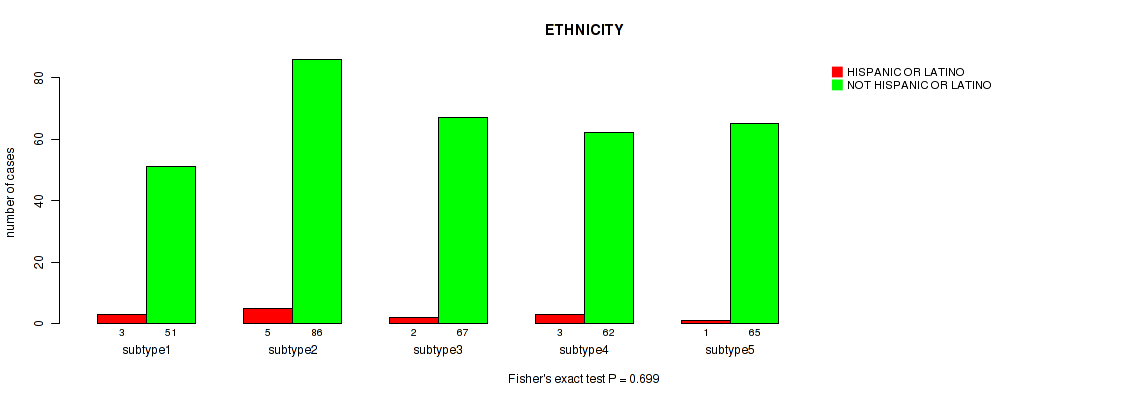
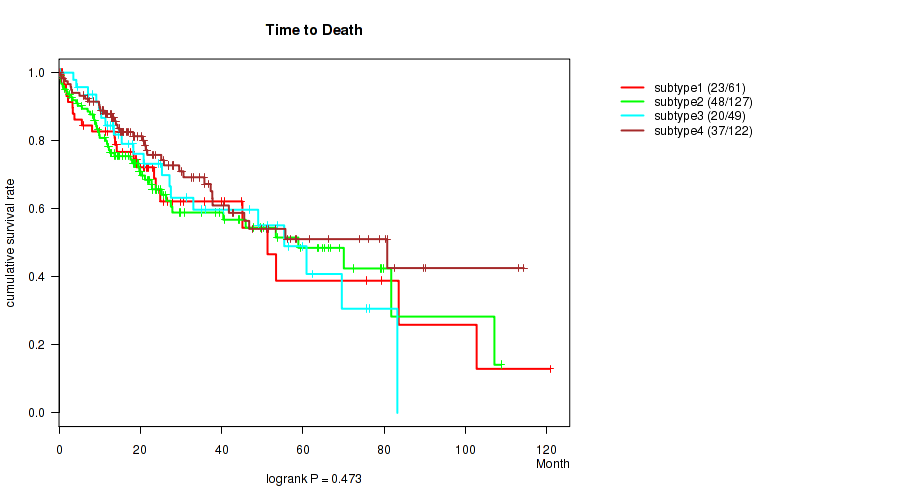
Table S40. Description of clustering approach #4: 'RNAseq cHierClus subtypes'
| Cluster Labels | 1 | 2 | 3 | 4 | 5 |
|---|---|---|---|---|---|
| Number of samples | 53 | 56 | 114 | 84 | 55 |
P value = 0.00423 (logrank test), Q value = 0.029
Table S41. Clustering Approach #4: 'RNAseq cHierClus subtypes' versus Clinical Feature #1: 'Time to Death'
| nPatients | nDeath | Duration Range (Median), Month | |
|---|---|---|---|
| ALL | 358 | 130 | 0.0 - 120.8 (19.4) |
| subtype1 | 52 | 29 | 0.2 - 107.1 (13.3) |
| subtype2 | 56 | 17 | 0.0 - 90.3 (19.2) |
| subtype3 | 114 | 42 | 0.3 - 120.8 (21.0) |
| subtype4 | 81 | 27 | 0.2 - 114.3 (19.6) |
| subtype5 | 55 | 15 | 0.4 - 108.8 (18.7) |
Figure S37. Get High-res Image Clustering Approach #4: 'RNAseq cHierClus subtypes' versus Clinical Feature #1: 'Time to Death'
P value = 5.63e-05 (Kruskal-Wallis (anova)), Q value = 0.00082
Table S42. Clustering Approach #4: 'RNAseq cHierClus subtypes' versus Clinical Feature #2: 'YEARS_TO_BIRTH'
| nPatients | Mean (Std.Dev) | |
|---|---|---|
| ALL | 359 | 59.6 (13.0) |
| subtype1 | 52 | 61.1 (11.2) |
| subtype2 | 55 | 61.9 (9.6) |
| subtype3 | 113 | 62.1 (11.7) |
| subtype4 | 84 | 52.5 (15.5) |
| subtype5 | 55 | 61.5 (12.3) |
Figure S38. Get High-res Image Clustering Approach #4: 'RNAseq cHierClus subtypes' versus Clinical Feature #2: 'YEARS_TO_BIRTH'
P value = 0.0023 (Fisher's exact test), Q value = 0.017
Table S43. Clustering Approach #4: 'RNAseq cHierClus subtypes' versus Clinical Feature #3: 'PATHOLOGIC_STAGE'
| nPatients | STAGE I | STAGE II | STAGE III | STAGE IIIA | STAGE IIIB | STAGE IIIC | STAGE IV | STAGE IVA | STAGE IVB |
|---|---|---|---|---|---|---|---|---|---|
| ALL | 168 | 84 | 3 | 63 | 7 | 9 | 3 | 1 | 2 |
| subtype1 | 11 | 15 | 0 | 15 | 4 | 3 | 0 | 0 | 0 |
| subtype2 | 32 | 10 | 0 | 3 | 1 | 2 | 1 | 1 | 0 |
| subtype3 | 61 | 25 | 1 | 17 | 1 | 1 | 0 | 0 | 1 |
| subtype4 | 40 | 19 | 1 | 17 | 0 | 2 | 2 | 0 | 1 |
| subtype5 | 24 | 15 | 1 | 11 | 1 | 1 | 0 | 0 | 0 |
Figure S39. Get High-res Image Clustering Approach #4: 'RNAseq cHierClus subtypes' versus Clinical Feature #3: 'PATHOLOGIC_STAGE'
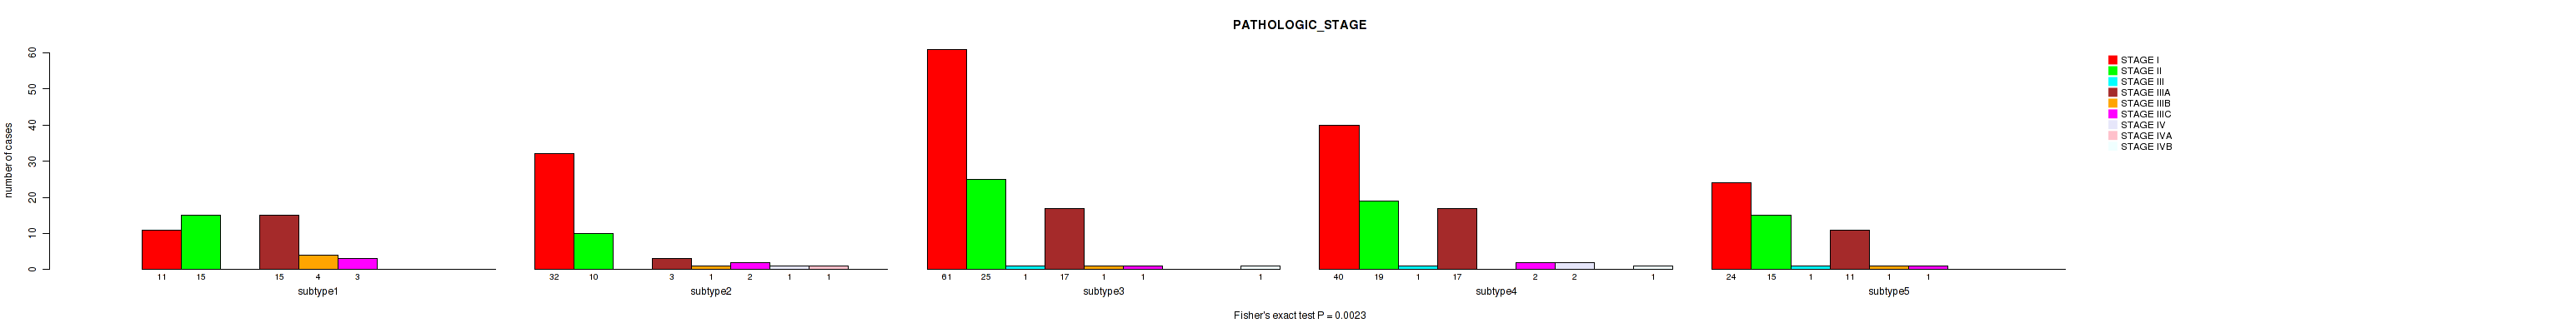
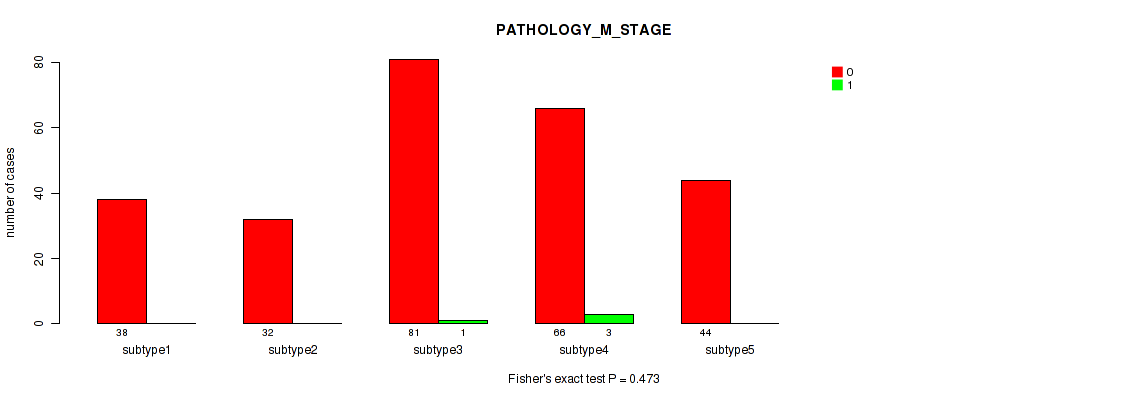
P value = 0.00029 (Fisher's exact test), Q value = 0.0034
Table S44. Clustering Approach #4: 'RNAseq cHierClus subtypes' versus Clinical Feature #4: 'PATHOLOGY_T_STAGE'
| nPatients | T0+T1 | T2 | T3 | T4 |
|---|---|---|---|---|
| ALL | 179 | 91 | 77 | 13 |
| subtype1 | 11 | 18 | 20 | 4 |
| subtype2 | 38 | 11 | 5 | 2 |
| subtype3 | 62 | 28 | 18 | 5 |
| subtype4 | 43 | 19 | 21 | 1 |
| subtype5 | 25 | 15 | 13 | 1 |
Figure S40. Get High-res Image Clustering Approach #4: 'RNAseq cHierClus subtypes' versus Clinical Feature #4: 'PATHOLOGY_T_STAGE'
P value = 0.305 (Fisher's exact test), Q value = 0.48
Table S45. Clustering Approach #4: 'RNAseq cHierClus subtypes' versus Clinical Feature #5: 'PATHOLOGY_N_STAGE'
| nPatients | 0 | 1 |
|---|---|---|
| ALL | 248 | 4 |
| subtype1 | 33 | 1 |
| subtype2 | 30 | 1 |
| subtype3 | 76 | 0 |
| subtype4 | 66 | 2 |
| subtype5 | 43 | 0 |
Figure S41. Get High-res Image Clustering Approach #4: 'RNAseq cHierClus subtypes' versus Clinical Feature #5: 'PATHOLOGY_N_STAGE'
P value = 0.473 (Fisher's exact test), Q value = 0.67
Table S46. Clustering Approach #4: 'RNAseq cHierClus subtypes' versus Clinical Feature #6: 'PATHOLOGY_M_STAGE'
| nPatients | 0 | 1 |
|---|---|---|
| ALL | 261 | 4 |
| subtype1 | 38 | 0 |
| subtype2 | 32 | 0 |
| subtype3 | 81 | 1 |
| subtype4 | 66 | 3 |
| subtype5 | 44 | 0 |
Figure S42. Get High-res Image Clustering Approach #4: 'RNAseq cHierClus subtypes' versus Clinical Feature #6: 'PATHOLOGY_M_STAGE'
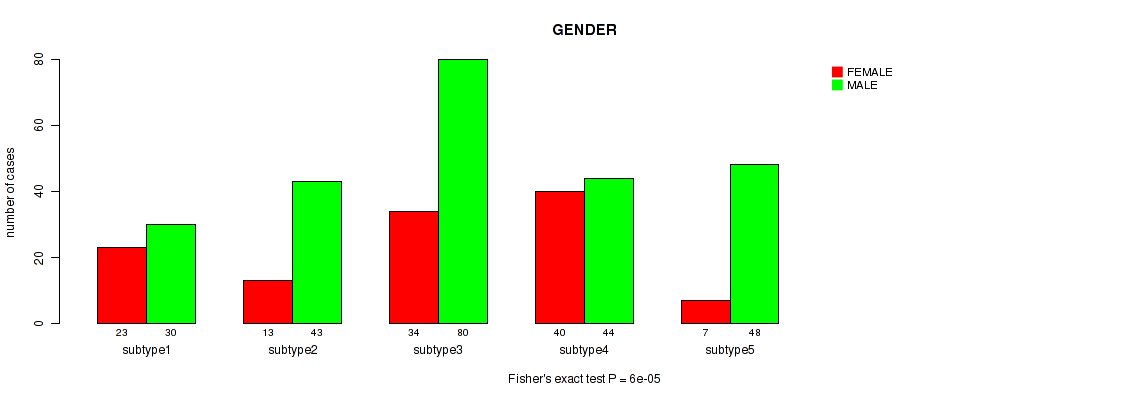
P value = 6e-05 (Fisher's exact test), Q value = 0.00082
Table S47. Clustering Approach #4: 'RNAseq cHierClus subtypes' versus Clinical Feature #7: 'GENDER'
| nPatients | FEMALE | MALE |
|---|---|---|
| ALL | 117 | 245 |
| subtype1 | 23 | 30 |
| subtype2 | 13 | 43 |
| subtype3 | 34 | 80 |
| subtype4 | 40 | 44 |
| subtype5 | 7 | 48 |
Figure S43. Get High-res Image Clustering Approach #4: 'RNAseq cHierClus subtypes' versus Clinical Feature #7: 'GENDER'
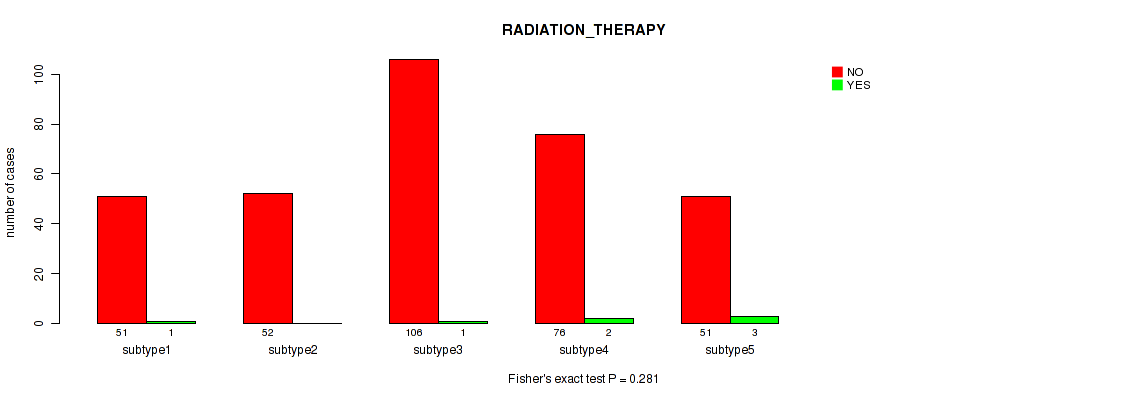
P value = 0.281 (Fisher's exact test), Q value = 0.46
Table S48. Clustering Approach #4: 'RNAseq cHierClus subtypes' versus Clinical Feature #8: 'RADIATION_THERAPY'
| nPatients | NO | YES |
|---|---|---|
| ALL | 336 | 7 |
| subtype1 | 51 | 1 |
| subtype2 | 52 | 0 |
| subtype3 | 106 | 1 |
| subtype4 | 76 | 2 |
| subtype5 | 51 | 3 |
Figure S44. Get High-res Image Clustering Approach #4: 'RNAseq cHierClus subtypes' versus Clinical Feature #8: 'RADIATION_THERAPY'
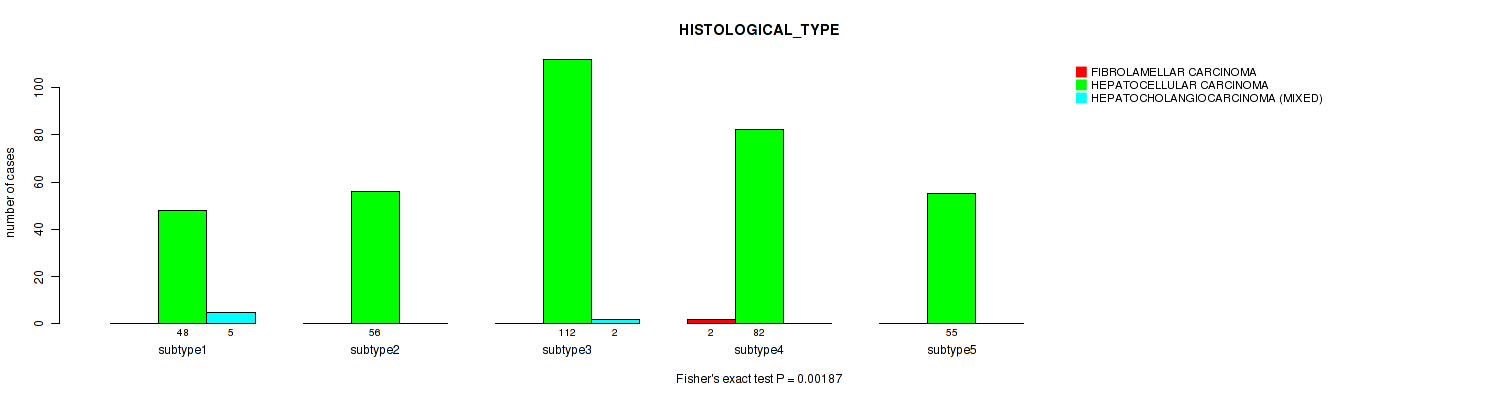
P value = 0.00187 (Fisher's exact test), Q value = 0.016
Table S49. Clustering Approach #4: 'RNAseq cHierClus subtypes' versus Clinical Feature #9: 'HISTOLOGICAL_TYPE'
| nPatients | FIBROLAMELLAR CARCINOMA | HEPATOCELLULAR CARCINOMA | HEPATOCHOLANGIOCARCINOMA (MIXED) |
|---|---|---|---|
| ALL | 2 | 353 | 7 |
| subtype1 | 0 | 48 | 5 |
| subtype2 | 0 | 56 | 0 |
| subtype3 | 0 | 112 | 2 |
| subtype4 | 2 | 82 | 0 |
| subtype5 | 0 | 55 | 0 |
Figure S45. Get High-res Image Clustering Approach #4: 'RNAseq cHierClus subtypes' versus Clinical Feature #9: 'HISTOLOGICAL_TYPE'
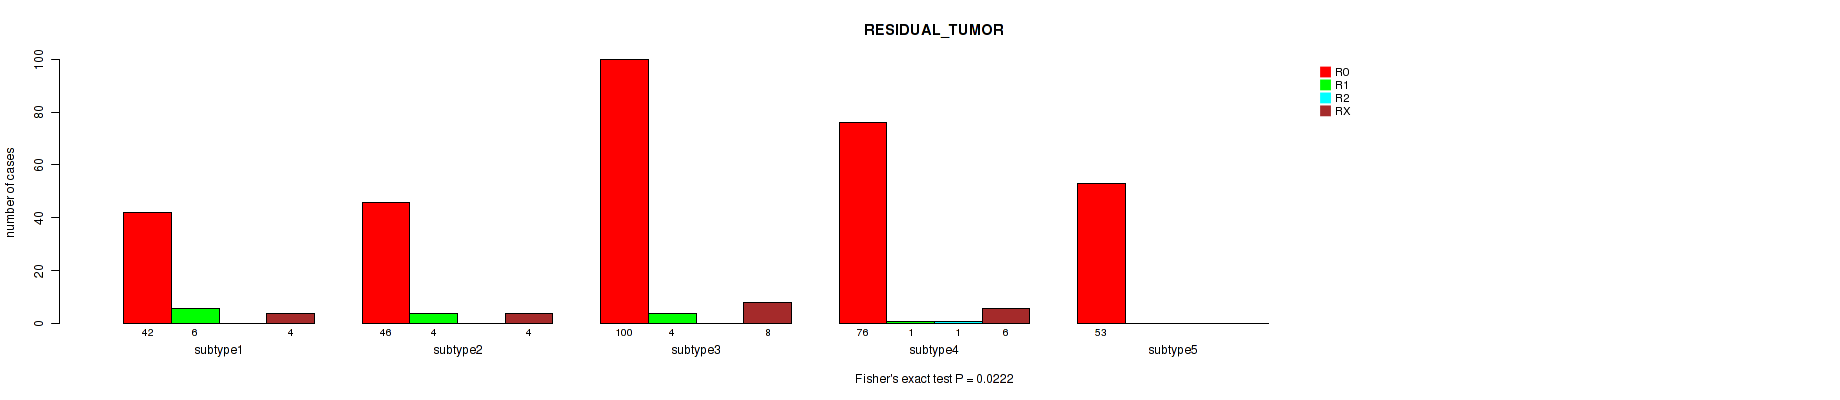
P value = 0.0222 (Fisher's exact test), Q value = 0.082
Table S50. Clustering Approach #4: 'RNAseq cHierClus subtypes' versus Clinical Feature #10: 'RESIDUAL_TUMOR'
| nPatients | R0 | R1 | R2 | RX |
|---|---|---|---|---|
| ALL | 317 | 15 | 1 | 22 |
| subtype1 | 42 | 6 | 0 | 4 |
| subtype2 | 46 | 4 | 0 | 4 |
| subtype3 | 100 | 4 | 0 | 8 |
| subtype4 | 76 | 1 | 1 | 6 |
| subtype5 | 53 | 0 | 0 | 0 |
Figure S46. Get High-res Image Clustering Approach #4: 'RNAseq cHierClus subtypes' versus Clinical Feature #10: 'RESIDUAL_TUMOR'
P value = 0.0154 (Fisher's exact test), Q value = 0.062
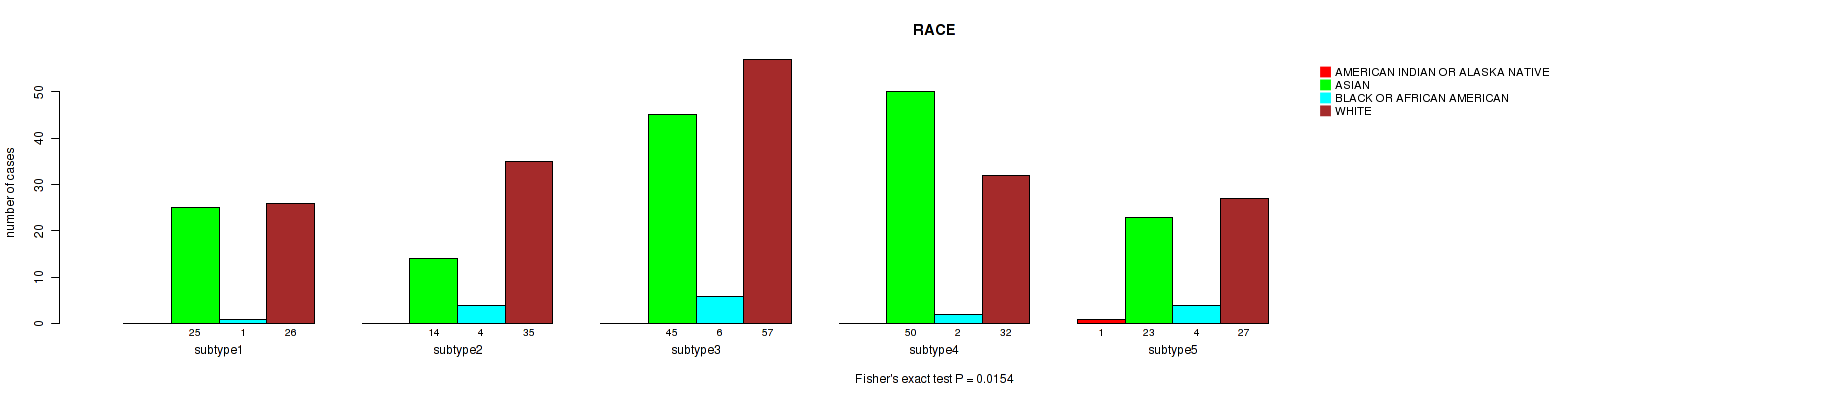
Table S51. Clustering Approach #4: 'RNAseq cHierClus subtypes' versus Clinical Feature #11: 'RACE'
| nPatients | AMERICAN INDIAN OR ALASKA NATIVE | ASIAN | BLACK OR AFRICAN AMERICAN | WHITE |
|---|---|---|---|---|
| ALL | 1 | 157 | 17 | 177 |
| subtype1 | 0 | 25 | 1 | 26 |
| subtype2 | 0 | 14 | 4 | 35 |
| subtype3 | 0 | 45 | 6 | 57 |
| subtype4 | 0 | 50 | 2 | 32 |
| subtype5 | 1 | 23 | 4 | 27 |
Figure S47. Get High-res Image Clustering Approach #4: 'RNAseq cHierClus subtypes' versus Clinical Feature #11: 'RACE'
P value = 0.256 (Fisher's exact test), Q value = 0.45
Table S52. Clustering Approach #4: 'RNAseq cHierClus subtypes' versus Clinical Feature #12: 'ETHNICITY'
| nPatients | HISPANIC OR LATINO | NOT HISPANIC OR LATINO |
|---|---|---|
| ALL | 14 | 331 |
| subtype1 | 3 | 49 |
| subtype2 | 4 | 51 |
| subtype3 | 5 | 98 |
| subtype4 | 2 | 80 |
| subtype5 | 0 | 53 |
Figure S48. Get High-res Image Clustering Approach #4: 'RNAseq cHierClus subtypes' versus Clinical Feature #12: 'ETHNICITY'
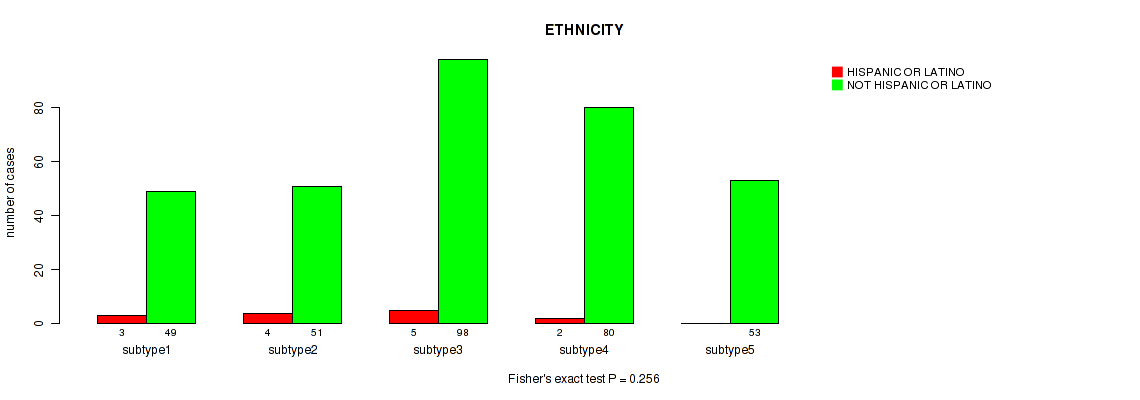
Table S53. Description of clustering approach #5: 'MIRSEQ CNMF'
| Cluster Labels | 1 | 2 | 3 | 4 |
|---|---|---|---|---|
| Number of samples | 62 | 128 | 50 | 123 |
P value = 0.473 (logrank test), Q value = 0.67
Table S54. Clustering Approach #5: 'MIRSEQ CNMF' versus Clinical Feature #1: 'Time to Death'
| nPatients | nDeath | Duration Range (Median), Month | |
|---|---|---|---|
| ALL | 359 | 128 | 0.0 - 120.8 (19.8) |
| subtype1 | 61 | 23 | 0.0 - 120.8 (20.0) |
| subtype2 | 127 | 48 | 0.3 - 108.8 (19.3) |
| subtype3 | 49 | 20 | 0.2 - 83.2 (21.0) |
| subtype4 | 122 | 37 | 0.2 - 114.3 (20.4) |
Figure S49. Get High-res Image Clustering Approach #5: 'MIRSEQ CNMF' versus Clinical Feature #1: 'Time to Death'
P value = 0.00217 (Kruskal-Wallis (anova)), Q value = 0.017
Table S55. Clustering Approach #5: 'MIRSEQ CNMF' versus Clinical Feature #2: 'YEARS_TO_BIRTH'
| nPatients | Mean (Std.Dev) | |
|---|---|---|
| ALL | 360 | 59.5 (13.0) |
| subtype1 | 60 | 62.8 (10.9) |
| subtype2 | 128 | 61.3 (13.2) |
| subtype3 | 50 | 55.4 (14.7) |
| subtype4 | 122 | 57.7 (12.3) |
Figure S50. Get High-res Image Clustering Approach #5: 'MIRSEQ CNMF' versus Clinical Feature #2: 'YEARS_TO_BIRTH'
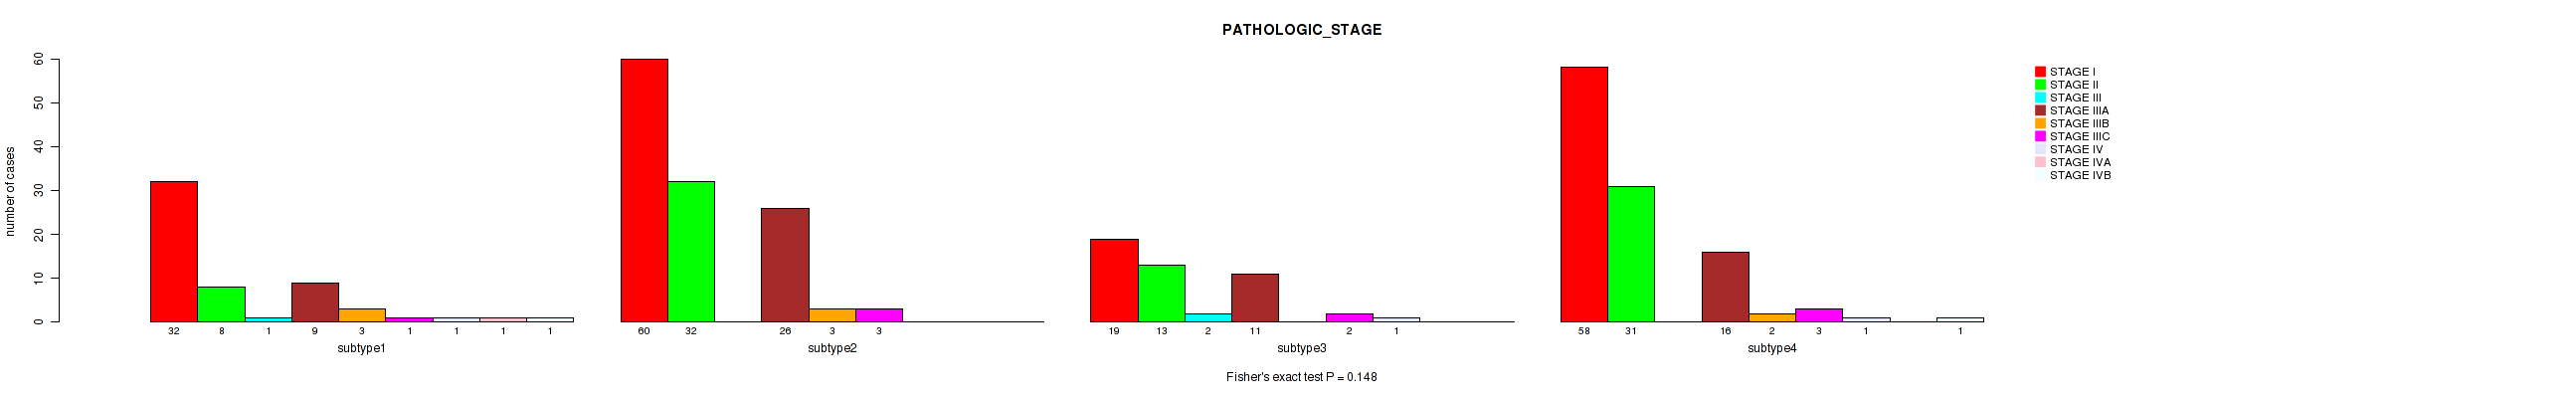
P value = 0.148 (Fisher's exact test), Q value = 0.32
Table S56. Clustering Approach #5: 'MIRSEQ CNMF' versus Clinical Feature #3: 'PATHOLOGIC_STAGE'
| nPatients | STAGE I | STAGE II | STAGE III | STAGE IIIA | STAGE IIIB | STAGE IIIC | STAGE IV | STAGE IVA | STAGE IVB |
|---|---|---|---|---|---|---|---|---|---|
| ALL | 169 | 84 | 3 | 62 | 8 | 9 | 3 | 1 | 2 |
| subtype1 | 32 | 8 | 1 | 9 | 3 | 1 | 1 | 1 | 1 |
| subtype2 | 60 | 32 | 0 | 26 | 3 | 3 | 0 | 0 | 0 |
| subtype3 | 19 | 13 | 2 | 11 | 0 | 2 | 1 | 0 | 0 |
| subtype4 | 58 | 31 | 0 | 16 | 2 | 3 | 1 | 0 | 1 |
Figure S51. Get High-res Image Clustering Approach #5: 'MIRSEQ CNMF' versus Clinical Feature #3: 'PATHOLOGIC_STAGE'
P value = 0.852 (Fisher's exact test), Q value = 0.93
Table S57. Clustering Approach #5: 'MIRSEQ CNMF' versus Clinical Feature #4: 'PATHOLOGY_T_STAGE'
| nPatients | T0+T1 | T2 | T3 | T4 |
|---|---|---|---|---|
| ALL | 180 | 91 | 77 | 13 |
| subtype1 | 35 | 11 | 13 | 3 |
| subtype2 | 61 | 33 | 29 | 4 |
| subtype3 | 22 | 13 | 13 | 2 |
| subtype4 | 62 | 34 | 22 | 4 |
Figure S52. Get High-res Image Clustering Approach #5: 'MIRSEQ CNMF' versus Clinical Feature #4: 'PATHOLOGY_T_STAGE'
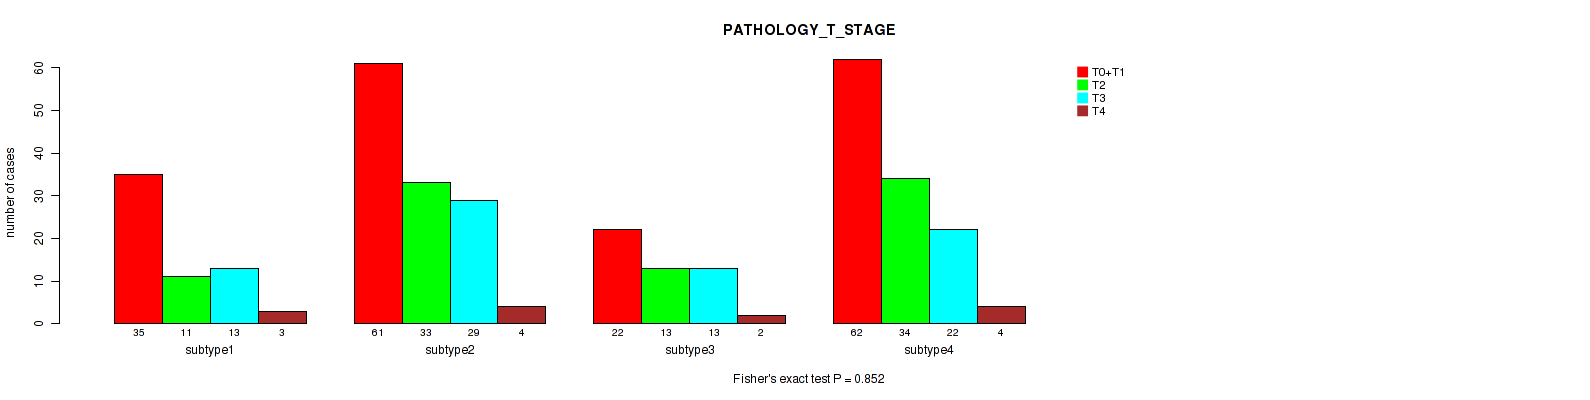
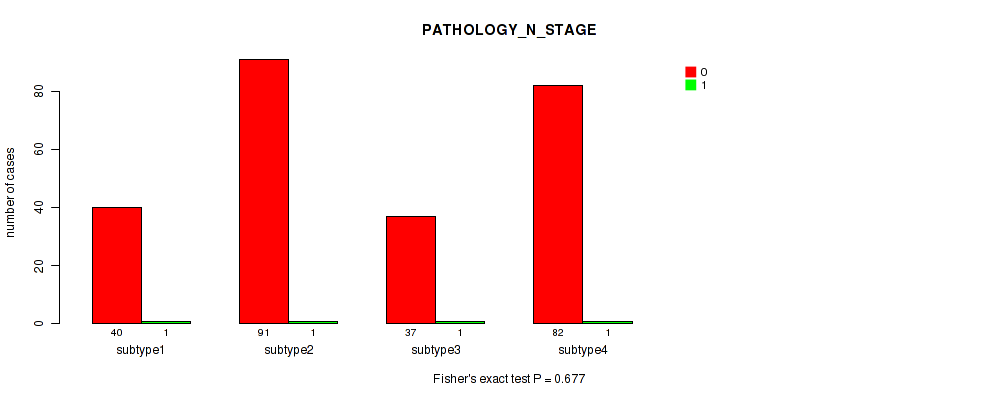
P value = 0.677 (Fisher's exact test), Q value = 0.81
Table S58. Clustering Approach #5: 'MIRSEQ CNMF' versus Clinical Feature #5: 'PATHOLOGY_N_STAGE'
| nPatients | 0 | 1 |
|---|---|---|
| ALL | 250 | 4 |
| subtype1 | 40 | 1 |
| subtype2 | 91 | 1 |
| subtype3 | 37 | 1 |
| subtype4 | 82 | 1 |
Figure S53. Get High-res Image Clustering Approach #5: 'MIRSEQ CNMF' versus Clinical Feature #5: 'PATHOLOGY_N_STAGE'
P value = 0.236 (Fisher's exact test), Q value = 0.43
Table S59. Clustering Approach #5: 'MIRSEQ CNMF' versus Clinical Feature #6: 'PATHOLOGY_M_STAGE'
| nPatients | 0 | 1 |
|---|---|---|
| ALL | 264 | 4 |
| subtype1 | 36 | 1 |
| subtype2 | 101 | 0 |
| subtype3 | 39 | 1 |
| subtype4 | 88 | 2 |
Figure S54. Get High-res Image Clustering Approach #5: 'MIRSEQ CNMF' versus Clinical Feature #6: 'PATHOLOGY_M_STAGE'
P value = 0.228 (Fisher's exact test), Q value = 0.42
Table S60. Clustering Approach #5: 'MIRSEQ CNMF' versus Clinical Feature #7: 'GENDER'
| nPatients | FEMALE | MALE |
|---|---|---|
| ALL | 115 | 248 |
| subtype1 | 19 | 43 |
| subtype2 | 33 | 95 |
| subtype3 | 20 | 30 |
| subtype4 | 43 | 80 |
Figure S55. Get High-res Image Clustering Approach #5: 'MIRSEQ CNMF' versus Clinical Feature #7: 'GENDER'
P value = 0.637 (Fisher's exact test), Q value = 0.78
Table S61. Clustering Approach #5: 'MIRSEQ CNMF' versus Clinical Feature #8: 'RADIATION_THERAPY'
| nPatients | NO | YES |
|---|---|---|
| ALL | 337 | 7 |
| subtype1 | 58 | 0 |
| subtype2 | 117 | 4 |
| subtype3 | 47 | 1 |
| subtype4 | 115 | 2 |
Figure S56. Get High-res Image Clustering Approach #5: 'MIRSEQ CNMF' versus Clinical Feature #8: 'RADIATION_THERAPY'
P value = 0.102 (Fisher's exact test), Q value = 0.25
Table S62. Clustering Approach #5: 'MIRSEQ CNMF' versus Clinical Feature #9: 'HISTOLOGICAL_TYPE'
| nPatients | FIBROLAMELLAR CARCINOMA | HEPATOCELLULAR CARCINOMA | HEPATOCHOLANGIOCARCINOMA (MIXED) |
|---|---|---|---|
| ALL | 2 | 354 | 7 |
| subtype1 | 0 | 61 | 1 |
| subtype2 | 0 | 128 | 0 |
| subtype3 | 0 | 48 | 2 |
| subtype4 | 2 | 117 | 4 |
Figure S57. Get High-res Image Clustering Approach #5: 'MIRSEQ CNMF' versus Clinical Feature #9: 'HISTOLOGICAL_TYPE'
P value = 0.835 (Fisher's exact test), Q value = 0.93
Table S63. Clustering Approach #5: 'MIRSEQ CNMF' versus Clinical Feature #10: 'RESIDUAL_TUMOR'
| nPatients | R0 | R1 | R2 | RX |
|---|---|---|---|---|
| ALL | 318 | 15 | 1 | 22 |
| subtype1 | 49 | 4 | 0 | 5 |
| subtype2 | 116 | 4 | 0 | 7 |
| subtype3 | 44 | 2 | 0 | 4 |
| subtype4 | 109 | 5 | 1 | 6 |
Figure S58. Get High-res Image Clustering Approach #5: 'MIRSEQ CNMF' versus Clinical Feature #10: 'RESIDUAL_TUMOR'
P value = 0.42 (Fisher's exact test), Q value = 0.62
Table S64. Clustering Approach #5: 'MIRSEQ CNMF' versus Clinical Feature #11: 'RACE'
| nPatients | AMERICAN INDIAN OR ALASKA NATIVE | ASIAN | BLACK OR AFRICAN AMERICAN | WHITE |
|---|---|---|---|---|
| ALL | 1 | 160 | 17 | 175 |
| subtype1 | 0 | 20 | 4 | 36 |
| subtype2 | 1 | 58 | 6 | 60 |
| subtype3 | 0 | 27 | 3 | 20 |
| subtype4 | 0 | 55 | 4 | 59 |
Figure S59. Get High-res Image Clustering Approach #5: 'MIRSEQ CNMF' versus Clinical Feature #11: 'RACE'
P value = 0.4 (Fisher's exact test), Q value = 0.6
Table S65. Clustering Approach #5: 'MIRSEQ CNMF' versus Clinical Feature #12: 'ETHNICITY'
| nPatients | HISPANIC OR LATINO | NOT HISPANIC OR LATINO |
|---|---|---|
| ALL | 14 | 332 |
| subtype1 | 2 | 56 |
| subtype2 | 3 | 119 |
| subtype3 | 1 | 47 |
| subtype4 | 8 | 110 |
Figure S60. Get High-res Image Clustering Approach #5: 'MIRSEQ CNMF' versus Clinical Feature #12: 'ETHNICITY'
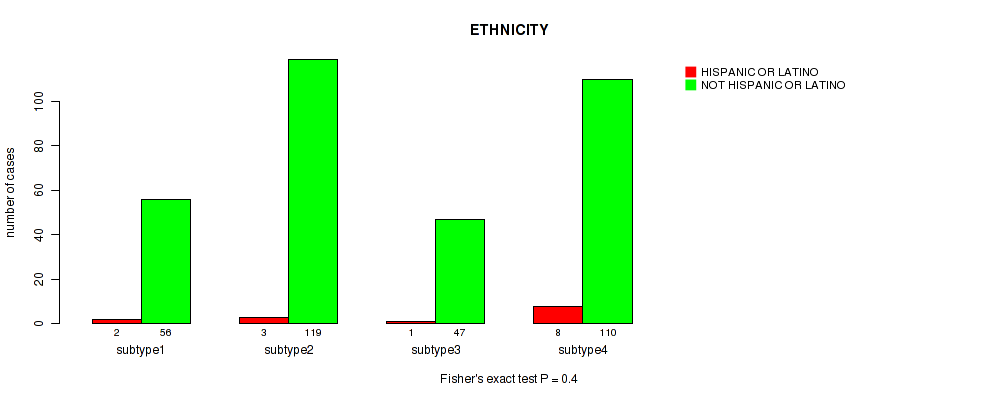
Table S66. Description of clustering approach #6: 'MIRSEQ CHIERARCHICAL'
| Cluster Labels | 1 | 2 | 3 | 4 | 5 |
|---|---|---|---|---|---|
| Number of samples | 41 | 97 | 56 | 122 | 47 |
P value = 0.056 (logrank test), Q value = 0.15
Table S67. Clustering Approach #6: 'MIRSEQ CHIERARCHICAL' versus Clinical Feature #1: 'Time to Death'
| nPatients | nDeath | Duration Range (Median), Month | |
|---|---|---|---|
| ALL | 359 | 128 | 0.0 - 120.8 (19.8) |
| subtype1 | 40 | 18 | 0.0 - 120.8 (14.6) |
| subtype2 | 97 | 34 | 0.3 - 102.7 (21.5) |
| subtype3 | 54 | 26 | 0.3 - 113.0 (16.4) |
| subtype4 | 121 | 40 | 0.2 - 114.3 (21.3) |
| subtype5 | 47 | 10 | 0.3 - 108.8 (18.7) |
Figure S61. Get High-res Image Clustering Approach #6: 'MIRSEQ CHIERARCHICAL' versus Clinical Feature #1: 'Time to Death'
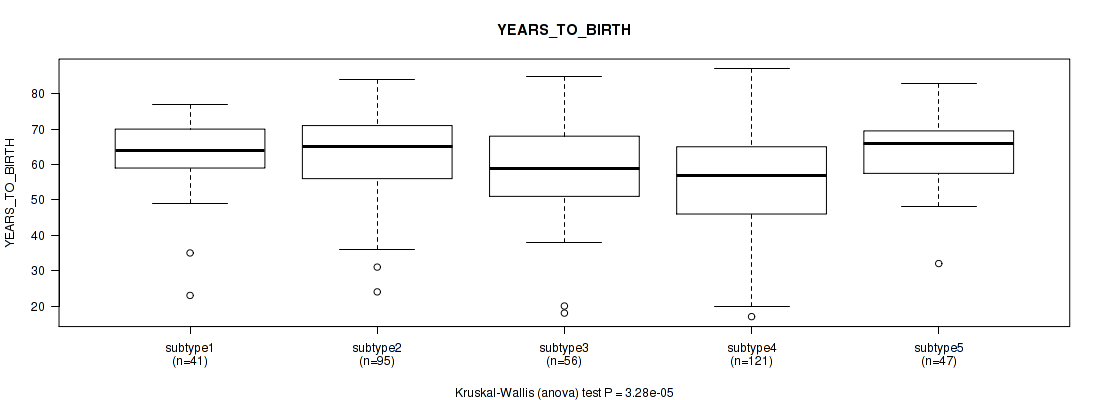
P value = 3.28e-05 (Kruskal-Wallis (anova)), Q value = 0.00063
Table S68. Clustering Approach #6: 'MIRSEQ CHIERARCHICAL' versus Clinical Feature #2: 'YEARS_TO_BIRTH'
| nPatients | Mean (Std.Dev) | |
|---|---|---|
| ALL | 360 | 59.5 (13.0) |
| subtype1 | 41 | 62.0 (11.1) |
| subtype2 | 95 | 62.8 (11.7) |
| subtype3 | 56 | 58.7 (13.6) |
| subtype4 | 121 | 55.0 (13.9) |
| subtype5 | 47 | 63.4 (9.9) |
Figure S62. Get High-res Image Clustering Approach #6: 'MIRSEQ CHIERARCHICAL' versus Clinical Feature #2: 'YEARS_TO_BIRTH'
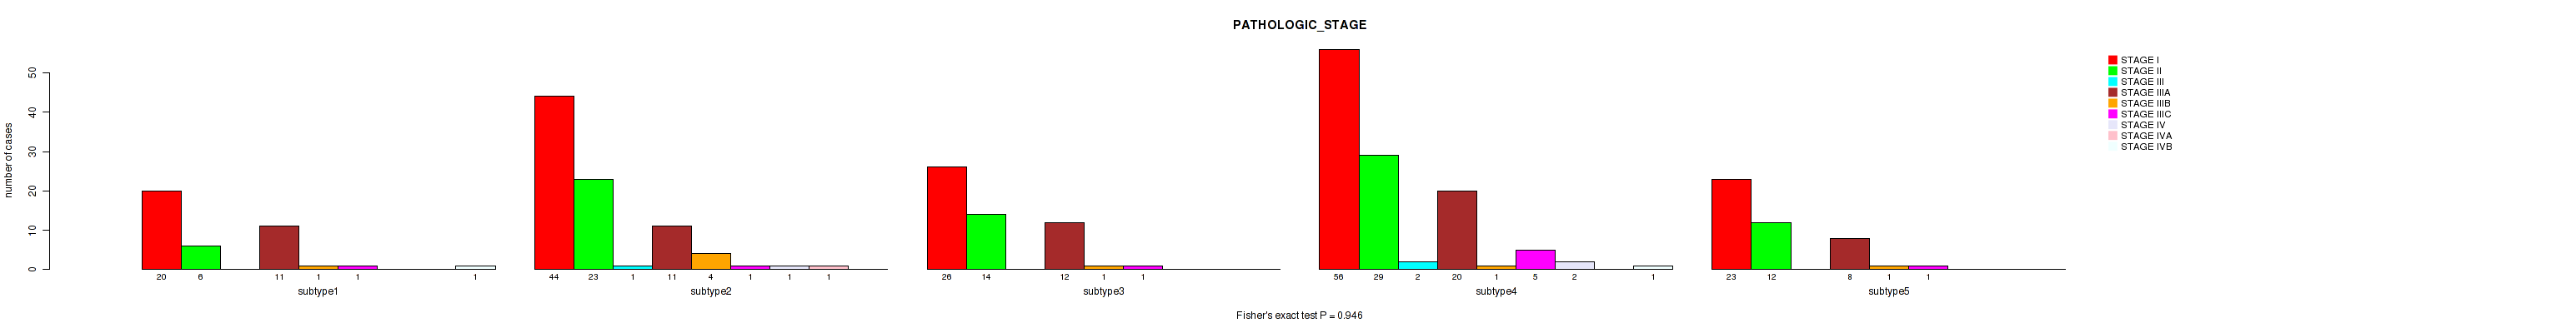
P value = 0.946 (Fisher's exact test), Q value = 0.99
Table S69. Clustering Approach #6: 'MIRSEQ CHIERARCHICAL' versus Clinical Feature #3: 'PATHOLOGIC_STAGE'
| nPatients | STAGE I | STAGE II | STAGE III | STAGE IIIA | STAGE IIIB | STAGE IIIC | STAGE IV | STAGE IVA | STAGE IVB |
|---|---|---|---|---|---|---|---|---|---|
| ALL | 169 | 84 | 3 | 62 | 8 | 9 | 3 | 1 | 2 |
| subtype1 | 20 | 6 | 0 | 11 | 1 | 1 | 0 | 0 | 1 |
| subtype2 | 44 | 23 | 1 | 11 | 4 | 1 | 1 | 1 | 0 |
| subtype3 | 26 | 14 | 0 | 12 | 1 | 1 | 0 | 0 | 0 |
| subtype4 | 56 | 29 | 2 | 20 | 1 | 5 | 2 | 0 | 1 |
| subtype5 | 23 | 12 | 0 | 8 | 1 | 1 | 0 | 0 | 0 |
Figure S63. Get High-res Image Clustering Approach #6: 'MIRSEQ CHIERARCHICAL' versus Clinical Feature #3: 'PATHOLOGIC_STAGE'
P value = 0.863 (Fisher's exact test), Q value = 0.93
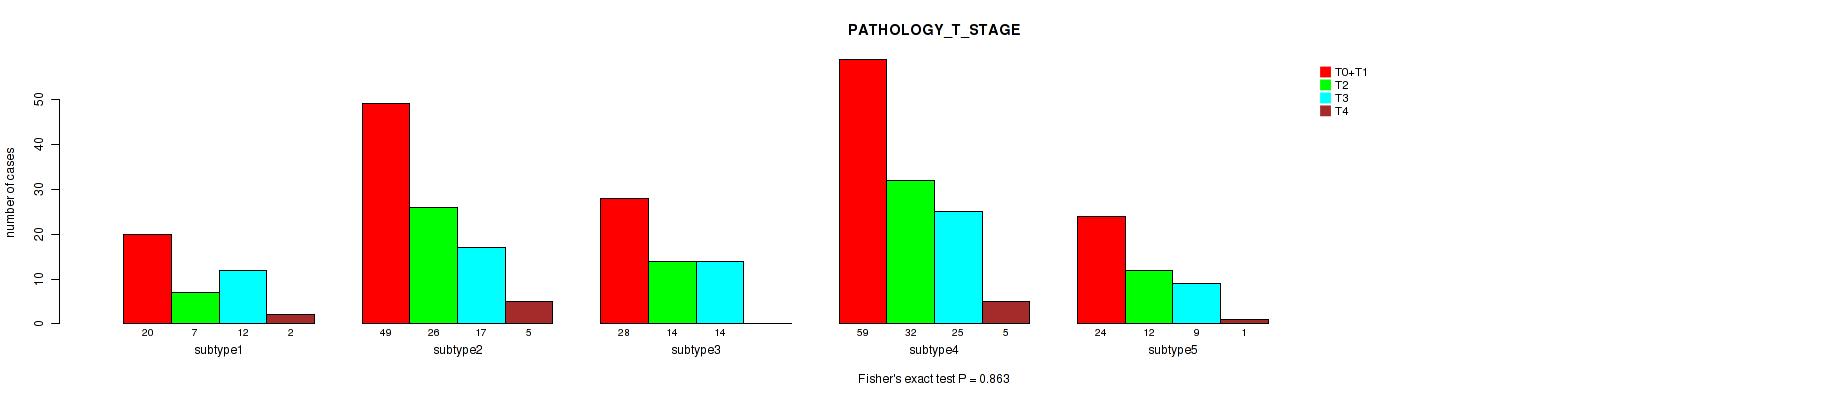
Table S70. Clustering Approach #6: 'MIRSEQ CHIERARCHICAL' versus Clinical Feature #4: 'PATHOLOGY_T_STAGE'
| nPatients | T0+T1 | T2 | T3 | T4 |
|---|---|---|---|---|
| ALL | 180 | 91 | 77 | 13 |
| subtype1 | 20 | 7 | 12 | 2 |
| subtype2 | 49 | 26 | 17 | 5 |
| subtype3 | 28 | 14 | 14 | 0 |
| subtype4 | 59 | 32 | 25 | 5 |
| subtype5 | 24 | 12 | 9 | 1 |
Figure S64. Get High-res Image Clustering Approach #6: 'MIRSEQ CHIERARCHICAL' versus Clinical Feature #4: 'PATHOLOGY_T_STAGE'
P value = 1 (Fisher's exact test), Q value = 1
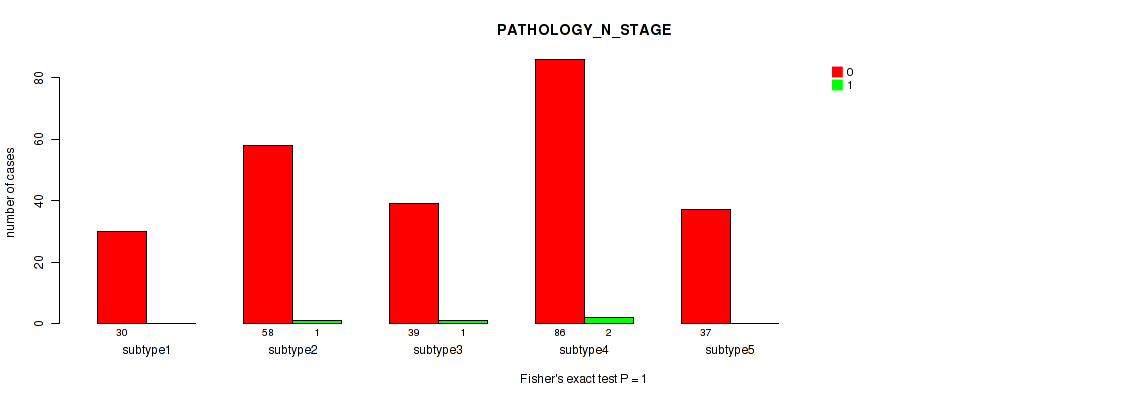
Table S71. Clustering Approach #6: 'MIRSEQ CHIERARCHICAL' versus Clinical Feature #5: 'PATHOLOGY_N_STAGE'
| nPatients | 0 | 1 |
|---|---|---|
| ALL | 250 | 4 |
| subtype1 | 30 | 0 |
| subtype2 | 58 | 1 |
| subtype3 | 39 | 1 |
| subtype4 | 86 | 2 |
| subtype5 | 37 | 0 |
Figure S65. Get High-res Image Clustering Approach #6: 'MIRSEQ CHIERARCHICAL' versus Clinical Feature #5: 'PATHOLOGY_N_STAGE'
P value = 0.308 (Fisher's exact test), Q value = 0.48
Table S72. Clustering Approach #6: 'MIRSEQ CHIERARCHICAL' versus Clinical Feature #6: 'PATHOLOGY_M_STAGE'
| nPatients | 0 | 1 |
|---|---|---|
| ALL | 264 | 4 |
| subtype1 | 26 | 1 |
| subtype2 | 65 | 0 |
| subtype3 | 42 | 0 |
| subtype4 | 92 | 3 |
| subtype5 | 39 | 0 |
Figure S66. Get High-res Image Clustering Approach #6: 'MIRSEQ CHIERARCHICAL' versus Clinical Feature #6: 'PATHOLOGY_M_STAGE'
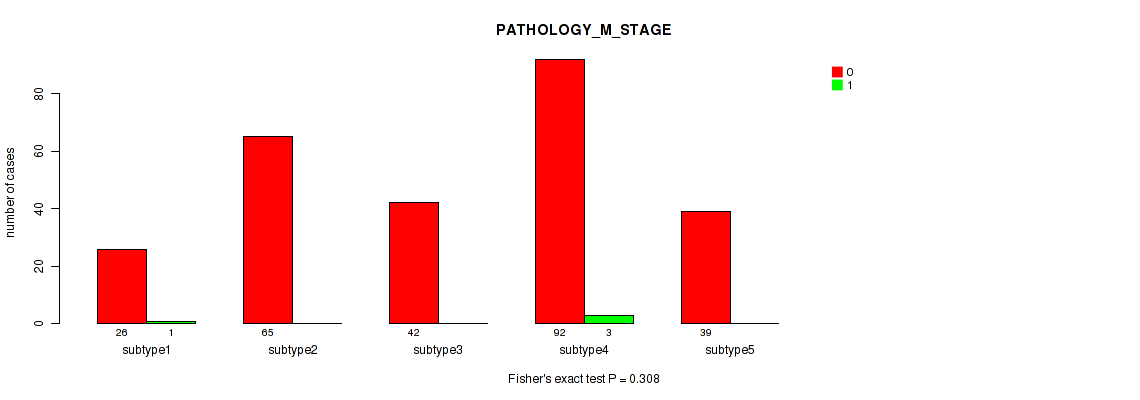
P value = 0.0162 (Fisher's exact test), Q value = 0.062
Table S73. Clustering Approach #6: 'MIRSEQ CHIERARCHICAL' versus Clinical Feature #7: 'GENDER'
| nPatients | FEMALE | MALE |
|---|---|---|
| ALL | 115 | 248 |
| subtype1 | 13 | 28 |
| subtype2 | 29 | 68 |
| subtype3 | 19 | 37 |
| subtype4 | 48 | 74 |
| subtype5 | 6 | 41 |
Figure S67. Get High-res Image Clustering Approach #6: 'MIRSEQ CHIERARCHICAL' versus Clinical Feature #7: 'GENDER'
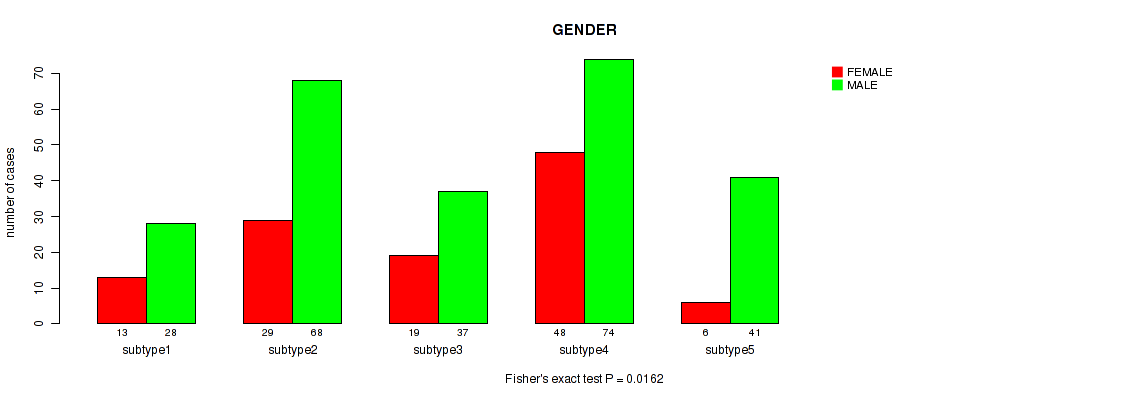
P value = 0.0521 (Fisher's exact test), Q value = 0.14
Table S74. Clustering Approach #6: 'MIRSEQ CHIERARCHICAL' versus Clinical Feature #8: 'RADIATION_THERAPY'
| nPatients | NO | YES |
|---|---|---|
| ALL | 337 | 7 |
| subtype1 | 39 | 0 |
| subtype2 | 93 | 0 |
| subtype3 | 51 | 0 |
| subtype4 | 111 | 4 |
| subtype5 | 43 | 3 |
Figure S68. Get High-res Image Clustering Approach #6: 'MIRSEQ CHIERARCHICAL' versus Clinical Feature #8: 'RADIATION_THERAPY'
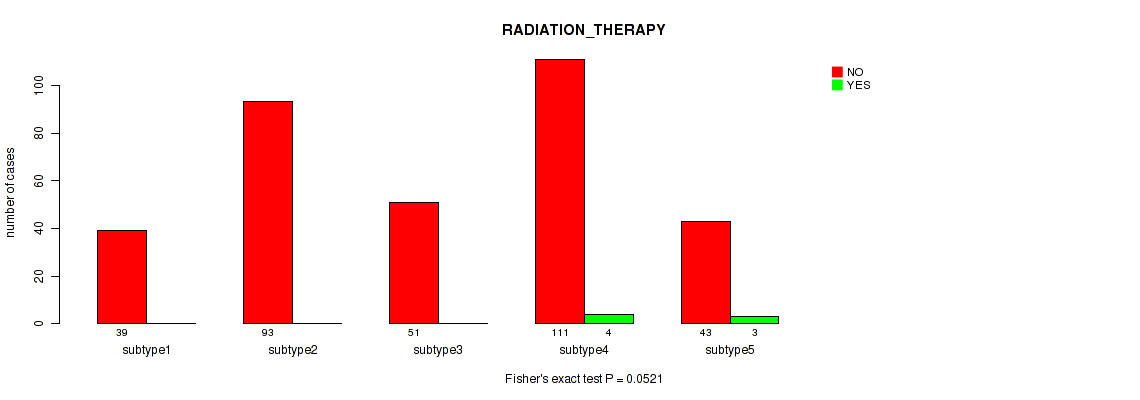
P value = 0.851 (Fisher's exact test), Q value = 0.93
Table S75. Clustering Approach #6: 'MIRSEQ CHIERARCHICAL' versus Clinical Feature #9: 'HISTOLOGICAL_TYPE'
| nPatients | FIBROLAMELLAR CARCINOMA | HEPATOCELLULAR CARCINOMA | HEPATOCHOLANGIOCARCINOMA (MIXED) |
|---|---|---|---|
| ALL | 2 | 354 | 7 |
| subtype1 | 0 | 41 | 0 |
| subtype2 | 0 | 95 | 2 |
| subtype3 | 0 | 55 | 1 |
| subtype4 | 2 | 116 | 4 |
| subtype5 | 0 | 47 | 0 |
Figure S69. Get High-res Image Clustering Approach #6: 'MIRSEQ CHIERARCHICAL' versus Clinical Feature #9: 'HISTOLOGICAL_TYPE'
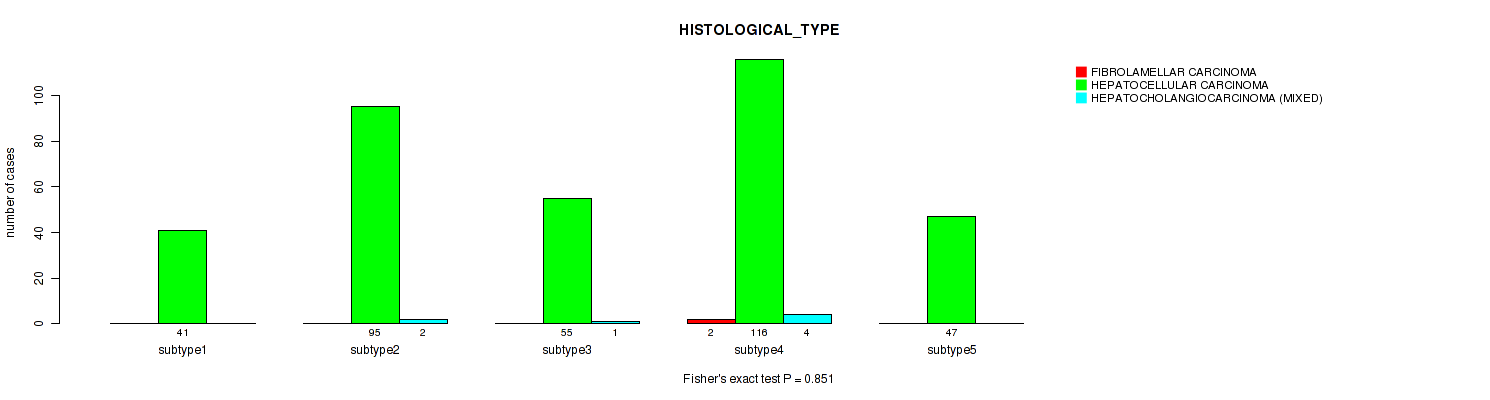
P value = 0.356 (Fisher's exact test), Q value = 0.54
Table S76. Clustering Approach #6: 'MIRSEQ CHIERARCHICAL' versus Clinical Feature #10: 'RESIDUAL_TUMOR'
| nPatients | R0 | R1 | R2 | RX |
|---|---|---|---|---|
| ALL | 318 | 15 | 1 | 22 |
| subtype1 | 32 | 3 | 0 | 3 |
| subtype2 | 83 | 5 | 0 | 6 |
| subtype3 | 50 | 1 | 0 | 5 |
| subtype4 | 107 | 6 | 1 | 8 |
| subtype5 | 46 | 0 | 0 | 0 |
Figure S70. Get High-res Image Clustering Approach #6: 'MIRSEQ CHIERARCHICAL' versus Clinical Feature #10: 'RESIDUAL_TUMOR'
P value = 0.138 (Fisher's exact test), Q value = 0.31
Table S77. Clustering Approach #6: 'MIRSEQ CHIERARCHICAL' versus Clinical Feature #11: 'RACE'
| nPatients | AMERICAN INDIAN OR ALASKA NATIVE | ASIAN | BLACK OR AFRICAN AMERICAN | WHITE |
|---|---|---|---|---|
| ALL | 1 | 160 | 17 | 175 |
| subtype1 | 0 | 17 | 5 | 19 |
| subtype2 | 0 | 34 | 5 | 52 |
| subtype3 | 0 | 32 | 2 | 21 |
| subtype4 | 0 | 56 | 4 | 59 |
| subtype5 | 1 | 21 | 1 | 24 |
Figure S71. Get High-res Image Clustering Approach #6: 'MIRSEQ CHIERARCHICAL' versus Clinical Feature #11: 'RACE'
P value = 0.63 (Fisher's exact test), Q value = 0.78
Table S78. Clustering Approach #6: 'MIRSEQ CHIERARCHICAL' versus Clinical Feature #12: 'ETHNICITY'
| nPatients | HISPANIC OR LATINO | NOT HISPANIC OR LATINO |
|---|---|---|
| ALL | 14 | 332 |
| subtype1 | 1 | 39 |
| subtype2 | 4 | 86 |
| subtype3 | 3 | 51 |
| subtype4 | 6 | 112 |
| subtype5 | 0 | 44 |
Figure S72. Get High-res Image Clustering Approach #6: 'MIRSEQ CHIERARCHICAL' versus Clinical Feature #12: 'ETHNICITY'
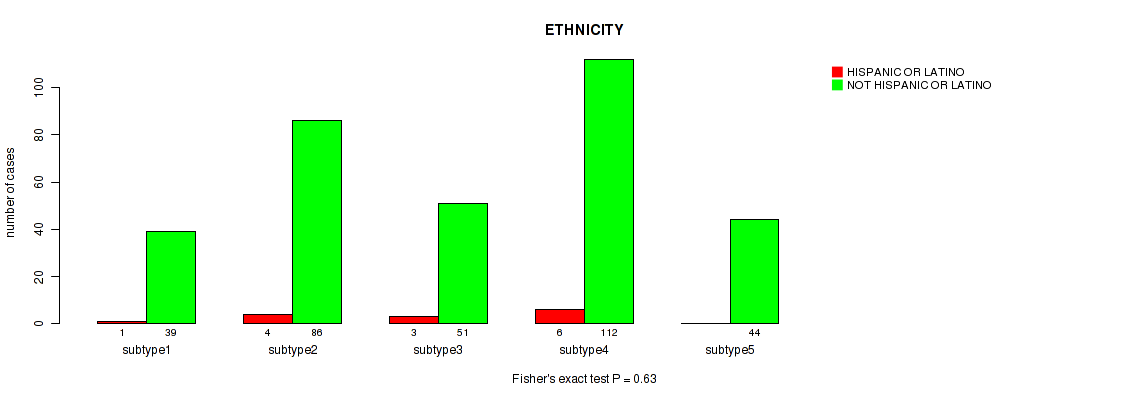
Table S79. Description of clustering approach #7: 'MIRseq Mature CNMF subtypes'
| Cluster Labels | 1 | 2 | 3 | 4 |
|---|---|---|---|---|
| Number of samples | 93 | 86 | 118 | 41 |
P value = 0.119 (logrank test), Q value = 0.28
Table S80. Clustering Approach #7: 'MIRseq Mature CNMF subtypes' versus Clinical Feature #1: 'Time to Death'
| nPatients | nDeath | Duration Range (Median), Month | |
|---|---|---|---|
| ALL | 334 | 120 | 0.0 - 120.8 (19.7) |
| subtype1 | 92 | 41 | 0.5 - 120.8 (17.9) |
| subtype2 | 85 | 30 | 0.2 - 107.1 (20.8) |
| subtype3 | 118 | 35 | 0.3 - 108.8 (21.1) |
| subtype4 | 39 | 14 | 0.0 - 90.3 (15.4) |
Figure S73. Get High-res Image Clustering Approach #7: 'MIRseq Mature CNMF subtypes' versus Clinical Feature #1: 'Time to Death'
P value = 0.00566 (Kruskal-Wallis (anova)), Q value = 0.033
Table S81. Clustering Approach #7: 'MIRseq Mature CNMF subtypes' versus Clinical Feature #2: 'YEARS_TO_BIRTH'
| nPatients | Mean (Std.Dev) | |
|---|---|---|
| ALL | 335 | 59.5 (12.7) |
| subtype1 | 93 | 57.8 (13.5) |
| subtype2 | 85 | 58.8 (12.3) |
| subtype3 | 117 | 62.9 (10.2) |
| subtype4 | 40 | 55.1 (15.7) |
Figure S74. Get High-res Image Clustering Approach #7: 'MIRseq Mature CNMF subtypes' versus Clinical Feature #2: 'YEARS_TO_BIRTH'
P value = 0.00032 (Fisher's exact test), Q value = 0.0034
Table S82. Clustering Approach #7: 'MIRseq Mature CNMF subtypes' versus Clinical Feature #3: 'PATHOLOGIC_STAGE'
| nPatients | STAGE I | STAGE II | STAGE III | STAGE IIIA | STAGE IIIB | STAGE IIIC | STAGE IV | STAGE IVA | STAGE IVB |
|---|---|---|---|---|---|---|---|---|---|
| ALL | 155 | 81 | 3 | 57 | 6 | 8 | 3 | 1 | 2 |
| subtype1 | 34 | 22 | 0 | 26 | 5 | 5 | 0 | 0 | 0 |
| subtype2 | 37 | 21 | 0 | 12 | 0 | 3 | 2 | 1 | 1 |
| subtype3 | 66 | 27 | 1 | 12 | 0 | 0 | 0 | 0 | 1 |
| subtype4 | 18 | 11 | 2 | 7 | 1 | 0 | 1 | 0 | 0 |
Figure S75. Get High-res Image Clustering Approach #7: 'MIRseq Mature CNMF subtypes' versus Clinical Feature #3: 'PATHOLOGIC_STAGE'
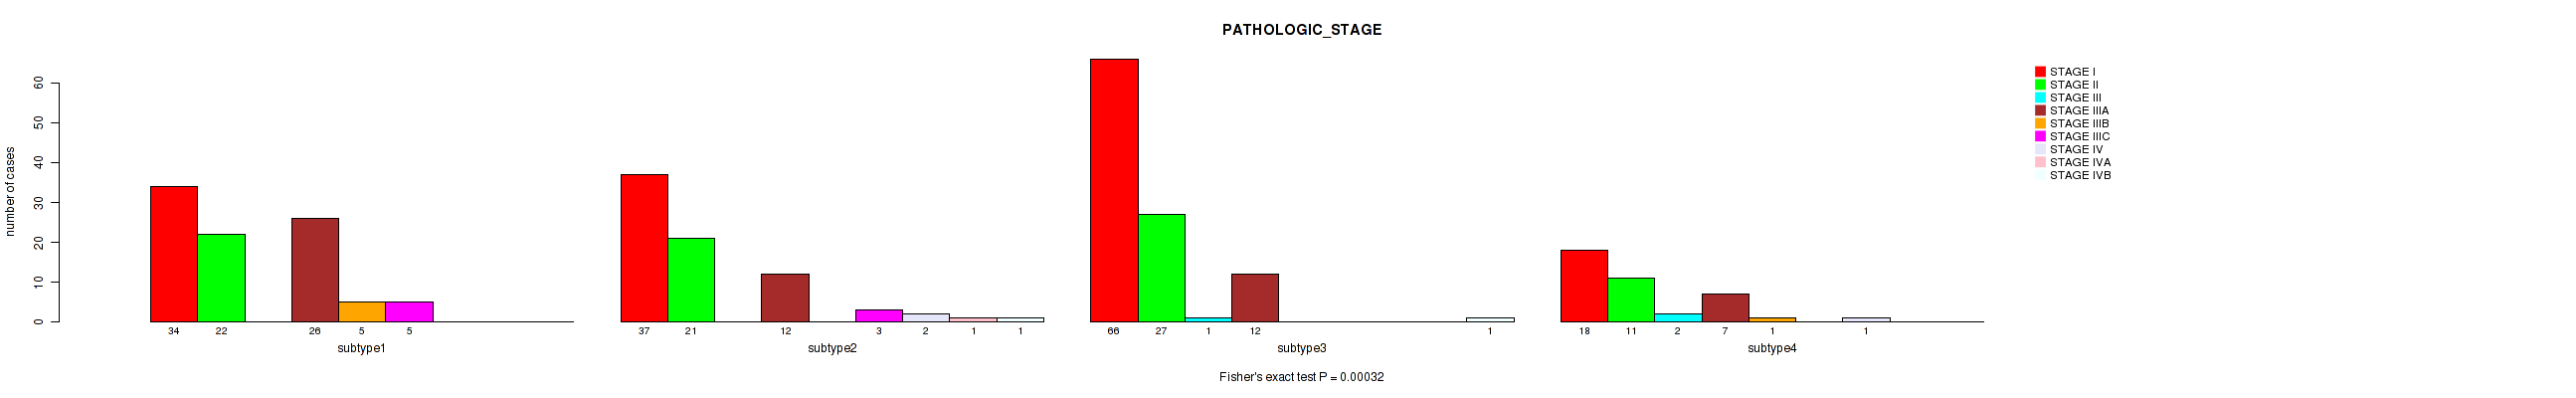
P value = 0.00901 (Fisher's exact test), Q value = 0.041
Table S83. Clustering Approach #7: 'MIRseq Mature CNMF subtypes' versus Clinical Feature #4: 'PATHOLOGY_T_STAGE'
| nPatients | T0+T1 | T2 | T3 | T4 |
|---|---|---|---|---|
| ALL | 166 | 88 | 70 | 12 |
| subtype1 | 35 | 23 | 30 | 5 |
| subtype2 | 42 | 24 | 15 | 5 |
| subtype3 | 70 | 30 | 14 | 2 |
| subtype4 | 19 | 11 | 11 | 0 |
Figure S76. Get High-res Image Clustering Approach #7: 'MIRseq Mature CNMF subtypes' versus Clinical Feature #4: 'PATHOLOGY_T_STAGE'
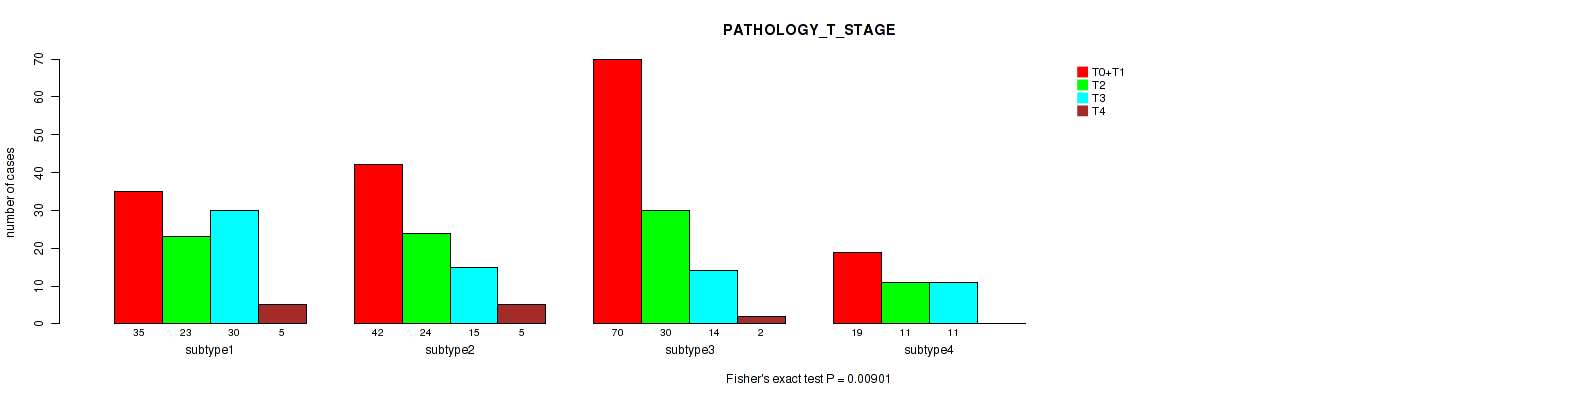
P value = 0.159 (Fisher's exact test), Q value = 0.33
Table S84. Clustering Approach #7: 'MIRseq Mature CNMF subtypes' versus Clinical Feature #5: 'PATHOLOGY_N_STAGE'
| nPatients | 0 | 1 |
|---|---|---|
| ALL | 234 | 4 |
| subtype1 | 65 | 3 |
| subtype2 | 54 | 1 |
| subtype3 | 83 | 0 |
| subtype4 | 32 | 0 |
Figure S77. Get High-res Image Clustering Approach #7: 'MIRseq Mature CNMF subtypes' versus Clinical Feature #5: 'PATHOLOGY_N_STAGE'

P value = 0.289 (Fisher's exact test), Q value = 0.46
Table S85. Clustering Approach #7: 'MIRseq Mature CNMF subtypes' versus Clinical Feature #6: 'PATHOLOGY_M_STAGE'
| nPatients | 0 | 1 |
|---|---|---|
| ALL | 250 | 4 |
| subtype1 | 73 | 0 |
| subtype2 | 52 | 2 |
| subtype3 | 89 | 1 |
| subtype4 | 36 | 1 |
Figure S78. Get High-res Image Clustering Approach #7: 'MIRseq Mature CNMF subtypes' versus Clinical Feature #6: 'PATHOLOGY_M_STAGE'
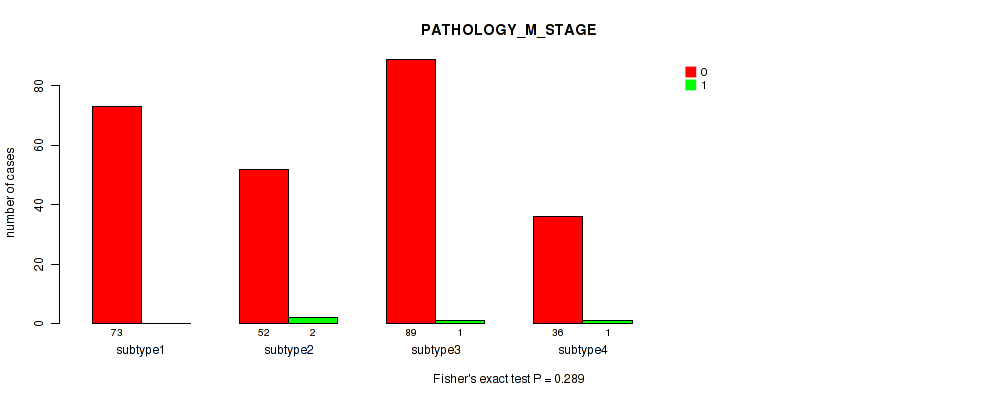
P value = 0.0144 (Fisher's exact test), Q value = 0.06
Table S86. Clustering Approach #7: 'MIRseq Mature CNMF subtypes' versus Clinical Feature #7: 'GENDER'
| nPatients | FEMALE | MALE |
|---|---|---|
| ALL | 112 | 226 |
| subtype1 | 40 | 53 |
| subtype2 | 29 | 57 |
| subtype3 | 27 | 91 |
| subtype4 | 16 | 25 |
Figure S79. Get High-res Image Clustering Approach #7: 'MIRseq Mature CNMF subtypes' versus Clinical Feature #7: 'GENDER'
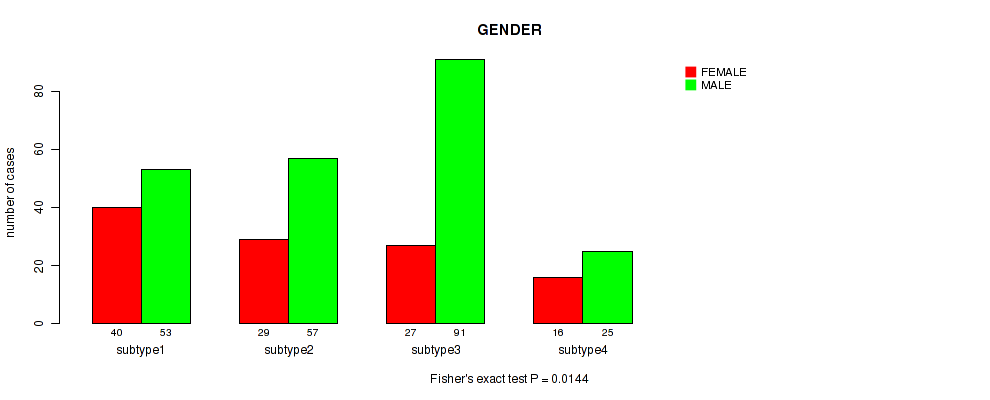
P value = 0.757 (Fisher's exact test), Q value = 0.88
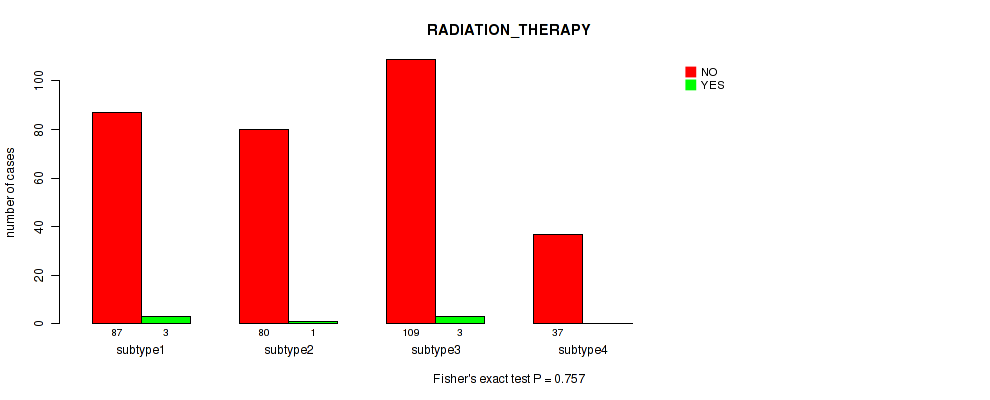
Table S87. Clustering Approach #7: 'MIRseq Mature CNMF subtypes' versus Clinical Feature #8: 'RADIATION_THERAPY'
| nPatients | NO | YES |
|---|---|---|
| ALL | 313 | 7 |
| subtype1 | 87 | 3 |
| subtype2 | 80 | 1 |
| subtype3 | 109 | 3 |
| subtype4 | 37 | 0 |
Figure S80. Get High-res Image Clustering Approach #7: 'MIRseq Mature CNMF subtypes' versus Clinical Feature #8: 'RADIATION_THERAPY'
P value = 0.123 (Fisher's exact test), Q value = 0.28
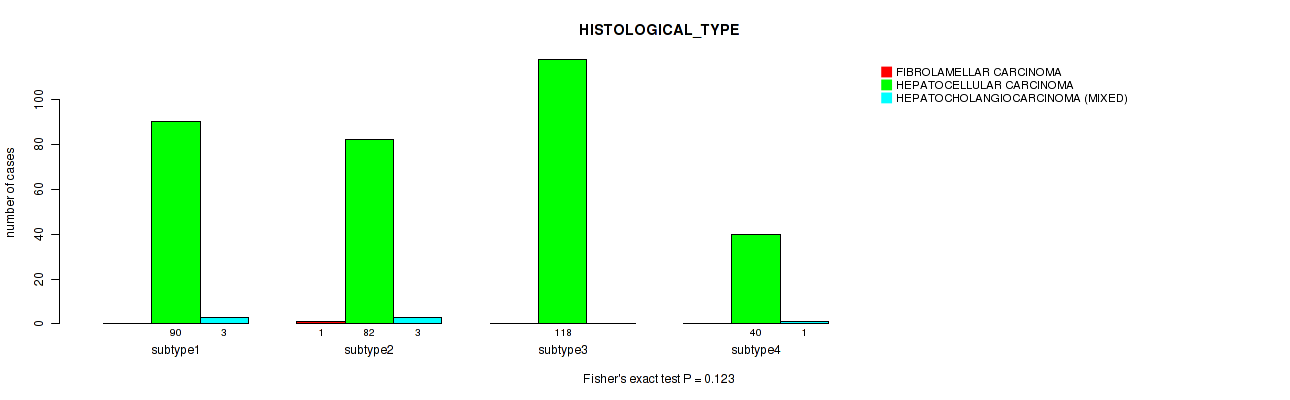
Table S88. Clustering Approach #7: 'MIRseq Mature CNMF subtypes' versus Clinical Feature #9: 'HISTOLOGICAL_TYPE'
| nPatients | FIBROLAMELLAR CARCINOMA | HEPATOCELLULAR CARCINOMA | HEPATOCHOLANGIOCARCINOMA (MIXED) |
|---|---|---|---|
| ALL | 1 | 330 | 7 |
| subtype1 | 0 | 90 | 3 |
| subtype2 | 1 | 82 | 3 |
| subtype3 | 0 | 118 | 0 |
| subtype4 | 0 | 40 | 1 |
Figure S81. Get High-res Image Clustering Approach #7: 'MIRseq Mature CNMF subtypes' versus Clinical Feature #9: 'HISTOLOGICAL_TYPE'
P value = 0.182 (Fisher's exact test), Q value = 0.36
Table S89. Clustering Approach #7: 'MIRseq Mature CNMF subtypes' versus Clinical Feature #10: 'RESIDUAL_TUMOR'
| nPatients | R0 | R1 | R2 | RX |
|---|---|---|---|---|
| ALL | 297 | 15 | 1 | 19 |
| subtype1 | 79 | 5 | 0 | 6 |
| subtype2 | 71 | 7 | 1 | 5 |
| subtype3 | 111 | 2 | 0 | 4 |
| subtype4 | 36 | 1 | 0 | 4 |
Figure S82. Get High-res Image Clustering Approach #7: 'MIRseq Mature CNMF subtypes' versus Clinical Feature #10: 'RESIDUAL_TUMOR'
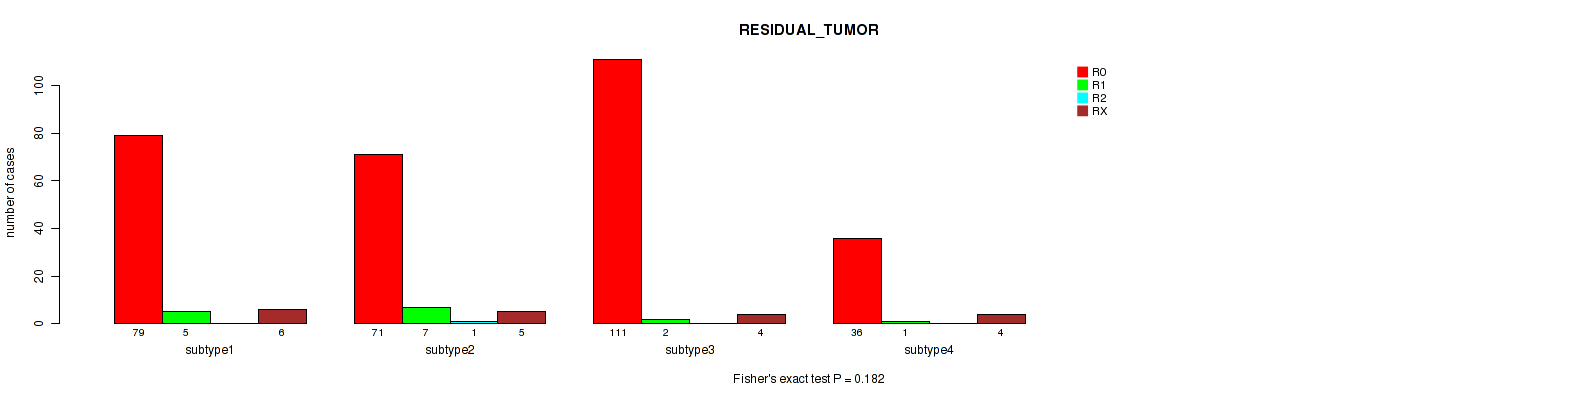
P value = 0.817 (Fisher's exact test), Q value = 0.93
Table S90. Clustering Approach #7: 'MIRseq Mature CNMF subtypes' versus Clinical Feature #11: 'RACE'
| nPatients | AMERICAN INDIAN OR ALASKA NATIVE | ASIAN | BLACK OR AFRICAN AMERICAN | WHITE |
|---|---|---|---|---|
| ALL | 1 | 154 | 16 | 157 |
| subtype1 | 0 | 45 | 4 | 43 |
| subtype2 | 0 | 35 | 4 | 43 |
| subtype3 | 1 | 50 | 7 | 55 |
| subtype4 | 0 | 24 | 1 | 16 |
Figure S83. Get High-res Image Clustering Approach #7: 'MIRseq Mature CNMF subtypes' versus Clinical Feature #11: 'RACE'
P value = 0.54 (Fisher's exact test), Q value = 0.72
Table S91. Clustering Approach #7: 'MIRseq Mature CNMF subtypes' versus Clinical Feature #12: 'ETHNICITY'
| nPatients | HISPANIC OR LATINO | NOT HISPANIC OR LATINO |
|---|---|---|
| ALL | 13 | 309 |
| subtype1 | 6 | 82 |
| subtype2 | 3 | 80 |
| subtype3 | 3 | 107 |
| subtype4 | 1 | 40 |
Figure S84. Get High-res Image Clustering Approach #7: 'MIRseq Mature CNMF subtypes' versus Clinical Feature #12: 'ETHNICITY'
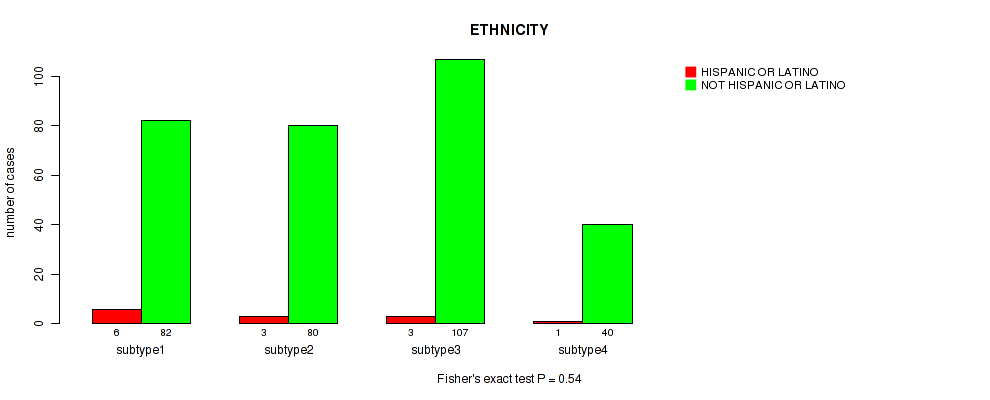
Table S92. Description of clustering approach #8: 'MIRseq Mature cHierClus subtypes'
| Cluster Labels | 1 | 2 | 3 | 4 | 5 |
|---|---|---|---|---|---|
| Number of samples | 66 | 87 | 99 | 34 | 52 |
P value = 0.035 (logrank test), Q value = 0.1
Table S93. Clustering Approach #8: 'MIRseq Mature cHierClus subtypes' versus Clinical Feature #1: 'Time to Death'
| nPatients | nDeath | Duration Range (Median), Month | |
|---|---|---|---|
| ALL | 334 | 120 | 0.0 - 120.8 (19.7) |
| subtype1 | 64 | 31 | 0.7 - 107.1 (17.9) |
| subtype2 | 87 | 32 | 0.3 - 113.0 (21.8) |
| subtype3 | 98 | 32 | 0.2 - 114.3 (20.8) |
| subtype4 | 33 | 15 | 0.0 - 120.8 (13.7) |
| subtype5 | 52 | 10 | 0.3 - 79.4 (19.4) |
Figure S85. Get High-res Image Clustering Approach #8: 'MIRseq Mature cHierClus subtypes' versus Clinical Feature #1: 'Time to Death'
P value = 1.91e-05 (Kruskal-Wallis (anova)), Q value = 0.00048
Table S94. Clustering Approach #8: 'MIRseq Mature cHierClus subtypes' versus Clinical Feature #2: 'YEARS_TO_BIRTH'
| nPatients | Mean (Std.Dev) | |
|---|---|---|
| ALL | 335 | 59.5 (12.7) |
| subtype1 | 66 | 54.9 (12.7) |
| subtype2 | 85 | 63.1 (11.5) |
| subtype3 | 98 | 56.6 (14.0) |
| subtype4 | 34 | 63.2 (10.9) |
| subtype5 | 52 | 62.7 (9.6) |
Figure S86. Get High-res Image Clustering Approach #8: 'MIRseq Mature cHierClus subtypes' versus Clinical Feature #2: 'YEARS_TO_BIRTH'
P value = 0.0744 (Fisher's exact test), Q value = 0.19
Table S95. Clustering Approach #8: 'MIRseq Mature cHierClus subtypes' versus Clinical Feature #3: 'PATHOLOGIC_STAGE'
| nPatients | STAGE I | STAGE II | STAGE III | STAGE IIIA | STAGE IIIB | STAGE IIIC | STAGE IV | STAGE IVA | STAGE IVB |
|---|---|---|---|---|---|---|---|---|---|
| ALL | 155 | 81 | 3 | 57 | 6 | 8 | 3 | 1 | 2 |
| subtype1 | 25 | 15 | 0 | 20 | 1 | 1 | 0 | 0 | 0 |
| subtype2 | 38 | 20 | 1 | 11 | 4 | 1 | 1 | 1 | 0 |
| subtype3 | 46 | 25 | 2 | 12 | 0 | 5 | 2 | 0 | 1 |
| subtype4 | 19 | 4 | 0 | 8 | 1 | 1 | 0 | 0 | 1 |
| subtype5 | 27 | 17 | 0 | 6 | 0 | 0 | 0 | 0 | 0 |
Figure S87. Get High-res Image Clustering Approach #8: 'MIRseq Mature cHierClus subtypes' versus Clinical Feature #3: 'PATHOLOGIC_STAGE'
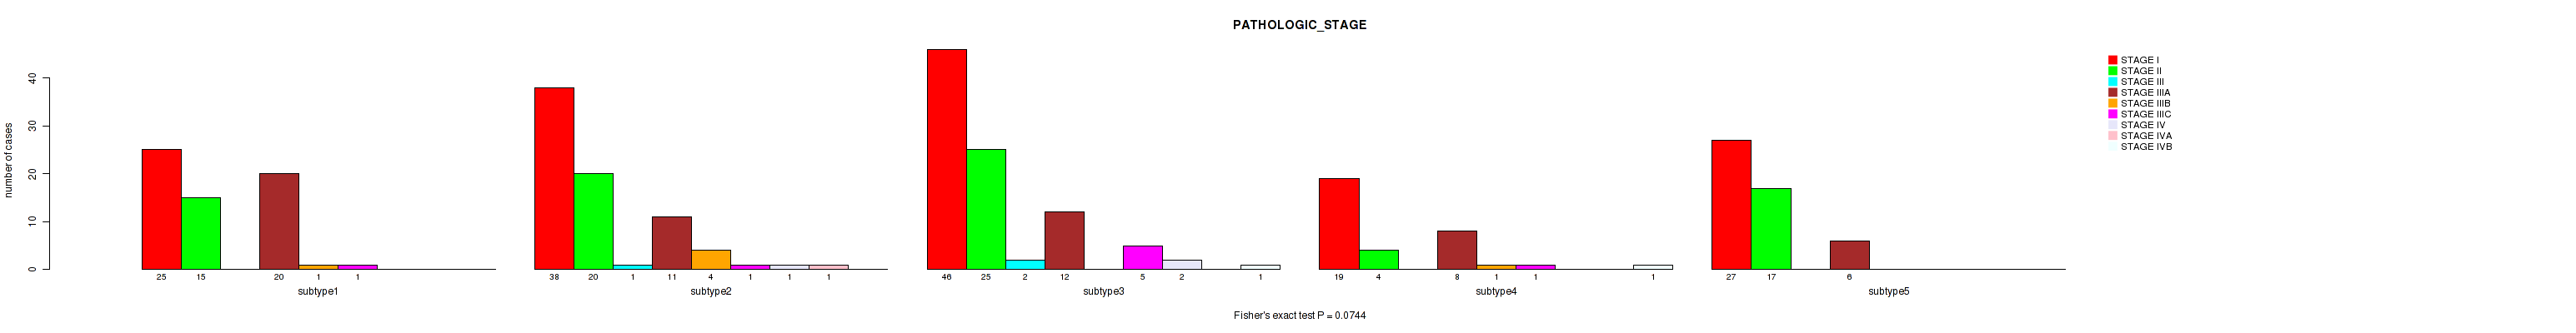
P value = 0.0953 (Fisher's exact test), Q value = 0.23
Table S96. Clustering Approach #8: 'MIRseq Mature cHierClus subtypes' versus Clinical Feature #4: 'PATHOLOGY_T_STAGE'
| nPatients | T0+T1 | T2 | T3 | T4 |
|---|---|---|---|---|
| ALL | 166 | 88 | 70 | 12 |
| subtype1 | 27 | 16 | 22 | 1 |
| subtype2 | 43 | 23 | 16 | 5 |
| subtype3 | 49 | 28 | 17 | 4 |
| subtype4 | 19 | 4 | 9 | 2 |
| subtype5 | 28 | 17 | 6 | 0 |
Figure S88. Get High-res Image Clustering Approach #8: 'MIRseq Mature cHierClus subtypes' versus Clinical Feature #4: 'PATHOLOGY_T_STAGE'
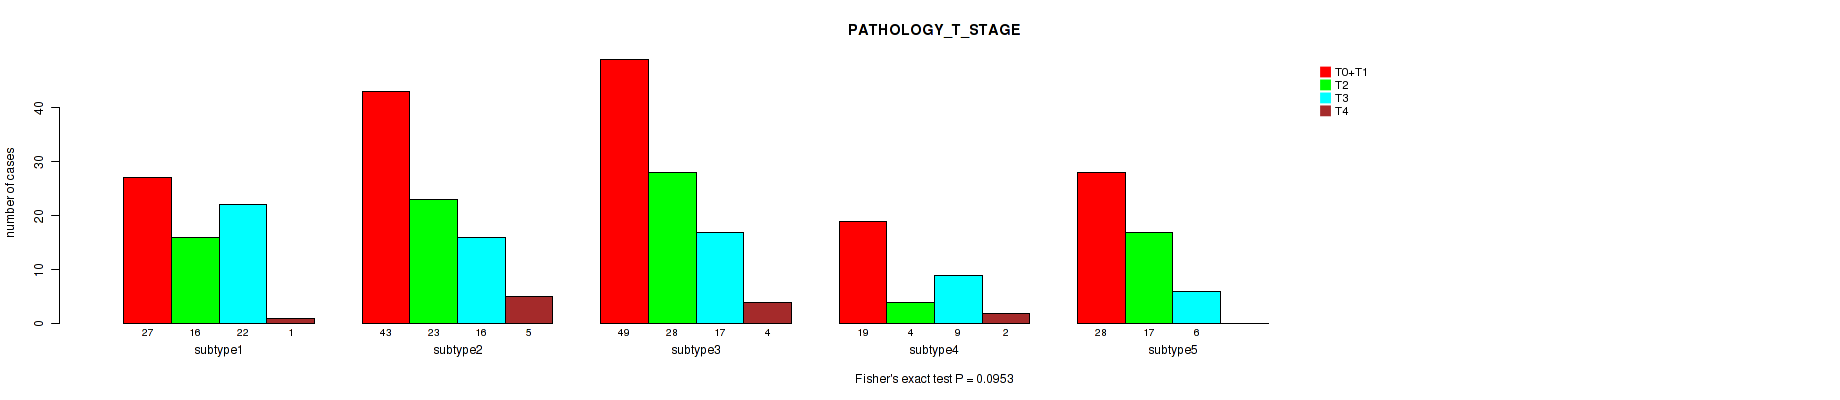
P value = 0.944 (Fisher's exact test), Q value = 0.99
Table S97. Clustering Approach #8: 'MIRseq Mature cHierClus subtypes' versus Clinical Feature #5: 'PATHOLOGY_N_STAGE'
| nPatients | 0 | 1 |
|---|---|---|
| ALL | 234 | 4 |
| subtype1 | 47 | 1 |
| subtype2 | 51 | 1 |
| subtype3 | 69 | 2 |
| subtype4 | 26 | 0 |
| subtype5 | 41 | 0 |
Figure S89. Get High-res Image Clustering Approach #8: 'MIRseq Mature cHierClus subtypes' versus Clinical Feature #5: 'PATHOLOGY_N_STAGE'
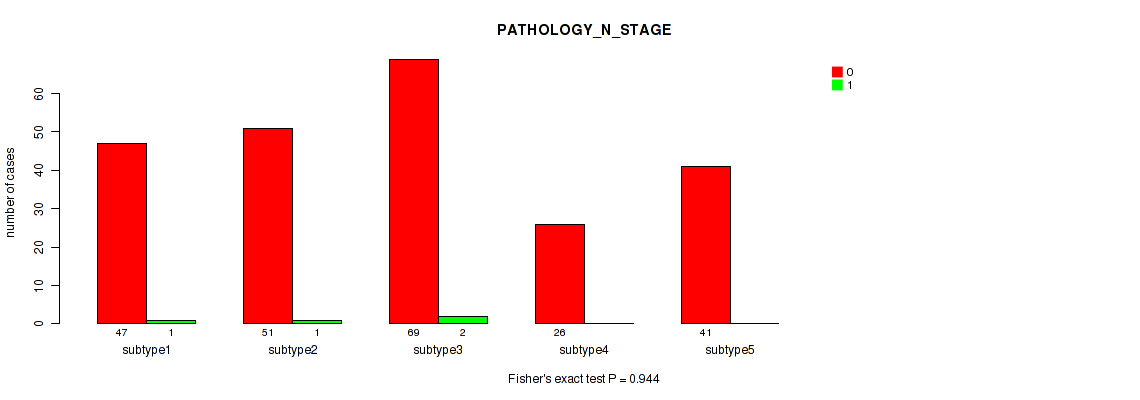
P value = 0.15 (Fisher's exact test), Q value = 0.32
Table S98. Clustering Approach #8: 'MIRseq Mature cHierClus subtypes' versus Clinical Feature #6: 'PATHOLOGY_M_STAGE'
| nPatients | 0 | 1 |
|---|---|---|
| ALL | 250 | 4 |
| subtype1 | 51 | 0 |
| subtype2 | 59 | 0 |
| subtype3 | 73 | 3 |
| subtype4 | 22 | 1 |
| subtype5 | 45 | 0 |
Figure S90. Get High-res Image Clustering Approach #8: 'MIRseq Mature cHierClus subtypes' versus Clinical Feature #6: 'PATHOLOGY_M_STAGE'
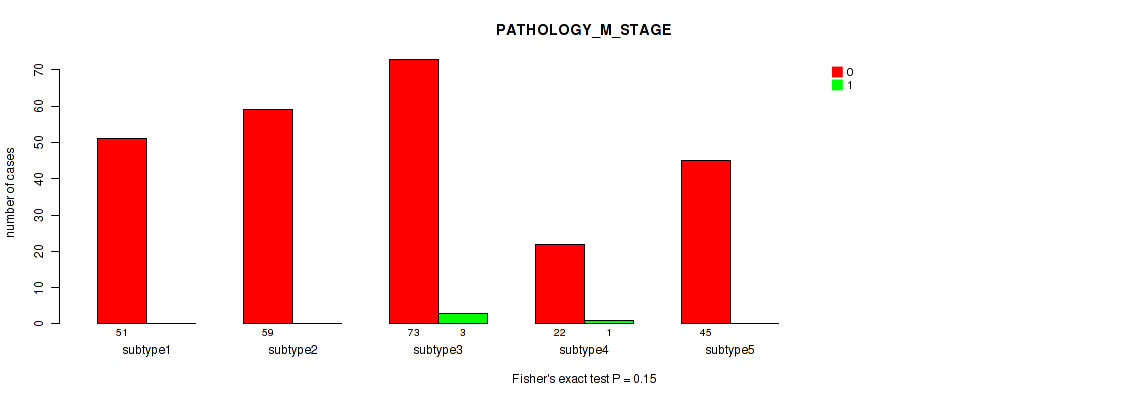
P value = 0.0395 (Fisher's exact test), Q value = 0.11
Table S99. Clustering Approach #8: 'MIRseq Mature cHierClus subtypes' versus Clinical Feature #7: 'GENDER'
| nPatients | FEMALE | MALE |
|---|---|---|
| ALL | 112 | 226 |
| subtype1 | 24 | 42 |
| subtype2 | 26 | 61 |
| subtype3 | 41 | 58 |
| subtype4 | 12 | 22 |
| subtype5 | 9 | 43 |
Figure S91. Get High-res Image Clustering Approach #8: 'MIRseq Mature cHierClus subtypes' versus Clinical Feature #7: 'GENDER'
P value = 0.0521 (Fisher's exact test), Q value = 0.14
Table S100. Clustering Approach #8: 'MIRseq Mature cHierClus subtypes' versus Clinical Feature #8: 'RADIATION_THERAPY'
| nPatients | NO | YES |
|---|---|---|
| ALL | 313 | 7 |
| subtype1 | 59 | 3 |
| subtype2 | 83 | 0 |
| subtype3 | 92 | 1 |
| subtype4 | 32 | 0 |
| subtype5 | 47 | 3 |
Figure S92. Get High-res Image Clustering Approach #8: 'MIRseq Mature cHierClus subtypes' versus Clinical Feature #8: 'RADIATION_THERAPY'
P value = 0.628 (Fisher's exact test), Q value = 0.78
Table S101. Clustering Approach #8: 'MIRseq Mature cHierClus subtypes' versus Clinical Feature #9: 'HISTOLOGICAL_TYPE'
| nPatients | FIBROLAMELLAR CARCINOMA | HEPATOCELLULAR CARCINOMA | HEPATOCHOLANGIOCARCINOMA (MIXED) |
|---|---|---|---|
| ALL | 1 | 330 | 7 |
| subtype1 | 0 | 64 | 2 |
| subtype2 | 0 | 86 | 1 |
| subtype3 | 1 | 94 | 4 |
| subtype4 | 0 | 34 | 0 |
| subtype5 | 0 | 52 | 0 |
Figure S93. Get High-res Image Clustering Approach #8: 'MIRseq Mature cHierClus subtypes' versus Clinical Feature #9: 'HISTOLOGICAL_TYPE'
P value = 0.194 (Fisher's exact test), Q value = 0.37
Table S102. Clustering Approach #8: 'MIRseq Mature cHierClus subtypes' versus Clinical Feature #10: 'RESIDUAL_TUMOR'
| nPatients | R0 | R1 | R2 | RX |
|---|---|---|---|---|
| ALL | 297 | 15 | 1 | 19 |
| subtype1 | 59 | 4 | 0 | 3 |
| subtype2 | 75 | 3 | 0 | 7 |
| subtype3 | 85 | 5 | 1 | 8 |
| subtype4 | 27 | 3 | 0 | 1 |
| subtype5 | 51 | 0 | 0 | 0 |
Figure S94. Get High-res Image Clustering Approach #8: 'MIRseq Mature cHierClus subtypes' versus Clinical Feature #10: 'RESIDUAL_TUMOR'
P value = 0.0112 (Fisher's exact test), Q value = 0.049
Table S103. Clustering Approach #8: 'MIRseq Mature cHierClus subtypes' versus Clinical Feature #11: 'RACE'
| nPatients | AMERICAN INDIAN OR ALASKA NATIVE | ASIAN | BLACK OR AFRICAN AMERICAN | WHITE |
|---|---|---|---|---|
| ALL | 1 | 154 | 16 | 157 |
| subtype1 | 0 | 42 | 1 | 23 |
| subtype2 | 0 | 27 | 7 | 47 |
| subtype3 | 0 | 45 | 4 | 47 |
| subtype4 | 0 | 13 | 3 | 18 |
| subtype5 | 1 | 27 | 1 | 22 |
Figure S95. Get High-res Image Clustering Approach #8: 'MIRseq Mature cHierClus subtypes' versus Clinical Feature #11: 'RACE'
P value = 0.545 (Fisher's exact test), Q value = 0.72
Table S104. Clustering Approach #8: 'MIRseq Mature cHierClus subtypes' versus Clinical Feature #12: 'ETHNICITY'
| nPatients | HISPANIC OR LATINO | NOT HISPANIC OR LATINO |
|---|---|---|
| ALL | 13 | 309 |
| subtype1 | 5 | 60 |
| subtype2 | 3 | 77 |
| subtype3 | 2 | 93 |
| subtype4 | 1 | 32 |
| subtype5 | 2 | 47 |
Figure S96. Get High-res Image Clustering Approach #8: 'MIRseq Mature cHierClus subtypes' versus Clinical Feature #12: 'ETHNICITY'
-
Cluster data file = /xchip/cga/gdac-prod/tcga-gdac/jobResults/GDAC_mergedClustering/LIHC-TP/20139336/LIHC-TP.mergedcluster.txt
-
Clinical data file = /xchip/cga/gdac-prod/tcga-gdac/jobResults/Append_Data/LIHC-TP/19775332/LIHC-TP.merged_data.txt
-
Number of patients = 368
-
Number of clustering approaches = 8
-
Number of selected clinical features = 12
-
Exclude small clusters that include fewer than K patients, K = 3
consensus non-negative matrix factorization clustering approach (Brunet et al. 2004)
Resampling-based clustering method (Monti et al. 2003)
For survival clinical features, the Kaplan-Meier survival curves of tumors with and without gene mutations were plotted and the statistical significance P values were estimated by logrank test (Bland and Altman 2004) using the 'survdiff' function in R
For binary clinical features, two-tailed Fisher's exact tests (Fisher 1922) were used to estimate the P values using the 'fisher.test' function in R
For multiple hypothesis correction, Q value is the False Discovery Rate (FDR) analogue of the P value (Benjamini and Hochberg 1995), defined as the minimum FDR at which the test may be called significant. We used the 'Benjamini and Hochberg' method of 'p.adjust' function in R to convert P values into Q values.
In addition to the links below, the full results of the analysis summarized in this report can also be downloaded programmatically using firehose_get, or interactively from either the Broad GDAC website or TCGA Data Coordination Center Portal.