This report serves to describe the mutational landscape and properties of a given individual set, as well as rank genes and genesets according to mutational significance. MutSig v2.0 was used to generate the results found in this report.
-
Working with individual set: PRAD-TP
-
Number of patients in set: 332
The input for this pipeline is a set of individuals with the following files associated for each:
-
An annotated .maf file describing the mutations called for the respective individual, and their properties.
-
A .wig file that contains information about the coverage of the sample.
-
MAF used for this analysis:PRAD-TP.final_analysis_set.maf
-
Blacklist used for this analysis: pancan_mutation_blacklist.v14.hg19.txt
-
Significantly mutated genes (q ≤ 0.1): 22
-
Mutations seen in COSMIC: 78
-
Significantly mutated genes in COSMIC territory: 8
-
Significantly mutated genesets: 29
-
Significantly mutated genesets: (excluding sig. mutated genes):0
-
Read 332 MAFs of type "maf1"
-
Total number of mutations in input MAFs: 12302
-
After removing 26 mutations outside chr1-24: 12276
-
After removing 14 blacklisted mutations: 12262
-
After removing 427 noncoding mutations: 11835
-
Number of mutations before filtering: 11835
-
After removing 608 mutations outside gene set: 11227
-
After removing 4 mutations outside category set: 11223
Table 1. Get Full Table Table representing breakdown of mutations by type.
| type | count |
|---|---|
| De_novo_Start_InFrame | 9 |
| De_novo_Start_OutOfFrame | 11 |
| Frame_Shift_Del | 297 |
| Frame_Shift_Ins | 96 |
| In_Frame_Del | 57 |
| In_Frame_Ins | 5 |
| Missense_Mutation | 7287 |
| Nonsense_Mutation | 391 |
| Nonstop_Mutation | 7 |
| Silent | 2580 |
| Splice_Site | 466 |
| Start_Codon_SNP | 17 |
| Total | 11223 |
Table 2. Get Full Table A breakdown of mutation rates per category discovered for this individual set.
| category | n | N | rate | rate_per_mb | relative_rate | exp_ns_s_ratio |
|---|---|---|---|---|---|---|
| Cp*C->A | 1900 | 1395886984 | 1.4e-06 | 1.4 | 1.5 | 2.4 |
| C->(T/G) | 2404 | 4934634181 | 4.9e-07 | 0.49 | 0.55 | 2.8 |
| (A/G/T)p*C->A | 875 | 3538747197 | 2.5e-07 | 0.25 | 0.28 | 6 |
| A->mut | 2125 | 4759038903 | 4.5e-07 | 0.45 | 0.5 | 3.9 |
| indel+null | 1335 | 9693673084 | 1.4e-07 | 0.14 | 0.15 | NaN |
| double_null | 4 | 9693673084 | 4.1e-10 | 0.00041 | 0.00046 | NaN |
| Total | 8643 | 9693673084 | 8.9e-07 | 0.89 | 1 | 3.5 |
The x axis represents the samples. The y axis represents the exons, one row per exon, and they are sorted by average coverage across samples. For exons with exactly the same average coverage, they are sorted next by the %GC of the exon. (The secondary sort is especially useful for the zero-coverage exons at the bottom). If the figure is unpopulated, then full coverage is assumed (e.g. MutSig CV doesn't use WIGs and assumes full coverage).
Figure 1.
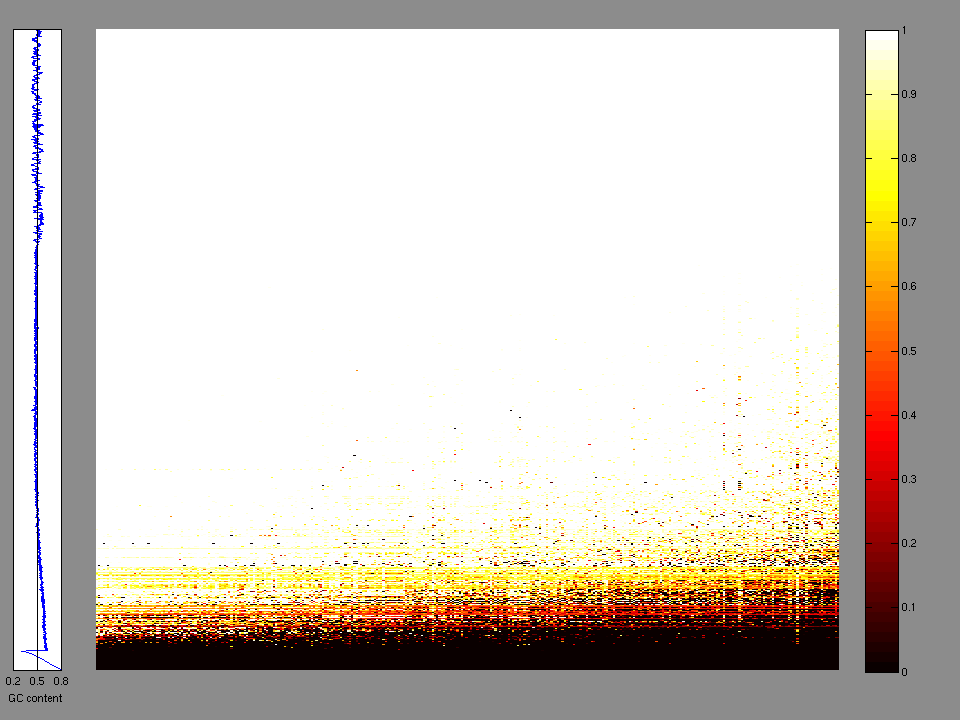
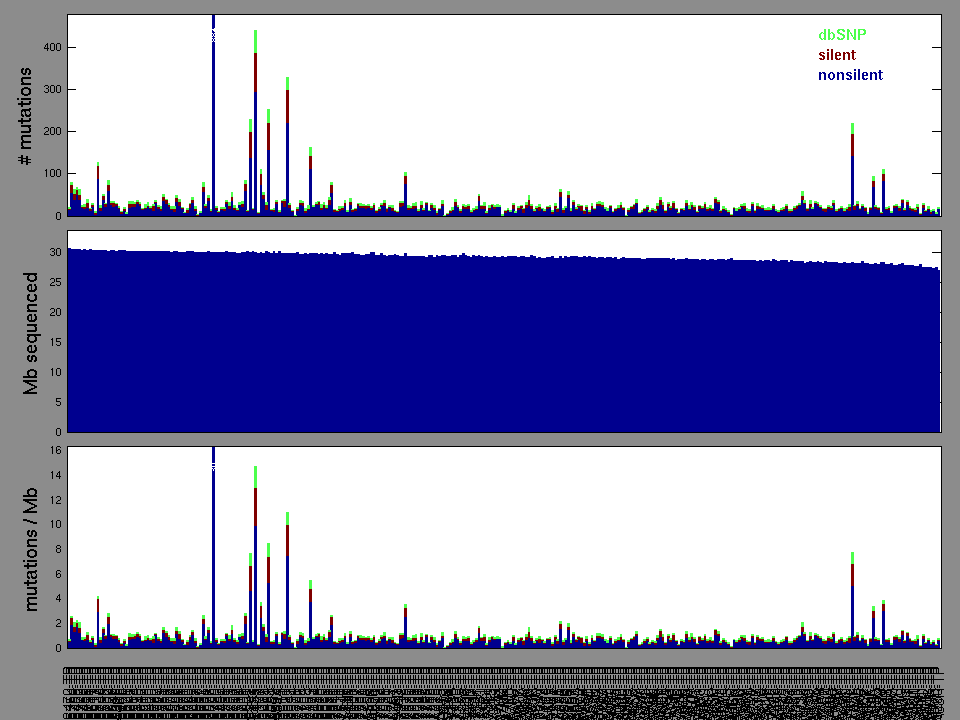
Figure 2. Patients counts and rates file used to generate this plot: PRAD-TP.patients.counts_and_rates.txt
The mutation spectrum is depicted in the lego plots below in which the 96 possible mutation types are subdivided into six large blocks, color-coded to reflect the base substitution type. Each large block is further subdivided into the 16 possible pairs of 5' and 3' neighbors, as listed in the 4x4 trinucleotide context legend. The height of each block corresponds to the mutation frequency for that kind of mutation (counts of mutations normalized by the base coverage in a given bin). The shape of the spectrum is a signature for dominant mutational mechanisms in different tumor types.
Figure 3. Get High-res Image SNV Mutation rate lego plot for entire set. Each bin is normalized by base coverage for that bin. Colors represent the six SNV types on the upper right. The three-base context for each mutation is labeled in the 4x4 legend on the lower right. The fractional breakdown of SNV counts is shown in the pie chart on the upper left. If this figure is blank, not enough information was provided in the MAF to generate it.
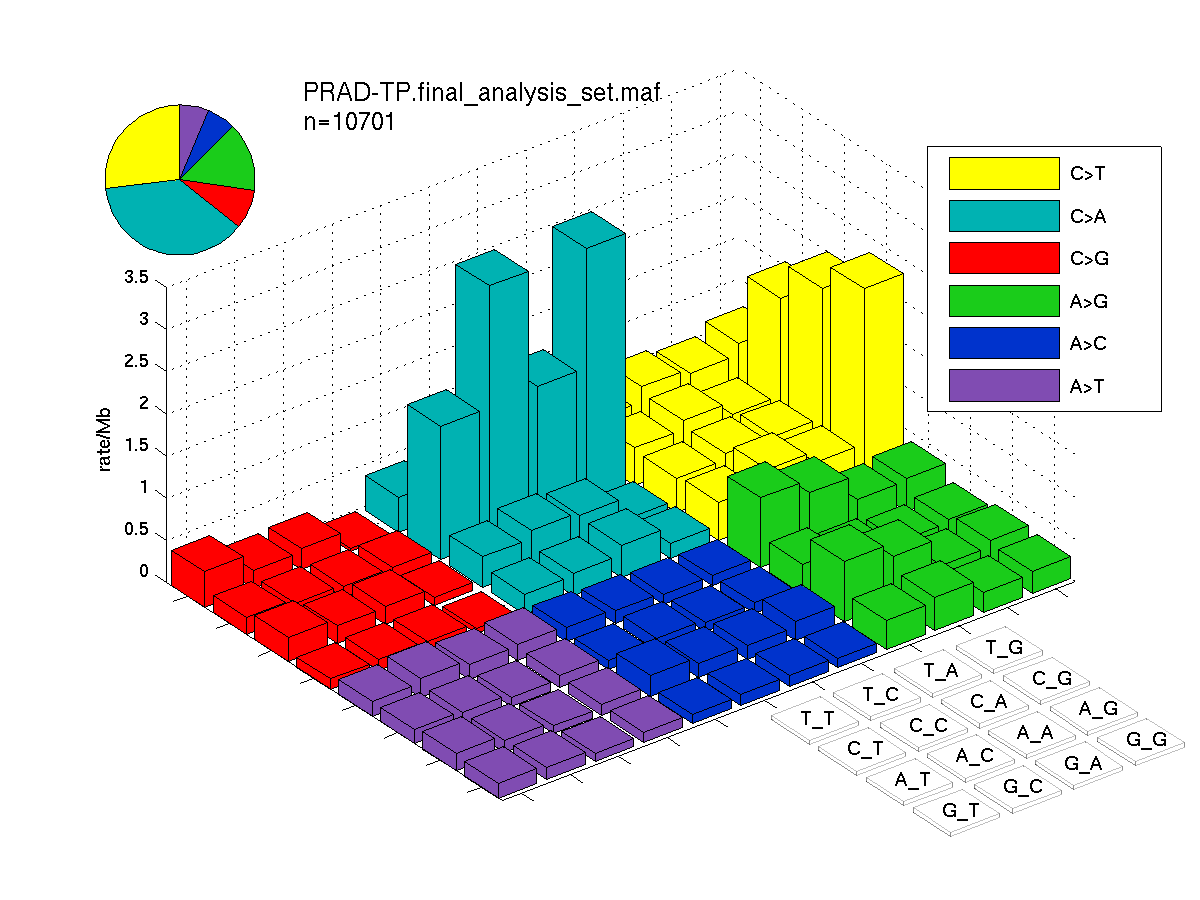
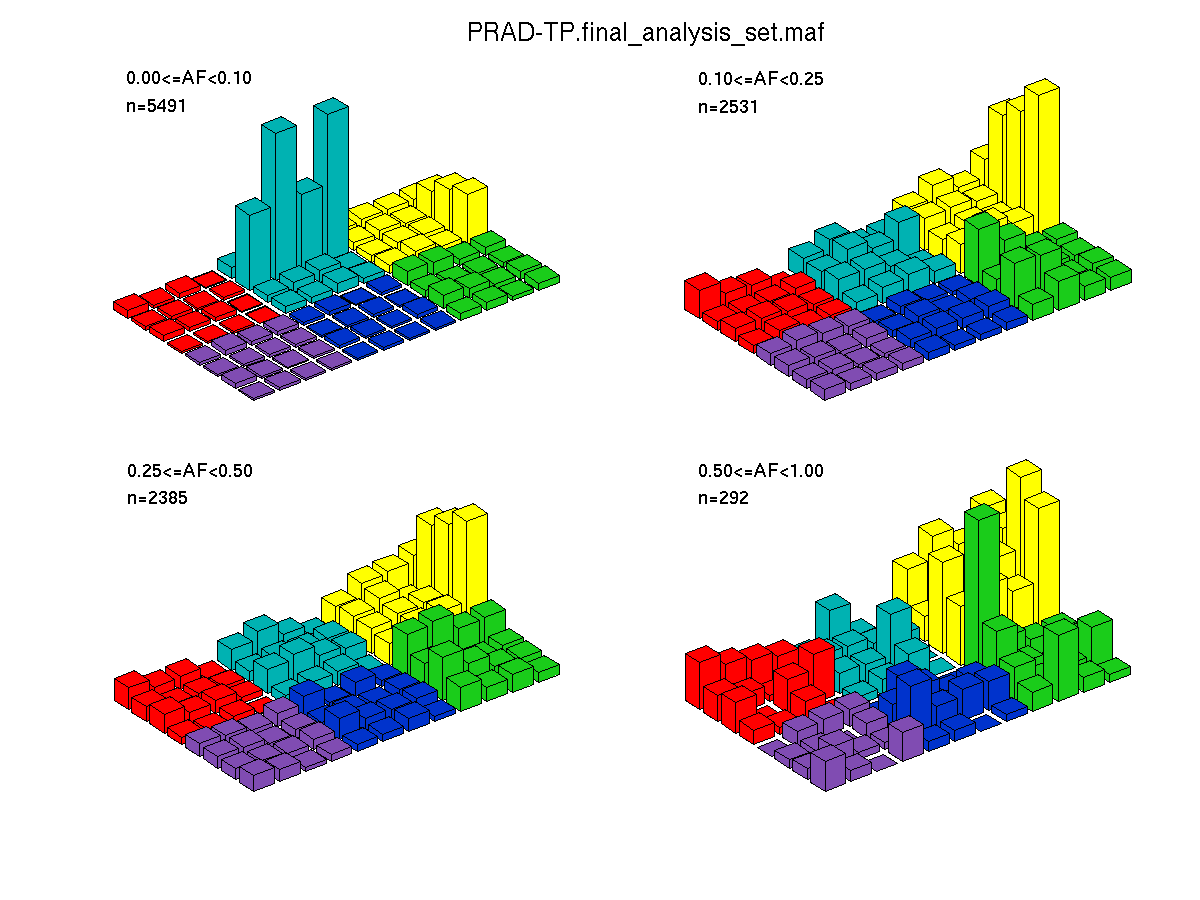
Figure 4. Get High-res Image SNV Mutation rate lego plots for 4 slices of mutation allele fraction (0<=AF<0.1, 0.1<=AF<0.25, 0.25<=AF<0.5, & 0.5<=AF) . The color code and three-base context legends are the same as the previous figure. If this figure is blank, not enough information was provided in the MAF to generate it.
Column Descriptions:
-
N = number of sequenced bases in this gene across the individual set
-
n = number of (nonsilent) mutations in this gene across the individual set
-
npat = number of patients (individuals) with at least one nonsilent mutation
-
nsite = number of unique sites having a non-silent mutation
-
nsil = number of silent mutations in this gene across the individual set
-
n1 = number of nonsilent mutations of type: Cp*C->A
-
n2 = number of nonsilent mutations of type: C->(T/G)
-
n3 = number of nonsilent mutations of type: (A/G/T)p*C->A
-
n4 = number of nonsilent mutations of type: A->mut
-
n5 = number of nonsilent mutations of type: indel+null
-
n6 = number of nonsilent mutations of type: double_null
-
p_classic = p-value for the observed amount of nonsilent mutations being elevated in this gene
-
p_ns_s = p-value for the observed nonsilent/silent ratio being elevated in this gene
-
p_cons = p-value for enrichment of mutations at evolutionarily most-conserved sites in gene
-
p_joint = p-value for clustering + conservation
-
p = p-value (overall)
-
q = q-value, False Discovery Rate (Benjamini-Hochberg procedure)
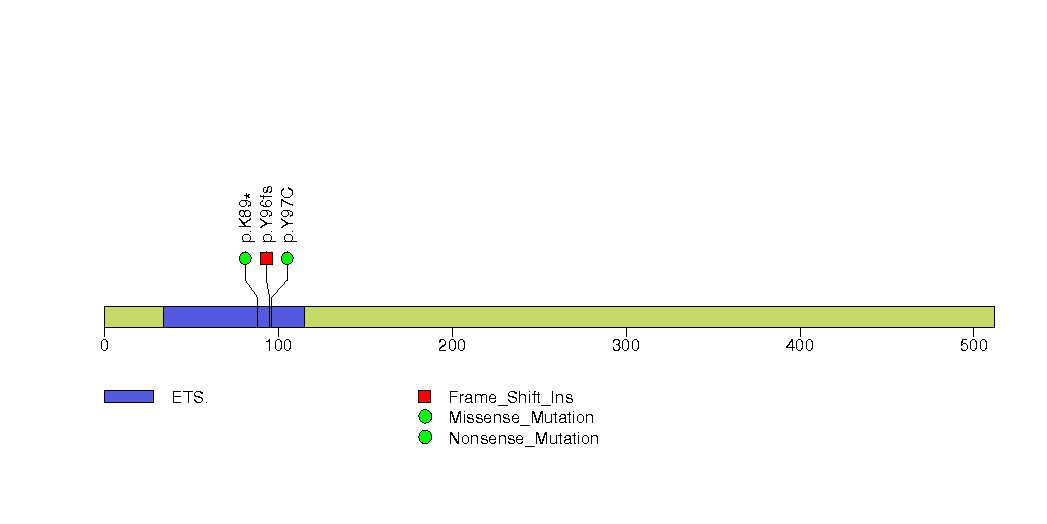
Table 3. Get Full Table A Ranked List of Significantly Mutated Genes. Number of significant genes found: 22. Number of genes displayed: 35. Click on a gene name to display its stick figure depicting the distribution of mutations and mutation types across the chosen gene (this feature may not be available for all significant genes).
| rank | gene | description | N | n | npat | nsite | nsil | n1 | n2 | n3 | n4 | n5 | n6 | p_classic | p_ns_s | p_clust | p_cons | p_joint | p | q |
|---|---|---|---|---|---|---|---|---|---|---|---|---|---|---|---|---|---|---|---|---|
| 1 | TP53 | tumor protein p53 | 400419 | 23 | 23 | 21 | 0 | 0 | 5 | 1 | 7 | 10 | 0 | 4.9e-15 | 0.017 | 0.0004 | 0.0019 | 0.00019 | 0.000 | 0.000 |
| 2 | SPOP | speckle-type POZ protein | 385366 | 38 | 37 | 14 | 0 | 1 | 4 | 3 | 28 | 2 | 0 | 1.9e-15 | 0.00034 | 0 | 0.16 | 0 | <1.00e-15 | <6.03e-12 |
| 3 | FOXA1 | forkhead box A1 | 350244 | 13 | 13 | 10 | 0 | 0 | 2 | 0 | 5 | 5 | 1 | 8.9e-15 | 0.27 | 2e-07 | 0.006 | 0 | <1.00e-15 | <6.03e-12 |
| 4 | PTEN | phosphatase and tensin homolog (mutated in multiple advanced cancers 1) | 388867 | 9 | 9 | 9 | 0 | 0 | 0 | 2 | 1 | 6 | 0 | 2.8e-12 | 0.45 | 0.34 | 0.8 | 0.43 | 3.46e-11 | 1.56e-07 |
| 5 | CTNNB1 | catenin (cadherin-associated protein), beta 1, 88kDa | 796491 | 8 | 8 | 7 | 0 | 1 | 2 | 2 | 3 | 0 | 0 | 2.5e-07 | 0.15 | 0.0018 | 0.083 | 0.0014 | 7.79e-09 | 2.82e-05 |
| 6 | BRAF | v-raf murine sarcoma viral oncogene homolog B1 | 740084 | 8 | 8 | 8 | 0 | 1 | 1 | 1 | 3 | 2 | 0 | 1.6e-07 | 0.17 | 0.52 | 0.034 | 0.16 | 4.60e-07 | 0.00139 |
| 7 | PIK3CA | phosphoinositide-3-kinase, catalytic, alpha polypeptide | 1087905 | 7 | 6 | 7 | 1 | 0 | 1 | 1 | 5 | 0 | 0 | 0.0001 | 0.5 | 0.00035 | 0.15 | 0.0003 | 5.68e-07 | 0.00147 |
| 8 | MED12 | mediator complex subunit 12 | 1765332 | 6 | 6 | 3 | 0 | 0 | 5 | 1 | 0 | 0 | 0 | 0.0011 | 0.18 | 4.4e-06 | 0.15 | 0.000038 | 7.73e-07 | 0.00175 |
| 9 | NKX3-1 | NK3 homeobox 1 | 169068 | 4 | 4 | 4 | 0 | 0 | 1 | 0 | 3 | 0 | 0 | 5.7e-06 | 0.4 | 0.06 | 0.0024 | 0.036 | 3.36e-06 | 0.00675 |
| 10 | IRF4 | interferon regulatory factor 4 | 401399 | 4 | 4 | 4 | 1 | 2 | 0 | 0 | 0 | 2 | 0 | 0.00071 | 0.83 | 0.00013 | 0.49 | 0.00053 | 5.96e-06 | 0.0108 |
| 11 | PCDH18 | protocadherin 18 | 1134275 | 8 | 8 | 8 | 1 | 1 | 3 | 0 | 3 | 1 | 0 | 8.6e-06 | 0.36 | 0.73 | 0.0091 | 0.064 | 8.48e-06 | 0.0133 |
| 12 | IDH1 | isocitrate dehydrogenase 1 (NADP+), soluble | 420799 | 3 | 3 | 2 | 0 | 0 | 3 | 0 | 0 | 0 | 0 | 0.0019 | 0.46 | 0.00015 | 0.65 | 0.00031 | 8.85e-06 | 0.0133 |
| 13 | HRAS | v-Ha-ras Harvey rat sarcoma viral oncogene homolog | 214214 | 4 | 4 | 2 | 0 | 0 | 1 | 0 | 3 | 0 | 0 | 6e-06 | 0.49 | 0.082 | 0.21 | 0.12 | 1.06e-05 | 0.0143 |
| 14 | OR5L2 | olfactory receptor, family 5, subfamily L, member 2 | 311639 | 5 | 5 | 5 | 0 | 1 | 1 | 2 | 1 | 0 | 0 | 1.1e-06 | 0.21 | 0.65 | 0.45 | 0.68 | 1.10e-05 | 0.0143 |
| 15 | PLCB4 | phospholipase C, beta 4 | 1226699 | 7 | 7 | 7 | 0 | 0 | 3 | 2 | 1 | 1 | 0 | 0.000014 | 0.25 | 0.093 | 0.17 | 0.09 | 1.88e-05 | 0.0227 |
| 16 | CDKN1B | cyclin-dependent kinase inhibitor 1B (p27, Kip1) | 200216 | 4 | 4 | 4 | 0 | 0 | 0 | 0 | 0 | 4 | 0 | 2e-06 | 0.82 | 0.7 | 0.74 | 0.88 | 2.58e-05 | 0.0291 |
| 17 | CSMD3 | CUB and Sushi multiple domains 3 | 3796342 | 12 | 12 | 12 | 1 | 2 | 1 | 3 | 2 | 4 | 0 | 0.000013 | 0.29 | 0.15 | 0.24 | 0.16 | 2.78e-05 | 0.0295 |
| 18 | FAM83B | family with sequence similarity 83, member B | 1009206 | 6 | 6 | 6 | 1 | 1 | 1 | 1 | 3 | 0 | 0 | 0.000061 | 0.54 | 0.74 | 0.012 | 0.056 | 4.60e-05 | 0.0462 |
| 19 | ATM | ataxia telangiectasia mutated | 3104760 | 13 | 13 | 13 | 2 | 0 | 5 | 0 | 6 | 2 | 0 | 0.00031 | 0.46 | 0.066 | 0.018 | 0.012 | 5.14e-05 | 0.0489 |
| 20 | ZNF514 | zinc finger protein 514 | 403380 | 2 | 2 | 1 | 0 | 2 | 0 | 0 | 0 | 0 | 0 | 0.044 | 0.54 | 0.022 | 0.00013 | 0.00013 | 7.37e-05 | 0.0635 |
| 21 | LRP1B | low density lipoprotein-related protein 1B (deleted in tumors) | 4653773 | 12 | 12 | 12 | 1 | 0 | 2 | 6 | 2 | 2 | 0 | 0.000012 | 0.38 | 0.53 | 0.23 | 0.48 | 7.37e-05 | 0.0635 |
| 22 | ETV3 | ets variant gene 3 | 146892 | 3 | 3 | 3 | 0 | 0 | 0 | 0 | 1 | 2 | 0 | 0.00011 | 0.74 | 0.019 | 0.44 | 0.062 | 8.60e-05 | 0.0707 |
| 23 | HIST1H2BG | histone cluster 1, H2bg | 127820 | 3 | 3 | 3 | 0 | 0 | 0 | 0 | 1 | 2 | 0 | 0.000012 | 0.82 | 0.51 | 0.9 | 1 | 0.000144 | 0.114 |
| 24 | CD48 | CD48 molecule | 248002 | 4 | 4 | 4 | 0 | 1 | 2 | 1 | 0 | 0 | 0 | 0.000042 | 0.27 | 0.29 | 0.71 | 0.44 | 0.000219 | 0.165 |
| 25 | OR5D18 | olfactory receptor, family 5, subfamily D, member 18 | 313673 | 4 | 4 | 4 | 0 | 0 | 2 | 1 | 1 | 0 | 0 | 0.000068 | 0.28 | 0.13 | 0.85 | 0.28 | 0.000228 | 0.165 |
| 26 | KDM6A | lysine (K)-specific demethylase 6A | 1243236 | 6 | 6 | 6 | 1 | 0 | 0 | 0 | 1 | 5 | 0 | 0.00011 | 0.83 | 0.3 | 0.096 | 0.22 | 0.000285 | 0.198 |
| 27 | CD5L | CD5 molecule-like | 352619 | 4 | 4 | 4 | 0 | 0 | 0 | 1 | 2 | 1 | 0 | 0.0001 | 0.41 | 0.15 | 0.76 | 0.27 | 0.000306 | 0.198 |
| 28 | FILIP1 | filamin A interacting protein 1 | 1212371 | 7 | 7 | 7 | 0 | 1 | 3 | 1 | 2 | 0 | 0 | 0.000056 | 0.17 | 0.38 | 0.52 | 0.47 | 0.000307 | 0.198 |
| 29 | FLG2 | filaggrin family member 2 | 2383495 | 10 | 9 | 10 | 0 | 1 | 3 | 2 | 3 | 1 | 0 | 0.000043 | 0.13 | 0.74 | 0.41 | 0.8 | 0.000387 | 0.239 |
| 30 | PCDHA12 | protocadherin alpha 12 | 944112 | 6 | 6 | 6 | 1 | 0 | 5 | 1 | 0 | 0 | 0 | 0.000071 | 0.33 | 0.33 | 0.41 | 0.51 | 0.000404 | 0.239 |
| 31 | LRRIQ3 | leucine-rich repeats and IQ motif containing 3 | 611581 | 5 | 5 | 5 | 0 | 1 | 0 | 1 | 2 | 1 | 0 | 0.000046 | 0.42 | 0.59 | 0.74 | 0.78 | 0.000409 | 0.239 |
| 32 | DCHS2 | dachsous 2 (Drosophila) | 2852107 | 9 | 9 | 9 | 1 | 0 | 3 | 3 | 3 | 0 | 0 | 9e-05 | 0.37 | 0.33 | 0.32 | 0.44 | 0.000440 | 0.243 |
| 33 | ZMYM3 | zinc finger, MYM-type 3 | 927569 | 6 | 6 | 6 | 0 | 0 | 1 | 0 | 1 | 4 | 0 | 0.000058 | 0.43 | 0.49 | 0.83 | 0.69 | 0.000445 | 0.243 |
| 34 | HSPA8 | heat shock 70kDa protein 8 | 653704 | 5 | 5 | 5 | 0 | 1 | 0 | 1 | 3 | 0 | 0 | 0.000061 | 0.28 | 0.57 | 0.85 | 0.67 | 0.000457 | 0.243 |
| 35 | TLK1 | tousled-like kinase 1 | 770797 | 4 | 4 | 4 | 1 | 0 | 1 | 2 | 0 | 1 | 0 | 0.00054 | 0.82 | 0.07 | 0.62 | 0.084 | 0.000495 | 0.256 |
Figure S1. This figure depicts the distribution of mutations and mutation types across the TP53 significant gene.
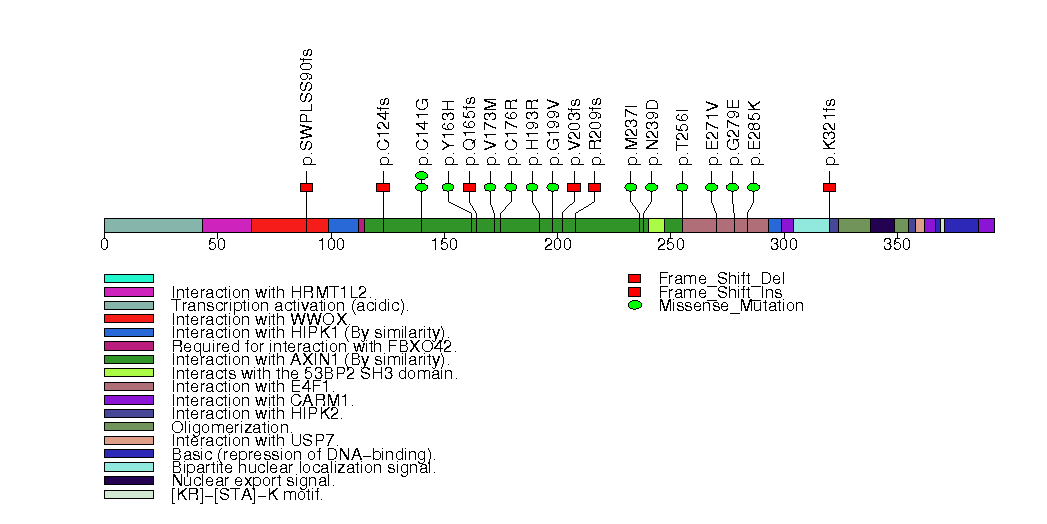
Figure S2. This figure depicts the distribution of mutations and mutation types across the SPOP significant gene.
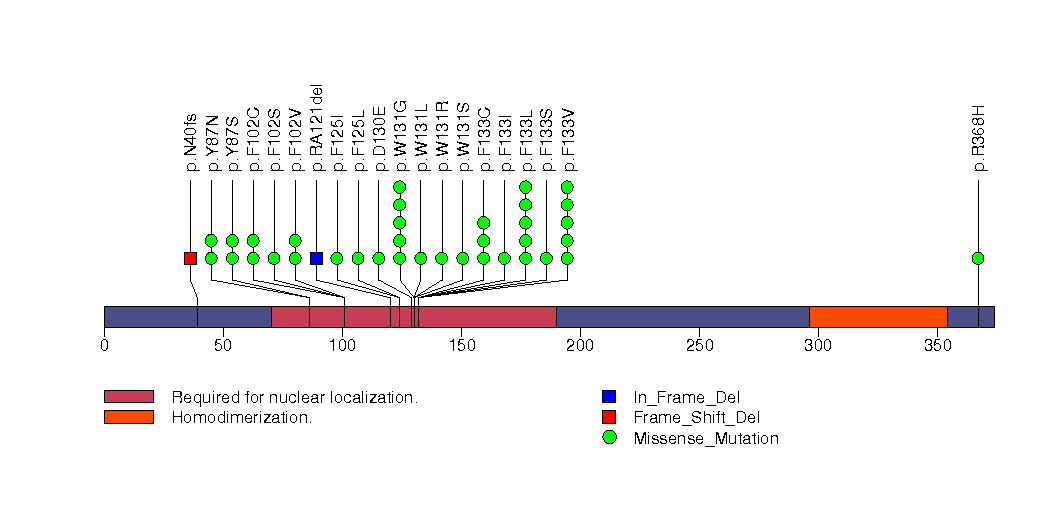
Figure S3. This figure depicts the distribution of mutations and mutation types across the FOXA1 significant gene.
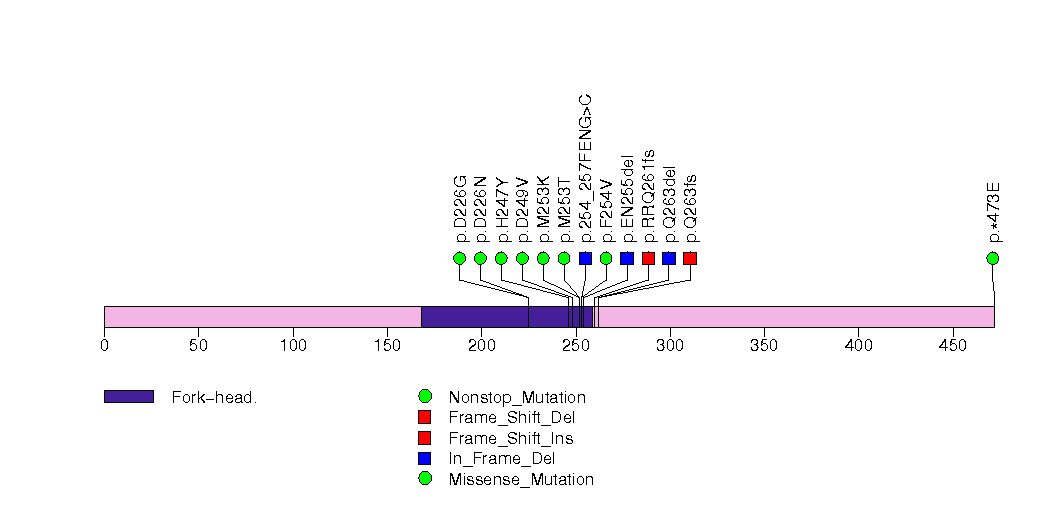
Figure S4. This figure depicts the distribution of mutations and mutation types across the PTEN significant gene.
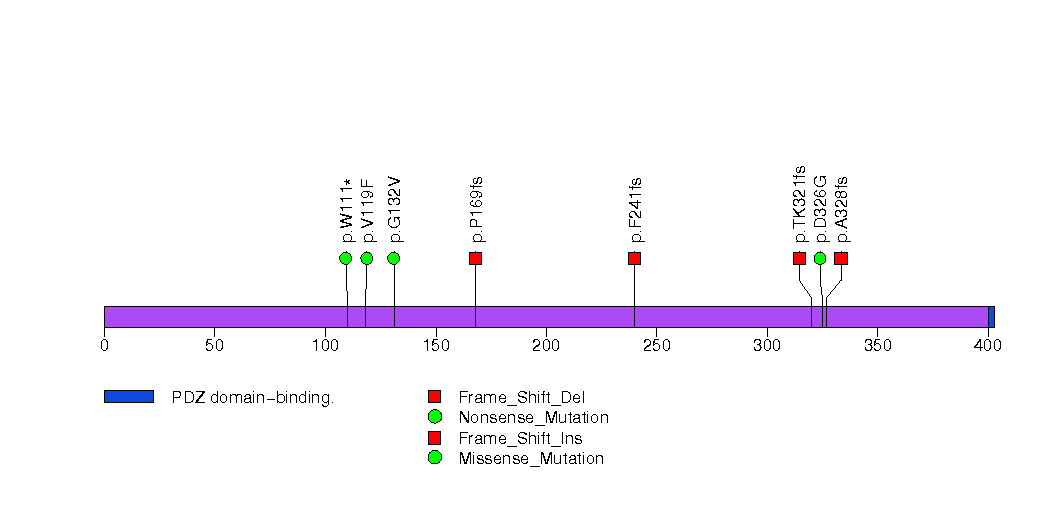
Figure S5. This figure depicts the distribution of mutations and mutation types across the CTNNB1 significant gene.
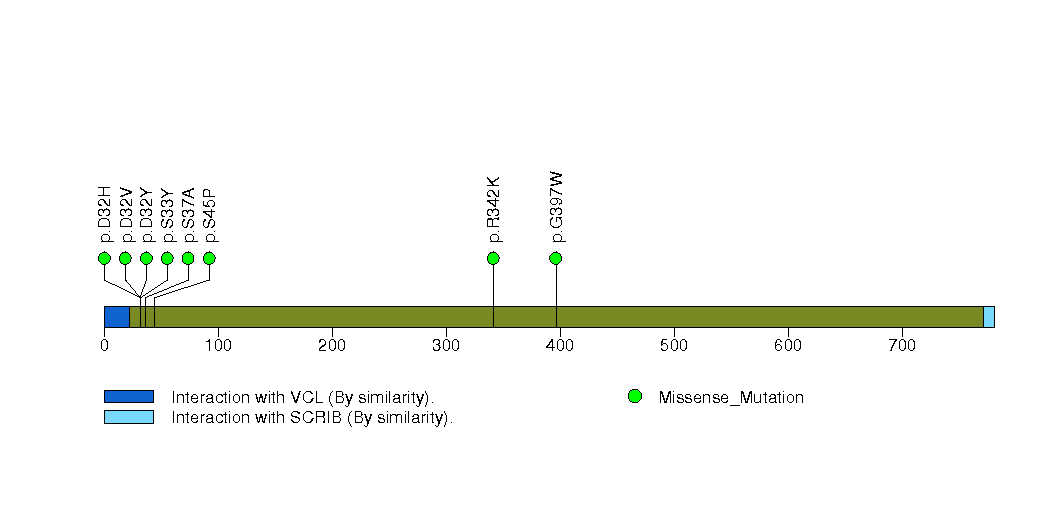
Figure S6. This figure depicts the distribution of mutations and mutation types across the BRAF significant gene.
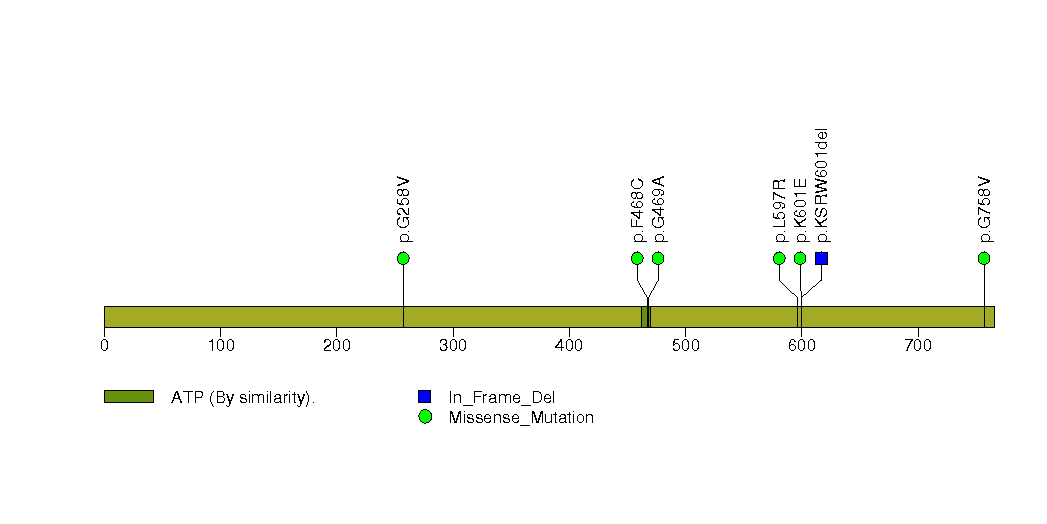
Figure S7. This figure depicts the distribution of mutations and mutation types across the PIK3CA significant gene.
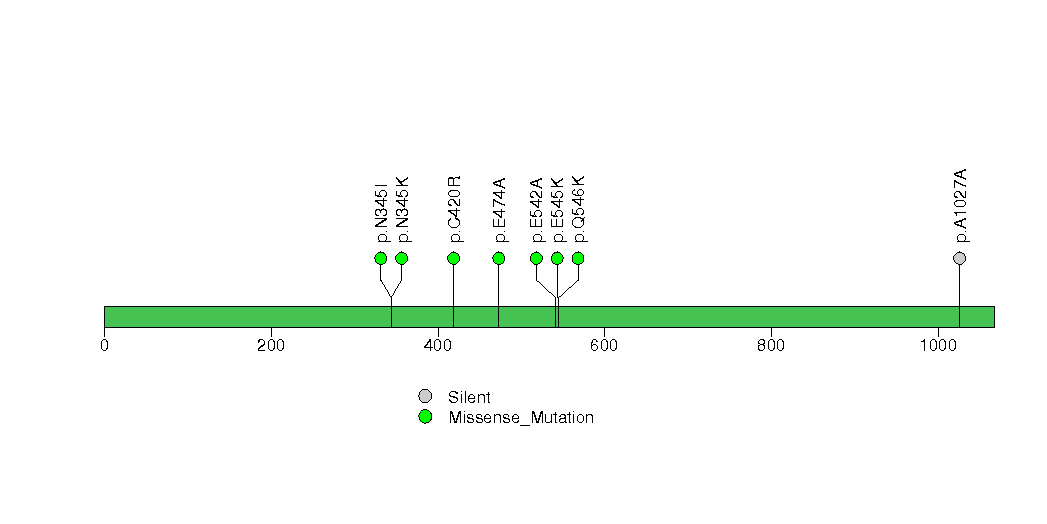
Figure S8. This figure depicts the distribution of mutations and mutation types across the MED12 significant gene.
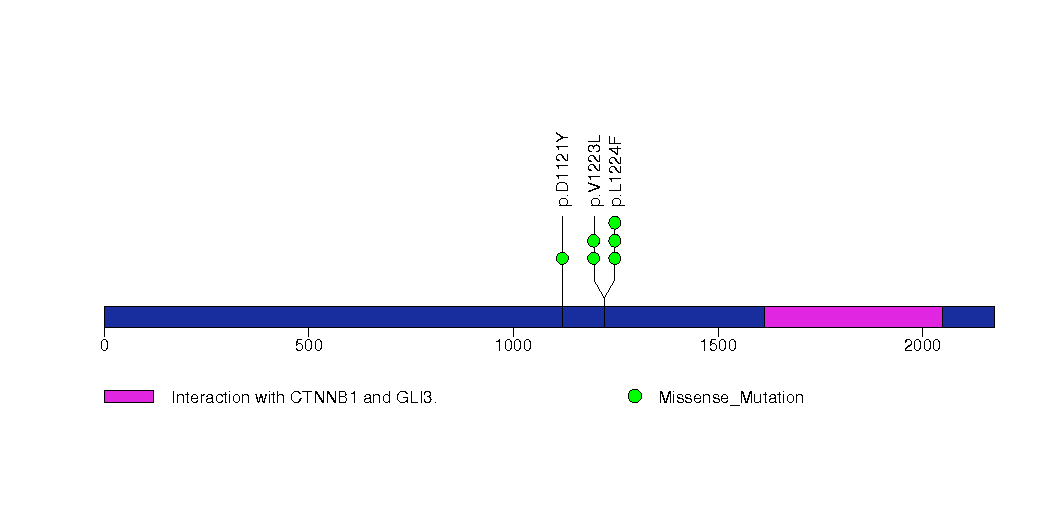
Figure S9. This figure depicts the distribution of mutations and mutation types across the NKX3-1 significant gene.
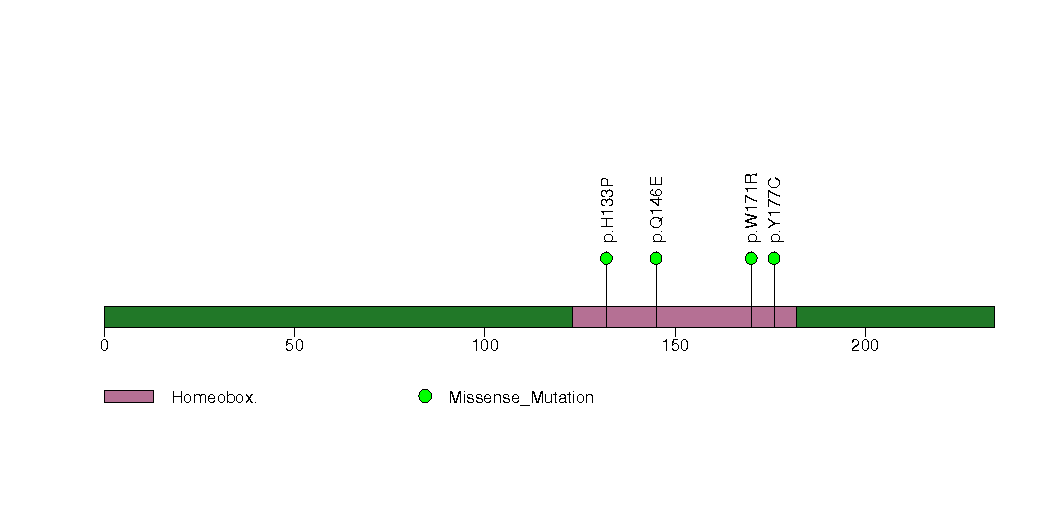
Figure S10. This figure depicts the distribution of mutations and mutation types across the IRF4 significant gene.
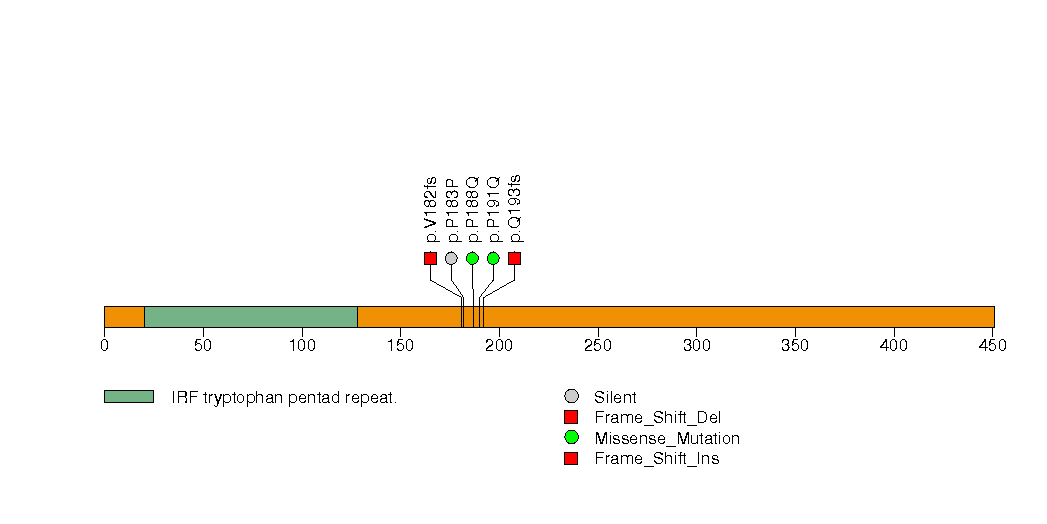
Figure S11. This figure depicts the distribution of mutations and mutation types across the PCDH18 significant gene.
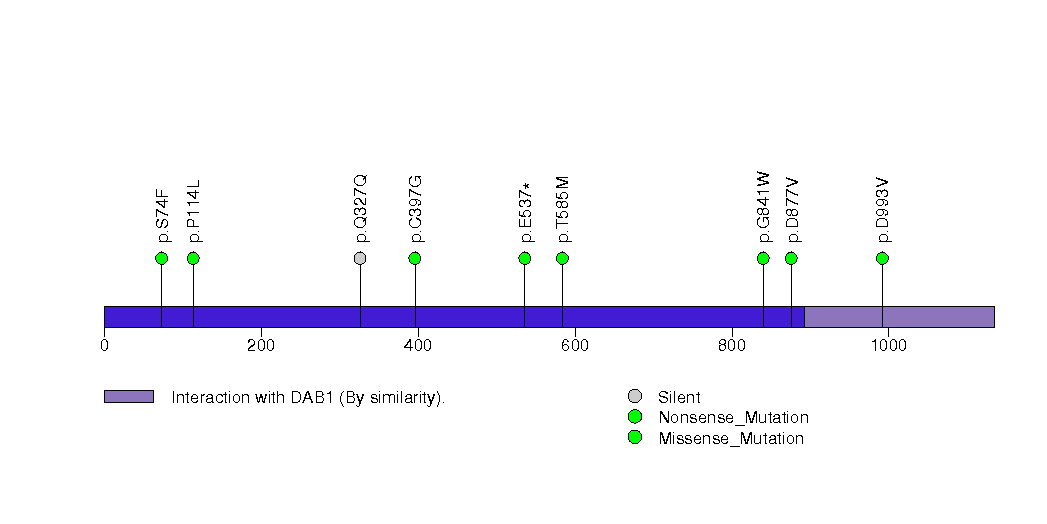
Figure S12. This figure depicts the distribution of mutations and mutation types across the IDH1 significant gene.
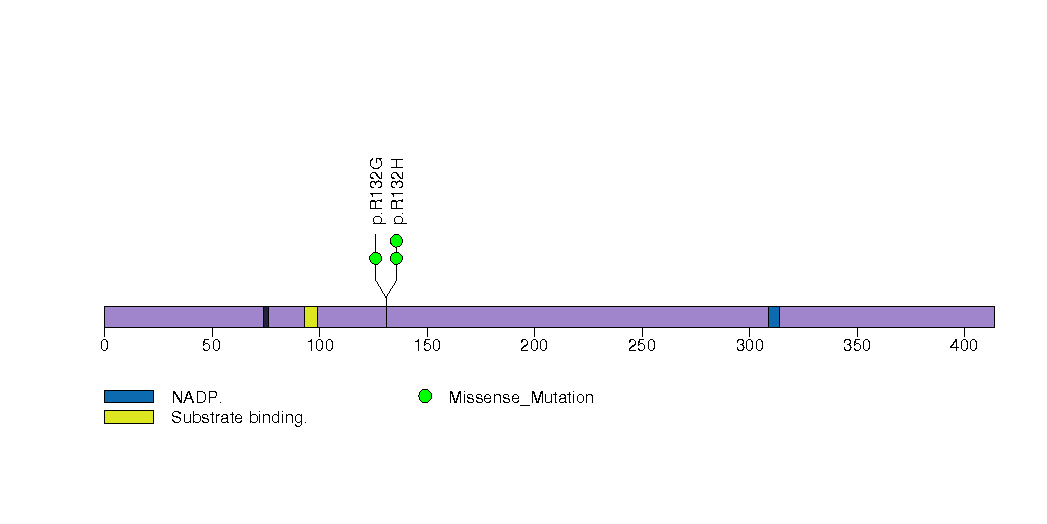
Figure S13. This figure depicts the distribution of mutations and mutation types across the HRAS significant gene.
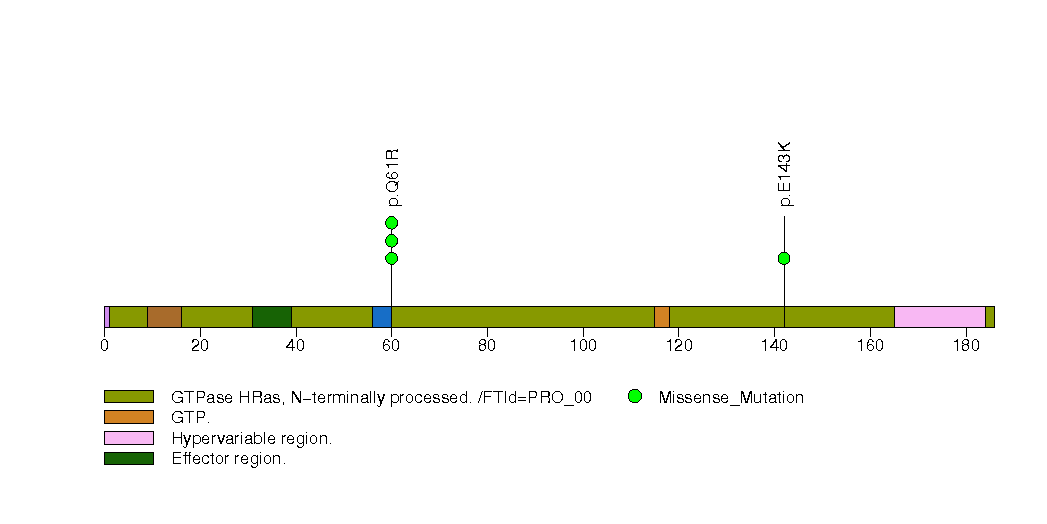
Figure S14. This figure depicts the distribution of mutations and mutation types across the OR5L2 significant gene.
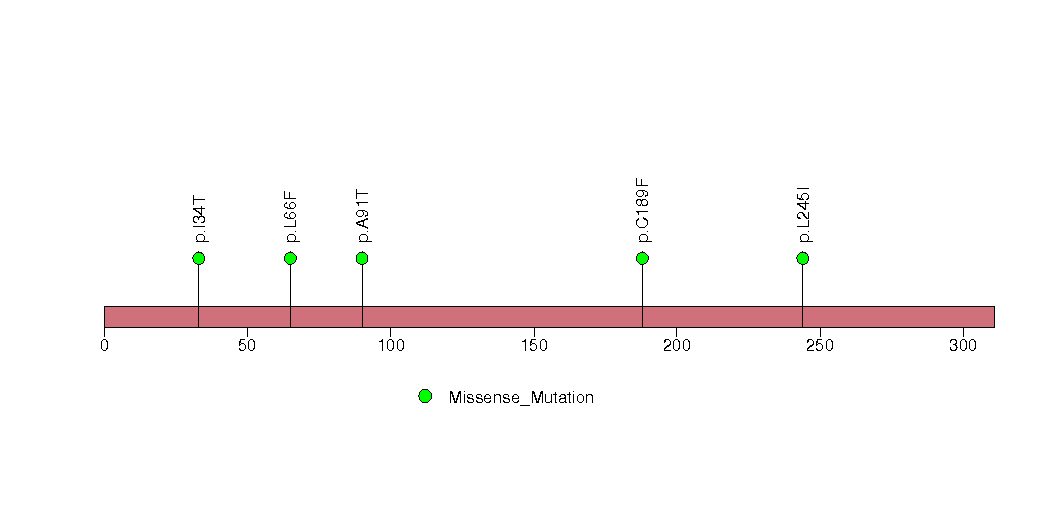
Figure S15. This figure depicts the distribution of mutations and mutation types across the PLCB4 significant gene.
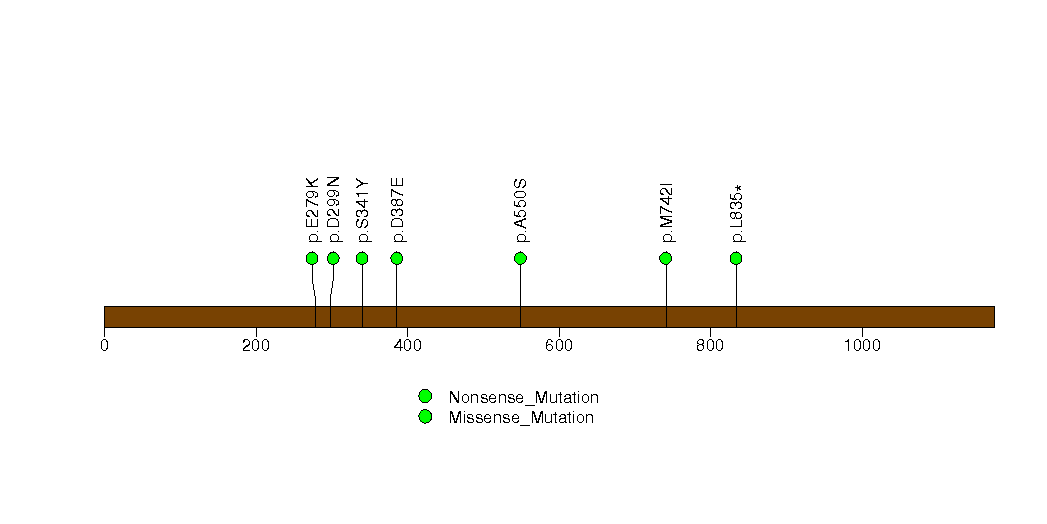
Figure S16. This figure depicts the distribution of mutations and mutation types across the CDKN1B significant gene.
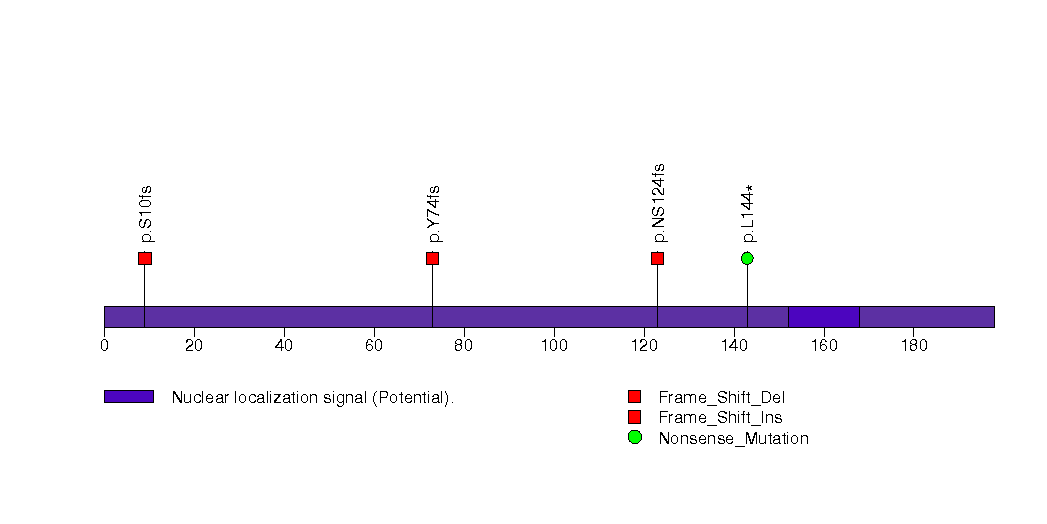
Figure S17. This figure depicts the distribution of mutations and mutation types across the CSMD3 significant gene.
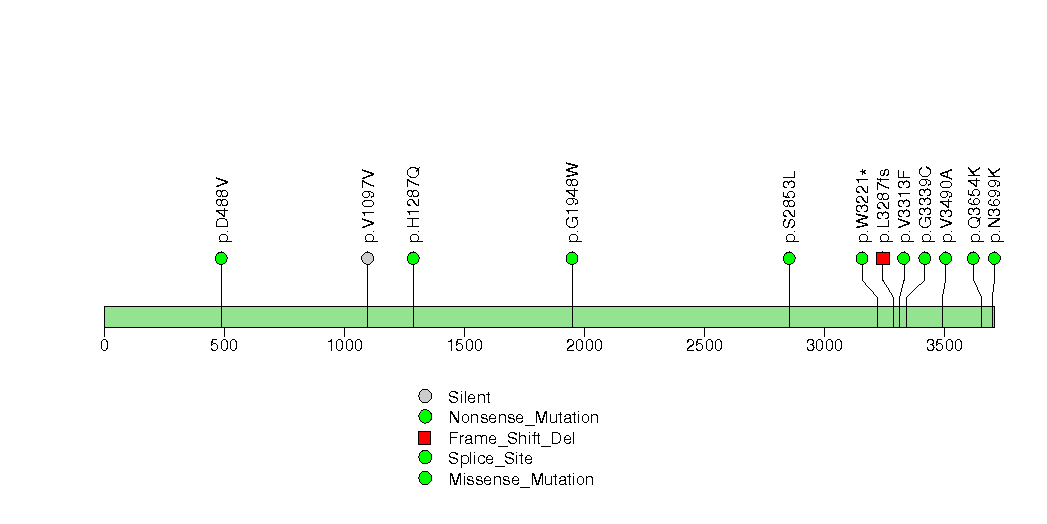
Figure S18. This figure depicts the distribution of mutations and mutation types across the FAM83B significant gene.
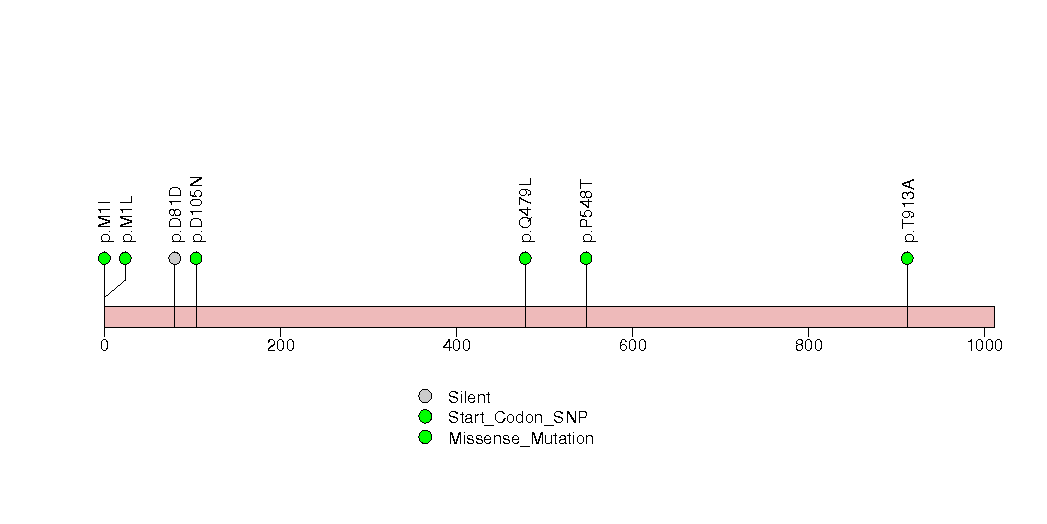
Figure S19. This figure depicts the distribution of mutations and mutation types across the ATM significant gene.
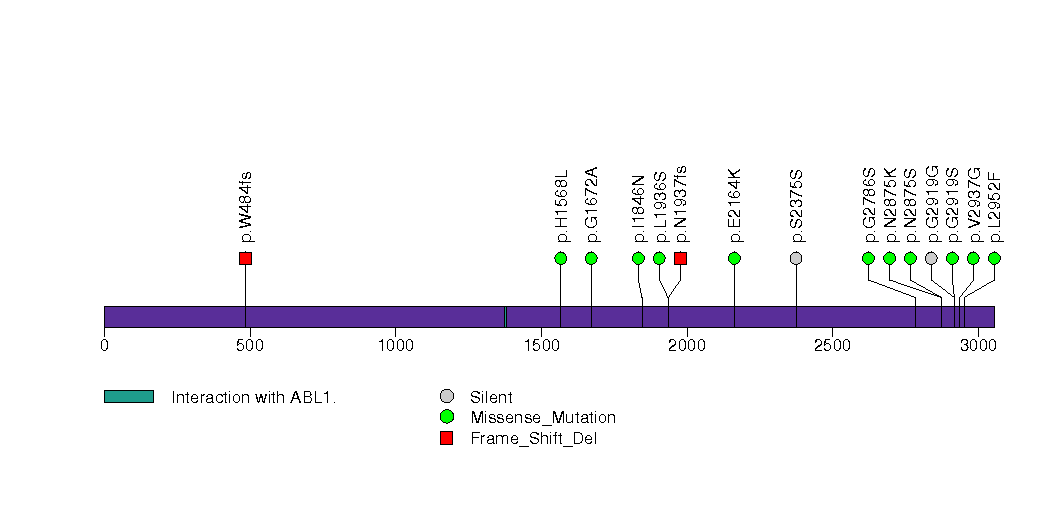
Figure S20. This figure depicts the distribution of mutations and mutation types across the ZNF514 significant gene.
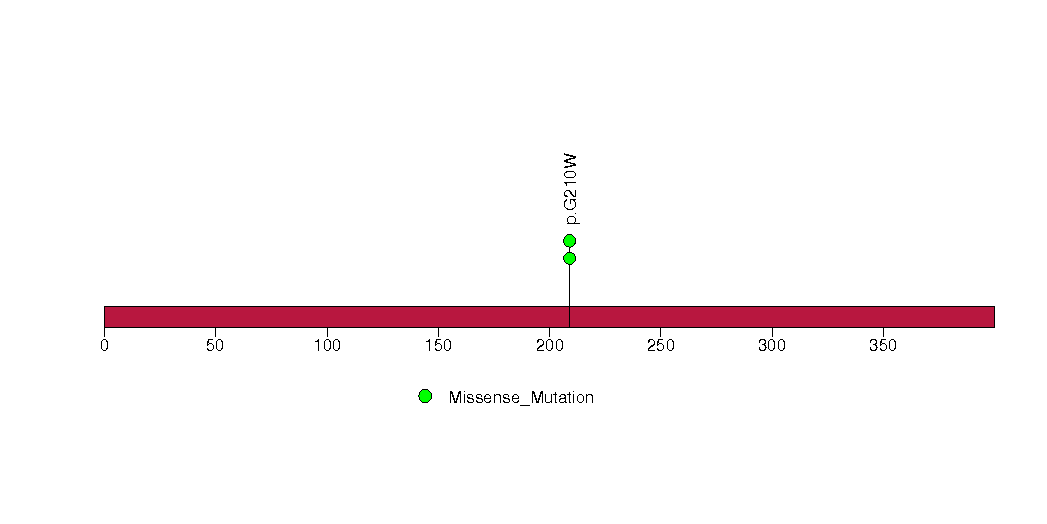
Figure S21. This figure depicts the distribution of mutations and mutation types across the LRP1B significant gene.
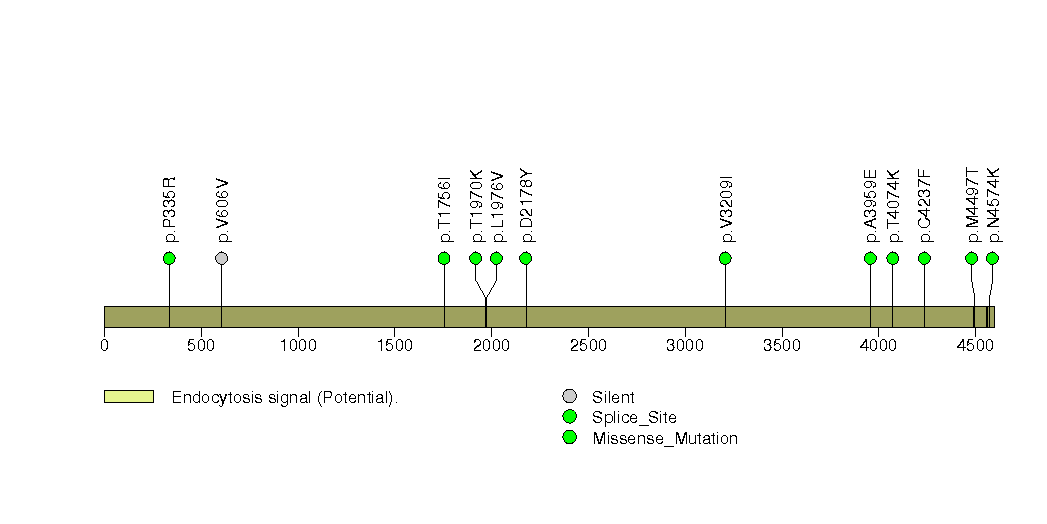
Figure S22. This figure depicts the distribution of mutations and mutation types across the ETV3 significant gene.
In this analysis, COSMIC is used as a filter to increase power by restricting the territory of each gene. Cosmic version: v48.
Table 4. Get Full Table Significantly mutated genes (COSMIC territory only). To access the database please go to: COSMIC. Number of significant genes found: 8. Number of genes displayed: 10
| rank | gene | description | n | cos | n_cos | N_cos | cos_ev | p | q |
|---|---|---|---|---|---|---|---|---|---|
| 1 | TP53 | tumor protein p53 | 23 | 356 | 21 | 118192 | 1670 | 0 | 0 |
| 2 | PTEN | phosphatase and tensin homolog (mutated in multiple advanced cancers 1) | 9 | 767 | 9 | 254644 | 96 | 0 | 0 |
| 3 | CTNNB1 | catenin (cadherin-associated protein), beta 1, 88kDa | 8 | 138 | 6 | 45816 | 2207 | 3.9e-12 | 5.9e-09 |
| 4 | PIK3CA | phosphoinositide-3-kinase, catalytic, alpha polypeptide | 7 | 220 | 6 | 73040 | 1262 | 9.7e-11 | 9.2e-08 |
| 5 | BRAF | v-raf murine sarcoma viral oncogene homolog B1 | 8 | 89 | 5 | 29548 | 14375 | 1e-10 | 9.2e-08 |
| 6 | IDH1 | isocitrate dehydrogenase 1 (NADP+), soluble | 3 | 5 | 3 | 1660 | 4476 | 5.4e-10 | 4.1e-07 |
| 7 | HRAS | v-Ha-ras Harvey rat sarcoma viral oncogene homolog | 4 | 19 | 3 | 6308 | 624 | 3e-08 | 0.000019 |
| 8 | SMAD4 | SMAD family member 4 | 4 | 159 | 4 | 52788 | 19 | 2e-07 | 0.00011 |
| 9 | ACSM2B | acyl-CoA synthetase medium-chain family member 2B | 2 | 1 | 1 | 332 | 1 | 0.0003 | 0.12 |
| 10 | BRE | brain and reproductive organ-expressed (TNFRSF1A modulator) | 2 | 1 | 1 | 332 | 1 | 0.0003 | 0.12 |
Note:
n - number of (nonsilent) mutations in this gene across the individual set.
cos = number of unique mutated sites in this gene in COSMIC
n_cos = overlap between n and cos.
N_cos = number of individuals times cos.
cos_ev = total evidence: number of reports in COSMIC for mutations seen in this gene.
p = p-value for seeing the observed amount of overlap in this gene)
q = q-value, False Discovery Rate (Benjamini-Hochberg procedure)
Table 5. Get Full Table A Ranked List of Significantly Mutated Genesets. (Source: MSigDB GSEA Cannonical Pathway Set).Number of significant genesets found: 29. Number of genesets displayed: 10
| rank | geneset | description | genes | N_genes | mut_tally | N | n | npat | nsite | nsil | n1 | n2 | n3 | n4 | n5 | n6 | p_ns_s | p | q |
|---|---|---|---|---|---|---|---|---|---|---|---|---|---|---|---|---|---|---|---|
| 1 | P53HYPOXIAPATHWAY | Hypoxia induces p53 accumulation and consequent apoptosis with p53-mediated cell cycle arrest, which is present under conditions of DNA damage. | ABCB1, AKT1, ATM, BAX, CDKN1A, CPB2, CSNK1A1, CSNK1D, FHL2, GADD45A, HIC1, HIF1A, HSPA1A, HSPCA, IGFBP3, MAPK8, MDM2, NFKBIB, NQO1, TP53 | 19 | AKT1(3), ATM(13), HSPA1A(1), NFKBIB(1), TP53(23) | 10237566 | 41 | 39 | 38 | 2 | 1 | 13 | 2 | 13 | 12 | 0 | 0.012 | 2.8e-15 | 9.4e-13 |
| 2 | P53PATHWAY | p53 induces cell cycle arrest or apoptosis under conditions of DNA damage. | APAF1, ATM, BAX, BCL2, CCND1, CCNE1, CDK2, CDK4, CDKN1A, E2F1, GADD45A, MDM2, PCNA, RB1, TIMP3, TP53 | 16 | APAF1(1), ATM(13), RB1(2), TP53(23) | 8943084 | 39 | 37 | 37 | 2 | 1 | 11 | 1 | 14 | 12 | 0 | 0.016 | 5.9e-15 | 9.4e-13 |
| 3 | ARFPATHWAY | Cyclin-dependent kinase inhibitor 2A is a tumor suppressor that induces G1 arrest and can activate the p53 pathway, leading to G2/M arrest. | ABL1, CDKN2A, E2F1, MDM2, MYC, PIK3CA, PIK3R1, POLR1A, POLR1B, POLR1C, POLR1D, RAC1, RB1, TBX2, TP53, TWIST1 | 16 | ABL1(1), PIK3CA(7), POLR1A(2), POLR1B(1), POLR1C(1), RAC1(1), RB1(2), TP53(23) | 10023689 | 38 | 37 | 36 | 1 | 3 | 6 | 3 | 16 | 10 | 0 | 0.0035 | 8.2e-15 | 9.4e-13 |
| 4 | PMLPATHWAY | Ring-shaped PML nuclear bodies regulate transcription and are required co-activators in p53- and DAXX-mediated apoptosis. | CREBBP, DAXX, HRAS, PAX3, PML, PRAM-1, RARA, RB1, SIRT1, SP100, TNF, TNFRSF1A, TNFRSF1B, TNFRSF6, TNFSF6, TP53, UBL1 | 13 | CREBBP(2), DAXX(1), HRAS(4), PAX3(1), RB1(2), SIRT1(1), SP100(1), TP53(23) | 9353517 | 35 | 35 | 31 | 1 | 2 | 6 | 2 | 15 | 10 | 0 | 0.0068 | 8.9e-15 | 9.4e-13 |
| 5 | SA_G1_AND_S_PHASES | Cdk2, 4, and 6 bind cyclin D in G1, while cdk2/cyclin E promotes the G1/S transition. | ARF1, ARF3, CCND1, CDK2, CDK4, CDKN1A, CDKN1B, CDKN2A, CFL1, E2F1, E2F2, MDM2, NXT1, PRB1, TP53 | 15 | CDKN1B(4), CFL1(1), TP53(23) | 4146431 | 28 | 28 | 26 | 1 | 0 | 5 | 1 | 7 | 15 | 0 | 0.06 | 9e-15 | 9.4e-13 |
| 6 | TERTPATHWAY | hTERC, the RNA subunit of telomerase, and hTERT, the catalytic protein subunit, are required for telomerase activity and are overexpressed in many cancers. | HDAC1, MAX, MYC, SP1, SP3, TP53, WT1, ZNF42 | 7 | SP1(2), SP3(3), TP53(23) | 3469530 | 28 | 28 | 26 | 0 | 0 | 7 | 2 | 7 | 12 | 0 | 0.0053 | 9.1e-15 | 9.4e-13 |
| 7 | RNAPATHWAY | dsRNA-activated protein kinase phosphorylates elF2a, which generally inhibits translation, and activates NF-kB to provoke inflammation. | CHUK, DNAJC3, EIF2S1, EIF2S2, MAP3K14, NFKB1, NFKBIA, PRKR, RELA, TP53 | 9 | NFKB1(2), RELA(2), TP53(23) | 4782176 | 27 | 27 | 25 | 1 | 2 | 6 | 1 | 8 | 10 | 0 | 0.031 | 1.1e-14 | 9.6e-13 |
| 8 | TELPATHWAY | Telomerase is a ribonucleotide protein that adds telomeric repeats to the 3' ends of chromosomes. | AKT1, BCL2, EGFR, G22P1, HSPCA, IGF1R, KRAS2, MYC, POLR2A, PPP2CA, PRKCA, RB1, TEP1, TERF1, TERT, TNKS, TP53, XRCC5 | 15 | AKT1(3), EGFR(4), IGF1R(2), PRKCA(1), RB1(2), TEP1(4), TNKS(2), TP53(23), XRCC5(1) | 13842900 | 42 | 41 | 39 | 1 | 6 | 9 | 4 | 13 | 10 | 0 | 0.00076 | 6.8e-14 | 5.3e-12 |
| 9 | RBPATHWAY | The ATM protein kinase recognizes DNA damage and blocks cell cycle progression by phosphorylating chk1 and p53, which normally inhibits Rb to allow G1/S transitions. | ATM, CDC2, CDC25A, CDC25B, CDC25C, CDK2, CDK4, CHEK1, MYT1, RB1, TP53, WEE1, YWHAH | 12 | ATM(13), MYT1(1), RB1(2), TP53(23) | 8673699 | 39 | 37 | 37 | 3 | 2 | 10 | 1 | 14 | 12 | 0 | 0.044 | 4e-13 | 2.7e-11 |
| 10 | CHEMICALPATHWAY | DNA damage promotes Bid cleavage, which stimulates mitochondrial cytochrome c release and consequent caspase activation, resulting in apoptosis. | ADPRT, AKT1, APAF1, ATM, BAD, BAX, BCL2, BCL2L1, BID, CASP3, CASP6, CASP7, CASP9, CYCS, EIF2S1, PRKCA, PRKCB1, PTK2, PXN, STAT1, TLN1, TP53 | 20 | AKT1(3), APAF1(1), ATM(13), BAD(1), PRKCA(1), STAT1(1), TLN1(2), TP53(23) | 13528093 | 45 | 43 | 42 | 3 | 1 | 13 | 3 | 15 | 13 | 0 | 0.017 | 7.2e-13 | 4.4e-11 |
Table 6. Get Full Table A Ranked List of Significantly Mutated Genesets (Excluding Significantly Mutated Genes). Number of significant genesets found: 0. Number of genesets displayed: 10
| rank | geneset | description | genes | N_genes | mut_tally | N | n | npat | nsite | nsil | n1 | n2 | n3 | n4 | n5 | n6 | p_ns_s | p | q |
|---|---|---|---|---|---|---|---|---|---|---|---|---|---|---|---|---|---|---|---|
| 1 | HSA00550_PEPTIDOGLYCAN_BIOSYNTHESIS | Genes involved in peptidoglycan biosynthesis | GLUL, PGLYRP2 | 2 | GLUL(1), PGLYRP2(3) | 890560 | 4 | 4 | 4 | 0 | 1 | 1 | 1 | 0 | 1 | 0 | 0.33 | 0.0022 | 0.82 |
| 2 | TERCPATHWAY | hTERC, the RNA subunit of telomerase, and hTERT, the catalytic protein subunit, are required for telomerase activity and are overexpressed in many cancers. | NFYA, NFYB, NFYC, RB1, SP1, SP3 | 6 | NFYC(1), RB1(2), SP1(2), SP3(3) | 3297294 | 8 | 8 | 8 | 0 | 1 | 3 | 1 | 1 | 2 | 0 | 0.17 | 0.0027 | 0.82 |
| 3 | HSA00130_UBIQUINONE_BIOSYNTHESIS | Genes involved in ubiquinone biosynthesis | COQ2, COQ3, COQ5, COQ6, COQ7, ND1, ND2, ND3, ND4, ND4L, ND5, ND6, NDUFA12, NDUFA13, NDUFB11 | 8 | COQ3(2), COQ5(1), COQ7(1), NDUFA13(1) | 1961734 | 5 | 5 | 5 | 0 | 0 | 2 | 0 | 2 | 1 | 0 | 0.27 | 0.008 | 1 |
| 4 | LONGEVITYPATHWAY | Caloric restriction in animals often increases lifespan, which may occur via decreased IGF receptor expression and consequent expression of stress-resistance proteins. | AKT1, CAT, FOXO3A, GH1, GHR, HRAS, IGF1, IGF1R, PIK3CA, PIK3R1, SHC1, SOD1, SOD2, SOD3 | 11 | AKT1(3), GH1(1), GHR(2), IGF1R(2), SHC1(1), SOD3(1) | 5269377 | 10 | 10 | 9 | 0 | 2 | 4 | 2 | 2 | 0 | 0 | 0.07 | 0.0083 | 1 |
| 5 | ETCPATHWAY | Energy is extracted from carbohydrates via oxidation and transferred to the mitochondrial electron transport chain, which couples ATP synthesis to the reduction of oxygen to water. | ATP5A1, CYCS, GPD2, MTCO1, NDUFA1, SDHA, SDHB, SDHC, SDHD, UQCRC1 | 9 | ATP5A1(2), SDHA(1), SDHB(1), SDHC(2), UQCRC1(1) | 3258606 | 7 | 7 | 7 | 0 | 1 | 2 | 0 | 1 | 3 | 0 | 0.19 | 0.016 | 1 |
| 6 | EEA1PATHWAY | The FYVE-finger proteins EEA1 and HRS are localized to endosome membranes and regulate sorting and ubiquitination in the vesicle transport system. | EEA1, EGF, EGFR, HGS, RAB5A, TF, TFRC | 7 | EEA1(2), EGF(2), EGFR(4), TF(2) | 6338332 | 10 | 10 | 10 | 1 | 4 | 2 | 1 | 3 | 0 | 0 | 0.27 | 0.016 | 1 |
| 7 | ERBB3PATHWAY | Neuregulins bind to the receptor tyrosine kinases ErbB3 and ErbB4, surface-localized receptors whose overexpression induces tumor formation. | EGF, EGFR, ERBB3, NRG1, UBE2D1 | 5 | EGF(2), EGFR(4), ERBB3(2), UBE2D1(1) | 5068951 | 9 | 9 | 9 | 1 | 3 | 0 | 1 | 4 | 1 | 0 | 0.3 | 0.017 | 1 |
| 8 | TELPATHWAY | Telomerase is a ribonucleotide protein that adds telomeric repeats to the 3' ends of chromosomes. | AKT1, BCL2, EGFR, G22P1, HSPCA, IGF1R, KRAS2, MYC, POLR2A, PPP2CA, PRKCA, RB1, TEP1, TERF1, TERT, TNKS, TP53, XRCC5 | 14 | AKT1(3), EGFR(4), IGF1R(2), PRKCA(1), RB1(2), TEP1(4), TNKS(2), XRCC5(1) | 13442481 | 19 | 19 | 18 | 1 | 6 | 4 | 3 | 6 | 0 | 0 | 0.027 | 0.019 | 1 |
| 9 | FATTY_ACID_BIOSYNTHESIS_PATH_2 | ACAA1, ACAA2, ACAT1, ACAT2, ECHS1, EHHADH, HADHA, HADHB, SDS | 9 | ACAA1(3), ACAA2(1), ACAT1(1), EHHADH(5) | 4121609 | 10 | 8 | 10 | 1 | 3 | 1 | 1 | 2 | 3 | 0 | 0.27 | 0.02 | 1 | |
| 10 | HSA00534_HEPARAN_SULFATE_BIOSYNTHESIS | Genes involved in heparan sulfate biosynthesis | EXT1, EXT2, EXTL1, EXTL2, EXTL3, GLCE, HS2ST1, HS3ST1, HS3ST2, HS3ST3A1, HS3ST3B1, HS3ST5, HS6ST1, HS6ST2, HS6ST3, LOC728969, NDST1, NDST2, NDST3, NDST4 | 19 | EXT1(1), EXT2(4), EXTL1(1), EXTL3(1), HS6ST1(1), HS6ST2(1), NDST2(2), NDST4(4) | 10133977 | 15 | 15 | 15 | 1 | 1 | 7 | 0 | 5 | 2 | 0 | 0.083 | 0.022 | 1 |
In brief, we tabulate the number of mutations and the number of covered bases for each gene. The counts are broken down by mutation context category: four context categories that are discovered by MutSig, and one for indel and 'null' mutations, which include indels, nonsense mutations, splice-site mutations, and non-stop (read-through) mutations. For each gene, we calculate the probability of seeing the observed constellation of mutations, i.e. the product P1 x P2 x ... x Pm, or a more extreme one, given the background mutation rates calculated across the dataset. [1]
In addition to the links below, the full results of the analysis summarized in this report can also be downloaded programmatically using firehose_get, or interactively from either the Broad GDAC website or TCGA Data Coordination Center Portal.