This report serves to describe the mutational landscape and properties of a given individual set, as well as rank genes and genesets according to mutational significance. MutSig v2.0 was used to generate the results found in this report.
-
Working with individual set: UCS-TP
-
Number of patients in set: 57
The input for this pipeline is a set of individuals with the following files associated for each:
-
An annotated .maf file describing the mutations called for the respective individual, and their properties.
-
A .wig file that contains information about the coverage of the sample.
-
MAF used for this analysis:UCS-TP.final_analysis_set.maf
-
Blacklist used for this analysis: pancan_mutation_blacklist.v14.hg19.txt
-
Significantly mutated genes (q ≤ 0.1): 16
-
Mutations seen in COSMIC: 138
-
Significantly mutated genes in COSMIC territory: 12
-
Significantly mutated genesets: 103
-
Significantly mutated genesets: (excluding sig. mutated genes):0
-
Read 57 MAFs of type "maf1"
-
Total number of mutations in input MAFs: 11339
-
After removing 78 mutations outside chr1-24: 11261
-
After removing 432 blacklisted mutations: 10829
-
After removing 1059 noncoding mutations: 9770
-
Number of mutations before filtering: 9770
-
After removing 525 mutations outside gene set: 9245
-
After removing 38 mutations outside category set: 9207
Table 1. Get Full Table Table representing breakdown of mutations by type.
| type | count |
|---|---|
| De_novo_Start_InFrame | 4 |
| De_novo_Start_OutOfFrame | 11 |
| Frame_Shift_Del | 235 |
| Frame_Shift_Ins | 79 |
| In_Frame_Del | 64 |
| In_Frame_Ins | 9 |
| Missense_Mutation | 6012 |
| Nonsense_Mutation | 582 |
| Nonstop_Mutation | 11 |
| Silent | 1906 |
| Splice_Site | 282 |
| Start_Codon_Del | 1 |
| Start_Codon_SNP | 11 |
| Total | 9207 |
Table 2. Get Full Table A breakdown of mutation rates per category discovered for this individual set.
| category | n | N | rate | rate_per_mb | relative_rate | exp_ns_s_ratio |
|---|---|---|---|---|---|---|
| *CpG->T | 1673 | 95243737 | 0.000018 | 18 | 4 | 2.1 |
| *Cp(A/C/T)->T | 806 | 765648006 | 1.1e-06 | 1.1 | 0.24 | 1.7 |
| C->(G/A) | 1844 | 860891743 | 2.1e-06 | 2.1 | 0.49 | 4.7 |
| A->mut | 1700 | 819427697 | 2.1e-06 | 2.1 | 0.48 | 3.9 |
| indel+null | 1246 | 1680319440 | 7.4e-07 | 0.74 | 0.17 | NaN |
| double_null | 32 | 1680319440 | 1.9e-08 | 0.019 | 0.0044 | NaN |
| Total | 7301 | 1680319440 | 4.3e-06 | 4.3 | 1 | 3.5 |
The x axis represents the samples. The y axis represents the exons, one row per exon, and they are sorted by average coverage across samples. For exons with exactly the same average coverage, they are sorted next by the %GC of the exon. (The secondary sort is especially useful for the zero-coverage exons at the bottom). If the figure is unpopulated, then full coverage is assumed (e.g. MutSig CV doesn't use WIGs and assumes full coverage).
Figure 1.
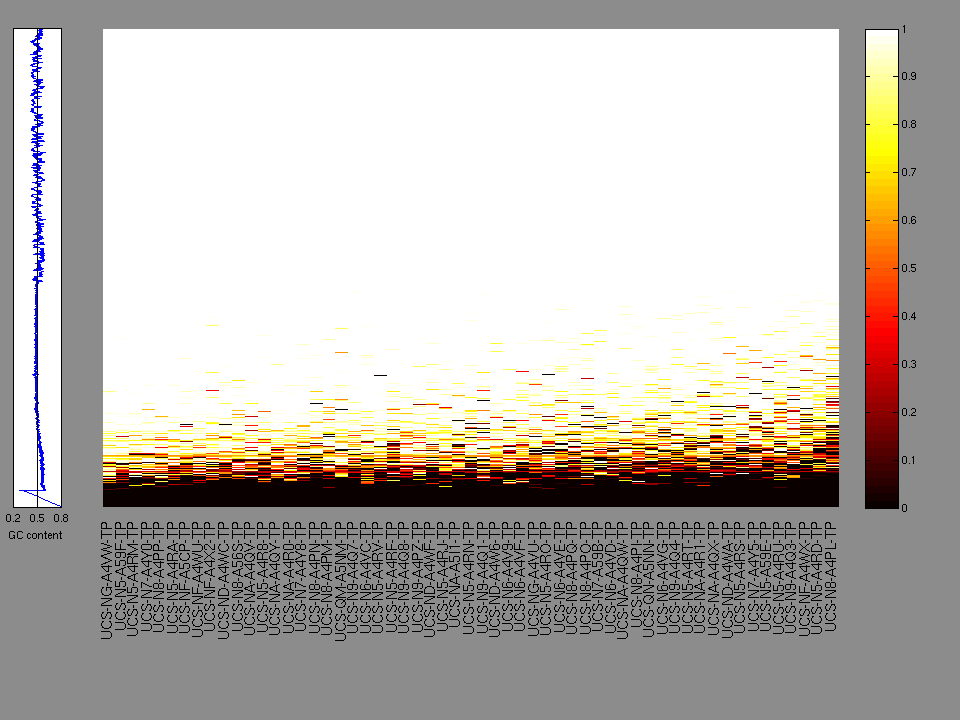
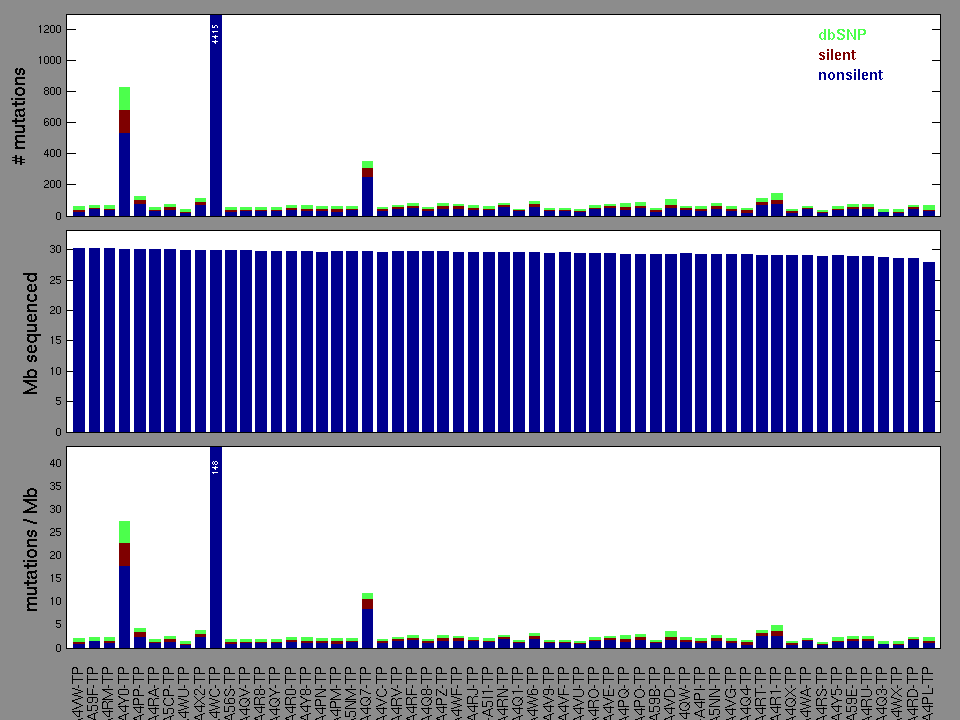
Figure 2. Patients counts and rates file used to generate this plot: UCS-TP.patients.counts_and_rates.txt
The mutation spectrum is depicted in the lego plots below in which the 96 possible mutation types are subdivided into six large blocks, color-coded to reflect the base substitution type. Each large block is further subdivided into the 16 possible pairs of 5' and 3' neighbors, as listed in the 4x4 trinucleotide context legend. The height of each block corresponds to the mutation frequency for that kind of mutation (counts of mutations normalized by the base coverage in a given bin). The shape of the spectrum is a signature for dominant mutational mechanisms in different tumor types.
Figure 3. Get High-res Image SNV Mutation rate lego plot for entire set. Each bin is normalized by base coverage for that bin. Colors represent the six SNV types on the upper right. The three-base context for each mutation is labeled in the 4x4 legend on the lower right. The fractional breakdown of SNV counts is shown in the pie chart on the upper left. If this figure is blank, not enough information was provided in the MAF to generate it.
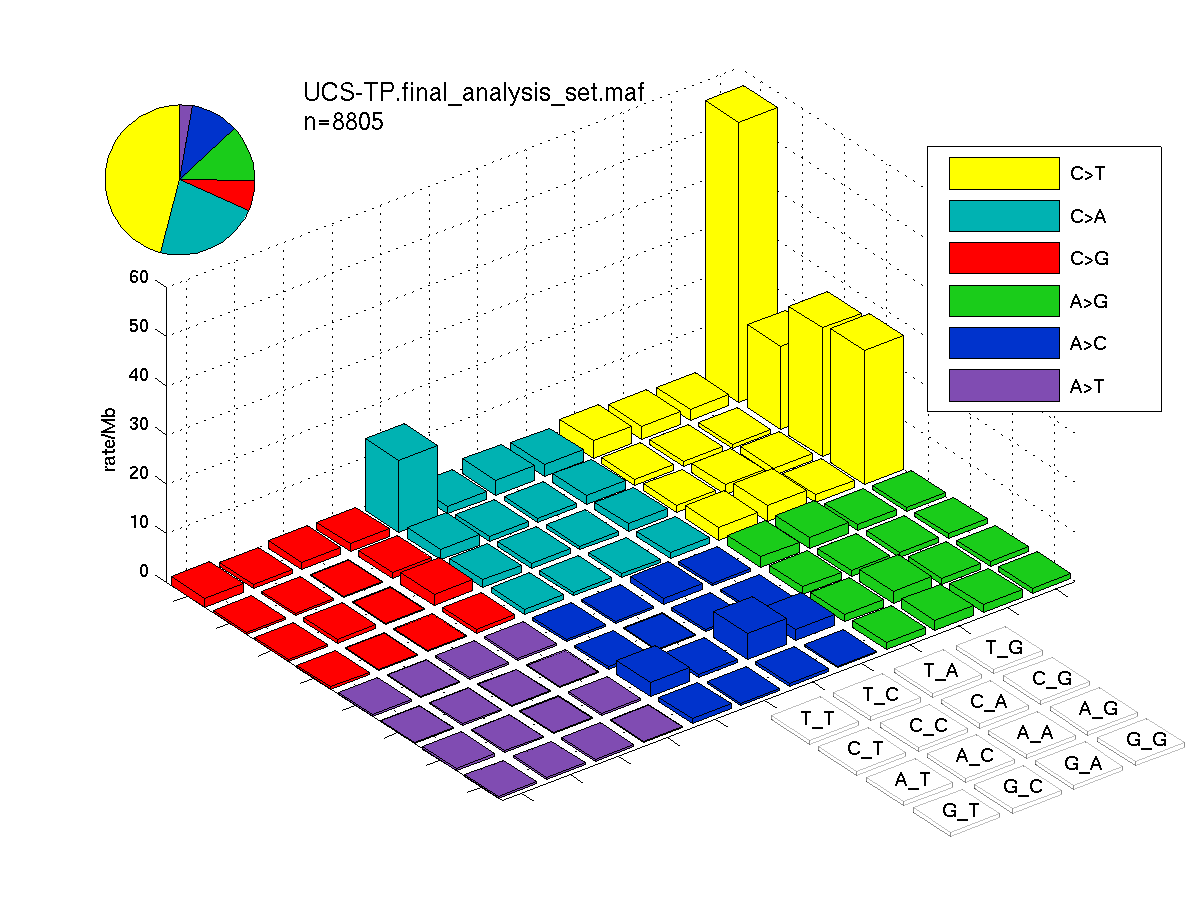
Figure 4. Get High-res Image SNV Mutation rate lego plots for 4 slices of mutation allele fraction (0<=AF<0.1, 0.1<=AF<0.25, 0.25<=AF<0.5, & 0.5<=AF) . The color code and three-base context legends are the same as the previous figure. If this figure is blank, not enough information was provided in the MAF to generate it.
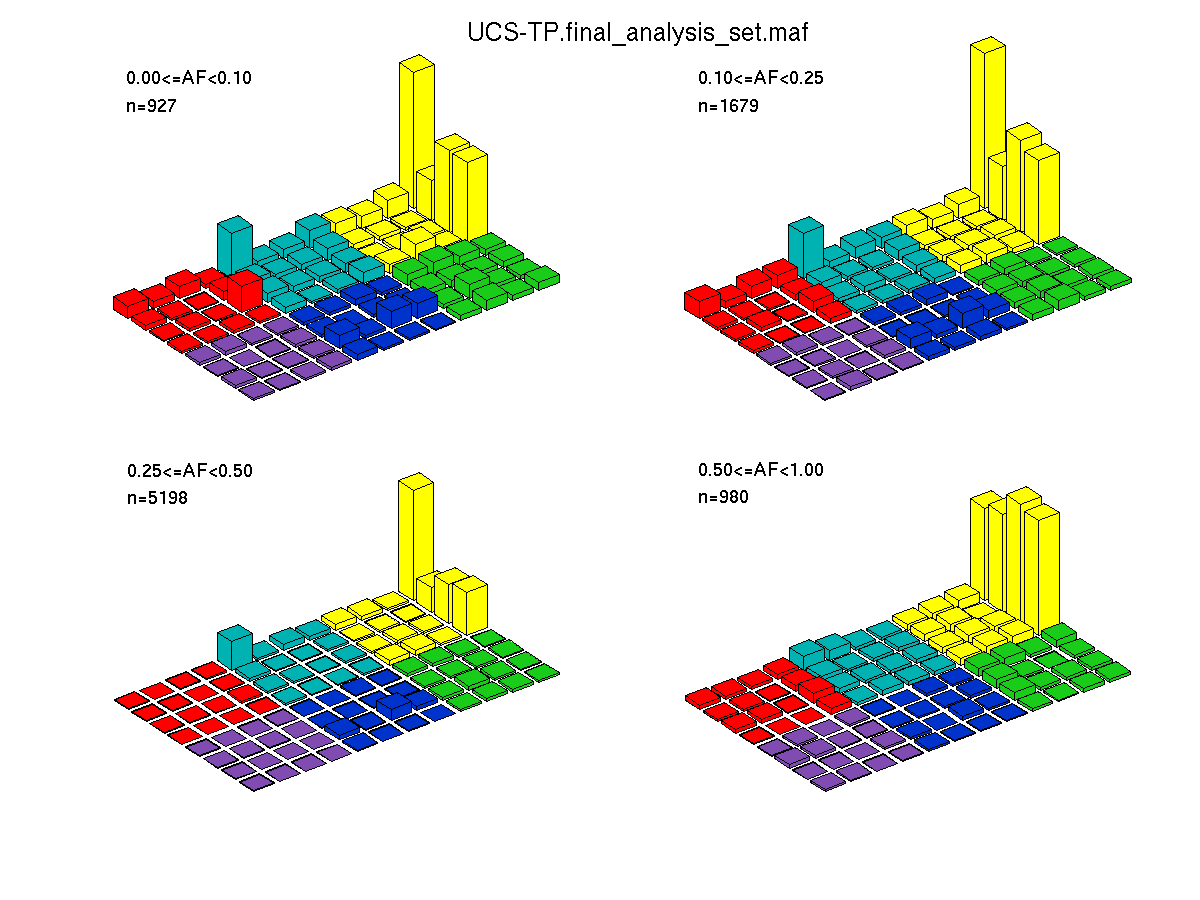
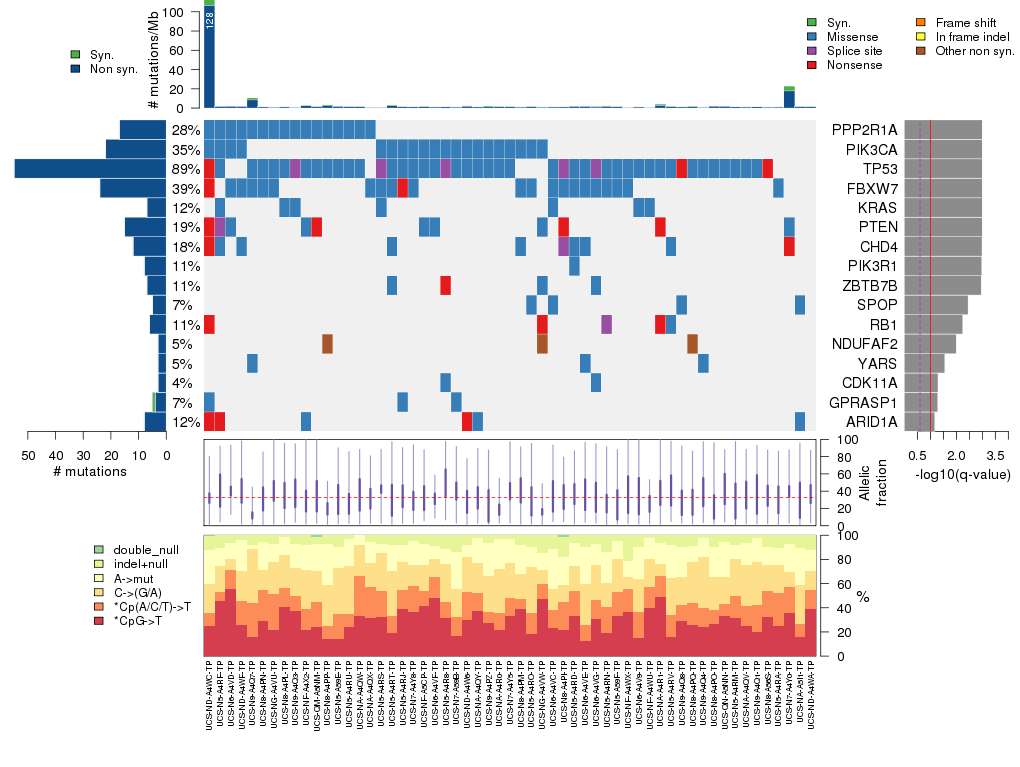
Figure 5. Get High-res Image The matrix in the center of the figure represents individual mutations in patient samples, color-coded by type of mutation, for the significantly mutated genes. The rate of synonymous and non-synonymous mutations is displayed at the top of the matrix. The barplot on the left of the matrix shows the number of mutations in each gene. The percentages represent the fraction of tumors with at least one mutation in the specified gene. The barplot to the right of the matrix displays the q-values for the most significantly mutated genes. The purple boxplots below the matrix (only displayed if required columns are present in the provided MAF) represent the distributions of allelic fractions observed in each sample. The plot at the bottom represents the base substitution distribution of individual samples, using the same categories that were used to calculate significance.
Column Descriptions:
-
N = number of sequenced bases in this gene across the individual set
-
n = number of (nonsilent) mutations in this gene across the individual set
-
npat = number of patients (individuals) with at least one nonsilent mutation
-
nsite = number of unique sites having a non-silent mutation
-
nsil = number of silent mutations in this gene across the individual set
-
n1 = number of nonsilent mutations of type: *CpG->T
-
n2 = number of nonsilent mutations of type: *Cp(A/C/T)->T
-
n3 = number of nonsilent mutations of type: C->(G/A)
-
n4 = number of nonsilent mutations of type: A->mut
-
n5 = number of nonsilent mutations of type: indel+null
-
n6 = number of nonsilent mutations of type: double_null
-
p_classic = p-value for the observed amount of nonsilent mutations being elevated in this gene
-
p_ns_s = p-value for the observed nonsilent/silent ratio being elevated in this gene
-
p_cons = p-value for enrichment of mutations at evolutionarily most-conserved sites in gene
-
p_joint = p-value for clustering + conservation
-
p = p-value (overall)
-
q = q-value, False Discovery Rate (Benjamini-Hochberg procedure)
Table 3. Get Full Table A Ranked List of Significantly Mutated Genes. Number of significant genes found: 16. Number of genes displayed: 35. Click on a gene name to display its stick figure depicting the distribution of mutations and mutation types across the chosen gene (this feature may not be available for all significant genes).
| rank | gene | description | N | n | npat | nsite | nsil | n1 | n2 | n3 | n4 | n5 | n6 | p_classic | p_ns_s | p_clust | p_cons | p_joint | p | q |
|---|---|---|---|---|---|---|---|---|---|---|---|---|---|---|---|---|---|---|---|---|
| 1 | PPP2R1A | protein phosphatase 2 (formerly 2A), regulatory subunit A , alpha isoform | 99487 | 17 | 16 | 10 | 0 | 7 | 3 | 7 | 0 | 0 | 0 | 6.6e-15 | 0.0015 | 0.000055 | 0.018 | 0.000029 | 0.000 | 0.000 |
| 2 | PIK3CA | phosphoinositide-3-kinase, catalytic, alpha polypeptide | 186411 | 22 | 20 | 13 | 0 | 3 | 5 | 4 | 10 | 0 | 0 | 5.8e-15 | 0.0057 | 0.012 | 0.0027 | 0.00074 | 2.22e-16 | 2.01e-12 |
| 3 | TP53 | tumor protein p53 | 68846 | 55 | 51 | 43 | 0 | 14 | 5 | 11 | 12 | 12 | 1 | 3.1e-15 | 6.6e-07 | 0 | 0 | 0 | <1.00e-15 | <3.62e-12 |
| 4 | FBXW7 | F-box and WD repeat domain containing 7 | 139842 | 24 | 22 | 15 | 0 | 12 | 4 | 5 | 1 | 2 | 0 | 4.1e-15 | 0.0031 | 2e-07 | 0.001 | 0 | <1.00e-15 | <3.62e-12 |
| 5 | KRAS | v-Ki-ras2 Kirsten rat sarcoma viral oncogene homolog | 36696 | 7 | 7 | 2 | 0 | 0 | 2 | 5 | 0 | 0 | 0 | 8.6e-15 | 0.35 | 0 | 0.047 | 0 | <1.00e-15 | <3.62e-12 |
| 6 | PTEN | phosphatase and tensin homolog (mutated in multiple advanced cancers 1) | 64171 | 15 | 11 | 14 | 0 | 1 | 2 | 4 | 2 | 5 | 1 | 7.3e-15 | 0.042 | 0.15 | 0.73 | 0.28 | 7.02e-14 | 2.12e-10 |
| 7 | CHD4 | chromodomain helicase DNA binding protein 4 | 336006 | 12 | 10 | 12 | 0 | 2 | 1 | 0 | 6 | 3 | 0 | 8.9e-09 | 0.037 | 0.089 | 0.037 | 0.053 | 1.06e-08 | 2.74e-05 |
| 8 | PIK3R1 | phosphoinositide-3-kinase, regulatory subunit 1 (alpha) | 134194 | 8 | 6 | 8 | 0 | 0 | 1 | 0 | 0 | 7 | 0 | 3.1e-08 | 0.69 | 0.02 | 0.56 | 0.042 | 2.78e-08 | 6.30e-05 |
| 9 | ZBTB7B | zinc finger and BTB domain containing 7B | 92321 | 7 | 6 | 7 | 0 | 1 | 0 | 2 | 1 | 3 | 0 | 2.4e-08 | 0.25 | 0.38 | 0.022 | 0.077 | 3.88e-08 | 7.81e-05 |
| 10 | SPOP | speckle-type POZ protein | 66102 | 5 | 4 | 5 | 0 | 1 | 0 | 2 | 2 | 0 | 0 | 3.7e-06 | 0.35 | 0.018 | 0.12 | 0.022 | 1.38e-06 | 0.00250 |
| 11 | RB1 | retinoblastoma 1 (including osteosarcoma) | 133287 | 6 | 6 | 6 | 0 | 0 | 0 | 0 | 1 | 4 | 1 | 1.7e-07 | 0.4 | 0.78 | 0.7 | 1 | 2.87e-06 | 0.00473 |
| 12 | NDUFAF2 | NADH dehydrogenase (ubiquinone) 1 alpha subcomplex, assembly factor 2 | 23615 | 3 | 3 | 1 | 0 | 0 | 0 | 0 | 0 | 3 | 0 | 6e-06 | 0.29 | NaN | NaN | NaN | 5.98e-06 | 0.00903 |
| 13 | YARS | tyrosyl-tRNA synthetase | 92520 | 3 | 3 | 3 | 0 | 1 | 0 | 2 | 0 | 0 | 0 | 0.00059 | 0.45 | 0.0018 | 0.3 | 0.0022 | 1.93e-05 | 0.0270 |
| 14 | CDK11A | cyclin-dependent kinase 11A | 72275 | 3 | 2 | 3 | 0 | 1 | 0 | 1 | 1 | 0 | 0 | 0.0045 | 0.47 | 0.0036 | 0.022 | 0.00062 | 3.83e-05 | 0.0496 |
| 15 | GPRASP1 | G protein-coupled receptor associated sorting protein 1 | 238270 | 4 | 4 | 4 | 1 | 1 | 1 | 1 | 0 | 1 | 0 | 0.0008 | 0.8 | 0.0015 | 0.31 | 0.004 | 4.31e-05 | 0.0521 |
| 16 | ARID1A | AT rich interactive domain 1A (SWI-like) | 336825 | 8 | 7 | 8 | 0 | 1 | 0 | 2 | 1 | 3 | 1 | 4.4e-06 | 0.16 | 0.49 | 0.81 | 1 | 5.89e-05 | 0.0667 |
| 17 | MGAM | maltase-glucoamylase (alpha-glucosidase) | 289007 | 7 | 6 | 7 | 1 | 2 | 1 | 1 | 2 | 1 | 0 | 9.2e-06 | 0.34 | 0.99 | 0.59 | 1 | 0.000116 | 0.124 |
| 18 | MAGEC2 | melanoma antigen family C, 2 | 64182 | 5 | 4 | 5 | 0 | 0 | 1 | 4 | 0 | 0 | 0 | 0.000016 | 0.3 | 0.61 | 0.95 | 0.8 | 0.000152 | 0.153 |
| 19 | FAM92B | family with sequence similarity 92, member B | 52370 | 3 | 3 | 3 | 0 | 0 | 1 | 1 | 0 | 1 | 0 | 0.0003 | 0.35 | 0.35 | 0.015 | 0.044 | 0.000163 | 0.155 |
| 20 | ALCAM | activated leukocyte cell adhesion molecule | 103047 | 3 | 3 | 3 | 0 | 0 | 0 | 1 | 1 | 1 | 0 | 0.00026 | 0.67 | 0.027 | 0.54 | 0.057 | 0.000178 | 0.162 |
| 21 | HCFC1R1 | host cell factor C1 regulator 1 (XPO1 dependent) | 18746 | 2 | 2 | 2 | 0 | 0 | 0 | 0 | 0 | 2 | 0 | 0.000047 | 1 | 0.21 | 0.61 | 0.35 | 0.000197 | 0.170 |
| 22 | DPP10 | dipeptidyl-peptidase 10 | 138928 | 5 | 4 | 5 | 1 | 0 | 0 | 2 | 2 | 1 | 0 | 0.00047 | 0.64 | 0.017 | 0.77 | 0.039 | 0.000217 | 0.174 |
| 23 | BCL2L11 | BCL2-like 11 (apoptosis facilitator) | 34712 | 2 | 2 | 1 | 0 | 0 | 0 | 0 | 0 | 2 | 0 | 0.0003 | 1 | 0.012 | 0.096 | 0.062 | 0.000220 | 0.174 |
| 24 | TREX2 | three prime repair exonuclease 2 | 22043 | 2 | 2 | 2 | 0 | 0 | 2 | 0 | 0 | 0 | 0 | 0.00024 | 0.27 | NaN | NaN | NaN | 0.000235 | 0.177 |
| 25 | U2AF1 | U2 small nuclear RNA auxiliary factor 1 | 46802 | 2 | 2 | 1 | 0 | 0 | 2 | 0 | 0 | 0 | 0 | 0.00081 | 0.38 | 0.016 | 0.0084 | 0.031 | 0.000289 | 0.209 |
| 26 | ATP4A | ATPase, H+/K+ exchanging, alpha polypeptide | 177895 | 5 | 5 | 5 | 0 | 3 | 0 | 1 | 0 | 1 | 0 | 0.000048 | 0.19 | 0.93 | 0.82 | 1 | 0.000522 | 0.364 |
| 27 | SYCP2 | synaptonemal complex protein 2 | 241280 | 4 | 4 | 4 | 0 | 0 | 1 | 1 | 2 | 0 | 0 | 0.0016 | 0.42 | 0.085 | 0.034 | 0.037 | 0.000653 | 0.438 |
| 28 | COPB1 | coatomer protein complex, subunit beta 1 | 160279 | 4 | 4 | 4 | 0 | 1 | 2 | 1 | 0 | 0 | 0 | 0.00055 | 0.36 | 0.098 | 0.66 | 0.12 | 0.000678 | 0.439 |
| 29 | PDGFRB | platelet-derived growth factor receptor, beta polypeptide | 189225 | 4 | 4 | 4 | 1 | 1 | 1 | 1 | 1 | 0 | 0 | 0.00099 | 0.52 | 0.29 | 0.045 | 0.088 | 0.000907 | 0.567 |
| 30 | FOXA2 | forkhead box A2 | 64487 | 3 | 3 | 3 | 0 | 1 | 0 | 1 | 0 | 1 | 0 | 0.00023 | 0.32 | 0.27 | 0.83 | 0.42 | 0.000981 | 0.592 |
| 31 | ERBB3 | v-erb-b2 erythroblastic leukemia viral oncogene homolog 3 (avian) | 239091 | 5 | 4 | 5 | 0 | 2 | 1 | 1 | 0 | 1 | 0 | 0.0005 | 0.21 | 0.64 | 0.07 | 0.22 | 0.00110 | 0.645 |
| 32 | TMUB2 | transmembrane and ubiquitin-like domain containing 2 | 53523 | 3 | 3 | 3 | 0 | 2 | 1 | 0 | 0 | 0 | 0 | 0.00054 | 0.31 | 0.8 | 0.054 | 0.24 | 0.00130 | 0.735 |
| 33 | MAMLD1 | mastermind-like domain containing 1 | 135529 | 4 | 4 | 3 | 0 | 0 | 0 | 1 | 2 | 1 | 0 | 0.0004 | 0.49 | 0.22 | 0.58 | 0.34 | 0.00134 | 0.736 |
| 34 | SLC10A6 | solute carrier family 10 (sodium/bile acid cotransporter family), member 6 | 65602 | 3 | 2 | 3 | 0 | 0 | 2 | 0 | 0 | 1 | 0 | 0.01 | 0.4 | 0.061 | 0.0088 | 0.015 | 0.00154 | 0.800 |
| 35 | MMEL1 | membrane metallo-endopeptidase-like 1 | 117524 | 3 | 3 | 3 | 0 | 1 | 1 | 1 | 0 | 0 | 0 | 0.0015 | 0.27 | 0.042 | 0.54 | 0.1 | 0.00154 | 0.800 |
Figure S1. This figure depicts the distribution of mutations and mutation types across the PPP2R1A significant gene.
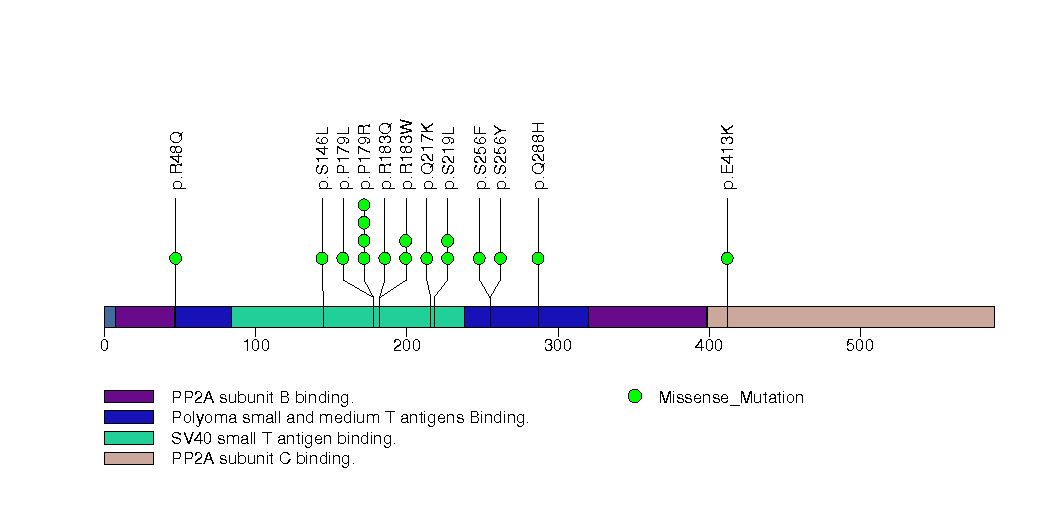
Figure S2. This figure depicts the distribution of mutations and mutation types across the PIK3CA significant gene.
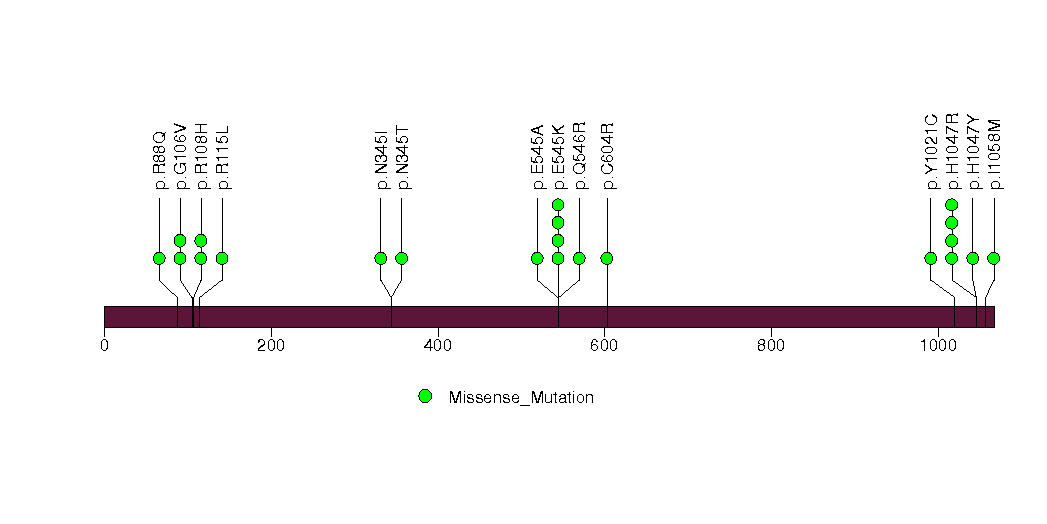
Figure S3. This figure depicts the distribution of mutations and mutation types across the TP53 significant gene.
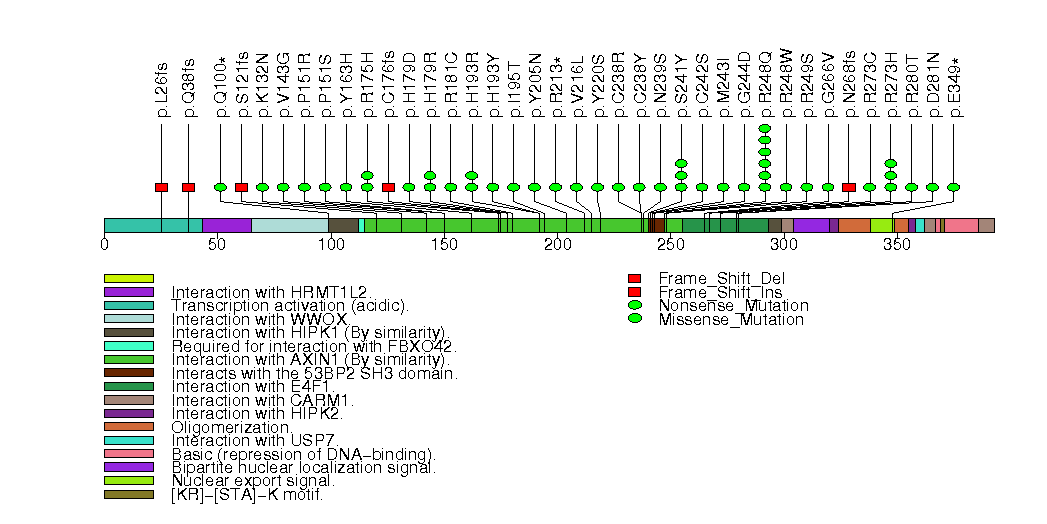
Figure S4. This figure depicts the distribution of mutations and mutation types across the FBXW7 significant gene.
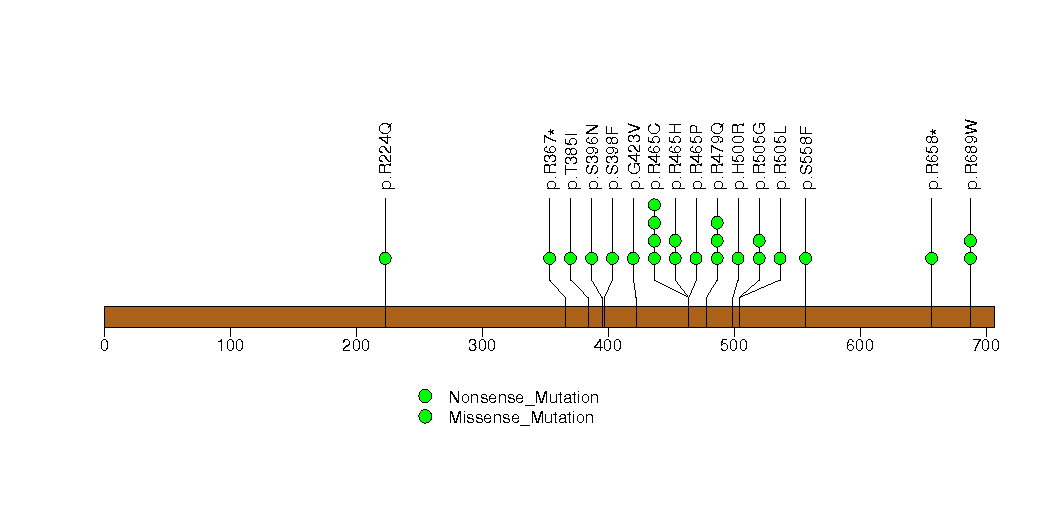
Figure S5. This figure depicts the distribution of mutations and mutation types across the KRAS significant gene.
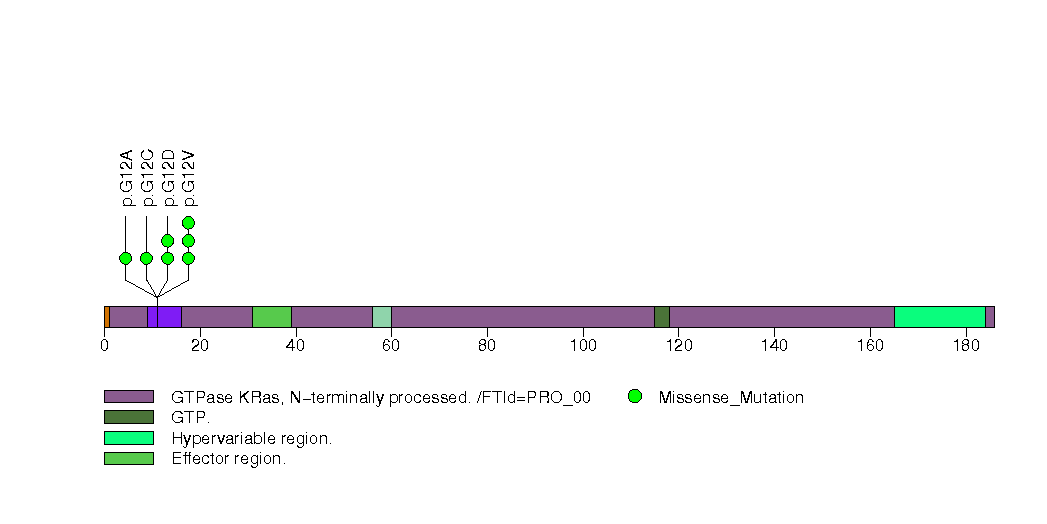
Figure S6. This figure depicts the distribution of mutations and mutation types across the PTEN significant gene.
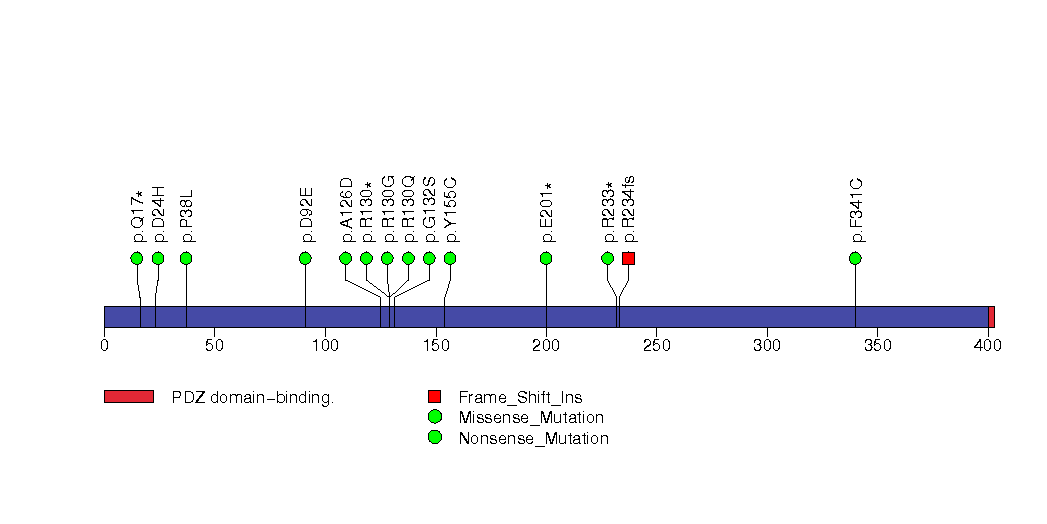
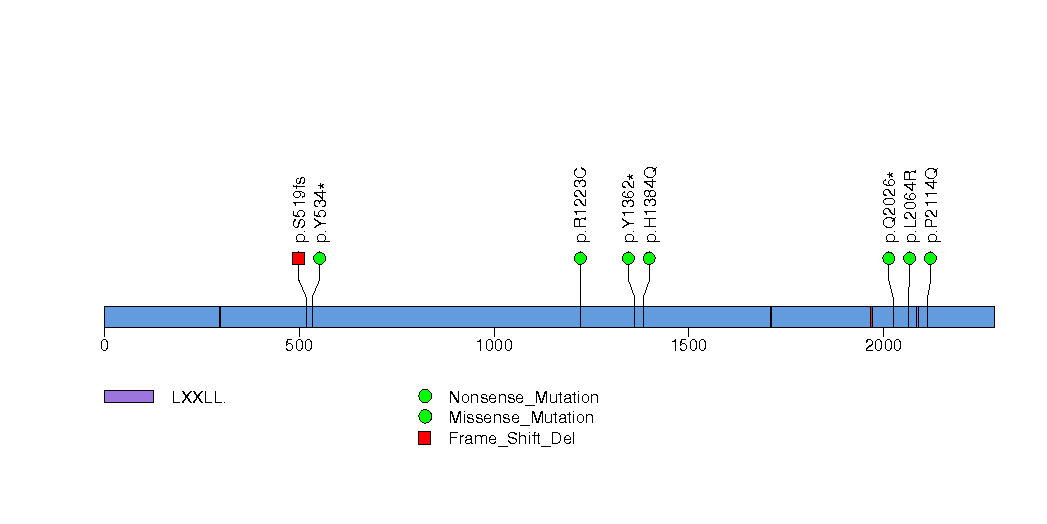
Figure S7. This figure depicts the distribution of mutations and mutation types across the CHD4 significant gene.
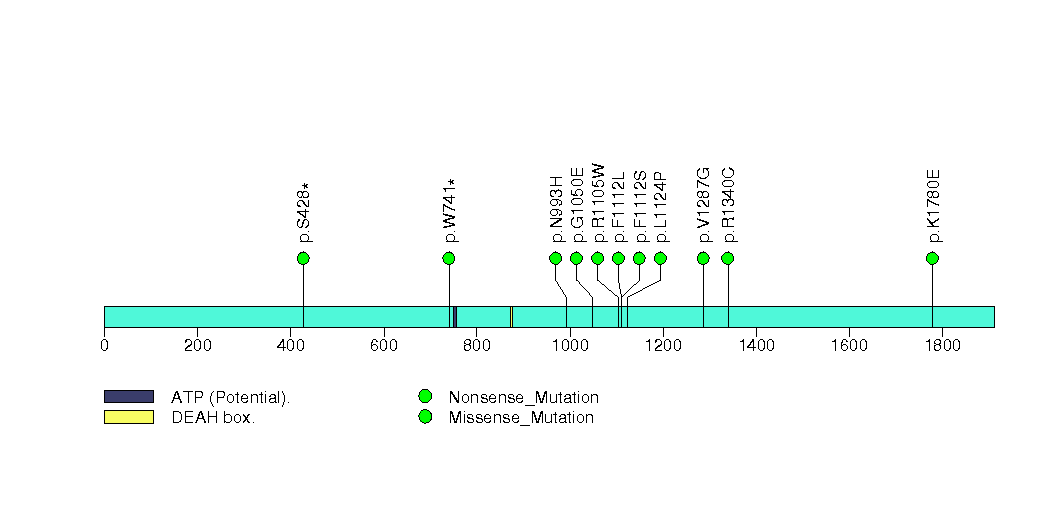
Figure S8. This figure depicts the distribution of mutations and mutation types across the PIK3R1 significant gene.
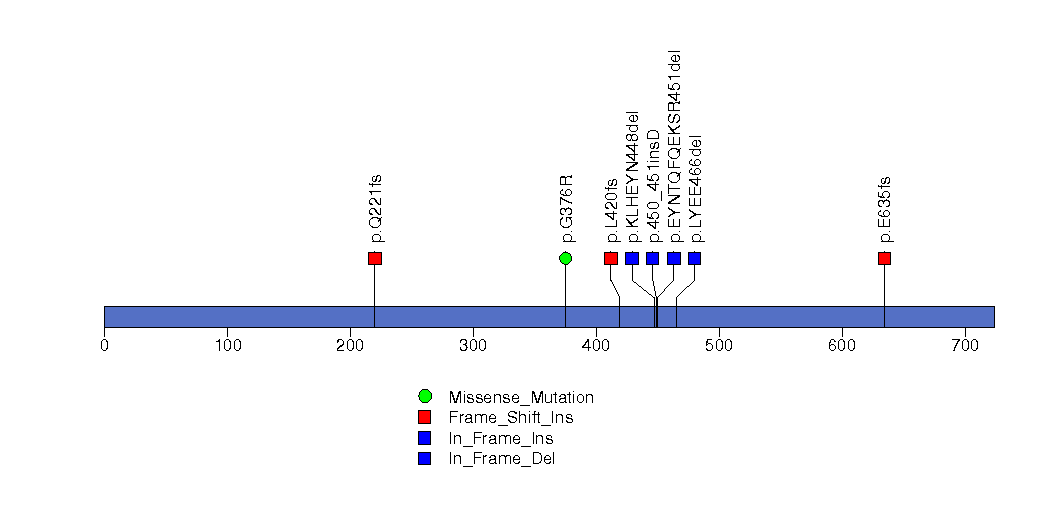
Figure S9. This figure depicts the distribution of mutations and mutation types across the ZBTB7B significant gene.
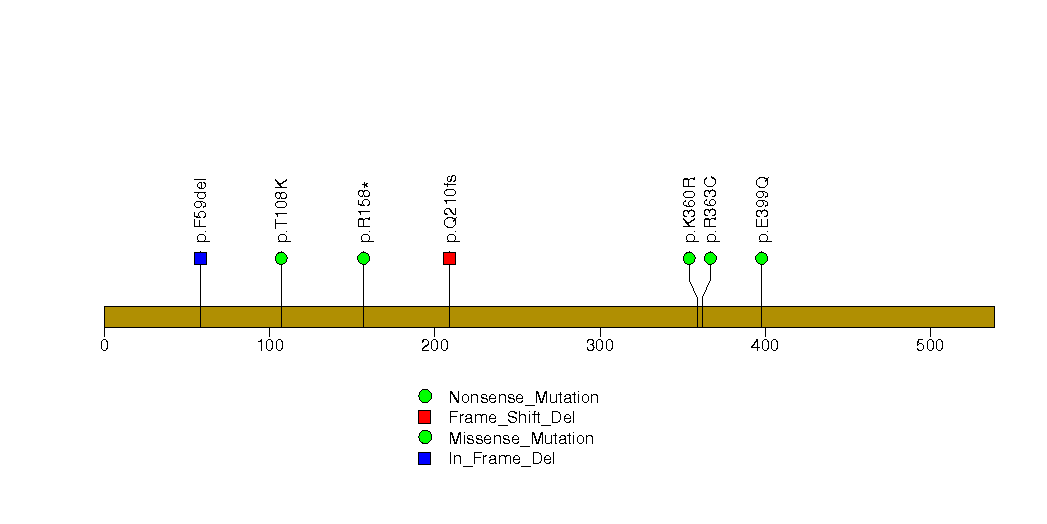
Figure S10. This figure depicts the distribution of mutations and mutation types across the SPOP significant gene.
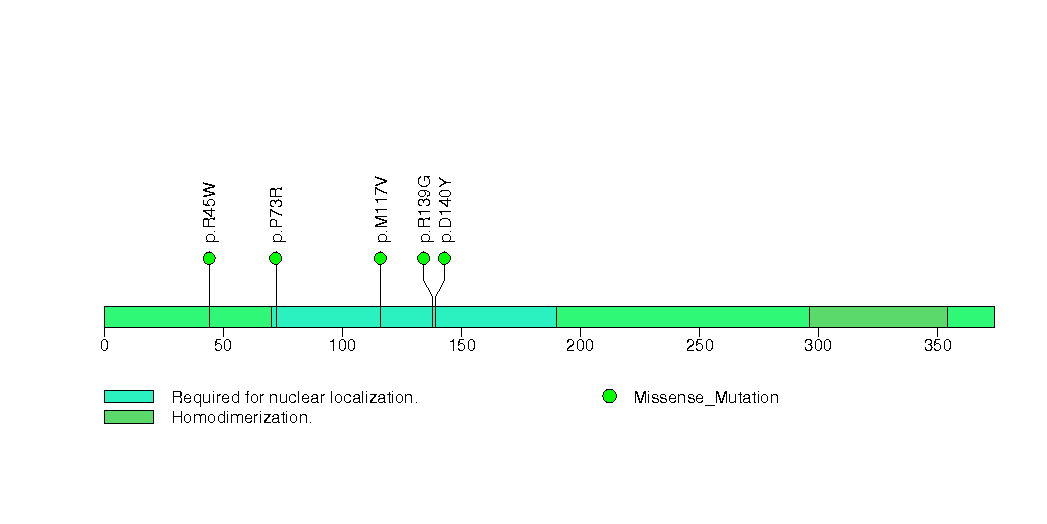
Figure S11. This figure depicts the distribution of mutations and mutation types across the RB1 significant gene.
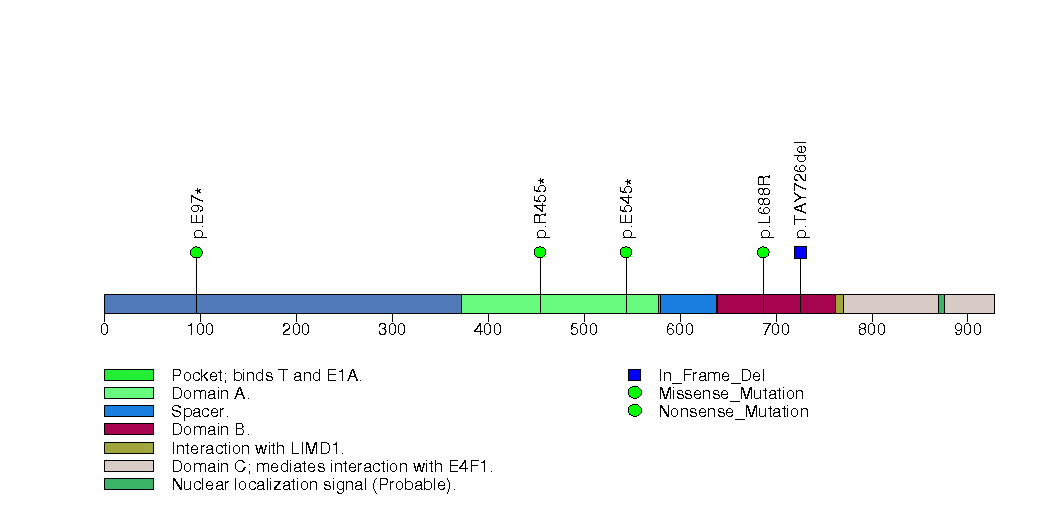
Figure S12. This figure depicts the distribution of mutations and mutation types across the YARS significant gene.
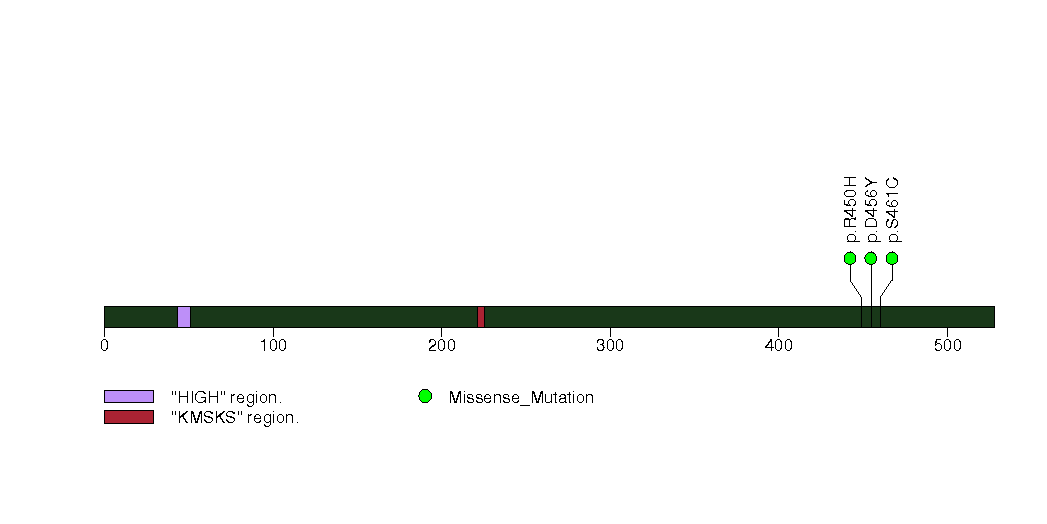
Figure S13. This figure depicts the distribution of mutations and mutation types across the CDK11A significant gene.
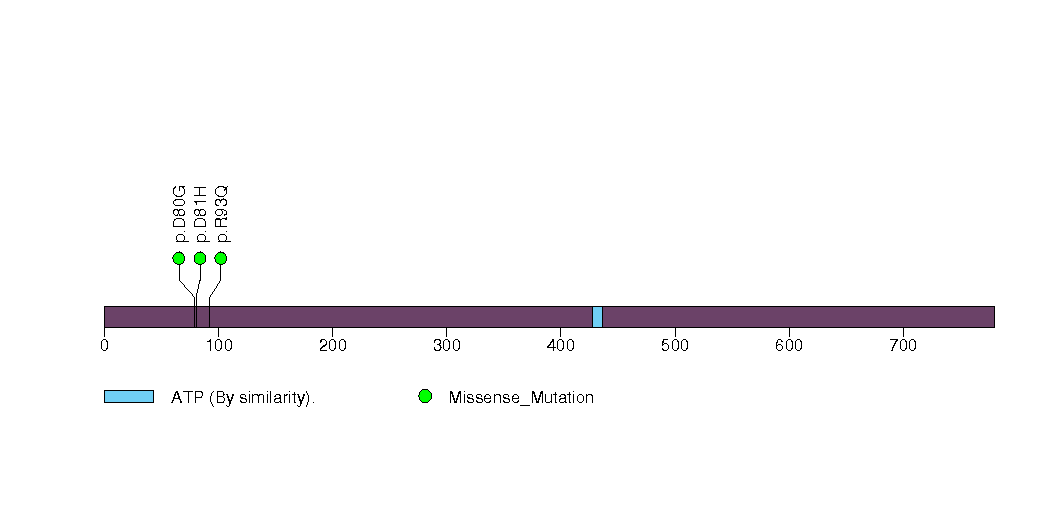
Figure S14. This figure depicts the distribution of mutations and mutation types across the GPRASP1 significant gene.
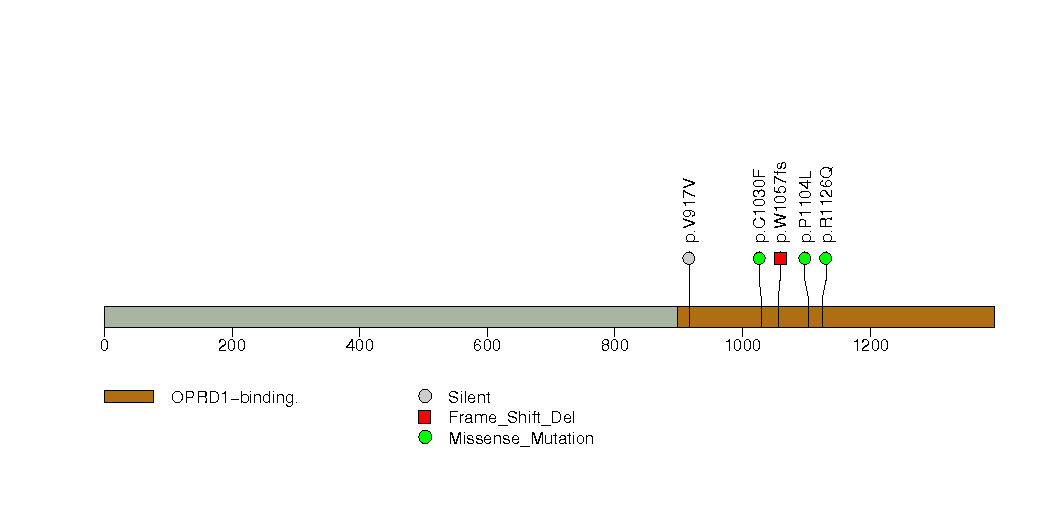
Figure S15. This figure depicts the distribution of mutations and mutation types across the ARID1A significant gene.
In this analysis, COSMIC is used as a filter to increase power by restricting the territory of each gene. Cosmic version: v48.
Table 4. Get Full Table Significantly mutated genes (COSMIC territory only). To access the database please go to: COSMIC. Number of significant genes found: 12. Number of genes displayed: 10
| rank | gene | description | n | cos | n_cos | N_cos | cos_ev | p | q |
|---|---|---|---|---|---|---|---|---|---|
| 1 | KRAS | v-Ki-ras2 Kirsten rat sarcoma viral oncogene homolog | 7 | 52 | 7 | 2964 | 101988 | 9e-14 | 3.5e-10 |
| 2 | FBXW7 | F-box and WD repeat domain containing 7 | 24 | 91 | 19 | 5187 | 788 | 1.6e-13 | 3.5e-10 |
| 3 | PIK3CA | phosphoinositide-3-kinase, catalytic, alpha polypeptide | 22 | 220 | 20 | 12540 | 8438 | 3.7e-13 | 5.5e-10 |
| 4 | TP53 | tumor protein p53 | 55 | 356 | 52 | 20292 | 16225 | 5.7e-13 | 6.5e-10 |
| 5 | PTEN | phosphatase and tensin homolog (mutated in multiple advanced cancers 1) | 15 | 767 | 15 | 43719 | 769 | 1.1e-12 | 1e-09 |
| 6 | PIK3R1 | phosphoinositide-3-kinase, regulatory subunit 1 (alpha) | 8 | 33 | 4 | 1881 | 9 | 1.8e-10 | 1.4e-07 |
| 7 | ERBB3 | v-erb-b2 erythroblastic leukemia viral oncogene homolog 3 (avian) | 5 | 6 | 2 | 342 | 2 | 1.1e-06 | 0.00071 |
| 8 | RB1 | retinoblastoma 1 (including osteosarcoma) | 6 | 267 | 3 | 15219 | 10 | 0.000046 | 0.026 |
| 9 | F13A1 | coagulation factor XIII, A1 polypeptide | 1 | 1 | 1 | 57 | 1 | 0.00025 | 0.093 |
| 10 | FERD3L | Fer3-like (Drosophila) | 2 | 1 | 1 | 57 | 1 | 0.00025 | 0.093 |
Note:
n - number of (nonsilent) mutations in this gene across the individual set.
cos = number of unique mutated sites in this gene in COSMIC
n_cos = overlap between n and cos.
N_cos = number of individuals times cos.
cos_ev = total evidence: number of reports in COSMIC for mutations seen in this gene.
p = p-value for seeing the observed amount of overlap in this gene)
q = q-value, False Discovery Rate (Benjamini-Hochberg procedure)
Table 5. Get Full Table A Ranked List of Significantly Mutated Genesets. (Source: MSigDB GSEA Cannonical Pathway Set).Number of significant genesets found: 103. Number of genesets displayed: 10
| rank | geneset | description | genes | N_genes | mut_tally | N | n | npat | nsite | nsil | n1 | n2 | n3 | n4 | n5 | n6 | p_ns_s | p | q |
|---|---|---|---|---|---|---|---|---|---|---|---|---|---|---|---|---|---|---|---|
| 1 | ARFPATHWAY | Cyclin-dependent kinase inhibitor 2A is a tumor suppressor that induces G1 arrest and can activate the p53 pathway, leading to G2/M arrest. | ABL1, CDKN2A, E2F1, MDM2, MYC, PIK3CA, PIK3R1, POLR1A, POLR1B, POLR1C, POLR1D, RAC1, RB1, TBX2, TP53, TWIST1 | 16 | ABL1(1), CDKN2A(1), E2F1(1), MYC(2), PIK3CA(22), PIK3R1(8), POLR1A(2), POLR1B(1), RAC1(1), RB1(6), TBX2(1), TP53(55) | 1719962 | 101 | 55 | 80 | 1 | 22 | 11 | 17 | 25 | 24 | 2 | 1.2e-10 | <1.00e-15 | <9.37e-14 |
| 2 | CHEMICALPATHWAY | DNA damage promotes Bid cleavage, which stimulates mitochondrial cytochrome c release and consequent caspase activation, resulting in apoptosis. | ADPRT, AKT1, APAF1, ATM, BAD, BAX, BCL2, BCL2L1, BID, CASP3, CASP6, CASP7, CASP9, CYCS, EIF2S1, PRKCA, PRKCB1, PTK2, PXN, STAT1, TLN1, TP53 | 20 | APAF1(2), ATM(3), BCL2L1(1), CASP7(1), EIF2S1(1), PXN(1), STAT1(1), TP53(55) | 2302234 | 65 | 53 | 53 | 2 | 16 | 6 | 14 | 13 | 15 | 1 | 4.3e-06 | <1.00e-15 | <9.37e-14 |
| 3 | SA_G1_AND_S_PHASES | Cdk2, 4, and 6 bind cyclin D in G1, while cdk2/cyclin E promotes the G1/S transition. | ARF1, ARF3, CCND1, CDK2, CDK4, CDKN1A, CDKN1B, CDKN2A, CFL1, E2F1, E2F2, MDM2, NXT1, PRB1, TP53 | 15 | CCND1(1), CDKN2A(1), E2F1(1), TP53(55) | 728452 | 58 | 52 | 46 | 0 | 15 | 6 | 12 | 12 | 12 | 1 | 9e-08 | <1.00e-15 | <9.37e-14 |
| 4 | CDC42RACPATHWAY | PI3 kinase stimulates cell migration by activating cdc42, which activates ARP2/3, which in turn promotes formation of new actin fibers. | ACTR2, ACTR3, ARHA, ARPC1A, ARPC1B, ARPC2, ARPC3, ARPC4, CDC42, PAK1, PDGFRA, PIK3CA, PIK3R1, RAC1, WASL | 14 | ACTR3(1), PIK3CA(22), PIK3R1(8), RAC1(1), WASL(1) | 1132069 | 33 | 27 | 24 | 1 | 4 | 6 | 5 | 11 | 7 | 0 | 0.0047 | <1.00e-15 | <9.37e-14 |
| 5 | EDG1PATHWAY | The lipid S1P is an EDG1 ligand promoting chemotaxis via Rac1 and cell survival and proliferation via ERK activation. | ADCY1, AKT1, ARHA, ASAH1, EDG1, GNAI1, GNB1, GNGT1, ITGAV, ITGB3, MAPK1, MAPK3, PDGFA, PDGFRA, PIK3CA, PIK3R1, PLCB1, PRKCA, PRKCB1, PTK2, RAC1, SKIP, SMPD1, SMPD2, SPHK1, SRC | 22 | GNB1(1), ITGAV(1), PIK3CA(22), PIK3R1(8), RAC1(1) | 2322413 | 33 | 27 | 24 | 1 | 4 | 6 | 5 | 11 | 7 | 0 | 0.003 | <1.00e-15 | <9.37e-14 |
| 6 | PTENPATHWAY | PTEN suppresses AKT-induced cell proliferation and antagonizes the action of PI3K. | AKT1, BCAR1, CDKN1B, FOXO3A, GRB2, ILK, ITGB1, MAPK1, MAPK3, PDK2, PDPK1, PIK3CA, PIK3R1, PTEN, PTK2, SHC1, SOS1, TNFSF6 | 16 | ITGB1(1), PDK2(1), PIK3CA(22), PIK3R1(8), PTEN(15) | 1630880 | 47 | 30 | 37 | 0 | 4 | 8 | 9 | 13 | 12 | 1 | 0.000015 | 1.44e-15 | 9.37e-14 |
| 7 | APOPTOSIS_GENMAPP | APAF1, BAK1, BCL2L7P1, BAX, BCL2, BCL2L1, BID, BIRC2, BIRC3, BIRC4, CASP2, CASP3, CASP6, CASP7, CASP8, CASP9, CYCS, FADD, FAS, FASLG, GZMB, IKBKG, JUN, MAP2K4, MAP3K1, MAP3K14, MAPK10, MCL1, MDM2, MYC, NFKB1, NFKBIA, PARP1, PRF1, RELA, RIPK1, TNF, TNFRSF1A, TNFRSF1B, TNFSF10, TP53, TRADD, TRAF1, TRAF2 | 41 | APAF1(2), BCL2L1(1), CASP7(1), CASP8(2), GZMB(1), MAP2K4(1), MAP3K1(1), MAPK10(1), MYC(2), TP53(55) | 3179857 | 67 | 52 | 55 | 5 | 18 | 6 | 12 | 13 | 17 | 1 | 0.000058 | 1.55e-15 | 9.37e-14 | |
| 8 | ST_JNK_MAPK_PATHWAY | JNKs are MAP kinases regulated by several levels of kinases (MAPKK, MAPKKK) and phosphorylate transcription factors and regulatory proteins. | AKT1, ATF2, CDC42, DLD, DUSP10, DUSP4, DUSP8, GAB1, GADD45A, GCK, IL1R1, JUN, MAP2K4, MAP2K5, MAP2K7, MAP3K1, MAP3K10, MAP3K11, MAP3K12, MAP3K13, MAP3K2, MAP3K3, MAP3K4, MAP3K5, MAP3K7, MAP3K7IP1, MAP3K7IP2, MAP3K9, MAPK10, MAPK7, MAPK8, MAPK9, MYEF2, NFATC3, NR2C2, PAPPA, SHC1, TP53, TRAF6, ZAK | 38 | GAB1(1), GCK(1), IL1R1(1), MAP2K4(1), MAP3K1(1), MAP3K4(4), MAP3K5(2), MAP3K9(1), MAPK10(1), MAPK7(1), MAPK9(1), PAPPA(1), TP53(55), ZAK(1) | 4282008 | 72 | 52 | 60 | 8 | 18 | 5 | 16 | 15 | 17 | 1 | 0.0026 | 1.55e-15 | 9.37e-14 |
| 9 | ATRBRCAPATHWAY | BRCA1 and 2 block cell cycle progression in response to DNA damage and promote double-stranded break repair; mutations induce breast cancer susceptibility. | ATM, ATR, BRCA1, BRCA2, CHEK1, CHEK2, FANCA, FANCC, FANCD2, FANCE, FANCF, FANCG, HUS1, MRE11A, NBS1, RAD1, RAD17, RAD50, RAD51, RAD9A, TP53, TREX1 | 21 | ATM(3), ATR(3), BRCA2(4), CHEK2(2), FANCC(1), FANCD2(1), FANCE(1), FANCF(1), FANCG(1), HUS1(1), MRE11A(1), RAD9A(1), TP53(55) | 3685680 | 75 | 52 | 63 | 4 | 16 | 7 | 18 | 18 | 15 | 1 | 0.000074 | 2.22e-15 | 9.37e-14 |
| 10 | IGF1PATHWAY | Growth factor IGF-1 stimulates growth and inhibits apoptosis by activating the MAP kinase pathway in a variety of cell types. | CSNK2A1, ELK1, FOS, GRB2, HRAS, IGF1, IGF1R, IRS1, JUN, MAP2K1, MAPK3, MAPK8, PIK3CA, PIK3R1, PTPN11, RAF1, RASA1, SHC1, SOS1, SRF | 20 | IRS1(2), PIK3CA(22), PIK3R1(8), PTPN11(1), RASA1(1) | 2121354 | 34 | 27 | 25 | 2 | 3 | 6 | 5 | 11 | 9 | 0 | 0.011 | 2.33e-15 | 9.37e-14 |
Table 6. Get Full Table A Ranked List of Significantly Mutated Genesets (Excluding Significantly Mutated Genes). Number of significant genesets found: 0. Number of genesets displayed: 10
| rank | geneset | description | genes | N_genes | mut_tally | N | n | npat | nsite | nsil | n1 | n2 | n3 | n4 | n5 | n6 | p_ns_s | p | q |
|---|---|---|---|---|---|---|---|---|---|---|---|---|---|---|---|---|---|---|---|
| 1 | ACTINYPATHWAY | The Arp 2/3 complex localizes to the Y-junction of polymerizing actin fibers that enable lamellipod extension and consequent cell motility. | ABI-2, ACTA1, ACTR2, ACTR3, ARPC1A, ARPC1B, ARPC2, ARPC3, ARPC4, NCK1, NCKAP1, NTRK1, PIR, PSMA7, RAC1, WASF1, WASF2, WASF3, WASL | 18 | ACTA1(1), ACTR3(1), NCK1(2), NCKAP1(3), NTRK1(2), PSMA7(1), RAC1(1), WASF1(1), WASF3(1), WASL(1) | 1290167 | 14 | 9 | 14 | 1 | 5 | 1 | 4 | 1 | 3 | 0 | 0.074 | 0.0018 | 0.96 |
| 2 | IL5PATHWAY | Pro-inflammatory IL-5 is secretes by activated T cells, eosinophils, and mast cells, and stimulates the proliferation and activation of eosinophils in bone marrow. | CCL11, CCR3, CD4, HLA-DRA, HLA-DRB1, IL1B, IL4, IL5, IL5RA, IL6 | 10 | CCR3(2), HLA-DRA(1), IL1B(2), IL5RA(1) | 453522 | 6 | 5 | 6 | 0 | 2 | 1 | 3 | 0 | 0 | 0 | 0.14 | 0.004 | 0.96 |
| 3 | CTLA4PATHWAY | T cell activation requires interaction with an antigen-MHC-I complex on an antigen-presenting cell (APC), as well as CD28 interaction with the APC's CD80 or 86. | CD28, CD3D, CD3E, CD3G, CD3Z, CD80, CD86, CTLA4, GRB2, HLA-DRA, HLA-DRB1, ICOS, ICOSL, IL2, ITK, LCK, PIK3CA, PIK3R1, PTPN11, TRA@, TRB@ | 15 | CD3E(1), CD80(2), CD86(1), HLA-DRA(1), IL2(1), ITK(1), PTPN11(1) | 765001 | 8 | 6 | 8 | 0 | 3 | 2 | 1 | 2 | 0 | 0 | 0.072 | 0.0046 | 0.96 |
| 4 | ASBCELLPATHWAY | B cells require interaction with helper T cells to produce antigen-specific immunoglobulins as a key element of the human immune response. | CD28, CD4, CD80, HLA-DRA, HLA-DRB1, IL10, IL2, IL4, TNFRSF5, TNFRSF6, TNFSF5, TNFSF6 | 8 | CD80(2), HLA-DRA(1), IL2(1) | 337807 | 4 | 4 | 4 | 0 | 2 | 1 | 1 | 0 | 0 | 0 | 0.23 | 0.0074 | 1 |
| 5 | PARKINPATHWAY | In Parkinson's disease, dopaminergic neurons contain Lewy bodies consisting of alpha-synuclein and parkin, an E3 ubiquitin ligase that targets glycosylated alpha-synuclein. | GPR37, PARK2, PNUTL1, SNCA, SNCAIP, UBE2E2, UBE2F, UBE2G1, UBE2G2, UBE2L3, UBE2L6, UBL1 | 10 | GPR37(3), SNCAIP(2), UBE2G1(2) | 546771 | 7 | 5 | 7 | 1 | 2 | 2 | 1 | 1 | 1 | 0 | 0.28 | 0.015 | 1 |
| 6 | SA_PROGRAMMED_CELL_DEATH | Programmed cell death, or apoptosis, eliminates damaged or unneeded cells. | APAF1, BAD, BAK1, BAX, BCL10, BCL2, BCL2L1, BCL2L11, BID, CASP8AP2, CASP9, CES1 | 12 | APAF1(2), BCL10(1), BCL2L1(1), BCL2L11(2) | 919398 | 6 | 6 | 5 | 1 | 2 | 1 | 0 | 0 | 3 | 0 | 0.49 | 0.016 | 1 |
| 7 | TOB1PATHWAY | TGF-beta signaling activates SMADs, which interact with intracellular Tob to maintain unstimulated T cells by repressing IL-2 expression. | CD28, CD3D, CD3E, CD3G, CD3Z, IFNG, IL2, IL2RA, IL4, MADH3, MADH4, TGFB1, TGFB2, TGFB3, TGFBR1, TGFBR2, TGFBR3, TOB1, TOB2, TRA@, TRB@ | 16 | CD3E(1), IL2(1), IL2RA(1), TGFB1(1), TGFBR3(1), TOB2(1) | 897887 | 6 | 6 | 6 | 0 | 2 | 2 | 0 | 1 | 1 | 0 | 0.12 | 0.017 | 1 |
| 8 | EOSINOPHILSPATHWAY | Recruitment of eosinophils in the inflammatory response observed in asthma occurs via the chemoattractant eotaxin binding to the CCR3 receptor. | CCL11, CCL5, CCR3, CSF2, HLA-DRA, HLA-DRB1, IL3, IL5 | 8 | CCR3(2), HLA-DRA(1) | 259845 | 3 | 3 | 3 | 0 | 1 | 1 | 1 | 0 | 0 | 0 | 0.32 | 0.029 | 1 |
| 9 | ERBB3PATHWAY | Neuregulins bind to the receptor tyrosine kinases ErbB3 and ErbB4, surface-localized receptors whose overexpression induces tumor formation. | EGF, EGFR, ERBB3, NRG1, UBE2D1 | 5 | EGF(2), ERBB3(5), NRG1(1) | 875639 | 8 | 5 | 8 | 1 | 2 | 1 | 4 | 0 | 1 | 0 | 0.32 | 0.036 | 1 |
| 10 | HSA00052_GALACTOSE_METABOLISM | Genes involved in galactose metabolism | AKR1B1, AKR1B10, B4GALT1, B4GALT2, G6PC, G6PC2, GAA, GALE, GALK1, GALK2, GALT, GANC, GCK, GLA, GLB1, HK1, HK2, HK3, HSD3B7, LALBA, LCT, MGAM, PFKL, PFKM, PFKP, PGM1, PGM3, RDH11, RDH12, RDH13, RDH14, UGP2 | 32 | B4GALT2(1), GAA(1), GCK(1), GLA(1), HK2(1), LCT(2), MGAM(7), PFKL(1), PFKP(1), PGM3(1), RDH14(2), UGP2(1) | 3288784 | 20 | 13 | 20 | 3 | 5 | 4 | 4 | 4 | 3 | 0 | 0.081 | 0.038 | 1 |
In brief, we tabulate the number of mutations and the number of covered bases for each gene. The counts are broken down by mutation context category: four context categories that are discovered by MutSig, and one for indel and 'null' mutations, which include indels, nonsense mutations, splice-site mutations, and non-stop (read-through) mutations. For each gene, we calculate the probability of seeing the observed constellation of mutations, i.e. the product P1 x P2 x ... x Pm, or a more extreme one, given the background mutation rates calculated across the dataset. [1]
In addition to the links below, the full results of the analysis summarized in this report can also be downloaded programmatically using firehose_get, or interactively from either the Broad GDAC website or TCGA Data Coordination Center Portal.