This pipeline computes the correlation between significantly recurrent gene mutations and selected clinical features.
Testing the association between mutation status of 60 genes and 15 clinical features across 185 patients, 13 significant findings detected with Q value < 0.25.
-
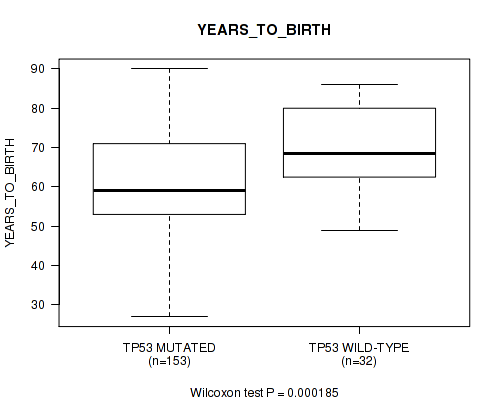
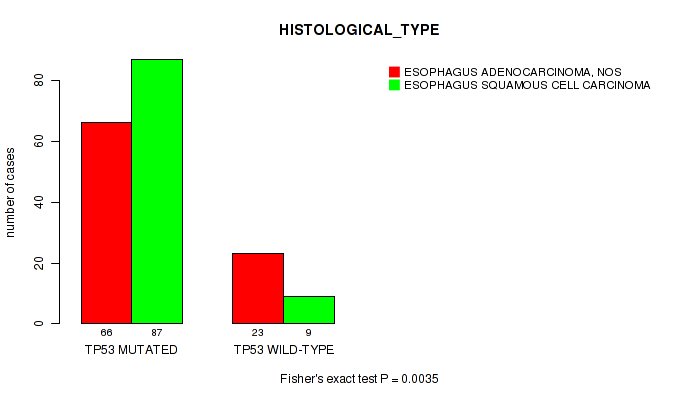
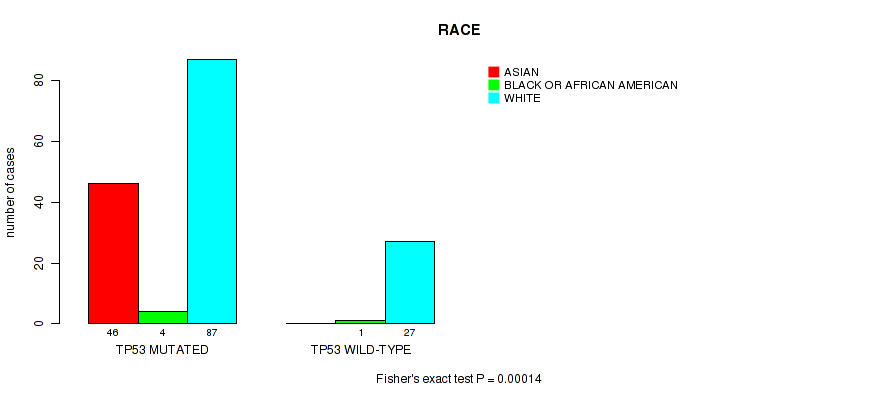
TP53 mutation correlated to 'YEARS_TO_BIRTH', 'HISTOLOGICAL_TYPE', and 'RACE'.
-
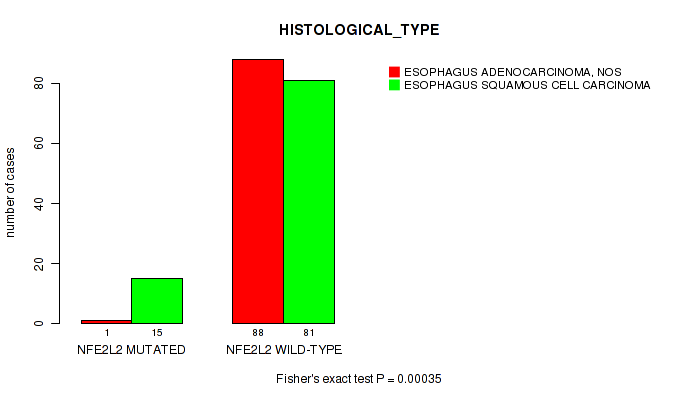
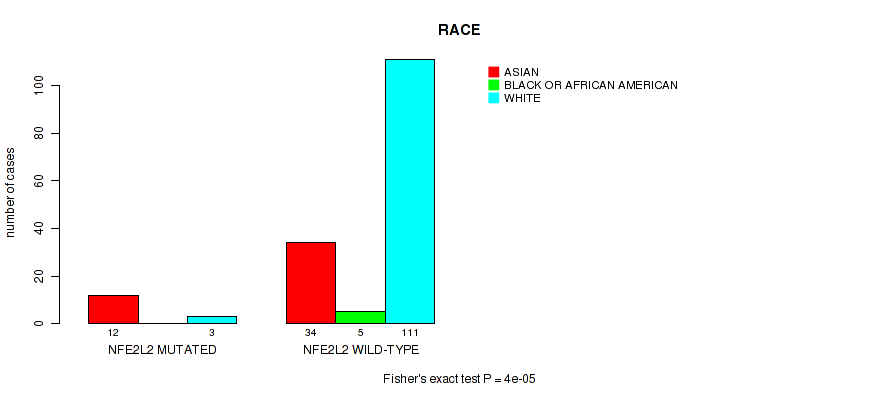
NFE2L2 mutation correlated to 'HISTOLOGICAL_TYPE' and 'RACE'.
-
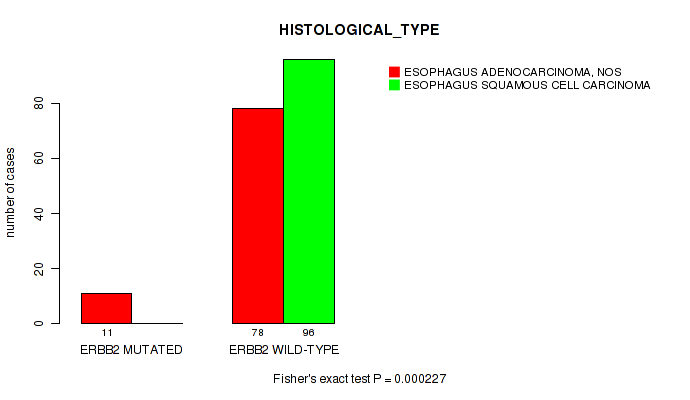
ERBB2 mutation correlated to 'HISTOLOGICAL_TYPE'.
-
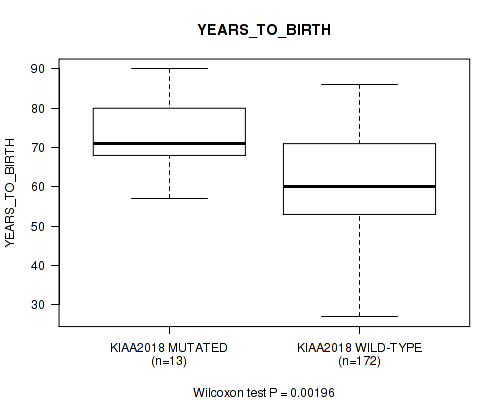
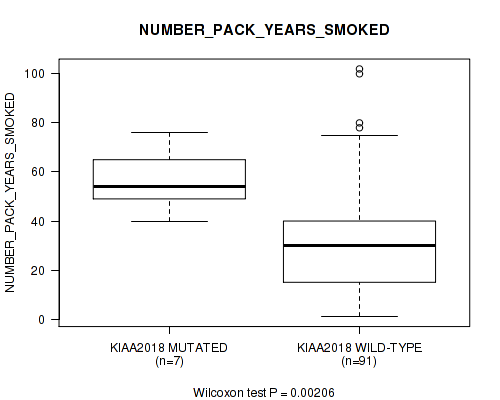
KIAA2018 mutation correlated to 'YEARS_TO_BIRTH' and 'NUMBER_PACK_YEARS_SMOKED'.
-
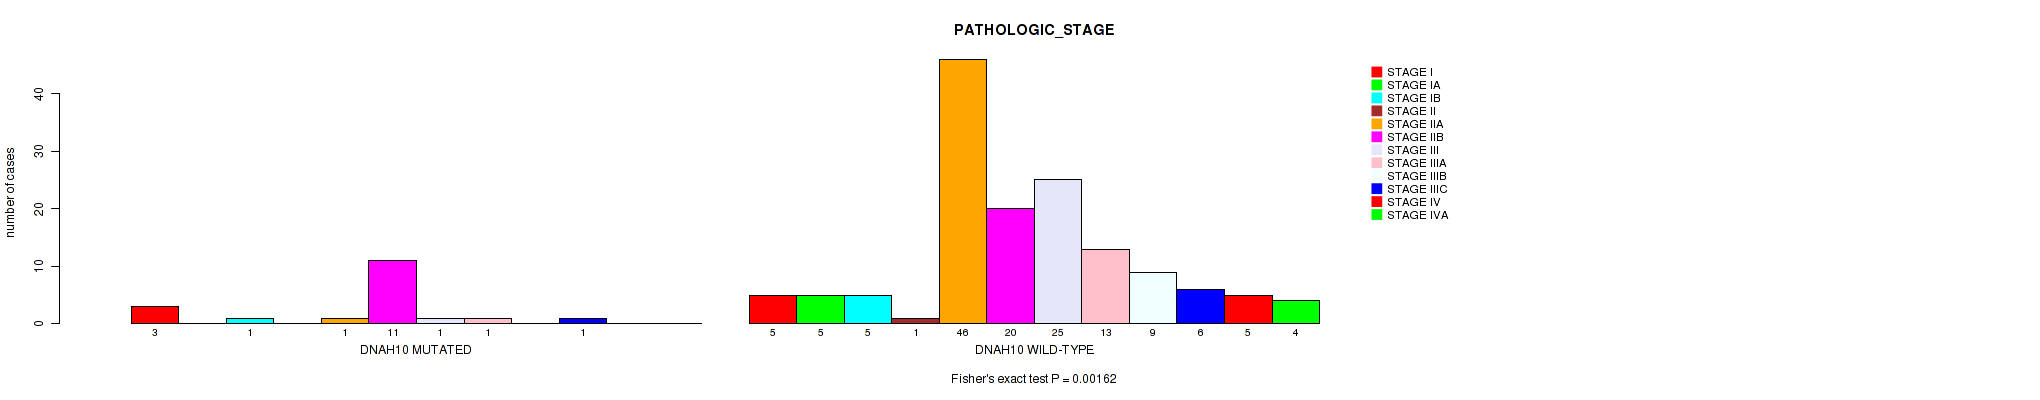
DNAH10 mutation correlated to 'PATHOLOGIC_STAGE'.
-
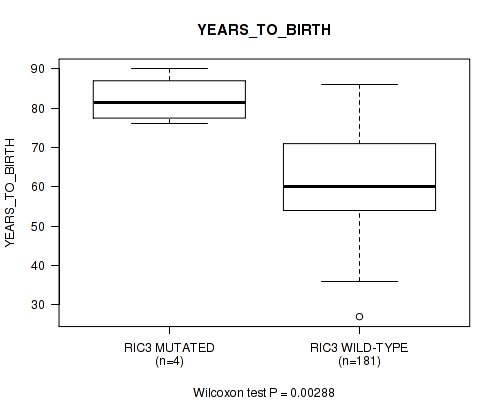
RIC3 mutation correlated to 'YEARS_TO_BIRTH'.
-
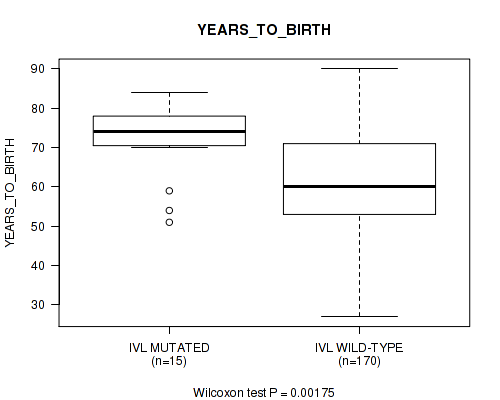
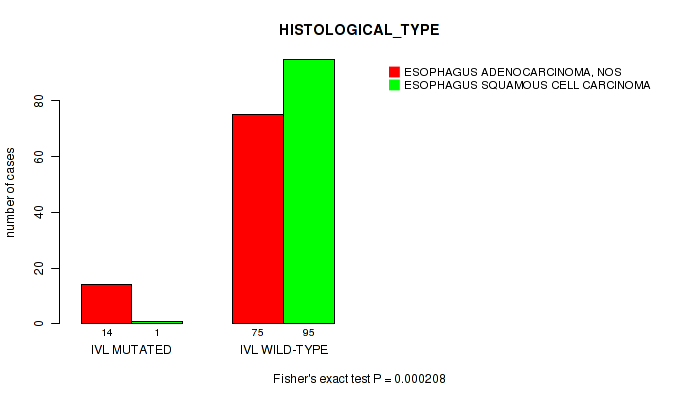
IVL mutation correlated to 'YEARS_TO_BIRTH' and 'HISTOLOGICAL_TYPE'.
-
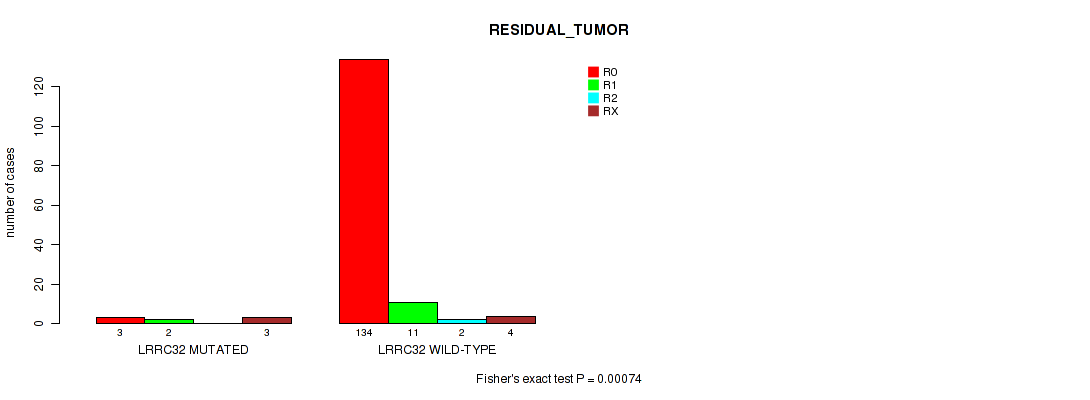
LRRC32 mutation correlated to 'RESIDUAL_TUMOR'.
Table 1. Get Full Table Overview of the association between mutation status of 60 genes and 15 clinical features. Shown in the table are P values (Q values). Thresholded by Q value < 0.25, 13 significant findings detected.
|
Clinical Features |
Time to Death |
YEARS TO BIRTH |
PATHOLOGIC STAGE |
PATHOLOGY T STAGE |
PATHOLOGY N STAGE |
PATHOLOGY M STAGE |
GENDER |
RADIATION THERAPY |
KARNOFSKY PERFORMANCE SCORE |
HISTOLOGICAL TYPE |
NUMBER PACK YEARS SMOKED |
RESIDUAL TUMOR |
NUMBER OF LYMPH NODES |
RACE | ETHNICITY | ||
| nMutated (%) | nWild-Type | logrank test | Wilcoxon-test | Fisher's exact test | Fisher's exact test | Fisher's exact test | Fisher's exact test | Fisher's exact test | Fisher's exact test | Wilcoxon-test | Fisher's exact test | Wilcoxon-test | Fisher's exact test | Wilcoxon-test | Fisher's exact test | Fisher's exact test | |
| TP53 | 153 (83%) | 32 |
0.93 (1.00) |
0.000185 (0.0409) |
0.276 (1.00) |
0.424 (1.00) |
0.443 (1.00) |
1 (1.00) |
0.0946 (0.947) |
0.159 (1.00) |
0.126 (0.992) |
0.0035 (0.242) |
0.975 (1.00) |
0.365 (1.00) |
0.368 (1.00) |
0.00014 (0.0409) |
1 (1.00) |
| NFE2L2 | 16 (9%) | 169 |
0.983 (1.00) |
0.0459 (0.774) |
0.189 (1.00) |
0.059 (0.826) |
0.498 (1.00) |
1 (1.00) |
1 (1.00) |
0.742 (1.00) |
0.581 (1.00) |
0.00035 (0.0525) |
0.137 (1.00) |
0.327 (1.00) |
0.245 (1.00) |
4e-05 (0.036) |
0.587 (1.00) |
| KIAA2018 | 13 (7%) | 172 |
0.0136 (0.599) |
0.00196 (0.168) |
0.497 (1.00) |
0.795 (1.00) |
0.223 (1.00) |
0.448 (1.00) |
1 (1.00) |
0.733 (1.00) |
0.323 (1.00) |
0.152 (1.00) |
0.00206 (0.168) |
0.45 (1.00) |
0.943 (1.00) |
0.657 (1.00) |
0.334 (1.00) |
| IVL | 15 (8%) | 170 |
0.138 (1.00) |
0.00175 (0.168) |
0.0601 (0.826) |
0.696 (1.00) |
0.186 (1.00) |
0.409 (1.00) |
0.463 (1.00) |
0.119 (0.974) |
0.000208 (0.0409) |
0.0153 (0.599) |
0.569 (1.00) |
0.574 (1.00) |
0.0428 (0.74) |
0.0314 (0.669) |
|
| ERBB2 | 11 (6%) | 174 |
0.222 (1.00) |
0.283 (1.00) |
0.685 (1.00) |
1 (1.00) |
0.391 (1.00) |
1 (1.00) |
0.664 (1.00) |
0.113 (0.964) |
0.000227 (0.0409) |
0.796 (1.00) |
1 (1.00) |
0.525 (1.00) |
0.107 (0.947) |
0.286 (1.00) |
|
| DNAH10 | 19 (10%) | 166 |
0.241 (1.00) |
0.291 (1.00) |
0.00162 (0.168) |
0.395 (1.00) |
0.567 (1.00) |
0.598 (1.00) |
1 (1.00) |
1 (1.00) |
0.226 (1.00) |
0.226 (1.00) |
0.887 (1.00) |
0.101 (0.947) |
0.191 (1.00) |
1 (1.00) |
|
| RIC3 | 4 (2%) | 181 |
0.359 (1.00) |
0.00288 (0.216) |
0.213 (1.00) |
0.836 (1.00) |
0.329 (1.00) |
1 (1.00) |
0.471 (1.00) |
1 (1.00) |
0.353 (1.00) |
0.0317 (0.669) |
0.237 (1.00) |
0.595 (1.00) |
0.628 (1.00) |
||
| LRRC32 | 9 (5%) | 176 |
0.0946 (0.947) |
0.146 (1.00) |
0.935 (1.00) |
0.372 (1.00) |
0.817 (1.00) |
1 (1.00) |
0.361 (1.00) |
0.681 (1.00) |
0.74 (1.00) |
0.238 (1.00) |
0.00074 (0.0951) |
0.136 (1.00) |
0.739 (1.00) |
1 (1.00) |
|
| SMAD4 | 13 (7%) | 172 |
0.389 (1.00) |
0.946 (1.00) |
0.159 (1.00) |
0.605 (1.00) |
0.0387 (0.74) |
1 (1.00) |
0.696 (1.00) |
0.731 (1.00) |
0.0426 (0.74) |
0.716 (1.00) |
0.149 (1.00) |
0.124 (0.989) |
0.42 (1.00) |
1 (1.00) |
|
| CDKN2A | 19 (10%) | 166 |
0.342 (1.00) |
0.559 (1.00) |
0.225 (1.00) |
1 (1.00) |
0.065 (0.826) |
0.6 (1.00) |
0.489 (1.00) |
0.032 (0.669) |
0.836 (1.00) |
0.0274 (0.669) |
0.518 (1.00) |
0.624 (1.00) |
0.283 (1.00) |
0.365 (1.00) |
0.38 (1.00) |
| MLL2 | 32 (17%) | 153 |
0.692 (1.00) |
0.738 (1.00) |
0.27 (1.00) |
0.515 (1.00) |
0.585 (1.00) |
0.685 (1.00) |
0.0946 (0.947) |
0.0645 (0.826) |
0.115 (0.967) |
0.119 (0.974) |
0.234 (1.00) |
0.468 (1.00) |
0.818 (1.00) |
0.0182 (0.602) |
1 (1.00) |
| ZNF750 | 10 (5%) | 175 |
0.849 (1.00) |
0.727 (1.00) |
0.546 (1.00) |
0.35 (1.00) |
0.306 (1.00) |
1 (1.00) |
1 (1.00) |
0.238 (1.00) |
0.0869 (0.938) |
0.0191 (0.602) |
0.582 (1.00) |
0.57 (1.00) |
0.905 (1.00) |
0.0173 (0.599) |
1 (1.00) |
| TGFBR2 | 15 (8%) | 170 |
0.57 (1.00) |
0.183 (1.00) |
0.188 (1.00) |
0.887 (1.00) |
0.081 (0.9) |
0.519 (1.00) |
0.241 (1.00) |
1 (1.00) |
0.356 (1.00) |
0.596 (1.00) |
0.128 (1.00) |
0.847 (1.00) |
0.428 (1.00) |
0.842 (1.00) |
1 (1.00) |
| FBXW7 | 13 (7%) | 172 |
0.253 (1.00) |
0.303 (1.00) |
0.622 (1.00) |
0.567 (1.00) |
0.089 (0.942) |
0.448 (1.00) |
0.102 (0.947) |
0.518 (1.00) |
0.061 (0.826) |
0.152 (1.00) |
0.557 (1.00) |
0.78 (1.00) |
0.284 (1.00) |
0.424 (1.00) |
0.0621 (0.826) |
| PKD2 | 7 (4%) | 178 |
0.389 (1.00) |
0.166 (1.00) |
0.982 (1.00) |
0.602 (1.00) |
0.779 (1.00) |
1 (1.00) |
0.596 (1.00) |
0.0388 (0.74) |
0.0732 (0.834) |
0.446 (1.00) |
0.984 (1.00) |
1 (1.00) |
0.933 (1.00) |
0.282 (1.00) |
1 (1.00) |
| ARID1A | 15 (8%) | 170 |
0.874 (1.00) |
0.0612 (0.826) |
0.575 (1.00) |
0.55 (1.00) |
0.211 (1.00) |
1 (1.00) |
0.0482 (0.774) |
0.0225 (0.642) |
0.0136 (0.599) |
0.709 (1.00) |
0.371 (1.00) |
0.284 (1.00) |
0.175 (1.00) |
0.181 (1.00) |
|
| PTCH1 | 12 (6%) | 173 |
0.393 (1.00) |
0.639 (1.00) |
0.66 (1.00) |
0.792 (1.00) |
0.335 (1.00) |
0.448 (1.00) |
1 (1.00) |
0.476 (1.00) |
0.288 (1.00) |
0.136 (1.00) |
0.589 (1.00) |
0.496 (1.00) |
0.843 (1.00) |
0.0652 (0.826) |
0.235 (1.00) |
| FAM108A1 | 4 (2%) | 181 |
0.0693 (0.832) |
0.748 (1.00) |
0.877 (1.00) |
0.58 (1.00) |
1 (1.00) |
1 (1.00) |
0.102 (0.947) |
1 (1.00) |
1 (1.00) |
1 (1.00) |
0.545 (1.00) |
1 (1.00) |
1 (1.00) |
||
| PAXIP1 | 10 (5%) | 175 |
0.552 (1.00) |
0.192 (1.00) |
0.296 (1.00) |
0.136 (1.00) |
0.747 (1.00) |
0.0984 (0.947) |
0.642 (1.00) |
0.696 (1.00) |
0.853 (1.00) |
0.749 (1.00) |
0.251 (1.00) |
1 (1.00) |
0.511 (1.00) |
0.785 (1.00) |
1 (1.00) |
| MGC29506 | 4 (2%) | 181 |
0.244 (1.00) |
0.671 (1.00) |
0.281 (1.00) |
0.686 (1.00) |
0.4 (1.00) |
0.228 (1.00) |
0.471 (1.00) |
0.573 (1.00) |
1 (1.00) |
1 (1.00) |
0.287 (1.00) |
0.268 (1.00) |
|||
| C10ORF76 | 6 (3%) | 179 |
0.397 (1.00) |
0.52 (1.00) |
0.257 (1.00) |
0.262 (1.00) |
0.166 (1.00) |
1 (1.00) |
0.0413 (0.74) |
1 (1.00) |
0.684 (1.00) |
0.472 (1.00) |
0.592 (1.00) |
0.756 (1.00) |
0.732 (1.00) |
1 (1.00) |
|
| IPP | 6 (3%) | 179 |
0.49 (1.00) |
0.00907 (0.544) |
0.777 (1.00) |
0.29 (1.00) |
0.302 (1.00) |
1 (1.00) |
1 (1.00) |
0.34 (1.00) |
0.43 (1.00) |
0.489 (1.00) |
1 (1.00) |
0.603 (1.00) |
0.629 (1.00) |
1 (1.00) |
|
| HMMR | 4 (2%) | 181 |
0.651 (1.00) |
0.428 (1.00) |
0.536 (1.00) |
0.689 (1.00) |
1 (1.00) |
1 (1.00) |
1 (1.00) |
1 (1.00) |
1 (1.00) |
0.454 (1.00) |
0.409 (1.00) |
1 (1.00) |
1 (1.00) |
||
| PIAS1 | 5 (3%) | 180 |
0.665 (1.00) |
0.879 (1.00) |
0.292 (1.00) |
0.209 (1.00) |
0.365 (1.00) |
1 (1.00) |
1 (1.00) |
1 (1.00) |
0.673 (1.00) |
0.364 (1.00) |
1 (1.00) |
0.82 (1.00) |
0.629 (1.00) |
1 (1.00) |
|
| ITGA6 | 7 (4%) | 178 |
0.529 (1.00) |
0.0409 (0.74) |
0.852 (1.00) |
0.548 (1.00) |
1 (1.00) |
1 (1.00) |
1 (1.00) |
0.0388 (0.74) |
0.0385 (0.74) |
1 (1.00) |
0.396 (1.00) |
0.288 (1.00) |
0.4 (1.00) |
0.465 (1.00) |
1 (1.00) |
| ASTE1 | 5 (3%) | 180 |
0.299 (1.00) |
0.0167 (0.599) |
0.209 (1.00) |
0.416 (1.00) |
0.148 (1.00) |
1 (1.00) |
0.155 (1.00) |
0.573 (1.00) |
0.0243 (0.643) |
0.511 (1.00) |
0.299 (1.00) |
0.256 (1.00) |
0.628 (1.00) |
1 (1.00) |
|
| KPNA1 | 6 (3%) | 179 |
0.4 (1.00) |
0.898 (1.00) |
0.591 (1.00) |
0.499 (1.00) |
0.391 (1.00) |
1 (1.00) |
0.595 (1.00) |
0.648 (1.00) |
0.43 (1.00) |
0.844 (1.00) |
0.598 (1.00) |
0.857 (1.00) |
1 (1.00) |
1 (1.00) |
|
| LIMA1 | 8 (4%) | 177 |
0.639 (1.00) |
0.107 (0.947) |
0.0875 (0.938) |
0.0468 (0.774) |
1 (1.00) |
0.409 (1.00) |
0.0941 (0.947) |
0.681 (1.00) |
0.157 (1.00) |
0.843 (1.00) |
1 (1.00) |
0.368 (1.00) |
0.568 (1.00) |
1 (1.00) |
|
| FAM65B | 8 (4%) | 177 |
0.513 (1.00) |
0.326 (1.00) |
0.668 (1.00) |
0.596 (1.00) |
0.903 (1.00) |
0.368 (1.00) |
1 (1.00) |
0.192 (1.00) |
0.722 (1.00) |
0.61 (1.00) |
1 (1.00) |
0.633 (1.00) |
1 (1.00) |
1 (1.00) |
|
| CORO7 | 7 (4%) | 178 |
0.0714 (0.834) |
0.382 (1.00) |
0.623 (1.00) |
0.358 (1.00) |
0.562 (1.00) |
1 (1.00) |
0.271 (1.00) |
0.329 (1.00) |
0.264 (1.00) |
0.316 (1.00) |
0.0296 (0.669) |
0.768 (1.00) |
0.321 (1.00) |
1 (1.00) |
|
| ANAPC1 | 5 (3%) | 180 |
0.203 (1.00) |
0.226 (1.00) |
0.438 (1.00) |
1 (1.00) |
0.366 (1.00) |
1 (1.00) |
0.0229 (0.642) |
0.329 (1.00) |
0.673 (1.00) |
1 (1.00) |
0.558 (1.00) |
1 (1.00) |
1 (1.00) |
||
| PIK3CA | 19 (10%) | 166 |
0.672 (1.00) |
0.0205 (0.615) |
0.953 (1.00) |
0.0718 (0.834) |
0.822 (1.00) |
1 (1.00) |
0.744 (1.00) |
0.771 (1.00) |
0.415 (1.00) |
0.151 (1.00) |
0.152 (1.00) |
0.875 (1.00) |
0.498 (1.00) |
0.593 (1.00) |
0.57 (1.00) |
| RB1 | 7 (4%) | 178 |
0.0669 (0.83) |
0.695 (1.00) |
0.515 (1.00) |
0.37 (1.00) |
0.334 (1.00) |
1 (1.00) |
0.271 (1.00) |
0.192 (1.00) |
0.458 (1.00) |
1 (1.00) |
0.289 (1.00) |
1 (1.00) |
0.911 (1.00) |
1 (1.00) |
1 (1.00) |
| EIF4EBP2 | 3 (2%) | 182 |
0.677 (1.00) |
0.119 (0.974) |
1 (1.00) |
1 (1.00) |
0.57 (1.00) |
0.109 (0.947) |
0.596 (1.00) |
1 (1.00) |
|||||||
| SCD | 3 (2%) | 182 |
0.993 (1.00) |
0.105 (0.947) |
0.153 (1.00) |
0.474 (1.00) |
0.0291 (0.669) |
1 (1.00) |
0.379 (1.00) |
1 (1.00) |
0.609 (1.00) |
1 (1.00) |
0.0159 (0.599) |
1 (1.00) |
|||
| MKL2 | 6 (3%) | 179 |
0.675 (1.00) |
0.0146 (0.599) |
0.305 (1.00) |
1 (1.00) |
0.365 (1.00) |
1 (1.00) |
1 (1.00) |
0.329 (1.00) |
0.107 (0.947) |
0.0301 (0.669) |
0.302 (1.00) |
0.558 (1.00) |
0.325 (1.00) |
1 (1.00) |
|
| NOTCH1 | 18 (10%) | 167 |
0.924 (1.00) |
0.311 (1.00) |
0.465 (1.00) |
0.35 (1.00) |
0.627 (1.00) |
0.6 (1.00) |
1 (1.00) |
0.365 (1.00) |
0.893 (1.00) |
0.0252 (0.648) |
0.367 (1.00) |
0.537 (1.00) |
0.244 (1.00) |
0.0758 (0.853) |
0.57 (1.00) |
| KLF3 | 3 (2%) | 182 |
0.66 (1.00) |
0.0128 (0.599) |
0.422 (1.00) |
1 (1.00) |
0.0649 (0.826) |
1 (1.00) |
0.379 (1.00) |
0.57 (1.00) |
0.109 (0.947) |
1 (1.00) |
0.54 (1.00) |
0.598 (1.00) |
|||
| IL10RA | 3 (2%) | 182 |
0.952 (1.00) |
0.849 (1.00) |
0.466 (1.00) |
0.629 (1.00) |
0.727 (1.00) |
1 (1.00) |
1 (1.00) |
0.163 (1.00) |
0.609 (1.00) |
1 (1.00) |
0.719 (1.00) |
0.596 (1.00) |
1 (1.00) |
||
| RAD17 | 4 (2%) | 181 |
0.186 (1.00) |
0.962 (1.00) |
0.552 (1.00) |
1 (1.00) |
0.611 (1.00) |
1 (1.00) |
1 (1.00) |
1 (1.00) |
0.926 (1.00) |
0.622 (1.00) |
0.861 (1.00) |
0.24 (1.00) |
0.624 (1.00) |
1 (1.00) |
1 (1.00) |
| KPNB1 | 6 (3%) | 179 |
0.541 (1.00) |
0.0838 (0.919) |
0.945 (1.00) |
0.695 (1.00) |
0.639 (1.00) |
1 (1.00) |
0.595 (1.00) |
0.648 (1.00) |
0.164 (1.00) |
0.213 (1.00) |
0.808 (1.00) |
0.596 (1.00) |
0.4 (1.00) |
0.111 (0.949) |
1 (1.00) |
| ZBED4 | 5 (3%) | 180 |
0.7 (1.00) |
0.909 (1.00) |
1 (1.00) |
0.754 (1.00) |
0.672 (1.00) |
1 (1.00) |
1 (1.00) |
0.273 (1.00) |
0.164 (1.00) |
0.37 (1.00) |
0.935 (1.00) |
0.302 (1.00) |
0.269 (1.00) |
1 (1.00) |
|
| NAA16 | 6 (3%) | 179 |
0.777 (1.00) |
0.941 (1.00) |
0.287 (1.00) |
0.0482 (0.774) |
0.0566 (0.826) |
1 (1.00) |
0.595 (1.00) |
0.648 (1.00) |
0.43 (1.00) |
0.733 (1.00) |
0.23 (1.00) |
0.269 (1.00) |
1 (1.00) |
1 (1.00) |
|
| CNNM2 | 7 (4%) | 178 |
0.26 (1.00) |
0.0648 (0.826) |
0.634 (1.00) |
0.341 (1.00) |
0.369 (1.00) |
0.324 (1.00) |
1 (1.00) |
0.679 (1.00) |
0.264 (1.00) |
0.0235 (0.642) |
1 (1.00) |
0.25 (1.00) |
0.736 (1.00) |
1 (1.00) |
|
| HLA-B | 7 (4%) | 178 |
0.232 (1.00) |
0.871 (1.00) |
0.188 (1.00) |
1 (1.00) |
0.641 (1.00) |
1 (1.00) |
0.271 (1.00) |
0.329 (1.00) |
1 (1.00) |
0.265 (1.00) |
1 (1.00) |
0.861 (1.00) |
0.352 (1.00) |
1 (1.00) |
|
| PLXNB2 | 12 (6%) | 173 |
0.689 (1.00) |
0.641 (1.00) |
0.491 (1.00) |
0.531 (1.00) |
0.319 (1.00) |
1 (1.00) |
1 (1.00) |
0.476 (1.00) |
0.299 (1.00) |
1 (1.00) |
0.658 (1.00) |
1 (1.00) |
0.558 (1.00) |
0.505 (1.00) |
0.463 (1.00) |
| PTEN | 7 (4%) | 178 |
0.371 (1.00) |
0.392 (1.00) |
0.765 (1.00) |
0.243 (1.00) |
0.705 (1.00) |
1 (1.00) |
0.271 (1.00) |
0.679 (1.00) |
0.535 (1.00) |
0.446 (1.00) |
0.984 (1.00) |
1 (1.00) |
0.891 (1.00) |
0.528 (1.00) |
1 (1.00) |
| CPT1B | 5 (3%) | 180 |
0.413 (1.00) |
0.973 (1.00) |
0.748 (1.00) |
0.36 (1.00) |
0.145 (1.00) |
1 (1.00) |
0.55 (1.00) |
1 (1.00) |
1 (1.00) |
0.596 (1.00) |
1 (1.00) |
0.131 (1.00) |
0.166 (1.00) |
0.124 (0.989) |
|
| CAMTA1 | 9 (5%) | 176 |
0.816 (1.00) |
0.153 (1.00) |
0.345 (1.00) |
0.861 (1.00) |
0.141 (1.00) |
1 (1.00) |
0.622 (1.00) |
1 (1.00) |
0.316 (1.00) |
0.378 (1.00) |
0.396 (1.00) |
0.664 (1.00) |
0.738 (1.00) |
1 (1.00) |
|
| OTUD7B | 7 (4%) | 178 |
0.392 (1.00) |
0.326 (1.00) |
0.617 (1.00) |
0.289 (1.00) |
0.494 (1.00) |
1 (1.00) |
0.0652 (0.826) |
0.648 (1.00) |
0.712 (1.00) |
0.314 (1.00) |
0.599 (1.00) |
0.805 (1.00) |
0.0682 (0.83) |
1 (1.00) |
|
| ARRB1 | 5 (3%) | 180 |
0.759 (1.00) |
0.976 (1.00) |
0.642 (1.00) |
0.578 (1.00) |
1 (1.00) |
1 (1.00) |
1 (1.00) |
1 (1.00) |
0.673 (1.00) |
0.337 (1.00) |
0.452 (1.00) |
0.783 (1.00) |
1 (1.00) |
1 (1.00) |
|
| KIAA1704 | 3 (2%) | 182 |
0.231 (1.00) |
0.147 (1.00) |
0.19 (1.00) |
1 (1.00) |
0.0286 (0.669) |
1 (1.00) |
0.379 (1.00) |
0.57 (1.00) |
0.609 (1.00) |
1 (1.00) |
0.188 (1.00) |
1 (1.00) |
|||
| RNF169 | 6 (3%) | 179 |
0.724 (1.00) |
0.753 (1.00) |
0.679 (1.00) |
0.561 (1.00) |
1 (1.00) |
0.278 (1.00) |
0.595 (1.00) |
0.108 (0.947) |
0.0732 (0.834) |
0.43 (1.00) |
0.679 (1.00) |
1 (1.00) |
0.519 (1.00) |
1 (1.00) |
1 (1.00) |
| RBPJL | 6 (3%) | 179 |
0.165 (1.00) |
0.16 (1.00) |
1 (1.00) |
0.448 (1.00) |
0.855 (1.00) |
1 (1.00) |
0.212 (1.00) |
0.108 (0.947) |
0.684 (1.00) |
0.369 (1.00) |
0.359 (1.00) |
0.563 (1.00) |
1 (1.00) |
1 (1.00) |
|
| MGAT5B | 8 (4%) | 177 |
0.0533 (0.826) |
0.468 (1.00) |
0.189 (1.00) |
0.341 (1.00) |
0.016 (0.599) |
0.278 (1.00) |
1 (1.00) |
1 (1.00) |
0.362 (1.00) |
1 (1.00) |
0.605 (1.00) |
0.414 (1.00) |
0.336 (1.00) |
0.739 (1.00) |
0.0194 (0.602) |
| TCHH | 14 (8%) | 171 |
0.24 (1.00) |
0.954 (1.00) |
0.952 (1.00) |
0.124 (0.989) |
0.866 (1.00) |
1 (1.00) |
1 (1.00) |
0.0501 (0.791) |
0.602 (1.00) |
0.784 (1.00) |
0.82 (1.00) |
1 (1.00) |
0.521 (1.00) |
0.0675 (0.83) |
1 (1.00) |
| SLC22A2 | 4 (2%) | 181 |
0.85 (1.00) |
0.0984 (0.947) |
0.363 (1.00) |
0.26 (1.00) |
0.477 (1.00) |
0.228 (1.00) |
0.471 (1.00) |
0.163 (1.00) |
0.353 (1.00) |
1 (1.00) |
0.302 (1.00) |
0.405 (1.00) |
1 (1.00) |
||
| PCDH15 | 21 (11%) | 164 |
0.769 (1.00) |
0.509 (1.00) |
0.0985 (0.947) |
0.572 (1.00) |
0.0143 (0.599) |
1 (1.00) |
0.321 (1.00) |
1 (1.00) |
0.591 (1.00) |
0.246 (1.00) |
0.221 (1.00) |
0.484 (1.00) |
0.0122 (0.599) |
0.324 (1.00) |
0.536 (1.00) |
| KIAA1549 | 8 (4%) | 177 |
0.733 (1.00) |
0.168 (1.00) |
0.749 (1.00) |
0.0607 (0.826) |
0.409 (1.00) |
1 (1.00) |
0.33 (1.00) |
0.679 (1.00) |
1 (1.00) |
0.187 (1.00) |
1 (1.00) |
0.834 (1.00) |
0.565 (1.00) |
0.181 (1.00) |
|
| SETBP1 | 14 (8%) | 171 |
0.3 (1.00) |
0.00572 (0.368) |
0.615 (1.00) |
0.291 (1.00) |
0.868 (1.00) |
0.581 (1.00) |
1 (1.00) |
1 (1.00) |
0.557 (1.00) |
0.0949 (0.947) |
0.211 (1.00) |
0.429 (1.00) |
0.536 (1.00) |
0.0415 (0.74) |
0.334 (1.00) |
P value = 0.000185 (Wilcoxon-test), Q value = 0.041
Table S1. Gene #1: 'TP53 MUTATION STATUS' versus Clinical Feature #2: 'YEARS_TO_BIRTH'
| nPatients | Mean (Std.Dev) | |
|---|---|---|
| ALL | 185 | 62.5 (11.9) |
| TP53 MUTATED | 153 | 60.9 (11.6) |
| TP53 WILD-TYPE | 32 | 69.8 (10.7) |
Figure S1. Get High-res Image Gene #1: 'TP53 MUTATION STATUS' versus Clinical Feature #2: 'YEARS_TO_BIRTH'
P value = 0.0035 (Fisher's exact test), Q value = 0.24
Table S2. Gene #1: 'TP53 MUTATION STATUS' versus Clinical Feature #10: 'HISTOLOGICAL_TYPE'
| nPatients | ESOPHAGUS ADENOCARCINOMA, NOS | ESOPHAGUS SQUAMOUS CELL CARCINOMA |
|---|---|---|
| ALL | 89 | 96 |
| TP53 MUTATED | 66 | 87 |
| TP53 WILD-TYPE | 23 | 9 |
Figure S2. Get High-res Image Gene #1: 'TP53 MUTATION STATUS' versus Clinical Feature #10: 'HISTOLOGICAL_TYPE'
P value = 0.00014 (Fisher's exact test), Q value = 0.041
Table S3. Gene #1: 'TP53 MUTATION STATUS' versus Clinical Feature #14: 'RACE'
| nPatients | ASIAN | BLACK OR AFRICAN AMERICAN | WHITE |
|---|---|---|---|
| ALL | 46 | 5 | 114 |
| TP53 MUTATED | 46 | 4 | 87 |
| TP53 WILD-TYPE | 0 | 1 | 27 |
Figure S3. Get High-res Image Gene #1: 'TP53 MUTATION STATUS' versus Clinical Feature #14: 'RACE'
P value = 0.00035 (Fisher's exact test), Q value = 0.052
Table S4. Gene #4: 'NFE2L2 MUTATION STATUS' versus Clinical Feature #10: 'HISTOLOGICAL_TYPE'
| nPatients | ESOPHAGUS ADENOCARCINOMA, NOS | ESOPHAGUS SQUAMOUS CELL CARCINOMA |
|---|---|---|
| ALL | 89 | 96 |
| NFE2L2 MUTATED | 1 | 15 |
| NFE2L2 WILD-TYPE | 88 | 81 |
Figure S4. Get High-res Image Gene #4: 'NFE2L2 MUTATION STATUS' versus Clinical Feature #10: 'HISTOLOGICAL_TYPE'
P value = 4e-05 (Fisher's exact test), Q value = 0.036
Table S5. Gene #4: 'NFE2L2 MUTATION STATUS' versus Clinical Feature #14: 'RACE'
| nPatients | ASIAN | BLACK OR AFRICAN AMERICAN | WHITE |
|---|---|---|---|
| ALL | 46 | 5 | 114 |
| NFE2L2 MUTATED | 12 | 0 | 3 |
| NFE2L2 WILD-TYPE | 34 | 5 | 111 |
Figure S5. Get High-res Image Gene #4: 'NFE2L2 MUTATION STATUS' versus Clinical Feature #14: 'RACE'
P value = 0.000227 (Fisher's exact test), Q value = 0.041
Table S6. Gene #11: 'ERBB2 MUTATION STATUS' versus Clinical Feature #10: 'HISTOLOGICAL_TYPE'
| nPatients | ESOPHAGUS ADENOCARCINOMA, NOS | ESOPHAGUS SQUAMOUS CELL CARCINOMA |
|---|---|---|
| ALL | 89 | 96 |
| ERBB2 MUTATED | 11 | 0 |
| ERBB2 WILD-TYPE | 78 | 96 |
Figure S6. Get High-res Image Gene #11: 'ERBB2 MUTATION STATUS' versus Clinical Feature #10: 'HISTOLOGICAL_TYPE'
P value = 0.00196 (Wilcoxon-test), Q value = 0.17
Table S7. Gene #13: 'KIAA2018 MUTATION STATUS' versus Clinical Feature #2: 'YEARS_TO_BIRTH'
| nPatients | Mean (Std.Dev) | |
|---|---|---|
| ALL | 185 | 62.5 (11.9) |
| KIAA2018 MUTATED | 13 | 72.7 (10.0) |
| KIAA2018 WILD-TYPE | 172 | 61.7 (11.7) |
Figure S7. Get High-res Image Gene #13: 'KIAA2018 MUTATION STATUS' versus Clinical Feature #2: 'YEARS_TO_BIRTH'
P value = 0.00206 (Wilcoxon-test), Q value = 0.17
Table S8. Gene #13: 'KIAA2018 MUTATION STATUS' versus Clinical Feature #11: 'NUMBER_PACK_YEARS_SMOKED'
| nPatients | Mean (Std.Dev) | |
|---|---|---|
| ALL | 98 | 34.5 (21.5) |
| KIAA2018 MUTATED | 7 | 56.9 (12.7) |
| KIAA2018 WILD-TYPE | 91 | 32.8 (21.1) |
Figure S8. Get High-res Image Gene #13: 'KIAA2018 MUTATION STATUS' versus Clinical Feature #11: 'NUMBER_PACK_YEARS_SMOKED'
P value = 0.00162 (Fisher's exact test), Q value = 0.17
Table S9. Gene #19: 'DNAH10 MUTATION STATUS' versus Clinical Feature #3: 'PATHOLOGIC_STAGE'
| nPatients | STAGE I | STAGE IA | STAGE IB | STAGE II | STAGE IIA | STAGE IIB | STAGE III | STAGE IIIA | STAGE IIIB | STAGE IIIC | STAGE IV | STAGE IVA |
|---|---|---|---|---|---|---|---|---|---|---|---|---|
| ALL | 8 | 5 | 6 | 1 | 47 | 31 | 26 | 14 | 9 | 7 | 5 | 4 |
| DNAH10 MUTATED | 3 | 0 | 1 | 0 | 1 | 11 | 1 | 1 | 0 | 1 | 0 | 0 |
| DNAH10 WILD-TYPE | 5 | 5 | 5 | 1 | 46 | 20 | 25 | 13 | 9 | 6 | 5 | 4 |
Figure S9. Get High-res Image Gene #19: 'DNAH10 MUTATION STATUS' versus Clinical Feature #3: 'PATHOLOGIC_STAGE'
P value = 0.00288 (Wilcoxon-test), Q value = 0.22
Table S10. Gene #20: 'RIC3 MUTATION STATUS' versus Clinical Feature #2: 'YEARS_TO_BIRTH'
| nPatients | Mean (Std.Dev) | |
|---|---|---|
| ALL | 185 | 62.5 (11.9) |
| RIC3 MUTATED | 4 | 82.2 (6.1) |
| RIC3 WILD-TYPE | 181 | 62.0 (11.6) |
Figure S10. Get High-res Image Gene #20: 'RIC3 MUTATION STATUS' versus Clinical Feature #2: 'YEARS_TO_BIRTH'
P value = 0.00175 (Wilcoxon-test), Q value = 0.17
Table S11. Gene #30: 'IVL MUTATION STATUS' versus Clinical Feature #2: 'YEARS_TO_BIRTH'
| nPatients | Mean (Std.Dev) | |
|---|---|---|
| ALL | 185 | 62.5 (11.9) |
| IVL MUTATED | 15 | 71.8 (10.0) |
| IVL WILD-TYPE | 170 | 61.6 (11.7) |
Figure S11. Get High-res Image Gene #30: 'IVL MUTATION STATUS' versus Clinical Feature #2: 'YEARS_TO_BIRTH'
P value = 0.000208 (Fisher's exact test), Q value = 0.041
Table S12. Gene #30: 'IVL MUTATION STATUS' versus Clinical Feature #10: 'HISTOLOGICAL_TYPE'
| nPatients | ESOPHAGUS ADENOCARCINOMA, NOS | ESOPHAGUS SQUAMOUS CELL CARCINOMA |
|---|---|---|
| ALL | 89 | 96 |
| IVL MUTATED | 14 | 1 |
| IVL WILD-TYPE | 75 | 95 |
Figure S12. Get High-res Image Gene #30: 'IVL MUTATION STATUS' versus Clinical Feature #10: 'HISTOLOGICAL_TYPE'
P value = 0.00074 (Fisher's exact test), Q value = 0.095
Table S13. Gene #55: 'LRRC32 MUTATION STATUS' versus Clinical Feature #12: 'RESIDUAL_TUMOR'
| nPatients | R0 | R1 | R2 | RX |
|---|---|---|---|---|
| ALL | 137 | 13 | 2 | 7 |
| LRRC32 MUTATED | 3 | 2 | 0 | 3 |
| LRRC32 WILD-TYPE | 134 | 11 | 2 | 4 |
Figure S13. Get High-res Image Gene #55: 'LRRC32 MUTATION STATUS' versus Clinical Feature #12: 'RESIDUAL_TUMOR'
-
Mutation data file = sample_sig_gene_table.txt from Mutsig_2CV pipeline
-
Processed Mutation data file = /xchip/cga/gdac-prod/tcga-gdac/jobResults/GDAC_Correlate_Genomic_Events_Preprocess/ESCA-TP/22588509/transformed.cor.cli.txt
-
Clinical data file = /xchip/cga/gdac-prod/tcga-gdac/jobResults/Append_Data/ESCA-TP/22506419/ESCA-TP.merged_data.txt
-
Number of patients = 185
-
Number of significantly mutated genes = 60
-
Number of selected clinical features = 15
-
Exclude genes that fewer than K tumors have mutations, K = 3
For survival clinical features, the Kaplan-Meier survival curves of tumors with and without gene mutations were plotted and the statistical significance P values were estimated by logrank test (Bland and Altman 2004) using the 'survdiff' function in R
For binary or multi-class clinical features (nominal or ordinal), two-tailed Fisher's exact tests (Fisher 1922) were used to estimate the P values using the 'fisher.test' function in R
For multiple hypothesis correction, Q value is the False Discovery Rate (FDR) analogue of the P value (Benjamini and Hochberg 1995), defined as the minimum FDR at which the test may be called significant. We used the 'Benjamini and Hochberg' method of 'p.adjust' function in R to convert P values into Q values.
In addition to the links below, the full results of the analysis summarized in this report can also be downloaded programmatically using firehose_get, or interactively from either the Broad GDAC website or TCGA Data Coordination Center Portal.