This pipeline performs Gene Set Enrichment Analysis (GSEA) using The Broad Institute GSEA tool with MSigDB - Class2: Canonical Pathways gene sets. For a given phenotype subtype, it shows what pathways are significantly enriched in each subtype by comparing gene expression profiles between subtypes. Here, the phenotype is mRNAseq_cNMF subtypes having more than three samples and the input expression file "HNSC-TP.uncv2.mRNAseq_RSEM_normalized_log2.txt" is generated in the pipeline mRNAseq_Preprocess in the stddata run. This pipeline has the following features:
-
For each subtype, calculates enrichment scores (ES) using signal to noise (S2N) that checks similarity between subtypes in expression level then calculates p values through permutation test.
-
Lists pathways significantly enriched in each phenotype subtype and their enrichment scores (ES).
-
Lists top 20 core genes enriched in each significant gene set and their enrichment scores (ES).
-
Checks if the top core genes are up-regulated or down-regulated.
-
Checks if the top core genes are high expressed or low expressed.
-
Checks if the top core genes are significantly differently expressed genes.
Table 1. Get Full Table basic data info
| basic data info |
|---|
| Number of Gene Sets: 716 |
| Number of samples: 520 |
| Original number of Gene Sets: 1320 |
| Maximum gene set size: 933 |
Table 2. Get Full Table pheno data info
| phenotype info |
|---|
| pheno.type: 1 - 4 :[ clus1 ] 136 |
| pheno.type: 2 - 4 :[ clus2 ] 114 |
| pheno.type: 3 - 4 :[ clus3 ] 172 |
| pheno.type: 4 - 4 :[ clus4 ] 98 |
For the expression subtypes of 18378 genes in 521 samples, GSEA found enriched gene sets in each cluster using 520 gene sets in MSigDB canonical pathways. Top enriched gene sets are listed as below.
-
clus1
-
Top enriched gene sets are PID INTEGRIN3 PATHWAY, PID ILK PATHWAY, PID SYNDECAN 2 PATHWAY, REACTOME ER PHAGOSOME PATHWAY, REACTOME EXTRACELLULAR MATRIX ORGANIZATION, REACTOME COLLAGEN FORMATION, REACTOME CHONDROITIN SULFATE DERMATAN SULFATE METABOLISM, REACTOME MRNA CAPPING, REACTOME ASSOCIATION OF TRIC CCT WITH TARGET PROTEINS DURING BIOSYNTHESIS, REACTOME PROTEIN FOLDING
-
And common core enriched genes are ARFGAP1, C19orf10, CUL7, DDX11, DNAJB11, EXTL3, FKBP14, HYOU1, KDELR3, PDIA5
-
clus2
-
Top enriched gene sets are KEGG PROTEASOME, KEGG CYTOSOLIC DNA SENSING PATHWAY, BIOCARTA PROTEASOME PATHWAY, PID MTOR 4PATHWAY, REACTOME FORMATION OF THE TERNARY COMPLEX AND SUBSEQUENTLY THE 43S COMPLEX, REACTOME SIGNALING BY WNT, REACTOME TRIF MEDIATED TLR3 SIGNALING, REACTOME ER PHAGOSOME PATHWAY, REACTOME ACTIVATION OF THE MRNA UPON BINDING OF THE CAP BINDING COMPLEX AND EIFS AND SUBSEQUENT BINDING TO 43S, REACTOME REGULATION OF ORNITHINE DECARBOXYLASE ODC
-
And common core enriched genes are RPS27A, EIF4A1, EIF4E, EIF4EBP1, EIF1AX, EIF2S1, EIF2S2, EIF2S3, EIF3A, EIF3B
-
clus3
-
Top enriched gene sets are KEGG FATTY ACID METABOLISM, KEGG VALINE LEUCINE AND ISOLEUCINE DEGRADATION, KEGG STARCH AND SUCROSE METABOLISM, KEGG GLYCOSYLPHOSPHATIDYLINOSITOL GPI ANCHOR BIOSYNTHESIS, KEGG GLYCOSPHINGOLIPID BIOSYNTHESIS LACTO AND NEOLACTO SERIES, KEGG BUTANOATE METABOLISM, KEGG PORPHYRIN AND CHLOROPHYLL METABOLISM, KEGG METABOLISM OF XENOBIOTICS BY CYTOCHROME P450, KEGG DRUG METABOLISM CYTOCHROME P450, PID FANCONI PATHWAY
-
And common core enriched genes are UGT1A1, UGT1A10, UGT1A3, UGT1A4, UGT1A6, UGT1A7, UGT1A8, UGT1A9, UGT2A1, UGT2B15
-
clus4
-
Top enriched gene sets are KEGG GLYCOLYSIS GLUCONEOGENESIS, KEGG PURINE METABOLISM, KEGG ARGININE AND PROLINE METABOLISM, KEGG TYROSINE METABOLISM, KEGG GLYCEROLIPID METABOLISM, KEGG INOSITOL PHOSPHATE METABOLISM, KEGG GLYCEROPHOSPHOLIPID METABOLISM, KEGG ETHER LIPID METABOLISM, KEGG ABC TRANSPORTERS, KEGG RNA DEGRADATION
-
And common core enriched genes are ASB11, ASB12, ASB15, ASB16, ASB4, ASB5, PARK2, TRIM63, ZBTB16, ASB2
Table 3. Get Full Table This table shows top 10 pathways which are significantly enriched in cluster clus1. It displays only significant gene sets satisfying nom.p.val.threshold (-1), fwer.p.val.threshold (-1) , fdr.q.val.threshold (0.25) and the default table is sorted by Normalized Enrichment Score (NES). Further details on NES statistics, please visit The Broad GSEA website.
| GeneSet(GS) | Size(#genes) | genes.ES.table | ES | NES | NOM.p.val | FDR.q.val | FWER.p.val | Tag.. | Gene.. | Signal | FDR..median. | glob.p.val |
|---|---|---|---|---|---|---|---|---|---|---|---|---|
| PID INTEGRIN3 PATHWAY | 43 | genes.ES.table | 0.64 | 1.6 | 0.042 | 0.71 | 0.92 | 0.7 | 0.17 | 0.58 | 0.36 | 0.21 |
| PID ILK PATHWAY | 45 | genes.ES.table | 0.51 | 1.9 | 0.016 | 0.53 | 0.31 | 0.49 | 0.3 | 0.34 | 0 | 0.11 |
| PID SYNDECAN 2 PATHWAY | 33 | genes.ES.table | 0.55 | 1.7 | 0.025 | 0.71 | 0.77 | 0.36 | 0.14 | 0.31 | 0.25 | 0.18 |
| REACTOME ER PHAGOSOME PATHWAY | 58 | genes.ES.table | 0.52 | 1.6 | 0.11 | 0.67 | 0.95 | 0.76 | 0.4 | 0.46 | 0.38 | 0.2 |
| REACTOME EXTRACELLULAR MATRIX ORGANIZATION | 83 | genes.ES.table | 0.64 | 1.6 | 0.041 | 0.76 | 0.94 | 0.68 | 0.12 | 0.59 | 0.42 | 0.23 |
| REACTOME COLLAGEN FORMATION | 58 | genes.ES.table | 0.67 | 1.6 | 0.036 | 0.72 | 0.94 | 0.71 | 0.12 | 0.62 | 0.4 | 0.22 |
| REACTOME CHONDROITIN SULFATE DERMATAN SULFATE METABOLISM | 47 | genes.ES.table | 0.58 | 1.6 | 0.012 | 0.8 | 0.9 | 0.62 | 0.2 | 0.5 | 0.37 | 0.22 |
| REACTOME MRNA CAPPING | 29 | genes.ES.table | 0.52 | 1.7 | 0.029 | 0.82 | 0.76 | 0.52 | 0.28 | 0.37 | 0.28 | 0.2 |
| REACTOME ASSOCIATION OF TRIC CCT WITH TARGET PROTEINS DURING BIOSYNTHESIS | 26 | genes.ES.table | 0.4 | 1.6 | 0.042 | 0.9 | 0.88 | 0.58 | 0.36 | 0.37 | 0.41 | 0.25 |
| REACTOME PROTEIN FOLDING | 49 | genes.ES.table | 0.44 | 1.9 | 0.012 | 0.39 | 0.4 | 0.55 | 0.34 | 0.36 | 0 | 0.091 |
Table S1. Get Full Table This table shows a Running Enrichment Score (RES) of each gene in this pathway, that is, the enrichment score at this point in the ranked list of genes. All genes are ranked by Signal-to-Noise (S2N), a measure of similarity as default and are used to obtain ES matrix of all genes. In this way, GSEA tool uses expression pattern of not only overlapped genes but also not-overlapped genes to produce ES matrix.
| Rank | GENE | SYMBOL | DESC | LIST.LOC | S2N | RES | CORE_ENRICHMENT |
|---|---|---|---|---|---|---|---|
| 1 | KDELR3 | KDELR3 | KDELR3 | 257 | 0.25 | 0.056 | YES |
| 2 | FKBP14 | FKBP14 | FKBP14 | 688 | 0.19 | 0.085 | YES |
| 3 | IGFBP1 | IGFBP1 | IGFBP1 | 750 | 0.18 | 0.13 | YES |
| 4 | PDIA5 | PDIA5 | PDIA5 | 1447 | 0.13 | 0.13 | YES |
| 5 | IL8 | IL8 | IL8 | 1464 | 0.13 | 0.17 | YES |
| 6 | C19orf10 | C19orf10 | C19orf10 | 1880 | 0.11 | 0.17 | YES |
| 7 | ARFGAP1 | ARFGAP1 | ARFGAP1 | 2220 | 0.096 | 0.18 | YES |
| 8 | EXOSC6 | EXOSC6 | EXOSC6 | 2391 | 0.09 | 0.2 | YES |
| 9 | YIF1A | YIF1A | YIF1A | 2409 | 0.09 | 0.22 | YES |
| 10 | EXOSC4 | EXOSC4 | EXOSC4 | 2593 | 0.085 | 0.24 | YES |
| 11 | SHC1 | SHC1 | SHC1 | 2758 | 0.08 | 0.25 | YES |
| 12 | DDIT3 | DDIT3 | DDIT3 | 3264 | 0.069 | 0.24 | YES |
| 13 | HSP90B1 | HSP90B1 | HSP90B1 | 3298 | 0.068 | 0.26 | YES |
| 14 | EXOSC9 | EXOSC9 | EXOSC9 | 3444 | 0.066 | 0.27 | YES |
| 15 | EXOSC1 | EXOSC1 | EXOSC1 | 3788 | 0.059 | 0.27 | YES |
| 16 | HSPA5 | HSPA5 | HSPA5 | 3910 | 0.058 | 0.28 | YES |
| 17 | PARN | PARN | PARN | 3993 | 0.056 | 0.29 | YES |
| 18 | EXOSC2 | EXOSC2 | EXOSC2 | 3997 | 0.056 | 0.3 | YES |
| 19 | EXTL3 | EXTL3 | EXTL3 | 4067 | 0.055 | 0.32 | YES |
| 20 | CALR | CALR | CALR | 4173 | 0.054 | 0.33 | YES |
| 21 | HYOU1 | HYOU1 | HYOU1 | 4188 | 0.054 | 0.34 | YES |
| 22 | ASNS | ASNS | ASNS | 4206 | 0.053 | 0.36 | YES |
| 23 | EXOSC8 | EXOSC8 | EXOSC8 | 4316 | 0.051 | 0.36 | YES |
| 24 | CUL7 | CUL7 | CUL7 | 4595 | 0.048 | 0.36 | YES |
| 25 | PDIA6 | PDIA6 | PDIA6 | 4697 | 0.046 | 0.37 | YES |
| 26 | SULT1A3 | SULT1A3 | SULT1A3 | 4740 | 0.046 | 0.38 | YES |
| 27 | ZBTB17 | ZBTB17 | ZBTB17 | 4893 | 0.044 | 0.38 | YES |
| 28 | TPP1 | TPP1 | TPP1 | 5140 | 0.041 | 0.38 | YES |
| 29 | DNAJB11 | DNAJB11 | DNAJB11 | 5275 | 0.039 | 0.38 | YES |
| 30 | DDX11 | DDX11 | DDX11 | 5510 | 0.036 | 0.38 | YES |
| 31 | WFS1 | WFS1 | WFS1 | 5715 | 0.034 | 0.38 | YES |
| 32 | MBTPS2 | MBTPS2 | MBTPS2 | 5949 | 0.031 | 0.38 | YES |
| 33 | MBTPS1 | MBTPS1 | MBTPS1 | 5989 | 0.031 | 0.38 | YES |
| 34 | SRPRB | SRPRB | SRPRB | 6003 | 0.031 | 0.39 | YES |
| 35 | EIF2S1 | EIF2S1 | EIF2S1 | 6340 | 0.028 | 0.38 | YES |
| 36 | LMNA | LMNA | LMNA | 6354 | 0.027 | 0.39 | YES |
| 37 | TSPYL2 | TSPYL2 | TSPYL2 | 6542 | 0.026 | 0.38 | YES |
| 38 | EXOSC7 | EXOSC7 | EXOSC7 | 6546 | 0.026 | 0.39 | YES |
| 39 | PPP2R5B | PPP2R5B | PPP2R5B | 6754 | 0.024 | 0.39 | NO |
| 40 | SYVN1 | SYVN1 | SYVN1 | 7302 | 0.018 | 0.36 | NO |
| 41 | DNAJC3 | DNAJC3 | DNAJC3 | 7405 | 0.017 | 0.36 | NO |
| 42 | KLHDC3 | KLHDC3 | KLHDC3 | 7566 | 0.016 | 0.36 | NO |
| 43 | DCTN1 | DCTN1 | DCTN1 | 7590 | 0.015 | 0.36 | NO |
| 44 | TLN1 | TLN1 | TLN1 | 7756 | 0.014 | 0.36 | NO |
| 45 | ATP6V0D1 | ATP6V0D1 | ATP6V0D1 | 7786 | 0.013 | 0.36 | NO |
| 46 | ADD1 | ADD1 | ADD1 | 7884 | 0.012 | 0.36 | NO |
| 47 | GSK3A | GSK3A | GSK3A | 8012 | 0.011 | 0.35 | NO |
| 48 | GOSR2 | GOSR2 | GOSR2 | 8441 | 0.0073 | 0.33 | NO |
| 49 | EXOSC5 | EXOSC5 | EXOSC5 | 8477 | 0.0069 | 0.33 | NO |
| 50 | PREB | PREB | PREB | 8515 | 0.0065 | 0.33 | NO |
| 51 | SRPR | SRPR | SRPR | 8523 | 0.0065 | 0.33 | NO |
| 52 | SEC31A | SEC31A | SEC31A | 8556 | 0.0061 | 0.33 | NO |
| 53 | NFYA | NFYA | NFYA | 8745 | 0.0043 | 0.32 | NO |
| 54 | ATF6 | ATF6 | ATF6 | 8776 | 0.004 | 0.32 | NO |
| 55 | HDGF | HDGF | HDGF | 8780 | 0.004 | 0.32 | NO |
| 56 | ATF4 | ATF4 | ATF4 | 9159 | 0.00046 | 0.3 | NO |
| 57 | SSR1 | SSR1 | SSR1 | 9191 | 0.00023 | 0.3 | NO |
| 58 | EDEM1 | EDEM1 | EDEM1 | 9257 | -0.00046 | 0.3 | NO |
| 59 | KHSRP | KHSRP | KHSRP | 9606 | -0.0037 | 0.28 | NO |
| 60 | NFYB | NFYB | NFYB | 10037 | -0.0084 | 0.26 | NO |
| 61 | SERP1 | SERP1 | SERP1 | 11049 | -0.019 | 0.21 | NO |
| 62 | EXOSC3 | EXOSC3 | EXOSC3 | 11059 | -0.019 | 0.21 | NO |
| 63 | DIS3 | DIS3 | DIS3 | 11235 | -0.022 | 0.21 | NO |
| 64 | TATDN2 | TATDN2 | TATDN2 | 11266 | -0.022 | 0.22 | NO |
| 65 | ACADVL | ACADVL | ACADVL | 11430 | -0.024 | 0.21 | NO |
| 66 | CCL2 | CCL2 | CCL2 | 11736 | -0.028 | 0.2 | NO |
| 67 | CTDSP2 | CTDSP2 | CTDSP2 | 11911 | -0.03 | 0.2 | NO |
| 68 | DCP2 | DCP2 | DCP2 | 11975 | -0.031 | 0.21 | NO |
| 69 | ATF3 | ATF3 | ATF3 | 12022 | -0.032 | 0.21 | NO |
| 70 | CXXC1 | CXXC1 | CXXC1 | 12054 | -0.032 | 0.22 | NO |
| 71 | HERPUD1 | HERPUD1 | HERPUD1 | 12647 | -0.04 | 0.2 | NO |
| 72 | DNAJB9 | DNAJB9 | DNAJB9 | 12705 | -0.041 | 0.21 | NO |
| 73 | WIPI1 | WIPI1 | WIPI1 | 13251 | -0.05 | 0.19 | NO |
| 74 | XBP1 | XBP1 | XBP1 | 14753 | -0.085 | 0.14 | NO |
| 75 | EIF2AK3 | EIF2AK3 | EIF2AK3 | 15034 | -0.094 | 0.15 | NO |
| 76 | ERN1 | ERN1 | ERN1 | 15872 | -0.13 | 0.14 | NO |
Figure S1. Get High-res Image This plot shows mRNAseq_cNMF expression data heatmap (on the left) a RunningEnrichmentScore(RES) plot (on the top right) and a Signal2Noise(S2N) plot (on the bottom right) of genes in the pathway: PID INTEGRIN3 PATHWAY.
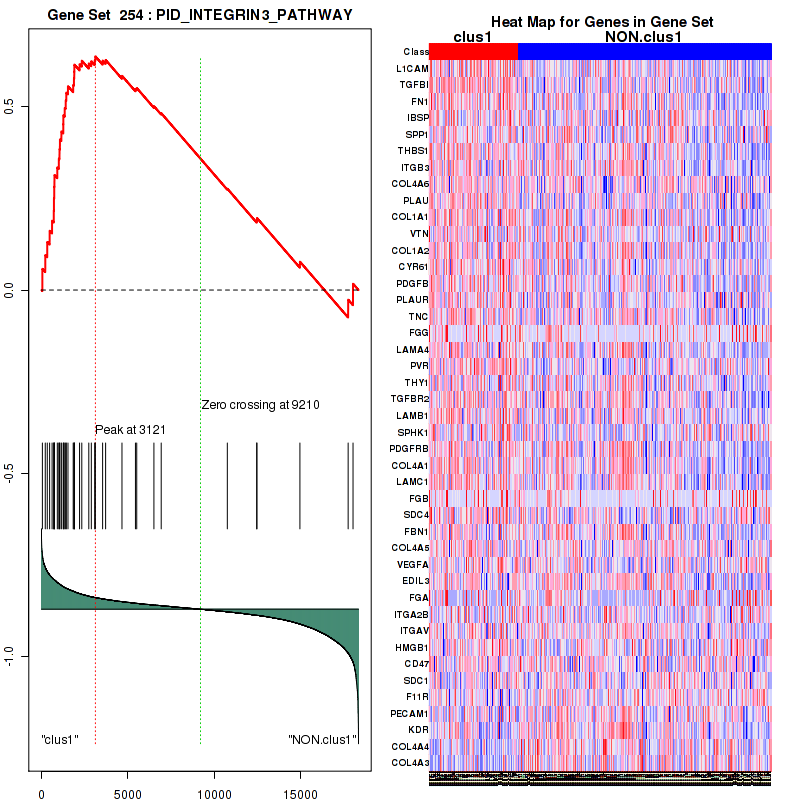
Figure S2. Get High-res Image For the top 5 core enriched genes in the pathway: PID INTEGRIN3 PATHWAY, this volcano plot shows how much they are up/down-regulated and significant. The significance was calculated by empirical bayesian fit
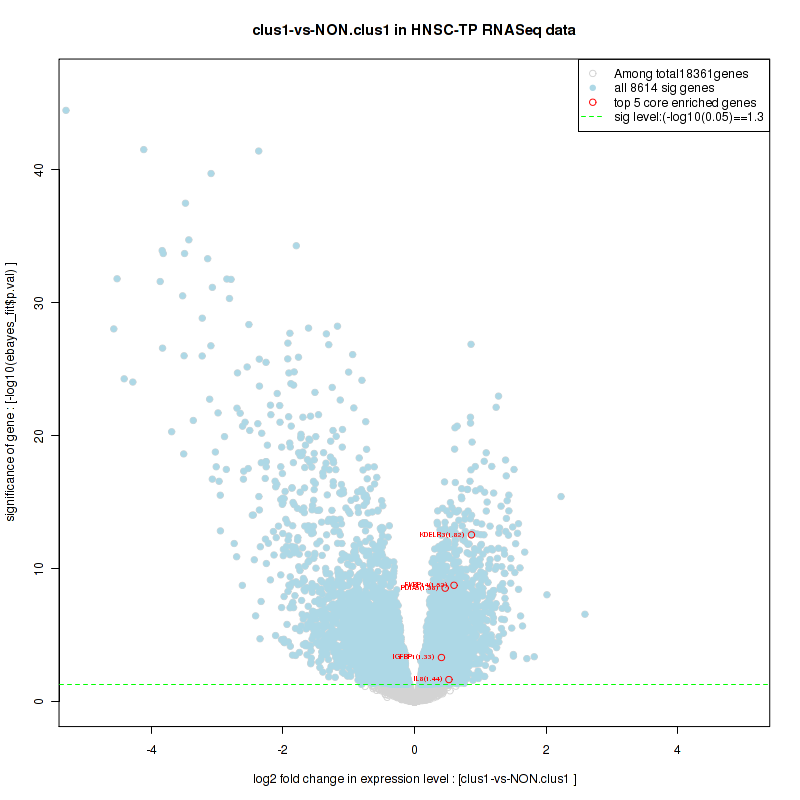
Table S2. Get Full Table This table shows a Running Enrichment Score (RES) of each gene in this pathway, that is, the enrichment score at this point in the ranked list of genes. All genes are ranked by Signal-to-Noise (S2N), a measure of similarity as default and are used to obtain ES matrix of all genes. In this way, GSEA tool uses expression pattern of not only overlapped genes but also not-overlapped genes to produce ES matrix.
| Rank | GENE | SYMBOL | DESC | LIST.LOC | S2N | RES | CORE_ENRICHMENT |
|---|---|---|---|---|---|---|---|
| 1 | MYL9 | MYL9 | MYL9 | 393 | 0.22 | 0.061 | YES |
| 2 | PPP1R14A | PPP1R14A | PPP1R14A | 458 | 0.21 | 0.14 | YES |
| 3 | SNAI1 | SNAI1 | SNAI1 | 736 | 0.18 | 0.19 | YES |
| 4 | PARVB | PARVB | PARVB | 764 | 0.18 | 0.25 | YES |
| 5 | CCND1 | CCND1 | CCND1 | 958 | 0.16 | 0.3 | YES |
| 6 | ACTN1 | ACTN1 | ACTN1 | 1194 | 0.14 | 0.34 | YES |
| 7 | PXN | PXN | PXN | 1488 | 0.13 | 0.37 | YES |
| 8 | PPP1R14C | PPP1R14C | PPP1R14C | 2106 | 0.1 | 0.38 | YES |
| 9 | PARVA | PARVA | PARVA | 2138 | 0.099 | 0.41 | YES |
| 10 | PPP1R14B | PPP1R14B | PPP1R14B | 2143 | 0.099 | 0.45 | YES |
| 11 | AURKA | AURKA | AURKA | 2202 | 0.097 | 0.48 | YES |
| 12 | ILK | ILK | ILK | 2645 | 0.084 | 0.48 | YES |
| 13 | ZYX | ZYX | ZYX | 3269 | 0.069 | 0.48 | YES |
| 14 | RUVBL2 | RUVBL2 | RUVBL2 | 3487 | 0.065 | 0.49 | YES |
| 15 | TACC3 | TACC3 | TACC3 | 3844 | 0.059 | 0.49 | YES |
| 16 | JUN | JUN | JUN | 4072 | 0.055 | 0.5 | YES |
| 17 | AKT1 | AKT1 | AKT1 | 4438 | 0.05 | 0.5 | YES |
| 18 | HSP90AA1 | HSP90AA1 | HSP90AA1 | 4715 | 0.046 | 0.5 | YES |
| 19 | ILKAP | ILKAP | ILKAP | 4958 | 0.043 | 0.5 | YES |
| 20 | CDC37 | CDC37 | CDC37 | 5443 | 0.037 | 0.49 | YES |
| 21 | CTNNB1 | CTNNB1 | CTNNB1 | 5488 | 0.036 | 0.5 | YES |
| 22 | RUVBL1 | RUVBL1 | RUVBL1 | 5563 | 0.036 | 0.51 | YES |
| 23 | LIMS2 | LIMS2 | LIMS2 | 6670 | 0.024 | 0.46 | NO |
| 24 | CKAP5 | CKAP5 | CKAP5 | 6714 | 0.024 | 0.46 | NO |
| 25 | CDC42 | CDC42 | CDC42 | 7214 | 0.019 | 0.44 | NO |
| 26 | RHOG | RHOG | RHOG | 7753 | 0.014 | 0.42 | NO |
| 27 | LIMS1 | LIMS1 | LIMS1 | 7948 | 0.012 | 0.41 | NO |
| 28 | ZEB1 | ZEB1 | ZEB1 | 8015 | 0.011 | 0.41 | NO |
| 29 | PARP1 | PARP1 | PARP1 | 8113 | 0.01 | 0.41 | NO |
| 30 | RICTOR | RICTOR | RICTOR | 8225 | 0.0093 | 0.41 | NO |
| 31 | XPO1 | XPO1 | XPO1 | 9027 | 0.0016 | 0.37 | NO |
| 32 | ARHGEF7 | ARHGEF7 | ARHGEF7 | 9084 | 0.0011 | 0.36 | NO |
| 33 | NACA | NACA | NACA | 9570 | -0.0034 | 0.34 | NO |
| 34 | IQGAP1 | IQGAP1 | IQGAP1 | 10022 | -0.0081 | 0.32 | NO |
| 35 | GIT2 | GIT2 | GIT2 | 10067 | -0.0087 | 0.32 | NO |
| 36 | RAC1 | RAC1 | RAC1 | 10124 | -0.0092 | 0.32 | NO |
| 37 | PPP1R12A | PPP1R12A | PPP1R12A | 10269 | -0.011 | 0.31 | NO |
| 38 | ELMO2 | ELMO2 | ELMO2 | 10394 | -0.012 | 0.31 | NO |
| 39 | DIAPH1 | DIAPH1 | DIAPH1 | 11304 | -0.022 | 0.27 | NO |
| 40 | PARVG | PARVG | PARVG | 11670 | -0.027 | 0.26 | NO |
| 41 | CREB1 | CREB1 | CREB1 | 12210 | -0.034 | 0.24 | NO |
| 42 | GSK3B | GSK3B | GSK3B | 12710 | -0.041 | 0.23 | NO |
| 43 | NCK2 | NCK2 | NCK2 | 12812 | -0.043 | 0.24 | NO |
| 44 | TNS1 | TNS1 | TNS1 | 14184 | -0.07 | 0.19 | NO |
| 45 | ARHGEF6 | ARHGEF6 | ARHGEF6 | 15166 | -0.099 | 0.17 | NO |
Figure S3. Get High-res Image This plot shows mRNAseq_cNMF expression data heatmap (on the left) a RunningEnrichmentScore(RES) plot (on the top right) and a Signal2Noise(S2N) plot (on the bottom right) of genes in the pathway: PID ILK PATHWAY.
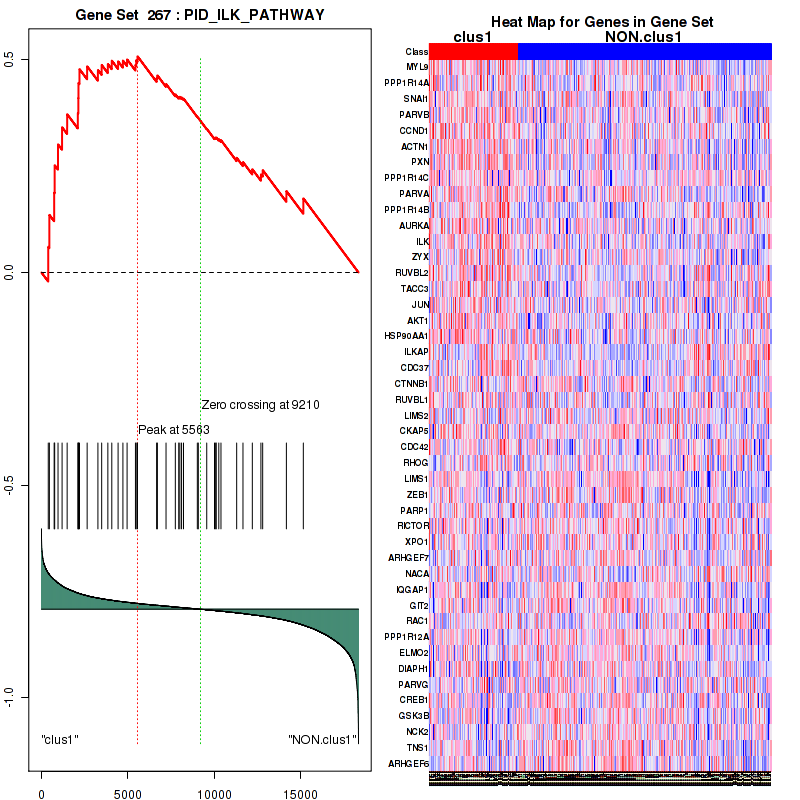
Figure S4. Get High-res Image For the top 5 core enriched genes in the pathway: PID ILK PATHWAY, this volcano plot shows how much they are up/down-regulated and significant. The significance was calculated by empirical bayesian fit

Table S3. Get Full Table This table shows a Running Enrichment Score (RES) of each gene in this pathway, that is, the enrichment score at this point in the ranked list of genes. All genes are ranked by Signal-to-Noise (S2N), a measure of similarity as default and are used to obtain ES matrix of all genes. In this way, GSEA tool uses expression pattern of not only overlapped genes but also not-overlapped genes to produce ES matrix.
| Rank | GENE | SYMBOL | DESC | LIST.LOC | S2N | RES | CORE_ENRICHMENT |
|---|---|---|---|---|---|---|---|
| 1 | GFPT2 | GFPT2 | GFPT2 | 260 | 0.25 | 0.17 | YES |
| 2 | DPM2 | DPM2 | DPM2 | 3187 | 0.07 | 0.067 | YES |
| 3 | GMPPA | GMPPA | GMPPA | 3498 | 0.065 | 0.099 | YES |
| 4 | PMM2 | PMM2 | PMM2 | 3552 | 0.064 | 0.14 | YES |
| 5 | DPM3 | DPM3 | DPM3 | 3621 | 0.062 | 0.19 | YES |
| 6 | PMM1 | PMM1 | PMM1 | 3664 | 0.062 | 0.23 | YES |
| 7 | ALG3 | ALG3 | ALG3 | 3689 | 0.061 | 0.28 | YES |
| 8 | ALG11 | ALG11 | ALG11 | 3894 | 0.058 | 0.31 | YES |
| 9 | ALG14 | ALG14 | ALG14 | 4059 | 0.056 | 0.34 | YES |
| 10 | PGM3 | PGM3 | PGM3 | 4383 | 0.05 | 0.36 | YES |
| 11 | RFT1 | RFT1 | RFT1 | 4491 | 0.049 | 0.39 | YES |
| 12 | ALG5 | ALG5 | ALG5 | 4722 | 0.046 | 0.42 | YES |
| 13 | ALG8 | ALG8 | ALG8 | 4753 | 0.046 | 0.45 | YES |
| 14 | ALG1 | ALG1 | ALG1 | 4844 | 0.044 | 0.48 | YES |
| 15 | DPAGT1 | DPAGT1 | DPAGT1 | 5188 | 0.04 | 0.49 | YES |
| 16 | DPM1 | DPM1 | DPM1 | 5403 | 0.038 | 0.51 | YES |
| 17 | ALG2 | ALG2 | ALG2 | 6056 | 0.03 | 0.49 | YES |
| 18 | DOLK | DOLK | DOLK | 6409 | 0.027 | 0.5 | YES |
| 19 | GNPNAT1 | GNPNAT1 | GNPNAT1 | 6554 | 0.026 | 0.51 | YES |
| 20 | ALG9 | ALG9 | ALG9 | 6923 | 0.022 | 0.5 | YES |
| 21 | MPI | MPI | MPI | 6926 | 0.022 | 0.52 | YES |
| 22 | ALG12 | ALG12 | ALG12 | 7811 | 0.013 | 0.48 | NO |
| 23 | DOLPP1 | DOLPP1 | DOLPP1 | 8541 | 0.0063 | 0.45 | NO |
| 24 | ALG10B | ALG10B | ALG10B | 9918 | -0.0072 | 0.38 | NO |
| 25 | ALG10 | ALG10 | ALG10 | 10907 | -0.018 | 0.34 | NO |
| 26 | ALG13 | ALG13 | ALG13 | 11108 | -0.02 | 0.34 | NO |
| 27 | GMPPB | GMPPB | GMPPB | 11913 | -0.03 | 0.32 | NO |
| 28 | ALG6 | ALG6 | ALG6 | 12876 | -0.044 | 0.3 | NO |
Figure S5. Get High-res Image This plot shows mRNAseq_cNMF expression data heatmap (on the left) a RunningEnrichmentScore(RES) plot (on the top right) and a Signal2Noise(S2N) plot (on the bottom right) of genes in the pathway: PID SYNDECAN 2 PATHWAY.
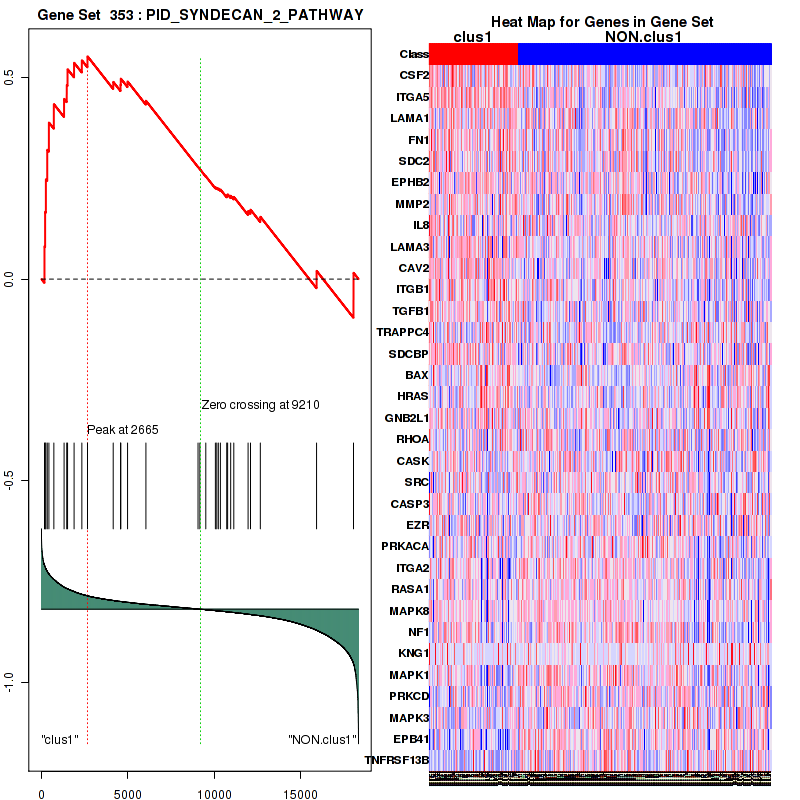
Figure S6. Get High-res Image For the top 5 core enriched genes in the pathway: PID SYNDECAN 2 PATHWAY, this volcano plot shows how much they are up/down-regulated and significant. The significance was calculated by empirical bayesian fit
Table S4. Get Full Table This table shows a Running Enrichment Score (RES) of each gene in this pathway, that is, the enrichment score at this point in the ranked list of genes. All genes are ranked by Signal-to-Noise (S2N), a measure of similarity as default and are used to obtain ES matrix of all genes. In this way, GSEA tool uses expression pattern of not only overlapped genes but also not-overlapped genes to produce ES matrix.
| Rank | GENE | SYMBOL | DESC | LIST.LOC | S2N | RES | CORE_ENRICHMENT |
|---|---|---|---|---|---|---|---|
| 1 | TUBB3 | TUBB3 | TUBB3 | 851 | 0.17 | 0.029 | YES |
| 2 | KIFC3 | KIFC3 | KIFC3 | 1346 | 0.13 | 0.061 | YES |
| 3 | SPHK1 | SPHK1 | SPHK1 | 1900 | 0.11 | 0.079 | YES |
| 4 | PFDN4 | PFDN4 | PFDN4 | 1953 | 0.11 | 0.12 | YES |
| 5 | TUBB6 | TUBB6 | TUBB6 | 2088 | 0.1 | 0.16 | YES |
| 6 | TUBA1A | TUBA1A | TUBA1A | 2192 | 0.097 | 0.2 | YES |
| 7 | FKBP9 | FKBP9 | FKBP9 | 2236 | 0.095 | 0.24 | YES |
| 8 | PFDN2 | PFDN2 | PFDN2 | 2583 | 0.085 | 0.26 | YES |
| 9 | PFDN6 | PFDN6 | PFDN6 | 2754 | 0.08 | 0.28 | YES |
| 10 | TBCE | TBCE | TBCE | 3576 | 0.063 | 0.26 | YES |
| 11 | CCT6A | CCT6A | CCT6A | 3996 | 0.056 | 0.27 | YES |
| 12 | CCT3 | CCT3 | CCT3 | 4040 | 0.056 | 0.29 | YES |
| 13 | CCT5 | CCT5 | CCT5 | 4053 | 0.056 | 0.31 | YES |
| 14 | TUBA1B | TUBA1B | TUBA1B | 4226 | 0.053 | 0.33 | YES |
| 15 | TBCA | TBCA | TBCA | 4244 | 0.052 | 0.35 | YES |
| 16 | ACTB | ACTB | ACTB | 4488 | 0.049 | 0.36 | YES |
| 17 | TBCB | TBCB | TBCB | 4525 | 0.049 | 0.38 | YES |
| 18 | CCT2 | CCT2 | CCT2 | 4735 | 0.046 | 0.38 | YES |
| 19 | CCT4 | CCT4 | CCT4 | 4906 | 0.044 | 0.39 | YES |
| 20 | FBXO4 | FBXO4 | FBXO4 | 5172 | 0.04 | 0.4 | YES |
| 21 | USP11 | USP11 | USP11 | 5415 | 0.037 | 0.4 | YES |
| 22 | PFDN5 | PFDN5 | PFDN5 | 5511 | 0.036 | 0.41 | YES |
| 23 | CCT7 | CCT7 | CCT7 | 5518 | 0.036 | 0.43 | YES |
| 24 | PFDN1 | PFDN1 | PFDN1 | 5620 | 0.035 | 0.44 | YES |
| 25 | NOP56 | NOP56 | NOP56 | 5811 | 0.033 | 0.44 | YES |
| 26 | LONP2 | LONP2 | LONP2 | 6190 | 0.029 | 0.43 | YES |
| 27 | TCP1 | TCP1 | TCP1 | 6251 | 0.028 | 0.44 | YES |
| 28 | CCT8 | CCT8 | CCT8 | 6573 | 0.025 | 0.44 | NO |
| 29 | TUBA1C | TUBA1C | TUBA1C | 6890 | 0.022 | 0.43 | NO |
| 30 | VBP1 | VBP1 | VBP1 | 7970 | 0.012 | 0.38 | NO |
| 31 | TUBA3C | TUBA3C | TUBA3C | 7989 | 0.011 | 0.38 | NO |
| 32 | TUBA3D | TUBA3D | TUBA3D | 9168 | 0.00041 | 0.32 | NO |
| 33 | FBXW7 | FBXW7 | FBXW7 | 9219 | -0.00013 | 0.31 | NO |
| 34 | XRN2 | XRN2 | XRN2 | 9283 | -0.0007 | 0.31 | NO |
| 35 | FBXW2 | FBXW2 | FBXW2 | 9644 | -0.0041 | 0.29 | NO |
| 36 | FBXW4 | FBXW4 | FBXW4 | 9891 | -0.0068 | 0.28 | NO |
| 37 | FBXO6 | FBXO6 | FBXO6 | 9896 | -0.0068 | 0.28 | NO |
| 38 | TUBB2A | TUBB2A | TUBB2A | 10151 | -0.0095 | 0.27 | NO |
| 39 | TBCD | TBCD | TBCD | 10388 | -0.012 | 0.27 | NO |
| 40 | TUBA4A | TUBA4A | TUBA4A | 10615 | -0.014 | 0.26 | NO |
| 41 | FBXW5 | FBXW5 | FBXW5 | 11423 | -0.024 | 0.23 | NO |
| 42 | TBCC | TBCC | TBCC | 11451 | -0.024 | 0.24 | NO |
| 43 | AP3M1 | AP3M1 | AP3M1 | 11696 | -0.027 | 0.23 | NO |
| 44 | TUBB1 | TUBB1 | TUBB1 | 11782 | -0.028 | 0.24 | NO |
| 45 | FBXL3 | FBXL3 | FBXL3 | 13006 | -0.046 | 0.2 | NO |
| 46 | KIF13A | KIF13A | KIF13A | 13007 | -0.046 | 0.22 | NO |
| 47 | FBXL5 | FBXL5 | FBXL5 | 13036 | -0.046 | 0.23 | NO |
| 48 | ARFGEF2 | ARFGEF2 | ARFGEF2 | 13375 | -0.052 | 0.24 | NO |
| 49 | TUBB2B | TUBB2B | TUBB2B | 14508 | -0.077 | 0.21 | NO |
Figure S7. Get High-res Image This plot shows mRNAseq_cNMF expression data heatmap (on the left) a RunningEnrichmentScore(RES) plot (on the top right) and a Signal2Noise(S2N) plot (on the bottom right) of genes in the pathway: REACTOME ER PHAGOSOME PATHWAY.
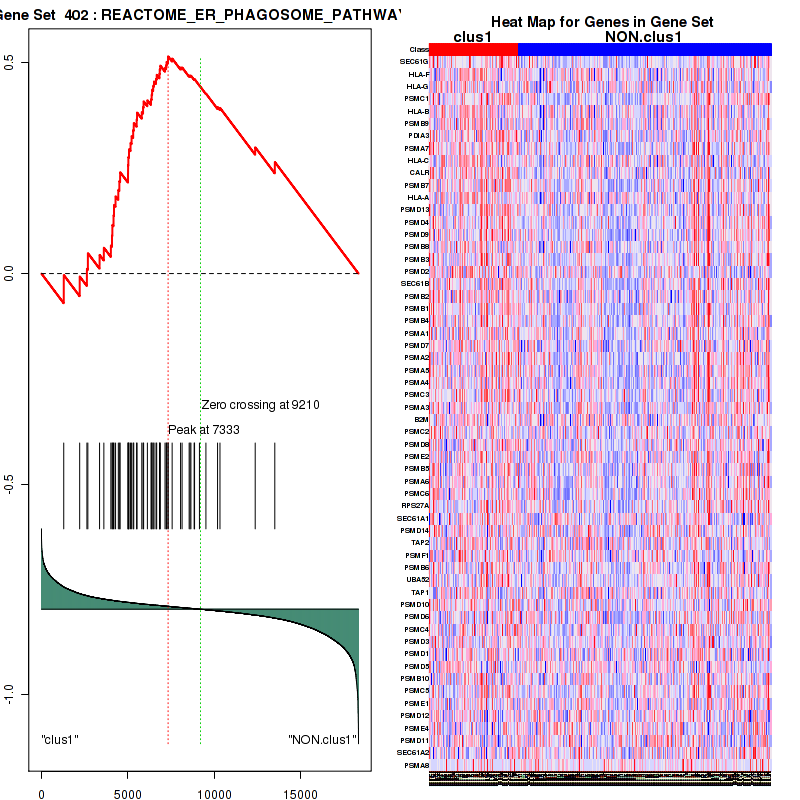
Figure S8. Get High-res Image For the top 5 core enriched genes in the pathway: REACTOME ER PHAGOSOME PATHWAY, this volcano plot shows how much they are up/down-regulated and significant. The significance was calculated by empirical bayesian fit

Table S5. Get Full Table This table shows a Running Enrichment Score (RES) of each gene in this pathway, that is, the enrichment score at this point in the ranked list of genes. All genes are ranked by Signal-to-Noise (S2N), a measure of similarity as default and are used to obtain ES matrix of all genes. In this way, GSEA tool uses expression pattern of not only overlapped genes but also not-overlapped genes to produce ES matrix.
| Rank | GENE | SYMBOL | DESC | LIST.LOC | S2N | RES | CORE_ENRICHMENT |
|---|---|---|---|---|---|---|---|
| 1 | KDELR3 | KDELR3 | KDELR3 | 257 | 0.25 | 0.11 | YES |
| 2 | FKBP14 | FKBP14 | FKBP14 | 688 | 0.19 | 0.19 | YES |
| 3 | PDIA5 | PDIA5 | PDIA5 | 1447 | 0.13 | 0.21 | YES |
| 4 | C19orf10 | C19orf10 | C19orf10 | 1880 | 0.11 | 0.24 | YES |
| 5 | ARFGAP1 | ARFGAP1 | ARFGAP1 | 2220 | 0.096 | 0.28 | YES |
| 6 | YIF1A | YIF1A | YIF1A | 2409 | 0.09 | 0.31 | YES |
| 7 | SHC1 | SHC1 | SHC1 | 2758 | 0.08 | 0.33 | YES |
| 8 | EXTL3 | EXTL3 | EXTL3 | 4067 | 0.055 | 0.29 | YES |
| 9 | HYOU1 | HYOU1 | HYOU1 | 4188 | 0.054 | 0.31 | YES |
| 10 | CUL7 | CUL7 | CUL7 | 4595 | 0.048 | 0.31 | YES |
| 11 | PDIA6 | PDIA6 | PDIA6 | 4697 | 0.046 | 0.33 | YES |
| 12 | SULT1A3 | SULT1A3 | SULT1A3 | 4740 | 0.046 | 0.35 | YES |
| 13 | ZBTB17 | ZBTB17 | ZBTB17 | 4893 | 0.044 | 0.37 | YES |
| 14 | TPP1 | TPP1 | TPP1 | 5140 | 0.041 | 0.38 | YES |
| 15 | DNAJB11 | DNAJB11 | DNAJB11 | 5275 | 0.039 | 0.39 | YES |
| 16 | DDX11 | DDX11 | DDX11 | 5510 | 0.036 | 0.4 | YES |
| 17 | WFS1 | WFS1 | WFS1 | 5715 | 0.034 | 0.4 | YES |
| 18 | SRPRB | SRPRB | SRPRB | 6003 | 0.031 | 0.4 | YES |
| 19 | LMNA | LMNA | LMNA | 6354 | 0.027 | 0.4 | NO |
| 20 | TSPYL2 | TSPYL2 | TSPYL2 | 6542 | 0.026 | 0.4 | NO |
| 21 | PPP2R5B | PPP2R5B | PPP2R5B | 6754 | 0.024 | 0.4 | NO |
| 22 | SYVN1 | SYVN1 | SYVN1 | 7302 | 0.018 | 0.38 | NO |
| 23 | DNAJC3 | DNAJC3 | DNAJC3 | 7405 | 0.017 | 0.38 | NO |
| 24 | KLHDC3 | KLHDC3 | KLHDC3 | 7566 | 0.016 | 0.38 | NO |
| 25 | DCTN1 | DCTN1 | DCTN1 | 7590 | 0.015 | 0.39 | NO |
| 26 | TLN1 | TLN1 | TLN1 | 7756 | 0.014 | 0.39 | NO |
| 27 | ATP6V0D1 | ATP6V0D1 | ATP6V0D1 | 7786 | 0.013 | 0.39 | NO |
| 28 | ADD1 | ADD1 | ADD1 | 7884 | 0.012 | 0.39 | NO |
| 29 | GSK3A | GSK3A | GSK3A | 8012 | 0.011 | 0.39 | NO |
| 30 | GOSR2 | GOSR2 | GOSR2 | 8441 | 0.0073 | 0.37 | NO |
| 31 | PREB | PREB | PREB | 8515 | 0.0065 | 0.37 | NO |
| 32 | SRPR | SRPR | SRPR | 8523 | 0.0065 | 0.38 | NO |
| 33 | SEC31A | SEC31A | SEC31A | 8556 | 0.0061 | 0.38 | NO |
| 34 | HDGF | HDGF | HDGF | 8780 | 0.004 | 0.37 | NO |
| 35 | SSR1 | SSR1 | SSR1 | 9191 | 0.00023 | 0.34 | NO |
| 36 | EDEM1 | EDEM1 | EDEM1 | 9257 | -0.00046 | 0.34 | NO |
| 37 | SERP1 | SERP1 | SERP1 | 11049 | -0.019 | 0.25 | NO |
| 38 | TATDN2 | TATDN2 | TATDN2 | 11266 | -0.022 | 0.25 | NO |
| 39 | ACADVL | ACADVL | ACADVL | 11430 | -0.024 | 0.26 | NO |
| 40 | CTDSP2 | CTDSP2 | CTDSP2 | 11911 | -0.03 | 0.24 | NO |
| 41 | CXXC1 | CXXC1 | CXXC1 | 12054 | -0.032 | 0.25 | NO |
| 42 | DNAJB9 | DNAJB9 | DNAJB9 | 12705 | -0.041 | 0.24 | NO |
| 43 | WIPI1 | WIPI1 | WIPI1 | 13251 | -0.05 | 0.24 | NO |
| 44 | XBP1 | XBP1 | XBP1 | 14753 | -0.085 | 0.2 | NO |
Figure S9. Get High-res Image This plot shows mRNAseq_cNMF expression data heatmap (on the left) a RunningEnrichmentScore(RES) plot (on the top right) and a Signal2Noise(S2N) plot (on the bottom right) of genes in the pathway: REACTOME EXTRACELLULAR MATRIX ORGANIZATION.
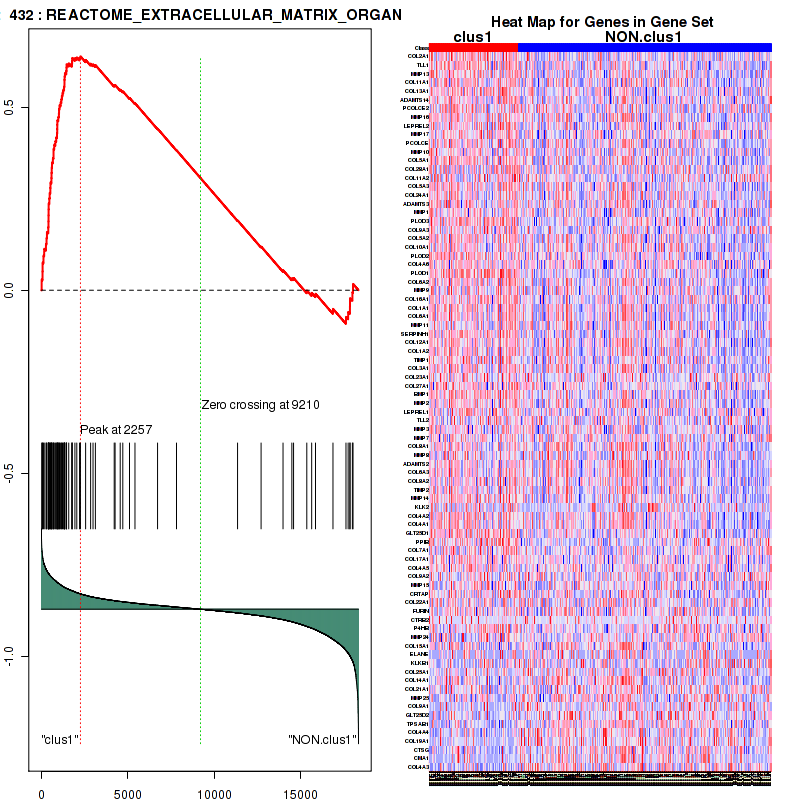
Figure S10. Get High-res Image For the top 5 core enriched genes in the pathway: REACTOME EXTRACELLULAR MATRIX ORGANIZATION, this volcano plot shows how much they are up/down-regulated and significant. The significance was calculated by empirical bayesian fit

Table S6. Get Full Table This table shows a Running Enrichment Score (RES) of each gene in this pathway, that is, the enrichment score at this point in the ranked list of genes. All genes are ranked by Signal-to-Noise (S2N), a measure of similarity as default and are used to obtain ES matrix of all genes. In this way, GSEA tool uses expression pattern of not only overlapped genes but also not-overlapped genes to produce ES matrix.
| Rank | GENE | SYMBOL | DESC | LIST.LOC | S2N | RES | CORE_ENRICHMENT |
|---|---|---|---|---|---|---|---|
| 1 | GTF2H2B | GTF2H2B | GTF2H2B | 2273 | 0.094 | -0.04 | YES |
| 2 | GTF2H4 | GTF2H4 | GTF2H4 | 2766 | 0.08 | 0.0038 | YES |
| 3 | ERCC2 | ERCC2 | ERCC2 | 3128 | 0.072 | 0.048 | YES |
| 4 | MNAT1 | MNAT1 | MNAT1 | 3200 | 0.07 | 0.11 | YES |
| 5 | POLR2L | POLR2L | POLR2L | 3333 | 0.068 | 0.16 | YES |
| 6 | POLR2H | POLR2H | POLR2H | 3471 | 0.065 | 0.21 | YES |
| 7 | POLR2F | POLR2F | POLR2F | 3517 | 0.064 | 0.26 | YES |
| 8 | GTF2F2 | GTF2F2 | GTF2F2 | 3672 | 0.062 | 0.31 | YES |
| 9 | POLR2C | POLR2C | POLR2C | 4114 | 0.055 | 0.34 | YES |
| 10 | POLR2G | POLR2G | POLR2G | 4602 | 0.048 | 0.35 | YES |
| 11 | GTF2H2 | GTF2H2 | GTF2H2 | 4807 | 0.045 | 0.38 | YES |
| 12 | NCBP2 | NCBP2 | NCBP2 | 4809 | 0.045 | 0.42 | YES |
| 13 | POLR2J | POLR2J | POLR2J | 4847 | 0.044 | 0.46 | YES |
| 14 | POLR2K | POLR2K | POLR2K | 4907 | 0.044 | 0.49 | YES |
| 15 | POLR2D | POLR2D | POLR2D | 5100 | 0.042 | 0.52 | YES |
| 16 | CCNH | CCNH | CCNH | 6726 | 0.024 | 0.45 | NO |
| 17 | CDK7 | CDK7 | CDK7 | 7198 | 0.02 | 0.44 | NO |
| 18 | GTF2F1 | GTF2F1 | GTF2F1 | 7577 | 0.016 | 0.44 | NO |
| 19 | ERCC3 | ERCC3 | ERCC3 | 7941 | 0.012 | 0.43 | NO |
| 20 | POLR2I | POLR2I | POLR2I | 8175 | 0.0097 | 0.42 | NO |
| 21 | SUPT5H | SUPT5H | SUPT5H | 8256 | 0.009 | 0.43 | NO |
| 22 | RNGTT | RNGTT | RNGTT | 8294 | 0.0086 | 0.43 | NO |
| 23 | POLR2E | POLR2E | POLR2E | 8347 | 0.0082 | 0.44 | NO |
| 24 | GTF2H1 | GTF2H1 | GTF2H1 | 9835 | -0.0062 | 0.36 | NO |
| 25 | NCBP1 | NCBP1 | NCBP1 | 10522 | -0.013 | 0.34 | NO |
| 26 | GTF2H3 | GTF2H3 | GTF2H3 | 11014 | -0.019 | 0.33 | NO |
| 27 | POLR2B | POLR2B | POLR2B | 11093 | -0.02 | 0.34 | NO |
| 28 | POLR2A | POLR2A | POLR2A | 11574 | -0.025 | 0.34 | NO |
| 29 | RNMT | RNMT | RNMT | 12558 | -0.039 | 0.32 | NO |
Figure S11. Get High-res Image This plot shows mRNAseq_cNMF expression data heatmap (on the left) a RunningEnrichmentScore(RES) plot (on the top right) and a Signal2Noise(S2N) plot (on the bottom right) of genes in the pathway: REACTOME COLLAGEN FORMATION.
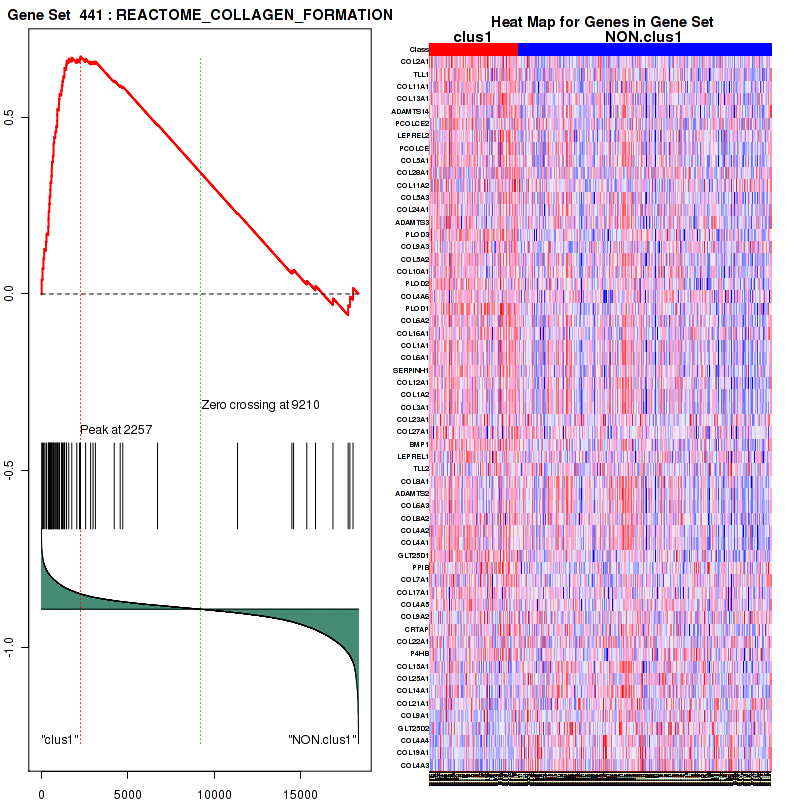
Figure S12. Get High-res Image For the top 5 core enriched genes in the pathway: REACTOME COLLAGEN FORMATION, this volcano plot shows how much they are up/down-regulated and significant. The significance was calculated by empirical bayesian fit

Table S7. Get Full Table This table shows a Running Enrichment Score (RES) of each gene in this pathway, that is, the enrichment score at this point in the ranked list of genes. All genes are ranked by Signal-to-Noise (S2N), a measure of similarity as default and are used to obtain ES matrix of all genes. In this way, GSEA tool uses expression pattern of not only overlapped genes but also not-overlapped genes to produce ES matrix.
| Rank | GENE | SYMBOL | DESC | LIST.LOC | S2N | RES | CORE_ENRICHMENT |
|---|---|---|---|---|---|---|---|
| 1 | CSF2 | CSF2 | CSF2 | 175 | 0.27 | 0.082 | YES |
| 2 | ITGA5 | ITGA5 | ITGA5 | 213 | 0.26 | 0.17 | YES |
| 3 | LAMA1 | LAMA1 | LAMA1 | 255 | 0.25 | 0.25 | YES |
| 4 | FN1 | FN1 | FN1 | 335 | 0.23 | 0.32 | YES |
| 5 | SDC2 | SDC2 | SDC2 | 431 | 0.22 | 0.39 | YES |
| 6 | EPHB2 | EPHB2 | EPHB2 | 717 | 0.18 | 0.43 | YES |
| 7 | MMP2 | MMP2 | MMP2 | 1309 | 0.14 | 0.45 | YES |
| 8 | IL8 | IL8 | IL8 | 1464 | 0.13 | 0.48 | YES |
| 9 | LAMA3 | LAMA3 | LAMA3 | 1511 | 0.12 | 0.52 | YES |
| 10 | CAV2 | CAV2 | CAV2 | 1888 | 0.11 | 0.54 | YES |
| 11 | ITGB1 | ITGB1 | ITGB1 | 2338 | 0.092 | 0.54 | YES |
| 12 | TGFB1 | TGFB1 | TGFB1 | 2665 | 0.083 | 0.55 | YES |
| 13 | TRAPPC4 | TRAPPC4 | TRAPPC4 | 4156 | 0.054 | 0.49 | NO |
| 14 | SDCBP | SDCBP | SDCBP | 4580 | 0.048 | 0.48 | NO |
| 15 | BAX | BAX | BAX | 4593 | 0.048 | 0.5 | NO |
| 16 | HRAS | HRAS | HRAS | 4985 | 0.043 | 0.49 | NO |
| 17 | GNB2L1 | GNB2L1 | GNB2L1 | 6047 | 0.03 | 0.44 | NO |
| 18 | RHOA | RHOA | RHOA | 9068 | 0.0012 | 0.28 | NO |
| 19 | CASK | CASK | CASK | 9174 | 0.00036 | 0.27 | NO |
| 20 | SRC | SRC | SRC | 9516 | -0.0029 | 0.26 | NO |
| 21 | CASP3 | CASP3 | CASP3 | 10071 | -0.0087 | 0.23 | NO |
| 22 | EZR | EZR | EZR | 10152 | -0.0095 | 0.23 | NO |
| 23 | PRKACA | PRKACA | PRKACA | 10243 | -0.01 | 0.22 | NO |
| 24 | ITGA2 | ITGA2 | ITGA2 | 10360 | -0.012 | 0.22 | NO |
| 25 | RASA1 | RASA1 | RASA1 | 10729 | -0.016 | 0.21 | NO |
| 26 | MAPK8 | MAPK8 | MAPK8 | 10782 | -0.016 | 0.21 | NO |
| 27 | NF1 | NF1 | NF1 | 10957 | -0.018 | 0.21 | NO |
| 28 | KNG1 | KNG1 | KNG1 | 11137 | -0.02 | 0.2 | NO |
| 29 | MAPK1 | MAPK1 | MAPK1 | 11966 | -0.031 | 0.17 | NO |
| 30 | PRKCD | PRKCD | PRKCD | 12104 | -0.033 | 0.17 | NO |
| 31 | MAPK3 | MAPK3 | MAPK3 | 12674 | -0.04 | 0.16 | NO |
| 32 | EPB41 | EPB41 | EPB41 | 15932 | -0.13 | 0.02 | NO |
| 33 | TNFRSF13B | TNFRSF13B | TNFRSF13B | 18071 | -0.34 | 0.016 | NO |
Figure S13. Get High-res Image This plot shows mRNAseq_cNMF expression data heatmap (on the left) a RunningEnrichmentScore(RES) plot (on the top right) and a Signal2Noise(S2N) plot (on the bottom right) of genes in the pathway: REACTOME CHONDROITIN SULFATE DERMATAN SULFATE METABOLISM.
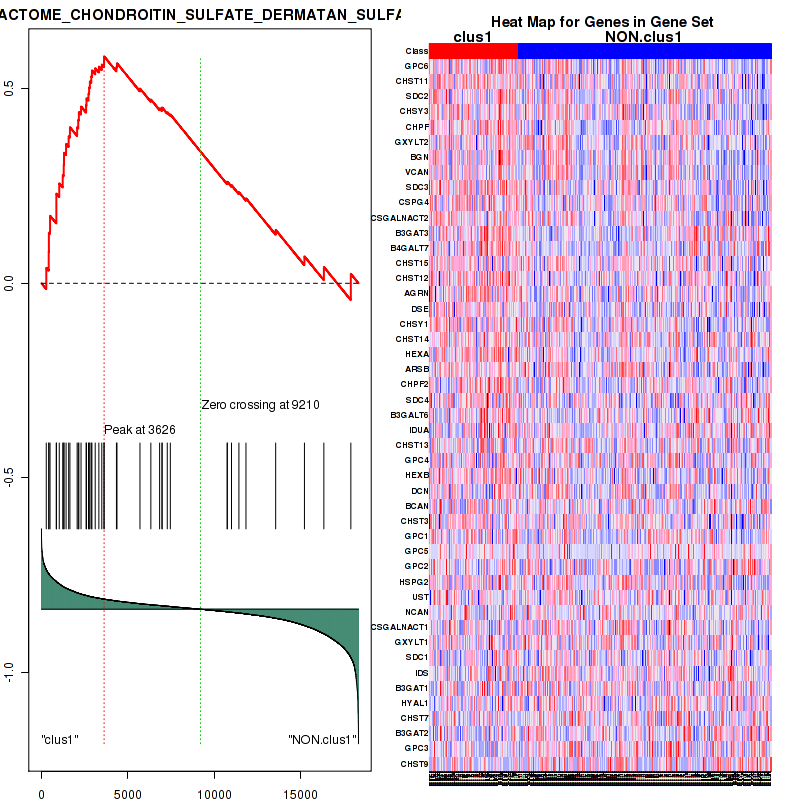
Figure S14. Get High-res Image For the top 5 core enriched genes in the pathway: REACTOME CHONDROITIN SULFATE DERMATAN SULFATE METABOLISM, this volcano plot shows how much they are up/down-regulated and significant. The significance was calculated by empirical bayesian fit

Table S8. Get Full Table This table shows a Running Enrichment Score (RES) of each gene in this pathway, that is, the enrichment score at this point in the ranked list of genes. All genes are ranked by Signal-to-Noise (S2N), a measure of similarity as default and are used to obtain ES matrix of all genes. In this way, GSEA tool uses expression pattern of not only overlapped genes but also not-overlapped genes to produce ES matrix.
| Rank | GENE | SYMBOL | DESC | LIST.LOC | S2N | RES | CORE_ENRICHMENT |
|---|---|---|---|---|---|---|---|
| 1 | SNAPC1 | SNAPC1 | SNAPC1 | 1563 | 0.12 | 0.037 | YES |
| 2 | SNAPC2 | SNAPC2 | SNAPC2 | 2480 | 0.088 | 0.074 | YES |
| 3 | POLR2L | POLR2L | POLR2L | 3333 | 0.068 | 0.095 | YES |
| 4 | POLR2H | POLR2H | POLR2H | 3471 | 0.065 | 0.15 | YES |
| 5 | POLR2F | POLR2F | POLR2F | 3517 | 0.064 | 0.21 | YES |
| 6 | LZTS1 | LZTS1 | LZTS1 | 3779 | 0.06 | 0.26 | YES |
| 7 | SNAPC4 | SNAPC4 | SNAPC4 | 3877 | 0.058 | 0.31 | YES |
| 8 | POLR2K | POLR2K | POLR2K | 4907 | 0.044 | 0.3 | YES |
| 9 | POLR3D | POLR3D | POLR3D | 4915 | 0.044 | 0.34 | YES |
| 10 | POLR3GL | POLR3GL | POLR3GL | 5129 | 0.041 | 0.37 | YES |
| 11 | POLR3K | POLR3K | POLR3K | 5633 | 0.035 | 0.38 | YES |
| 12 | POLR1C | POLR1C | POLR1C | 5667 | 0.034 | 0.41 | YES |
| 13 | POLR3H | POLR3H | POLR3H | 5960 | 0.031 | 0.42 | YES |
| 14 | POLR3C | POLR3C | POLR3C | 6252 | 0.028 | 0.44 | YES |
| 15 | TBP | TBP | TBP | 7019 | 0.021 | 0.42 | NO |
| 16 | POLR1D | POLR1D | POLR1D | 7351 | 0.018 | 0.42 | NO |
| 17 | BRF2 | BRF2 | BRF2 | 7475 | 0.016 | 0.43 | NO |
| 18 | POLR3A | POLR3A | POLR3A | 8295 | 0.0086 | 0.39 | NO |
| 19 | POLR2E | POLR2E | POLR2E | 8347 | 0.0082 | 0.4 | NO |
| 20 | POLR3F | POLR3F | POLR3F | 8355 | 0.0082 | 0.4 | NO |
| 21 | SNAPC5 | SNAPC5 | SNAPC5 | 9582 | -0.0035 | 0.34 | NO |
| 22 | ZNF143 | ZNF143 | ZNF143 | 10055 | -0.0086 | 0.32 | NO |
| 23 | POLR3E | POLR3E | POLR3E | 10253 | -0.01 | 0.32 | NO |
| 24 | SNAPC3 | SNAPC3 | SNAPC3 | 10657 | -0.015 | 0.32 | NO |
| 25 | POLR3B | POLR3B | POLR3B | 12967 | -0.045 | 0.23 | NO |
| 26 | POU2F1 | POU2F1 | POU2F1 | 13765 | -0.06 | 0.25 | NO |
Figure S15. Get High-res Image This plot shows mRNAseq_cNMF expression data heatmap (on the left) a RunningEnrichmentScore(RES) plot (on the top right) and a Signal2Noise(S2N) plot (on the bottom right) of genes in the pathway: REACTOME MRNA CAPPING.
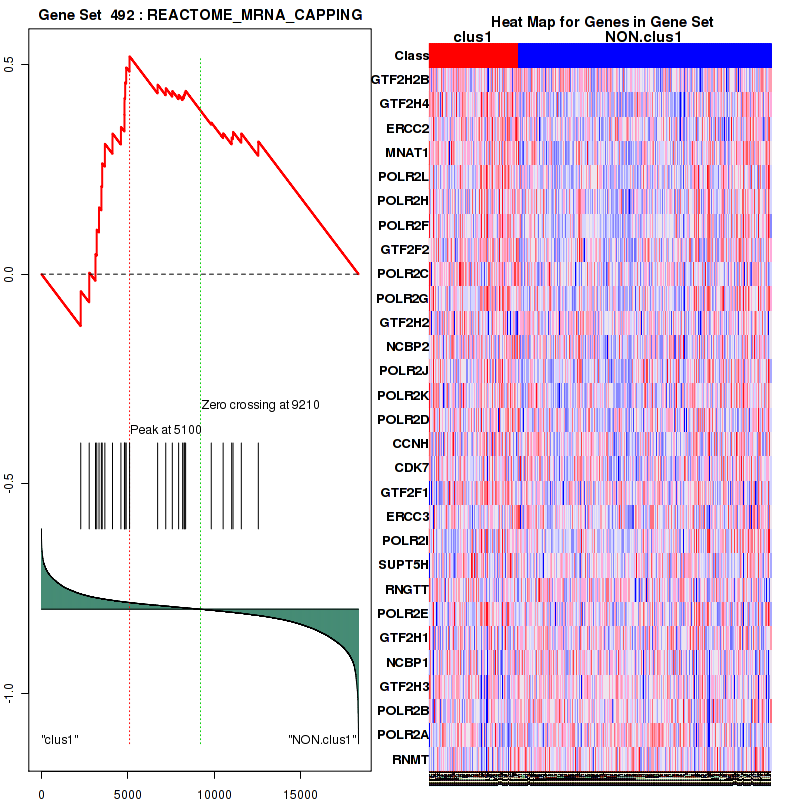
Figure S16. Get High-res Image For the top 5 core enriched genes in the pathway: REACTOME MRNA CAPPING, this volcano plot shows how much they are up/down-regulated and significant. The significance was calculated by empirical bayesian fit
Table S9. Get Full Table This table shows a Running Enrichment Score (RES) of each gene in this pathway, that is, the enrichment score at this point in the ranked list of genes. All genes are ranked by Signal-to-Noise (S2N), a measure of similarity as default and are used to obtain ES matrix of all genes. In this way, GSEA tool uses expression pattern of not only overlapped genes but also not-overlapped genes to produce ES matrix.
| Rank | GENE | SYMBOL | DESC | LIST.LOC | S2N | RES | CORE_ENRICHMENT |
|---|---|---|---|---|---|---|---|
| 1 | KIFC3 | KIFC3 | KIFC3 | 1346 | 0.13 | 0.05 | YES |
| 2 | SPHK1 | SPHK1 | SPHK1 | 1900 | 0.11 | 0.12 | YES |
| 3 | FKBP9 | FKBP9 | FKBP9 | 2236 | 0.095 | 0.19 | YES |
| 4 | CCT6A | CCT6A | CCT6A | 3996 | 0.056 | 0.15 | YES |
| 5 | CCT3 | CCT3 | CCT3 | 4040 | 0.056 | 0.2 | YES |
| 6 | CCT5 | CCT5 | CCT5 | 4053 | 0.056 | 0.25 | YES |
| 7 | CCT2 | CCT2 | CCT2 | 4735 | 0.046 | 0.25 | YES |
| 8 | CCT4 | CCT4 | CCT4 | 4906 | 0.044 | 0.28 | YES |
| 9 | FBXO4 | FBXO4 | FBXO4 | 5172 | 0.04 | 0.3 | YES |
| 10 | USP11 | USP11 | USP11 | 5415 | 0.037 | 0.33 | YES |
| 11 | CCT7 | CCT7 | CCT7 | 5518 | 0.036 | 0.35 | YES |
| 12 | NOP56 | NOP56 | NOP56 | 5811 | 0.033 | 0.37 | YES |
| 13 | LONP2 | LONP2 | LONP2 | 6190 | 0.029 | 0.38 | YES |
| 14 | TCP1 | TCP1 | TCP1 | 6251 | 0.028 | 0.4 | YES |
| 15 | CCT8 | CCT8 | CCT8 | 6573 | 0.025 | 0.4 | YES |
| 16 | FBXW7 | FBXW7 | FBXW7 | 9219 | -0.00013 | 0.26 | NO |
| 17 | XRN2 | XRN2 | XRN2 | 9283 | -0.0007 | 0.26 | NO |
| 18 | FBXW2 | FBXW2 | FBXW2 | 9644 | -0.0041 | 0.24 | NO |
| 19 | FBXW4 | FBXW4 | FBXW4 | 9891 | -0.0068 | 0.23 | NO |
| 20 | FBXO6 | FBXO6 | FBXO6 | 9896 | -0.0068 | 0.24 | NO |
| 21 | FBXW5 | FBXW5 | FBXW5 | 11423 | -0.024 | 0.18 | NO |
| 22 | AP3M1 | AP3M1 | AP3M1 | 11696 | -0.027 | 0.19 | NO |
| 23 | FBXL3 | FBXL3 | FBXL3 | 13006 | -0.046 | 0.16 | NO |
| 24 | KIF13A | KIF13A | KIF13A | 13007 | -0.046 | 0.2 | NO |
| 25 | FBXL5 | FBXL5 | FBXL5 | 13036 | -0.046 | 0.24 | NO |
| 26 | ARFGEF2 | ARFGEF2 | ARFGEF2 | 13375 | -0.052 | 0.27 | NO |
Figure S17. Get High-res Image This plot shows mRNAseq_cNMF expression data heatmap (on the left) a RunningEnrichmentScore(RES) plot (on the top right) and a Signal2Noise(S2N) plot (on the bottom right) of genes in the pathway: REACTOME ASSOCIATION OF TRIC CCT WITH TARGET PROTEINS DURING BIOSYNTHESIS.
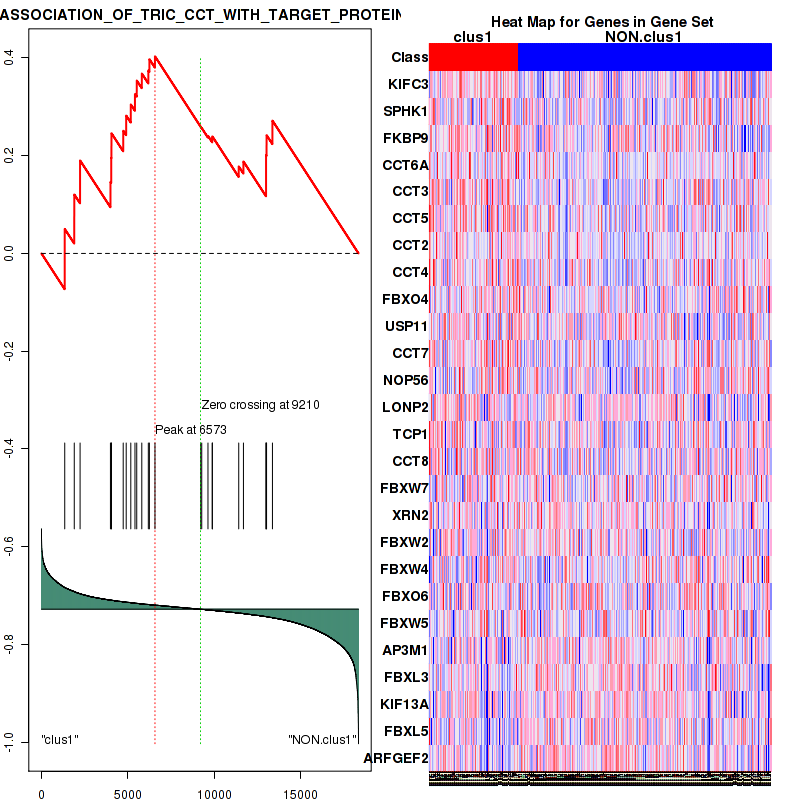
Figure S18. Get High-res Image For the top 5 core enriched genes in the pathway: REACTOME ASSOCIATION OF TRIC CCT WITH TARGET PROTEINS DURING BIOSYNTHESIS, this volcano plot shows how much they are up/down-regulated and significant. The significance was calculated by empirical bayesian fit
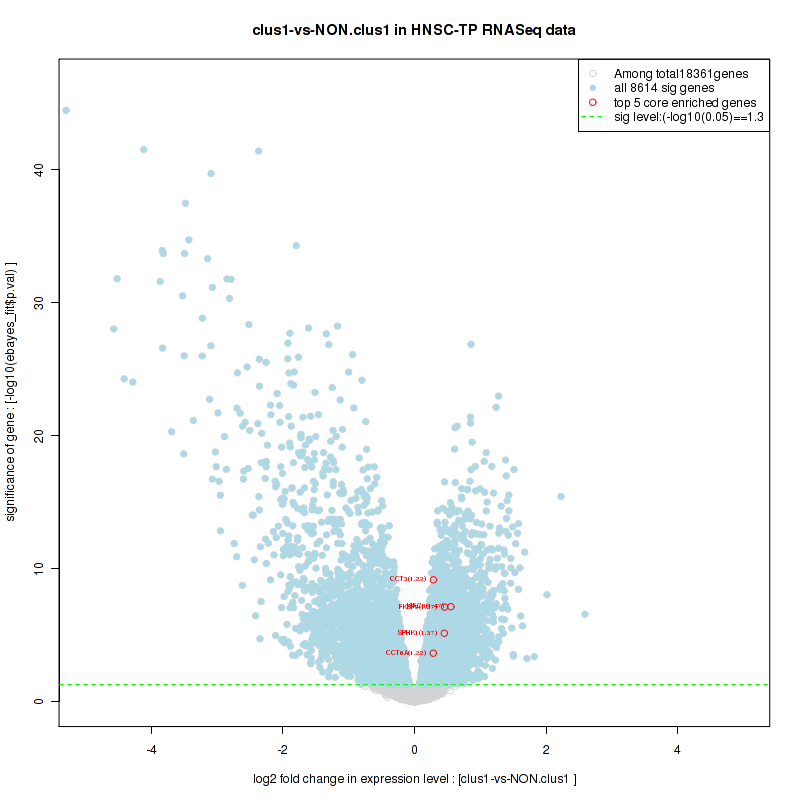
Table S10. Get Full Table This table shows a Running Enrichment Score (RES) of each gene in this pathway, that is, the enrichment score at this point in the ranked list of genes. All genes are ranked by Signal-to-Noise (S2N), a measure of similarity as default and are used to obtain ES matrix of all genes. In this way, GSEA tool uses expression pattern of not only overlapped genes but also not-overlapped genes to produce ES matrix.
| Rank | GENE | SYMBOL | DESC | LIST.LOC | S2N | RES | CORE_ENRICHMENT |
|---|---|---|---|---|---|---|---|
| 1 | GTF2H2B | GTF2H2B | GTF2H2B | 2273 | 0.094 | -0.037 | YES |
| 2 | GTF2H4 | GTF2H4 | GTF2H4 | 2766 | 0.08 | 0.01 | YES |
| 3 | ERCC2 | ERCC2 | ERCC2 | 3128 | 0.072 | 0.057 | YES |
| 4 | MNAT1 | MNAT1 | MNAT1 | 3200 | 0.07 | 0.12 | YES |
| 5 | POLR2L | POLR2L | POLR2L | 3333 | 0.068 | 0.17 | YES |
| 6 | POLR2H | POLR2H | POLR2H | 3471 | 0.065 | 0.23 | YES |
| 7 | POLR2F | POLR2F | POLR2F | 3517 | 0.064 | 0.28 | YES |
| 8 | POLR2C | POLR2C | POLR2C | 4114 | 0.055 | 0.3 | YES |
| 9 | POLR2G | POLR2G | POLR2G | 4602 | 0.048 | 0.32 | YES |
| 10 | GTF2H2 | GTF2H2 | GTF2H2 | 4807 | 0.045 | 0.35 | YES |
| 11 | POLR2J | POLR2J | POLR2J | 4847 | 0.044 | 0.39 | YES |
| 12 | POLR2K | POLR2K | POLR2K | 4907 | 0.044 | 0.42 | YES |
| 13 | POLR2D | POLR2D | POLR2D | 5100 | 0.042 | 0.45 | YES |
| 14 | ERCC1 | ERCC1 | ERCC1 | 5256 | 0.039 | 0.48 | YES |
| 15 | XAB2 | XAB2 | XAB2 | 6465 | 0.026 | 0.44 | NO |
| 16 | CCNH | CCNH | CCNH | 6726 | 0.024 | 0.45 | NO |
| 17 | CDK7 | CDK7 | CDK7 | 7198 | 0.02 | 0.44 | NO |
| 18 | TCEA1 | TCEA1 | TCEA1 | 7412 | 0.017 | 0.44 | NO |
| 19 | ERCC8 | ERCC8 | ERCC8 | 7425 | 0.017 | 0.46 | NO |
| 20 | ERCC3 | ERCC3 | ERCC3 | 7941 | 0.012 | 0.44 | NO |
| 21 | POLR2I | POLR2I | POLR2I | 8175 | 0.0097 | 0.44 | NO |
| 22 | POLR2E | POLR2E | POLR2E | 8347 | 0.0082 | 0.44 | NO |
| 23 | ERCC6 | ERCC6 | ERCC6 | 8499 | 0.0067 | 0.43 | NO |
| 24 | ERCC5 | ERCC5 | ERCC5 | 9310 | -0.00097 | 0.39 | NO |
| 25 | GTF2H1 | GTF2H1 | GTF2H1 | 9835 | -0.0062 | 0.37 | NO |
| 26 | GTF2H3 | GTF2H3 | GTF2H3 | 11014 | -0.019 | 0.32 | NO |
| 27 | POLR2B | POLR2B | POLR2B | 11093 | -0.02 | 0.34 | NO |
| 28 | POLR2A | POLR2A | POLR2A | 11574 | -0.025 | 0.33 | NO |
| 29 | ERCC4 | ERCC4 | ERCC4 | 12687 | -0.041 | 0.31 | NO |
Figure S19. Get High-res Image This plot shows mRNAseq_cNMF expression data heatmap (on the left) a RunningEnrichmentScore(RES) plot (on the top right) and a Signal2Noise(S2N) plot (on the bottom right) of genes in the pathway: REACTOME PROTEIN FOLDING.
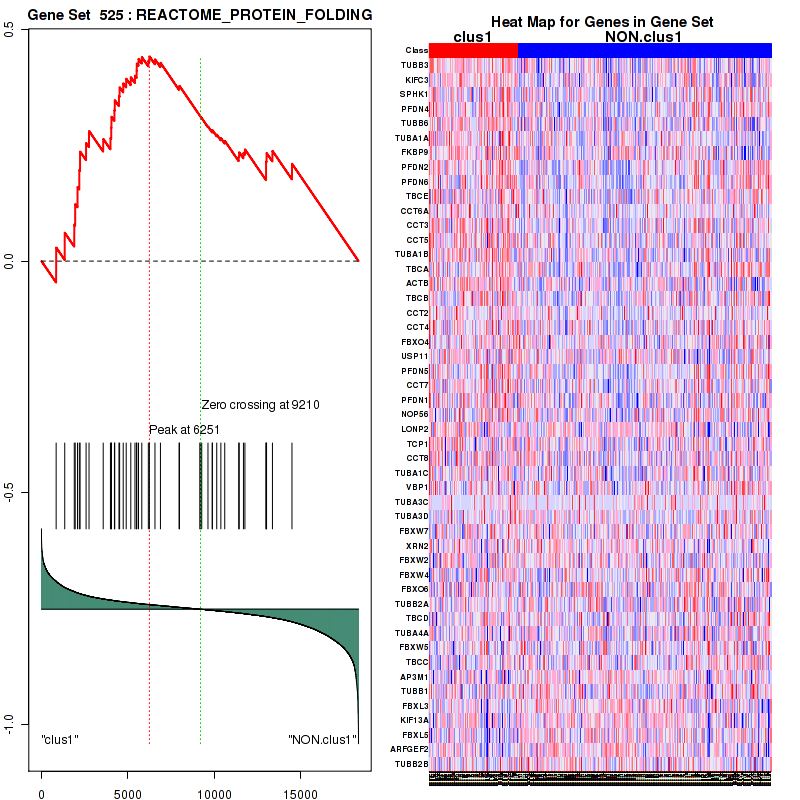
Figure S20. Get High-res Image For the top 5 core enriched genes in the pathway: REACTOME PROTEIN FOLDING, this volcano plot shows how much they are up/down-regulated and significant. The significance was calculated by empirical bayesian fit
For the top enriched genes, if you want to check whether they are
-
up-regulated, please check the list of up-regulated genes
-
down-regulated, please check the list of down-regulated genes
For the top enriched genes, if you want to check whether they are
-
highly expressed genes, please check the list of high (top 30%) expressed genes
-
low expressed genes, please check the list of low (bottom 30%) expressed genes
An expression pattern of top(30%)/middle(30%)/low(30%) in this subtype against other subtypes is available in a heatmap
For the top enriched genes, if you want to check whether they are
-
significantly differently expressed genes by eBayes lm fit, please check the list of significant genes
Table 4. Get Full Table This table shows top 10 pathways which are significantly enriched in cluster clus2. It displays only significant gene sets satisfying nom.p.val.threshold (-1), fwer.p.val.threshold (-1) , fdr.q.val.threshold (0.25) and the default table is sorted by Normalized Enrichment Score (NES). Further details on NES statistics, please visit The Broad GSEA website.
| GeneSet(GS) | Size(#genes) | genes.ES.table | ES | NES | NOM.p.val | FDR.q.val | FWER.p.val | Tag.. | Gene.. | Signal | FDR..median. | glob.p.val |
|---|---|---|---|---|---|---|---|---|---|---|---|---|
| KEGG PROTEASOME | 43 | genes.ES.table | 0.53 | 1.5 | 0.099 | 1 | 0.98 | 0.79 | 0.27 | 0.58 | 0.77 | 0.41 |
| KEGG CYTOSOLIC DNA SENSING PATHWAY | 44 | genes.ES.table | 0.57 | 1.6 | 0.078 | 1 | 0.97 | 0.34 | 0.14 | 0.3 | 0.8 | 0.43 |
| BIOCARTA PROTEASOME PATHWAY | 28 | genes.ES.table | 0.59 | 1.5 | 0.049 | 1 | 0.98 | 0.68 | 0.23 | 0.52 | 0.81 | 0.43 |
| PID MTOR 4PATHWAY | 67 | genes.ES.table | 0.32 | 1.7 | 0.049 | 1 | 0.85 | 0.42 | 0.2 | 0.33 | 1 | 0.73 |
| REACTOME FORMATION OF THE TERNARY COMPLEX AND SUBSEQUENTLY THE 43S COMPLEX | 49 | genes.ES.table | 0.63 | 1.7 | 0.047 | 1 | 0.86 | 0.92 | 0.25 | 0.69 | 1 | 0.56 |
| REACTOME SIGNALING BY WNT | 63 | genes.ES.table | 0.42 | 1.6 | 0.072 | 1 | 0.9 | 0.6 | 0.23 | 0.46 | 1 | 0.5 |
| REACTOME TRIF MEDIATED TLR3 SIGNALING | 72 | genes.ES.table | 0.38 | 1.6 | 0.069 | 1 | 0.97 | 0.26 | 0.14 | 0.23 | 0.88 | 0.45 |
| REACTOME ER PHAGOSOME PATHWAY | 58 | genes.ES.table | 0.5 | 1.5 | 0.13 | 1 | 0.99 | 0.64 | 0.23 | 0.49 | 0.79 | 0.4 |
| REACTOME ACTIVATION OF THE MRNA UPON BINDING OF THE CAP BINDING COMPLEX AND EIFS AND SUBSEQUENT BINDING TO 43S | 57 | genes.ES.table | 0.57 | 1.6 | 0.08 | 1 | 0.91 | 0.88 | 0.25 | 0.66 | 0.86 | 0.44 |
| REACTOME REGULATION OF ORNITHINE DECARBOXYLASE ODC | 48 | genes.ES.table | 0.51 | 1.6 | 0.091 | 1 | 0.93 | 0.67 | 0.25 | 0.5 | 0.81 | 0.42 |
Table S11. Get Full Table This table shows a Running Enrichment Score (RES) of each gene in this pathway, that is, the enrichment score at this point in the ranked list of genes. All genes are ranked by Signal-to-Noise (S2N), a measure of similarity as default and are used to obtain ES matrix of all genes. In this way, GSEA tool uses expression pattern of not only overlapped genes but also not-overlapped genes to produce ES matrix.
| Rank | GENE | SYMBOL | DESC | LIST.LOC | S2N | RES | CORE_ENRICHMENT |
|---|---|---|---|---|---|---|---|
| 1 | PLD2 | PLD2 | PLD2 | 486 | 0.27 | 0.036 | YES |
| 2 | SFN | SFN | SFN | 561 | 0.24 | 0.089 | YES |
| 3 | BNIP3 | BNIP3 | BNIP3 | 908 | 0.17 | 0.11 | YES |
| 4 | MAPK3 | MAPK3 | MAPK3 | 1080 | 0.15 | 0.13 | YES |
| 5 | HRAS | HRAS | HRAS | 1203 | 0.13 | 0.16 | YES |
| 6 | CLIP1 | CLIP1 | CLIP1 | 1499 | 0.11 | 0.17 | YES |
| 7 | YWHAZ | YWHAZ | YWHAZ | 1606 | 0.099 | 0.18 | YES |
| 8 | EIF4E | EIF4E | EIF4E | 1674 | 0.095 | 0.2 | YES |
| 9 | RRAGC | RRAGC | RRAGC | 1794 | 0.088 | 0.22 | YES |
| 10 | CCNE1 | CCNE1 | CCNE1 | 1838 | 0.085 | 0.24 | YES |
| 11 | IRS1 | IRS1 | IRS1 | 2008 | 0.077 | 0.24 | YES |
| 12 | RRAGA | RRAGA | RRAGA | 2460 | 0.06 | 0.23 | YES |
| 13 | AKT1S1 | AKT1S1 | AKT1S1 | 2675 | 0.054 | 0.24 | YES |
| 14 | EIF4EBP1 | EIF4EBP1 | EIF4EBP1 | 2684 | 0.054 | 0.25 | YES |
| 15 | YWHAQ | YWHAQ | YWHAQ | 2707 | 0.053 | 0.26 | YES |
| 16 | EIF4A1 | EIF4A1 | EIF4A1 | 2709 | 0.053 | 0.27 | YES |
| 17 | PML | PML | PML | 2722 | 0.053 | 0.28 | YES |
| 18 | RAC1 | RAC1 | RAC1 | 2746 | 0.052 | 0.29 | YES |
| 19 | CYCS | CYCS | CYCS | 2988 | 0.046 | 0.29 | YES |
| 20 | YWHAB | YWHAB | YWHAB | 3078 | 0.043 | 0.3 | YES |
| 21 | PDCD4 | PDCD4 | PDCD4 | 3082 | 0.043 | 0.31 | YES |
| 22 | RPTOR | RPTOR | RPTOR | 3143 | 0.042 | 0.31 | YES |
| 23 | PLD1 | PLD1 | PLD1 | 3287 | 0.038 | 0.31 | YES |
| 24 | NRAS | NRAS | NRAS | 3442 | 0.035 | 0.31 | YES |
| 25 | PXN | PXN | PXN | 3594 | 0.032 | 0.31 | YES |
| 26 | MAP2K2 | MAP2K2 | MAP2K2 | 3723 | 0.029 | 0.31 | YES |
| 27 | RHOA | RHOA | RHOA | 3748 | 0.028 | 0.32 | YES |
| 28 | RPS6KB1 | RPS6KB1 | RPS6KB1 | 3753 | 0.028 | 0.32 | YES |
| 29 | RPS6KA1 | RPS6KA1 | RPS6KA1 | 3925 | 0.025 | 0.32 | NO |
| 30 | YWHAE | YWHAE | YWHAE | 4538 | 0.014 | 0.29 | NO |
| 31 | DDIT4 | DDIT4 | DDIT4 | 4821 | 0.0096 | 0.28 | NO |
| 32 | MAPKAP1 | MAPKAP1 | MAPKAP1 | 4831 | 0.0094 | 0.28 | NO |
| 33 | MTOR | MTOR | MTOR | 4845 | 0.0091 | 0.28 | NO |
| 34 | ULK1 | ULK1 | ULK1 | 4856 | 0.0089 | 0.28 | NO |
| 35 | FBXW11 | FBXW11 | FBXW11 | 4931 | 0.0078 | 0.28 | NO |
| 36 | MAPK1 | MAPK1 | MAPK1 | 4985 | 0.0071 | 0.28 | NO |
| 37 | MLST8 | MLST8 | MLST8 | 5256 | 0.0026 | 0.26 | NO |
| 38 | YWHAG | YWHAG | YWHAG | 5408 | 0.00022 | 0.26 | NO |
| 39 | EEF2 | EEF2 | EEF2 | 5476 | -0.00079 | 0.25 | NO |
| 40 | PDPK1 | PDPK1 | PDPK1 | 5659 | -0.0035 | 0.24 | NO |
| 41 | MAP2K1 | MAP2K1 | MAP2K1 | 5711 | -0.0042 | 0.24 | NO |
| 42 | RAF1 | RAF1 | RAF1 | 5780 | -0.0053 | 0.24 | NO |
| 43 | TSC1 | TSC1 | TSC1 | 5950 | -0.0082 | 0.23 | NO |
| 44 | KRAS | KRAS | KRAS | 6233 | -0.012 | 0.22 | NO |
| 45 | EIF4B | EIF4B | EIF4B | 6443 | -0.015 | 0.21 | NO |
| 46 | SGK1 | SGK1 | SGK1 | 6558 | -0.017 | 0.21 | NO |
| 47 | YY1 | YY1 | YY1 | 7290 | -0.028 | 0.18 | NO |
| 48 | PRR5 | PRR5 | PRR5 | 7414 | -0.03 | 0.18 | NO |
| 49 | TSC2 | TSC2 | TSC2 | 7661 | -0.034 | 0.17 | NO |
| 50 | BRAF | BRAF | BRAF | 7802 | -0.036 | 0.17 | NO |
| 51 | RB1CC1 | RB1CC1 | RB1CC1 | 7900 | -0.038 | 0.18 | NO |
| 52 | SREBF1 | SREBF1 | SREBF1 | 7922 | -0.038 | 0.18 | NO |
| 53 | AKT1 | AKT1 | AKT1 | 7990 | -0.039 | 0.19 | NO |
| 54 | RRN3 | RRN3 | RRN3 | 8197 | -0.043 | 0.19 | NO |
| 55 | YWHAH | YWHAH | YWHAH | 8198 | -0.043 | 0.2 | NO |
| 56 | ULK2 | ULK2 | ULK2 | 8434 | -0.046 | 0.2 | NO |
| 57 | POLDIP3 | POLDIP3 | POLDIP3 | 8661 | -0.05 | 0.2 | NO |
| 58 | IKBKB | IKBKB | IKBKB | 8809 | -0.053 | 0.2 | NO |
| 59 | RICTOR | RICTOR | RICTOR | 9204 | -0.06 | 0.19 | NO |
| 60 | EEF2K | EEF2K | EEF2K | 9583 | -0.068 | 0.19 | NO |
| 61 | RHEB | RHEB | RHEB | 9594 | -0.068 | 0.2 | NO |
| 62 | CDK2 | CDK2 | CDK2 | 11421 | -0.11 | 0.13 | NO |
| 63 | PRKCA | PRKCA | PRKCA | 12396 | -0.14 | 0.11 | NO |
| 64 | RRAGB | RRAGB | RRAGB | 13145 | -0.16 | 0.1 | NO |
| 65 | RRAGD | RRAGD | RRAGD | 14187 | -0.2 | 0.094 | NO |
| 66 | SSPO | SSPO | SSPO | 14937 | -0.23 | 0.11 | NO |
| 67 | PPARGC1A | PPARGC1A | PPARGC1A | 17007 | -0.34 | 0.074 | NO |
Figure S21. Get High-res Image This plot shows mRNAseq_cNMF expression data heatmap (on the left) a RunningEnrichmentScore(RES) plot (on the top right) and a Signal2Noise(S2N) plot (on the bottom right) of genes in the pathway: KEGG PROTEASOME.
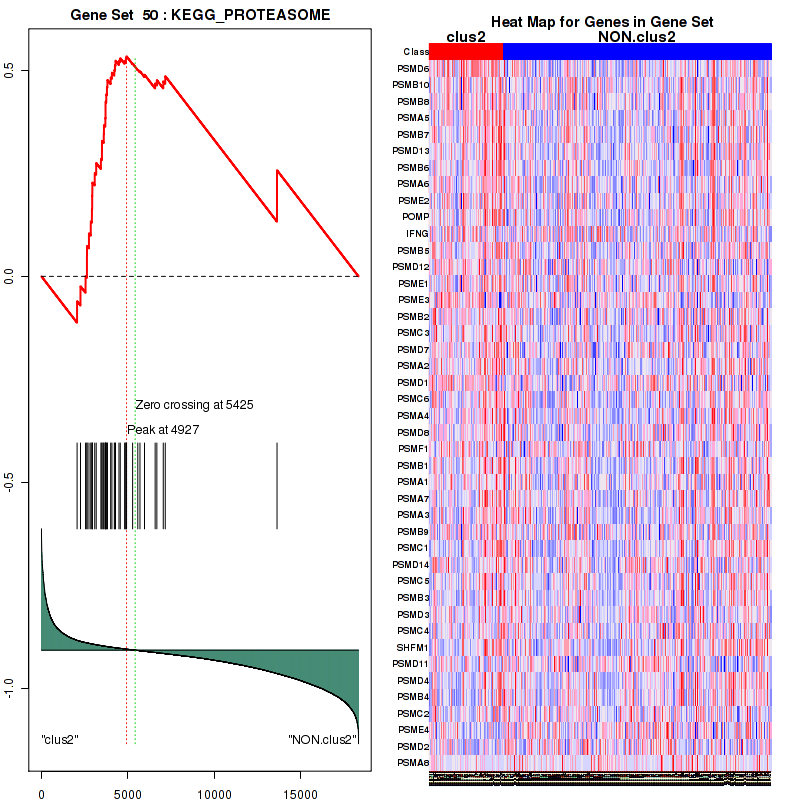
Figure S22. Get High-res Image For the top 5 core enriched genes in the pathway: KEGG PROTEASOME, this volcano plot shows how much they are up/down-regulated and significant. The significance was calculated by empirical bayesian fit
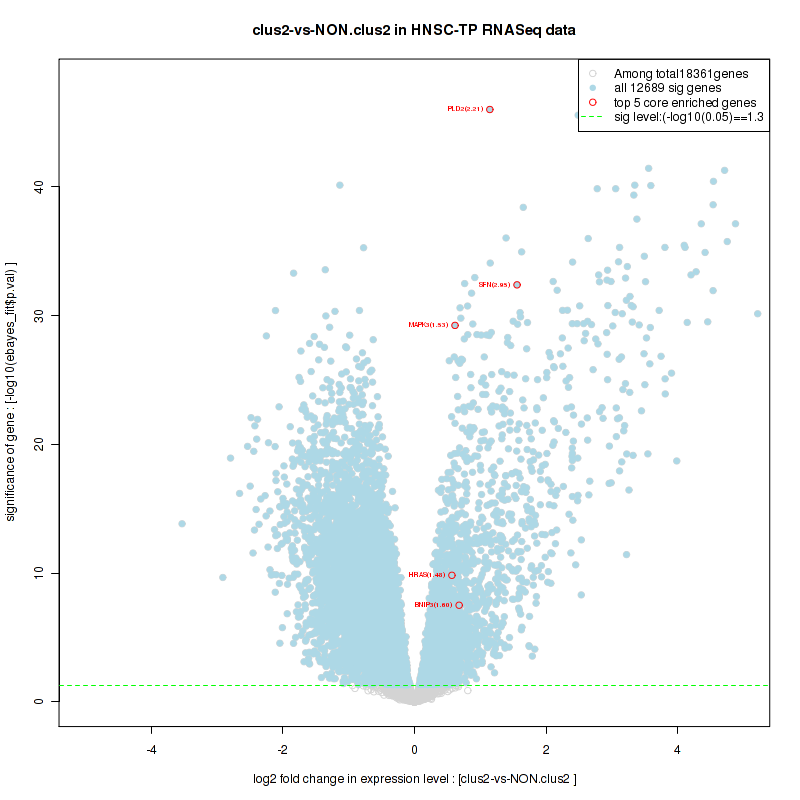
Table S12. Get Full Table This table shows a Running Enrichment Score (RES) of each gene in this pathway, that is, the enrichment score at this point in the ranked list of genes. All genes are ranked by Signal-to-Noise (S2N), a measure of similarity as default and are used to obtain ES matrix of all genes. In this way, GSEA tool uses expression pattern of not only overlapped genes but also not-overlapped genes to produce ES matrix.
| Rank | GENE | SYMBOL | DESC | LIST.LOC | S2N | RES | CORE_ENRICHMENT |
|---|---|---|---|---|---|---|---|
| 1 | EIF2S1 | EIF2S1 | EIF2S1 | 2178 | 0.07 | -0.079 | YES |
| 2 | RPS13 | RPS13 | RPS13 | 2249 | 0.067 | -0.045 | YES |
| 3 | RPS12 | RPS12 | RPS12 | 2499 | 0.059 | -0.025 | YES |
| 4 | RPS10 | RPS10 | RPS10 | 2655 | 0.055 | -0.0029 | YES |
| 5 | EIF3I | EIF3I | EIF3I | 2690 | 0.054 | 0.026 | YES |
| 6 | RPS3 | RPS3 | RPS3 | 2803 | 0.051 | 0.048 | YES |
| 7 | EIF3J | EIF3J | EIF3J | 2856 | 0.049 | 0.073 | YES |
| 8 | EIF3B | EIF3B | EIF3B | 2910 | 0.048 | 0.097 | YES |
| 9 | RPS24 | RPS24 | RPS24 | 3039 | 0.044 | 0.12 | YES |
| 10 | RPS16 | RPS16 | RPS16 | 3084 | 0.043 | 0.14 | YES |
| 11 | EIF1AX | EIF1AX | EIF1AX | 3093 | 0.043 | 0.16 | YES |
| 12 | RPS15 | RPS15 | RPS15 | 3096 | 0.043 | 0.18 | YES |
| 13 | RPS6 | RPS6 | RPS6 | 3097 | 0.043 | 0.21 | YES |
| 14 | RPSA | RPSA | RPSA | 3103 | 0.043 | 0.23 | YES |
| 15 | RPS29 | RPS29 | RPS29 | 3165 | 0.041 | 0.25 | YES |
| 16 | RPS25 | RPS25 | RPS25 | 3166 | 0.041 | 0.28 | YES |
| 17 | EIF2S3 | EIF2S3 | EIF2S3 | 3181 | 0.041 | 0.3 | YES |
| 18 | RPS14 | RPS14 | RPS14 | 3236 | 0.039 | 0.32 | YES |
| 19 | RPS18 | RPS18 | RPS18 | 3335 | 0.037 | 0.33 | YES |
| 20 | RPS2 | RPS2 | RPS2 | 3413 | 0.036 | 0.35 | YES |
| 21 | RPS9 | RPS9 | RPS9 | 3517 | 0.033 | 0.36 | YES |
| 22 | RPS15A | RPS15A | RPS15A | 3523 | 0.033 | 0.38 | YES |
| 23 | RPS7 | RPS7 | RPS7 | 3577 | 0.032 | 0.4 | YES |
| 24 | FAU | FAU | FAU | 3596 | 0.032 | 0.41 | YES |
| 25 | RPS3A | RPS3A | RPS3A | 3629 | 0.031 | 0.43 | YES |
| 26 | RPS17 | RPS17 | RPS17 | 3644 | 0.031 | 0.45 | YES |
| 27 | RPS4X | RPS4X | RPS4X | 3673 | 0.03 | 0.46 | YES |
| 28 | RPS21 | RPS21 | RPS21 | 3701 | 0.029 | 0.48 | YES |
| 29 | EIF2S2 | EIF2S2 | EIF2S2 | 3705 | 0.029 | 0.49 | YES |
| 30 | RPS5 | RPS5 | RPS5 | 3751 | 0.028 | 0.51 | YES |
| 31 | EIF3H | EIF3H | EIF3H | 3759 | 0.028 | 0.52 | YES |
| 32 | EIF3E | EIF3E | EIF3E | 3783 | 0.028 | 0.54 | YES |
| 33 | RPS8 | RPS8 | RPS8 | 3866 | 0.026 | 0.55 | YES |
| 34 | RPS27A | RPS27A | RPS27A | 3887 | 0.026 | 0.56 | YES |
| 35 | EIF3F | EIF3F | EIF3F | 3944 | 0.024 | 0.57 | YES |
| 36 | RPS26 | RPS26 | RPS26 | 4005 | 0.023 | 0.58 | YES |
| 37 | RPS23 | RPS23 | RPS23 | 4116 | 0.021 | 0.59 | YES |
| 38 | EIF3D | EIF3D | EIF3D | 4233 | 0.019 | 0.59 | YES |
| 39 | EIF3A | EIF3A | EIF3A | 4343 | 0.018 | 0.6 | YES |
| 40 | RPS19 | RPS19 | RPS19 | 4466 | 0.015 | 0.6 | YES |
| 41 | EIF3K | EIF3K | EIF3K | 4494 | 0.015 | 0.6 | YES |
| 42 | EIF3G | EIF3G | EIF3G | 4513 | 0.015 | 0.61 | YES |
| 43 | RPS20 | RPS20 | RPS20 | 4574 | 0.014 | 0.62 | YES |
| 44 | RPS28 | RPS28 | RPS28 | 4610 | 0.013 | 0.62 | YES |
| 45 | RPS11 | RPS11 | RPS11 | 4611 | 0.013 | 0.63 | YES |
| 46 | RPSAP9 | RPSAP9 | RPSAP9 | 5001 | 0.0068 | 0.61 | NO |
| 47 | EIF3C | EIF3C | EIF3C | 6222 | -0.012 | 0.55 | NO |
| 48 | RPS27 | RPS27 | RPS27 | 6396 | -0.015 | 0.55 | NO |
| 49 | RPS4Y1 | RPS4Y1 | RPS4Y1 | 13743 | -0.18 | 0.25 | NO |
Figure S23. Get High-res Image This plot shows mRNAseq_cNMF expression data heatmap (on the left) a RunningEnrichmentScore(RES) plot (on the top right) and a Signal2Noise(S2N) plot (on the bottom right) of genes in the pathway: KEGG CYTOSOLIC DNA SENSING PATHWAY.
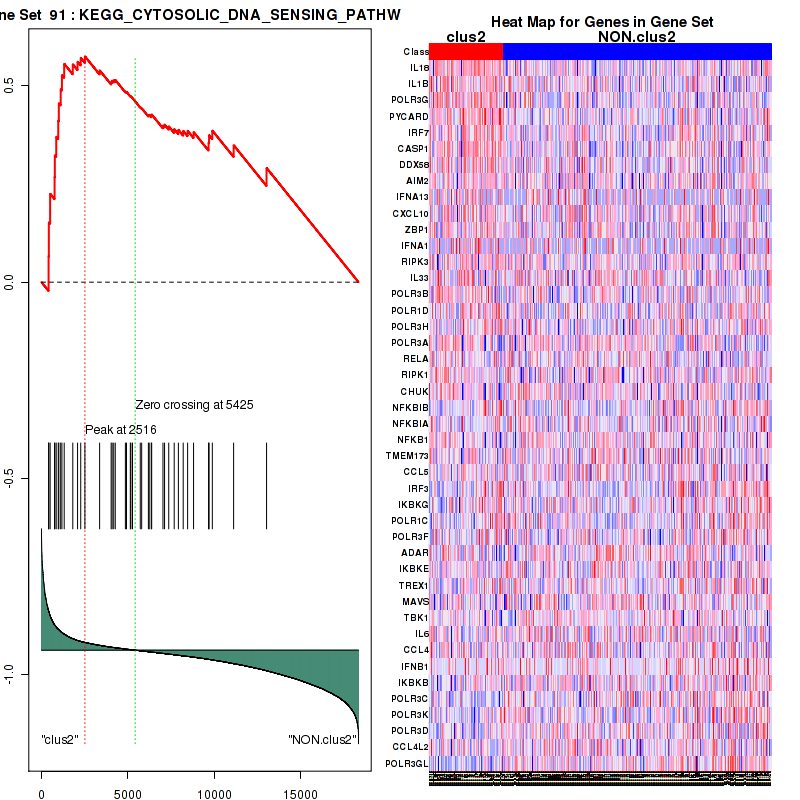
Figure S24. Get High-res Image For the top 5 core enriched genes in the pathway: KEGG CYTOSOLIC DNA SENSING PATHWAY, this volcano plot shows how much they are up/down-regulated and significant. The significance was calculated by empirical bayesian fit
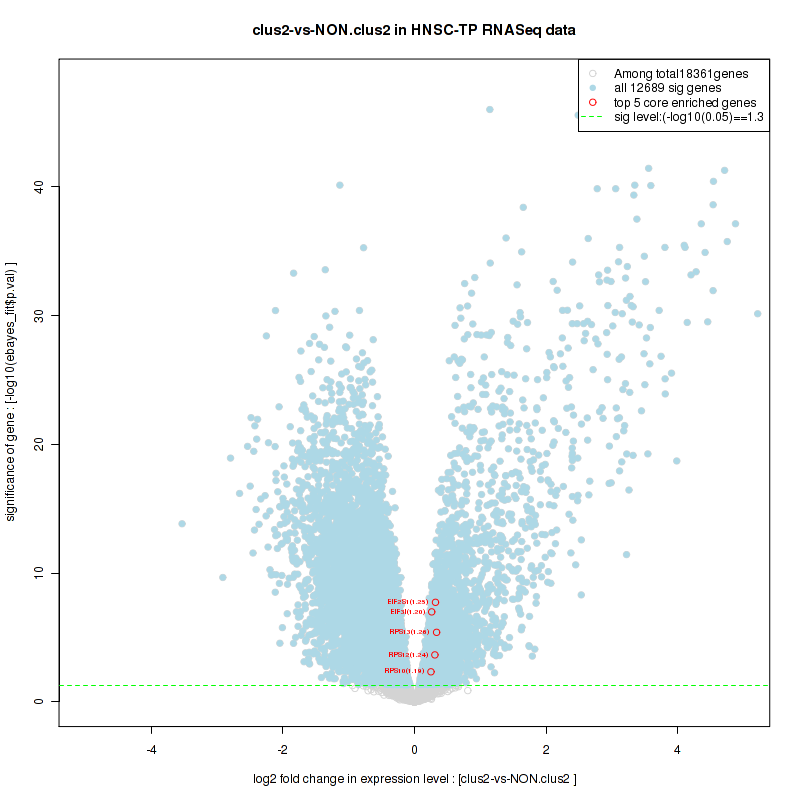
Table S13. Get Full Table This table shows a Running Enrichment Score (RES) of each gene in this pathway, that is, the enrichment score at this point in the ranked list of genes. All genes are ranked by Signal-to-Noise (S2N), a measure of similarity as default and are used to obtain ES matrix of all genes. In this way, GSEA tool uses expression pattern of not only overlapped genes but also not-overlapped genes to produce ES matrix.
| Rank | GENE | SYMBOL | DESC | LIST.LOC | S2N | RES | CORE_ENRICHMENT |
|---|---|---|---|---|---|---|---|
| 1 | CSNK1A1 | CSNK1A1 | CSNK1A1 | 1354 | 0.12 | -0.026 | YES |
| 2 | BTRC | BTRC | BTRC | 1742 | 0.091 | -0.011 | YES |
| 3 | PPP2R5B | PPP2R5B | PPP2R5B | 1899 | 0.083 | 0.014 | YES |
| 4 | PPP2R1B | PPP2R1B | PPP2R1B | 1928 | 0.081 | 0.045 | YES |
| 5 | PSMD6 | PSMD6 | PSMD6 | 2062 | 0.074 | 0.067 | YES |
| 6 | PPP2CA | PPP2CA | PPP2CA | 2190 | 0.07 | 0.088 | YES |
| 7 | PSMB10 | PSMB10 | PSMB10 | 2260 | 0.067 | 0.11 | YES |
| 8 | PSMB8 | PSMB8 | PSMB8 | 2554 | 0.058 | 0.12 | YES |
| 9 | PSMA5 | PSMA5 | PSMA5 | 2635 | 0.055 | 0.14 | YES |
| 10 | PSMB7 | PSMB7 | PSMB7 | 2636 | 0.055 | 0.16 | YES |
| 11 | PSMD13 | PSMD13 | PSMD13 | 2750 | 0.052 | 0.17 | YES |
| 12 | PSMB6 | PSMB6 | PSMB6 | 2857 | 0.049 | 0.19 | YES |
| 13 | PSMA6 | PSMA6 | PSMA6 | 2922 | 0.047 | 0.2 | YES |
| 14 | PSME2 | PSME2 | PSME2 | 2937 | 0.047 | 0.22 | YES |
| 15 | PPP2R1A | PPP2R1A | PPP2R1A | 3045 | 0.044 | 0.23 | YES |
| 16 | PSMB5 | PSMB5 | PSMB5 | 3170 | 0.041 | 0.24 | YES |
| 17 | PPP2R5E | PPP2R5E | PPP2R5E | 3204 | 0.04 | 0.26 | YES |
| 18 | PSMD12 | PSMD12 | PSMD12 | 3443 | 0.035 | 0.26 | YES |
| 19 | PSME1 | PSME1 | PSME1 | 3504 | 0.034 | 0.27 | YES |
| 20 | PSMB2 | PSMB2 | PSMB2 | 3607 | 0.032 | 0.28 | YES |
| 21 | PSMC3 | PSMC3 | PSMC3 | 3619 | 0.031 | 0.29 | YES |
| 22 | UBA52 | UBA52 | UBA52 | 3666 | 0.03 | 0.3 | YES |
| 23 | PSMD7 | PSMD7 | PSMD7 | 3699 | 0.029 | 0.31 | YES |
| 24 | PSMA2 | PSMA2 | PSMA2 | 3711 | 0.029 | 0.32 | YES |
| 25 | PSMD1 | PSMD1 | PSMD1 | 3712 | 0.029 | 0.33 | YES |
| 26 | PSMC6 | PSMC6 | PSMC6 | 3755 | 0.028 | 0.34 | YES |
| 27 | PSMA4 | PSMA4 | PSMA4 | 3792 | 0.028 | 0.35 | YES |
| 28 | PSMD8 | PSMD8 | PSMD8 | 3820 | 0.027 | 0.36 | YES |
| 29 | RPS27A | RPS27A | RPS27A | 3887 | 0.026 | 0.36 | YES |
| 30 | SKP1 | SKP1 | SKP1 | 3975 | 0.024 | 0.37 | YES |
| 31 | PSMF1 | PSMF1 | PSMF1 | 4009 | 0.023 | 0.38 | YES |
| 32 | PSMD9 | PSMD9 | PSMD9 | 4053 | 0.023 | 0.38 | YES |
| 33 | PSMB1 | PSMB1 | PSMB1 | 4079 | 0.022 | 0.39 | YES |
| 34 | CUL1 | CUL1 | CUL1 | 4167 | 0.02 | 0.39 | YES |
| 35 | PPP2CB | PPP2CB | PPP2CB | 4205 | 0.02 | 0.4 | YES |
| 36 | PSMA1 | PSMA1 | PSMA1 | 4220 | 0.02 | 0.41 | YES |
| 37 | PSMA7 | PSMA7 | PSMA7 | 4255 | 0.019 | 0.41 | YES |
| 38 | PSMA3 | PSMA3 | PSMA3 | 4289 | 0.019 | 0.42 | YES |
| 39 | PSMB9 | PSMB9 | PSMB9 | 4490 | 0.015 | 0.41 | NO |
| 40 | PSMC1 | PSMC1 | PSMC1 | 4562 | 0.014 | 0.42 | NO |
| 41 | PPP2R5A | PPP2R5A | PPP2R5A | 4728 | 0.011 | 0.41 | NO |
| 42 | PSMD14 | PSMD14 | PSMD14 | 4815 | 0.0097 | 0.41 | NO |
| 43 | PSMC5 | PSMC5 | PSMC5 | 4888 | 0.0085 | 0.41 | NO |
| 44 | PSMB3 | PSMB3 | PSMB3 | 4889 | 0.0084 | 0.41 | NO |
| 45 | PSMD3 | PSMD3 | PSMD3 | 4927 | 0.0079 | 0.41 | NO |
| 46 | PSMC4 | PSMC4 | PSMC4 | 5278 | 0.0022 | 0.4 | NO |
| 47 | AXIN1 | AXIN1 | AXIN1 | 5340 | 0.0011 | 0.39 | NO |
| 48 | PPP2R5C | PPP2R5C | PPP2R5C | 5418 | 0.00013 | 0.39 | NO |
| 49 | PSMD11 | PSMD11 | PSMD11 | 5705 | -0.0042 | 0.37 | NO |
| 50 | PSMD4 | PSMD4 | PSMD4 | 5966 | -0.0084 | 0.36 | NO |
| 51 | PSMD5 | PSMD5 | PSMD5 | 6083 | -0.01 | 0.36 | NO |
| 52 | PSMB4 | PSMB4 | PSMB4 | 6583 | -0.018 | 0.34 | NO |
| 53 | PSMC2 | PSMC2 | PSMC2 | 6681 | -0.019 | 0.34 | NO |
| 54 | PSMD10 | PSMD10 | PSMD10 | 6927 | -0.023 | 0.34 | NO |
| 55 | PSME4 | PSME4 | PSME4 | 7055 | -0.025 | 0.34 | NO |
| 56 | PPP2R5D | PPP2R5D | PPP2R5D | 7103 | -0.026 | 0.35 | NO |
| 57 | PSMD2 | PSMD2 | PSMD2 | 7170 | -0.026 | 0.36 | NO |
| 58 | CTNNB1 | CTNNB1 | CTNNB1 | 8440 | -0.047 | 0.31 | NO |
| 59 | APC | APC | APC | 8961 | -0.056 | 0.3 | NO |
| 60 | FRAT2 | FRAT2 | FRAT2 | 9686 | -0.07 | 0.29 | NO |
| 61 | FRAT1 | FRAT1 | FRAT1 | 9803 | -0.072 | 0.31 | NO |
| 62 | PSMA8 | PSMA8 | PSMA8 | 13641 | -0.18 | 0.17 | NO |
| 63 | FAM123B | FAM123B | FAM123B | 14609 | -0.21 | 0.2 | NO |
Figure S25. Get High-res Image This plot shows mRNAseq_cNMF expression data heatmap (on the left) a RunningEnrichmentScore(RES) plot (on the top right) and a Signal2Noise(S2N) plot (on the bottom right) of genes in the pathway: BIOCARTA PROTEASOME PATHWAY.
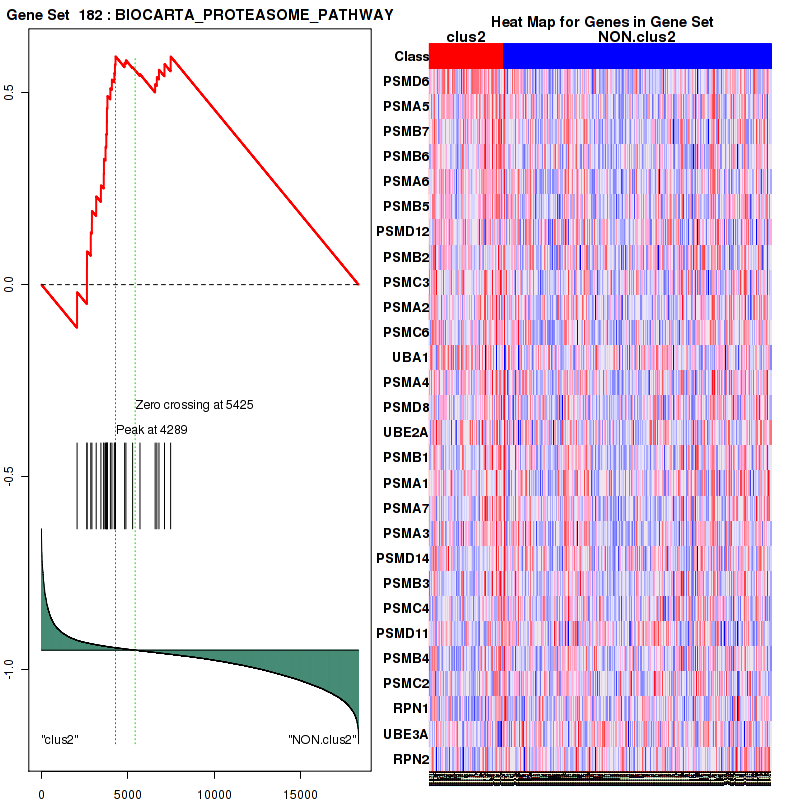
Figure S26. Get High-res Image For the top 5 core enriched genes in the pathway: BIOCARTA PROTEASOME PATHWAY, this volcano plot shows how much they are up/down-regulated and significant. The significance was calculated by empirical bayesian fit
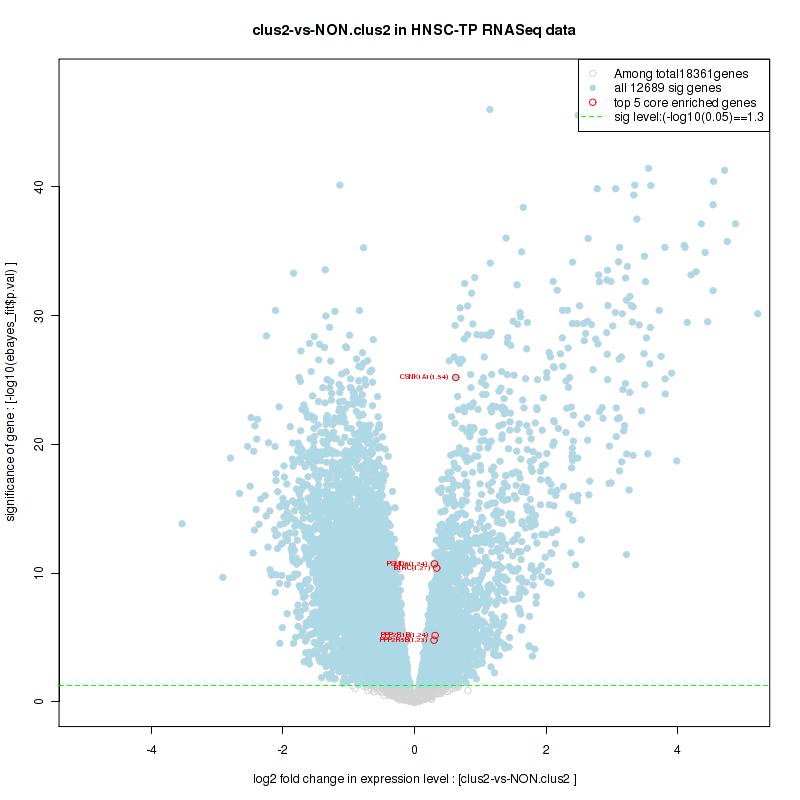
Table S14. Get Full Table This table shows a Running Enrichment Score (RES) of each gene in this pathway, that is, the enrichment score at this point in the ranked list of genes. All genes are ranked by Signal-to-Noise (S2N), a measure of similarity as default and are used to obtain ES matrix of all genes. In this way, GSEA tool uses expression pattern of not only overlapped genes but also not-overlapped genes to produce ES matrix.
| Rank | GENE | SYMBOL | DESC | LIST.LOC | S2N | RES | CORE_ENRICHMENT |
|---|---|---|---|---|---|---|---|
| 1 | EIF4E | EIF4E | EIF4E | 1674 | 0.095 | -0.048 | YES |
| 2 | EIF2S1 | EIF2S1 | EIF2S1 | 2178 | 0.07 | -0.044 | YES |
| 3 | RPS13 | RPS13 | RPS13 | 2249 | 0.067 | -0.017 | YES |
| 4 | RPS12 | RPS12 | RPS12 | 2499 | 0.059 | -0.004 | YES |
| 5 | RPS10 | RPS10 | RPS10 | 2655 | 0.055 | 0.012 | YES |
| 6 | EIF4EBP1 | EIF4EBP1 | EIF4EBP1 | 2684 | 0.054 | 0.035 | YES |
| 7 | EIF3I | EIF3I | EIF3I | 2690 | 0.054 | 0.059 | YES |
| 8 | EIF4A1 | EIF4A1 | EIF4A1 | 2709 | 0.053 | 0.082 | YES |
| 9 | RPS3 | RPS3 | RPS3 | 2803 | 0.051 | 0.1 | YES |
| 10 | EIF3J | EIF3J | EIF3J | 2856 | 0.049 | 0.12 | YES |
| 11 | EIF3B | EIF3B | EIF3B | 2910 | 0.048 | 0.14 | YES |
| 12 | RPS24 | RPS24 | RPS24 | 3039 | 0.044 | 0.15 | YES |
| 13 | RPS16 | RPS16 | RPS16 | 3084 | 0.043 | 0.17 | YES |
| 14 | EIF1AX | EIF1AX | EIF1AX | 3093 | 0.043 | 0.19 | YES |
| 15 | RPS15 | RPS15 | RPS15 | 3096 | 0.043 | 0.21 | YES |
| 16 | RPS6 | RPS6 | RPS6 | 3097 | 0.043 | 0.23 | YES |
| 17 | RPSA | RPSA | RPSA | 3103 | 0.043 | 0.25 | YES |
| 18 | RPS29 | RPS29 | RPS29 | 3165 | 0.041 | 0.26 | YES |
| 19 | RPS25 | RPS25 | RPS25 | 3166 | 0.041 | 0.28 | YES |
| 20 | EIF2S3 | EIF2S3 | EIF2S3 | 3181 | 0.041 | 0.3 | YES |
| 21 | RPS14 | RPS14 | RPS14 | 3236 | 0.039 | 0.31 | YES |
| 22 | RPS18 | RPS18 | RPS18 | 3335 | 0.037 | 0.32 | YES |
| 23 | RPS2 | RPS2 | RPS2 | 3413 | 0.036 | 0.34 | YES |
| 24 | RPS9 | RPS9 | RPS9 | 3517 | 0.033 | 0.35 | YES |
| 25 | RPS15A | RPS15A | RPS15A | 3523 | 0.033 | 0.36 | YES |
| 26 | EIF4H | EIF4H | EIF4H | 3557 | 0.032 | 0.37 | YES |
| 27 | RPS7 | RPS7 | RPS7 | 3577 | 0.032 | 0.39 | YES |
| 28 | FAU | FAU | FAU | 3596 | 0.032 | 0.4 | YES |
| 29 | RPS3A | RPS3A | RPS3A | 3629 | 0.031 | 0.41 | YES |
| 30 | RPS17 | RPS17 | RPS17 | 3644 | 0.031 | 0.43 | YES |
| 31 | RPS4X | RPS4X | RPS4X | 3673 | 0.03 | 0.44 | YES |
| 32 | RPS21 | RPS21 | RPS21 | 3701 | 0.029 | 0.45 | YES |
| 33 | EIF2S2 | EIF2S2 | EIF2S2 | 3705 | 0.029 | 0.46 | YES |
| 34 | RPS5 | RPS5 | RPS5 | 3751 | 0.028 | 0.47 | YES |
| 35 | EIF3H | EIF3H | EIF3H | 3759 | 0.028 | 0.48 | YES |
| 36 | EIF3E | EIF3E | EIF3E | 3783 | 0.028 | 0.5 | YES |
| 37 | RPS8 | RPS8 | RPS8 | 3866 | 0.026 | 0.5 | YES |
| 38 | RPS27A | RPS27A | RPS27A | 3887 | 0.026 | 0.51 | YES |
| 39 | PABPC1 | PABPC1 | PABPC1 | 3898 | 0.025 | 0.52 | YES |
| 40 | EIF3F | EIF3F | EIF3F | 3944 | 0.024 | 0.53 | YES |
| 41 | RPS26 | RPS26 | RPS26 | 4005 | 0.023 | 0.54 | YES |
| 42 | RPS23 | RPS23 | RPS23 | 4116 | 0.021 | 0.55 | YES |
| 43 | EIF3D | EIF3D | EIF3D | 4233 | 0.019 | 0.55 | YES |
| 44 | EIF3A | EIF3A | EIF3A | 4343 | 0.018 | 0.55 | YES |
| 45 | RPS19 | RPS19 | RPS19 | 4466 | 0.015 | 0.55 | YES |
| 46 | EIF3K | EIF3K | EIF3K | 4494 | 0.015 | 0.56 | YES |
| 47 | EIF3G | EIF3G | EIF3G | 4513 | 0.015 | 0.56 | YES |
| 48 | RPS20 | RPS20 | RPS20 | 4574 | 0.014 | 0.56 | YES |
| 49 | RPS28 | RPS28 | RPS28 | 4610 | 0.013 | 0.57 | YES |
| 50 | RPS11 | RPS11 | RPS11 | 4611 | 0.013 | 0.57 | YES |
| 51 | EIF4G1 | EIF4G1 | EIF4G1 | 4834 | 0.0094 | 0.57 | NO |
| 52 | RPSAP9 | RPSAP9 | RPSAP9 | 5001 | 0.0068 | 0.56 | NO |
| 53 | EIF3C | EIF3C | EIF3C | 6222 | -0.012 | 0.5 | NO |
| 54 | RPS27 | RPS27 | RPS27 | 6396 | -0.015 | 0.5 | NO |
| 55 | EIF4B | EIF4B | EIF4B | 6443 | -0.015 | 0.5 | NO |
| 56 | EIF4A2 | EIF4A2 | EIF4A2 | 12899 | -0.15 | 0.22 | NO |
| 57 | RPS4Y1 | RPS4Y1 | RPS4Y1 | 13743 | -0.18 | 0.25 | NO |
Figure S27. Get High-res Image This plot shows mRNAseq_cNMF expression data heatmap (on the left) a RunningEnrichmentScore(RES) plot (on the top right) and a Signal2Noise(S2N) plot (on the bottom right) of genes in the pathway: PID MTOR 4PATHWAY.
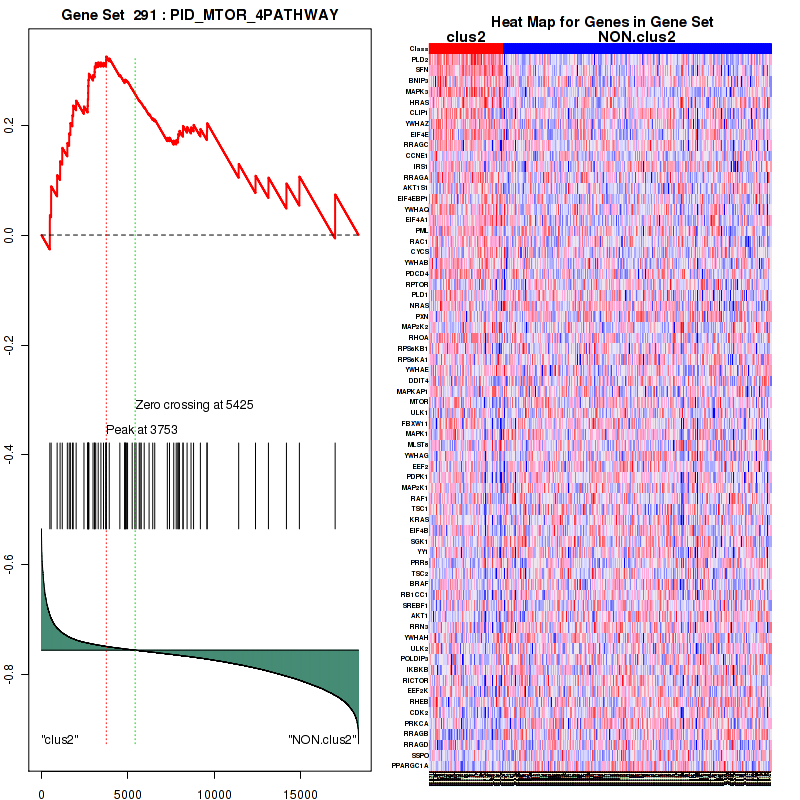
Figure S28. Get High-res Image For the top 5 core enriched genes in the pathway: PID MTOR 4PATHWAY, this volcano plot shows how much they are up/down-regulated and significant. The significance was calculated by empirical bayesian fit
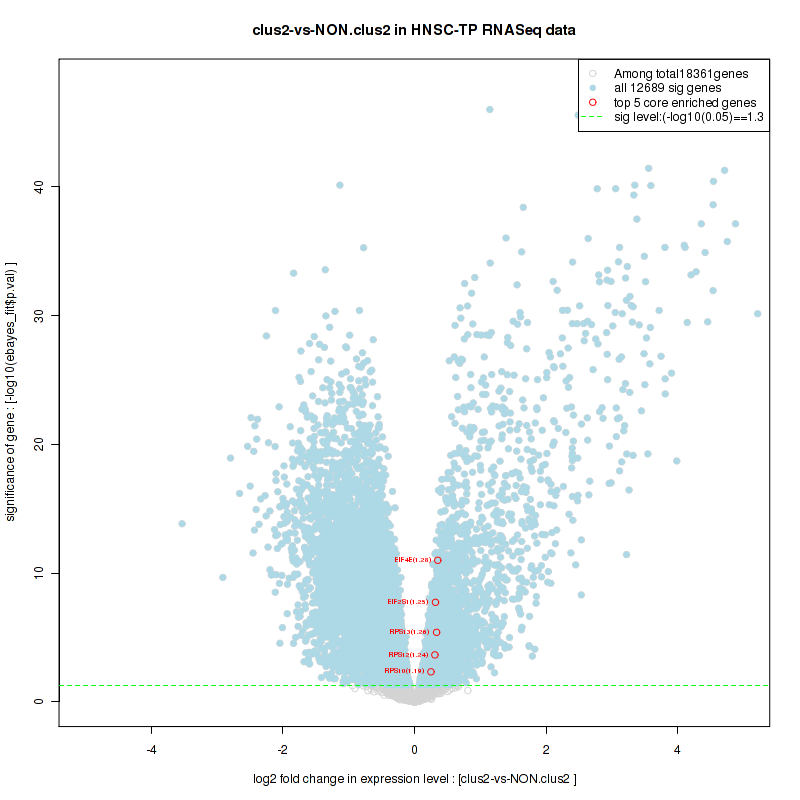
Table S15. Get Full Table This table shows a Running Enrichment Score (RES) of each gene in this pathway, that is, the enrichment score at this point in the ranked list of genes. All genes are ranked by Signal-to-Noise (S2N), a measure of similarity as default and are used to obtain ES matrix of all genes. In this way, GSEA tool uses expression pattern of not only overlapped genes but also not-overlapped genes to produce ES matrix.
| Rank | GENE | SYMBOL | DESC | LIST.LOC | S2N | RES | CORE_ENRICHMENT |
|---|---|---|---|---|---|---|---|
| 1 | OAZ3 | OAZ3 | OAZ3 | 579 | 0.24 | 0.099 | YES |
| 2 | PSMD6 | PSMD6 | PSMD6 | 2062 | 0.074 | 0.06 | YES |
| 3 | PSMB10 | PSMB10 | PSMB10 | 2260 | 0.067 | 0.086 | YES |
| 4 | PSMB8 | PSMB8 | PSMB8 | 2554 | 0.058 | 0.1 | YES |
| 5 | PSMA5 | PSMA5 | PSMA5 | 2635 | 0.055 | 0.13 | YES |
| 6 | PSMB7 | PSMB7 | PSMB7 | 2636 | 0.055 | 0.16 | YES |
| 7 | ODC1 | ODC1 | ODC1 | 2745 | 0.052 | 0.18 | YES |
| 8 | PSMD13 | PSMD13 | PSMD13 | 2750 | 0.052 | 0.21 | YES |
| 9 | NQO1 | NQO1 | NQO1 | 2829 | 0.05 | 0.24 | YES |
| 10 | PSMB6 | PSMB6 | PSMB6 | 2857 | 0.049 | 0.26 | YES |
| 11 | PSMA6 | PSMA6 | PSMA6 | 2922 | 0.047 | 0.28 | YES |
| 12 | PSME2 | PSME2 | PSME2 | 2937 | 0.047 | 0.31 | YES |
| 13 | PSMB5 | PSMB5 | PSMB5 | 3170 | 0.041 | 0.32 | YES |
| 14 | PSMD12 | PSMD12 | PSMD12 | 3443 | 0.035 | 0.32 | YES |
| 15 | PSME1 | PSME1 | PSME1 | 3504 | 0.034 | 0.34 | YES |
| 16 | PSMB2 | PSMB2 | PSMB2 | 3607 | 0.032 | 0.35 | YES |
| 17 | PSMC3 | PSMC3 | PSMC3 | 3619 | 0.031 | 0.37 | YES |
| 18 | PSMD7 | PSMD7 | PSMD7 | 3699 | 0.029 | 0.38 | YES |
| 19 | PSMA2 | PSMA2 | PSMA2 | 3711 | 0.029 | 0.4 | YES |
| 20 | PSMD1 | PSMD1 | PSMD1 | 3712 | 0.029 | 0.41 | YES |
| 21 | PSMC6 | PSMC6 | PSMC6 | 3755 | 0.028 | 0.42 | YES |
| 22 | PSMA4 | PSMA4 | PSMA4 | 3792 | 0.028 | 0.44 | YES |
| 23 | PSMD8 | PSMD8 | PSMD8 | 3820 | 0.027 | 0.45 | YES |
| 24 | PSMF1 | PSMF1 | PSMF1 | 4009 | 0.023 | 0.45 | YES |
| 25 | PSMD9 | PSMD9 | PSMD9 | 4053 | 0.023 | 0.46 | YES |
| 26 | PSMB1 | PSMB1 | PSMB1 | 4079 | 0.022 | 0.48 | YES |
| 27 | PSMA1 | PSMA1 | PSMA1 | 4220 | 0.02 | 0.48 | YES |
| 28 | PSMA7 | PSMA7 | PSMA7 | 4255 | 0.019 | 0.49 | YES |
| 29 | PSMA3 | PSMA3 | PSMA3 | 4289 | 0.019 | 0.5 | YES |
| 30 | OAZ1 | OAZ1 | OAZ1 | 4324 | 0.018 | 0.5 | YES |
| 31 | PSMB9 | PSMB9 | PSMB9 | 4490 | 0.015 | 0.5 | YES |
| 32 | PSMC1 | PSMC1 | PSMC1 | 4562 | 0.014 | 0.51 | YES |
| 33 | PSMD14 | PSMD14 | PSMD14 | 4815 | 0.0097 | 0.5 | NO |
| 34 | PSMC5 | PSMC5 | PSMC5 | 4888 | 0.0085 | 0.5 | NO |
| 35 | PSMB3 | PSMB3 | PSMB3 | 4889 | 0.0084 | 0.5 | NO |
| 36 | PSMD3 | PSMD3 | PSMD3 | 4927 | 0.0079 | 0.51 | NO |
| 37 | PSMC4 | PSMC4 | PSMC4 | 5278 | 0.0022 | 0.49 | NO |
| 38 | PSMD11 | PSMD11 | PSMD11 | 5705 | -0.0042 | 0.47 | NO |
| 39 | PSMD4 | PSMD4 | PSMD4 | 5966 | -0.0084 | 0.46 | NO |
| 40 | PSMD5 | PSMD5 | PSMD5 | 6083 | -0.01 | 0.46 | NO |
| 41 | PSMB4 | PSMB4 | PSMB4 | 6583 | -0.018 | 0.44 | NO |
| 42 | PSMC2 | PSMC2 | PSMC2 | 6681 | -0.019 | 0.45 | NO |
| 43 | PSMD10 | PSMD10 | PSMD10 | 6927 | -0.023 | 0.44 | NO |
| 44 | PSME4 | PSME4 | PSME4 | 7055 | -0.025 | 0.45 | NO |
| 45 | PSMD2 | PSMD2 | PSMD2 | 7170 | -0.026 | 0.46 | NO |
| 46 | OAZ2 | OAZ2 | OAZ2 | 7653 | -0.034 | 0.45 | NO |
| 47 | AZIN1 | AZIN1 | AZIN1 | 9175 | -0.059 | 0.4 | NO |
| 48 | PSMA8 | PSMA8 | PSMA8 | 13641 | -0.18 | 0.26 | NO |
Figure S29. Get High-res Image This plot shows mRNAseq_cNMF expression data heatmap (on the left) a RunningEnrichmentScore(RES) plot (on the top right) and a Signal2Noise(S2N) plot (on the bottom right) of genes in the pathway: REACTOME FORMATION OF THE TERNARY COMPLEX AND SUBSEQUENTLY THE 43S COMPLEX.
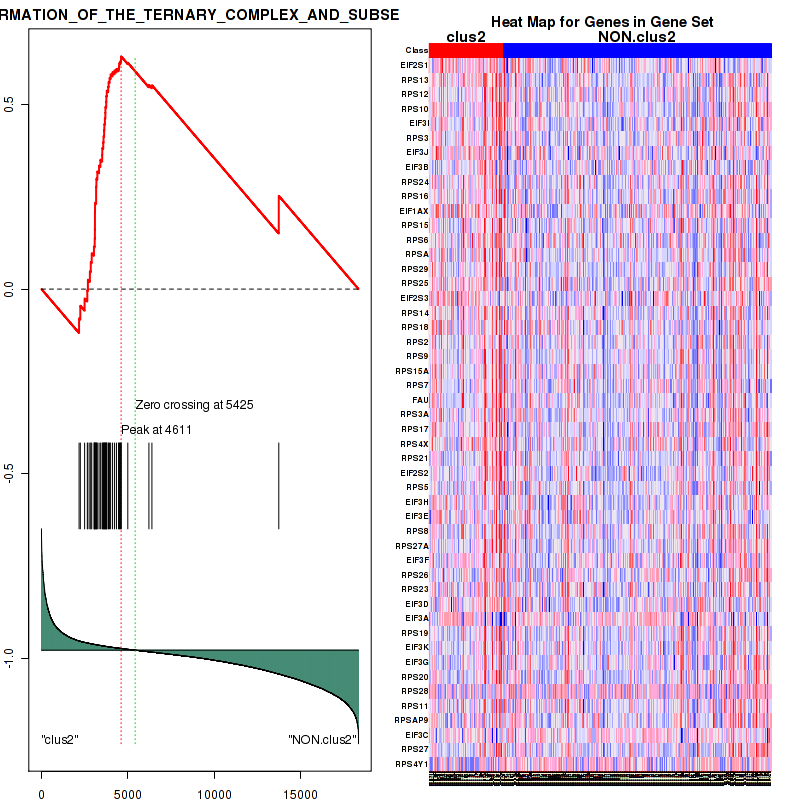
Figure S30. Get High-res Image For the top 5 core enriched genes in the pathway: REACTOME FORMATION OF THE TERNARY COMPLEX AND SUBSEQUENTLY THE 43S COMPLEX, this volcano plot shows how much they are up/down-regulated and significant. The significance was calculated by empirical bayesian fit

Table S16. Get Full Table This table shows a Running Enrichment Score (RES) of each gene in this pathway, that is, the enrichment score at this point in the ranked list of genes. All genes are ranked by Signal-to-Noise (S2N), a measure of similarity as default and are used to obtain ES matrix of all genes. In this way, GSEA tool uses expression pattern of not only overlapped genes but also not-overlapped genes to produce ES matrix.
| Rank | GENE | SYMBOL | DESC | LIST.LOC | S2N | RES | CORE_ENRICHMENT |
|---|---|---|---|---|---|---|---|
| 1 | POLR2L | POLR2L | POLR2L | 1201 | 0.13 | 0.045 | YES |
| 2 | CDK7 | CDK7 | CDK7 | 1283 | 0.12 | 0.14 | YES |
| 3 | ERCC1 | ERCC1 | ERCC1 | 2244 | 0.067 | 0.15 | YES |
| 4 | ERCC6 | ERCC6 | ERCC6 | 2682 | 0.054 | 0.17 | YES |
| 5 | GTF2H1 | GTF2H1 | GTF2H1 | 3537 | 0.033 | 0.15 | YES |
| 6 | POLR2A | POLR2A | POLR2A | 4073 | 0.022 | 0.14 | YES |
| 7 | CCNH | CCNH | CCNH | 4540 | 0.014 | 0.13 | YES |
| 8 | ERCC5 | ERCC5 | ERCC5 | 4572 | 0.014 | 0.14 | YES |
| 9 | POLR2E | POLR2E | POLR2E | 4603 | 0.013 | 0.15 | YES |
| 10 | POLR2G | POLR2G | POLR2G | 5257 | 0.0026 | 0.11 | YES |
| 11 | POLR2I | POLR2I | POLR2I | 5311 | 0.0017 | 0.11 | YES |
| 12 | POLR2F | POLR2F | POLR2F | 6206 | -0.012 | 0.073 | YES |
| 13 | GTF2H3 | GTF2H3 | GTF2H3 | 6316 | -0.014 | 0.079 | YES |
| 14 | XAB2 | XAB2 | XAB2 | 6704 | -0.019 | 0.074 | YES |
| 15 | POLR2C | POLR2C | POLR2C | 6958 | -0.023 | 0.079 | YES |
| 16 | POLR2K | POLR2K | POLR2K | 6965 | -0.023 | 0.098 | YES |
| 17 | POLR2B | POLR2B | POLR2B | 7019 | -0.024 | 0.12 | YES |
| 18 | GTF2H2 | GTF2H2 | GTF2H2 | 7022 | -0.024 | 0.14 | YES |
| 19 | POLR2J | POLR2J | POLR2J | 7552 | -0.032 | 0.13 | YES |
| 20 | TCEA1 | TCEA1 | TCEA1 | 7587 | -0.033 | 0.16 | YES |
| 21 | GTF2H4 | GTF2H4 | GTF2H4 | 7926 | -0.038 | 0.17 | YES |
| 22 | ERCC8 | ERCC8 | ERCC8 | 8202 | -0.043 | 0.19 | YES |
| 23 | ERCC3 | ERCC3 | ERCC3 | 8800 | -0.052 | 0.21 | YES |
| 24 | ERCC4 | ERCC4 | ERCC4 | 8833 | -0.053 | 0.25 | YES |
| 25 | MNAT1 | MNAT1 | MNAT1 | 8887 | -0.054 | 0.29 | YES |
| 26 | POLR2D | POLR2D | POLR2D | 8965 | -0.056 | 0.33 | YES |
| 27 | GTF2H2B | GTF2H2B | GTF2H2B | 9367 | -0.063 | 0.36 | YES |
| 28 | ERCC2 | ERCC2 | ERCC2 | 9661 | -0.069 | 0.41 | YES |
| 29 | POLR2H | POLR2H | POLR2H | 10251 | -0.082 | 0.44 | YES |
Figure S31. Get High-res Image This plot shows mRNAseq_cNMF expression data heatmap (on the left) a RunningEnrichmentScore(RES) plot (on the top right) and a Signal2Noise(S2N) plot (on the bottom right) of genes in the pathway: REACTOME SIGNALING BY WNT.
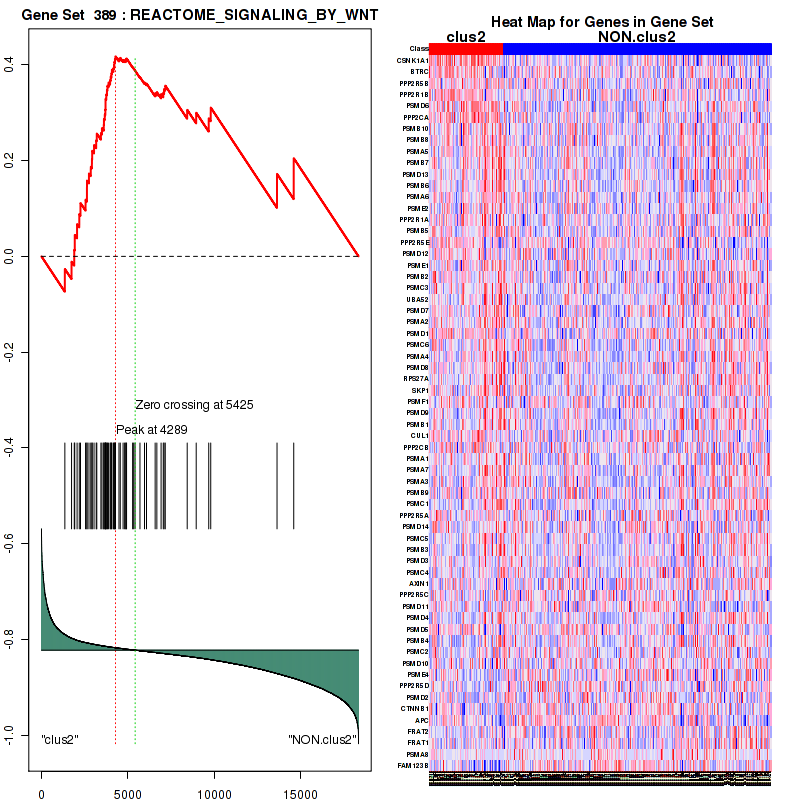
Figure S32. Get High-res Image For the top 5 core enriched genes in the pathway: REACTOME SIGNALING BY WNT, this volcano plot shows how much they are up/down-regulated and significant. The significance was calculated by empirical bayesian fit
Table S17. Get Full Table This table shows a Running Enrichment Score (RES) of each gene in this pathway, that is, the enrichment score at this point in the ranked list of genes. All genes are ranked by Signal-to-Noise (S2N), a measure of similarity as default and are used to obtain ES matrix of all genes. In this way, GSEA tool uses expression pattern of not only overlapped genes but also not-overlapped genes to produce ES matrix.
| Rank | GENE | SYMBOL | DESC | LIST.LOC | S2N | RES | CORE_ENRICHMENT |
|---|---|---|---|---|---|---|---|
| 1 | S100A12 | S100A12 | S100A12 | 21 | 0.74 | 0.14 | YES |
| 2 | NOD2 | NOD2 | NOD2 | 269 | 0.38 | 0.19 | YES |
| 3 | IRF7 | IRF7 | IRF7 | 774 | 0.19 | 0.2 | YES |
| 4 | MAPK3 | MAPK3 | MAPK3 | 1080 | 0.15 | 0.21 | YES |
| 5 | ZBP1 | ZBP1 | ZBP1 | 1316 | 0.12 | 0.22 | YES |
| 6 | FOS | FOS | FOS | 1337 | 0.12 | 0.24 | YES |
| 7 | DUSP7 | DUSP7 | DUSP7 | 1368 | 0.12 | 0.26 | YES |
| 8 | DUSP6 | DUSP6 | DUSP6 | 1469 | 0.11 | 0.28 | YES |
| 9 | MAP2K4 | MAP2K4 | MAP2K4 | 1542 | 0.1 | 0.29 | YES |
| 10 | MAPKAPK3 | MAPKAPK3 | MAPKAPK3 | 1737 | 0.091 | 0.3 | YES |
| 11 | IRAK2 | IRAK2 | IRAK2 | 1781 | 0.089 | 0.31 | YES |
| 12 | PPP2R1B | PPP2R1B | PPP2R1B | 1928 | 0.081 | 0.32 | YES |
| 13 | MAPK14 | MAPK14 | MAPK14 | 1988 | 0.078 | 0.33 | YES |
| 14 | RIPK3 | RIPK3 | RIPK3 | 2090 | 0.073 | 0.34 | YES |
| 15 | SAA1 | SAA1 | SAA1 | 2188 | 0.07 | 0.34 | YES |
| 16 | PPP2CA | PPP2CA | PPP2CA | 2190 | 0.07 | 0.36 | YES |
| 17 | MAPK7 | MAPK7 | MAPK7 | 2295 | 0.065 | 0.36 | YES |
| 18 | TICAM1 | TICAM1 | TICAM1 | 2349 | 0.063 | 0.37 | YES |
| 19 | MAP2K3 | MAP2K3 | MAP2K3 | 2473 | 0.06 | 0.38 | YES |
| 20 | PPP2R1A | PPP2R1A | PPP2R1A | 3045 | 0.044 | 0.35 | NO |
| 21 | JUN | JUN | JUN | 3105 | 0.043 | 0.36 | NO |
| 22 | TAB2 | TAB2 | TAB2 | 3503 | 0.034 | 0.34 | NO |
| 23 | UBA52 | UBA52 | UBA52 | 3666 | 0.03 | 0.34 | NO |
| 24 | MAP2K2 | MAP2K2 | MAP2K2 | 3723 | 0.029 | 0.34 | NO |
| 25 | RPS27A | RPS27A | RPS27A | 3887 | 0.026 | 0.34 | NO |
| 26 | RPS6KA1 | RPS6KA1 | RPS6KA1 | 3925 | 0.025 | 0.34 | NO |
| 27 | RELA | RELA | RELA | 4184 | 0.02 | 0.33 | NO |
| 28 | PPP2CB | PPP2CB | PPP2CB | 4205 | 0.02 | 0.33 | NO |
| 29 | TLR3 | TLR3 | TLR3 | 4230 | 0.02 | 0.33 | NO |
| 30 | TAB3 | TAB3 | TAB3 | 4243 | 0.019 | 0.34 | NO |
| 31 | RIPK1 | RIPK1 | RIPK1 | 4275 | 0.019 | 0.34 | NO |
| 32 | RIPK2 | RIPK2 | RIPK2 | 4446 | 0.016 | 0.33 | NO |
| 33 | MEF2A | MEF2A | MEF2A | 4722 | 0.011 | 0.32 | NO |
| 34 | CHUK | CHUK | CHUK | 4861 | 0.0088 | 0.31 | NO |
| 35 | NFKBIB | NFKBIB | NFKBIB | 4925 | 0.0079 | 0.31 | NO |
| 36 | MAPK1 | MAPK1 | MAPK1 | 4985 | 0.0071 | 0.31 | NO |
| 37 | NFKBIA | NFKBIA | NFKBIA | 5147 | 0.0042 | 0.3 | NO |
| 38 | DUSP4 | DUSP4 | DUSP4 | 5456 | -0.00046 | 0.28 | NO |
| 39 | IRAK1 | IRAK1 | IRAK1 | 5505 | -0.0012 | 0.28 | NO |
| 40 | NOD1 | NOD1 | NOD1 | 5634 | -0.0031 | 0.28 | NO |
| 41 | MAP2K1 | MAP2K1 | MAP2K1 | 5711 | -0.0042 | 0.27 | NO |
| 42 | DUSP3 | DUSP3 | DUSP3 | 5712 | -0.0042 | 0.27 | NO |
| 43 | MAP3K7 | MAP3K7 | MAP3K7 | 5755 | -0.0048 | 0.27 | NO |
| 44 | IRF3 | IRF3 | IRF3 | 5803 | -0.0057 | 0.27 | NO |
| 45 | MAP2K7 | MAP2K7 | MAP2K7 | 6000 | -0.0089 | 0.26 | NO |
| 46 | CREB1 | CREB1 | CREB1 | 6043 | -0.0095 | 0.26 | NO |
| 47 | IKBKG | IKBKG | IKBKG | 6193 | -0.012 | 0.25 | NO |
| 48 | S100B | S100B | S100B | 6227 | -0.012 | 0.25 | NO |
| 49 | MAPK11 | MAPK11 | MAPK11 | 6463 | -0.016 | 0.24 | NO |
| 50 | APP | APP | APP | 6653 | -0.018 | 0.24 | NO |
| 51 | IKBKE | IKBKE | IKBKE | 7035 | -0.024 | 0.22 | NO |
| 52 | PPP2R5D | PPP2R5D | PPP2R5D | 7103 | -0.026 | 0.22 | NO |
| 53 | TRAF6 | TRAF6 | TRAF6 | 7311 | -0.029 | 0.22 | NO |
| 54 | RPS6KA3 | RPS6KA3 | RPS6KA3 | 7458 | -0.031 | 0.21 | NO |
| 55 | TBK1 | TBK1 | TBK1 | 7686 | -0.034 | 0.21 | NO |
| 56 | MAPK9 | MAPK9 | MAPK9 | 8009 | -0.04 | 0.2 | NO |
| 57 | HMGB1 | HMGB1 | HMGB1 | 8116 | -0.042 | 0.2 | NO |
| 58 | MAPKAPK2 | MAPKAPK2 | MAPKAPK2 | 8501 | -0.048 | 0.19 | NO |
| 59 | NFKB2 | NFKB2 | NFKB2 | 8593 | -0.049 | 0.19 | NO |
| 60 | IKBKB | IKBKB | IKBKB | 8809 | -0.053 | 0.19 | NO |
| 61 | AGER | AGER | AGER | 9798 | -0.072 | 0.15 | NO |
| 62 | RPS6KA2 | RPS6KA2 | RPS6KA2 | 9886 | -0.074 | 0.16 | NO |
| 63 | TAB1 | TAB1 | TAB1 | 10264 | -0.082 | 0.15 | NO |
| 64 | RPS6KA5 | RPS6KA5 | RPS6KA5 | 10489 | -0.086 | 0.16 | NO |
| 65 | CDK1 | CDK1 | CDK1 | 10550 | -0.088 | 0.17 | NO |
| 66 | ATF1 | ATF1 | ATF1 | 10820 | -0.094 | 0.17 | NO |
| 67 | ELK1 | ELK1 | ELK1 | 11295 | -0.11 | 0.16 | NO |
| 68 | MAPK8 | MAPK8 | MAPK8 | 12445 | -0.14 | 0.13 | NO |
| 69 | ATF2 | ATF2 | ATF2 | 13632 | -0.18 | 0.094 | NO |
| 70 | MAPK10 | MAPK10 | MAPK10 | 13726 | -0.18 | 0.12 | NO |
| 71 | MEF2C | MEF2C | MEF2C | 16398 | -0.3 | 0.032 | NO |
| 72 | MAP2K6 | MAP2K6 | MAP2K6 | 17730 | -0.41 | 0.034 | NO |
Figure S33. Get High-res Image This plot shows mRNAseq_cNMF expression data heatmap (on the left) a RunningEnrichmentScore(RES) plot (on the top right) and a Signal2Noise(S2N) plot (on the bottom right) of genes in the pathway: REACTOME TRIF MEDIATED TLR3 SIGNALING.
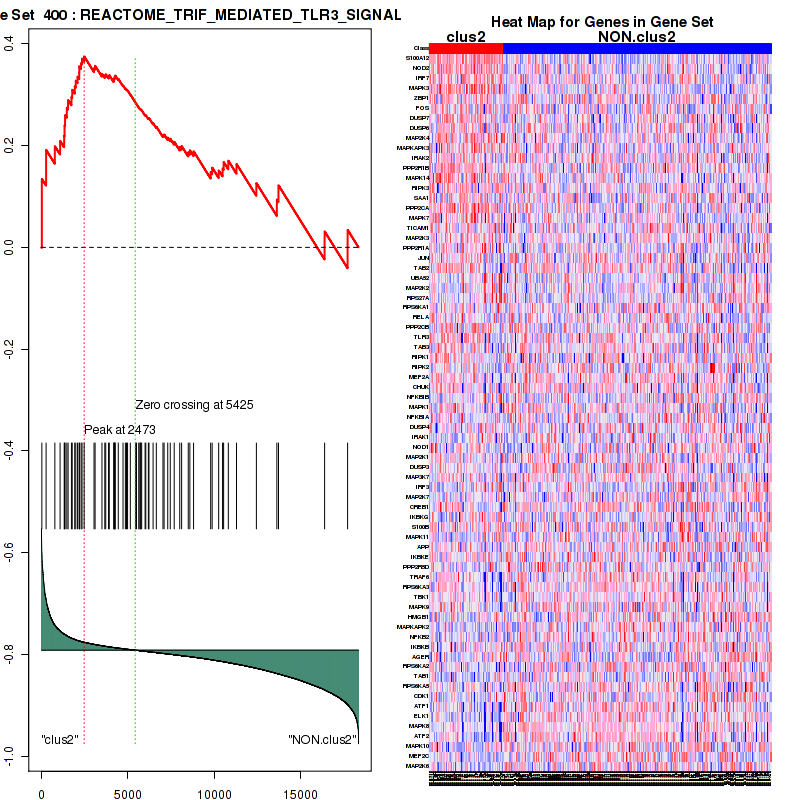
Figure S34. Get High-res Image For the top 5 core enriched genes in the pathway: REACTOME TRIF MEDIATED TLR3 SIGNALING, this volcano plot shows how much they are up/down-regulated and significant. The significance was calculated by empirical bayesian fit
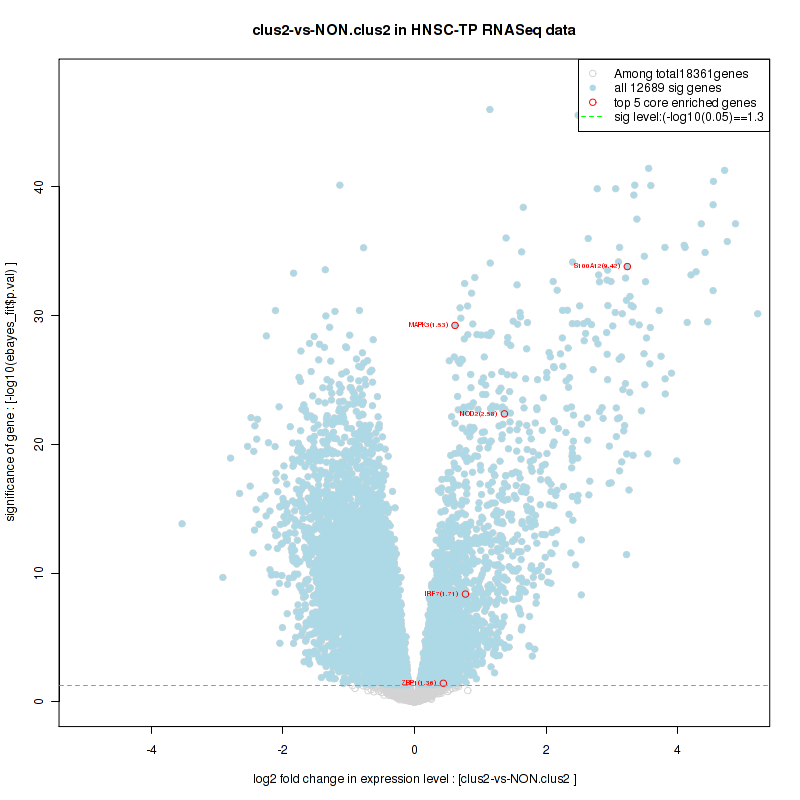
Table S18. Get Full Table This table shows a Running Enrichment Score (RES) of each gene in this pathway, that is, the enrichment score at this point in the ranked list of genes. All genes are ranked by Signal-to-Noise (S2N), a measure of similarity as default and are used to obtain ES matrix of all genes. In this way, GSEA tool uses expression pattern of not only overlapped genes but also not-overlapped genes to produce ES matrix.
| Rank | GENE | SYMBOL | DESC | LIST.LOC | S2N | RES | CORE_ENRICHMENT |
|---|---|---|---|---|---|---|---|
| 1 | IL18 | IL18 | IL18 | 414 | 0.3 | 0.066 | YES |
| 2 | IL1B | IL1B | IL1B | 426 | 0.29 | 0.15 | YES |
| 3 | POLR3G | POLR3G | POLR3G | 503 | 0.26 | 0.22 | YES |
| 4 | PYCARD | PYCARD | PYCARD | 760 | 0.19 | 0.27 | YES |
| 5 | IRF7 | IRF7 | IRF7 | 774 | 0.19 | 0.32 | YES |
| 6 | CASP1 | CASP1 | CASP1 | 855 | 0.18 | 0.37 | YES |
| 7 | DDX58 | DDX58 | DDX58 | 972 | 0.16 | 0.41 | YES |
| 8 | AIM2 | AIM2 | AIM2 | 1006 | 0.16 | 0.46 | YES |
| 9 | IFNA13 | IFNA13 | IFNA13 | 1114 | 0.14 | 0.49 | YES |
| 10 | CXCL10 | CXCL10 | CXCL10 | 1185 | 0.13 | 0.53 | YES |
| 11 | ZBP1 | ZBP1 | ZBP1 | 1316 | 0.12 | 0.56 | YES |
| 12 | IFNA1 | IFNA1 | IFNA1 | 1813 | 0.087 | 0.56 | YES |
| 13 | RIPK3 | RIPK3 | RIPK3 | 2090 | 0.073 | 0.56 | YES |
| 14 | IL33 | IL33 | IL33 | 2273 | 0.066 | 0.57 | YES |
| 15 | POLR3B | POLR3B | POLR3B | 2516 | 0.058 | 0.57 | YES |
| 16 | POLR1D | POLR1D | POLR1D | 3369 | 0.037 | 0.54 | NO |
| 17 | POLR3H | POLR3H | POLR3H | 4036 | 0.023 | 0.51 | NO |
| 18 | POLR3A | POLR3A | POLR3A | 4092 | 0.022 | 0.51 | NO |
| 19 | RELA | RELA | RELA | 4184 | 0.02 | 0.51 | NO |
| 20 | RIPK1 | RIPK1 | RIPK1 | 4275 | 0.019 | 0.52 | NO |
| 21 | CHUK | CHUK | CHUK | 4861 | 0.0088 | 0.48 | NO |
| 22 | NFKBIB | NFKBIB | NFKBIB | 4925 | 0.0079 | 0.48 | NO |
| 23 | NFKBIA | NFKBIA | NFKBIA | 5147 | 0.0042 | 0.47 | NO |
| 24 | NFKB1 | NFKB1 | NFKB1 | 5181 | 0.0037 | 0.47 | NO |
| 25 | TMEM173 | TMEM173 | TMEM173 | 5272 | 0.0023 | 0.47 | NO |
| 26 | CCL5 | CCL5 | CCL5 | 5722 | -0.0044 | 0.44 | NO |
| 27 | IRF3 | IRF3 | IRF3 | 5803 | -0.0057 | 0.44 | NO |
| 28 | IKBKG | IKBKG | IKBKG | 6193 | -0.012 | 0.42 | NO |
| 29 | POLR1C | POLR1C | POLR1C | 6241 | -0.012 | 0.43 | NO |
| 30 | POLR3F | POLR3F | POLR3F | 6356 | -0.014 | 0.42 | NO |
| 31 | ADAR | ADAR | ADAR | 6381 | -0.015 | 0.43 | NO |
| 32 | IKBKE | IKBKE | IKBKE | 7035 | -0.024 | 0.4 | NO |
| 33 | TREX1 | TREX1 | TREX1 | 7127 | -0.026 | 0.4 | NO |
| 34 | MAVS | MAVS | MAVS | 7371 | -0.03 | 0.4 | NO |
| 35 | TBK1 | TBK1 | TBK1 | 7686 | -0.034 | 0.39 | NO |
| 36 | IL6 | IL6 | IL6 | 7929 | -0.038 | 0.39 | NO |
| 37 | CCL4 | CCL4 | CCL4 | 8208 | -0.043 | 0.38 | NO |
| 38 | IFNB1 | IFNB1 | IFNB1 | 8464 | -0.047 | 0.38 | NO |
| 39 | IKBKB | IKBKB | IKBKB | 8809 | -0.053 | 0.38 | NO |
| 40 | POLR3C | POLR3C | POLR3C | 9677 | -0.069 | 0.36 | NO |
| 41 | POLR3K | POLR3K | POLR3K | 9706 | -0.07 | 0.37 | NO |
| 42 | POLR3D | POLR3D | POLR3D | 9894 | -0.074 | 0.39 | NO |
| 43 | CCL4L2 | CCL4L2 | CCL4L2 | 11129 | -0.1 | 0.35 | NO |
| 44 | POLR3GL | POLR3GL | POLR3GL | 13035 | -0.16 | 0.29 | NO |
Figure S35. Get High-res Image This plot shows mRNAseq_cNMF expression data heatmap (on the left) a RunningEnrichmentScore(RES) plot (on the top right) and a Signal2Noise(S2N) plot (on the bottom right) of genes in the pathway: REACTOME ER PHAGOSOME PATHWAY.
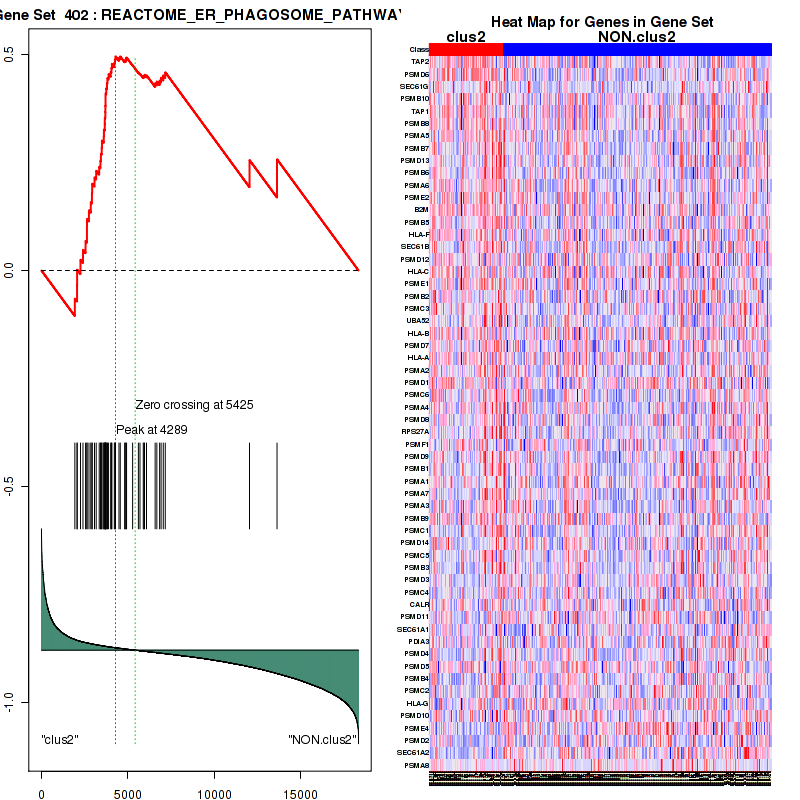
Figure S36. Get High-res Image For the top 5 core enriched genes in the pathway: REACTOME ER PHAGOSOME PATHWAY, this volcano plot shows how much they are up/down-regulated and significant. The significance was calculated by empirical bayesian fit
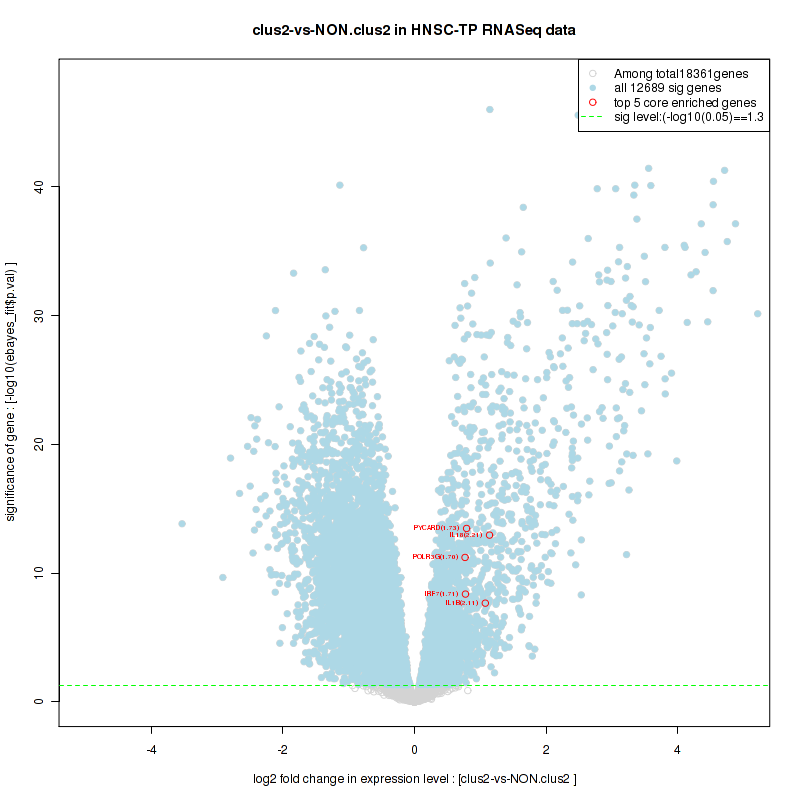
Table S19. Get Full Table This table shows a Running Enrichment Score (RES) of each gene in this pathway, that is, the enrichment score at this point in the ranked list of genes. All genes are ranked by Signal-to-Noise (S2N), a measure of similarity as default and are used to obtain ES matrix of all genes. In this way, GSEA tool uses expression pattern of not only overlapped genes but also not-overlapped genes to produce ES matrix.
| Rank | GENE | SYMBOL | DESC | LIST.LOC | S2N | RES | CORE_ENRICHMENT |
|---|---|---|---|---|---|---|---|
| 1 | PSMD6 | PSMD6 | PSMD6 | 2062 | 0.074 | -0.02 | YES |
| 2 | PSMA5 | PSMA5 | PSMA5 | 2635 | 0.055 | 0.018 | YES |
| 3 | PSMB7 | PSMB7 | PSMB7 | 2636 | 0.055 | 0.087 | YES |
| 4 | PSMB6 | PSMB6 | PSMB6 | 2857 | 0.049 | 0.14 | YES |
| 5 | PSMA6 | PSMA6 | PSMA6 | 2922 | 0.047 | 0.19 | YES |
| 6 | PSMB5 | PSMB5 | PSMB5 | 3170 | 0.041 | 0.23 | YES |
| 7 | PSMD12 | PSMD12 | PSMD12 | 3443 | 0.035 | 0.26 | YES |
| 8 | PSMB2 | PSMB2 | PSMB2 | 3607 | 0.032 | 0.29 | YES |
| 9 | PSMC3 | PSMC3 | PSMC3 | 3619 | 0.031 | 0.33 | YES |
| 10 | PSMA2 | PSMA2 | PSMA2 | 3711 | 0.029 | 0.36 | YES |
| 11 | PSMC6 | PSMC6 | PSMC6 | 3755 | 0.028 | 0.39 | YES |
| 12 | UBA1 | UBA1 | UBA1 | 3789 | 0.028 | 0.42 | YES |
| 13 | PSMA4 | PSMA4 | PSMA4 | 3792 | 0.028 | 0.46 | YES |
| 14 | PSMD8 | PSMD8 | PSMD8 | 3820 | 0.027 | 0.49 | YES |
| 15 | UBE2A | UBE2A | UBE2A | 3990 | 0.024 | 0.51 | YES |
| 16 | PSMB1 | PSMB1 | PSMB1 | 4079 | 0.022 | 0.53 | YES |
| 17 | PSMA1 | PSMA1 | PSMA1 | 4220 | 0.02 | 0.55 | YES |
| 18 | PSMA7 | PSMA7 | PSMA7 | 4255 | 0.019 | 0.57 | YES |
| 19 | PSMA3 | PSMA3 | PSMA3 | 4289 | 0.019 | 0.59 | YES |
| 20 | PSMD14 | PSMD14 | PSMD14 | 4815 | 0.0097 | 0.58 | NO |
| 21 | PSMB3 | PSMB3 | PSMB3 | 4889 | 0.0084 | 0.58 | NO |
| 22 | PSMC4 | PSMC4 | PSMC4 | 5278 | 0.0022 | 0.56 | NO |
| 23 | PSMD11 | PSMD11 | PSMD11 | 5705 | -0.0042 | 0.55 | NO |
| 24 | PSMB4 | PSMB4 | PSMB4 | 6583 | -0.018 | 0.52 | NO |
| 25 | PSMC2 | PSMC2 | PSMC2 | 6681 | -0.019 | 0.54 | NO |
| 26 | RPN1 | RPN1 | RPN1 | 6804 | -0.021 | 0.56 | NO |
| 27 | UBE3A | UBE3A | UBE3A | 7125 | -0.026 | 0.57 | NO |
| 28 | RPN2 | RPN2 | RPN2 | 7481 | -0.031 | 0.59 | NO |
Figure S37. Get High-res Image This plot shows mRNAseq_cNMF expression data heatmap (on the left) a RunningEnrichmentScore(RES) plot (on the top right) and a Signal2Noise(S2N) plot (on the bottom right) of genes in the pathway: REACTOME ACTIVATION OF THE MRNA UPON BINDING OF THE CAP BINDING COMPLEX AND EIFS AND SUBSEQUENT BINDING TO 43S.
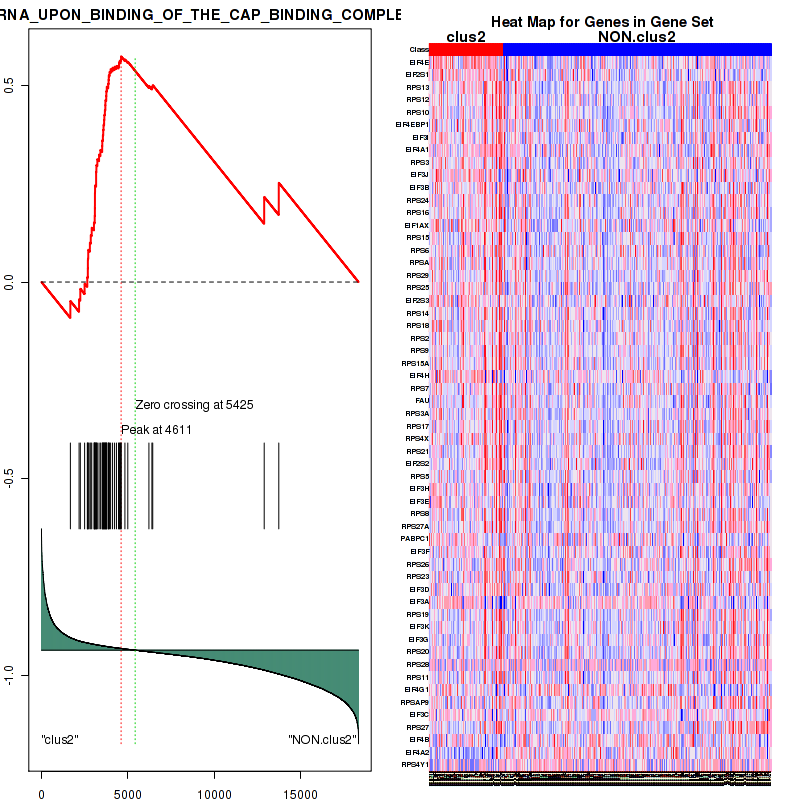
Figure S38. Get High-res Image For the top 5 core enriched genes in the pathway: REACTOME ACTIVATION OF THE MRNA UPON BINDING OF THE CAP BINDING COMPLEX AND EIFS AND SUBSEQUENT BINDING TO 43S, this volcano plot shows how much they are up/down-regulated and significant. The significance was calculated by empirical bayesian fit

Table S20. Get Full Table This table shows a Running Enrichment Score (RES) of each gene in this pathway, that is, the enrichment score at this point in the ranked list of genes. All genes are ranked by Signal-to-Noise (S2N), a measure of similarity as default and are used to obtain ES matrix of all genes. In this way, GSEA tool uses expression pattern of not only overlapped genes but also not-overlapped genes to produce ES matrix.
| Rank | GENE | SYMBOL | DESC | LIST.LOC | S2N | RES | CORE_ENRICHMENT |
|---|---|---|---|---|---|---|---|
| 1 | PSMD6 | PSMD6 | PSMD6 | 2062 | 0.074 | -0.067 | YES |
| 2 | HSPB1 | HSPB1 | HSPB1 | 2169 | 0.071 | -0.03 | YES |
| 3 | PSMB10 | PSMB10 | PSMB10 | 2260 | 0.067 | 0.006 | YES |
| 4 | PSMB8 | PSMB8 | PSMB8 | 2554 | 0.058 | 0.025 | YES |
| 5 | PSMA5 | PSMA5 | PSMA5 | 2635 | 0.055 | 0.054 | YES |
| 6 | PSMB7 | PSMB7 | PSMB7 | 2636 | 0.055 | 0.088 | YES |
| 7 | PSMD13 | PSMD13 | PSMD13 | 2750 | 0.052 | 0.11 | YES |
| 8 | PSMB6 | PSMB6 | PSMB6 | 2857 | 0.049 | 0.14 | YES |
| 9 | PSMA6 | PSMA6 | PSMA6 | 2922 | 0.047 | 0.16 | YES |
| 10 | PSME2 | PSME2 | PSME2 | 2937 | 0.047 | 0.19 | YES |
| 11 | HSPA8 | HSPA8 | HSPA8 | 3034 | 0.044 | 0.21 | YES |
| 12 | PSMB5 | PSMB5 | PSMB5 | 3170 | 0.041 | 0.23 | YES |
| 13 | PSMD12 | PSMD12 | PSMD12 | 3443 | 0.035 | 0.24 | YES |
| 14 | PSME1 | PSME1 | PSME1 | 3504 | 0.034 | 0.26 | YES |
| 15 | PSMB2 | PSMB2 | PSMB2 | 3607 | 0.032 | 0.27 | YES |
| 16 | PSMC3 | PSMC3 | PSMC3 | 3619 | 0.031 | 0.29 | YES |
| 17 | UBA52 | UBA52 | UBA52 | 3666 | 0.03 | 0.3 | YES |
| 18 | PSMD7 | PSMD7 | PSMD7 | 3699 | 0.029 | 0.32 | YES |
| 19 | PSMA2 | PSMA2 | PSMA2 | 3711 | 0.029 | 0.34 | YES |
| 20 | PSMD1 | PSMD1 | PSMD1 | 3712 | 0.029 | 0.35 | YES |
| 21 | PSMC6 | PSMC6 | PSMC6 | 3755 | 0.028 | 0.37 | YES |
| 22 | PSMA4 | PSMA4 | PSMA4 | 3792 | 0.028 | 0.38 | YES |
| 23 | PSMD8 | PSMD8 | PSMD8 | 3820 | 0.027 | 0.4 | YES |
| 24 | RPS27A | RPS27A | RPS27A | 3887 | 0.026 | 0.41 | YES |
| 25 | PABPC1 | PABPC1 | PABPC1 | 3898 | 0.025 | 0.42 | YES |
| 26 | PSMF1 | PSMF1 | PSMF1 | 4009 | 0.023 | 0.43 | YES |
| 27 | PSMD9 | PSMD9 | PSMD9 | 4053 | 0.023 | 0.44 | YES |
| 28 | PSMB1 | PSMB1 | PSMB1 | 4079 | 0.022 | 0.46 | YES |
| 29 | PSMA1 | PSMA1 | PSMA1 | 4220 | 0.02 | 0.46 | YES |
| 30 | PSMA7 | PSMA7 | PSMA7 | 4255 | 0.019 | 0.47 | YES |
| 31 | PSMA3 | PSMA3 | PSMA3 | 4289 | 0.019 | 0.48 | YES |
| 32 | PSMB9 | PSMB9 | PSMB9 | 4490 | 0.015 | 0.48 | YES |
| 33 | PSMC1 | PSMC1 | PSMC1 | 4562 | 0.014 | 0.48 | YES |
| 34 | PSMD14 | PSMD14 | PSMD14 | 4815 | 0.0097 | 0.48 | YES |
| 35 | EIF4G1 | EIF4G1 | EIF4G1 | 4834 | 0.0094 | 0.48 | YES |
| 36 | PSMC5 | PSMC5 | PSMC5 | 4888 | 0.0085 | 0.48 | YES |
| 37 | PSMB3 | PSMB3 | PSMB3 | 4889 | 0.0084 | 0.49 | YES |
| 38 | PSMD3 | PSMD3 | PSMD3 | 4927 | 0.0079 | 0.49 | YES |
| 39 | PSMC4 | PSMC4 | PSMC4 | 5278 | 0.0022 | 0.47 | NO |
| 40 | PSMD11 | PSMD11 | PSMD11 | 5705 | -0.0042 | 0.45 | NO |
| 41 | PSMD4 | PSMD4 | PSMD4 | 5966 | -0.0084 | 0.44 | NO |
| 42 | PSMD5 | PSMD5 | PSMD5 | 6083 | -0.01 | 0.44 | NO |
| 43 | PSMB4 | PSMB4 | PSMB4 | 6583 | -0.018 | 0.43 | NO |
| 44 | PSMC2 | PSMC2 | PSMC2 | 6681 | -0.019 | 0.43 | NO |
| 45 | PSMD10 | PSMD10 | PSMD10 | 6927 | -0.023 | 0.43 | NO |
| 46 | PSME4 | PSME4 | PSME4 | 7055 | -0.025 | 0.44 | NO |
| 47 | PSMD2 | PSMD2 | PSMD2 | 7170 | -0.026 | 0.45 | NO |
| 48 | HNRNPD | HNRNPD | HNRNPD | 8003 | -0.04 | 0.43 | NO |
| 49 | HSPA1B | HSPA1B | HSPA1B | 8286 | -0.044 | 0.44 | NO |
| 50 | PSMA8 | PSMA8 | PSMA8 | 13641 | -0.18 | 0.26 | NO |
Figure S39. Get High-res Image This plot shows mRNAseq_cNMF expression data heatmap (on the left) a RunningEnrichmentScore(RES) plot (on the top right) and a Signal2Noise(S2N) plot (on the bottom right) of genes in the pathway: REACTOME REGULATION OF ORNITHINE DECARBOXYLASE ODC.
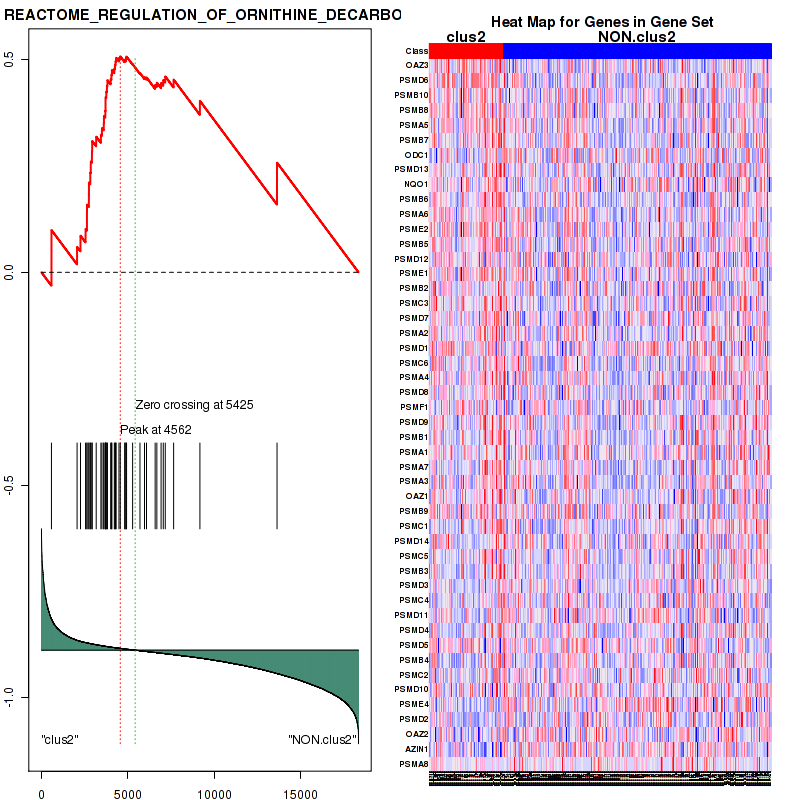
Figure S40. Get High-res Image For the top 5 core enriched genes in the pathway: REACTOME REGULATION OF ORNITHINE DECARBOXYLASE ODC, this volcano plot shows how much they are up/down-regulated and significant. The significance was calculated by empirical bayesian fit
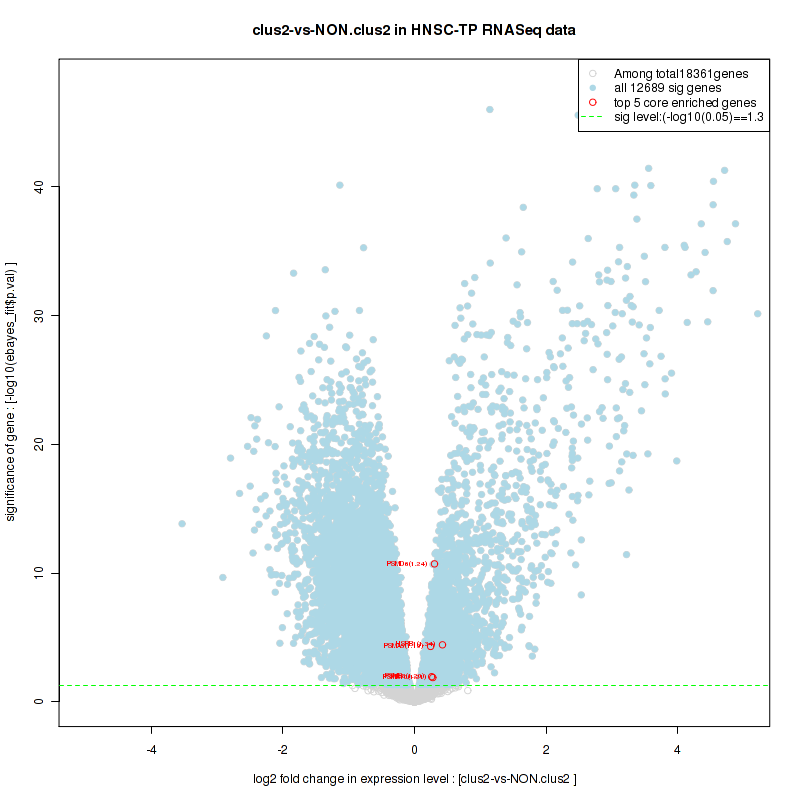
For the top enriched genes, if you want to check whether they are
-
up-regulated, please check the list of up-regulated genes
-
down-regulated, please check the list of down-regulated genes
For the top enriched genes, if you want to check whether they are
-
highly expressed genes, please check the list of high (top 30%) expressed genes
-
low expressed genes, please check the list of low (bottom 30%) expressed genes
An expression pattern of top(30%)/middle(30%)/low(30%) in this subtype against other subtypes is available in a heatmap
For the top enriched genes, if you want to check whether they are
-
significantly differently expressed genes by eBayes lm fit, please check the list of significant genes
Table 5. Get Full Table This table shows top 10 pathways which are significantly enriched in cluster clus3. It displays only significant gene sets satisfying nom.p.val.threshold (-1), fwer.p.val.threshold (-1) , fdr.q.val.threshold (0.25) and the default table is sorted by Normalized Enrichment Score (NES). Further details on NES statistics, please visit The Broad GSEA website.
| GeneSet(GS) | Size(#genes) | genes.ES.table | ES | NES | NOM.p.val | FDR.q.val | FWER.p.val | Tag.. | Gene.. | Signal | FDR..median. | glob.p.val |
|---|---|---|---|---|---|---|---|---|---|---|---|---|
| KEGG FATTY ACID METABOLISM | 39 | genes.ES.table | 0.5 | 1.5 | 0.082 | 1 | 0.98 | 0.46 | 0.32 | 0.32 | 0.88 | 0.46 |
| KEGG VALINE LEUCINE AND ISOLEUCINE DEGRADATION | 44 | genes.ES.table | 0.44 | 1.5 | 0.077 | 1 | 0.99 | 0.48 | 0.34 | 0.32 | 0.93 | 0.47 |
| KEGG STARCH AND SUCROSE METABOLISM | 40 | genes.ES.table | 0.65 | 1.7 | 0.0041 | 1 | 0.84 | 0.42 | 0.14 | 0.36 | 1 | 0.54 |
| KEGG GLYCOSYLPHOSPHATIDYLINOSITOL GPI ANCHOR BIOSYNTHESIS | 25 | genes.ES.table | 0.43 | 1.5 | 0.11 | 1 | 0.99 | 0.2 | 0.22 | 0.16 | 0.89 | 0.46 |
| KEGG GLYCOSPHINGOLIPID BIOSYNTHESIS LACTO AND NEOLACTO SERIES | 26 | genes.ES.table | 0.63 | 1.7 | 0.004 | 1 | 0.82 | 0.31 | 0.088 | 0.28 | 1 | 0.76 |
| KEGG BUTANOATE METABOLISM | 30 | genes.ES.table | 0.52 | 1.6 | 0.037 | 1 | 0.96 | 0.47 | 0.3 | 0.33 | 1 | 0.5 |
| KEGG PORPHYRIN AND CHLOROPHYLL METABOLISM | 33 | genes.ES.table | 0.65 | 1.6 | 0.025 | 1 | 0.9 | 0.33 | 0.14 | 0.29 | 1 | 0.57 |
| KEGG METABOLISM OF XENOBIOTICS BY CYTOCHROME P450 | 59 | genes.ES.table | 0.73 | 1.6 | 0.014 | 1 | 0.92 | 0.56 | 0.14 | 0.48 | 1 | 0.51 |
| KEGG DRUG METABOLISM CYTOCHROME P450 | 60 | genes.ES.table | 0.75 | 1.7 | 0.0062 | 1 | 0.82 | 0.57 | 0.14 | 0.49 | 1 | 0.59 |
| PID FANCONI PATHWAY | 46 | genes.ES.table | 0.54 | 1.6 | 0.1 | 1 | 0.96 | 0.7 | 0.36 | 0.45 | 1 | 0.54 |
Table S21. Get Full Table This table shows a Running Enrichment Score (RES) of each gene in this pathway, that is, the enrichment score at this point in the ranked list of genes. All genes are ranked by Signal-to-Noise (S2N), a measure of similarity as default and are used to obtain ES matrix of all genes. In this way, GSEA tool uses expression pattern of not only overlapped genes but also not-overlapped genes to produce ES matrix.
| Rank | GENE | SYMBOL | DESC | LIST.LOC | S2N | RES | CORE_ENRICHMENT |
|---|---|---|---|---|---|---|---|
| 1 | GCNT2 | GCNT2 | GCNT2 | 33 | 0.72 | 0.14 | YES |
| 2 | B3GALT5 | B3GALT5 | B3GALT5 | 64 | 0.67 | 0.27 | YES |
| 3 | FUT6 | FUT6 | FUT6 | 165 | 0.56 | 0.38 | YES |
| 4 | ABO | ABO | ABO | 519 | 0.44 | 0.44 | YES |
| 5 | FUT3 | FUT3 | FUT3 | 1201 | 0.33 | 0.47 | YES |
| 6 | B3GALT2 | B3GALT2 | B3GALT2 | 1242 | 0.33 | 0.53 | YES |
| 7 | FUT5 | FUT5 | FUT5 | 1576 | 0.3 | 0.57 | YES |
| 8 | B4GALT4 | B4GALT4 | B4GALT4 | 1614 | 0.29 | 0.63 | YES |
| 9 | FUT2 | FUT2 | FUT2 | 3398 | 0.18 | 0.57 | NO |
| 10 | FUT9 | FUT9 | FUT9 | 4151 | 0.14 | 0.55 | NO |
| 11 | FUT4 | FUT4 | FUT4 | 7147 | 0.066 | 0.4 | NO |
| 12 | B3GNT3 | B3GNT3 | B3GNT3 | 7689 | 0.056 | 0.38 | NO |
| 13 | B3GALT1 | B3GALT1 | B3GALT1 | 8470 | 0.041 | 0.35 | NO |
| 14 | ST8SIA1 | ST8SIA1 | ST8SIA1 | 8539 | 0.04 | 0.35 | NO |
| 15 | ST3GAL3 | ST3GAL3 | ST3GAL3 | 10152 | 0.016 | 0.27 | NO |
| 16 | FUT1 | FUT1 | FUT1 | 10203 | 0.015 | 0.27 | NO |
| 17 | B3GNT2 | B3GNT2 | B3GNT2 | 10602 | 0.0092 | 0.25 | NO |
| 18 | FUT7 | FUT7 | FUT7 | 10870 | 0.005 | 0.24 | NO |
| 19 | ST3GAL4 | ST3GAL4 | ST3GAL4 | 11497 | -0.0039 | 0.2 | NO |
| 20 | B4GALT3 | B4GALT3 | B4GALT3 | 11541 | -0.0047 | 0.2 | NO |
| 21 | B3GNT5 | B3GNT5 | B3GNT5 | 12903 | -0.027 | 0.13 | NO |
| 22 | B4GALT1 | B4GALT1 | B4GALT1 | 14497 | -0.06 | 0.057 | NO |
| 23 | B4GALT2 | B4GALT2 | B4GALT2 | 15125 | -0.078 | 0.038 | NO |
| 24 | B3GNT1 | B3GNT1 | B3GNT1 | 15570 | -0.095 | 0.033 | NO |
| 25 | ST3GAL6 | ST3GAL6 | ST3GAL6 | 17684 | -0.28 | -0.027 | NO |
| 26 | B3GNT4 | B3GNT4 | B3GNT4 | 17909 | -0.32 | 0.025 | NO |
Figure S41. Get High-res Image This plot shows mRNAseq_cNMF expression data heatmap (on the left) a RunningEnrichmentScore(RES) plot (on the top right) and a Signal2Noise(S2N) plot (on the bottom right) of genes in the pathway: KEGG FATTY ACID METABOLISM.
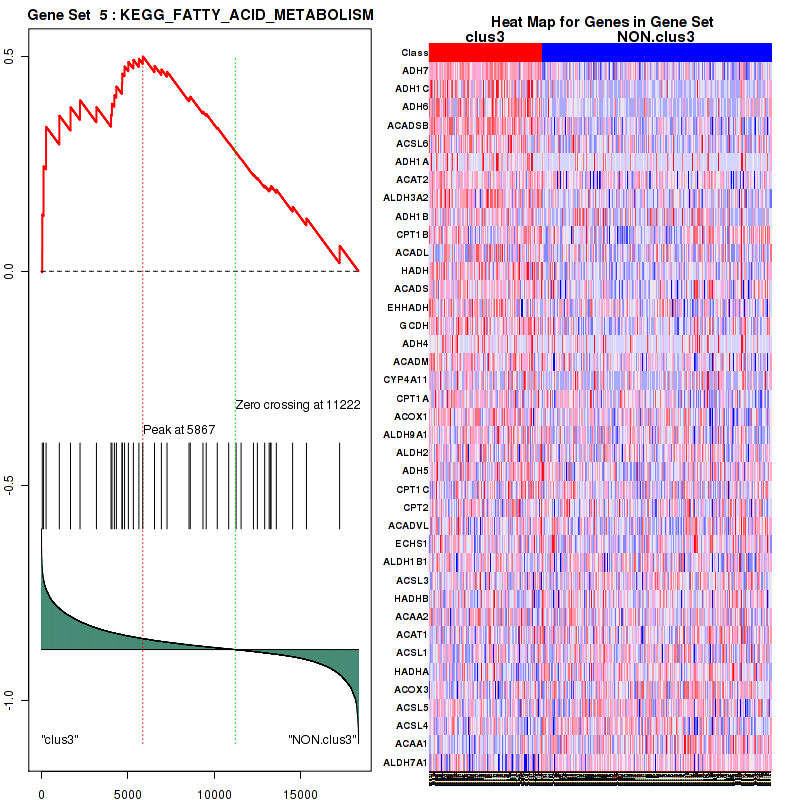
Figure S42. Get High-res Image For the top 5 core enriched genes in the pathway: KEGG FATTY ACID METABOLISM, this volcano plot shows how much they are up/down-regulated and significant. The significance was calculated by empirical bayesian fit
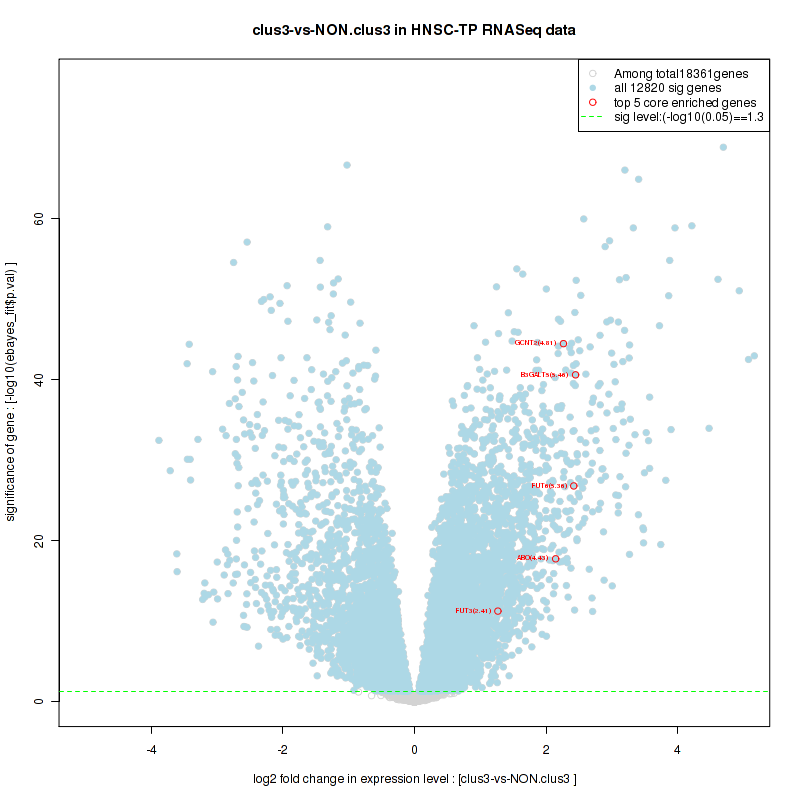
Table S22. Get Full Table This table shows a Running Enrichment Score (RES) of each gene in this pathway, that is, the enrichment score at this point in the ranked list of genes. All genes are ranked by Signal-to-Noise (S2N), a measure of similarity as default and are used to obtain ES matrix of all genes. In this way, GSEA tool uses expression pattern of not only overlapped genes but also not-overlapped genes to produce ES matrix.
| Rank | GENE | SYMBOL | DESC | LIST.LOC | S2N | RES | CORE_ENRICHMENT |
|---|---|---|---|---|---|---|---|
| 1 | GSTA1 | GSTA1 | GSTA1 | 20 | 0.78 | 0.048 | YES |
| 2 | ADH7 | ADH7 | ADH7 | 47 | 0.7 | 0.09 | YES |
| 3 | UGT1A6 | UGT1A6 | UGT1A6 | 70 | 0.66 | 0.13 | YES |
| 4 | ALDH3A1 | ALDH3A1 | ALDH3A1 | 89 | 0.63 | 0.17 | YES |
| 5 | UGT1A9 | UGT1A9 | UGT1A9 | 100 | 0.62 | 0.21 | YES |
| 6 | ADH1C | ADH1C | ADH1C | 120 | 0.61 | 0.24 | YES |
| 7 | GSTA2 | GSTA2 | GSTA2 | 139 | 0.59 | 0.28 | YES |
| 8 | UGT2A1 | UGT2A1 | UGT2A1 | 187 | 0.55 | 0.31 | YES |
| 9 | UGT1A7 | UGT1A7 | UGT1A7 | 196 | 0.55 | 0.34 | YES |
| 10 | UGT1A8 | UGT1A8 | UGT1A8 | 215 | 0.54 | 0.38 | YES |
| 11 | ADH6 | ADH6 | ADH6 | 267 | 0.52 | 0.41 | YES |
| 12 | UGT1A3 | UGT1A3 | UGT1A3 | 424 | 0.47 | 0.43 | YES |
| 13 | CYP2C19 | CYP2C19 | CYP2C19 | 438 | 0.46 | 0.46 | YES |
| 14 | CYP2E1 | CYP2E1 | CYP2E1 | 454 | 0.46 | 0.48 | YES |
| 15 | CYP2C18 | CYP2C18 | CYP2C18 | 714 | 0.4 | 0.49 | YES |
| 16 | CYP2C9 | CYP2C9 | CYP2C9 | 739 | 0.4 | 0.52 | YES |
| 17 | FMO3 | FMO3 | FMO3 | 753 | 0.4 | 0.54 | YES |
| 18 | CYP2A6 | CYP2A6 | CYP2A6 | 758 | 0.39 | 0.56 | YES |
| 19 | GSTM4 | GSTM4 | GSTM4 | 1158 | 0.34 | 0.56 | YES |
| 20 | GSTM2 | GSTM2 | GSTM2 | 1210 | 0.33 | 0.58 | YES |
| 21 | MGST1 | MGST1 | MGST1 | 1275 | 0.32 | 0.6 | YES |
| 22 | MAOB | MAOB | MAOB | 1443 | 0.31 | 0.61 | YES |
| 23 | UGT1A4 | UGT1A4 | UGT1A4 | 1491 | 0.3 | 0.62 | YES |
| 24 | CYP3A5 | CYP3A5 | CYP3A5 | 1531 | 0.3 | 0.64 | YES |
| 25 | GSTM3 | GSTM3 | GSTM3 | 1538 | 0.3 | 0.66 | YES |
| 26 | UGT1A10 | UGT1A10 | UGT1A10 | 1747 | 0.28 | 0.67 | YES |
| 27 | CYP2D6 | CYP2D6 | CYP2D6 | 1792 | 0.28 | 0.68 | YES |
| 28 | FMO2 | FMO2 | FMO2 | 1796 | 0.28 | 0.7 | YES |
| 29 | MAOA | MAOA | MAOA | 1889 | 0.27 | 0.71 | YES |
| 30 | UGT1A1 | UGT1A1 | UGT1A1 | 2054 | 0.25 | 0.72 | YES |
| 31 | ADH1A | ADH1A | ADH1A | 2233 | 0.24 | 0.72 | YES |
| 32 | GSTA3 | GSTA3 | GSTA3 | 2377 | 0.23 | 0.73 | YES |
| 33 | GSTA4 | GSTA4 | GSTA4 | 2449 | 0.23 | 0.74 | YES |
| 34 | UGT2B15 | UGT2B15 | UGT2B15 | 2565 | 0.22 | 0.75 | YES |
| 35 | CYP3A7 | CYP3A7 | CYP3A7 | 3023 | 0.19 | 0.73 | NO |
| 36 | UGT2B7 | UGT2B7 | UGT2B7 | 3981 | 0.15 | 0.69 | NO |
| 37 | ADH1B | ADH1B | ADH1B | 4082 | 0.15 | 0.69 | NO |
| 38 | CYP2C8 | CYP2C8 | CYP2C8 | 4171 | 0.14 | 0.7 | NO |
| 39 | FMO5 | FMO5 | FMO5 | 4332 | 0.14 | 0.7 | NO |
| 40 | GSTM1 | GSTM1 | GSTM1 | 5013 | 0.12 | 0.67 | NO |
| 41 | ADH4 | ADH4 | ADH4 | 5324 | 0.11 | 0.66 | NO |
| 42 | MGST2 | MGST2 | MGST2 | 6075 | 0.09 | 0.62 | NO |
| 43 | GSTT1 | GSTT1 | GSTT1 | 6329 | 0.084 | 0.61 | NO |
| 44 | FMO4 | FMO4 | FMO4 | 6765 | 0.074 | 0.59 | NO |
| 45 | CYP2B6 | CYP2B6 | CYP2B6 | 7726 | 0.055 | 0.55 | NO |
| 46 | ADH5 | ADH5 | ADH5 | 8616 | 0.039 | 0.5 | NO |
| 47 | CYP3A4 | CYP3A4 | CYP3A4 | 8674 | 0.038 | 0.5 | NO |
| 48 | GSTM5 | GSTM5 | GSTM5 | 8852 | 0.035 | 0.49 | NO |
| 49 | ALDH3B1 | ALDH3B1 | ALDH3B1 | 9129 | 0.031 | 0.48 | NO |
| 50 | GSTO2 | GSTO2 | GSTO2 | 10394 | 0.012 | 0.41 | NO |
| 51 | ALDH1A3 | ALDH1A3 | ALDH1A3 | 11244 | -0.00036 | 0.36 | NO |
| 52 | MGST3 | MGST3 | MGST3 | 11968 | -0.012 | 0.32 | NO |
| 53 | GSTZ1 | GSTZ1 | GSTZ1 | 12195 | -0.015 | 0.31 | NO |
| 54 | GSTT2 | GSTT2 | GSTT2 | 12311 | -0.017 | 0.31 | NO |
| 55 | AOX1 | AOX1 | AOX1 | 13172 | -0.032 | 0.26 | NO |
| 56 | GSTK1 | GSTK1 | GSTK1 | 13767 | -0.043 | 0.23 | NO |
| 57 | FMO1 | FMO1 | FMO1 | 13862 | -0.045 | 0.23 | NO |
| 58 | GSTP1 | GSTP1 | GSTP1 | 14076 | -0.05 | 0.22 | NO |
| 59 | GSTO1 | GSTO1 | GSTO1 | 14866 | -0.07 | 0.18 | NO |
| 60 | ALDH3B2 | ALDH3B2 | ALDH3B2 | 16098 | -0.12 | 0.12 | NO |
Figure S43. Get High-res Image This plot shows mRNAseq_cNMF expression data heatmap (on the left) a RunningEnrichmentScore(RES) plot (on the top right) and a Signal2Noise(S2N) plot (on the bottom right) of genes in the pathway: KEGG VALINE LEUCINE AND ISOLEUCINE DEGRADATION.
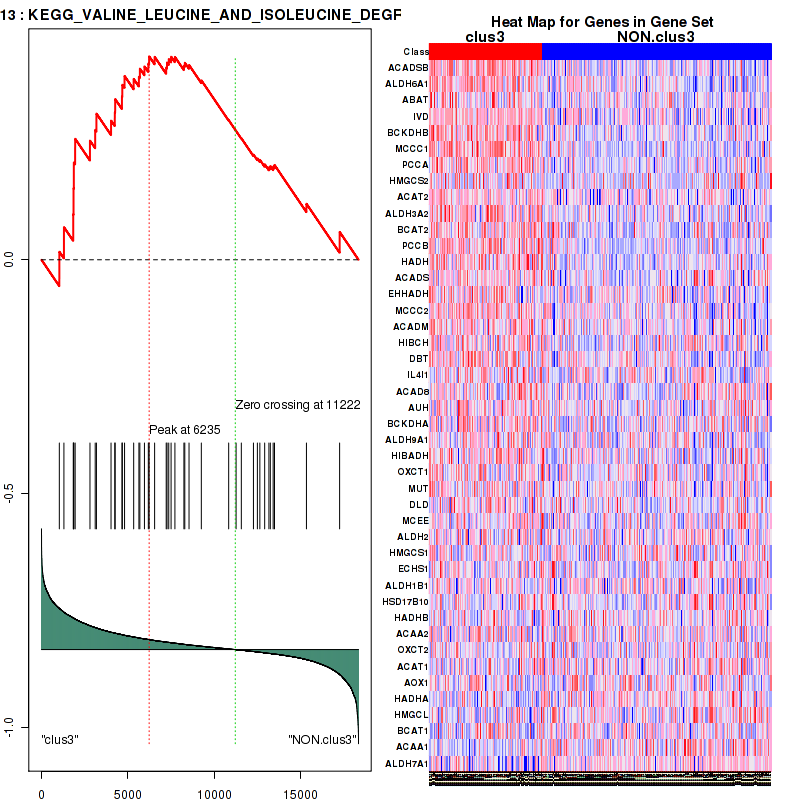
Figure S44. Get High-res Image For the top 5 core enriched genes in the pathway: KEGG VALINE LEUCINE AND ISOLEUCINE DEGRADATION, this volcano plot shows how much they are up/down-regulated and significant. The significance was calculated by empirical bayesian fit

Table S23. Get Full Table This table shows a Running Enrichment Score (RES) of each gene in this pathway, that is, the enrichment score at this point in the ranked list of genes. All genes are ranked by Signal-to-Noise (S2N), a measure of similarity as default and are used to obtain ES matrix of all genes. In this way, GSEA tool uses expression pattern of not only overlapped genes but also not-overlapped genes to produce ES matrix.
| Rank | GENE | SYMBOL | DESC | LIST.LOC | S2N | RES | CORE_ENRICHMENT |
|---|---|---|---|---|---|---|---|
| 1 | UGT1A6 | UGT1A6 | UGT1A6 | 70 | 0.66 | 0.072 | YES |
| 2 | UGT1A9 | UGT1A9 | UGT1A9 | 100 | 0.62 | 0.14 | YES |
| 3 | UGT2A1 | UGT2A1 | UGT2A1 | 187 | 0.55 | 0.2 | YES |
| 4 | UGT1A7 | UGT1A7 | UGT1A7 | 196 | 0.55 | 0.26 | YES |
| 5 | UGT1A8 | UGT1A8 | UGT1A8 | 215 | 0.54 | 0.32 | YES |
| 6 | UGT1A3 | UGT1A3 | UGT1A3 | 424 | 0.47 | 0.37 | YES |
| 7 | GCK | GCK | GCK | 484 | 0.45 | 0.41 | YES |
| 8 | AMY2B | AMY2B | AMY2B | 603 | 0.42 | 0.46 | YES |
| 9 | ENPP3 | ENPP3 | ENPP3 | 893 | 0.37 | 0.48 | YES |
| 10 | AMY1A | AMY1A | AMY1A | 943 | 0.37 | 0.52 | YES |
| 11 | AMY2A | AMY2A | AMY2A | 1075 | 0.35 | 0.56 | YES |
| 12 | UGT1A4 | UGT1A4 | UGT1A4 | 1491 | 0.3 | 0.57 | YES |
| 13 | UGT1A10 | UGT1A10 | UGT1A10 | 1747 | 0.28 | 0.58 | YES |
| 14 | GBA3 | GBA3 | GBA3 | 1778 | 0.28 | 0.62 | YES |
| 15 | UGT1A1 | UGT1A1 | UGT1A1 | 2054 | 0.25 | 0.63 | YES |
| 16 | UGT2B15 | UGT2B15 | UGT2B15 | 2565 | 0.22 | 0.63 | YES |
| 17 | TREH | TREH | TREH | 2610 | 0.22 | 0.65 | YES |
| 18 | UGT2B7 | UGT2B7 | UGT2B7 | 3981 | 0.15 | 0.59 | NO |
| 19 | UGDH | UGDH | UGDH | 4216 | 0.14 | 0.59 | NO |
| 20 | AGL | AGL | AGL | 5138 | 0.11 | 0.56 | NO |
| 21 | UXS1 | UXS1 | UXS1 | 5829 | 0.095 | 0.53 | NO |
| 22 | GUSB | GUSB | GUSB | 6487 | 0.08 | 0.5 | NO |
| 23 | GYS2 | GYS2 | GYS2 | 7083 | 0.067 | 0.48 | NO |
| 24 | GPI | GPI | GPI | 8096 | 0.048 | 0.43 | NO |
| 25 | GAA | GAA | GAA | 8545 | 0.04 | 0.41 | NO |
| 26 | GBE1 | GBE1 | GBE1 | 10820 | 0.0056 | 0.29 | NO |
| 27 | HK1 | HK1 | HK1 | 11153 | 0.0011 | 0.27 | NO |
| 28 | PGM2 | PGM2 | PGM2 | 11441 | -0.0033 | 0.25 | NO |
| 29 | ENPP1 | ENPP1 | ENPP1 | 12036 | -0.012 | 0.22 | NO |
| 30 | UGP2 | UGP2 | UGP2 | 12215 | -0.015 | 0.21 | NO |
| 31 | PGM2L1 | PGM2L1 | PGM2L1 | 13038 | -0.03 | 0.17 | NO |
| 32 | HK2 | HK2 | HK2 | 13355 | -0.036 | 0.16 | NO |
| 33 | PYGB | PYGB | PYGB | 14935 | -0.072 | 0.081 | NO |
| 34 | PGM1 | PGM1 | PGM1 | 15097 | -0.077 | 0.081 | NO |
| 35 | HK3 | HK3 | HK3 | 15231 | -0.082 | 0.083 | NO |
| 36 | GYS1 | GYS1 | GYS1 | 15372 | -0.087 | 0.085 | NO |
| 37 | GANC | GANC | GANC | 15390 | -0.088 | 0.094 | NO |
| 38 | MGAM | MGAM | MGAM | 16030 | -0.12 | 0.073 | NO |
| 39 | PYGM | PYGM | PYGM | 16926 | -0.18 | 0.044 | NO |
| 40 | PYGL | PYGL | PYGL | 17762 | -0.3 | 0.033 | NO |
Figure S45. Get High-res Image This plot shows mRNAseq_cNMF expression data heatmap (on the left) a RunningEnrichmentScore(RES) plot (on the top right) and a Signal2Noise(S2N) plot (on the bottom right) of genes in the pathway: KEGG STARCH AND SUCROSE METABOLISM.
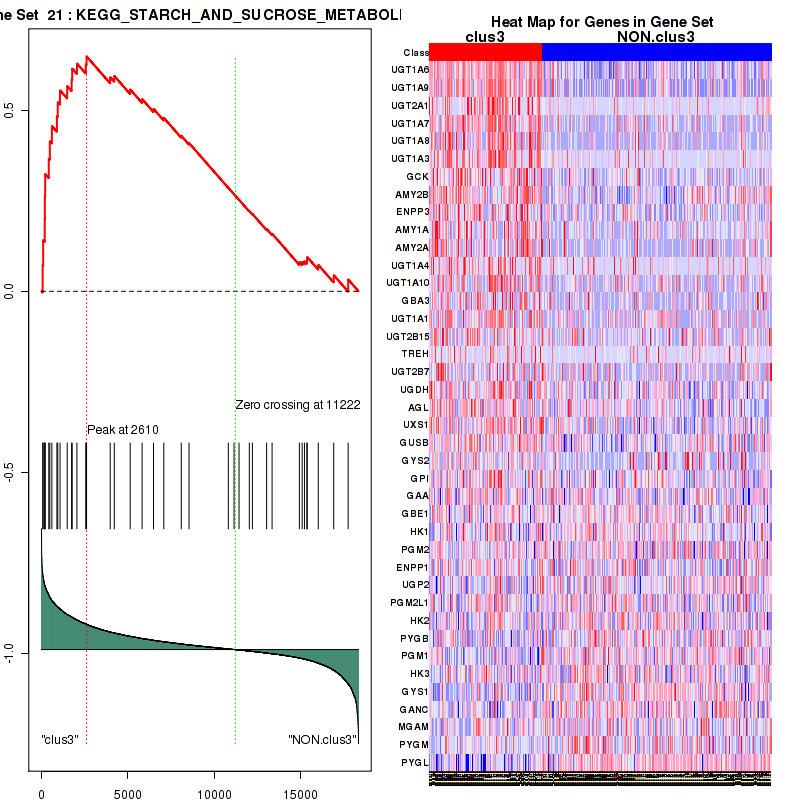
Figure S46. Get High-res Image For the top 5 core enriched genes in the pathway: KEGG STARCH AND SUCROSE METABOLISM, this volcano plot shows how much they are up/down-regulated and significant. The significance was calculated by empirical bayesian fit
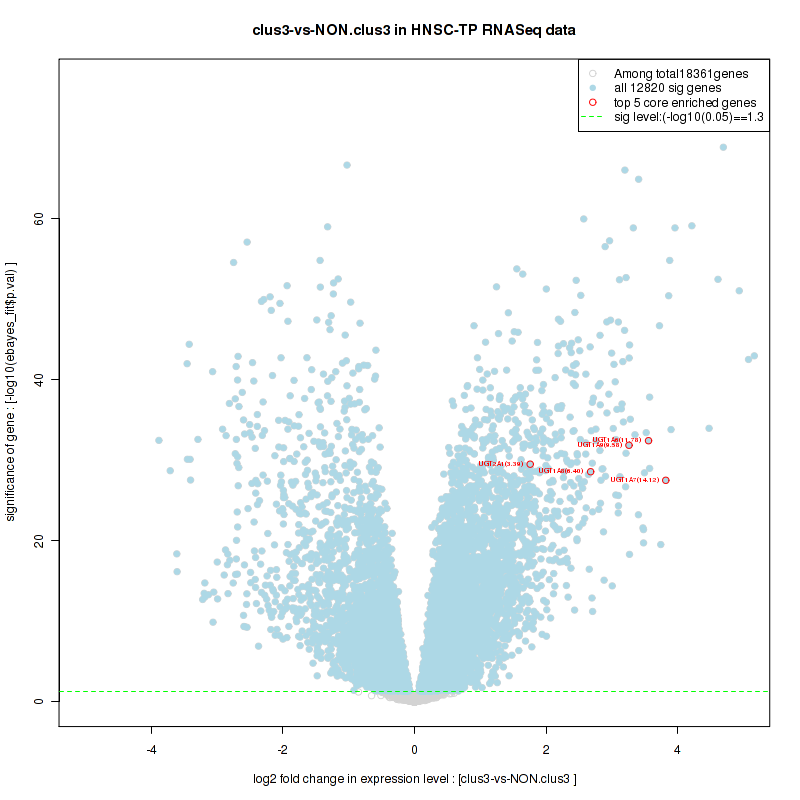
Table S24. Get Full Table This table shows a Running Enrichment Score (RES) of each gene in this pathway, that is, the enrichment score at this point in the ranked list of genes. All genes are ranked by Signal-to-Noise (S2N), a measure of similarity as default and are used to obtain ES matrix of all genes. In this way, GSEA tool uses expression pattern of not only overlapped genes but also not-overlapped genes to produce ES matrix.
| Rank | GENE | SYMBOL | DESC | LIST.LOC | S2N | RES | CORE_ENRICHMENT |
|---|---|---|---|---|---|---|---|
| 1 | UGT1A6 | UGT1A6 | UGT1A6 | 70 | 0.66 | 0.1 | YES |
| 2 | UGT1A9 | UGT1A9 | UGT1A9 | 100 | 0.62 | 0.2 | YES |
| 3 | CP | CP | CP | 133 | 0.59 | 0.29 | YES |
| 4 | UGT2A1 | UGT2A1 | UGT2A1 | 187 | 0.55 | 0.37 | YES |
| 5 | UGT1A7 | UGT1A7 | UGT1A7 | 196 | 0.55 | 0.46 | YES |
| 6 | UGT1A8 | UGT1A8 | UGT1A8 | 215 | 0.54 | 0.54 | YES |
| 7 | UGT1A3 | UGT1A3 | UGT1A3 | 424 | 0.47 | 0.6 | YES |
| 8 | UGT1A4 | UGT1A4 | UGT1A4 | 1491 | 0.3 | 0.59 | YES |
| 9 | UGT1A10 | UGT1A10 | UGT1A10 | 1747 | 0.28 | 0.62 | YES |
| 10 | UGT1A1 | UGT1A1 | UGT1A1 | 2054 | 0.25 | 0.64 | YES |
| 11 | UGT2B15 | UGT2B15 | UGT2B15 | 2565 | 0.22 | 0.65 | YES |
| 12 | UGT2B7 | UGT2B7 | UGT2B7 | 3981 | 0.15 | 0.6 | NO |
| 13 | FECH | FECH | FECH | 4693 | 0.13 | 0.58 | NO |
| 14 | PPOX | PPOX | PPOX | 5282 | 0.11 | 0.56 | NO |
| 15 | CPOX | CPOX | CPOX | 5807 | 0.096 | 0.55 | NO |
| 16 | GUSB | GUSB | GUSB | 6487 | 0.08 | 0.53 | NO |
| 17 | MMAB | MMAB | MMAB | 6635 | 0.076 | 0.53 | NO |
| 18 | BLVRB | BLVRB | BLVRB | 8175 | 0.047 | 0.45 | NO |
| 19 | ALAD | ALAD | ALAD | 8738 | 0.037 | 0.43 | NO |
| 20 | EARS2 | EARS2 | EARS2 | 8868 | 0.035 | 0.43 | NO |
| 21 | EPRS | EPRS | EPRS | 9204 | 0.03 | 0.41 | NO |
| 22 | COX10 | COX10 | COX10 | 9542 | 0.025 | 0.4 | NO |
| 23 | COX15 | COX15 | COX15 | 9702 | 0.022 | 0.39 | NO |
| 24 | ALAS1 | ALAS1 | ALAS1 | 9709 | 0.022 | 0.4 | NO |
| 25 | FTH1 | FTH1 | FTH1 | 12130 | -0.014 | 0.27 | NO |
| 26 | HCCS | HCCS | HCCS | 12279 | -0.016 | 0.26 | NO |
| 27 | UROS | UROS | UROS | 12611 | -0.022 | 0.25 | NO |
| 28 | HMOX1 | HMOX1 | HMOX1 | 13025 | -0.029 | 0.23 | NO |
| 29 | BLVRA | BLVRA | BLVRA | 13546 | -0.039 | 0.21 | NO |
| 30 | HMBS | HMBS | HMBS | 13847 | -0.045 | 0.2 | NO |
| 31 | UROD | UROD | UROD | 14919 | -0.071 | 0.15 | NO |
| 32 | ALAS2 | ALAS2 | ALAS2 | 15409 | -0.088 | 0.14 | NO |
| 33 | HMOX2 | HMOX2 | HMOX2 | 16567 | -0.15 | 0.098 | NO |
Figure S47. Get High-res Image This plot shows mRNAseq_cNMF expression data heatmap (on the left) a RunningEnrichmentScore(RES) plot (on the top right) and a Signal2Noise(S2N) plot (on the bottom right) of genes in the pathway: KEGG GLYCOSYLPHOSPHATIDYLINOSITOL GPI ANCHOR BIOSYNTHESIS.
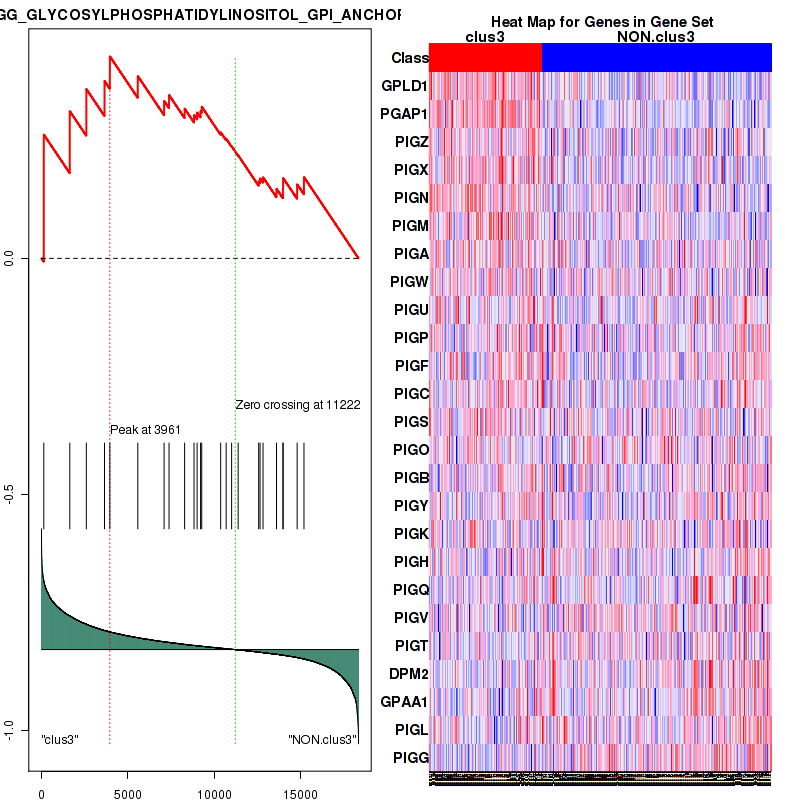
Figure S48. Get High-res Image For the top 5 core enriched genes in the pathway: KEGG GLYCOSYLPHOSPHATIDYLINOSITOL GPI ANCHOR BIOSYNTHESIS, this volcano plot shows how much they are up/down-regulated and significant. The significance was calculated by empirical bayesian fit
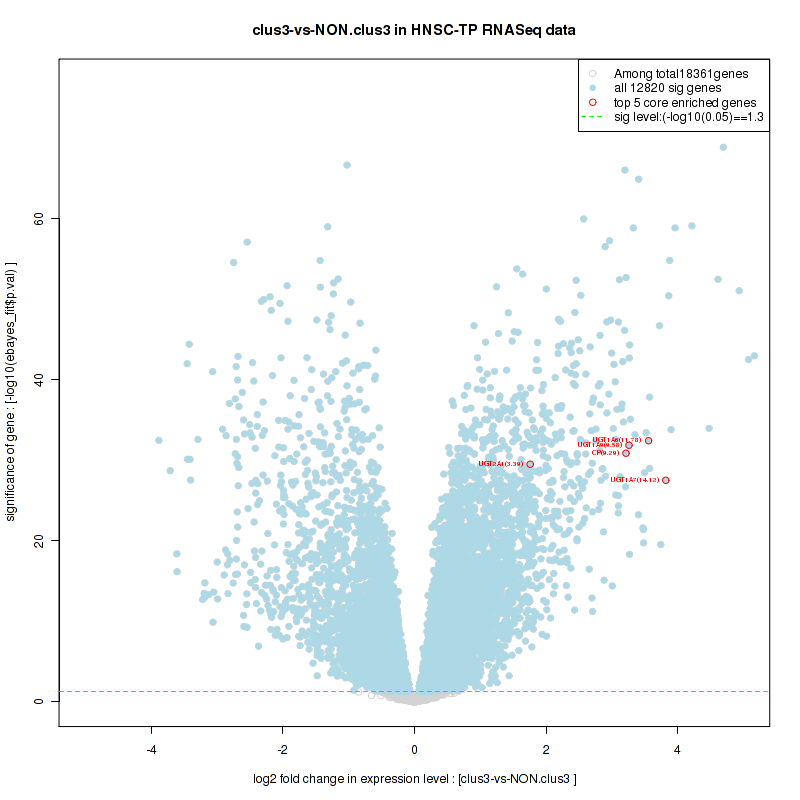
Table S25. Get Full Table This table shows a Running Enrichment Score (RES) of each gene in this pathway, that is, the enrichment score at this point in the ranked list of genes. All genes are ranked by Signal-to-Noise (S2N), a measure of similarity as default and are used to obtain ES matrix of all genes. In this way, GSEA tool uses expression pattern of not only overlapped genes but also not-overlapped genes to produce ES matrix.
| Rank | GENE | SYMBOL | DESC | LIST.LOC | S2N | RES | CORE_ENRICHMENT |
|---|---|---|---|---|---|---|---|
| 1 | CLDN3 | CLDN3 | CLDN3 | 8 | 0.87 | 0.14 | YES |
| 2 | PARD6A | PARD6A | PARD6A | 137 | 0.59 | 0.22 | YES |
| 3 | CLDN10 | CLDN10 | CLDN10 | 217 | 0.54 | 0.3 | YES |
| 4 | CLDN7 | CLDN7 | CLDN7 | 447 | 0.46 | 0.36 | YES |
| 5 | CLDN20 | CLDN20 | CLDN20 | 451 | 0.46 | 0.43 | YES |
| 6 | CLDN8 | CLDN8 | CLDN8 | 506 | 0.44 | 0.49 | YES |
| 7 | CLDN16 | CLDN16 | CLDN16 | 1310 | 0.32 | 0.5 | YES |
| 8 | CLDN4 | CLDN4 | CLDN4 | 1320 | 0.32 | 0.55 | YES |
| 9 | PARD6B | PARD6B | PARD6B | 1327 | 0.32 | 0.6 | YES |
| 10 | CLDN18 | CLDN18 | CLDN18 | 2026 | 0.26 | 0.6 | YES |
| 11 | CLDN2 | CLDN2 | CLDN2 | 2252 | 0.24 | 0.62 | YES |
| 12 | CLDN15 | CLDN15 | CLDN15 | 2482 | 0.22 | 0.65 | YES |
| 13 | CRB3 | CRB3 | CRB3 | 2638 | 0.22 | 0.67 | YES |
| 14 | CLDN11 | CLDN11 | CLDN11 | 3850 | 0.16 | 0.63 | NO |
| 15 | PARD3 | PARD3 | PARD3 | 3893 | 0.15 | 0.65 | NO |
| 16 | CLDN1 | CLDN1 | CLDN1 | 4466 | 0.14 | 0.64 | NO |
| 17 | PRKCI | PRKCI | PRKCI | 5225 | 0.11 | 0.62 | NO |
| 18 | CLDN6 | CLDN6 | CLDN6 | 6022 | 0.091 | 0.59 | NO |
| 19 | F11R | F11R | F11R | 6188 | 0.087 | 0.59 | NO |
| 20 | CLDN19 | CLDN19 | CLDN19 | 6808 | 0.073 | 0.57 | NO |
| 21 | CLDN9 | CLDN9 | CLDN9 | 7646 | 0.057 | 0.53 | NO |
| 22 | PARD6G | PARD6G | PARD6G | 7683 | 0.056 | 0.54 | NO |
| 23 | CLDN5 | CLDN5 | CLDN5 | 7712 | 0.056 | 0.55 | NO |
| 24 | INADL | INADL | INADL | 8872 | 0.035 | 0.49 | NO |
| 25 | CLDN14 | CLDN14 | CLDN14 | 9716 | 0.022 | 0.45 | NO |
| 26 | CLDN12 | CLDN12 | CLDN12 | 10768 | 0.0066 | 0.39 | NO |
| 27 | MPP5 | MPP5 | MPP5 | 13317 | -0.035 | 0.26 | NO |
| 28 | CLDN17 | CLDN17 | CLDN17 | 16187 | -0.12 | 0.12 | NO |
Figure S49. Get High-res Image This plot shows mRNAseq_cNMF expression data heatmap (on the left) a RunningEnrichmentScore(RES) plot (on the top right) and a Signal2Noise(S2N) plot (on the bottom right) of genes in the pathway: KEGG GLYCOSPHINGOLIPID BIOSYNTHESIS LACTO AND NEOLACTO SERIES.
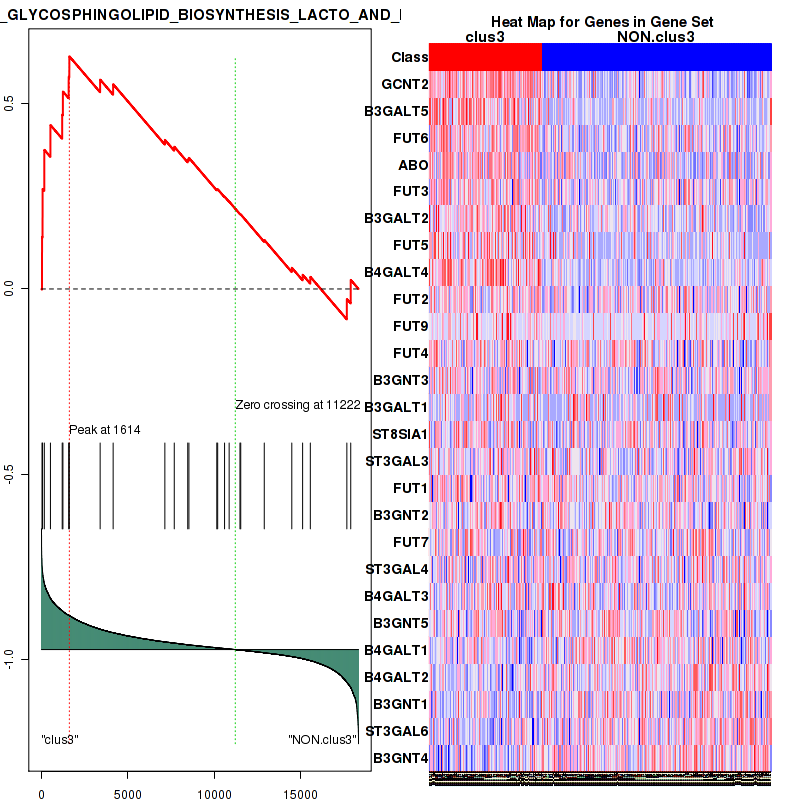
Figure S50. Get High-res Image For the top 5 core enriched genes in the pathway: KEGG GLYCOSPHINGOLIPID BIOSYNTHESIS LACTO AND NEOLACTO SERIES, this volcano plot shows how much they are up/down-regulated and significant. The significance was calculated by empirical bayesian fit
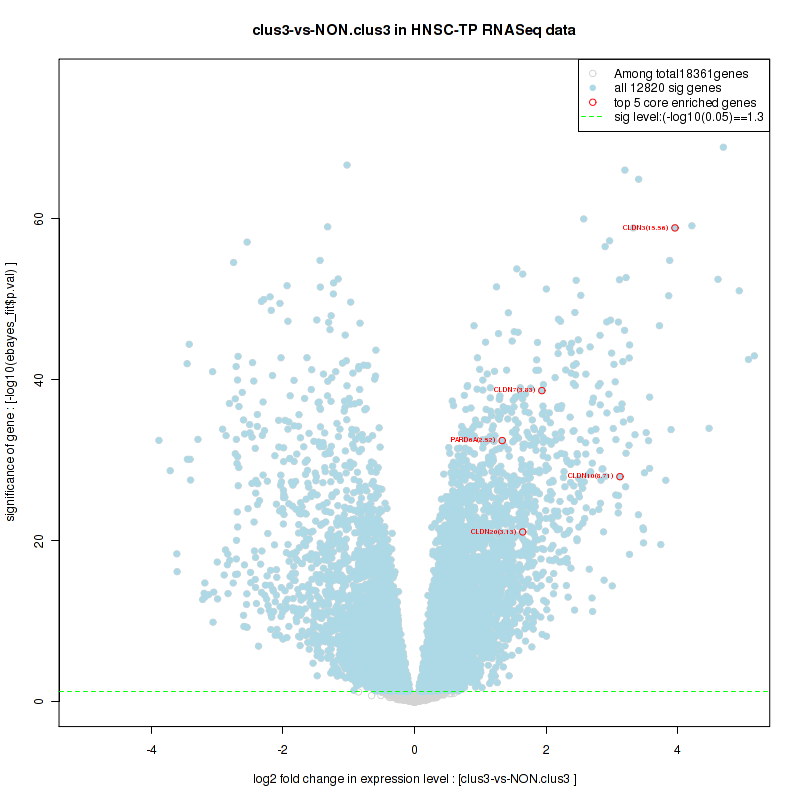
Table S26. Get Full Table This table shows a Running Enrichment Score (RES) of each gene in this pathway, that is, the enrichment score at this point in the ranked list of genes. All genes are ranked by Signal-to-Noise (S2N), a measure of similarity as default and are used to obtain ES matrix of all genes. In this way, GSEA tool uses expression pattern of not only overlapped genes but also not-overlapped genes to produce ES matrix.
| Rank | GENE | SYMBOL | DESC | LIST.LOC | S2N | RES | CORE_ENRICHMENT |
|---|---|---|---|---|---|---|---|
| 1 | GSTA1 | GSTA1 | GSTA1 | 20 | 0.78 | 0.047 | YES |
| 2 | ADH7 | ADH7 | ADH7 | 47 | 0.7 | 0.089 | YES |
| 3 | UGT1A6 | UGT1A6 | UGT1A6 | 70 | 0.66 | 0.13 | YES |
| 4 | ALDH3A1 | ALDH3A1 | ALDH3A1 | 89 | 0.63 | 0.17 | YES |
| 5 | UGT1A9 | UGT1A9 | UGT1A9 | 100 | 0.62 | 0.2 | YES |
| 6 | ADH1C | ADH1C | ADH1C | 120 | 0.61 | 0.24 | YES |
| 7 | CYP2F1 | CYP2F1 | CYP2F1 | 127 | 0.6 | 0.28 | YES |
| 8 | GSTA2 | GSTA2 | GSTA2 | 139 | 0.59 | 0.31 | YES |
| 9 | UGT2A1 | UGT2A1 | UGT2A1 | 187 | 0.55 | 0.34 | YES |
| 10 | UGT1A7 | UGT1A7 | UGT1A7 | 196 | 0.55 | 0.38 | YES |
| 11 | UGT1A8 | UGT1A8 | UGT1A8 | 215 | 0.54 | 0.41 | YES |
| 12 | ADH6 | ADH6 | ADH6 | 267 | 0.52 | 0.44 | YES |
| 13 | UGT1A3 | UGT1A3 | UGT1A3 | 424 | 0.47 | 0.46 | YES |
| 14 | CYP2C19 | CYP2C19 | CYP2C19 | 438 | 0.46 | 0.49 | YES |
| 15 | CYP2E1 | CYP2E1 | CYP2E1 | 454 | 0.46 | 0.52 | YES |
| 16 | CYP2C18 | CYP2C18 | CYP2C18 | 714 | 0.4 | 0.53 | YES |
| 17 | CYP2C9 | CYP2C9 | CYP2C9 | 739 | 0.4 | 0.55 | YES |
| 18 | CYP2S1 | CYP2S1 | CYP2S1 | 772 | 0.39 | 0.57 | YES |
| 19 | GSTM4 | GSTM4 | GSTM4 | 1158 | 0.34 | 0.57 | YES |
| 20 | GSTM2 | GSTM2 | GSTM2 | 1210 | 0.33 | 0.59 | YES |
| 21 | MGST1 | MGST1 | MGST1 | 1275 | 0.32 | 0.61 | YES |
| 22 | UGT1A4 | UGT1A4 | UGT1A4 | 1491 | 0.3 | 0.61 | YES |
| 23 | CYP3A5 | CYP3A5 | CYP3A5 | 1531 | 0.3 | 0.63 | YES |
| 24 | GSTM3 | GSTM3 | GSTM3 | 1538 | 0.3 | 0.65 | YES |
| 25 | UGT1A10 | UGT1A10 | UGT1A10 | 1747 | 0.28 | 0.65 | YES |
| 26 | UGT1A1 | UGT1A1 | UGT1A1 | 2054 | 0.25 | 0.65 | YES |
| 27 | ADH1A | ADH1A | ADH1A | 2233 | 0.24 | 0.66 | YES |
| 28 | EPHX1 | EPHX1 | EPHX1 | 2265 | 0.24 | 0.67 | YES |
| 29 | DHDH | DHDH | DHDH | 2268 | 0.24 | 0.69 | YES |
| 30 | GSTA3 | GSTA3 | GSTA3 | 2377 | 0.23 | 0.69 | YES |
| 31 | GSTA4 | GSTA4 | GSTA4 | 2449 | 0.23 | 0.7 | YES |
| 32 | AKR1C1 | AKR1C1 | AKR1C1 | 2554 | 0.22 | 0.71 | YES |
| 33 | UGT2B15 | UGT2B15 | UGT2B15 | 2565 | 0.22 | 0.72 | YES |
| 34 | CYP3A7 | CYP3A7 | CYP3A7 | 3023 | 0.19 | 0.71 | NO |
| 35 | AKR1C2 | AKR1C2 | AKR1C2 | 3254 | 0.18 | 0.71 | NO |
| 36 | CYP1B1 | CYP1B1 | CYP1B1 | 3342 | 0.18 | 0.72 | NO |
| 37 | CYP1A1 | CYP1A1 | CYP1A1 | 3973 | 0.15 | 0.69 | NO |
| 38 | UGT2B7 | UGT2B7 | UGT2B7 | 3981 | 0.15 | 0.7 | NO |
| 39 | ADH1B | ADH1B | ADH1B | 4082 | 0.15 | 0.7 | NO |
| 40 | CYP2C8 | CYP2C8 | CYP2C8 | 4171 | 0.14 | 0.71 | NO |
| 41 | AKR1C3 | AKR1C3 | AKR1C3 | 4735 | 0.13 | 0.69 | NO |
| 42 | GSTM1 | GSTM1 | GSTM1 | 5013 | 0.12 | 0.68 | NO |
| 43 | ADH4 | ADH4 | ADH4 | 5324 | 0.11 | 0.67 | NO |
| 44 | MGST2 | MGST2 | MGST2 | 6075 | 0.09 | 0.63 | NO |
| 45 | GSTT1 | GSTT1 | GSTT1 | 6329 | 0.084 | 0.62 | NO |
| 46 | CYP2B6 | CYP2B6 | CYP2B6 | 7726 | 0.055 | 0.55 | NO |
| 47 | ADH5 | ADH5 | ADH5 | 8616 | 0.039 | 0.5 | NO |
| 48 | CYP3A4 | CYP3A4 | CYP3A4 | 8674 | 0.038 | 0.5 | NO |
| 49 | GSTM5 | GSTM5 | GSTM5 | 8852 | 0.035 | 0.5 | NO |
| 50 | ALDH3B1 | ALDH3B1 | ALDH3B1 | 9129 | 0.031 | 0.48 | NO |
| 51 | GSTO2 | GSTO2 | GSTO2 | 10394 | 0.012 | 0.42 | NO |
| 52 | ALDH1A3 | ALDH1A3 | ALDH1A3 | 11244 | -0.00036 | 0.37 | NO |
| 53 | MGST3 | MGST3 | MGST3 | 11968 | -0.012 | 0.33 | NO |
| 54 | GSTZ1 | GSTZ1 | GSTZ1 | 12195 | -0.015 | 0.32 | NO |
| 55 | GSTT2 | GSTT2 | GSTT2 | 12311 | -0.017 | 0.31 | NO |
| 56 | GSTK1 | GSTK1 | GSTK1 | 13767 | -0.043 | 0.24 | NO |
| 57 | GSTP1 | GSTP1 | GSTP1 | 14076 | -0.05 | 0.22 | NO |
| 58 | GSTO1 | GSTO1 | GSTO1 | 14866 | -0.07 | 0.18 | NO |
| 59 | ALDH3B2 | ALDH3B2 | ALDH3B2 | 16098 | -0.12 | 0.12 | NO |
Figure S51. Get High-res Image This plot shows mRNAseq_cNMF expression data heatmap (on the left) a RunningEnrichmentScore(RES) plot (on the top right) and a Signal2Noise(S2N) plot (on the bottom right) of genes in the pathway: KEGG BUTANOATE METABOLISM.
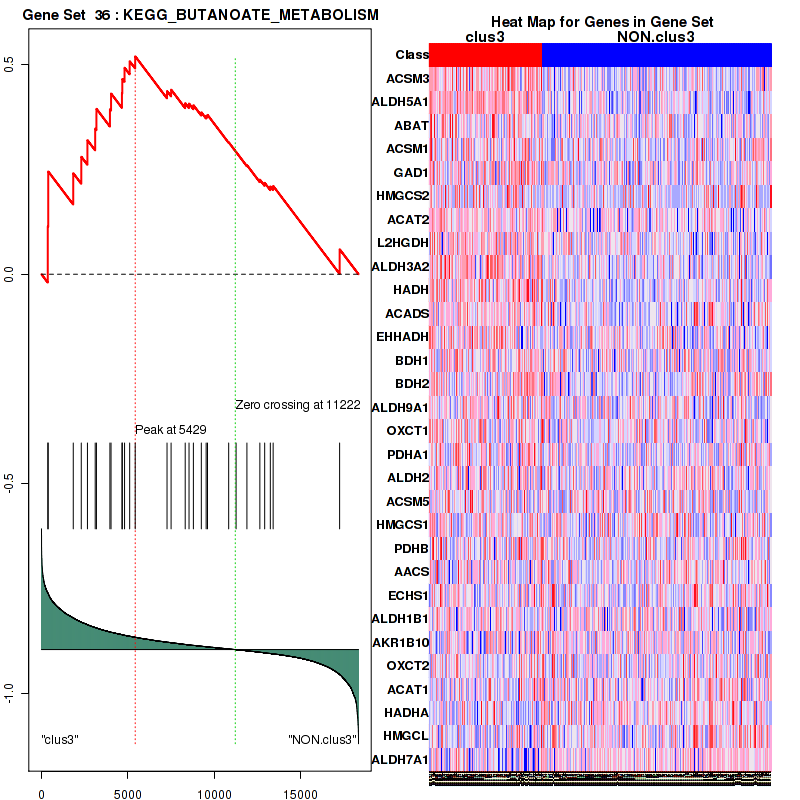
Figure S52. Get High-res Image For the top 5 core enriched genes in the pathway: KEGG BUTANOATE METABOLISM, this volcano plot shows how much they are up/down-regulated and significant. The significance was calculated by empirical bayesian fit
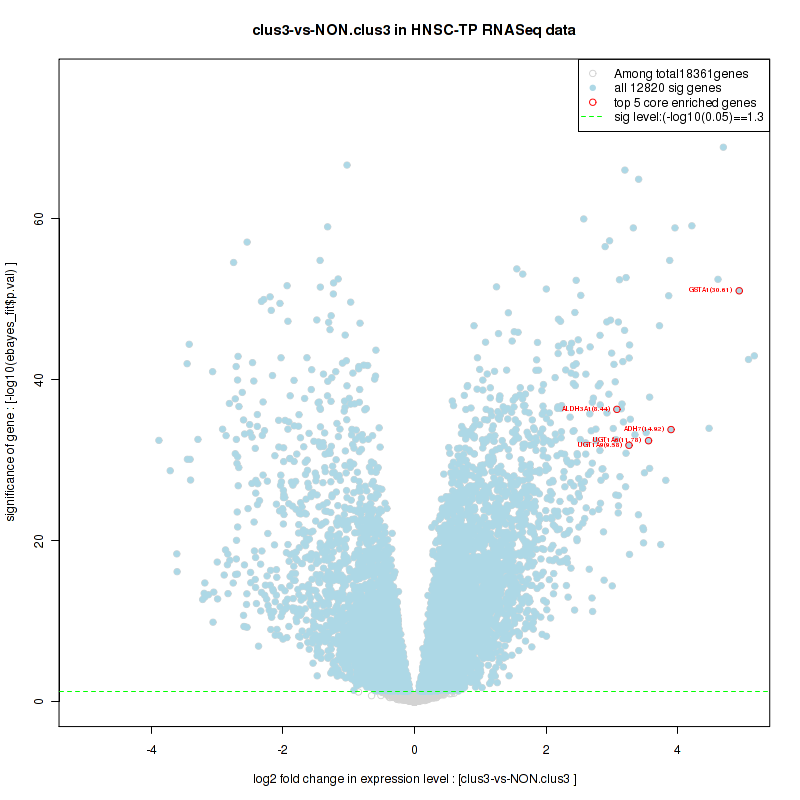
Table S27. Get Full Table This table shows a Running Enrichment Score (RES) of each gene in this pathway, that is, the enrichment score at this point in the ranked list of genes. All genes are ranked by Signal-to-Noise (S2N), a measure of similarity as default and are used to obtain ES matrix of all genes. In this way, GSEA tool uses expression pattern of not only overlapped genes but also not-overlapped genes to produce ES matrix.
| Rank | GENE | SYMBOL | DESC | LIST.LOC | S2N | RES | CORE_ENRICHMENT |
|---|---|---|---|---|---|---|---|
| 1 | BARD1 | BARD1 | BARD1 | 1228 | 0.33 | 0.052 | YES |
| 2 | FANCL | FANCL | FANCL | 1776 | 0.28 | 0.12 | YES |
| 3 | TP53 | TP53 | TP53 | 2997 | 0.2 | 0.12 | YES |
| 4 | TOPBP1 | TOPBP1 | TOPBP1 | 3367 | 0.18 | 0.17 | YES |
| 5 | BRCA1 | BRCA1 | BRCA1 | 3423 | 0.17 | 0.23 | YES |
| 6 | FANCD2 | FANCD2 | FANCD2 | 3447 | 0.17 | 0.29 | YES |
| 7 | FANCC | FANCC | FANCC | 3919 | 0.15 | 0.32 | YES |
| 8 | RBBP8 | RBBP8 | RBBP8 | 4577 | 0.13 | 0.33 | YES |
| 9 | FANCE | FANCE | FANCE | 4636 | 0.13 | 0.37 | YES |
| 10 | ATR | ATR | ATR | 5216 | 0.11 | 0.38 | YES |
| 11 | ATM | ATM | ATM | 5434 | 0.11 | 0.41 | YES |
| 12 | FANCA | FANCA | FANCA | 5498 | 0.1 | 0.44 | YES |
| 13 | CDK2 | CDK2 | CDK2 | 5590 | 0.1 | 0.47 | YES |
| 14 | PCNA | PCNA | PCNA | 5852 | 0.094 | 0.49 | YES |
| 15 | RAD51 | RAD51 | RAD51 | 6356 | 0.083 | 0.5 | YES |
| 16 | FANCG | FANCG | FANCG | 6422 | 0.081 | 0.52 | YES |
| 17 | MRE11A | MRE11A | MRE11A | 6621 | 0.076 | 0.54 | YES |
| 18 | PRKDC | PRKDC | PRKDC | 9029 | 0.033 | 0.42 | NO |
| 19 | XRCC5 | XRCC5 | XRCC5 | 9527 | 0.025 | 0.4 | NO |
| 20 | CSTF1 | CSTF1 | CSTF1 | 9722 | 0.022 | 0.4 | NO |
| 21 | CCNE1 | CCNE1 | CCNE1 | 9729 | 0.022 | 0.4 | NO |
| 22 | NBN | NBN | NBN | 10272 | 0.014 | 0.38 | NO |
| 23 | EWSR1 | EWSR1 | EWSR1 | 10736 | 0.0071 | 0.36 | NO |
| 24 | XRCC6 | XRCC6 | XRCC6 | 11260 | -0.00057 | 0.33 | NO |
| 25 | RAD50 | RAD50 | RAD50 | 12384 | -0.018 | 0.28 | NO |
| 26 | FANCF | FANCF | FANCF | 12669 | -0.023 | 0.27 | NO |
| 27 | UBE2D3 | UBE2D3 | UBE2D3 | 13486 | -0.038 | 0.24 | NO |
| 28 | NPM1 | NPM1 | NPM1 | 13566 | -0.039 | 0.25 | NO |
| 29 | UBE2L3 | UBE2L3 | UBE2L3 | 13695 | -0.042 | 0.26 | NO |
Figure S53. Get High-res Image This plot shows mRNAseq_cNMF expression data heatmap (on the left) a RunningEnrichmentScore(RES) plot (on the top right) and a Signal2Noise(S2N) plot (on the bottom right) of genes in the pathway: KEGG PORPHYRIN AND CHLOROPHYLL METABOLISM.
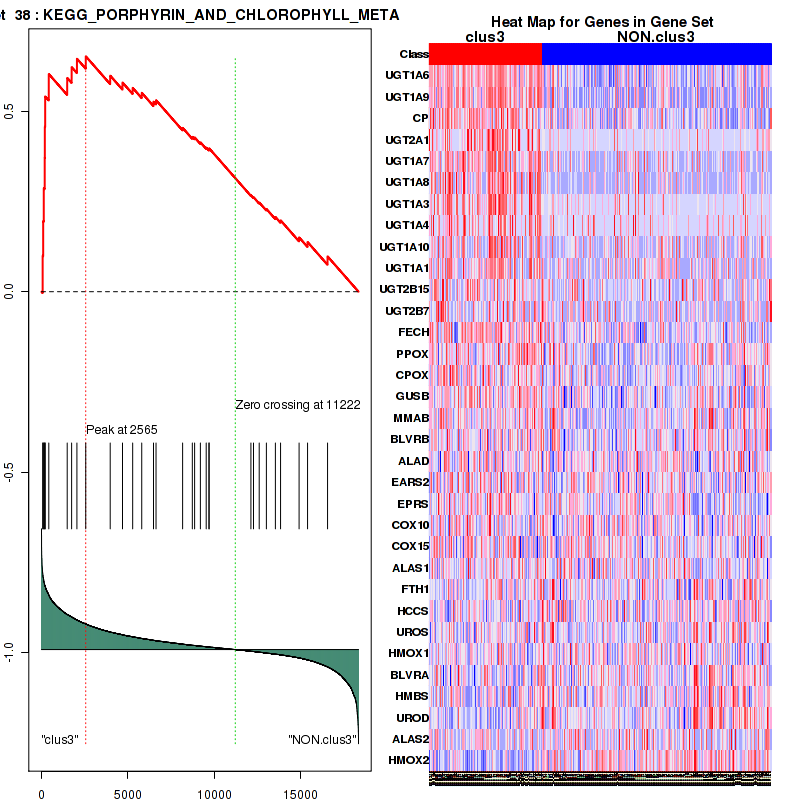
Figure S54. Get High-res Image For the top 5 core enriched genes in the pathway: KEGG PORPHYRIN AND CHLOROPHYLL METABOLISM, this volcano plot shows how much they are up/down-regulated and significant. The significance was calculated by empirical bayesian fit
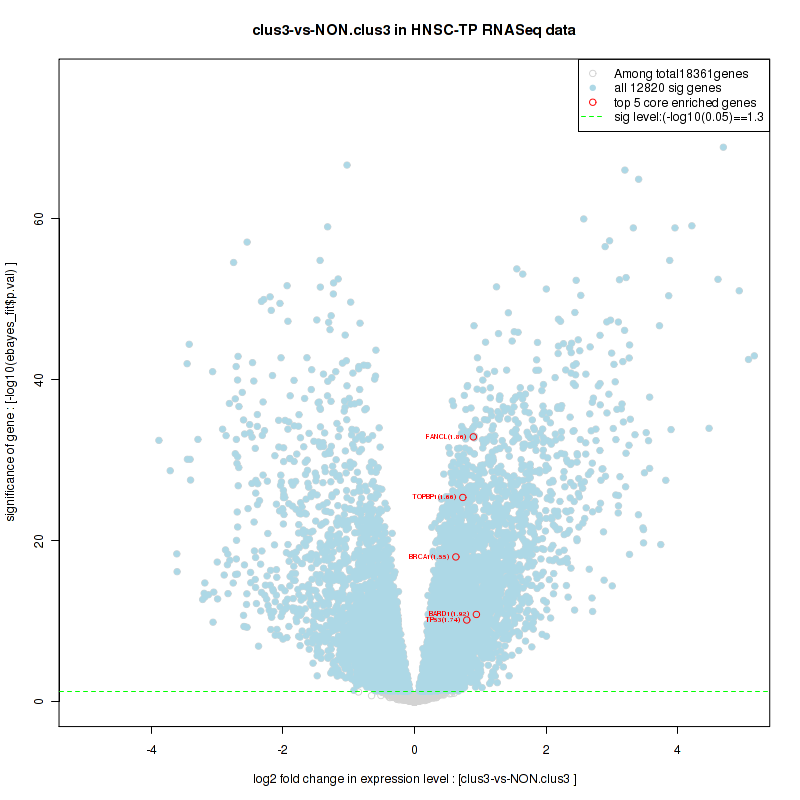
Table S28. Get Full Table This table shows a Running Enrichment Score (RES) of each gene in this pathway, that is, the enrichment score at this point in the ranked list of genes. All genes are ranked by Signal-to-Noise (S2N), a measure of similarity as default and are used to obtain ES matrix of all genes. In this way, GSEA tool uses expression pattern of not only overlapped genes but also not-overlapped genes to produce ES matrix.
| Rank | GENE | SYMBOL | DESC | LIST.LOC | S2N | RES | CORE_ENRICHMENT |
|---|---|---|---|---|---|---|---|
| 1 | BRIP1 | BRIP1 | BRIP1 | 1564 | 0.3 | -0.03 | YES |
| 2 | SSPO | SSPO | SSPO | 1703 | 0.28 | 0.016 | YES |
| 3 | FANCL | FANCL | FANCL | 1776 | 0.28 | 0.064 | YES |
| 4 | BRCA2 | BRCA2 | BRCA2 | 2196 | 0.24 | 0.086 | YES |
| 5 | FANCB | FANCB | FANCB | 2642 | 0.22 | 0.1 | YES |
| 6 | RFC5 | RFC5 | RFC5 | 2840 | 0.2 | 0.13 | YES |
| 7 | BLM | BLM | BLM | 3170 | 0.19 | 0.15 | YES |
| 8 | RMI1 | RMI1 | RMI1 | 3172 | 0.19 | 0.18 | YES |
| 9 | RFC4 | RFC4 | RFC4 | 3180 | 0.19 | 0.22 | YES |
| 10 | UBE2T | UBE2T | UBE2T | 3223 | 0.18 | 0.25 | YES |
| 11 | APITD1 | APITD1 | APITD1 | 3355 | 0.18 | 0.27 | YES |
| 12 | TOPBP1 | TOPBP1 | TOPBP1 | 3367 | 0.18 | 0.31 | YES |
| 13 | BRCA1 | BRCA1 | BRCA1 | 3423 | 0.17 | 0.34 | YES |
| 14 | FANCD2 | FANCD2 | FANCD2 | 3447 | 0.17 | 0.37 | YES |
| 15 | FANCC | FANCC | FANCC | 3919 | 0.15 | 0.37 | YES |
| 16 | FANCE | FANCE | FANCE | 4636 | 0.13 | 0.36 | YES |
| 17 | C19orf40 | C19orf40 | C19orf40 | 4804 | 0.12 | 0.37 | YES |
| 18 | FANCI | FANCI | FANCI | 4852 | 0.12 | 0.39 | YES |
| 19 | ATR | ATR | ATR | 5216 | 0.11 | 0.39 | YES |
| 20 | RFC3 | RFC3 | RFC3 | 5376 | 0.11 | 0.4 | YES |
| 21 | RAD1 | RAD1 | RAD1 | 5430 | 0.11 | 0.42 | YES |
| 22 | ATM | ATM | ATM | 5434 | 0.11 | 0.44 | YES |
| 23 | USP1 | USP1 | USP1 | 5468 | 0.1 | 0.46 | YES |
| 24 | FANCA | FANCA | FANCA | 5498 | 0.1 | 0.47 | YES |
| 25 | RPA2 | RPA2 | RPA2 | 5579 | 0.1 | 0.49 | YES |
| 26 | WDR48 | WDR48 | WDR48 | 5735 | 0.097 | 0.5 | YES |
| 27 | FANCM | FANCM | FANCM | 6001 | 0.091 | 0.5 | YES |
| 28 | RFC2 | RFC2 | RFC2 | 6047 | 0.09 | 0.52 | YES |
| 29 | FANCG | FANCG | FANCG | 6422 | 0.081 | 0.51 | YES |
| 30 | RPA1 | RPA1 | RPA1 | 6501 | 0.08 | 0.52 | YES |
| 31 | HES1 | HES1 | HES1 | 6565 | 0.078 | 0.53 | YES |
| 32 | MRE11A | MRE11A | MRE11A | 6621 | 0.076 | 0.54 | YES |
| 33 | PALB2 | PALB2 | PALB2 | 7082 | 0.067 | 0.53 | NO |
| 34 | TOP3A | TOP3A | TOP3A | 7323 | 0.063 | 0.53 | NO |
| 35 | XRCC3 | XRCC3 | XRCC3 | 7375 | 0.062 | 0.54 | NO |
| 36 | H2AFX | H2AFX | H2AFX | 7660 | 0.057 | 0.53 | NO |
| 37 | RAD17 | RAD17 | RAD17 | 8155 | 0.047 | 0.52 | NO |
| 38 | CHEK1 | CHEK1 | CHEK1 | 8301 | 0.044 | 0.52 | NO |
| 39 | FBXW11 | FBXW11 | FBXW11 | 8758 | 0.037 | 0.5 | NO |
| 40 | RAD9A | RAD9A | RAD9A | 9395 | 0.027 | 0.47 | NO |
| 41 | NBN | NBN | NBN | 10272 | 0.014 | 0.42 | NO |
| 42 | ATRIP | ATRIP | ATRIP | 11768 | -0.0081 | 0.34 | NO |
| 43 | C17orf70 | C17orf70 | C17orf70 | 11992 | -0.012 | 0.33 | NO |
| 44 | RAD50 | RAD50 | RAD50 | 12384 | -0.018 | 0.32 | NO |
| 45 | FANCF | FANCF | FANCF | 12669 | -0.023 | 0.3 | NO |
| 46 | HUS1 | HUS1 | HUS1 | 13548 | -0.039 | 0.26 | NO |
Figure S55. Get High-res Image This plot shows mRNAseq_cNMF expression data heatmap (on the left) a RunningEnrichmentScore(RES) plot (on the top right) and a Signal2Noise(S2N) plot (on the bottom right) of genes in the pathway: KEGG METABOLISM OF XENOBIOTICS BY CYTOCHROME P450.
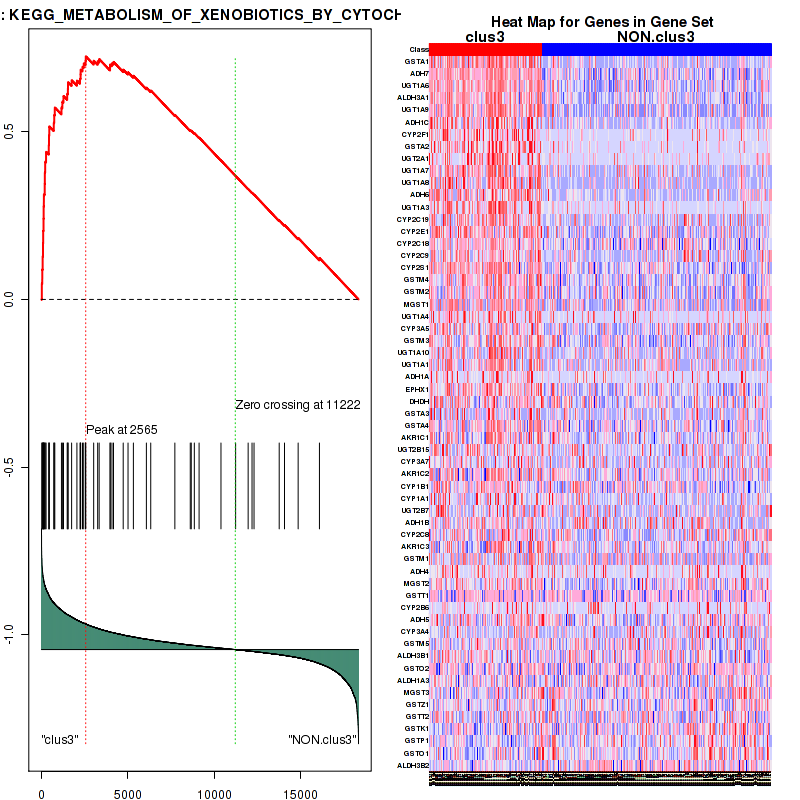
Figure S56. Get High-res Image For the top 5 core enriched genes in the pathway: KEGG METABOLISM OF XENOBIOTICS BY CYTOCHROME P450, this volcano plot shows how much they are up/down-regulated and significant. The significance was calculated by empirical bayesian fit

Table S29. Get Full Table This table shows a Running Enrichment Score (RES) of each gene in this pathway, that is, the enrichment score at this point in the ranked list of genes. All genes are ranked by Signal-to-Noise (S2N), a measure of similarity as default and are used to obtain ES matrix of all genes. In this way, GSEA tool uses expression pattern of not only overlapped genes but also not-overlapped genes to produce ES matrix.
| Rank | GENE | SYMBOL | DESC | LIST.LOC | S2N | RES | CORE_ENRICHMENT |
|---|---|---|---|---|---|---|---|
| 1 | ACSM3 | ACSM3 | ACSM3 | 365 | 0.49 | 0.11 | YES |
| 2 | ALDH5A1 | ALDH5A1 | ALDH5A1 | 392 | 0.48 | 0.24 | YES |
| 3 | ABAT | ABAT | ABAT | 1840 | 0.27 | 0.24 | YES |
| 4 | ACSM1 | ACSM1 | ACSM1 | 2306 | 0.24 | 0.28 | YES |
| 5 | GAD1 | GAD1 | GAD1 | 2661 | 0.21 | 0.32 | YES |
| 6 | HMGCS2 | HMGCS2 | HMGCS2 | 3111 | 0.19 | 0.35 | YES |
| 7 | ACAT2 | ACAT2 | ACAT2 | 3184 | 0.19 | 0.4 | YES |
| 8 | L2HGDH | L2HGDH | L2HGDH | 3965 | 0.15 | 0.39 | YES |
| 9 | ALDH3A2 | ALDH3A2 | ALDH3A2 | 4030 | 0.15 | 0.43 | YES |
| 10 | HADH | HADH | HADH | 4662 | 0.13 | 0.43 | YES |
| 11 | ACADS | ACADS | ACADS | 4682 | 0.13 | 0.47 | YES |
| 12 | EHHADH | EHHADH | EHHADH | 4811 | 0.12 | 0.49 | YES |
| 13 | BDH1 | BDH1 | BDH1 | 5107 | 0.12 | 0.51 | YES |
| 14 | BDH2 | BDH2 | BDH2 | 5429 | 0.11 | 0.52 | YES |
| 15 | ALDH9A1 | ALDH9A1 | ALDH9A1 | 7270 | 0.064 | 0.44 | NO |
| 16 | OXCT1 | OXCT1 | OXCT1 | 7508 | 0.059 | 0.44 | NO |
| 17 | PDHA1 | PDHA1 | PDHA1 | 8323 | 0.044 | 0.41 | NO |
| 18 | ALDH2 | ALDH2 | ALDH2 | 8544 | 0.04 | 0.41 | NO |
| 19 | ACSM5 | ACSM5 | ACSM5 | 8799 | 0.036 | 0.4 | NO |
| 20 | HMGCS1 | HMGCS1 | HMGCS1 | 9258 | 0.029 | 0.39 | NO |
| 21 | PDHB | PDHB | PDHB | 9538 | 0.025 | 0.38 | NO |
| 22 | AACS | AACS | AACS | 9615 | 0.023 | 0.38 | NO |
| 23 | ECHS1 | ECHS1 | ECHS1 | 10840 | 0.0054 | 0.32 | NO |
| 24 | ALDH1B1 | ALDH1B1 | ALDH1B1 | 11270 | -0.00071 | 0.29 | NO |
| 25 | AKR1B10 | AKR1B10 | AKR1B10 | 11899 | -0.01 | 0.26 | NO |
| 26 | OXCT2 | OXCT2 | OXCT2 | 12646 | -0.022 | 0.23 | NO |
| 27 | ACAT1 | ACAT1 | ACAT1 | 12925 | -0.028 | 0.22 | NO |
| 28 | HADHA | HADHA | HADHA | 13253 | -0.034 | 0.21 | NO |
| 29 | HMGCL | HMGCL | HMGCL | 13417 | -0.036 | 0.21 | NO |
| 30 | ALDH7A1 | ALDH7A1 | ALDH7A1 | 17268 | -0.21 | 0.06 | NO |
Figure S57. Get High-res Image This plot shows mRNAseq_cNMF expression data heatmap (on the left) a RunningEnrichmentScore(RES) plot (on the top right) and a Signal2Noise(S2N) plot (on the bottom right) of genes in the pathway: KEGG DRUG METABOLISM CYTOCHROME P450.
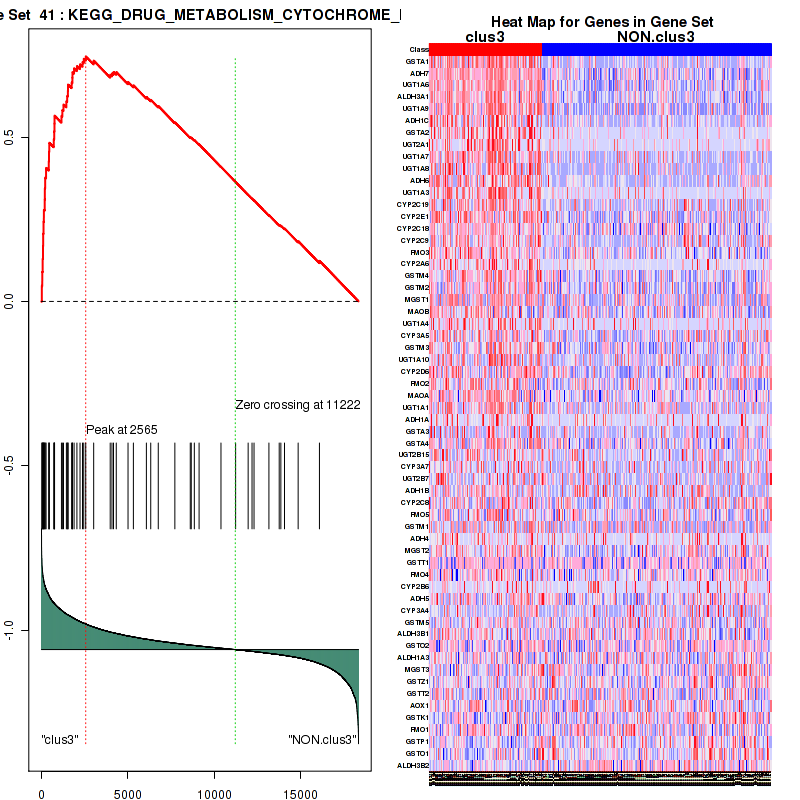
Figure S58. Get High-res Image For the top 5 core enriched genes in the pathway: KEGG DRUG METABOLISM CYTOCHROME P450, this volcano plot shows how much they are up/down-regulated and significant. The significance was calculated by empirical bayesian fit

Table S30. Get Full Table This table shows a Running Enrichment Score (RES) of each gene in this pathway, that is, the enrichment score at this point in the ranked list of genes. All genes are ranked by Signal-to-Noise (S2N), a measure of similarity as default and are used to obtain ES matrix of all genes. In this way, GSEA tool uses expression pattern of not only overlapped genes but also not-overlapped genes to produce ES matrix.
| Rank | GENE | SYMBOL | DESC | LIST.LOC | S2N | RES | CORE_ENRICHMENT |
|---|---|---|---|---|---|---|---|
| 1 | NUP210 | NUP210 | NUP210 | 594 | 0.42 | 0.16 | YES |
| 2 | SLC25A4 | SLC25A4 | SLC25A4 | 2649 | 0.22 | 0.14 | YES |
| 3 | PSIP1 | PSIP1 | PSIP1 | 2722 | 0.21 | 0.24 | YES |
| 4 | SEH1L | SEH1L | SEH1L | 6320 | 0.084 | 0.078 | YES |
| 5 | NUP43 | NUP43 | NUP43 | 6398 | 0.082 | 0.11 | YES |
| 6 | NUP35 | NUP35 | NUP35 | 6489 | 0.08 | 0.14 | YES |
| 7 | TPR | TPR | TPR | 6563 | 0.078 | 0.17 | YES |
| 8 | NUP205 | NUP205 | NUP205 | 6603 | 0.077 | 0.21 | YES |
| 9 | NUP155 | NUP155 | NUP155 | 6823 | 0.072 | 0.23 | YES |
| 10 | NUP153 | NUP153 | NUP153 | 7188 | 0.066 | 0.24 | YES |
| 11 | POM121 | POM121 | POM121 | 7369 | 0.062 | 0.26 | YES |
| 12 | HMGA1 | HMGA1 | HMGA1 | 7478 | 0.06 | 0.28 | YES |
| 13 | NUP107 | NUP107 | NUP107 | 7781 | 0.054 | 0.28 | YES |
| 14 | NUP62 | NUP62 | NUP62 | 7895 | 0.052 | 0.3 | YES |
| 15 | NUP133 | NUP133 | NUP133 | 7911 | 0.052 | 0.32 | YES |
| 16 | NUP88 | NUP88 | NUP88 | 7922 | 0.052 | 0.35 | YES |
| 17 | NUPL2 | NUPL2 | NUPL2 | 7936 | 0.051 | 0.37 | YES |
| 18 | NUP50 | NUP50 | NUP50 | 8113 | 0.048 | 0.38 | YES |
| 19 | NUP188 | NUP188 | NUP188 | 8244 | 0.045 | 0.4 | YES |
| 20 | NUP214 | NUP214 | NUP214 | 8531 | 0.04 | 0.4 | YES |
| 21 | SLC25A6 | SLC25A6 | SLC25A6 | 8679 | 0.038 | 0.41 | YES |
| 22 | AAAS | AAAS | AAAS | 8739 | 0.037 | 0.42 | YES |
| 23 | KPNA1 | KPNA1 | KPNA1 | 8817 | 0.036 | 0.43 | YES |
| 24 | NUP54 | NUP54 | NUP54 | 8875 | 0.035 | 0.45 | YES |
| 25 | NUP85 | NUP85 | NUP85 | 9346 | 0.028 | 0.43 | NO |
| 26 | RANBP2 | RANBP2 | RANBP2 | 9573 | 0.024 | 0.43 | NO |
| 27 | SLC25A5 | SLC25A5 | SLC25A5 | 9753 | 0.021 | 0.43 | NO |
| 28 | RAE1 | RAE1 | RAE1 | 9858 | 0.02 | 0.44 | NO |
| 29 | NUPL1 | NUPL1 | NUPL1 | 10869 | 0.005 | 0.38 | NO |
| 30 | NUP37 | NUP37 | NUP37 | 11862 | -0.0096 | 0.33 | NO |
| 31 | NUP93 | NUP93 | NUP93 | 11891 | -0.01 | 0.34 | NO |
| 32 | BANF1 | BANF1 | BANF1 | 13501 | -0.038 | 0.26 | NO |
Figure S59. Get High-res Image This plot shows mRNAseq_cNMF expression data heatmap (on the left) a RunningEnrichmentScore(RES) plot (on the top right) and a Signal2Noise(S2N) plot (on the bottom right) of genes in the pathway: PID FANCONI PATHWAY.
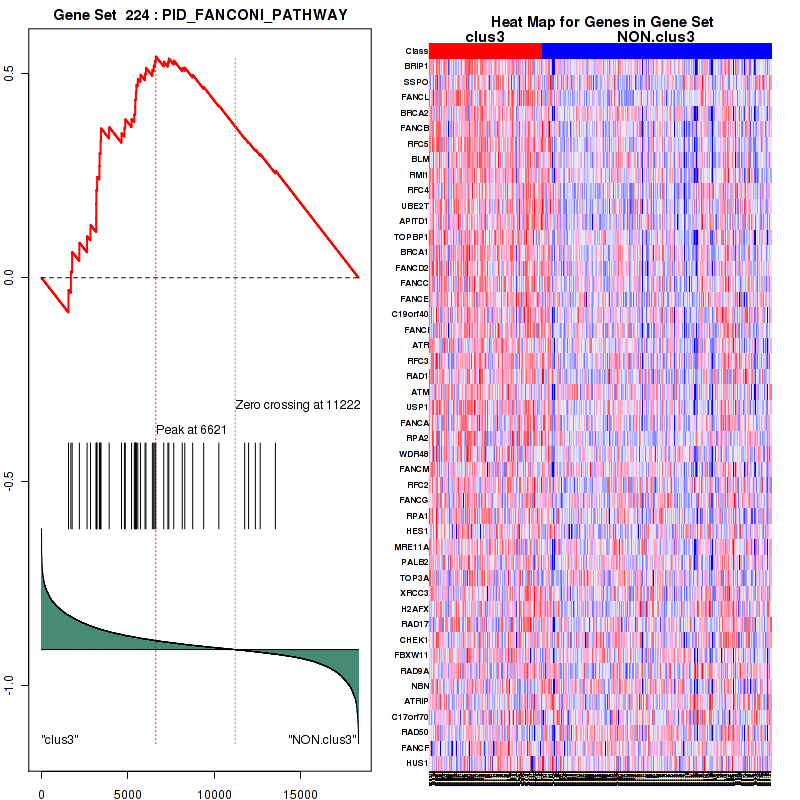
Figure S60. Get High-res Image For the top 5 core enriched genes in the pathway: PID FANCONI PATHWAY, this volcano plot shows how much they are up/down-regulated and significant. The significance was calculated by empirical bayesian fit
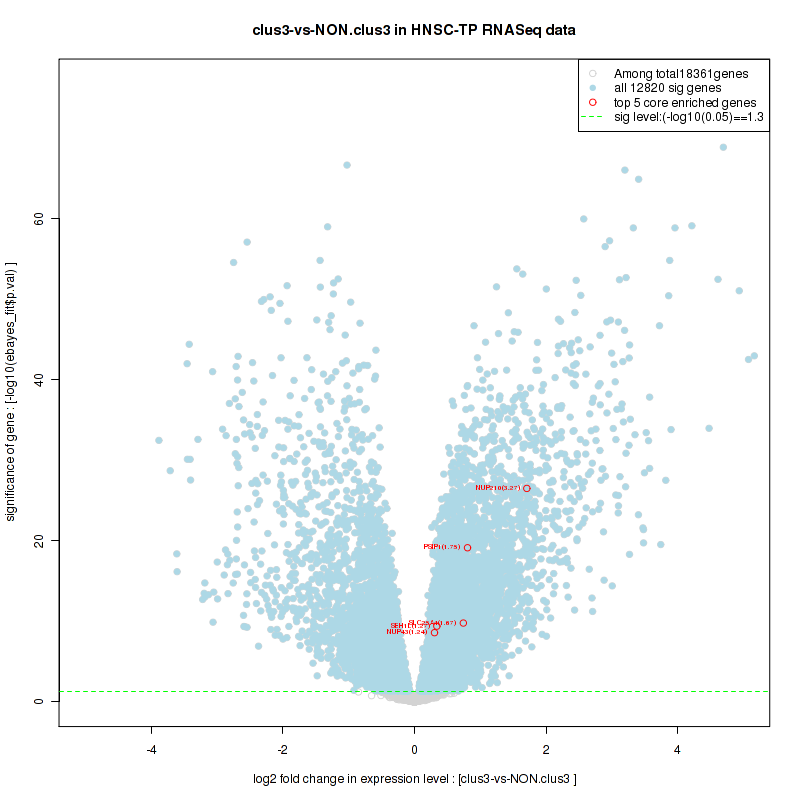
For the top enriched genes, if you want to check whether they are
-
up-regulated, please check the list of up-regulated genes
-
down-regulated, please check the list of down-regulated genes
For the top enriched genes, if you want to check whether they are
-
highly expressed genes, please check the list of high (top 30%) expressed genes
-
low expressed genes, please check the list of low (bottom 30%) expressed genes
An expression pattern of top(30%)/middle(30%)/low(30%) in this subtype against other subtypes is available in a heatmap
For the top enriched genes, if you want to check whether they are
-
significantly differently expressed genes by eBayes lm fit, please check the list of significant genes
Table 6. Get Full Table This table shows top 10 pathways which are significantly enriched in cluster clus4. It displays only significant gene sets satisfying nom.p.val.threshold (-1), fwer.p.val.threshold (-1) , fdr.q.val.threshold (0.25) and the default table is sorted by Normalized Enrichment Score (NES). Further details on NES statistics, please visit The Broad GSEA website.
| GeneSet(GS) | Size(#genes) | genes.ES.table | ES | NES | NOM.p.val | FDR.q.val | FWER.p.val | Tag.. | Gene.. | Signal | FDR..median. | glob.p.val |
|---|---|---|---|---|---|---|---|---|---|---|---|---|
| KEGG GLYCOLYSIS GLUCONEOGENESIS | 58 | genes.ES.table | 0.47 | 1.5 | 0.053 | 0.12 | 0.98 | 0.22 | 0.17 | 0.19 | 0.077 | 0 |
| KEGG PURINE METABOLISM | 154 | genes.ES.table | 0.43 | 1.7 | 0.002 | 0.067 | 0.84 | 0.16 | 0.13 | 0.14 | 0.027 | 0.001 |
| KEGG ARGININE AND PROLINE METABOLISM | 52 | genes.ES.table | 0.48 | 1.6 | 0.0042 | 0.086 | 0.93 | 0.14 | 0.11 | 0.12 | 0.042 | 0 |
| KEGG TYROSINE METABOLISM | 41 | genes.ES.table | 0.47 | 1.3 | 0.18 | 0.25 | 1 | 0.27 | 0.17 | 0.22 | 0.21 | 0 |
| KEGG GLYCEROLIPID METABOLISM | 43 | genes.ES.table | 0.41 | 1.4 | 0.071 | 0.18 | 1 | 0.3 | 0.22 | 0.24 | 0.14 | 0 |
| KEGG INOSITOL PHOSPHATE METABOLISM | 54 | genes.ES.table | 0.36 | 1.3 | 0.11 | 0.21 | 1 | 0.43 | 0.32 | 0.29 | 0.17 | 0 |
| KEGG GLYCEROPHOSPHOLIPID METABOLISM | 73 | genes.ES.table | 0.49 | 1.8 | 0.0021 | 0.043 | 0.52 | 0.22 | 0.19 | 0.18 | 0.011 | 0.001 |
| KEGG ETHER LIPID METABOLISM | 29 | genes.ES.table | 0.46 | 1.3 | 0.12 | 0.22 | 1 | 0.34 | 0.21 | 0.27 | 0.18 | 0 |
| KEGG ABC TRANSPORTERS | 43 | genes.ES.table | 0.48 | 1.3 | 0.13 | 0.24 | 1 | 0.23 | 0.14 | 0.2 | 0.2 | 0 |
| KEGG RNA DEGRADATION | 57 | genes.ES.table | 0.31 | 1.4 | 0.16 | 0.18 | 1 | 0.018 | 0.0059 | 0.018 | 0.14 | 0 |
Table S31. Get Full Table This table shows a Running Enrichment Score (RES) of each gene in this pathway, that is, the enrichment score at this point in the ranked list of genes. All genes are ranked by Signal-to-Noise (S2N), a measure of similarity as default and are used to obtain ES matrix of all genes. In this way, GSEA tool uses expression pattern of not only overlapped genes but also not-overlapped genes to produce ES matrix.
| Rank | GENE | SYMBOL | DESC | LIST.LOC | S2N | RES | CORE_ENRICHMENT |
|---|---|---|---|---|---|---|---|
| 1 | ASB5 | ASB5 | ASB5 | 21 | 1.5 | 0.1 | YES |
| 2 | TRIM63 | TRIM63 | TRIM63 | 59 | 1.3 | 0.2 | YES |
| 3 | ASB15 | ASB15 | ASB15 | 122 | 1.1 | 0.27 | YES |
| 4 | ASB11 | ASB11 | ASB11 | 176 | 0.85 | 0.33 | YES |
| 5 | ASB12 | ASB12 | ASB12 | 234 | 0.7 | 0.38 | YES |
| 6 | ZBTB16 | ZBTB16 | ZBTB16 | 251 | 0.66 | 0.42 | YES |
| 7 | ASB16 | ASB16 | ASB16 | 310 | 0.58 | 0.46 | YES |
| 8 | PARK2 | PARK2 | PARK2 | 404 | 0.5 | 0.49 | YES |
| 9 | ASB4 | ASB4 | ASB4 | 519 | 0.43 | 0.51 | YES |
| 10 | SPSB4 | SPSB4 | SPSB4 | 1226 | 0.28 | 0.5 | NO |
| 11 | ASB2 | ASB2 | ASB2 | 1719 | 0.22 | 0.48 | NO |
| 12 | DET1 | DET1 | DET1 | 2530 | 0.16 | 0.45 | NO |
| 13 | NEDD4 | NEDD4 | NEDD4 | 2806 | 0.14 | 0.45 | NO |
| 14 | TRIM9 | TRIM9 | TRIM9 | 3210 | 0.12 | 0.43 | NO |
| 15 | CBLB | CBLB | CBLB | 3477 | 0.11 | 0.43 | NO |
| 16 | UBE2D4 | UBE2D4 | UBE2D4 | 3536 | 0.11 | 0.43 | NO |
| 17 | LNPEP | LNPEP | LNPEP | 3864 | 0.096 | 0.42 | NO |
| 18 | FBXO2 | FBXO2 | FBXO2 | 3952 | 0.092 | 0.42 | NO |
| 19 | SPSB1 | SPSB1 | SPSB1 | 4040 | 0.089 | 0.42 | NO |
| 20 | TRIM21 | TRIM21 | TRIM21 | 4161 | 0.084 | 0.42 | NO |
| 21 | ASB8 | ASB8 | ASB8 | 4174 | 0.084 | 0.43 | NO |
| 22 | UBR1 | UBR1 | UBR1 | 4378 | 0.077 | 0.42 | NO |
| 23 | UBR2 | UBR2 | UBR2 | 4468 | 0.074 | 0.42 | NO |
| 24 | TRIM32 | TRIM32 | TRIM32 | 4600 | 0.07 | 0.42 | NO |
| 25 | TRIM36 | TRIM36 | TRIM36 | 4781 | 0.066 | 0.42 | NO |
| 26 | PSMB9 | PSMB9 | PSMB9 | 4886 | 0.062 | 0.41 | NO |
| 27 | UBE2L6 | UBE2L6 | UBE2L6 | 4968 | 0.06 | 0.41 | NO |
| 28 | ASB1 | ASB1 | ASB1 | 5045 | 0.058 | 0.41 | NO |
| 29 | PJA2 | PJA2 | PJA2 | 5182 | 0.055 | 0.41 | NO |
| 30 | DZIP3 | DZIP3 | DZIP3 | 5263 | 0.053 | 0.41 | NO |
| 31 | FBXO17 | FBXO17 | FBXO17 | 5319 | 0.052 | 0.41 | NO |
| 32 | UBA7 | UBA7 | UBA7 | 5407 | 0.049 | 0.41 | NO |
| 33 | DTX3L | DTX3L | DTX3L | 5409 | 0.049 | 0.41 | NO |
| 34 | SMURF2 | SMURF2 | SMURF2 | 5504 | 0.047 | 0.41 | NO |
| 35 | UBE2D1 | UBE2D1 | UBE2D1 | 5581 | 0.045 | 0.41 | NO |
| 36 | RNF123 | RNF123 | RNF123 | 5643 | 0.044 | 0.41 | NO |
| 37 | UBE2H | UBE2H | UBE2H | 5675 | 0.043 | 0.41 | NO |
| 38 | WWP1 | WWP1 | WWP1 | 5759 | 0.042 | 0.41 | NO |
| 39 | HECTD3 | HECTD3 | HECTD3 | 5792 | 0.041 | 0.41 | NO |
| 40 | UBE2Q2 | UBE2Q2 | UBE2Q2 | 5794 | 0.041 | 0.41 | NO |
| 41 | CUL5 | CUL5 | CUL5 | 5873 | 0.04 | 0.41 | NO |
| 42 | SOCS3 | SOCS3 | SOCS3 | 6036 | 0.037 | 0.41 | NO |
| 43 | TRIP12 | TRIP12 | TRIP12 | 6053 | 0.037 | 0.41 | NO |
| 44 | TPP2 | TPP2 | TPP2 | 6186 | 0.035 | 0.4 | NO |
| 45 | CDC27 | CDC27 | CDC27 | 6246 | 0.034 | 0.4 | NO |
| 46 | PSMB10 | PSMB10 | PSMB10 | 6253 | 0.034 | 0.4 | NO |
| 47 | SMURF1 | SMURF1 | SMURF1 | 6418 | 0.031 | 0.4 | NO |
| 48 | KLHL20 | KLHL20 | KLHL20 | 6457 | 0.031 | 0.4 | NO |
| 49 | HERC2 | HERC2 | HERC2 | 6501 | 0.03 | 0.4 | NO |
| 50 | FBXW7 | FBXW7 | FBXW7 | 6645 | 0.028 | 0.39 | NO |
| 51 | UBOX5 | UBOX5 | UBOX5 | 6686 | 0.027 | 0.39 | NO |
| 52 | CUL7 | CUL7 | CUL7 | 6693 | 0.027 | 0.39 | NO |
| 53 | UBE4A | UBE4A | UBE4A | 6830 | 0.025 | 0.39 | NO |
| 54 | UBE2R2 | UBE2R2 | UBE2R2 | 6840 | 0.025 | 0.39 | NO |
| 55 | PSMD1 | PSMD1 | PSMD1 | 6850 | 0.025 | 0.39 | NO |
| 56 | UBE3B | UBE3B | UBE3B | 6890 | 0.024 | 0.39 | NO |
| 57 | ASB13 | ASB13 | ASB13 | 6891 | 0.024 | 0.39 | NO |
| 58 | UBR4 | UBR4 | UBR4 | 6930 | 0.024 | 0.39 | NO |
| 59 | PSMB8 | PSMB8 | PSMB8 | 6938 | 0.024 | 0.39 | NO |
| 60 | UBE3C | UBE3C | UBE3C | 7117 | 0.021 | 0.38 | NO |
| 61 | FBXO3 | FBXO3 | FBXO3 | 7147 | 0.021 | 0.38 | NO |
| 62 | FBXW8 | FBXW8 | FBXW8 | 7182 | 0.02 | 0.38 | NO |
| 63 | PSMF1 | PSMF1 | PSMF1 | 7186 | 0.02 | 0.38 | NO |
| 64 | RNF41 | RNF41 | RNF41 | 7291 | 0.019 | 0.38 | NO |
| 65 | UBE2W | UBE2W | UBE2W | 7303 | 0.019 | 0.38 | NO |
| 66 | LRSAM1 | LRSAM1 | LRSAM1 | 7336 | 0.018 | 0.38 | NO |
| 67 | PSMD5 | PSMD5 | PSMD5 | 7513 | 0.016 | 0.37 | NO |
| 68 | RBCK1 | RBCK1 | RBCK1 | 7547 | 0.016 | 0.37 | NO |
| 69 | RNF4 | RNF4 | RNF4 | 7561 | 0.016 | 0.37 | NO |
| 70 | ASB7 | ASB7 | ASB7 | 7595 | 0.016 | 0.37 | NO |
| 71 | FBXO27 | FBXO27 | FBXO27 | 7601 | 0.016 | 0.37 | NO |
| 72 | RNF34 | RNF34 | RNF34 | 7668 | 0.015 | 0.37 | NO |
| 73 | HUWE1 | HUWE1 | HUWE1 | 7692 | 0.014 | 0.37 | NO |
| 74 | PJA1 | PJA1 | PJA1 | 7697 | 0.014 | 0.37 | NO |
| 75 | RNF6 | RNF6 | RNF6 | 7770 | 0.013 | 0.37 | NO |
| 76 | UBE2F | UBE2F | UBE2F | 7847 | 0.012 | 0.36 | NO |
| 77 | PSMD2 | PSMD2 | PSMD2 | 7872 | 0.012 | 0.36 | NO |
| 78 | BTRC | BTRC | BTRC | 7934 | 0.011 | 0.36 | NO |
| 79 | UBE2G1 | UBE2G1 | UBE2G1 | 7950 | 0.011 | 0.36 | NO |
| 80 | KLHL9 | KLHL9 | KLHL9 | 8056 | 0.01 | 0.36 | NO |
| 81 | PSME2 | PSME2 | PSME2 | 8059 | 0.0099 | 0.36 | NO |
| 82 | PSME1 | PSME1 | PSME1 | 8360 | 0.0065 | 0.34 | NO |
| 83 | FBXO6 | FBXO6 | FBXO6 | 8415 | 0.0059 | 0.34 | NO |
| 84 | PSMC2 | PSMC2 | PSMC2 | 8478 | 0.0052 | 0.33 | NO |
| 85 | RNF25 | RNF25 | RNF25 | 8492 | 0.0051 | 0.33 | NO |
| 86 | TMEM189-UBE2V1 | TMEM189-UBE2V1 | TMEM189-UBE2V1 | 8499 | 0.005 | 0.33 | NO |
| 87 | PSMD7 | PSMD7 | PSMD7 | 8578 | 0.0042 | 0.33 | NO |
| 88 | KLHL13 | KLHL13 | KLHL13 | 8618 | 0.0039 | 0.33 | NO |
| 89 | UBE2Z | UBE2Z | UBE2Z | 8623 | 0.0038 | 0.33 | NO |
| 90 | RNF144B | RNF144B | RNF144B | 8627 | 0.0038 | 0.33 | NO |
| 91 | UBE2J1 | UBE2J1 | UBE2J1 | 8681 | 0.0033 | 0.32 | NO |
| 92 | RCHY1 | RCHY1 | RCHY1 | 8854 | 0.0016 | 0.32 | NO |
| 93 | TRIM37 | TRIM37 | TRIM37 | 8896 | 0.0011 | 0.31 | NO |
| 94 | UBE3A | UBE3A | UBE3A | 9096 | -0.00097 | 0.3 | NO |
| 95 | ARIH2 | ARIH2 | ARIH2 | 9141 | -0.0014 | 0.3 | NO |
| 96 | PSMD13 | PSMD13 | PSMD13 | 9144 | -0.0014 | 0.3 | NO |
| 97 | PSMD11 | PSMD11 | PSMD11 | 9178 | -0.0017 | 0.3 | NO |
| 98 | UBE2L3 | UBE2L3 | UBE2L3 | 9189 | -0.0018 | 0.3 | NO |
| 99 | PSMA7 | PSMA7 | PSMA7 | 9213 | -0.0021 | 0.3 | NO |
| 100 | CUL2 | CUL2 | CUL2 | 9224 | -0.0022 | 0.3 | NO |
| 101 | ATG7 | ATG7 | ATG7 | 9239 | -0.0023 | 0.3 | NO |
| 102 | CUL3 | CUL3 | CUL3 | 9265 | -0.0025 | 0.3 | NO |
| 103 | CUL1 | CUL1 | CUL1 | 9266 | -0.0025 | 0.3 | NO |
| 104 | MKRN1 | MKRN1 | MKRN1 | 9314 | -0.003 | 0.29 | NO |
| 105 | PSME4 | PSME4 | PSME4 | 9336 | -0.0032 | 0.29 | NO |
| 106 | VPRBP | VPRBP | VPRBP | 9381 | -0.0036 | 0.29 | NO |
| 107 | PSMB5 | PSMB5 | PSMB5 | 9384 | -0.0036 | 0.29 | NO |
| 108 | UBE2A | UBE2A | UBE2A | 9401 | -0.0038 | 0.29 | NO |
| 109 | FBXW11 | FBXW11 | FBXW11 | 9406 | -0.0038 | 0.29 | NO |
| 110 | PSMC3 | PSMC3 | PSMC3 | 9536 | -0.0051 | 0.28 | NO |
| 111 | LRRC41 | LRRC41 | LRRC41 | 9591 | -0.0057 | 0.28 | NO |
| 112 | ANAPC1 | ANAPC1 | ANAPC1 | 9661 | -0.0064 | 0.28 | NO |
| 113 | SPSB2 | SPSB2 | SPSB2 | 9668 | -0.0064 | 0.28 | NO |
| 114 | CDC16 | CDC16 | CDC16 | 9691 | -0.0066 | 0.28 | NO |
| 115 | ANAPC5 | ANAPC5 | ANAPC5 | 9733 | -0.0071 | 0.27 | NO |
| 116 | PSMB2 | PSMB2 | PSMB2 | 9779 | -0.0075 | 0.27 | NO |
| 117 | UBE2G2 | UBE2G2 | UBE2G2 | 9814 | -0.0078 | 0.27 | NO |
| 118 | RNF220 | RNF220 | RNF220 | 9920 | -0.0088 | 0.27 | NO |
| 119 | PSMC6 | PSMC6 | PSMC6 | 9972 | -0.0092 | 0.26 | NO |
| 120 | UBE2D3 | UBE2D3 | UBE2D3 | 9986 | -0.0094 | 0.26 | NO |
| 121 | PSMA8 | PSMA8 | PSMA8 | 9989 | -0.0094 | 0.26 | NO |
| 122 | UBE2K | UBE2K | UBE2K | 10005 | -0.0096 | 0.26 | NO |
| 123 | UBE2B | UBE2B | UBE2B | 10016 | -0.0097 | 0.26 | NO |
| 124 | PSMA1 | PSMA1 | PSMA1 | 10180 | -0.011 | 0.26 | NO |
| 125 | PSMB6 | PSMB6 | PSMB6 | 10261 | -0.012 | 0.25 | NO |
| 126 | UBA1 | UBA1 | UBA1 | 10312 | -0.012 | 0.25 | NO |
| 127 | PSMC1 | PSMC1 | PSMC1 | 10585 | -0.015 | 0.24 | NO |
| 128 | PSMC5 | PSMC5 | PSMC5 | 10654 | -0.016 | 0.23 | NO |
| 129 | PSMD12 | PSMD12 | PSMD12 | 10658 | -0.016 | 0.24 | NO |
| 130 | PSMA5 | PSMA5 | PSMA5 | 10753 | -0.017 | 0.23 | NO |
| 131 | UBE2O | UBE2O | UBE2O | 10774 | -0.017 | 0.23 | NO |
| 132 | SKP1 | SKP1 | SKP1 | 10800 | -0.017 | 0.23 | NO |
| 133 | PSMD8 | PSMD8 | PSMD8 | 10808 | -0.017 | 0.23 | NO |
| 134 | PSMD9 | PSMD9 | PSMD9 | 10879 | -0.018 | 0.23 | NO |
| 135 | PSMA6 | PSMA6 | PSMA6 | 10928 | -0.018 | 0.23 | NO |
| 136 | PSMC4 | PSMC4 | PSMC4 | 10961 | -0.019 | 0.23 | NO |
| 137 | CDC26 | CDC26 | CDC26 | 11006 | -0.019 | 0.23 | NO |
| 138 | PSMA3 | PSMA3 | PSMA3 | 11012 | -0.019 | 0.23 | NO |
| 139 | PSMD3 | PSMD3 | PSMD3 | 11028 | -0.019 | 0.23 | NO |
| 140 | UBE2V2 | UBE2V2 | UBE2V2 | 11155 | -0.021 | 0.22 | NO |
| 141 | PSMD10 | PSMD10 | PSMD10 | 11158 | -0.021 | 0.22 | NO |
| 142 | UBA3 | UBA3 | UBA3 | 11190 | -0.021 | 0.22 | NO |
| 143 | NPEPPS | NPEPPS | NPEPPS | 11272 | -0.022 | 0.22 | NO |
| 144 | ANAPC13 | ANAPC13 | ANAPC13 | 11277 | -0.022 | 0.22 | NO |
| 145 | UBE2Q1 | UBE2Q1 | UBE2Q1 | 11397 | -0.023 | 0.22 | NO |
| 146 | PSMB1 | PSMB1 | PSMB1 | 11401 | -0.023 | 0.22 | NO |
| 147 | ANAPC2 | ANAPC2 | ANAPC2 | 11422 | -0.023 | 0.22 | NO |
| 148 | CDC23 | CDC23 | CDC23 | 11493 | -0.024 | 0.22 | NO |
| 149 | UBE2E3 | UBE2E3 | UBE2E3 | 11722 | -0.026 | 0.21 | NO |
| 150 | UBE2E2 | UBE2E2 | UBE2E2 | 11825 | -0.027 | 0.2 | NO |
| 151 | PSMD4 | PSMD4 | PSMD4 | 11831 | -0.027 | 0.2 | NO |
| 152 | UBA6 | UBA6 | UBA6 | 11841 | -0.027 | 0.21 | NO |
| 153 | KEAP1 | KEAP1 | KEAP1 | 11842 | -0.027 | 0.21 | NO |
| 154 | STUB1 | STUB1 | STUB1 | 11898 | -0.028 | 0.21 | NO |
| 155 | UBE2D2 | UBE2D2 | UBE2D2 | 11910 | -0.028 | 0.21 | NO |
| 156 | ANAPC4 | ANAPC4 | ANAPC4 | 11932 | -0.028 | 0.21 | NO |
| 157 | CDC34 | CDC34 | CDC34 | 11959 | -0.029 | 0.21 | NO |
| 158 | PSMD14 | PSMD14 | PSMD14 | 11987 | -0.029 | 0.21 | NO |
| 159 | RBX1 | RBX1 | RBX1 | 12031 | -0.029 | 0.21 | NO |
| 160 | PSMD6 | PSMD6 | PSMD6 | 12047 | -0.03 | 0.21 | NO |
| 161 | GAN | GAN | GAN | 12094 | -0.03 | 0.21 | NO |
| 162 | ASB3 | ASB3 | ASB3 | 12097 | -0.03 | 0.21 | NO |
| 163 | TCEB1 | TCEB1 | TCEB1 | 12101 | -0.03 | 0.22 | NO |
| 164 | PSMA2 | PSMA2 | PSMA2 | 12188 | -0.031 | 0.21 | NO |
| 165 | UBE2J2 | UBE2J2 | UBE2J2 | 12217 | -0.031 | 0.21 | NO |
| 166 | ASB6 | ASB6 | ASB6 | 12228 | -0.031 | 0.22 | NO |
| 167 | PSMB7 | PSMB7 | PSMB7 | 12319 | -0.032 | 0.21 | NO |
| 168 | SAE1 | SAE1 | SAE1 | 12340 | -0.032 | 0.21 | NO |
| 169 | SOCS1 | SOCS1 | SOCS1 | 12370 | -0.033 | 0.21 | NO |
| 170 | PSMA4 | PSMA4 | PSMA4 | 12474 | -0.034 | 0.21 | NO |
| 171 | FBXO4 | FBXO4 | FBXO4 | 12498 | -0.034 | 0.21 | NO |
| 172 | UBA2 | UBA2 | UBA2 | 12558 | -0.035 | 0.21 | NO |
| 173 | FBXO44 | FBXO44 | FBXO44 | 12708 | -0.037 | 0.2 | NO |
| 174 | PSMB3 | PSMB3 | PSMB3 | 12830 | -0.038 | 0.2 | NO |
| 175 | ANAPC11 | ANAPC11 | ANAPC11 | 13077 | -0.041 | 0.19 | NO |
| 176 | VHL | VHL | VHL | 13227 | -0.043 | 0.19 | NO |
| 177 | TCEB2 | TCEB2 | TCEB2 | 13240 | -0.043 | 0.19 | NO |
| 178 | UBE2N | UBE2N | UBE2N | 13256 | -0.043 | 0.19 | NO |
| 179 | PSMB4 | PSMB4 | PSMB4 | 13266 | -0.043 | 0.19 | NO |
| 180 | UBA5 | UBA5 | UBA5 | 13362 | -0.044 | 0.19 | NO |
| 181 | UBA52 | UBA52 | UBA52 | 13505 | -0.046 | 0.19 | NO |
| 182 | UBE2E1 | UBE2E1 | UBE2E1 | 13553 | -0.047 | 0.19 | NO |
| 183 | WSB1 | WSB1 | WSB1 | 13865 | -0.051 | 0.17 | NO |
| 184 | ANAPC7 | ANAPC7 | ANAPC7 | 14016 | -0.054 | 0.17 | NO |
| 185 | UBE2M | UBE2M | UBE2M | 14027 | -0.054 | 0.17 | NO |
| 186 | SKP2 | SKP2 | SKP2 | 14074 | -0.054 | 0.17 | NO |
| 187 | RNF182 | RNF182 | RNF182 | 14075 | -0.054 | 0.18 | NO |
| 188 | BLMH | BLMH | BLMH | 14086 | -0.055 | 0.18 | NO |
| 189 | TRIM11 | TRIM11 | TRIM11 | 14578 | -0.063 | 0.16 | NO |
| 190 | ANAPC10 | ANAPC10 | ANAPC10 | 14810 | -0.067 | 0.15 | NO |
| 191 | CDC20 | CDC20 | CDC20 | 14817 | -0.068 | 0.16 | NO |
| 192 | RPS27A | RPS27A | RPS27A | 14964 | -0.07 | 0.15 | NO |
| 193 | UBE2C | UBE2C | UBE2C | 15955 | -0.098 | 0.1 | NO |
| 194 | RNF138 | RNF138 | RNF138 | 16095 | -0.1 | 0.1 | NO |
| 195 | UBE2S | UBE2S | UBE2S | 16635 | -0.12 | 0.084 | NO |
| 196 | ASB9 | ASB9 | ASB9 | 17274 | -0.16 | 0.06 | NO |
Figure S61. Get High-res Image This plot shows mRNAseq_cNMF expression data heatmap (on the left) a RunningEnrichmentScore(RES) plot (on the top right) and a Signal2Noise(S2N) plot (on the bottom right) of genes in the pathway: KEGG GLYCOLYSIS GLUCONEOGENESIS.
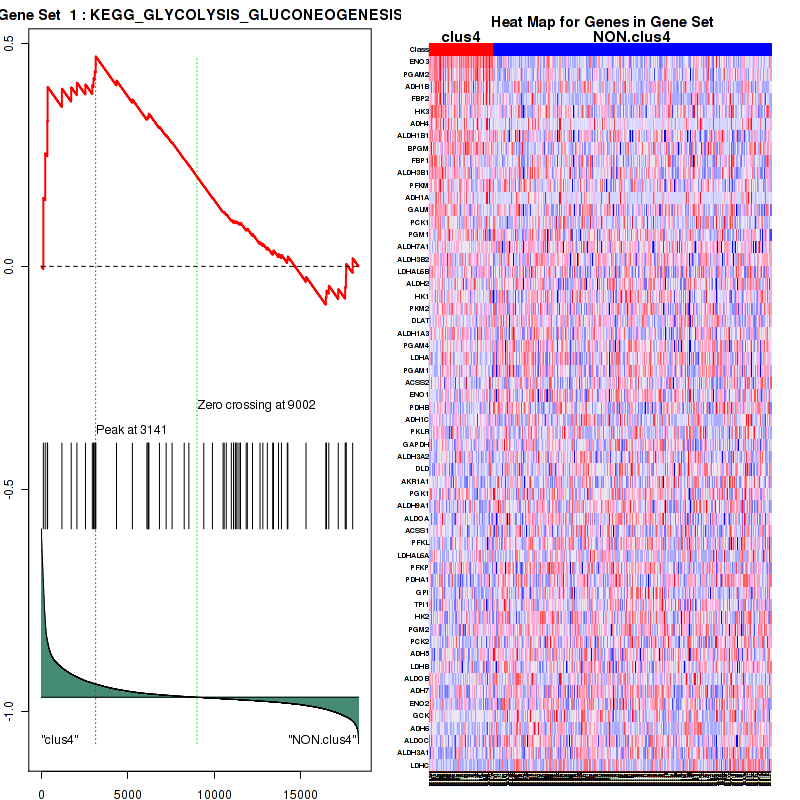
Figure S62. Get High-res Image For the top 5 core enriched genes in the pathway: KEGG GLYCOLYSIS GLUCONEOGENESIS, this volcano plot shows how much they are up/down-regulated and significant. The significance was calculated by empirical bayesian fit

Table S32. Get Full Table This table shows a Running Enrichment Score (RES) of each gene in this pathway, that is, the enrichment score at this point in the ranked list of genes. All genes are ranked by Signal-to-Noise (S2N), a measure of similarity as default and are used to obtain ES matrix of all genes. In this way, GSEA tool uses expression pattern of not only overlapped genes but also not-overlapped genes to produce ES matrix.
| Rank | GENE | SYMBOL | DESC | LIST.LOC | S2N | RES | CORE_ENRICHMENT |
|---|---|---|---|---|---|---|---|
| 1 | PRKAG3 | PRKAG3 | PRKAG3 | 53 | 1.4 | 0.5 | YES |
| 2 | PRKAA2 | PRKAA2 | PRKAA2 | 280 | 0.61 | 0.72 | YES |
| 3 | PRKAB2 | PRKAB2 | PRKAB2 | 2997 | 0.14 | 0.62 | NO |
| 4 | CAB39 | CAB39 | CAB39 | 4958 | 0.06 | 0.53 | NO |
| 5 | MTOR | MTOR | MTOR | 5870 | 0.04 | 0.5 | NO |
| 6 | PPM1A | PPM1A | PPM1A | 6282 | 0.033 | 0.49 | NO |
| 7 | STRADB | STRADB | STRADB | 6593 | 0.029 | 0.48 | NO |
| 8 | PRKAA1 | PRKAA1 | PRKAA1 | 7130 | 0.021 | 0.46 | NO |
| 9 | CAB39L | CAB39L | CAB39L | 7281 | 0.019 | 0.46 | NO |
| 10 | RPTOR | RPTOR | RPTOR | 7448 | 0.017 | 0.46 | NO |
| 11 | EEF2K | EEF2K | EEF2K | 7877 | 0.012 | 0.44 | NO |
| 12 | AKT2 | AKT2 | AKT2 | 7952 | 0.011 | 0.44 | NO |
| 13 | PRKAG1 | PRKAG1 | PRKAG1 | 8584 | 0.0042 | 0.4 | NO |
| 14 | PRKAG2 | PRKAG2 | PRKAG2 | 8622 | 0.0038 | 0.4 | NO |
| 15 | EIF4G1 | EIF4G1 | EIF4G1 | 8637 | 0.0037 | 0.4 | NO |
| 16 | TSC2 | TSC2 | TSC2 | 9158 | -0.0015 | 0.38 | NO |
| 17 | RHEB | RHEB | RHEB | 9538 | -0.0051 | 0.36 | NO |
| 18 | TSC1 | TSC1 | TSC1 | 9555 | -0.0053 | 0.36 | NO |
| 19 | EIF4B | EIF4B | EIF4B | 9894 | -0.0086 | 0.34 | NO |
| 20 | STRADA | STRADA | STRADA | 10568 | -0.015 | 0.31 | NO |
| 21 | STK11 | STK11 | STK11 | 10624 | -0.016 | 0.32 | NO |
| 22 | RPS6KB1 | RPS6KB1 | RPS6KB1 | 10955 | -0.019 | 0.3 | NO |
| 23 | PDE3B | PDE3B | PDE3B | 12049 | -0.03 | 0.26 | NO |
| 24 | PRKAB1 | PRKAB1 | PRKAB1 | 12224 | -0.031 | 0.26 | NO |
| 25 | MLST8 | MLST8 | MLST8 | 12483 | -0.034 | 0.26 | NO |
| 26 | EIF4E | EIF4E | EIF4E | 13167 | -0.042 | 0.24 | NO |
| 27 | RPS6 | RPS6 | RPS6 | 13588 | -0.047 | 0.23 | NO |
| 28 | EIF4EBP1 | EIF4EBP1 | EIF4EBP1 | 15371 | -0.081 | 0.16 | NO |
Figure S63. Get High-res Image This plot shows mRNAseq_cNMF expression data heatmap (on the left) a RunningEnrichmentScore(RES) plot (on the top right) and a Signal2Noise(S2N) plot (on the bottom right) of genes in the pathway: KEGG PURINE METABOLISM.
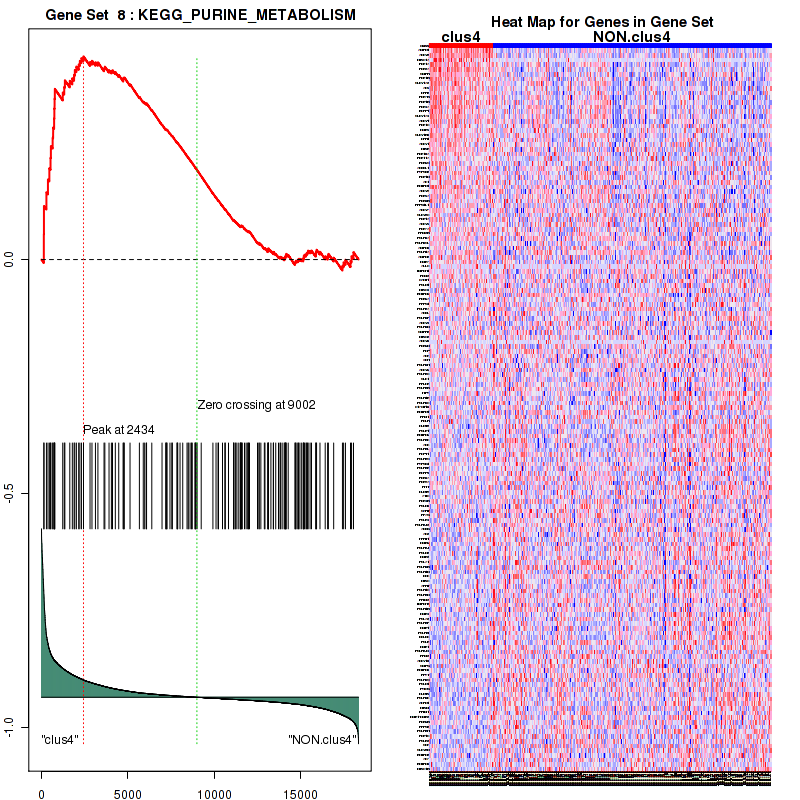
Figure S64. Get High-res Image For the top 5 core enriched genes in the pathway: KEGG PURINE METABOLISM, this volcano plot shows how much they are up/down-regulated and significant. The significance was calculated by empirical bayesian fit
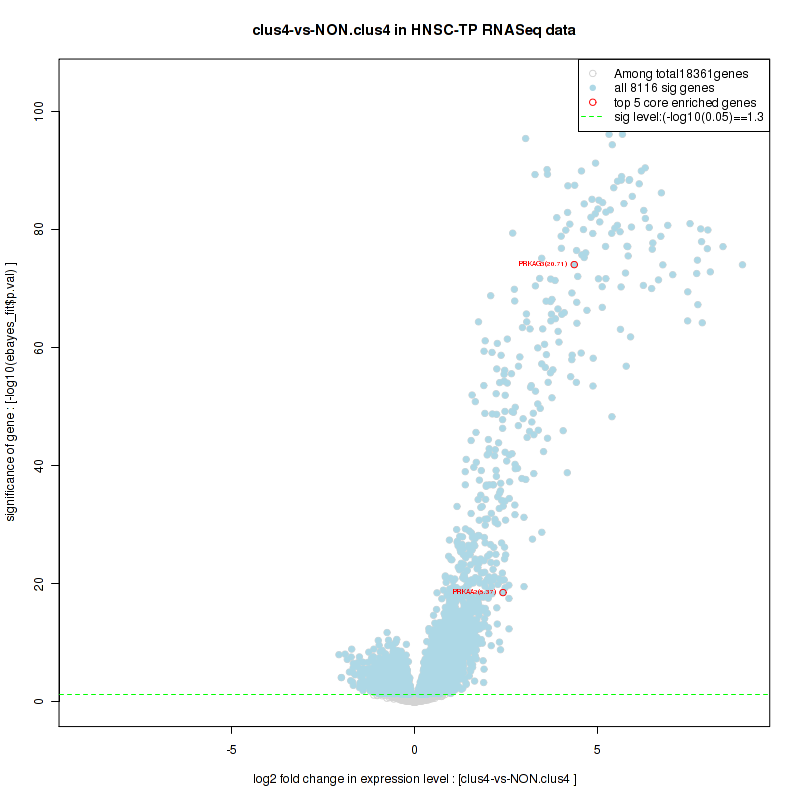
Table S33. Get Full Table This table shows a Running Enrichment Score (RES) of each gene in this pathway, that is, the enrichment score at this point in the ranked list of genes. All genes are ranked by Signal-to-Noise (S2N), a measure of similarity as default and are used to obtain ES matrix of all genes. In this way, GSEA tool uses expression pattern of not only overlapped genes but also not-overlapped genes to produce ES matrix.
| Rank | GENE | SYMBOL | DESC | LIST.LOC | S2N | RES | CORE_ENRICHMENT |
|---|---|---|---|---|---|---|---|
| 1 | ASB5 | ASB5 | ASB5 | 21 | 1.5 | 0.085 | YES |
| 2 | TRIM63 | TRIM63 | TRIM63 | 59 | 1.3 | 0.16 | YES |
| 3 | ASB15 | ASB15 | ASB15 | 122 | 1.1 | 0.22 | YES |
| 4 | ASB11 | ASB11 | ASB11 | 176 | 0.85 | 0.26 | YES |
| 5 | ASB12 | ASB12 | ASB12 | 234 | 0.7 | 0.3 | YES |
| 6 | ZBTB16 | ZBTB16 | ZBTB16 | 251 | 0.66 | 0.34 | YES |
| 7 | ASB16 | ASB16 | ASB16 | 310 | 0.58 | 0.37 | YES |
| 8 | PARK2 | PARK2 | PARK2 | 404 | 0.5 | 0.39 | YES |
| 9 | ASB4 | ASB4 | ASB4 | 519 | 0.43 | 0.41 | YES |
| 10 | MRC1 | MRC1 | MRC1 | 1010 | 0.31 | 0.4 | YES |
| 11 | FCGR1A | FCGR1A | FCGR1A | 1166 | 0.29 | 0.41 | YES |
| 12 | SPSB4 | SPSB4 | SPSB4 | 1226 | 0.28 | 0.42 | YES |
| 13 | CYBB | CYBB | CYBB | 1259 | 0.28 | 0.44 | YES |
| 14 | FCGR1B | FCGR1B | FCGR1B | 1415 | 0.26 | 0.44 | YES |
| 15 | ASB2 | ASB2 | ASB2 | 1719 | 0.22 | 0.44 | YES |
| 16 | CD36 | CD36 | CD36 | 1796 | 0.22 | 0.45 | YES |
| 17 | CD207 | CD207 | CD207 | 2140 | 0.19 | 0.44 | NO |
| 18 | MRC2 | MRC2 | MRC2 | 2391 | 0.17 | 0.44 | NO |
| 19 | DET1 | DET1 | DET1 | 2530 | 0.16 | 0.44 | NO |
| 20 | CTSS | CTSS | CTSS | 2722 | 0.15 | 0.44 | NO |
| 21 | NEDD4 | NEDD4 | NEDD4 | 2806 | 0.14 | 0.44 | NO |
| 22 | ITGAV | ITGAV | ITGAV | 3044 | 0.13 | 0.44 | NO |
| 23 | TRIM9 | TRIM9 | TRIM9 | 3210 | 0.12 | 0.43 | NO |
| 24 | NCF4 | NCF4 | NCF4 | 3228 | 0.12 | 0.44 | NO |
| 25 | CBLB | CBLB | CBLB | 3477 | 0.11 | 0.43 | NO |
| 26 | UBE2D4 | UBE2D4 | UBE2D4 | 3536 | 0.11 | 0.44 | NO |
| 27 | SEC23A | SEC23A | SEC23A | 3767 | 0.099 | 0.43 | NO |
| 28 | ITGB5 | ITGB5 | ITGB5 | 3830 | 0.097 | 0.43 | NO |
| 29 | NCF2 | NCF2 | NCF2 | 3831 | 0.097 | 0.44 | NO |
| 30 | LNPEP | LNPEP | LNPEP | 3864 | 0.096 | 0.44 | NO |
| 31 | FBXO2 | FBXO2 | FBXO2 | 3952 | 0.092 | 0.44 | NO |
| 32 | SPSB1 | SPSB1 | SPSB1 | 4040 | 0.089 | 0.44 | NO |
| 33 | TRIM21 | TRIM21 | TRIM21 | 4161 | 0.084 | 0.44 | NO |
| 34 | ASB8 | ASB8 | ASB8 | 4174 | 0.084 | 0.44 | NO |
| 35 | UBR1 | UBR1 | UBR1 | 4378 | 0.077 | 0.44 | NO |
| 36 | HLA-F | HLA-F | HLA-F | 4462 | 0.074 | 0.44 | NO |
| 37 | UBR2 | UBR2 | UBR2 | 4468 | 0.074 | 0.44 | NO |
| 38 | SEC24D | SEC24D | SEC24D | 4479 | 0.074 | 0.44 | NO |
| 39 | HLA-C | HLA-C | HLA-C | 4556 | 0.072 | 0.44 | NO |
| 40 | TRIM32 | TRIM32 | TRIM32 | 4600 | 0.07 | 0.44 | NO |
| 41 | HLA-B | HLA-B | HLA-B | 4655 | 0.069 | 0.45 | NO |
| 42 | TRIM36 | TRIM36 | TRIM36 | 4781 | 0.066 | 0.44 | NO |
| 43 | PSMB9 | PSMB9 | PSMB9 | 4886 | 0.062 | 0.44 | NO |
| 44 | TAP1 | TAP1 | TAP1 | 4960 | 0.06 | 0.44 | NO |
| 45 | UBE2L6 | UBE2L6 | UBE2L6 | 4968 | 0.06 | 0.44 | NO |
| 46 | ASB1 | ASB1 | ASB1 | 5045 | 0.058 | 0.44 | NO |
| 47 | TAP2 | TAP2 | TAP2 | 5050 | 0.058 | 0.45 | NO |
| 48 | HLA-A | HLA-A | HLA-A | 5092 | 0.057 | 0.45 | NO |
| 49 | PJA2 | PJA2 | PJA2 | 5182 | 0.055 | 0.44 | NO |
| 50 | DZIP3 | DZIP3 | DZIP3 | 5263 | 0.053 | 0.44 | NO |
| 51 | FBXO17 | FBXO17 | FBXO17 | 5319 | 0.052 | 0.44 | NO |
| 52 | UBA7 | UBA7 | UBA7 | 5407 | 0.049 | 0.44 | NO |
| 53 | DTX3L | DTX3L | DTX3L | 5409 | 0.049 | 0.44 | NO |
| 54 | B2M | B2M | B2M | 5457 | 0.048 | 0.44 | NO |
| 55 | SMURF2 | SMURF2 | SMURF2 | 5504 | 0.047 | 0.44 | NO |
| 56 | UBE2D1 | UBE2D1 | UBE2D1 | 5581 | 0.045 | 0.44 | NO |
| 57 | RNF123 | RNF123 | RNF123 | 5643 | 0.044 | 0.44 | NO |
| 58 | UBE2H | UBE2H | UBE2H | 5675 | 0.043 | 0.44 | NO |
| 59 | WWP1 | WWP1 | WWP1 | 5759 | 0.042 | 0.44 | NO |
| 60 | HECTD3 | HECTD3 | HECTD3 | 5792 | 0.041 | 0.44 | NO |
| 61 | UBE2Q2 | UBE2Q2 | UBE2Q2 | 5794 | 0.041 | 0.44 | NO |
| 62 | SEC31A | SEC31A | SEC31A | 5854 | 0.04 | 0.44 | NO |
| 63 | CUL5 | CUL5 | CUL5 | 5873 | 0.04 | 0.44 | NO |
| 64 | ERAP1 | ERAP1 | ERAP1 | 5904 | 0.039 | 0.44 | NO |
| 65 | SOCS3 | SOCS3 | SOCS3 | 6036 | 0.037 | 0.44 | NO |
| 66 | TRIP12 | TRIP12 | TRIP12 | 6053 | 0.037 | 0.44 | NO |
| 67 | TPP2 | TPP2 | TPP2 | 6186 | 0.035 | 0.44 | NO |
| 68 | CDC27 | CDC27 | CDC27 | 6246 | 0.034 | 0.44 | NO |
| 69 | PSMB10 | PSMB10 | PSMB10 | 6253 | 0.034 | 0.44 | NO |
| 70 | SMURF1 | SMURF1 | SMURF1 | 6418 | 0.031 | 0.43 | NO |
| 71 | KLHL20 | KLHL20 | KLHL20 | 6457 | 0.031 | 0.43 | NO |
| 72 | HERC2 | HERC2 | HERC2 | 6501 | 0.03 | 0.43 | NO |
| 73 | FBXW7 | FBXW7 | FBXW7 | 6645 | 0.028 | 0.42 | NO |
| 74 | UBOX5 | UBOX5 | UBOX5 | 6686 | 0.027 | 0.42 | NO |
| 75 | CUL7 | CUL7 | CUL7 | 6693 | 0.027 | 0.42 | NO |
| 76 | UBE4A | UBE4A | UBE4A | 6830 | 0.025 | 0.42 | NO |
| 77 | UBE2R2 | UBE2R2 | UBE2R2 | 6840 | 0.025 | 0.42 | NO |
| 78 | PSMD1 | PSMD1 | PSMD1 | 6850 | 0.025 | 0.42 | NO |
| 79 | UBE3B | UBE3B | UBE3B | 6890 | 0.024 | 0.42 | NO |
| 80 | ASB13 | ASB13 | ASB13 | 6891 | 0.024 | 0.42 | NO |
| 81 | UBR4 | UBR4 | UBR4 | 6930 | 0.024 | 0.42 | NO |
| 82 | PSMB8 | PSMB8 | PSMB8 | 6938 | 0.024 | 0.42 | NO |
| 83 | UBE3C | UBE3C | UBE3C | 7117 | 0.021 | 0.41 | NO |
| 84 | FBXO3 | FBXO3 | FBXO3 | 7147 | 0.021 | 0.41 | NO |
| 85 | FBXW8 | FBXW8 | FBXW8 | 7182 | 0.02 | 0.41 | NO |
| 86 | PSMF1 | PSMF1 | PSMF1 | 7186 | 0.02 | 0.41 | NO |
| 87 | RNF41 | RNF41 | RNF41 | 7291 | 0.019 | 0.41 | NO |
| 88 | UBE2W | UBE2W | UBE2W | 7303 | 0.019 | 0.41 | NO |
| 89 | LRSAM1 | LRSAM1 | LRSAM1 | 7336 | 0.018 | 0.41 | NO |
| 90 | PSMD5 | PSMD5 | PSMD5 | 7513 | 0.016 | 0.4 | NO |
| 91 | HSPA5 | HSPA5 | HSPA5 | 7524 | 0.016 | 0.4 | NO |
| 92 | RBCK1 | RBCK1 | RBCK1 | 7547 | 0.016 | 0.4 | NO |
| 93 | RNF4 | RNF4 | RNF4 | 7561 | 0.016 | 0.4 | NO |
| 94 | ASB7 | ASB7 | ASB7 | 7595 | 0.016 | 0.4 | NO |
| 95 | FBXO27 | FBXO27 | FBXO27 | 7601 | 0.016 | 0.4 | NO |
| 96 | RNF34 | RNF34 | RNF34 | 7668 | 0.015 | 0.39 | NO |
| 97 | HUWE1 | HUWE1 | HUWE1 | 7692 | 0.014 | 0.39 | NO |
| 98 | PJA1 | PJA1 | PJA1 | 7697 | 0.014 | 0.39 | NO |
| 99 | SEC24B | SEC24B | SEC24B | 7732 | 0.014 | 0.39 | NO |
| 100 | CALR | CALR | CALR | 7761 | 0.013 | 0.39 | NO |
| 101 | RNF6 | RNF6 | RNF6 | 7770 | 0.013 | 0.39 | NO |
| 102 | UBE2F | UBE2F | UBE2F | 7847 | 0.012 | 0.39 | NO |
| 103 | PSMD2 | PSMD2 | PSMD2 | 7872 | 0.012 | 0.39 | NO |
| 104 | BTRC | BTRC | BTRC | 7934 | 0.011 | 0.39 | NO |
| 105 | UBE2G1 | UBE2G1 | UBE2G1 | 7950 | 0.011 | 0.39 | NO |
| 106 | CANX | CANX | CANX | 8032 | 0.01 | 0.38 | NO |
| 107 | KLHL9 | KLHL9 | KLHL9 | 8056 | 0.01 | 0.38 | NO |
| 108 | PSME2 | PSME2 | PSME2 | 8059 | 0.0099 | 0.38 | NO |
| 109 | SEC24C | SEC24C | SEC24C | 8078 | 0.0097 | 0.38 | NO |
| 110 | SAR1B | SAR1B | SAR1B | 8287 | 0.0074 | 0.37 | NO |
| 111 | PSME1 | PSME1 | PSME1 | 8360 | 0.0065 | 0.37 | NO |
| 112 | FBXO6 | FBXO6 | FBXO6 | 8415 | 0.0059 | 0.36 | NO |
| 113 | PSMC2 | PSMC2 | PSMC2 | 8478 | 0.0052 | 0.36 | NO |
| 114 | RNF25 | RNF25 | RNF25 | 8492 | 0.0051 | 0.36 | NO |
| 115 | TMEM189-UBE2V1 | TMEM189-UBE2V1 | TMEM189-UBE2V1 | 8499 | 0.005 | 0.36 | NO |
| 116 | PSMD7 | PSMD7 | PSMD7 | 8578 | 0.0042 | 0.36 | NO |
| 117 | KLHL13 | KLHL13 | KLHL13 | 8618 | 0.0039 | 0.36 | NO |
| 118 | UBE2Z | UBE2Z | UBE2Z | 8623 | 0.0038 | 0.36 | NO |
| 119 | RNF144B | RNF144B | RNF144B | 8627 | 0.0038 | 0.36 | NO |
| 120 | UBE2J1 | UBE2J1 | UBE2J1 | 8681 | 0.0033 | 0.35 | NO |
| 121 | SEC61A1 | SEC61A1 | SEC61A1 | 8778 | 0.0024 | 0.35 | NO |
| 122 | RCHY1 | RCHY1 | RCHY1 | 8854 | 0.0016 | 0.34 | NO |
| 123 | TRIM37 | TRIM37 | TRIM37 | 8896 | 0.0011 | 0.34 | NO |
| 124 | UBE3A | UBE3A | UBE3A | 9096 | -0.00097 | 0.33 | NO |
| 125 | ARIH2 | ARIH2 | ARIH2 | 9141 | -0.0014 | 0.33 | NO |
| 126 | PSMD13 | PSMD13 | PSMD13 | 9144 | -0.0014 | 0.33 | NO |
| 127 | PSMD11 | PSMD11 | PSMD11 | 9178 | -0.0017 | 0.32 | NO |
| 128 | UBE2L3 | UBE2L3 | UBE2L3 | 9189 | -0.0018 | 0.32 | NO |
| 129 | PSMA7 | PSMA7 | PSMA7 | 9213 | -0.0021 | 0.32 | NO |
| 130 | CUL2 | CUL2 | CUL2 | 9224 | -0.0022 | 0.32 | NO |
| 131 | ATG7 | ATG7 | ATG7 | 9239 | -0.0023 | 0.32 | NO |
| 132 | PDIA3 | PDIA3 | PDIA3 | 9257 | -0.0024 | 0.32 | NO |
| 133 | CUL3 | CUL3 | CUL3 | 9265 | -0.0025 | 0.32 | NO |
| 134 | CUL1 | CUL1 | CUL1 | 9266 | -0.0025 | 0.32 | NO |
| 135 | MKRN1 | MKRN1 | MKRN1 | 9314 | -0.003 | 0.32 | NO |
| 136 | PSME4 | PSME4 | PSME4 | 9336 | -0.0032 | 0.32 | NO |
| 137 | VPRBP | VPRBP | VPRBP | 9381 | -0.0036 | 0.32 | NO |
| 138 | PSMB5 | PSMB5 | PSMB5 | 9384 | -0.0036 | 0.32 | NO |
| 139 | UBE2A | UBE2A | UBE2A | 9401 | -0.0038 | 0.32 | NO |
| 140 | FBXW11 | FBXW11 | FBXW11 | 9406 | -0.0038 | 0.32 | NO |
| 141 | PSMC3 | PSMC3 | PSMC3 | 9536 | -0.0051 | 0.31 | NO |
| 142 | LRRC41 | LRRC41 | LRRC41 | 9591 | -0.0057 | 0.31 | NO |
| 143 | ANAPC1 | ANAPC1 | ANAPC1 | 9661 | -0.0064 | 0.3 | NO |
| 144 | SPSB2 | SPSB2 | SPSB2 | 9668 | -0.0064 | 0.3 | NO |
| 145 | CDC16 | CDC16 | CDC16 | 9691 | -0.0066 | 0.3 | NO |
| 146 | ANAPC5 | ANAPC5 | ANAPC5 | 9733 | -0.0071 | 0.3 | NO |
| 147 | PSMB2 | PSMB2 | PSMB2 | 9779 | -0.0075 | 0.3 | NO |
| 148 | UBE2G2 | UBE2G2 | UBE2G2 | 9814 | -0.0078 | 0.3 | NO |
| 149 | RNF220 | RNF220 | RNF220 | 9920 | -0.0088 | 0.29 | NO |
| 150 | PSMC6 | PSMC6 | PSMC6 | 9972 | -0.0092 | 0.29 | NO |
| 151 | UBE2D3 | UBE2D3 | UBE2D3 | 9986 | -0.0094 | 0.29 | NO |
| 152 | PSMA8 | PSMA8 | PSMA8 | 9989 | -0.0094 | 0.29 | NO |
| 153 | UBE2K | UBE2K | UBE2K | 10005 | -0.0096 | 0.29 | NO |
| 154 | UBE2B | UBE2B | UBE2B | 10016 | -0.0097 | 0.29 | NO |
| 155 | SEC13 | SEC13 | SEC13 | 10073 | -0.01 | 0.29 | NO |
| 156 | PSMA1 | PSMA1 | PSMA1 | 10180 | -0.011 | 0.28 | NO |
| 157 | PSMB6 | PSMB6 | PSMB6 | 10261 | -0.012 | 0.28 | NO |
| 158 | UBA1 | UBA1 | UBA1 | 10312 | -0.012 | 0.28 | NO |
| 159 | CYBA | CYBA | CYBA | 10420 | -0.014 | 0.27 | NO |
| 160 | HLA-G | HLA-G | HLA-G | 10581 | -0.015 | 0.26 | NO |
| 161 | PSMC1 | PSMC1 | PSMC1 | 10585 | -0.015 | 0.26 | NO |
| 162 | PSMC5 | PSMC5 | PSMC5 | 10654 | -0.016 | 0.26 | NO |
| 163 | PSMD12 | PSMD12 | PSMD12 | 10658 | -0.016 | 0.26 | NO |
| 164 | PSMA5 | PSMA5 | PSMA5 | 10753 | -0.017 | 0.26 | NO |
| 165 | UBE2O | UBE2O | UBE2O | 10774 | -0.017 | 0.26 | NO |
| 166 | SKP1 | SKP1 | SKP1 | 10800 | -0.017 | 0.26 | NO |
| 167 | PSMD8 | PSMD8 | PSMD8 | 10808 | -0.017 | 0.26 | NO |
| 168 | PSMD9 | PSMD9 | PSMD9 | 10879 | -0.018 | 0.25 | NO |
| 169 | PSMA6 | PSMA6 | PSMA6 | 10928 | -0.018 | 0.25 | NO |
| 170 | PSMC4 | PSMC4 | PSMC4 | 10961 | -0.019 | 0.25 | NO |
| 171 | CDC26 | CDC26 | CDC26 | 11006 | -0.019 | 0.25 | NO |
| 172 | PSMA3 | PSMA3 | PSMA3 | 11012 | -0.019 | 0.25 | NO |
| 173 | PSMD3 | PSMD3 | PSMD3 | 11028 | -0.019 | 0.25 | NO |
| 174 | UBE2V2 | UBE2V2 | UBE2V2 | 11155 | -0.021 | 0.25 | NO |
| 175 | PSMD10 | PSMD10 | PSMD10 | 11158 | -0.021 | 0.25 | NO |
| 176 | UBA3 | UBA3 | UBA3 | 11190 | -0.021 | 0.25 | NO |
| 177 | NPEPPS | NPEPPS | NPEPPS | 11272 | -0.022 | 0.24 | NO |
| 178 | ANAPC13 | ANAPC13 | ANAPC13 | 11277 | -0.022 | 0.24 | NO |
| 179 | UBE2Q1 | UBE2Q1 | UBE2Q1 | 11397 | -0.023 | 0.24 | NO |
| 180 | PSMB1 | PSMB1 | PSMB1 | 11401 | -0.023 | 0.24 | NO |
| 181 | ANAPC2 | ANAPC2 | ANAPC2 | 11422 | -0.023 | 0.24 | NO |
| 182 | CDC23 | CDC23 | CDC23 | 11493 | -0.024 | 0.24 | NO |
| 183 | UBE2E3 | UBE2E3 | UBE2E3 | 11722 | -0.026 | 0.23 | NO |
| 184 | UBE2E2 | UBE2E2 | UBE2E2 | 11825 | -0.027 | 0.22 | NO |
| 185 | PSMD4 | PSMD4 | PSMD4 | 11831 | -0.027 | 0.22 | NO |
| 186 | UBA6 | UBA6 | UBA6 | 11841 | -0.027 | 0.22 | NO |
| 187 | KEAP1 | KEAP1 | KEAP1 | 11842 | -0.027 | 0.23 | NO |
| 188 | STUB1 | STUB1 | STUB1 | 11898 | -0.028 | 0.23 | NO |
| 189 | UBE2D2 | UBE2D2 | UBE2D2 | 11910 | -0.028 | 0.23 | NO |
| 190 | ANAPC4 | ANAPC4 | ANAPC4 | 11932 | -0.028 | 0.23 | NO |
| 191 | CDC34 | CDC34 | CDC34 | 11959 | -0.029 | 0.23 | NO |
| 192 | PSMD14 | PSMD14 | PSMD14 | 11987 | -0.029 | 0.23 | NO |
| 193 | RBX1 | RBX1 | RBX1 | 12031 | -0.029 | 0.23 | NO |
| 194 | PSMD6 | PSMD6 | PSMD6 | 12047 | -0.03 | 0.23 | NO |
| 195 | GAN | GAN | GAN | 12094 | -0.03 | 0.23 | NO |
| 196 | ASB3 | ASB3 | ASB3 | 12097 | -0.03 | 0.23 | NO |
| 197 | TCEB1 | TCEB1 | TCEB1 | 12101 | -0.03 | 0.23 | NO |
| 198 | PSMA2 | PSMA2 | PSMA2 | 12188 | -0.031 | 0.23 | NO |
| 199 | UBE2J2 | UBE2J2 | UBE2J2 | 12217 | -0.031 | 0.23 | NO |
| 200 | ASB6 | ASB6 | ASB6 | 12228 | -0.031 | 0.23 | NO |
| 201 | PSMB7 | PSMB7 | PSMB7 | 12319 | -0.032 | 0.23 | NO |
| 202 | SAE1 | SAE1 | SAE1 | 12340 | -0.032 | 0.23 | NO |
| 203 | SOCS1 | SOCS1 | SOCS1 | 12370 | -0.033 | 0.23 | NO |
| 204 | PSMA4 | PSMA4 | PSMA4 | 12474 | -0.034 | 0.22 | NO |
| 205 | FBXO4 | FBXO4 | FBXO4 | 12498 | -0.034 | 0.22 | NO |
| 206 | UBA2 | UBA2 | UBA2 | 12558 | -0.035 | 0.22 | NO |
| 207 | FBXO44 | FBXO44 | FBXO44 | 12708 | -0.037 | 0.22 | NO |
| 208 | PSMB3 | PSMB3 | PSMB3 | 12830 | -0.038 | 0.21 | NO |
| 209 | SEC61A2 | SEC61A2 | SEC61A2 | 12855 | -0.038 | 0.21 | NO |
| 210 | ANAPC11 | ANAPC11 | ANAPC11 | 13077 | -0.041 | 0.2 | NO |
| 211 | VHL | VHL | VHL | 13227 | -0.043 | 0.2 | NO |
| 212 | TCEB2 | TCEB2 | TCEB2 | 13240 | -0.043 | 0.2 | NO |
| 213 | UBE2N | UBE2N | UBE2N | 13256 | -0.043 | 0.2 | NO |
| 214 | PSMB4 | PSMB4 | PSMB4 | 13266 | -0.043 | 0.2 | NO |
| 215 | UBA5 | UBA5 | UBA5 | 13362 | -0.044 | 0.2 | NO |
| 216 | UBA52 | UBA52 | UBA52 | 13505 | -0.046 | 0.2 | NO |
| 217 | UBE2E1 | UBE2E1 | UBE2E1 | 13553 | -0.047 | 0.2 | NO |
| 218 | SEC61B | SEC61B | SEC61B | 13691 | -0.049 | 0.19 | NO |
| 219 | WSB1 | WSB1 | WSB1 | 13865 | -0.051 | 0.18 | NO |
| 220 | ANAPC7 | ANAPC7 | ANAPC7 | 14016 | -0.054 | 0.18 | NO |
| 221 | UBE2M | UBE2M | UBE2M | 14027 | -0.054 | 0.18 | NO |
| 222 | SKP2 | SKP2 | SKP2 | 14074 | -0.054 | 0.18 | NO |
| 223 | RNF182 | RNF182 | RNF182 | 14075 | -0.054 | 0.18 | NO |
| 224 | BLMH | BLMH | BLMH | 14086 | -0.055 | 0.19 | NO |
| 225 | TRIM11 | TRIM11 | TRIM11 | 14578 | -0.063 | 0.16 | NO |
| 226 | ANAPC10 | ANAPC10 | ANAPC10 | 14810 | -0.067 | 0.16 | NO |
| 227 | CDC20 | CDC20 | CDC20 | 14817 | -0.068 | 0.16 | NO |
| 228 | RPS27A | RPS27A | RPS27A | 14964 | -0.07 | 0.16 | NO |
| 229 | SEC61G | SEC61G | SEC61G | 15276 | -0.078 | 0.14 | NO |
| 230 | UBE2C | UBE2C | UBE2C | 15955 | -0.098 | 0.11 | NO |
| 231 | RNF138 | RNF138 | RNF138 | 16095 | -0.1 | 0.11 | NO |
| 232 | UBE2S | UBE2S | UBE2S | 16635 | -0.12 | 0.086 | NO |
| 233 | ASB9 | ASB9 | ASB9 | 17274 | -0.16 | 0.06 | NO |
Figure S65. Get High-res Image This plot shows mRNAseq_cNMF expression data heatmap (on the left) a RunningEnrichmentScore(RES) plot (on the top right) and a Signal2Noise(S2N) plot (on the bottom right) of genes in the pathway: KEGG ARGININE AND PROLINE METABOLISM.
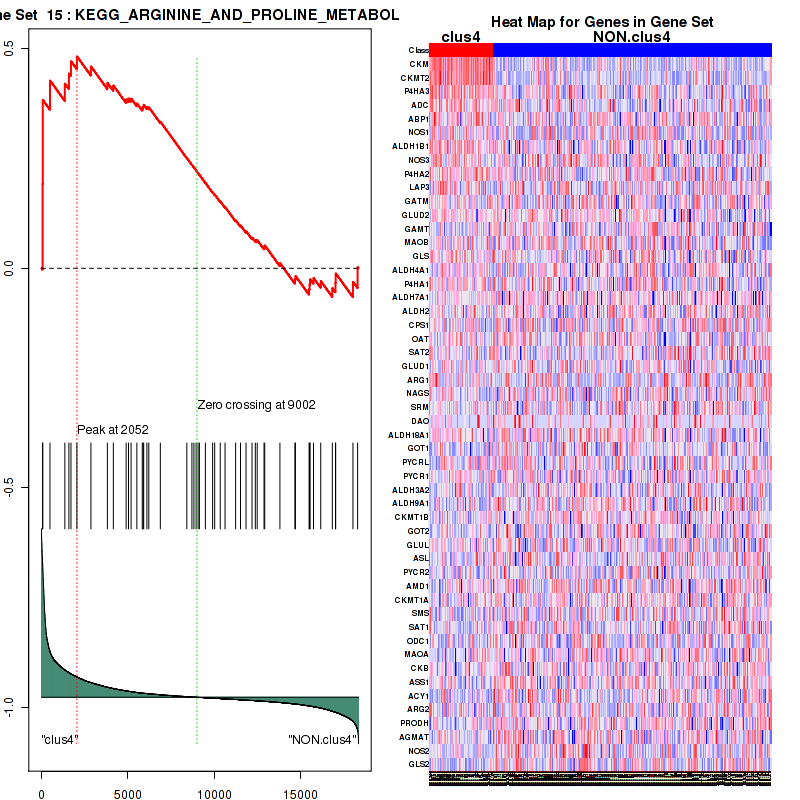
Figure S66. Get High-res Image For the top 5 core enriched genes in the pathway: KEGG ARGININE AND PROLINE METABOLISM, this volcano plot shows how much they are up/down-regulated and significant. The significance was calculated by empirical bayesian fit

Table S34. Get Full Table This table shows a Running Enrichment Score (RES) of each gene in this pathway, that is, the enrichment score at this point in the ranked list of genes. All genes are ranked by Signal-to-Noise (S2N), a measure of similarity as default and are used to obtain ES matrix of all genes. In this way, GSEA tool uses expression pattern of not only overlapped genes but also not-overlapped genes to produce ES matrix.
| Rank | GENE | SYMBOL | DESC | LIST.LOC | S2N | RES | CORE_ENRICHMENT |
|---|---|---|---|---|---|---|---|
| 1 | CKM | CKM | CKM | 66 | 1.3 | 0.18 | YES |
| 2 | MYOD1 | MYOD1 | MYOD1 | 84 | 1.2 | 0.34 | YES |
| 3 | MEF2C | MEF2C | MEF2C | 208 | 0.76 | 0.44 | YES |
| 4 | MITF | MITF | MITF | 503 | 0.44 | 0.49 | YES |
| 5 | GSC | GSC | GSC | 1067 | 0.3 | 0.5 | YES |
| 6 | PAX3 | PAX3 | PAX3 | 1704 | 0.23 | 0.5 | YES |
| 7 | TGFB2 | TGFB2 | TGFB2 | 1745 | 0.22 | 0.52 | YES |
| 8 | RUNX2 | RUNX2 | RUNX2 | 1823 | 0.22 | 0.55 | YES |
| 9 | SPI1 | SPI1 | SPI1 | 1895 | 0.21 | 0.57 | YES |
| 10 | CDK6 | CDK6 | CDK6 | 4053 | 0.089 | 0.47 | NO |
| 11 | PPARG | PPARG | PPARG | 4232 | 0.082 | 0.47 | NO |
| 12 | MET | MET | MET | 4583 | 0.071 | 0.46 | NO |
| 13 | CCND1 | CCND1 | CCND1 | 4768 | 0.066 | 0.46 | NO |
| 14 | ATF2 | ATF2 | ATF2 | 4836 | 0.064 | 0.46 | NO |
| 15 | ABL1 | ABL1 | ABL1 | 5088 | 0.057 | 0.46 | NO |
| 16 | PPP2R3B | PPP2R3B | PPP2R3B | 5325 | 0.052 | 0.45 | NO |
| 17 | ATF7 | ATF7 | ATF7 | 5343 | 0.051 | 0.46 | NO |
| 18 | SFTPD | SFTPD | SFTPD | 5829 | 0.041 | 0.44 | NO |
| 19 | CCND2 | CCND2 | CCND2 | 5923 | 0.039 | 0.44 | NO |
| 20 | EP300 | EP300 | EP300 | 6038 | 0.037 | 0.44 | NO |
| 21 | ELF1 | ELF1 | ELF1 | 6141 | 0.035 | 0.44 | NO |
| 22 | SIRT1 | SIRT1 | SIRT1 | 6192 | 0.034 | 0.44 | NO |
| 23 | RB1 | RB1 | RB1 | 6454 | 0.031 | 0.43 | NO |
| 24 | CEBPB | CEBPB | CEBPB | 6481 | 0.03 | 0.43 | NO |
| 25 | CTBP1 | CTBP1 | CTBP1 | 6498 | 0.03 | 0.44 | NO |
| 26 | CSF2 | CSF2 | CSF2 | 6665 | 0.028 | 0.43 | NO |
| 27 | CREBBP | CREBBP | CREBBP | 7288 | 0.019 | 0.4 | NO |
| 28 | JUN | JUN | JUN | 7587 | 0.016 | 0.38 | NO |
| 29 | TAF1 | TAF1 | TAF1 | 7639 | 0.015 | 0.38 | NO |
| 30 | CCND3 | CCND3 | CCND3 | 7834 | 0.012 | 0.37 | NO |
| 31 | CDKN2A | CDKN2A | CDKN2A | 7845 | 0.012 | 0.38 | NO |
| 32 | CDKN1B | CDKN1B | CDKN1B | 8121 | 0.0092 | 0.36 | NO |
| 33 | MAPK14 | MAPK14 | MAPK14 | 9242 | -0.0023 | 0.3 | NO |
| 34 | CDKN1A | CDKN1A | CDKN1A | 9260 | -0.0025 | 0.3 | NO |
| 35 | UBTF | UBTF | UBTF | 9274 | -0.0026 | 0.3 | NO |
| 36 | MAPK11 | MAPK11 | MAPK11 | 9707 | -0.0068 | 0.28 | NO |
| 37 | SMARCB1 | SMARCB1 | SMARCB1 | 10075 | -0.01 | 0.26 | NO |
| 38 | E2F4 | E2F4 | E2F4 | 10233 | -0.012 | 0.25 | NO |
| 39 | RAF1 | RAF1 | RAF1 | 10240 | -0.012 | 0.25 | NO |
| 40 | AATF | AATF | AATF | 10266 | -0.012 | 0.25 | NO |
| 41 | MAPK9 | MAPK9 | MAPK9 | 10639 | -0.016 | 0.24 | NO |
| 42 | BRD2 | BRD2 | BRD2 | 10662 | -0.016 | 0.24 | NO |
| 43 | TBP | TBP | TBP | 10863 | -0.018 | 0.23 | NO |
| 44 | E2F3 | E2F3 | E2F3 | 10906 | -0.018 | 0.23 | NO |
| 45 | PPP2CA | PPP2CA | PPP2CA | 11056 | -0.02 | 0.22 | NO |
| 46 | HDAC1 | HDAC1 | HDAC1 | 12115 | -0.03 | 0.17 | NO |
| 47 | HDAC3 | HDAC3 | HDAC3 | 12247 | -0.032 | 0.17 | NO |
| 48 | RBBP4 | RBBP4 | RBBP4 | 12278 | -0.032 | 0.17 | NO |
| 49 | DNMT1 | DNMT1 | DNMT1 | 12329 | -0.032 | 0.17 | NO |
| 50 | CEBPA | CEBPA | CEBPA | 12553 | -0.035 | 0.16 | NO |
| 51 | TFDP1 | TFDP1 | TFDP1 | 12678 | -0.036 | 0.16 | NO |
| 52 | BGLAP | BGLAP | BGLAP | 12866 | -0.038 | 0.16 | NO |
| 53 | SMARCA4 | SMARCA4 | SMARCA4 | 13015 | -0.04 | 0.15 | NO |
| 54 | MDM2 | MDM2 | MDM2 | 13114 | -0.041 | 0.15 | NO |
| 55 | CDK4 | CDK4 | CDK4 | 13914 | -0.052 | 0.12 | NO |
| 56 | SKP2 | SKP2 | SKP2 | 14074 | -0.054 | 0.12 | NO |
| 57 | CDK2 | CDK2 | CDK2 | 14094 | -0.055 | 0.12 | NO |
| 58 | CBX4 | CBX4 | CBX4 | 14462 | -0.061 | 0.11 | NO |
| 59 | SUV39H1 | SUV39H1 | SUV39H1 | 15633 | -0.088 | 0.06 | NO |
| 60 | CEBPD | CEBPD | CEBPD | 15821 | -0.093 | 0.062 | NO |
| 61 | CCNA2 | CCNA2 | CCNA2 | 15842 | -0.094 | 0.074 | NO |
| 62 | E2F1 | E2F1 | E2F1 | 16779 | -0.13 | 0.041 | NO |
| 63 | E2F2 | E2F2 | E2F2 | 16961 | -0.14 | 0.051 | NO |
| 64 | CCNE1 | CCNE1 | CCNE1 | 17587 | -0.18 | 0.042 | NO |
Figure S67. Get High-res Image This plot shows mRNAseq_cNMF expression data heatmap (on the left) a RunningEnrichmentScore(RES) plot (on the top right) and a Signal2Noise(S2N) plot (on the bottom right) of genes in the pathway: KEGG TYROSINE METABOLISM.
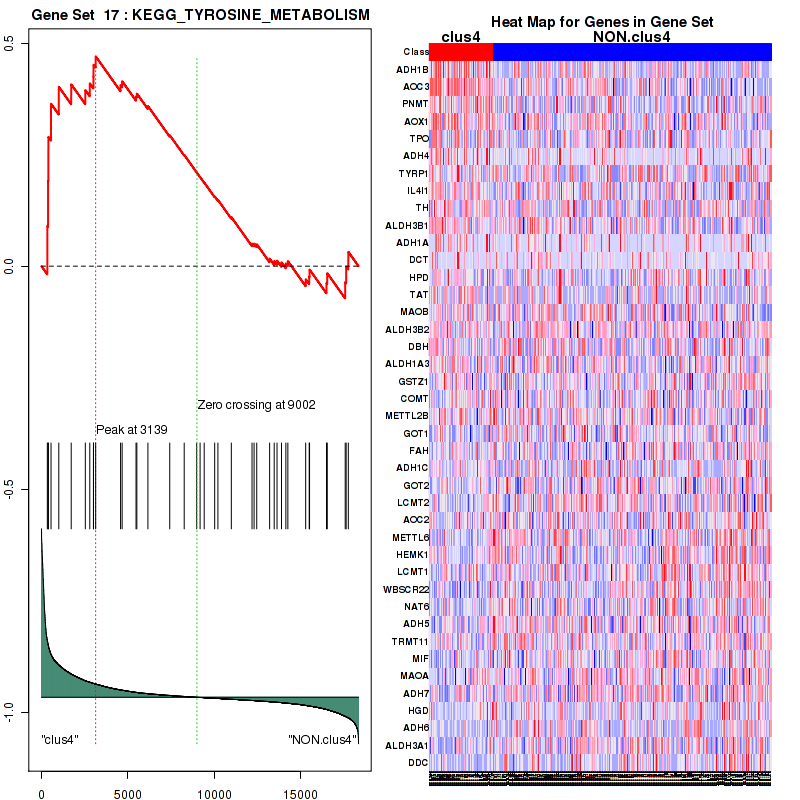
Figure S68. Get High-res Image For the top 5 core enriched genes in the pathway: KEGG TYROSINE METABOLISM, this volcano plot shows how much they are up/down-regulated and significant. The significance was calculated by empirical bayesian fit
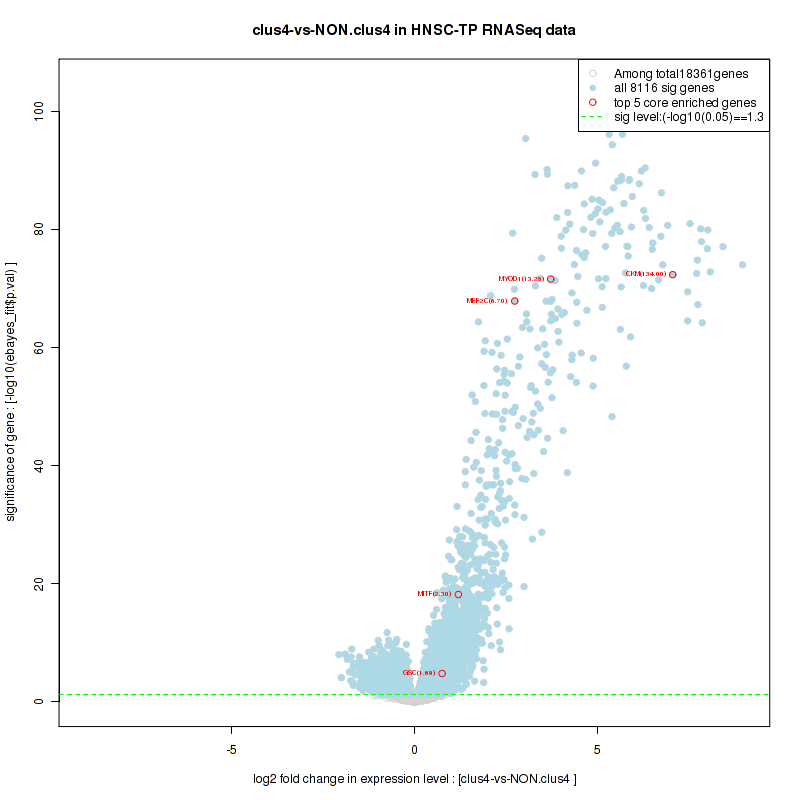
Table S35. Get Full Table This table shows a Running Enrichment Score (RES) of each gene in this pathway, that is, the enrichment score at this point in the ranked list of genes. All genes are ranked by Signal-to-Noise (S2N), a measure of similarity as default and are used to obtain ES matrix of all genes. In this way, GSEA tool uses expression pattern of not only overlapped genes but also not-overlapped genes to produce ES matrix.
| Rank | GENE | SYMBOL | DESC | LIST.LOC | S2N | RES | CORE_ENRICHMENT |
|---|---|---|---|---|---|---|---|
| 1 | PPP1R3A | PPP1R3A | PPP1R3A | 19 | 1.5 | 0.52 | YES |
| 2 | SLC2A4 | SLC2A4 | SLC2A4 | 423 | 0.48 | 0.66 | YES |
| 3 | RHOQ | RHOQ | RHOQ | 3565 | 0.11 | 0.53 | NO |
| 4 | ASIP | ASIP | ASIP | 3838 | 0.097 | 0.55 | NO |
| 5 | LNPEP | LNPEP | LNPEP | 3864 | 0.096 | 0.58 | NO |
| 6 | INSR | INSR | INSR | 4414 | 0.076 | 0.58 | NO |
| 7 | TBC1D4 | TBC1D4 | TBC1D4 | 5240 | 0.054 | 0.55 | NO |
| 8 | GYS1 | GYS1 | GYS1 | 6100 | 0.036 | 0.52 | NO |
| 9 | YWHAG | YWHAG | YWHAG | 6342 | 0.032 | 0.52 | NO |
| 10 | YWHAH | YWHAH | YWHAH | 6621 | 0.028 | 0.51 | NO |
| 11 | VAMP2 | VAMP2 | VAMP2 | 6833 | 0.025 | 0.51 | NO |
| 12 | YWHAZ | YWHAZ | YWHAZ | 7204 | 0.02 | 0.5 | NO |
| 13 | STX4 | STX4 | STX4 | 7318 | 0.019 | 0.5 | NO |
| 14 | GSK3B | GSK3B | GSK3B | 7370 | 0.018 | 0.5 | NO |
| 15 | AKT2 | AKT2 | AKT2 | 7952 | 0.011 | 0.47 | NO |
| 16 | YWHAB | YWHAB | YWHAB | 8016 | 0.01 | 0.47 | NO |
| 17 | SFN | SFN | SFN | 8022 | 0.01 | 0.48 | NO |
| 18 | AKT1 | AKT1 | AKT1 | 8190 | 0.0086 | 0.47 | NO |
| 19 | YWHAQ | YWHAQ | YWHAQ | 9215 | -0.0021 | 0.41 | NO |
| 20 | YWHAE | YWHAE | YWHAE | 10973 | -0.019 | 0.32 | NO |
| 21 | PPP1CC | PPP1CC | PPP1CC | 11114 | -0.02 | 0.32 | NO |
| 22 | PRKCI | PRKCI | PRKCI | 12639 | -0.036 | 0.25 | NO |
| 23 | TRIP10 | TRIP10 | TRIP10 | 12761 | -0.037 | 0.26 | NO |
| 24 | PRKCZ | PRKCZ | PRKCZ | 14592 | -0.064 | 0.18 | NO |
| 25 | STXBP4 | STXBP4 | STXBP4 | 14828 | -0.068 | 0.19 | NO |
Figure S69. Get High-res Image This plot shows mRNAseq_cNMF expression data heatmap (on the left) a RunningEnrichmentScore(RES) plot (on the top right) and a Signal2Noise(S2N) plot (on the bottom right) of genes in the pathway: KEGG GLYCEROLIPID METABOLISM.
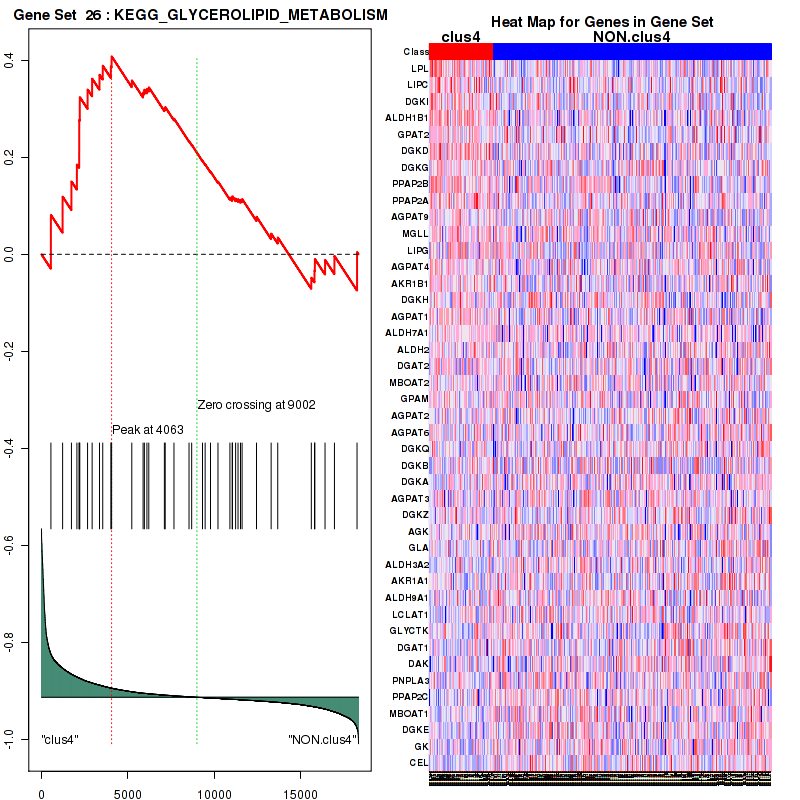
Figure S70. Get High-res Image For the top 5 core enriched genes in the pathway: KEGG GLYCEROLIPID METABOLISM, this volcano plot shows how much they are up/down-regulated and significant. The significance was calculated by empirical bayesian fit

Table S36. Get Full Table This table shows a Running Enrichment Score (RES) of each gene in this pathway, that is, the enrichment score at this point in the ranked list of genes. All genes are ranked by Signal-to-Noise (S2N), a measure of similarity as default and are used to obtain ES matrix of all genes. In this way, GSEA tool uses expression pattern of not only overlapped genes but also not-overlapped genes to produce ES matrix.
| Rank | GENE | SYMBOL | DESC | LIST.LOC | S2N | RES | CORE_ENRICHMENT |
|---|---|---|---|---|---|---|---|
| 1 | MYLPF | MYLPF | MYLPF | 49 | 1.4 | 0.21 | YES |
| 2 | MEF2C | MEF2C | MEF2C | 208 | 0.76 | 0.32 | YES |
| 3 | EGF | EGF | EGF | 323 | 0.56 | 0.4 | YES |
| 4 | F2RL2 | F2RL2 | F2RL2 | 439 | 0.47 | 0.46 | YES |
| 5 | CHN2 | CHN2 | CHN2 | 732 | 0.36 | 0.5 | YES |
| 6 | PIK3R1 | PIK3R1 | PIK3R1 | 2109 | 0.19 | 0.46 | NO |
| 7 | PRKCA | PRKCA | PRKCA | 2649 | 0.15 | 0.45 | NO |
| 8 | PIK3CD | PIK3CD | PIK3CD | 3369 | 0.12 | 0.43 | NO |
| 9 | EPS8 | EPS8 | EPS8 | 3680 | 0.1 | 0.43 | NO |
| 10 | STAT1 | STAT1 | STAT1 | 3976 | 0.091 | 0.43 | NO |
| 11 | DUSP6 | DUSP6 | DUSP6 | 4412 | 0.076 | 0.42 | NO |
| 12 | MAP3K2 | MAP3K2 | MAP3K2 | 4446 | 0.075 | 0.43 | NO |
| 13 | CYFIP2 | CYFIP2 | CYFIP2 | 4581 | 0.071 | 0.43 | NO |
| 14 | ATF2 | ATF2 | ATF2 | 4836 | 0.064 | 0.42 | NO |
| 15 | ARPC1B | ARPC1B | ARPC1B | 4871 | 0.063 | 0.43 | NO |
| 16 | GAB1 | GAB1 | GAB1 | 5317 | 0.052 | 0.42 | NO |
| 17 | VAV2 | VAV2 | VAV2 | 5406 | 0.049 | 0.42 | NO |
| 18 | RICTOR | RICTOR | RICTOR | 5453 | 0.048 | 0.42 | NO |
| 19 | MAP3K1 | MAP3K1 | MAP3K1 | 5748 | 0.042 | 0.42 | NO |
| 20 | MTOR | MTOR | MTOR | 5870 | 0.04 | 0.41 | NO |
| 21 | EGFR | EGFR | EGFR | 6109 | 0.036 | 0.41 | NO |
| 22 | RIN1 | RIN1 | RIN1 | 6152 | 0.035 | 0.41 | NO |
| 23 | MAPK8 | MAPK8 | MAPK8 | 6171 | 0.035 | 0.41 | NO |
| 24 | SRC | SRC | SRC | 6226 | 0.034 | 0.42 | NO |
| 25 | YWHAG | YWHAG | YWHAG | 6342 | 0.032 | 0.42 | NO |
| 26 | IQGAP1 | IQGAP1 | IQGAP1 | 6550 | 0.029 | 0.41 | NO |
| 27 | RPS6KA4 | RPS6KA4 | RPS6KA4 | 6556 | 0.029 | 0.41 | NO |
| 28 | YWHAH | YWHAH | YWHAH | 6621 | 0.028 | 0.41 | NO |
| 29 | PDPK1 | PDPK1 | PDPK1 | 6876 | 0.025 | 0.4 | NO |
| 30 | SOS1 | SOS1 | SOS1 | 6914 | 0.024 | 0.4 | NO |
| 31 | ARF4 | ARF4 | ARF4 | 7004 | 0.023 | 0.4 | NO |
| 32 | PIK3CA | PIK3CA | PIK3CA | 7181 | 0.02 | 0.4 | NO |
| 33 | YWHAZ | YWHAZ | YWHAZ | 7204 | 0.02 | 0.4 | NO |
| 34 | MAPK1 | MAPK1 | MAPK1 | 7233 | 0.02 | 0.4 | NO |
| 35 | CAPN2 | CAPN2 | CAPN2 | 7287 | 0.019 | 0.4 | NO |
| 36 | CREB1 | CREB1 | CREB1 | 7337 | 0.018 | 0.4 | NO |
| 37 | SRF | SRF | SRF | 7430 | 0.018 | 0.4 | NO |
| 38 | SMAD1 | SMAD1 | SMAD1 | 7460 | 0.017 | 0.4 | NO |
| 39 | NCKAP1 | NCKAP1 | NCKAP1 | 7527 | 0.016 | 0.4 | NO |
| 40 | JUN | JUN | JUN | 7587 | 0.016 | 0.4 | NO |
| 41 | ATF1 | ATF1 | ATF1 | 7708 | 0.014 | 0.39 | NO |
| 42 | NRAS | NRAS | NRAS | 7718 | 0.014 | 0.4 | NO |
| 43 | ACTR2 | ACTR2 | ACTR2 | 7833 | 0.012 | 0.39 | NO |
| 44 | ARPC2 | ARPC2 | ARPC2 | 7899 | 0.012 | 0.39 | NO |
| 45 | SH2D2A | SH2D2A | SH2D2A | 8001 | 0.011 | 0.38 | NO |
| 46 | YWHAB | YWHAB | YWHAB | 8016 | 0.01 | 0.39 | NO |
| 47 | SFN | SFN | SFN | 8022 | 0.01 | 0.39 | NO |
| 48 | MAP2K4 | MAP2K4 | MAP2K4 | 8151 | 0.0091 | 0.38 | NO |
| 49 | AKT1 | AKT1 | AKT1 | 8190 | 0.0086 | 0.38 | NO |
| 50 | RALA | RALA | RALA | 8306 | 0.0072 | 0.38 | NO |
| 51 | SLC9A1 | SLC9A1 | SLC9A1 | 8485 | 0.0051 | 0.37 | NO |
| 52 | EGR1 | EGR1 | EGR1 | 8547 | 0.0045 | 0.36 | NO |
| 53 | ACTR3 | ACTR3 | ACTR3 | 8614 | 0.0039 | 0.36 | NO |
| 54 | STAT3 | STAT3 | STAT3 | 8748 | 0.0027 | 0.36 | NO |
| 55 | RPS6KA3 | RPS6KA3 | RPS6KA3 | 8749 | 0.0027 | 0.36 | NO |
| 56 | PLD1 | PLD1 | PLD1 | 8889 | 0.0012 | 0.35 | NO |
| 57 | RPS6KA5 | RPS6KA5 | RPS6KA5 | 8924 | 0.00079 | 0.35 | NO |
| 58 | GRB2 | GRB2 | GRB2 | 9018 | -0.00015 | 0.34 | NO |
| 59 | WASL | WASL | WASL | 9128 | -0.0012 | 0.34 | NO |
| 60 | MAPK7 | MAPK7 | MAPK7 | 9174 | -0.0017 | 0.33 | NO |
| 61 | YWHAQ | YWHAQ | YWHAQ | 9215 | -0.0021 | 0.33 | NO |
| 62 | ELK1 | ELK1 | ELK1 | 9238 | -0.0023 | 0.33 | NO |
| 63 | CDC42 | CDC42 | CDC42 | 9447 | -0.0042 | 0.32 | NO |
| 64 | ARPC4 | ARPC4 | ARPC4 | 9454 | -0.0043 | 0.32 | NO |
| 65 | MAPKAP1 | MAPKAP1 | MAPKAP1 | 9497 | -0.0047 | 0.32 | NO |
| 66 | KSR1 | KSR1 | KSR1 | 9735 | -0.0071 | 0.31 | NO |
| 67 | PPP2R1A | PPP2R1A | PPP2R1A | 9776 | -0.0074 | 0.3 | NO |
| 68 | FOS | FOS | FOS | 9816 | -0.0078 | 0.3 | NO |
| 69 | KRAS | KRAS | KRAS | 10060 | -0.01 | 0.29 | NO |
| 70 | PIK3R2 | PIK3R2 | PIK3R2 | 10143 | -0.011 | 0.29 | NO |
| 71 | MAP2K1 | MAP2K1 | MAP2K1 | 10189 | -0.011 | 0.29 | NO |
| 72 | RAF1 | RAF1 | RAF1 | 10240 | -0.012 | 0.29 | NO |
| 73 | HRAS | HRAS | HRAS | 10288 | -0.012 | 0.29 | NO |
| 74 | WASF2 | WASF2 | WASF2 | 10628 | -0.016 | 0.27 | NO |
| 75 | PLD2 | PLD2 | PLD2 | 10636 | -0.016 | 0.27 | NO |
| 76 | MAPK9 | MAPK9 | MAPK9 | 10639 | -0.016 | 0.28 | NO |
| 77 | MAP2K5 | MAP2K5 | MAP2K5 | 10670 | -0.016 | 0.28 | NO |
| 78 | YWHAE | YWHAE | YWHAE | 10973 | -0.019 | 0.26 | NO |
| 79 | ABI1 | ABI1 | ABI1 | 10992 | -0.019 | 0.26 | NO |
| 80 | PPP2CA | PPP2CA | PPP2CA | 11056 | -0.02 | 0.26 | NO |
| 81 | BCL2L1 | BCL2L1 | BCL2L1 | 11060 | -0.02 | 0.27 | NO |
| 82 | MAP2K2 | MAP2K2 | MAP2K2 | 11179 | -0.021 | 0.26 | NO |
| 83 | PPP5C | PPP5C | PPP5C | 11448 | -0.023 | 0.25 | NO |
| 84 | PIK3CB | PIK3CB | PIK3CB | 11583 | -0.025 | 0.25 | NO |
| 85 | ARPC5 | ARPC5 | ARPC5 | 11661 | -0.026 | 0.25 | NO |
| 86 | RAB5A | RAB5A | RAB5A | 11669 | -0.026 | 0.25 | NO |
| 87 | MAPK3 | MAPK3 | MAPK3 | 11690 | -0.026 | 0.26 | NO |
| 88 | PEBP1 | PEBP1 | PEBP1 | 11785 | -0.027 | 0.26 | NO |
| 89 | RAC1 | RAC1 | RAC1 | 11884 | -0.028 | 0.25 | NO |
| 90 | PRKCD | PRKCD | PRKCD | 11992 | -0.029 | 0.25 | NO |
| 91 | ARPC3 | ARPC3 | ARPC3 | 12033 | -0.029 | 0.25 | NO |
| 92 | ZFP36 | ZFP36 | ZFP36 | 12123 | -0.03 | 0.25 | NO |
| 93 | BAD | BAD | BAD | 12361 | -0.033 | 0.25 | NO |
| 94 | MLST8 | MLST8 | MLST8 | 12483 | -0.034 | 0.24 | NO |
| 95 | DIAPH3 | DIAPH3 | DIAPH3 | 12501 | -0.034 | 0.25 | NO |
| 96 | PIK3R3 | PIK3R3 | PIK3R3 | 12662 | -0.036 | 0.25 | NO |
| 97 | BAIAP2 | BAIAP2 | BAIAP2 | 12843 | -0.038 | 0.24 | NO |
| 98 | BRAF | BRAF | BRAF | 13102 | -0.041 | 0.23 | NO |
| 99 | RPS6 | RPS6 | RPS6 | 13588 | -0.047 | 0.22 | NO |
| 100 | RALGDS | RALGDS | RALGDS | 13722 | -0.049 | 0.22 | NO |
| 101 | PPP2R2A | PPP2R2A | PPP2R2A | 13801 | -0.05 | 0.22 | NO |
| 102 | DUSP1 | DUSP1 | DUSP1 | 14270 | -0.058 | 0.2 | NO |
| 103 | PRKCZ | PRKCZ | PRKCZ | 14592 | -0.064 | 0.2 | NO |
| 104 | USP6NL | USP6NL | USP6NL | 15205 | -0.076 | 0.17 | NO |
Figure S71. Get High-res Image This plot shows mRNAseq_cNMF expression data heatmap (on the left) a RunningEnrichmentScore(RES) plot (on the top right) and a Signal2Noise(S2N) plot (on the bottom right) of genes in the pathway: KEGG INOSITOL PHOSPHATE METABOLISM.
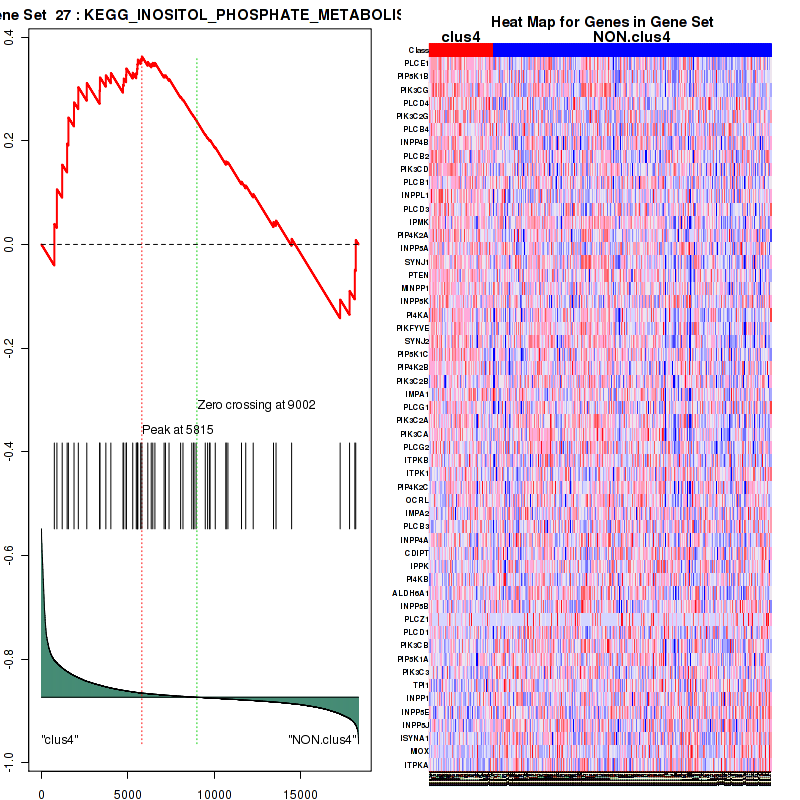
Figure S72. Get High-res Image For the top 5 core enriched genes in the pathway: KEGG INOSITOL PHOSPHATE METABOLISM, this volcano plot shows how much they are up/down-regulated and significant. The significance was calculated by empirical bayesian fit

Table S37. Get Full Table This table shows a Running Enrichment Score (RES) of each gene in this pathway, that is, the enrichment score at this point in the ranked list of genes. All genes are ranked by Signal-to-Noise (S2N), a measure of similarity as default and are used to obtain ES matrix of all genes. In this way, GSEA tool uses expression pattern of not only overlapped genes but also not-overlapped genes to produce ES matrix.
| Rank | GENE | SYMBOL | DESC | LIST.LOC | S2N | RES | CORE_ENRICHMENT |
|---|---|---|---|---|---|---|---|
| 1 | PPP1R3A | PPP1R3A | PPP1R3A | 19 | 1.5 | 0.094 | YES |
| 2 | PRKAG3 | PRKAG3 | PRKAG3 | 53 | 1.4 | 0.18 | YES |
| 3 | PHKG1 | PHKG1 | PHKG1 | 133 | 1 | 0.24 | YES |
| 4 | PYGM | PYGM | PYGM | 134 | 1 | 0.3 | YES |
| 5 | PRKAA2 | PRKAA2 | PRKAA2 | 280 | 0.61 | 0.34 | YES |
| 6 | SORBS1 | SORBS1 | SORBS1 | 283 | 0.61 | 0.37 | YES |
| 7 | FBP2 | FBP2 | FBP2 | 356 | 0.54 | 0.4 | YES |
| 8 | PPARGC1A | PPARGC1A | PPARGC1A | 386 | 0.51 | 0.43 | YES |
| 9 | SLC2A4 | SLC2A4 | SLC2A4 | 423 | 0.48 | 0.46 | YES |
| 10 | PPP1R3C | PPP1R3C | PPP1R3C | 502 | 0.44 | 0.49 | YES |
| 11 | ACACB | ACACB | ACACB | 767 | 0.35 | 0.5 | YES |
| 12 | PDE3A | PDE3A | PDE3A | 774 | 0.35 | 0.52 | YES |
| 13 | HK3 | HK3 | HK3 | 1184 | 0.29 | 0.51 | YES |
| 14 | PIK3CG | PIK3CG | PIK3CG | 1200 | 0.28 | 0.53 | YES |
| 15 | PIK3R5 | PIK3R5 | PIK3R5 | 1873 | 0.21 | 0.51 | YES |
| 16 | PIK3R1 | PIK3R1 | PIK3R1 | 2109 | 0.19 | 0.51 | YES |
| 17 | SHC3 | SHC3 | SHC3 | 2158 | 0.19 | 0.52 | YES |
| 18 | SHC2 | SHC2 | SHC2 | 2259 | 0.18 | 0.52 | YES |
| 19 | IRS1 | IRS1 | IRS1 | 2411 | 0.17 | 0.52 | YES |
| 20 | SH2B2 | SH2B2 | SH2B2 | 2729 | 0.15 | 0.52 | YES |
| 21 | PRKAR2B | PRKAR2B | PRKAR2B | 2747 | 0.15 | 0.52 | YES |
| 22 | AKT3 | AKT3 | AKT3 | 2790 | 0.15 | 0.53 | YES |
| 23 | FBP1 | FBP1 | FBP1 | 2945 | 0.14 | 0.53 | YES |
| 24 | PRKAB2 | PRKAB2 | PRKAB2 | 2997 | 0.14 | 0.54 | YES |
| 25 | FOXO1 | FOXO1 | FOXO1 | 3182 | 0.13 | 0.54 | YES |
| 26 | PIK3CD | PIK3CD | PIK3CD | 3369 | 0.12 | 0.53 | YES |
| 27 | CBLB | CBLB | CBLB | 3477 | 0.11 | 0.53 | YES |
| 28 | SHC4 | SHC4 | SHC4 | 3497 | 0.11 | 0.54 | YES |
| 29 | RAPGEF1 | RAPGEF1 | RAPGEF1 | 3522 | 0.11 | 0.55 | YES |
| 30 | RHOQ | RHOQ | RHOQ | 3565 | 0.11 | 0.55 | YES |
| 31 | PRKACB | PRKACB | PRKACB | 3921 | 0.093 | 0.54 | NO |
| 32 | PRKAR2A | PRKAR2A | PRKAR2A | 3928 | 0.093 | 0.54 | NO |
| 33 | PCK1 | PCK1 | PCK1 | 4345 | 0.078 | 0.52 | NO |
| 34 | PHKA1 | PHKA1 | PHKA1 | 4377 | 0.077 | 0.53 | NO |
| 35 | INSR | INSR | INSR | 4414 | 0.076 | 0.53 | NO |
| 36 | IRS2 | IRS2 | IRS2 | 4645 | 0.069 | 0.52 | NO |
| 37 | INPP5D | INPP5D | INPP5D | 5203 | 0.054 | 0.5 | NO |
| 38 | PYGL | PYGL | PYGL | 5326 | 0.051 | 0.49 | NO |
| 39 | SOS2 | SOS2 | SOS2 | 5432 | 0.048 | 0.49 | NO |
| 40 | PRKACA | PRKACA | PRKACA | 5448 | 0.048 | 0.49 | NO |
| 41 | GYS2 | GYS2 | GYS2 | 5510 | 0.047 | 0.49 | NO |
| 42 | SOCS4 | SOCS4 | SOCS4 | 5513 | 0.047 | 0.49 | NO |
| 43 | INPP5K | INPP5K | INPP5K | 5540 | 0.046 | 0.5 | NO |
| 44 | CRK | CRK | CRK | 5558 | 0.046 | 0.5 | NO |
| 45 | CALML6 | CALML6 | CALML6 | 5697 | 0.043 | 0.49 | NO |
| 46 | CBL | CBL | CBL | 5706 | 0.043 | 0.49 | NO |
| 47 | CALM1 | CALM1 | CALM1 | 5813 | 0.041 | 0.49 | NO |
| 48 | MTOR | MTOR | MTOR | 5870 | 0.04 | 0.49 | NO |
| 49 | SOCS2 | SOCS2 | SOCS2 | 5902 | 0.039 | 0.49 | NO |
| 50 | PRKAR1A | PRKAR1A | PRKAR1A | 6019 | 0.037 | 0.49 | NO |
| 51 | SOCS3 | SOCS3 | SOCS3 | 6036 | 0.037 | 0.49 | NO |
| 52 | GYS1 | GYS1 | GYS1 | 6100 | 0.036 | 0.49 | NO |
| 53 | MAPK8 | MAPK8 | MAPK8 | 6171 | 0.035 | 0.49 | NO |
| 54 | ARAF | ARAF | ARAF | 6346 | 0.032 | 0.48 | NO |
| 55 | PYGB | PYGB | PYGB | 6355 | 0.032 | 0.48 | NO |
| 56 | FLOT1 | FLOT1 | FLOT1 | 6732 | 0.027 | 0.46 | NO |
| 57 | PHKB | PHKB | PHKB | 6734 | 0.027 | 0.46 | NO |
| 58 | SHC1 | SHC1 | SHC1 | 6804 | 0.026 | 0.46 | NO |
| 59 | HK1 | HK1 | HK1 | 6831 | 0.025 | 0.46 | NO |
| 60 | PDPK1 | PDPK1 | PDPK1 | 6876 | 0.025 | 0.46 | NO |
| 61 | SOS1 | SOS1 | SOS1 | 6914 | 0.024 | 0.46 | NO |
| 62 | CALML3 | CALML3 | CALML3 | 7077 | 0.022 | 0.45 | NO |
| 63 | PRKAA1 | PRKAA1 | PRKAA1 | 7130 | 0.021 | 0.45 | NO |
| 64 | PIK3CA | PIK3CA | PIK3CA | 7181 | 0.02 | 0.45 | NO |
| 65 | MAPK1 | MAPK1 | MAPK1 | 7233 | 0.02 | 0.45 | NO |
| 66 | PTPN1 | PTPN1 | PTPN1 | 7238 | 0.02 | 0.45 | NO |
| 67 | GSK3B | GSK3B | GSK3B | 7370 | 0.018 | 0.44 | NO |
| 68 | RPTOR | RPTOR | RPTOR | 7448 | 0.017 | 0.44 | NO |
| 69 | NRAS | NRAS | NRAS | 7718 | 0.014 | 0.43 | NO |
| 70 | EIF4E2 | EIF4E2 | EIF4E2 | 7923 | 0.012 | 0.42 | NO |
| 71 | AKT2 | AKT2 | AKT2 | 7952 | 0.011 | 0.41 | NO |
| 72 | AKT1 | AKT1 | AKT1 | 8190 | 0.0086 | 0.4 | NO |
| 73 | PRKAG1 | PRKAG1 | PRKAG1 | 8584 | 0.0042 | 0.38 | NO |
| 74 | PRKAG2 | PRKAG2 | PRKAG2 | 8622 | 0.0038 | 0.38 | NO |
| 75 | EXOC7 | EXOC7 | EXOC7 | 8815 | 0.0019 | 0.37 | NO |
| 76 | MKNK1 | MKNK1 | MKNK1 | 8818 | 0.0019 | 0.37 | NO |
| 77 | PPP1CA | PPP1CA | PPP1CA | 8835 | 0.0017 | 0.37 | NO |
| 78 | IKBKB | IKBKB | IKBKB | 8906 | 0.001 | 0.36 | NO |
| 79 | GRB2 | GRB2 | GRB2 | 9018 | -0.00015 | 0.36 | NO |
| 80 | CRKL | CRKL | CRKL | 9038 | -0.0003 | 0.36 | NO |
| 81 | TSC2 | TSC2 | TSC2 | 9158 | -0.0015 | 0.35 | NO |
| 82 | ELK1 | ELK1 | ELK1 | 9238 | -0.0023 | 0.35 | NO |
| 83 | PPP1CB | PPP1CB | PPP1CB | 9450 | -0.0042 | 0.34 | NO |
| 84 | RHEB | RHEB | RHEB | 9538 | -0.0051 | 0.33 | NO |
| 85 | TSC1 | TSC1 | TSC1 | 9555 | -0.0053 | 0.33 | NO |
| 86 | PTPRF | PTPRF | PTPRF | 9872 | -0.0084 | 0.31 | NO |
| 87 | PPP1R3B | PPP1R3B | PPP1R3B | 9980 | -0.0094 | 0.31 | NO |
| 88 | KRAS | KRAS | KRAS | 10060 | -0.01 | 0.3 | NO |
| 89 | CALM3 | CALM3 | CALM3 | 10112 | -0.011 | 0.3 | NO |
| 90 | PIK3R2 | PIK3R2 | PIK3R2 | 10143 | -0.011 | 0.3 | NO |
| 91 | MAP2K1 | MAP2K1 | MAP2K1 | 10189 | -0.011 | 0.3 | NO |
| 92 | RAF1 | RAF1 | RAF1 | 10240 | -0.012 | 0.3 | NO |
| 93 | HRAS | HRAS | HRAS | 10288 | -0.012 | 0.3 | NO |
| 94 | RPS6KB2 | RPS6KB2 | RPS6KB2 | 10532 | -0.015 | 0.28 | NO |
| 95 | MAPK9 | MAPK9 | MAPK9 | 10639 | -0.016 | 0.28 | NO |
| 96 | RPS6KB1 | RPS6KB1 | RPS6KB1 | 10955 | -0.019 | 0.26 | NO |
| 97 | PPP1CC | PPP1CC | PPP1CC | 11114 | -0.02 | 0.26 | NO |
| 98 | PKLR | PKLR | PKLR | 11120 | -0.02 | 0.26 | NO |
| 99 | MAP2K2 | MAP2K2 | MAP2K2 | 11179 | -0.021 | 0.25 | NO |
| 100 | PIK3CB | PIK3CB | PIK3CB | 11583 | -0.025 | 0.23 | NO |
| 101 | MAPK3 | MAPK3 | MAPK3 | 11690 | -0.026 | 0.23 | NO |
| 102 | CALM2 | CALM2 | CALM2 | 11748 | -0.026 | 0.23 | NO |
| 103 | PDE3B | PDE3B | PDE3B | 12049 | -0.03 | 0.21 | NO |
| 104 | PRKAB1 | PRKAB1 | PRKAB1 | 12224 | -0.031 | 0.2 | NO |
| 105 | BAD | BAD | BAD | 12361 | -0.033 | 0.2 | NO |
| 106 | SOCS1 | SOCS1 | SOCS1 | 12370 | -0.033 | 0.2 | NO |
| 107 | PRKCI | PRKCI | PRKCI | 12639 | -0.036 | 0.19 | NO |
| 108 | PIK3R3 | PIK3R3 | PIK3R3 | 12662 | -0.036 | 0.19 | NO |
| 109 | FLOT2 | FLOT2 | FLOT2 | 12669 | -0.036 | 0.19 | NO |
| 110 | TRIP10 | TRIP10 | TRIP10 | 12761 | -0.037 | 0.19 | NO |
| 111 | ACACA | ACACA | ACACA | 12935 | -0.039 | 0.18 | NO |
| 112 | BRAF | BRAF | BRAF | 13102 | -0.041 | 0.18 | NO |
| 113 | EIF4E | EIF4E | EIF4E | 13167 | -0.042 | 0.18 | NO |
| 114 | RPS6 | RPS6 | RPS6 | 13588 | -0.047 | 0.16 | NO |
| 115 | HK2 | HK2 | HK2 | 13726 | -0.049 | 0.15 | NO |
| 116 | PHKA2 | PHKA2 | PHKA2 | 13814 | -0.05 | 0.15 | NO |
| 117 | PCK2 | PCK2 | PCK2 | 14235 | -0.057 | 0.13 | NO |
| 118 | FASN | FASN | FASN | 14430 | -0.061 | 0.12 | NO |
| 119 | PRKCZ | PRKCZ | PRKCZ | 14592 | -0.064 | 0.12 | NO |
| 120 | MKNK2 | MKNK2 | MKNK2 | 14842 | -0.068 | 0.11 | NO |
| 121 | PHKG2 | PHKG2 | PHKG2 | 14874 | -0.068 | 0.11 | NO |
| 122 | PPP1R3D | PPP1R3D | PPP1R3D | 15009 | -0.071 | 0.11 | NO |
| 123 | SREBF1 | SREBF1 | SREBF1 | 15153 | -0.075 | 0.11 | NO |
| 124 | LIPE | LIPE | LIPE | 15182 | -0.076 | 0.11 | NO |
| 125 | CALML5 | CALML5 | CALML5 | 15314 | -0.079 | 0.11 | NO |
| 126 | EIF4EBP1 | EIF4EBP1 | EIF4EBP1 | 15371 | -0.081 | 0.11 | NO |
| 127 | PRKAR1B | PRKAR1B | PRKAR1B | 15835 | -0.094 | 0.09 | NO |
| 128 | PRKX | PRKX | PRKX | 16528 | -0.12 | 0.059 | NO |
| 129 | CBLC | CBLC | CBLC | 16725 | -0.13 | 0.057 | NO |
| 130 | GCK | GCK | GCK | 17189 | -0.16 | 0.041 | NO |
| 131 | MAPK10 | MAPK10 | MAPK10 | 17343 | -0.17 | 0.043 | NO |
| 132 | IRS4 | IRS4 | IRS4 | 17738 | -0.2 | 0.034 | NO |
Figure S73. Get High-res Image This plot shows mRNAseq_cNMF expression data heatmap (on the left) a RunningEnrichmentScore(RES) plot (on the top right) and a Signal2Noise(S2N) plot (on the bottom right) of genes in the pathway: KEGG GLYCEROPHOSPHOLIPID METABOLISM.
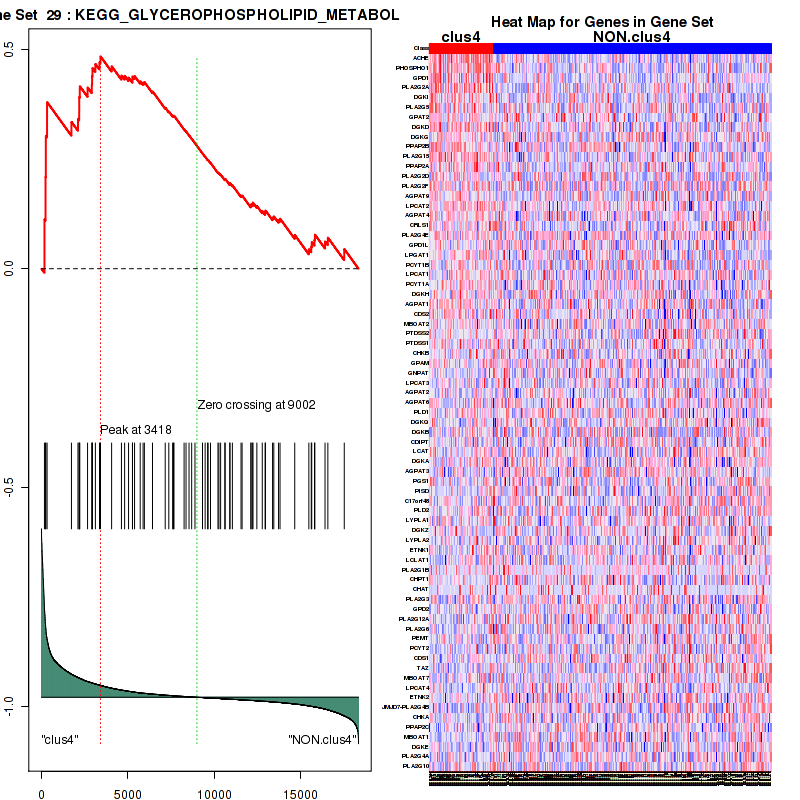
Figure S74. Get High-res Image For the top 5 core enriched genes in the pathway: KEGG GLYCEROPHOSPHOLIPID METABOLISM, this volcano plot shows how much they are up/down-regulated and significant. The significance was calculated by empirical bayesian fit
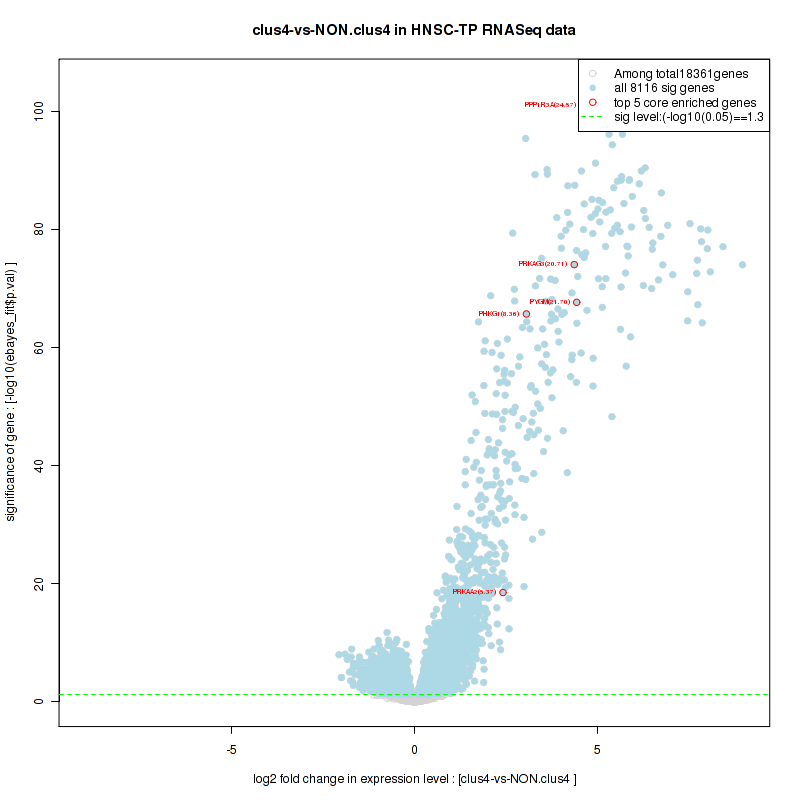
Table S38. Get Full Table This table shows a Running Enrichment Score (RES) of each gene in this pathway, that is, the enrichment score at this point in the ranked list of genes. All genes are ranked by Signal-to-Noise (S2N), a measure of similarity as default and are used to obtain ES matrix of all genes. In this way, GSEA tool uses expression pattern of not only overlapped genes but also not-overlapped genes to produce ES matrix.
| Rank | GENE | SYMBOL | DESC | LIST.LOC | S2N | RES | CORE_ENRICHMENT |
|---|---|---|---|---|---|---|---|
| 1 | MYL2 | MYL2 | MYL2 | 33 | 1.4 | 0.38 | YES |
| 2 | ARHGAP6 | ARHGAP6 | ARHGAP6 | 422 | 0.48 | 0.49 | YES |
| 3 | PIP5K1B | PIP5K1B | PIP5K1B | 894 | 0.33 | 0.56 | YES |
| 4 | PPP1R12B | PPP1R12B | PPP1R12B | 1341 | 0.27 | 0.61 | YES |
| 5 | MYLK | MYLK | MYLK | 2148 | 0.19 | 0.61 | YES |
| 6 | TLN1 | TLN1 | TLN1 | 3448 | 0.11 | 0.57 | NO |
| 7 | GSN | GSN | GSN | 4496 | 0.074 | 0.54 | NO |
| 8 | ARHGAP1 | ARHGAP1 | ARHGAP1 | 4647 | 0.069 | 0.55 | NO |
| 9 | OPHN1 | OPHN1 | OPHN1 | 4692 | 0.068 | 0.56 | NO |
| 10 | VCL | VCL | VCL | 4757 | 0.066 | 0.58 | NO |
| 11 | ARPC1B | ARPC1B | ARPC1B | 4871 | 0.063 | 0.59 | NO |
| 12 | LIMK1 | LIMK1 | LIMK1 | 4983 | 0.06 | 0.6 | NO |
| 13 | ROCK1 | ROCK1 | ROCK1 | 5631 | 0.044 | 0.58 | NO |
| 14 | SRC | SRC | SRC | 6226 | 0.034 | 0.55 | NO |
| 15 | ARHGAP5 | ARHGAP5 | ARHGAP5 | 6828 | 0.025 | 0.53 | NO |
| 16 | DIAPH1 | DIAPH1 | DIAPH1 | 7239 | 0.02 | 0.51 | NO |
| 17 | CFL1 | CFL1 | CFL1 | 7681 | 0.015 | 0.49 | NO |
| 18 | PFN1 | PFN1 | PFN1 | 7693 | 0.014 | 0.49 | NO |
| 19 | RHOA | RHOA | RHOA | 7750 | 0.014 | 0.49 | NO |
| 20 | ACTR2 | ACTR2 | ACTR2 | 7833 | 0.012 | 0.49 | NO |
| 21 | ARPC2 | ARPC2 | ARPC2 | 7899 | 0.012 | 0.49 | NO |
| 22 | ARHGEF1 | ARHGEF1 | ARHGEF1 | 7928 | 0.011 | 0.49 | NO |
| 23 | ACTR3 | ACTR3 | ACTR3 | 8614 | 0.0039 | 0.46 | NO |
| 24 | ARHGEF11 | ARHGEF11 | ARHGEF11 | 8866 | 0.0014 | 0.44 | NO |
| 25 | ARPC4 | ARPC4 | ARPC4 | 9454 | -0.0043 | 0.41 | NO |
| 26 | ARPC1A | ARPC1A | ARPC1A | 11495 | -0.024 | 0.31 | NO |
| 27 | ARPC5 | ARPC5 | ARPC5 | 11661 | -0.026 | 0.31 | NO |
| 28 | PIP5K1A | PIP5K1A | PIP5K1A | 11830 | -0.027 | 0.3 | NO |
| 29 | ARPC3 | ARPC3 | ARPC3 | 12033 | -0.029 | 0.3 | NO |
| 30 | BAIAP2 | BAIAP2 | BAIAP2 | 12843 | -0.038 | 0.27 | NO |
| 31 | ARHGEF5 | ARHGEF5 | ARHGEF5 | 13797 | -0.05 | 0.23 | NO |
| 32 | ARHGAP4 | ARHGAP4 | ARHGAP4 | 14840 | -0.068 | 0.19 | NO |
Figure S75. Get High-res Image This plot shows mRNAseq_cNMF expression data heatmap (on the left) a RunningEnrichmentScore(RES) plot (on the top right) and a Signal2Noise(S2N) plot (on the bottom right) of genes in the pathway: KEGG ETHER LIPID METABOLISM.
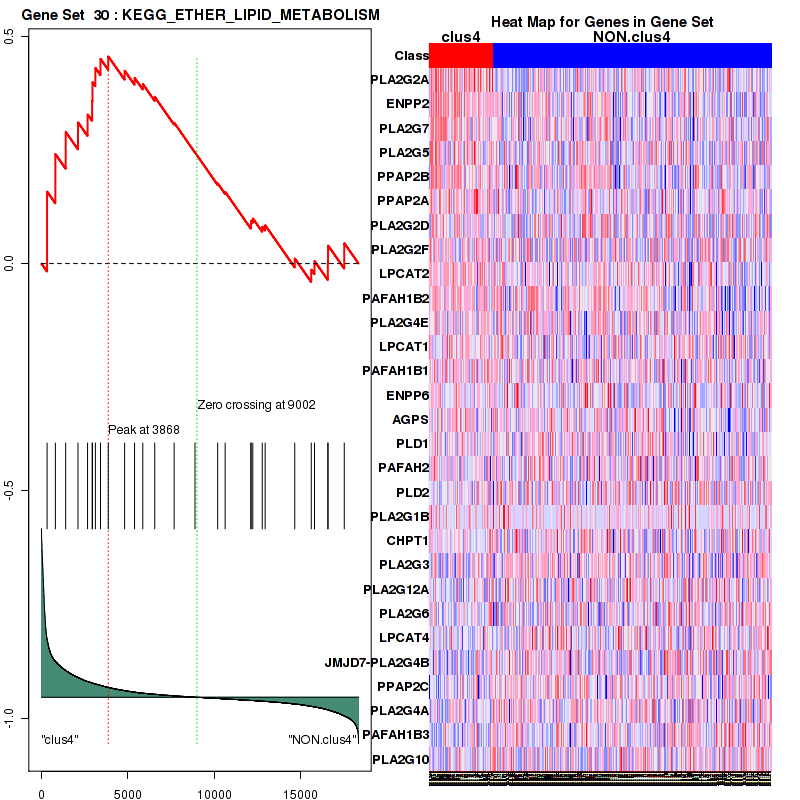
Figure S76. Get High-res Image For the top 5 core enriched genes in the pathway: KEGG ETHER LIPID METABOLISM, this volcano plot shows how much they are up/down-regulated and significant. The significance was calculated by empirical bayesian fit
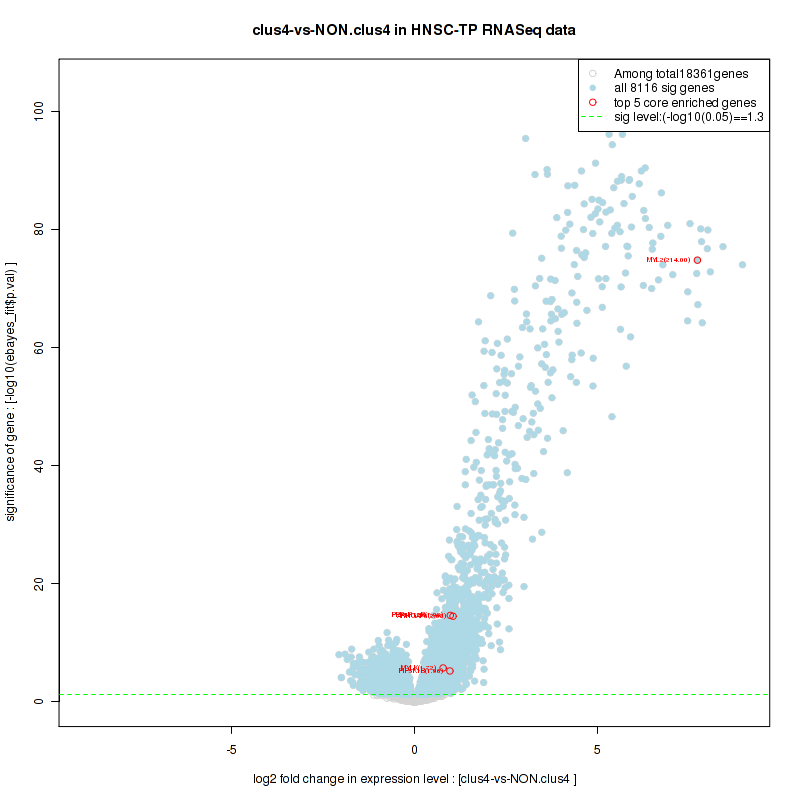
Table S39. Get Full Table This table shows a Running Enrichment Score (RES) of each gene in this pathway, that is, the enrichment score at this point in the ranked list of genes. All genes are ranked by Signal-to-Noise (S2N), a measure of similarity as default and are used to obtain ES matrix of all genes. In this way, GSEA tool uses expression pattern of not only overlapped genes but also not-overlapped genes to produce ES matrix.
| Rank | GENE | SYMBOL | DESC | LIST.LOC | S2N | RES | CORE_ENRICHMENT |
|---|---|---|---|---|---|---|---|
| 1 | ENO3 | ENO3 | ENO3 | 109 | 1.1 | 0.14 | YES |
| 2 | PHKG1 | PHKG1 | PHKG1 | 133 | 1 | 0.28 | YES |
| 3 | PYGM | PYGM | PYGM | 134 | 1 | 0.42 | YES |
| 4 | PGAM2 | PGAM2 | PGAM2 | 218 | 0.73 | 0.51 | YES |
| 5 | FBP2 | FBP2 | FBP2 | 356 | 0.54 | 0.58 | YES |
| 6 | FBP1 | FBP1 | FBP1 | 2945 | 0.14 | 0.46 | NO |
| 7 | PFKM | PFKM | PFKM | 3084 | 0.13 | 0.47 | NO |
| 8 | PRKACB | PRKACB | PRKACB | 3921 | 0.093 | 0.43 | NO |
| 9 | GBE1 | GBE1 | GBE1 | 4002 | 0.09 | 0.44 | NO |
| 10 | GYG1 | GYG1 | GYG1 | 4339 | 0.079 | 0.43 | NO |
| 11 | PCK1 | PCK1 | PCK1 | 4345 | 0.078 | 0.44 | NO |
| 12 | PHKA1 | PHKA1 | PHKA1 | 4377 | 0.077 | 0.45 | NO |
| 13 | AGL | AGL | AGL | 4688 | 0.068 | 0.44 | NO |
| 14 | GYG2 | GYG2 | GYG2 | 4790 | 0.065 | 0.45 | NO |
| 15 | PFKFB1 | PFKFB1 | PFKFB1 | 4943 | 0.061 | 0.45 | NO |
| 16 | PGM1 | PGM1 | PGM1 | 5265 | 0.053 | 0.44 | NO |
| 17 | PYGL | PYGL | PYGL | 5326 | 0.051 | 0.44 | NO |
| 18 | PRKACA | PRKACA | PRKACA | 5448 | 0.048 | 0.44 | NO |
| 19 | GYS2 | GYS2 | GYS2 | 5510 | 0.047 | 0.44 | NO |
| 20 | SLC25A12 | SLC25A12 | SLC25A12 | 5779 | 0.042 | 0.44 | NO |
| 21 | CALM1 | CALM1 | CALM1 | 5813 | 0.041 | 0.44 | NO |
| 22 | GYS1 | GYS1 | GYS1 | 6100 | 0.036 | 0.43 | NO |
| 23 | PYGB | PYGB | PYGB | 6355 | 0.032 | 0.42 | NO |
| 24 | PC | PC | PC | 6388 | 0.032 | 0.42 | NO |
| 25 | UGP2 | UGP2 | UGP2 | 6642 | 0.028 | 0.41 | NO |
| 26 | PHKB | PHKB | PHKB | 6734 | 0.027 | 0.41 | NO |
| 27 | PKM2 | PKM2 | PKM2 | 7220 | 0.02 | 0.39 | NO |
| 28 | PFKFB3 | PFKFB3 | PFKFB3 | 7565 | 0.016 | 0.37 | NO |
| 29 | PFKFB2 | PFKFB2 | PFKFB2 | 7663 | 0.015 | 0.37 | NO |
| 30 | PPP2R5D | PPP2R5D | PPP2R5D | 8304 | 0.0072 | 0.33 | NO |
| 31 | SLC25A11 | SLC25A11 | SLC25A11 | 8392 | 0.0062 | 0.33 | NO |
| 32 | PPP2R1B | PPP2R1B | PPP2R1B | 8777 | 0.0024 | 0.31 | NO |
| 33 | PPP2R1A | PPP2R1A | PPP2R1A | 9776 | -0.0074 | 0.25 | NO |
| 34 | PGAM1 | PGAM1 | PGAM1 | 9901 | -0.0086 | 0.25 | NO |
| 35 | GOT1 | GOT1 | GOT1 | 10030 | -0.0098 | 0.24 | NO |
| 36 | CALM3 | CALM3 | CALM3 | 10112 | -0.011 | 0.24 | NO |
| 37 | ENO1 | ENO1 | ENO1 | 10579 | -0.015 | 0.22 | NO |
| 38 | MDH2 | MDH2 | MDH2 | 10727 | -0.016 | 0.21 | NO |
| 39 | PPP2CA | PPP2CA | PPP2CA | 11056 | -0.02 | 0.2 | NO |
| 40 | PKLR | PKLR | PKLR | 11120 | -0.02 | 0.19 | NO |
| 41 | GAPDH | GAPDH | GAPDH | 11131 | -0.02 | 0.2 | NO |
| 42 | PGK1 | PGK1 | PGK1 | 11496 | -0.024 | 0.18 | NO |
| 43 | CALM2 | CALM2 | CALM2 | 11748 | -0.026 | 0.17 | NO |
| 44 | PPP2CB | PPP2CB | PPP2CB | 11782 | -0.027 | 0.17 | NO |
| 45 | ALDOA | ALDOA | ALDOA | 11857 | -0.028 | 0.17 | NO |
| 46 | GOT2 | GOT2 | GOT2 | 12195 | -0.031 | 0.16 | NO |
| 47 | PFKL | PFKL | PFKL | 12223 | -0.031 | 0.16 | NO |
| 48 | PFKP | PFKP | PFKP | 12821 | -0.038 | 0.13 | NO |
| 49 | SLC25A13 | SLC25A13 | SLC25A13 | 13180 | -0.042 | 0.12 | NO |
| 50 | MDH1 | MDH1 | MDH1 | 13359 | -0.044 | 0.11 | NO |
| 51 | GPI | GPI | GPI | 13391 | -0.045 | 0.12 | NO |
| 52 | TPI1 | TPI1 | TPI1 | 13439 | -0.045 | 0.12 | NO |
| 53 | PHKA2 | PHKA2 | PHKA2 | 13814 | -0.05 | 0.11 | NO |
| 54 | PGM2 | PGM2 | PGM2 | 13897 | -0.052 | 0.11 | NO |
| 55 | PCK2 | PCK2 | PCK2 | 14235 | -0.057 | 0.1 | NO |
| 56 | SLC25A1 | SLC25A1 | SLC25A1 | 14624 | -0.064 | 0.088 | NO |
| 57 | PHKG2 | PHKG2 | PHKG2 | 14874 | -0.068 | 0.084 | NO |
| 58 | PFKFB4 | PFKFB4 | PFKFB4 | 15742 | -0.091 | 0.049 | NO |
| 59 | SLC25A10 | SLC25A10 | SLC25A10 | 16387 | -0.11 | 0.029 | NO |
| 60 | ALDOB | ALDOB | ALDOB | 16467 | -0.12 | 0.04 | NO |
| 61 | ENO2 | ENO2 | ENO2 | 16638 | -0.12 | 0.048 | NO |
| 62 | GAPDHS | GAPDHS | GAPDHS | 17184 | -0.15 | 0.039 | NO |
| 63 | ALDOC | ALDOC | ALDOC | 17630 | -0.19 | 0.04 | NO |
Figure S77. Get High-res Image This plot shows mRNAseq_cNMF expression data heatmap (on the left) a RunningEnrichmentScore(RES) plot (on the top right) and a Signal2Noise(S2N) plot (on the bottom right) of genes in the pathway: KEGG ABC TRANSPORTERS.
Figure S78. Get High-res Image For the top 5 core enriched genes in the pathway: KEGG ABC TRANSPORTERS, this volcano plot shows how much they are up/down-regulated and significant. The significance was calculated by empirical bayesian fit
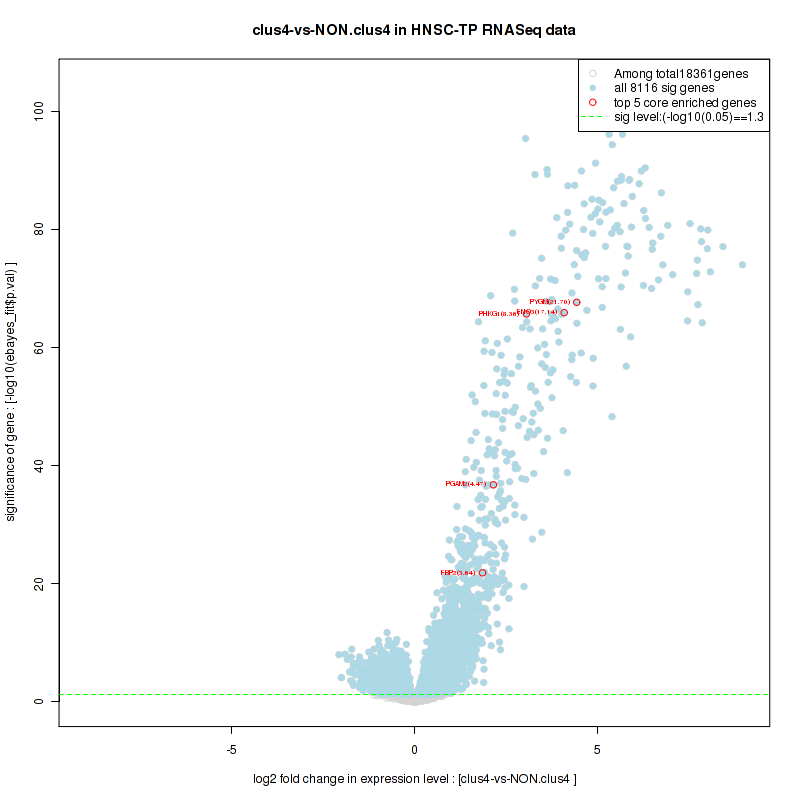
Table S40. Get Full Table This table shows a Running Enrichment Score (RES) of each gene in this pathway, that is, the enrichment score at this point in the ranked list of genes. All genes are ranked by Signal-to-Noise (S2N), a measure of similarity as default and are used to obtain ES matrix of all genes. In this way, GSEA tool uses expression pattern of not only overlapped genes but also not-overlapped genes to produce ES matrix.
| Rank | GENE | SYMBOL | DESC | LIST.LOC | S2N | RES | CORE_ENRICHMENT |
|---|---|---|---|---|---|---|---|
| 1 | MYH1 | MYH1 | MYH1 | 27 | 1.4 | 0.053 | YES |
| 2 | MYH8 | MYH8 | MYH8 | 31 | 1.4 | 0.11 | YES |
| 3 | ACTN2 | ACTN2 | ACTN2 | 32 | 1.4 | 0.16 | YES |
| 4 | MYL2 | MYL2 | MYL2 | 33 | 1.4 | 0.21 | YES |
| 5 | MYH7 | MYH7 | MYH7 | 45 | 1.4 | 0.26 | YES |
| 6 | MYH2 | MYH2 | MYH2 | 47 | 1.4 | 0.31 | YES |
| 7 | MYLPF | MYLPF | MYLPF | 49 | 1.4 | 0.36 | YES |
| 8 | MYH6 | MYH6 | MYH6 | 67 | 1.3 | 0.41 | YES |
| 9 | MYH4 | MYH4 | MYH4 | 71 | 1.3 | 0.46 | YES |
| 10 | MYH3 | MYH3 | MYH3 | 120 | 1.1 | 0.5 | YES |
| 11 | CTNNA3 | CTNNA3 | CTNNA3 | 141 | 0.99 | 0.54 | YES |
| 12 | MYH13 | MYH13 | MYH13 | 159 | 0.92 | 0.57 | YES |
| 13 | JAM2 | JAM2 | JAM2 | 345 | 0.54 | 0.58 | YES |
| 14 | MYH7B | MYH7B | MYH7B | 444 | 0.47 | 0.59 | YES |
| 15 | ACTN3 | ACTN3 | ACTN3 | 478 | 0.45 | 0.61 | YES |
| 16 | MRAS | MRAS | MRAS | 479 | 0.45 | 0.62 | YES |
| 17 | PRKCQ | PRKCQ | PRKCQ | 575 | 0.41 | 0.63 | YES |
| 18 | MYH11 | MYH11 | MYH11 | 845 | 0.34 | 0.63 | YES |
| 19 | CLDN11 | CLDN11 | CLDN11 | 1084 | 0.3 | 0.63 | YES |
| 20 | CLDN5 | CLDN5 | CLDN5 | 1176 | 0.29 | 0.64 | YES |
| 21 | MYH15 | MYH15 | MYH15 | 1177 | 0.29 | 0.65 | YES |
| 22 | MPDZ | MPDZ | MPDZ | 1312 | 0.27 | 0.65 | YES |
| 23 | JAM3 | JAM3 | JAM3 | 1375 | 0.26 | 0.66 | YES |
| 24 | PRKCB | PRKCB | PRKCB | 1644 | 0.23 | 0.65 | NO |
| 25 | MYL9 | MYL9 | MYL9 | 2036 | 0.2 | 0.64 | NO |
| 26 | CLDN14 | CLDN14 | CLDN14 | 2344 | 0.17 | 0.63 | NO |
| 27 | EPB41L3 | EPB41L3 | EPB41L3 | 2557 | 0.16 | 0.62 | NO |
| 28 | ZAK | ZAK | ZAK | 2570 | 0.16 | 0.63 | NO |
| 29 | PRKCA | PRKCA | PRKCA | 2649 | 0.15 | 0.63 | NO |
| 30 | PPP2R2C | PPP2R2C | PPP2R2C | 2743 | 0.15 | 0.63 | NO |
| 31 | AKT3 | AKT3 | AKT3 | 2790 | 0.15 | 0.63 | NO |
| 32 | CTNNA2 | CTNNA2 | CTNNA2 | 3233 | 0.12 | 0.61 | NO |
| 33 | CLDN19 | CLDN19 | CLDN19 | 3527 | 0.11 | 0.6 | NO |
| 34 | ACTN1 | ACTN1 | ACTN1 | 3533 | 0.11 | 0.6 | NO |
| 35 | HCLS1 | HCLS1 | HCLS1 | 3766 | 0.099 | 0.59 | NO |
| 36 | MYH10 | MYH10 | MYH10 | 4324 | 0.079 | 0.57 | NO |
| 37 | AMOTL1 | AMOTL1 | AMOTL1 | 4547 | 0.072 | 0.56 | NO |
| 38 | EPB41L2 | EPB41L2 | EPB41L2 | 4952 | 0.06 | 0.54 | NO |
| 39 | PTEN | PTEN | PTEN | 5285 | 0.052 | 0.52 | NO |
| 40 | RRAS | RRAS | RRAS | 5292 | 0.052 | 0.52 | NO |
| 41 | GNAI2 | GNAI2 | GNAI2 | 5353 | 0.051 | 0.52 | NO |
| 42 | CSDA | CSDA | CSDA | 5397 | 0.049 | 0.52 | NO |
| 43 | MYH9 | MYH9 | MYH9 | 5484 | 0.047 | 0.52 | NO |
| 44 | CLDN9 | CLDN9 | CLDN9 | 5953 | 0.038 | 0.49 | NO |
| 45 | MAGI2 | MAGI2 | MAGI2 | 6169 | 0.035 | 0.48 | NO |
| 46 | SRC | SRC | SRC | 6226 | 0.034 | 0.48 | NO |
| 47 | MYL12A | MYL12A | MYL12A | 6270 | 0.033 | 0.48 | NO |
| 48 | CLDN23 | CLDN23 | CLDN23 | 6487 | 0.03 | 0.47 | NO |
| 49 | TJAP1 | TJAP1 | TJAP1 | 6533 | 0.03 | 0.47 | NO |
| 50 | SPTAN1 | SPTAN1 | SPTAN1 | 7019 | 0.023 | 0.44 | NO |
| 51 | MAGI1 | MAGI1 | MAGI1 | 7143 | 0.021 | 0.44 | NO |
| 52 | CTNNB1 | CTNNB1 | CTNNB1 | 7191 | 0.02 | 0.43 | NO |
| 53 | CLDN17 | CLDN17 | CLDN17 | 7329 | 0.019 | 0.43 | NO |
| 54 | LLGL1 | LLGL1 | LLGL1 | 7551 | 0.016 | 0.42 | NO |
| 55 | ASH1L | ASH1L | ASH1L | 7577 | 0.016 | 0.42 | NO |
| 56 | NRAS | NRAS | NRAS | 7718 | 0.014 | 0.41 | NO |
| 57 | RHOA | RHOA | RHOA | 7750 | 0.014 | 0.41 | NO |
| 58 | ACTB | ACTB | ACTB | 7878 | 0.012 | 0.4 | NO |
| 59 | GNAI1 | GNAI1 | GNAI1 | 7925 | 0.012 | 0.4 | NO |
| 60 | AKT2 | AKT2 | AKT2 | 7952 | 0.011 | 0.4 | NO |
| 61 | EXOC4 | EXOC4 | EXOC4 | 8049 | 0.01 | 0.39 | NO |
| 62 | CTTN | CTTN | CTTN | 8136 | 0.0092 | 0.39 | NO |
| 63 | AKT1 | AKT1 | AKT1 | 8190 | 0.0086 | 0.39 | NO |
| 64 | CSNK2A2 | CSNK2A2 | CSNK2A2 | 8434 | 0.0057 | 0.37 | NO |
| 65 | MPP5 | MPP5 | MPP5 | 8468 | 0.0054 | 0.37 | NO |
| 66 | PPP2R1B | PPP2R1B | PPP2R1B | 8777 | 0.0024 | 0.35 | NO |
| 67 | TJP1 | TJP1 | TJP1 | 8917 | 0.0009 | 0.35 | NO |
| 68 | ACTN4 | ACTN4 | ACTN4 | 9165 | -0.0016 | 0.33 | NO |
| 69 | EXOC3 | EXOC3 | EXOC3 | 9197 | -0.0019 | 0.33 | NO |
| 70 | CSNK2A1 | CSNK2A1 | CSNK2A1 | 9441 | -0.0042 | 0.32 | NO |
| 71 | CDC42 | CDC42 | CDC42 | 9447 | -0.0042 | 0.32 | NO |
| 72 | PPP2R2D | PPP2R2D | PPP2R2D | 9580 | -0.0055 | 0.31 | NO |
| 73 | CASK | CASK | CASK | 9645 | -0.0062 | 0.31 | NO |
| 74 | CTNNA1 | CTNNA1 | CTNNA1 | 9752 | -0.0072 | 0.3 | NO |
| 75 | PPP2R1A | PPP2R1A | PPP2R1A | 9776 | -0.0074 | 0.3 | NO |
| 76 | GNAI3 | GNAI3 | GNAI3 | 9885 | -0.0085 | 0.3 | NO |
| 77 | PRKCH | PRKCH | PRKCH | 9908 | -0.0087 | 0.3 | NO |
| 78 | MYH14 | MYH14 | MYH14 | 9968 | -0.0092 | 0.29 | NO |
| 79 | PARD3 | PARD3 | PARD3 | 9976 | -0.0093 | 0.29 | NO |
| 80 | KRAS | KRAS | KRAS | 10060 | -0.01 | 0.29 | NO |
| 81 | SYMPK | SYMPK | SYMPK | 10168 | -0.011 | 0.28 | NO |
| 82 | INADL | INADL | INADL | 10177 | -0.011 | 0.28 | NO |
| 83 | HRAS | HRAS | HRAS | 10288 | -0.012 | 0.28 | NO |
| 84 | VAPA | VAPA | VAPA | 10609 | -0.015 | 0.26 | NO |
| 85 | PPP2R2B | PPP2R2B | PPP2R2B | 10730 | -0.016 | 0.25 | NO |
| 86 | RRAS2 | RRAS2 | RRAS2 | 10960 | -0.019 | 0.24 | NO |
| 87 | PPP2CA | PPP2CA | PPP2CA | 11056 | -0.02 | 0.24 | NO |
| 88 | ACTG1 | ACTG1 | ACTG1 | 11105 | -0.02 | 0.24 | NO |
| 89 | RAB13 | RAB13 | RAB13 | 11235 | -0.021 | 0.23 | NO |
| 90 | MLLT4 | MLLT4 | MLLT4 | 11286 | -0.022 | 0.23 | NO |
| 91 | MYL12B | MYL12B | MYL12B | 11436 | -0.023 | 0.22 | NO |
| 92 | PARD6G | PARD6G | PARD6G | 11531 | -0.024 | 0.22 | NO |
| 93 | EPB41L1 | EPB41L1 | EPB41L1 | 11551 | -0.024 | 0.22 | NO |
| 94 | YES1 | YES1 | YES1 | 11630 | -0.025 | 0.21 | NO |
| 95 | CLDN15 | CLDN15 | CLDN15 | 11671 | -0.026 | 0.21 | NO |
| 96 | PPP2CB | PPP2CB | PPP2CB | 11782 | -0.027 | 0.21 | NO |
| 97 | PRKCD | PRKCD | PRKCD | 11992 | -0.029 | 0.2 | NO |
| 98 | TJP2 | TJP2 | TJP2 | 12484 | -0.034 | 0.17 | NO |
| 99 | PRKCI | PRKCI | PRKCI | 12639 | -0.036 | 0.16 | NO |
| 100 | CSNK2B | CSNK2B | CSNK2B | 12771 | -0.037 | 0.16 | NO |
| 101 | EPB41 | EPB41 | EPB41 | 12872 | -0.038 | 0.15 | NO |
| 102 | RAB3B | RAB3B | RAB3B | 12945 | -0.039 | 0.15 | NO |
| 103 | F11R | F11R | F11R | 13027 | -0.04 | 0.15 | NO |
| 104 | PRKCE | PRKCE | PRKCE | 13181 | -0.042 | 0.14 | NO |
| 105 | PPP2R2A | PPP2R2A | PPP2R2A | 13801 | -0.05 | 0.11 | NO |
| 106 | CDK4 | CDK4 | CDK4 | 13914 | -0.052 | 0.1 | NO |
| 107 | MYL7 | MYL7 | MYL7 | 13998 | -0.053 | 0.1 | NO |
| 108 | CLDN2 | CLDN2 | CLDN2 | 14326 | -0.059 | 0.086 | NO |
| 109 | MAGI3 | MAGI3 | MAGI3 | 14575 | -0.063 | 0.075 | NO |
| 110 | PRKCZ | PRKCZ | PRKCZ | 14592 | -0.064 | 0.076 | NO |
| 111 | CLDN8 | CLDN8 | CLDN8 | 15103 | -0.074 | 0.051 | NO |
| 112 | CLDN18 | CLDN18 | CLDN18 | 15380 | -0.081 | 0.039 | NO |
| 113 | CLDN1 | CLDN1 | CLDN1 | 15394 | -0.081 | 0.042 | NO |
| 114 | PARD6A | PARD6A | PARD6A | 15544 | -0.086 | 0.037 | NO |
| 115 | CLDN20 | CLDN20 | CLDN20 | 15957 | -0.098 | 0.018 | NO |
| 116 | MYL5 | MYL5 | MYL5 | 16046 | -0.1 | 0.017 | NO |
| 117 | LLGL2 | LLGL2 | LLGL2 | 16808 | -0.13 | -0.02 | NO |
| 118 | CLDN4 | CLDN4 | CLDN4 | 16940 | -0.14 | -0.022 | NO |
| 119 | IGSF5 | IGSF5 | IGSF5 | 17090 | -0.15 | -0.025 | NO |
| 120 | CRB3 | CRB3 | CRB3 | 17296 | -0.16 | -0.03 | NO |
| 121 | CLDN6 | CLDN6 | CLDN6 | 17392 | -0.17 | -0.029 | NO |
| 122 | PRKCG | PRKCG | PRKCG | 17725 | -0.2 | -0.039 | NO |
| 123 | OCLN | OCLN | OCLN | 17779 | -0.2 | -0.035 | NO |
| 124 | CGN | CGN | CGN | 17900 | -0.21 | -0.033 | NO |
| 125 | CLDN16 | CLDN16 | CLDN16 | 18006 | -0.23 | -0.031 | NO |
| 126 | CLDN7 | CLDN7 | CLDN7 | 18035 | -0.23 | -0.023 | NO |
| 127 | PARD6B | PARD6B | PARD6B | 18055 | -0.24 | -0.016 | NO |
| 128 | CLDN10 | CLDN10 | CLDN10 | 18109 | -0.25 | -0.0092 | NO |
| 129 | TJP3 | TJP3 | TJP3 | 18222 | -0.28 | -0.005 | NO |
| 130 | CLDN3 | CLDN3 | CLDN3 | 18327 | -0.33 | 0.0019 | NO |
Figure S79. Get High-res Image This plot shows mRNAseq_cNMF expression data heatmap (on the left) a RunningEnrichmentScore(RES) plot (on the top right) and a Signal2Noise(S2N) plot (on the bottom right) of genes in the pathway: KEGG RNA DEGRADATION.
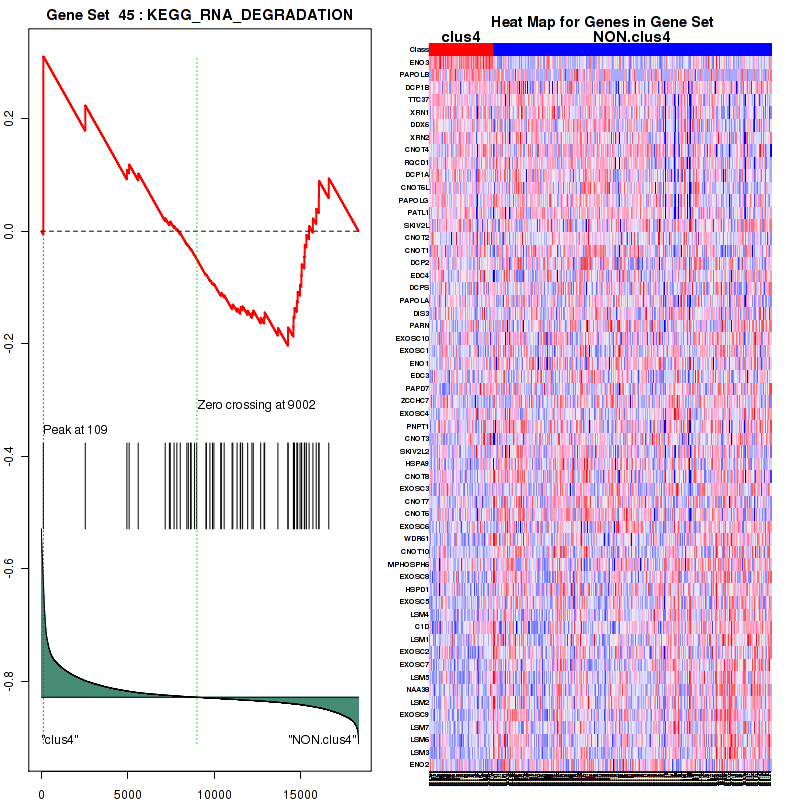
Figure S80. Get High-res Image For the top 5 core enriched genes in the pathway: KEGG RNA DEGRADATION, this volcano plot shows how much they are up/down-regulated and significant. The significance was calculated by empirical bayesian fit
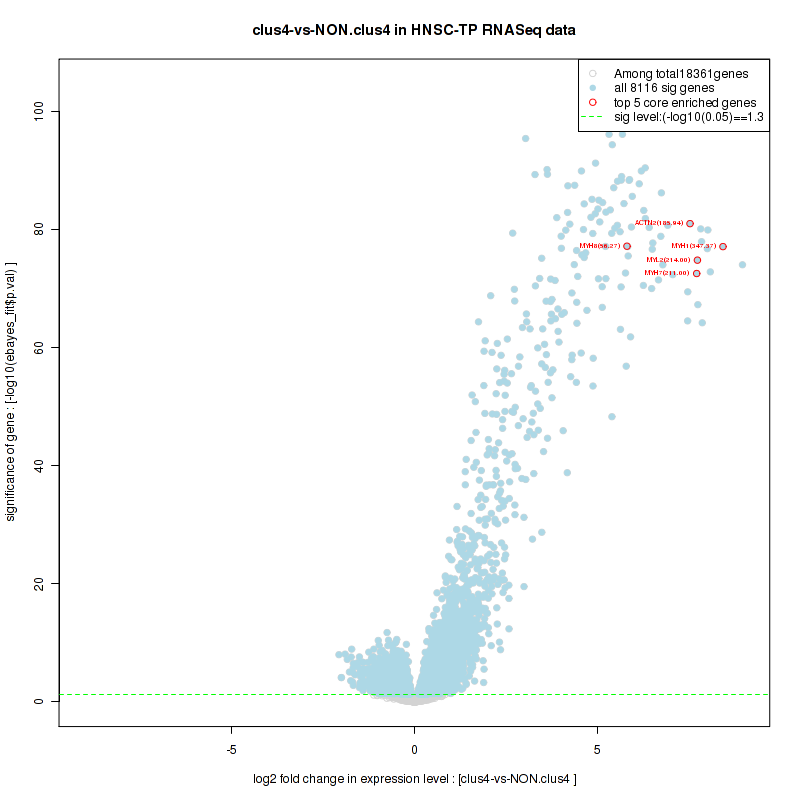
For the top enriched genes, if you want to check whether they are
-
up-regulated, please check the list of up-regulated genes
-
down-regulated, please check the list of down-regulated genes
For the top enriched genes, if you want to check whether they are
-
highly expressed genes, please check the list of high (top 30%) expressed genes
-
low expressed genes, please check the list of low (bottom 30%) expressed genes
An expression pattern of top(30%)/middle(30%)/low(30%) in this subtype against other subtypes is available in a heatmap
For the top enriched genes, if you want to check whether they are
-
significantly differently expressed genes by eBayes lm fit, please check the list of significant genes
-
Gene set database = c2.cp.v4.0.symbols.gmt
-
Expression data file = HNSC-TP.uncv2.mRNAseq_RSEM_normalized_log2.txt
-
Phenotype data file = HNSC-TP.mergedcluster.txt
For the Gene Set Enrichment Analysis (GSEA), Broad GSEA-P-R.1.0 version is used with class2: canonical pathways geneses from MSigDB. Further details about statistics are available inThe Broad GSEA website.
In addition to the links below, the full results of the analysis summarized in this report can also be downloaded programmatically using firehose_get, or interactively from either the Broad GDAC website or TCGA Data Coordination Center Portal.