This report serves to describe the mutational landscape and properties of a given individual set, as well as rank genes and genesets according to mutational significance. MutSig v2.0 was used to generate the results found in this report.
-
Working with individual set: LUAD-TP
-
Number of patients in set: 545
The input for this pipeline is a set of individuals with the following files associated for each:
-
An annotated .maf file describing the mutations called for the respective individual, and their properties.
-
A .wig file that contains information about the coverage of the sample.
-
MAF used for this analysis:LUAD-TP.final_analysis_set.maf
-
Blacklist used for this analysis: pancan_mutation_blacklist.v14.hg19.txt
-
Significantly mutated genes (q ≤ 0.1): 164
-
Mutations seen in COSMIC: 1117
-
Significantly mutated genes in COSMIC territory: 39
-
Significantly mutated genesets: 17
-
Significantly mutated genesets: (excluding sig. mutated genes):0
-
Read 545 MAFs of type "maf1"
-
Total number of mutations in input MAFs: 255949
-
After removing 114 mutations outside chr1-24: 255835
-
After removing 8884 blacklisted mutations: 246951
-
After removing 19788 noncoding mutations: 227163
-
After collapsing adjacent/redundant mutations: 190718
-
Number of mutations before filtering: 190718
-
After removing 9928 mutations outside gene set: 180790
-
After removing 423 mutations outside category set: 180367
-
After removing 14 "impossible" mutations in
-
gene-patient-category bins of zero coverage: 170002
Table 1. Get Full Table Table representing breakdown of mutations by type.
| type | count |
|---|---|
| De_novo_Start_InFrame | 60 |
| De_novo_Start_OutOfFrame | 177 |
| Frame_Shift_Del | 3844 |
| Frame_Shift_Ins | 1608 |
| In_Frame_Del | 487 |
| In_Frame_Ins | 69 |
| Missense_Mutation | 115984 |
| Nonsense_Mutation | 9151 |
| Nonstop_Mutation | 159 |
| Silent | 41254 |
| Splice_Site | 7374 |
| Start_Codon_Del | 7 |
| Start_Codon_Ins | 4 |
| Start_Codon_SNP | 189 |
| Total | 180367 |
Table 2. Get Full Table A breakdown of mutation rates per category discovered for this individual set.
| category | n | N | rate | rate_per_mb | relative_rate | exp_ns_s_ratio |
|---|---|---|---|---|---|---|
| *CpG->(A/T) | 16528 | 861142629 | 0.000019 | 19 | 2.2 | 2.1 |
| *Cp(A/C/T)->(A/T) | 56880 | 7163719428 | 7.9e-06 | 7.9 | 0.9 | 2.7 |
| flip | 29781 | 15791237960 | 1.9e-06 | 1.9 | 0.21 | 5.3 |
| A->(C/G) | 12975 | 7766375903 | 1.7e-06 | 1.7 | 0.19 | 3.3 |
| indel+null | 22524 | 15791237960 | 1.4e-06 | 1.4 | 0.16 | NaN |
| double_null | 412 | 15791237960 | 2.6e-08 | 0.026 | 0.003 | NaN |
| Total | 139100 | 15791237960 | 8.8e-06 | 8.8 | 1 | 3.5 |
The x axis represents the samples. The y axis represents the exons, one row per exon, and they are sorted by average coverage across samples. For exons with exactly the same average coverage, they are sorted next by the %GC of the exon. (The secondary sort is especially useful for the zero-coverage exons at the bottom). If the figure is unpopulated, then full coverage is assumed (e.g. MutSig CV doesn't use WIGs and assumes full coverage).
Figure 1.
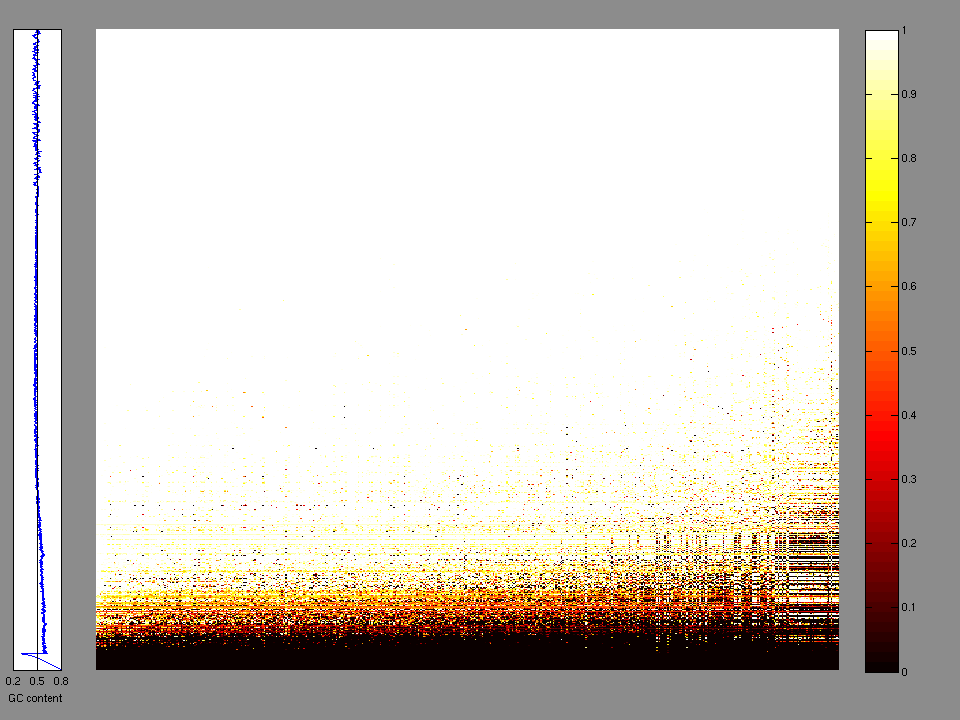
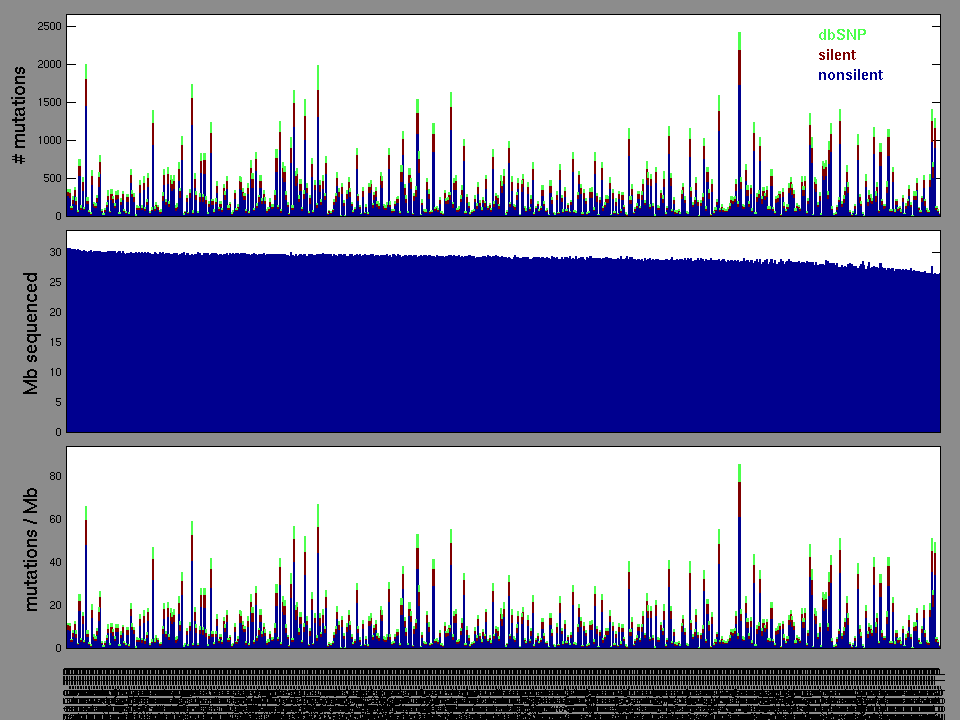
Figure 2. Patients counts and rates file used to generate this plot: LUAD-TP.patients.counts_and_rates.txt
The mutation spectrum is depicted in the lego plots below in which the 96 possible mutation types are subdivided into six large blocks, color-coded to reflect the base substitution type. Each large block is further subdivided into the 16 possible pairs of 5' and 3' neighbors, as listed in the 4x4 trinucleotide context legend. The height of each block corresponds to the mutation frequency for that kind of mutation (counts of mutations normalized by the base coverage in a given bin). The shape of the spectrum is a signature for dominant mutational mechanisms in different tumor types.
Figure 3. Get High-res Image SNV Mutation rate lego plot for entire set. Each bin is normalized by base coverage for that bin. Colors represent the six SNV types on the upper right. The three-base context for each mutation is labeled in the 4x4 legend on the lower right. The fractional breakdown of SNV counts is shown in the pie chart on the upper left. If this figure is blank, not enough information was provided in the MAF to generate it.
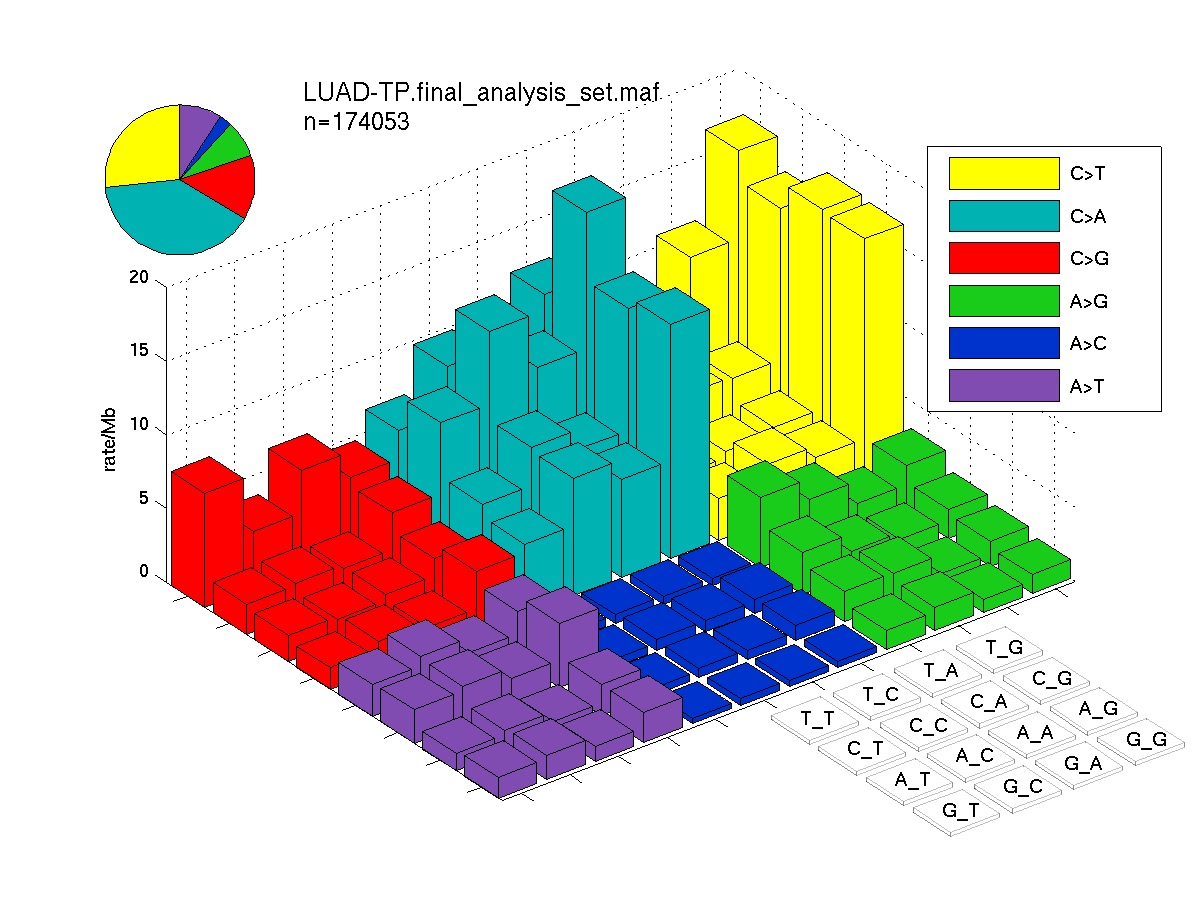
Figure 4. Get High-res Image SNV Mutation rate lego plots for 4 slices of mutation allele fraction (0<=AF<0.1, 0.1<=AF<0.25, 0.25<=AF<0.5, & 0.5<=AF) . The color code and three-base context legends are the same as the previous figure. If this figure is blank, not enough information was provided in the MAF to generate it.
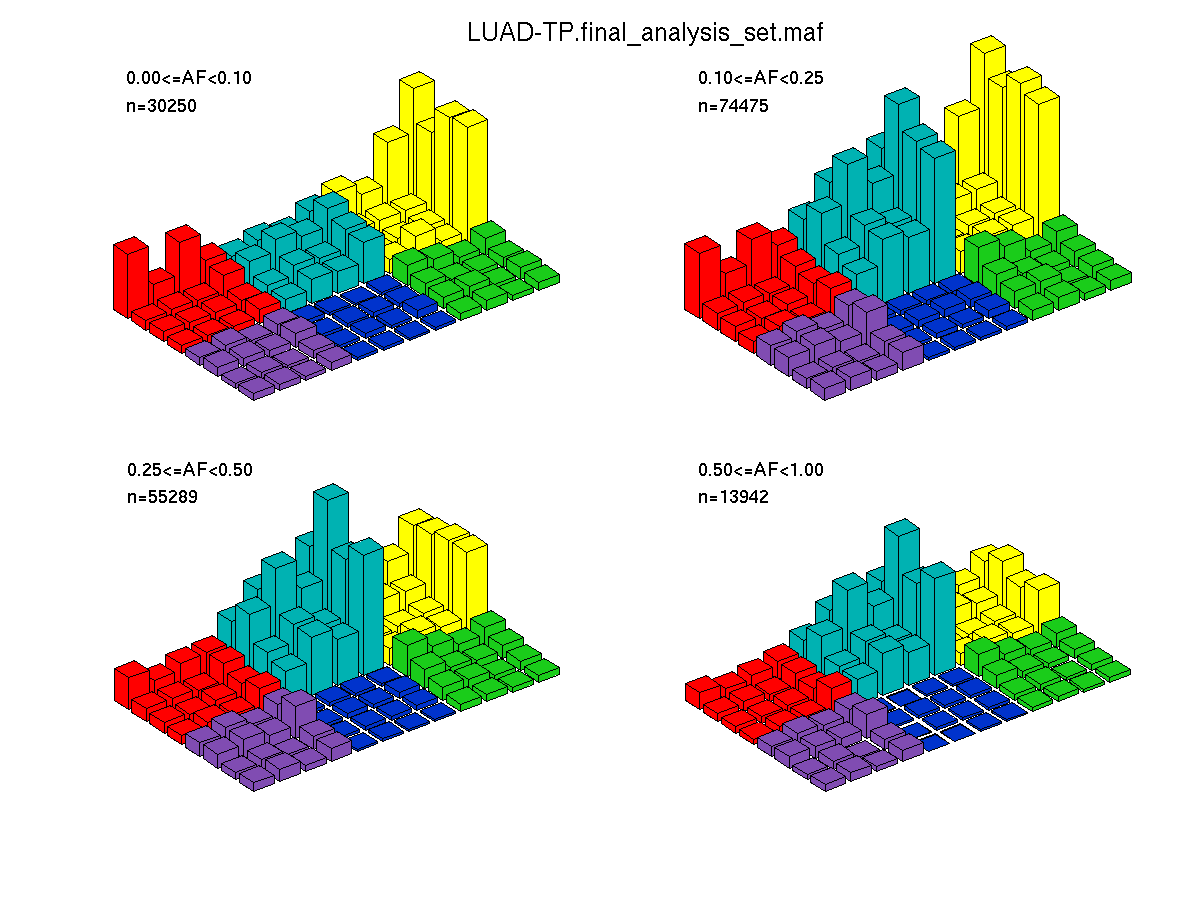
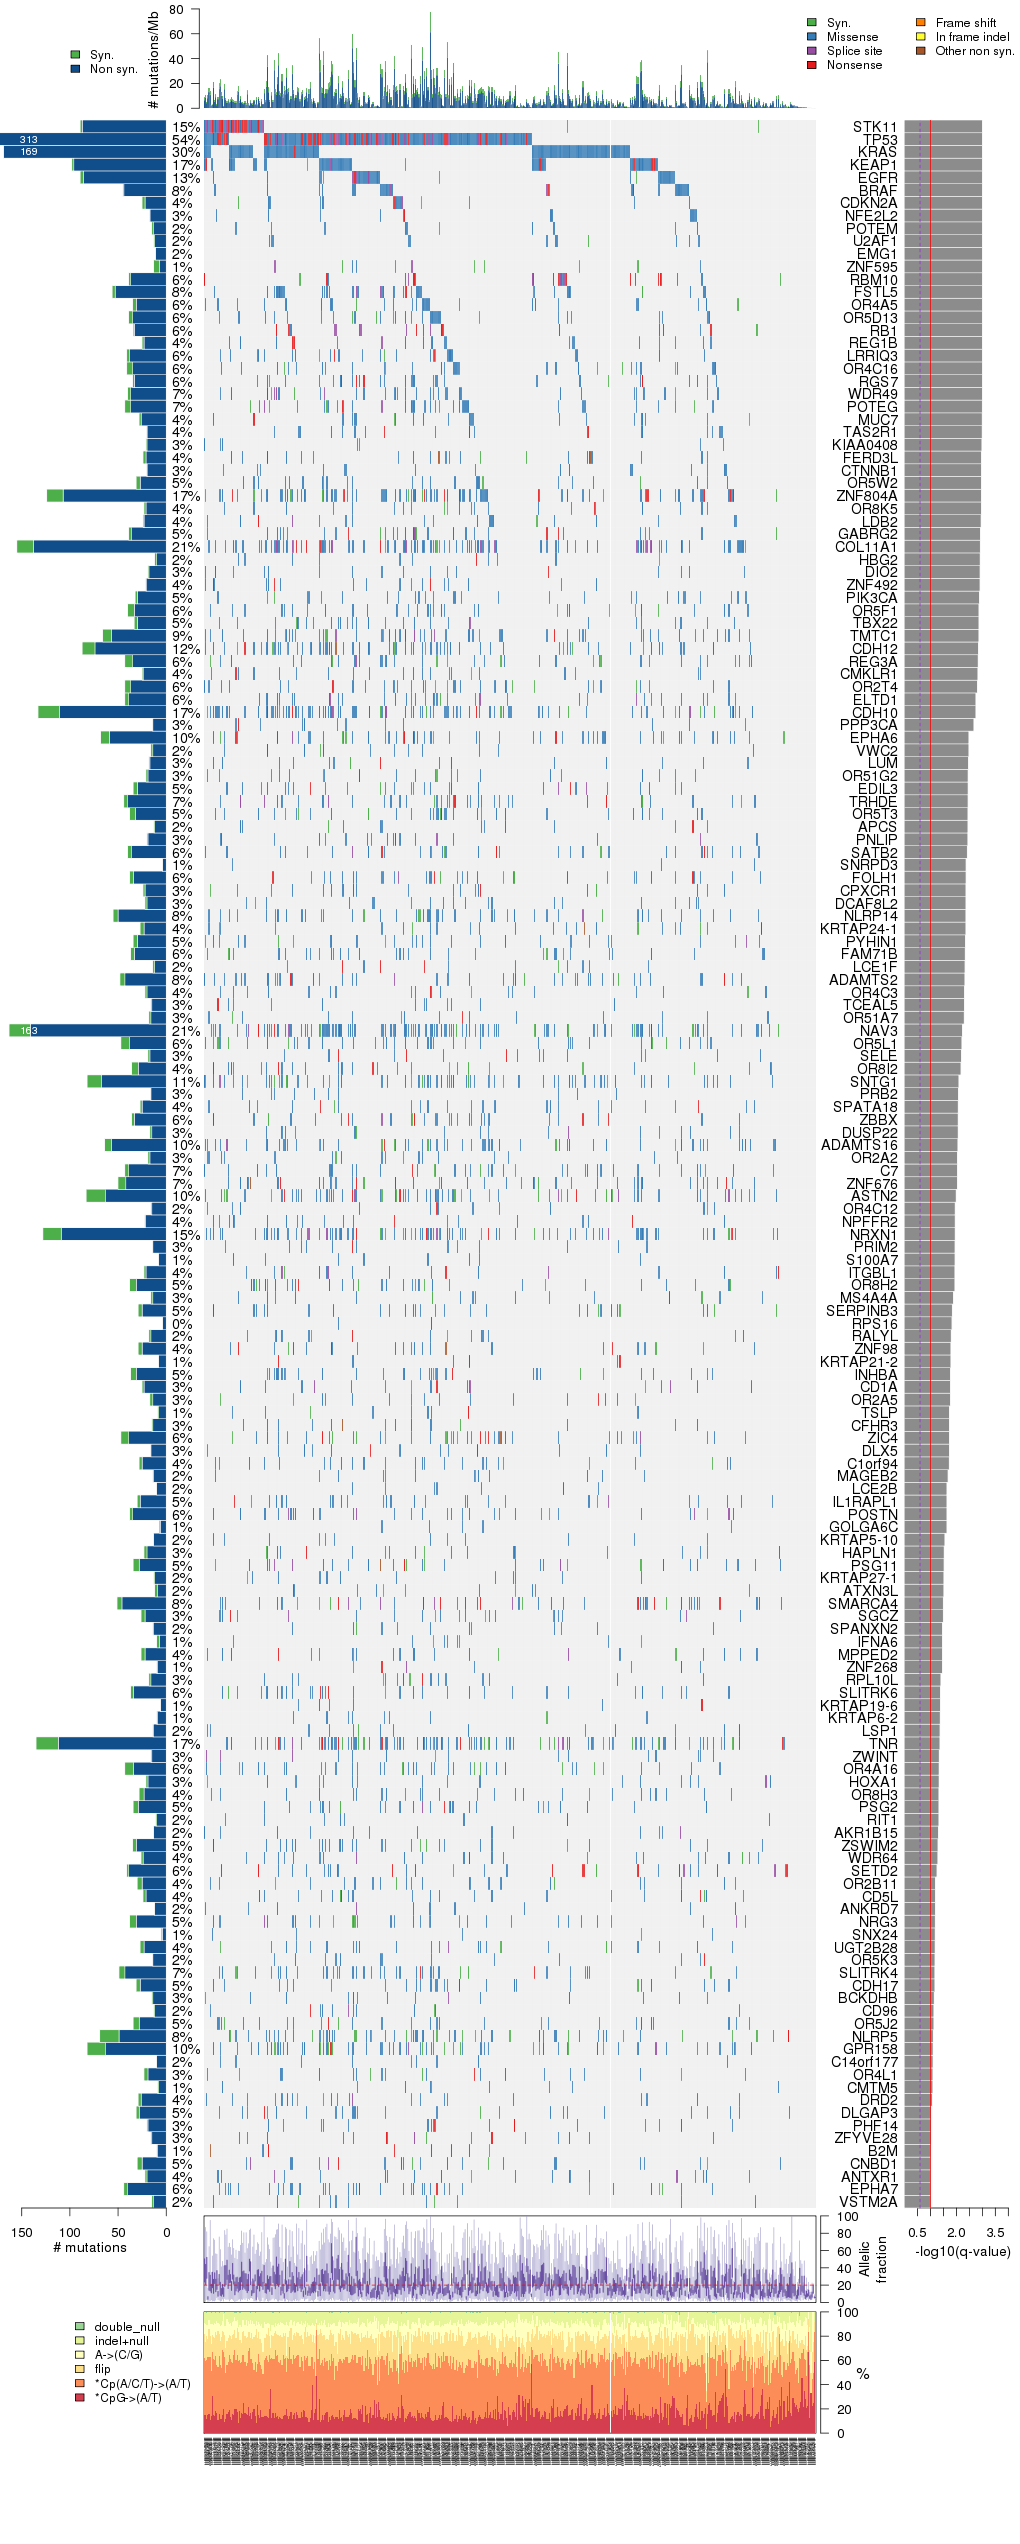
Figure 5. Get High-res Image The matrix in the center of the figure represents individual mutations in patient samples, color-coded by type of mutation, for the significantly mutated genes. The rate of synonymous and non-synonymous mutations is displayed at the top of the matrix. The barplot on the left of the matrix shows the number of mutations in each gene. The percentages represent the fraction of tumors with at least one mutation in the specified gene. The barplot to the right of the matrix displays the q-values for the most significantly mutated genes. The purple boxplots below the matrix (only displayed if required columns are present in the provided MAF) represent the distributions of allelic fractions observed in each sample. The plot at the bottom represents the base substitution distribution of individual samples, using the same categories that were used to calculate significance.
Column Descriptions:
-
N = number of sequenced bases in this gene across the individual set
-
n = number of (nonsilent) mutations in this gene across the individual set
-
npat = number of patients (individuals) with at least one nonsilent mutation
-
nsite = number of unique sites having a non-silent mutation
-
nsil = number of silent mutations in this gene across the individual set
-
n1 = number of nonsilent mutations of type: *CpG->(A/T)
-
n2 = number of nonsilent mutations of type: *Cp(A/C/T)->(A/T)
-
n3 = number of nonsilent mutations of type: flip
-
n4 = number of nonsilent mutations of type: A->(C/G)
-
n5 = number of nonsilent mutations of type: indel+null
-
n6 = number of nonsilent mutations of type: double_null
-
p_classic = p-value for the observed amount of nonsilent mutations being elevated in this gene
-
p_ns_s = p-value for the observed nonsilent/silent ratio being elevated in this gene
-
p_cons = p-value for enrichment of mutations at evolutionarily most-conserved sites in gene
-
p_joint = p-value for clustering + conservation
-
p = p-value (overall)
-
q = q-value, False Discovery Rate (Benjamini-Hochberg procedure)
Table 3. Get Full Table A Ranked List of Significantly Mutated Genes. Number of significant genes found: 164. Number of genes displayed: 35. Click on a gene name to display its stick figure depicting the distribution of mutations and mutation types across the chosen gene (this feature may not be available for all significant genes).
| rank | gene | description | N | n | npat | nsite | nsil | n1 | n2 | n3 | n4 | n5 | n6 | p_classic | p_ns_s | p_clust | p_cons | p_joint | p | q |
|---|---|---|---|---|---|---|---|---|---|---|---|---|---|---|---|---|---|---|---|---|
| 1 | STK11 | serine/threonine kinase 11 | 353629 | 87 | 80 | 69 | 2 | 1 | 16 | 6 | 5 | 59 | 0 | 2.22e-15 | 6.73e-08 | 1.2e-06 | 0.014 | 1.8e-06 | 0.000 | 0.000 |
| 2 | TP53 | tumor protein p53 | 667839 | 309 | 295 | 175 | 4 | 42 | 79 | 33 | 33 | 119 | 3 | 3.55e-15 | <1.00e-15 | 0 | 0 | 0 | <1.00e-15 | <1.51e-12 |
| 3 | KRAS | v-Ki-ras2 Kirsten rat sarcoma viral oncogene homolog | 373039 | 169 | 164 | 11 | 0 | 0 | 141 | 27 | 0 | 1 | 0 | <1.00e-15 | 4.91e-14 | 0 | 0 | 0 | <1.00e-15 | <1.51e-12 |
| 4 | KEAP1 | kelch-like ECH-associated protein 1 | 912683 | 96 | 95 | 85 | 2 | 24 | 28 | 13 | 9 | 22 | 0 | 4.66e-15 | 6.90e-11 | 0.017 | 0 | 0 | <1.00e-15 | <1.51e-12 |
| 5 | EGFR | epidermal growth factor receptor (erythroblastic leukemia viral (v-erb-b) oncogene homolog, avian) | 2137011 | 86 | 72 | 38 | 3 | 3 | 13 | 8 | 28 | 34 | 0 | 1.44e-15 | 0.000194 | 0 | 0.000014 | 0 | <1.00e-15 | <1.51e-12 |
| 6 | BRAF | v-raf murine sarcoma viral oncogene homolog B1 | 1213204 | 44 | 41 | 21 | 1 | 2 | 18 | 14 | 1 | 8 | 1 | 5.77e-15 | 0.000560 | 0 | 0.0065 | 0 | <1.00e-15 | <1.51e-12 |
| 7 | CDKN2A | cyclin-dependent kinase inhibitor 2A (melanoma, p16, inhibits CDK4) | 451726 | 22 | 21 | 18 | 3 | 3 | 6 | 4 | 2 | 7 | 0 | 4.12e-06 | 0.269 | 6.8e-06 | 0 | 0 | <1.00e-15 | <1.51e-12 |
| 8 | NFE2L2 | nuclear factor (erythroid-derived 2)-like 2 | 974172 | 17 | 17 | 17 | 0 | 0 | 5 | 5 | 4 | 3 | 0 | 0.000261 | 0.0351 | 0.000028 | 0.00049 | 0 | <1.00e-15 | <1.51e-12 |
| 9 | POTEM | POTE ankyrin domain family, member M | 312390 | 13 | 13 | 13 | 2 | 0 | 7 | 4 | 1 | 1 | 0 | 0.000262 | 0.452 | 0 | 0.72 | 0 | <1.00e-15 | <1.51e-12 |
| 10 | U2AF1 | U2 small nuclear RNA auxiliary factor 1 | 443093 | 12 | 12 | 2 | 1 | 0 | 11 | 1 | 0 | 0 | 0 | 0.000337 | 0.111 | 0 | 2e-05 | 0 | <1.00e-15 | <1.51e-12 |
| 11 | EMG1 | EMG1 nucleolar protein homolog (S. cerevisiae) | 358643 | 11 | 11 | 2 | 0 | 0 | 0 | 0 | 0 | 11 | 0 | 3.15e-05 | 1.000 | 0 | 0.94 | 0 | <1.00e-15 | <1.51e-12 |
| 12 | ZNF595 | zinc finger protein 595 | 1009299 | 7 | 7 | 5 | 6 | 0 | 5 | 0 | 0 | 2 | 0 | 0.990 | 0.979 | 1.4e-06 | 0.28 | 0 | <1.00e-15 | <1.51e-12 |
| 13 | RBM10 | RNA binding motif protein 10 | 1073502 | 37 | 35 | 35 | 2 | 1 | 5 | 0 | 0 | 31 | 0 | 4.77e-13 | 0.00407 | 0.4 | 0.0034 | 0.034 | 5.34e-13 | 7.43e-10 |
| 14 | FSTL5 | follistatin-like 5 | 1365825 | 53 | 45 | 52 | 3 | 3 | 25 | 11 | 6 | 8 | 0 | 1.67e-12 | 0.00111 | 0.11 | 0.74 | 0.17 | 8.32e-12 | 1.07e-08 |
| 15 | OR4A5 | olfactory receptor, family 4, subfamily A, member 5 | 505448 | 31 | 30 | 31 | 4 | 1 | 16 | 6 | 4 | 4 | 0 | 9.30e-12 | 0.0500 | 0.15 | 0.23 | 0.2 | 5.11e-11 | 6.16e-08 |
| 16 | OR5D13 | olfactory receptor, family 5, subfamily D, member 13 | 515537 | 35 | 32 | 35 | 4 | 1 | 17 | 10 | 6 | 1 | 0 | 4.39e-12 | 0.0210 | 0.57 | 0.2 | 0.54 | 6.61e-11 | 7.47e-08 |
| 17 | RB1 | retinoblastoma 1 (including osteosarcoma) | 1393625 | 33 | 32 | 32 | 1 | 0 | 1 | 3 | 1 | 28 | 0 | 7.92e-11 | 0.0575 | 0.012 | 0.92 | 0.033 | 7.27e-11 | 7.73e-08 |
| 18 | REG1B | regenerating islet-derived 1 beta (pancreatic stone protein, pancreatic thread protein) | 283328 | 23 | 22 | 23 | 2 | 1 | 14 | 2 | 2 | 4 | 0 | 1.31e-11 | 0.0230 | 0.69 | 0.088 | 0.25 | 9.04e-11 | 9.08e-08 |
| 19 | LRRIQ3 | leucine-rich repeats and IQ motif containing 3 | 979489 | 38 | 32 | 38 | 3 | 2 | 15 | 8 | 5 | 8 | 0 | 6.33e-10 | 0.0880 | 0.026 | 0.91 | 0.046 | 7.31e-10 | 6.95e-07 |
| 20 | OR4C16 | olfactory receptor, family 4, subfamily C, member 16 | 506644 | 35 | 32 | 34 | 6 | 1 | 15 | 12 | 3 | 4 | 0 | 1.09e-09 | 0.152 | 0.044 | 0.6 | 0.084 | 2.22e-09 | 2.01e-06 |
| 21 | RGS7 | regulator of G-protein signaling 7 | 827433 | 33 | 31 | 32 | 2 | 3 | 17 | 6 | 0 | 6 | 1 | 3.01e-10 | 0.0117 | 0.31 | 0.27 | 0.33 | 2.39e-09 | 2.05e-06 |
| 22 | WDR49 | WD repeat domain 49 | 1162480 | 37 | 36 | 37 | 3 | 2 | 12 | 13 | 3 | 6 | 1 | 1.99e-09 | 0.0438 | 0.045 | 0.28 | 0.074 | 3.49e-09 | 2.87e-06 |
| 23 | POTEG | POTE ankyrin domain family, member G | 644380 | 37 | 36 | 34 | 6 | 3 | 19 | 7 | 2 | 5 | 1 | 6.18e-07 | 0.174 | 0.0005 | 0.98 | 0.0011 | 1.45e-08 | 1.14e-05 |
| 24 | MUC7 | mucin 7, secreted | 622300 | 26 | 24 | 26 | 2 | 1 | 13 | 4 | 5 | 3 | 0 | 8.21e-09 | 0.0405 | 0.084 | 0.79 | 0.16 | 2.90e-08 | 2.18e-05 |
| 25 | TAS2R1 | taste receptor, type 2, member 1 | 490760 | 20 | 20 | 20 | 0 | 1 | 11 | 4 | 1 | 3 | 0 | 2.75e-09 | 0.00205 | 0.55 | 0.7 | 0.65 | 3.81e-08 | 2.75e-05 |
| 26 | KIAA0408 | KIAA0408 | 1145889 | 20 | 19 | 8 | 1 | 0 | 4 | 2 | 1 | 13 | 0 | 0.000565 | 0.516 | 1.2e-06 | 0.37 | 9.6e-06 | 1.09e-07 | 7.55e-05 |
| 27 | FERD3L | Fer3-like (Drosophila) | 273884 | 21 | 21 | 19 | 3 | 0 | 12 | 3 | 2 | 4 | 0 | 9.97e-09 | 0.0456 | 0.5 | 0.43 | 0.6 | 1.19e-07 | 7.85e-05 |
| 28 | CTNNB1 | catenin (cadherin-associated protein), beta 1, 88kDa | 1306090 | 20 | 19 | 13 | 0 | 0 | 13 | 4 | 2 | 1 | 0 | 0.00235 | 0.0114 | 2e-07 | 0.0066 | 2.6e-06 | 1.22e-07 | 7.85e-05 |
| 29 | OR5W2 | olfactory receptor, family 5, subfamily W, member 2 | 505839 | 27 | 26 | 25 | 4 | 1 | 15 | 8 | 2 | 1 | 0 | 4.08e-08 | 0.0830 | 0.16 | 0.35 | 0.18 | 1.44e-07 | 9.01e-05 |
| 30 | ZNF804A | zinc finger protein 804A | 1984779 | 107 | 90 | 104 | 17 | 4 | 59 | 19 | 6 | 18 | 1 | 7.88e-09 | 0.0939 | 0.72 | 0.68 | 1 | 1.55e-07 | 9.09e-05 |
| 31 | OR8K5 | olfactory receptor, family 8, subfamily K, member 5 | 504960 | 21 | 21 | 20 | 2 | 0 | 12 | 5 | 2 | 2 | 0 | 4.90e-08 | 0.0472 | 0.83 | 0.044 | 0.16 | 1.56e-07 | 9.09e-05 |
| 32 | LDB2 | LIM domain binding 2 | 630229 | 23 | 21 | 22 | 1 | 3 | 6 | 7 | 2 | 5 | 0 | 4.23e-08 | 0.0186 | 0.32 | 0.14 | 0.28 | 2.28e-07 | 0.000129 |
| 33 | GABRG2 | gamma-aminobutyric acid (GABA) A receptor, gamma 2 | 796777 | 36 | 29 | 36 | 3 | 2 | 16 | 4 | 7 | 7 | 0 | 9.63e-08 | 0.00634 | 0.14 | 0.27 | 0.2 | 3.61e-07 | 0.000198 |
| 34 | COL11A1 | collagen, type XI, alpha 1 | 3066776 | 138 | 112 | 135 | 17 | 2 | 77 | 20 | 7 | 28 | 4 | 2.08e-07 | 0.0370 | 0.56 | 0.057 | 0.099 | 3.86e-07 | 0.000205 |
| 35 | HBG2 | hemoglobin, gamma G | 201510 | 10 | 10 | 10 | 2 | 1 | 4 | 2 | 2 | 1 | 0 | 0.000124 | 0.280 | 0.00061 | 0.026 | 0.00019 | 4.40e-07 | 0.000227 |
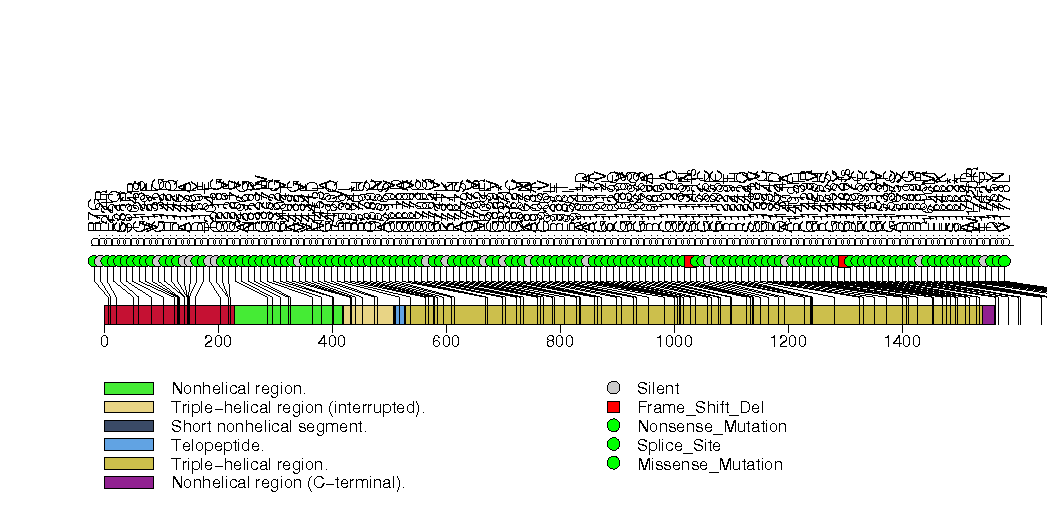
Figure S1. This figure depicts the distribution of mutations and mutation types across the STK11 significant gene.
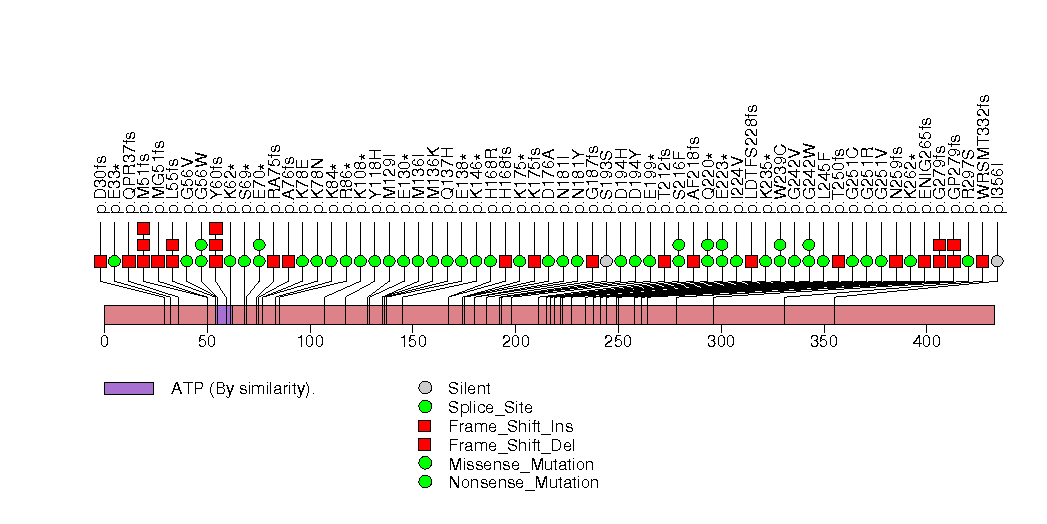
Figure S2. This figure depicts the distribution of mutations and mutation types across the TP53 significant gene.
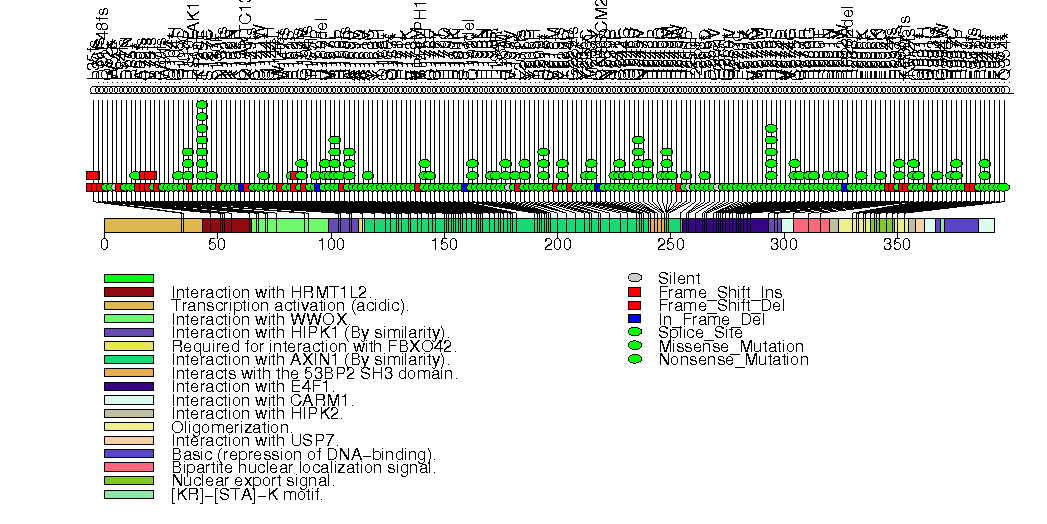
Figure S3. This figure depicts the distribution of mutations and mutation types across the KRAS significant gene.
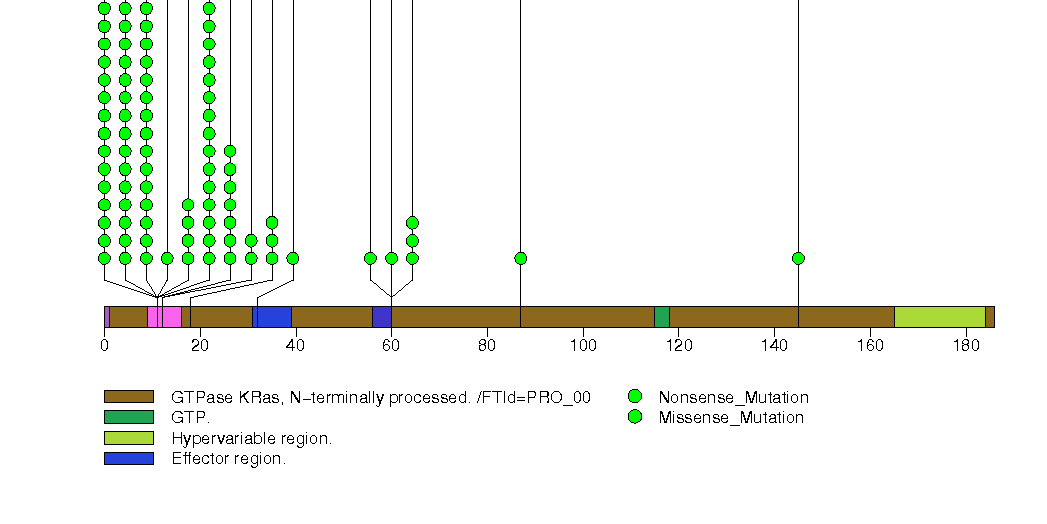
Figure S4. This figure depicts the distribution of mutations and mutation types across the KEAP1 significant gene.
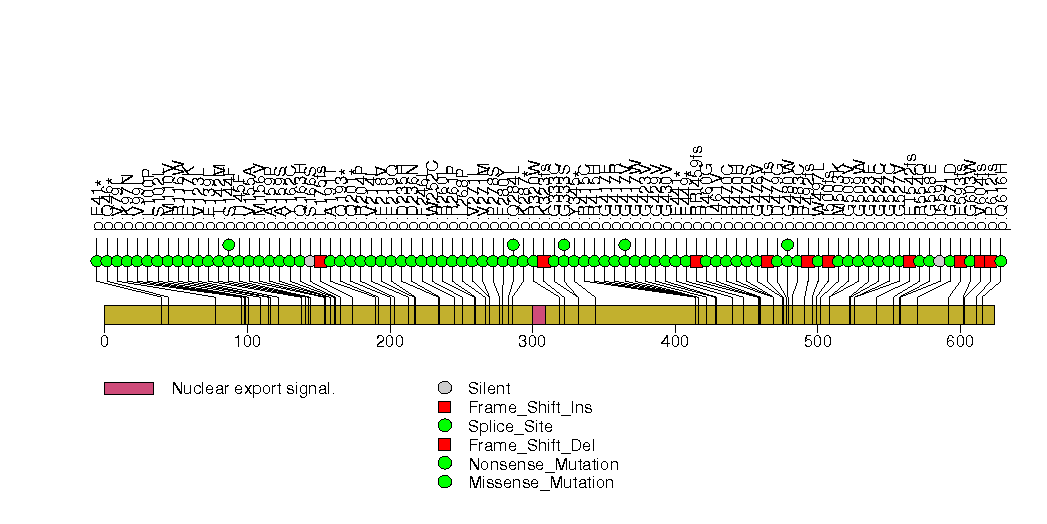
Figure S5. This figure depicts the distribution of mutations and mutation types across the EGFR significant gene.
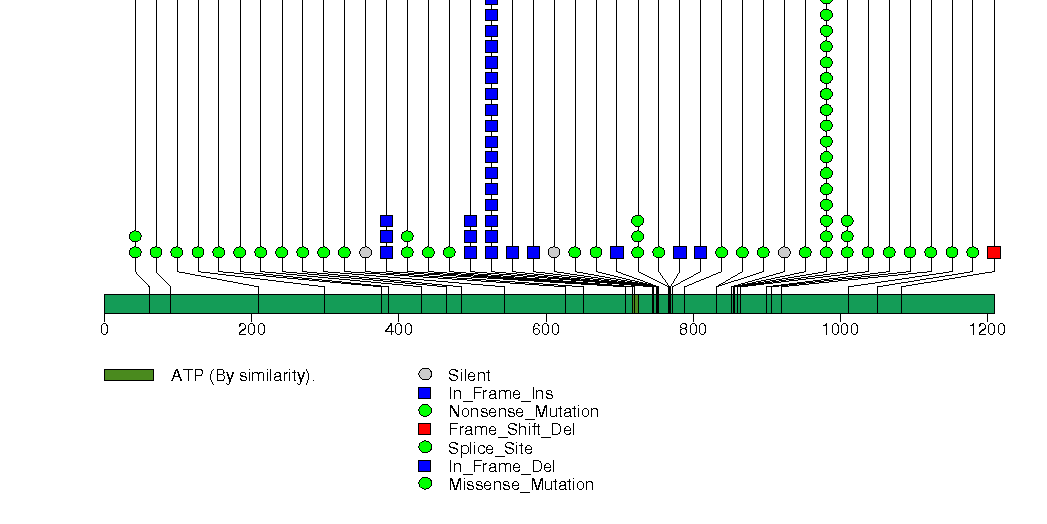
Figure S6. This figure depicts the distribution of mutations and mutation types across the BRAF significant gene.
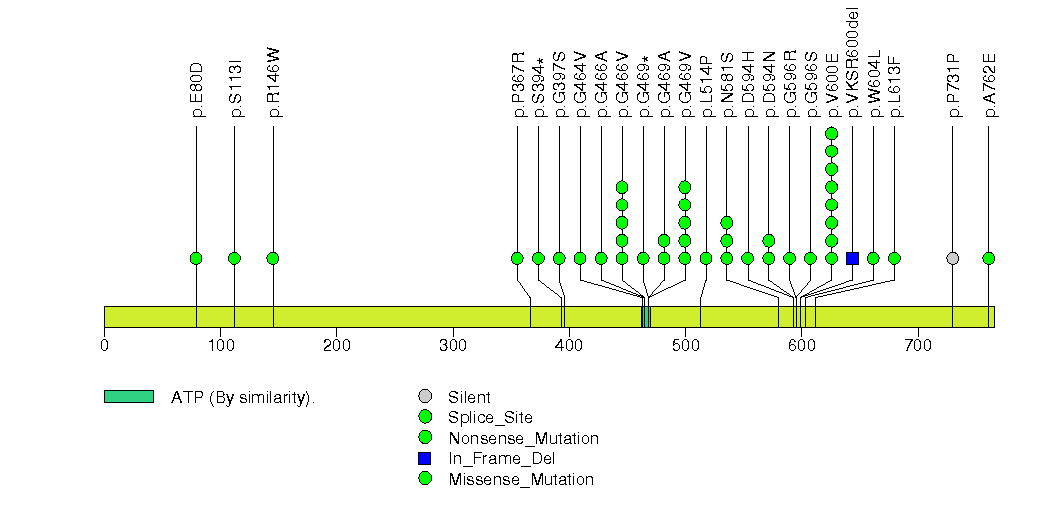
Figure S7. This figure depicts the distribution of mutations and mutation types across the CDKN2A significant gene.
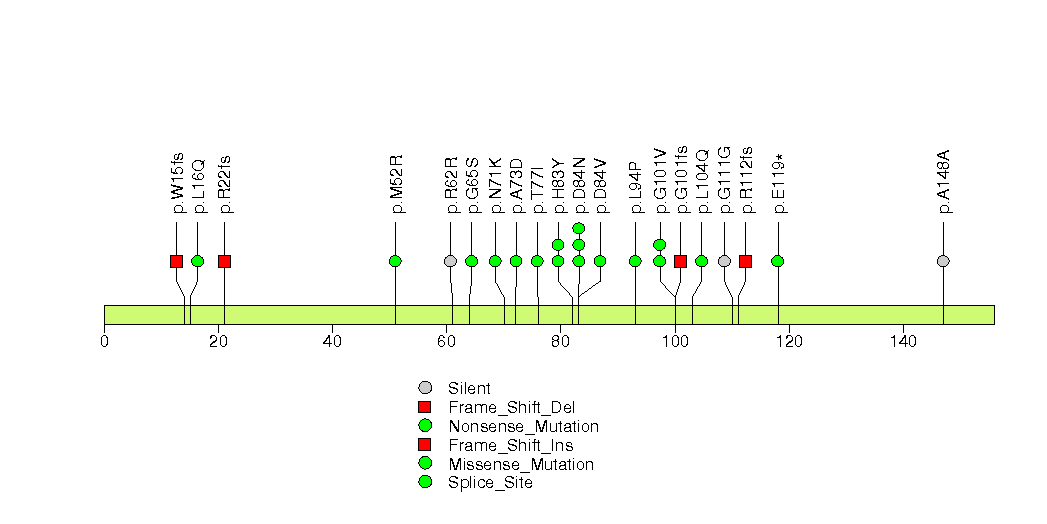
Figure S8. This figure depicts the distribution of mutations and mutation types across the NFE2L2 significant gene.
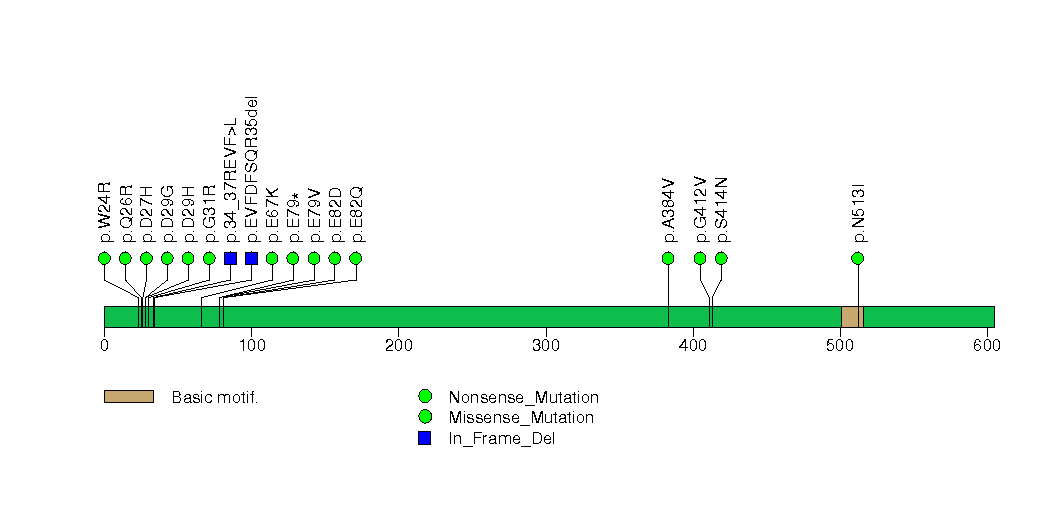
Figure S9. This figure depicts the distribution of mutations and mutation types across the POTEM significant gene.
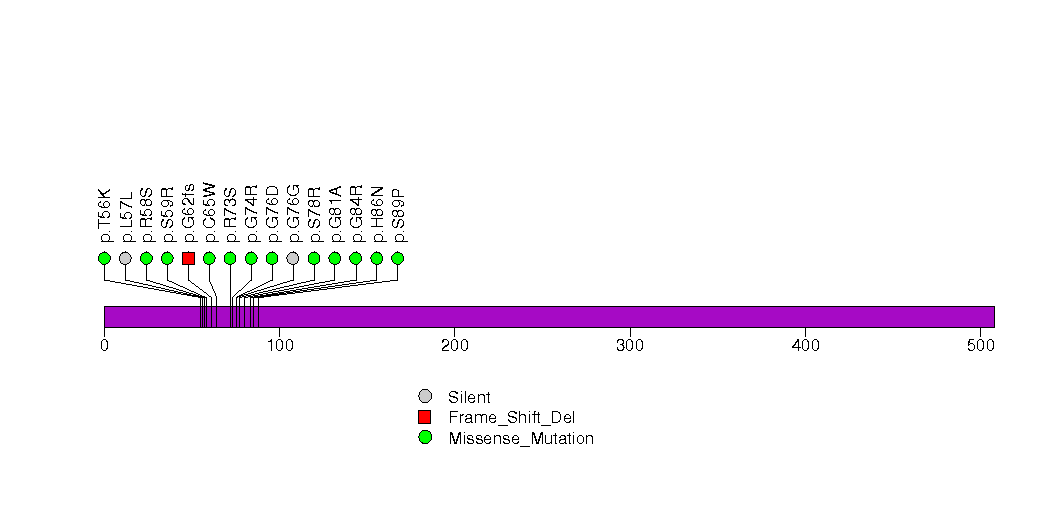
Figure S10. This figure depicts the distribution of mutations and mutation types across the U2AF1 significant gene.
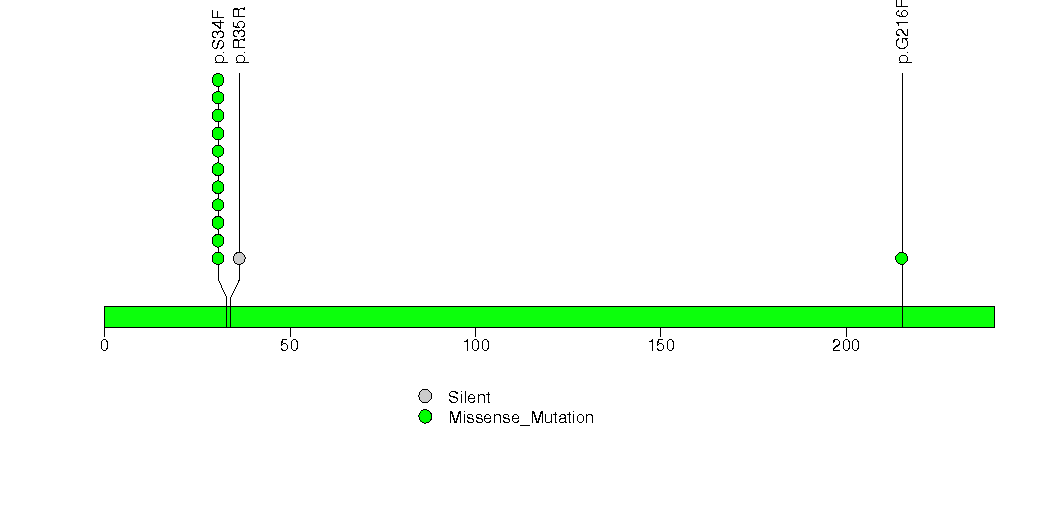
Figure S11. This figure depicts the distribution of mutations and mutation types across the ZNF595 significant gene.
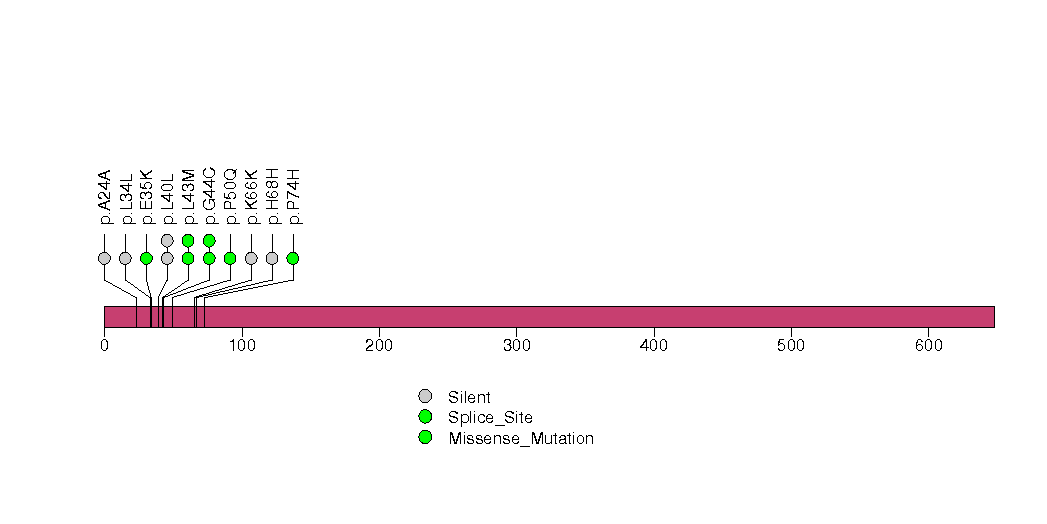
Figure S12. This figure depicts the distribution of mutations and mutation types across the RBM10 significant gene.
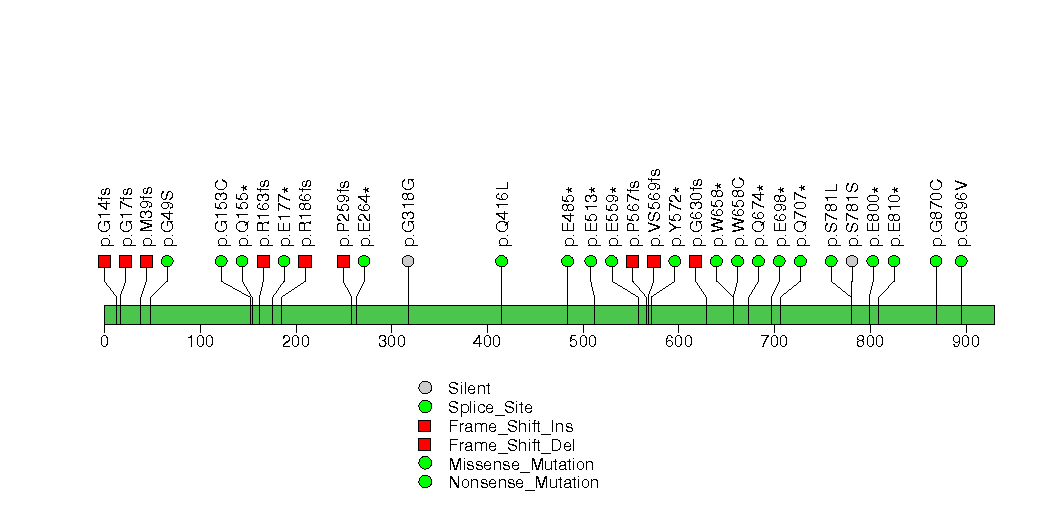
Figure S13. This figure depicts the distribution of mutations and mutation types across the FSTL5 significant gene.
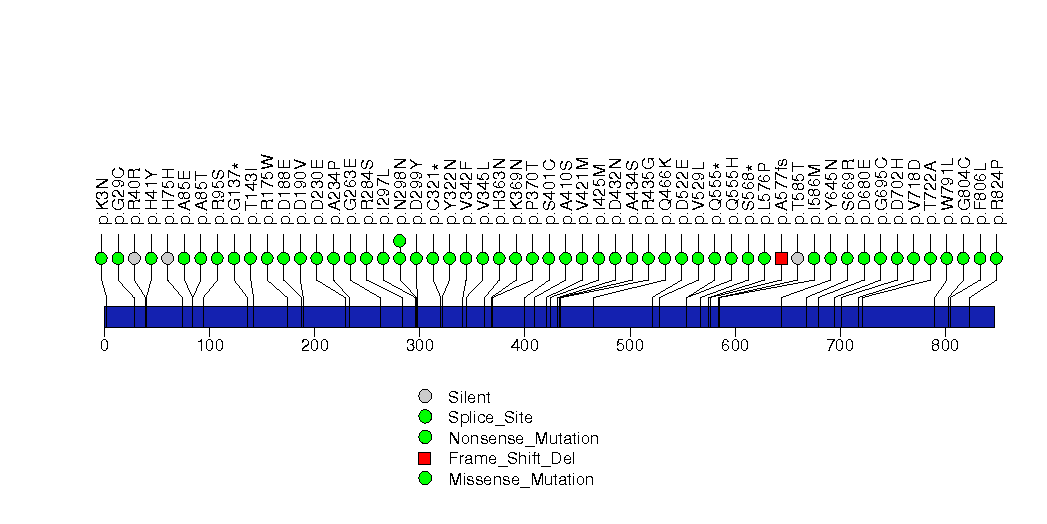
Figure S14. This figure depicts the distribution of mutations and mutation types across the OR4A5 significant gene.
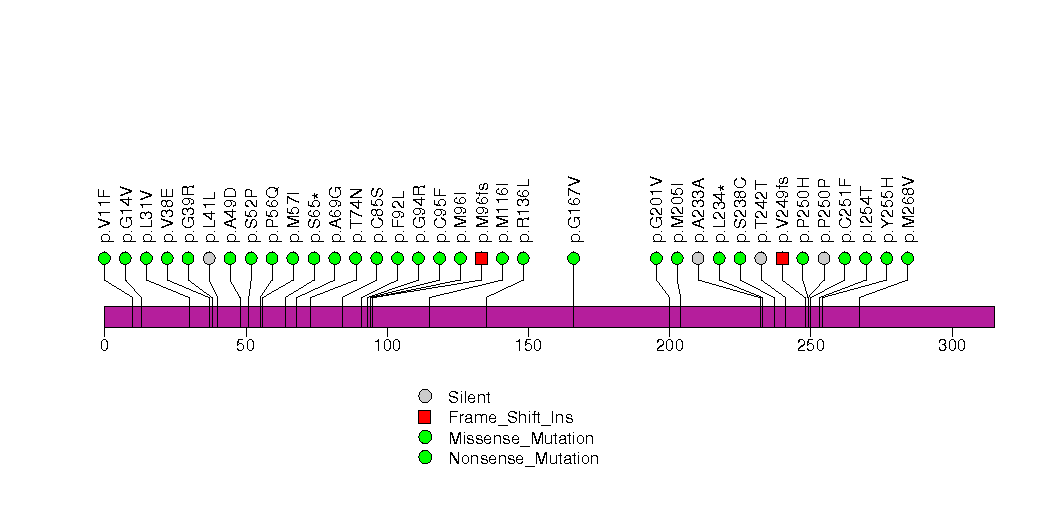
Figure S15. This figure depicts the distribution of mutations and mutation types across the OR5D13 significant gene.
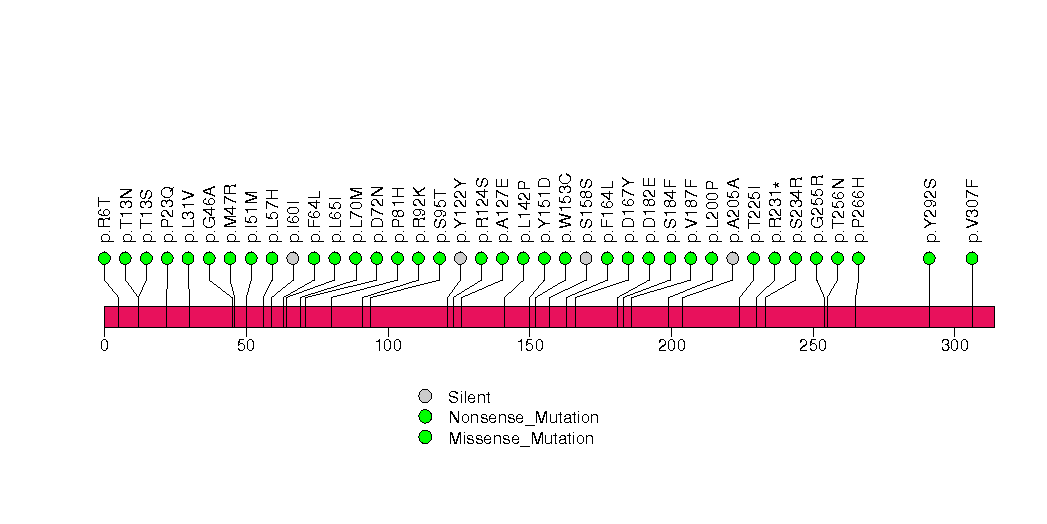
Figure S16. This figure depicts the distribution of mutations and mutation types across the RB1 significant gene.
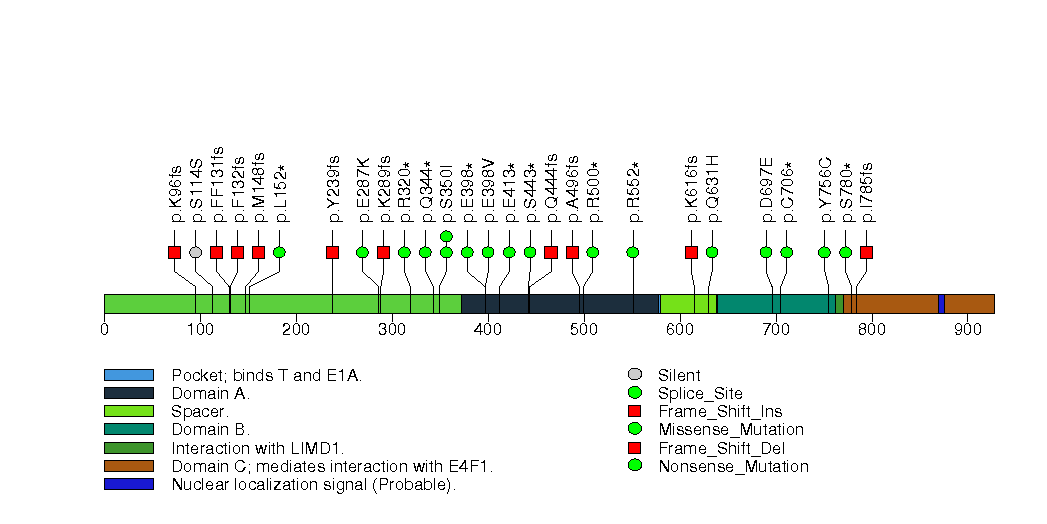
Figure S17. This figure depicts the distribution of mutations and mutation types across the REG1B significant gene.
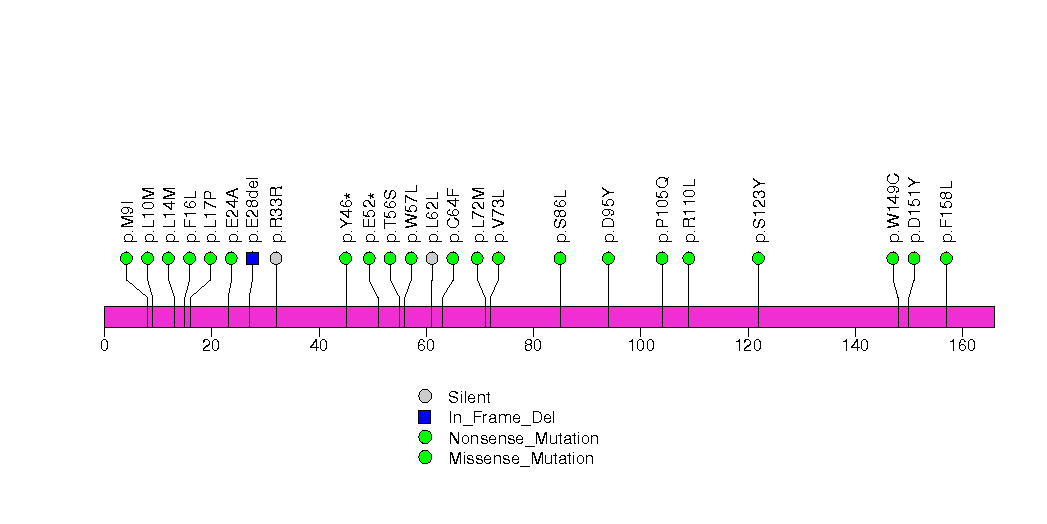
Figure S18. This figure depicts the distribution of mutations and mutation types across the LRRIQ3 significant gene.
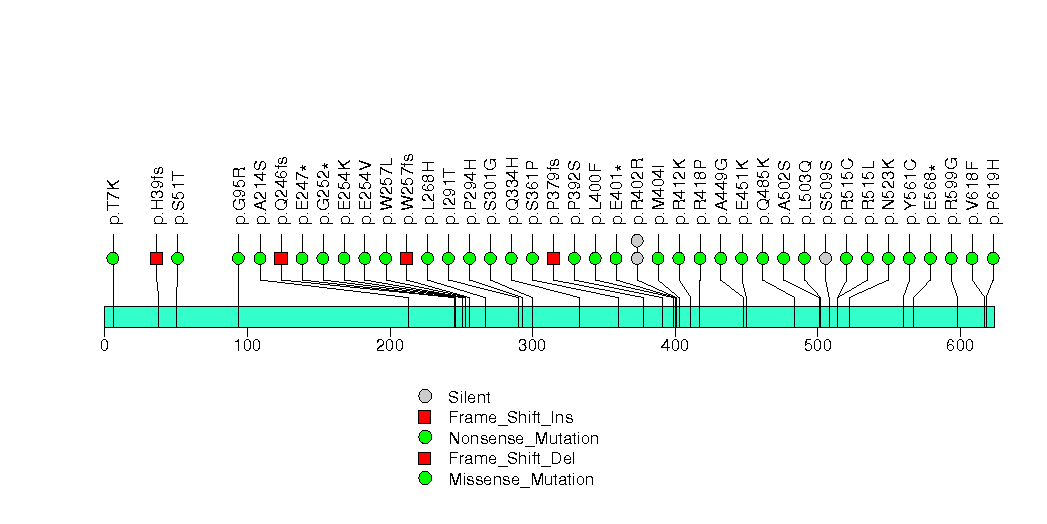
Figure S19. This figure depicts the distribution of mutations and mutation types across the OR4C16 significant gene.
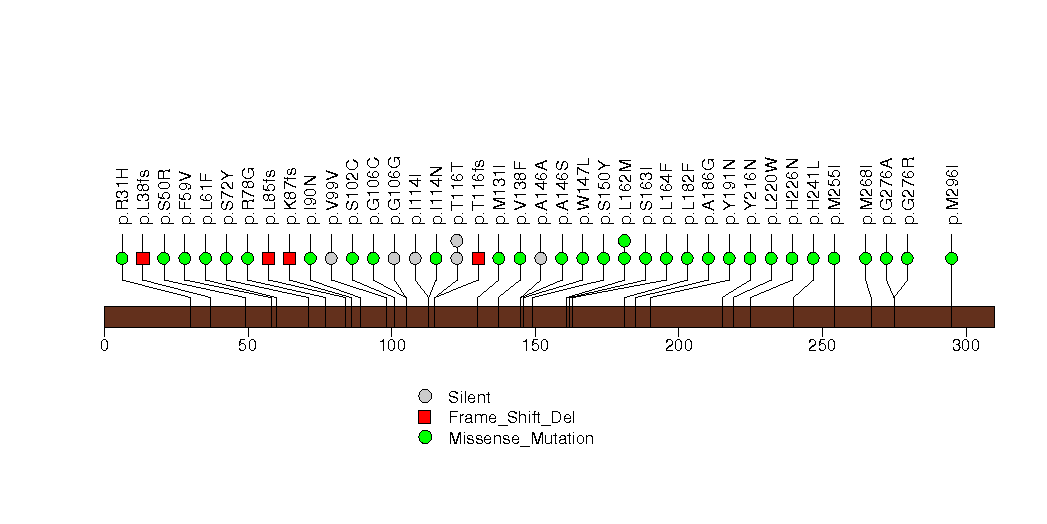
Figure S20. This figure depicts the distribution of mutations and mutation types across the RGS7 significant gene.
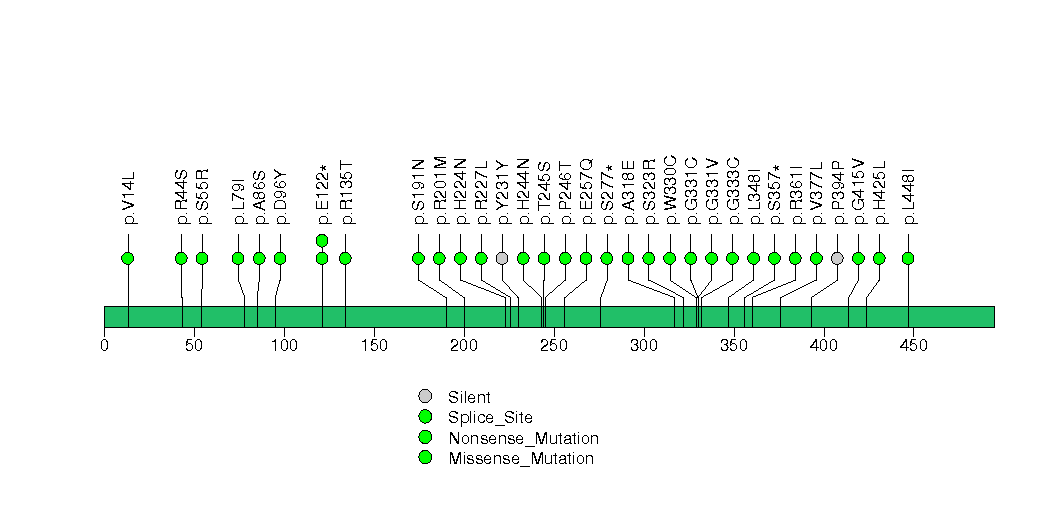
Figure S21. This figure depicts the distribution of mutations and mutation types across the WDR49 significant gene.
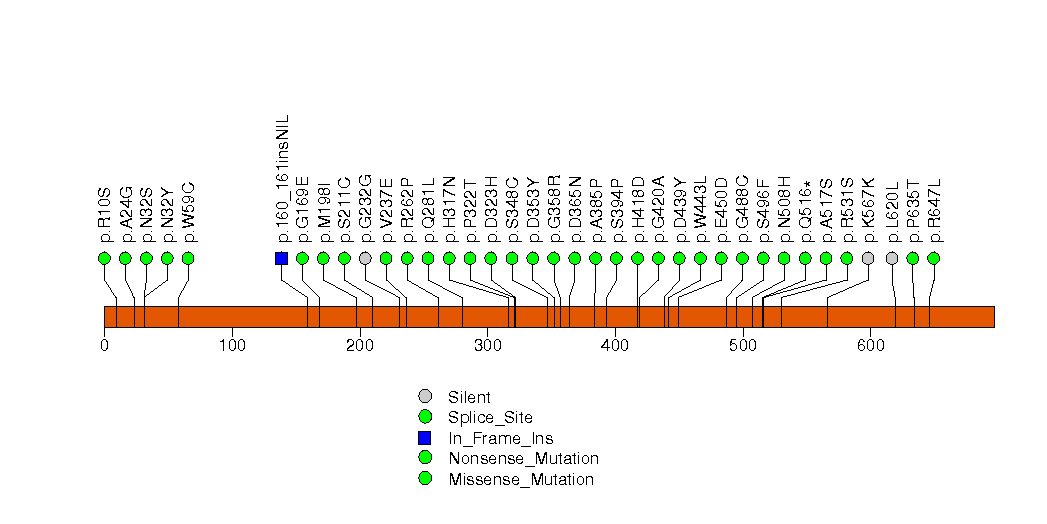
Figure S22. This figure depicts the distribution of mutations and mutation types across the POTEG significant gene.

Figure S23. This figure depicts the distribution of mutations and mutation types across the MUC7 significant gene.
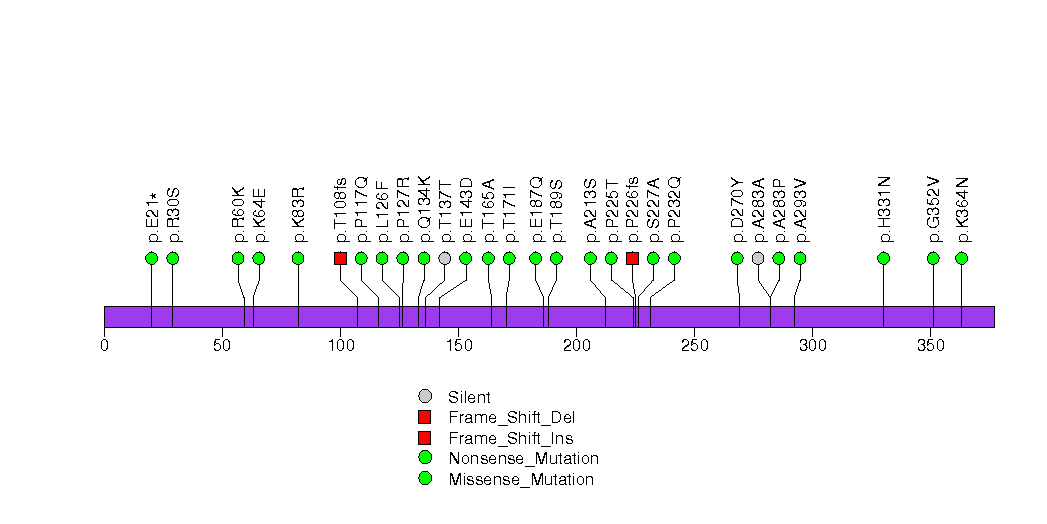
Figure S24. This figure depicts the distribution of mutations and mutation types across the TAS2R1 significant gene.
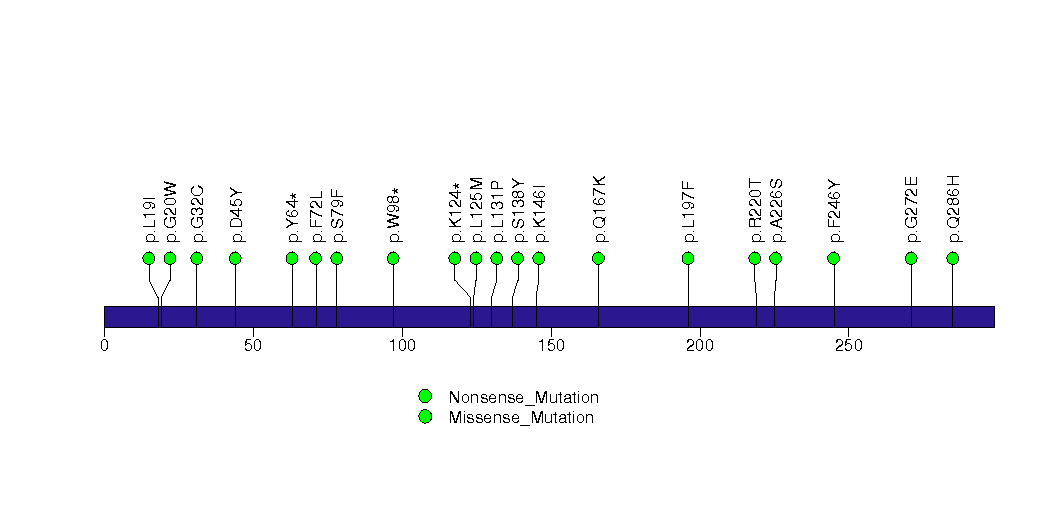
Figure S25. This figure depicts the distribution of mutations and mutation types across the KIAA0408 significant gene.
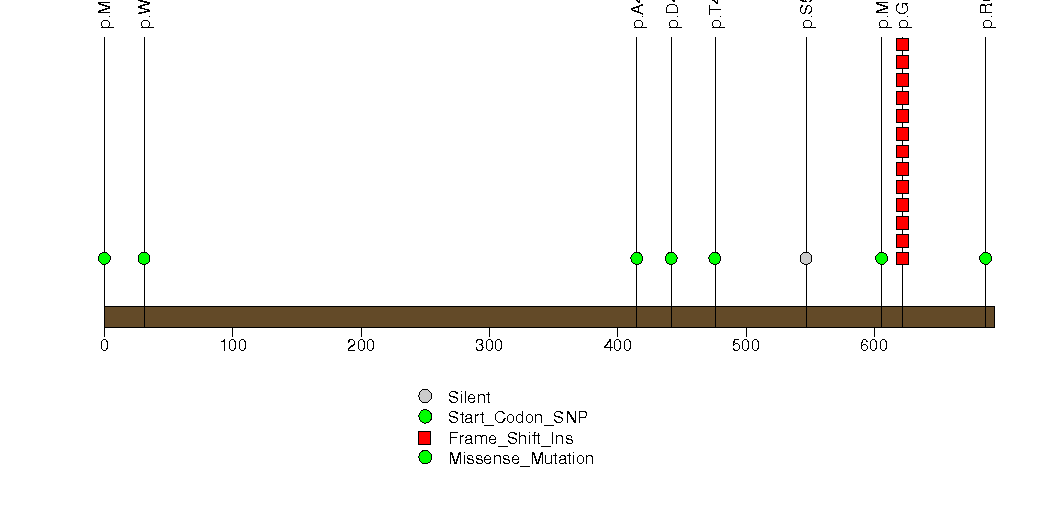
Figure S26. This figure depicts the distribution of mutations and mutation types across the FERD3L significant gene.
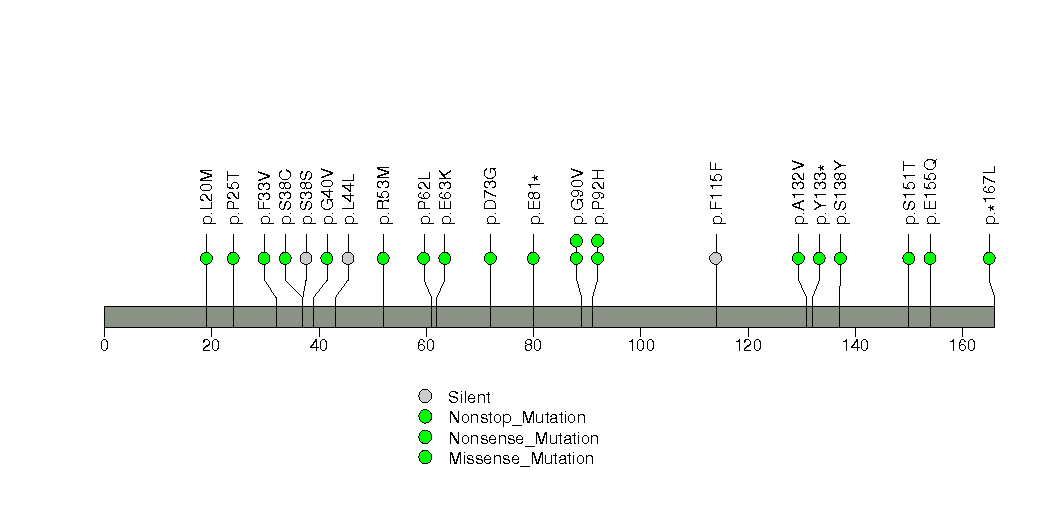
Figure S27. This figure depicts the distribution of mutations and mutation types across the CTNNB1 significant gene.
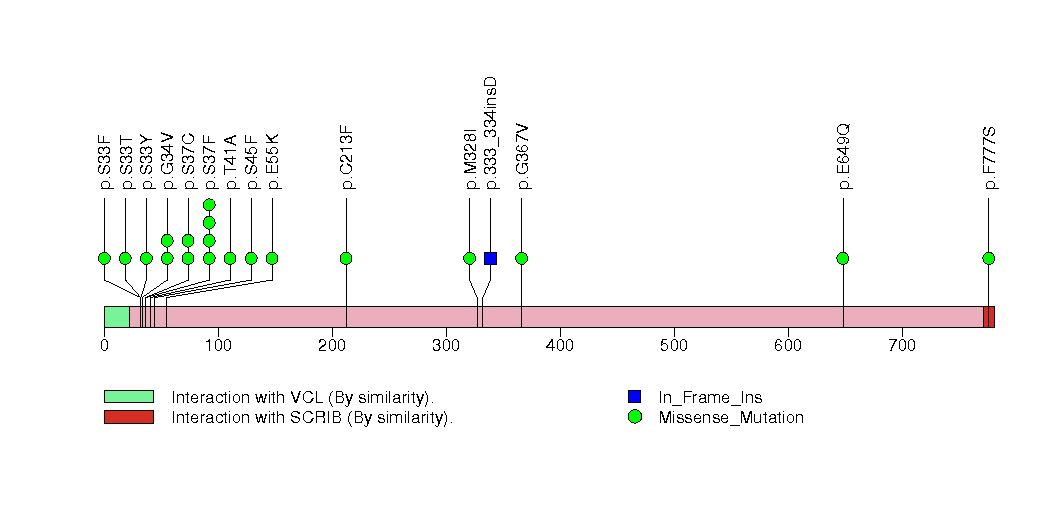
Figure S28. This figure depicts the distribution of mutations and mutation types across the OR5W2 significant gene.
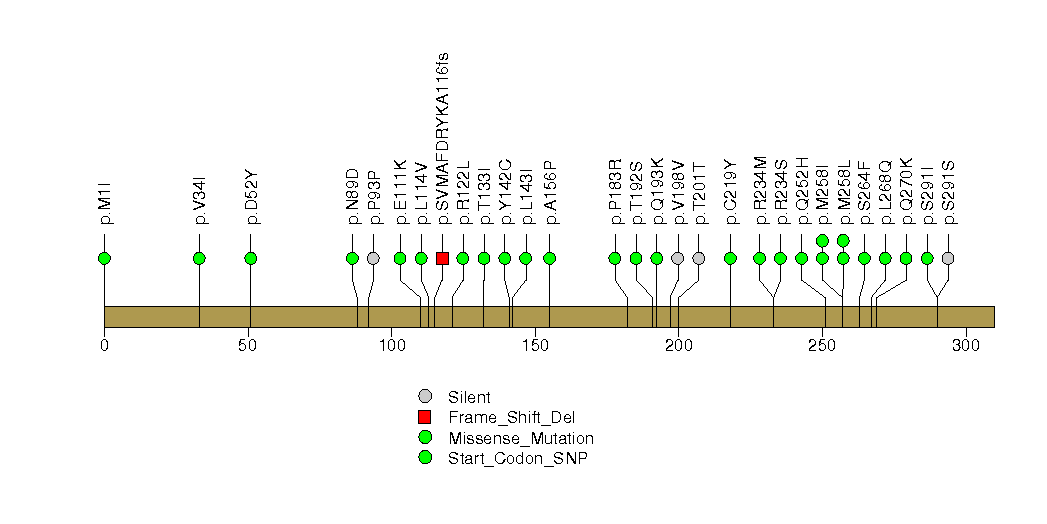
Figure S29. This figure depicts the distribution of mutations and mutation types across the ZNF804A significant gene.
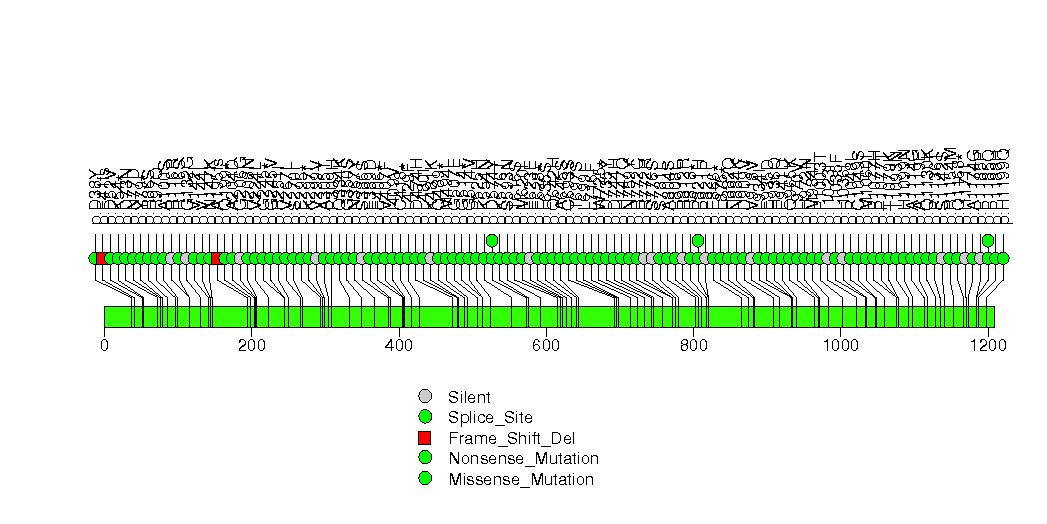
Figure S30. This figure depicts the distribution of mutations and mutation types across the OR8K5 significant gene.
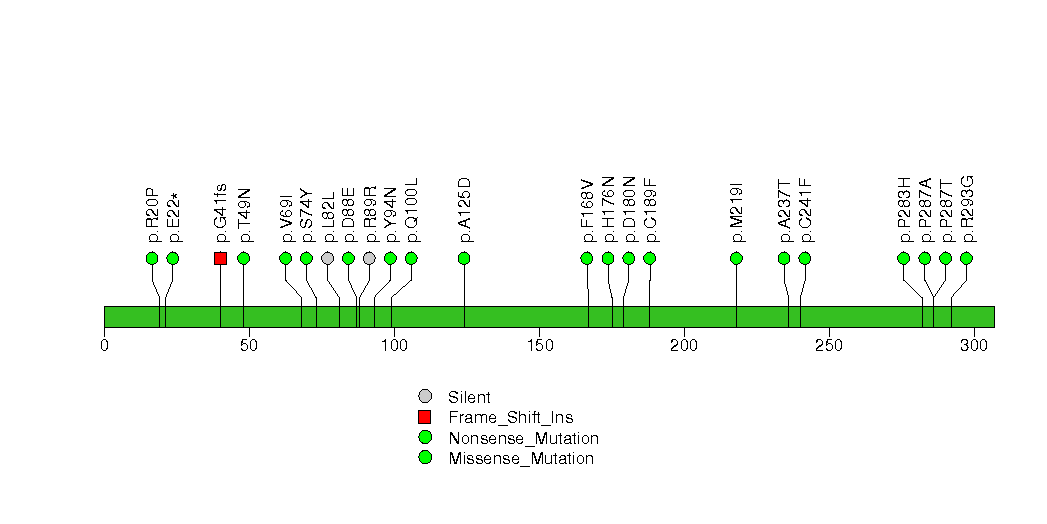
Figure S31. This figure depicts the distribution of mutations and mutation types across the LDB2 significant gene.
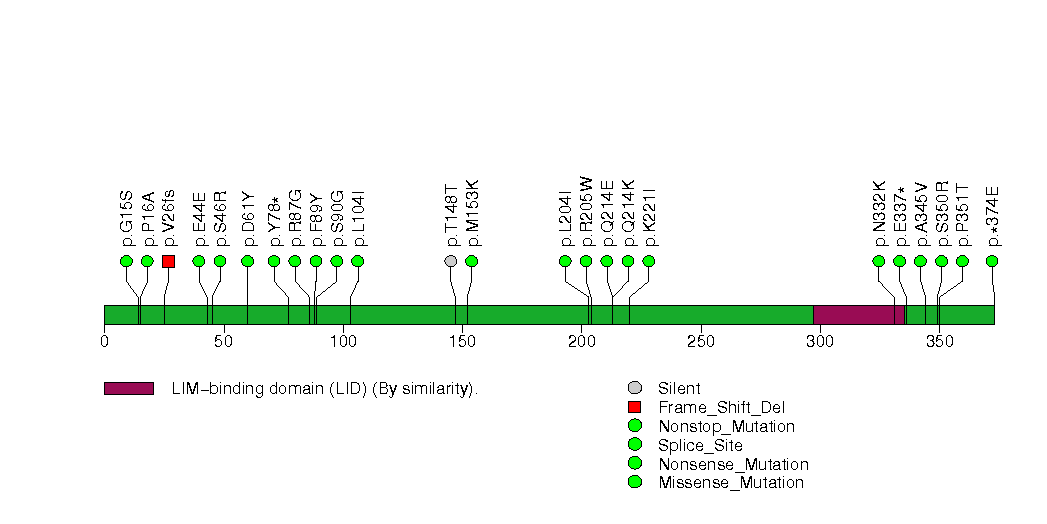
Figure S32. This figure depicts the distribution of mutations and mutation types across the GABRG2 significant gene.
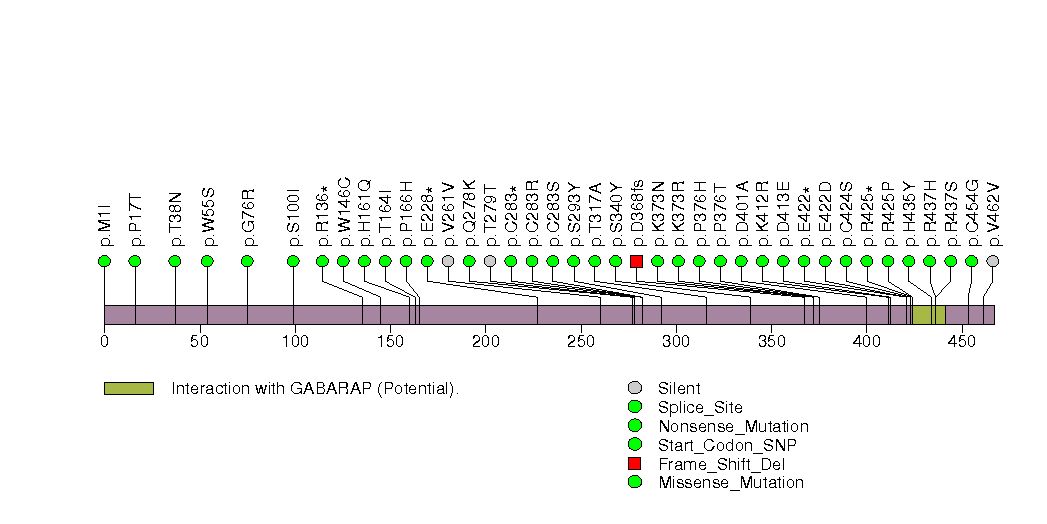
Figure S33. This figure depicts the distribution of mutations and mutation types across the COL11A1 significant gene.
In this analysis, COSMIC is used as a filter to increase power by restricting the territory of each gene. Cosmic version: v48.
Table 4. Get Full Table Significantly mutated genes (COSMIC territory only). To access the database please go to: COSMIC. Number of significant genes found: 39. Number of genes displayed: 10
| rank | gene | description | n | cos | n_cos | N_cos | cos_ev | p | q |
|---|---|---|---|---|---|---|---|---|---|
| 1 | TP53 | tumor protein p53 | 309 | 356 | 296 | 194020 | 42333 | 0 | 0 |
| 2 | EGFR | epidermal growth factor receptor (erythroblastic leukemia viral (v-erb-b) oncogene homolog, avian) | 86 | 293 | 70 | 159685 | 25575 | 0 | 0 |
| 3 | LRP1B | low density lipoprotein-related protein 1B (deleted in tumors) | 333 | 18 | 8 | 9810 | 8 | 2e-13 | 2.7e-10 |
| 4 | KRAS | v-Ki-ras2 Kirsten rat sarcoma viral oncogene homolog | 169 | 52 | 168 | 28340 | 2255476 | 3.2e-13 | 2.7e-10 |
| 5 | MET | met proto-oncogene (hepatocyte growth factor receptor) | 22 | 34 | 9 | 18530 | 73 | 4.3e-13 | 2.7e-10 |
| 6 | BRAF | v-raf murine sarcoma viral oncogene homolog B1 | 44 | 89 | 34 | 48505 | 129957 | 4.6e-13 | 2.7e-10 |
| 7 | CDKN2A | cyclin-dependent kinase inhibitor 2A (melanoma, p16, inhibits CDK4) | 22 | 332 | 21 | 180940 | 418 | 5.4e-13 | 2.7e-10 |
| 8 | STK11 | serine/threonine kinase 11 | 87 | 130 | 56 | 70850 | 153 | 5.6e-13 | 2.7e-10 |
| 9 | CTNNB1 | catenin (cadherin-associated protein), beta 1, 88kDa | 20 | 138 | 14 | 75210 | 4768 | 5.9e-13 | 2.7e-10 |
| 10 | PIK3CA | phosphoinositide-3-kinase, catalytic, alpha polypeptide | 30 | 220 | 23 | 119900 | 7945 | 6.1e-13 | 2.7e-10 |
Note:
n - number of (nonsilent) mutations in this gene across the individual set.
cos = number of unique mutated sites in this gene in COSMIC
n_cos = overlap between n and cos.
N_cos = number of individuals times cos.
cos_ev = total evidence: number of reports in COSMIC for mutations seen in this gene.
p = p-value for seeing the observed amount of overlap in this gene)
q = q-value, False Discovery Rate (Benjamini-Hochberg procedure)
Table 5. Get Full Table A Ranked List of Significantly Mutated Genesets. (Source: MSigDB GSEA Cannonical Pathway Set).Number of significant genesets found: 17. Number of genesets displayed: 10
| rank | geneset | description | genes | N_genes | mut_tally | N | n | npat | nsite | nsil | n1 | n2 | n3 | n4 | n5 | n6 | p_ns_s | p | q |
|---|---|---|---|---|---|---|---|---|---|---|---|---|---|---|---|---|---|---|---|
| 1 | ATRBRCAPATHWAY | BRCA1 and 2 block cell cycle progression in response to DNA damage and promote double-stranded break repair; mutations induce breast cancer susceptibility. | ATM, ATR, BRCA1, BRCA2, CHEK1, CHEK2, FANCA, FANCC, FANCD2, FANCE, FANCF, FANCG, HUS1, MRE11A, NBS1, RAD1, RAD17, RAD50, RAD51, RAD9A, TP53, TREX1 | 21 | ATM(53), ATR(26), BRCA1(22), BRCA2(31), CHEK1(7), CHEK2(10), FANCA(7), FANCC(2), FANCD2(4), FANCE(3), FANCF(4), FANCG(7), HUS1(4), MRE11A(13), RAD1(1), RAD17(6), RAD50(10), RAD51(2), RAD9A(2), TP53(309), TREX1(1) | 35575939 | 524 | 354 | 387 | 37 | 58 | 144 | 83 | 68 | 166 | 5 | <1.00e-15 | <1.00e-15 | <1.23e-13 |
| 2 | ATMPATHWAY | The tumor-suppressing protein kinase ATM responds to radiation-induced DNA damage by blocking cell-cycle progression and activating DNA repair. | ABL1, ATM, BRCA1, CDKN1A, CHEK1, CHEK2, GADD45A, JUN, MAPK8, MDM2, MRE11A, NBS1, NFKB1, NFKBIA, RAD50, RAD51, RBBP8, RELA, TP53, TP73 | 19 | ABL1(9), ATM(53), BRCA1(22), CDKN1A(2), CHEK1(7), CHEK2(10), GADD45A(2), JUN(3), MAPK8(2), MDM2(5), MRE11A(13), NFKB1(6), NFKBIA(4), RAD50(10), RAD51(2), RBBP8(6), RELA(3), TP53(309), TP73(7) | 23963460 | 475 | 347 | 337 | 35 | 59 | 126 | 70 | 56 | 159 | 5 | <1.00e-15 | <1.00e-15 | <1.23e-13 |
| 3 | P53PATHWAY | p53 induces cell cycle arrest or apoptosis under conditions of DNA damage. | APAF1, ATM, BAX, BCL2, CCND1, CCNE1, CDK2, CDK4, CDKN1A, E2F1, GADD45A, MDM2, PCNA, RB1, TIMP3, TP53 | 16 | APAF1(10), ATM(53), BAX(3), BCL2(5), CCND1(3), CCNE1(7), CDK2(1), CDK4(3), CDKN1A(2), E2F1(3), GADD45A(2), MDM2(5), PCNA(1), RB1(33), TIMP3(4), TP53(309) | 14566640 | 444 | 342 | 306 | 24 | 53 | 111 | 57 | 50 | 168 | 5 | <1.00e-15 | <1.00e-15 | <1.23e-13 |
| 4 | PLK3PATHWAY | Active Plk3 phosphorylates CDC25c, blocking the G2/M transition, and phosphorylates p53 to induce apoptosis. | ATM, ATR, CDC25C, CHEK1, CHEK2, CNK, TP53, YWHAH | 7 | ATM(53), ATR(26), CDC25C(8), CHEK1(7), CHEK2(10), TP53(309), YWHAH(1) | 12948811 | 414 | 334 | 278 | 13 | 51 | 105 | 51 | 52 | 150 | 5 | <1.00e-15 | <1.00e-15 | <1.23e-13 |
| 5 | TIDPATHWAY | On ligand binding, interferon gamma receptors stimulate JAK2 kinase to phosphorylate STAT transcription factors, which promote expression of interferon responsive genes. | DNAJA3, HSPA1A, IFNG, IFNGR1, IFNGR2, IKBKB, JAK2, LIN7A, NFKB1, NFKBIA, RB1, RELA, TIP-1, TNF, TNFRSF1A, TNFRSF1B, TP53, USH1C, WT1 | 18 | DNAJA3(2), IFNG(7), IFNGR1(7), IFNGR2(4), IKBKB(9), JAK2(16), LIN7A(7), NFKB1(6), NFKBIA(4), RB1(33), RELA(3), TNF(2), TNFRSF1B(2), TP53(309), USH1C(13), WT1(16) | 14547980 | 440 | 329 | 304 | 37 | 54 | 114 | 55 | 41 | 172 | 4 | <1.00e-15 | <1.00e-15 | <1.23e-13 |
| 6 | G1PATHWAY | CDK4/6-cyclin D and CDK2-cyclin E phosphorylate Rb, which allows the transcription of genes needed for the G1/S cell cycle transition. | ABL1, ATM, ATR, CCNA1, CCND1, CCNE1, CDC2, CDC25A, CDK2, CDK4, CDK6, CDKN1A, CDKN1B, CDKN2A, CDKN2B, DHFR, E2F1, GSK3B, HDAC1, MADH3, MADH4, RB1, SKP2, TFDP1, TGFB1, TGFB2, TGFB3, TP53 | 25 | ABL1(9), ATM(53), ATR(26), CCNA1(7), CCND1(3), CCNE1(7), CDC25A(4), CDK2(1), CDK4(3), CDK6(5), CDKN1A(2), CDKN1B(5), CDKN2A(22), DHFR(2), E2F1(3), GSK3B(4), HDAC1(4), RB1(33), SKP2(3), TFDP1(10), TGFB1(3), TGFB2(10), TP53(309) | 24262756 | 528 | 351 | 385 | 42 | 63 | 138 | 71 | 57 | 194 | 5 | <1.00e-15 | 1.33e-15 | 1.37e-13 |
| 7 | TERTPATHWAY | hTERC, the RNA subunit of telomerase, and hTERT, the catalytic protein subunit, are required for telomerase activity and are overexpressed in many cancers. | HDAC1, MAX, MYC, SP1, SP3, TP53, WT1, ZNF42 | 7 | HDAC1(4), MAX(8), MYC(4), SP1(6), SP3(6), TP53(309), WT1(16) | 5699587 | 353 | 306 | 218 | 16 | 48 | 95 | 38 | 36 | 133 | 3 | <1.00e-15 | 1.89e-15 | 1.66e-13 |
| 8 | RNAPATHWAY | dsRNA-activated protein kinase phosphorylates elF2a, which generally inhibits translation, and activates NF-kB to provoke inflammation. | CHUK, DNAJC3, EIF2S1, EIF2S2, MAP3K14, NFKB1, NFKBIA, PRKR, RELA, TP53 | 9 | CHUK(7), DNAJC3(5), EIF2S2(3), NFKB1(6), NFKBIA(4), RELA(3), TP53(309) | 7863806 | 337 | 303 | 203 | 17 | 43 | 87 | 37 | 38 | 129 | 3 | <1.00e-15 | 2.22e-15 | 1.67e-13 |
| 9 | TELPATHWAY | Telomerase is a ribonucleotide protein that adds telomeric repeats to the 3' ends of chromosomes. | AKT1, BCL2, EGFR, G22P1, HSPCA, IGF1R, KRAS2, MYC, POLR2A, PPP2CA, PRKCA, RB1, TEP1, TERF1, TERT, TNKS, TP53, XRCC5 | 15 | AKT1(3), BCL2(5), EGFR(86), IGF1R(8), MYC(4), POLR2A(11), PPP2CA(1), PRKCA(10), RB1(33), TEP1(39), TERF1(4), TERT(7), TNKS(11), TP53(309), XRCC5(9) | 22681635 | 540 | 351 | 356 | 50 | 62 | 137 | 64 | 70 | 204 | 3 | <1.00e-15 | 2.44e-15 | 1.67e-13 |
| 10 | SA_G1_AND_S_PHASES | Cdk2, 4, and 6 bind cyclin D in G1, while cdk2/cyclin E promotes the G1/S transition. | ARF1, ARF3, CCND1, CDK2, CDK4, CDKN1A, CDKN1B, CDKN2A, CFL1, E2F1, E2F2, MDM2, NXT1, PRB1, TP53 | 15 | ARF1(1), ARF3(1), CCND1(3), CDK2(1), CDK4(3), CDKN1A(2), CDKN1B(5), CDKN2A(22), E2F1(3), E2F2(5), MDM2(5), NXT1(2), PRB1(5), TP53(309) | 6739941 | 367 | 307 | 228 | 15 | 50 | 100 | 42 | 38 | 134 | 3 | <1.00e-15 | 2.89e-15 | 1.77e-13 |
Table 6. Get Full Table A Ranked List of Significantly Mutated Genesets (Excluding Significantly Mutated Genes). Number of significant genesets found: 0. Number of genesets displayed: 10
| rank | geneset | description | genes | N_genes | mut_tally | N | n | npat | nsite | nsil | n1 | n2 | n3 | n4 | n5 | n6 | p_ns_s | p | q |
|---|---|---|---|---|---|---|---|---|---|---|---|---|---|---|---|---|---|---|---|
| 1 | HSA00950_ALKALOID_BIOSYNTHESIS_I | Genes involved in alkaloid biosynthesis I | DDC, GOT1, GOT2, TAT, TYR | 5 | DDC(8), GOT1(3), GOT2(6), TAT(9), TYR(29) | 3808360 | 55 | 53 | 55 | 9 | 8 | 22 | 11 | 6 | 8 | 0 | 0.033 | 0.6 | 1 |
| 2 | HSA00401_NOVOBIOCIN_BIOSYNTHESIS | Genes involved in novobiocin biosynthesis | GOT1, GOT2, TAT | 3 | GOT1(3), GOT2(6), TAT(9) | 2128311 | 18 | 18 | 18 | 2 | 5 | 7 | 3 | 2 | 1 | 0 | 0.076 | 0.62 | 1 |
| 3 | IL18PATHWAY | Pro-inflammatory IL-18 is activated in macrophages by caspase-1 cleavage and, in conjunction with IL-12, stimulates Th1 cell differentiation. | CASP1, IFNG, IL12A, IL12B, IL18, IL2 | 6 | CASP1(8), IFNG(7), IL12A(2), IL12B(3), IL2(7) | 2403481 | 27 | 26 | 27 | 5 | 1 | 16 | 0 | 1 | 8 | 1 | 0.2 | 0.73 | 1 |
| 4 | PLK3PATHWAY | Active Plk3 phosphorylates CDC25c, blocking the G2/M transition, and phosphorylates p53 to induce apoptosis. | ATM, ATR, CDC25C, CHEK1, CHEK2, CNK, TP53, YWHAH | 6 | ATM(53), ATR(26), CDC25C(8), CHEK1(7), CHEK2(10), YWHAH(1) | 12280972 | 105 | 90 | 103 | 9 | 9 | 26 | 18 | 19 | 31 | 2 | 0.00048 | 0.79 | 1 |
| 5 | HSA00472_D_ARGININE_AND_D_ORNITHINE_METABOLISM | Genes involved in D-arginine and D-ornithine metabolism | DAO | 1 | DAO(7) | 584333 | 7 | 7 | 7 | 3 | 2 | 1 | 0 | 2 | 2 | 0 | 0.74 | 0.93 | 1 |
| 6 | PEPIPATHWAY | Proepithelin (PEPI) induces epithelial cells to secrete IL-8, which promotes elastase secretion by neutrophils. | ELA1, ELA2, ELA2A, ELA2B, ELA3B, GRN, IL8, SLPI | 3 | GRN(6), SLPI(1) | 1382720 | 7 | 7 | 6 | 1 | 1 | 2 | 1 | 1 | 2 | 0 | 0.35 | 0.93 | 1 |
| 7 | HSA00031_INOSITOL_METABOLISM | Genes involved in inositol metabolism | ALDH6A1, TPI1 | 2 | ALDH6A1(2), TPI1(9) | 1324024 | 11 | 10 | 11 | 3 | 1 | 3 | 5 | 0 | 2 | 0 | 0.59 | 0.96 | 1 |
| 8 | SULFUR_METABOLISM | BPNT1, PAPSS1, PAPSS2, SULT1A2, SULT1A3, SULT1A3, SULT1A4, SULT1E1, SULT2A1, SUOX | 7 | BPNT1(7), PAPSS1(5), PAPSS2(10), SULT1A2(5), SULT1E1(11), SULT2A1(6), SUOX(5) | 4954097 | 49 | 45 | 49 | 7 | 3 | 21 | 9 | 7 | 9 | 0 | 0.037 | 0.98 | 1 | |
| 9 | HSA00471_D_GLUTAMINE_AND_D_GLUTAMATE_METABOLISM | Genes involved in D-glutamine and D-glutamate metabolism | GLS, GLS2, GLUD1, GLUD2 | 4 | GLS(8), GLS2(6), GLUD1(4), GLUD2(15) | 3672284 | 33 | 31 | 33 | 5 | 0 | 17 | 9 | 2 | 5 | 0 | 0.13 | 0.98 | 1 |
| 10 | ASBCELLPATHWAY | B cells require interaction with helper T cells to produce antigen-specific immunoglobulins as a key element of the human immune response. | CD28, CD4, CD80, HLA-DRA, HLA-DRB1, IL10, IL2, IL4, TNFRSF5, TNFRSF6, TNFSF5, TNFSF6 | 8 | CD28(4), CD4(8), CD80(3), HLA-DRA(3), HLA-DRB1(5), IL10(2), IL2(7), IL4(1) | 3223968 | 33 | 29 | 29 | 7 | 1 | 14 | 1 | 3 | 14 | 0 | 0.42 | 0.99 | 1 |
In brief, we tabulate the number of mutations and the number of covered bases for each gene. The counts are broken down by mutation context category: four context categories that are discovered by MutSig, and one for indel and 'null' mutations, which include indels, nonsense mutations, splice-site mutations, and non-stop (read-through) mutations. For each gene, we calculate the probability of seeing the observed constellation of mutations, i.e. the product P1 x P2 x ... x Pm, or a more extreme one, given the background mutation rates calculated across the dataset. [1]
In addition to the links below, the full results of the analysis summarized in this report can also be downloaded programmatically using firehose_get, or interactively from either the Broad GDAC website or TCGA Data Coordination Center Portal.