This pipeline performs Gene Set Enrichment Analysis (GSEA) using The Broad Institute GSEA tool with MSigDB - Class2: Canonical Pathways gene sets. For a given phenotype subtype, it shows what pathways are significantly enriched in each subtype by comparing gene expression profiles between subtypes. Here, the phenotype is mRNAseq_cNMF subtypes having more than three samples and the input expression file "PAAD-TP.uncv2.mRNAseq_RSEM_normalized_log2.txt" is generated in the pipeline mRNAseq_Preprocess in the stddata run. This pipeline has the following features:
-
For each subtype, calculates enrichment scores (ES) using signal to noise (S2N) that checks similarity between subtypes in expression level then calculates p values through permutation test.
-
Lists pathways significantly enriched in each phenotype subtype and their enrichment scores (ES).
-
Lists top 20 core genes enriched in each significant gene set and their enrichment scores (ES).
-
Checks if the top core genes are up-regulated or down-regulated.
-
Checks if the top core genes are high expressed or low expressed.
-
Checks if the top core genes are significantly differently expressed genes.
Table 1. Get Full Table basic data info
| basic data info |
|---|
| Number of Gene Sets: 730 |
| Number of samples: 178 |
| Original number of Gene Sets: 1320 |
| Maximum gene set size: 933 |
Table 2. Get Full Table pheno data info
| phenotype info |
|---|
| pheno.type: 1 - 5 :[ clus1 ] 39 |
| pheno.type: 2 - 5 :[ clus2 ] 26 |
| pheno.type: 3 - 5 :[ clus3 ] 43 |
| pheno.type: 4 - 5 :[ clus4 ] 40 |
| pheno.type: 5 - 5 :[ clus5 ] 30 |
For the expression subtypes of 18475 genes in 179 samples, GSEA found enriched gene sets in each cluster using 178 gene sets in MSigDB canonical pathways. Top enriched gene sets are listed as below.
-
clus1
-
Top enriched gene sets are KEGG PENTOSE AND GLUCURONATE INTERCONVERSIONS, KEGG FRUCTOSE AND MANNOSE METABOLISM, KEGG STEROID HORMONE BIOSYNTHESIS, KEGG RETINOL METABOLISM, KEGG PORPHYRIN AND CHLOROPHYLL METABOLISM, KEGG AMINOACYL TRNA BIOSYNTHESIS, KEGG METABOLISM OF XENOBIOTICS BY CYTOCHROME P450, KEGG DRUG METABOLISM CYTOCHROME P450, KEGG DRUG METABOLISM OTHER ENZYMES, KEGG BASE EXCISION REPAIR
-
And common core enriched genes are UGT1A1, UGT1A10, UGT1A3, UGT1A4, UGT1A6, UGT1A7, UGT1A8, UGT1A9, UGT2A3, UGT2B10
-
clus2
-
Top enriched gene sets are KEGG LYSINE DEGRADATION, KEGG GLYCOSYLPHOSPHATIDYLINOSITOL GPI ANCHOR BIOSYNTHESIS, BIOCARTA BIOPEPTIDES PATHWAY, BIOCARTA CHREBP2 PATHWAY, SIG CD40PATHWAYMAP, PID P38 MKK3 6PATHWAY, PID LKB1 PATHWAY, PID LIS1PATHWAY, PID HEDGEHOG GLIPATHWAY, REACTOME TRANS GOLGI NETWORK VESICLE BUDDING
-
And common core enriched genes are MLXIPL, PKLR, PRKAR2B, OGDHL, PIPOX, GCK, PPP2R2B, PPP2R2C, PPP2R3B, CACNG2
-
clus3
-
Top enriched gene sets are KEGG DNA REPLICATION, KEGG CELL CYCLE, KEGG P53 SIGNALING PATHWAY, BIOCARTA RACCYCD PATHWAY, PID P73PATHWAY, PID E2F PATHWAY, PID ATR PATHWAY, PID FRA PATHWAY, PID MYC ACTIVPATHWAY, PID PLK1 PATHWAY
-
And common core enriched genes are CCNB1, CDK1, CDK2, CCNA2, CCNB2, PLK1, CCNE2, CDK6, CHEK1, AZI1
-
clus4
-
Top enriched gene sets are KEGG FATTY ACID METABOLISM, KEGG SELENOAMINO ACID METABOLISM, KEGG GLUTATHIONE METABOLISM, KEGG GLYCEROLIPID METABOLISM, KEGG PROPANOATE METABOLISM, KEGG ENDOCYTOSIS, SIG PIP3 SIGNALING IN CARDIAC MYOCTES, SIG CHEMOTAXIS, SIG REGULATION OF THE ACTIN CYTOSKELETON BY RHO GTPASES, PID INSULIN PATHWAY
-
And common core enriched genes are ERBB4, F2RL2, CBS, CTH, GGT1, GGT6, MAT1A, EGF, FOXO3, NRG2
-
clus5
-
Top enriched gene sets are KEGG PURINE METABOLISM, KEGG GLYCOSAMINOGLYCAN BIOSYNTHESIS HEPARAN SULFATE, KEGG ABC TRANSPORTERS, KEGG MAPK SIGNALING PATHWAY, KEGG CYTOKINE CYTOKINE RECEPTOR INTERACTION, KEGG PHOSPHATIDYLINOSITOL SIGNALING SYSTEM, KEGG NEUROACTIVE LIGAND RECEPTOR INTERACTION, KEGG OOCYTE MEIOSIS, KEGG MTOR SIGNALING PATHWAY, KEGG APOPTOSIS
-
And common core enriched genes are FYN, HCK, LCK, PSMA8, SLC2A4, BLK, PIK3CD, AP1S2, APOBEC3G, CD247
Table 3. Get Full Table This table shows top 10 pathways which are significantly enriched in cluster clus1. It displays only significant gene sets satisfying nom.p.val.threshold (-1), fwer.p.val.threshold (-1) , fdr.q.val.threshold (0.25) and the default table is sorted by Normalized Enrichment Score (NES). Further details on NES statistics, please visit The Broad GSEA website.
| GeneSet(GS) | Size(#genes) | genes.ES.table | ES | NES | NOM.p.val | FDR.q.val | FWER.p.val | Tag.. | Gene.. | Signal | FDR..median. | glob.p.val |
|---|---|---|---|---|---|---|---|---|---|---|---|---|
| KEGG PENTOSE AND GLUCURONATE INTERCONVERSIONS | 26 | genes.ES.table | 0.81 | 1.7 | 0.0065 | 1 | 0.81 | 0.58 | 0.066 | 0.54 | 0.51 | 0.3 |
| KEGG FRUCTOSE AND MANNOSE METABOLISM | 34 | genes.ES.table | 0.44 | 1.4 | 0.1 | 1 | 1 | 0.32 | 0.16 | 0.27 | 0.95 | 0.47 |
| KEGG STEROID HORMONE BIOSYNTHESIS | 50 | genes.ES.table | 0.61 | 1.4 | 0.043 | 1 | 0.99 | 0.46 | 0.068 | 0.43 | 0.91 | 0.45 |
| KEGG RETINOL METABOLISM | 59 | genes.ES.table | 0.72 | 1.7 | 0 | 1 | 0.85 | 0.64 | 0.13 | 0.56 | 0.5 | 0.29 |
| KEGG PORPHYRIN AND CHLOROPHYLL METABOLISM | 38 | genes.ES.table | 0.64 | 1.6 | 0.044 | 1 | 0.96 | 0.34 | 0.066 | 0.32 | 0.63 | 0.32 |
| KEGG AMINOACYL TRNA BIOSYNTHESIS | 41 | genes.ES.table | 0.41 | 1.5 | 0.13 | 1 | 0.99 | 1 | 0.59 | 0.41 | 0.82 | 0.4 |
| KEGG METABOLISM OF XENOBIOTICS BY CYTOCHROME P450 | 65 | genes.ES.table | 0.67 | 1.5 | 0.015 | 0.86 | 0.97 | 0.58 | 0.14 | 0.51 | 0.53 | 0.26 |
| KEGG DRUG METABOLISM CYTOCHROME P450 | 66 | genes.ES.table | 0.62 | 1.4 | 0.047 | 1 | 0.99 | 0.48 | 0.082 | 0.45 | 0.94 | 0.46 |
| KEGG DRUG METABOLISM OTHER ENZYMES | 47 | genes.ES.table | 0.71 | 1.7 | 0 | 1 | 0.78 | 0.47 | 0.066 | 0.44 | 0.68 | 0.39 |
| KEGG BASE EXCISION REPAIR | 33 | genes.ES.table | 0.58 | 1.7 | 0.054 | 1 | 0.76 | 0.46 | 0.24 | 0.35 | 1 | 0.56 |
Table S1. Get Full Table This table shows a Running Enrichment Score (RES) of each gene in this pathway, that is, the enrichment score at this point in the ranked list of genes. All genes are ranked by Signal-to-Noise (S2N), a measure of similarity as default and are used to obtain ES matrix of all genes. In this way, GSEA tool uses expression pattern of not only overlapped genes but also not-overlapped genes to produce ES matrix.
| Rank | GENE | SYMBOL | DESC | LIST.LOC | S2N | RES | CORE_ENRICHMENT |
|---|---|---|---|---|---|---|---|
| 1 | POLE2 | POLE2 | POLE2 | 996 | 0.22 | 0.051 | YES |
| 2 | NTHL1 | NTHL1 | NTHL1 | 1367 | 0.18 | 0.12 | YES |
| 3 | NEIL3 | NEIL3 | NEIL3 | 1476 | 0.17 | 0.19 | YES |
| 4 | MUTYH | MUTYH | MUTYH | 1666 | 0.15 | 0.25 | YES |
| 5 | NEIL1 | NEIL1 | NEIL1 | 1958 | 0.13 | 0.3 | YES |
| 6 | POLD4 | POLD4 | POLD4 | 1971 | 0.13 | 0.36 | YES |
| 7 | PARP3 | PARP3 | PARP3 | 2038 | 0.13 | 0.41 | YES |
| 8 | SMUG1 | SMUG1 | SMUG1 | 2457 | 0.11 | 0.44 | YES |
| 9 | PARP4 | PARP4 | PARP4 | 2590 | 0.1 | 0.48 | YES |
| 10 | POLD3 | POLD3 | POLD3 | 2637 | 0.098 | 0.52 | YES |
| 11 | POLE | POLE | POLE | 3224 | 0.078 | 0.53 | YES |
| 12 | MPG | MPG | MPG | 3485 | 0.071 | 0.55 | YES |
| 13 | POLB | POLB | POLB | 3556 | 0.069 | 0.58 | YES |
| 14 | POLL | POLL | POLL | 4057 | 0.056 | 0.57 | YES |
| 15 | POLD2 | POLD2 | POLD2 | 4437 | 0.048 | 0.58 | YES |
| 16 | POLE4 | POLE4 | POLE4 | 4846 | 0.04 | 0.57 | NO |
| 17 | APEX2 | APEX2 | APEX2 | 5141 | 0.034 | 0.57 | NO |
| 18 | OGG1 | OGG1 | OGG1 | 5434 | 0.029 | 0.57 | NO |
| 19 | PCNA | PCNA | PCNA | 6042 | 0.02 | 0.55 | NO |
| 20 | MBD4 | MBD4 | MBD4 | 6332 | 0.016 | 0.54 | NO |
| 21 | LIG3 | LIG3 | LIG3 | 6371 | 0.016 | 0.55 | NO |
| 22 | POLD1 | POLD1 | POLD1 | 6586 | 0.012 | 0.54 | NO |
| 23 | HMGB1 | HMGB1 | HMGB1 | 6914 | 0.0078 | 0.52 | NO |
| 24 | UNG | UNG | UNG | 6977 | 0.0071 | 0.52 | NO |
| 25 | LIG1 | LIG1 | LIG1 | 7154 | 0.005 | 0.52 | NO |
| 26 | APEX1 | APEX1 | APEX1 | 7626 | -0.0017 | 0.49 | NO |
| 27 | TDG | TDG | TDG | 7780 | -0.0037 | 0.49 | NO |
| 28 | XRCC1 | XRCC1 | XRCC1 | 7956 | -0.006 | 0.48 | NO |
| 29 | FEN1 | FEN1 | FEN1 | 8038 | -0.007 | 0.48 | NO |
| 30 | PARP1 | PARP1 | PARP1 | 8813 | -0.019 | 0.45 | NO |
| 31 | POLE3 | POLE3 | POLE3 | 8921 | -0.021 | 0.45 | NO |
| 32 | PARP2 | PARP2 | PARP2 | 10309 | -0.043 | 0.4 | NO |
| 33 | NEIL2 | NEIL2 | NEIL2 | 12673 | -0.1 | 0.31 | NO |
Figure S1. Get High-res Image This plot shows mRNAseq_cNMF expression data heatmap (on the left) a RunningEnrichmentScore(RES) plot (on the top right) and a Signal2Noise(S2N) plot (on the bottom right) of genes in the pathway: KEGG PENTOSE AND GLUCURONATE INTERCONVERSIONS.
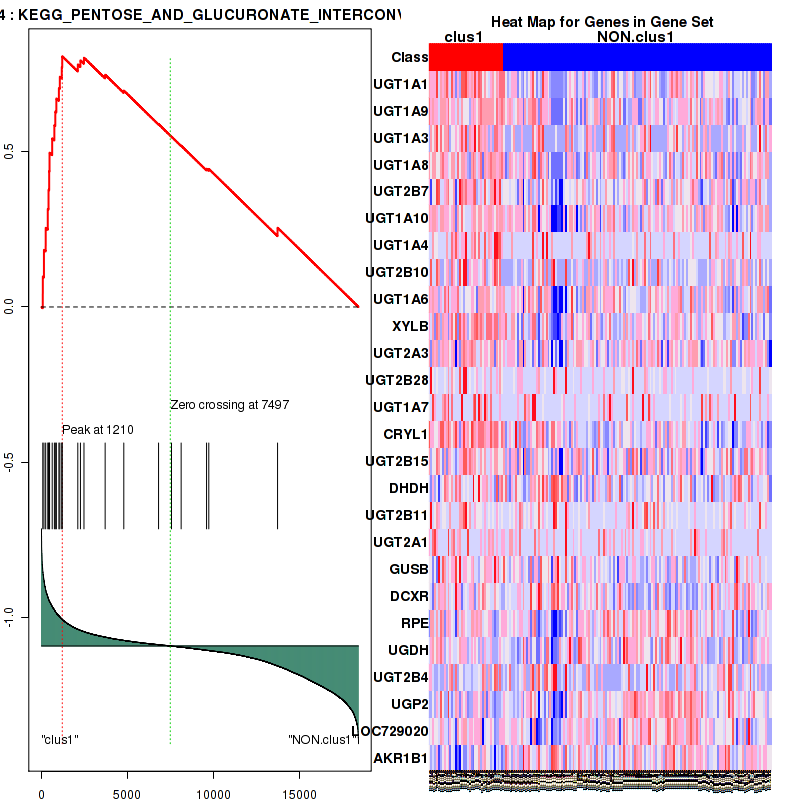
Figure S2. Get High-res Image For the top 5 core enriched genes in the pathway: KEGG PENTOSE AND GLUCURONATE INTERCONVERSIONS, this volcano plot shows how much they are up/down-regulated and significant. The significance was calculated by empirical bayesian fit
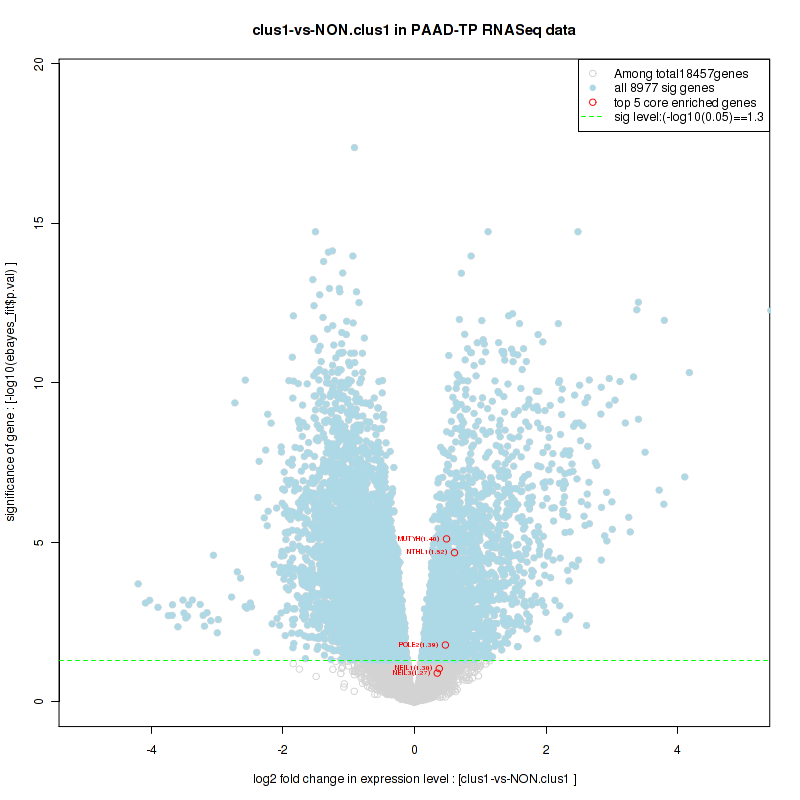
Table S2. Get Full Table This table shows a Running Enrichment Score (RES) of each gene in this pathway, that is, the enrichment score at this point in the ranked list of genes. All genes are ranked by Signal-to-Noise (S2N), a measure of similarity as default and are used to obtain ES matrix of all genes. In this way, GSEA tool uses expression pattern of not only overlapped genes but also not-overlapped genes to produce ES matrix.
| Rank | GENE | SYMBOL | DESC | LIST.LOC | S2N | RES | CORE_ENRICHMENT |
|---|---|---|---|---|---|---|---|
| 1 | CYP3A7 | CYP3A7 | CYP3A7 | 70 | 0.56 | 0.055 | YES |
| 2 | UGT1A1 | UGT1A1 | UGT1A1 | 78 | 0.55 | 0.11 | YES |
| 3 | UGT1A9 | UGT1A9 | UGT1A9 | 145 | 0.48 | 0.16 | YES |
| 4 | NAT2 | NAT2 | NAT2 | 156 | 0.47 | 0.21 | YES |
| 5 | CYP3A5 | CYP3A5 | CYP3A5 | 236 | 0.42 | 0.25 | YES |
| 6 | UGT1A3 | UGT1A3 | UGT1A3 | 246 | 0.41 | 0.29 | YES |
| 7 | CYP3A4 | CYP3A4 | CYP3A4 | 274 | 0.4 | 0.33 | YES |
| 8 | CYP2A7 | CYP2A7 | CYP2A7 | 296 | 0.39 | 0.37 | YES |
| 9 | UGT1A8 | UGT1A8 | UGT1A8 | 367 | 0.36 | 0.4 | YES |
| 10 | UGT2B7 | UGT2B7 | UGT2B7 | 412 | 0.34 | 0.44 | YES |
| 11 | UGT1A10 | UGT1A10 | UGT1A10 | 450 | 0.33 | 0.47 | YES |
| 12 | UGT1A4 | UGT1A4 | UGT1A4 | 470 | 0.33 | 0.5 | YES |
| 13 | UGT2B10 | UGT2B10 | UGT2B10 | 624 | 0.29 | 0.52 | YES |
| 14 | UGT1A6 | UGT1A6 | UGT1A6 | 751 | 0.27 | 0.55 | YES |
| 15 | XDH | XDH | XDH | 845 | 0.25 | 0.57 | YES |
| 16 | UGT2A3 | UGT2A3 | UGT2A3 | 867 | 0.24 | 0.59 | YES |
| 17 | CYP2A6 | CYP2A6 | CYP2A6 | 872 | 0.24 | 0.62 | YES |
| 18 | UGT2B28 | UGT2B28 | UGT2B28 | 1015 | 0.22 | 0.63 | YES |
| 19 | UGT1A7 | UGT1A7 | UGT1A7 | 1069 | 0.21 | 0.65 | YES |
| 20 | NAT1 | NAT1 | NAT1 | 1080 | 0.21 | 0.67 | YES |
| 21 | CES2 | CES2 | CES2 | 1134 | 0.2 | 0.69 | YES |
| 22 | UGT2B15 | UGT2B15 | UGT2B15 | 1210 | 0.19 | 0.71 | YES |
| 23 | UCK2 | UCK2 | UCK2 | 2189 | 0.12 | 0.67 | NO |
| 24 | UGT2B11 | UGT2B11 | UGT2B11 | 2269 | 0.12 | 0.67 | NO |
| 25 | TPMT | TPMT | TPMT | 2272 | 0.11 | 0.69 | NO |
| 26 | UGT2A1 | UGT2A1 | UGT2A1 | 2473 | 0.1 | 0.69 | NO |
| 27 | TK1 | TK1 | TK1 | 2723 | 0.095 | 0.68 | NO |
| 28 | ITPA | ITPA | ITPA | 3059 | 0.083 | 0.67 | NO |
| 29 | HPRT1 | HPRT1 | HPRT1 | 3611 | 0.068 | 0.65 | NO |
| 30 | GUSB | GUSB | GUSB | 3708 | 0.065 | 0.65 | NO |
| 31 | UCKL1 | UCKL1 | UCKL1 | 4659 | 0.044 | 0.6 | NO |
| 32 | UMPS | UMPS | UMPS | 6016 | 0.02 | 0.53 | NO |
| 33 | IMPDH2 | IMPDH2 | IMPDH2 | 6031 | 0.02 | 0.54 | NO |
| 34 | GMPS | GMPS | GMPS | 7038 | 0.0064 | 0.48 | NO |
| 35 | TK2 | TK2 | TK2 | 7463 | 0.00044 | 0.46 | NO |
| 36 | UPP1 | UPP1 | UPP1 | 7991 | -0.0065 | 0.43 | NO |
| 37 | UGT2B4 | UGT2B4 | UGT2B4 | 8130 | -0.0082 | 0.42 | NO |
| 38 | CYP3A43 | CYP3A43 | CYP3A43 | 9192 | -0.024 | 0.37 | NO |
| 39 | IMPDH1 | IMPDH1 | IMPDH1 | 10073 | -0.039 | 0.32 | NO |
| 40 | CDA | CDA | CDA | 10342 | -0.043 | 0.31 | NO |
| 41 | UCK1 | UCK1 | UCK1 | 11628 | -0.07 | 0.25 | NO |
| 42 | TYMP | TYMP | TYMP | 11639 | -0.07 | 0.26 | NO |
| 43 | CES1 | CES1 | CES1 | 13275 | -0.12 | 0.18 | NO |
| 44 | DPYD | DPYD | DPYD | 14195 | -0.17 | 0.15 | NO |
| 45 | UPP2 | UPP2 | UPP2 | 14772 | -0.2 | 0.14 | NO |
| 46 | DPYS | DPYS | DPYS | 15830 | -0.27 | 0.11 | NO |
| 47 | UPB1 | UPB1 | UPB1 | 16405 | -0.3 | 0.11 | NO |
Figure S3. Get High-res Image This plot shows mRNAseq_cNMF expression data heatmap (on the left) a RunningEnrichmentScore(RES) plot (on the top right) and a Signal2Noise(S2N) plot (on the bottom right) of genes in the pathway: KEGG FRUCTOSE AND MANNOSE METABOLISM.
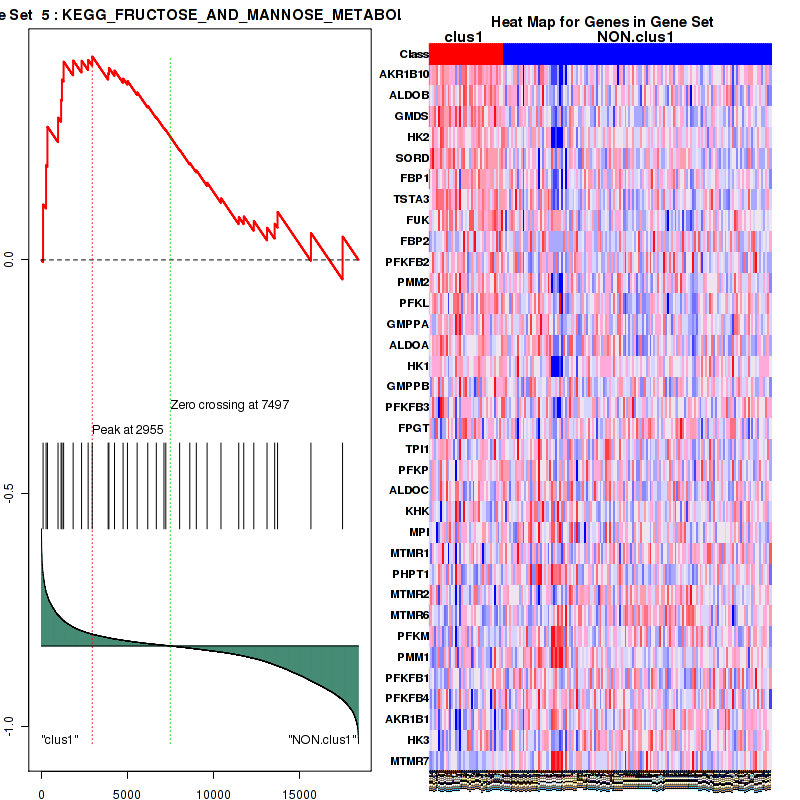
Figure S4. Get High-res Image For the top 5 core enriched genes in the pathway: KEGG FRUCTOSE AND MANNOSE METABOLISM, this volcano plot shows how much they are up/down-regulated and significant. The significance was calculated by empirical bayesian fit
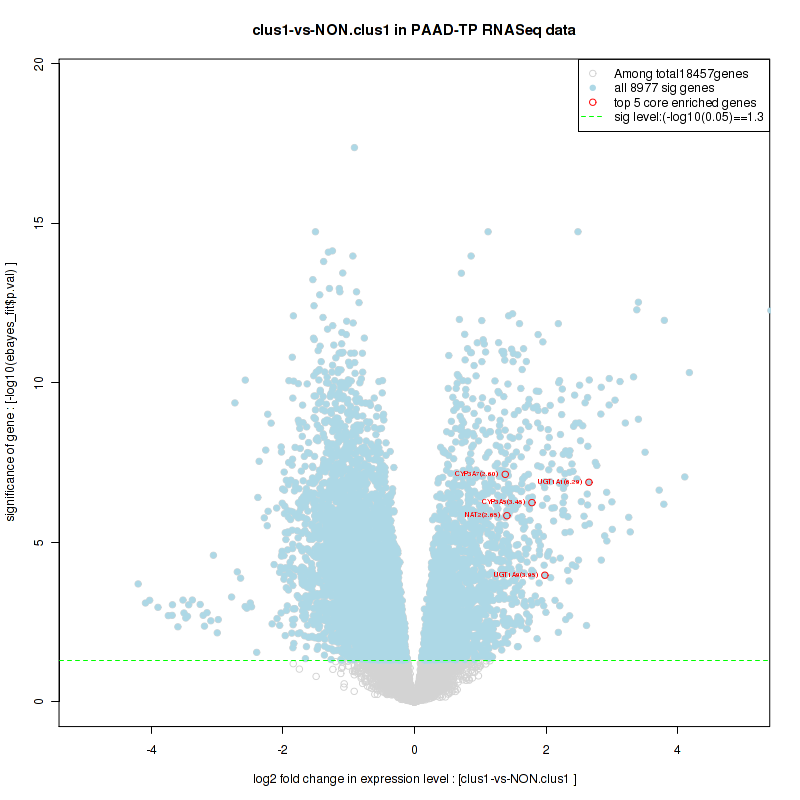
Table S3. Get Full Table This table shows a Running Enrichment Score (RES) of each gene in this pathway, that is, the enrichment score at this point in the ranked list of genes. All genes are ranked by Signal-to-Noise (S2N), a measure of similarity as default and are used to obtain ES matrix of all genes. In this way, GSEA tool uses expression pattern of not only overlapped genes but also not-overlapped genes to produce ES matrix.
| Rank | GENE | SYMBOL | DESC | LIST.LOC | S2N | RES | CORE_ENRICHMENT |
|---|---|---|---|---|---|---|---|
| 1 | UGT1A1 | UGT1A1 | UGT1A1 | 78 | 0.55 | 0.098 | YES |
| 2 | UGT1A9 | UGT1A9 | UGT1A9 | 145 | 0.48 | 0.18 | YES |
| 3 | UGT1A3 | UGT1A3 | UGT1A3 | 246 | 0.41 | 0.26 | YES |
| 4 | UGT1A8 | UGT1A8 | UGT1A8 | 367 | 0.36 | 0.32 | YES |
| 5 | UGT2B7 | UGT2B7 | UGT2B7 | 412 | 0.34 | 0.38 | YES |
| 6 | UGT1A10 | UGT1A10 | UGT1A10 | 450 | 0.33 | 0.44 | YES |
| 7 | UGT1A4 | UGT1A4 | UGT1A4 | 470 | 0.33 | 0.5 | YES |
| 8 | UGT2B10 | UGT2B10 | UGT2B10 | 624 | 0.29 | 0.54 | YES |
| 9 | UGT1A6 | UGT1A6 | UGT1A6 | 751 | 0.27 | 0.59 | YES |
| 10 | XYLB | XYLB | XYLB | 807 | 0.25 | 0.63 | YES |
| 11 | UGT2A3 | UGT2A3 | UGT2A3 | 867 | 0.24 | 0.67 | YES |
| 12 | UGT2B28 | UGT2B28 | UGT2B28 | 1015 | 0.22 | 0.71 | YES |
| 13 | UGT1A7 | UGT1A7 | UGT1A7 | 1069 | 0.21 | 0.74 | YES |
| 14 | CRYL1 | CRYL1 | CRYL1 | 1181 | 0.2 | 0.77 | YES |
| 15 | UGT2B15 | UGT2B15 | UGT2B15 | 1210 | 0.19 | 0.81 | YES |
| 16 | DHDH | DHDH | DHDH | 2116 | 0.12 | 0.78 | NO |
| 17 | UGT2B11 | UGT2B11 | UGT2B11 | 2269 | 0.12 | 0.8 | NO |
| 18 | UGT2A1 | UGT2A1 | UGT2A1 | 2473 | 0.1 | 0.8 | NO |
| 19 | GUSB | GUSB | GUSB | 3708 | 0.065 | 0.75 | NO |
| 20 | DCXR | DCXR | DCXR | 4791 | 0.041 | 0.7 | NO |
| 21 | RPE | RPE | RPE | 6815 | 0.0092 | 0.59 | NO |
| 22 | UGDH | UGDH | UGDH | 7569 | -0.00097 | 0.55 | NO |
| 23 | UGT2B4 | UGT2B4 | UGT2B4 | 8130 | -0.0082 | 0.52 | NO |
| 24 | UGP2 | UGP2 | UGP2 | 9611 | -0.032 | 0.45 | NO |
| 25 | LOC729020 | LOC729020 | LOC729020 | 9741 | -0.034 | 0.44 | NO |
| 26 | AKR1B1 | AKR1B1 | AKR1B1 | 13744 | -0.15 | 0.26 | NO |
Figure S5. Get High-res Image This plot shows mRNAseq_cNMF expression data heatmap (on the left) a RunningEnrichmentScore(RES) plot (on the top right) and a Signal2Noise(S2N) plot (on the bottom right) of genes in the pathway: KEGG STEROID HORMONE BIOSYNTHESIS.
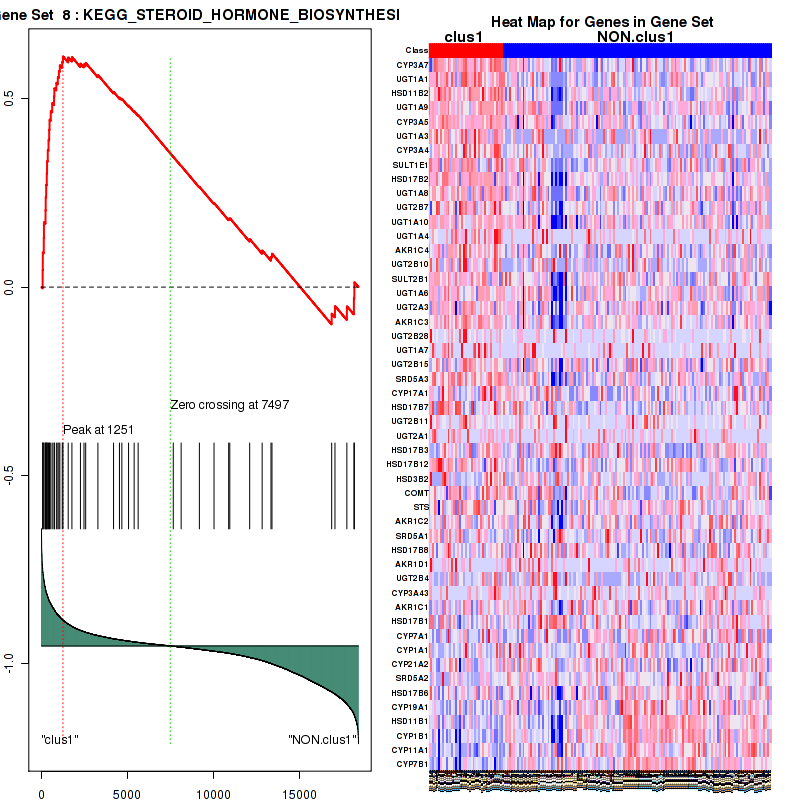
Figure S6. Get High-res Image For the top 5 core enriched genes in the pathway: KEGG STEROID HORMONE BIOSYNTHESIS, this volcano plot shows how much they are up/down-regulated and significant. The significance was calculated by empirical bayesian fit
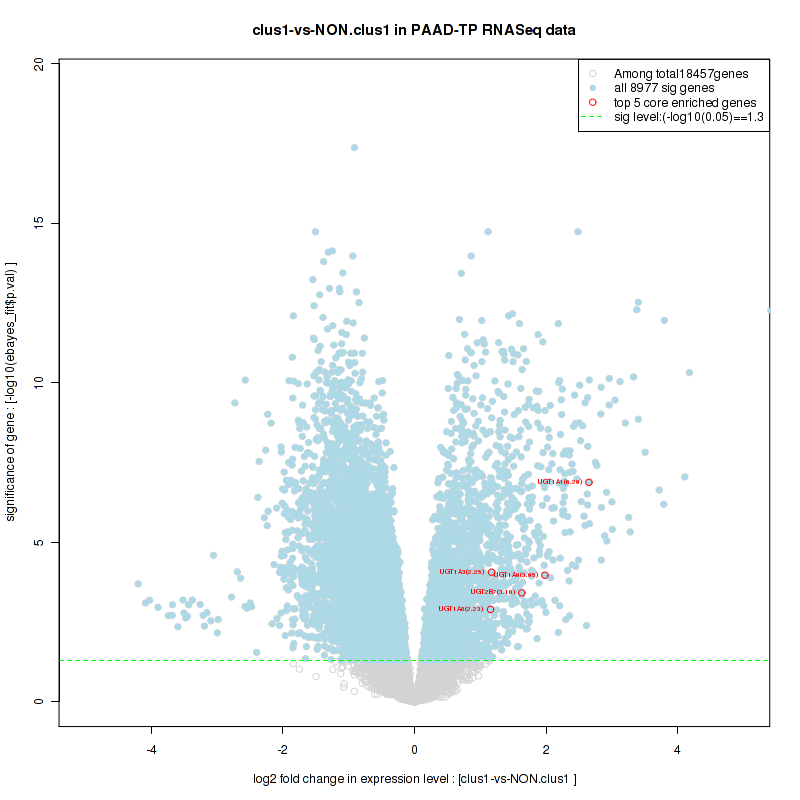
Table S4. Get Full Table This table shows a Running Enrichment Score (RES) of each gene in this pathway, that is, the enrichment score at this point in the ranked list of genes. All genes are ranked by Signal-to-Noise (S2N), a measure of similarity as default and are used to obtain ES matrix of all genes. In this way, GSEA tool uses expression pattern of not only overlapped genes but also not-overlapped genes to produce ES matrix.
| Rank | GENE | SYMBOL | DESC | LIST.LOC | S2N | RES | CORE_ENRICHMENT |
|---|---|---|---|---|---|---|---|
| 1 | CYP3A7 | CYP3A7 | CYP3A7 | 70 | 0.56 | 0.037 | YES |
| 2 | CYP2B6 | CYP2B6 | CYP2B6 | 76 | 0.55 | 0.078 | YES |
| 3 | UGT1A1 | UGT1A1 | UGT1A1 | 78 | 0.55 | 0.12 | YES |
| 4 | CYP2C9 | CYP2C9 | CYP2C9 | 91 | 0.53 | 0.16 | YES |
| 5 | CYP2C19 | CYP2C19 | CYP2C19 | 95 | 0.53 | 0.19 | YES |
| 6 | CYP2C18 | CYP2C18 | CYP2C18 | 128 | 0.5 | 0.23 | YES |
| 7 | UGT1A9 | UGT1A9 | UGT1A9 | 145 | 0.48 | 0.26 | YES |
| 8 | BCMO1 | BCMO1 | BCMO1 | 150 | 0.48 | 0.3 | YES |
| 9 | CYP3A5 | CYP3A5 | CYP3A5 | 236 | 0.42 | 0.32 | YES |
| 10 | UGT1A3 | UGT1A3 | UGT1A3 | 246 | 0.41 | 0.35 | YES |
| 11 | CYP3A4 | CYP3A4 | CYP3A4 | 274 | 0.4 | 0.38 | YES |
| 12 | CYP2A7 | CYP2A7 | CYP2A7 | 296 | 0.39 | 0.41 | YES |
| 13 | UGT1A8 | UGT1A8 | UGT1A8 | 367 | 0.36 | 0.43 | YES |
| 14 | UGT2B7 | UGT2B7 | UGT2B7 | 412 | 0.34 | 0.45 | YES |
| 15 | ADH6 | ADH6 | ADH6 | 441 | 0.33 | 0.48 | YES |
| 16 | UGT1A10 | UGT1A10 | UGT1A10 | 450 | 0.33 | 0.5 | YES |
| 17 | UGT1A4 | UGT1A4 | UGT1A4 | 470 | 0.33 | 0.52 | YES |
| 18 | RDH5 | RDH5 | RDH5 | 515 | 0.32 | 0.54 | YES |
| 19 | UGT2B10 | UGT2B10 | UGT2B10 | 624 | 0.29 | 0.56 | YES |
| 20 | ADH1C | ADH1C | ADH1C | 745 | 0.27 | 0.57 | YES |
| 21 | UGT1A6 | UGT1A6 | UGT1A6 | 751 | 0.27 | 0.59 | YES |
| 22 | DHRS9 | DHRS9 | DHRS9 | 811 | 0.25 | 0.6 | YES |
| 23 | UGT2A3 | UGT2A3 | UGT2A3 | 867 | 0.24 | 0.62 | YES |
| 24 | CYP2A6 | CYP2A6 | CYP2A6 | 872 | 0.24 | 0.64 | YES |
| 25 | DGAT2 | DGAT2 | DGAT2 | 914 | 0.23 | 0.65 | YES |
| 26 | RDH12 | RDH12 | RDH12 | 983 | 0.22 | 0.66 | YES |
| 27 | UGT2B28 | UGT2B28 | UGT2B28 | 1015 | 0.22 | 0.68 | YES |
| 28 | UGT1A7 | UGT1A7 | UGT1A7 | 1069 | 0.21 | 0.69 | YES |
| 29 | UGT2B15 | UGT2B15 | UGT2B15 | 1210 | 0.19 | 0.7 | YES |
| 30 | CYP26A1 | CYP26A1 | CYP26A1 | 1285 | 0.19 | 0.71 | YES |
| 31 | DGAT1 | DGAT1 | DGAT1 | 1310 | 0.18 | 0.72 | YES |
| 32 | RETSAT | RETSAT | RETSAT | 1574 | 0.16 | 0.72 | YES |
| 33 | CYP4A11 | CYP4A11 | CYP4A11 | 1697 | 0.15 | 0.72 | YES |
| 34 | RDH10 | RDH10 | RDH10 | 1928 | 0.13 | 0.72 | YES |
| 35 | RDH16 | RDH16 | RDH16 | 2263 | 0.12 | 0.71 | YES |
| 36 | UGT2B11 | UGT2B11 | UGT2B11 | 2269 | 0.12 | 0.72 | YES |
| 37 | DHRS3 | DHRS3 | DHRS3 | 2391 | 0.11 | 0.72 | YES |
| 38 | UGT2A1 | UGT2A1 | UGT2A1 | 2473 | 0.1 | 0.72 | YES |
| 39 | ADH4 | ADH4 | ADH4 | 2636 | 0.098 | 0.72 | NO |
| 40 | CYP2C8 | CYP2C8 | CYP2C8 | 3908 | 0.06 | 0.66 | NO |
| 41 | ALDH1A1 | ALDH1A1 | ALDH1A1 | 4300 | 0.05 | 0.64 | NO |
| 42 | DHRS4L2 | DHRS4L2 | DHRS4L2 | 4918 | 0.038 | 0.61 | NO |
| 43 | PNPLA4 | PNPLA4 | PNPLA4 | 5954 | 0.021 | 0.55 | NO |
| 44 | CYP26C1 | CYP26C1 | CYP26C1 | 6699 | 0.011 | 0.51 | NO |
| 45 | DHRS4 | DHRS4 | DHRS4 | 7310 | 0.0027 | 0.48 | NO |
| 46 | RDH11 | RDH11 | RDH11 | 7621 | -0.0016 | 0.46 | NO |
| 47 | UGT2B4 | UGT2B4 | UGT2B4 | 8130 | -0.0082 | 0.44 | NO |
| 48 | ADH5 | ADH5 | ADH5 | 9149 | -0.024 | 0.38 | NO |
| 49 | CYP3A43 | CYP3A43 | CYP3A43 | 9192 | -0.024 | 0.38 | NO |
| 50 | ALDH1A2 | ALDH1A2 | ALDH1A2 | 10807 | -0.052 | 0.3 | NO |
| 51 | CYP1A1 | CYP1A1 | CYP1A1 | 12120 | -0.084 | 0.23 | NO |
| 52 | CYP1A2 | CYP1A2 | CYP1A2 | 12282 | -0.089 | 0.23 | NO |
| 53 | LRAT | LRAT | LRAT | 12519 | -0.096 | 0.22 | NO |
| 54 | RDH8 | RDH8 | RDH8 | 12630 | -0.1 | 0.23 | NO |
| 55 | RPE65 | RPE65 | RPE65 | 13797 | -0.15 | 0.17 | NO |
| 56 | ADH1A | ADH1A | ADH1A | 14031 | -0.16 | 0.17 | NO |
| 57 | AWAT2 | AWAT2 | AWAT2 | 14652 | -0.19 | 0.15 | NO |
| 58 | ADH1B | ADH1B | ADH1B | 16672 | -0.32 | 0.067 | NO |
| 59 | CYP26B1 | CYP26B1 | CYP26B1 | 17689 | -0.41 | 0.042 | NO |
Figure S7. Get High-res Image This plot shows mRNAseq_cNMF expression data heatmap (on the left) a RunningEnrichmentScore(RES) plot (on the top right) and a Signal2Noise(S2N) plot (on the bottom right) of genes in the pathway: KEGG RETINOL METABOLISM.
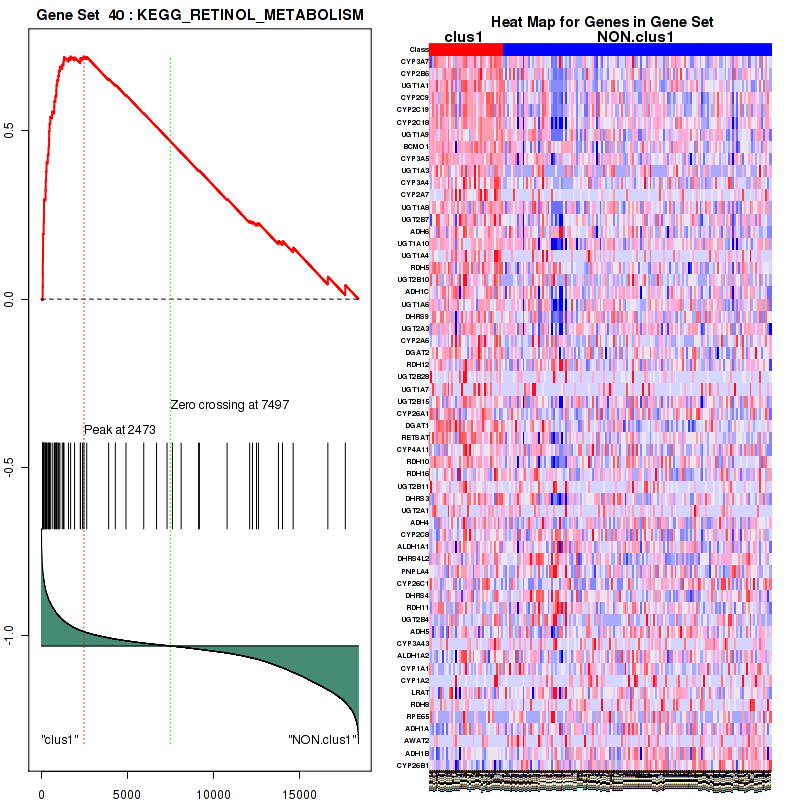
Figure S8. Get High-res Image For the top 5 core enriched genes in the pathway: KEGG RETINOL METABOLISM, this volcano plot shows how much they are up/down-regulated and significant. The significance was calculated by empirical bayesian fit

Table S5. Get Full Table This table shows a Running Enrichment Score (RES) of each gene in this pathway, that is, the enrichment score at this point in the ranked list of genes. All genes are ranked by Signal-to-Noise (S2N), a measure of similarity as default and are used to obtain ES matrix of all genes. In this way, GSEA tool uses expression pattern of not only overlapped genes but also not-overlapped genes to produce ES matrix.
| Rank | GENE | SYMBOL | DESC | LIST.LOC | S2N | RES | CORE_ENRICHMENT |
|---|---|---|---|---|---|---|---|
| 1 | NDUFA7 | NDUFA7 | NDUFA7 | 1899 | 0.14 | -0.06 | YES |
| 2 | COX5A | COX5A | COX5A | 2205 | 0.12 | -0.04 | YES |
| 3 | COX5B | COX5B | COX5B | 2369 | 0.11 | -0.014 | YES |
| 4 | COX7B | COX7B | COX7B | 2730 | 0.094 | -0.0035 | YES |
| 5 | NDUFV2 | NDUFV2 | NDUFV2 | 3168 | 0.08 | -0.002 | YES |
| 6 | UQCRQ | UQCRQ | UQCRQ | 3170 | 0.08 | 0.023 | YES |
| 7 | COX6A1 | COX6A1 | COX6A1 | 3207 | 0.079 | 0.046 | YES |
| 8 | NDUFS7 | NDUFS7 | NDUFS7 | 3278 | 0.077 | 0.067 | YES |
| 9 | NDUFA4 | NDUFA4 | NDUFA4 | 3319 | 0.076 | 0.088 | YES |
| 10 | CYCS | CYCS | CYCS | 3354 | 0.074 | 0.11 | YES |
| 11 | NDUFA3 | NDUFA3 | NDUFA3 | 3371 | 0.074 | 0.13 | YES |
| 12 | NDUFB3 | NDUFB3 | NDUFB3 | 3418 | 0.072 | 0.15 | YES |
| 13 | COX6B1 | COX6B1 | COX6B1 | 3420 | 0.072 | 0.18 | YES |
| 14 | ETFB | ETFB | ETFB | 3486 | 0.071 | 0.2 | YES |
| 15 | ETFA | ETFA | ETFA | 3508 | 0.07 | 0.22 | YES |
| 16 | SDHA | SDHA | SDHA | 3537 | 0.07 | 0.24 | YES |
| 17 | NDUFC1 | NDUFC1 | NDUFC1 | 3598 | 0.068 | 0.26 | YES |
| 18 | NDUFB7 | NDUFB7 | NDUFB7 | 3617 | 0.067 | 0.28 | YES |
| 19 | UQCRHL | UQCRHL | UQCRHL | 3669 | 0.066 | 0.29 | YES |
| 20 | NDUFA1 | NDUFA1 | NDUFA1 | 3812 | 0.062 | 0.31 | YES |
| 21 | NDUFA2 | NDUFA2 | NDUFA2 | 3856 | 0.061 | 0.32 | YES |
| 22 | NDUFS3 | NDUFS3 | NDUFS3 | 3871 | 0.061 | 0.34 | YES |
| 23 | COX6C | COX6C | COX6C | 3880 | 0.061 | 0.36 | YES |
| 24 | COX4I1 | COX4I1 | COX4I1 | 3891 | 0.06 | 0.38 | YES |
| 25 | NDUFS6 | NDUFS6 | NDUFS6 | 3894 | 0.06 | 0.4 | YES |
| 26 | UQCR11 | UQCR11 | UQCR11 | 3977 | 0.058 | 0.41 | YES |
| 27 | CYC1 | CYC1 | CYC1 | 4096 | 0.055 | 0.42 | YES |
| 28 | COX7C | COX7C | COX7C | 4120 | 0.054 | 0.44 | YES |
| 29 | NDUFS2 | NDUFS2 | NDUFS2 | 4135 | 0.054 | 0.46 | YES |
| 30 | NDUFB10 | NDUFB10 | NDUFB10 | 4140 | 0.054 | 0.47 | YES |
| 31 | NDUFA12 | NDUFA12 | NDUFA12 | 4144 | 0.054 | 0.49 | YES |
| 32 | UQCRC1 | UQCRC1 | UQCRC1 | 4149 | 0.054 | 0.51 | YES |
| 33 | SDHC | SDHC | SDHC | 4375 | 0.049 | 0.51 | YES |
| 34 | UQCRH | UQCRH | UQCRH | 4384 | 0.049 | 0.52 | YES |
| 35 | NDUFA13 | NDUFA13 | NDUFA13 | 4505 | 0.047 | 0.53 | YES |
| 36 | NDUFS5 | NDUFS5 | NDUFS5 | 4632 | 0.044 | 0.54 | YES |
| 37 | NDUFB1 | NDUFB1 | NDUFB1 | 4705 | 0.042 | 0.55 | YES |
| 38 | COX8A | COX8A | COX8A | 4748 | 0.042 | 0.56 | YES |
| 39 | NDUFA10 | NDUFA10 | NDUFA10 | 4785 | 0.041 | 0.57 | YES |
| 40 | NDUFAB1 | NDUFAB1 | NDUFAB1 | 4799 | 0.04 | 0.58 | YES |
| 41 | ETFDH | ETFDH | ETFDH | 4850 | 0.04 | 0.59 | YES |
| 42 | NDUFB8 | NDUFB8 | NDUFB8 | 4891 | 0.039 | 0.6 | YES |
| 43 | UQCRC2 | UQCRC2 | UQCRC2 | 4931 | 0.038 | 0.61 | YES |
| 44 | NDUFA9 | NDUFA9 | NDUFA9 | 5109 | 0.035 | 0.62 | YES |
| 45 | NDUFS8 | NDUFS8 | NDUFS8 | 5113 | 0.035 | 0.63 | YES |
| 46 | NDUFA11 | NDUFA11 | NDUFA11 | 5127 | 0.035 | 0.64 | YES |
| 47 | NDUFC2 | NDUFC2 | NDUFC2 | 5292 | 0.032 | 0.64 | YES |
| 48 | NDUFV3 | NDUFV3 | NDUFV3 | 5327 | 0.031 | 0.64 | YES |
| 49 | NDUFB9 | NDUFB9 | NDUFB9 | 5504 | 0.028 | 0.64 | YES |
| 50 | NDUFB2 | NDUFB2 | NDUFB2 | 5854 | 0.023 | 0.63 | YES |
| 51 | NDUFA8 | NDUFA8 | NDUFA8 | 5978 | 0.021 | 0.63 | YES |
| 52 | NDUFB4 | NDUFB4 | NDUFB4 | 6072 | 0.019 | 0.63 | YES |
| 53 | NDUFV1 | NDUFV1 | NDUFV1 | 6083 | 0.019 | 0.64 | YES |
| 54 | UQCRFS1 | UQCRFS1 | UQCRFS1 | 6237 | 0.017 | 0.64 | YES |
| 55 | NDUFA5 | NDUFA5 | NDUFA5 | 6290 | 0.016 | 0.64 | YES |
| 56 | NDUFA6 | NDUFA6 | NDUFA6 | 6291 | 0.016 | 0.64 | YES |
| 57 | NDUFS4 | NDUFS4 | NDUFS4 | 6338 | 0.016 | 0.65 | YES |
| 58 | SDHD | SDHD | SDHD | 6521 | 0.013 | 0.64 | NO |
| 59 | NDUFB5 | NDUFB5 | NDUFB5 | 6528 | 0.013 | 0.64 | NO |
| 60 | NDUFS1 | NDUFS1 | NDUFS1 | 7287 | 0.0031 | 0.6 | NO |
| 61 | COX7A2L | COX7A2L | COX7A2L | 7351 | 0.002 | 0.6 | NO |
| 62 | NDUFB6 | NDUFB6 | NDUFB6 | 7440 | 0.00073 | 0.6 | NO |
| 63 | SDHB | SDHB | SDHB | 7647 | -0.002 | 0.59 | NO |
| 64 | UQCRB | UQCRB | UQCRB | 7728 | -0.0031 | 0.58 | NO |
Figure S9. Get High-res Image This plot shows mRNAseq_cNMF expression data heatmap (on the left) a RunningEnrichmentScore(RES) plot (on the top right) and a Signal2Noise(S2N) plot (on the bottom right) of genes in the pathway: KEGG PORPHYRIN AND CHLOROPHYLL METABOLISM.
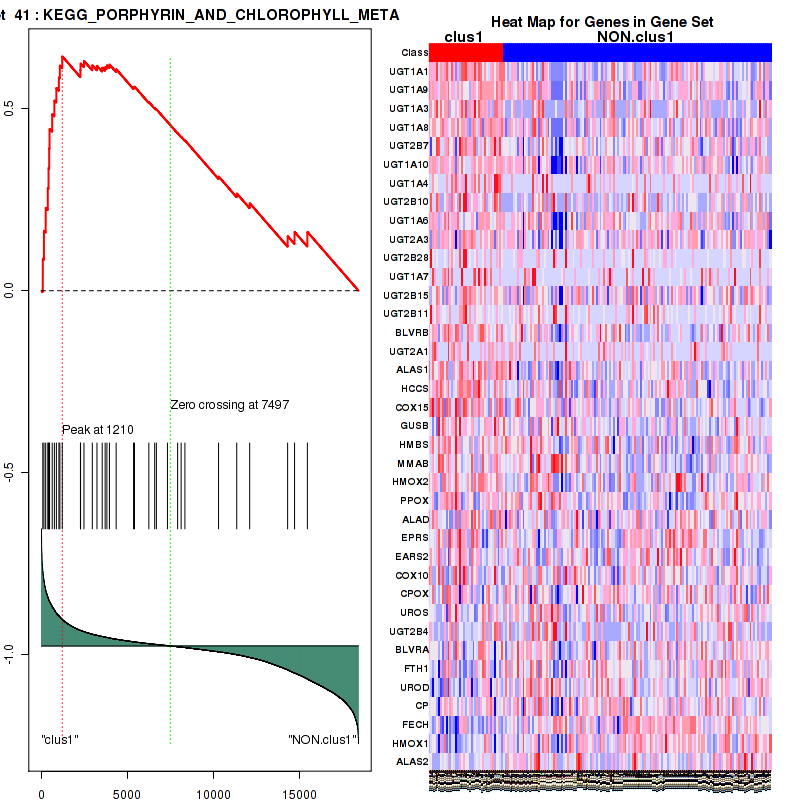
Figure S10. Get High-res Image For the top 5 core enriched genes in the pathway: KEGG PORPHYRIN AND CHLOROPHYLL METABOLISM, this volcano plot shows how much they are up/down-regulated and significant. The significance was calculated by empirical bayesian fit
Table S6. Get Full Table This table shows a Running Enrichment Score (RES) of each gene in this pathway, that is, the enrichment score at this point in the ranked list of genes. All genes are ranked by Signal-to-Noise (S2N), a measure of similarity as default and are used to obtain ES matrix of all genes. In this way, GSEA tool uses expression pattern of not only overlapped genes but also not-overlapped genes to produce ES matrix.
| Rank | GENE | SYMBOL | DESC | LIST.LOC | S2N | RES | CORE_ENRICHMENT |
|---|---|---|---|---|---|---|---|
| 1 | NDUFA7 | NDUFA7 | NDUFA7 | 1899 | 0.14 | -0.068 | YES |
| 2 | COX5A | COX5A | COX5A | 2205 | 0.12 | -0.055 | YES |
| 3 | COX5B | COX5B | COX5B | 2369 | 0.11 | -0.035 | YES |
| 4 | ATP5D | ATP5D | ATP5D | 2440 | 0.11 | -0.011 | YES |
| 5 | COX7B | COX7B | COX7B | 2730 | 0.094 | -0.0028 | YES |
| 6 | ATP5I | ATP5I | ATP5I | 3092 | 0.082 | -0.0012 | YES |
| 7 | NDUFV2 | NDUFV2 | NDUFV2 | 3168 | 0.08 | 0.015 | YES |
| 8 | UQCRQ | UQCRQ | UQCRQ | 3170 | 0.08 | 0.036 | YES |
| 9 | COX6A1 | COX6A1 | COX6A1 | 3207 | 0.079 | 0.054 | YES |
| 10 | NDUFS7 | NDUFS7 | NDUFS7 | 3278 | 0.077 | 0.07 | YES |
| 11 | NDUFA4 | NDUFA4 | NDUFA4 | 3319 | 0.076 | 0.088 | YES |
| 12 | CYCS | CYCS | CYCS | 3354 | 0.074 | 0.1 | YES |
| 13 | NDUFA3 | NDUFA3 | NDUFA3 | 3371 | 0.074 | 0.12 | YES |
| 14 | NDUFB3 | NDUFB3 | NDUFB3 | 3418 | 0.072 | 0.14 | YES |
| 15 | COX6B1 | COX6B1 | COX6B1 | 3420 | 0.072 | 0.16 | YES |
| 16 | ETFB | ETFB | ETFB | 3486 | 0.071 | 0.17 | YES |
| 17 | ETFA | ETFA | ETFA | 3508 | 0.07 | 0.19 | YES |
| 18 | SDHA | SDHA | SDHA | 3537 | 0.07 | 0.21 | YES |
| 19 | NDUFC1 | NDUFC1 | NDUFC1 | 3598 | 0.068 | 0.22 | YES |
| 20 | NDUFB7 | NDUFB7 | NDUFB7 | 3617 | 0.067 | 0.24 | YES |
| 21 | UQCRHL | UQCRHL | UQCRHL | 3669 | 0.066 | 0.25 | YES |
| 22 | NDUFA1 | NDUFA1 | NDUFA1 | 3812 | 0.062 | 0.26 | YES |
| 23 | ATP5J2 | ATP5J2 | ATP5J2 | 3845 | 0.062 | 0.27 | YES |
| 24 | NDUFA2 | NDUFA2 | NDUFA2 | 3856 | 0.061 | 0.29 | YES |
| 25 | NDUFS3 | NDUFS3 | NDUFS3 | 3871 | 0.061 | 0.3 | YES |
| 26 | COX6C | COX6C | COX6C | 3880 | 0.061 | 0.32 | YES |
| 27 | COX4I1 | COX4I1 | COX4I1 | 3891 | 0.06 | 0.33 | YES |
| 28 | NDUFS6 | NDUFS6 | NDUFS6 | 3894 | 0.06 | 0.35 | YES |
| 29 | UQCR11 | UQCR11 | UQCR11 | 3977 | 0.058 | 0.36 | YES |
| 30 | ATP5G1 | ATP5G1 | ATP5G1 | 3990 | 0.058 | 0.38 | YES |
| 31 | ATP5C1 | ATP5C1 | ATP5C1 | 4051 | 0.056 | 0.39 | YES |
| 32 | CYC1 | CYC1 | CYC1 | 4096 | 0.055 | 0.4 | YES |
| 33 | COX7C | COX7C | COX7C | 4120 | 0.054 | 0.41 | YES |
| 34 | NDUFS2 | NDUFS2 | NDUFS2 | 4135 | 0.054 | 0.42 | YES |
| 35 | NDUFB10 | NDUFB10 | NDUFB10 | 4140 | 0.054 | 0.44 | YES |
| 36 | NDUFA12 | NDUFA12 | NDUFA12 | 4144 | 0.054 | 0.45 | YES |
| 37 | UQCRC1 | UQCRC1 | UQCRC1 | 4149 | 0.054 | 0.46 | YES |
| 38 | SDHC | SDHC | SDHC | 4375 | 0.049 | 0.46 | YES |
| 39 | UQCRH | UQCRH | UQCRH | 4384 | 0.049 | 0.48 | YES |
| 40 | ATP5O | ATP5O | ATP5O | 4493 | 0.047 | 0.48 | YES |
| 41 | NDUFA13 | NDUFA13 | NDUFA13 | 4505 | 0.047 | 0.5 | YES |
| 42 | NDUFS5 | NDUFS5 | NDUFS5 | 4632 | 0.044 | 0.5 | YES |
| 43 | NDUFB1 | NDUFB1 | NDUFB1 | 4705 | 0.042 | 0.51 | YES |
| 44 | COX8A | COX8A | COX8A | 4748 | 0.042 | 0.52 | YES |
| 45 | NDUFA10 | NDUFA10 | NDUFA10 | 4785 | 0.041 | 0.52 | YES |
| 46 | NDUFAB1 | NDUFAB1 | NDUFAB1 | 4799 | 0.04 | 0.53 | YES |
| 47 | ETFDH | ETFDH | ETFDH | 4850 | 0.04 | 0.54 | YES |
| 48 | NDUFB8 | NDUFB8 | NDUFB8 | 4891 | 0.039 | 0.55 | YES |
| 49 | UQCRC2 | UQCRC2 | UQCRC2 | 4931 | 0.038 | 0.56 | YES |
| 50 | NDUFA9 | NDUFA9 | NDUFA9 | 5109 | 0.035 | 0.56 | YES |
| 51 | NDUFS8 | NDUFS8 | NDUFS8 | 5113 | 0.035 | 0.56 | YES |
| 52 | NDUFA11 | NDUFA11 | NDUFA11 | 5127 | 0.035 | 0.57 | YES |
| 53 | NDUFC2 | NDUFC2 | NDUFC2 | 5292 | 0.032 | 0.57 | YES |
| 54 | NDUFV3 | NDUFV3 | NDUFV3 | 5327 | 0.031 | 0.58 | YES |
| 55 | NDUFB9 | NDUFB9 | NDUFB9 | 5504 | 0.028 | 0.58 | YES |
| 56 | NDUFB2 | NDUFB2 | NDUFB2 | 5854 | 0.023 | 0.56 | YES |
| 57 | ATP5B | ATP5B | ATP5B | 5903 | 0.022 | 0.57 | YES |
| 58 | NDUFA8 | NDUFA8 | NDUFA8 | 5978 | 0.021 | 0.57 | YES |
| 59 | ATP5E | ATP5E | ATP5E | 6015 | 0.02 | 0.57 | YES |
| 60 | NDUFB4 | NDUFB4 | NDUFB4 | 6072 | 0.019 | 0.57 | YES |
| 61 | NDUFV1 | NDUFV1 | NDUFV1 | 6083 | 0.019 | 0.58 | YES |
| 62 | UQCRFS1 | UQCRFS1 | UQCRFS1 | 6237 | 0.017 | 0.57 | YES |
| 63 | ATP5L | ATP5L | ATP5L | 6287 | 0.016 | 0.57 | YES |
| 64 | NDUFA5 | NDUFA5 | NDUFA5 | 6290 | 0.016 | 0.58 | YES |
| 65 | NDUFA6 | NDUFA6 | NDUFA6 | 6291 | 0.016 | 0.58 | YES |
| 66 | NDUFS4 | NDUFS4 | NDUFS4 | 6338 | 0.016 | 0.58 | YES |
| 67 | ATP5H | ATP5H | ATP5H | 6352 | 0.016 | 0.59 | YES |
| 68 | SDHD | SDHD | SDHD | 6521 | 0.013 | 0.58 | NO |
| 69 | NDUFB5 | NDUFB5 | NDUFB5 | 6528 | 0.013 | 0.59 | NO |
| 70 | ATP5J | ATP5J | ATP5J | 6625 | 0.012 | 0.58 | NO |
| 71 | NDUFS1 | NDUFS1 | NDUFS1 | 7287 | 0.0031 | 0.55 | NO |
| 72 | COX7A2L | COX7A2L | COX7A2L | 7351 | 0.002 | 0.55 | NO |
| 73 | NDUFB6 | NDUFB6 | NDUFB6 | 7440 | 0.00073 | 0.54 | NO |
| 74 | SDHB | SDHB | SDHB | 7647 | -0.002 | 0.53 | NO |
| 75 | UQCRB | UQCRB | UQCRB | 7728 | -0.0031 | 0.53 | NO |
| 76 | ATP5F1 | ATP5F1 | ATP5F1 | 7993 | -0.0065 | 0.51 | NO |
| 77 | UCP2 | UCP2 | UCP2 | 8479 | -0.014 | 0.49 | NO |
| 78 | ATP5A1 | ATP5A1 | ATP5A1 | 10422 | -0.045 | 0.4 | NO |
| 79 | UCP3 | UCP3 | UCP3 | 13913 | -0.15 | 0.25 | NO |
Figure S11. Get High-res Image This plot shows mRNAseq_cNMF expression data heatmap (on the left) a RunningEnrichmentScore(RES) plot (on the top right) and a Signal2Noise(S2N) plot (on the bottom right) of genes in the pathway: KEGG AMINOACYL TRNA BIOSYNTHESIS.
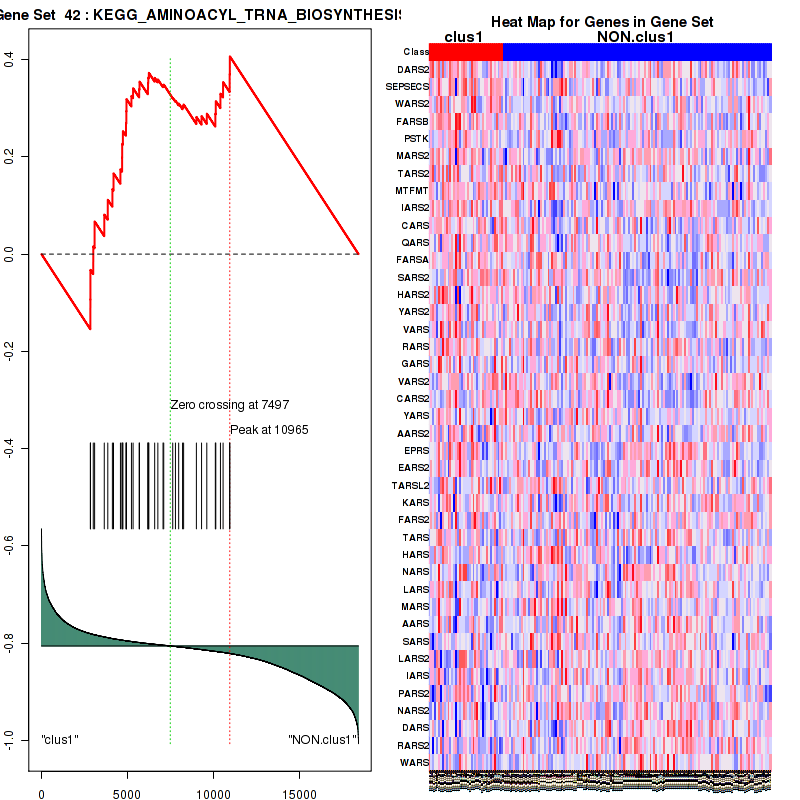
Figure S12. Get High-res Image For the top 5 core enriched genes in the pathway: KEGG AMINOACYL TRNA BIOSYNTHESIS, this volcano plot shows how much they are up/down-regulated and significant. The significance was calculated by empirical bayesian fit
Table S7. Get Full Table This table shows a Running Enrichment Score (RES) of each gene in this pathway, that is, the enrichment score at this point in the ranked list of genes. All genes are ranked by Signal-to-Noise (S2N), a measure of similarity as default and are used to obtain ES matrix of all genes. In this way, GSEA tool uses expression pattern of not only overlapped genes but also not-overlapped genes to produce ES matrix.
| Rank | GENE | SYMBOL | DESC | LIST.LOC | S2N | RES | CORE_ENRICHMENT |
|---|---|---|---|---|---|---|---|
| 1 | SLC16A8 | SLC16A8 | SLC16A8 | 1404 | 0.18 | -0.047 | YES |
| 2 | SLC16A1 | SLC16A1 | SLC16A1 | 1803 | 0.14 | -0.045 | YES |
| 3 | D2HGDH | D2HGDH | D2HGDH | 1859 | 0.14 | -0.025 | YES |
| 4 | NDUFA7 | NDUFA7 | NDUFA7 | 1899 | 0.14 | -0.0047 | YES |
| 5 | COX5A | COX5A | COX5A | 2205 | 0.12 | -0.0017 | YES |
| 6 | COX5B | COX5B | COX5B | 2369 | 0.11 | 0.0077 | YES |
| 7 | SUCLG2 | SUCLG2 | SUCLG2 | 2433 | 0.11 | 0.022 | YES |
| 8 | ATP5D | ATP5D | ATP5D | 2440 | 0.11 | 0.04 | YES |
| 9 | IDH1 | IDH1 | IDH1 | 2689 | 0.096 | 0.042 | YES |
| 10 | COX7B | COX7B | COX7B | 2730 | 0.094 | 0.056 | YES |
| 11 | ATP5I | ATP5I | ATP5I | 3092 | 0.082 | 0.05 | YES |
| 12 | NDUFV2 | NDUFV2 | NDUFV2 | 3168 | 0.08 | 0.059 | YES |
| 13 | UQCRQ | UQCRQ | UQCRQ | 3170 | 0.08 | 0.072 | YES |
| 14 | COX6A1 | COX6A1 | COX6A1 | 3207 | 0.079 | 0.084 | YES |
| 15 | PDK2 | PDK2 | PDK2 | 3246 | 0.077 | 0.094 | YES |
| 16 | NDUFS7 | NDUFS7 | NDUFS7 | 3278 | 0.077 | 0.11 | YES |
| 17 | NDUFA4 | NDUFA4 | NDUFA4 | 3319 | 0.076 | 0.12 | YES |
| 18 | CYCS | CYCS | CYCS | 3354 | 0.074 | 0.13 | YES |
| 19 | NDUFA3 | NDUFA3 | NDUFA3 | 3371 | 0.074 | 0.14 | YES |
| 20 | FH | FH | FH | 3389 | 0.073 | 0.15 | YES |
| 21 | NDUFB3 | NDUFB3 | NDUFB3 | 3418 | 0.072 | 0.16 | YES |
| 22 | COX6B1 | COX6B1 | COX6B1 | 3420 | 0.072 | 0.17 | YES |
| 23 | ETFB | ETFB | ETFB | 3486 | 0.071 | 0.18 | YES |
| 24 | ETFA | ETFA | ETFA | 3508 | 0.07 | 0.19 | YES |
| 25 | SDHA | SDHA | SDHA | 3537 | 0.07 | 0.2 | YES |
| 26 | NDUFC1 | NDUFC1 | NDUFC1 | 3598 | 0.068 | 0.21 | YES |
| 27 | NDUFB7 | NDUFB7 | NDUFB7 | 3617 | 0.067 | 0.22 | YES |
| 28 | UQCRHL | UQCRHL | UQCRHL | 3669 | 0.066 | 0.23 | YES |
| 29 | NDUFA1 | NDUFA1 | NDUFA1 | 3812 | 0.062 | 0.23 | YES |
| 30 | ATP5J2 | ATP5J2 | ATP5J2 | 3845 | 0.062 | 0.24 | YES |
| 31 | NDUFA2 | NDUFA2 | NDUFA2 | 3856 | 0.061 | 0.25 | YES |
| 32 | NDUFS3 | NDUFS3 | NDUFS3 | 3871 | 0.061 | 0.26 | YES |
| 33 | COX6C | COX6C | COX6C | 3880 | 0.061 | 0.27 | YES |
| 34 | COX4I1 | COX4I1 | COX4I1 | 3891 | 0.06 | 0.28 | YES |
| 35 | NDUFS6 | NDUFS6 | NDUFS6 | 3894 | 0.06 | 0.29 | YES |
| 36 | UQCR11 | UQCR11 | UQCR11 | 3977 | 0.058 | 0.29 | YES |
| 37 | ATP5G1 | ATP5G1 | ATP5G1 | 3990 | 0.058 | 0.3 | YES |
| 38 | ATP5C1 | ATP5C1 | ATP5C1 | 4051 | 0.056 | 0.31 | YES |
| 39 | CYC1 | CYC1 | CYC1 | 4096 | 0.055 | 0.31 | YES |
| 40 | COX7C | COX7C | COX7C | 4120 | 0.054 | 0.32 | YES |
| 41 | NDUFS2 | NDUFS2 | NDUFS2 | 4135 | 0.054 | 0.33 | YES |
| 42 | NDUFB10 | NDUFB10 | NDUFB10 | 4140 | 0.054 | 0.34 | YES |
| 43 | NDUFA12 | NDUFA12 | NDUFA12 | 4144 | 0.054 | 0.35 | YES |
| 44 | UQCRC1 | UQCRC1 | UQCRC1 | 4149 | 0.054 | 0.36 | YES |
| 45 | SDHC | SDHC | SDHC | 4375 | 0.049 | 0.35 | YES |
| 46 | UQCRH | UQCRH | UQCRH | 4384 | 0.049 | 0.36 | YES |
| 47 | BSG | BSG | BSG | 4418 | 0.048 | 0.37 | YES |
| 48 | ATP5O | ATP5O | ATP5O | 4493 | 0.047 | 0.37 | YES |
| 49 | NDUFA13 | NDUFA13 | NDUFA13 | 4505 | 0.047 | 0.38 | YES |
| 50 | MDH2 | MDH2 | MDH2 | 4525 | 0.046 | 0.38 | YES |
| 51 | NDUFS5 | NDUFS5 | NDUFS5 | 4632 | 0.044 | 0.39 | YES |
| 52 | NDUFB1 | NDUFB1 | NDUFB1 | 4705 | 0.042 | 0.39 | YES |
| 53 | COX8A | COX8A | COX8A | 4748 | 0.042 | 0.39 | YES |
| 54 | NDUFA10 | NDUFA10 | NDUFA10 | 4785 | 0.041 | 0.4 | YES |
| 55 | NDUFAB1 | NDUFAB1 | NDUFAB1 | 4799 | 0.04 | 0.4 | YES |
| 56 | ETFDH | ETFDH | ETFDH | 4850 | 0.04 | 0.41 | YES |
| 57 | NDUFB8 | NDUFB8 | NDUFB8 | 4891 | 0.039 | 0.41 | YES |
| 58 | UQCRC2 | UQCRC2 | UQCRC2 | 4931 | 0.038 | 0.42 | YES |
| 59 | NDUFA9 | NDUFA9 | NDUFA9 | 5109 | 0.035 | 0.41 | YES |
| 60 | NDUFS8 | NDUFS8 | NDUFS8 | 5113 | 0.035 | 0.42 | YES |
| 61 | NDUFA11 | NDUFA11 | NDUFA11 | 5127 | 0.035 | 0.42 | YES |
| 62 | NDUFC2 | NDUFC2 | NDUFC2 | 5292 | 0.032 | 0.42 | YES |
| 63 | NDUFV3 | NDUFV3 | NDUFV3 | 5327 | 0.031 | 0.42 | YES |
| 64 | SUCLG1 | SUCLG1 | SUCLG1 | 5369 | 0.03 | 0.43 | YES |
| 65 | NDUFB9 | NDUFB9 | NDUFB9 | 5504 | 0.028 | 0.42 | YES |
| 66 | OGDH | OGDH | OGDH | 5597 | 0.027 | 0.42 | YES |
| 67 | LDHA | LDHA | LDHA | 5710 | 0.025 | 0.42 | YES |
| 68 | IDH3B | IDH3B | IDH3B | 5806 | 0.024 | 0.42 | YES |
| 69 | NDUFB2 | NDUFB2 | NDUFB2 | 5854 | 0.023 | 0.42 | YES |
| 70 | ATP5B | ATP5B | ATP5B | 5903 | 0.022 | 0.42 | YES |
| 71 | IDH3G | IDH3G | IDH3G | 5925 | 0.022 | 0.43 | YES |
| 72 | NDUFA8 | NDUFA8 | NDUFA8 | 5978 | 0.021 | 0.43 | YES |
| 73 | ATP5E | ATP5E | ATP5E | 6015 | 0.02 | 0.43 | YES |
| 74 | NDUFB4 | NDUFB4 | NDUFB4 | 6072 | 0.019 | 0.43 | YES |
| 75 | NDUFV1 | NDUFV1 | NDUFV1 | 6083 | 0.019 | 0.43 | YES |
| 76 | PDHA1 | PDHA1 | PDHA1 | 6109 | 0.019 | 0.43 | YES |
| 77 | UQCRFS1 | UQCRFS1 | UQCRFS1 | 6237 | 0.017 | 0.43 | YES |
| 78 | ATP5L | ATP5L | ATP5L | 6287 | 0.016 | 0.43 | YES |
| 79 | NDUFA5 | NDUFA5 | NDUFA5 | 6290 | 0.016 | 0.43 | YES |
| 80 | NDUFA6 | NDUFA6 | NDUFA6 | 6291 | 0.016 | 0.43 | YES |
| 81 | NDUFS4 | NDUFS4 | NDUFS4 | 6338 | 0.016 | 0.43 | YES |
| 82 | ATP5H | ATP5H | ATP5H | 6352 | 0.016 | 0.44 | YES |
| 83 | SDHD | SDHD | SDHD | 6521 | 0.013 | 0.43 | NO |
| 84 | NDUFB5 | NDUFB5 | NDUFB5 | 6528 | 0.013 | 0.43 | NO |
| 85 | ACO2 | ACO2 | ACO2 | 6573 | 0.013 | 0.43 | NO |
| 86 | ATP5J | ATP5J | ATP5J | 6625 | 0.012 | 0.43 | NO |
| 87 | SLC16A3 | SLC16A3 | SLC16A3 | 6653 | 0.012 | 0.43 | NO |
| 88 | PDHX | PDHX | PDHX | 6826 | 0.009 | 0.42 | NO |
| 89 | DLST | DLST | DLST | 7176 | 0.0046 | 0.4 | NO |
| 90 | PDP2 | PDP2 | PDP2 | 7273 | 0.0034 | 0.4 | NO |
| 91 | NDUFS1 | NDUFS1 | NDUFS1 | 7287 | 0.0031 | 0.4 | NO |
| 92 | COX7A2L | COX7A2L | COX7A2L | 7351 | 0.002 | 0.4 | NO |
| 93 | CS | CS | CS | 7379 | 0.0017 | 0.4 | NO |
| 94 | NDUFB6 | NDUFB6 | NDUFB6 | 7440 | 0.00073 | 0.39 | NO |
| 95 | SDHB | SDHB | SDHB | 7647 | -0.002 | 0.38 | NO |
| 96 | UQCRB | UQCRB | UQCRB | 7728 | -0.0031 | 0.38 | NO |
| 97 | DLD | DLD | DLD | 7794 | -0.0039 | 0.37 | NO |
| 98 | ATP5F1 | ATP5F1 | ATP5F1 | 7993 | -0.0065 | 0.36 | NO |
| 99 | IDH3A | IDH3A | IDH3A | 8205 | -0.0093 | 0.35 | NO |
| 100 | UCP2 | UCP2 | UCP2 | 8479 | -0.014 | 0.34 | NO |
| 101 | PDP1 | PDP1 | PDP1 | 8589 | -0.015 | 0.34 | NO |
| 102 | PDPR | PDPR | PDPR | 9307 | -0.026 | 0.3 | NO |
| 103 | L2HGDH | L2HGDH | L2HGDH | 9521 | -0.03 | 0.3 | NO |
| 104 | IDH2 | IDH2 | IDH2 | 9539 | -0.03 | 0.3 | NO |
| 105 | DLAT | DLAT | DLAT | 9664 | -0.032 | 0.3 | NO |
| 106 | PDK1 | PDK1 | PDK1 | 9698 | -0.033 | 0.3 | NO |
| 107 | PDHB | PDHB | PDHB | 10219 | -0.041 | 0.28 | NO |
| 108 | ATP5A1 | ATP5A1 | ATP5A1 | 10422 | -0.045 | 0.28 | NO |
| 109 | NNT | NNT | NNT | 10538 | -0.047 | 0.28 | NO |
| 110 | SUCLA2 | SUCLA2 | SUCLA2 | 10972 | -0.055 | 0.27 | NO |
| 111 | PDK3 | PDK3 | PDK3 | 12744 | -0.1 | 0.19 | NO |
| 112 | UCP3 | UCP3 | UCP3 | 13913 | -0.15 | 0.15 | NO |
| 113 | LDHB | LDHB | LDHB | 14519 | -0.19 | 0.15 | NO |
| 114 | ADHFE1 | ADHFE1 | ADHFE1 | 14531 | -0.19 | 0.18 | NO |
| 115 | PDK4 | PDK4 | PDK4 | 15059 | -0.22 | 0.18 | NO |
Figure S13. Get High-res Image This plot shows mRNAseq_cNMF expression data heatmap (on the left) a RunningEnrichmentScore(RES) plot (on the top right) and a Signal2Noise(S2N) plot (on the bottom right) of genes in the pathway: KEGG METABOLISM OF XENOBIOTICS BY CYTOCHROME P450.
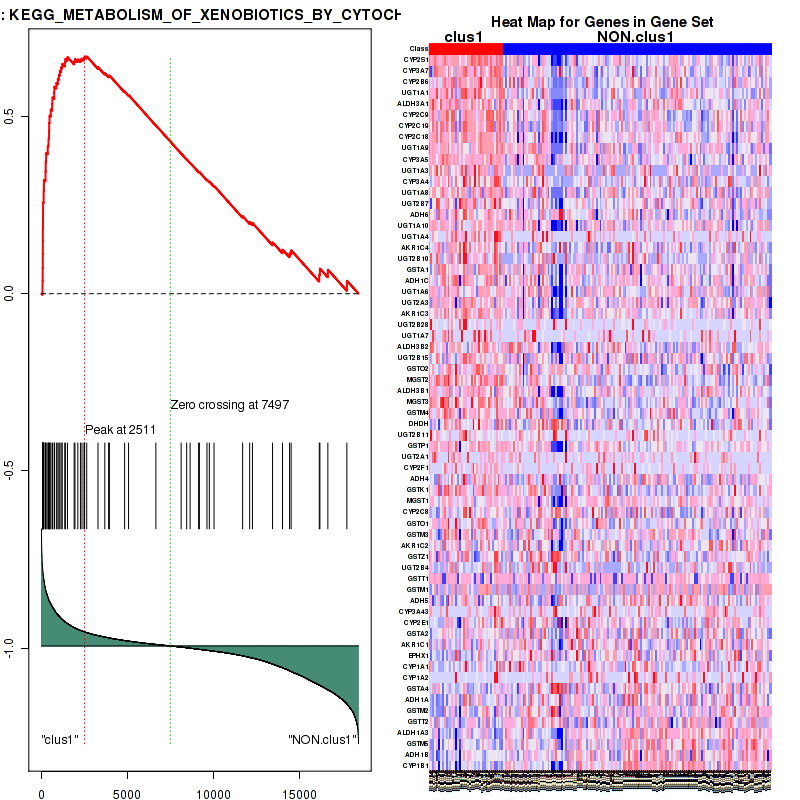
Figure S14. Get High-res Image For the top 5 core enriched genes in the pathway: KEGG METABOLISM OF XENOBIOTICS BY CYTOCHROME P450, this volcano plot shows how much they are up/down-regulated and significant. The significance was calculated by empirical bayesian fit
Table S8. Get Full Table This table shows a Running Enrichment Score (RES) of each gene in this pathway, that is, the enrichment score at this point in the ranked list of genes. All genes are ranked by Signal-to-Noise (S2N), a measure of similarity as default and are used to obtain ES matrix of all genes. In this way, GSEA tool uses expression pattern of not only overlapped genes but also not-overlapped genes to produce ES matrix.
| Rank | GENE | SYMBOL | DESC | LIST.LOC | S2N | RES | CORE_ENRICHMENT |
|---|---|---|---|---|---|---|---|
| 1 | SULT1B1 | SULT1B1 | SULT1B1 | 16 | 0.7 | 0.058 | YES |
| 2 | UGT1A1 | UGT1A1 | UGT1A1 | 78 | 0.55 | 0.1 | YES |
| 3 | SULT1C2 | SULT1C2 | SULT1C2 | 122 | 0.5 | 0.14 | YES |
| 4 | UGT1A9 | UGT1A9 | UGT1A9 | 145 | 0.48 | 0.18 | YES |
| 5 | NAT2 | NAT2 | NAT2 | 156 | 0.47 | 0.22 | YES |
| 6 | UGT1A3 | UGT1A3 | UGT1A3 | 246 | 0.41 | 0.25 | YES |
| 7 | SULT1E1 | SULT1E1 | SULT1E1 | 308 | 0.38 | 0.28 | YES |
| 8 | UGT1A8 | UGT1A8 | UGT1A8 | 367 | 0.36 | 0.3 | YES |
| 9 | UGT2B7 | UGT2B7 | UGT2B7 | 412 | 0.34 | 0.33 | YES |
| 10 | UGT1A4 | UGT1A4 | UGT1A4 | 470 | 0.33 | 0.35 | YES |
| 11 | UGT2B10 | UGT2B10 | UGT2B10 | 624 | 0.29 | 0.37 | YES |
| 12 | GSTA1 | GSTA1 | GSTA1 | 639 | 0.29 | 0.39 | YES |
| 13 | SULT2B1 | SULT2B1 | SULT2B1 | 732 | 0.27 | 0.41 | YES |
| 14 | UGT1A6 | UGT1A6 | UGT1A6 | 751 | 0.27 | 0.43 | YES |
| 15 | ACSM1 | ACSM1 | ACSM1 | 774 | 0.26 | 0.45 | YES |
| 16 | SULT1A2 | SULT1A2 | SULT1A2 | 809 | 0.25 | 0.47 | YES |
| 17 | UGT2B28 | UGT2B28 | UGT2B28 | 1015 | 0.22 | 0.48 | YES |
| 18 | UGT1A7 | UGT1A7 | UGT1A7 | 1069 | 0.21 | 0.49 | YES |
| 19 | NAT1 | NAT1 | NAT1 | 1080 | 0.21 | 0.51 | YES |
| 20 | OPLAH | OPLAH | OPLAH | 1138 | 0.2 | 0.52 | YES |
| 21 | SULT1A3 | SULT1A3 | SULT1A3 | 1235 | 0.19 | 0.53 | YES |
| 22 | GSTO2 | GSTO2 | GSTO2 | 1358 | 0.18 | 0.54 | YES |
| 23 | MGST2 | MGST2 | MGST2 | 1388 | 0.18 | 0.56 | YES |
| 24 | SULT2A1 | SULT2A1 | SULT2A1 | 1447 | 0.17 | 0.57 | YES |
| 25 | BPNT1 | BPNT1 | BPNT1 | 1495 | 0.17 | 0.58 | YES |
| 26 | MGST3 | MGST3 | MGST3 | 1904 | 0.14 | 0.57 | YES |
| 27 | GSTM4 | GSTM4 | GSTM4 | 1951 | 0.13 | 0.57 | YES |
| 28 | SLC35D1 | SLC35D1 | SLC35D1 | 2167 | 0.12 | 0.57 | YES |
| 29 | UGT2B11 | UGT2B11 | UGT2B11 | 2269 | 0.12 | 0.58 | YES |
| 30 | TPMT | TPMT | TPMT | 2272 | 0.11 | 0.59 | YES |
| 31 | GSTP1 | GSTP1 | GSTP1 | 2357 | 0.11 | 0.59 | YES |
| 32 | UGT2A1 | UGT2A1 | UGT2A1 | 2473 | 0.1 | 0.59 | YES |
| 33 | MAT2A | MAT2A | MAT2A | 2497 | 0.1 | 0.6 | YES |
| 34 | GSS | GSS | GSS | 2775 | 0.093 | 0.59 | NO |
| 35 | SULT1A1 | SULT1A1 | SULT1A1 | 2892 | 0.089 | 0.6 | NO |
| 36 | GGCT | GGCT | GGCT | 3116 | 0.081 | 0.59 | NO |
| 37 | AHCY | AHCY | AHCY | 3256 | 0.077 | 0.59 | NO |
| 38 | MGST1 | MGST1 | MGST1 | 3685 | 0.066 | 0.57 | NO |
| 39 | GSTO1 | GSTO1 | GSTO1 | 3953 | 0.058 | 0.56 | NO |
| 40 | GGT7 | GGT7 | GGT7 | 4210 | 0.053 | 0.55 | NO |
| 41 | COMT | COMT | COMT | 4540 | 0.046 | 0.54 | NO |
| 42 | MAT2B | MAT2B | MAT2B | 5099 | 0.035 | 0.51 | NO |
| 43 | UGDH | UGDH | UGDH | 7569 | -0.00097 | 0.38 | NO |
| 44 | UGT2B4 | UGT2B4 | UGT2B4 | 8130 | -0.0082 | 0.35 | NO |
| 45 | CNDP2 | CNDP2 | CNDP2 | 8278 | -0.01 | 0.34 | NO |
| 46 | GSTM1 | GSTM1 | GSTM1 | 8653 | -0.016 | 0.32 | NO |
| 47 | GGT1 | GGT1 | GGT1 | 9155 | -0.024 | 0.29 | NO |
| 48 | UGP2 | UGP2 | UGP2 | 9611 | -0.032 | 0.27 | NO |
| 49 | ACSM2B | ACSM2B | ACSM2B | 9721 | -0.033 | 0.27 | NO |
| 50 | GSTA2 | GSTA2 | GSTA2 | 9771 | -0.034 | 0.27 | NO |
| 51 | GCLC | GCLC | GCLC | 9860 | -0.036 | 0.27 | NO |
| 52 | PAPSS1 | PAPSS1 | PAPSS1 | 9927 | -0.037 | 0.27 | NO |
| 53 | MTR | MTR | MTR | 11009 | -0.056 | 0.21 | NO |
| 54 | CYP1A2 | CYP1A2 | CYP1A2 | 12282 | -0.089 | 0.15 | NO |
| 55 | GSTA4 | GSTA4 | GSTA4 | 13453 | -0.13 | 0.099 | NO |
| 56 | GCLM | GCLM | GCLM | 13783 | -0.15 | 0.093 | NO |
| 57 | PAPSS2 | PAPSS2 | PAPSS2 | 13796 | -0.15 | 0.1 | NO |
| 58 | GGT5 | GGT5 | GGT5 | 13987 | -0.16 | 0.11 | NO |
| 59 | NNMT | NNMT | NNMT | 14243 | -0.17 | 0.11 | NO |
| 60 | MAT1A | MAT1A | MAT1A | 14252 | -0.17 | 0.12 | NO |
| 61 | GLYAT | GLYAT | GLYAT | 15516 | -0.24 | 0.074 | NO |
| 62 | GSTM5 | GSTM5 | GSTM5 | 16210 | -0.29 | 0.06 | NO |
| 63 | SULT4A1 | SULT4A1 | SULT4A1 | 17178 | -0.36 | 0.038 | NO |
| 64 | SULT1C4 | SULT1C4 | SULT1C4 | 17356 | -0.38 | 0.06 | NO |
Figure S15. Get High-res Image This plot shows mRNAseq_cNMF expression data heatmap (on the left) a RunningEnrichmentScore(RES) plot (on the top right) and a Signal2Noise(S2N) plot (on the bottom right) of genes in the pathway: KEGG DRUG METABOLISM CYTOCHROME P450.
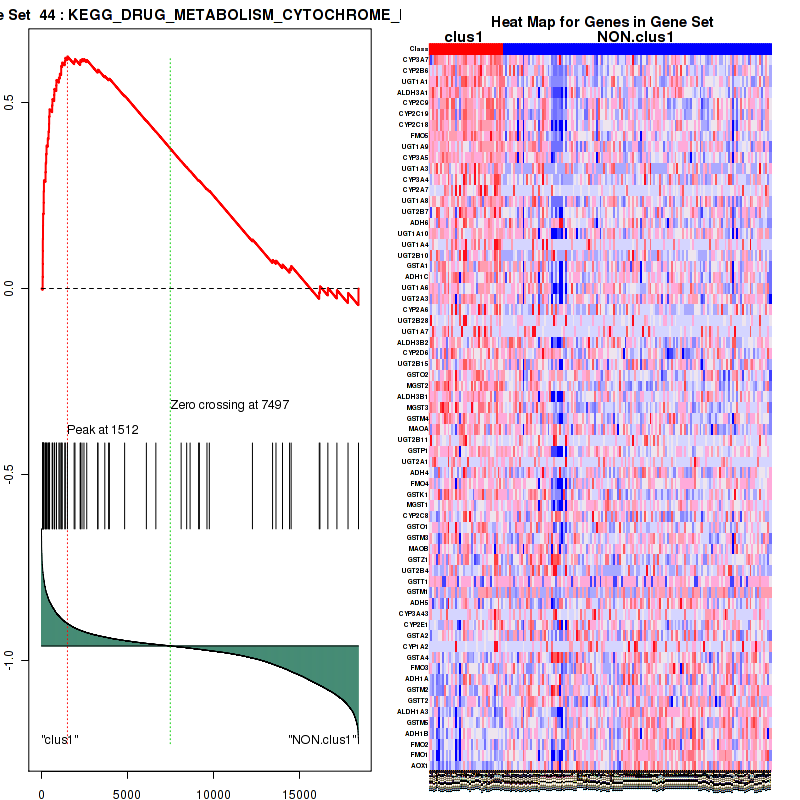
Figure S16. Get High-res Image For the top 5 core enriched genes in the pathway: KEGG DRUG METABOLISM CYTOCHROME P450, this volcano plot shows how much they are up/down-regulated and significant. The significance was calculated by empirical bayesian fit
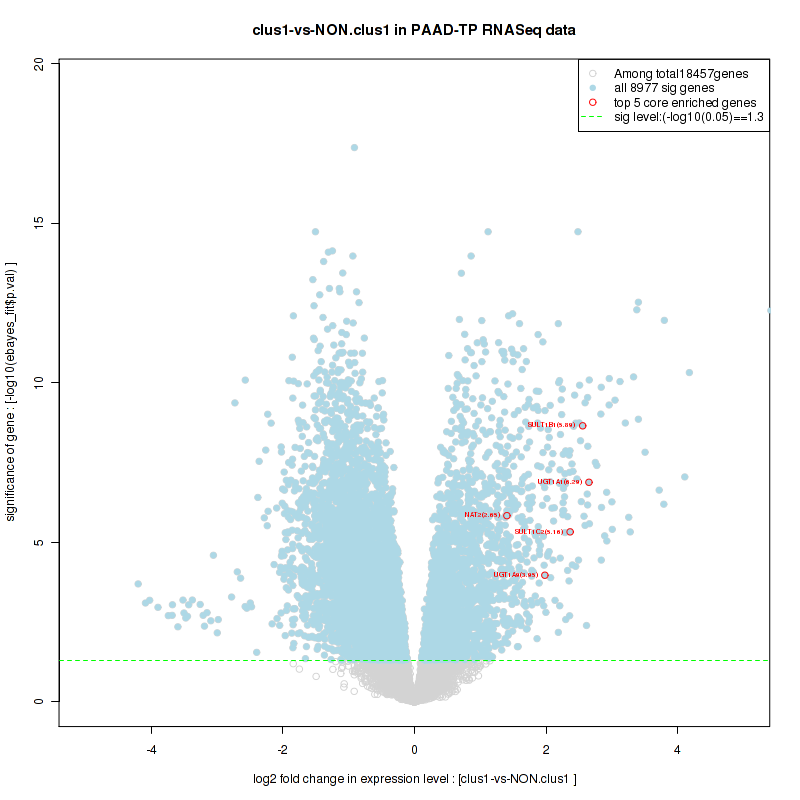
Table S9. Get Full Table This table shows a Running Enrichment Score (RES) of each gene in this pathway, that is, the enrichment score at this point in the ranked list of genes. All genes are ranked by Signal-to-Noise (S2N), a measure of similarity as default and are used to obtain ES matrix of all genes. In this way, GSEA tool uses expression pattern of not only overlapped genes but also not-overlapped genes to produce ES matrix.
| Rank | GENE | SYMBOL | DESC | LIST.LOC | S2N | RES | CORE_ENRICHMENT |
|---|---|---|---|---|---|---|---|
| 1 | UGT1A1 | UGT1A1 | UGT1A1 | 78 | 0.55 | 0.088 | YES |
| 2 | UGT1A9 | UGT1A9 | UGT1A9 | 145 | 0.48 | 0.16 | YES |
| 3 | UGT1A3 | UGT1A3 | UGT1A3 | 246 | 0.41 | 0.23 | YES |
| 4 | UGT1A8 | UGT1A8 | UGT1A8 | 367 | 0.36 | 0.28 | YES |
| 5 | UGT2B7 | UGT2B7 | UGT2B7 | 412 | 0.34 | 0.34 | YES |
| 6 | UGT1A10 | UGT1A10 | UGT1A10 | 450 | 0.33 | 0.39 | YES |
| 7 | UGT1A4 | UGT1A4 | UGT1A4 | 470 | 0.33 | 0.44 | YES |
| 8 | UGT2B10 | UGT2B10 | UGT2B10 | 624 | 0.29 | 0.48 | YES |
| 9 | UGT1A6 | UGT1A6 | UGT1A6 | 751 | 0.27 | 0.52 | YES |
| 10 | UGT2A3 | UGT2A3 | UGT2A3 | 867 | 0.24 | 0.56 | YES |
| 11 | UGT2B28 | UGT2B28 | UGT2B28 | 1015 | 0.22 | 0.59 | YES |
| 12 | UGT1A7 | UGT1A7 | UGT1A7 | 1069 | 0.21 | 0.62 | YES |
| 13 | UGT2B15 | UGT2B15 | UGT2B15 | 1210 | 0.19 | 0.64 | YES |
| 14 | UGT2B11 | UGT2B11 | UGT2B11 | 2269 | 0.12 | 0.6 | NO |
| 15 | BLVRB | BLVRB | BLVRB | 2275 | 0.11 | 0.62 | NO |
| 16 | UGT2A1 | UGT2A1 | UGT2A1 | 2473 | 0.1 | 0.63 | NO |
| 17 | ALAS1 | ALAS1 | ALAS1 | 2960 | 0.086 | 0.62 | NO |
| 18 | HCCS | HCCS | HCCS | 3230 | 0.078 | 0.62 | NO |
| 19 | COX15 | COX15 | COX15 | 3535 | 0.07 | 0.61 | NO |
| 20 | GUSB | GUSB | GUSB | 3708 | 0.065 | 0.61 | NO |
| 21 | HMBS | HMBS | HMBS | 3811 | 0.062 | 0.62 | NO |
| 22 | MMAB | MMAB | MMAB | 3958 | 0.058 | 0.62 | NO |
| 23 | HMOX2 | HMOX2 | HMOX2 | 4348 | 0.05 | 0.61 | NO |
| 24 | PPOX | PPOX | PPOX | 5361 | 0.03 | 0.56 | NO |
| 25 | ALAD | ALAD | ALAD | 5415 | 0.03 | 0.56 | NO |
| 26 | EPRS | EPRS | EPRS | 6250 | 0.017 | 0.52 | NO |
| 27 | EARS2 | EARS2 | EARS2 | 6592 | 0.012 | 0.5 | NO |
| 28 | COX10 | COX10 | COX10 | 6690 | 0.011 | 0.5 | NO |
| 29 | CPOX | CPOX | CPOX | 7333 | 0.0024 | 0.46 | NO |
| 30 | UROS | UROS | UROS | 7925 | -0.0054 | 0.43 | NO |
| 31 | UGT2B4 | UGT2B4 | UGT2B4 | 8130 | -0.0082 | 0.42 | NO |
| 32 | BLVRA | BLVRA | BLVRA | 8349 | -0.011 | 0.41 | NO |
| 33 | FTH1 | FTH1 | FTH1 | 10310 | -0.043 | 0.31 | NO |
| 34 | UROD | UROD | UROD | 11369 | -0.064 | 0.27 | NO |
| 35 | CP | CP | CP | 12122 | -0.084 | 0.24 | NO |
| 36 | FECH | FECH | FECH | 14331 | -0.18 | 0.15 | NO |
| 37 | HMOX1 | HMOX1 | HMOX1 | 14733 | -0.2 | 0.16 | NO |
| 38 | ALAS2 | ALAS2 | ALAS2 | 15480 | -0.24 | 0.16 | NO |
Figure S17. Get High-res Image This plot shows mRNAseq_cNMF expression data heatmap (on the left) a RunningEnrichmentScore(RES) plot (on the top right) and a Signal2Noise(S2N) plot (on the bottom right) of genes in the pathway: KEGG DRUG METABOLISM OTHER ENZYMES.
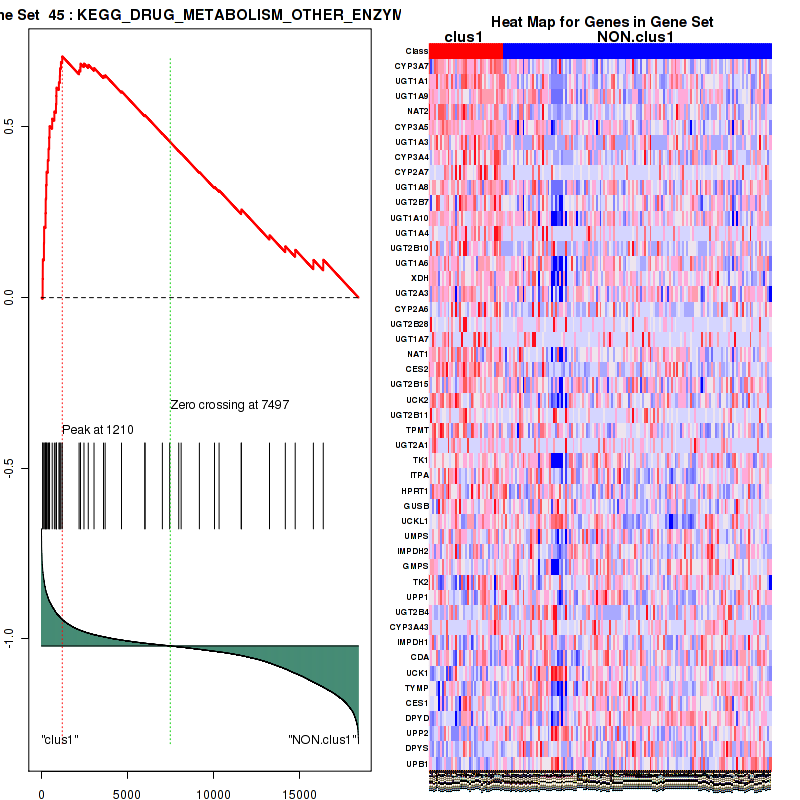
Figure S18. Get High-res Image For the top 5 core enriched genes in the pathway: KEGG DRUG METABOLISM OTHER ENZYMES, this volcano plot shows how much they are up/down-regulated and significant. The significance was calculated by empirical bayesian fit

Table S10. Get Full Table This table shows a Running Enrichment Score (RES) of each gene in this pathway, that is, the enrichment score at this point in the ranked list of genes. All genes are ranked by Signal-to-Noise (S2N), a measure of similarity as default and are used to obtain ES matrix of all genes. In this way, GSEA tool uses expression pattern of not only overlapped genes but also not-overlapped genes to produce ES matrix.
| Rank | GENE | SYMBOL | DESC | LIST.LOC | S2N | RES | CORE_ENRICHMENT |
|---|---|---|---|---|---|---|---|
| 1 | LSM4 | LSM4 | LSM4 | 2543 | 0.1 | -0.064 | YES |
| 2 | C2orf29 | C2orf29 | C2orf29 | 2662 | 0.097 | -0.00011 | YES |
| 3 | EXOSC5 | EXOSC5 | EXOSC5 | 3152 | 0.08 | 0.032 | YES |
| 4 | EXOSC1 | EXOSC1 | EXOSC1 | 3186 | 0.079 | 0.087 | YES |
| 5 | EXOSC4 | EXOSC4 | EXOSC4 | 3661 | 0.066 | 0.11 | YES |
| 6 | LSM5 | LSM5 | LSM5 | 4280 | 0.051 | 0.11 | YES |
| 7 | EXOSC7 | EXOSC7 | EXOSC7 | 4680 | 0.043 | 0.12 | YES |
| 8 | EXOSC8 | EXOSC8 | EXOSC8 | 5142 | 0.034 | 0.12 | YES |
| 9 | PATL1 | PATL1 | PATL1 | 5207 | 0.033 | 0.14 | YES |
| 10 | EXOSC3 | EXOSC3 | EXOSC3 | 5213 | 0.033 | 0.17 | YES |
| 11 | PABPC1 | PABPC1 | PABPC1 | 5533 | 0.028 | 0.17 | YES |
| 12 | DCPS | DCPS | DCPS | 5554 | 0.027 | 0.19 | YES |
| 13 | PARN | PARN | PARN | 5627 | 0.026 | 0.2 | YES |
| 14 | EDC4 | EDC4 | EDC4 | 5890 | 0.022 | 0.2 | YES |
| 15 | EXOSC6 | EXOSC6 | EXOSC6 | 5967 | 0.021 | 0.22 | YES |
| 16 | TNKS1BP1 | TNKS1BP1 | TNKS1BP1 | 6230 | 0.017 | 0.22 | YES |
| 17 | EXOSC2 | EXOSC2 | EXOSC2 | 6403 | 0.015 | 0.22 | YES |
| 18 | LSM2 | LSM2 | LSM2 | 6519 | 0.013 | 0.22 | YES |
| 19 | LSM6 | LSM6 | LSM6 | 6877 | 0.0084 | 0.21 | YES |
| 20 | CNOT2 | CNOT2 | CNOT2 | 6886 | 0.0083 | 0.21 | YES |
| 21 | CNOT6 | CNOT6 | CNOT6 | 6915 | 0.0078 | 0.22 | YES |
| 22 | DIS3 | DIS3 | DIS3 | 7043 | 0.0063 | 0.21 | YES |
| 23 | LSM1 | LSM1 | LSM1 | 7112 | 0.0056 | 0.21 | YES |
| 24 | CNOT3 | CNOT3 | CNOT3 | 7180 | 0.0046 | 0.21 | YES |
| 25 | CNOT10 | CNOT10 | CNOT10 | 7298 | 0.003 | 0.21 | YES |
| 26 | CNOT8 | CNOT8 | CNOT8 | 7358 | 0.002 | 0.21 | YES |
| 27 | LSM3 | LSM3 | LSM3 | 8124 | -0.0081 | 0.17 | YES |
| 28 | PAIP1 | PAIP1 | PAIP1 | 8264 | -0.01 | 0.17 | YES |
| 29 | EIF4A1 | EIF4A1 | EIF4A1 | 8566 | -0.015 | 0.17 | YES |
| 30 | EIF4G1 | EIF4G1 | EIF4G1 | 8580 | -0.015 | 0.18 | YES |
| 31 | EIF4A2 | EIF4A2 | EIF4A2 | 8927 | -0.021 | 0.17 | YES |
| 32 | EXOSC9 | EXOSC9 | EXOSC9 | 8955 | -0.021 | 0.19 | YES |
| 33 | EDC3 | EDC3 | EDC3 | 9088 | -0.023 | 0.2 | YES |
| 34 | EIF4A3 | EIF4A3 | EIF4A3 | 9144 | -0.024 | 0.21 | YES |
| 35 | CNOT4 | CNOT4 | CNOT4 | 9159 | -0.024 | 0.23 | YES |
| 36 | EIF4E | EIF4E | EIF4E | 9189 | -0.024 | 0.24 | YES |
| 37 | EIF4B | EIF4B | EIF4B | 9394 | -0.028 | 0.25 | YES |
| 38 | DCP1A | DCP1A | DCP1A | 9921 | -0.036 | 0.25 | YES |
| 39 | DCP1B | DCP1B | DCP1B | 10237 | -0.042 | 0.26 | YES |
| 40 | DDX6 | DDX6 | DDX6 | 10508 | -0.046 | 0.28 | YES |
| 41 | RQCD1 | RQCD1 | RQCD1 | 10550 | -0.047 | 0.31 | YES |
| 42 | CNOT7 | CNOT7 | CNOT7 | 10695 | -0.05 | 0.34 | YES |
| 43 | DCP2 | DCP2 | DCP2 | 10863 | -0.053 | 0.37 | YES |
| 44 | XRN1 | XRN1 | XRN1 | 11038 | -0.057 | 0.4 | YES |
Figure S19. Get High-res Image This plot shows mRNAseq_cNMF expression data heatmap (on the left) a RunningEnrichmentScore(RES) plot (on the top right) and a Signal2Noise(S2N) plot (on the bottom right) of genes in the pathway: KEGG BASE EXCISION REPAIR.
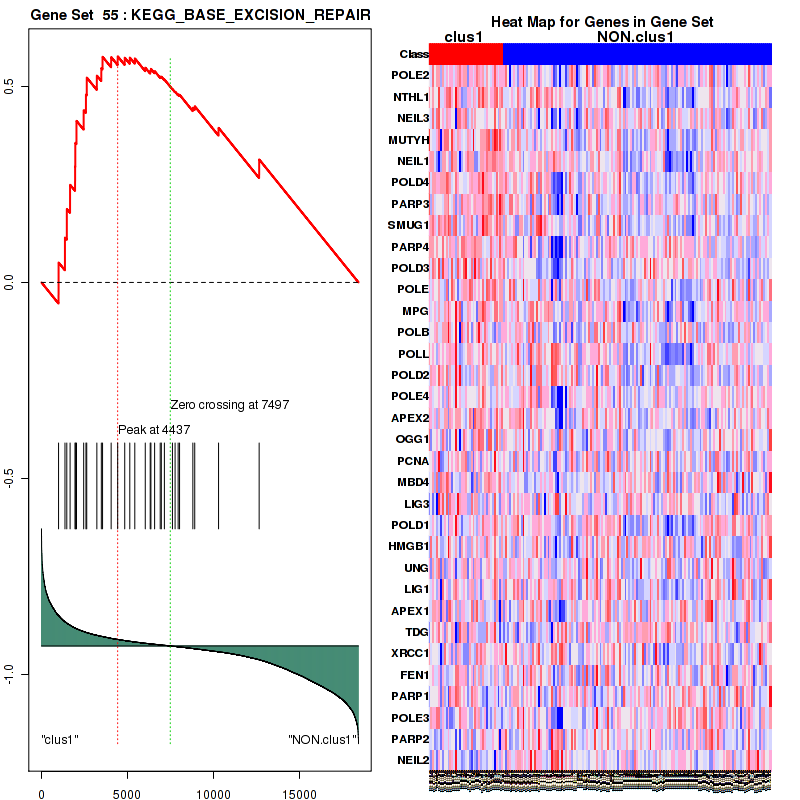
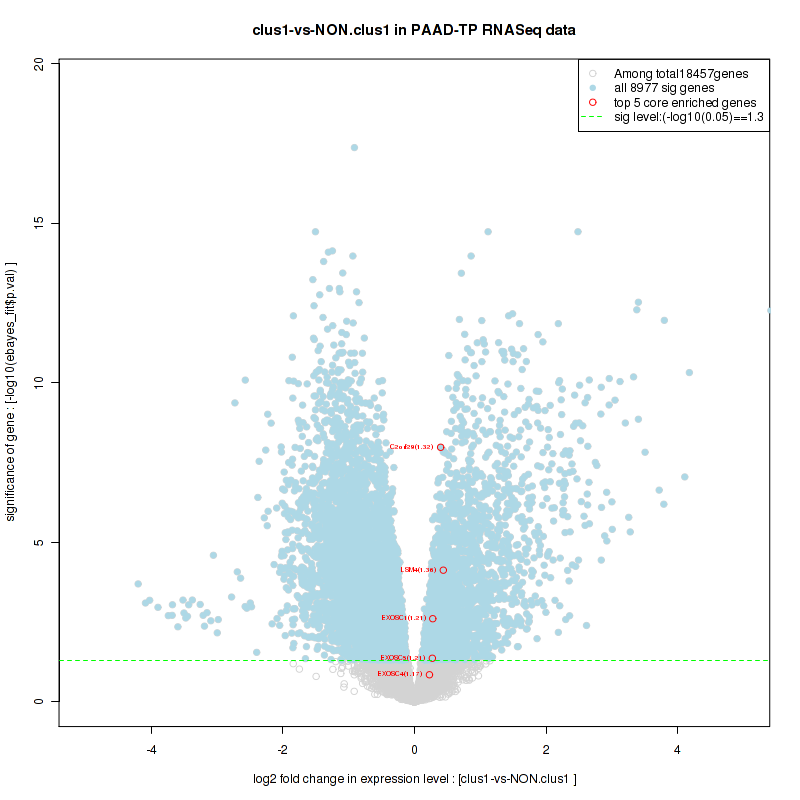
Figure S20. Get High-res Image For the top 5 core enriched genes in the pathway: KEGG BASE EXCISION REPAIR, this volcano plot shows how much they are up/down-regulated and significant. The significance was calculated by empirical bayesian fit
For the top enriched genes, if you want to check whether they are
-
up-regulated, please check the list of up-regulated genes
-
down-regulated, please check the list of down-regulated genes
For the top enriched genes, if you want to check whether they are
-
highly expressed genes, please check the list of high (top 30%) expressed genes
-
low expressed genes, please check the list of low (bottom 30%) expressed genes
An expression pattern of top(30%)/middle(30%)/low(30%) in this subtype against other subtypes is available in a heatmap
For the top enriched genes, if you want to check whether they are
-
significantly differently expressed genes by eBayes lm fit, please check the list of significant genes
Table 4. Get Full Table This table shows top 10 pathways which are significantly enriched in cluster clus2. It displays only significant gene sets satisfying nom.p.val.threshold (-1), fwer.p.val.threshold (-1) , fdr.q.val.threshold (0.25) and the default table is sorted by Normalized Enrichment Score (NES). Further details on NES statistics, please visit The Broad GSEA website.
| GeneSet(GS) | Size(#genes) | genes.ES.table | ES | NES | NOM.p.val | FDR.q.val | FWER.p.val | Tag.. | Gene.. | Signal | FDR..median. | glob.p.val |
|---|---|---|---|---|---|---|---|---|---|---|---|---|
| KEGG LYSINE DEGRADATION | 44 | genes.ES.table | 0.45 | 1.9 | 0 | 0.84 | 0.27 | 0.046 | 0.0097 | 0.045 | 0 | 0.17 |
| KEGG GLYCOSYLPHOSPHATIDYLINOSITOL GPI ANCHOR BIOSYNTHESIS | 25 | genes.ES.table | 0.49 | 1.7 | 0.03 | 0.36 | 0.85 | 0.76 | 0.42 | 0.44 | 0.17 | 0.085 |
| BIOCARTA BIOPEPTIDES PATHWAY | 42 | genes.ES.table | 0.51 | 1.7 | 0.011 | 0.46 | 0.74 | 0.14 | 0.11 | 0.13 | 0.18 | 0.11 |
| BIOCARTA CHREBP2 PATHWAY | 40 | genes.ES.table | 0.55 | 1.9 | 0 | 0.49 | 0.3 | 0.18 | 0.11 | 0.16 | 0 | 0.1 |
| SIG CD40PATHWAYMAP | 33 | genes.ES.table | 0.49 | 1.7 | 0.024 | 0.38 | 0.8 | 0.15 | 0.089 | 0.14 | 0.16 | 0.091 |
| PID P38 MKK3 6PATHWAY | 26 | genes.ES.table | 0.45 | 1.7 | 0.015 | 0.41 | 0.79 | 0.15 | 0.14 | 0.13 | 0.17 | 0.097 |
| PID LKB1 PATHWAY | 47 | genes.ES.table | 0.38 | 1.7 | 0.033 | 0.45 | 0.77 | 0.11 | 0.056 | 0.1 | 0.18 | 0.11 |
| PID LIS1PATHWAY | 28 | genes.ES.table | 0.61 | 1.8 | 0.0042 | 0.41 | 0.54 | 0.25 | 0.11 | 0.22 | 0.1 | 0.097 |
| PID HEDGEHOG GLIPATHWAY | 48 | genes.ES.table | 0.43 | 1.6 | 0.024 | 0.38 | 0.9 | 0.15 | 0.11 | 0.13 | 0.2 | 0.087 |
| REACTOME TRANS GOLGI NETWORK VESICLE BUDDING | 59 | genes.ES.table | 0.33 | 1.7 | 0.023 | 0.42 | 0.77 | 0.034 | 0.013 | 0.034 | 0.17 | 0.098 |
Table S11. Get Full Table This table shows a Running Enrichment Score (RES) of each gene in this pathway, that is, the enrichment score at this point in the ranked list of genes. All genes are ranked by Signal-to-Noise (S2N), a measure of similarity as default and are used to obtain ES matrix of all genes. In this way, GSEA tool uses expression pattern of not only overlapped genes but also not-overlapped genes to produce ES matrix.
| Rank | GENE | SYMBOL | DESC | LIST.LOC | S2N | RES | CORE_ENRICHMENT |
|---|---|---|---|---|---|---|---|
| 1 | OGDHL | OGDHL | OGDHL | 101 | 0.96 | 0.24 | YES |
| 2 | PIPOX | PIPOX | PIPOX | 179 | 0.85 | 0.45 | YES |
| 3 | AADAT | AADAT | AADAT | 2443 | 0.21 | 0.38 | NO |
| 4 | ACAT1 | ACAT1 | ACAT1 | 3430 | 0.14 | 0.36 | NO |
| 5 | HADH | HADH | HADH | 3857 | 0.12 | 0.37 | NO |
| 6 | SUV420H2 | SUV420H2 | SUV420H2 | 4021 | 0.11 | 0.39 | NO |
| 7 | GCDH | GCDH | GCDH | 5023 | 0.08 | 0.35 | NO |
| 8 | AASDH | AASDH | AASDH | 5360 | 0.071 | 0.35 | NO |
| 9 | SUV39H1 | SUV39H1 | SUV39H1 | 5792 | 0.061 | 0.34 | NO |
| 10 | SETMAR | SETMAR | SETMAR | 6038 | 0.056 | 0.34 | NO |
| 11 | ALDH9A1 | ALDH9A1 | ALDH9A1 | 6143 | 0.054 | 0.35 | NO |
| 12 | SETDB2 | SETDB2 | SETDB2 | 7149 | 0.034 | 0.31 | NO |
| 13 | AASDHPPT | AASDHPPT | AASDHPPT | 7155 | 0.034 | 0.32 | NO |
| 14 | DOT1L | DOT1L | DOT1L | 7193 | 0.033 | 0.32 | NO |
| 15 | ECHS1 | ECHS1 | ECHS1 | 7747 | 0.024 | 0.3 | NO |
| 16 | NSD1 | NSD1 | NSD1 | 7801 | 0.023 | 0.3 | NO |
| 17 | SETD1B | SETD1B | SETD1B | 8109 | 0.018 | 0.29 | NO |
| 18 | BBOX1 | BBOX1 | BBOX1 | 8393 | 0.014 | 0.28 | NO |
| 19 | EHMT2 | EHMT2 | EHMT2 | 8910 | 0.0059 | 0.25 | NO |
| 20 | PLOD3 | PLOD3 | PLOD3 | 8914 | 0.0057 | 0.25 | NO |
| 21 | SETD1A | SETD1A | SETD1A | 9193 | 0.0014 | 0.24 | NO |
| 22 | OGDH | OGDH | OGDH | 9314 | -0.00048 | 0.23 | NO |
| 23 | ALDH3A2 | ALDH3A2 | ALDH3A2 | 9355 | -0.00097 | 0.23 | NO |
| 24 | HADHA | HADHA | HADHA | 9453 | -0.0023 | 0.22 | NO |
| 25 | EHHADH | EHHADH | EHHADH | 9992 | -0.011 | 0.2 | NO |
| 26 | EHMT1 | EHMT1 | EHMT1 | 10429 | -0.018 | 0.18 | NO |
| 27 | SETD2 | SETD2 | SETD2 | 10541 | -0.02 | 0.18 | NO |
| 28 | AASS | AASS | AASS | 10607 | -0.021 | 0.18 | NO |
| 29 | ASH1L | ASH1L | ASH1L | 10659 | -0.022 | 0.18 | NO |
| 30 | WHSC1 | WHSC1 | WHSC1 | 11051 | -0.028 | 0.17 | NO |
| 31 | SETDB1 | SETDB1 | SETDB1 | 11060 | -0.028 | 0.17 | NO |
| 32 | SUV420H1 | SUV420H1 | SUV420H1 | 11146 | -0.03 | 0.18 | NO |
| 33 | DLST | DLST | DLST | 11189 | -0.031 | 0.18 | NO |
| 34 | ACAT2 | ACAT2 | ACAT2 | 11659 | -0.039 | 0.17 | NO |
| 35 | SUV39H2 | SUV39H2 | SUV39H2 | 11981 | -0.044 | 0.16 | NO |
| 36 | TMLHE | TMLHE | TMLHE | 12286 | -0.051 | 0.16 | NO |
| 37 | SETD7 | SETD7 | SETD7 | 12505 | -0.055 | 0.16 | NO |
| 38 | WHSC1L1 | WHSC1L1 | WHSC1L1 | 12770 | -0.061 | 0.16 | NO |
| 39 | SETD8 | SETD8 | SETD8 | 13264 | -0.072 | 0.15 | NO |
| 40 | PLOD1 | PLOD1 | PLOD1 | 13787 | -0.086 | 0.14 | NO |
| 41 | ALDH7A1 | ALDH7A1 | ALDH7A1 | 13791 | -0.086 | 0.17 | NO |
| 42 | ALDH2 | ALDH2 | ALDH2 | 13964 | -0.092 | 0.18 | NO |
| 43 | PLOD2 | PLOD2 | PLOD2 | 14884 | -0.12 | 0.16 | NO |
| 44 | ALDH1B1 | ALDH1B1 | ALDH1B1 | 15009 | -0.13 | 0.19 | NO |
Figure S21. Get High-res Image This plot shows mRNAseq_cNMF expression data heatmap (on the left) a RunningEnrichmentScore(RES) plot (on the top right) and a Signal2Noise(S2N) plot (on the bottom right) of genes in the pathway: KEGG LYSINE DEGRADATION.
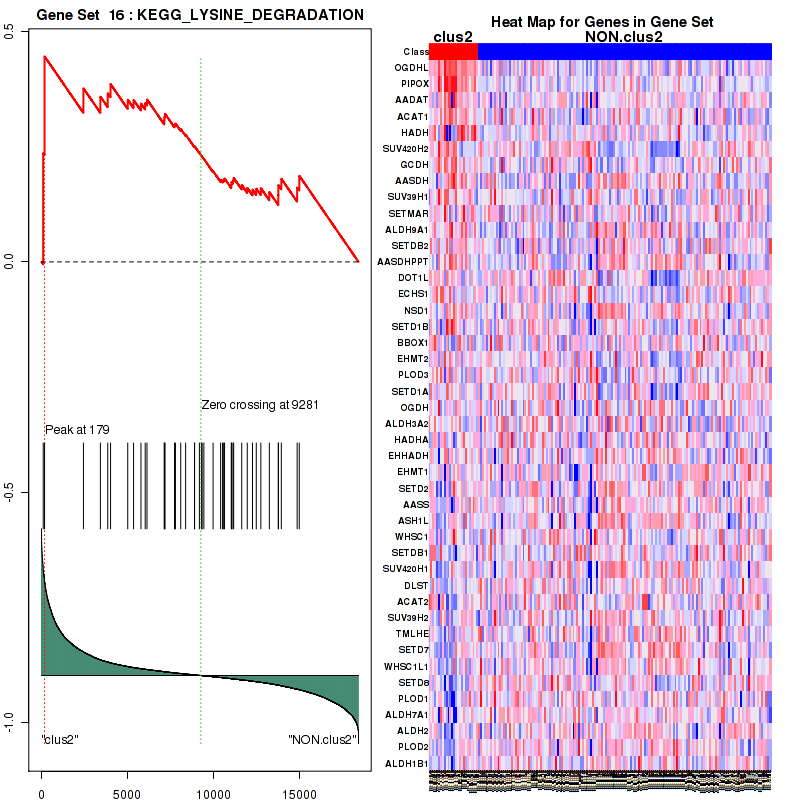
Figure S22. Get High-res Image For the top 5 core enriched genes in the pathway: KEGG LYSINE DEGRADATION, this volcano plot shows how much they are up/down-regulated and significant. The significance was calculated by empirical bayesian fit
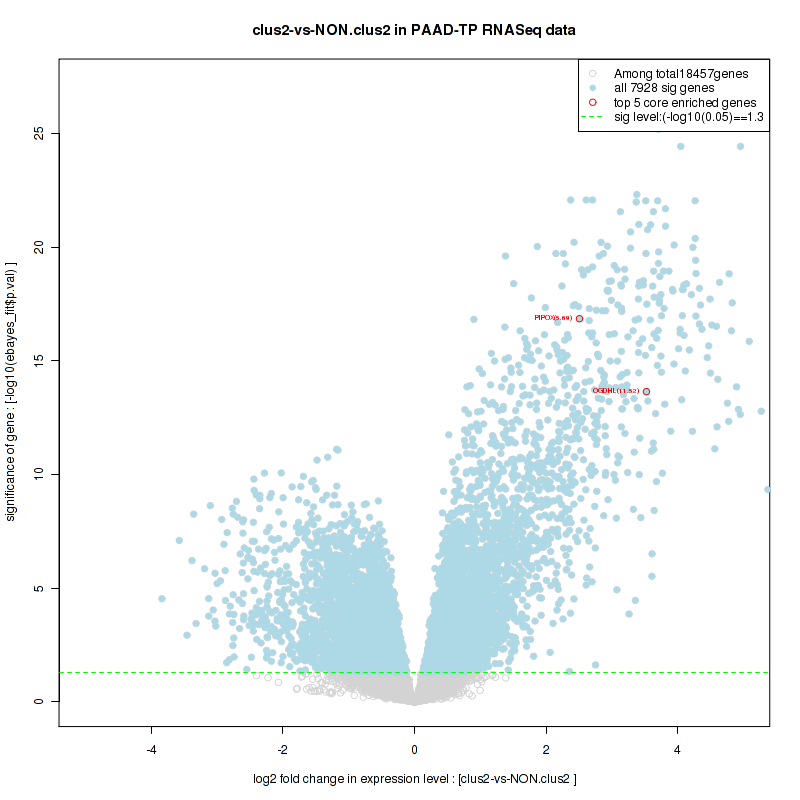
Table S12. Get Full Table This table shows a Running Enrichment Score (RES) of each gene in this pathway, that is, the enrichment score at this point in the ranked list of genes. All genes are ranked by Signal-to-Noise (S2N), a measure of similarity as default and are used to obtain ES matrix of all genes. In this way, GSEA tool uses expression pattern of not only overlapped genes but also not-overlapped genes to produce ES matrix.
| Rank | GENE | SYMBOL | DESC | LIST.LOC | S2N | RES | CORE_ENRICHMENT |
|---|---|---|---|---|---|---|---|
| 1 | GCK | GCK | GCK | 73 | 1 | 0.2 | YES |
| 2 | PPP2R2B | PPP2R2B | PPP2R2B | 491 | 0.61 | 0.3 | YES |
| 3 | MLXIPL | MLXIPL | MLXIPL | 636 | 0.55 | 0.4 | YES |
| 4 | PPP2R2C | PPP2R2C | PPP2R2C | 1337 | 0.35 | 0.43 | YES |
| 5 | PRKAR2B | PRKAR2B | PRKAR2B | 1779 | 0.28 | 0.46 | YES |
| 6 | PPP2R3B | PPP2R3B | PPP2R3B | 2025 | 0.25 | 0.5 | YES |
| 7 | PKLR | PKLR | PKLR | 2033 | 0.25 | 0.55 | YES |
| 8 | PRKAR1B | PRKAR1B | PRKAR1B | 2731 | 0.19 | 0.55 | NO |
| 9 | PPP2R5B | PPP2R5B | PPP2R5B | 4189 | 0.11 | 0.49 | NO |
| 10 | PRKACA | PRKACA | PRKACA | 4439 | 0.098 | 0.5 | NO |
| 11 | PRKAR1A | PRKAR1A | PRKAR1A | 4780 | 0.087 | 0.5 | NO |
| 12 | PRKACB | PRKACB | PRKACB | 5572 | 0.066 | 0.46 | NO |
| 13 | YWHAE | YWHAE | YWHAE | 5835 | 0.06 | 0.46 | NO |
| 14 | ACACA | ACACA | ACACA | 5904 | 0.059 | 0.47 | NO |
| 15 | PPP2R4 | PPP2R4 | PPP2R4 | 6604 | 0.045 | 0.44 | NO |
| 16 | PPP2R1A | PPP2R1A | PPP2R1A | 6624 | 0.044 | 0.45 | NO |
| 17 | PRKAA2 | PRKAA2 | PRKAA2 | 6668 | 0.044 | 0.46 | NO |
| 18 | PRKAG1 | PRKAG1 | PRKAG1 | 6859 | 0.04 | 0.45 | NO |
| 19 | PRKAG2 | PRKAG2 | PRKAG2 | 7011 | 0.037 | 0.45 | NO |
| 20 | FASN | FASN | FASN | 7096 | 0.035 | 0.46 | NO |
| 21 | YWHAQ | YWHAQ | YWHAQ | 7103 | 0.035 | 0.46 | NO |
| 22 | PPP2R1B | PPP2R1B | PPP2R1B | 7342 | 0.031 | 0.46 | NO |
| 23 | PPP2CB | PPP2CB | PPP2CB | 8923 | 0.0056 | 0.37 | NO |
| 24 | YWHAG | YWHAG | YWHAG | 9307 | -0.0004 | 0.35 | NO |
| 25 | YWHAH | YWHAH | YWHAH | 9428 | -0.0018 | 0.34 | NO |
| 26 | PPP2CA | PPP2CA | PPP2CA | 9469 | -0.0026 | 0.34 | NO |
| 27 | PPP2R5D | PPP2R5D | PPP2R5D | 9951 | -0.01 | 0.32 | NO |
| 28 | PPP2R5C | PPP2R5C | PPP2R5C | 10091 | -0.012 | 0.31 | NO |
| 29 | MLX | MLX | MLX | 10226 | -0.014 | 0.31 | NO |
| 30 | PPP2R2D | PPP2R2D | PPP2R2D | 10708 | -0.022 | 0.29 | NO |
| 31 | PRKAB1 | PRKAB1 | PRKAB1 | 10795 | -0.024 | 0.29 | NO |
| 32 | YWHAB | YWHAB | YWHAB | 11239 | -0.032 | 0.27 | NO |
| 33 | PPP2R5A | PPP2R5A | PPP2R5A | 11528 | -0.037 | 0.26 | NO |
| 34 | PRKAB2 | PRKAB2 | PRKAB2 | 11955 | -0.044 | 0.25 | NO |
| 35 | PPP2R5E | PPP2R5E | PPP2R5E | 12809 | -0.062 | 0.21 | NO |
| 36 | PRKAR2A | PRKAR2A | PRKAR2A | 13258 | -0.072 | 0.2 | NO |
| 37 | PRKAA1 | PRKAA1 | PRKAA1 | 13550 | -0.08 | 0.2 | NO |
| 38 | PPP2R2A | PPP2R2A | PPP2R2A | 13729 | -0.084 | 0.21 | NO |
| 39 | YWHAZ | YWHAZ | YWHAZ | 14377 | -0.1 | 0.2 | NO |
| 40 | PPP2R3A | PPP2R3A | PPP2R3A | 15136 | -0.13 | 0.18 | NO |
Figure S23. Get High-res Image This plot shows mRNAseq_cNMF expression data heatmap (on the left) a RunningEnrichmentScore(RES) plot (on the top right) and a Signal2Noise(S2N) plot (on the bottom right) of genes in the pathway: KEGG GLYCOSYLPHOSPHATIDYLINOSITOL GPI ANCHOR BIOSYNTHESIS.
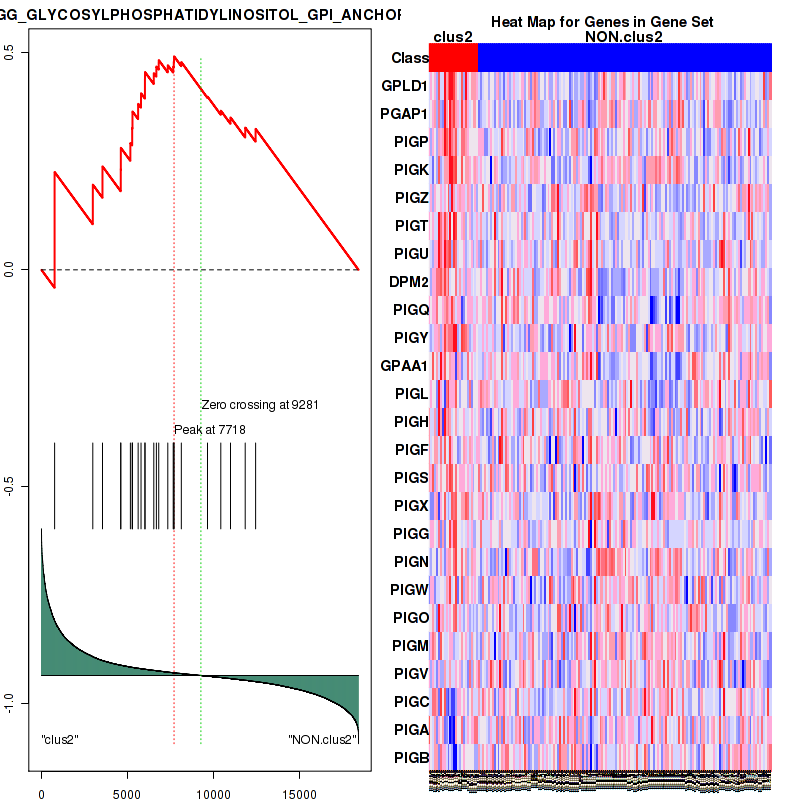
Figure S24. Get High-res Image For the top 5 core enriched genes in the pathway: KEGG GLYCOSYLPHOSPHATIDYLINOSITOL GPI ANCHOR BIOSYNTHESIS, this volcano plot shows how much they are up/down-regulated and significant. The significance was calculated by empirical bayesian fit
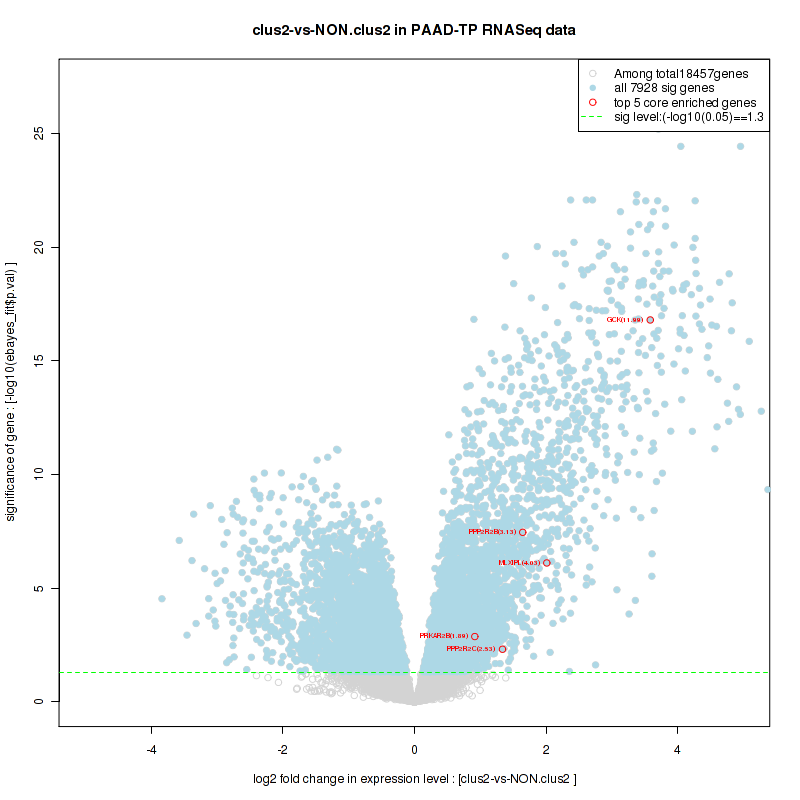
Table S13. Get Full Table This table shows a Running Enrichment Score (RES) of each gene in this pathway, that is, the enrichment score at this point in the ranked list of genes. All genes are ranked by Signal-to-Noise (S2N), a measure of similarity as default and are used to obtain ES matrix of all genes. In this way, GSEA tool uses expression pattern of not only overlapped genes but also not-overlapped genes to produce ES matrix.
| Rank | GENE | SYMBOL | DESC | LIST.LOC | S2N | RES | CORE_ENRICHMENT |
|---|---|---|---|---|---|---|---|
| 1 | GRIA2 | GRIA2 | GRIA2 | 17 | 1.2 | 0.18 | YES |
| 2 | CAMK2B | CAMK2B | CAMK2B | 19 | 1.2 | 0.35 | YES |
| 3 | GRIA3 | GRIA3 | GRIA3 | 62 | 1 | 0.51 | YES |
| 4 | CACNG2 | CACNG2 | CACNG2 | 413 | 0.66 | 0.59 | YES |
| 5 | GRIA4 | GRIA4 | GRIA4 | 1088 | 0.4 | 0.62 | YES |
| 6 | CACNG4 | CACNG4 | CACNG4 | 1146 | 0.38 | 0.67 | YES |
| 7 | PRKCG | PRKCG | PRKCG | 1259 | 0.36 | 0.72 | YES |
| 8 | GRIA1 | GRIA1 | GRIA1 | 1644 | 0.3 | 0.75 | YES |
| 9 | NSF | NSF | NSF | 4298 | 0.1 | 0.62 | NO |
| 10 | PICK1 | PICK1 | PICK1 | 4814 | 0.086 | 0.6 | NO |
| 11 | CACNG8 | CACNG8 | CACNG8 | 5084 | 0.078 | 0.6 | NO |
| 12 | CACNG3 | CACNG3 | CACNG3 | 5971 | 0.058 | 0.56 | NO |
| 13 | AP2A2 | AP2A2 | AP2A2 | 7329 | 0.031 | 0.49 | NO |
| 14 | AP2B1 | AP2B1 | AP2B1 | 8510 | 0.012 | 0.43 | NO |
| 15 | AP2S1 | AP2S1 | AP2S1 | 8906 | 0.006 | 0.41 | NO |
| 16 | CAMK2D | CAMK2D | CAMK2D | 9257 | 0.00034 | 0.39 | NO |
| 17 | AP2M1 | AP2M1 | AP2M1 | 10023 | -0.011 | 0.35 | NO |
| 18 | AP2A1 | AP2A1 | AP2A1 | 10106 | -0.012 | 0.35 | NO |
| 19 | MDM2 | MDM2 | MDM2 | 10122 | -0.012 | 0.35 | NO |
| 20 | GRIP2 | GRIP2 | GRIP2 | 10543 | -0.02 | 0.33 | NO |
| 21 | DLG1 | DLG1 | DLG1 | 12149 | -0.048 | 0.25 | NO |
| 22 | EPB41L1 | EPB41L1 | EPB41L1 | 12363 | -0.053 | 0.25 | NO |
| 23 | MYO6 | MYO6 | MYO6 | 12562 | -0.056 | 0.25 | NO |
| 24 | PRKCA | PRKCA | PRKCA | 13493 | -0.078 | 0.21 | NO |
| 25 | CAMK2A | CAMK2A | CAMK2A | 13497 | -0.078 | 0.22 | NO |
| 26 | PRKCB | PRKCB | PRKCB | 13923 | -0.091 | 0.21 | NO |
| 27 | AKAP5 | AKAP5 | AKAP5 | 16902 | -0.23 | 0.084 | NO |
Figure S25. Get High-res Image This plot shows mRNAseq_cNMF expression data heatmap (on the left) a RunningEnrichmentScore(RES) plot (on the top right) and a Signal2Noise(S2N) plot (on the bottom right) of genes in the pathway: BIOCARTA BIOPEPTIDES PATHWAY.
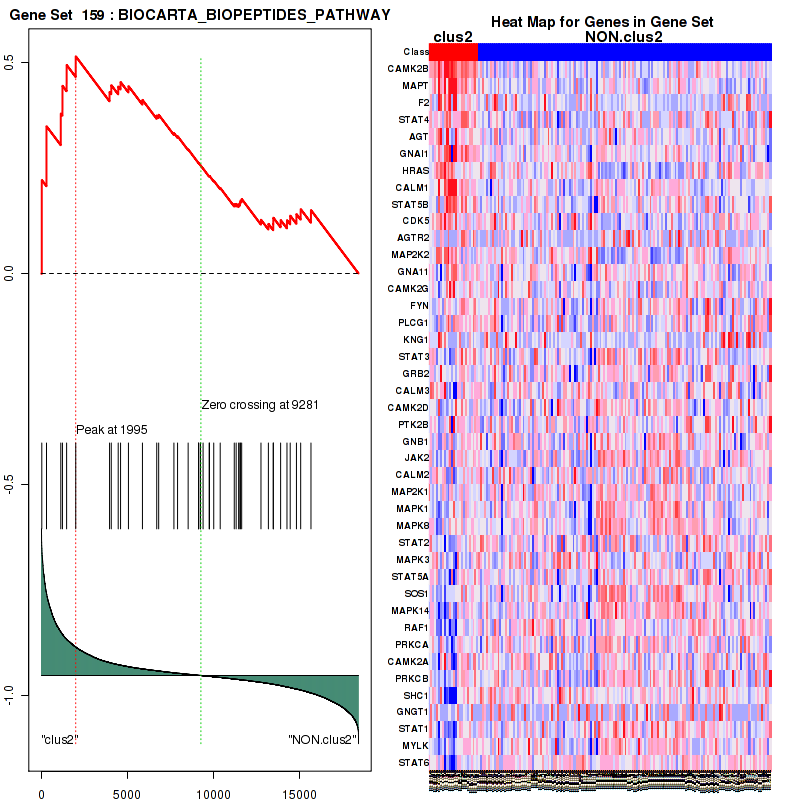
Figure S26. Get High-res Image For the top 5 core enriched genes in the pathway: BIOCARTA BIOPEPTIDES PATHWAY, this volcano plot shows how much they are up/down-regulated and significant. The significance was calculated by empirical bayesian fit
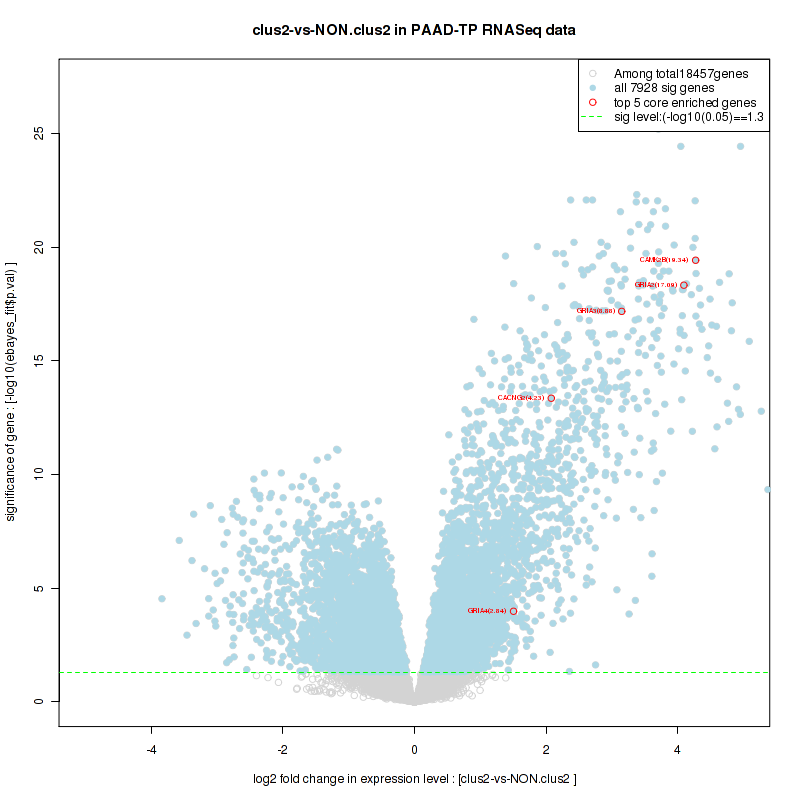
Table S14. Get Full Table This table shows a Running Enrichment Score (RES) of each gene in this pathway, that is, the enrichment score at this point in the ranked list of genes. All genes are ranked by Signal-to-Noise (S2N), a measure of similarity as default and are used to obtain ES matrix of all genes. In this way, GSEA tool uses expression pattern of not only overlapped genes but also not-overlapped genes to produce ES matrix.
| Rank | GENE | SYMBOL | DESC | LIST.LOC | S2N | RES | CORE_ENRICHMENT |
|---|---|---|---|---|---|---|---|
| 1 | CACNA1A | CACNA1A | CACNA1A | 27 | 1.1 | 0.039 | YES |
| 2 | SYT5 | SYT5 | SYT5 | 52 | 1.1 | 0.077 | YES |
| 3 | SNAP25 | SNAP25 | SNAP25 | 97 | 0.97 | 0.11 | YES |
| 4 | ABCC8 | ABCC8 | ABCC8 | 122 | 0.92 | 0.14 | YES |
| 5 | KCNJ11 | KCNJ11 | KCNJ11 | 136 | 0.91 | 0.18 | YES |
| 6 | PAX6 | PAX6 | PAX6 | 157 | 0.88 | 0.21 | YES |
| 7 | ISL1 | ISL1 | ISL1 | 180 | 0.85 | 0.24 | YES |
| 8 | GNG4 | GNG4 | GNG4 | 188 | 0.84 | 0.27 | YES |
| 9 | PCSK1 | PCSK1 | PCSK1 | 189 | 0.84 | 0.3 | YES |
| 10 | GPR119 | GPR119 | GPR119 | 191 | 0.83 | 0.33 | YES |
| 11 | ADCY1 | ADCY1 | ADCY1 | 295 | 0.74 | 0.35 | YES |
| 12 | FFAR1 | FFAR1 | FFAR1 | 306 | 0.73 | 0.38 | YES |
| 13 | CACNB2 | CACNB2 | CACNB2 | 321 | 0.71 | 0.4 | YES |
| 14 | GNAO1 | GNAO1 | GNAO1 | 352 | 0.69 | 0.42 | YES |
| 15 | KCNC2 | KCNC2 | KCNC2 | 368 | 0.68 | 0.45 | YES |
| 16 | KCNB1 | KCNB1 | KCNB1 | 451 | 0.63 | 0.47 | YES |
| 17 | GCGR | GCGR | GCGR | 536 | 0.59 | 0.48 | YES |
| 18 | MLXIPL | MLXIPL | MLXIPL | 636 | 0.55 | 0.5 | YES |
| 19 | GNB3 | GNB3 | GNB3 | 654 | 0.53 | 0.52 | YES |
| 20 | RAPGEF4 | RAPGEF4 | RAPGEF4 | 801 | 0.48 | 0.53 | YES |
| 21 | ADCY2 | ADCY2 | ADCY2 | 956 | 0.43 | 0.54 | YES |
| 22 | GNG2 | GNG2 | GNG2 | 986 | 0.43 | 0.55 | YES |
| 23 | GNG7 | GNG7 | GNG7 | 1124 | 0.39 | 0.56 | YES |
| 24 | GLP1R | GLP1R | GLP1R | 1265 | 0.36 | 0.56 | YES |
| 25 | STXBP1 | STXBP1 | STXBP1 | 1400 | 0.34 | 0.57 | YES |
| 26 | SEC11C | SEC11C | SEC11C | 1464 | 0.32 | 0.58 | YES |
| 27 | STX1A | STX1A | STX1A | 1666 | 0.3 | 0.58 | YES |
| 28 | PRKAR2B | PRKAR2B | PRKAR2B | 1779 | 0.28 | 0.58 | YES |
| 29 | VAMP2 | VAMP2 | VAMP2 | 1921 | 0.26 | 0.58 | YES |
| 30 | ACACB | ACACB | ACACB | 1935 | 0.26 | 0.59 | YES |
| 31 | GNAI1 | GNAI1 | GNAI1 | 1995 | 0.26 | 0.6 | YES |
| 32 | PKLR | PKLR | PKLR | 2033 | 0.25 | 0.6 | YES |
| 33 | GCG | GCG | GCG | 2049 | 0.25 | 0.61 | YES |
| 34 | GNAS | GNAS | GNAS | 2253 | 0.23 | 0.61 | YES |
| 35 | GNG3 | GNG3 | GNG3 | 2256 | 0.23 | 0.62 | YES |
| 36 | PFKFB1 | PFKFB1 | PFKFB1 | 2263 | 0.23 | 0.63 | YES |
| 37 | INS | INS | INS | 2335 | 0.22 | 0.63 | YES |
| 38 | SLC25A4 | SLC25A4 | SLC25A4 | 2472 | 0.21 | 0.63 | YES |
| 39 | ADCY8 | ADCY8 | ADCY8 | 2592 | 0.2 | 0.63 | YES |
| 40 | PRKAR1B | PRKAR1B | PRKAR1B | 2731 | 0.19 | 0.63 | NO |
| 41 | DPP4 | DPP4 | DPP4 | 3762 | 0.12 | 0.58 | NO |
| 42 | ACLY | ACLY | ACLY | 3893 | 0.12 | 0.58 | NO |
| 43 | PRKACA | PRKACA | PRKACA | 4439 | 0.098 | 0.55 | NO |
| 44 | KCNG2 | KCNG2 | KCNG2 | 4536 | 0.095 | 0.55 | NO |
| 45 | GNB5 | GNB5 | GNB5 | 4540 | 0.095 | 0.55 | NO |
| 46 | SLC2A2 | SLC2A2 | SLC2A2 | 4581 | 0.094 | 0.55 | NO |
| 47 | LEP | LEP | LEP | 4751 | 0.088 | 0.55 | NO |
| 48 | PRKAR1A | PRKAR1A | PRKAR1A | 4780 | 0.087 | 0.55 | NO |
| 49 | ADCY4 | ADCY4 | ADCY4 | 5042 | 0.08 | 0.54 | NO |
| 50 | GNG10 | GNG10 | GNG10 | 5122 | 0.078 | 0.54 | NO |
| 51 | PLCB1 | PLCB1 | PLCB1 | 5349 | 0.072 | 0.53 | NO |
| 52 | PRKACB | PRKACB | PRKACB | 5572 | 0.066 | 0.52 | NO |
| 53 | GNG11 | GNG11 | GNG11 | 5673 | 0.064 | 0.51 | NO |
| 54 | STK11 | STK11 | STK11 | 5752 | 0.062 | 0.51 | NO |
| 55 | ACACA | ACACA | ACACA | 5904 | 0.059 | 0.51 | NO |
| 56 | PPP2R1A | PPP2R1A | PPP2R1A | 6624 | 0.044 | 0.47 | NO |
| 57 | PRKAA2 | PRKAA2 | PRKAA2 | 6668 | 0.044 | 0.47 | NO |
| 58 | GRP | GRP | GRP | 6685 | 0.043 | 0.47 | NO |
| 59 | GNA11 | GNA11 | GNA11 | 6709 | 0.043 | 0.47 | NO |
| 60 | GNB2 | GNB2 | GNB2 | 6739 | 0.042 | 0.47 | NO |
| 61 | ADCY6 | ADCY6 | ADCY6 | 6762 | 0.042 | 0.47 | NO |
| 62 | PRKAG2 | PRKAG2 | PRKAG2 | 7011 | 0.037 | 0.46 | NO |
| 63 | AGPAT1 | AGPAT1 | AGPAT1 | 7083 | 0.036 | 0.45 | NO |
| 64 | FASN | FASN | FASN | 7096 | 0.035 | 0.46 | NO |
| 65 | PPP2R1B | PPP2R1B | PPP2R1B | 7342 | 0.031 | 0.44 | NO |
| 66 | SPCS1 | SPCS1 | SPCS1 | 7970 | 0.02 | 0.41 | NO |
| 67 | ADCY3 | ADCY3 | ADCY3 | 8084 | 0.018 | 0.4 | NO |
| 68 | GNAI2 | GNAI2 | GNAI2 | 8375 | 0.014 | 0.39 | NO |
| 69 | MARCKS | MARCKS | MARCKS | 8646 | 0.0096 | 0.37 | NO |
| 70 | SPCS2 | SPCS2 | SPCS2 | 8857 | 0.0065 | 0.36 | NO |
| 71 | PPP2CB | PPP2CB | PPP2CB | 8923 | 0.0056 | 0.36 | NO |
| 72 | SLC25A6 | SLC25A6 | SLC25A6 | 8971 | 0.0047 | 0.36 | NO |
| 73 | LOC653566 | LOC653566 | LOC653566 | 8979 | 0.0046 | 0.36 | NO |
| 74 | ADCY9 | ADCY9 | ADCY9 | 9024 | 0.0039 | 0.36 | NO |
| 75 | GNA14 | GNA14 | GNA14 | 9367 | -0.0011 | 0.34 | NO |
| 76 | PPP2CA | PPP2CA | PPP2CA | 9469 | -0.0026 | 0.33 | NO |
| 77 | GNAQ | GNAQ | GNAQ | 9679 | -0.0058 | 0.32 | NO |
| 78 | GNB1 | GNB1 | GNB1 | 9761 | -0.0071 | 0.32 | NO |
| 79 | PPP2R5D | PPP2R5D | PPP2R5D | 9951 | -0.01 | 0.3 | NO |
| 80 | MLX | MLX | MLX | 10226 | -0.014 | 0.29 | NO |
| 81 | ADCY5 | ADCY5 | ADCY5 | 10580 | -0.02 | 0.27 | NO |
| 82 | SLC25A5 | SLC25A5 | SLC25A5 | 10602 | -0.021 | 0.27 | NO |
| 83 | GNG13 | GNG13 | GNG13 | 10804 | -0.024 | 0.26 | NO |
| 84 | SEC11A | SEC11A | SEC11A | 10936 | -0.026 | 0.26 | NO |
| 85 | GNGT2 | GNGT2 | GNGT2 | 11817 | -0.042 | 0.21 | NO |
| 86 | CACNB3 | CACNB3 | CACNB3 | 11871 | -0.043 | 0.21 | NO |
| 87 | PRKAB2 | PRKAB2 | PRKAB2 | 11955 | -0.044 | 0.2 | NO |
| 88 | SPCS3 | SPCS3 | SPCS3 | 12103 | -0.047 | 0.2 | NO |
| 89 | KCNS3 | KCNS3 | KCNS3 | 12640 | -0.058 | 0.17 | NO |
| 90 | TALDO1 | TALDO1 | TALDO1 | 12752 | -0.06 | 0.17 | NO |
| 91 | RAP1B | RAP1B | RAP1B | 12791 | -0.061 | 0.17 | NO |
| 92 | RAPGEF3 | RAPGEF3 | RAPGEF3 | 13109 | -0.068 | 0.15 | NO |
| 93 | PRKAR2A | PRKAR2A | PRKAR2A | 13258 | -0.072 | 0.15 | NO |
| 94 | GNG8 | GNG8 | GNG8 | 13314 | -0.073 | 0.15 | NO |
| 95 | PRKCA | PRKCA | PRKCA | 13493 | -0.078 | 0.14 | NO |
| 96 | GIP | GIP | GIP | 13529 | -0.079 | 0.14 | NO |
| 97 | CTNNB1 | CTNNB1 | CTNNB1 | 13669 | -0.083 | 0.14 | NO |
| 98 | GNG5 | GNG5 | GNG5 | 13821 | -0.087 | 0.13 | NO |
| 99 | ADCY7 | ADCY7 | ADCY7 | 14137 | -0.097 | 0.12 | NO |
| 100 | RAP1A | RAP1A | RAP1A | 14348 | -0.1 | 0.11 | NO |
| 101 | GNGT1 | GNGT1 | GNGT1 | 14480 | -0.11 | 0.11 | NO |
| 102 | GNB4 | GNB4 | GNB4 | 14597 | -0.11 | 0.11 | NO |
| 103 | GNG12 | GNG12 | GNG12 | 14695 | -0.12 | 0.1 | NO |
| 104 | TKT | TKT | TKT | 14791 | -0.12 | 0.1 | NO |
| 105 | CDX2 | CDX2 | CDX2 | 14837 | -0.12 | 0.11 | NO |
| 106 | ITPR2 | ITPR2 | ITPR2 | 14944 | -0.12 | 0.1 | NO |
| 107 | IQGAP1 | IQGAP1 | IQGAP1 | 15360 | -0.14 | 0.087 | NO |
| 108 | PLCB2 | PLCB2 | PLCB2 | 15634 | -0.15 | 0.078 | NO |
| 109 | ADRA2A | ADRA2A | ADRA2A | 15806 | -0.16 | 0.075 | NO |
| 110 | CHRM3 | CHRM3 | CHRM3 | 15883 | -0.16 | 0.077 | NO |
| 111 | SLC2A1 | SLC2A1 | SLC2A1 | 16445 | -0.2 | 0.053 | NO |
| 112 | PLCB3 | PLCB3 | PLCB3 | 16825 | -0.23 | 0.041 | NO |
| 113 | AKAP5 | AKAP5 | AKAP5 | 16902 | -0.23 | 0.045 | NO |
| 114 | ITPR3 | ITPR3 | ITPR3 | 17475 | -0.28 | 0.024 | NO |
| 115 | GNA15 | GNA15 | GNA15 | 18012 | -0.35 | 0.0079 | NO |
| 116 | GATA4 | GATA4 | GATA4 | 18374 | -0.44 | 0.0045 | NO |
Figure S27. Get High-res Image This plot shows mRNAseq_cNMF expression data heatmap (on the left) a RunningEnrichmentScore(RES) plot (on the top right) and a Signal2Noise(S2N) plot (on the bottom right) of genes in the pathway: BIOCARTA CHREBP2 PATHWAY.
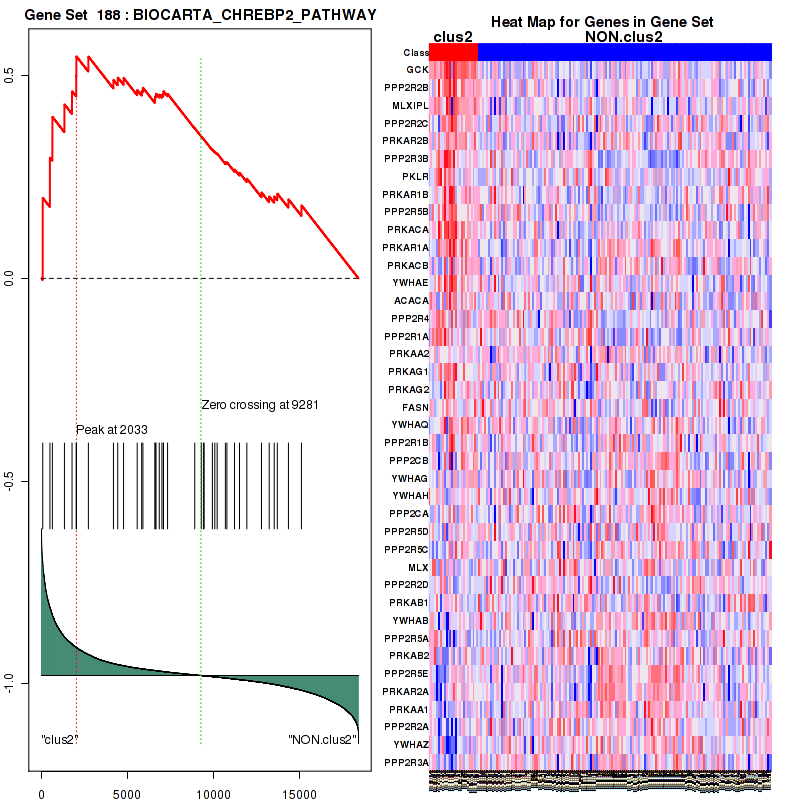
Figure S28. Get High-res Image For the top 5 core enriched genes in the pathway: BIOCARTA CHREBP2 PATHWAY, this volcano plot shows how much they are up/down-regulated and significant. The significance was calculated by empirical bayesian fit

Table S15. Get Full Table This table shows a Running Enrichment Score (RES) of each gene in this pathway, that is, the enrichment score at this point in the ranked list of genes. All genes are ranked by Signal-to-Noise (S2N), a measure of similarity as default and are used to obtain ES matrix of all genes. In this way, GSEA tool uses expression pattern of not only overlapped genes but also not-overlapped genes to produce ES matrix.
| Rank | GENE | SYMBOL | DESC | LIST.LOC | S2N | RES | CORE_ENRICHMENT |
|---|---|---|---|---|---|---|---|
| 1 | CDK5R2 | CDK5R2 | CDK5R2 | 11 | 1.2 | 0.24 | YES |
| 2 | DCX | DCX | DCX | 225 | 0.8 | 0.38 | YES |
| 3 | CDK5R1 | CDK5R1 | CDK5R1 | 870 | 0.46 | 0.44 | YES |
| 4 | RELN | RELN | RELN | 1336 | 0.35 | 0.48 | YES |
| 5 | MAP1B | MAP1B | MAP1B | 1707 | 0.29 | 0.52 | YES |
| 6 | DAB1 | DAB1 | DAB1 | 1780 | 0.28 | 0.57 | YES |
| 7 | VLDLR | VLDLR | VLDLR | 1986 | 0.26 | 0.61 | YES |
| 8 | LRPAP1 | LRPAP1 | LRPAP1 | 3336 | 0.14 | 0.57 | NO |
| 9 | CDK5 | CDK5 | CDK5 | 4604 | 0.093 | 0.52 | NO |
| 10 | PAFAH1B1 | PAFAH1B1 | PAFAH1B1 | 4871 | 0.085 | 0.52 | NO |
| 11 | YWHAE | YWHAE | YWHAE | 5835 | 0.06 | 0.48 | NO |
| 12 | PAFAH1B3 | PAFAH1B3 | PAFAH1B3 | 6079 | 0.055 | 0.48 | NO |
| 13 | NDEL1 | NDEL1 | NDEL1 | 7916 | 0.021 | 0.38 | NO |
| 14 | NUDC | NUDC | NUDC | 9001 | 0.0042 | 0.32 | NO |
| 15 | DYNC1H1 | DYNC1H1 | DYNC1H1 | 9142 | 0.002 | 0.32 | NO |
| 16 | DYNLT1 | DYNLT1 | DYNLT1 | 9299 | -0.00021 | 0.31 | NO |
| 17 | ABL1 | ABL1 | ABL1 | 9316 | -0.00051 | 0.31 | NO |
| 18 | PPP2R5D | PPP2R5D | PPP2R5D | 9951 | -0.01 | 0.28 | NO |
| 19 | CLIP1 | CLIP1 | CLIP1 | 10749 | -0.023 | 0.24 | NO |
| 20 | KATNA1 | KATNA1 | KATNA1 | 11331 | -0.033 | 0.21 | NO |
| 21 | RAC1 | RAC1 | RAC1 | 11759 | -0.041 | 0.2 | NO |
| 22 | CDC42 | CDC42 | CDC42 | 11766 | -0.041 | 0.21 | NO |
| 23 | CSNK2A1 | CSNK2A1 | CSNK2A1 | 12131 | -0.048 | 0.2 | NO |
| 24 | RHOA | RHOA | RHOA | 12312 | -0.052 | 0.2 | NO |
| 25 | PAFAH1B2 | PAFAH1B2 | PAFAH1B2 | 14561 | -0.11 | 0.096 | NO |
| 26 | IQGAP1 | IQGAP1 | IQGAP1 | 15360 | -0.14 | 0.081 | NO |
| 27 | LRP8 | LRP8 | LRP8 | 16439 | -0.2 | 0.062 | NO |
| 28 | PLA2G7 | PLA2G7 | PLA2G7 | 17046 | -0.24 | 0.077 | NO |
Figure S29. Get High-res Image This plot shows mRNAseq_cNMF expression data heatmap (on the left) a RunningEnrichmentScore(RES) plot (on the top right) and a Signal2Noise(S2N) plot (on the bottom right) of genes in the pathway: SIG CD40PATHWAYMAP.
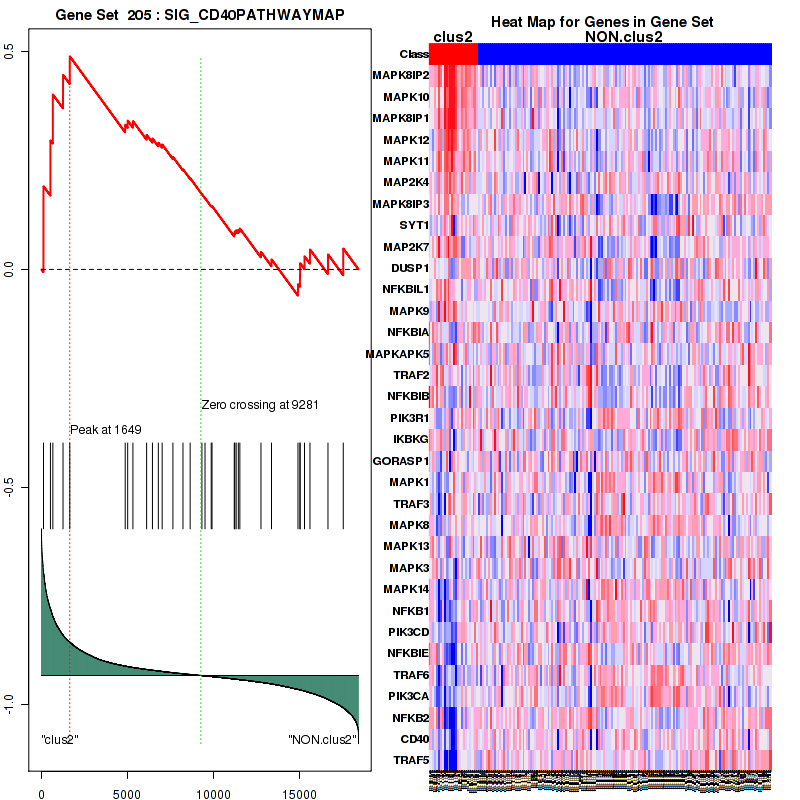
Figure S30. Get High-res Image For the top 5 core enriched genes in the pathway: SIG CD40PATHWAYMAP, this volcano plot shows how much they are up/down-regulated and significant. The significance was calculated by empirical bayesian fit

Table S16. Get Full Table This table shows a Running Enrichment Score (RES) of each gene in this pathway, that is, the enrichment score at this point in the ranked list of genes. All genes are ranked by Signal-to-Noise (S2N), a measure of similarity as default and are used to obtain ES matrix of all genes. In this way, GSEA tool uses expression pattern of not only overlapped genes but also not-overlapped genes to produce ES matrix.
| Rank | GENE | SYMBOL | DESC | LIST.LOC | S2N | RES | CORE_ENRICHMENT |
|---|---|---|---|---|---|---|---|
| 1 | SH3GL2 | SH3GL2 | SH3GL2 | 45 | 1.1 | 0.21 | YES |
| 2 | DNAJC6 | DNAJC6 | DNAJC6 | 245 | 0.77 | 0.36 | YES |
| 3 | VAMP2 | VAMP2 | VAMP2 | 1921 | 0.26 | 0.32 | NO |
| 4 | OCRL | OCRL | OCRL | 2734 | 0.19 | 0.31 | NO |
| 5 | NECAP1 | NECAP1 | NECAP1 | 3536 | 0.14 | 0.3 | NO |
| 6 | TPD52 | TPD52 | TPD52 | 3826 | 0.12 | 0.31 | NO |
| 7 | AP1S2 | AP1S2 | AP1S2 | 4012 | 0.11 | 0.32 | NO |
| 8 | NAPA | NAPA | NAPA | 4328 | 0.1 | 0.32 | NO |
| 9 | BLOC1S1 | BLOC1S1 | BLOC1S1 | 4367 | 0.1 | 0.34 | NO |
| 10 | HIP1R | HIP1R | HIP1R | 4734 | 0.089 | 0.34 | NO |
| 11 | DTNBP1 | DTNBP1 | DTNBP1 | 5208 | 0.075 | 0.33 | NO |
| 12 | AP1S1 | AP1S1 | AP1S1 | 6094 | 0.055 | 0.29 | NO |
| 13 | AP1M1 | AP1M1 | AP1M1 | 6321 | 0.05 | 0.29 | NO |
| 14 | PLDN | PLDN | PLDN | 6695 | 0.043 | 0.28 | NO |
| 15 | SORT1 | SORT1 | SORT1 | 6748 | 0.042 | 0.28 | NO |
| 16 | AP3B1 | AP3B1 | AP3B1 | 7123 | 0.035 | 0.27 | NO |
| 17 | AP1B1 | AP1B1 | AP1B1 | 7374 | 0.03 | 0.26 | NO |
| 18 | CLTA | CLTA | CLTA | 7460 | 0.029 | 0.26 | NO |
| 19 | HSPA8 | HSPA8 | HSPA8 | 8218 | 0.016 | 0.23 | NO |
| 20 | AP1M2 | AP1M2 | AP1M2 | 8438 | 0.013 | 0.22 | NO |
| 21 | CLTC | CLTC | CLTC | 8662 | 0.0093 | 0.21 | NO |
| 22 | SNX2 | SNX2 | SNX2 | 8766 | 0.008 | 0.2 | NO |
| 23 | TGOLN2 | TGOLN2 | TGOLN2 | 9572 | -0.0042 | 0.16 | NO |
| 24 | ARF1 | ARF1 | ARF1 | 9741 | -0.0068 | 0.15 | NO |
| 25 | BLOC1S3 | BLOC1S3 | BLOC1S3 | 9955 | -0.01 | 0.14 | NO |
| 26 | RAB5C | RAB5C | RAB5C | 10012 | -0.011 | 0.14 | NO |
| 27 | CPD | CPD | CPD | 10053 | -0.012 | 0.14 | NO |
| 28 | GAK | GAK | GAK | 10366 | -0.017 | 0.13 | NO |
| 29 | AP1G1 | AP1G1 | AP1G1 | 10631 | -0.021 | 0.12 | NO |
| 30 | VAMP7 | VAMP7 | VAMP7 | 10665 | -0.022 | 0.12 | NO |
| 31 | IGF2R | IGF2R | IGF2R | 10679 | -0.022 | 0.12 | NO |
| 32 | SNAPIN | SNAPIN | SNAPIN | 10957 | -0.027 | 0.12 | NO |
| 33 | FTL | FTL | FTL | 11227 | -0.031 | 0.11 | NO |
| 34 | PUM1 | PUM1 | PUM1 | 11344 | -0.033 | 0.11 | NO |
| 35 | YIPF6 | YIPF6 | YIPF6 | 11735 | -0.04 | 0.094 | NO |
| 36 | FTH1 | FTH1 | FTH1 | 11754 | -0.041 | 0.1 | NO |
| 37 | ARRB1 | ARRB1 | ARRB1 | 11866 | -0.043 | 0.1 | NO |
| 38 | AP4E1 | AP4E1 | AP4E1 | 12087 | -0.047 | 0.1 | NO |
| 39 | TPD52L1 | TPD52L1 | TPD52L1 | 12403 | -0.053 | 0.094 | NO |
| 40 | TXNDC5 | TXNDC5 | TXNDC5 | 12793 | -0.061 | 0.086 | NO |
| 41 | PICALM | PICALM | PICALM | 12920 | -0.064 | 0.092 | NO |
| 42 | SNX5 | SNX5 | SNX5 | 13032 | -0.066 | 0.099 | NO |
| 43 | TBC1D8B | TBC1D8B | TBC1D8B | 13111 | -0.068 | 0.11 | NO |
| 44 | SNX9 | SNX9 | SNX9 | 13112 | -0.068 | 0.12 | NO |
| 45 | DNM2 | DNM2 | DNM2 | 13160 | -0.07 | 0.13 | NO |
| 46 | PIK3C2A | PIK3C2A | PIK3C2A | 13202 | -0.071 | 0.15 | NO |
| 47 | AP4B1 | AP4B1 | AP4B1 | 13471 | -0.078 | 0.15 | NO |
| 48 | CNO | CNO | CNO | 13658 | -0.083 | 0.15 | NO |
| 49 | AP3S1 | AP3S1 | AP3S1 | 14002 | -0.093 | 0.15 | NO |
| 50 | SH3D19 | SH3D19 | SH3D19 | 15350 | -0.14 | 0.11 | NO |
| 51 | TFRC | TFRC | TFRC | 15466 | -0.15 | 0.13 | NO |
| 52 | VAMP8 | VAMP8 | VAMP8 | 15544 | -0.15 | 0.16 | NO |
Figure S31. Get High-res Image This plot shows mRNAseq_cNMF expression data heatmap (on the left) a RunningEnrichmentScore(RES) plot (on the top right) and a Signal2Noise(S2N) plot (on the bottom right) of genes in the pathway: PID P38 MKK3 6PATHWAY.
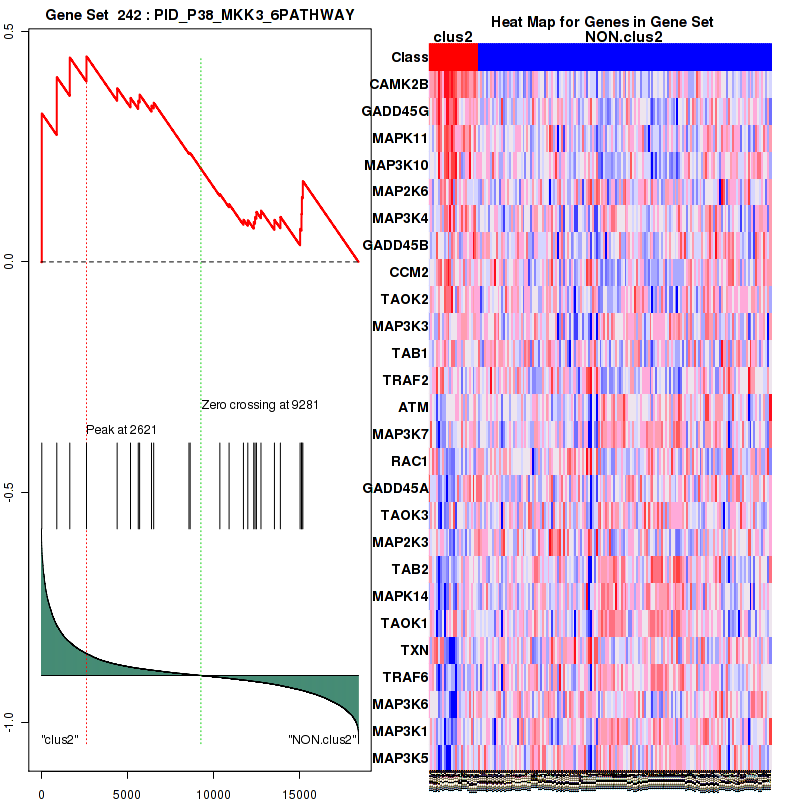
Figure S32. Get High-res Image For the top 5 core enriched genes in the pathway: PID P38 MKK3 6PATHWAY, this volcano plot shows how much they are up/down-regulated and significant. The significance was calculated by empirical bayesian fit
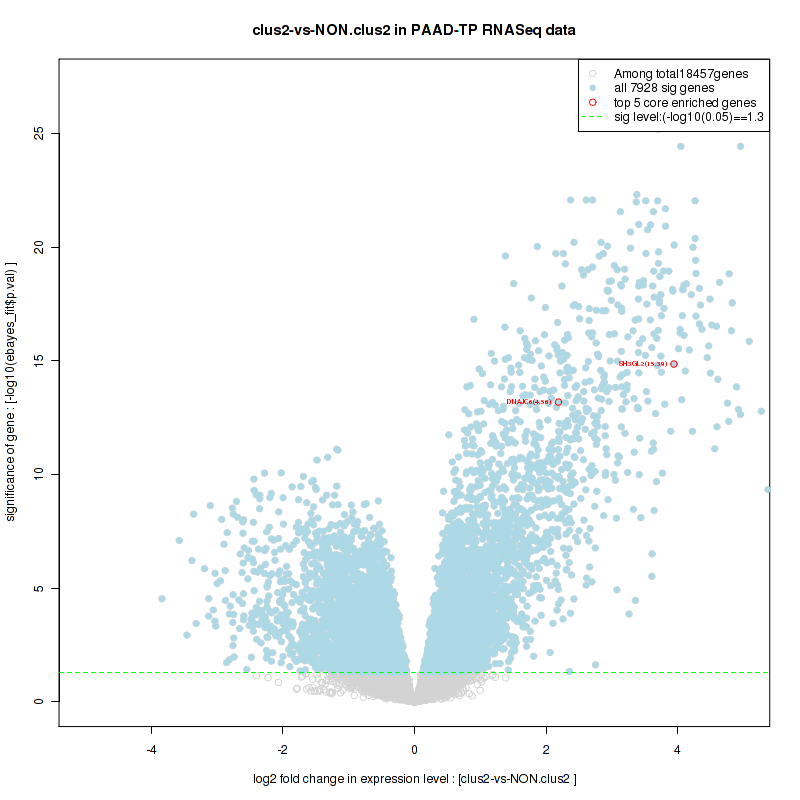
Table S17. Get Full Table This table shows a Running Enrichment Score (RES) of each gene in this pathway, that is, the enrichment score at this point in the ranked list of genes. All genes are ranked by Signal-to-Noise (S2N), a measure of similarity as default and are used to obtain ES matrix of all genes. In this way, GSEA tool uses expression pattern of not only overlapped genes but also not-overlapped genes to produce ES matrix.
| Rank | GENE | SYMBOL | DESC | LIST.LOC | S2N | RES | CORE_ENRICHMENT |
|---|---|---|---|---|---|---|---|
| 1 | CACNA1A | CACNA1A | CACNA1A | 27 | 1.1 | 0.046 | YES |
| 2 | SYT5 | SYT5 | SYT5 | 52 | 1.1 | 0.09 | YES |
| 3 | SNAP25 | SNAP25 | SNAP25 | 97 | 0.97 | 0.13 | YES |
| 4 | ABCC8 | ABCC8 | ABCC8 | 122 | 0.92 | 0.17 | YES |
| 5 | KCNJ11 | KCNJ11 | KCNJ11 | 136 | 0.91 | 0.21 | YES |
| 6 | PAX6 | PAX6 | PAX6 | 157 | 0.88 | 0.24 | YES |
| 7 | ISL1 | ISL1 | ISL1 | 180 | 0.85 | 0.28 | YES |
| 8 | GNG4 | GNG4 | GNG4 | 188 | 0.84 | 0.31 | YES |
| 9 | PCSK1 | PCSK1 | PCSK1 | 189 | 0.84 | 0.35 | YES |
| 10 | GPR119 | GPR119 | GPR119 | 191 | 0.83 | 0.39 | YES |
| 11 | FFAR1 | FFAR1 | FFAR1 | 306 | 0.73 | 0.41 | YES |
| 12 | CACNB2 | CACNB2 | CACNB2 | 321 | 0.71 | 0.44 | YES |
| 13 | GNAO1 | GNAO1 | GNAO1 | 352 | 0.69 | 0.47 | YES |
| 14 | KCNC2 | KCNC2 | KCNC2 | 368 | 0.68 | 0.5 | YES |
| 15 | KCNB1 | KCNB1 | KCNB1 | 451 | 0.63 | 0.52 | YES |
| 16 | GNB3 | GNB3 | GNB3 | 654 | 0.53 | 0.53 | YES |
| 17 | RAPGEF4 | RAPGEF4 | RAPGEF4 | 801 | 0.48 | 0.55 | YES |
| 18 | GNG2 | GNG2 | GNG2 | 986 | 0.43 | 0.55 | YES |
| 19 | GNG7 | GNG7 | GNG7 | 1124 | 0.39 | 0.56 | YES |
| 20 | GLP1R | GLP1R | GLP1R | 1265 | 0.36 | 0.57 | YES |
| 21 | STXBP1 | STXBP1 | STXBP1 | 1400 | 0.34 | 0.58 | YES |
| 22 | SEC11C | SEC11C | SEC11C | 1464 | 0.32 | 0.59 | YES |
| 23 | STX1A | STX1A | STX1A | 1666 | 0.3 | 0.59 | YES |
| 24 | PRKAR2B | PRKAR2B | PRKAR2B | 1779 | 0.28 | 0.6 | YES |
| 25 | VAMP2 | VAMP2 | VAMP2 | 1921 | 0.26 | 0.6 | YES |
| 26 | GNAI1 | GNAI1 | GNAI1 | 1995 | 0.26 | 0.61 | YES |
| 27 | GCG | GCG | GCG | 2049 | 0.25 | 0.62 | YES |
| 28 | GNAS | GNAS | GNAS | 2253 | 0.23 | 0.61 | YES |
| 29 | GNG3 | GNG3 | GNG3 | 2256 | 0.23 | 0.62 | YES |
| 30 | INS | INS | INS | 2335 | 0.22 | 0.63 | YES |
| 31 | SLC25A4 | SLC25A4 | SLC25A4 | 2472 | 0.21 | 0.63 | YES |
| 32 | ADCY8 | ADCY8 | ADCY8 | 2592 | 0.2 | 0.63 | YES |
| 33 | PRKAR1B | PRKAR1B | PRKAR1B | 2731 | 0.19 | 0.63 | YES |
| 34 | DPP4 | DPP4 | DPP4 | 3762 | 0.12 | 0.58 | NO |
| 35 | PRKACA | PRKACA | PRKACA | 4439 | 0.098 | 0.55 | NO |
| 36 | KCNG2 | KCNG2 | KCNG2 | 4536 | 0.095 | 0.55 | NO |
| 37 | GNB5 | GNB5 | GNB5 | 4540 | 0.095 | 0.55 | NO |
| 38 | SLC2A2 | SLC2A2 | SLC2A2 | 4581 | 0.094 | 0.55 | NO |
| 39 | LEP | LEP | LEP | 4751 | 0.088 | 0.55 | NO |
| 40 | PRKAR1A | PRKAR1A | PRKAR1A | 4780 | 0.087 | 0.55 | NO |
| 41 | GNG10 | GNG10 | GNG10 | 5122 | 0.078 | 0.54 | NO |
| 42 | PLCB1 | PLCB1 | PLCB1 | 5349 | 0.072 | 0.53 | NO |
| 43 | PRKACB | PRKACB | PRKACB | 5572 | 0.066 | 0.52 | NO |
| 44 | GNG11 | GNG11 | GNG11 | 5673 | 0.064 | 0.51 | NO |
| 45 | GRP | GRP | GRP | 6685 | 0.043 | 0.46 | NO |
| 46 | GNA11 | GNA11 | GNA11 | 6709 | 0.043 | 0.46 | NO |
| 47 | GNB2 | GNB2 | GNB2 | 6739 | 0.042 | 0.46 | NO |
| 48 | ADCY6 | ADCY6 | ADCY6 | 6762 | 0.042 | 0.46 | NO |
| 49 | SPCS1 | SPCS1 | SPCS1 | 7970 | 0.02 | 0.4 | NO |
| 50 | GNAI2 | GNAI2 | GNAI2 | 8375 | 0.014 | 0.38 | NO |
| 51 | MARCKS | MARCKS | MARCKS | 8646 | 0.0096 | 0.36 | NO |
| 52 | SPCS2 | SPCS2 | SPCS2 | 8857 | 0.0065 | 0.35 | NO |
| 53 | SLC25A6 | SLC25A6 | SLC25A6 | 8971 | 0.0047 | 0.34 | NO |
| 54 | LOC653566 | LOC653566 | LOC653566 | 8979 | 0.0046 | 0.34 | NO |
| 55 | GNA14 | GNA14 | GNA14 | 9367 | -0.0011 | 0.32 | NO |
| 56 | GNAQ | GNAQ | GNAQ | 9679 | -0.0058 | 0.31 | NO |
| 57 | GNB1 | GNB1 | GNB1 | 9761 | -0.0071 | 0.3 | NO |
| 58 | ADCY5 | ADCY5 | ADCY5 | 10580 | -0.02 | 0.26 | NO |
| 59 | SLC25A5 | SLC25A5 | SLC25A5 | 10602 | -0.021 | 0.26 | NO |
| 60 | GNG13 | GNG13 | GNG13 | 10804 | -0.024 | 0.25 | NO |
| 61 | SEC11A | SEC11A | SEC11A | 10936 | -0.026 | 0.24 | NO |
| 62 | GNGT2 | GNGT2 | GNGT2 | 11817 | -0.042 | 0.2 | NO |
| 63 | CACNB3 | CACNB3 | CACNB3 | 11871 | -0.043 | 0.2 | NO |
| 64 | SPCS3 | SPCS3 | SPCS3 | 12103 | -0.047 | 0.18 | NO |
| 65 | KCNS3 | KCNS3 | KCNS3 | 12640 | -0.058 | 0.16 | NO |
| 66 | RAP1B | RAP1B | RAP1B | 12791 | -0.061 | 0.15 | NO |
| 67 | RAPGEF3 | RAPGEF3 | RAPGEF3 | 13109 | -0.068 | 0.14 | NO |
| 68 | PRKAR2A | PRKAR2A | PRKAR2A | 13258 | -0.072 | 0.13 | NO |
| 69 | GNG8 | GNG8 | GNG8 | 13314 | -0.073 | 0.13 | NO |
| 70 | PRKCA | PRKCA | PRKCA | 13493 | -0.078 | 0.13 | NO |
| 71 | GIP | GIP | GIP | 13529 | -0.079 | 0.13 | NO |
| 72 | CTNNB1 | CTNNB1 | CTNNB1 | 13669 | -0.083 | 0.12 | NO |
| 73 | GNG5 | GNG5 | GNG5 | 13821 | -0.087 | 0.12 | NO |
| 74 | RAP1A | RAP1A | RAP1A | 14348 | -0.1 | 0.097 | NO |
| 75 | GNGT1 | GNGT1 | GNGT1 | 14480 | -0.11 | 0.094 | NO |
| 76 | GNB4 | GNB4 | GNB4 | 14597 | -0.11 | 0.093 | NO |
| 77 | GNG12 | GNG12 | GNG12 | 14695 | -0.12 | 0.092 | NO |
| 78 | CDX2 | CDX2 | CDX2 | 14837 | -0.12 | 0.09 | NO |
| 79 | ITPR2 | ITPR2 | ITPR2 | 14944 | -0.12 | 0.09 | NO |
| 80 | IQGAP1 | IQGAP1 | IQGAP1 | 15360 | -0.14 | 0.073 | NO |
| 81 | PLCB2 | PLCB2 | PLCB2 | 15634 | -0.15 | 0.065 | NO |
| 82 | ADRA2A | ADRA2A | ADRA2A | 15806 | -0.16 | 0.063 | NO |
| 83 | CHRM3 | CHRM3 | CHRM3 | 15883 | -0.16 | 0.066 | NO |
| 84 | SLC2A1 | SLC2A1 | SLC2A1 | 16445 | -0.2 | 0.044 | NO |
| 85 | PLCB3 | PLCB3 | PLCB3 | 16825 | -0.23 | 0.033 | NO |
| 86 | AKAP5 | AKAP5 | AKAP5 | 16902 | -0.23 | 0.038 | NO |
| 87 | ITPR3 | ITPR3 | ITPR3 | 17475 | -0.28 | 0.019 | NO |
| 88 | GNA15 | GNA15 | GNA15 | 18012 | -0.35 | 0.0051 | NO |
| 89 | GATA4 | GATA4 | GATA4 | 18374 | -0.44 | 0.0045 | NO |
Figure S33. Get High-res Image This plot shows mRNAseq_cNMF expression data heatmap (on the left) a RunningEnrichmentScore(RES) plot (on the top right) and a Signal2Noise(S2N) plot (on the bottom right) of genes in the pathway: PID LKB1 PATHWAY.
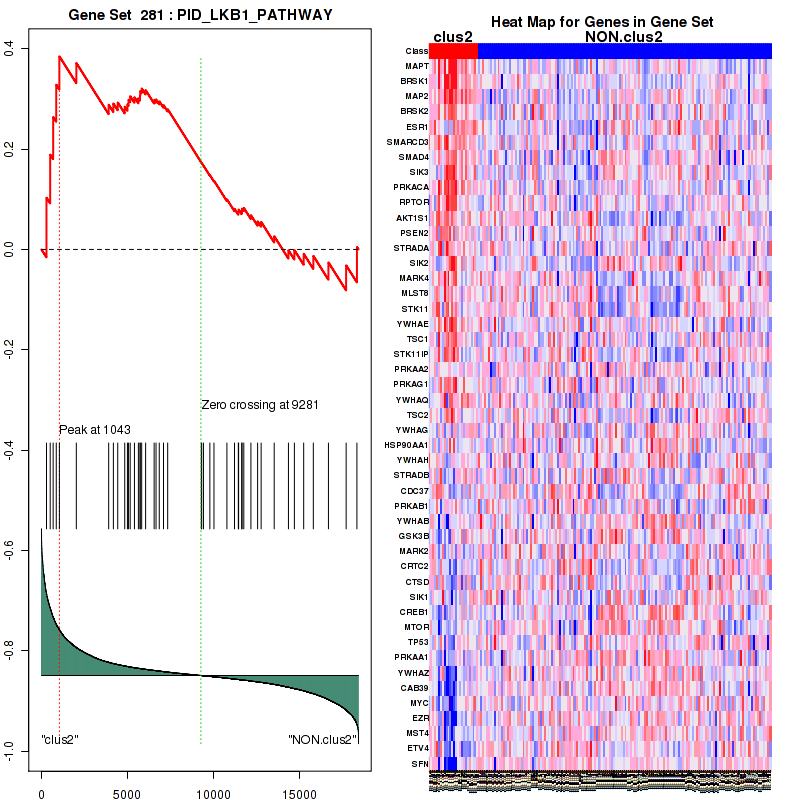
Figure S34. Get High-res Image For the top 5 core enriched genes in the pathway: PID LKB1 PATHWAY, this volcano plot shows how much they are up/down-regulated and significant. The significance was calculated by empirical bayesian fit
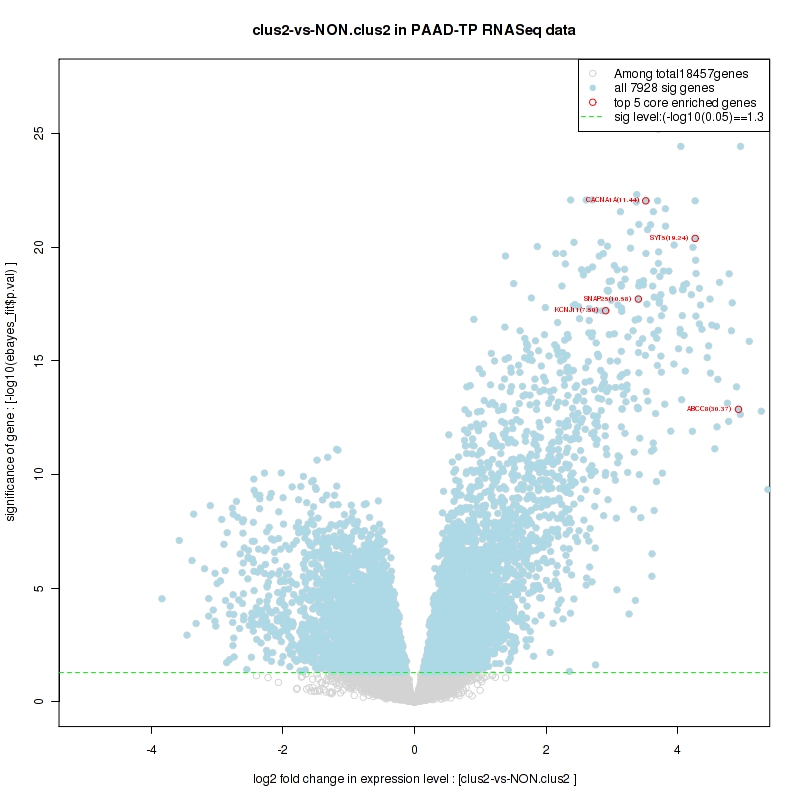
Table S18. Get Full Table This table shows a Running Enrichment Score (RES) of each gene in this pathway, that is, the enrichment score at this point in the ranked list of genes. All genes are ranked by Signal-to-Noise (S2N), a measure of similarity as default and are used to obtain ES matrix of all genes. In this way, GSEA tool uses expression pattern of not only overlapped genes but also not-overlapped genes to produce ES matrix.
| Rank | GENE | SYMBOL | DESC | LIST.LOC | S2N | RES | CORE_ENRICHMENT |
|---|---|---|---|---|---|---|---|
| 1 | CAMK2B | CAMK2B | CAMK2B | 19 | 1.2 | 0.22 | YES |
| 2 | MAPT | MAPT | MAPT | 293 | 0.74 | 0.35 | YES |
| 3 | F2 | F2 | F2 | 1125 | 0.39 | 0.38 | YES |
| 4 | STAT4 | STAT4 | STAT4 | 1222 | 0.37 | 0.44 | YES |
| 5 | AGT | AGT | AGT | 1465 | 0.32 | 0.49 | YES |
| 6 | GNAI1 | GNAI1 | GNAI1 | 1995 | 0.26 | 0.52 | YES |
| 7 | HRAS | HRAS | HRAS | 3964 | 0.12 | 0.43 | NO |
| 8 | CALM1 | CALM1 | CALM1 | 4065 | 0.11 | 0.45 | NO |
| 9 | STAT5B | STAT5B | STAT5B | 4469 | 0.097 | 0.44 | NO |
| 10 | CDK5 | CDK5 | CDK5 | 4604 | 0.093 | 0.45 | NO |
| 11 | AGTR2 | AGTR2 | AGTR2 | 5064 | 0.079 | 0.44 | NO |
| 12 | MAP2K2 | MAP2K2 | MAP2K2 | 5877 | 0.06 | 0.41 | NO |
| 13 | GNA11 | GNA11 | GNA11 | 6709 | 0.043 | 0.38 | NO |
| 14 | CAMK2G | CAMK2G | CAMK2G | 6825 | 0.041 | 0.38 | NO |
| 15 | FYN | FYN | FYN | 7710 | 0.024 | 0.33 | NO |
| 16 | PLCG1 | PLCG1 | PLCG1 | 7924 | 0.021 | 0.33 | NO |
| 17 | KNG1 | KNG1 | KNG1 | 8538 | 0.011 | 0.29 | NO |
| 18 | STAT3 | STAT3 | STAT3 | 9147 | 0.002 | 0.26 | NO |
| 19 | GRB2 | GRB2 | GRB2 | 9153 | 0.0018 | 0.26 | NO |
| 20 | CALM3 | CALM3 | CALM3 | 9256 | 0.00036 | 0.26 | NO |
| 21 | CAMK2D | CAMK2D | CAMK2D | 9257 | 0.00034 | 0.26 | NO |
| 22 | PTK2B | PTK2B | PTK2B | 9410 | -0.0016 | 0.25 | NO |
| 23 | GNB1 | GNB1 | GNB1 | 9761 | -0.0071 | 0.23 | NO |
| 24 | JAK2 | JAK2 | JAK2 | 9781 | -0.0076 | 0.23 | NO |
| 25 | CALM2 | CALM2 | CALM2 | 10029 | -0.011 | 0.22 | NO |
| 26 | MAP2K1 | MAP2K1 | MAP2K1 | 10405 | -0.017 | 0.2 | NO |
| 27 | MAPK1 | MAPK1 | MAPK1 | 11224 | -0.031 | 0.16 | NO |
| 28 | MAPK8 | MAPK8 | MAPK8 | 11334 | -0.033 | 0.16 | NO |
| 29 | STAT2 | STAT2 | STAT2 | 11477 | -0.036 | 0.16 | NO |
| 30 | MAPK3 | MAPK3 | MAPK3 | 11548 | -0.037 | 0.17 | NO |
| 31 | STAT5A | STAT5A | STAT5A | 11584 | -0.038 | 0.17 | NO |
| 32 | SOS1 | SOS1 | SOS1 | 11656 | -0.039 | 0.18 | NO |
| 33 | MAPK14 | MAPK14 | MAPK14 | 12779 | -0.061 | 0.13 | NO |
| 34 | RAF1 | RAF1 | RAF1 | 13211 | -0.071 | 0.12 | NO |
| 35 | PRKCA | PRKCA | PRKCA | 13493 | -0.078 | 0.12 | NO |
| 36 | CAMK2A | CAMK2A | CAMK2A | 13497 | -0.078 | 0.13 | NO |
| 37 | PRKCB | PRKCB | PRKCB | 13923 | -0.091 | 0.13 | NO |
| 38 | SHC1 | SHC1 | SHC1 | 14292 | -0.1 | 0.13 | NO |
| 39 | GNGT1 | GNGT1 | GNGT1 | 14480 | -0.11 | 0.14 | NO |
| 40 | STAT1 | STAT1 | STAT1 | 14843 | -0.12 | 0.14 | NO |
| 41 | MYLK | MYLK | MYLK | 15090 | -0.13 | 0.15 | NO |
| 42 | STAT6 | STAT6 | STAT6 | 15688 | -0.16 | 0.15 | NO |
Figure S35. Get High-res Image This plot shows mRNAseq_cNMF expression data heatmap (on the left) a RunningEnrichmentScore(RES) plot (on the top right) and a Signal2Noise(S2N) plot (on the bottom right) of genes in the pathway: PID LIS1PATHWAY.
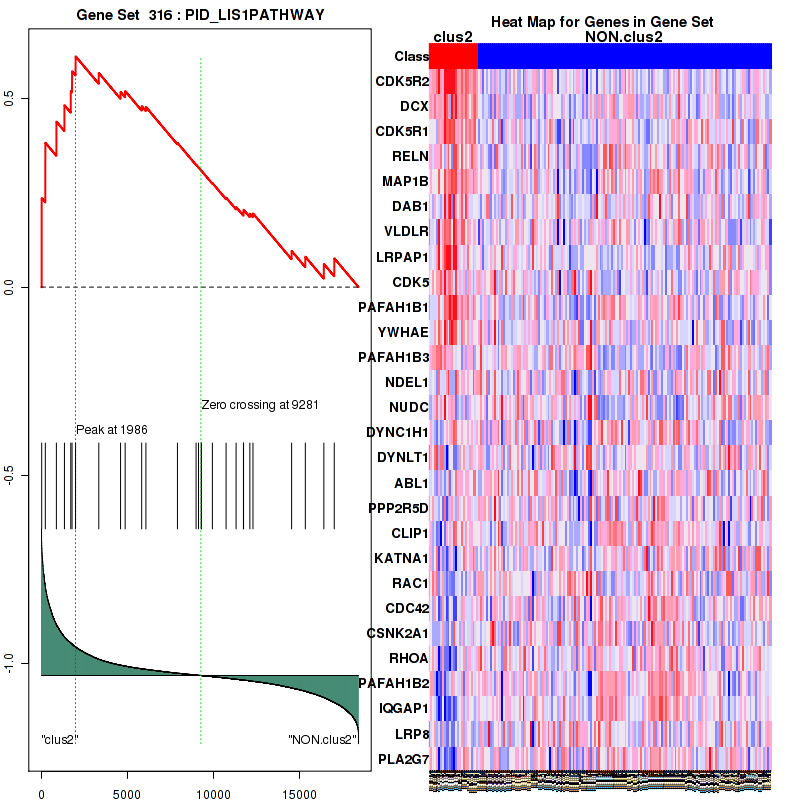
Figure S36. Get High-res Image For the top 5 core enriched genes in the pathway: PID LIS1PATHWAY, this volcano plot shows how much they are up/down-regulated and significant. The significance was calculated by empirical bayesian fit

Table S19. Get Full Table This table shows a Running Enrichment Score (RES) of each gene in this pathway, that is, the enrichment score at this point in the ranked list of genes. All genes are ranked by Signal-to-Noise (S2N), a measure of similarity as default and are used to obtain ES matrix of all genes. In this way, GSEA tool uses expression pattern of not only overlapped genes but also not-overlapped genes to produce ES matrix.
| Rank | GENE | SYMBOL | DESC | LIST.LOC | S2N | RES | CORE_ENRICHMENT |
|---|---|---|---|---|---|---|---|
| 1 | MAPT | MAPT | MAPT | 293 | 0.74 | 0.1 | YES |
| 2 | BRSK1 | BRSK1 | BRSK1 | 509 | 0.6 | 0.19 | YES |
| 3 | MAP2 | MAP2 | MAP2 | 681 | 0.52 | 0.26 | YES |
| 4 | BRSK2 | BRSK2 | BRSK2 | 861 | 0.46 | 0.33 | YES |
| 5 | ESR1 | ESR1 | ESR1 | 1043 | 0.41 | 0.38 | YES |
| 6 | SMARCD3 | SMARCD3 | SMARCD3 | 2031 | 0.25 | 0.37 | NO |
| 7 | SMAD4 | SMAD4 | SMAD4 | 3911 | 0.12 | 0.29 | NO |
| 8 | SIK3 | SIK3 | SIK3 | 4185 | 0.11 | 0.29 | NO |
| 9 | PRKACA | PRKACA | PRKACA | 4439 | 0.098 | 0.29 | NO |
| 10 | RPTOR | RPTOR | RPTOR | 4847 | 0.085 | 0.28 | NO |
| 11 | AKT1S1 | AKT1S1 | AKT1S1 | 5005 | 0.081 | 0.29 | NO |
| 12 | PSEN2 | PSEN2 | PSEN2 | 5069 | 0.079 | 0.3 | NO |
| 13 | STRADA | STRADA | STRADA | 5167 | 0.076 | 0.3 | NO |
| 14 | SIK2 | SIK2 | SIK2 | 5412 | 0.07 | 0.3 | NO |
| 15 | MARK4 | MARK4 | MARK4 | 5642 | 0.065 | 0.3 | NO |
| 16 | MLST8 | MLST8 | MLST8 | 5736 | 0.062 | 0.31 | NO |
| 17 | STK11 | STK11 | STK11 | 5752 | 0.062 | 0.32 | NO |
| 18 | YWHAE | YWHAE | YWHAE | 5835 | 0.06 | 0.32 | NO |
| 19 | TSC1 | TSC1 | TSC1 | 6062 | 0.056 | 0.32 | NO |
| 20 | STK11IP | STK11IP | STK11IP | 6560 | 0.046 | 0.3 | NO |
| 21 | PRKAA2 | PRKAA2 | PRKAA2 | 6668 | 0.044 | 0.3 | NO |
| 22 | PRKAG1 | PRKAG1 | PRKAG1 | 6859 | 0.04 | 0.3 | NO |
| 23 | YWHAQ | YWHAQ | YWHAQ | 7103 | 0.035 | 0.29 | NO |
| 24 | TSC2 | TSC2 | TSC2 | 7346 | 0.031 | 0.28 | NO |
| 25 | YWHAG | YWHAG | YWHAG | 9307 | -0.0004 | 0.17 | NO |
| 26 | HSP90AA1 | HSP90AA1 | HSP90AA1 | 9328 | -0.00067 | 0.17 | NO |
| 27 | YWHAH | YWHAH | YWHAH | 9428 | -0.0018 | 0.17 | NO |
| 28 | STRADB | STRADB | STRADB | 9803 | -0.0079 | 0.15 | NO |
| 29 | CDC37 | CDC37 | CDC37 | 10041 | -0.011 | 0.14 | NO |
| 30 | PRKAB1 | PRKAB1 | PRKAB1 | 10795 | -0.024 | 0.1 | NO |
| 31 | YWHAB | YWHAB | YWHAB | 11239 | -0.032 | 0.081 | NO |
| 32 | GSK3B | GSK3B | GSK3B | 11461 | -0.035 | 0.075 | NO |
| 33 | MARK2 | MARK2 | MARK2 | 11476 | -0.036 | 0.08 | NO |
| 34 | CRTC2 | CRTC2 | CRTC2 | 11654 | -0.039 | 0.076 | NO |
| 35 | CTSD | CTSD | CTSD | 11680 | -0.04 | 0.082 | NO |
| 36 | SIK1 | SIK1 | SIK1 | 11777 | -0.041 | 0.083 | NO |
| 37 | CREB1 | CREB1 | CREB1 | 12191 | -0.049 | 0.068 | NO |
| 38 | MTOR | MTOR | MTOR | 12583 | -0.057 | 0.056 | NO |
| 39 | TP53 | TP53 | TP53 | 12788 | -0.061 | 0.055 | NO |
| 40 | PRKAA1 | PRKAA1 | PRKAA1 | 13550 | -0.08 | 0.026 | NO |
| 41 | YWHAZ | YWHAZ | YWHAZ | 14377 | -0.1 | -0.0014 | NO |
| 42 | CAB39 | CAB39 | CAB39 | 14723 | -0.12 | -0.0013 | NO |
| 43 | MYC | MYC | MYC | 15265 | -0.14 | -0.0085 | NO |
| 44 | EZR | EZR | EZR | 15827 | -0.16 | -0.013 | NO |
| 45 | MST4 | MST4 | MST4 | 16706 | -0.22 | -0.026 | NO |
| 46 | ETV4 | ETV4 | ETV4 | 17737 | -0.31 | -0.032 | NO |
| 47 | SFN | SFN | SFN | 18365 | -0.44 | 0.005 | NO |
Figure S37. Get High-res Image This plot shows mRNAseq_cNMF expression data heatmap (on the left) a RunningEnrichmentScore(RES) plot (on the top right) and a Signal2Noise(S2N) plot (on the bottom right) of genes in the pathway: PID HEDGEHOG GLIPATHWAY.
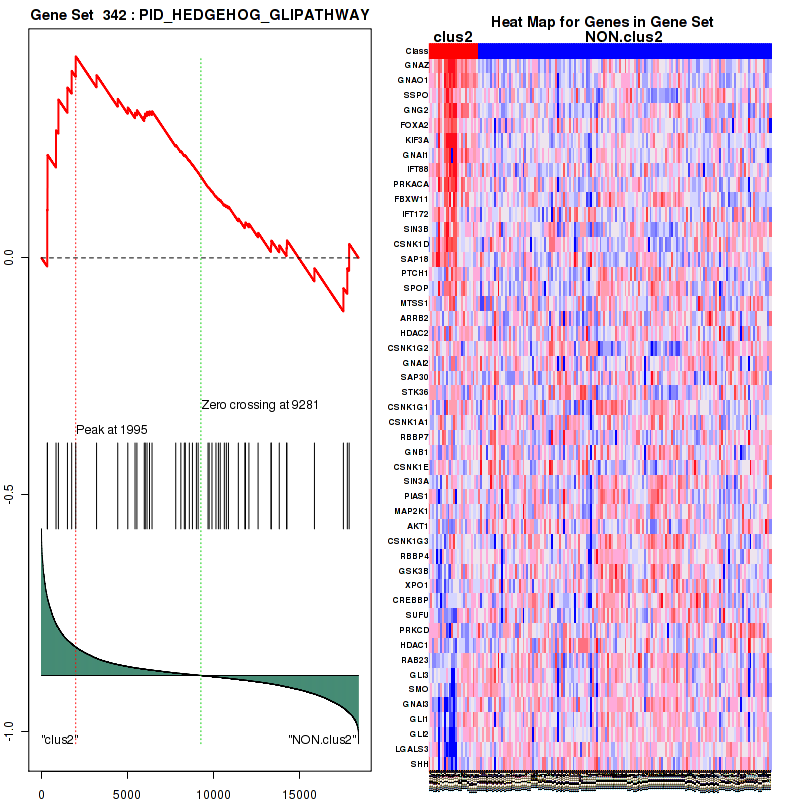
Figure S38. Get High-res Image For the top 5 core enriched genes in the pathway: PID HEDGEHOG GLIPATHWAY, this volcano plot shows how much they are up/down-regulated and significant. The significance was calculated by empirical bayesian fit
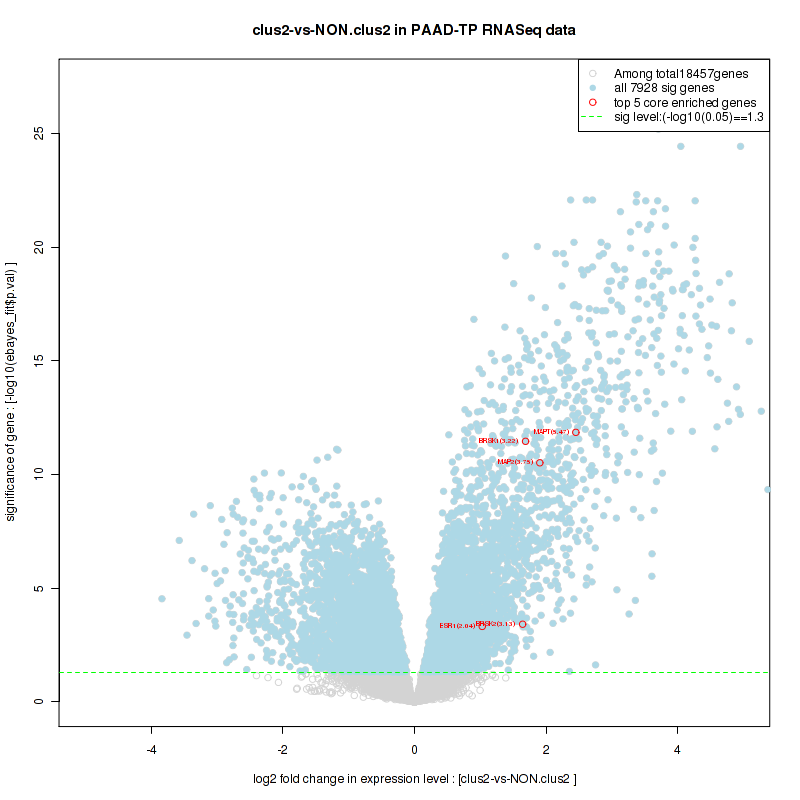
Table S20. Get Full Table This table shows a Running Enrichment Score (RES) of each gene in this pathway, that is, the enrichment score at this point in the ranked list of genes. All genes are ranked by Signal-to-Noise (S2N), a measure of similarity as default and are used to obtain ES matrix of all genes. In this way, GSEA tool uses expression pattern of not only overlapped genes but also not-overlapped genes to produce ES matrix.
| Rank | GENE | SYMBOL | DESC | LIST.LOC | S2N | RES | CORE_ENRICHMENT |
|---|---|---|---|---|---|---|---|
| 1 | SH3GL2 | SH3GL2 | SH3GL2 | 45 | 1.1 | 0.2 | YES |
| 2 | DNAJC6 | DNAJC6 | DNAJC6 | 245 | 0.77 | 0.33 | YES |
| 3 | VAMP2 | VAMP2 | VAMP2 | 1921 | 0.26 | 0.28 | NO |
| 4 | OCRL | OCRL | OCRL | 2734 | 0.19 | 0.28 | NO |
| 5 | NECAP1 | NECAP1 | NECAP1 | 3536 | 0.14 | 0.26 | NO |
| 6 | TPD52 | TPD52 | TPD52 | 3826 | 0.12 | 0.26 | NO |
| 7 | AP1S2 | AP1S2 | AP1S2 | 4012 | 0.11 | 0.27 | NO |
| 8 | NAPA | NAPA | NAPA | 4328 | 0.1 | 0.28 | NO |
| 9 | BLOC1S1 | BLOC1S1 | BLOC1S1 | 4367 | 0.1 | 0.29 | NO |
| 10 | HIP1R | HIP1R | HIP1R | 4734 | 0.089 | 0.29 | NO |
| 11 | DTNBP1 | DTNBP1 | DTNBP1 | 5208 | 0.075 | 0.28 | NO |
| 12 | AP1S1 | AP1S1 | AP1S1 | 6094 | 0.055 | 0.24 | NO |
| 13 | AP1M1 | AP1M1 | AP1M1 | 6321 | 0.05 | 0.24 | NO |
| 14 | PLDN | PLDN | PLDN | 6695 | 0.043 | 0.22 | NO |
| 15 | SORT1 | SORT1 | SORT1 | 6748 | 0.042 | 0.23 | NO |
| 16 | GNS | GNS | GNS | 6867 | 0.04 | 0.23 | NO |
| 17 | AP3B1 | AP3B1 | AP3B1 | 7123 | 0.035 | 0.22 | NO |
| 18 | AP1B1 | AP1B1 | AP1B1 | 7374 | 0.03 | 0.21 | NO |
| 19 | DNASE2 | DNASE2 | DNASE2 | 7456 | 0.029 | 0.22 | NO |
| 20 | CLTA | CLTA | CLTA | 7460 | 0.029 | 0.22 | NO |
| 21 | GBF1 | GBF1 | GBF1 | 7600 | 0.026 | 0.22 | NO |
| 22 | HSPA8 | HSPA8 | HSPA8 | 8218 | 0.016 | 0.19 | NO |
| 23 | AP1M2 | AP1M2 | AP1M2 | 8438 | 0.013 | 0.18 | NO |
| 24 | CLTC | CLTC | CLTC | 8662 | 0.0093 | 0.17 | NO |
| 25 | SNX2 | SNX2 | SNX2 | 8766 | 0.008 | 0.16 | NO |
| 26 | M6PR | M6PR | M6PR | 9557 | -0.0039 | 0.12 | NO |
| 27 | TGOLN2 | TGOLN2 | TGOLN2 | 9572 | -0.0042 | 0.12 | NO |
| 28 | ARF1 | ARF1 | ARF1 | 9741 | -0.0068 | 0.11 | NO |
| 29 | BLOC1S3 | BLOC1S3 | BLOC1S3 | 9955 | -0.01 | 0.1 | NO |
| 30 | RAB5C | RAB5C | RAB5C | 10012 | -0.011 | 0.1 | NO |
| 31 | CPD | CPD | CPD | 10053 | -0.012 | 0.1 | NO |
| 32 | GAK | GAK | GAK | 10366 | -0.017 | 0.088 | NO |
| 33 | AP1G1 | AP1G1 | AP1G1 | 10631 | -0.021 | 0.078 | NO |
| 34 | VAMP7 | VAMP7 | VAMP7 | 10665 | -0.022 | 0.08 | NO |
| 35 | IGF2R | IGF2R | IGF2R | 10679 | -0.022 | 0.084 | NO |
| 36 | SNAPIN | SNAPIN | SNAPIN | 10957 | -0.027 | 0.073 | NO |
| 37 | FTL | FTL | FTL | 11227 | -0.031 | 0.064 | NO |
| 38 | PUM1 | PUM1 | PUM1 | 11344 | -0.033 | 0.064 | NO |
| 39 | YIPF6 | YIPF6 | YIPF6 | 11735 | -0.04 | 0.051 | NO |
| 40 | FTH1 | FTH1 | FTH1 | 11754 | -0.041 | 0.057 | NO |
| 41 | ARRB1 | ARRB1 | ARRB1 | 11866 | -0.043 | 0.059 | NO |
| 42 | AP4E1 | AP4E1 | AP4E1 | 12087 | -0.047 | 0.056 | NO |
| 43 | TPD52L1 | TPD52L1 | TPD52L1 | 12403 | -0.053 | 0.048 | NO |
| 44 | TXNDC5 | TXNDC5 | TXNDC5 | 12793 | -0.061 | 0.039 | NO |
| 45 | PICALM | PICALM | PICALM | 12920 | -0.064 | 0.044 | NO |
| 46 | SNX5 | SNX5 | SNX5 | 13032 | -0.066 | 0.05 | NO |
| 47 | TBC1D8B | TBC1D8B | TBC1D8B | 13111 | -0.068 | 0.058 | NO |
| 48 | SNX9 | SNX9 | SNX9 | 13112 | -0.068 | 0.071 | NO |
| 49 | DNM2 | DNM2 | DNM2 | 13160 | -0.07 | 0.081 | NO |
| 50 | PIK3C2A | PIK3C2A | PIK3C2A | 13202 | -0.071 | 0.092 | NO |
| 51 | STX4 | STX4 | STX4 | 13280 | -0.072 | 0.1 | NO |
| 52 | AP4B1 | AP4B1 | AP4B1 | 13471 | -0.078 | 0.1 | NO |
| 53 | CNO | CNO | CNO | 13658 | -0.083 | 0.11 | NO |
| 54 | AP3S1 | AP3S1 | AP3S1 | 14002 | -0.093 | 0.11 | NO |
| 55 | CTSZ | CTSZ | CTSZ | 14131 | -0.097 | 0.12 | NO |
| 56 | SH3D19 | SH3D19 | SH3D19 | 15350 | -0.14 | 0.08 | NO |
| 57 | TFRC | TFRC | TFRC | 15466 | -0.15 | 0.1 | NO |
| 58 | VAMP8 | VAMP8 | VAMP8 | 15544 | -0.15 | 0.12 | NO |
| 59 | SNAP23 | SNAP23 | SNAP23 | 16256 | -0.19 | 0.12 | NO |
Figure S39. Get High-res Image This plot shows mRNAseq_cNMF expression data heatmap (on the left) a RunningEnrichmentScore(RES) plot (on the top right) and a Signal2Noise(S2N) plot (on the bottom right) of genes in the pathway: REACTOME TRANS GOLGI NETWORK VESICLE BUDDING.
Figure S40. Get High-res Image For the top 5 core enriched genes in the pathway: REACTOME TRANS GOLGI NETWORK VESICLE BUDDING, this volcano plot shows how much they are up/down-regulated and significant. The significance was calculated by empirical bayesian fit
For the top enriched genes, if you want to check whether they are
-
up-regulated, please check the list of up-regulated genes
-
down-regulated, please check the list of down-regulated genes
For the top enriched genes, if you want to check whether they are
-
highly expressed genes, please check the list of high (top 30%) expressed genes
-
low expressed genes, please check the list of low (bottom 30%) expressed genes
An expression pattern of top(30%)/middle(30%)/low(30%) in this subtype against other subtypes is available in a heatmap
For the top enriched genes, if you want to check whether they are
-
significantly differently expressed genes by eBayes lm fit, please check the list of significant genes
Table 5. Get Full Table This table shows top 10 pathways which are significantly enriched in cluster clus3. It displays only significant gene sets satisfying nom.p.val.threshold (-1), fwer.p.val.threshold (-1) , fdr.q.val.threshold (0.25) and the default table is sorted by Normalized Enrichment Score (NES). Further details on NES statistics, please visit The Broad GSEA website.
| GeneSet(GS) | Size(#genes) | genes.ES.table | ES | NES | NOM.p.val | FDR.q.val | FWER.p.val | Tag.. | Gene.. | Signal | FDR..median. | glob.p.val |
|---|---|---|---|---|---|---|---|---|---|---|---|---|
| KEGG DNA REPLICATION | 36 | genes.ES.table | 0.57 | 1.6 | 0.1 | 0.25 | 0.95 | 0.61 | 0.26 | 0.46 | 0.15 | 0.034 |
| KEGG CELL CYCLE | 118 | genes.ES.table | 0.54 | 1.7 | 0.035 | 0.35 | 0.73 | 0.4 | 0.2 | 0.32 | 0.12 | 0.084 |
| KEGG P53 SIGNALING PATHWAY | 67 | genes.ES.table | 0.54 | 1.8 | 0.004 | 0.48 | 0.58 | 0.42 | 0.15 | 0.36 | 0.13 | 0.1 |
| BIOCARTA RACCYCD PATHWAY | 26 | genes.ES.table | 0.5 | 1.7 | 0.023 | 0.32 | 0.73 | 0.58 | 0.33 | 0.39 | 0.11 | 0.075 |
| PID P73PATHWAY | 79 | genes.ES.table | 0.54 | 1.9 | 0.0041 | 0.7 | 0.41 | 0.33 | 0.13 | 0.29 | 0 | 0.16 |
| PID E2F PATHWAY | 70 | genes.ES.table | 0.49 | 1.6 | 0.07 | 0.25 | 0.94 | 0.29 | 0.15 | 0.24 | 0.14 | 0.04 |
| PID ATR PATHWAY | 39 | genes.ES.table | 0.57 | 1.6 | 0.08 | 0.24 | 0.94 | 0.38 | 0.14 | 0.33 | 0.14 | 0.038 |
| PID FRA PATHWAY | 37 | genes.ES.table | 0.65 | 1.6 | 0.008 | 0.24 | 0.9 | 0.35 | 0.086 | 0.32 | 0.12 | 0.044 |
| PID MYC ACTIVPATHWAY | 78 | genes.ES.table | 0.43 | 1.6 | 0.046 | 0.24 | 0.9 | 0.33 | 0.19 | 0.27 | 0.12 | 0.045 |
| PID PLK1 PATHWAY | 45 | genes.ES.table | 0.73 | 1.7 | 0.024 | 0.31 | 0.8 | 0.42 | 0.075 | 0.39 | 0.13 | 0.07 |
Table S21. Get Full Table This table shows a Running Enrichment Score (RES) of each gene in this pathway, that is, the enrichment score at this point in the ranked list of genes. All genes are ranked by Signal-to-Noise (S2N), a measure of similarity as default and are used to obtain ES matrix of all genes. In this way, GSEA tool uses expression pattern of not only overlapped genes but also not-overlapped genes to produce ES matrix.
| Rank | GENE | SYMBOL | DESC | LIST.LOC | S2N | RES | CORE_ENRICHMENT |
|---|---|---|---|---|---|---|---|
| 1 | CDC25C | CDC25C | CDC25C | 214 | 0.37 | 0.057 | YES |
| 2 | NEK2 | NEK2 | NEK2 | 278 | 0.34 | 0.12 | YES |
| 3 | PKMYT1 | PKMYT1 | PKMYT1 | 350 | 0.32 | 0.17 | YES |
| 4 | CCNB2 | CCNB2 | CCNB2 | 440 | 0.3 | 0.22 | YES |
| 5 | PLK4 | PLK4 | PLK4 | 542 | 0.27 | 0.27 | YES |
| 6 | E2F1 | E2F1 | E2F1 | 659 | 0.25 | 0.31 | YES |
| 7 | PLK1 | PLK1 | PLK1 | 672 | 0.25 | 0.35 | YES |
| 8 | CDK1 | CDK1 | CDK1 | 888 | 0.22 | 0.38 | YES |
| 9 | CCNA2 | CCNA2 | CCNA2 | 939 | 0.21 | 0.42 | YES |
| 10 | CCNB1 | CCNB1 | CCNB1 | 1102 | 0.19 | 0.44 | YES |
| 11 | CDC25A | CDC25A | CDC25A | 2038 | 0.12 | 0.42 | YES |
| 12 | WEE1 | WEE1 | WEE1 | 2106 | 0.11 | 0.43 | YES |
| 13 | CDK2 | CDK2 | CDK2 | 2260 | 0.11 | 0.44 | YES |
| 14 | MNAT1 | MNAT1 | MNAT1 | 2403 | 0.098 | 0.45 | YES |
| 15 | TUBA4A | TUBA4A | TUBA4A | 2427 | 0.097 | 0.47 | YES |
| 16 | E2F3 | E2F3 | E2F3 | 2606 | 0.09 | 0.48 | YES |
| 17 | CSNK1E | CSNK1E | CSNK1E | 2670 | 0.087 | 0.49 | YES |
| 18 | AZI1 | AZI1 | AZI1 | 2760 | 0.084 | 0.5 | YES |
| 19 | CENPJ | CENPJ | CENPJ | 2823 | 0.082 | 0.51 | YES |
| 20 | TUBB | TUBB | TUBB | 3374 | 0.067 | 0.5 | YES |
| 21 | CKAP5 | CKAP5 | CKAP5 | 3467 | 0.065 | 0.5 | YES |
| 22 | CDK7 | CDK7 | CDK7 | 3599 | 0.061 | 0.51 | YES |
| 23 | XPO1 | XPO1 | XPO1 | 3930 | 0.054 | 0.5 | YES |
| 24 | DYNC1I2 | DYNC1I2 | DYNC1I2 | 4015 | 0.052 | 0.5 | YES |
| 25 | YWHAG | YWHAG | YWHAG | 4091 | 0.05 | 0.51 | YES |
| 26 | TUBG1 | TUBG1 | TUBG1 | 4092 | 0.05 | 0.52 | YES |
| 27 | HSP90AA1 | HSP90AA1 | HSP90AA1 | 4138 | 0.05 | 0.52 | YES |
| 28 | NUMA1 | NUMA1 | NUMA1 | 4615 | 0.041 | 0.51 | NO |
| 29 | NEDD1 | NEDD1 | NEDD1 | 4879 | 0.037 | 0.5 | NO |
| 30 | CETN2 | CETN2 | CETN2 | 4960 | 0.036 | 0.5 | NO |
| 31 | CEP250 | CEP250 | CEP250 | 5045 | 0.035 | 0.5 | NO |
| 32 | CEP70 | CEP70 | CEP70 | 5156 | 0.033 | 0.5 | NO |
| 33 | CEP72 | CEP72 | CEP72 | 5180 | 0.033 | 0.51 | NO |
| 34 | HAUS2 | HAUS2 | HAUS2 | 5457 | 0.029 | 0.5 | NO |
| 35 | CDC25B | CDC25B | CDC25B | 6043 | 0.021 | 0.47 | NO |
| 36 | DYNC1H1 | DYNC1H1 | DYNC1H1 | 6188 | 0.02 | 0.47 | NO |
| 37 | CLASP1 | CLASP1 | CLASP1 | 6661 | 0.014 | 0.44 | NO |
| 38 | PPP2R1A | PPP2R1A | PPP2R1A | 6745 | 0.014 | 0.44 | NO |
| 39 | DYNLL1 | DYNLL1 | DYNLL1 | 6847 | 0.012 | 0.44 | NO |
| 40 | MAPRE1 | MAPRE1 | MAPRE1 | 6962 | 0.011 | 0.43 | NO |
| 41 | FGFR1OP | FGFR1OP | FGFR1OP | 6971 | 0.011 | 0.44 | NO |
| 42 | DCTN1 | DCTN1 | DCTN1 | 7237 | 0.0084 | 0.42 | NO |
| 43 | CEP63 | CEP63 | CEP63 | 7355 | 0.0071 | 0.42 | NO |
| 44 | CEP135 | CEP135 | CEP135 | 7416 | 0.0064 | 0.42 | NO |
| 45 | TUBA1A | TUBA1A | TUBA1A | 7597 | 0.0042 | 0.41 | NO |
| 46 | CEP192 | CEP192 | CEP192 | 7810 | 0.0016 | 0.4 | NO |
| 47 | CSNK1D | CSNK1D | CSNK1D | 7864 | 0.001 | 0.39 | NO |
| 48 | TUBGCP2 | TUBGCP2 | TUBGCP2 | 8056 | -0.00092 | 0.38 | NO |
| 49 | ALMS1 | ALMS1 | ALMS1 | 8154 | -0.0019 | 0.38 | NO |
| 50 | TUBGCP5 | TUBGCP5 | TUBGCP5 | 8299 | -0.0037 | 0.37 | NO |
| 51 | YWHAE | YWHAE | YWHAE | 8418 | -0.005 | 0.36 | NO |
| 52 | CDK5RAP2 | CDK5RAP2 | CDK5RAP2 | 8452 | -0.0054 | 0.36 | NO |
| 53 | NINL | NINL | NINL | 8485 | -0.0057 | 0.36 | NO |
| 54 | SDCCAG8 | SDCCAG8 | SDCCAG8 | 8760 | -0.0086 | 0.35 | NO |
| 55 | TUBG2 | TUBG2 | TUBG2 | 8762 | -0.0086 | 0.35 | NO |
| 56 | ACTR1A | ACTR1A | ACTR1A | 8781 | -0.0088 | 0.35 | NO |
| 57 | CEP76 | CEP76 | CEP76 | 8956 | -0.011 | 0.34 | NO |
| 58 | SSNA1 | SSNA1 | SSNA1 | 9144 | -0.013 | 0.34 | NO |
| 59 | CEP164 | CEP164 | CEP164 | 9366 | -0.015 | 0.33 | NO |
| 60 | CCNH | CCNH | CCNH | 9461 | -0.016 | 0.33 | NO |
| 61 | DCTN2 | DCTN2 | DCTN2 | 9995 | -0.022 | 0.3 | NO |
| 62 | OFD1 | OFD1 | OFD1 | 10006 | -0.022 | 0.3 | NO |
| 63 | CEP57 | CEP57 | CEP57 | 10044 | -0.023 | 0.31 | NO |
| 64 | CEP290 | CEP290 | CEP290 | 10516 | -0.028 | 0.29 | NO |
| 65 | TUBGCP3 | TUBGCP3 | TUBGCP3 | 11043 | -0.036 | 0.26 | NO |
| 66 | TUBGCP6 | TUBGCP6 | TUBGCP6 | 11074 | -0.036 | 0.27 | NO |
| 67 | PRKACA | PRKACA | PRKACA | 11373 | -0.04 | 0.26 | NO |
| 68 | AKAP9 | AKAP9 | AKAP9 | 11420 | -0.041 | 0.26 | NO |
| 69 | DCTN3 | DCTN3 | DCTN3 | 12060 | -0.052 | 0.24 | NO |
| 70 | PCM1 | PCM1 | PCM1 | 12166 | -0.054 | 0.24 | NO |
| 71 | PAFAH1B1 | PAFAH1B1 | PAFAH1B1 | 12209 | -0.055 | 0.25 | NO |
| 72 | PCNT | PCNT | PCNT | 12274 | -0.057 | 0.26 | NO |
| 73 | CCNA1 | CCNA1 | CCNA1 | 15153 | -0.15 | 0.13 | NO |
| 74 | PRKAR2B | PRKAR2B | PRKAR2B | 16712 | -0.26 | 0.095 | NO |
Figure S41. Get High-res Image This plot shows mRNAseq_cNMF expression data heatmap (on the left) a RunningEnrichmentScore(RES) plot (on the top right) and a Signal2Noise(S2N) plot (on the bottom right) of genes in the pathway: KEGG DNA REPLICATION.
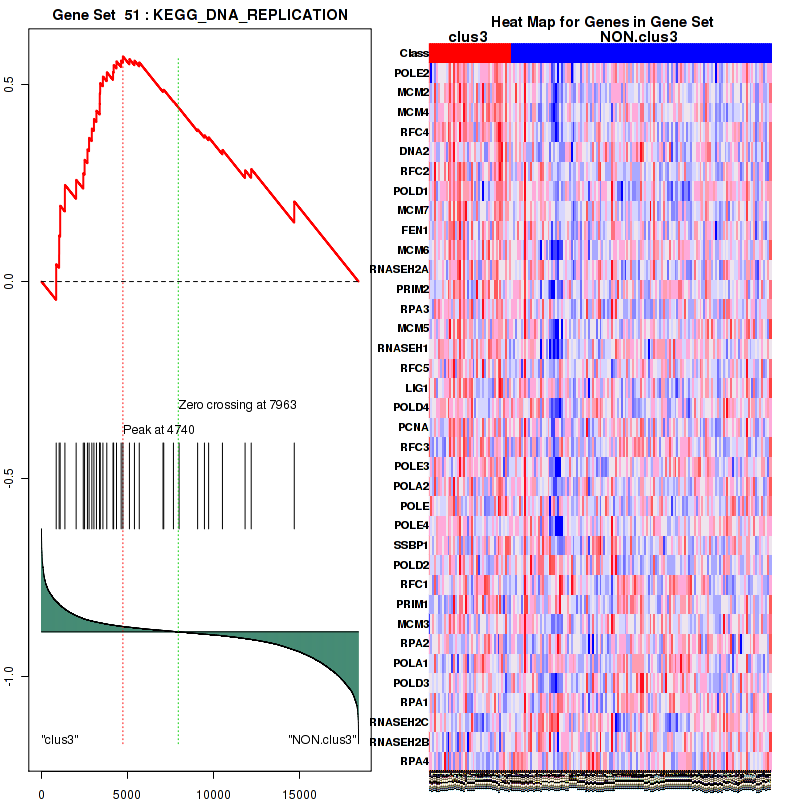
Figure S42. Get High-res Image For the top 5 core enriched genes in the pathway: KEGG DNA REPLICATION, this volcano plot shows how much they are up/down-regulated and significant. The significance was calculated by empirical bayesian fit

Table S22. Get Full Table This table shows a Running Enrichment Score (RES) of each gene in this pathway, that is, the enrichment score at this point in the ranked list of genes. All genes are ranked by Signal-to-Noise (S2N), a measure of similarity as default and are used to obtain ES matrix of all genes. In this way, GSEA tool uses expression pattern of not only overlapped genes but also not-overlapped genes to produce ES matrix.
| Rank | GENE | SYMBOL | DESC | LIST.LOC | S2N | RES | CORE_ENRICHMENT |
|---|---|---|---|---|---|---|---|
| 1 | S100A2 | S100A2 | S100A2 | 33 | 0.56 | 0.063 | YES |
| 2 | TP73 | TP73 | TP73 | 54 | 0.5 | 0.12 | YES |
| 3 | TP63 | TP63 | TP63 | 115 | 0.44 | 0.17 | YES |
| 4 | BUB1 | BUB1 | BUB1 | 416 | 0.3 | 0.18 | YES |
| 5 | SFN | SFN | SFN | 450 | 0.29 | 0.22 | YES |
| 6 | IL1RAP | IL1RAP | IL1RAP | 465 | 0.29 | 0.25 | YES |
| 7 | TP53AIP1 | TP53AIP1 | TP53AIP1 | 484 | 0.28 | 0.28 | YES |
| 8 | RAD51 | RAD51 | RAD51 | 517 | 0.28 | 0.31 | YES |
| 9 | PLK1 | PLK1 | PLK1 | 672 | 0.25 | 0.33 | YES |
| 10 | WT1 | WT1 | WT1 | 773 | 0.23 | 0.35 | YES |
| 11 | CDK1 | CDK1 | CDK1 | 888 | 0.22 | 0.37 | YES |
| 12 | CCNA2 | CCNA2 | CCNA2 | 939 | 0.21 | 0.39 | YES |
| 13 | ADA | ADA | ADA | 1031 | 0.2 | 0.41 | YES |
| 14 | CCNE2 | CCNE2 | CCNE2 | 1067 | 0.2 | 0.43 | YES |
| 15 | CCNB1 | CCNB1 | CCNB1 | 1102 | 0.19 | 0.45 | YES |
| 16 | CLCA2 | CLCA2 | CLCA2 | 1224 | 0.18 | 0.46 | YES |
| 17 | CHEK1 | CHEK1 | CHEK1 | 1292 | 0.17 | 0.48 | YES |
| 18 | BRCA2 | BRCA2 | BRCA2 | 1413 | 0.16 | 0.49 | YES |
| 19 | SERPINE1 | SERPINE1 | SERPINE1 | 1486 | 0.16 | 0.5 | YES |
| 20 | JAG2 | JAG2 | JAG2 | 1673 | 0.14 | 0.51 | YES |
| 21 | CDK6 | CDK6 | CDK6 | 2115 | 0.11 | 0.5 | YES |
| 22 | PLK3 | PLK3 | PLK3 | 2188 | 0.11 | 0.51 | YES |
| 23 | BBC3 | BBC3 | BBC3 | 2198 | 0.11 | 0.52 | YES |
| 24 | CDK2 | CDK2 | CDK2 | 2260 | 0.11 | 0.53 | YES |
| 25 | YAP1 | YAP1 | YAP1 | 2287 | 0.1 | 0.54 | YES |
| 26 | HSF1 | HSF1 | HSF1 | 2415 | 0.098 | 0.54 | YES |
| 27 | FBXO45 | FBXO45 | FBXO45 | 2657 | 0.088 | 0.54 | NO |
| 28 | PML | PML | PML | 3179 | 0.072 | 0.52 | NO |
| 29 | IL4R | IL4R | IL4R | 3219 | 0.071 | 0.53 | NO |
| 30 | TP53I3 | TP53I3 | TP53I3 | 3794 | 0.057 | 0.5 | NO |
| 31 | CASP2 | CASP2 | CASP2 | 3859 | 0.055 | 0.5 | NO |
| 32 | ITCH | ITCH | ITCH | 3867 | 0.055 | 0.51 | NO |
| 33 | RELA | RELA | RELA | 4309 | 0.046 | 0.49 | NO |
| 34 | SP1 | SP1 | SP1 | 4780 | 0.039 | 0.47 | NO |
| 35 | MDM2 | MDM2 | MDM2 | 4867 | 0.037 | 0.47 | NO |
| 36 | BCL2L11 | BCL2L11 | BCL2L11 | 5136 | 0.034 | 0.46 | NO |
| 37 | BUB3 | BUB3 | BUB3 | 5218 | 0.032 | 0.46 | NO |
| 38 | FASN | FASN | FASN | 5233 | 0.032 | 0.46 | NO |
| 39 | BAK1 | BAK1 | BAK1 | 5234 | 0.032 | 0.46 | NO |
| 40 | CDKN1A | CDKN1A | CDKN1A | 6056 | 0.021 | 0.42 | NO |
| 41 | PEA15 | PEA15 | PEA15 | 6289 | 0.018 | 0.41 | NO |
| 42 | MAPK14 | MAPK14 | MAPK14 | 6355 | 0.018 | 0.41 | NO |
| 43 | DEDD | DEDD | DEDD | 6409 | 0.017 | 0.41 | NO |
| 44 | MYC | MYC | MYC | 7176 | 0.009 | 0.37 | NO |
| 45 | TUBA1A | TUBA1A | TUBA1A | 7597 | 0.0042 | 0.35 | NO |
| 46 | BAX | BAX | BAX | 7713 | 0.0028 | 0.34 | NO |
| 47 | FLOT2 | FLOT2 | FLOT2 | 7912 | 0.00052 | 0.33 | NO |
| 48 | UBE4B | UBE4B | UBE4B | 8001 | -0.00039 | 0.32 | NO |
| 49 | EP300 | EP300 | EP300 | 8021 | -0.00054 | 0.32 | NO |
| 50 | ABL1 | ABL1 | ABL1 | 8208 | -0.0025 | 0.31 | NO |
| 51 | FAS | FAS | FAS | 8537 | -0.0062 | 0.3 | NO |
| 52 | AFP | AFP | AFP | 8794 | -0.0089 | 0.28 | NO |
| 53 | GNB2L1 | GNB2L1 | GNB2L1 | 8862 | -0.0097 | 0.28 | NO |
| 54 | JAK1 | JAK1 | JAK1 | 9052 | -0.012 | 0.27 | NO |
| 55 | NDUFS2 | NDUFS2 | NDUFS2 | 9758 | -0.02 | 0.24 | NO |
| 56 | KAT5 | KAT5 | KAT5 | 9806 | -0.02 | 0.24 | NO |
| 57 | MAPK11 | MAPK11 | MAPK11 | 10045 | -0.023 | 0.23 | NO |
| 58 | RB1 | RB1 | RB1 | 10458 | -0.027 | 0.21 | NO |
| 59 | FOXO3 | FOXO3 | FOXO3 | 10875 | -0.033 | 0.19 | NO |
| 60 | BIN1 | BIN1 | BIN1 | 11231 | -0.038 | 0.17 | NO |
| 61 | RCHY1 | RCHY1 | RCHY1 | 11436 | -0.042 | 0.17 | NO |
| 62 | PFDN5 | PFDN5 | PFDN5 | 11597 | -0.044 | 0.16 | NO |
| 63 | AEN | AEN | AEN | 11645 | -0.045 | 0.16 | NO |
| 64 | DCP1B | DCP1B | DCP1B | 11652 | -0.045 | 0.17 | NO |
| 65 | RNF43 | RNF43 | RNF43 | 11700 | -0.046 | 0.17 | NO |
| 66 | PIN1 | PIN1 | PIN1 | 11995 | -0.051 | 0.16 | NO |
| 67 | GRAMD4 | GRAMD4 | GRAMD4 | 12007 | -0.051 | 0.17 | NO |
| 68 | SIRT1 | SIRT1 | SIRT1 | 12285 | -0.057 | 0.16 | NO |
| 69 | HEY2 | HEY2 | HEY2 | 12572 | -0.063 | 0.15 | NO |
| 70 | SERPINA1 | SERPINA1 | SERPINA1 | 12801 | -0.068 | 0.15 | NO |
| 71 | NEDD4L | NEDD4L | NEDD4L | 12909 | -0.07 | 0.15 | NO |
| 72 | HAGH | HAGH | HAGH | 13411 | -0.083 | 0.13 | NO |
| 73 | GDF15 | GDF15 | GDF15 | 13498 | -0.086 | 0.14 | NO |
| 74 | WWOX | WWOX | WWOX | 13747 | -0.093 | 0.13 | NO |
| 75 | GATA1 | GATA1 | GATA1 | 14828 | -0.14 | 0.09 | NO |
| 76 | PRKACB | PRKACB | PRKACB | 14965 | -0.14 | 0.099 | NO |
| 77 | PPAP2A | PPAP2A | PPAP2A | 15049 | -0.15 | 0.11 | NO |
| 78 | NTRK1 | NTRK1 | NTRK1 | 16684 | -0.26 | 0.052 | NO |
| 79 | D4S234E | D4S234E | D4S234E | 17796 | -0.39 | 0.036 | NO |
Figure S43. Get High-res Image This plot shows mRNAseq_cNMF expression data heatmap (on the left) a RunningEnrichmentScore(RES) plot (on the top right) and a Signal2Noise(S2N) plot (on the bottom right) of genes in the pathway: KEGG CELL CYCLE.
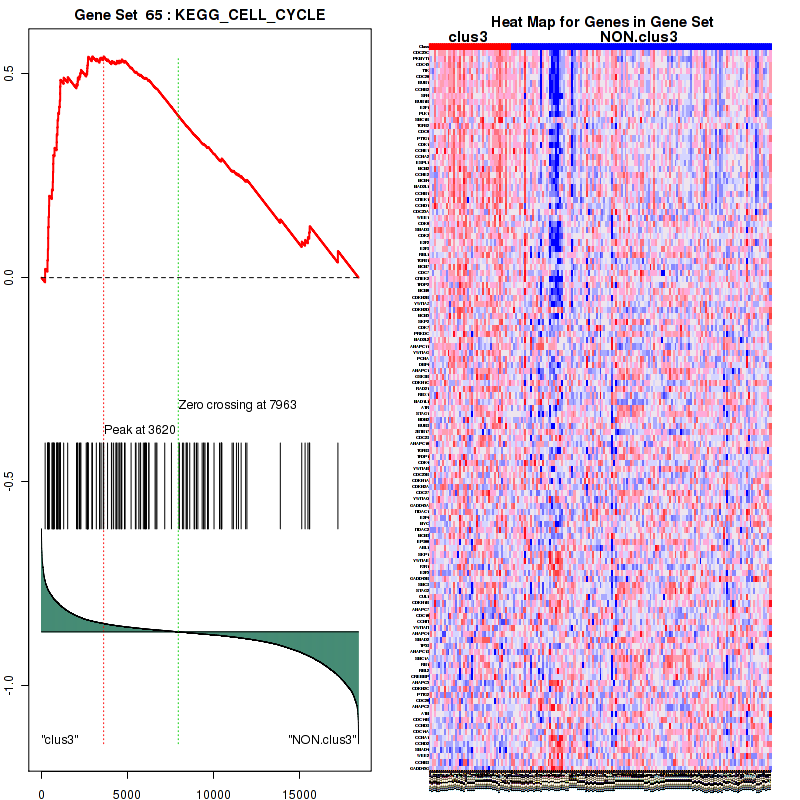
Figure S44. Get High-res Image For the top 5 core enriched genes in the pathway: KEGG CELL CYCLE, this volcano plot shows how much they are up/down-regulated and significant. The significance was calculated by empirical bayesian fit

Table S23. Get Full Table This table shows a Running Enrichment Score (RES) of each gene in this pathway, that is, the enrichment score at this point in the ranked list of genes. All genes are ranked by Signal-to-Noise (S2N), a measure of similarity as default and are used to obtain ES matrix of all genes. In this way, GSEA tool uses expression pattern of not only overlapped genes but also not-overlapped genes to produce ES matrix.
| Rank | GENE | SYMBOL | DESC | LIST.LOC | S2N | RES | CORE_ENRICHMENT |
|---|---|---|---|---|---|---|---|
| 1 | KIF18A | KIF18A | KIF18A | 148 | 0.41 | 0.0039 | YES |
| 2 | SPC24 | SPC24 | SPC24 | 165 | 0.4 | 0.015 | YES |
| 3 | CDC25C | CDC25C | CDC25C | 214 | 0.37 | 0.023 | YES |
| 4 | BIRC5 | BIRC5 | BIRC5 | 220 | 0.37 | 0.034 | YES |
| 5 | MCM10 | MCM10 | MCM10 | 250 | 0.35 | 0.042 | YES |
| 6 | CENPA | CENPA | CENPA | 263 | 0.35 | 0.052 | YES |
| 7 | CENPI | CENPI | CENPI | 269 | 0.34 | 0.062 | YES |
| 8 | HJURP | HJURP | HJURP | 273 | 0.34 | 0.072 | YES |
| 9 | NEK2 | NEK2 | NEK2 | 278 | 0.34 | 0.082 | YES |
| 10 | OIP5 | OIP5 | OIP5 | 280 | 0.34 | 0.092 | YES |
| 11 | KIF20A | KIF20A | KIF20A | 300 | 0.34 | 0.1 | YES |
| 12 | HIST1H2BC | HIST1H2BC | HIST1H2BC | 319 | 0.33 | 0.11 | YES |
| 13 | UBE2C | UBE2C | UBE2C | 333 | 0.32 | 0.12 | YES |
| 14 | SGOL1 | SGOL1 | SGOL1 | 335 | 0.32 | 0.13 | YES |
| 15 | PKMYT1 | PKMYT1 | PKMYT1 | 350 | 0.32 | 0.14 | YES |
| 16 | HIST1H2BO | HIST1H2BO | HIST1H2BO | 351 | 0.32 | 0.15 | YES |
| 17 | KIF23 | KIF23 | KIF23 | 354 | 0.32 | 0.16 | YES |
| 18 | CDC45 | CDC45 | CDC45 | 373 | 0.31 | 0.16 | YES |
| 19 | CDC20 | CDC20 | CDC20 | 395 | 0.3 | 0.17 | YES |
| 20 | KIF2C | KIF2C | KIF2C | 401 | 0.3 | 0.18 | YES |
| 21 | ERCC6L | ERCC6L | ERCC6L | 407 | 0.3 | 0.19 | YES |
| 22 | HIST1H2BJ | HIST1H2BJ | HIST1H2BJ | 410 | 0.3 | 0.2 | YES |
| 23 | BUB1 | BUB1 | BUB1 | 416 | 0.3 | 0.21 | YES |
| 24 | CCNB2 | CCNB2 | CCNB2 | 440 | 0.3 | 0.21 | YES |
| 25 | CENPK | CENPK | CENPK | 449 | 0.29 | 0.22 | YES |
| 26 | HIST1H2BD | HIST1H2BD | HIST1H2BD | 469 | 0.29 | 0.23 | YES |
| 27 | PLK4 | PLK4 | PLK4 | 542 | 0.27 | 0.23 | YES |
| 28 | CASC5 | CASC5 | CASC5 | 584 | 0.27 | 0.24 | YES |
| 29 | HIST1H4E | HIST1H4E | HIST1H4E | 587 | 0.27 | 0.25 | YES |
| 30 | HIST1H4I | HIST1H4I | HIST1H4I | 597 | 0.26 | 0.25 | YES |
| 31 | BUB1B | BUB1B | BUB1B | 608 | 0.26 | 0.26 | YES |
| 32 | AURKB | AURKB | AURKB | 625 | 0.26 | 0.27 | YES |
| 33 | MYBL2 | MYBL2 | MYBL2 | 632 | 0.26 | 0.28 | YES |
| 34 | E2F1 | E2F1 | E2F1 | 659 | 0.25 | 0.28 | YES |
| 35 | NUF2 | NUF2 | NUF2 | 664 | 0.25 | 0.29 | YES |
| 36 | PLK1 | PLK1 | PLK1 | 672 | 0.25 | 0.3 | YES |
| 37 | SMC1B | SMC1B | SMC1B | 685 | 0.25 | 0.3 | YES |
| 38 | HIST3H2BB | HIST3H2BB | HIST3H2BB | 713 | 0.24 | 0.31 | YES |
| 39 | CDC6 | CDC6 | CDC6 | 762 | 0.24 | 0.31 | YES |
| 40 | HIST1H2BG | HIST1H2BG | HIST1H2BG | 767 | 0.23 | 0.32 | YES |
| 41 | CDT1 | CDT1 | CDT1 | 771 | 0.23 | 0.32 | YES |
| 42 | HIST1H2AJ | HIST1H2AJ | HIST1H2AJ | 818 | 0.23 | 0.33 | YES |
| 43 | HIST1H2BF | HIST1H2BF | HIST1H2BF | 843 | 0.22 | 0.33 | YES |
| 44 | POLE2 | POLE2 | POLE2 | 857 | 0.22 | 0.34 | YES |
| 45 | HIST1H2AD | HIST1H2AD | HIST1H2AD | 874 | 0.22 | 0.34 | YES |
| 46 | GINS4 | GINS4 | GINS4 | 875 | 0.22 | 0.35 | YES |
| 47 | HIST1H2BM | HIST1H2BM | HIST1H2BM | 876 | 0.22 | 0.36 | YES |
| 48 | AURKA | AURKA | AURKA | 877 | 0.22 | 0.36 | YES |
| 49 | PTTG1 | PTTG1 | PTTG1 | 884 | 0.22 | 0.37 | YES |
| 50 | CDK1 | CDK1 | CDK1 | 888 | 0.22 | 0.38 | YES |
| 51 | CCNE1 | CCNE1 | CCNE1 | 930 | 0.22 | 0.38 | YES |
| 52 | CCNA2 | CCNA2 | CCNA2 | 939 | 0.21 | 0.39 | YES |
| 53 | HIST1H2AE | HIST1H2AE | HIST1H2AE | 971 | 0.21 | 0.39 | YES |
| 54 | NDC80 | NDC80 | NDC80 | 979 | 0.21 | 0.4 | YES |
| 55 | HIST2H2AA3 | HIST2H2AA3 | HIST2H2AA3 | 988 | 0.21 | 0.4 | YES |
| 56 | SKA1 | SKA1 | SKA1 | 993 | 0.21 | 0.41 | YES |
| 57 | MCM2 | MCM2 | MCM2 | 1030 | 0.2 | 0.41 | YES |
| 58 | HIST1H2BN | HIST1H2BN | HIST1H2BN | 1032 | 0.2 | 0.42 | YES |
| 59 | RRM2 | RRM2 | RRM2 | 1040 | 0.2 | 0.42 | YES |
| 60 | CCNE2 | CCNE2 | CCNE2 | 1067 | 0.2 | 0.43 | YES |
| 61 | HIST1H4H | HIST1H4H | HIST1H4H | 1084 | 0.19 | 0.43 | YES |
| 62 | GINS2 | GINS2 | GINS2 | 1087 | 0.19 | 0.44 | YES |
| 63 | MCM4 | MCM4 | MCM4 | 1089 | 0.19 | 0.44 | YES |
| 64 | MAD2L1 | MAD2L1 | MAD2L1 | 1091 | 0.19 | 0.45 | YES |
| 65 | HIST1H4B | HIST1H4B | HIST1H4B | 1096 | 0.19 | 0.46 | YES |
| 66 | CCNB1 | CCNB1 | CCNB1 | 1102 | 0.19 | 0.46 | YES |
| 67 | GINS1 | GINS1 | GINS1 | 1126 | 0.19 | 0.47 | YES |
| 68 | CDCA8 | CDCA8 | CDCA8 | 1135 | 0.19 | 0.47 | YES |
| 69 | HIST1H2BE | HIST1H2BE | HIST1H2BE | 1175 | 0.18 | 0.47 | YES |
| 70 | CENPM | CENPM | CENPM | 1250 | 0.18 | 0.48 | YES |
| 71 | HIST1H2BL | HIST1H2BL | HIST1H2BL | 1280 | 0.18 | 0.48 | YES |
| 72 | CHEK1 | CHEK1 | CHEK1 | 1292 | 0.17 | 0.48 | YES |
| 73 | HIST1H4D | HIST1H4D | HIST1H4D | 1296 | 0.17 | 0.49 | YES |
| 74 | KNTC1 | KNTC1 | KNTC1 | 1299 | 0.17 | 0.49 | YES |
| 75 | HIST2H4A | HIST2H4A | HIST2H4A | 1312 | 0.17 | 0.5 | YES |
| 76 | SGOL2 | SGOL2 | SGOL2 | 1338 | 0.17 | 0.5 | YES |
| 77 | RFC4 | RFC4 | RFC4 | 1365 | 0.17 | 0.5 | YES |
| 78 | MLF1IP | MLF1IP | MLF1IP | 1380 | 0.16 | 0.51 | YES |
| 79 | CENPH | CENPH | CENPH | 1442 | 0.16 | 0.51 | YES |
| 80 | HIST2H2BE | HIST2H2BE | HIST2H2BE | 1457 | 0.16 | 0.51 | YES |
| 81 | CCND1 | CCND1 | CCND1 | 1526 | 0.15 | 0.52 | YES |
| 82 | ZWINT | ZWINT | ZWINT | 1606 | 0.15 | 0.52 | YES |
| 83 | CKS1B | CKS1B | CKS1B | 1615 | 0.14 | 0.52 | YES |
| 84 | SYCP2 | SYCP2 | SYCP2 | 1632 | 0.14 | 0.52 | YES |
| 85 | TYMS | TYMS | TYMS | 1647 | 0.14 | 0.52 | YES |
| 86 | SPC25 | SPC25 | SPC25 | 1784 | 0.13 | 0.52 | YES |
| 87 | TERT | TERT | TERT | 1979 | 0.12 | 0.51 | YES |
| 88 | DNA2 | DNA2 | DNA2 | 2018 | 0.12 | 0.52 | YES |
| 89 | CDC25A | CDC25A | CDC25A | 2038 | 0.12 | 0.52 | YES |
| 90 | INCENP | INCENP | INCENP | 2105 | 0.11 | 0.52 | YES |
| 91 | WEE1 | WEE1 | WEE1 | 2106 | 0.11 | 0.52 | YES |
| 92 | CDK6 | CDK6 | CDK6 | 2115 | 0.11 | 0.52 | YES |
| 93 | CCDC99 | CCDC99 | CCDC99 | 2153 | 0.11 | 0.52 | YES |
| 94 | CENPN | CENPN | CENPN | 2235 | 0.11 | 0.52 | YES |
| 95 | CDK2 | CDK2 | CDK2 | 2260 | 0.11 | 0.53 | YES |
| 96 | LMNB1 | LMNB1 | LMNB1 | 2264 | 0.11 | 0.53 | YES |
| 97 | E2F2 | E2F2 | E2F2 | 2298 | 0.1 | 0.53 | YES |
| 98 | HIST1H4J | HIST1H4J | HIST1H4J | 2300 | 0.1 | 0.53 | YES |
| 99 | HIST1H2BK | HIST1H2BK | HIST1H2BK | 2354 | 0.1 | 0.53 | YES |
| 100 | ZWILCH | ZWILCH | ZWILCH | 2371 | 0.1 | 0.54 | YES |
| 101 | MNAT1 | MNAT1 | MNAT1 | 2403 | 0.098 | 0.54 | YES |
| 102 | CENPO | CENPO | CENPO | 2424 | 0.097 | 0.54 | YES |
| 103 | TUBA4A | TUBA4A | TUBA4A | 2427 | 0.097 | 0.54 | YES |
| 104 | RFC2 | RFC2 | RFC2 | 2435 | 0.097 | 0.54 | YES |
| 105 | H2AFX | H2AFX | H2AFX | 2484 | 0.095 | 0.54 | YES |
| 106 | HIST1H2AC | HIST1H2AC | HIST1H2AC | 2490 | 0.094 | 0.55 | YES |
| 107 | RUVBL1 | RUVBL1 | RUVBL1 | 2507 | 0.094 | 0.55 | YES |
| 108 | POLD1 | POLD1 | POLD1 | 2510 | 0.094 | 0.55 | YES |
| 109 | NUP107 | NUP107 | NUP107 | 2554 | 0.092 | 0.55 | YES |
| 110 | LIN9 | LIN9 | LIN9 | 2577 | 0.09 | 0.55 | YES |
| 111 | E2F3 | E2F3 | E2F3 | 2606 | 0.09 | 0.55 | YES |
| 112 | PSMD2 | PSMD2 | PSMD2 | 2609 | 0.089 | 0.56 | YES |
| 113 | RBL1 | RBL1 | RBL1 | 2663 | 0.087 | 0.56 | YES |
| 114 | CSNK1E | CSNK1E | CSNK1E | 2670 | 0.087 | 0.56 | YES |
| 115 | MCM7 | MCM7 | MCM7 | 2678 | 0.087 | 0.56 | YES |
| 116 | CDC7 | CDC7 | CDC7 | 2696 | 0.086 | 0.56 | YES |
| 117 | CHEK2 | CHEK2 | CHEK2 | 2710 | 0.086 | 0.56 | YES |
| 118 | RCC2 | RCC2 | RCC2 | 2753 | 0.084 | 0.56 | YES |
| 119 | AZI1 | AZI1 | AZI1 | 2760 | 0.084 | 0.57 | YES |
| 120 | HIST4H4 | HIST4H4 | HIST4H4 | 2765 | 0.084 | 0.57 | YES |
| 121 | FEN1 | FEN1 | FEN1 | 2771 | 0.084 | 0.57 | YES |
| 122 | CENPJ | CENPJ | CENPJ | 2823 | 0.082 | 0.57 | YES |
| 123 | DSN1 | DSN1 | DSN1 | 2848 | 0.082 | 0.57 | YES |
| 124 | PSMD14 | PSMD14 | PSMD14 | 2871 | 0.081 | 0.57 | YES |
| 125 | MCM6 | MCM6 | MCM6 | 2932 | 0.079 | 0.57 | YES |
| 126 | CDKN2B | CDKN2B | CDKN2B | 2966 | 0.078 | 0.57 | YES |
| 127 | RUVBL2 | RUVBL2 | RUVBL2 | 3055 | 0.075 | 0.57 | YES |
| 128 | NUP85 | NUP85 | NUP85 | 3129 | 0.073 | 0.57 | YES |
| 129 | HIST3H3 | HIST3H3 | HIST3H3 | 3140 | 0.073 | 0.57 | YES |
| 130 | FKBP6 | FKBP6 | FKBP6 | 3166 | 0.072 | 0.57 | YES |
| 131 | PRIM2 | PRIM2 | PRIM2 | 3200 | 0.071 | 0.57 | YES |
| 132 | MCM8 | MCM8 | MCM8 | 3214 | 0.071 | 0.57 | YES |
| 133 | CENPL | CENPL | CENPL | 3241 | 0.07 | 0.57 | YES |
| 134 | CENPP | CENPP | CENPP | 3309 | 0.068 | 0.57 | YES |
| 135 | PSMD12 | PSMD12 | PSMD12 | 3311 | 0.068 | 0.57 | YES |
| 136 | TUBB | TUBB | TUBB | 3374 | 0.067 | 0.57 | YES |
| 137 | CDKN2D | CDKN2D | CDKN2D | 3379 | 0.067 | 0.57 | YES |
| 138 | RPA3 | RPA3 | RPA3 | 3390 | 0.067 | 0.57 | YES |
| 139 | MCM5 | MCM5 | MCM5 | 3395 | 0.067 | 0.57 | YES |
| 140 | CKAP5 | CKAP5 | CKAP5 | 3467 | 0.065 | 0.57 | YES |
| 141 | SKP2 | SKP2 | SKP2 | 3471 | 0.065 | 0.57 | YES |
| 142 | H2AFZ | H2AFZ | H2AFZ | 3541 | 0.063 | 0.57 | YES |
| 143 | RANGAP1 | RANGAP1 | RANGAP1 | 3562 | 0.062 | 0.57 | YES |
| 144 | RFC5 | RFC5 | RFC5 | 3577 | 0.062 | 0.57 | YES |
| 145 | PPP2R2A | PPP2R2A | PPP2R2A | 3596 | 0.061 | 0.58 | YES |
| 146 | CDK7 | CDK7 | CDK7 | 3599 | 0.061 | 0.58 | YES |
| 147 | PSMD7 | PSMD7 | PSMD7 | 3660 | 0.06 | 0.58 | YES |
| 148 | UBE2E1 | UBE2E1 | UBE2E1 | 3695 | 0.059 | 0.58 | YES |
| 149 | HSPA2 | HSPA2 | HSPA2 | 3698 | 0.059 | 0.58 | YES |
| 150 | PSMD11 | PSMD11 | PSMD11 | 3713 | 0.058 | 0.58 | YES |
| 151 | TAOK1 | TAOK1 | TAOK1 | 3723 | 0.058 | 0.58 | YES |
| 152 | NUP37 | NUP37 | NUP37 | 3731 | 0.058 | 0.58 | YES |
| 153 | LIG1 | LIG1 | LIG1 | 3804 | 0.056 | 0.58 | NO |
| 154 | XPO1 | XPO1 | XPO1 | 3930 | 0.054 | 0.57 | NO |
| 155 | BRCA1 | BRCA1 | BRCA1 | 3945 | 0.053 | 0.57 | NO |
| 156 | LMNA | LMNA | LMNA | 4005 | 0.052 | 0.57 | NO |
| 157 | DYNC1I2 | DYNC1I2 | DYNC1I2 | 4015 | 0.052 | 0.57 | NO |
| 158 | UBE2I | UBE2I | UBE2I | 4038 | 0.052 | 0.57 | NO |
| 159 | RSF1 | RSF1 | RSF1 | 4047 | 0.051 | 0.57 | NO |
| 160 | PSMA1 | PSMA1 | PSMA1 | 4051 | 0.051 | 0.58 | NO |
| 161 | ZW10 | ZW10 | ZW10 | 4053 | 0.051 | 0.58 | NO |
| 162 | ANAPC11 | ANAPC11 | ANAPC11 | 4073 | 0.051 | 0.58 | NO |
| 163 | YWHAG | YWHAG | YWHAG | 4091 | 0.05 | 0.58 | NO |
| 164 | TUBG1 | TUBG1 | TUBG1 | 4092 | 0.05 | 0.58 | NO |
| 165 | HSP90AA1 | HSP90AA1 | HSP90AA1 | 4138 | 0.05 | 0.58 | NO |
| 166 | POLD4 | POLD4 | POLD4 | 4167 | 0.049 | 0.58 | NO |
| 167 | PCNA | PCNA | PCNA | 4202 | 0.048 | 0.58 | NO |
| 168 | TK2 | TK2 | TK2 | 4225 | 0.048 | 0.58 | NO |
| 169 | PSMB2 | PSMB2 | PSMB2 | 4258 | 0.047 | 0.58 | NO |
| 170 | PSMA7 | PSMA7 | PSMA7 | 4327 | 0.046 | 0.58 | NO |
| 171 | DBF4 | DBF4 | DBF4 | 4330 | 0.046 | 0.58 | NO |
| 172 | TEX12 | TEX12 | TEX12 | 4343 | 0.046 | 0.58 | NO |
| 173 | RFC3 | RFC3 | RFC3 | 4368 | 0.045 | 0.58 | NO |
| 174 | ANAPC1 | ANAPC1 | ANAPC1 | 4384 | 0.045 | 0.58 | NO |
| 175 | PSMA5 | PSMA5 | PSMA5 | 4401 | 0.045 | 0.58 | NO |
| 176 | ACD | ACD | ACD | 4432 | 0.044 | 0.58 | NO |
| 177 | CENPQ | CENPQ | CENPQ | 4447 | 0.044 | 0.58 | NO |
| 178 | LIN37 | LIN37 | LIN37 | 4497 | 0.043 | 0.58 | NO |
| 179 | RAD21 | RAD21 | RAD21 | 4525 | 0.043 | 0.58 | NO |
| 180 | HIST1H2AB | HIST1H2AB | HIST1H2AB | 4553 | 0.042 | 0.58 | NO |
| 181 | PSMA6 | PSMA6 | PSMA6 | 4582 | 0.042 | 0.58 | NO |
| 182 | NUMA1 | NUMA1 | NUMA1 | 4615 | 0.041 | 0.58 | NO |
| 183 | UBE2D1 | UBE2D1 | UBE2D1 | 4616 | 0.041 | 0.58 | NO |
| 184 | MAD1L1 | MAD1L1 | MAD1L1 | 4667 | 0.04 | 0.58 | NO |
| 185 | CLIP1 | CLIP1 | CLIP1 | 4673 | 0.04 | 0.58 | NO |
| 186 | ATR | ATR | ATR | 4674 | 0.04 | 0.58 | NO |
| 187 | PPP2R5E | PPP2R5E | PPP2R5E | 4701 | 0.04 | 0.58 | NO |
| 188 | POLA2 | POLA2 | POLA2 | 4740 | 0.039 | 0.58 | NO |
| 189 | PSMD8 | PSMD8 | PSMD8 | 4821 | 0.038 | 0.57 | NO |
| 190 | STAG1 | STAG1 | STAG1 | 4835 | 0.038 | 0.57 | NO |
| 191 | MDM2 | MDM2 | MDM2 | 4867 | 0.037 | 0.57 | NO |
| 192 | NEDD1 | NEDD1 | NEDD1 | 4879 | 0.037 | 0.57 | NO |
| 193 | ITGB3BP | ITGB3BP | ITGB3BP | 4881 | 0.037 | 0.57 | NO |
| 194 | CETN2 | CETN2 | CETN2 | 4960 | 0.036 | 0.57 | NO |
| 195 | CEP250 | CEP250 | CEP250 | 5045 | 0.035 | 0.57 | NO |
| 196 | PSMD13 | PSMD13 | PSMD13 | 5082 | 0.034 | 0.57 | NO |
| 197 | POLE | POLE | POLE | 5120 | 0.034 | 0.57 | NO |
| 198 | CEP70 | CEP70 | CEP70 | 5156 | 0.033 | 0.56 | NO |
| 199 | CEP72 | CEP72 | CEP72 | 5180 | 0.033 | 0.56 | NO |
| 200 | PSMC3 | PSMC3 | PSMC3 | 5187 | 0.033 | 0.56 | NO |
| 201 | BUB3 | BUB3 | BUB3 | 5218 | 0.032 | 0.56 | NO |
| 202 | PSMC1 | PSMC1 | PSMC1 | 5255 | 0.032 | 0.56 | NO |
| 203 | RAD9A | RAD9A | RAD9A | 5260 | 0.032 | 0.56 | NO |
| 204 | PSMD1 | PSMD1 | PSMD1 | 5280 | 0.032 | 0.56 | NO |
| 205 | POT1 | POT1 | POT1 | 5412 | 0.03 | 0.56 | NO |
| 206 | PSMC6 | PSMC6 | PSMC6 | 5442 | 0.029 | 0.56 | NO |
| 207 | HAUS2 | HAUS2 | HAUS2 | 5457 | 0.029 | 0.56 | NO |
| 208 | CDC23 | CDC23 | CDC23 | 5505 | 0.028 | 0.56 | NO |
| 209 | KIF2A | KIF2A | KIF2A | 5545 | 0.028 | 0.55 | NO |
| 210 | PSMD5 | PSMD5 | PSMD5 | 5561 | 0.028 | 0.55 | NO |
| 211 | PSME4 | PSME4 | PSME4 | 5630 | 0.027 | 0.55 | NO |
| 212 | ANAPC10 | ANAPC10 | ANAPC10 | 5665 | 0.026 | 0.55 | NO |
| 213 | PSMC4 | PSMC4 | PSMC4 | 5669 | 0.026 | 0.55 | NO |
| 214 | DHFR | DHFR | DHFR | 5672 | 0.026 | 0.55 | NO |
| 215 | TFDP1 | TFDP1 | TFDP1 | 5771 | 0.025 | 0.55 | NO |
| 216 | PSMA3 | PSMA3 | PSMA3 | 5831 | 0.024 | 0.54 | NO |
| 217 | PSMD4 | PSMD4 | PSMD4 | 5878 | 0.024 | 0.54 | NO |
| 218 | CENPT | CENPT | CENPT | 5884 | 0.023 | 0.54 | NO |
| 219 | CDK4 | CDK4 | CDK4 | 5928 | 0.023 | 0.54 | NO |
| 220 | CDC25B | CDC25B | CDC25B | 6043 | 0.021 | 0.54 | NO |
| 221 | PSMD10 | PSMD10 | PSMD10 | 6055 | 0.021 | 0.54 | NO |
| 222 | CDKN1A | CDKN1A | CDKN1A | 6056 | 0.021 | 0.54 | NO |
| 223 | SKA2 | SKA2 | SKA2 | 6077 | 0.021 | 0.54 | NO |
| 224 | CDKN2A | CDKN2A | CDKN2A | 6115 | 0.021 | 0.53 | NO |
| 225 | SEC13 | SEC13 | SEC13 | 6170 | 0.02 | 0.53 | NO |
| 226 | PPP2R5B | PPP2R5B | PPP2R5B | 6173 | 0.02 | 0.53 | NO |
| 227 | DYNC1H1 | DYNC1H1 | DYNC1H1 | 6188 | 0.02 | 0.53 | NO |
| 228 | PSMD3 | PSMD3 | PSMD3 | 6194 | 0.02 | 0.53 | NO |
| 229 | NUDC | NUDC | NUDC | 6225 | 0.019 | 0.53 | NO |
| 230 | CDC27 | CDC27 | CDC27 | 6249 | 0.019 | 0.53 | NO |
| 231 | PSMA2 | PSMA2 | PSMA2 | 6271 | 0.019 | 0.53 | NO |
| 232 | PSMA4 | PSMA4 | PSMA4 | 6379 | 0.018 | 0.52 | NO |
| 233 | PSMB5 | PSMB5 | PSMB5 | 6385 | 0.018 | 0.52 | NO |
| 234 | PSMB3 | PSMB3 | PSMB3 | 6437 | 0.017 | 0.52 | NO |
| 235 | SUN2 | SUN2 | SUN2 | 6458 | 0.017 | 0.52 | NO |
| 236 | NPM1 | NPM1 | NPM1 | 6558 | 0.016 | 0.52 | NO |
| 237 | NDEL1 | NDEL1 | NDEL1 | 6654 | 0.014 | 0.51 | NO |
| 238 | CLASP1 | CLASP1 | CLASP1 | 6661 | 0.014 | 0.51 | NO |
| 239 | HDAC1 | HDAC1 | HDAC1 | 6671 | 0.014 | 0.51 | NO |
| 240 | PSMB9 | PSMB9 | PSMB9 | 6695 | 0.014 | 0.51 | NO |
| 241 | E2F4 | E2F4 | E2F4 | 6720 | 0.014 | 0.51 | NO |
| 242 | PPP2R1A | PPP2R1A | PPP2R1A | 6745 | 0.014 | 0.51 | NO |
| 243 | PPP2CA | PPP2CA | PPP2CA | 6752 | 0.014 | 0.51 | NO |
| 244 | PSMB7 | PSMB7 | PSMB7 | 6763 | 0.013 | 0.51 | NO |
| 245 | SEH1L | SEH1L | SEH1L | 6823 | 0.013 | 0.51 | NO |
| 246 | DYNLL1 | DYNLL1 | DYNLL1 | 6847 | 0.012 | 0.5 | NO |
| 247 | PSMB4 | PSMB4 | PSMB4 | 6883 | 0.012 | 0.5 | NO |
| 248 | MAPRE1 | MAPRE1 | MAPRE1 | 6962 | 0.011 | 0.5 | NO |
| 249 | FGFR1OP | FGFR1OP | FGFR1OP | 6971 | 0.011 | 0.5 | NO |
| 250 | POLD2 | POLD2 | POLD2 | 7077 | 0.01 | 0.49 | NO |
| 251 | RBBP4 | RBBP4 | RBBP4 | 7143 | 0.0094 | 0.49 | NO |
| 252 | PSMD9 | PSMD9 | PSMD9 | 7162 | 0.0092 | 0.49 | NO |
| 253 | MYC | MYC | MYC | 7176 | 0.009 | 0.49 | NO |
| 254 | PSMC2 | PSMC2 | PSMC2 | 7201 | 0.0088 | 0.49 | NO |
| 255 | DCTN1 | DCTN1 | DCTN1 | 7237 | 0.0084 | 0.49 | NO |
| 256 | SMARCA5 | SMARCA5 | SMARCA5 | 7244 | 0.0083 | 0.49 | NO |
| 257 | RBBP7 | RBBP7 | RBBP7 | 7338 | 0.0073 | 0.48 | NO |
| 258 | CEP63 | CEP63 | CEP63 | 7355 | 0.0071 | 0.48 | NO |
| 259 | RAD1 | RAD1 | RAD1 | 7386 | 0.0068 | 0.48 | NO |
| 260 | PSMB8 | PSMB8 | PSMB8 | 7411 | 0.0065 | 0.48 | NO |
| 261 | CEP135 | CEP135 | CEP135 | 7416 | 0.0064 | 0.48 | NO |
| 262 | PSMC5 | PSMC5 | PSMC5 | 7439 | 0.0062 | 0.48 | NO |
| 263 | DKC1 | DKC1 | DKC1 | 7446 | 0.0061 | 0.48 | NO |
| 264 | HIST1H4A | HIST1H4A | HIST1H4A | 7530 | 0.0051 | 0.47 | NO |
| 265 | TUBA1A | TUBA1A | TUBA1A | 7597 | 0.0042 | 0.47 | NO |
| 266 | PRIM1 | PRIM1 | PRIM1 | 7684 | 0.0032 | 0.46 | NO |
| 267 | PPP2CB | PPP2CB | PPP2CB | 7803 | 0.0017 | 0.46 | NO |
| 268 | CEP192 | CEP192 | CEP192 | 7810 | 0.0016 | 0.46 | NO |
| 269 | SYNE2 | SYNE2 | SYNE2 | 7846 | 0.0012 | 0.46 | NO |
| 270 | CSNK1D | CSNK1D | CSNK1D | 7864 | 0.001 | 0.46 | NO |
| 271 | MCM3 | MCM3 | MCM3 | 8011 | -0.00046 | 0.45 | NO |
| 272 | TUBGCP2 | TUBGCP2 | TUBGCP2 | 8056 | -0.00092 | 0.44 | NO |
| 273 | PPP2R5C | PPP2R5C | PPP2R5C | 8066 | -0.00098 | 0.44 | NO |
| 274 | PSME2 | PSME2 | PSME2 | 8112 | -0.0015 | 0.44 | NO |
| 275 | ALMS1 | ALMS1 | ALMS1 | 8154 | -0.0019 | 0.44 | NO |
| 276 | LIN54 | LIN54 | LIN54 | 8197 | -0.0024 | 0.44 | NO |
| 277 | AHCTF1 | AHCTF1 | AHCTF1 | 8198 | -0.0024 | 0.44 | NO |
| 278 | PSMF1 | PSMF1 | PSMF1 | 8251 | -0.003 | 0.43 | NO |
| 279 | SKP1 | SKP1 | SKP1 | 8277 | -0.0034 | 0.43 | NO |
| 280 | TUBGCP5 | TUBGCP5 | TUBGCP5 | 8299 | -0.0037 | 0.43 | NO |
| 281 | NHP2 | NHP2 | NHP2 | 8360 | -0.0044 | 0.43 | NO |
| 282 | YWHAE | YWHAE | YWHAE | 8418 | -0.005 | 0.43 | NO |
| 283 | PSME1 | PSME1 | PSME1 | 8420 | -0.005 | 0.43 | NO |
| 284 | CDK5RAP2 | CDK5RAP2 | CDK5RAP2 | 8452 | -0.0054 | 0.42 | NO |
| 285 | NINL | NINL | NINL | 8485 | -0.0057 | 0.42 | NO |
| 286 | TERF1 | TERF1 | TERF1 | 8486 | -0.0057 | 0.42 | NO |
| 287 | E2F5 | E2F5 | E2F5 | 8487 | -0.0058 | 0.42 | NO |
| 288 | ATRIP | ATRIP | ATRIP | 8697 | -0.0079 | 0.41 | NO |
| 289 | SDCCAG8 | SDCCAG8 | SDCCAG8 | 8760 | -0.0086 | 0.41 | NO |
| 290 | TUBG2 | TUBG2 | TUBG2 | 8762 | -0.0086 | 0.41 | NO |
| 291 | ACTR1A | ACTR1A | ACTR1A | 8781 | -0.0088 | 0.41 | NO |
| 292 | FBXO5 | FBXO5 | FBXO5 | 8887 | -0.01 | 0.4 | NO |
| 293 | SMC3 | SMC3 | SMC3 | 8889 | -0.01 | 0.4 | NO |
| 294 | HUS1 | HUS1 | HUS1 | 8899 | -0.01 | 0.4 | NO |
| 295 | STAG2 | STAG2 | STAG2 | 8921 | -0.01 | 0.4 | NO |
| 296 | RPS27A | RPS27A | RPS27A | 8932 | -0.01 | 0.4 | NO |
| 297 | CEP76 | CEP76 | CEP76 | 8956 | -0.011 | 0.4 | NO |
| 298 | PPP2R5D | PPP2R5D | PPP2R5D | 8989 | -0.011 | 0.4 | NO |
| 299 | DIDO1 | DIDO1 | DIDO1 | 9010 | -0.011 | 0.4 | NO |
| 300 | CUL1 | CUL1 | CUL1 | 9026 | -0.012 | 0.4 | NO |
| 301 | RPA2 | RPA2 | RPA2 | 9089 | -0.012 | 0.39 | NO |
| 302 | CDKN1B | CDKN1B | CDKN1B | 9103 | -0.012 | 0.39 | NO |
| 303 | SSNA1 | SSNA1 | SSNA1 | 9144 | -0.013 | 0.39 | NO |
| 304 | PSMB10 | PSMB10 | PSMB10 | 9206 | -0.014 | 0.39 | NO |
| 305 | TINF2 | TINF2 | TINF2 | 9237 | -0.014 | 0.39 | NO |
| 306 | RFWD2 | RFWD2 | RFWD2 | 9287 | -0.015 | 0.39 | NO |
| 307 | PSMB1 | PSMB1 | PSMB1 | 9317 | -0.015 | 0.38 | NO |
| 308 | ANAPC7 | ANAPC7 | ANAPC7 | 9353 | -0.015 | 0.38 | NO |
| 309 | CEP164 | CEP164 | CEP164 | 9366 | -0.015 | 0.38 | NO |
| 310 | CDC16 | CDC16 | CDC16 | 9441 | -0.016 | 0.38 | NO |
| 311 | CCNH | CCNH | CCNH | 9461 | -0.016 | 0.38 | NO |
| 312 | POLA1 | POLA1 | POLA1 | 9488 | -0.017 | 0.38 | NO |
| 313 | NUP133 | NUP133 | NUP133 | 9516 | -0.017 | 0.38 | NO |
| 314 | GORASP1 | GORASP1 | GORASP1 | 9521 | -0.017 | 0.38 | NO |
| 315 | ANAPC4 | ANAPC4 | ANAPC4 | 9667 | -0.019 | 0.37 | NO |
| 316 | TP53 | TP53 | TP53 | 9714 | -0.019 | 0.37 | NO |
| 317 | POLD3 | POLD3 | POLD3 | 9730 | -0.019 | 0.37 | NO |
| 318 | PPP2R3B | PPP2R3B | PPP2R3B | 9864 | -0.021 | 0.36 | NO |
| 319 | PSMD6 | PSMD6 | PSMD6 | 9911 | -0.021 | 0.36 | NO |
| 320 | DCTN2 | DCTN2 | DCTN2 | 9995 | -0.022 | 0.36 | NO |
| 321 | OFD1 | OFD1 | OFD1 | 10006 | -0.022 | 0.36 | NO |
| 322 | CEP57 | CEP57 | CEP57 | 10044 | -0.023 | 0.35 | NO |
| 323 | PMF1 | PMF1 | PMF1 | 10065 | -0.023 | 0.35 | NO |
| 324 | PPP1CC | PPP1CC | PPP1CC | 10091 | -0.023 | 0.35 | NO |
| 325 | SMC1A | SMC1A | SMC1A | 10363 | -0.026 | 0.34 | NO |
| 326 | PSMB6 | PSMB6 | PSMB6 | 10392 | -0.026 | 0.34 | NO |
| 327 | RB1 | RB1 | RB1 | 10458 | -0.027 | 0.34 | NO |
| 328 | RBL2 | RBL2 | RBL2 | 10469 | -0.028 | 0.34 | NO |
| 329 | ANAPC5 | ANAPC5 | ANAPC5 | 10493 | -0.028 | 0.33 | NO |
| 330 | GMNN | GMNN | GMNN | 10506 | -0.028 | 0.34 | NO |
| 331 | LIN52 | LIN52 | LIN52 | 10507 | -0.028 | 0.34 | NO |
| 332 | CEP290 | CEP290 | CEP290 | 10516 | -0.028 | 0.34 | NO |
| 333 | RPA1 | RPA1 | RPA1 | 10536 | -0.028 | 0.34 | NO |
| 334 | MAX | MAX | MAX | 10558 | -0.029 | 0.34 | NO |
| 335 | HIST2H2AC | HIST2H2AC | HIST2H2AC | 10616 | -0.03 | 0.33 | NO |
| 336 | NUP43 | NUP43 | NUP43 | 10721 | -0.031 | 0.33 | NO |
| 337 | RANBP2 | RANBP2 | RANBP2 | 10769 | -0.032 | 0.33 | NO |
| 338 | TUBGCP3 | TUBGCP3 | TUBGCP3 | 11043 | -0.036 | 0.31 | NO |
| 339 | TUBGCP6 | TUBGCP6 | TUBGCP6 | 11074 | -0.036 | 0.31 | NO |
| 340 | CDKN2C | CDKN2C | CDKN2C | 11098 | -0.036 | 0.31 | NO |
| 341 | TERF2 | TERF2 | TERF2 | 11185 | -0.038 | 0.31 | NO |
| 342 | HIST1H4C | HIST1H4C | HIST1H4C | 11308 | -0.04 | 0.3 | NO |
| 343 | CDC26 | CDC26 | CDC26 | 11351 | -0.04 | 0.3 | NO |
| 344 | PRKACA | PRKACA | PRKACA | 11373 | -0.04 | 0.3 | NO |
| 345 | AKAP9 | AKAP9 | AKAP9 | 11420 | -0.041 | 0.3 | NO |
| 346 | ANAPC2 | ANAPC2 | ANAPC2 | 11466 | -0.042 | 0.3 | NO |
| 347 | UBA52 | UBA52 | UBA52 | 11476 | -0.042 | 0.3 | NO |
| 348 | DYRK1A | DYRK1A | DYRK1A | 11509 | -0.043 | 0.3 | NO |
| 349 | CENPC1 | CENPC1 | CENPC1 | 11513 | -0.043 | 0.3 | NO |
| 350 | TERF2IP | TERF2IP | TERF2IP | 11591 | -0.044 | 0.3 | NO |
| 351 | RAD17 | RAD17 | RAD17 | 11596 | -0.044 | 0.3 | NO |
| 352 | ATM | ATM | ATM | 11624 | -0.045 | 0.3 | NO |
| 353 | HIST1H2BH | HIST1H2BH | HIST1H2BH | 11661 | -0.045 | 0.3 | NO |
| 354 | PPP2R1B | PPP2R1B | PPP2R1B | 11667 | -0.046 | 0.3 | NO |
| 355 | APITD1 | APITD1 | APITD1 | 11910 | -0.05 | 0.29 | NO |
| 356 | CCND3 | CCND3 | CCND3 | 11961 | -0.051 | 0.28 | NO |
| 357 | DCTN3 | DCTN3 | DCTN3 | 12060 | -0.052 | 0.28 | NO |
| 358 | BTRC | BTRC | BTRC | 12104 | -0.053 | 0.28 | NO |
| 359 | PCM1 | PCM1 | PCM1 | 12166 | -0.054 | 0.28 | NO |
| 360 | PAFAH1B1 | PAFAH1B1 | PAFAH1B1 | 12209 | -0.055 | 0.28 | NO |
| 361 | PCNT | PCNT | PCNT | 12274 | -0.057 | 0.28 | NO |
| 362 | WRAP53 | WRAP53 | WRAP53 | 12445 | -0.06 | 0.27 | NO |
| 363 | PPP2R5A | PPP2R5A | PPP2R5A | 13073 | -0.074 | 0.24 | NO |
| 364 | B9D2 | B9D2 | B9D2 | 13178 | -0.077 | 0.23 | NO |
| 365 | NSL1 | NSL1 | NSL1 | 13249 | -0.079 | 0.23 | NO |
| 366 | CDC14A | CDC14A | CDC14A | 13905 | -0.099 | 0.2 | NO |
| 367 | MIS12 | MIS12 | MIS12 | 14114 | -0.11 | 0.19 | NO |
| 368 | RPA4 | RPA4 | RPA4 | 14716 | -0.13 | 0.16 | NO |
| 369 | RPS27 | RPS27 | RPS27 | 15001 | -0.14 | 0.15 | NO |
| 370 | CCNA1 | CCNA1 | CCNA1 | 15153 | -0.15 | 0.14 | NO |
| 371 | CCND2 | CCND2 | CCND2 | 15348 | -0.16 | 0.14 | NO |
| 372 | SYNE1 | SYNE1 | SYNE1 | 15352 | -0.16 | 0.14 | NO |
| 373 | STAG3 | STAG3 | STAG3 | 15363 | -0.16 | 0.15 | NO |
| 374 | PSMA8 | PSMA8 | PSMA8 | 16164 | -0.22 | 0.11 | NO |
| 375 | PRKAR2B | PRKAR2B | PRKAR2B | 16712 | -0.26 | 0.088 | NO |
| 376 | REC8 | REC8 | REC8 | 17109 | -0.3 | 0.075 | NO |
Figure S45. Get High-res Image This plot shows mRNAseq_cNMF expression data heatmap (on the left) a RunningEnrichmentScore(RES) plot (on the top right) and a Signal2Noise(S2N) plot (on the bottom right) of genes in the pathway: KEGG P53 SIGNALING PATHWAY.
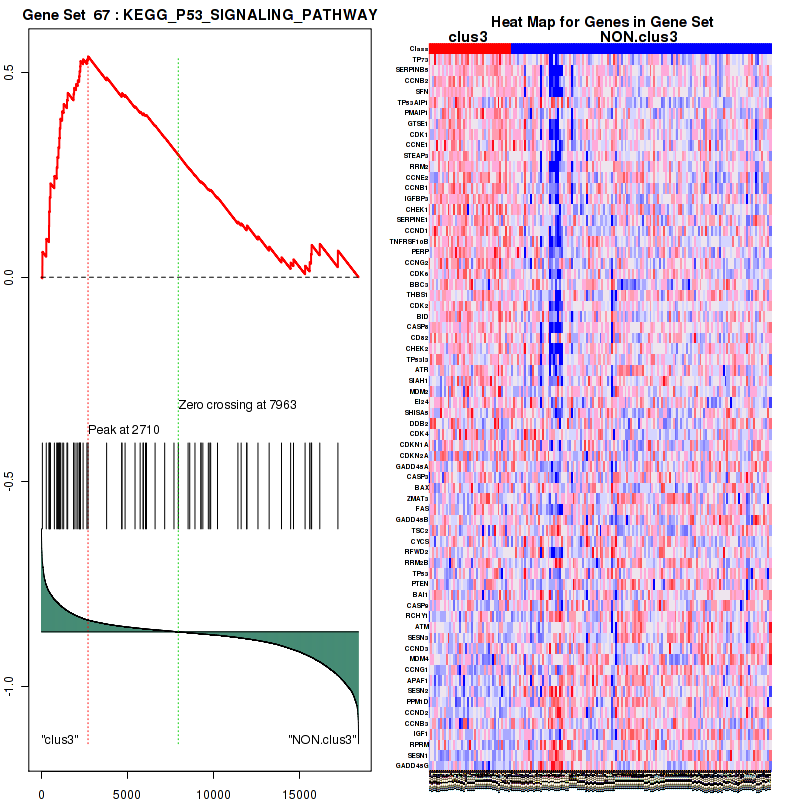
Figure S46. Get High-res Image For the top 5 core enriched genes in the pathway: KEGG P53 SIGNALING PATHWAY, this volcano plot shows how much they are up/down-regulated and significant. The significance was calculated by empirical bayesian fit

Table S24. Get Full Table This table shows a Running Enrichment Score (RES) of each gene in this pathway, that is, the enrichment score at this point in the ranked list of genes. All genes are ranked by Signal-to-Noise (S2N), a measure of similarity as default and are used to obtain ES matrix of all genes. In this way, GSEA tool uses expression pattern of not only overlapped genes but also not-overlapped genes to produce ES matrix.
| Rank | GENE | SYMBOL | DESC | LIST.LOC | S2N | RES | CORE_ENRICHMENT |
|---|---|---|---|---|---|---|---|
| 1 | IL8 | IL8 | IL8 | 730 | 0.24 | 0.04 | YES |
| 2 | LAMA3 | LAMA3 | LAMA3 | 797 | 0.23 | 0.11 | YES |
| 3 | FN1 | FN1 | FN1 | 841 | 0.22 | 0.19 | YES |
| 4 | EPHB2 | EPHB2 | EPHB2 | 1034 | 0.2 | 0.24 | YES |
| 5 | LAMA1 | LAMA1 | LAMA1 | 1036 | 0.2 | 0.31 | YES |
| 6 | ITGA2 | ITGA2 | ITGA2 | 1085 | 0.19 | 0.37 | YES |
| 7 | CAV2 | CAV2 | CAV2 | 1377 | 0.16 | 0.41 | YES |
| 8 | CSF2 | CSF2 | CSF2 | 1392 | 0.16 | 0.46 | YES |
| 9 | MMP2 | MMP2 | MMP2 | 1406 | 0.16 | 0.52 | YES |
| 10 | ITGA5 | ITGA5 | ITGA5 | 1466 | 0.16 | 0.57 | YES |
| 11 | RASA1 | RASA1 | RASA1 | 2308 | 0.1 | 0.56 | YES |
| 12 | EZR | EZR | EZR | 2420 | 0.097 | 0.58 | YES |
| 13 | ITGB1 | ITGB1 | ITGB1 | 2633 | 0.089 | 0.6 | YES |
| 14 | TGFB1 | TGFB1 | TGFB1 | 2669 | 0.087 | 0.63 | YES |
| 15 | SRC | SRC | SRC | 4208 | 0.048 | 0.56 | NO |
| 16 | HRAS | HRAS | HRAS | 4413 | 0.045 | 0.56 | NO |
| 17 | MAPK8 | MAPK8 | MAPK8 | 5036 | 0.035 | 0.54 | NO |
| 18 | NF1 | NF1 | NF1 | 5659 | 0.026 | 0.52 | NO |
| 19 | RHOA | RHOA | RHOA | 5695 | 0.026 | 0.52 | NO |
| 20 | CASK | CASK | CASK | 5952 | 0.022 | 0.52 | NO |
| 21 | KNG1 | KNG1 | KNG1 | 6407 | 0.017 | 0.5 | NO |
| 22 | MAPK3 | MAPK3 | MAPK3 | 7034 | 0.011 | 0.47 | NO |
| 23 | CASP3 | CASP3 | CASP3 | 7174 | 0.009 | 0.46 | NO |
| 24 | BAX | BAX | BAX | 7713 | 0.0028 | 0.44 | NO |
| 25 | MAPK1 | MAPK1 | MAPK1 | 8193 | -0.0023 | 0.41 | NO |
| 26 | SDCBP | SDCBP | SDCBP | 8262 | -0.0031 | 0.41 | NO |
| 27 | GNB2L1 | GNB2L1 | GNB2L1 | 8862 | -0.0097 | 0.38 | NO |
| 28 | SDC2 | SDC2 | SDC2 | 10818 | -0.032 | 0.28 | NO |
| 29 | PRKCD | PRKCD | PRKCD | 10892 | -0.034 | 0.29 | NO |
| 30 | PRKACA | PRKACA | PRKACA | 11373 | -0.04 | 0.28 | NO |
| 31 | TRAPPC4 | TRAPPC4 | TRAPPC4 | 11782 | -0.048 | 0.27 | NO |
| 32 | EPB41 | EPB41 | EPB41 | 13870 | -0.098 | 0.19 | NO |
| 33 | TNFRSF13B | TNFRSF13B | TNFRSF13B | 15544 | -0.18 | 0.16 | NO |
Figure S47. Get High-res Image This plot shows mRNAseq_cNMF expression data heatmap (on the left) a RunningEnrichmentScore(RES) plot (on the top right) and a Signal2Noise(S2N) plot (on the bottom right) of genes in the pathway: BIOCARTA RACCYCD PATHWAY.
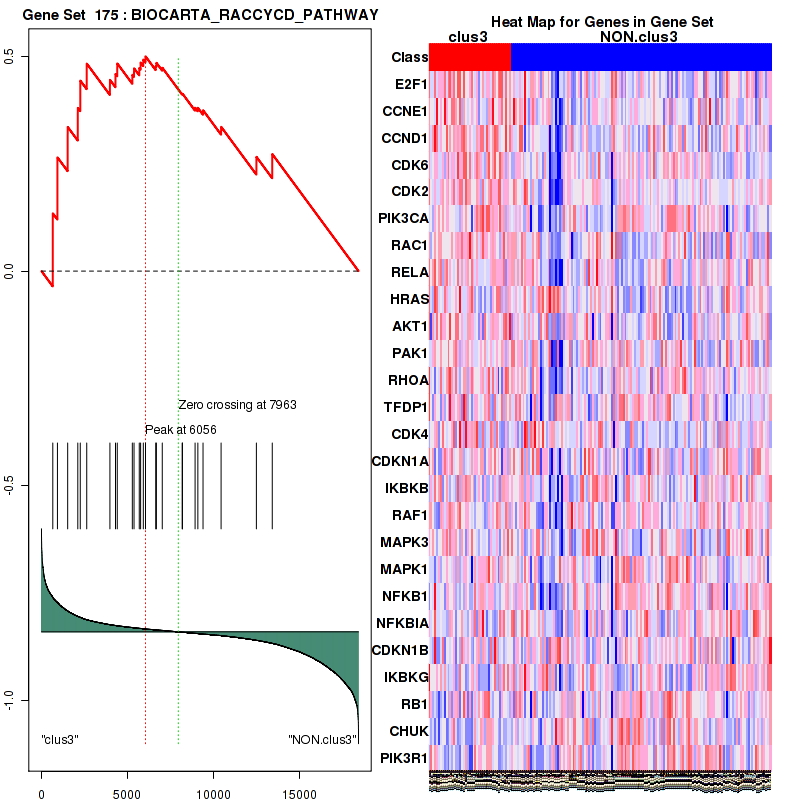
Figure S48. Get High-res Image For the top 5 core enriched genes in the pathway: BIOCARTA RACCYCD PATHWAY, this volcano plot shows how much they are up/down-regulated and significant. The significance was calculated by empirical bayesian fit
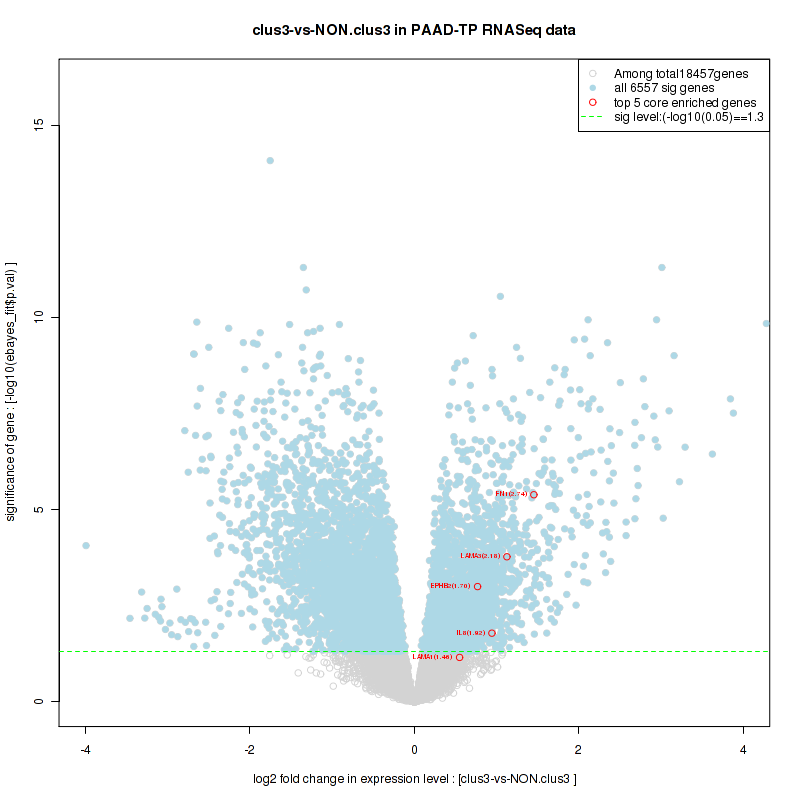
Table S25. Get Full Table This table shows a Running Enrichment Score (RES) of each gene in this pathway, that is, the enrichment score at this point in the ranked list of genes. All genes are ranked by Signal-to-Noise (S2N), a measure of similarity as default and are used to obtain ES matrix of all genes. In this way, GSEA tool uses expression pattern of not only overlapped genes but also not-overlapped genes to produce ES matrix.
| Rank | GENE | SYMBOL | DESC | LIST.LOC | S2N | RES | CORE_ENRICHMENT |
|---|---|---|---|---|---|---|---|
| 1 | TP73 | TP73 | TP73 | 54 | 0.5 | 0.062 | YES |
| 2 | SERPINB5 | SERPINB5 | SERPINB5 | 281 | 0.34 | 0.094 | YES |
| 3 | CCNB2 | CCNB2 | CCNB2 | 440 | 0.3 | 0.12 | YES |
| 4 | SFN | SFN | SFN | 450 | 0.29 | 0.16 | YES |
| 5 | TP53AIP1 | TP53AIP1 | TP53AIP1 | 484 | 0.28 | 0.2 | YES |
| 6 | PMAIP1 | PMAIP1 | PMAIP1 | 524 | 0.28 | 0.23 | YES |
| 7 | GTSE1 | GTSE1 | GTSE1 | 752 | 0.24 | 0.25 | YES |
| 8 | CDK1 | CDK1 | CDK1 | 888 | 0.22 | 0.27 | YES |
| 9 | CCNE1 | CCNE1 | CCNE1 | 930 | 0.22 | 0.29 | YES |
| 10 | STEAP3 | STEAP3 | STEAP3 | 989 | 0.21 | 0.32 | YES |
| 11 | RRM2 | RRM2 | RRM2 | 1040 | 0.2 | 0.34 | YES |
| 12 | CCNE2 | CCNE2 | CCNE2 | 1067 | 0.2 | 0.36 | YES |
| 13 | CCNB1 | CCNB1 | CCNB1 | 1102 | 0.19 | 0.39 | YES |
| 14 | IGFBP3 | IGFBP3 | IGFBP3 | 1206 | 0.18 | 0.41 | YES |
| 15 | CHEK1 | CHEK1 | CHEK1 | 1292 | 0.17 | 0.42 | YES |
| 16 | SERPINE1 | SERPINE1 | SERPINE1 | 1486 | 0.16 | 0.43 | YES |
| 17 | CCND1 | CCND1 | CCND1 | 1526 | 0.15 | 0.45 | YES |
| 18 | TNFRSF10B | TNFRSF10B | TNFRSF10B | 1869 | 0.13 | 0.45 | YES |
| 19 | PERP | PERP | PERP | 1900 | 0.12 | 0.46 | YES |
| 20 | CCNG2 | CCNG2 | CCNG2 | 2013 | 0.12 | 0.47 | YES |
| 21 | CDK6 | CDK6 | CDK6 | 2115 | 0.11 | 0.48 | YES |
| 22 | BBC3 | BBC3 | BBC3 | 2198 | 0.11 | 0.49 | YES |
| 23 | THBS1 | THBS1 | THBS1 | 2218 | 0.11 | 0.5 | YES |
| 24 | CDK2 | CDK2 | CDK2 | 2260 | 0.11 | 0.52 | YES |
| 25 | BID | BID | BID | 2271 | 0.1 | 0.53 | YES |
| 26 | CASP8 | CASP8 | CASP8 | 2423 | 0.097 | 0.53 | YES |
| 27 | CD82 | CD82 | CD82 | 2646 | 0.088 | 0.53 | YES |
| 28 | CHEK2 | CHEK2 | CHEK2 | 2710 | 0.086 | 0.54 | YES |
| 29 | TP53I3 | TP53I3 | TP53I3 | 3794 | 0.057 | 0.49 | NO |
| 30 | ATR | ATR | ATR | 4674 | 0.04 | 0.45 | NO |
| 31 | SIAH1 | SIAH1 | SIAH1 | 4688 | 0.04 | 0.45 | NO |
| 32 | MDM2 | MDM2 | MDM2 | 4867 | 0.037 | 0.44 | NO |
| 33 | EI24 | EI24 | EI24 | 5445 | 0.029 | 0.42 | NO |
| 34 | SHISA5 | SHISA5 | SHISA5 | 5744 | 0.025 | 0.4 | NO |
| 35 | DDB2 | DDB2 | DDB2 | 5915 | 0.023 | 0.4 | NO |
| 36 | CDK4 | CDK4 | CDK4 | 5928 | 0.023 | 0.4 | NO |
| 37 | CDKN1A | CDKN1A | CDKN1A | 6056 | 0.021 | 0.4 | NO |
| 38 | CDKN2A | CDKN2A | CDKN2A | 6115 | 0.021 | 0.4 | NO |
| 39 | GADD45A | GADD45A | GADD45A | 6614 | 0.015 | 0.37 | NO |
| 40 | CASP3 | CASP3 | CASP3 | 7174 | 0.009 | 0.34 | NO |
| 41 | BAX | BAX | BAX | 7713 | 0.0028 | 0.31 | NO |
| 42 | ZMAT3 | ZMAT3 | ZMAT3 | 7967 | -0.000038 | 0.3 | NO |
| 43 | FAS | FAS | FAS | 8537 | -0.0062 | 0.27 | NO |
| 44 | GADD45B | GADD45B | GADD45B | 8631 | -0.0072 | 0.26 | NO |
| 45 | TSC2 | TSC2 | TSC2 | 8937 | -0.011 | 0.25 | NO |
| 46 | CYCS | CYCS | CYCS | 9285 | -0.015 | 0.23 | NO |
| 47 | RFWD2 | RFWD2 | RFWD2 | 9287 | -0.015 | 0.23 | NO |
| 48 | RRM2B | RRM2B | RRM2B | 9396 | -0.016 | 0.23 | NO |
| 49 | TP53 | TP53 | TP53 | 9714 | -0.019 | 0.22 | NO |
| 50 | PTEN | PTEN | PTEN | 9804 | -0.02 | 0.21 | NO |
| 51 | BAI1 | BAI1 | BAI1 | 9851 | -0.02 | 0.21 | NO |
| 52 | CASP9 | CASP9 | CASP9 | 10248 | -0.025 | 0.2 | NO |
| 53 | RCHY1 | RCHY1 | RCHY1 | 11436 | -0.042 | 0.14 | NO |
| 54 | ATM | ATM | ATM | 11624 | -0.045 | 0.13 | NO |
| 55 | SESN3 | SESN3 | SESN3 | 11947 | -0.05 | 0.12 | NO |
| 56 | CCND3 | CCND3 | CCND3 | 11961 | -0.051 | 0.13 | NO |
| 57 | MDM4 | MDM4 | MDM4 | 12605 | -0.063 | 0.1 | NO |
| 58 | CCNG1 | CCNG1 | CCNG1 | 13254 | -0.079 | 0.075 | NO |
| 59 | APAF1 | APAF1 | APAF1 | 13974 | -0.1 | 0.049 | NO |
| 60 | SESN2 | SESN2 | SESN2 | 14505 | -0.12 | 0.036 | NO |
| 61 | PPM1D | PPM1D | PPM1D | 14671 | -0.13 | 0.044 | NO |
| 62 | CCND2 | CCND2 | CCND2 | 15348 | -0.16 | 0.028 | NO |
| 63 | CCNB3 | CCNB3 | CCNB3 | 15614 | -0.18 | 0.037 | NO |
| 64 | IGF1 | IGF1 | IGF1 | 15695 | -0.18 | 0.057 | NO |
| 65 | RPRM | RPRM | RPRM | 15727 | -0.19 | 0.079 | NO |
| 66 | SESN1 | SESN1 | SESN1 | 16201 | -0.22 | 0.082 | NO |
| 67 | GADD45G | GADD45G | GADD45G | 17256 | -0.32 | 0.065 | NO |
Figure S49. Get High-res Image This plot shows mRNAseq_cNMF expression data heatmap (on the left) a RunningEnrichmentScore(RES) plot (on the top right) and a Signal2Noise(S2N) plot (on the bottom right) of genes in the pathway: PID P73PATHWAY.
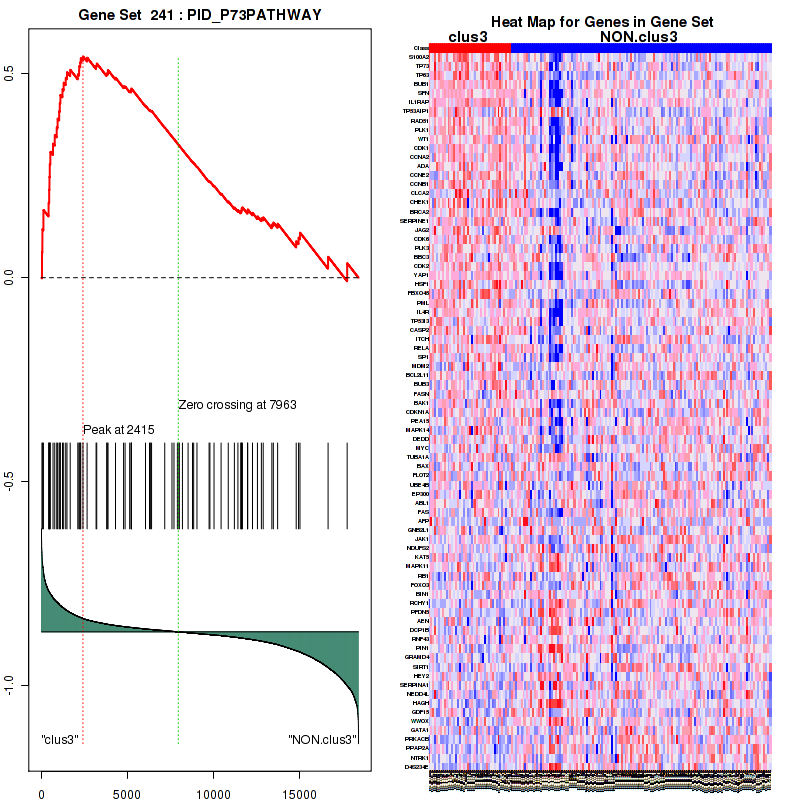
Figure S50. Get High-res Image For the top 5 core enriched genes in the pathway: PID P73PATHWAY, this volcano plot shows how much they are up/down-regulated and significant. The significance was calculated by empirical bayesian fit
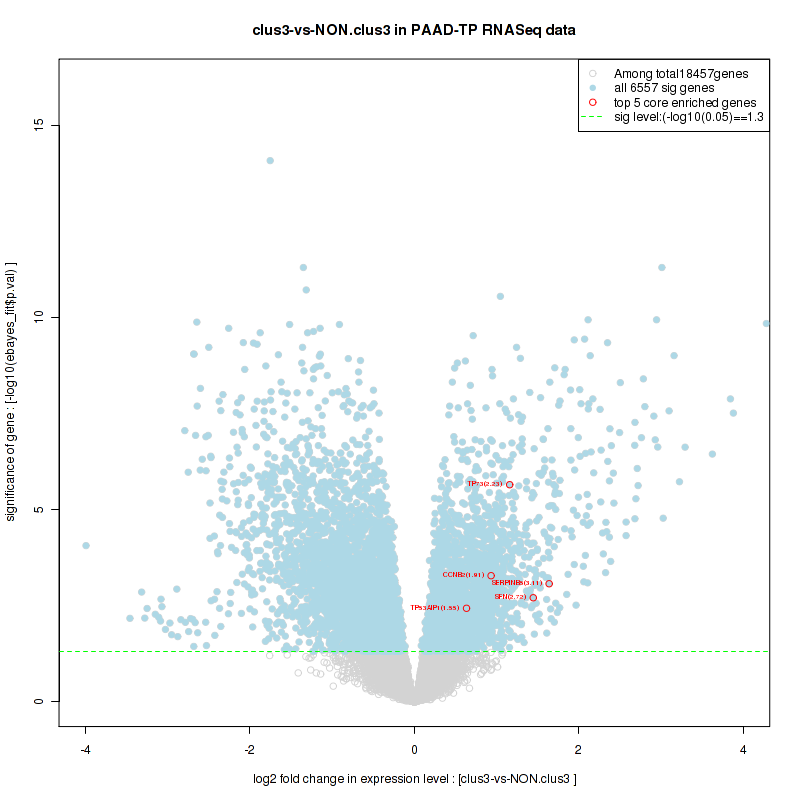
Table S26. Get Full Table This table shows a Running Enrichment Score (RES) of each gene in this pathway, that is, the enrichment score at this point in the ranked list of genes. All genes are ranked by Signal-to-Noise (S2N), a measure of similarity as default and are used to obtain ES matrix of all genes. In this way, GSEA tool uses expression pattern of not only overlapped genes but also not-overlapped genes to produce ES matrix.
| Rank | GENE | SYMBOL | DESC | LIST.LOC | S2N | RES | CORE_ENRICHMENT |
|---|---|---|---|---|---|---|---|
| 1 | KIF18A | KIF18A | KIF18A | 148 | 0.41 | 0.0084 | YES |
| 2 | SPC24 | SPC24 | SPC24 | 165 | 0.4 | 0.024 | YES |
| 3 | CDC25C | CDC25C | CDC25C | 214 | 0.37 | 0.036 | YES |
| 4 | BIRC5 | BIRC5 | BIRC5 | 220 | 0.37 | 0.05 | YES |
| 5 | MCM10 | MCM10 | MCM10 | 250 | 0.35 | 0.063 | YES |
| 6 | CENPA | CENPA | CENPA | 263 | 0.35 | 0.076 | YES |
| 7 | CENPI | CENPI | CENPI | 269 | 0.34 | 0.09 | YES |
| 8 | NEK2 | NEK2 | NEK2 | 278 | 0.34 | 0.1 | YES |
| 9 | KIF20A | KIF20A | KIF20A | 300 | 0.34 | 0.12 | YES |
| 10 | UBE2C | UBE2C | UBE2C | 333 | 0.32 | 0.13 | YES |
| 11 | SGOL1 | SGOL1 | SGOL1 | 335 | 0.32 | 0.14 | YES |
| 12 | PKMYT1 | PKMYT1 | PKMYT1 | 350 | 0.32 | 0.15 | YES |
| 13 | KIF23 | KIF23 | KIF23 | 354 | 0.32 | 0.16 | YES |
| 14 | CDC45 | CDC45 | CDC45 | 373 | 0.31 | 0.18 | YES |
| 15 | CDC20 | CDC20 | CDC20 | 395 | 0.3 | 0.19 | YES |
| 16 | KIF2C | KIF2C | KIF2C | 401 | 0.3 | 0.2 | YES |
| 17 | ERCC6L | ERCC6L | ERCC6L | 407 | 0.3 | 0.21 | YES |
| 18 | BUB1 | BUB1 | BUB1 | 416 | 0.3 | 0.22 | YES |
| 19 | CCNB2 | CCNB2 | CCNB2 | 440 | 0.3 | 0.23 | YES |
| 20 | CENPK | CENPK | CENPK | 449 | 0.29 | 0.24 | YES |
| 21 | PLK4 | PLK4 | PLK4 | 542 | 0.27 | 0.25 | YES |
| 22 | CASC5 | CASC5 | CASC5 | 584 | 0.27 | 0.26 | YES |
| 23 | BUB1B | BUB1B | BUB1B | 608 | 0.26 | 0.27 | YES |
| 24 | AURKB | AURKB | AURKB | 625 | 0.26 | 0.28 | YES |
| 25 | MYBL2 | MYBL2 | MYBL2 | 632 | 0.26 | 0.29 | YES |
| 26 | E2F1 | E2F1 | E2F1 | 659 | 0.25 | 0.3 | YES |
| 27 | NUF2 | NUF2 | NUF2 | 664 | 0.25 | 0.31 | YES |
| 28 | PLK1 | PLK1 | PLK1 | 672 | 0.25 | 0.32 | YES |
| 29 | CDC6 | CDC6 | CDC6 | 762 | 0.24 | 0.32 | YES |
| 30 | CDT1 | CDT1 | CDT1 | 771 | 0.23 | 0.33 | YES |
| 31 | POLE2 | POLE2 | POLE2 | 857 | 0.22 | 0.33 | YES |
| 32 | GINS4 | GINS4 | GINS4 | 875 | 0.22 | 0.34 | YES |
| 33 | AURKA | AURKA | AURKA | 877 | 0.22 | 0.35 | YES |
| 34 | PTTG1 | PTTG1 | PTTG1 | 884 | 0.22 | 0.36 | YES |
| 35 | CDK1 | CDK1 | CDK1 | 888 | 0.22 | 0.37 | YES |
| 36 | CCNE1 | CCNE1 | CCNE1 | 930 | 0.22 | 0.37 | YES |
| 37 | CCNA2 | CCNA2 | CCNA2 | 939 | 0.21 | 0.38 | YES |
| 38 | NDC80 | NDC80 | NDC80 | 979 | 0.21 | 0.39 | YES |
| 39 | SKA1 | SKA1 | SKA1 | 993 | 0.21 | 0.4 | YES |
| 40 | MCM2 | MCM2 | MCM2 | 1030 | 0.2 | 0.4 | YES |
| 41 | RRM2 | RRM2 | RRM2 | 1040 | 0.2 | 0.41 | YES |
| 42 | CCNE2 | CCNE2 | CCNE2 | 1067 | 0.2 | 0.42 | YES |
| 43 | GINS2 | GINS2 | GINS2 | 1087 | 0.19 | 0.42 | YES |
| 44 | MCM4 | MCM4 | MCM4 | 1089 | 0.19 | 0.43 | YES |
| 45 | MAD2L1 | MAD2L1 | MAD2L1 | 1091 | 0.19 | 0.44 | YES |
| 46 | CCNB1 | CCNB1 | CCNB1 | 1102 | 0.19 | 0.45 | YES |
| 47 | GINS1 | GINS1 | GINS1 | 1126 | 0.19 | 0.45 | YES |
| 48 | CDCA8 | CDCA8 | CDCA8 | 1135 | 0.19 | 0.46 | YES |
| 49 | CENPM | CENPM | CENPM | 1250 | 0.18 | 0.46 | YES |
| 50 | KNTC1 | KNTC1 | KNTC1 | 1299 | 0.17 | 0.46 | YES |
| 51 | SGOL2 | SGOL2 | SGOL2 | 1338 | 0.17 | 0.47 | YES |
| 52 | RFC4 | RFC4 | RFC4 | 1365 | 0.17 | 0.48 | YES |
| 53 | MLF1IP | MLF1IP | MLF1IP | 1380 | 0.16 | 0.48 | YES |
| 54 | CENPH | CENPH | CENPH | 1442 | 0.16 | 0.48 | YES |
| 55 | CCND1 | CCND1 | CCND1 | 1526 | 0.15 | 0.48 | YES |
| 56 | ZWINT | ZWINT | ZWINT | 1606 | 0.15 | 0.49 | YES |
| 57 | CKS1B | CKS1B | CKS1B | 1615 | 0.14 | 0.49 | YES |
| 58 | TYMS | TYMS | TYMS | 1647 | 0.14 | 0.5 | YES |
| 59 | SPC25 | SPC25 | SPC25 | 1784 | 0.13 | 0.49 | YES |
| 60 | DNA2 | DNA2 | DNA2 | 2018 | 0.12 | 0.49 | YES |
| 61 | CDC25A | CDC25A | CDC25A | 2038 | 0.12 | 0.49 | YES |
| 62 | INCENP | INCENP | INCENP | 2105 | 0.11 | 0.49 | YES |
| 63 | WEE1 | WEE1 | WEE1 | 2106 | 0.11 | 0.5 | YES |
| 64 | CDK6 | CDK6 | CDK6 | 2115 | 0.11 | 0.5 | YES |
| 65 | CCDC99 | CCDC99 | CCDC99 | 2153 | 0.11 | 0.5 | YES |
| 66 | CENPN | CENPN | CENPN | 2235 | 0.11 | 0.5 | YES |
| 67 | CDK2 | CDK2 | CDK2 | 2260 | 0.11 | 0.5 | YES |
| 68 | E2F2 | E2F2 | E2F2 | 2298 | 0.1 | 0.51 | YES |
| 69 | ZWILCH | ZWILCH | ZWILCH | 2371 | 0.1 | 0.51 | YES |
| 70 | MNAT1 | MNAT1 | MNAT1 | 2403 | 0.098 | 0.51 | YES |
| 71 | CENPO | CENPO | CENPO | 2424 | 0.097 | 0.51 | YES |
| 72 | TUBA4A | TUBA4A | TUBA4A | 2427 | 0.097 | 0.52 | YES |
| 73 | RFC2 | RFC2 | RFC2 | 2435 | 0.097 | 0.52 | YES |
| 74 | POLD1 | POLD1 | POLD1 | 2510 | 0.094 | 0.52 | YES |
| 75 | NUP107 | NUP107 | NUP107 | 2554 | 0.092 | 0.52 | YES |
| 76 | LIN9 | LIN9 | LIN9 | 2577 | 0.09 | 0.52 | YES |
| 77 | E2F3 | E2F3 | E2F3 | 2606 | 0.09 | 0.52 | YES |
| 78 | PSMD2 | PSMD2 | PSMD2 | 2609 | 0.089 | 0.53 | YES |
| 79 | RBL1 | RBL1 | RBL1 | 2663 | 0.087 | 0.53 | YES |
| 80 | CSNK1E | CSNK1E | CSNK1E | 2670 | 0.087 | 0.53 | YES |
| 81 | MCM7 | MCM7 | MCM7 | 2678 | 0.087 | 0.54 | YES |
| 82 | CDC7 | CDC7 | CDC7 | 2696 | 0.086 | 0.54 | YES |
| 83 | RCC2 | RCC2 | RCC2 | 2753 | 0.084 | 0.54 | YES |
| 84 | AZI1 | AZI1 | AZI1 | 2760 | 0.084 | 0.54 | YES |
| 85 | FEN1 | FEN1 | FEN1 | 2771 | 0.084 | 0.54 | YES |
| 86 | CENPJ | CENPJ | CENPJ | 2823 | 0.082 | 0.54 | YES |
| 87 | DSN1 | DSN1 | DSN1 | 2848 | 0.082 | 0.55 | YES |
| 88 | PSMD14 | PSMD14 | PSMD14 | 2871 | 0.081 | 0.55 | YES |
| 89 | MCM6 | MCM6 | MCM6 | 2932 | 0.079 | 0.55 | YES |
| 90 | CDKN2B | CDKN2B | CDKN2B | 2966 | 0.078 | 0.55 | YES |
| 91 | NUP85 | NUP85 | NUP85 | 3129 | 0.073 | 0.54 | YES |
| 92 | PRIM2 | PRIM2 | PRIM2 | 3200 | 0.071 | 0.54 | YES |
| 93 | MCM8 | MCM8 | MCM8 | 3214 | 0.071 | 0.55 | YES |
| 94 | CENPL | CENPL | CENPL | 3241 | 0.07 | 0.55 | YES |
| 95 | CENPP | CENPP | CENPP | 3309 | 0.068 | 0.55 | YES |
| 96 | PSMD12 | PSMD12 | PSMD12 | 3311 | 0.068 | 0.55 | YES |
| 97 | TUBB | TUBB | TUBB | 3374 | 0.067 | 0.55 | YES |
| 98 | CDKN2D | CDKN2D | CDKN2D | 3379 | 0.067 | 0.55 | YES |
| 99 | RPA3 | RPA3 | RPA3 | 3390 | 0.067 | 0.55 | YES |
| 100 | MCM5 | MCM5 | MCM5 | 3395 | 0.067 | 0.55 | YES |
| 101 | CKAP5 | CKAP5 | CKAP5 | 3467 | 0.065 | 0.55 | YES |
| 102 | SKP2 | SKP2 | SKP2 | 3471 | 0.065 | 0.56 | YES |
| 103 | RANGAP1 | RANGAP1 | RANGAP1 | 3562 | 0.062 | 0.55 | YES |
| 104 | RFC5 | RFC5 | RFC5 | 3577 | 0.062 | 0.56 | YES |
| 105 | PPP2R2A | PPP2R2A | PPP2R2A | 3596 | 0.061 | 0.56 | YES |
| 106 | CDK7 | CDK7 | CDK7 | 3599 | 0.061 | 0.56 | YES |
| 107 | PSMD7 | PSMD7 | PSMD7 | 3660 | 0.06 | 0.56 | YES |
| 108 | UBE2E1 | UBE2E1 | UBE2E1 | 3695 | 0.059 | 0.56 | YES |
| 109 | PSMD11 | PSMD11 | PSMD11 | 3713 | 0.058 | 0.56 | YES |
| 110 | TAOK1 | TAOK1 | TAOK1 | 3723 | 0.058 | 0.56 | YES |
| 111 | NUP37 | NUP37 | NUP37 | 3731 | 0.058 | 0.56 | YES |
| 112 | LIG1 | LIG1 | LIG1 | 3804 | 0.056 | 0.56 | NO |
| 113 | XPO1 | XPO1 | XPO1 | 3930 | 0.054 | 0.56 | NO |
| 114 | DYNC1I2 | DYNC1I2 | DYNC1I2 | 4015 | 0.052 | 0.55 | NO |
| 115 | PSMA1 | PSMA1 | PSMA1 | 4051 | 0.051 | 0.55 | NO |
| 116 | ZW10 | ZW10 | ZW10 | 4053 | 0.051 | 0.56 | NO |
| 117 | ANAPC11 | ANAPC11 | ANAPC11 | 4073 | 0.051 | 0.56 | NO |
| 118 | YWHAG | YWHAG | YWHAG | 4091 | 0.05 | 0.56 | NO |
| 119 | TUBG1 | TUBG1 | TUBG1 | 4092 | 0.05 | 0.56 | NO |
| 120 | HSP90AA1 | HSP90AA1 | HSP90AA1 | 4138 | 0.05 | 0.56 | NO |
| 121 | POLD4 | POLD4 | POLD4 | 4167 | 0.049 | 0.56 | NO |
| 122 | PCNA | PCNA | PCNA | 4202 | 0.048 | 0.56 | NO |
| 123 | TK2 | TK2 | TK2 | 4225 | 0.048 | 0.56 | NO |
| 124 | PSMB2 | PSMB2 | PSMB2 | 4258 | 0.047 | 0.56 | NO |
| 125 | PSMA7 | PSMA7 | PSMA7 | 4327 | 0.046 | 0.56 | NO |
| 126 | DBF4 | DBF4 | DBF4 | 4330 | 0.046 | 0.56 | NO |
| 127 | RFC3 | RFC3 | RFC3 | 4368 | 0.045 | 0.56 | NO |
| 128 | ANAPC1 | ANAPC1 | ANAPC1 | 4384 | 0.045 | 0.56 | NO |
| 129 | PSMA5 | PSMA5 | PSMA5 | 4401 | 0.045 | 0.56 | NO |
| 130 | CENPQ | CENPQ | CENPQ | 4447 | 0.044 | 0.56 | NO |
| 131 | LIN37 | LIN37 | LIN37 | 4497 | 0.043 | 0.56 | NO |
| 132 | RAD21 | RAD21 | RAD21 | 4525 | 0.043 | 0.56 | NO |
| 133 | PSMA6 | PSMA6 | PSMA6 | 4582 | 0.042 | 0.56 | NO |
| 134 | NUMA1 | NUMA1 | NUMA1 | 4615 | 0.041 | 0.56 | NO |
| 135 | UBE2D1 | UBE2D1 | UBE2D1 | 4616 | 0.041 | 0.56 | NO |
| 136 | MAD1L1 | MAD1L1 | MAD1L1 | 4667 | 0.04 | 0.56 | NO |
| 137 | CLIP1 | CLIP1 | CLIP1 | 4673 | 0.04 | 0.56 | NO |
| 138 | PPP2R5E | PPP2R5E | PPP2R5E | 4701 | 0.04 | 0.56 | NO |
| 139 | POLA2 | POLA2 | POLA2 | 4740 | 0.039 | 0.56 | NO |
| 140 | PSMD8 | PSMD8 | PSMD8 | 4821 | 0.038 | 0.56 | NO |
| 141 | STAG1 | STAG1 | STAG1 | 4835 | 0.038 | 0.56 | NO |
| 142 | NEDD1 | NEDD1 | NEDD1 | 4879 | 0.037 | 0.56 | NO |
| 143 | ITGB3BP | ITGB3BP | ITGB3BP | 4881 | 0.037 | 0.56 | NO |
| 144 | CETN2 | CETN2 | CETN2 | 4960 | 0.036 | 0.56 | NO |
| 145 | CEP250 | CEP250 | CEP250 | 5045 | 0.035 | 0.55 | NO |
| 146 | PSMD13 | PSMD13 | PSMD13 | 5082 | 0.034 | 0.55 | NO |
| 147 | POLE | POLE | POLE | 5120 | 0.034 | 0.55 | NO |
| 148 | CEP70 | CEP70 | CEP70 | 5156 | 0.033 | 0.55 | NO |
| 149 | CEP72 | CEP72 | CEP72 | 5180 | 0.033 | 0.55 | NO |
| 150 | PSMC3 | PSMC3 | PSMC3 | 5187 | 0.033 | 0.55 | NO |
| 151 | BUB3 | BUB3 | BUB3 | 5218 | 0.032 | 0.55 | NO |
| 152 | PSMC1 | PSMC1 | PSMC1 | 5255 | 0.032 | 0.55 | NO |
| 153 | PSMD1 | PSMD1 | PSMD1 | 5280 | 0.032 | 0.55 | NO |
| 154 | PSMC6 | PSMC6 | PSMC6 | 5442 | 0.029 | 0.54 | NO |
| 155 | HAUS2 | HAUS2 | HAUS2 | 5457 | 0.029 | 0.55 | NO |
| 156 | CDC23 | CDC23 | CDC23 | 5505 | 0.028 | 0.54 | NO |
| 157 | KIF2A | KIF2A | KIF2A | 5545 | 0.028 | 0.54 | NO |
| 158 | PSMD5 | PSMD5 | PSMD5 | 5561 | 0.028 | 0.54 | NO |
| 159 | PSME4 | PSME4 | PSME4 | 5630 | 0.027 | 0.54 | NO |
| 160 | ANAPC10 | ANAPC10 | ANAPC10 | 5665 | 0.026 | 0.54 | NO |
| 161 | PSMC4 | PSMC4 | PSMC4 | 5669 | 0.026 | 0.54 | NO |
| 162 | DHFR | DHFR | DHFR | 5672 | 0.026 | 0.54 | NO |
| 163 | TFDP1 | TFDP1 | TFDP1 | 5771 | 0.025 | 0.54 | NO |
| 164 | PSMA3 | PSMA3 | PSMA3 | 5831 | 0.024 | 0.53 | NO |
| 165 | PSMD4 | PSMD4 | PSMD4 | 5878 | 0.024 | 0.53 | NO |
| 166 | CENPT | CENPT | CENPT | 5884 | 0.023 | 0.53 | NO |
| 167 | CDK4 | CDK4 | CDK4 | 5928 | 0.023 | 0.53 | NO |
| 168 | CDC25B | CDC25B | CDC25B | 6043 | 0.021 | 0.53 | NO |
| 169 | PSMD10 | PSMD10 | PSMD10 | 6055 | 0.021 | 0.53 | NO |
| 170 | CDKN1A | CDKN1A | CDKN1A | 6056 | 0.021 | 0.53 | NO |
| 171 | SKA2 | SKA2 | SKA2 | 6077 | 0.021 | 0.53 | NO |
| 172 | CDKN2A | CDKN2A | CDKN2A | 6115 | 0.021 | 0.53 | NO |
| 173 | SEC13 | SEC13 | SEC13 | 6170 | 0.02 | 0.52 | NO |
| 174 | PPP2R5B | PPP2R5B | PPP2R5B | 6173 | 0.02 | 0.52 | NO |
| 175 | DYNC1H1 | DYNC1H1 | DYNC1H1 | 6188 | 0.02 | 0.52 | NO |
| 176 | PSMD3 | PSMD3 | PSMD3 | 6194 | 0.02 | 0.52 | NO |
| 177 | NUDC | NUDC | NUDC | 6225 | 0.019 | 0.52 | NO |
| 178 | CDC27 | CDC27 | CDC27 | 6249 | 0.019 | 0.52 | NO |
| 179 | PSMA2 | PSMA2 | PSMA2 | 6271 | 0.019 | 0.52 | NO |
| 180 | PSMA4 | PSMA4 | PSMA4 | 6379 | 0.018 | 0.52 | NO |
| 181 | PSMB5 | PSMB5 | PSMB5 | 6385 | 0.018 | 0.52 | NO |
| 182 | PSMB3 | PSMB3 | PSMB3 | 6437 | 0.017 | 0.52 | NO |
| 183 | NDEL1 | NDEL1 | NDEL1 | 6654 | 0.014 | 0.5 | NO |
| 184 | CLASP1 | CLASP1 | CLASP1 | 6661 | 0.014 | 0.5 | NO |
| 185 | HDAC1 | HDAC1 | HDAC1 | 6671 | 0.014 | 0.5 | NO |
| 186 | PSMB9 | PSMB9 | PSMB9 | 6695 | 0.014 | 0.5 | NO |
| 187 | E2F4 | E2F4 | E2F4 | 6720 | 0.014 | 0.5 | NO |
| 188 | PPP2R1A | PPP2R1A | PPP2R1A | 6745 | 0.014 | 0.5 | NO |
| 189 | PPP2CA | PPP2CA | PPP2CA | 6752 | 0.014 | 0.5 | NO |
| 190 | PSMB7 | PSMB7 | PSMB7 | 6763 | 0.013 | 0.5 | NO |
| 191 | SEH1L | SEH1L | SEH1L | 6823 | 0.013 | 0.5 | NO |
| 192 | DYNLL1 | DYNLL1 | DYNLL1 | 6847 | 0.012 | 0.5 | NO |
| 193 | PSMB4 | PSMB4 | PSMB4 | 6883 | 0.012 | 0.5 | NO |
| 194 | MAPRE1 | MAPRE1 | MAPRE1 | 6962 | 0.011 | 0.5 | NO |
| 195 | FGFR1OP | FGFR1OP | FGFR1OP | 6971 | 0.011 | 0.5 | NO |
| 196 | POLD2 | POLD2 | POLD2 | 7077 | 0.01 | 0.49 | NO |
| 197 | RBBP4 | RBBP4 | RBBP4 | 7143 | 0.0094 | 0.49 | NO |
| 198 | PSMD9 | PSMD9 | PSMD9 | 7162 | 0.0092 | 0.48 | NO |
| 199 | MYC | MYC | MYC | 7176 | 0.009 | 0.48 | NO |
| 200 | PSMC2 | PSMC2 | PSMC2 | 7201 | 0.0088 | 0.48 | NO |
| 201 | DCTN1 | DCTN1 | DCTN1 | 7237 | 0.0084 | 0.48 | NO |
| 202 | CEP63 | CEP63 | CEP63 | 7355 | 0.0071 | 0.48 | NO |
| 203 | PSMB8 | PSMB8 | PSMB8 | 7411 | 0.0065 | 0.47 | NO |
| 204 | CEP135 | CEP135 | CEP135 | 7416 | 0.0064 | 0.47 | NO |
| 205 | PSMC5 | PSMC5 | PSMC5 | 7439 | 0.0062 | 0.47 | NO |
| 206 | TUBA1A | TUBA1A | TUBA1A | 7597 | 0.0042 | 0.46 | NO |
| 207 | PRIM1 | PRIM1 | PRIM1 | 7684 | 0.0032 | 0.46 | NO |
| 208 | PPP2CB | PPP2CB | PPP2CB | 7803 | 0.0017 | 0.45 | NO |
| 209 | CEP192 | CEP192 | CEP192 | 7810 | 0.0016 | 0.45 | NO |
| 210 | CSNK1D | CSNK1D | CSNK1D | 7864 | 0.001 | 0.45 | NO |
| 211 | MCM3 | MCM3 | MCM3 | 8011 | -0.00046 | 0.44 | NO |
| 212 | TUBGCP2 | TUBGCP2 | TUBGCP2 | 8056 | -0.00092 | 0.44 | NO |
| 213 | PPP2R5C | PPP2R5C | PPP2R5C | 8066 | -0.00098 | 0.44 | NO |
| 214 | PSME2 | PSME2 | PSME2 | 8112 | -0.0015 | 0.44 | NO |
| 215 | ALMS1 | ALMS1 | ALMS1 | 8154 | -0.0019 | 0.44 | NO |
| 216 | LIN54 | LIN54 | LIN54 | 8197 | -0.0024 | 0.43 | NO |
| 217 | AHCTF1 | AHCTF1 | AHCTF1 | 8198 | -0.0024 | 0.43 | NO |
| 218 | PSMF1 | PSMF1 | PSMF1 | 8251 | -0.003 | 0.43 | NO |
| 219 | SKP1 | SKP1 | SKP1 | 8277 | -0.0034 | 0.43 | NO |
| 220 | TUBGCP5 | TUBGCP5 | TUBGCP5 | 8299 | -0.0037 | 0.43 | NO |
| 221 | YWHAE | YWHAE | YWHAE | 8418 | -0.005 | 0.42 | NO |
| 222 | PSME1 | PSME1 | PSME1 | 8420 | -0.005 | 0.42 | NO |
| 223 | CDK5RAP2 | CDK5RAP2 | CDK5RAP2 | 8452 | -0.0054 | 0.42 | NO |
| 224 | NINL | NINL | NINL | 8485 | -0.0057 | 0.42 | NO |
| 225 | E2F5 | E2F5 | E2F5 | 8487 | -0.0058 | 0.42 | NO |
| 226 | SDCCAG8 | SDCCAG8 | SDCCAG8 | 8760 | -0.0086 | 0.4 | NO |
| 227 | TUBG2 | TUBG2 | TUBG2 | 8762 | -0.0086 | 0.4 | NO |
| 228 | ACTR1A | ACTR1A | ACTR1A | 8781 | -0.0088 | 0.4 | NO |
| 229 | FBXO5 | FBXO5 | FBXO5 | 8887 | -0.01 | 0.4 | NO |
| 230 | SMC3 | SMC3 | SMC3 | 8889 | -0.01 | 0.4 | NO |
| 231 | STAG2 | STAG2 | STAG2 | 8921 | -0.01 | 0.4 | NO |
| 232 | RPS27A | RPS27A | RPS27A | 8932 | -0.01 | 0.4 | NO |
| 233 | CEP76 | CEP76 | CEP76 | 8956 | -0.011 | 0.4 | NO |
| 234 | PPP2R5D | PPP2R5D | PPP2R5D | 8989 | -0.011 | 0.4 | NO |
| 235 | CUL1 | CUL1 | CUL1 | 9026 | -0.012 | 0.39 | NO |
| 236 | RPA2 | RPA2 | RPA2 | 9089 | -0.012 | 0.39 | NO |
| 237 | CDKN1B | CDKN1B | CDKN1B | 9103 | -0.012 | 0.39 | NO |
| 238 | SSNA1 | SSNA1 | SSNA1 | 9144 | -0.013 | 0.39 | NO |
| 239 | PSMB10 | PSMB10 | PSMB10 | 9206 | -0.014 | 0.39 | NO |
| 240 | PSMB1 | PSMB1 | PSMB1 | 9317 | -0.015 | 0.38 | NO |
| 241 | ANAPC7 | ANAPC7 | ANAPC7 | 9353 | -0.015 | 0.38 | NO |
| 242 | CEP164 | CEP164 | CEP164 | 9366 | -0.015 | 0.38 | NO |
| 243 | CDC16 | CDC16 | CDC16 | 9441 | -0.016 | 0.38 | NO |
| 244 | CCNH | CCNH | CCNH | 9461 | -0.016 | 0.38 | NO |
| 245 | POLA1 | POLA1 | POLA1 | 9488 | -0.017 | 0.37 | NO |
| 246 | NUP133 | NUP133 | NUP133 | 9516 | -0.017 | 0.37 | NO |
| 247 | GORASP1 | GORASP1 | GORASP1 | 9521 | -0.017 | 0.37 | NO |
| 248 | ANAPC4 | ANAPC4 | ANAPC4 | 9667 | -0.019 | 0.37 | NO |
| 249 | POLD3 | POLD3 | POLD3 | 9730 | -0.019 | 0.36 | NO |
| 250 | PPP2R3B | PPP2R3B | PPP2R3B | 9864 | -0.021 | 0.36 | NO |
| 251 | PSMD6 | PSMD6 | PSMD6 | 9911 | -0.021 | 0.36 | NO |
| 252 | DCTN2 | DCTN2 | DCTN2 | 9995 | -0.022 | 0.35 | NO |
| 253 | OFD1 | OFD1 | OFD1 | 10006 | -0.022 | 0.35 | NO |
| 254 | CEP57 | CEP57 | CEP57 | 10044 | -0.023 | 0.35 | NO |
| 255 | PMF1 | PMF1 | PMF1 | 10065 | -0.023 | 0.35 | NO |
| 256 | PPP1CC | PPP1CC | PPP1CC | 10091 | -0.023 | 0.35 | NO |
| 257 | SMC1A | SMC1A | SMC1A | 10363 | -0.026 | 0.34 | NO |
| 258 | PSMB6 | PSMB6 | PSMB6 | 10392 | -0.026 | 0.34 | NO |
| 259 | RB1 | RB1 | RB1 | 10458 | -0.027 | 0.33 | NO |
| 260 | RBL2 | RBL2 | RBL2 | 10469 | -0.028 | 0.34 | NO |
| 261 | ANAPC5 | ANAPC5 | ANAPC5 | 10493 | -0.028 | 0.34 | NO |
| 262 | GMNN | GMNN | GMNN | 10506 | -0.028 | 0.34 | NO |
| 263 | LIN52 | LIN52 | LIN52 | 10507 | -0.028 | 0.34 | NO |
| 264 | CEP290 | CEP290 | CEP290 | 10516 | -0.028 | 0.34 | NO |
| 265 | RPA1 | RPA1 | RPA1 | 10536 | -0.028 | 0.34 | NO |
| 266 | MAX | MAX | MAX | 10558 | -0.029 | 0.34 | NO |
| 267 | NUP43 | NUP43 | NUP43 | 10721 | -0.031 | 0.33 | NO |
| 268 | RANBP2 | RANBP2 | RANBP2 | 10769 | -0.032 | 0.33 | NO |
| 269 | TUBGCP3 | TUBGCP3 | TUBGCP3 | 11043 | -0.036 | 0.31 | NO |
| 270 | TUBGCP6 | TUBGCP6 | TUBGCP6 | 11074 | -0.036 | 0.31 | NO |
| 271 | CDKN2C | CDKN2C | CDKN2C | 11098 | -0.036 | 0.31 | NO |
| 272 | CDC26 | CDC26 | CDC26 | 11351 | -0.04 | 0.3 | NO |
| 273 | PRKACA | PRKACA | PRKACA | 11373 | -0.04 | 0.3 | NO |
| 274 | AKAP9 | AKAP9 | AKAP9 | 11420 | -0.041 | 0.3 | NO |
| 275 | ANAPC2 | ANAPC2 | ANAPC2 | 11466 | -0.042 | 0.3 | NO |
| 276 | UBA52 | UBA52 | UBA52 | 11476 | -0.042 | 0.3 | NO |
| 277 | DYRK1A | DYRK1A | DYRK1A | 11509 | -0.043 | 0.3 | NO |
| 278 | CENPC1 | CENPC1 | CENPC1 | 11513 | -0.043 | 0.3 | NO |
| 279 | PPP2R1B | PPP2R1B | PPP2R1B | 11667 | -0.046 | 0.3 | NO |
| 280 | APITD1 | APITD1 | APITD1 | 11910 | -0.05 | 0.29 | NO |
| 281 | CCND3 | CCND3 | CCND3 | 11961 | -0.051 | 0.28 | NO |
| 282 | DCTN3 | DCTN3 | DCTN3 | 12060 | -0.052 | 0.28 | NO |
| 283 | BTRC | BTRC | BTRC | 12104 | -0.053 | 0.28 | NO |
| 284 | PCM1 | PCM1 | PCM1 | 12166 | -0.054 | 0.28 | NO |
| 285 | PAFAH1B1 | PAFAH1B1 | PAFAH1B1 | 12209 | -0.055 | 0.28 | NO |
| 286 | PCNT | PCNT | PCNT | 12274 | -0.057 | 0.28 | NO |
| 287 | PPP2R5A | PPP2R5A | PPP2R5A | 13073 | -0.074 | 0.24 | NO |
| 288 | B9D2 | B9D2 | B9D2 | 13178 | -0.077 | 0.24 | NO |
| 289 | NSL1 | NSL1 | NSL1 | 13249 | -0.079 | 0.24 | NO |
| 290 | CDC14A | CDC14A | CDC14A | 13905 | -0.099 | 0.2 | NO |
| 291 | MIS12 | MIS12 | MIS12 | 14114 | -0.11 | 0.2 | NO |
| 292 | RPA4 | RPA4 | RPA4 | 14716 | -0.13 | 0.17 | NO |
| 293 | RPS27 | RPS27 | RPS27 | 15001 | -0.14 | 0.16 | NO |
| 294 | CCNA1 | CCNA1 | CCNA1 | 15153 | -0.15 | 0.16 | NO |
| 295 | CCND2 | CCND2 | CCND2 | 15348 | -0.16 | 0.15 | NO |
| 296 | PSMA8 | PSMA8 | PSMA8 | 16164 | -0.22 | 0.12 | NO |
| 297 | PRKAR2B | PRKAR2B | PRKAR2B | 16712 | -0.26 | 0.096 | NO |
Figure S51. Get High-res Image This plot shows mRNAseq_cNMF expression data heatmap (on the left) a RunningEnrichmentScore(RES) plot (on the top right) and a Signal2Noise(S2N) plot (on the bottom right) of genes in the pathway: PID E2F PATHWAY.
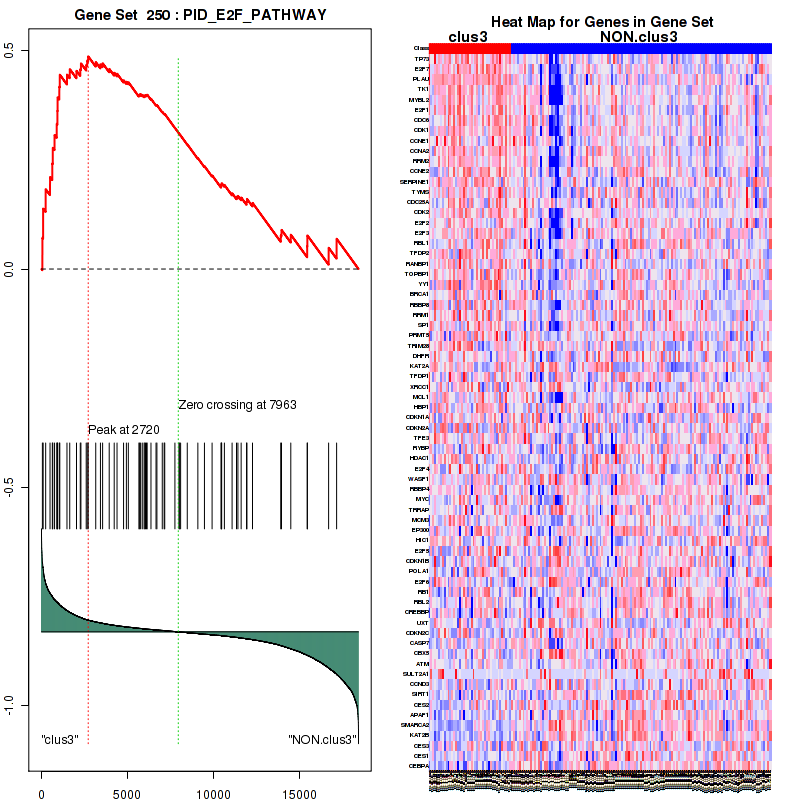
Figure S52. Get High-res Image For the top 5 core enriched genes in the pathway: PID E2F PATHWAY, this volcano plot shows how much they are up/down-regulated and significant. The significance was calculated by empirical bayesian fit
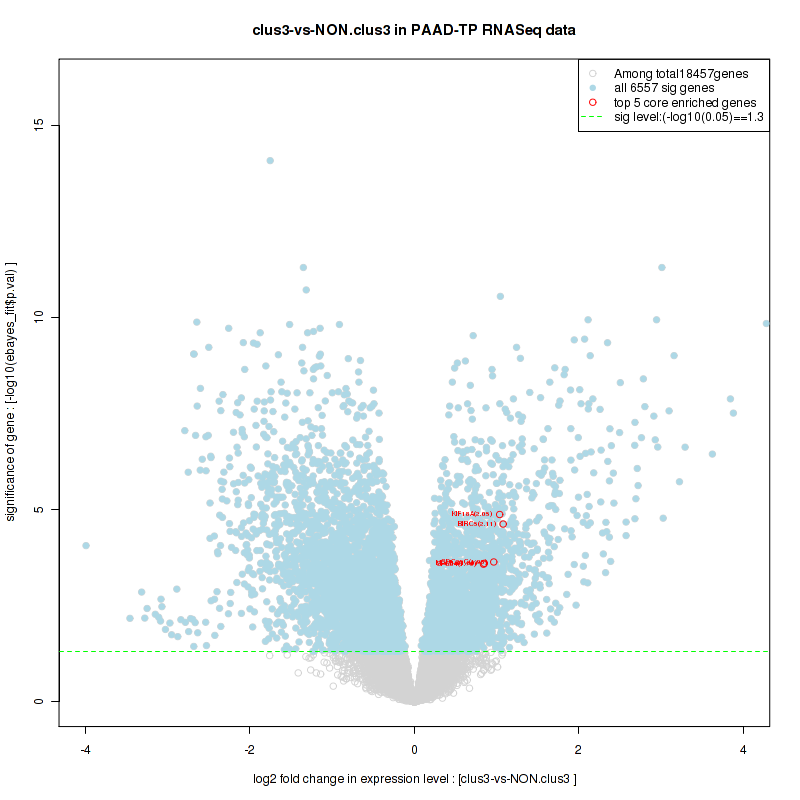
Table S27. Get Full Table This table shows a Running Enrichment Score (RES) of each gene in this pathway, that is, the enrichment score at this point in the ranked list of genes. All genes are ranked by Signal-to-Noise (S2N), a measure of similarity as default and are used to obtain ES matrix of all genes. In this way, GSEA tool uses expression pattern of not only overlapped genes but also not-overlapped genes to produce ES matrix.
| Rank | GENE | SYMBOL | DESC | LIST.LOC | S2N | RES | CORE_ENRICHMENT |
|---|---|---|---|---|---|---|---|
| 1 | NEK2 | NEK2 | NEK2 | 278 | 0.34 | 0.094 | YES |
| 2 | PLK4 | PLK4 | PLK4 | 542 | 0.27 | 0.17 | YES |
| 3 | PLK1 | PLK1 | PLK1 | 672 | 0.25 | 0.24 | YES |
| 4 | CDK1 | CDK1 | CDK1 | 888 | 0.22 | 0.3 | YES |
| 5 | CCNB1 | CCNB1 | CCNB1 | 1102 | 0.19 | 0.35 | YES |
| 6 | TUBA4A | TUBA4A | TUBA4A | 2427 | 0.097 | 0.31 | YES |
| 7 | CSNK1E | CSNK1E | CSNK1E | 2670 | 0.087 | 0.32 | YES |
| 8 | AZI1 | AZI1 | AZI1 | 2760 | 0.084 | 0.34 | YES |
| 9 | CENPJ | CENPJ | CENPJ | 2823 | 0.082 | 0.37 | YES |
| 10 | TUBB | TUBB | TUBB | 3374 | 0.067 | 0.36 | YES |
| 11 | CKAP5 | CKAP5 | CKAP5 | 3467 | 0.065 | 0.37 | YES |
| 12 | DYNC1I2 | DYNC1I2 | DYNC1I2 | 4015 | 0.052 | 0.36 | YES |
| 13 | YWHAG | YWHAG | YWHAG | 4091 | 0.05 | 0.37 | YES |
| 14 | TUBG1 | TUBG1 | TUBG1 | 4092 | 0.05 | 0.39 | YES |
| 15 | HSP90AA1 | HSP90AA1 | HSP90AA1 | 4138 | 0.05 | 0.4 | YES |
| 16 | NUMA1 | NUMA1 | NUMA1 | 4615 | 0.041 | 0.39 | YES |
| 17 | NEDD1 | NEDD1 | NEDD1 | 4879 | 0.037 | 0.39 | YES |
| 18 | CETN2 | CETN2 | CETN2 | 4960 | 0.036 | 0.39 | YES |
| 19 | CEP250 | CEP250 | CEP250 | 5045 | 0.035 | 0.4 | YES |
| 20 | CEP70 | CEP70 | CEP70 | 5156 | 0.033 | 0.4 | YES |
| 21 | CEP72 | CEP72 | CEP72 | 5180 | 0.033 | 0.41 | YES |
| 22 | HAUS2 | HAUS2 | HAUS2 | 5457 | 0.029 | 0.41 | NO |
| 23 | DYNC1H1 | DYNC1H1 | DYNC1H1 | 6188 | 0.02 | 0.37 | NO |
| 24 | CLASP1 | CLASP1 | CLASP1 | 6661 | 0.014 | 0.35 | NO |
| 25 | PPP2R1A | PPP2R1A | PPP2R1A | 6745 | 0.014 | 0.35 | NO |
| 26 | DYNLL1 | DYNLL1 | DYNLL1 | 6847 | 0.012 | 0.35 | NO |
| 27 | MAPRE1 | MAPRE1 | MAPRE1 | 6962 | 0.011 | 0.35 | NO |
| 28 | FGFR1OP | FGFR1OP | FGFR1OP | 6971 | 0.011 | 0.35 | NO |
| 29 | DCTN1 | DCTN1 | DCTN1 | 7237 | 0.0084 | 0.34 | NO |
| 30 | CEP63 | CEP63 | CEP63 | 7355 | 0.0071 | 0.34 | NO |
| 31 | CEP135 | CEP135 | CEP135 | 7416 | 0.0064 | 0.34 | NO |
| 32 | TUBA1A | TUBA1A | TUBA1A | 7597 | 0.0042 | 0.33 | NO |
| 33 | CEP192 | CEP192 | CEP192 | 7810 | 0.0016 | 0.32 | NO |
| 34 | CSNK1D | CSNK1D | CSNK1D | 7864 | 0.001 | 0.31 | NO |
| 35 | TUBGCP2 | TUBGCP2 | TUBGCP2 | 8056 | -0.00092 | 0.3 | NO |
| 36 | ALMS1 | ALMS1 | ALMS1 | 8154 | -0.0019 | 0.3 | NO |
| 37 | TUBGCP5 | TUBGCP5 | TUBGCP5 | 8299 | -0.0037 | 0.29 | NO |
| 38 | YWHAE | YWHAE | YWHAE | 8418 | -0.005 | 0.29 | NO |
| 39 | CDK5RAP2 | CDK5RAP2 | CDK5RAP2 | 8452 | -0.0054 | 0.29 | NO |
| 40 | NINL | NINL | NINL | 8485 | -0.0057 | 0.29 | NO |
| 41 | SDCCAG8 | SDCCAG8 | SDCCAG8 | 8760 | -0.0086 | 0.28 | NO |
| 42 | TUBG2 | TUBG2 | TUBG2 | 8762 | -0.0086 | 0.28 | NO |
| 43 | ACTR1A | ACTR1A | ACTR1A | 8781 | -0.0088 | 0.28 | NO |
| 44 | CEP76 | CEP76 | CEP76 | 8956 | -0.011 | 0.27 | NO |
| 45 | SSNA1 | SSNA1 | SSNA1 | 9144 | -0.013 | 0.27 | NO |
| 46 | CEP164 | CEP164 | CEP164 | 9366 | -0.015 | 0.26 | NO |
| 47 | DCTN2 | DCTN2 | DCTN2 | 9995 | -0.022 | 0.23 | NO |
| 48 | OFD1 | OFD1 | OFD1 | 10006 | -0.022 | 0.24 | NO |
| 49 | CEP57 | CEP57 | CEP57 | 10044 | -0.023 | 0.24 | NO |
| 50 | CEP290 | CEP290 | CEP290 | 10516 | -0.028 | 0.23 | NO |
| 51 | TUBGCP3 | TUBGCP3 | TUBGCP3 | 11043 | -0.036 | 0.21 | NO |
| 52 | TUBGCP6 | TUBGCP6 | TUBGCP6 | 11074 | -0.036 | 0.22 | NO |
| 53 | PRKACA | PRKACA | PRKACA | 11373 | -0.04 | 0.22 | NO |
| 54 | AKAP9 | AKAP9 | AKAP9 | 11420 | -0.041 | 0.23 | NO |
| 55 | DCTN3 | DCTN3 | DCTN3 | 12060 | -0.052 | 0.21 | NO |
| 56 | PCM1 | PCM1 | PCM1 | 12166 | -0.054 | 0.22 | NO |
| 57 | PAFAH1B1 | PAFAH1B1 | PAFAH1B1 | 12209 | -0.055 | 0.24 | NO |
| 58 | PCNT | PCNT | PCNT | 12274 | -0.057 | 0.25 | NO |
| 59 | PRKAR2B | PRKAR2B | PRKAR2B | 16712 | -0.26 | 0.095 | NO |
Figure S53. Get High-res Image This plot shows mRNAseq_cNMF expression data heatmap (on the left) a RunningEnrichmentScore(RES) plot (on the top right) and a Signal2Noise(S2N) plot (on the bottom right) of genes in the pathway: PID ATR PATHWAY.
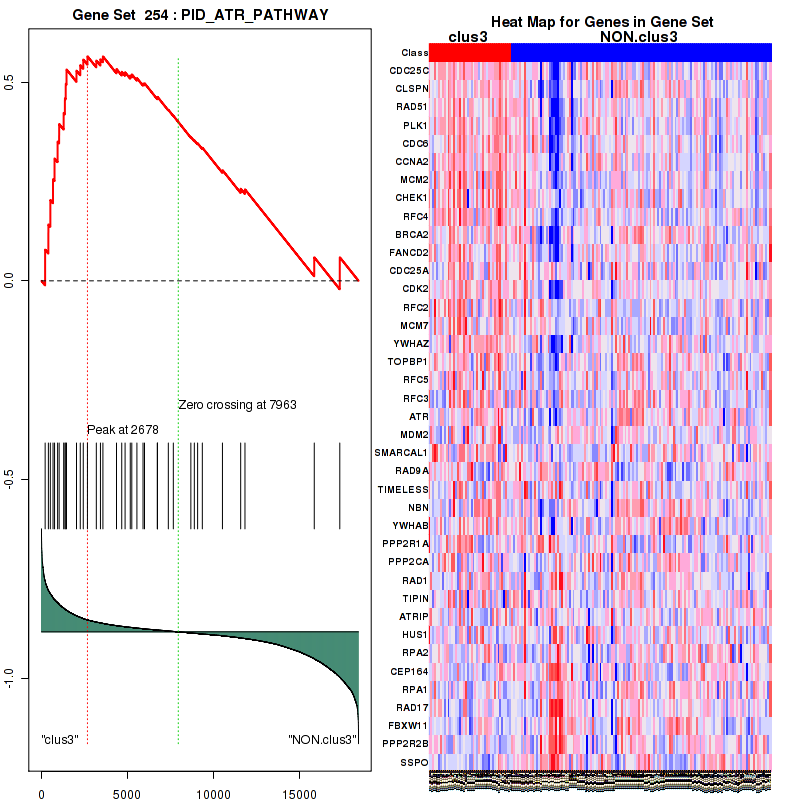
Figure S54. Get High-res Image For the top 5 core enriched genes in the pathway: PID ATR PATHWAY, this volcano plot shows how much they are up/down-regulated and significant. The significance was calculated by empirical bayesian fit
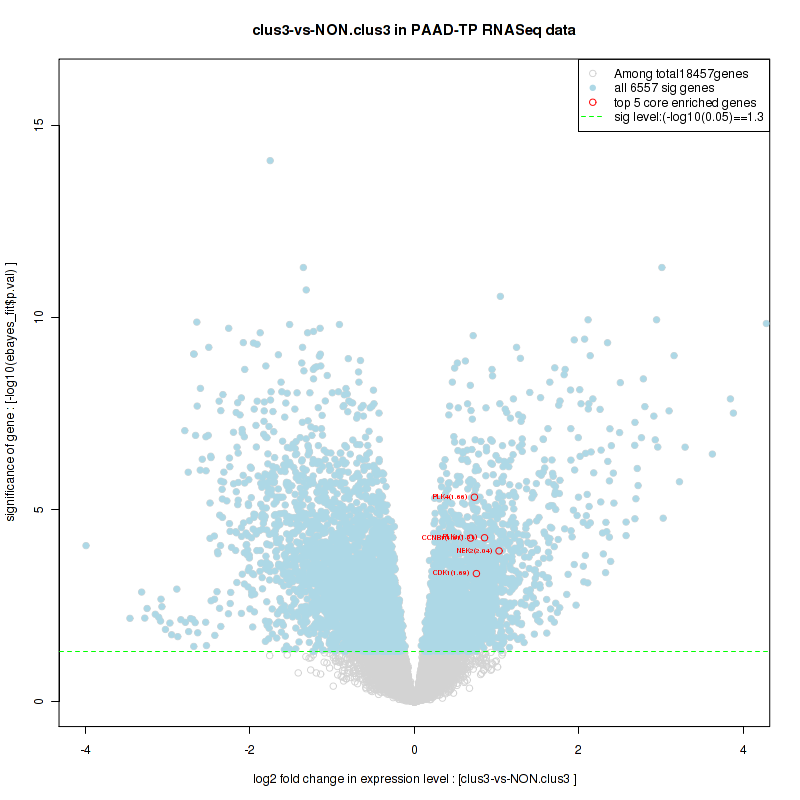
Table S28. Get Full Table This table shows a Running Enrichment Score (RES) of each gene in this pathway, that is, the enrichment score at this point in the ranked list of genes. All genes are ranked by Signal-to-Noise (S2N), a measure of similarity as default and are used to obtain ES matrix of all genes. In this way, GSEA tool uses expression pattern of not only overlapped genes but also not-overlapped genes to produce ES matrix.
| Rank | GENE | SYMBOL | DESC | LIST.LOC | S2N | RES | CORE_ENRICHMENT |
|---|---|---|---|---|---|---|---|
| 1 | MCM10 | MCM10 | MCM10 | 250 | 0.35 | 0.028 | YES |
| 2 | PKMYT1 | PKMYT1 | PKMYT1 | 350 | 0.32 | 0.059 | YES |
| 3 | CDC45 | CDC45 | CDC45 | 373 | 0.31 | 0.094 | YES |
| 4 | MYBL2 | MYBL2 | MYBL2 | 632 | 0.26 | 0.11 | YES |
| 5 | E2F1 | E2F1 | E2F1 | 659 | 0.25 | 0.14 | YES |
| 6 | CDC6 | CDC6 | CDC6 | 762 | 0.24 | 0.16 | YES |
| 7 | CDT1 | CDT1 | CDT1 | 771 | 0.23 | 0.19 | YES |
| 8 | POLE2 | POLE2 | POLE2 | 857 | 0.22 | 0.21 | YES |
| 9 | CDK1 | CDK1 | CDK1 | 888 | 0.22 | 0.23 | YES |
| 10 | CCNE1 | CCNE1 | CCNE1 | 930 | 0.22 | 0.26 | YES |
| 11 | CCNA2 | CCNA2 | CCNA2 | 939 | 0.21 | 0.28 | YES |
| 12 | MCM2 | MCM2 | MCM2 | 1030 | 0.2 | 0.3 | YES |
| 13 | RRM2 | RRM2 | RRM2 | 1040 | 0.2 | 0.32 | YES |
| 14 | CCNE2 | CCNE2 | CCNE2 | 1067 | 0.2 | 0.34 | YES |
| 15 | MCM4 | MCM4 | MCM4 | 1089 | 0.19 | 0.36 | YES |
| 16 | CCNB1 | CCNB1 | CCNB1 | 1102 | 0.19 | 0.39 | YES |
| 17 | CCND1 | CCND1 | CCND1 | 1526 | 0.15 | 0.38 | YES |
| 18 | CKS1B | CKS1B | CKS1B | 1615 | 0.14 | 0.39 | YES |
| 19 | TYMS | TYMS | TYMS | 1647 | 0.14 | 0.41 | YES |
| 20 | CDC25A | CDC25A | CDC25A | 2038 | 0.12 | 0.4 | YES |
| 21 | WEE1 | WEE1 | WEE1 | 2106 | 0.11 | 0.41 | YES |
| 22 | CDK6 | CDK6 | CDK6 | 2115 | 0.11 | 0.42 | YES |
| 23 | CDK2 | CDK2 | CDK2 | 2260 | 0.11 | 0.43 | YES |
| 24 | E2F2 | E2F2 | E2F2 | 2298 | 0.1 | 0.44 | YES |
| 25 | MNAT1 | MNAT1 | MNAT1 | 2403 | 0.098 | 0.44 | YES |
| 26 | LIN9 | LIN9 | LIN9 | 2577 | 0.09 | 0.44 | YES |
| 27 | E2F3 | E2F3 | E2F3 | 2606 | 0.09 | 0.45 | YES |
| 28 | PSMD2 | PSMD2 | PSMD2 | 2609 | 0.089 | 0.46 | YES |
| 29 | RBL1 | RBL1 | RBL1 | 2663 | 0.087 | 0.47 | YES |
| 30 | MCM7 | MCM7 | MCM7 | 2678 | 0.087 | 0.48 | YES |
| 31 | CDC7 | CDC7 | CDC7 | 2696 | 0.086 | 0.49 | YES |
| 32 | PSMD14 | PSMD14 | PSMD14 | 2871 | 0.081 | 0.49 | YES |
| 33 | MCM6 | MCM6 | MCM6 | 2932 | 0.079 | 0.5 | YES |
| 34 | CDKN2B | CDKN2B | CDKN2B | 2966 | 0.078 | 0.5 | YES |
| 35 | PRIM2 | PRIM2 | PRIM2 | 3200 | 0.071 | 0.5 | YES |
| 36 | MCM8 | MCM8 | MCM8 | 3214 | 0.071 | 0.5 | YES |
| 37 | PSMD12 | PSMD12 | PSMD12 | 3311 | 0.068 | 0.51 | YES |
| 38 | CDKN2D | CDKN2D | CDKN2D | 3379 | 0.067 | 0.51 | YES |
| 39 | RPA3 | RPA3 | RPA3 | 3390 | 0.067 | 0.52 | YES |
| 40 | MCM5 | MCM5 | MCM5 | 3395 | 0.067 | 0.53 | YES |
| 41 | SKP2 | SKP2 | SKP2 | 3471 | 0.065 | 0.53 | YES |
| 42 | PPP2R2A | PPP2R2A | PPP2R2A | 3596 | 0.061 | 0.53 | YES |
| 43 | CDK7 | CDK7 | CDK7 | 3599 | 0.061 | 0.54 | YES |
| 44 | PSMD7 | PSMD7 | PSMD7 | 3660 | 0.06 | 0.54 | YES |
| 45 | PSMD11 | PSMD11 | PSMD11 | 3713 | 0.058 | 0.55 | YES |
| 46 | PSMA1 | PSMA1 | PSMA1 | 4051 | 0.051 | 0.53 | YES |
| 47 | PCNA | PCNA | PCNA | 4202 | 0.048 | 0.53 | YES |
| 48 | TK2 | TK2 | TK2 | 4225 | 0.048 | 0.54 | YES |
| 49 | PSMB2 | PSMB2 | PSMB2 | 4258 | 0.047 | 0.54 | YES |
| 50 | PSMA7 | PSMA7 | PSMA7 | 4327 | 0.046 | 0.54 | YES |
| 51 | DBF4 | DBF4 | DBF4 | 4330 | 0.046 | 0.55 | YES |
| 52 | PSMA5 | PSMA5 | PSMA5 | 4401 | 0.045 | 0.55 | YES |
| 53 | LIN37 | LIN37 | LIN37 | 4497 | 0.043 | 0.55 | YES |
| 54 | PSMA6 | PSMA6 | PSMA6 | 4582 | 0.042 | 0.55 | YES |
| 55 | POLA2 | POLA2 | POLA2 | 4740 | 0.039 | 0.54 | NO |
| 56 | PSMD8 | PSMD8 | PSMD8 | 4821 | 0.038 | 0.54 | NO |
| 57 | PSMD13 | PSMD13 | PSMD13 | 5082 | 0.034 | 0.53 | NO |
| 58 | POLE | POLE | POLE | 5120 | 0.034 | 0.54 | NO |
| 59 | PSMC3 | PSMC3 | PSMC3 | 5187 | 0.033 | 0.54 | NO |
| 60 | PSMC1 | PSMC1 | PSMC1 | 5255 | 0.032 | 0.54 | NO |
| 61 | PSMD1 | PSMD1 | PSMD1 | 5280 | 0.032 | 0.54 | NO |
| 62 | PSMC6 | PSMC6 | PSMC6 | 5442 | 0.029 | 0.53 | NO |
| 63 | PSMD5 | PSMD5 | PSMD5 | 5561 | 0.028 | 0.53 | NO |
| 64 | PSMC4 | PSMC4 | PSMC4 | 5669 | 0.026 | 0.53 | NO |
| 65 | DHFR | DHFR | DHFR | 5672 | 0.026 | 0.53 | NO |
| 66 | TFDP1 | TFDP1 | TFDP1 | 5771 | 0.025 | 0.53 | NO |
| 67 | PSMA3 | PSMA3 | PSMA3 | 5831 | 0.024 | 0.53 | NO |
| 68 | PSMD4 | PSMD4 | PSMD4 | 5878 | 0.024 | 0.53 | NO |
| 69 | CDK4 | CDK4 | CDK4 | 5928 | 0.023 | 0.53 | NO |
| 70 | PSMD10 | PSMD10 | PSMD10 | 6055 | 0.021 | 0.52 | NO |
| 71 | CDKN1A | CDKN1A | CDKN1A | 6056 | 0.021 | 0.52 | NO |
| 72 | CDKN2A | CDKN2A | CDKN2A | 6115 | 0.021 | 0.52 | NO |
| 73 | PSMD3 | PSMD3 | PSMD3 | 6194 | 0.02 | 0.52 | NO |
| 74 | PSMA2 | PSMA2 | PSMA2 | 6271 | 0.019 | 0.52 | NO |
| 75 | PSMA4 | PSMA4 | PSMA4 | 6379 | 0.018 | 0.52 | NO |
| 76 | PSMB5 | PSMB5 | PSMB5 | 6385 | 0.018 | 0.52 | NO |
| 77 | PSMB3 | PSMB3 | PSMB3 | 6437 | 0.017 | 0.52 | NO |
| 78 | HDAC1 | HDAC1 | HDAC1 | 6671 | 0.014 | 0.51 | NO |
| 79 | PSMB9 | PSMB9 | PSMB9 | 6695 | 0.014 | 0.51 | NO |
| 80 | E2F4 | E2F4 | E2F4 | 6720 | 0.014 | 0.51 | NO |
| 81 | PPP2R1A | PPP2R1A | PPP2R1A | 6745 | 0.014 | 0.51 | NO |
| 82 | PPP2CA | PPP2CA | PPP2CA | 6752 | 0.014 | 0.51 | NO |
| 83 | PSMB7 | PSMB7 | PSMB7 | 6763 | 0.013 | 0.51 | NO |
| 84 | PSMB4 | PSMB4 | PSMB4 | 6883 | 0.012 | 0.5 | NO |
| 85 | RBBP4 | RBBP4 | RBBP4 | 7143 | 0.0094 | 0.49 | NO |
| 86 | PSMD9 | PSMD9 | PSMD9 | 7162 | 0.0092 | 0.49 | NO |
| 87 | MYC | MYC | MYC | 7176 | 0.009 | 0.49 | NO |
| 88 | PSMC2 | PSMC2 | PSMC2 | 7201 | 0.0088 | 0.49 | NO |
| 89 | PSMB8 | PSMB8 | PSMB8 | 7411 | 0.0065 | 0.48 | NO |
| 90 | PSMC5 | PSMC5 | PSMC5 | 7439 | 0.0062 | 0.48 | NO |
| 91 | PRIM1 | PRIM1 | PRIM1 | 7684 | 0.0032 | 0.47 | NO |
| 92 | PPP2CB | PPP2CB | PPP2CB | 7803 | 0.0017 | 0.46 | NO |
| 93 | MCM3 | MCM3 | MCM3 | 8011 | -0.00046 | 0.45 | NO |
| 94 | PSME2 | PSME2 | PSME2 | 8112 | -0.0015 | 0.44 | NO |
| 95 | LIN54 | LIN54 | LIN54 | 8197 | -0.0024 | 0.44 | NO |
| 96 | PSMF1 | PSMF1 | PSMF1 | 8251 | -0.003 | 0.44 | NO |
| 97 | SKP1 | SKP1 | SKP1 | 8277 | -0.0034 | 0.44 | NO |
| 98 | PSME1 | PSME1 | PSME1 | 8420 | -0.005 | 0.43 | NO |
| 99 | E2F5 | E2F5 | E2F5 | 8487 | -0.0058 | 0.43 | NO |
| 100 | FBXO5 | FBXO5 | FBXO5 | 8887 | -0.01 | 0.41 | NO |
| 101 | RPS27A | RPS27A | RPS27A | 8932 | -0.01 | 0.4 | NO |
| 102 | CUL1 | CUL1 | CUL1 | 9026 | -0.012 | 0.4 | NO |
| 103 | RPA2 | RPA2 | RPA2 | 9089 | -0.012 | 0.4 | NO |
| 104 | CDKN1B | CDKN1B | CDKN1B | 9103 | -0.012 | 0.4 | NO |
| 105 | PSMB10 | PSMB10 | PSMB10 | 9206 | -0.014 | 0.4 | NO |
| 106 | PSMB1 | PSMB1 | PSMB1 | 9317 | -0.015 | 0.39 | NO |
| 107 | CCNH | CCNH | CCNH | 9461 | -0.016 | 0.39 | NO |
| 108 | POLA1 | POLA1 | POLA1 | 9488 | -0.017 | 0.39 | NO |
| 109 | PPP2R3B | PPP2R3B | PPP2R3B | 9864 | -0.021 | 0.37 | NO |
| 110 | PSMD6 | PSMD6 | PSMD6 | 9911 | -0.021 | 0.37 | NO |
| 111 | PSMB6 | PSMB6 | PSMB6 | 10392 | -0.026 | 0.34 | NO |
| 112 | RB1 | RB1 | RB1 | 10458 | -0.027 | 0.34 | NO |
| 113 | RBL2 | RBL2 | RBL2 | 10469 | -0.028 | 0.35 | NO |
| 114 | LIN52 | LIN52 | LIN52 | 10507 | -0.028 | 0.35 | NO |
| 115 | RPA1 | RPA1 | RPA1 | 10536 | -0.028 | 0.35 | NO |
| 116 | MAX | MAX | MAX | 10558 | -0.029 | 0.35 | NO |
| 117 | CDKN2C | CDKN2C | CDKN2C | 11098 | -0.036 | 0.33 | NO |
| 118 | UBA52 | UBA52 | UBA52 | 11476 | -0.042 | 0.31 | NO |
| 119 | DYRK1A | DYRK1A | DYRK1A | 11509 | -0.043 | 0.32 | NO |
| 120 | PPP2R1B | PPP2R1B | PPP2R1B | 11667 | -0.046 | 0.31 | NO |
| 121 | CCND3 | CCND3 | CCND3 | 11961 | -0.051 | 0.3 | NO |
| 122 | RPA4 | RPA4 | RPA4 | 14716 | -0.13 | 0.17 | NO |
| 123 | CCNA1 | CCNA1 | CCNA1 | 15153 | -0.15 | 0.16 | NO |
| 124 | CCND2 | CCND2 | CCND2 | 15348 | -0.16 | 0.17 | NO |
Figure S55. Get High-res Image This plot shows mRNAseq_cNMF expression data heatmap (on the left) a RunningEnrichmentScore(RES) plot (on the top right) and a Signal2Noise(S2N) plot (on the bottom right) of genes in the pathway: PID FRA PATHWAY.
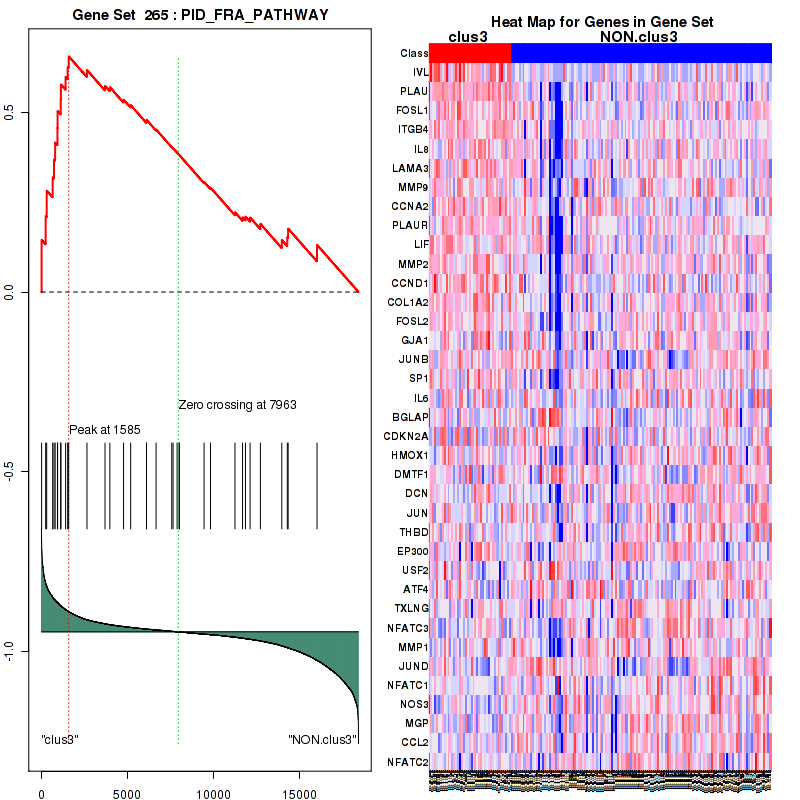
Figure S56. Get High-res Image For the top 5 core enriched genes in the pathway: PID FRA PATHWAY, this volcano plot shows how much they are up/down-regulated and significant. The significance was calculated by empirical bayesian fit
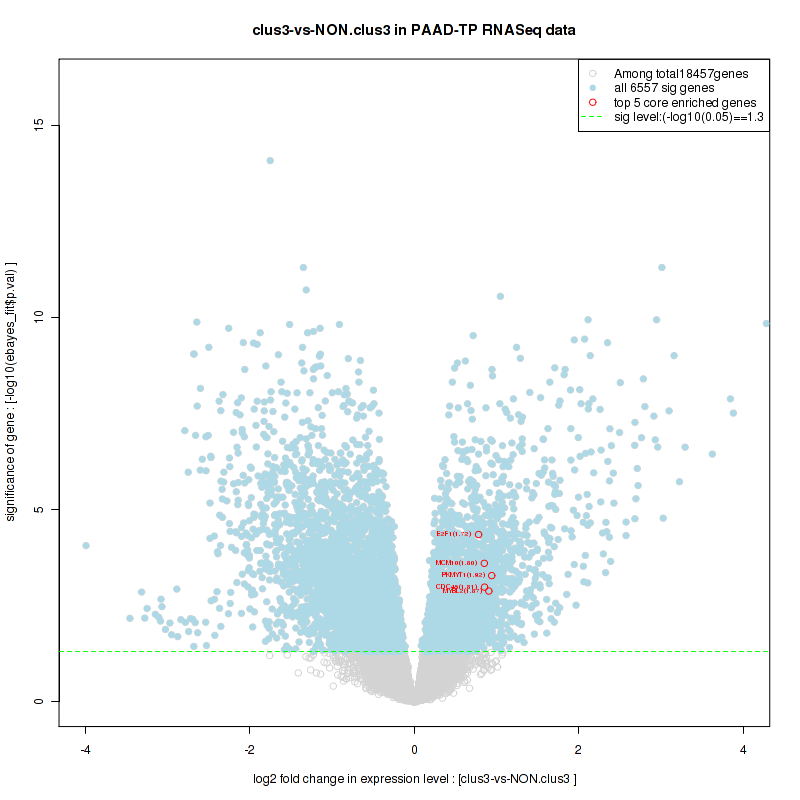
Table S29. Get Full Table This table shows a Running Enrichment Score (RES) of each gene in this pathway, that is, the enrichment score at this point in the ranked list of genes. All genes are ranked by Signal-to-Noise (S2N), a measure of similarity as default and are used to obtain ES matrix of all genes. In this way, GSEA tool uses expression pattern of not only overlapped genes but also not-overlapped genes to produce ES matrix.
| Rank | GENE | SYMBOL | DESC | LIST.LOC | S2N | RES | CORE_ENRICHMENT |
|---|---|---|---|---|---|---|---|
| 1 | KRT14 | KRT14 | KRT14 | 42 | 0.54 | 0.075 | YES |
| 2 | KRT5 | KRT5 | KRT5 | 63 | 0.5 | 0.15 | YES |
| 3 | TP63 | TP63 | TP63 | 115 | 0.44 | 0.21 | YES |
| 4 | DLX5 | DLX5 | DLX5 | 257 | 0.35 | 0.25 | YES |
| 5 | IL1A | IL1A | IL1A | 383 | 0.31 | 0.29 | YES |
| 6 | CCNB2 | CCNB2 | CCNB2 | 440 | 0.3 | 0.33 | YES |
| 7 | SFN | SFN | SFN | 450 | 0.29 | 0.37 | YES |
| 8 | RAB38 | RAB38 | RAB38 | 688 | 0.25 | 0.39 | YES |
| 9 | TOP2A | TOP2A | TOP2A | 735 | 0.24 | 0.42 | YES |
| 10 | RRAD | RRAD | RRAD | 751 | 0.24 | 0.46 | YES |
| 11 | ITGA3 | ITGA3 | ITGA3 | 777 | 0.23 | 0.49 | YES |
| 12 | HELLS | HELLS | HELLS | 879 | 0.22 | 0.51 | YES |
| 13 | AXL | AXL | AXL | 985 | 0.21 | 0.54 | YES |
| 14 | ADA | ADA | ADA | 1031 | 0.2 | 0.56 | YES |
| 15 | IGFBP3 | IGFBP3 | IGFBP3 | 1206 | 0.18 | 0.58 | YES |
| 16 | COL5A1 | COL5A1 | COL5A1 | 1209 | 0.18 | 0.61 | YES |
| 17 | DLX6 | DLX6 | DLX6 | 1360 | 0.17 | 0.62 | YES |
| 18 | BRCA2 | BRCA2 | BRCA2 | 1413 | 0.16 | 0.64 | YES |
| 19 | SEC14L2 | SEC14L2 | SEC14L2 | 1572 | 0.15 | 0.66 | YES |
| 20 | PERP | PERP | PERP | 1900 | 0.12 | 0.66 | YES |
| 21 | RUNX1 | RUNX1 | RUNX1 | 2147 | 0.11 | 0.66 | YES |
| 22 | VDR | VDR | VDR | 2157 | 0.11 | 0.68 | YES |
| 23 | YAP1 | YAP1 | YAP1 | 2287 | 0.1 | 0.68 | YES |
| 24 | FOSL2 | FOSL2 | FOSL2 | 2648 | 0.088 | 0.68 | NO |
| 25 | TCF7L1 | TCF7L1 | TCF7L1 | 3111 | 0.074 | 0.66 | NO |
| 26 | ITCH | ITCH | ITCH | 3867 | 0.055 | 0.63 | NO |
| 27 | MRE11A | MRE11A | MRE11A | 4172 | 0.049 | 0.62 | NO |
| 28 | ADRM1 | ADRM1 | ADRM1 | 4338 | 0.046 | 0.62 | NO |
| 29 | GSK3B | GSK3B | GSK3B | 4390 | 0.045 | 0.62 | NO |
| 30 | MDM2 | MDM2 | MDM2 | 4867 | 0.037 | 0.6 | NO |
| 31 | HES1 | HES1 | HES1 | 5042 | 0.035 | 0.6 | NO |
| 32 | FASN | FASN | FASN | 5233 | 0.032 | 0.59 | NO |
| 33 | NOTCH1 | NOTCH1 | NOTCH1 | 6007 | 0.022 | 0.55 | NO |
| 34 | HBP1 | HBP1 | HBP1 | 6017 | 0.022 | 0.55 | NO |
| 35 | CDKN2A | CDKN2A | CDKN2A | 6115 | 0.021 | 0.55 | NO |
| 36 | WWP1 | WWP1 | WWP1 | 7205 | 0.0088 | 0.49 | NO |
| 37 | CEBPD | CEBPD | CEBPD | 7371 | 0.007 | 0.48 | NO |
| 38 | GNB2L1 | GNB2L1 | GNB2L1 | 8862 | -0.0097 | 0.41 | NO |
| 39 | NRG1 | NRG1 | NRG1 | 10870 | -0.033 | 0.3 | NO |
| 40 | BDKRB2 | BDKRB2 | BDKRB2 | 11491 | -0.043 | 0.27 | NO |
| 41 | ATM | ATM | ATM | 11624 | -0.045 | 0.27 | NO |
| 42 | FBXW7 | FBXW7 | FBXW7 | 12894 | -0.07 | 0.22 | NO |
| 43 | PPP2R5A | PPP2R5A | PPP2R5A | 13073 | -0.074 | 0.22 | NO |
| 44 | STXBP4 | STXBP4 | STXBP4 | 15143 | -0.15 | 0.12 | NO |
| 45 | GPX2 | GPX2 | GPX2 | 15298 | -0.16 | 0.14 | NO |
| 46 | POU2F2 | POU2F2 | POU2F2 | 16209 | -0.22 | 0.12 | NO |
Figure S57. Get High-res Image This plot shows mRNAseq_cNMF expression data heatmap (on the left) a RunningEnrichmentScore(RES) plot (on the top right) and a Signal2Noise(S2N) plot (on the bottom right) of genes in the pathway: PID MYC ACTIVPATHWAY.
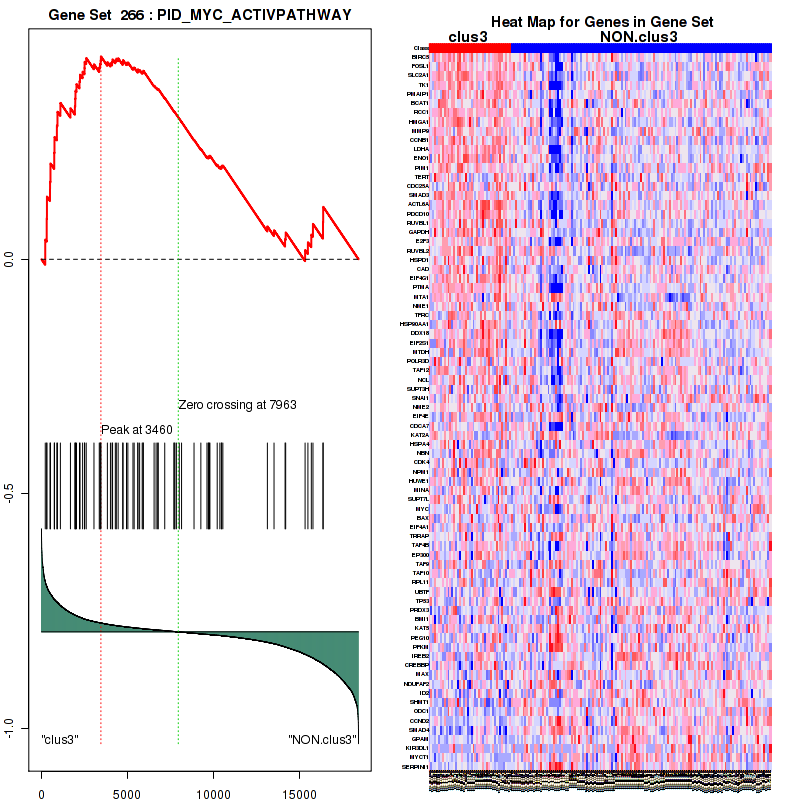
Figure S58. Get High-res Image For the top 5 core enriched genes in the pathway: PID MYC ACTIVPATHWAY, this volcano plot shows how much they are up/down-regulated and significant. The significance was calculated by empirical bayesian fit
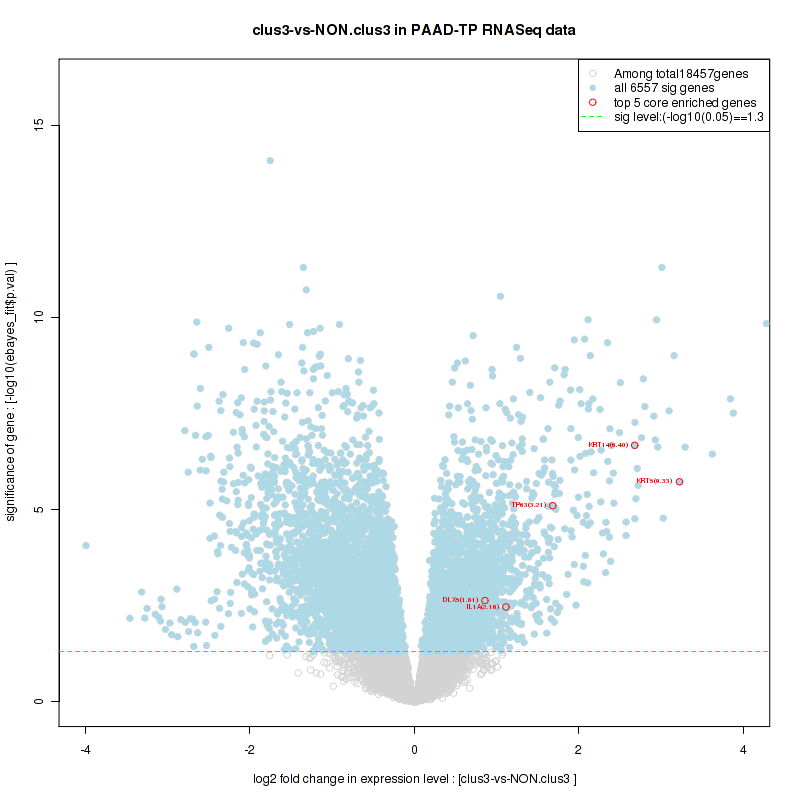
Table S30. Get Full Table This table shows a Running Enrichment Score (RES) of each gene in this pathway, that is, the enrichment score at this point in the ranked list of genes. All genes are ranked by Signal-to-Noise (S2N), a measure of similarity as default and are used to obtain ES matrix of all genes. In this way, GSEA tool uses expression pattern of not only overlapped genes but also not-overlapped genes to produce ES matrix.
| Rank | GENE | SYMBOL | DESC | LIST.LOC | S2N | RES | CORE_ENRICHMENT |
|---|---|---|---|---|---|---|---|
| 1 | FANCB | FANCB | FANCB | 357 | 0.32 | 0.031 | YES |
| 2 | FANCA | FANCA | FANCA | 397 | 0.3 | 0.077 | YES |
| 3 | BRIP1 | BRIP1 | BRIP1 | 412 | 0.3 | 0.12 | YES |
| 4 | RAD51 | RAD51 | RAD51 | 517 | 0.28 | 0.16 | YES |
| 5 | POLE2 | POLE2 | POLE2 | 857 | 0.22 | 0.18 | YES |
| 6 | C19orf40 | C19orf40 | C19orf40 | 1068 | 0.2 | 0.2 | YES |
| 7 | UBE2T | UBE2T | UBE2T | 1300 | 0.17 | 0.21 | YES |
| 8 | RFC4 | RFC4 | RFC4 | 1365 | 0.17 | 0.24 | YES |
| 9 | BRCA2 | BRCA2 | BRCA2 | 1413 | 0.16 | 0.26 | YES |
| 10 | FANCD2 | FANCD2 | FANCD2 | 1459 | 0.16 | 0.28 | YES |
| 11 | FANCE | FANCE | FANCE | 2041 | 0.12 | 0.27 | YES |
| 12 | POLB | POLB | POLB | 2094 | 0.11 | 0.28 | YES |
| 13 | MNAT1 | MNAT1 | MNAT1 | 2403 | 0.098 | 0.28 | YES |
| 14 | RFC2 | RFC2 | RFC2 | 2435 | 0.097 | 0.3 | YES |
| 15 | H2AFX | H2AFX | H2AFX | 2484 | 0.095 | 0.31 | YES |
| 16 | POLD1 | POLD1 | POLD1 | 2510 | 0.094 | 0.32 | YES |
| 17 | POLR2H | POLR2H | POLR2H | 2538 | 0.092 | 0.34 | YES |
| 18 | FEN1 | FEN1 | FEN1 | 2771 | 0.084 | 0.34 | YES |
| 19 | FANCG | FANCG | FANCG | 3126 | 0.073 | 0.33 | YES |
| 20 | PALB2 | PALB2 | PALB2 | 3264 | 0.07 | 0.33 | YES |
| 21 | RPA3 | RPA3 | RPA3 | 3390 | 0.067 | 0.34 | YES |
| 22 | GTF2H3 | GTF2H3 | GTF2H3 | 3447 | 0.066 | 0.34 | YES |
| 23 | RFC5 | RFC5 | RFC5 | 3577 | 0.062 | 0.35 | YES |
| 24 | CDK7 | CDK7 | CDK7 | 3599 | 0.061 | 0.36 | YES |
| 25 | PRKDC | PRKDC | PRKDC | 3620 | 0.061 | 0.36 | YES |
| 26 | POLR2D | POLR2D | POLR2D | 3787 | 0.057 | 0.36 | YES |
| 27 | LIG1 | LIG1 | LIG1 | 3804 | 0.056 | 0.37 | YES |
| 28 | MPG | MPG | MPG | 3839 | 0.056 | 0.38 | YES |
| 29 | MAD2L2 | MAD2L2 | MAD2L2 | 3847 | 0.056 | 0.39 | YES |
| 30 | TCEA1 | TCEA1 | TCEA1 | 3929 | 0.054 | 0.39 | YES |
| 31 | BRCA1 | BRCA1 | BRCA1 | 3945 | 0.053 | 0.4 | YES |
| 32 | POLD4 | POLD4 | POLD4 | 4167 | 0.049 | 0.4 | YES |
| 33 | MRE11A | MRE11A | MRE11A | 4172 | 0.049 | 0.4 | YES |
| 34 | PCNA | PCNA | PCNA | 4202 | 0.048 | 0.41 | YES |
| 35 | ERCC3 | ERCC3 | ERCC3 | 4346 | 0.046 | 0.41 | YES |
| 36 | RFC3 | RFC3 | RFC3 | 4368 | 0.045 | 0.42 | YES |
| 37 | ERCC2 | ERCC2 | ERCC2 | 4370 | 0.045 | 0.42 | YES |
| 38 | C17orf70 | C17orf70 | C17orf70 | 4403 | 0.045 | 0.43 | YES |
| 39 | GTF2H4 | GTF2H4 | GTF2H4 | 4543 | 0.042 | 0.43 | NO |
| 40 | ATR | ATR | ATR | 4674 | 0.04 | 0.43 | NO |
| 41 | XRCC5 | XRCC5 | XRCC5 | 4870 | 0.037 | 0.42 | NO |
| 42 | POLR2K | POLR2K | POLR2K | 4930 | 0.036 | 0.42 | NO |
| 43 | POLE | POLE | POLE | 5120 | 0.034 | 0.42 | NO |
| 44 | TP53BP1 | TP53BP1 | TP53BP1 | 5273 | 0.032 | 0.42 | NO |
| 45 | MGMT | MGMT | MGMT | 5379 | 0.03 | 0.41 | NO |
| 46 | TDP1 | TDP1 | TDP1 | 5678 | 0.026 | 0.4 | NO |
| 47 | FANCL | FANCL | FANCL | 5823 | 0.024 | 0.4 | NO |
| 48 | XRCC1 | XRCC1 | XRCC1 | 5868 | 0.024 | 0.4 | NO |
| 49 | USP1 | USP1 | USP1 | 5885 | 0.023 | 0.4 | NO |
| 50 | NBN | NBN | NBN | 5912 | 0.023 | 0.4 | NO |
| 51 | DDB2 | DDB2 | DDB2 | 5915 | 0.023 | 0.41 | NO |
| 52 | APEX1 | APEX1 | APEX1 | 5981 | 0.022 | 0.41 | NO |
| 53 | POLR2G | POLR2G | POLR2G | 6039 | 0.022 | 0.41 | NO |
| 54 | XRCC6 | XRCC6 | XRCC6 | 6049 | 0.021 | 0.41 | NO |
| 55 | TDG | TDG | TDG | 6266 | 0.019 | 0.4 | NO |
| 56 | POLR2I | POLR2I | POLR2I | 6411 | 0.017 | 0.4 | NO |
| 57 | ALKBH2 | ALKBH2 | ALKBH2 | 6451 | 0.017 | 0.4 | NO |
| 58 | RAD23B | RAD23B | RAD23B | 6561 | 0.015 | 0.4 | NO |
| 59 | ERCC1 | ERCC1 | ERCC1 | 6578 | 0.015 | 0.4 | NO |
| 60 | REV1 | REV1 | REV1 | 6649 | 0.014 | 0.4 | NO |
| 61 | GTF2H2 | GTF2H2 | GTF2H2 | 6864 | 0.012 | 0.38 | NO |
| 62 | NTHL1 | NTHL1 | NTHL1 | 7003 | 0.011 | 0.38 | NO |
| 63 | POLD2 | POLD2 | POLD2 | 7077 | 0.01 | 0.38 | NO |
| 64 | DDB1 | DDB1 | DDB1 | 7222 | 0.0086 | 0.37 | NO |
| 65 | LIG3 | LIG3 | LIG3 | 7262 | 0.0082 | 0.37 | NO |
| 66 | POLR2L | POLR2L | POLR2L | 7504 | 0.0054 | 0.36 | NO |
| 67 | POLR2C | POLR2C | POLR2C | 7549 | 0.0049 | 0.36 | NO |
| 68 | ERCC6 | ERCC6 | ERCC6 | 7603 | 0.0041 | 0.35 | NO |
| 69 | POLR2F | POLR2F | POLR2F | 7642 | 0.0036 | 0.35 | NO |
| 70 | MUTYH | MUTYH | MUTYH | 7671 | 0.0033 | 0.35 | NO |
| 71 | CCNO | CCNO | CCNO | 7685 | 0.0031 | 0.35 | NO |
| 72 | POLR2E | POLR2E | POLR2E | 7829 | 0.0014 | 0.34 | NO |
| 73 | SMUG1 | SMUG1 | SMUG1 | 8241 | -0.003 | 0.32 | NO |
| 74 | GTF2H1 | GTF2H1 | GTF2H1 | 8344 | -0.0042 | 0.32 | NO |
| 75 | MBD4 | MBD4 | MBD4 | 8705 | -0.008 | 0.3 | NO |
| 76 | RPS27A | RPS27A | RPS27A | 8932 | -0.01 | 0.29 | NO |
| 77 | RAD50 | RAD50 | RAD50 | 9044 | -0.012 | 0.28 | NO |
| 78 | RPA2 | RPA2 | RPA2 | 9089 | -0.012 | 0.28 | NO |
| 79 | POLR2A | POLR2A | POLR2A | 9134 | -0.013 | 0.28 | NO |
| 80 | FANCM | FANCM | FANCM | 9186 | -0.014 | 0.28 | NO |
| 81 | XAB2 | XAB2 | XAB2 | 9309 | -0.015 | 0.28 | NO |
| 82 | POLR2B | POLR2B | POLR2B | 9455 | -0.016 | 0.27 | NO |
| 83 | CCNH | CCNH | CCNH | 9461 | -0.016 | 0.27 | NO |
| 84 | POLR2J | POLR2J | POLR2J | 9639 | -0.018 | 0.27 | NO |
| 85 | POLD3 | POLD3 | POLD3 | 9730 | -0.019 | 0.27 | NO |
| 86 | ERCC8 | ERCC8 | ERCC8 | 9949 | -0.022 | 0.26 | NO |
| 87 | FANCF | FANCF | FANCF | 9983 | -0.022 | 0.26 | NO |
| 88 | RPA1 | RPA1 | RPA1 | 10536 | -0.028 | 0.23 | NO |
| 89 | MDC1 | MDC1 | MDC1 | 10550 | -0.029 | 0.24 | NO |
| 90 | OGG1 | OGG1 | OGG1 | 10623 | -0.03 | 0.24 | NO |
| 91 | ALKBH3 | ALKBH3 | ALKBH3 | 10981 | -0.035 | 0.22 | NO |
| 92 | RAD52 | RAD52 | RAD52 | 11343 | -0.04 | 0.21 | NO |
| 93 | UBA52 | UBA52 | UBA52 | 11476 | -0.042 | 0.21 | NO |
| 94 | XPC | XPC | XPC | 11488 | -0.043 | 0.22 | NO |
| 95 | ATM | ATM | ATM | 11624 | -0.045 | 0.22 | NO |
| 96 | ERCC5 | ERCC5 | ERCC5 | 11723 | -0.046 | 0.22 | NO |
| 97 | POLH | POLH | POLH | 12317 | -0.058 | 0.2 | NO |
| 98 | ERCC4 | ERCC4 | ERCC4 | 12330 | -0.058 | 0.2 | NO |
| 99 | LIG4 | LIG4 | LIG4 | 13015 | -0.073 | 0.18 | NO |
| 100 | FANCC | FANCC | FANCC | 13242 | -0.079 | 0.18 | NO |
| 101 | XPA | XPA | XPA | 13539 | -0.087 | 0.18 | NO |
| 102 | XRCC4 | XRCC4 | XRCC4 | 14442 | -0.12 | 0.15 | NO |
| 103 | ZBTB32 | ZBTB32 | ZBTB32 | 14587 | -0.13 | 0.16 | NO |
| 104 | REV3L | REV3L | REV3L | 14756 | -0.13 | 0.17 | NO |
| 105 | GTF2H2B | GTF2H2B | GTF2H2B | 15863 | -0.2 | 0.14 | NO |
Figure S59. Get High-res Image This plot shows mRNAseq_cNMF expression data heatmap (on the left) a RunningEnrichmentScore(RES) plot (on the top right) and a Signal2Noise(S2N) plot (on the bottom right) of genes in the pathway: PID PLK1 PATHWAY.
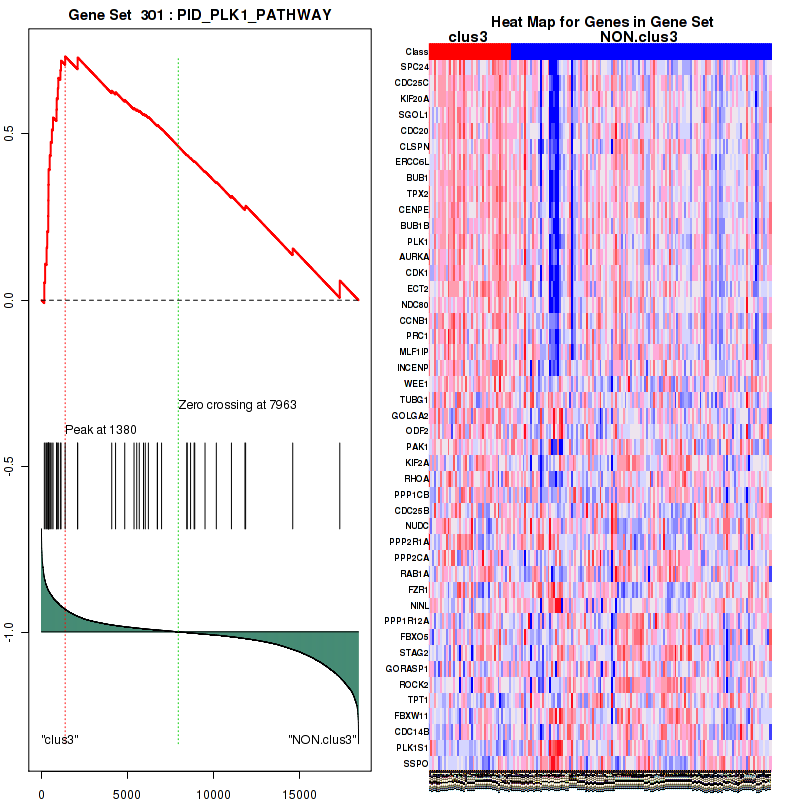
Figure S60. Get High-res Image For the top 5 core enriched genes in the pathway: PID PLK1 PATHWAY, this volcano plot shows how much they are up/down-regulated and significant. The significance was calculated by empirical bayesian fit

For the top enriched genes, if you want to check whether they are
-
up-regulated, please check the list of up-regulated genes
-
down-regulated, please check the list of down-regulated genes
For the top enriched genes, if you want to check whether they are
-
highly expressed genes, please check the list of high (top 30%) expressed genes
-
low expressed genes, please check the list of low (bottom 30%) expressed genes
An expression pattern of top(30%)/middle(30%)/low(30%) in this subtype against other subtypes is available in a heatmap
For the top enriched genes, if you want to check whether they are
-
significantly differently expressed genes by eBayes lm fit, please check the list of significant genes
Table 6. Get Full Table This table shows top 10 pathways which are significantly enriched in cluster clus4. It displays only significant gene sets satisfying nom.p.val.threshold (-1), fwer.p.val.threshold (-1) , fdr.q.val.threshold (0.25) and the default table is sorted by Normalized Enrichment Score (NES). Further details on NES statistics, please visit The Broad GSEA website.
| GeneSet(GS) | Size(#genes) | genes.ES.table | ES | NES | NOM.p.val | FDR.q.val | FWER.p.val | Tag.. | Gene.. | Signal | FDR..median. | glob.p.val |
|---|---|---|---|---|---|---|---|---|---|---|---|---|
| KEGG FATTY ACID METABOLISM | 38 | genes.ES.table | 0.6 | 1.8 | 0.004 | 0.26 | 0.6 | 0.21 | 0.093 | 0.19 | 0.088 | 0.069 |
| KEGG SELENOAMINO ACID METABOLISM | 26 | genes.ES.table | 0.76 | 2.3 | 0 | 0.082 | 0.021 | 0.19 | 0.03 | 0.19 | 0 | 0.021 |
| KEGG GLUTATHIONE METABOLISM | 46 | genes.ES.table | 0.6 | 1.9 | 0 | 0.2 | 0.36 | 0.11 | 0.028 | 0.11 | 0 | 0.049 |
| KEGG GLYCEROLIPID METABOLISM | 48 | genes.ES.table | 0.65 | 2 | 0 | 0.2 | 0.11 | 0.1 | 0.014 | 0.1 | 0 | 0.05 |
| KEGG PROPANOATE METABOLISM | 32 | genes.ES.table | 0.56 | 1.9 | 0.0041 | 0.22 | 0.35 | 0.56 | 0.28 | 0.41 | 0 | 0.055 |
| KEGG ENDOCYTOSIS | 179 | genes.ES.table | 0.39 | 1.8 | 0 | 0.24 | 0.5 | 0.26 | 0.25 | 0.2 | 0 | 0.06 |
| SIG PIP3 SIGNALING IN CARDIAC MYOCTES | 67 | genes.ES.table | 0.52 | 2 | 0 | 0.18 | 0.13 | 0.12 | 0.086 | 0.11 | 0 | 0.047 |
| SIG CHEMOTAXIS | 44 | genes.ES.table | 0.59 | 1.8 | 0.0021 | 0.23 | 0.51 | 0.16 | 0.086 | 0.15 | 0.059 | 0.059 |
| SIG REGULATION OF THE ACTIN CYTOSKELETON BY RHO GTPASES | 35 | genes.ES.table | 0.61 | 1.9 | 0 | 0.26 | 0.28 | 0.086 | 0.018 | 0.084 | 0 | 0.06 |
| PID INSULIN PATHWAY | 45 | genes.ES.table | 0.49 | 1.9 | 0.0021 | 0.25 | 0.23 | 0.31 | 0.26 | 0.23 | 0 | 0.06 |
Table S31. Get Full Table This table shows a Running Enrichment Score (RES) of each gene in this pathway, that is, the enrichment score at this point in the ranked list of genes. All genes are ranked by Signal-to-Noise (S2N), a measure of similarity as default and are used to obtain ES matrix of all genes. In this way, GSEA tool uses expression pattern of not only overlapped genes but also not-overlapped genes to produce ES matrix.
| Rank | GENE | SYMBOL | DESC | LIST.LOC | S2N | RES | CORE_ENRICHMENT |
|---|---|---|---|---|---|---|---|
| 1 | MAT1A | MAT1A | MAT1A | 158 | 0.63 | 0.2 | YES |
| 2 | CBS | CBS | CBS | 191 | 0.58 | 0.4 | YES |
| 3 | GGT6 | GGT6 | GGT6 | 412 | 0.41 | 0.52 | YES |
| 4 | GGT1 | GGT1 | GGT1 | 518 | 0.36 | 0.64 | YES |
| 5 | CTH | CTH | CTH | 554 | 0.35 | 0.76 | YES |
| 6 | SCLY | SCLY | SCLY | 1937 | 0.17 | 0.74 | NO |
| 7 | GGT7 | GGT7 | GGT7 | 4489 | 0.066 | 0.62 | NO |
| 8 | AHCYL1 | AHCYL1 | AHCYL1 | 4679 | 0.062 | 0.63 | NO |
| 9 | LCMT2 | LCMT2 | LCMT2 | 5585 | 0.046 | 0.6 | NO |
| 10 | PAPSS1 | PAPSS1 | PAPSS1 | 6214 | 0.037 | 0.57 | NO |
| 11 | MARS2 | MARS2 | MARS2 | 6606 | 0.032 | 0.56 | NO |
| 12 | PAPSS2 | PAPSS2 | PAPSS2 | 7018 | 0.027 | 0.55 | NO |
| 13 | MAT2B | MAT2B | MAT2B | 7088 | 0.026 | 0.56 | NO |
| 14 | MAT2A | MAT2A | MAT2A | 7577 | 0.022 | 0.54 | NO |
| 15 | AHCYL2 | AHCYL2 | AHCYL2 | 7628 | 0.021 | 0.54 | NO |
| 16 | GGT5 | GGT5 | GGT5 | 8136 | 0.016 | 0.52 | NO |
| 17 | LCMT1 | LCMT1 | LCMT1 | 8321 | 0.014 | 0.51 | NO |
| 18 | SEPHS1 | SEPHS1 | SEPHS1 | 8626 | 0.011 | 0.5 | NO |
| 19 | METTL2B | METTL2B | METTL2B | 9346 | 0.0041 | 0.46 | NO |
| 20 | METTL6 | METTL6 | METTL6 | 9688 | 0.0012 | 0.44 | NO |
| 21 | SEPHS2 | SEPHS2 | SEPHS2 | 9778 | 0.00046 | 0.44 | NO |
| 22 | HEMK1 | HEMK1 | HEMK1 | 9934 | -0.00073 | 0.43 | NO |
| 23 | MARS | MARS | MARS | 10468 | -0.0054 | 0.41 | NO |
| 24 | AHCY | AHCY | AHCY | 10508 | -0.0057 | 0.4 | NO |
| 25 | TRMT11 | TRMT11 | TRMT11 | 12457 | -0.024 | 0.31 | NO |
| 26 | WBSCR22 | WBSCR22 | WBSCR22 | 14632 | -0.053 | 0.21 | NO |
Figure S61. Get High-res Image This plot shows mRNAseq_cNMF expression data heatmap (on the left) a RunningEnrichmentScore(RES) plot (on the top right) and a Signal2Noise(S2N) plot (on the bottom right) of genes in the pathway: KEGG FATTY ACID METABOLISM.
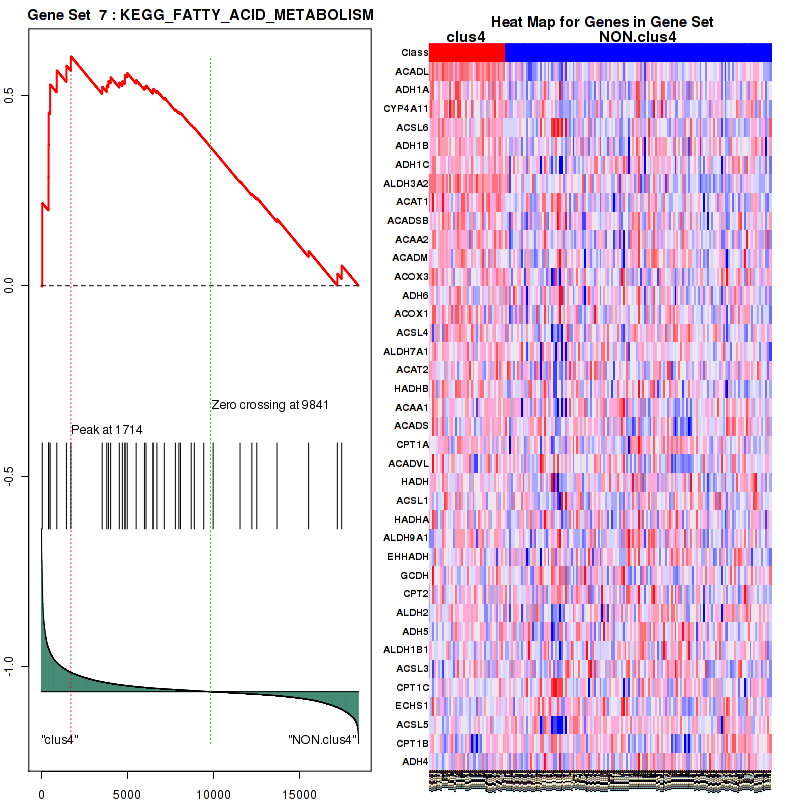
Figure S62. Get High-res Image For the top 5 core enriched genes in the pathway: KEGG FATTY ACID METABOLISM, this volcano plot shows how much they are up/down-regulated and significant. The significance was calculated by empirical bayesian fit

Table S32. Get Full Table This table shows a Running Enrichment Score (RES) of each gene in this pathway, that is, the enrichment score at this point in the ranked list of genes. All genes are ranked by Signal-to-Noise (S2N), a measure of similarity as default and are used to obtain ES matrix of all genes. In this way, GSEA tool uses expression pattern of not only overlapped genes but also not-overlapped genes to produce ES matrix.
| Rank | GENE | SYMBOL | DESC | LIST.LOC | S2N | RES | CORE_ENRICHMENT |
|---|---|---|---|---|---|---|---|
| 1 | EGF | EGF | EGF | 52 | 1 | 0.22 | YES |
| 2 | ERBB4 | ERBB4 | ERBB4 | 74 | 0.86 | 0.42 | YES |
| 3 | NRG4 | NRG4 | NRG4 | 144 | 0.64 | 0.56 | YES |
| 4 | NRG2 | NRG2 | NRG2 | 674 | 0.32 | 0.6 | YES |
| 5 | PHLPP1 | PHLPP1 | PHLPP1 | 2165 | 0.15 | 0.55 | NO |
| 6 | EGFR | EGFR | EGFR | 2872 | 0.12 | 0.54 | NO |
| 7 | FOXO3 | FOXO3 | FOXO3 | 3797 | 0.084 | 0.51 | NO |
| 8 | CASP9 | CASP9 | CASP9 | 3916 | 0.08 | 0.52 | NO |
| 9 | GAB1 | GAB1 | GAB1 | 4477 | 0.066 | 0.5 | NO |
| 10 | PIK3R1 | PIK3R1 | PIK3R1 | 4539 | 0.065 | 0.51 | NO |
| 11 | AKT3 | AKT3 | AKT3 | 4561 | 0.065 | 0.53 | NO |
| 12 | FOXO4 | FOXO4 | FOXO4 | 4886 | 0.058 | 0.52 | NO |
| 13 | PIK3CA | PIK3CA | PIK3CA | 5589 | 0.046 | 0.5 | NO |
| 14 | FOXO1 | FOXO1 | FOXO1 | 5701 | 0.044 | 0.5 | NO |
| 15 | PDPK1 | PDPK1 | PDPK1 | 5702 | 0.044 | 0.51 | NO |
| 16 | THEM4 | THEM4 | THEM4 | 5835 | 0.042 | 0.51 | NO |
| 17 | PTEN | PTEN | PTEN | 6302 | 0.036 | 0.49 | NO |
| 18 | MTOR | MTOR | MTOR | 6342 | 0.035 | 0.5 | NO |
| 19 | ERBB3 | ERBB3 | ERBB3 | 6719 | 0.03 | 0.48 | NO |
| 20 | MAPKAP1 | MAPKAP1 | MAPKAP1 | 6993 | 0.028 | 0.48 | NO |
| 21 | BTC | BTC | BTC | 7279 | 0.024 | 0.47 | NO |
| 22 | CREB1 | CREB1 | CREB1 | 7490 | 0.022 | 0.46 | NO |
| 23 | TRIB3 | TRIB3 | TRIB3 | 7930 | 0.018 | 0.44 | NO |
| 24 | RICTOR | RICTOR | RICTOR | 9171 | 0.0059 | 0.37 | NO |
| 25 | CHUK | CHUK | CHUK | 9228 | 0.0054 | 0.37 | NO |
| 26 | CDKN1B | CDKN1B | CDKN1B | 9491 | 0.0028 | 0.36 | NO |
| 27 | GRB2 | GRB2 | GRB2 | 9686 | 0.0012 | 0.35 | NO |
| 28 | NRG1 | NRG1 | NRG1 | 9829 | 0.000096 | 0.34 | NO |
| 29 | MDM2 | MDM2 | MDM2 | 10293 | -0.0039 | 0.32 | NO |
| 30 | AKT1 | AKT1 | AKT1 | 11563 | -0.015 | 0.25 | NO |
| 31 | ERBB2 | ERBB2 | ERBB2 | 11821 | -0.018 | 0.24 | NO |
| 32 | MLST8 | MLST8 | MLST8 | 11860 | -0.018 | 0.24 | NO |
| 33 | TSC2 | TSC2 | TSC2 | 12129 | -0.02 | 0.23 | NO |
| 34 | AKT2 | AKT2 | AKT2 | 12227 | -0.021 | 0.23 | NO |
| 35 | RPS6KB2 | RPS6KB2 | RPS6KB2 | 12422 | -0.023 | 0.23 | NO |
| 36 | HBEGF | HBEGF | HBEGF | 13015 | -0.029 | 0.2 | NO |
| 37 | GSK3A | GSK3A | GSK3A | 13311 | -0.033 | 0.19 | NO |
| 38 | AKT1S1 | AKT1S1 | AKT1S1 | 13907 | -0.041 | 0.17 | NO |
| 39 | CDKN1A | CDKN1A | CDKN1A | 14113 | -0.044 | 0.17 | NO |
| 40 | BAD | BAD | BAD | 14636 | -0.053 | 0.15 | NO |
| 41 | NR4A1 | NR4A1 | NR4A1 | 15984 | -0.087 | 0.098 | NO |
| 42 | EREG | EREG | EREG | 17401 | -0.16 | 0.057 | NO |
Figure S63. Get High-res Image This plot shows mRNAseq_cNMF expression data heatmap (on the left) a RunningEnrichmentScore(RES) plot (on the top right) and a Signal2Noise(S2N) plot (on the bottom right) of genes in the pathway: KEGG SELENOAMINO ACID METABOLISM.
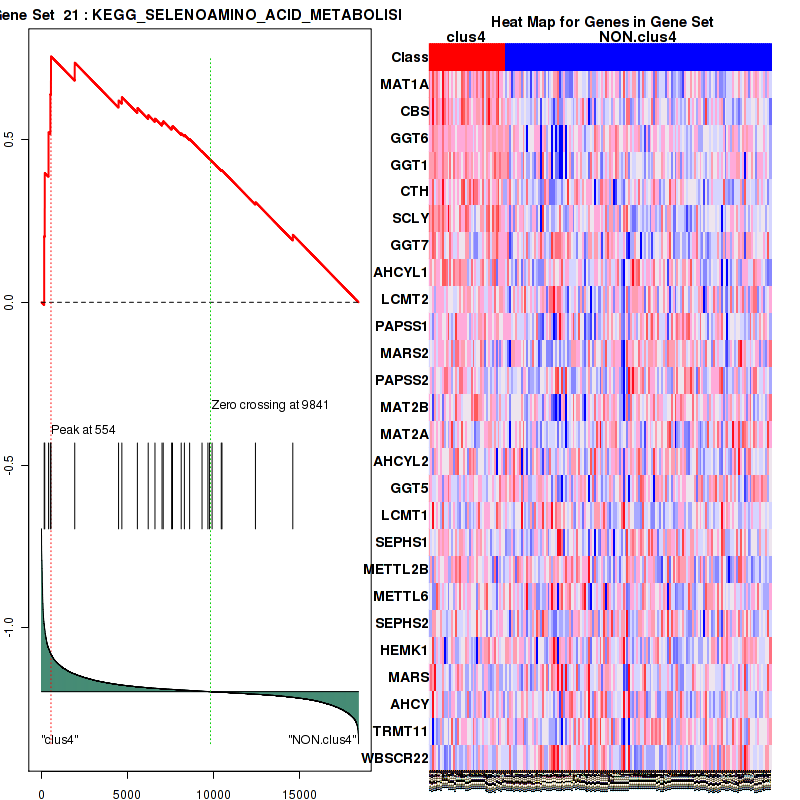
Figure S64. Get High-res Image For the top 5 core enriched genes in the pathway: KEGG SELENOAMINO ACID METABOLISM, this volcano plot shows how much they are up/down-regulated and significant. The significance was calculated by empirical bayesian fit
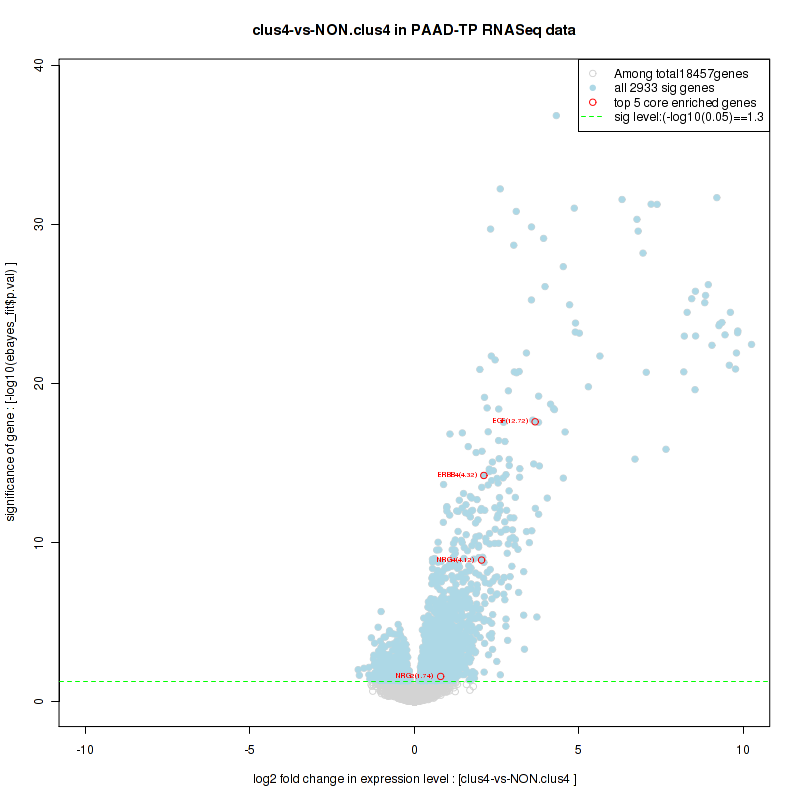
Table S33. Get Full Table This table shows a Running Enrichment Score (RES) of each gene in this pathway, that is, the enrichment score at this point in the ranked list of genes. All genes are ranked by Signal-to-Noise (S2N), a measure of similarity as default and are used to obtain ES matrix of all genes. In this way, GSEA tool uses expression pattern of not only overlapped genes but also not-overlapped genes to produce ES matrix.
| Rank | GENE | SYMBOL | DESC | LIST.LOC | S2N | RES | CORE_ENRICHMENT |
|---|---|---|---|---|---|---|---|
| 1 | PNLIPRP1 | PNLIPRP1 | PNLIPRP1 | 10 | 1.3 | 0.16 | YES |
| 2 | PNLIPRP2 | PNLIPRP2 | PNLIPRP2 | 18 | 1.3 | 0.31 | YES |
| 3 | PNLIP | PNLIP | PNLIP | 23 | 1.2 | 0.46 | YES |
| 4 | CEL | CEL | CEL | 26 | 1.2 | 0.6 | YES |
| 5 | LIPC | LIPC | LIPC | 251 | 0.52 | 0.65 | YES |
| 6 | ALDH3A2 | ALDH3A2 | ALDH3A2 | 1453 | 0.2 | 0.61 | NO |
| 7 | DGKB | DGKB | DGKB | 2077 | 0.16 | 0.6 | NO |
| 8 | LIPG | LIPG | LIPG | 2570 | 0.13 | 0.59 | NO |
| 9 | PPAP2C | PPAP2C | PPAP2C | 2984 | 0.11 | 0.58 | NO |
| 10 | GPAM | GPAM | GPAM | 3004 | 0.11 | 0.59 | NO |
| 11 | PPAP2B | PPAP2B | PPAP2B | 3329 | 0.098 | 0.58 | NO |
| 12 | LPL | LPL | LPL | 4268 | 0.071 | 0.54 | NO |
| 13 | AGPAT3 | AGPAT3 | AGPAT3 | 4855 | 0.058 | 0.52 | NO |
| 14 | ALDH7A1 | ALDH7A1 | ALDH7A1 | 4860 | 0.058 | 0.52 | NO |
| 15 | MBOAT1 | MBOAT1 | MBOAT1 | 5043 | 0.055 | 0.52 | NO |
| 16 | LIPF | LIPF | LIPF | 5592 | 0.046 | 0.5 | NO |
| 17 | AGPAT4 | AGPAT4 | AGPAT4 | 5872 | 0.042 | 0.48 | NO |
| 18 | PPAP2A | PPAP2A | PPAP2A | 6219 | 0.037 | 0.47 | NO |
| 19 | AKR1B1 | AKR1B1 | AKR1B1 | 6318 | 0.035 | 0.47 | NO |
| 20 | AGPAT6 | AGPAT6 | AGPAT6 | 6338 | 0.035 | 0.47 | NO |
| 21 | ALDH9A1 | ALDH9A1 | ALDH9A1 | 7998 | 0.017 | 0.38 | NO |
| 22 | AKR1A1 | AKR1A1 | AKR1A1 | 8352 | 0.014 | 0.37 | NO |
| 23 | GK | GK | GK | 8753 | 0.0099 | 0.35 | NO |
| 24 | ALDH2 | ALDH2 | ALDH2 | 9447 | 0.0032 | 0.31 | NO |
| 25 | DAK | DAK | DAK | 9669 | 0.0014 | 0.3 | NO |
| 26 | GLA | GLA | GLA | 10171 | -0.0029 | 0.27 | NO |
| 27 | AGPAT1 | AGPAT1 | AGPAT1 | 10273 | -0.0038 | 0.27 | NO |
| 28 | LCLAT1 | LCLAT1 | LCLAT1 | 11416 | -0.014 | 0.2 | NO |
| 29 | ALDH1B1 | ALDH1B1 | ALDH1B1 | 11559 | -0.015 | 0.2 | NO |
| 30 | DGKH | DGKH | DGKH | 12028 | -0.019 | 0.18 | NO |
| 31 | AGPAT2 | AGPAT2 | AGPAT2 | 12167 | -0.021 | 0.17 | NO |
| 32 | PNPLA3 | PNPLA3 | PNPLA3 | 12519 | -0.024 | 0.16 | NO |
| 33 | DGKE | DGKE | DGKE | 12555 | -0.025 | 0.16 | NO |
| 34 | AGPAT9 | AGPAT9 | AGPAT9 | 12725 | -0.026 | 0.15 | NO |
| 35 | AWAT2 | AWAT2 | AWAT2 | 12755 | -0.027 | 0.15 | NO |
| 36 | AGK | AGK | AGK | 13908 | -0.041 | 0.094 | NO |
| 37 | GPAT2 | GPAT2 | GPAT2 | 13929 | -0.041 | 0.098 | NO |
| 38 | DGKG | DGKG | DGKG | 14708 | -0.055 | 0.062 | NO |
| 39 | DGKZ | DGKZ | DGKZ | 14838 | -0.057 | 0.062 | NO |
| 40 | DGKD | DGKD | DGKD | 15064 | -0.062 | 0.057 | NO |
| 41 | MGLL | MGLL | MGLL | 15674 | -0.077 | 0.034 | NO |
| 42 | DGKQ | DGKQ | DGKQ | 16006 | -0.088 | 0.026 | NO |
| 43 | DGKA | DGKA | DGKA | 16532 | -0.11 | 0.011 | NO |
| 44 | DGAT1 | DGAT1 | DGAT1 | 16625 | -0.12 | 0.019 | NO |
| 45 | GLYCTK | GLYCTK | GLYCTK | 16755 | -0.12 | 0.027 | NO |
| 46 | DGKI | DGKI | DGKI | 17095 | -0.14 | 0.025 | NO |
| 47 | MBOAT2 | MBOAT2 | MBOAT2 | 17495 | -0.17 | 0.024 | NO |
| 48 | DGAT2 | DGAT2 | DGAT2 | 18086 | -0.24 | 0.02 | NO |
Figure S65. Get High-res Image This plot shows mRNAseq_cNMF expression data heatmap (on the left) a RunningEnrichmentScore(RES) plot (on the top right) and a Signal2Noise(S2N) plot (on the bottom right) of genes in the pathway: KEGG GLUTATHIONE METABOLISM.
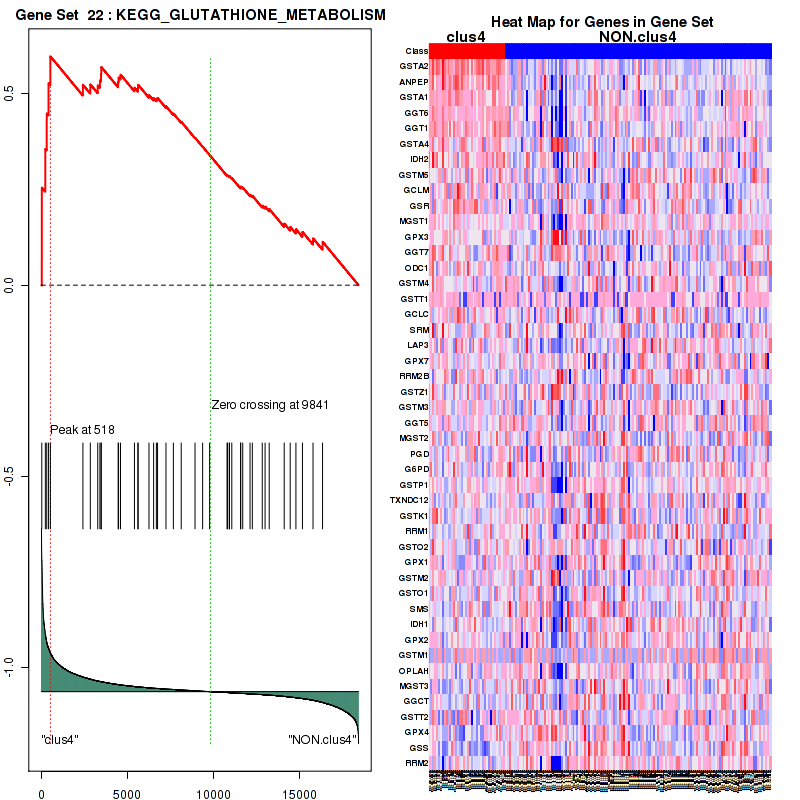
Figure S66. Get High-res Image For the top 5 core enriched genes in the pathway: KEGG GLUTATHIONE METABOLISM, this volcano plot shows how much they are up/down-regulated and significant. The significance was calculated by empirical bayesian fit
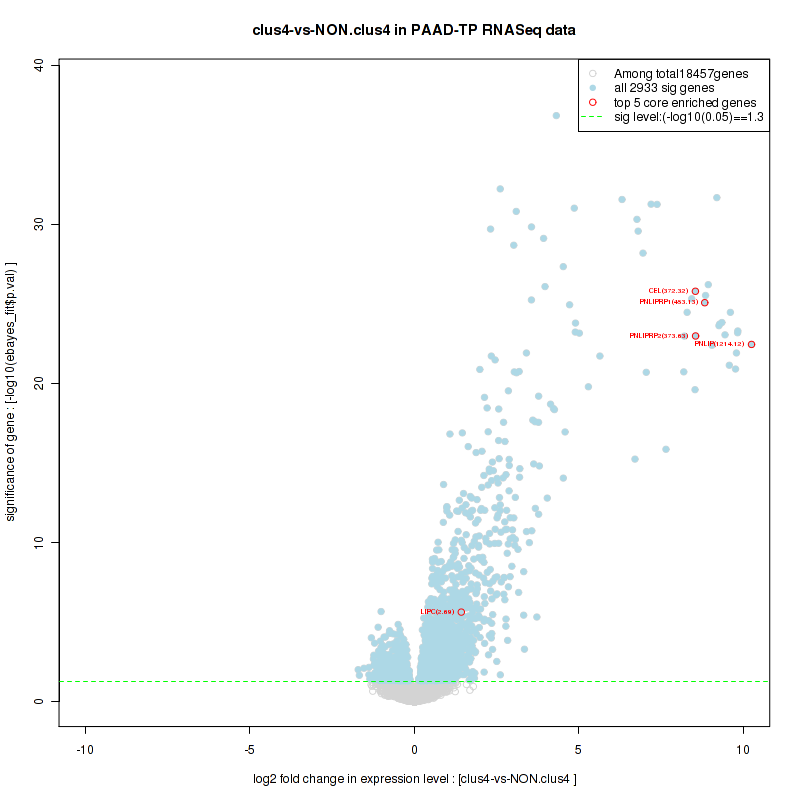
Table S34. Get Full Table This table shows a Running Enrichment Score (RES) of each gene in this pathway, that is, the enrichment score at this point in the ranked list of genes. All genes are ranked by Signal-to-Noise (S2N), a measure of similarity as default and are used to obtain ES matrix of all genes. In this way, GSEA tool uses expression pattern of not only overlapped genes but also not-overlapped genes to produce ES matrix.
| Rank | GENE | SYMBOL | DESC | LIST.LOC | S2N | RES | CORE_ENRICHMENT |
|---|---|---|---|---|---|---|---|
| 1 | ERBB4 | ERBB4 | ERBB4 | 74 | 0.86 | 0.15 | YES |
| 2 | PAK7 | PAK7 | PAK7 | 81 | 0.83 | 0.3 | YES |
| 3 | PAK3 | PAK3 | PAK3 | 325 | 0.45 | 0.37 | YES |
| 4 | F2RL2 | F2RL2 | F2RL2 | 662 | 0.32 | 0.41 | YES |
| 5 | IGF1 | IGF1 | IGF1 | 1038 | 0.25 | 0.44 | YES |
| 6 | CREB5 | CREB5 | CREB5 | 1291 | 0.22 | 0.46 | YES |
| 7 | IRS4 | IRS4 | IRS4 | 1379 | 0.21 | 0.5 | YES |
| 8 | PIK3R5 | PIK3R5 | PIK3R5 | 1584 | 0.19 | 0.52 | YES |
| 9 | PARD6A | PARD6A | PARD6A | 3019 | 0.11 | 0.46 | NO |
| 10 | PIK3CD | PIK3CD | PIK3CD | 3035 | 0.11 | 0.48 | NO |
| 11 | PREX1 | PREX1 | PREX1 | 3448 | 0.094 | 0.47 | NO |
| 12 | FOXO3 | FOXO3 | FOXO3 | 3797 | 0.084 | 0.47 | NO |
| 13 | RPS6KA2 | RPS6KA2 | RPS6KA2 | 4361 | 0.069 | 0.45 | NO |
| 14 | PARD3 | PARD3 | PARD3 | 4458 | 0.067 | 0.46 | NO |
| 15 | PPP1R13B | PPP1R13B | PPP1R13B | 4465 | 0.067 | 0.47 | NO |
| 16 | GAB1 | GAB1 | GAB1 | 4477 | 0.066 | 0.48 | NO |
| 17 | SOS2 | SOS2 | SOS2 | 4531 | 0.065 | 0.49 | NO |
| 18 | AKT3 | AKT3 | AKT3 | 4561 | 0.065 | 0.5 | NO |
| 19 | PIK3CA | PIK3CA | PIK3CA | 5589 | 0.046 | 0.45 | NO |
| 20 | CYTH3 | CYTH3 | CYTH3 | 6247 | 0.036 | 0.42 | NO |
| 21 | PTEN | PTEN | PTEN | 6302 | 0.036 | 0.43 | NO |
| 22 | MTOR | MTOR | MTOR | 6342 | 0.035 | 0.43 | NO |
| 23 | MYC | MYC | MYC | 6349 | 0.035 | 0.44 | NO |
| 24 | SOS1 | SOS1 | SOS1 | 6382 | 0.034 | 0.44 | NO |
| 25 | RPS6KB1 | RPS6KB1 | RPS6KB1 | 7477 | 0.022 | 0.39 | NO |
| 26 | CREB1 | CREB1 | CREB1 | 7490 | 0.022 | 0.39 | NO |
| 27 | YWHAQ | YWHAQ | YWHAQ | 8541 | 0.012 | 0.34 | NO |
| 28 | PTK2 | PTK2 | PTK2 | 8715 | 0.01 | 0.33 | NO |
| 29 | PAK6 | PAK6 | PAK6 | 8949 | 0.008 | 0.32 | NO |
| 30 | RPS6KA3 | RPS6KA3 | RPS6KA3 | 9062 | 0.007 | 0.31 | NO |
| 31 | YWHAE | YWHAE | YWHAE | 9253 | 0.0052 | 0.3 | NO |
| 32 | CDKN1B | CDKN1B | CDKN1B | 9491 | 0.0028 | 0.29 | NO |
| 33 | GRB2 | GRB2 | GRB2 | 9686 | 0.0012 | 0.28 | NO |
| 34 | MET | MET | MET | 9731 | 0.00083 | 0.28 | NO |
| 35 | TSC1 | TSC1 | TSC1 | 9983 | -0.0011 | 0.26 | NO |
| 36 | GSK3B | GSK3B | GSK3B | 10067 | -0.0019 | 0.26 | NO |
| 37 | PAK2 | PAK2 | PAK2 | 10118 | -0.0025 | 0.26 | NO |
| 38 | IRS1 | IRS1 | IRS1 | 10266 | -0.0037 | 0.25 | NO |
| 39 | CDK2 | CDK2 | CDK2 | 10557 | -0.0062 | 0.24 | NO |
| 40 | CDC42 | CDC42 | CDC42 | 10625 | -0.0068 | 0.23 | NO |
| 41 | CREB3 | CREB3 | CREB3 | 10787 | -0.0081 | 0.23 | NO |
| 42 | SHC1 | SHC1 | SHC1 | 11438 | -0.014 | 0.19 | NO |
| 43 | AKT1 | AKT1 | AKT1 | 11563 | -0.015 | 0.19 | NO |
| 44 | YWHAB | YWHAB | YWHAB | 11921 | -0.018 | 0.17 | NO |
| 45 | YWHAZ | YWHAZ | YWHAZ | 11942 | -0.019 | 0.18 | NO |
| 46 | INPPL1 | INPPL1 | INPPL1 | 11969 | -0.019 | 0.18 | NO |
| 47 | TSC2 | TSC2 | TSC2 | 12129 | -0.02 | 0.17 | NO |
| 48 | NOLC1 | NOLC1 | NOLC1 | 12226 | -0.021 | 0.17 | NO |
| 49 | AKT2 | AKT2 | AKT2 | 12227 | -0.021 | 0.18 | NO |
| 50 | YWHAG | YWHAG | YWHAG | 12250 | -0.022 | 0.18 | NO |
| 51 | SLC2A4 | SLC2A4 | SLC2A4 | 12270 | -0.022 | 0.18 | NO |
| 52 | YWHAH | YWHAH | YWHAH | 12338 | -0.022 | 0.18 | NO |
| 53 | RPS6KA1 | RPS6KA1 | RPS6KA1 | 12660 | -0.026 | 0.17 | NO |
| 54 | PAK1 | PAK1 | PAK1 | 13035 | -0.03 | 0.15 | NO |
| 55 | PTPN1 | PTPN1 | PTPN1 | 13058 | -0.03 | 0.16 | NO |
| 56 | GADD45A | GADD45A | GADD45A | 13140 | -0.031 | 0.16 | NO |
| 57 | IRS2 | IRS2 | IRS2 | 13175 | -0.031 | 0.16 | NO |
| 58 | GSK3A | GSK3A | GSK3A | 13311 | -0.033 | 0.16 | NO |
| 59 | CDKN2A | CDKN2A | CDKN2A | 13653 | -0.037 | 0.15 | NO |
| 60 | BCL2L1 | BCL2L1 | BCL2L1 | 13777 | -0.039 | 0.15 | NO |
| 61 | EBP | EBP | EBP | 14622 | -0.053 | 0.11 | NO |
| 62 | BAD | BAD | BAD | 14636 | -0.053 | 0.12 | NO |
| 63 | PAK4 | PAK4 | PAK4 | 15578 | -0.074 | 0.084 | NO |
| 64 | PDK1 | PDK1 | PDK1 | 15601 | -0.075 | 0.097 | NO |
| 65 | SFN | SFN | SFN | 16074 | -0.09 | 0.087 | NO |
| 66 | IFI27 | IFI27 | IFI27 | 16617 | -0.11 | 0.078 | NO |
| 67 | IGFBP1 | IGFBP1 | IGFBP1 | 16752 | -0.12 | 0.093 | NO |
Figure S67. Get High-res Image This plot shows mRNAseq_cNMF expression data heatmap (on the left) a RunningEnrichmentScore(RES) plot (on the top right) and a Signal2Noise(S2N) plot (on the bottom right) of genes in the pathway: KEGG GLYCEROLIPID METABOLISM.
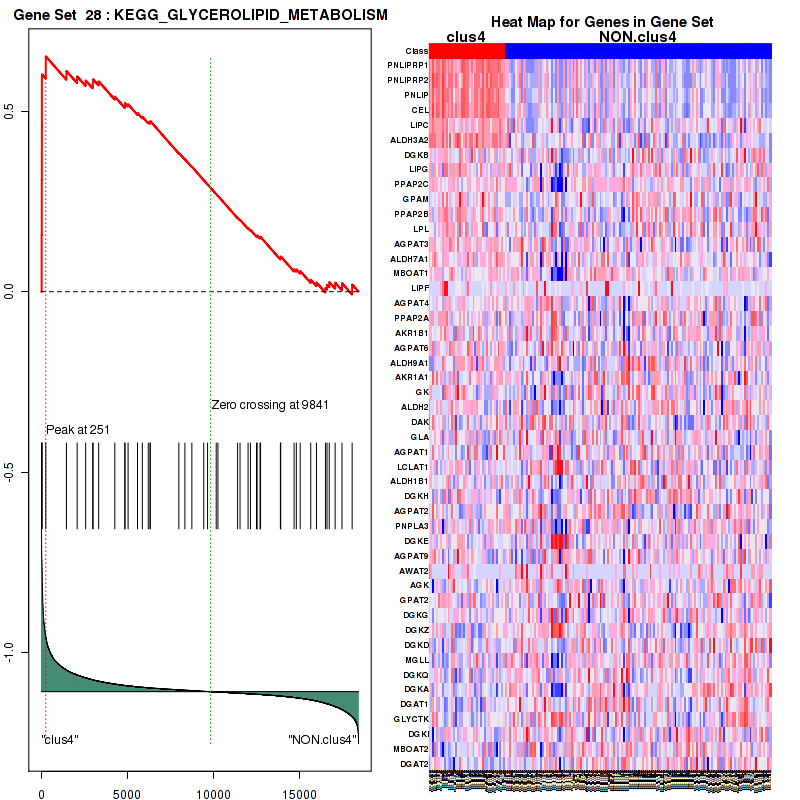
Figure S68. Get High-res Image For the top 5 core enriched genes in the pathway: KEGG GLYCEROLIPID METABOLISM, this volcano plot shows how much they are up/down-regulated and significant. The significance was calculated by empirical bayesian fit

Table S35. Get Full Table This table shows a Running Enrichment Score (RES) of each gene in this pathway, that is, the enrichment score at this point in the ranked list of genes. All genes are ranked by Signal-to-Noise (S2N), a measure of similarity as default and are used to obtain ES matrix of all genes. In this way, GSEA tool uses expression pattern of not only overlapped genes but also not-overlapped genes to produce ES matrix.
| Rank | GENE | SYMBOL | DESC | LIST.LOC | S2N | RES | CORE_ENRICHMENT |
|---|---|---|---|---|---|---|---|
| 1 | GRB14 | GRB14 | GRB14 | 113 | 0.72 | 0.2 | YES |
| 2 | INS | INS | INS | 648 | 0.33 | 0.27 | YES |
| 3 | F2RL2 | F2RL2 | F2RL2 | 662 | 0.32 | 0.36 | YES |
| 4 | GRB10 | GRB10 | GRB10 | 1187 | 0.23 | 0.4 | YES |
| 5 | SGK1 | SGK1 | SGK1 | 1487 | 0.2 | 0.45 | YES |
| 6 | EIF4EBP1 | EIF4EBP1 | EIF4EBP1 | 2127 | 0.15 | 0.46 | YES |
| 7 | INSR | INSR | INSR | 2848 | 0.12 | 0.45 | YES |
| 8 | PARD6A | PARD6A | PARD6A | 3019 | 0.11 | 0.48 | YES |
| 9 | FOXO3 | FOXO3 | FOXO3 | 3797 | 0.084 | 0.46 | YES |
| 10 | EXOC6 | EXOC6 | EXOC6 | 4313 | 0.07 | 0.45 | YES |
| 11 | CRK | CRK | CRK | 4370 | 0.069 | 0.47 | YES |
| 12 | PIK3R1 | PIK3R1 | PIK3R1 | 4539 | 0.065 | 0.48 | YES |
| 13 | INPP5D | INPP5D | INPP5D | 4844 | 0.059 | 0.48 | YES |
| 14 | NCK2 | NCK2 | NCK2 | 4877 | 0.058 | 0.49 | YES |
| 15 | RAPGEF1 | RAPGEF1 | RAPGEF1 | 5432 | 0.048 | 0.48 | NO |
| 16 | PIK3CA | PIK3CA | PIK3CA | 5589 | 0.046 | 0.48 | NO |
| 17 | PDPK1 | PDPK1 | PDPK1 | 5702 | 0.044 | 0.49 | NO |
| 18 | RHOQ | RHOQ | RHOQ | 6001 | 0.04 | 0.49 | NO |
| 19 | SOS1 | SOS1 | SOS1 | 6382 | 0.034 | 0.48 | NO |
| 20 | EXOC2 | EXOC2 | EXOC2 | 7374 | 0.023 | 0.43 | NO |
| 21 | RPS6KB1 | RPS6KB1 | RPS6KB1 | 7477 | 0.022 | 0.43 | NO |
| 22 | CBL | CBL | CBL | 7570 | 0.022 | 0.43 | NO |
| 23 | DOK1 | DOK1 | DOK1 | 7856 | 0.019 | 0.42 | NO |
| 24 | PTPN11 | PTPN11 | PTPN11 | 7867 | 0.019 | 0.42 | NO |
| 25 | EXOC5 | EXOC5 | EXOC5 | 8271 | 0.015 | 0.41 | NO |
| 26 | EXOC4 | EXOC4 | EXOC4 | 8364 | 0.014 | 0.41 | NO |
| 27 | GRB2 | GRB2 | GRB2 | 9686 | 0.0012 | 0.34 | NO |
| 28 | PTPRA | PTPRA | PTPRA | 9694 | 0.0011 | 0.34 | NO |
| 29 | EXOC7 | EXOC7 | EXOC7 | 9770 | 0.0005 | 0.33 | NO |
| 30 | CAV1 | CAV1 | CAV1 | 9793 | 0.00038 | 0.33 | NO |
| 31 | EXOC3 | EXOC3 | EXOC3 | 10055 | -0.0018 | 0.32 | NO |
| 32 | SORBS1 | SORBS1 | SORBS1 | 10122 | -0.0025 | 0.31 | NO |
| 33 | RASA1 | RASA1 | RASA1 | 10242 | -0.0035 | 0.31 | NO |
| 34 | IRS1 | IRS1 | IRS1 | 10266 | -0.0037 | 0.31 | NO |
| 35 | SHC1 | SHC1 | SHC1 | 11438 | -0.014 | 0.25 | NO |
| 36 | AKT1 | AKT1 | AKT1 | 11563 | -0.015 | 0.25 | NO |
| 37 | NCK1 | NCK1 | NCK1 | 12224 | -0.021 | 0.22 | NO |
| 38 | AKT2 | AKT2 | AKT2 | 12227 | -0.021 | 0.22 | NO |
| 39 | PTPN1 | PTPN1 | PTPN1 | 13058 | -0.03 | 0.19 | NO |
| 40 | EXOC1 | EXOC1 | EXOC1 | 13554 | -0.036 | 0.17 | NO |
| 41 | PRKCZ | PRKCZ | PRKCZ | 13864 | -0.04 | 0.16 | NO |
| 42 | TRIP10 | TRIP10 | TRIP10 | 14310 | -0.047 | 0.16 | NO |
| 43 | PRKCI | PRKCI | PRKCI | 14887 | -0.058 | 0.14 | NO |
| 44 | HRAS | HRAS | HRAS | 15637 | -0.076 | 0.12 | NO |
| 45 | SH2B2 | SH2B2 | SH2B2 | 16433 | -0.1 | 0.11 | NO |
Figure S69. Get High-res Image This plot shows mRNAseq_cNMF expression data heatmap (on the left) a RunningEnrichmentScore(RES) plot (on the top right) and a Signal2Noise(S2N) plot (on the bottom right) of genes in the pathway: KEGG PROPANOATE METABOLISM.
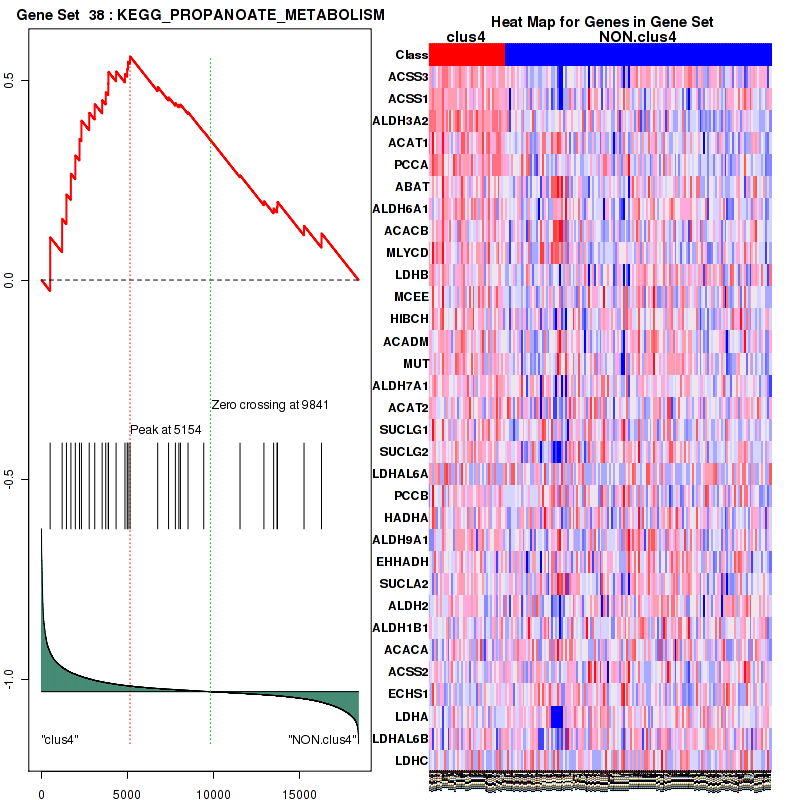
Figure S70. Get High-res Image For the top 5 core enriched genes in the pathway: KEGG PROPANOATE METABOLISM, this volcano plot shows how much they are up/down-regulated and significant. The significance was calculated by empirical bayesian fit
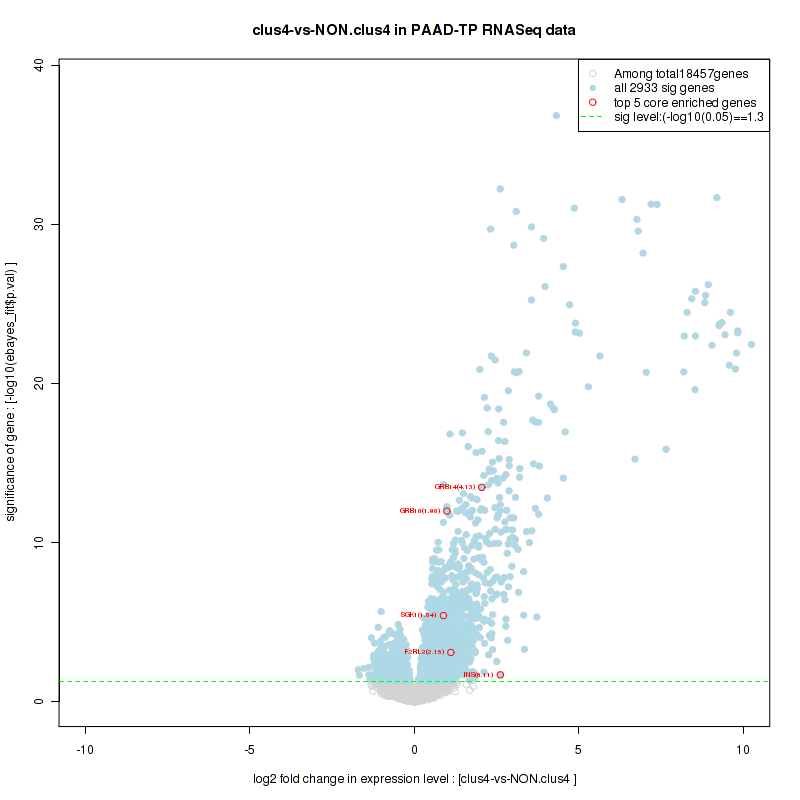
Table S36. Get Full Table This table shows a Running Enrichment Score (RES) of each gene in this pathway, that is, the enrichment score at this point in the ranked list of genes. All genes are ranked by Signal-to-Noise (S2N), a measure of similarity as default and are used to obtain ES matrix of all genes. In this way, GSEA tool uses expression pattern of not only overlapped genes but also not-overlapped genes to produce ES matrix.
| Rank | GENE | SYMBOL | DESC | LIST.LOC | S2N | RES | CORE_ENRICHMENT |
|---|---|---|---|---|---|---|---|
| 1 | MYLK2 | MYLK2 | MYLK2 | 12 | 1.3 | 0.32 | YES |
| 2 | PAK7 | PAK7 | PAK7 | 81 | 0.83 | 0.52 | YES |
| 3 | PAK3 | PAK3 | PAK3 | 325 | 0.45 | 0.61 | YES |
| 4 | FSCN2 | FSCN2 | FSCN2 | 1848 | 0.17 | 0.57 | NO |
| 5 | ROCK2 | ROCK2 | ROCK2 | 5024 | 0.056 | 0.41 | NO |
| 6 | WASF1 | WASF1 | WASF1 | 6380 | 0.034 | 0.35 | NO |
| 7 | CFL2 | CFL2 | CFL2 | 6737 | 0.03 | 0.34 | NO |
| 8 | RPS4X | RPS4X | RPS4X | 7136 | 0.026 | 0.32 | NO |
| 9 | ROCK1 | ROCK1 | ROCK1 | 7349 | 0.024 | 0.32 | NO |
| 10 | FLNA | FLNA | FLNA | 8294 | 0.014 | 0.27 | NO |
| 11 | GDI2 | GDI2 | GDI2 | 8847 | 0.009 | 0.24 | NO |
| 12 | PAK6 | PAK6 | PAK6 | 8949 | 0.008 | 0.24 | NO |
| 13 | ACTR2 | ACTR2 | ACTR2 | 9160 | 0.0061 | 0.23 | NO |
| 14 | PFN2 | PFN2 | PFN2 | 9997 | -0.0013 | 0.18 | NO |
| 15 | PAK2 | PAK2 | PAK2 | 10118 | -0.0025 | 0.18 | NO |
| 16 | CDC42 | CDC42 | CDC42 | 10625 | -0.0068 | 0.15 | NO |
| 17 | MYLK | MYLK | MYLK | 10773 | -0.0079 | 0.14 | NO |
| 18 | WASL | WASL | WASL | 10779 | -0.008 | 0.14 | NO |
| 19 | ACTR3 | ACTR3 | ACTR3 | 10899 | -0.009 | 0.14 | NO |
| 20 | LIMK1 | LIMK1 | LIMK1 | 11083 | -0.011 | 0.13 | NO |
| 21 | AKT1 | AKT1 | AKT1 | 11563 | -0.015 | 0.11 | NO |
| 22 | ACTG1 | ACTG1 | ACTG1 | 11818 | -0.018 | 0.1 | NO |
| 23 | PFN1 | PFN1 | PFN1 | 12658 | -0.026 | 0.062 | NO |
| 24 | PAK1 | PAK1 | PAK1 | 13035 | -0.03 | 0.049 | NO |
| 25 | CFL1 | CFL1 | CFL1 | 14741 | -0.055 | -0.031 | NO |
| 26 | MYH2 | MYH2 | MYH2 | 14749 | -0.055 | -0.018 | NO |
| 27 | ANGPTL2 | ANGPTL2 | ANGPTL2 | 14873 | -0.058 | -0.01 | NO |
| 28 | GDI1 | GDI1 | GDI1 | 14954 | -0.06 | -0.000011 | NO |
| 29 | FSCN3 | FSCN3 | FSCN3 | 15084 | -0.062 | 0.0081 | NO |
| 30 | VASP | VASP | VASP | 15509 | -0.072 | 0.0026 | NO |
| 31 | PAK4 | PAK4 | PAK4 | 15578 | -0.074 | 0.017 | NO |
| 32 | RHO | RHO | RHO | 16307 | -0.1 | 0.0016 | NO |
| 33 | FSCN1 | FSCN1 | FSCN1 | 16418 | -0.1 | 0.021 | NO |
| 34 | FLNC | FLNC | FLNC | 16457 | -0.11 | 0.044 | NO |
| 35 | ACTG2 | ACTG2 | ACTG2 | 18237 | -0.26 | 0.012 | NO |
Figure S71. Get High-res Image This plot shows mRNAseq_cNMF expression data heatmap (on the left) a RunningEnrichmentScore(RES) plot (on the top right) and a Signal2Noise(S2N) plot (on the bottom right) of genes in the pathway: KEGG ENDOCYTOSIS.
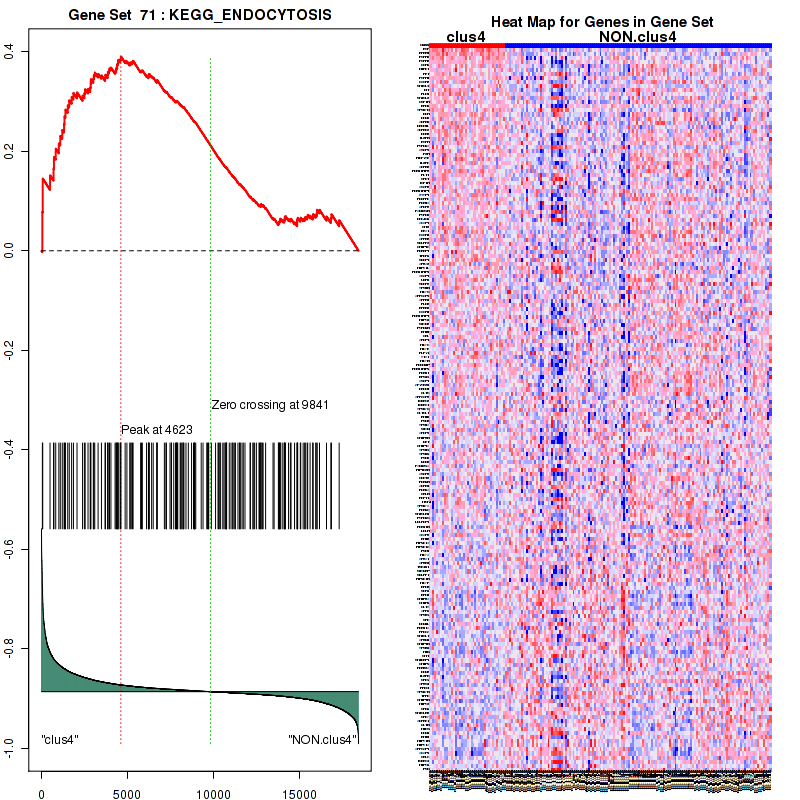
Figure S72. Get High-res Image For the top 5 core enriched genes in the pathway: KEGG ENDOCYTOSIS, this volcano plot shows how much they are up/down-regulated and significant. The significance was calculated by empirical bayesian fit

Table S37. Get Full Table This table shows a Running Enrichment Score (RES) of each gene in this pathway, that is, the enrichment score at this point in the ranked list of genes. All genes are ranked by Signal-to-Noise (S2N), a measure of similarity as default and are used to obtain ES matrix of all genes. In this way, GSEA tool uses expression pattern of not only overlapped genes but also not-overlapped genes to produce ES matrix.
| Rank | GENE | SYMBOL | DESC | LIST.LOC | S2N | RES | CORE_ENRICHMENT |
|---|---|---|---|---|---|---|---|
| 1 | CLPS | CLPS | CLPS | 17 | 1.3 | 0.16 | YES |
| 2 | PNLIPRP2 | PNLIPRP2 | PNLIPRP2 | 18 | 1.3 | 0.32 | YES |
| 3 | PNLIP | PNLIP | PNLIP | 23 | 1.2 | 0.47 | YES |
| 4 | ALB | ALB | ALB | 65 | 0.92 | 0.58 | YES |
| 5 | LPA | LPA | LPA | 135 | 0.66 | 0.66 | YES |
| 6 | LIPC | LIPC | LIPC | 251 | 0.52 | 0.72 | YES |
| 7 | FABP4 | FABP4 | FABP4 | 1494 | 0.2 | 0.67 | NO |
| 8 | APOC2 | APOC2 | APOC2 | 2291 | 0.14 | 0.65 | NO |
| 9 | CUBN | CUBN | CUBN | 2718 | 0.12 | 0.64 | NO |
| 10 | PLTP | PLTP | PLTP | 2830 | 0.12 | 0.65 | NO |
| 11 | PLIN1 | PLIN1 | PLIN1 | 3084 | 0.11 | 0.65 | NO |
| 12 | A2M | A2M | A2M | 3101 | 0.11 | 0.66 | NO |
| 13 | LPL | LPL | LPL | 4268 | 0.071 | 0.61 | NO |
| 14 | P4HB | P4HB | P4HB | 4280 | 0.071 | 0.61 | NO |
| 15 | APOE | APOE | APOE | 4325 | 0.07 | 0.62 | NO |
| 16 | PRKACB | PRKACB | PRKACB | 5318 | 0.05 | 0.57 | NO |
| 17 | APOA5 | APOA5 | APOA5 | 5472 | 0.047 | 0.57 | NO |
| 18 | ABHD5 | ABHD5 | ABHD5 | 5724 | 0.044 | 0.56 | NO |
| 19 | ABCA1 | ABCA1 | ABCA1 | 6073 | 0.039 | 0.55 | NO |
| 20 | PPP1CB | PPP1CB | PPP1CB | 6536 | 0.032 | 0.53 | NO |
| 21 | HSPG2 | HSPG2 | HSPG2 | 7647 | 0.021 | 0.47 | NO |
| 22 | ABCG5 | ABCG5 | ABCG5 | 8343 | 0.014 | 0.43 | NO |
| 23 | PPP1CC | PPP1CC | PPP1CC | 8840 | 0.0091 | 0.41 | NO |
| 24 | PRKACA | PRKACA | PRKACA | 8982 | 0.0077 | 0.4 | NO |
| 25 | CAV1 | CAV1 | CAV1 | 9793 | 0.00038 | 0.36 | NO |
| 26 | SAR1B | SAR1B | SAR1B | 10336 | -0.0042 | 0.33 | NO |
| 27 | PPP1CA | PPP1CA | PPP1CA | 10362 | -0.0044 | 0.33 | NO |
| 28 | CETP | CETP | CETP | 11153 | -0.011 | 0.29 | NO |
| 29 | LDLRAP1 | LDLRAP1 | LDLRAP1 | 11293 | -0.013 | 0.28 | NO |
| 30 | LDLR | LDLR | LDLR | 11543 | -0.015 | 0.27 | NO |
| 31 | MTTP | MTTP | MTTP | 11585 | -0.015 | 0.27 | NO |
| 32 | APOB | APOB | APOB | 11737 | -0.017 | 0.26 | NO |
| 33 | APOA1 | APOA1 | APOA1 | 12308 | -0.022 | 0.23 | NO |
| 34 | ABCG8 | ABCG8 | ABCG8 | 12608 | -0.025 | 0.22 | NO |
| 35 | BMP1 | BMP1 | BMP1 | 14781 | -0.056 | 0.11 | NO |
| 36 | SCARB1 | SCARB1 | SCARB1 | 14900 | -0.059 | 0.11 | NO |
| 37 | MGLL | MGLL | MGLL | 15674 | -0.077 | 0.078 | NO |
| 38 | APOC3 | APOC3 | APOC3 | 15683 | -0.077 | 0.087 | NO |
| 39 | LIPE | LIPE | LIPE | 15727 | -0.078 | 0.094 | NO |
| 40 | LCAT | LCAT | LCAT | 15845 | -0.082 | 0.098 | NO |
| 41 | ABCG1 | ABCG1 | ABCG1 | 16228 | -0.096 | 0.089 | NO |
| 42 | SDC1 | SDC1 | SDC1 | 16350 | -0.1 | 0.095 | NO |
| 43 | AMN | AMN | AMN | 17312 | -0.15 | 0.062 | NO |
Figure S73. Get High-res Image This plot shows mRNAseq_cNMF expression data heatmap (on the left) a RunningEnrichmentScore(RES) plot (on the top right) and a Signal2Noise(S2N) plot (on the bottom right) of genes in the pathway: SIG PIP3 SIGNALING IN CARDIAC MYOCTES.
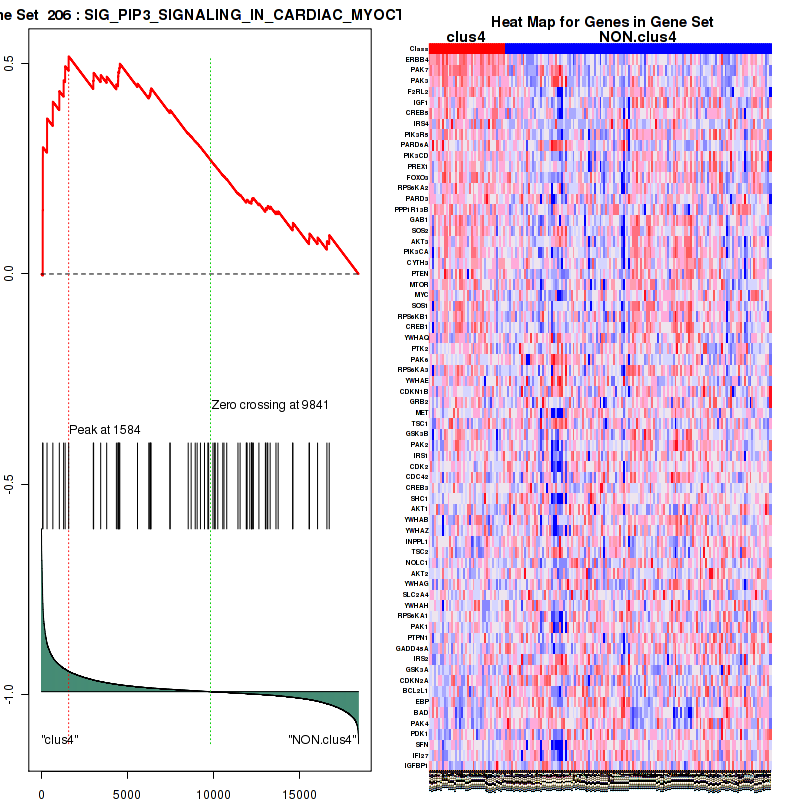
Figure S74. Get High-res Image For the top 5 core enriched genes in the pathway: SIG PIP3 SIGNALING IN CARDIAC MYOCTES, this volcano plot shows how much they are up/down-regulated and significant. The significance was calculated by empirical bayesian fit
Table S38. Get Full Table This table shows a Running Enrichment Score (RES) of each gene in this pathway, that is, the enrichment score at this point in the ranked list of genes. All genes are ranked by Signal-to-Noise (S2N), a measure of similarity as default and are used to obtain ES matrix of all genes. In this way, GSEA tool uses expression pattern of not only overlapped genes but also not-overlapped genes to produce ES matrix.
| Rank | GENE | SYMBOL | DESC | LIST.LOC | S2N | RES | CORE_ENRICHMENT |
|---|---|---|---|---|---|---|---|
| 1 | EGF | EGF | EGF | 52 | 1 | 0.12 | YES |
| 2 | ERBB4 | ERBB4 | ERBB4 | 74 | 0.86 | 0.22 | YES |
| 3 | NRG4 | NRG4 | NRG4 | 144 | 0.64 | 0.3 | YES |
| 4 | ADCY5 | ADCY5 | ADCY5 | 276 | 0.5 | 0.35 | YES |
| 5 | NRG2 | NRG2 | NRG2 | 674 | 0.32 | 0.37 | YES |
| 6 | PRKAR2B | PRKAR2B | PRKAR2B | 755 | 0.3 | 0.4 | YES |
| 7 | ITPR2 | ITPR2 | ITPR2 | 1041 | 0.25 | 0.41 | YES |
| 8 | MATK | MATK | MATK | 1835 | 0.17 | 0.39 | YES |
| 9 | PDE1A | PDE1A | PDE1A | 2017 | 0.16 | 0.4 | YES |
| 10 | PHLPP1 | PHLPP1 | PHLPP1 | 2165 | 0.15 | 0.41 | YES |
| 11 | ADCY1 | ADCY1 | ADCY1 | 2169 | 0.15 | 0.43 | YES |
| 12 | ADCY9 | ADCY9 | ADCY9 | 2342 | 0.14 | 0.44 | YES |
| 13 | ADCY8 | ADCY8 | ADCY8 | 2582 | 0.13 | 0.44 | YES |
| 14 | EGFR | EGFR | EGFR | 2872 | 0.12 | 0.44 | YES |
| 15 | PRKAR2A | PRKAR2A | PRKAR2A | 2945 | 0.11 | 0.45 | YES |
| 16 | CAMK4 | CAMK4 | CAMK4 | 3461 | 0.094 | 0.43 | NO |
| 17 | FOXO3 | FOXO3 | FOXO3 | 3797 | 0.084 | 0.42 | NO |
| 18 | CASP9 | CASP9 | CASP9 | 3916 | 0.08 | 0.42 | NO |
| 19 | GAB1 | GAB1 | GAB1 | 4477 | 0.066 | 0.4 | NO |
| 20 | PIK3R1 | PIK3R1 | PIK3R1 | 4539 | 0.065 | 0.41 | NO |
| 21 | AKT3 | AKT3 | AKT3 | 4561 | 0.065 | 0.41 | NO |
| 22 | FOXO4 | FOXO4 | FOXO4 | 4886 | 0.058 | 0.4 | NO |
| 23 | PDE1B | PDE1B | PDE1B | 5112 | 0.054 | 0.4 | NO |
| 24 | PRKACB | PRKACB | PRKACB | 5318 | 0.05 | 0.39 | NO |
| 25 | ADCY4 | ADCY4 | ADCY4 | 5446 | 0.048 | 0.39 | NO |
| 26 | PRKCA | PRKCA | PRKCA | 5456 | 0.048 | 0.4 | NO |
| 27 | PIK3CA | PIK3CA | PIK3CA | 5589 | 0.046 | 0.39 | NO |
| 28 | FOXO1 | FOXO1 | FOXO1 | 5701 | 0.044 | 0.39 | NO |
| 29 | PDPK1 | PDPK1 | PDPK1 | 5702 | 0.044 | 0.4 | NO |
| 30 | CUL5 | CUL5 | CUL5 | 5805 | 0.043 | 0.4 | NO |
| 31 | THEM4 | THEM4 | THEM4 | 5835 | 0.042 | 0.4 | NO |
| 32 | MAPK1 | MAPK1 | MAPK1 | 6112 | 0.038 | 0.39 | NO |
| 33 | USP8 | USP8 | USP8 | 6228 | 0.036 | 0.39 | NO |
| 34 | PRKCE | PRKCE | PRKCE | 6252 | 0.036 | 0.39 | NO |
| 35 | PTEN | PTEN | PTEN | 6302 | 0.036 | 0.39 | NO |
| 36 | MTOR | MTOR | MTOR | 6342 | 0.035 | 0.4 | NO |
| 37 | SOS1 | SOS1 | SOS1 | 6382 | 0.034 | 0.4 | NO |
| 38 | ERBB3 | ERBB3 | ERBB3 | 6719 | 0.03 | 0.38 | NO |
| 39 | ADCY3 | ADCY3 | ADCY3 | 6827 | 0.029 | 0.38 | NO |
| 40 | MAPKAP1 | MAPKAP1 | MAPKAP1 | 6993 | 0.028 | 0.38 | NO |
| 41 | RAF1 | RAF1 | RAF1 | 7098 | 0.026 | 0.37 | NO |
| 42 | BTC | BTC | BTC | 7279 | 0.024 | 0.37 | NO |
| 43 | CREB1 | CREB1 | CREB1 | 7490 | 0.022 | 0.36 | NO |
| 44 | TRIB3 | TRIB3 | TRIB3 | 7930 | 0.018 | 0.34 | NO |
| 45 | NRAS | NRAS | NRAS | 7956 | 0.018 | 0.34 | NO |
| 46 | PRKAR1A | PRKAR1A | PRKAR1A | 8087 | 0.016 | 0.33 | NO |
| 47 | YES1 | YES1 | YES1 | 8109 | 0.016 | 0.33 | NO |
| 48 | RPS27A | RPS27A | RPS27A | 8550 | 0.012 | 0.31 | NO |
| 49 | UBA52 | UBA52 | UBA52 | 8864 | 0.0089 | 0.29 | NO |
| 50 | PRKACA | PRKACA | PRKACA | 8982 | 0.0077 | 0.29 | NO |
| 51 | GRB7 | GRB7 | GRB7 | 9108 | 0.0066 | 0.28 | NO |
| 52 | CALM3 | CALM3 | CALM3 | 9151 | 0.0062 | 0.28 | NO |
| 53 | RICTOR | RICTOR | RICTOR | 9171 | 0.0059 | 0.28 | NO |
| 54 | PRKCD | PRKCD | PRKCD | 9204 | 0.0056 | 0.28 | NO |
| 55 | CHUK | CHUK | CHUK | 9228 | 0.0054 | 0.28 | NO |
| 56 | CDKN1B | CDKN1B | CDKN1B | 9491 | 0.0028 | 0.26 | NO |
| 57 | GRB2 | GRB2 | GRB2 | 9686 | 0.0012 | 0.26 | NO |
| 58 | NRG1 | NRG1 | NRG1 | 9829 | 0.000096 | 0.25 | NO |
| 59 | MAP2K1 | MAP2K1 | MAP2K1 | 9880 | -0.00028 | 0.24 | NO |
| 60 | FYN | FYN | FYN | 9965 | -0.0011 | 0.24 | NO |
| 61 | MDM2 | MDM2 | MDM2 | 10293 | -0.0039 | 0.22 | NO |
| 62 | ITPR3 | ITPR3 | ITPR3 | 10309 | -0.004 | 0.22 | NO |
| 63 | RNF41 | RNF41 | RNF41 | 10780 | -0.008 | 0.2 | NO |
| 64 | HSP90AA1 | HSP90AA1 | HSP90AA1 | 11007 | -0.01 | 0.19 | NO |
| 65 | SHC1 | SHC1 | SHC1 | 11438 | -0.014 | 0.16 | NO |
| 66 | AKT1 | AKT1 | AKT1 | 11563 | -0.015 | 0.16 | NO |
| 67 | ERBB2 | ERBB2 | ERBB2 | 11821 | -0.018 | 0.15 | NO |
| 68 | MLST8 | MLST8 | MLST8 | 11860 | -0.018 | 0.15 | NO |
| 69 | YWHAB | YWHAB | YWHAB | 11921 | -0.018 | 0.15 | NO |
| 70 | TSC2 | TSC2 | TSC2 | 12129 | -0.02 | 0.14 | NO |
| 71 | AKT2 | AKT2 | AKT2 | 12227 | -0.021 | 0.14 | NO |
| 72 | CALM1 | CALM1 | CALM1 | 12387 | -0.023 | 0.13 | NO |
| 73 | RPS6KB2 | RPS6KB2 | RPS6KB2 | 12422 | -0.023 | 0.13 | NO |
| 74 | KRAS | KRAS | KRAS | 12583 | -0.025 | 0.12 | NO |
| 75 | HBEGF | HBEGF | HBEGF | 13015 | -0.029 | 0.1 | NO |
| 76 | PLCG1 | PLCG1 | PLCG1 | 13023 | -0.03 | 0.11 | NO |
| 77 | GSK3A | GSK3A | GSK3A | 13311 | -0.033 | 0.096 | NO |
| 78 | MAP2K2 | MAP2K2 | MAP2K2 | 13703 | -0.038 | 0.08 | NO |
| 79 | SRC | SRC | SRC | 13791 | -0.039 | 0.08 | NO |
| 80 | CDC37 | CDC37 | CDC37 | 13851 | -0.04 | 0.081 | NO |
| 81 | ADCY7 | ADCY7 | ADCY7 | 13855 | -0.04 | 0.086 | NO |
| 82 | AKT1S1 | AKT1S1 | AKT1S1 | 13907 | -0.041 | 0.088 | NO |
| 83 | CDKN1A | CDKN1A | CDKN1A | 14113 | -0.044 | 0.082 | NO |
| 84 | STUB1 | STUB1 | STUB1 | 14167 | -0.045 | 0.085 | NO |
| 85 | ADCY6 | ADCY6 | ADCY6 | 14221 | -0.046 | 0.088 | NO |
| 86 | CALM2 | CALM2 | CALM2 | 14516 | -0.051 | 0.078 | NO |
| 87 | BAD | BAD | BAD | 14636 | -0.053 | 0.078 | NO |
| 88 | ADRBK1 | ADRBK1 | ADRBK1 | 15466 | -0.071 | 0.041 | NO |
| 89 | HRAS | HRAS | HRAS | 15637 | -0.076 | 0.041 | NO |
| 90 | ADCY2 | ADCY2 | ADCY2 | 15735 | -0.078 | 0.045 | NO |
| 91 | NR4A1 | NR4A1 | NR4A1 | 15984 | -0.087 | 0.042 | NO |
| 92 | MAPK3 | MAPK3 | MAPK3 | 16243 | -0.097 | 0.04 | NO |
| 93 | PRKAR1B | PRKAR1B | PRKAR1B | 16599 | -0.11 | 0.034 | NO |
| 94 | CDK1 | CDK1 | CDK1 | 17367 | -0.16 | 0.012 | NO |
| 95 | EREG | EREG | EREG | 17401 | -0.16 | 0.029 | NO |
| 96 | PRKCG | PRKCG | PRKCG | 18077 | -0.23 | 0.021 | NO |
Figure S75. Get High-res Image This plot shows mRNAseq_cNMF expression data heatmap (on the left) a RunningEnrichmentScore(RES) plot (on the top right) and a Signal2Noise(S2N) plot (on the bottom right) of genes in the pathway: SIG CHEMOTAXIS.
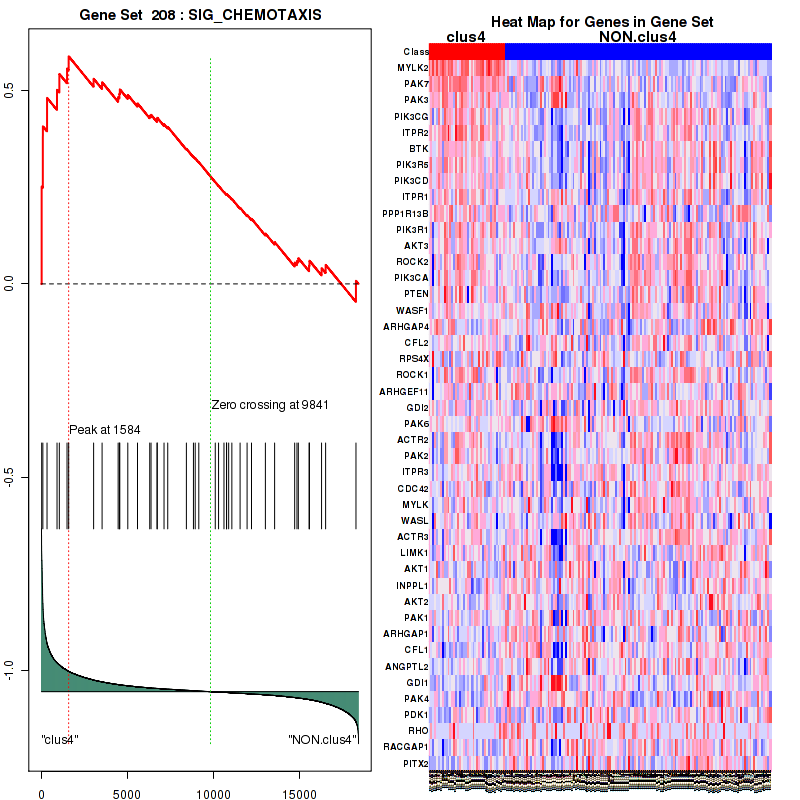
Figure S76. Get High-res Image For the top 5 core enriched genes in the pathway: SIG CHEMOTAXIS, this volcano plot shows how much they are up/down-regulated and significant. The significance was calculated by empirical bayesian fit
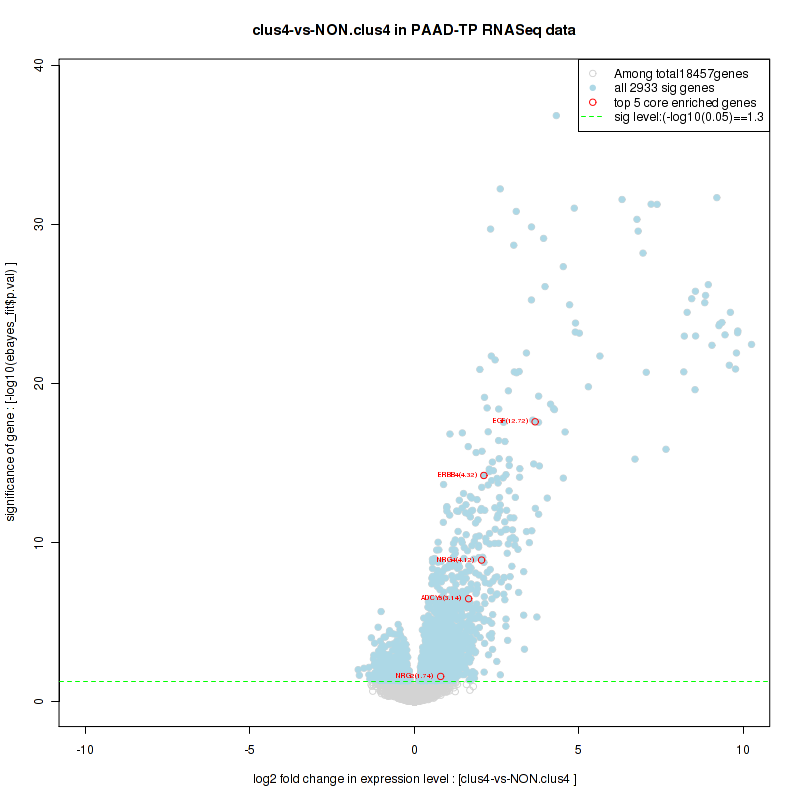
Table S39. Get Full Table This table shows a Running Enrichment Score (RES) of each gene in this pathway, that is, the enrichment score at this point in the ranked list of genes. All genes are ranked by Signal-to-Noise (S2N), a measure of similarity as default and are used to obtain ES matrix of all genes. In this way, GSEA tool uses expression pattern of not only overlapped genes but also not-overlapped genes to produce ES matrix.
| Rank | GENE | SYMBOL | DESC | LIST.LOC | S2N | RES | CORE_ENRICHMENT |
|---|---|---|---|---|---|---|---|
| 1 | EGF | EGF | EGF | 52 | 1 | 0.4 | YES |
| 2 | PHLPP1 | PHLPP1 | PHLPP1 | 2165 | 0.15 | 0.34 | YES |
| 3 | EGFR | EGFR | EGFR | 2872 | 0.12 | 0.35 | YES |
| 4 | FOXO3 | FOXO3 | FOXO3 | 3797 | 0.084 | 0.34 | YES |
| 5 | CASP9 | CASP9 | CASP9 | 3916 | 0.08 | 0.36 | YES |
| 6 | PAG1 | PAG1 | PAG1 | 4387 | 0.068 | 0.36 | YES |
| 7 | GAB1 | GAB1 | GAB1 | 4477 | 0.066 | 0.38 | YES |
| 8 | PIK3R1 | PIK3R1 | PIK3R1 | 4539 | 0.065 | 0.41 | YES |
| 9 | AKT3 | AKT3 | AKT3 | 4561 | 0.065 | 0.43 | YES |
| 10 | FOXO4 | FOXO4 | FOXO4 | 4886 | 0.058 | 0.44 | YES |
| 11 | PIK3CA | PIK3CA | PIK3CA | 5589 | 0.046 | 0.42 | YES |
| 12 | FOXO1 | FOXO1 | FOXO1 | 5701 | 0.044 | 0.43 | YES |
| 13 | PDPK1 | PDPK1 | PDPK1 | 5702 | 0.044 | 0.45 | YES |
| 14 | THEM4 | THEM4 | THEM4 | 5835 | 0.042 | 0.46 | YES |
| 15 | PTEN | PTEN | PTEN | 6302 | 0.036 | 0.44 | YES |
| 16 | MTOR | MTOR | MTOR | 6342 | 0.035 | 0.46 | YES |
| 17 | MAPKAP1 | MAPKAP1 | MAPKAP1 | 6993 | 0.028 | 0.43 | NO |
| 18 | CREB1 | CREB1 | CREB1 | 7490 | 0.022 | 0.41 | NO |
| 19 | TRIB3 | TRIB3 | TRIB3 | 7930 | 0.018 | 0.4 | NO |
| 20 | RICTOR | RICTOR | RICTOR | 9171 | 0.0059 | 0.33 | NO |
| 21 | CHUK | CHUK | CHUK | 9228 | 0.0054 | 0.33 | NO |
| 22 | CDKN1B | CDKN1B | CDKN1B | 9491 | 0.0028 | 0.32 | NO |
| 23 | GRB2 | GRB2 | GRB2 | 9686 | 0.0012 | 0.31 | NO |
| 24 | MDM2 | MDM2 | MDM2 | 10293 | -0.0039 | 0.28 | NO |
| 25 | AKT1 | AKT1 | AKT1 | 11563 | -0.015 | 0.21 | NO |
| 26 | MLST8 | MLST8 | MLST8 | 11860 | -0.018 | 0.2 | NO |
| 27 | TSC2 | TSC2 | TSC2 | 12129 | -0.02 | 0.2 | NO |
| 28 | AKT2 | AKT2 | AKT2 | 12227 | -0.021 | 0.2 | NO |
| 29 | RPS6KB2 | RPS6KB2 | RPS6KB2 | 12422 | -0.023 | 0.2 | NO |
| 30 | CSK | CSK | CSK | 12505 | -0.024 | 0.2 | NO |
| 31 | GSK3A | GSK3A | GSK3A | 13311 | -0.033 | 0.17 | NO |
| 32 | SRC | SRC | SRC | 13791 | -0.039 | 0.16 | NO |
| 33 | AKT1S1 | AKT1S1 | AKT1S1 | 13907 | -0.041 | 0.17 | NO |
| 34 | CDKN1A | CDKN1A | CDKN1A | 14113 | -0.044 | 0.18 | NO |
| 35 | BAD | BAD | BAD | 14636 | -0.053 | 0.17 | NO |
| 36 | NR4A1 | NR4A1 | NR4A1 | 15984 | -0.087 | 0.13 | NO |
Figure S77. Get High-res Image This plot shows mRNAseq_cNMF expression data heatmap (on the left) a RunningEnrichmentScore(RES) plot (on the top right) and a Signal2Noise(S2N) plot (on the bottom right) of genes in the pathway: SIG REGULATION OF THE ACTIN CYTOSKELETON BY RHO GTPASES.
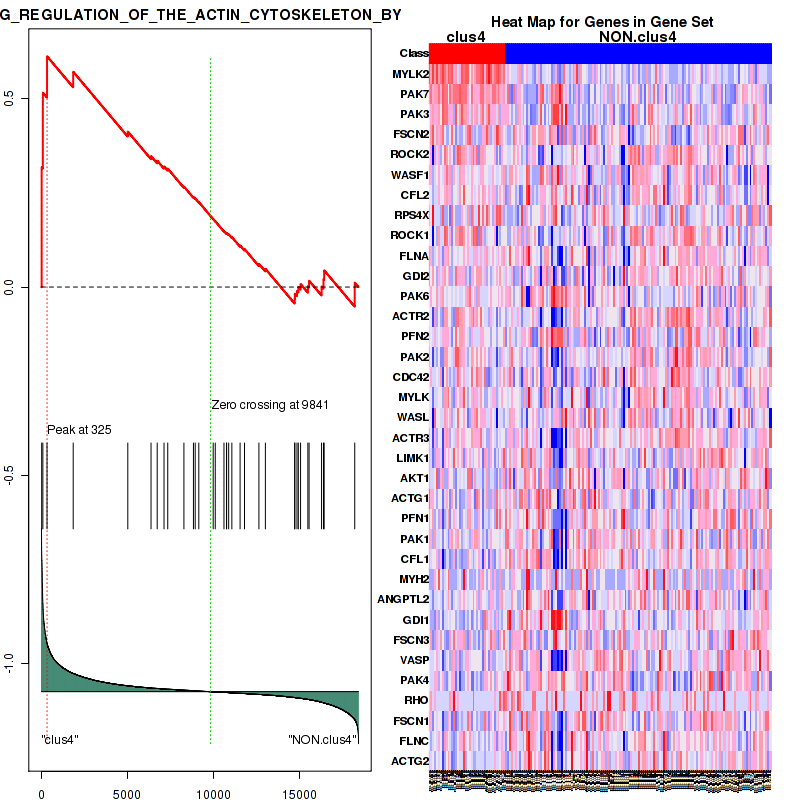
Figure S78. Get High-res Image For the top 5 core enriched genes in the pathway: SIG REGULATION OF THE ACTIN CYTOSKELETON BY RHO GTPASES, this volcano plot shows how much they are up/down-regulated and significant. The significance was calculated by empirical bayesian fit
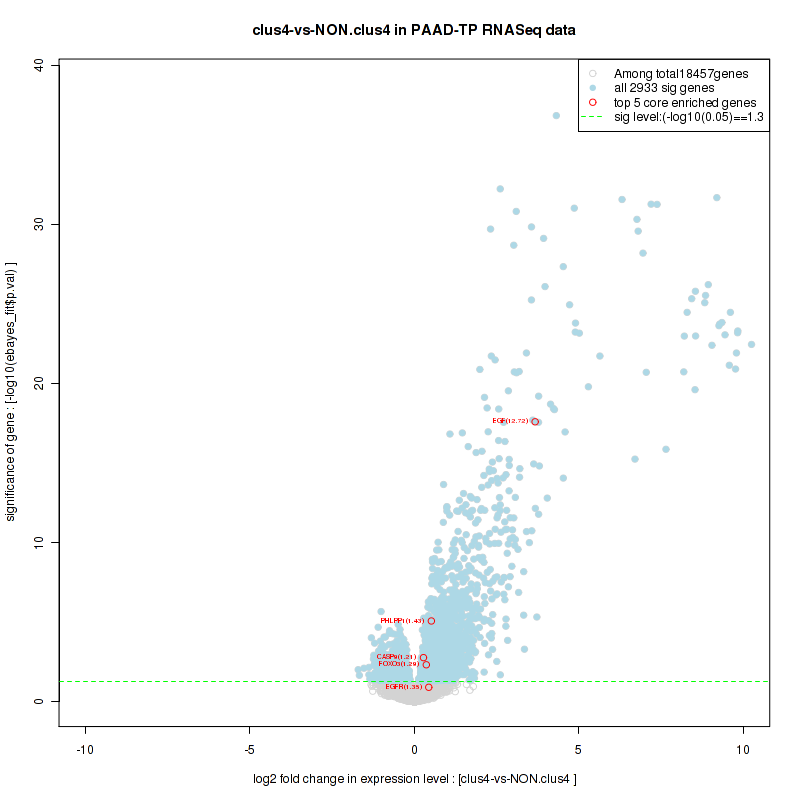
Table S40. Get Full Table This table shows a Running Enrichment Score (RES) of each gene in this pathway, that is, the enrichment score at this point in the ranked list of genes. All genes are ranked by Signal-to-Noise (S2N), a measure of similarity as default and are used to obtain ES matrix of all genes. In this way, GSEA tool uses expression pattern of not only overlapped genes but also not-overlapped genes to produce ES matrix.
| Rank | GENE | SYMBOL | DESC | LIST.LOC | S2N | RES | CORE_ENRICHMENT |
|---|---|---|---|---|---|---|---|
| 1 | ACSS3 | ACSS3 | ACSS3 | 507 | 0.37 | 0.11 | YES |
| 2 | ACSS1 | ACSS1 | ACSS1 | 1204 | 0.23 | 0.15 | YES |
| 3 | ALDH3A2 | ALDH3A2 | ALDH3A2 | 1453 | 0.2 | 0.21 | YES |
| 4 | ACAT1 | ACAT1 | ACAT1 | 1714 | 0.18 | 0.27 | YES |
| 5 | PCCA | PCCA | PCCA | 1972 | 0.16 | 0.31 | YES |
| 6 | ABAT | ABAT | ABAT | 2215 | 0.15 | 0.35 | YES |
| 7 | ALDH6A1 | ALDH6A1 | ALDH6A1 | 2327 | 0.14 | 0.4 | YES |
| 8 | ACACB | ACACB | ACACB | 2781 | 0.12 | 0.42 | YES |
| 9 | MLYCD | MLYCD | MLYCD | 3100 | 0.11 | 0.44 | YES |
| 10 | LDHB | LDHB | LDHB | 3534 | 0.092 | 0.45 | YES |
| 11 | MCEE | MCEE | MCEE | 3743 | 0.085 | 0.47 | YES |
| 12 | HIBCH | HIBCH | HIBCH | 3890 | 0.081 | 0.49 | YES |
| 13 | ACADM | ACADM | ACADM | 3899 | 0.081 | 0.52 | YES |
| 14 | MUT | MUT | MUT | 4345 | 0.07 | 0.52 | YES |
| 15 | ALDH7A1 | ALDH7A1 | ALDH7A1 | 4860 | 0.058 | 0.52 | YES |
| 16 | ACAT2 | ACAT2 | ACAT2 | 4991 | 0.056 | 0.53 | YES |
| 17 | SUCLG1 | SUCLG1 | SUCLG1 | 5039 | 0.055 | 0.55 | YES |
| 18 | SUCLG2 | SUCLG2 | SUCLG2 | 5154 | 0.053 | 0.56 | YES |
| 19 | LDHAL6A | LDHAL6A | LDHAL6A | 6766 | 0.03 | 0.48 | NO |
| 20 | PCCB | PCCB | PCCB | 7399 | 0.023 | 0.46 | NO |
| 21 | HADHA | HADHA | HADHA | 7796 | 0.019 | 0.44 | NO |
| 22 | ALDH9A1 | ALDH9A1 | ALDH9A1 | 7998 | 0.017 | 0.44 | NO |
| 23 | EHHADH | EHHADH | EHHADH | 8090 | 0.016 | 0.44 | NO |
| 24 | SUCLA2 | SUCLA2 | SUCLA2 | 8531 | 0.012 | 0.42 | NO |
| 25 | ALDH2 | ALDH2 | ALDH2 | 9447 | 0.0032 | 0.37 | NO |
| 26 | ALDH1B1 | ALDH1B1 | ALDH1B1 | 11559 | -0.015 | 0.26 | NO |
| 27 | ACACA | ACACA | ACACA | 12950 | -0.029 | 0.2 | NO |
| 28 | ACSS2 | ACSS2 | ACSS2 | 13515 | -0.035 | 0.18 | NO |
| 29 | ECHS1 | ECHS1 | ECHS1 | 13715 | -0.038 | 0.18 | NO |
| 30 | LDHA | LDHA | LDHA | 13740 | -0.039 | 0.2 | NO |
| 31 | LDHAL6B | LDHAL6B | LDHAL6B | 15285 | -0.067 | 0.14 | NO |
| 32 | LDHC | LDHC | LDHC | 16303 | -0.099 | 0.12 | NO |
Figure S79. Get High-res Image This plot shows mRNAseq_cNMF expression data heatmap (on the left) a RunningEnrichmentScore(RES) plot (on the top right) and a Signal2Noise(S2N) plot (on the bottom right) of genes in the pathway: PID INSULIN PATHWAY.
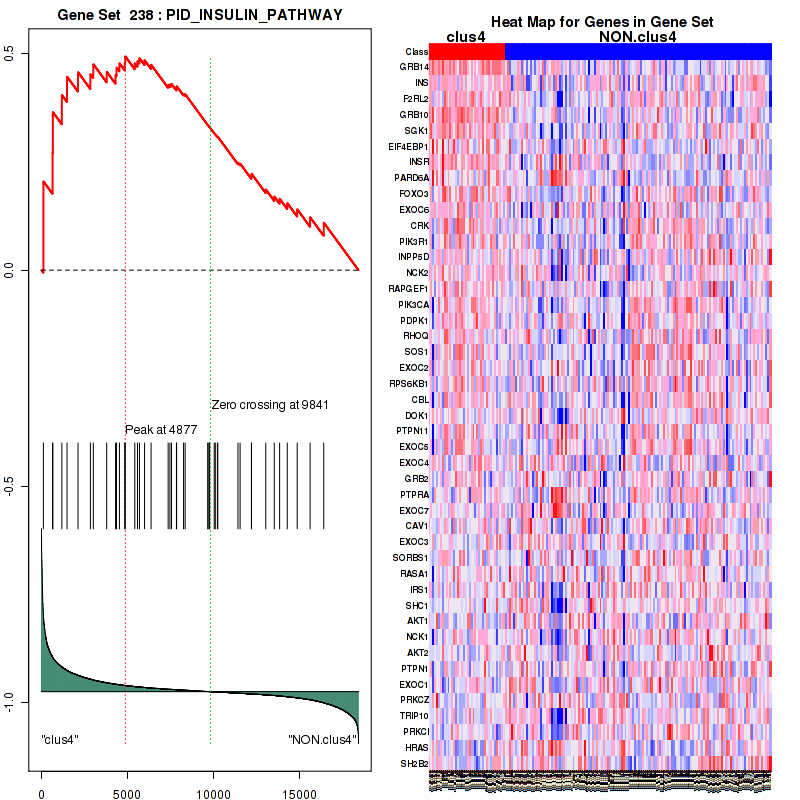
Figure S80. Get High-res Image For the top 5 core enriched genes in the pathway: PID INSULIN PATHWAY, this volcano plot shows how much they are up/down-regulated and significant. The significance was calculated by empirical bayesian fit

For the top enriched genes, if you want to check whether they are
-
up-regulated, please check the list of up-regulated genes
-
down-regulated, please check the list of down-regulated genes
For the top enriched genes, if you want to check whether they are
-
highly expressed genes, please check the list of high (top 30%) expressed genes
-
low expressed genes, please check the list of low (bottom 30%) expressed genes
An expression pattern of top(30%)/middle(30%)/low(30%) in this subtype against other subtypes is available in a heatmap
For the top enriched genes, if you want to check whether they are
-
significantly differently expressed genes by eBayes lm fit, please check the list of significant genes
Table 7. Get Full Table This table shows top 10 pathways which are significantly enriched in cluster clus5. It displays only significant gene sets satisfying nom.p.val.threshold (-1), fwer.p.val.threshold (-1) , fdr.q.val.threshold (0.25) and the default table is sorted by Normalized Enrichment Score (NES). Further details on NES statistics, please visit The Broad GSEA website.
| GeneSet(GS) | Size(#genes) | genes.ES.table | ES | NES | NOM.p.val | FDR.q.val | FWER.p.val | Tag.. | Gene.. | Signal | FDR..median. | glob.p.val |
|---|---|---|---|---|---|---|---|---|---|---|---|---|
| KEGG PURINE METABOLISM | 155 | genes.ES.table | 0.34 | 1.4 | 0.026 | 0.25 | 1 | 0.22 | 0.22 | 0.17 | 0.19 | 0.004 |
| KEGG GLYCOSAMINOGLYCAN BIOSYNTHESIS HEPARAN SULFATE | 25 | genes.ES.table | 0.52 | 1.4 | 0.054 | 0.22 | 0.99 | 0.48 | 0.29 | 0.34 | 0.16 | 0.004 |
| KEGG ABC TRANSPORTERS | 43 | genes.ES.table | 0.58 | 1.5 | 0.048 | 0.2 | 0.98 | 0.3 | 0.16 | 0.26 | 0.14 | 0.004 |
| KEGG MAPK SIGNALING PATHWAY | 257 | genes.ES.table | 0.43 | 1.6 | 0 | 0.19 | 0.93 | 0.32 | 0.24 | 0.24 | 0.11 | 0.022 |
| KEGG CYTOKINE CYTOKINE RECEPTOR INTERACTION | 240 | genes.ES.table | 0.68 | 1.6 | 0.0039 | 0.2 | 0.92 | 0.5 | 0.15 | 0.43 | 0.11 | 0.029 |
| KEGG PHOSPHATIDYLINOSITOL SIGNALING SYSTEM | 75 | genes.ES.table | 0.42 | 1.5 | 0.038 | 0.19 | 0.97 | 0.31 | 0.25 | 0.23 | 0.12 | 0.009 |
| KEGG NEUROACTIVE LIGAND RECEPTOR INTERACTION | 243 | genes.ES.table | 0.59 | 1.5 | 0.004 | 0.19 | 0.98 | 0.43 | 0.14 | 0.37 | 0.13 | 0.008 |
| KEGG OOCYTE MEIOSIS | 109 | genes.ES.table | 0.42 | 1.5 | 0.044 | 0.18 | 0.96 | 0.26 | 0.3 | 0.18 | 0.11 | 0.01 |
| KEGG MTOR SIGNALING PATHWAY | 52 | genes.ES.table | 0.43 | 1.5 | 0.052 | 0.19 | 0.98 | 0.25 | 0.25 | 0.19 | 0.13 | 0.005 |
| KEGG APOPTOSIS | 85 | genes.ES.table | 0.49 | 1.7 | 0.027 | 0.24 | 0.85 | 0.33 | 0.25 | 0.25 | 0.11 | 0.039 |
Table S41. Get Full Table This table shows a Running Enrichment Score (RES) of each gene in this pathway, that is, the enrichment score at this point in the ranked list of genes. All genes are ranked by Signal-to-Noise (S2N), a measure of similarity as default and are used to obtain ES matrix of all genes. In this way, GSEA tool uses expression pattern of not only overlapped genes but also not-overlapped genes to produce ES matrix.
| Rank | GENE | SYMBOL | DESC | LIST.LOC | S2N | RES | CORE_ENRICHMENT |
|---|---|---|---|---|---|---|---|
| 1 | CD28 | CD28 | CD28 | 64 | 0.76 | 0.09 | YES |
| 2 | CD247 | CD247 | CD247 | 210 | 0.62 | 0.16 | YES |
| 3 | CD8B | CD8B | CD8B | 261 | 0.6 | 0.23 | YES |
| 4 | PSMA8 | PSMA8 | PSMA8 | 519 | 0.5 | 0.28 | YES |
| 5 | DOCK2 | DOCK2 | DOCK2 | 575 | 0.49 | 0.34 | YES |
| 6 | LCK | LCK | LCK | 951 | 0.41 | 0.37 | YES |
| 7 | AP1S2 | AP1S2 | AP1S2 | 1467 | 0.32 | 0.38 | YES |
| 8 | HCK | HCK | HCK | 1771 | 0.29 | 0.4 | YES |
| 9 | ELMO1 | ELMO1 | ELMO1 | 1850 | 0.28 | 0.43 | YES |
| 10 | CD4 | CD4 | CD4 | 1968 | 0.27 | 0.46 | YES |
| 11 | FYN | FYN | FYN | 2277 | 0.24 | 0.47 | YES |
| 12 | APOBEC3G | APOBEC3G | APOBEC3G | 2730 | 0.21 | 0.47 | YES |
| 13 | PSIP1 | PSIP1 | PSIP1 | 3671 | 0.15 | 0.44 | NO |
| 14 | CCNT1 | CCNT1 | CCNT1 | 3868 | 0.14 | 0.44 | NO |
| 15 | NUP153 | NUP153 | NUP153 | 4779 | 0.099 | 0.41 | NO |
| 16 | PSMB9 | PSMB9 | PSMB9 | 5213 | 0.085 | 0.39 | NO |
| 17 | AP1B1 | AP1B1 | AP1B1 | 5627 | 0.073 | 0.38 | NO |
| 18 | NUP210 | NUP210 | NUP210 | 5664 | 0.072 | 0.39 | NO |
| 19 | NUP50 | NUP50 | NUP50 | 5738 | 0.07 | 0.39 | NO |
| 20 | AP1M1 | AP1M1 | AP1M1 | 6218 | 0.059 | 0.37 | NO |
| 21 | NUP88 | NUP88 | NUP88 | 6415 | 0.054 | 0.37 | NO |
| 22 | PACS1 | PACS1 | PACS1 | 6975 | 0.043 | 0.34 | NO |
| 23 | NUP43 | NUP43 | NUP43 | 7120 | 0.041 | 0.34 | NO |
| 24 | PAK2 | PAK2 | PAK2 | 7151 | 0.04 | 0.34 | NO |
| 25 | RANBP2 | RANBP2 | RANBP2 | 7191 | 0.039 | 0.35 | NO |
| 26 | B2M | B2M | B2M | 7205 | 0.039 | 0.35 | NO |
| 27 | PSME4 | PSME4 | PSME4 | 7382 | 0.036 | 0.35 | NO |
| 28 | NUP188 | NUP188 | NUP188 | 7525 | 0.034 | 0.34 | NO |
| 29 | PSMD5 | PSMD5 | PSMD5 | 7724 | 0.031 | 0.34 | NO |
| 30 | CUL5 | CUL5 | CUL5 | 7783 | 0.03 | 0.34 | NO |
| 31 | PSMB8 | PSMB8 | PSMB8 | 7798 | 0.03 | 0.34 | NO |
| 32 | NUP93 | NUP93 | NUP93 | 7850 | 0.029 | 0.34 | NO |
| 33 | NUP107 | NUP107 | NUP107 | 7999 | 0.027 | 0.34 | NO |
| 34 | NUP155 | NUP155 | NUP155 | 8087 | 0.026 | 0.34 | NO |
| 35 | NUP205 | NUP205 | NUP205 | 8092 | 0.026 | 0.34 | NO |
| 36 | KPNA1 | KPNA1 | KPNA1 | 8241 | 0.024 | 0.33 | NO |
| 37 | AP2M1 | AP2M1 | AP2M1 | 8816 | 0.017 | 0.3 | NO |
| 38 | RBX1 | RBX1 | RBX1 | 8819 | 0.017 | 0.3 | NO |
| 39 | PSMC2 | PSMC2 | PSMC2 | 9004 | 0.014 | 0.3 | NO |
| 40 | UBA52 | UBA52 | UBA52 | 9019 | 0.014 | 0.3 | NO |
| 41 | NUPL1 | NUPL1 | NUPL1 | 9057 | 0.014 | 0.3 | NO |
| 42 | RPS27A | RPS27A | RPS27A | 9064 | 0.014 | 0.3 | NO |
| 43 | KPNB1 | KPNB1 | KPNB1 | 9084 | 0.014 | 0.3 | NO |
| 44 | PSMC4 | PSMC4 | PSMC4 | 9111 | 0.013 | 0.3 | NO |
| 45 | PSMD11 | PSMD11 | PSMD11 | 9198 | 0.012 | 0.3 | NO |
| 46 | TPR | TPR | TPR | 9255 | 0.012 | 0.3 | NO |
| 47 | PSMA1 | PSMA1 | PSMA1 | 9453 | 0.0091 | 0.28 | NO |
| 48 | BTRC | BTRC | BTRC | 9479 | 0.0087 | 0.28 | NO |
| 49 | RANBP1 | RANBP1 | RANBP1 | 9535 | 0.0081 | 0.28 | NO |
| 50 | PSMD2 | PSMD2 | PSMD2 | 9603 | 0.0074 | 0.28 | NO |
| 51 | RAN | RAN | RAN | 9615 | 0.0073 | 0.28 | NO |
| 52 | AP2A1 | AP2A1 | AP2A1 | 9619 | 0.0072 | 0.28 | NO |
| 53 | PSMB1 | PSMB1 | PSMB1 | 9723 | 0.006 | 0.28 | NO |
| 54 | SLC25A6 | SLC25A6 | SLC25A6 | 9813 | 0.005 | 0.27 | NO |
| 55 | PSMD7 | PSMD7 | PSMD7 | 9846 | 0.0047 | 0.27 | NO |
| 56 | NUP62 | NUP62 | NUP62 | 9880 | 0.0042 | 0.27 | NO |
| 57 | PSMC5 | PSMC5 | PSMC5 | 9919 | 0.0037 | 0.27 | NO |
| 58 | HLA-A | HLA-A | HLA-A | 9949 | 0.0034 | 0.27 | NO |
| 59 | PSMB2 | PSMB2 | PSMB2 | 10007 | 0.0026 | 0.26 | NO |
| 60 | PSMA4 | PSMA4 | PSMA4 | 10034 | 0.0023 | 0.26 | NO |
| 61 | NUP214 | NUP214 | NUP214 | 10042 | 0.0022 | 0.26 | NO |
| 62 | PSMC1 | PSMC1 | PSMC1 | 10049 | 0.0021 | 0.26 | NO |
| 63 | PSMB6 | PSMB6 | PSMB6 | 10144 | 0.0011 | 0.26 | NO |
| 64 | NUPL2 | NUPL2 | NUPL2 | 10145 | 0.0011 | 0.26 | NO |
| 65 | NUP133 | NUP133 | NUP133 | 10155 | 0.00099 | 0.26 | NO |
| 66 | AP2A2 | AP2A2 | AP2A2 | 10192 | 0.0003 | 0.26 | NO |
| 67 | XPO1 | XPO1 | XPO1 | 10221 | -0.000073 | 0.25 | NO |
| 68 | PSMD1 | PSMD1 | PSMD1 | 10267 | -0.00062 | 0.25 | NO |
| 69 | PSMD14 | PSMD14 | PSMD14 | 10334 | -0.0012 | 0.25 | NO |
| 70 | PSMA7 | PSMA7 | PSMA7 | 10358 | -0.0015 | 0.25 | NO |
| 71 | POM121 | POM121 | POM121 | 10368 | -0.0016 | 0.25 | NO |
| 72 | PSMA3 | PSMA3 | PSMA3 | 10432 | -0.0025 | 0.24 | NO |
| 73 | NUP37 | NUP37 | NUP37 | 10473 | -0.003 | 0.24 | NO |
| 74 | NUP85 | NUP85 | NUP85 | 10634 | -0.0047 | 0.23 | NO |
| 75 | NUP54 | NUP54 | NUP54 | 10715 | -0.0055 | 0.23 | NO |
| 76 | PSMC3 | PSMC3 | PSMC3 | 10778 | -0.0061 | 0.23 | NO |
| 77 | PSMD12 | PSMD12 | PSMD12 | 10810 | -0.0065 | 0.23 | NO |
| 78 | PSMD10 | PSMD10 | PSMD10 | 10820 | -0.0066 | 0.23 | NO |
| 79 | PSMA6 | PSMA6 | PSMA6 | 10958 | -0.0083 | 0.22 | NO |
| 80 | RAE1 | RAE1 | RAE1 | 11046 | -0.0094 | 0.22 | NO |
| 81 | AP1G1 | AP1G1 | AP1G1 | 11047 | -0.0094 | 0.22 | NO |
| 82 | PSMD13 | PSMD13 | PSMD13 | 11051 | -0.0094 | 0.22 | NO |
| 83 | AP2S1 | AP2S1 | AP2S1 | 11253 | -0.012 | 0.21 | NO |
| 84 | PSMA2 | PSMA2 | PSMA2 | 11262 | -0.012 | 0.21 | NO |
| 85 | PSMA5 | PSMA5 | PSMA5 | 11294 | -0.012 | 0.21 | NO |
| 86 | PSMD8 | PSMD8 | PSMD8 | 11503 | -0.015 | 0.2 | NO |
| 87 | NPM1 | NPM1 | NPM1 | 11555 | -0.015 | 0.2 | NO |
| 88 | TCEB1 | TCEB1 | TCEB1 | 11605 | -0.016 | 0.2 | NO |
| 89 | CDK9 | CDK9 | CDK9 | 11663 | -0.017 | 0.2 | NO |
| 90 | PSMB3 | PSMB3 | PSMB3 | 11695 | -0.017 | 0.2 | NO |
| 91 | PSMB4 | PSMB4 | PSMB4 | 11819 | -0.019 | 0.2 | NO |
| 92 | ATP6V1H | ATP6V1H | ATP6V1H | 11834 | -0.019 | 0.2 | NO |
| 93 | AP2B1 | AP2B1 | AP2B1 | 11927 | -0.02 | 0.19 | NO |
| 94 | PSMC6 | PSMC6 | PSMC6 | 11954 | -0.02 | 0.2 | NO |
| 95 | PSMF1 | PSMF1 | PSMF1 | 11970 | -0.02 | 0.2 | NO |
| 96 | PSMD3 | PSMD3 | PSMD3 | 11986 | -0.021 | 0.2 | NO |
| 97 | PSMD9 | PSMD9 | PSMD9 | 12003 | -0.021 | 0.2 | NO |
| 98 | SEH1L | SEH1L | SEH1L | 12051 | -0.022 | 0.2 | NO |
| 99 | PSMB5 | PSMB5 | PSMB5 | 12193 | -0.024 | 0.2 | NO |
| 100 | SKP1 | SKP1 | SKP1 | 12318 | -0.025 | 0.19 | NO |
| 101 | PSMD6 | PSMD6 | PSMD6 | 12380 | -0.026 | 0.19 | NO |
| 102 | PSMD4 | PSMD4 | PSMD4 | 12521 | -0.028 | 0.19 | NO |
| 103 | PSMB7 | PSMB7 | PSMB7 | 12649 | -0.03 | 0.18 | NO |
| 104 | PSME1 | PSME1 | PSME1 | 12893 | -0.033 | 0.18 | NO |
| 105 | AAAS | AAAS | AAAS | 12917 | -0.034 | 0.18 | NO |
| 106 | RCC1 | RCC1 | RCC1 | 12933 | -0.034 | 0.18 | NO |
| 107 | PPIA | PPIA | PPIA | 13030 | -0.035 | 0.18 | NO |
| 108 | SLC25A5 | SLC25A5 | SLC25A5 | 13058 | -0.036 | 0.18 | NO |
| 109 | PSME2 | PSME2 | PSME2 | 13073 | -0.036 | 0.19 | NO |
| 110 | ARF1 | ARF1 | ARF1 | 13134 | -0.037 | 0.19 | NO |
| 111 | SLC25A4 | SLC25A4 | SLC25A4 | 13190 | -0.038 | 0.19 | NO |
| 112 | BANF1 | BANF1 | BANF1 | 13207 | -0.038 | 0.19 | NO |
| 113 | PSMB10 | PSMB10 | PSMB10 | 13216 | -0.038 | 0.2 | NO |
| 114 | RANGAP1 | RANGAP1 | RANGAP1 | 13476 | -0.042 | 0.19 | NO |
| 115 | NUP35 | NUP35 | NUP35 | 13612 | -0.044 | 0.19 | NO |
| 116 | RAC1 | RAC1 | RAC1 | 14257 | -0.056 | 0.16 | NO |
| 117 | TCEB2 | TCEB2 | TCEB2 | 14921 | -0.07 | 0.13 | NO |
| 118 | HMGA1 | HMGA1 | HMGA1 | 15972 | -0.1 | 0.088 | NO |
| 119 | AP1S1 | AP1S1 | AP1S1 | 16146 | -0.11 | 0.092 | NO |
| 120 | AP1M2 | AP1M2 | AP1M2 | 18072 | -0.28 | 0.021 | NO |
Figure S81. Get High-res Image This plot shows mRNAseq_cNMF expression data heatmap (on the left) a RunningEnrichmentScore(RES) plot (on the top right) and a Signal2Noise(S2N) plot (on the bottom right) of genes in the pathway: KEGG PURINE METABOLISM.
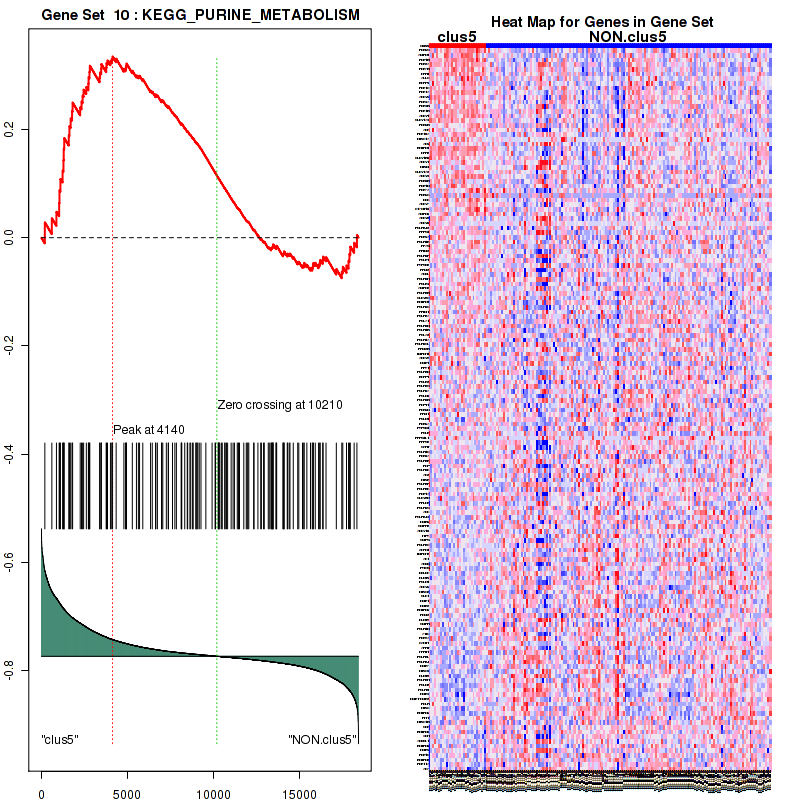
Figure S82. Get High-res Image For the top 5 core enriched genes in the pathway: KEGG PURINE METABOLISM, this volcano plot shows how much they are up/down-regulated and significant. The significance was calculated by empirical bayesian fit

Table S42. Get Full Table This table shows a Running Enrichment Score (RES) of each gene in this pathway, that is, the enrichment score at this point in the ranked list of genes. All genes are ranked by Signal-to-Noise (S2N), a measure of similarity as default and are used to obtain ES matrix of all genes. In this way, GSEA tool uses expression pattern of not only overlapped genes but also not-overlapped genes to produce ES matrix.
| Rank | GENE | SYMBOL | DESC | LIST.LOC | S2N | RES | CORE_ENRICHMENT |
|---|---|---|---|---|---|---|---|
| 1 | SLC2A4 | SLC2A4 | SLC2A4 | 241 | 0.61 | 0.063 | YES |
| 2 | FABP4 | FABP4 | FABP4 | 323 | 0.57 | 0.13 | YES |
| 3 | WNT10B | WNT10B | WNT10B | 356 | 0.56 | 0.2 | YES |
| 4 | LEP | LEP | LEP | 429 | 0.53 | 0.26 | YES |
| 5 | WNT1 | WNT1 | WNT1 | 434 | 0.53 | 0.33 | YES |
| 6 | ADIPOQ | ADIPOQ | ADIPOQ | 492 | 0.51 | 0.39 | YES |
| 7 | CD36 | CD36 | CD36 | 730 | 0.45 | 0.43 | YES |
| 8 | PLIN1 | PLIN1 | PLIN1 | 985 | 0.41 | 0.47 | YES |
| 9 | EBF1 | EBF1 | EBF1 | 1006 | 0.4 | 0.52 | YES |
| 10 | LPL | LPL | LPL | 1160 | 0.37 | 0.56 | YES |
| 11 | TNF | TNF | TNF | 1523 | 0.32 | 0.58 | YES |
| 12 | PCK1 | PCK1 | PCK1 | 2243 | 0.25 | 0.57 | NO |
| 13 | EGR2 | EGR2 | EGR2 | 2729 | 0.21 | 0.57 | NO |
| 14 | MED13L | MED13L | MED13L | 4644 | 0.1 | 0.48 | NO |
| 15 | TGFB1 | TGFB1 | TGFB1 | 4995 | 0.092 | 0.47 | NO |
| 16 | NCOA3 | NCOA3 | NCOA3 | 5544 | 0.076 | 0.45 | NO |
| 17 | CEBPD | CEBPD | CEBPD | 5666 | 0.072 | 0.45 | NO |
| 18 | CDK8 | CDK8 | CDK8 | 5720 | 0.071 | 0.46 | NO |
| 19 | CCND3 | CCND3 | CCND3 | 5803 | 0.068 | 0.46 | NO |
| 20 | NCOA2 | NCOA2 | NCOA2 | 5822 | 0.068 | 0.47 | NO |
| 21 | NR2F2 | NR2F2 | NR2F2 | 5963 | 0.064 | 0.47 | NO |
| 22 | CDK19 | CDK19 | CDK19 | 6034 | 0.063 | 0.48 | NO |
| 23 | NCOA1 | NCOA1 | NCOA1 | 6433 | 0.054 | 0.46 | NO |
| 24 | MED27 | MED27 | MED27 | 6639 | 0.05 | 0.46 | NO |
| 25 | TGS1 | TGS1 | TGS1 | 6787 | 0.047 | 0.45 | NO |
| 26 | EP300 | EP300 | EP300 | 7110 | 0.041 | 0.44 | NO |
| 27 | MED23 | MED23 | MED23 | 7371 | 0.036 | 0.43 | NO |
| 28 | MED26 | MED26 | MED26 | 7583 | 0.033 | 0.42 | NO |
| 29 | CREBBP | CREBBP | CREBBP | 7609 | 0.033 | 0.43 | NO |
| 30 | TBL1X | TBL1X | TBL1X | 7683 | 0.032 | 0.43 | NO |
| 31 | MED1 | MED1 | MED1 | 7900 | 0.029 | 0.42 | NO |
| 32 | MED8 | MED8 | MED8 | 7994 | 0.027 | 0.42 | NO |
| 33 | MED10 | MED10 | MED10 | 8097 | 0.026 | 0.41 | NO |
| 34 | NCOR1 | NCOR1 | NCOR1 | 8410 | 0.022 | 0.4 | NO |
| 35 | KLF4 | KLF4 | KLF4 | 8711 | 0.018 | 0.39 | NO |
| 36 | MED4 | MED4 | MED4 | 8748 | 0.018 | 0.39 | NO |
| 37 | MED17 | MED17 | MED17 | 8875 | 0.016 | 0.38 | NO |
| 38 | MED31 | MED31 | MED31 | 8933 | 0.015 | 0.38 | NO |
| 39 | MED12 | MED12 | MED12 | 9117 | 0.013 | 0.37 | NO |
| 40 | MED22 | MED22 | MED22 | 9184 | 0.012 | 0.37 | NO |
| 41 | MED14 | MED14 | MED14 | 9314 | 0.011 | 0.36 | NO |
| 42 | MED15 | MED15 | MED15 | 9527 | 0.0081 | 0.35 | NO |
| 43 | PPARA | PPARA | PPARA | 9552 | 0.0079 | 0.35 | NO |
| 44 | MED30 | MED30 | MED30 | 9578 | 0.0076 | 0.35 | NO |
| 45 | MED18 | MED18 | MED18 | 9632 | 0.0071 | 0.35 | NO |
| 46 | TBL1XR1 | TBL1XR1 | TBL1XR1 | 10002 | 0.0027 | 0.33 | NO |
| 47 | CDK4 | CDK4 | CDK4 | 10053 | 0.002 | 0.33 | NO |
| 48 | SMARCD3 | SMARCD3 | SMARCD3 | 10208 | 0.000052 | 0.32 | NO |
| 49 | MED6 | MED6 | MED6 | 10259 | -0.00046 | 0.32 | NO |
| 50 | HDAC3 | HDAC3 | HDAC3 | 10538 | -0.0036 | 0.3 | NO |
| 51 | CEBPB | CEBPB | CEBPB | 10592 | -0.0042 | 0.3 | NO |
| 52 | RXRA | RXRA | RXRA | 10945 | -0.0081 | 0.28 | NO |
| 53 | MED11 | MED11 | MED11 | 11147 | -0.01 | 0.27 | NO |
| 54 | NCOR2 | NCOR2 | NCOR2 | 11190 | -0.011 | 0.27 | NO |
| 55 | RELA | RELA | RELA | 11368 | -0.013 | 0.26 | NO |
| 56 | CCNC | CCNC | CCNC | 11370 | -0.013 | 0.27 | NO |
| 57 | MED20 | MED20 | MED20 | 11750 | -0.018 | 0.25 | NO |
| 58 | MED29 | MED29 | MED29 | 11784 | -0.018 | 0.25 | NO |
| 59 | MED9 | MED9 | MED9 | 12348 | -0.026 | 0.22 | NO |
| 60 | MED24 | MED24 | MED24 | 12575 | -0.029 | 0.21 | NO |
| 61 | PRIC285 | PRIC285 | PRIC285 | 12710 | -0.03 | 0.21 | NO |
| 62 | NCOA6 | NCOA6 | NCOA6 | 13092 | -0.036 | 0.19 | NO |
| 63 | MED7 | MED7 | MED7 | 13197 | -0.038 | 0.19 | NO |
| 64 | SREBF1 | SREBF1 | SREBF1 | 13652 | -0.045 | 0.17 | NO |
| 65 | ANGPTL4 | ANGPTL4 | ANGPTL4 | 13784 | -0.047 | 0.17 | NO |
| 66 | PPARGC1A | PPARGC1A | PPARGC1A | 14122 | -0.053 | 0.16 | NO |
| 67 | MED16 | MED16 | MED16 | 14787 | -0.066 | 0.13 | NO |
| 68 | MED21 | MED21 | MED21 | 14797 | -0.067 | 0.14 | NO |
| 69 | MED19 | MED19 | MED19 | 14919 | -0.07 | 0.14 | NO |
| 70 | MED25 | MED25 | MED25 | 15792 | -0.097 | 0.11 | NO |
| 71 | PPARG | PPARG | PPARG | 16636 | -0.14 | 0.078 | NO |
| 72 | KLF5 | KLF5 | KLF5 | 17131 | -0.17 | 0.072 | NO |
Figure S83. Get High-res Image This plot shows mRNAseq_cNMF expression data heatmap (on the left) a RunningEnrichmentScore(RES) plot (on the top right) and a Signal2Noise(S2N) plot (on the bottom right) of genes in the pathway: KEGG GLYCOSAMINOGLYCAN BIOSYNTHESIS HEPARAN SULFATE.
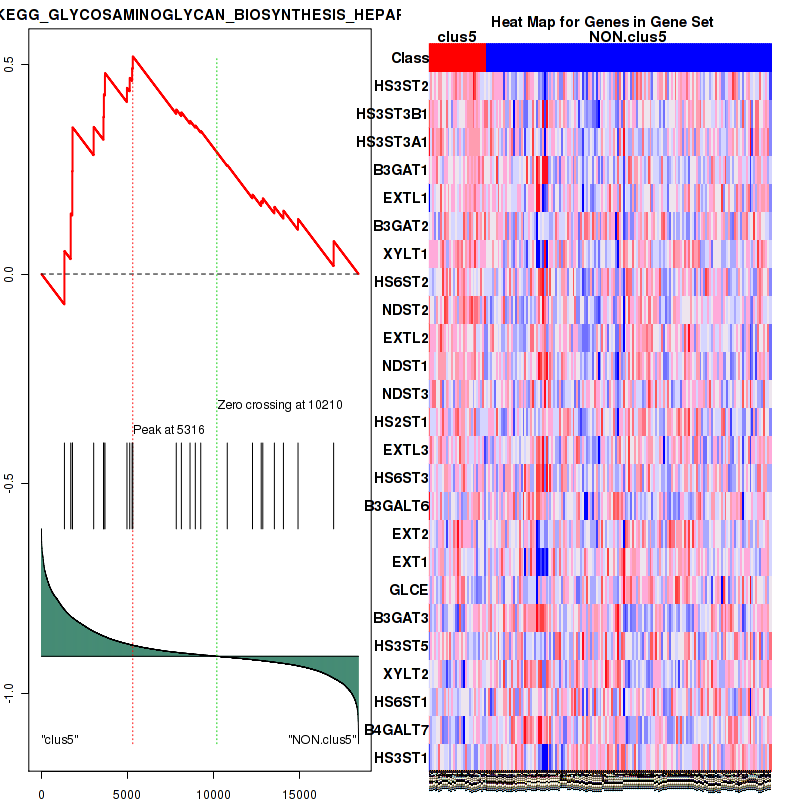
Figure S84. Get High-res Image For the top 5 core enriched genes in the pathway: KEGG GLYCOSAMINOGLYCAN BIOSYNTHESIS HEPARAN SULFATE, this volcano plot shows how much they are up/down-regulated and significant. The significance was calculated by empirical bayesian fit
Table S43. Get Full Table This table shows a Running Enrichment Score (RES) of each gene in this pathway, that is, the enrichment score at this point in the ranked list of genes. All genes are ranked by Signal-to-Noise (S2N), a measure of similarity as default and are used to obtain ES matrix of all genes. In this way, GSEA tool uses expression pattern of not only overlapped genes but also not-overlapped genes to produce ES matrix.
| Rank | GENE | SYMBOL | DESC | LIST.LOC | S2N | RES | CORE_ENRICHMENT |
|---|---|---|---|---|---|---|---|
| 1 | PRKCB | PRKCB | PRKCB | 15 | 0.83 | 0.074 | YES |
| 2 | CD79B | CD79B | CD79B | 28 | 0.8 | 0.15 | YES |
| 3 | CD19 | CD19 | CD19 | 66 | 0.75 | 0.21 | YES |
| 4 | CD79A | CD79A | CD79A | 85 | 0.73 | 0.28 | YES |
| 5 | BLK | BLK | BLK | 89 | 0.73 | 0.34 | YES |
| 6 | BTK | BTK | BTK | 300 | 0.58 | 0.39 | YES |
| 7 | PSMA8 | PSMA8 | PSMA8 | 519 | 0.5 | 0.42 | YES |
| 8 | PIK3CD | PIK3CD | PIK3CD | 1288 | 0.35 | 0.41 | YES |
| 9 | VAV1 | VAV1 | VAV1 | 1686 | 0.3 | 0.42 | YES |
| 10 | PLCG2 | PLCG2 | PLCG2 | 1979 | 0.27 | 0.42 | YES |
| 11 | RASGRP3 | RASGRP3 | RASGRP3 | 2155 | 0.25 | 0.44 | YES |
| 12 | FYN | FYN | FYN | 2277 | 0.24 | 0.45 | YES |
| 13 | REL | REL | REL | 2381 | 0.23 | 0.47 | YES |
| 14 | MALT1 | MALT1 | MALT1 | 3005 | 0.18 | 0.45 | YES |
| 15 | RASGRP1 | RASGRP1 | RASGRP1 | 3107 | 0.18 | 0.46 | YES |
| 16 | FOXO1 | FOXO1 | FOXO1 | 3117 | 0.18 | 0.48 | YES |
| 17 | AKT3 | AKT3 | AKT3 | 3143 | 0.18 | 0.49 | YES |
| 18 | PIK3R1 | PIK3R1 | PIK3R1 | 3665 | 0.15 | 0.48 | NO |
| 19 | NR4A1 | NR4A1 | NR4A1 | 4043 | 0.13 | 0.47 | NO |
| 20 | ITPR2 | ITPR2 | ITPR2 | 4194 | 0.12 | 0.47 | NO |
| 21 | CBL | CBL | CBL | 4321 | 0.12 | 0.47 | NO |
| 22 | PLCG1 | PLCG1 | PLCG1 | 4382 | 0.11 | 0.48 | NO |
| 23 | SYK | SYK | SYK | 4661 | 0.1 | 0.48 | NO |
| 24 | LYN | LYN | LYN | 4662 | 0.1 | 0.48 | NO |
| 25 | CBLB | CBLB | CBLB | 5043 | 0.091 | 0.47 | NO |
| 26 | PSMB9 | PSMB9 | PSMB9 | 5213 | 0.085 | 0.47 | NO |
| 27 | MAP3K7 | MAP3K7 | MAP3K7 | 5286 | 0.083 | 0.48 | NO |
| 28 | CDKN1B | CDKN1B | CDKN1B | 5586 | 0.074 | 0.46 | NO |
| 29 | GRB2 | GRB2 | GRB2 | 5637 | 0.073 | 0.47 | NO |
| 30 | SH3KBP1 | SH3KBP1 | SH3KBP1 | 5693 | 0.071 | 0.47 | NO |
| 31 | FOXO3 | FOXO3 | FOXO3 | 5769 | 0.069 | 0.48 | NO |
| 32 | NFKBIA | NFKBIA | NFKBIA | 5933 | 0.065 | 0.47 | NO |
| 33 | BLNK | BLNK | BLNK | 5987 | 0.064 | 0.47 | NO |
| 34 | ORAI1 | ORAI1 | ORAI1 | 6075 | 0.062 | 0.48 | NO |
| 35 | SOS1 | SOS1 | SOS1 | 6304 | 0.057 | 0.47 | NO |
| 36 | IKBKG | IKBKG | IKBKG | 6342 | 0.056 | 0.47 | NO |
| 37 | PTEN | PTEN | PTEN | 6359 | 0.055 | 0.48 | NO |
| 38 | MTOR | MTOR | MTOR | 6475 | 0.053 | 0.47 | NO |
| 39 | MAPKAP1 | MAPKAP1 | MAPKAP1 | 6615 | 0.05 | 0.47 | NO |
| 40 | NRAS | NRAS | NRAS | 6666 | 0.049 | 0.47 | NO |
| 41 | AKT2 | AKT2 | AKT2 | 7088 | 0.041 | 0.45 | NO |
| 42 | SHC1 | SHC1 | SHC1 | 7113 | 0.041 | 0.46 | NO |
| 43 | STIM1 | STIM1 | STIM1 | 7183 | 0.04 | 0.46 | NO |
| 44 | THEM4 | THEM4 | THEM4 | 7336 | 0.037 | 0.45 | NO |
| 45 | PSME4 | PSME4 | PSME4 | 7382 | 0.036 | 0.45 | NO |
| 46 | PDPK1 | PDPK1 | PDPK1 | 7413 | 0.036 | 0.45 | NO |
| 47 | RICTOR | RICTOR | RICTOR | 7449 | 0.035 | 0.45 | NO |
| 48 | CALM1 | CALM1 | CALM1 | 7462 | 0.035 | 0.46 | NO |
| 49 | PSMD5 | PSMD5 | PSMD5 | 7724 | 0.031 | 0.44 | NO |
| 50 | CREB1 | CREB1 | CREB1 | 7776 | 0.03 | 0.44 | NO |
| 51 | CHUK | CHUK | CHUK | 7788 | 0.03 | 0.45 | NO |
| 52 | PSMB8 | PSMB8 | PSMB8 | 7798 | 0.03 | 0.45 | NO |
| 53 | CUL1 | CUL1 | CUL1 | 7813 | 0.03 | 0.45 | NO |
| 54 | PIK3AP1 | PIK3AP1 | PIK3AP1 | 8181 | 0.025 | 0.43 | NO |
| 55 | NCK1 | NCK1 | NCK1 | 8765 | 0.018 | 0.4 | NO |
| 56 | CDKN1A | CDKN1A | CDKN1A | 8818 | 0.017 | 0.4 | NO |
| 57 | PSMC2 | PSMC2 | PSMC2 | 9004 | 0.014 | 0.39 | NO |
| 58 | UBA52 | UBA52 | UBA52 | 9019 | 0.014 | 0.39 | NO |
| 59 | RPS27A | RPS27A | RPS27A | 9064 | 0.014 | 0.39 | NO |
| 60 | PSMC4 | PSMC4 | PSMC4 | 9111 | 0.013 | 0.39 | NO |
| 61 | NFKBIE | NFKBIE | NFKBIE | 9166 | 0.013 | 0.39 | NO |
| 62 | PSMD11 | PSMD11 | PSMD11 | 9198 | 0.012 | 0.39 | NO |
| 63 | PSMA1 | PSMA1 | PSMA1 | 9453 | 0.0091 | 0.38 | NO |
| 64 | BTRC | BTRC | BTRC | 9479 | 0.0087 | 0.38 | NO |
| 65 | PSMD2 | PSMD2 | PSMD2 | 9603 | 0.0074 | 0.37 | NO |
| 66 | CALM3 | CALM3 | CALM3 | 9699 | 0.0063 | 0.36 | NO |
| 67 | PSMB1 | PSMB1 | PSMB1 | 9723 | 0.006 | 0.36 | NO |
| 68 | CASP9 | CASP9 | CASP9 | 9764 | 0.0056 | 0.36 | NO |
| 69 | PSMD7 | PSMD7 | PSMD7 | 9846 | 0.0047 | 0.36 | NO |
| 70 | PSMC5 | PSMC5 | PSMC5 | 9919 | 0.0037 | 0.36 | NO |
| 71 | PSMB2 | PSMB2 | PSMB2 | 10007 | 0.0026 | 0.35 | NO |
| 72 | PSMA4 | PSMA4 | PSMA4 | 10034 | 0.0023 | 0.35 | NO |
| 73 | PSMC1 | PSMC1 | PSMC1 | 10049 | 0.0021 | 0.35 | NO |
| 74 | PSMB6 | PSMB6 | PSMB6 | 10144 | 0.0011 | 0.34 | NO |
| 75 | CARD11 | CARD11 | CARD11 | 10190 | 0.00031 | 0.34 | NO |
| 76 | MDM2 | MDM2 | MDM2 | 10253 | -0.00038 | 0.34 | NO |
| 77 | PSMD1 | PSMD1 | PSMD1 | 10267 | -0.00062 | 0.34 | NO |
| 78 | PSMD14 | PSMD14 | PSMD14 | 10334 | -0.0012 | 0.33 | NO |
| 79 | PSMA7 | PSMA7 | PSMA7 | 10358 | -0.0015 | 0.33 | NO |
| 80 | PSMA3 | PSMA3 | PSMA3 | 10432 | -0.0025 | 0.33 | NO |
| 81 | IKBKB | IKBKB | IKBKB | 10433 | -0.0025 | 0.33 | NO |
| 82 | RPS6KB2 | RPS6KB2 | RPS6KB2 | 10492 | -0.0032 | 0.33 | NO |
| 83 | PSMC3 | PSMC3 | PSMC3 | 10778 | -0.0061 | 0.31 | NO |
| 84 | PSMD12 | PSMD12 | PSMD12 | 10810 | -0.0065 | 0.31 | NO |
| 85 | PSMD10 | PSMD10 | PSMD10 | 10820 | -0.0066 | 0.31 | NO |
| 86 | PSMA6 | PSMA6 | PSMA6 | 10958 | -0.0083 | 0.3 | NO |
| 87 | PSMD13 | PSMD13 | PSMD13 | 11051 | -0.0094 | 0.3 | NO |
| 88 | NFKBIB | NFKBIB | NFKBIB | 11160 | -0.011 | 0.3 | NO |
| 89 | FBXW11 | FBXW11 | FBXW11 | 11210 | -0.011 | 0.29 | NO |
| 90 | CALM2 | CALM2 | CALM2 | 11223 | -0.011 | 0.29 | NO |
| 91 | PSMA2 | PSMA2 | PSMA2 | 11262 | -0.012 | 0.29 | NO |
| 92 | PSMA5 | PSMA5 | PSMA5 | 11294 | -0.012 | 0.29 | NO |
| 93 | RELA | RELA | RELA | 11368 | -0.013 | 0.29 | NO |
| 94 | AKT1 | AKT1 | AKT1 | 11471 | -0.014 | 0.28 | NO |
| 95 | PSMD8 | PSMD8 | PSMD8 | 11503 | -0.015 | 0.28 | NO |
| 96 | PSMB3 | PSMB3 | PSMB3 | 11695 | -0.017 | 0.28 | NO |
| 97 | PSMB4 | PSMB4 | PSMB4 | 11819 | -0.019 | 0.27 | NO |
| 98 | FOXO4 | FOXO4 | FOXO4 | 11946 | -0.02 | 0.26 | NO |
| 99 | PSMC6 | PSMC6 | PSMC6 | 11954 | -0.02 | 0.27 | NO |
| 100 | PSMF1 | PSMF1 | PSMF1 | 11970 | -0.02 | 0.27 | NO |
| 101 | PSMD3 | PSMD3 | PSMD3 | 11986 | -0.021 | 0.27 | NO |
| 102 | PSMD9 | PSMD9 | PSMD9 | 12003 | -0.021 | 0.27 | NO |
| 103 | PSMB5 | PSMB5 | PSMB5 | 12193 | -0.024 | 0.26 | NO |
| 104 | SKP1 | SKP1 | SKP1 | 12318 | -0.025 | 0.26 | NO |
| 105 | KRAS | KRAS | KRAS | 12329 | -0.025 | 0.26 | NO |
| 106 | PSMD6 | PSMD6 | PSMD6 | 12380 | -0.026 | 0.26 | NO |
| 107 | TSC2 | TSC2 | TSC2 | 12427 | -0.027 | 0.26 | NO |
| 108 | PSMD4 | PSMD4 | PSMD4 | 12521 | -0.028 | 0.26 | NO |
| 109 | PSMB7 | PSMB7 | PSMB7 | 12649 | -0.03 | 0.25 | NO |
| 110 | PSME1 | PSME1 | PSME1 | 12893 | -0.033 | 0.24 | NO |
| 111 | PSME2 | PSME2 | PSME2 | 13073 | -0.036 | 0.24 | NO |
| 112 | PSMB10 | PSMB10 | PSMB10 | 13216 | -0.038 | 0.23 | NO |
| 113 | AKT1S1 | AKT1S1 | AKT1S1 | 13279 | -0.039 | 0.23 | NO |
| 114 | ITPR3 | ITPR3 | ITPR3 | 13384 | -0.041 | 0.23 | NO |
| 115 | BCL10 | BCL10 | BCL10 | 13421 | -0.041 | 0.23 | NO |
| 116 | GSK3A | GSK3A | GSK3A | 13552 | -0.043 | 0.23 | NO |
| 117 | PHLPP1 | PHLPP1 | PHLPP1 | 14183 | -0.054 | 0.2 | NO |
| 118 | MLST8 | MLST8 | MLST8 | 14428 | -0.059 | 0.19 | NO |
| 119 | BAD | BAD | BAD | 15149 | -0.076 | 0.16 | NO |
| 120 | HRAS | HRAS | HRAS | 15336 | -0.081 | 0.16 | NO |
| 121 | TRIB3 | TRIB3 | TRIB3 | 17025 | -0.16 | 0.078 | NO |
Figure S85. Get High-res Image This plot shows mRNAseq_cNMF expression data heatmap (on the left) a RunningEnrichmentScore(RES) plot (on the top right) and a Signal2Noise(S2N) plot (on the bottom right) of genes in the pathway: KEGG ABC TRANSPORTERS.
Figure S86. Get High-res Image For the top 5 core enriched genes in the pathway: KEGG ABC TRANSPORTERS, this volcano plot shows how much they are up/down-regulated and significant. The significance was calculated by empirical bayesian fit

Table S44. Get Full Table This table shows a Running Enrichment Score (RES) of each gene in this pathway, that is, the enrichment score at this point in the ranked list of genes. All genes are ranked by Signal-to-Noise (S2N), a measure of similarity as default and are used to obtain ES matrix of all genes. In this way, GSEA tool uses expression pattern of not only overlapped genes but also not-overlapped genes to produce ES matrix.
| Rank | GENE | SYMBOL | DESC | LIST.LOC | S2N | RES | CORE_ENRICHMENT |
|---|---|---|---|---|---|---|---|
| 1 | BLK | BLK | BLK | 89 | 0.73 | 0.051 | YES |
| 2 | MYOCD | MYOCD | MYOCD | 456 | 0.52 | 0.072 | YES |
| 3 | PIK3R5 | PIK3R5 | PIK3R5 | 601 | 0.48 | 0.1 | YES |
| 4 | PIK3CG | PIK3CG | PIK3CG | 646 | 0.47 | 0.13 | YES |
| 5 | SLA | SLA | SLA | 939 | 0.42 | 0.15 | YES |
| 6 | LCK | LCK | LCK | 951 | 0.41 | 0.18 | YES |
| 7 | PIK3R6 | PIK3R6 | PIK3R6 | 975 | 0.41 | 0.21 | YES |
| 8 | S1PR1 | S1PR1 | S1PR1 | 1249 | 0.36 | 0.22 | YES |
| 9 | FGR | FGR | FGR | 1275 | 0.36 | 0.25 | YES |
| 10 | PIK3CD | PIK3CD | PIK3CD | 1288 | 0.35 | 0.28 | YES |
| 11 | ITGB3 | ITGB3 | ITGB3 | 1650 | 0.3 | 0.28 | YES |
| 12 | HCK | HCK | HCK | 1771 | 0.29 | 0.3 | YES |
| 13 | MAPK10 | MAPK10 | MAPK10 | 1784 | 0.29 | 0.32 | YES |
| 14 | FYN | FYN | FYN | 2277 | 0.24 | 0.31 | YES |
| 15 | CYFIP2 | CYFIP2 | CYFIP2 | 2422 | 0.23 | 0.32 | YES |
| 16 | TAGLN | TAGLN | TAGLN | 2718 | 0.21 | 0.32 | YES |
| 17 | PAG1 | PAG1 | PAG1 | 2851 | 0.2 | 0.33 | YES |
| 18 | ACTA2 | ACTA2 | ACTA2 | 3066 | 0.18 | 0.33 | YES |
| 19 | DOCK4 | DOCK4 | DOCK4 | 3075 | 0.18 | 0.34 | YES |
| 20 | PIK3R3 | PIK3R3 | PIK3R3 | 3095 | 0.18 | 0.36 | YES |
| 21 | PPP2R2B | PPP2R2B | PPP2R2B | 3391 | 0.16 | 0.35 | YES |
| 22 | JAK2 | JAK2 | JAK2 | 3442 | 0.16 | 0.36 | YES |
| 23 | SIPA1 | SIPA1 | SIPA1 | 3559 | 0.15 | 0.37 | YES |
| 24 | PIK3R1 | PIK3R1 | PIK3R1 | 3665 | 0.15 | 0.37 | YES |
| 25 | STAT5A | STAT5A | STAT5A | 3679 | 0.15 | 0.38 | YES |
| 26 | MYC | MYC | MYC | 4023 | 0.13 | 0.37 | YES |
| 27 | RAPGEF1 | RAPGEF1 | RAPGEF1 | 4053 | 0.13 | 0.38 | YES |
| 28 | RAP1A | RAP1A | RAP1A | 4170 | 0.12 | 0.38 | YES |
| 29 | LRP1 | LRP1 | LRP1 | 4205 | 0.12 | 0.39 | YES |
| 30 | ABL1 | ABL1 | ABL1 | 4232 | 0.12 | 0.4 | YES |
| 31 | STAT5B | STAT5B | STAT5B | 4237 | 0.12 | 0.41 | YES |
| 32 | SRF | SRF | SRF | 4316 | 0.12 | 0.41 | YES |
| 33 | CBL | CBL | CBL | 4321 | 0.12 | 0.42 | YES |
| 34 | PLCG1 | PLCG1 | PLCG1 | 4382 | 0.11 | 0.43 | YES |
| 35 | PDGFRB | PDGFRB | PDGFRB | 4426 | 0.11 | 0.43 | YES |
| 36 | CSK | CSK | CSK | 4562 | 0.11 | 0.44 | YES |
| 37 | PIK3CA | PIK3CA | PIK3CA | 4566 | 0.11 | 0.44 | YES |
| 38 | SPHK1 | SPHK1 | SPHK1 | 4572 | 0.11 | 0.45 | YES |
| 39 | KSR1 | KSR1 | KSR1 | 4610 | 0.1 | 0.46 | YES |
| 40 | PTPN1 | PTPN1 | PTPN1 | 4631 | 0.1 | 0.46 | YES |
| 41 | LYN | LYN | LYN | 4662 | 0.1 | 0.47 | YES |
| 42 | WASF2 | WASF2 | WASF2 | 4822 | 0.098 | 0.47 | YES |
| 43 | GAB1 | GAB1 | GAB1 | 4878 | 0.096 | 0.47 | YES |
| 44 | DOK1 | DOK1 | DOK1 | 5240 | 0.084 | 0.46 | NO |
| 45 | PRKCE | PRKCE | PRKCE | 5301 | 0.082 | 0.46 | NO |
| 46 | GRB2 | GRB2 | GRB2 | 5637 | 0.073 | 0.45 | NO |
| 47 | MAP2K4 | MAP2K4 | MAP2K4 | 5776 | 0.069 | 0.45 | NO |
| 48 | CRK | CRK | CRK | 5971 | 0.064 | 0.44 | NO |
| 49 | ITGAV | ITGAV | ITGAV | 6018 | 0.063 | 0.44 | NO |
| 50 | PDGFB | PDGFB | PDGFB | 6113 | 0.061 | 0.44 | NO |
| 51 | ARAP1 | ARAP1 | ARAP1 | 6220 | 0.059 | 0.44 | NO |
| 52 | ACTR2 | ACTR2 | ACTR2 | 6302 | 0.057 | 0.44 | NO |
| 53 | SOS1 | SOS1 | SOS1 | 6304 | 0.057 | 0.45 | NO |
| 54 | ELK1 | ELK1 | ELK1 | 6322 | 0.056 | 0.45 | NO |
| 55 | STAT3 | STAT3 | STAT3 | 6325 | 0.056 | 0.46 | NO |
| 56 | RAP1B | RAP1B | RAP1B | 6335 | 0.056 | 0.46 | NO |
| 57 | PTEN | PTEN | PTEN | 6359 | 0.055 | 0.46 | NO |
| 58 | ACTR3 | ACTR3 | ACTR3 | 6368 | 0.055 | 0.47 | NO |
| 59 | STAT1 | STAT1 | STAT1 | 6391 | 0.055 | 0.47 | NO |
| 60 | NRAS | NRAS | NRAS | 6666 | 0.049 | 0.46 | NO |
| 61 | MAPK1 | MAPK1 | MAPK1 | 6760 | 0.048 | 0.46 | NO |
| 62 | PTPN11 | PTPN11 | PTPN11 | 6857 | 0.046 | 0.46 | NO |
| 63 | SHC1 | SHC1 | SHC1 | 7113 | 0.041 | 0.44 | NO |
| 64 | ARPC2 | ARPC2 | ARPC2 | 7180 | 0.04 | 0.44 | NO |
| 65 | RPS6KA3 | RPS6KA3 | RPS6KA3 | 7475 | 0.035 | 0.43 | NO |
| 66 | MAP2K1 | MAP2K1 | MAP2K1 | 7825 | 0.03 | 0.41 | NO |
| 67 | ARPC1B | ARPC1B | ARPC1B | 7924 | 0.028 | 0.41 | NO |
| 68 | MAPK8 | MAPK8 | MAPK8 | 8009 | 0.027 | 0.41 | NO |
| 69 | RHOA | RHOA | RHOA | 8044 | 0.026 | 0.41 | NO |
| 70 | JUN | JUN | JUN | 8203 | 0.024 | 0.4 | NO |
| 71 | ARPC4 | ARPC4 | ARPC4 | 8661 | 0.019 | 0.38 | NO |
| 72 | NCK1 | NCK1 | NCK1 | 8765 | 0.018 | 0.37 | NO |
| 73 | RAF1 | RAF1 | RAF1 | 8915 | 0.016 | 0.37 | NO |
| 74 | ABI1 | ABI1 | ABI1 | 8982 | 0.015 | 0.36 | NO |
| 75 | YWHAB | YWHAB | YWHAB | 9231 | 0.012 | 0.35 | NO |
| 76 | YWHAQ | YWHAQ | YWHAQ | 9301 | 0.011 | 0.35 | NO |
| 77 | IQGAP1 | IQGAP1 | IQGAP1 | 9331 | 0.011 | 0.35 | NO |
| 78 | USP6NL | USP6NL | USP6NL | 9446 | 0.0091 | 0.34 | NO |
| 79 | ARPC5 | ARPC5 | ARPC5 | 9733 | 0.0059 | 0.33 | NO |
| 80 | YWHAG | YWHAG | YWHAG | 9865 | 0.0044 | 0.32 | NO |
| 81 | NCK2 | NCK2 | NCK2 | 10153 | 0.001 | 0.3 | NO |
| 82 | JUND | JUND | JUND | 10350 | -0.0014 | 0.29 | NO |
| 83 | FOS | FOS | FOS | 10406 | -0.002 | 0.29 | NO |
| 84 | PRKCA | PRKCA | PRKCA | 10424 | -0.0024 | 0.29 | NO |
| 85 | YWHAH | YWHAH | YWHAH | 10537 | -0.0036 | 0.28 | NO |
| 86 | ARPC3 | ARPC3 | ARPC3 | 10915 | -0.0078 | 0.26 | NO |
| 87 | PPP2CA | PPP2CA | PPP2CA | 10982 | -0.0085 | 0.26 | NO |
| 88 | PTPRJ | PTPRJ | PTPRJ | 10991 | -0.0086 | 0.26 | NO |
| 89 | BRAF | BRAF | BRAF | 11009 | -0.0088 | 0.26 | NO |
| 90 | ARHGDIA | ARHGDIA | ARHGDIA | 11338 | -0.013 | 0.24 | NO |
| 91 | MAPK9 | MAPK9 | MAPK9 | 11534 | -0.015 | 0.24 | NO |
| 92 | PTPN2 | PTPN2 | PTPN2 | 11642 | -0.016 | 0.23 | NO |
| 93 | EIF2AK2 | EIF2AK2 | EIF2AK2 | 12043 | -0.022 | 0.21 | NO |
| 94 | PIN1 | PIN1 | PIN1 | 12148 | -0.023 | 0.21 | NO |
| 95 | GRB10 | GRB10 | GRB10 | 12172 | -0.023 | 0.21 | NO |
| 96 | EPS8 | EPS8 | EPS8 | 12191 | -0.023 | 0.21 | NO |
| 97 | RAB5A | RAB5A | RAB5A | 12258 | -0.024 | 0.21 | NO |
| 98 | KRAS | KRAS | KRAS | 12329 | -0.025 | 0.2 | NO |
| 99 | NCKAP1 | NCKAP1 | NCKAP1 | 12462 | -0.028 | 0.2 | NO |
| 100 | YWHAE | YWHAE | YWHAE | 12536 | -0.028 | 0.2 | NO |
| 101 | RASA1 | RASA1 | RASA1 | 12790 | -0.032 | 0.19 | NO |
| 102 | ACTN4 | ACTN4 | ACTN4 | 12818 | -0.032 | 0.19 | NO |
| 103 | PPP2R1A | PPP2R1A | PPP2R1A | 12853 | -0.033 | 0.19 | NO |
| 104 | YWHAZ | YWHAZ | YWHAZ | 12968 | -0.034 | 0.18 | NO |
| 105 | MAP2K7 | MAP2K7 | MAP2K7 | 13008 | -0.035 | 0.18 | NO |
| 106 | PIK3R2 | PIK3R2 | PIK3R2 | 13595 | -0.044 | 0.16 | NO |
| 107 | PLA2G4A | PLA2G4A | PLA2G4A | 13643 | -0.045 | 0.16 | NO |
| 108 | MAP2K2 | MAP2K2 | MAP2K2 | 13732 | -0.046 | 0.16 | NO |
| 109 | MAPK3 | MAPK3 | MAPK3 | 13954 | -0.05 | 0.15 | NO |
| 110 | DNM2 | DNM2 | DNM2 | 13970 | -0.05 | 0.15 | NO |
| 111 | RAB4A | RAB4A | RAB4A | 14030 | -0.051 | 0.15 | NO |
| 112 | PIK3CB | PIK3CB | PIK3CB | 14087 | -0.053 | 0.15 | NO |
| 113 | CTTN | CTTN | CTTN | 14118 | -0.053 | 0.16 | NO |
| 114 | YES1 | YES1 | YES1 | 14159 | -0.054 | 0.16 | NO |
| 115 | MLLT4 | MLLT4 | MLLT4 | 14249 | -0.056 | 0.16 | NO |
| 116 | RAC1 | RAC1 | RAC1 | 14257 | -0.056 | 0.16 | NO |
| 117 | VAV2 | VAV2 | VAV2 | 14315 | -0.057 | 0.16 | NO |
| 118 | PRKCD | PRKCD | PRKCD | 14668 | -0.064 | 0.15 | NO |
| 119 | BAIAP2 | BAIAP2 | BAIAP2 | 14695 | -0.064 | 0.15 | NO |
| 120 | WASL | WASL | WASL | 14725 | -0.065 | 0.15 | NO |
| 121 | HRAS | HRAS | HRAS | 15336 | -0.081 | 0.13 | NO |
| 122 | BCAR1 | BCAR1 | BCAR1 | 15338 | -0.081 | 0.13 | NO |
| 123 | SLC9A3R2 | SLC9A3R2 | SLC9A3R2 | 15395 | -0.083 | 0.14 | NO |
| 124 | SRC | SRC | SRC | 15811 | -0.098 | 0.12 | NO |
| 125 | PAK1 | PAK1 | PAK1 | 15818 | -0.098 | 0.13 | NO |
| 126 | SFN | SFN | SFN | 15853 | -0.099 | 0.13 | NO |
| 127 | SLC9A3R1 | SLC9A3R1 | SLC9A3R1 | 15897 | -0.1 | 0.14 | NO |
Figure S87. Get High-res Image This plot shows mRNAseq_cNMF expression data heatmap (on the left) a RunningEnrichmentScore(RES) plot (on the top right) and a Signal2Noise(S2N) plot (on the bottom right) of genes in the pathway: KEGG MAPK SIGNALING PATHWAY.
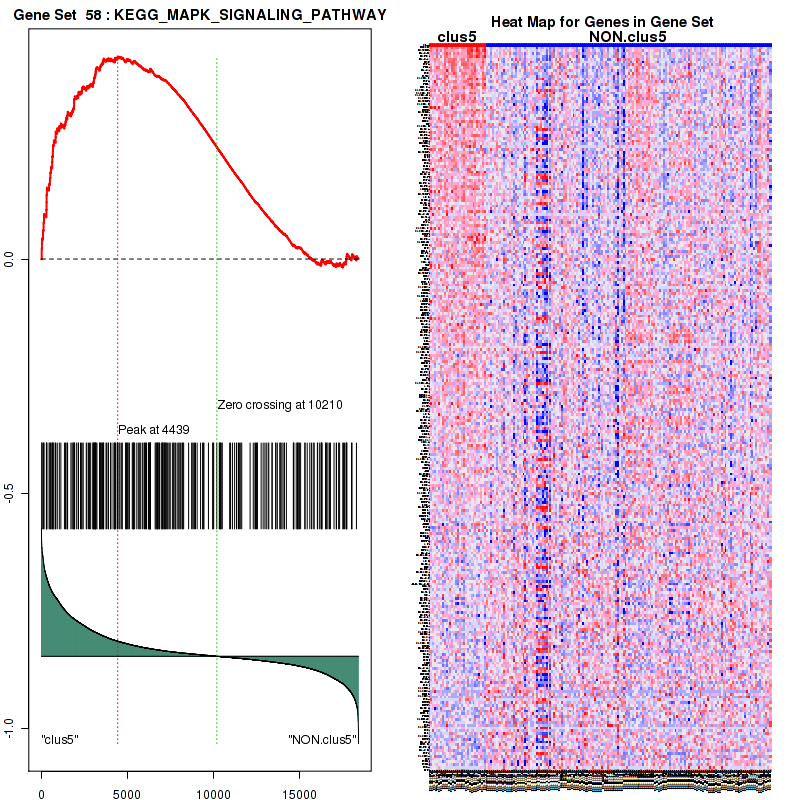
Figure S88. Get High-res Image For the top 5 core enriched genes in the pathway: KEGG MAPK SIGNALING PATHWAY, this volcano plot shows how much they are up/down-regulated and significant. The significance was calculated by empirical bayesian fit
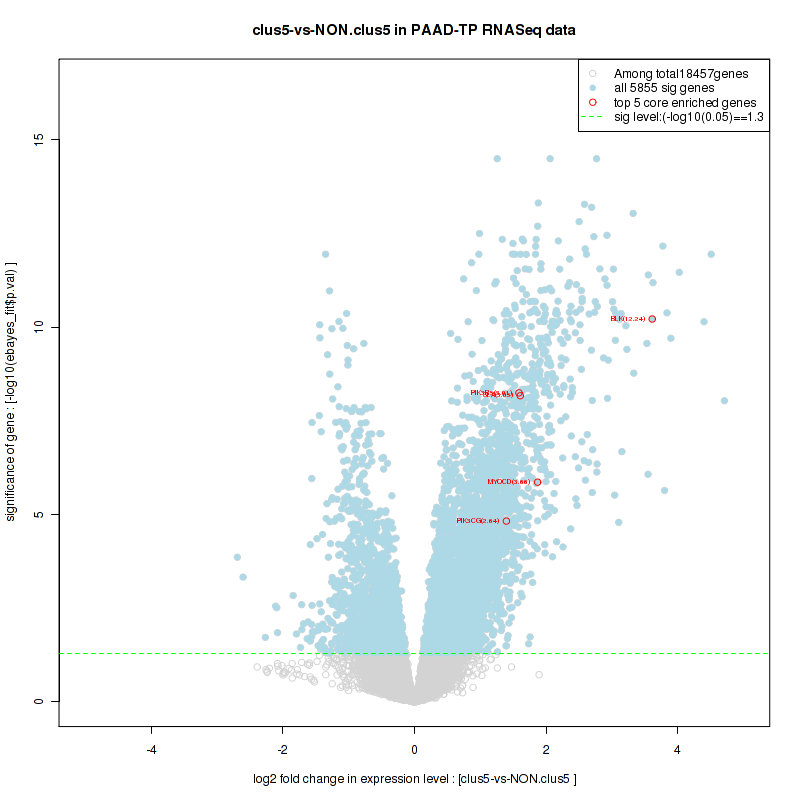
Table S45. Get Full Table This table shows a Running Enrichment Score (RES) of each gene in this pathway, that is, the enrichment score at this point in the ranked list of genes. All genes are ranked by Signal-to-Noise (S2N), a measure of similarity as default and are used to obtain ES matrix of all genes. In this way, GSEA tool uses expression pattern of not only overlapped genes but also not-overlapped genes to produce ES matrix.
| Rank | GENE | SYMBOL | DESC | LIST.LOC | S2N | RES | CORE_ENRICHMENT |
|---|---|---|---|---|---|---|---|
| 1 | ACAP1 | ACAP1 | ACAP1 | 219 | 0.62 | 0.064 | YES |
| 2 | SLC2A4 | SLC2A4 | SLC2A4 | 241 | 0.61 | 0.14 | YES |
| 3 | ITGA8 | ITGA8 | ITGA8 | 251 | 0.6 | 0.21 | YES |
| 4 | IL2RA | IL2RA | IL2RA | 513 | 0.5 | 0.26 | YES |
| 5 | ADRB2 | ADRB2 | ADRB2 | 563 | 0.49 | 0.32 | YES |
| 6 | TSHR | TSHR | TSHR | 651 | 0.47 | 0.37 | YES |
| 7 | ITGA4 | ITGA4 | ITGA4 | 738 | 0.45 | 0.42 | YES |
| 8 | AGTR1 | AGTR1 | AGTR1 | 773 | 0.44 | 0.47 | YES |
| 9 | ITGA9 | ITGA9 | ITGA9 | 886 | 0.43 | 0.52 | YES |
| 10 | AVPR2 | AVPR2 | AVPR2 | 911 | 0.42 | 0.57 | YES |
| 11 | ITGA7 | ITGA7 | ITGA7 | 927 | 0.42 | 0.62 | YES |
| 12 | EDNRB | EDNRB | EDNRB | 1158 | 0.37 | 0.65 | YES |
| 13 | ITGA5 | ITGA5 | ITGA5 | 3199 | 0.17 | 0.56 | NO |
| 14 | ITGA11 | ITGA11 | ITGA11 | 3666 | 0.15 | 0.55 | NO |
| 15 | ITGA1 | ITGA1 | ITGA1 | 3674 | 0.15 | 0.57 | NO |
| 16 | ITGA10 | ITGA10 | ITGA10 | 4073 | 0.13 | 0.56 | NO |
| 17 | BIN1 | BIN1 | BIN1 | 5191 | 0.086 | 0.51 | NO |
| 18 | EXOC2 | EXOC2 | EXOC2 | 5791 | 0.069 | 0.49 | NO |
| 19 | ITGAV | ITGAV | ITGAV | 6018 | 0.063 | 0.49 | NO |
| 20 | EXOC5 | EXOC5 | EXOC5 | 6057 | 0.062 | 0.49 | NO |
| 21 | SPAG9 | SPAG9 | SPAG9 | 6298 | 0.057 | 0.48 | NO |
| 22 | CPE | CPE | CPE | 7002 | 0.043 | 0.45 | NO |
| 23 | PIP5K1C | PIP5K1C | PIP5K1C | 7422 | 0.036 | 0.43 | NO |
| 24 | KLC1 | KLC1 | KLC1 | 8305 | 0.023 | 0.39 | NO |
| 25 | ITGB1 | ITGB1 | ITGB1 | 8861 | 0.016 | 0.36 | NO |
| 26 | VAMP3 | VAMP3 | VAMP3 | 9010 | 0.014 | 0.35 | NO |
| 27 | PLD2 | PLD2 | PLD2 | 9273 | 0.012 | 0.34 | NO |
| 28 | CLTC | CLTC | CLTC | 9478 | 0.0087 | 0.33 | NO |
| 29 | CTNNB1 | CTNNB1 | CTNNB1 | 10027 | 0.0024 | 0.3 | NO |
| 30 | ARF6 | ARF6 | ARF6 | 10206 | 0.000091 | 0.29 | NO |
| 31 | EXOC3 | EXOC3 | EXOC3 | 10652 | -0.0049 | 0.27 | NO |
| 32 | EXOC7 | EXOC7 | EXOC7 | 10738 | -0.0057 | 0.26 | NO |
| 33 | RALA | RALA | RALA | 11202 | -0.011 | 0.24 | NO |
| 34 | EXOC1 | EXOC1 | EXOC1 | 11486 | -0.015 | 0.23 | NO |
| 35 | SCAMP2 | SCAMP2 | SCAMP2 | 12551 | -0.028 | 0.17 | NO |
| 36 | EXOC6 | EXOC6 | EXOC6 | 12787 | -0.032 | 0.16 | NO |
| 37 | MAPK8IP3 | MAPK8IP3 | MAPK8IP3 | 13428 | -0.042 | 0.14 | NO |
| 38 | NME1 | NME1 | NME1 | 13661 | -0.045 | 0.13 | NO |
| 39 | EXOC4 | EXOC4 | EXOC4 | 13714 | -0.046 | 0.13 | NO |
| 40 | CTNNA1 | CTNNA1 | CTNNA1 | 13909 | -0.049 | 0.13 | NO |
| 41 | DNM2 | DNM2 | DNM2 | 13970 | -0.05 | 0.13 | NO |
| 42 | ITGA6 | ITGA6 | ITGA6 | 15136 | -0.076 | 0.075 | NO |
| 43 | PLD1 | PLD1 | PLD1 | 15247 | -0.079 | 0.078 | NO |
| 44 | CTNND1 | CTNND1 | CTNND1 | 15597 | -0.09 | 0.07 | NO |
| 45 | ASAP2 | ASAP2 | ASAP2 | 16053 | -0.11 | 0.059 | NO |
| 46 | INS | INS | INS | 16363 | -0.12 | 0.057 | NO |
| 47 | ITGA2 | ITGA2 | ITGA2 | 16476 | -0.13 | 0.066 | NO |
| 48 | ITGA3 | ITGA3 | ITGA3 | 17082 | -0.17 | 0.054 | NO |
| 49 | CDH1 | CDH1 | CDH1 | 17168 | -0.17 | 0.07 | NO |
Figure S89. Get High-res Image This plot shows mRNAseq_cNMF expression data heatmap (on the left) a RunningEnrichmentScore(RES) plot (on the top right) and a Signal2Noise(S2N) plot (on the bottom right) of genes in the pathway: KEGG CYTOKINE CYTOKINE RECEPTOR INTERACTION.
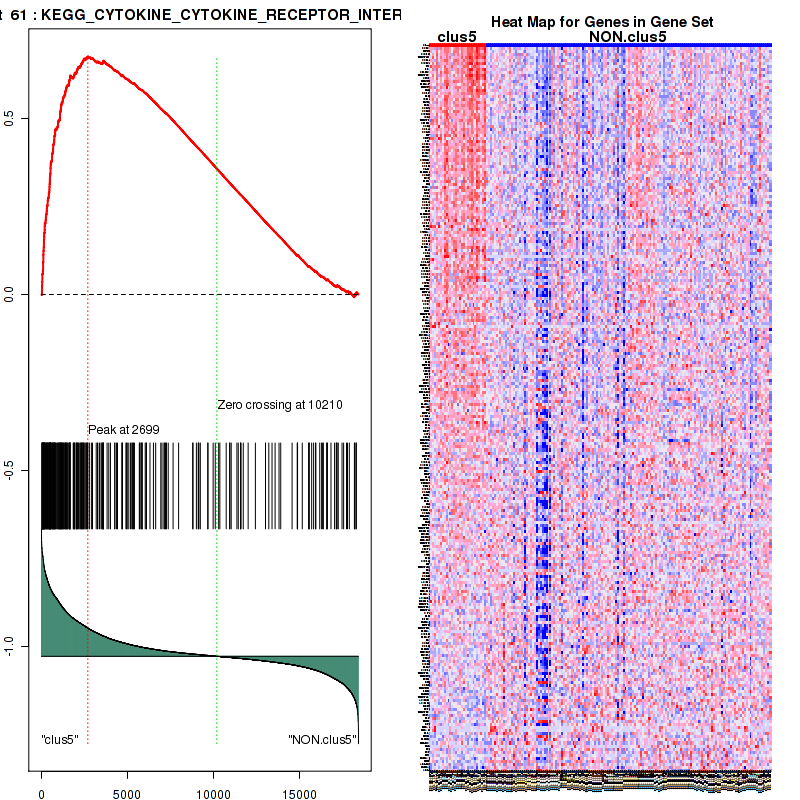
Figure S90. Get High-res Image For the top 5 core enriched genes in the pathway: KEGG CYTOKINE CYTOKINE RECEPTOR INTERACTION, this volcano plot shows how much they are up/down-regulated and significant. The significance was calculated by empirical bayesian fit

Table S46. Get Full Table This table shows a Running Enrichment Score (RES) of each gene in this pathway, that is, the enrichment score at this point in the ranked list of genes. All genes are ranked by Signal-to-Noise (S2N), a measure of similarity as default and are used to obtain ES matrix of all genes. In this way, GSEA tool uses expression pattern of not only overlapped genes but also not-overlapped genes to produce ES matrix.
| Rank | GENE | SYMBOL | DESC | LIST.LOC | S2N | RES | CORE_ENRICHMENT |
|---|---|---|---|---|---|---|---|
| 1 | CD28 | CD28 | CD28 | 64 | 0.76 | 0.056 | YES |
| 2 | CD247 | CD247 | CD247 | 210 | 0.62 | 0.098 | YES |
| 3 | CD8B | CD8B | CD8B | 261 | 0.6 | 0.14 | YES |
| 4 | CCR5 | CCR5 | CCR5 | 473 | 0.52 | 0.17 | YES |
| 5 | PSMA8 | PSMA8 | PSMA8 | 519 | 0.5 | 0.21 | YES |
| 6 | DOCK2 | DOCK2 | DOCK2 | 575 | 0.49 | 0.24 | YES |
| 7 | LCK | LCK | LCK | 951 | 0.41 | 0.26 | YES |
| 8 | CXCR4 | CXCR4 | CXCR4 | 1355 | 0.34 | 0.26 | YES |
| 9 | AP1S2 | AP1S2 | AP1S2 | 1467 | 0.32 | 0.28 | YES |
| 10 | HCK | HCK | HCK | 1771 | 0.29 | 0.29 | YES |
| 11 | ELMO1 | ELMO1 | ELMO1 | 1850 | 0.28 | 0.31 | YES |
| 12 | CD4 | CD4 | CD4 | 1968 | 0.27 | 0.32 | YES |
| 13 | TAF4B | TAF4B | TAF4B | 2025 | 0.26 | 0.34 | YES |
| 14 | FYN | FYN | FYN | 2277 | 0.24 | 0.34 | YES |
| 15 | APOBEC3G | APOBEC3G | APOBEC3G | 2730 | 0.21 | 0.34 | YES |
| 16 | RNGTT | RNGTT | RNGTT | 2951 | 0.19 | 0.34 | YES |
| 17 | PSIP1 | PSIP1 | PSIP1 | 3671 | 0.15 | 0.31 | YES |
| 18 | TAF13 | TAF13 | TAF13 | 3699 | 0.14 | 0.32 | YES |
| 19 | GTF2H2B | GTF2H2B | GTF2H2B | 3725 | 0.14 | 0.33 | YES |
| 20 | GTF2H2 | GTF2H2 | GTF2H2 | 3759 | 0.14 | 0.34 | YES |
| 21 | CCNT1 | CCNT1 | CCNT1 | 3868 | 0.14 | 0.35 | YES |
| 22 | TAF5 | TAF5 | TAF5 | 4565 | 0.11 | 0.32 | NO |
| 23 | NUP153 | NUP153 | NUP153 | 4779 | 0.099 | 0.31 | NO |
| 24 | GTF2E1 | GTF2E1 | GTF2E1 | 5075 | 0.089 | 0.3 | NO |
| 25 | PSMB9 | PSMB9 | PSMB9 | 5213 | 0.085 | 0.3 | NO |
| 26 | GTF2A1 | GTF2A1 | GTF2A1 | 5255 | 0.084 | 0.31 | NO |
| 27 | GTF2H3 | GTF2H3 | GTF2H3 | 5597 | 0.074 | 0.3 | NO |
| 28 | AP1B1 | AP1B1 | AP1B1 | 5627 | 0.073 | 0.3 | NO |
| 29 | NUP210 | NUP210 | NUP210 | 5664 | 0.072 | 0.3 | NO |
| 30 | NUP50 | NUP50 | NUP50 | 5738 | 0.07 | 0.3 | NO |
| 31 | TBP | TBP | TBP | 5990 | 0.064 | 0.3 | NO |
| 32 | ELL | ELL | ELL | 6040 | 0.063 | 0.3 | NO |
| 33 | AP1M1 | AP1M1 | AP1M1 | 6218 | 0.059 | 0.29 | NO |
| 34 | CTDP1 | CTDP1 | CTDP1 | 6236 | 0.058 | 0.3 | NO |
| 35 | NUP88 | NUP88 | NUP88 | 6415 | 0.054 | 0.29 | NO |
| 36 | LIG4 | LIG4 | LIG4 | 6438 | 0.054 | 0.29 | NO |
| 37 | GTF2H1 | GTF2H1 | GTF2H1 | 6885 | 0.045 | 0.27 | NO |
| 38 | TAF12 | TAF12 | TAF12 | 6911 | 0.044 | 0.28 | NO |
| 39 | PACS1 | PACS1 | PACS1 | 6975 | 0.043 | 0.28 | NO |
| 40 | TAF1 | TAF1 | TAF1 | 7095 | 0.041 | 0.27 | NO |
| 41 | NUP43 | NUP43 | NUP43 | 7120 | 0.041 | 0.27 | NO |
| 42 | PAK2 | PAK2 | PAK2 | 7151 | 0.04 | 0.28 | NO |
| 43 | RANBP2 | RANBP2 | RANBP2 | 7191 | 0.039 | 0.28 | NO |
| 44 | B2M | B2M | B2M | 7205 | 0.039 | 0.28 | NO |
| 45 | POLR2B | POLR2B | POLR2B | 7268 | 0.038 | 0.28 | NO |
| 46 | PSME4 | PSME4 | PSME4 | 7382 | 0.036 | 0.28 | NO |
| 47 | TAF11 | TAF11 | TAF11 | 7444 | 0.035 | 0.28 | NO |
| 48 | NUP188 | NUP188 | NUP188 | 7525 | 0.034 | 0.27 | NO |
| 49 | PSMD5 | PSMD5 | PSMD5 | 7724 | 0.031 | 0.26 | NO |
| 50 | CUL5 | CUL5 | CUL5 | 7783 | 0.03 | 0.26 | NO |
| 51 | PSMB8 | PSMB8 | PSMB8 | 7798 | 0.03 | 0.26 | NO |
| 52 | VPS37A | VPS37A | VPS37A | 7815 | 0.03 | 0.27 | NO |
| 53 | NUP93 | NUP93 | NUP93 | 7850 | 0.029 | 0.27 | NO |
| 54 | POLR2A | POLR2A | POLR2A | 7855 | 0.029 | 0.27 | NO |
| 55 | SUPT16H | SUPT16H | SUPT16H | 7920 | 0.028 | 0.27 | NO |
| 56 | TCEB3 | TCEB3 | TCEB3 | 7960 | 0.028 | 0.27 | NO |
| 57 | NUP107 | NUP107 | NUP107 | 7999 | 0.027 | 0.27 | NO |
| 58 | NUP155 | NUP155 | NUP155 | 8087 | 0.026 | 0.27 | NO |
| 59 | NUP205 | NUP205 | NUP205 | 8092 | 0.026 | 0.27 | NO |
| 60 | KPNA1 | KPNA1 | KPNA1 | 8241 | 0.024 | 0.26 | NO |
| 61 | RNMT | RNMT | RNMT | 8299 | 0.023 | 0.26 | NO |
| 62 | NMT2 | NMT2 | NMT2 | 8682 | 0.018 | 0.24 | NO |
| 63 | NCBP2 | NCBP2 | NCBP2 | 8736 | 0.018 | 0.24 | NO |
| 64 | FEN1 | FEN1 | FEN1 | 8791 | 0.017 | 0.24 | NO |
| 65 | AP2M1 | AP2M1 | AP2M1 | 8816 | 0.017 | 0.24 | NO |
| 66 | RBX1 | RBX1 | RBX1 | 8819 | 0.017 | 0.24 | NO |
| 67 | CCNH | CCNH | CCNH | 8948 | 0.015 | 0.23 | NO |
| 68 | PSMC2 | PSMC2 | PSMC2 | 9004 | 0.014 | 0.23 | NO |
| 69 | SUPT4H1 | SUPT4H1 | SUPT4H1 | 9016 | 0.014 | 0.23 | NO |
| 70 | UBA52 | UBA52 | UBA52 | 9019 | 0.014 | 0.23 | NO |
| 71 | POLR2D | POLR2D | POLR2D | 9042 | 0.014 | 0.23 | NO |
| 72 | NUPL1 | NUPL1 | NUPL1 | 9057 | 0.014 | 0.23 | NO |
| 73 | RPS27A | RPS27A | RPS27A | 9064 | 0.014 | 0.23 | NO |
| 74 | KPNB1 | KPNB1 | KPNB1 | 9084 | 0.014 | 0.23 | NO |
| 75 | PSMC4 | PSMC4 | PSMC4 | 9111 | 0.013 | 0.23 | NO |
| 76 | POLR2G | POLR2G | POLR2G | 9186 | 0.012 | 0.23 | NO |
| 77 | NMT1 | NMT1 | NMT1 | 9193 | 0.012 | 0.23 | NO |
| 78 | PSMD11 | PSMD11 | PSMD11 | 9198 | 0.012 | 0.23 | NO |
| 79 | ERCC3 | ERCC3 | ERCC3 | 9211 | 0.012 | 0.23 | NO |
| 80 | TPR | TPR | TPR | 9255 | 0.012 | 0.23 | NO |
| 81 | PSMA1 | PSMA1 | PSMA1 | 9453 | 0.0091 | 0.22 | NO |
| 82 | BTRC | BTRC | BTRC | 9479 | 0.0087 | 0.22 | NO |
| 83 | RANBP1 | RANBP1 | RANBP1 | 9535 | 0.0081 | 0.22 | NO |
| 84 | NCBP1 | NCBP1 | NCBP1 | 9543 | 0.008 | 0.22 | NO |
| 85 | PSMD2 | PSMD2 | PSMD2 | 9603 | 0.0074 | 0.22 | NO |
| 86 | XRCC6 | XRCC6 | XRCC6 | 9614 | 0.0073 | 0.22 | NO |
| 87 | RAN | RAN | RAN | 9615 | 0.0073 | 0.22 | NO |
| 88 | AP2A1 | AP2A1 | AP2A1 | 9619 | 0.0072 | 0.22 | NO |
| 89 | PSMB1 | PSMB1 | PSMB1 | 9723 | 0.006 | 0.21 | NO |
| 90 | CCNT2 | CCNT2 | CCNT2 | 9784 | 0.0054 | 0.21 | NO |
| 91 | SLC25A6 | SLC25A6 | SLC25A6 | 9813 | 0.005 | 0.21 | NO |
| 92 | PSMD7 | PSMD7 | PSMD7 | 9846 | 0.0047 | 0.2 | NO |
| 93 | NUP62 | NUP62 | NUP62 | 9880 | 0.0042 | 0.2 | NO |
| 94 | PSMC5 | PSMC5 | PSMC5 | 9919 | 0.0037 | 0.2 | NO |
| 95 | HLA-A | HLA-A | HLA-A | 9949 | 0.0034 | 0.2 | NO |
| 96 | PSMB2 | PSMB2 | PSMB2 | 10007 | 0.0026 | 0.2 | NO |
| 97 | PSMA4 | PSMA4 | PSMA4 | 10034 | 0.0023 | 0.2 | NO |
| 98 | NUP214 | NUP214 | NUP214 | 10042 | 0.0022 | 0.2 | NO |
| 99 | PSMC1 | PSMC1 | PSMC1 | 10049 | 0.0021 | 0.2 | NO |
| 100 | PSMB6 | PSMB6 | PSMB6 | 10144 | 0.0011 | 0.19 | NO |
| 101 | NUPL2 | NUPL2 | NUPL2 | 10145 | 0.0011 | 0.19 | NO |
| 102 | NUP133 | NUP133 | NUP133 | 10155 | 0.00099 | 0.19 | NO |
| 103 | GTF2B | GTF2B | GTF2B | 10183 | 0.00041 | 0.19 | NO |
| 104 | AP2A2 | AP2A2 | AP2A2 | 10192 | 0.0003 | 0.19 | NO |
| 105 | XPO1 | XPO1 | XPO1 | 10221 | -0.000073 | 0.19 | NO |
| 106 | PSMD1 | PSMD1 | PSMD1 | 10267 | -0.00062 | 0.18 | NO |
| 107 | TCEA1 | TCEA1 | TCEA1 | 10272 | -0.00067 | 0.18 | NO |
| 108 | PSMD14 | PSMD14 | PSMD14 | 10334 | -0.0012 | 0.18 | NO |
| 109 | PSMA7 | PSMA7 | PSMA7 | 10358 | -0.0015 | 0.18 | NO |
| 110 | POM121 | POM121 | POM121 | 10368 | -0.0016 | 0.18 | NO |
| 111 | PSMA3 | PSMA3 | PSMA3 | 10432 | -0.0025 | 0.18 | NO |
| 112 | NUP37 | NUP37 | NUP37 | 10473 | -0.003 | 0.18 | NO |
| 113 | NUP85 | NUP85 | NUP85 | 10634 | -0.0047 | 0.17 | NO |
| 114 | NUP54 | NUP54 | NUP54 | 10715 | -0.0055 | 0.16 | NO |
| 115 | PSMC3 | PSMC3 | PSMC3 | 10778 | -0.0061 | 0.16 | NO |
| 116 | PSMD12 | PSMD12 | PSMD12 | 10810 | -0.0065 | 0.16 | NO |
| 117 | PSMD10 | PSMD10 | PSMD10 | 10820 | -0.0066 | 0.16 | NO |
| 118 | POLR2E | POLR2E | POLR2E | 10838 | -0.0068 | 0.16 | NO |
| 119 | SUPT5H | SUPT5H | SUPT5H | 10883 | -0.0074 | 0.16 | NO |
| 120 | PSMA6 | PSMA6 | PSMA6 | 10958 | -0.0083 | 0.15 | NO |
| 121 | RAE1 | RAE1 | RAE1 | 11046 | -0.0094 | 0.15 | NO |
| 122 | AP1G1 | AP1G1 | AP1G1 | 11047 | -0.0094 | 0.15 | NO |
| 123 | PSMD13 | PSMD13 | PSMD13 | 11051 | -0.0094 | 0.15 | NO |
| 124 | XRCC5 | XRCC5 | XRCC5 | 11121 | -0.01 | 0.15 | NO |
| 125 | AP2S1 | AP2S1 | AP2S1 | 11253 | -0.012 | 0.14 | NO |
| 126 | PSMA2 | PSMA2 | PSMA2 | 11262 | -0.012 | 0.14 | NO |
| 127 | PSMA5 | PSMA5 | PSMA5 | 11294 | -0.012 | 0.14 | NO |
| 128 | XRCC4 | XRCC4 | XRCC4 | 11438 | -0.014 | 0.13 | NO |
| 129 | POLR2F | POLR2F | POLR2F | 11456 | -0.014 | 0.13 | NO |
| 130 | TAF9 | TAF9 | TAF9 | 11462 | -0.014 | 0.14 | NO |
| 131 | POLR2K | POLR2K | POLR2K | 11485 | -0.015 | 0.14 | NO |
| 132 | PSMD8 | PSMD8 | PSMD8 | 11503 | -0.015 | 0.14 | NO |
| 133 | NPM1 | NPM1 | NPM1 | 11555 | -0.015 | 0.13 | NO |
| 134 | TCEB1 | TCEB1 | TCEB1 | 11605 | -0.016 | 0.13 | NO |
| 135 | CDK9 | CDK9 | CDK9 | 11663 | -0.017 | 0.13 | NO |
| 136 | PSMB3 | PSMB3 | PSMB3 | 11695 | -0.017 | 0.13 | NO |
| 137 | ERCC2 | ERCC2 | ERCC2 | 11764 | -0.018 | 0.13 | NO |
| 138 | GTF2A2 | GTF2A2 | GTF2A2 | 11772 | -0.018 | 0.13 | NO |
| 139 | GTF2H4 | GTF2H4 | GTF2H4 | 11781 | -0.018 | 0.13 | NO |
| 140 | PSMB4 | PSMB4 | PSMB4 | 11819 | -0.019 | 0.13 | NO |
| 141 | ATP6V1H | ATP6V1H | ATP6V1H | 11834 | -0.019 | 0.13 | NO |
| 142 | AP2B1 | AP2B1 | AP2B1 | 11927 | -0.02 | 0.13 | NO |
| 143 | PSMC6 | PSMC6 | PSMC6 | 11954 | -0.02 | 0.13 | NO |
| 144 | PSMF1 | PSMF1 | PSMF1 | 11970 | -0.02 | 0.13 | NO |
| 145 | PSMD3 | PSMD3 | PSMD3 | 11986 | -0.021 | 0.13 | NO |
| 146 | PSMD9 | PSMD9 | PSMD9 | 12003 | -0.021 | 0.13 | NO |
| 147 | SEH1L | SEH1L | SEH1L | 12051 | -0.022 | 0.13 | NO |
| 148 | PSMB5 | PSMB5 | PSMB5 | 12193 | -0.024 | 0.12 | NO |
| 149 | LIG1 | LIG1 | LIG1 | 12246 | -0.024 | 0.12 | NO |
| 150 | SSRP1 | SSRP1 | SSRP1 | 12313 | -0.025 | 0.12 | NO |
| 151 | SKP1 | SKP1 | SKP1 | 12318 | -0.025 | 0.12 | NO |
| 152 | GTF2F2 | GTF2F2 | GTF2F2 | 12340 | -0.026 | 0.12 | NO |
| 153 | PSMD6 | PSMD6 | PSMD6 | 12380 | -0.026 | 0.12 | NO |
| 154 | GTF2F1 | GTF2F1 | GTF2F1 | 12504 | -0.028 | 0.12 | NO |
| 155 | PSMD4 | PSMD4 | PSMD4 | 12521 | -0.028 | 0.12 | NO |
| 156 | TAF6 | TAF6 | TAF6 | 12625 | -0.03 | 0.12 | NO |
| 157 | PSMB7 | PSMB7 | PSMB7 | 12649 | -0.03 | 0.12 | NO |
| 158 | PSME1 | PSME1 | PSME1 | 12893 | -0.033 | 0.11 | NO |
| 159 | AAAS | AAAS | AAAS | 12917 | -0.034 | 0.11 | NO |
| 160 | POLR2C | POLR2C | POLR2C | 12930 | -0.034 | 0.11 | NO |
| 161 | RCC1 | RCC1 | RCC1 | 12933 | -0.034 | 0.11 | NO |
| 162 | TH1L | TH1L | TH1L | 12944 | -0.034 | 0.12 | NO |
| 163 | VPS37C | VPS37C | VPS37C | 12974 | -0.035 | 0.12 | NO |
| 164 | PPIA | PPIA | PPIA | 13030 | -0.035 | 0.12 | NO |
| 165 | SLC25A5 | SLC25A5 | SLC25A5 | 13058 | -0.036 | 0.12 | NO |
| 166 | PSME2 | PSME2 | PSME2 | 13073 | -0.036 | 0.12 | NO |
| 167 | ARF1 | ARF1 | ARF1 | 13134 | -0.037 | 0.12 | NO |
| 168 | SLC25A4 | SLC25A4 | SLC25A4 | 13190 | -0.038 | 0.12 | NO |
| 169 | BANF1 | BANF1 | BANF1 | 13207 | -0.038 | 0.12 | NO |
| 170 | PSMB10 | PSMB10 | PSMB10 | 13216 | -0.038 | 0.12 | NO |
| 171 | RANGAP1 | RANGAP1 | RANGAP1 | 13476 | -0.042 | 0.11 | NO |
| 172 | COBRA1 | COBRA1 | COBRA1 | 13480 | -0.042 | 0.12 | NO |
| 173 | RDBP | RDBP | RDBP | 13512 | -0.043 | 0.12 | NO |
| 174 | NUP35 | NUP35 | NUP35 | 13612 | -0.044 | 0.12 | NO |
| 175 | GTF2E2 | GTF2E2 | GTF2E2 | 13727 | -0.046 | 0.11 | NO |
| 176 | TAF4 | TAF4 | TAF4 | 13745 | -0.047 | 0.12 | NO |
| 177 | TAF10 | TAF10 | TAF10 | 13812 | -0.048 | 0.12 | NO |
| 178 | TSG101 | TSG101 | TSG101 | 14080 | -0.052 | 0.11 | NO |
| 179 | RAC1 | RAC1 | RAC1 | 14257 | -0.056 | 0.1 | NO |
| 180 | VPS28 | VPS28 | VPS28 | 14480 | -0.06 | 0.093 | NO |
| 181 | WHSC2 | WHSC2 | WHSC2 | 14571 | -0.062 | 0.093 | NO |
| 182 | VPS37B | VPS37B | VPS37B | 14836 | -0.068 | 0.084 | NO |
| 183 | TCEB2 | TCEB2 | TCEB2 | 14921 | -0.07 | 0.085 | NO |
| 184 | POLR2L | POLR2L | POLR2L | 14979 | -0.072 | 0.087 | NO |
| 185 | POLR2J | POLR2J | POLR2J | 15195 | -0.077 | 0.082 | NO |
| 186 | CDK7 | CDK7 | CDK7 | 15298 | -0.08 | 0.082 | NO |
| 187 | MNAT1 | MNAT1 | MNAT1 | 15476 | -0.086 | 0.08 | NO |
| 188 | POLR2H | POLR2H | POLR2H | 15663 | -0.092 | 0.077 | NO |
| 189 | POLR2I | POLR2I | POLR2I | 15801 | -0.097 | 0.077 | NO |
| 190 | HMGA1 | HMGA1 | HMGA1 | 15972 | -0.1 | 0.076 | NO |
| 191 | AP1S1 | AP1S1 | AP1S1 | 16146 | -0.11 | 0.075 | NO |
| 192 | AP1M2 | AP1M2 | AP1M2 | 18072 | -0.28 | -0.0085 | NO |
| 193 | VPS37D | VPS37D | VPS37D | 18359 | -0.37 | 0.0054 | NO |
Figure S91. Get High-res Image This plot shows mRNAseq_cNMF expression data heatmap (on the left) a RunningEnrichmentScore(RES) plot (on the top right) and a Signal2Noise(S2N) plot (on the bottom right) of genes in the pathway: KEGG PHOSPHATIDYLINOSITOL SIGNALING SYSTEM.
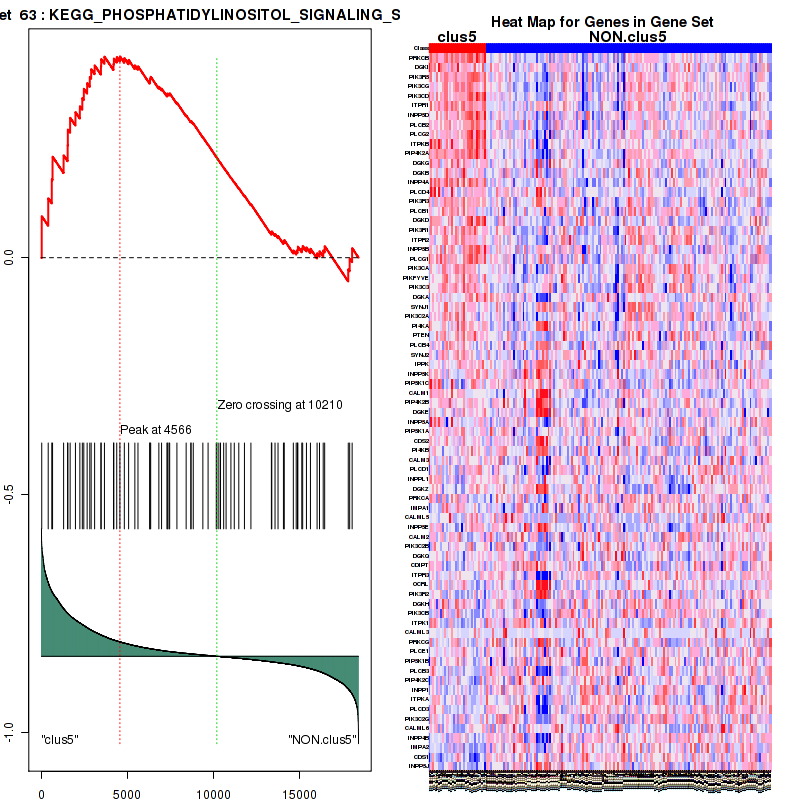
Figure S92. Get High-res Image For the top 5 core enriched genes in the pathway: KEGG PHOSPHATIDYLINOSITOL SIGNALING SYSTEM, this volcano plot shows how much they are up/down-regulated and significant. The significance was calculated by empirical bayesian fit

Table S47. Get Full Table This table shows a Running Enrichment Score (RES) of each gene in this pathway, that is, the enrichment score at this point in the ranked list of genes. All genes are ranked by Signal-to-Noise (S2N), a measure of similarity as default and are used to obtain ES matrix of all genes. In this way, GSEA tool uses expression pattern of not only overlapped genes but also not-overlapped genes to produce ES matrix.
| Rank | GENE | SYMBOL | DESC | LIST.LOC | S2N | RES | CORE_ENRICHMENT |
|---|---|---|---|---|---|---|---|
| 1 | CD28 | CD28 | CD28 | 64 | 0.76 | 0.14 | YES |
| 2 | CD247 | CD247 | CD247 | 210 | 0.62 | 0.26 | YES |
| 3 | CD8B | CD8B | CD8B | 261 | 0.6 | 0.37 | YES |
| 4 | DOCK2 | DOCK2 | DOCK2 | 575 | 0.49 | 0.45 | YES |
| 5 | LCK | LCK | LCK | 951 | 0.41 | 0.51 | YES |
| 6 | AP1S2 | AP1S2 | AP1S2 | 1467 | 0.32 | 0.55 | YES |
| 7 | HCK | HCK | HCK | 1771 | 0.29 | 0.59 | YES |
| 8 | ELMO1 | ELMO1 | ELMO1 | 1850 | 0.28 | 0.64 | YES |
| 9 | CD4 | CD4 | CD4 | 1968 | 0.27 | 0.68 | YES |
| 10 | FYN | FYN | FYN | 2277 | 0.24 | 0.72 | YES |
| 11 | AP1B1 | AP1B1 | AP1B1 | 5627 | 0.073 | 0.55 | NO |
| 12 | AP1M1 | AP1M1 | AP1M1 | 6218 | 0.059 | 0.53 | NO |
| 13 | PACS1 | PACS1 | PACS1 | 6975 | 0.043 | 0.5 | NO |
| 14 | PAK2 | PAK2 | PAK2 | 7151 | 0.04 | 0.49 | NO |
| 15 | B2M | B2M | B2M | 7205 | 0.039 | 0.5 | NO |
| 16 | AP2M1 | AP2M1 | AP2M1 | 8816 | 0.017 | 0.42 | NO |
| 17 | AP2A1 | AP2A1 | AP2A1 | 9619 | 0.0072 | 0.37 | NO |
| 18 | HLA-A | HLA-A | HLA-A | 9949 | 0.0034 | 0.36 | NO |
| 19 | AP2A2 | AP2A2 | AP2A2 | 10192 | 0.0003 | 0.34 | NO |
| 20 | AP1G1 | AP1G1 | AP1G1 | 11047 | -0.0094 | 0.3 | NO |
| 21 | AP2S1 | AP2S1 | AP2S1 | 11253 | -0.012 | 0.29 | NO |
| 22 | ATP6V1H | ATP6V1H | ATP6V1H | 11834 | -0.019 | 0.26 | NO |
| 23 | AP2B1 | AP2B1 | AP2B1 | 11927 | -0.02 | 0.26 | NO |
| 24 | ARF1 | ARF1 | ARF1 | 13134 | -0.037 | 0.2 | NO |
| 25 | RAC1 | RAC1 | RAC1 | 14257 | -0.056 | 0.15 | NO |
| 26 | AP1S1 | AP1S1 | AP1S1 | 16146 | -0.11 | 0.071 | NO |
| 27 | AP1M2 | AP1M2 | AP1M2 | 18072 | -0.28 | 0.021 | NO |
Figure S93. Get High-res Image This plot shows mRNAseq_cNMF expression data heatmap (on the left) a RunningEnrichmentScore(RES) plot (on the top right) and a Signal2Noise(S2N) plot (on the bottom right) of genes in the pathway: KEGG NEUROACTIVE LIGAND RECEPTOR INTERACTION.
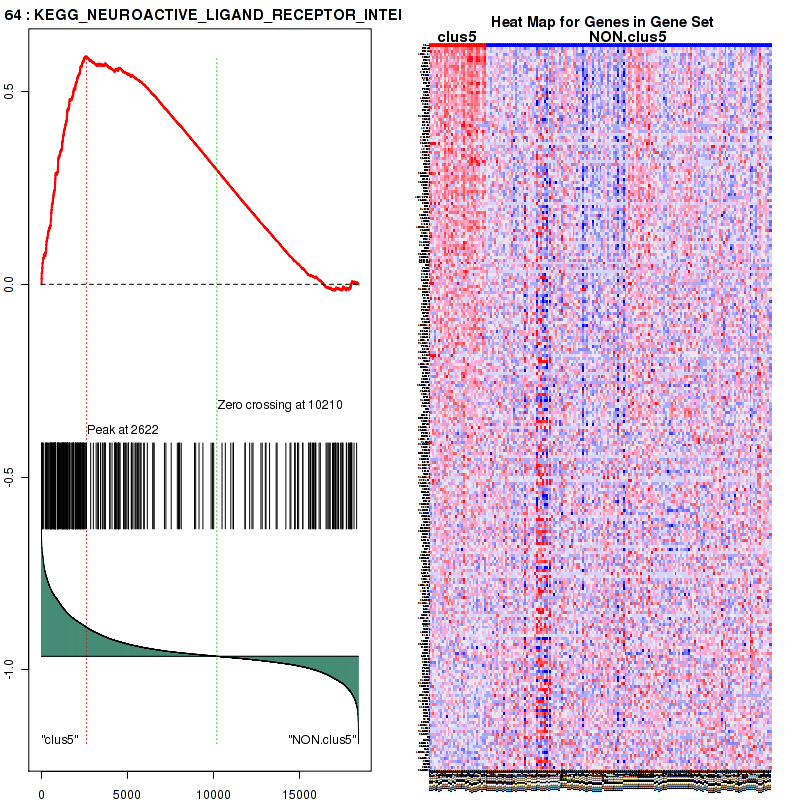
Figure S94. Get High-res Image For the top 5 core enriched genes in the pathway: KEGG NEUROACTIVE LIGAND RECEPTOR INTERACTION, this volcano plot shows how much they are up/down-regulated and significant. The significance was calculated by empirical bayesian fit

Table S48. Get Full Table This table shows a Running Enrichment Score (RES) of each gene in this pathway, that is, the enrichment score at this point in the ranked list of genes. All genes are ranked by Signal-to-Noise (S2N), a measure of similarity as default and are used to obtain ES matrix of all genes. In this way, GSEA tool uses expression pattern of not only overlapped genes but also not-overlapped genes to produce ES matrix.
| Rank | GENE | SYMBOL | DESC | LIST.LOC | S2N | RES | CORE_ENRICHMENT |
|---|---|---|---|---|---|---|---|
| 1 | NTRK3 | NTRK3 | NTRK3 | 117 | 0.7 | 0.044 | YES |
| 2 | NGF | NGF | NGF | 287 | 0.59 | 0.078 | YES |
| 3 | CAMK2A | CAMK2A | CAMK2A | 330 | 0.57 | 0.12 | YES |
| 4 | NGFR | NGFR | NGFR | 482 | 0.51 | 0.14 | YES |
| 5 | FASLG | FASLG | FASLG | 493 | 0.51 | 0.18 | YES |
| 6 | PIK3R5 | PIK3R5 | PIK3R5 | 601 | 0.48 | 0.21 | YES |
| 7 | PIK3CG | PIK3CG | PIK3CG | 646 | 0.47 | 0.24 | YES |
| 8 | CAMK4 | CAMK4 | CAMK4 | 767 | 0.44 | 0.27 | YES |
| 9 | BCL2 | BCL2 | BCL2 | 824 | 0.44 | 0.3 | YES |
| 10 | SHC4 | SHC4 | SHC4 | 826 | 0.44 | 0.33 | YES |
| 11 | PIK3CD | PIK3CD | PIK3CD | 1288 | 0.35 | 0.33 | YES |
| 12 | NTRK1 | NTRK1 | NTRK1 | 1397 | 0.34 | 0.35 | YES |
| 13 | MAPK10 | MAPK10 | MAPK10 | 1784 | 0.29 | 0.35 | YES |
| 14 | RPS6KA5 | RPS6KA5 | RPS6KA5 | 1839 | 0.28 | 0.36 | YES |
| 15 | PLCG2 | PLCG2 | PLCG2 | 1979 | 0.27 | 0.38 | YES |
| 16 | NTF3 | NTF3 | NTF3 | 2349 | 0.24 | 0.37 | YES |
| 17 | SH2B2 | SH2B2 | SH2B2 | 2596 | 0.22 | 0.38 | YES |
| 18 | MAPK11 | MAPK11 | MAPK11 | 2800 | 0.2 | 0.38 | YES |
| 19 | MAP3K3 | MAP3K3 | MAP3K3 | 3041 | 0.18 | 0.38 | YES |
| 20 | PIK3R3 | PIK3R3 | PIK3R3 | 3095 | 0.18 | 0.39 | YES |
| 21 | ARHGDIB | ARHGDIB | ARHGDIB | 3119 | 0.18 | 0.4 | YES |
| 22 | SH2B3 | SH2B3 | SH2B3 | 3131 | 0.18 | 0.41 | YES |
| 23 | AKT3 | AKT3 | AKT3 | 3143 | 0.18 | 0.42 | YES |
| 24 | NTRK2 | NTRK2 | NTRK2 | 3150 | 0.18 | 0.44 | YES |
| 25 | MAPK12 | MAPK12 | MAPK12 | 3158 | 0.18 | 0.45 | YES |
| 26 | IRAK3 | IRAK3 | IRAK3 | 3440 | 0.16 | 0.45 | NO |
| 27 | PIK3R1 | PIK3R1 | PIK3R1 | 3665 | 0.15 | 0.44 | NO |
| 28 | RAPGEF1 | RAPGEF1 | RAPGEF1 | 4053 | 0.13 | 0.43 | NO |
| 29 | RAP1A | RAP1A | RAP1A | 4170 | 0.12 | 0.44 | NO |
| 30 | ABL1 | ABL1 | ABL1 | 4232 | 0.12 | 0.44 | NO |
| 31 | PLCG1 | PLCG1 | PLCG1 | 4382 | 0.11 | 0.44 | NO |
| 32 | CSK | CSK | CSK | 4562 | 0.11 | 0.44 | NO |
| 33 | PIK3CA | PIK3CA | PIK3CA | 4566 | 0.11 | 0.45 | NO |
| 34 | GAB1 | GAB1 | GAB1 | 4878 | 0.096 | 0.44 | NO |
| 35 | BDNF | BDNF | BDNF | 4917 | 0.095 | 0.44 | NO |
| 36 | IRAK4 | IRAK4 | IRAK4 | 5169 | 0.086 | 0.43 | NO |
| 37 | GRB2 | GRB2 | GRB2 | 5637 | 0.073 | 0.41 | NO |
| 38 | FOXO3 | FOXO3 | FOXO3 | 5769 | 0.069 | 0.41 | NO |
| 39 | NFKBIA | NFKBIA | NFKBIA | 5933 | 0.065 | 0.41 | NO |
| 40 | CRK | CRK | CRK | 5971 | 0.064 | 0.41 | NO |
| 41 | PDK1 | PDK1 | PDK1 | 6033 | 0.063 | 0.41 | NO |
| 42 | MAPK7 | MAPK7 | MAPK7 | 6234 | 0.058 | 0.4 | NO |
| 43 | SOS1 | SOS1 | SOS1 | 6304 | 0.057 | 0.4 | NO |
| 44 | NFKB1 | NFKB1 | NFKB1 | 6320 | 0.056 | 0.41 | NO |
| 45 | RAP1B | RAP1B | RAP1B | 6335 | 0.056 | 0.41 | NO |
| 46 | MAP3K1 | MAP3K1 | MAP3K1 | 6339 | 0.056 | 0.42 | NO |
| 47 | TP53 | TP53 | TP53 | 6618 | 0.05 | 0.4 | NO |
| 48 | NRAS | NRAS | NRAS | 6666 | 0.049 | 0.4 | NO |
| 49 | MAPK1 | MAPK1 | MAPK1 | 6760 | 0.048 | 0.4 | NO |
| 50 | RPS6KA6 | RPS6KA6 | RPS6KA6 | 6794 | 0.047 | 0.4 | NO |
| 51 | PTPN11 | PTPN11 | PTPN11 | 6857 | 0.046 | 0.4 | NO |
| 52 | RPS6KA2 | RPS6KA2 | RPS6KA2 | 6858 | 0.046 | 0.41 | NO |
| 53 | TRAF6 | TRAF6 | TRAF6 | 6878 | 0.045 | 0.41 | NO |
| 54 | CAMK2G | CAMK2G | CAMK2G | 6893 | 0.045 | 0.41 | NO |
| 55 | FRS2 | FRS2 | FRS2 | 6932 | 0.044 | 0.41 | NO |
| 56 | PRDM4 | PRDM4 | PRDM4 | 7012 | 0.043 | 0.41 | NO |
| 57 | MAPKAPK2 | MAPKAPK2 | MAPKAPK2 | 7057 | 0.042 | 0.41 | NO |
| 58 | AKT2 | AKT2 | AKT2 | 7088 | 0.041 | 0.41 | NO |
| 59 | SHC1 | SHC1 | SHC1 | 7113 | 0.041 | 0.42 | NO |
| 60 | MAPK14 | MAPK14 | MAPK14 | 7186 | 0.039 | 0.42 | NO |
| 61 | MAP2K5 | MAP2K5 | MAP2K5 | 7204 | 0.039 | 0.42 | NO |
| 62 | KIDINS220 | KIDINS220 | KIDINS220 | 7247 | 0.038 | 0.42 | NO |
| 63 | CRKL | CRKL | CRKL | 7369 | 0.036 | 0.41 | NO |
| 64 | CALM1 | CALM1 | CALM1 | 7462 | 0.035 | 0.41 | NO |
| 65 | RPS6KA3 | RPS6KA3 | RPS6KA3 | 7475 | 0.035 | 0.41 | NO |
| 66 | CAMK2D | CAMK2D | CAMK2D | 7560 | 0.034 | 0.41 | NO |
| 67 | CDC42 | CDC42 | CDC42 | 7621 | 0.032 | 0.41 | NO |
| 68 | MAP2K1 | MAP2K1 | MAP2K1 | 7825 | 0.03 | 0.4 | NO |
| 69 | MAPK8 | MAPK8 | MAPK8 | 8009 | 0.027 | 0.39 | NO |
| 70 | RHOA | RHOA | RHOA | 8044 | 0.026 | 0.39 | NO |
| 71 | SOS2 | SOS2 | SOS2 | 8100 | 0.026 | 0.39 | NO |
| 72 | JUN | JUN | JUN | 8203 | 0.024 | 0.39 | NO |
| 73 | RIPK2 | RIPK2 | RIPK2 | 8274 | 0.024 | 0.39 | NO |
| 74 | IRS2 | IRS2 | IRS2 | 8551 | 0.02 | 0.37 | NO |
| 75 | RPS6KA1 | RPS6KA1 | RPS6KA1 | 8864 | 0.016 | 0.36 | NO |
| 76 | RAF1 | RAF1 | RAF1 | 8915 | 0.016 | 0.36 | NO |
| 77 | NFKBIE | NFKBIE | NFKBIE | 9166 | 0.013 | 0.34 | NO |
| 78 | YWHAB | YWHAB | YWHAB | 9231 | 0.012 | 0.34 | NO |
| 79 | YWHAQ | YWHAQ | YWHAQ | 9301 | 0.011 | 0.34 | NO |
| 80 | CALM3 | CALM3 | CALM3 | 9699 | 0.0063 | 0.32 | NO |
| 81 | MAGED1 | MAGED1 | MAGED1 | 9831 | 0.0049 | 0.31 | NO |
| 82 | YWHAG | YWHAG | YWHAG | 9865 | 0.0044 | 0.31 | NO |
| 83 | ZNF274 | ZNF274 | ZNF274 | 9904 | 0.004 | 0.3 | NO |
| 84 | IKBKB | IKBKB | IKBKB | 10433 | -0.0025 | 0.28 | NO |
| 85 | GSK3B | GSK3B | GSK3B | 10472 | -0.003 | 0.28 | NO |
| 86 | YWHAH | YWHAH | YWHAH | 10537 | -0.0036 | 0.27 | NO |
| 87 | CALML5 | CALML5 | CALML5 | 10748 | -0.0058 | 0.26 | NO |
| 88 | ATF4 | ATF4 | ATF4 | 10955 | -0.0082 | 0.25 | NO |
| 89 | BRAF | BRAF | BRAF | 11009 | -0.0088 | 0.25 | NO |
| 90 | IRS1 | IRS1 | IRS1 | 11125 | -0.01 | 0.24 | NO |
| 91 | NFKBIB | NFKBIB | NFKBIB | 11160 | -0.011 | 0.24 | NO |
| 92 | CALM2 | CALM2 | CALM2 | 11223 | -0.011 | 0.24 | NO |
| 93 | ARHGDIA | ARHGDIA | ARHGDIA | 11338 | -0.013 | 0.23 | NO |
| 94 | IRAK1 | IRAK1 | IRAK1 | 11360 | -0.013 | 0.23 | NO |
| 95 | RELA | RELA | RELA | 11368 | -0.013 | 0.23 | NO |
| 96 | AKT1 | AKT1 | AKT1 | 11471 | -0.014 | 0.23 | NO |
| 97 | MAPK9 | MAPK9 | MAPK9 | 11534 | -0.015 | 0.23 | NO |
| 98 | NGFRAP1 | NGFRAP1 | NGFRAP1 | 11568 | -0.015 | 0.23 | NO |
| 99 | SORT1 | SORT1 | SORT1 | 11681 | -0.017 | 0.22 | NO |
| 100 | BAX | BAX | BAX | 12198 | -0.024 | 0.2 | NO |
| 101 | KRAS | KRAS | KRAS | 12329 | -0.025 | 0.19 | NO |
| 102 | SH2B1 | SH2B1 | SH2B1 | 12361 | -0.026 | 0.19 | NO |
| 103 | RPS6KA4 | RPS6KA4 | RPS6KA4 | 12461 | -0.027 | 0.19 | NO |
| 104 | YWHAE | YWHAE | YWHAE | 12536 | -0.028 | 0.18 | NO |
| 105 | YWHAZ | YWHAZ | YWHAZ | 12968 | -0.034 | 0.16 | NO |
| 106 | MAP2K7 | MAP2K7 | MAP2K7 | 13008 | -0.035 | 0.16 | NO |
| 107 | MAP3K5 | MAP3K5 | MAP3K5 | 13086 | -0.036 | 0.16 | NO |
| 108 | CAMK2B | CAMK2B | CAMK2B | 13138 | -0.037 | 0.16 | NO |
| 109 | PSEN1 | PSEN1 | PSEN1 | 13331 | -0.04 | 0.15 | NO |
| 110 | PIK3R2 | PIK3R2 | PIK3R2 | 13595 | -0.044 | 0.14 | NO |
| 111 | MAP2K2 | MAP2K2 | MAP2K2 | 13732 | -0.046 | 0.14 | NO |
| 112 | IRAK2 | IRAK2 | IRAK2 | 13762 | -0.047 | 0.14 | NO |
| 113 | MAPK3 | MAPK3 | MAPK3 | 13954 | -0.05 | 0.13 | NO |
| 114 | PIK3CB | PIK3CB | PIK3CB | 14087 | -0.053 | 0.13 | NO |
| 115 | RAC1 | RAC1 | RAC1 | 14257 | -0.056 | 0.12 | NO |
| 116 | CALML3 | CALML3 | CALML3 | 14663 | -0.064 | 0.11 | NO |
| 117 | PRKCD | PRKCD | PRKCD | 14668 | -0.064 | 0.11 | NO |
| 118 | BAD | BAD | BAD | 15149 | -0.076 | 0.092 | NO |
| 119 | HRAS | HRAS | HRAS | 15336 | -0.081 | 0.087 | NO |
| 120 | TP73 | TP73 | TP73 | 15409 | -0.084 | 0.09 | NO |
| 121 | IRS4 | IRS4 | IRS4 | 15884 | -0.1 | 0.071 | NO |
| 122 | MAPK13 | MAPK13 | MAPK13 | 16305 | -0.12 | 0.056 | NO |
| 123 | CALML6 | CALML6 | CALML6 | 16403 | -0.12 | 0.06 | NO |
| 124 | SHC2 | SHC2 | SHC2 | 17019 | -0.16 | 0.038 | NO |
| 125 | SHC3 | SHC3 | SHC3 | 17492 | -0.2 | 0.027 | NO |
| 126 | NTF4 | NTF4 | NTF4 | 18335 | -0.35 | 0.0067 | NO |
Figure S95. Get High-res Image This plot shows mRNAseq_cNMF expression data heatmap (on the left) a RunningEnrichmentScore(RES) plot (on the top right) and a Signal2Noise(S2N) plot (on the bottom right) of genes in the pathway: KEGG OOCYTE MEIOSIS.
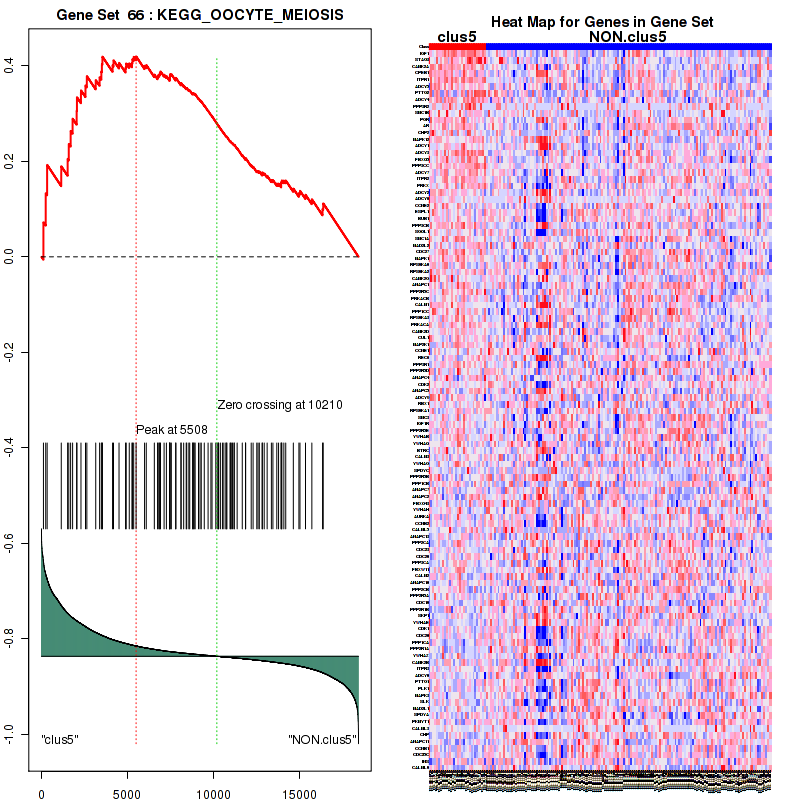
Figure S96. Get High-res Image For the top 5 core enriched genes in the pathway: KEGG OOCYTE MEIOSIS, this volcano plot shows how much they are up/down-regulated and significant. The significance was calculated by empirical bayesian fit

Table S49. Get Full Table This table shows a Running Enrichment Score (RES) of each gene in this pathway, that is, the enrichment score at this point in the ranked list of genes. All genes are ranked by Signal-to-Noise (S2N), a measure of similarity as default and are used to obtain ES matrix of all genes. In this way, GSEA tool uses expression pattern of not only overlapped genes but also not-overlapped genes to produce ES matrix.
| Rank | GENE | SYMBOL | DESC | LIST.LOC | S2N | RES | CORE_ENRICHMENT |
|---|---|---|---|---|---|---|---|
| 1 | BTK | BTK | BTK | 300 | 0.58 | 0.064 | YES |
| 2 | TLR6 | TLR6 | TLR6 | 653 | 0.47 | 0.11 | YES |
| 3 | S100A12 | S100A12 | S100A12 | 793 | 0.44 | 0.16 | YES |
| 4 | LY96 | LY96 | LY96 | 1091 | 0.39 | 0.2 | YES |
| 5 | S100B | S100B | S100B | 1308 | 0.35 | 0.24 | YES |
| 6 | MEF2C | MEF2C | MEF2C | 1509 | 0.32 | 0.27 | YES |
| 7 | SAA1 | SAA1 | SAA1 | 1515 | 0.32 | 0.31 | YES |
| 8 | MAPK10 | MAPK10 | MAPK10 | 1784 | 0.29 | 0.34 | YES |
| 9 | RPS6KA5 | RPS6KA5 | RPS6KA5 | 1839 | 0.28 | 0.37 | YES |
| 10 | TLR4 | TLR4 | TLR4 | 2013 | 0.26 | 0.4 | YES |
| 11 | MAPK11 | MAPK11 | MAPK11 | 2800 | 0.2 | 0.38 | YES |
| 12 | TLR1 | TLR1 | TLR1 | 3234 | 0.17 | 0.38 | YES |
| 13 | NOD1 | NOD1 | NOD1 | 3323 | 0.17 | 0.4 | YES |
| 14 | NOD2 | NOD2 | NOD2 | 3436 | 0.16 | 0.42 | YES |
| 15 | IRAK3 | IRAK3 | IRAK3 | 3440 | 0.16 | 0.44 | YES |
| 16 | AGER | AGER | AGER | 3558 | 0.15 | 0.45 | YES |
| 17 | TLR2 | TLR2 | TLR2 | 3650 | 0.15 | 0.47 | YES |
| 18 | MEF2A | MEF2A | MEF2A | 5120 | 0.088 | 0.4 | NO |
| 19 | IRAK4 | IRAK4 | IRAK4 | 5169 | 0.086 | 0.41 | NO |
| 20 | MAP3K7 | MAP3K7 | MAP3K7 | 5286 | 0.083 | 0.42 | NO |
| 21 | TMEM189-UBE2V1 | TMEM189-UBE2V1 | TMEM189-UBE2V1 | 5410 | 0.079 | 0.42 | NO |
| 22 | MAP2K4 | MAP2K4 | MAP2K4 | 5776 | 0.069 | 0.41 | NO |
| 23 | NFKBIA | NFKBIA | NFKBIA | 5933 | 0.065 | 0.41 | NO |
| 24 | TAB2 | TAB2 | TAB2 | 5994 | 0.064 | 0.42 | NO |
| 25 | MAPK7 | MAPK7 | MAPK7 | 6234 | 0.058 | 0.41 | NO |
| 26 | ELK1 | ELK1 | ELK1 | 6322 | 0.056 | 0.41 | NO |
| 27 | MAP3K1 | MAP3K1 | MAP3K1 | 6339 | 0.056 | 0.42 | NO |
| 28 | IKBKG | IKBKG | IKBKG | 6342 | 0.056 | 0.43 | NO |
| 29 | ATF2 | ATF2 | ATF2 | 6738 | 0.048 | 0.41 | NO |
| 30 | MAPK1 | MAPK1 | MAPK1 | 6760 | 0.048 | 0.42 | NO |
| 31 | RPS6KA2 | RPS6KA2 | RPS6KA2 | 6858 | 0.046 | 0.42 | NO |
| 32 | TRAF6 | TRAF6 | TRAF6 | 6878 | 0.045 | 0.42 | NO |
| 33 | DUSP3 | DUSP3 | DUSP3 | 6978 | 0.043 | 0.42 | NO |
| 34 | PELI2 | PELI2 | PELI2 | 6986 | 0.043 | 0.43 | NO |
| 35 | MAPKAPK2 | MAPKAPK2 | MAPKAPK2 | 7057 | 0.042 | 0.43 | NO |
| 36 | MAPK14 | MAPK14 | MAPK14 | 7186 | 0.039 | 0.43 | NO |
| 37 | NFKB2 | NFKB2 | NFKB2 | 7352 | 0.036 | 0.43 | NO |
| 38 | RPS6KA3 | RPS6KA3 | RPS6KA3 | 7475 | 0.035 | 0.43 | NO |
| 39 | ATF1 | ATF1 | ATF1 | 7499 | 0.034 | 0.43 | NO |
| 40 | UBE2N | UBE2N | UBE2N | 7537 | 0.034 | 0.43 | NO |
| 41 | CREB1 | CREB1 | CREB1 | 7776 | 0.03 | 0.42 | NO |
| 42 | CHUK | CHUK | CHUK | 7788 | 0.03 | 0.43 | NO |
| 43 | MAP2K1 | MAP2K1 | MAP2K1 | 7825 | 0.03 | 0.43 | NO |
| 44 | MAPK8 | MAPK8 | MAPK8 | 8009 | 0.027 | 0.42 | NO |
| 45 | JUN | JUN | JUN | 8203 | 0.024 | 0.42 | NO |
| 46 | RIPK2 | RIPK2 | RIPK2 | 8274 | 0.024 | 0.42 | NO |
| 47 | PELI1 | PELI1 | PELI1 | 8393 | 0.022 | 0.41 | NO |
| 48 | PPP2R5D | PPP2R5D | PPP2R5D | 8425 | 0.022 | 0.41 | NO |
| 49 | MAP2K6 | MAP2K6 | MAP2K6 | 8745 | 0.018 | 0.4 | NO |
| 50 | RPS6KA1 | RPS6KA1 | RPS6KA1 | 8864 | 0.016 | 0.39 | NO |
| 51 | HMGB1 | HMGB1 | HMGB1 | 8968 | 0.015 | 0.39 | NO |
| 52 | UBA52 | UBA52 | UBA52 | 9019 | 0.014 | 0.39 | NO |
| 53 | DUSP7 | DUSP7 | DUSP7 | 9062 | 0.014 | 0.39 | NO |
| 54 | RPS27A | RPS27A | RPS27A | 9064 | 0.014 | 0.39 | NO |
| 55 | MYD88 | MYD88 | MYD88 | 9357 | 0.01 | 0.38 | NO |
| 56 | PELI3 | PELI3 | PELI3 | 9551 | 0.0079 | 0.37 | NO |
| 57 | TAB1 | TAB1 | TAB1 | 10204 | 0.00013 | 0.33 | NO |
| 58 | FOS | FOS | FOS | 10406 | -0.002 | 0.32 | NO |
| 59 | IKBKB | IKBKB | IKBKB | 10433 | -0.0025 | 0.32 | NO |
| 60 | PPP2CA | PPP2CA | PPP2CA | 10982 | -0.0085 | 0.29 | NO |
| 61 | TIRAP | TIRAP | TIRAP | 11064 | -0.0096 | 0.29 | NO |
| 62 | NFKBIB | NFKBIB | NFKBIB | 11160 | -0.011 | 0.28 | NO |
| 63 | MAPKAPK3 | MAPKAPK3 | MAPKAPK3 | 11355 | -0.013 | 0.28 | NO |
| 64 | IRAK1 | IRAK1 | IRAK1 | 11360 | -0.013 | 0.28 | NO |
| 65 | RELA | RELA | RELA | 11368 | -0.013 | 0.28 | NO |
| 66 | MAPK9 | MAPK9 | MAPK9 | 11534 | -0.015 | 0.27 | NO |
| 67 | MAP2K3 | MAP2K3 | MAP2K3 | 11658 | -0.017 | 0.27 | NO |
| 68 | PPP2CB | PPP2CB | PPP2CB | 11691 | -0.017 | 0.27 | NO |
| 69 | APP | APP | APP | 12038 | -0.022 | 0.25 | NO |
| 70 | PPP2R1B | PPP2R1B | PPP2R1B | 12210 | -0.024 | 0.25 | NO |
| 71 | TAB3 | TAB3 | TAB3 | 12391 | -0.026 | 0.24 | NO |
| 72 | CDK1 | CDK1 | CDK1 | 12606 | -0.029 | 0.23 | NO |
| 73 | PPP2R1A | PPP2R1A | PPP2R1A | 12853 | -0.033 | 0.22 | NO |
| 74 | MAP2K7 | MAP2K7 | MAP2K7 | 13008 | -0.035 | 0.22 | NO |
| 75 | MAP2K2 | MAP2K2 | MAP2K2 | 13732 | -0.046 | 0.19 | NO |
| 76 | IRAK2 | IRAK2 | IRAK2 | 13762 | -0.047 | 0.19 | NO |
| 77 | MAPK3 | MAPK3 | MAPK3 | 13954 | -0.05 | 0.19 | NO |
| 78 | DUSP6 | DUSP6 | DUSP6 | 14667 | -0.064 | 0.16 | NO |
| 79 | ECSIT | ECSIT | ECSIT | 14937 | -0.071 | 0.15 | NO |
| 80 | SIGIRR | SIGIRR | SIGIRR | 15862 | -0.099 | 0.12 | NO |
| 81 | DUSP4 | DUSP4 | DUSP4 | 17300 | -0.18 | 0.063 | NO |
Figure S97. Get High-res Image This plot shows mRNAseq_cNMF expression data heatmap (on the left) a RunningEnrichmentScore(RES) plot (on the top right) and a Signal2Noise(S2N) plot (on the bottom right) of genes in the pathway: KEGG MTOR SIGNALING PATHWAY.
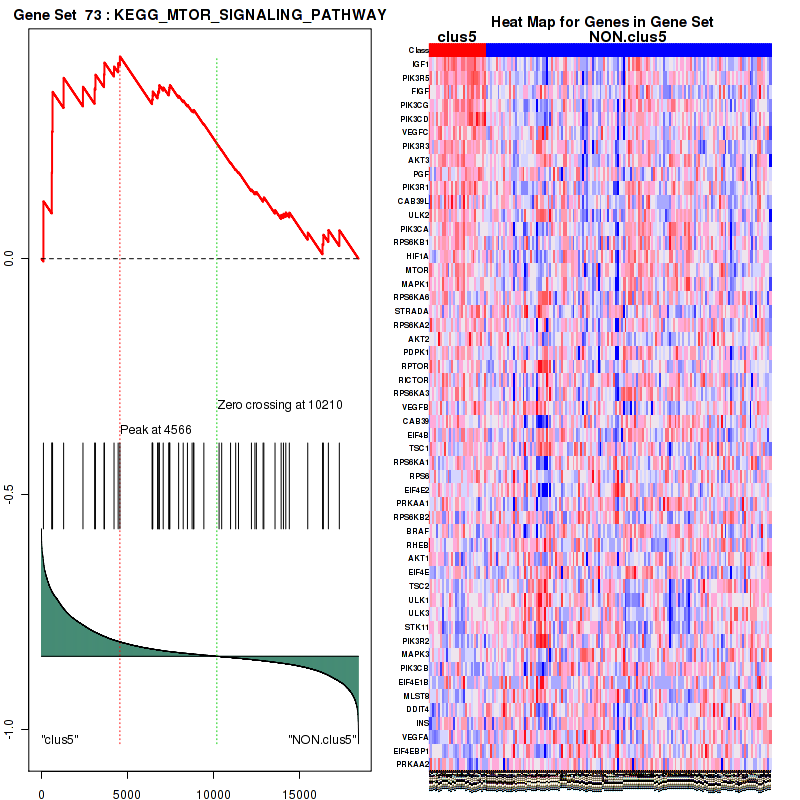
Figure S98. Get High-res Image For the top 5 core enriched genes in the pathway: KEGG MTOR SIGNALING PATHWAY, this volcano plot shows how much they are up/down-regulated and significant. The significance was calculated by empirical bayesian fit

Table S50. Get Full Table This table shows a Running Enrichment Score (RES) of each gene in this pathway, that is, the enrichment score at this point in the ranked list of genes. All genes are ranked by Signal-to-Noise (S2N), a measure of similarity as default and are used to obtain ES matrix of all genes. In this way, GSEA tool uses expression pattern of not only overlapped genes but also not-overlapped genes to produce ES matrix.
| Rank | GENE | SYMBOL | DESC | LIST.LOC | S2N | RES | CORE_ENRICHMENT |
|---|---|---|---|---|---|---|---|
| 1 | PRKCB | PRKCB | PRKCB | 15 | 0.83 | 0.1 | YES |
| 2 | IKZF3 | IKZF3 | IKZF3 | 77 | 0.74 | 0.19 | YES |
| 3 | IL2RA | IL2RA | IL2RA | 513 | 0.5 | 0.23 | YES |
| 4 | IL2RB | IL2RB | IL2RB | 744 | 0.45 | 0.27 | YES |
| 5 | BCL2 | BCL2 | BCL2 | 824 | 0.44 | 0.32 | YES |
| 6 | LCK | LCK | LCK | 951 | 0.41 | 0.37 | YES |
| 7 | DOK2 | DOK2 | DOK2 | 1123 | 0.38 | 0.4 | YES |
| 8 | JAK3 | JAK3 | JAK3 | 1354 | 0.34 | 0.43 | YES |
| 9 | IL2 | IL2 | IL2 | 1386 | 0.34 | 0.48 | YES |
| 10 | SOCS2 | SOCS2 | SOCS2 | 2246 | 0.25 | 0.46 | YES |
| 11 | FYN | FYN | FYN | 2277 | 0.24 | 0.49 | YES |
| 12 | SOCS1 | SOCS1 | SOCS1 | 2434 | 0.23 | 0.51 | YES |
| 13 | IFNG | IFNG | IFNG | 2446 | 0.23 | 0.54 | YES |
| 14 | MAPK11 | MAPK11 | MAPK11 | 2800 | 0.2 | 0.54 | YES |
| 15 | SOCS3 | SOCS3 | SOCS3 | 3138 | 0.18 | 0.54 | YES |
| 16 | PIK3R1 | PIK3R1 | PIK3R1 | 3665 | 0.15 | 0.53 | YES |
| 17 | STAT5A | STAT5A | STAT5A | 3679 | 0.15 | 0.55 | YES |
| 18 | PTK2B | PTK2B | PTK2B | 3807 | 0.14 | 0.56 | YES |
| 19 | IL2RG | IL2RG | IL2RG | 3820 | 0.14 | 0.58 | YES |
| 20 | MYC | MYC | MYC | 4023 | 0.13 | 0.58 | YES |
| 21 | GAB2 | GAB2 | GAB2 | 4222 | 0.12 | 0.59 | YES |
| 22 | STAT5B | STAT5B | STAT5B | 4237 | 0.12 | 0.6 | YES |
| 23 | PIK3CA | PIK3CA | PIK3CA | 4566 | 0.11 | 0.6 | YES |
| 24 | SYK | SYK | SYK | 4661 | 0.1 | 0.6 | YES |
| 25 | JAK1 | JAK1 | JAK1 | 5221 | 0.084 | 0.58 | NO |
| 26 | PRKCE | PRKCE | PRKCE | 5301 | 0.082 | 0.59 | NO |
| 27 | GRB2 | GRB2 | GRB2 | 5637 | 0.073 | 0.58 | NO |
| 28 | SOS1 | SOS1 | SOS1 | 6304 | 0.057 | 0.55 | NO |
| 29 | STAT3 | STAT3 | STAT3 | 6325 | 0.056 | 0.56 | NO |
| 30 | STAT1 | STAT1 | STAT1 | 6391 | 0.055 | 0.56 | NO |
| 31 | NRAS | NRAS | NRAS | 6666 | 0.049 | 0.55 | NO |
| 32 | MAPK1 | MAPK1 | MAPK1 | 6760 | 0.048 | 0.55 | NO |
| 33 | PTPN11 | PTPN11 | PTPN11 | 6857 | 0.046 | 0.55 | NO |
| 34 | MAPKAPK2 | MAPKAPK2 | MAPKAPK2 | 7057 | 0.042 | 0.55 | NO |
| 35 | SHC1 | SHC1 | SHC1 | 7113 | 0.041 | 0.55 | NO |
| 36 | MAPK14 | MAPK14 | MAPK14 | 7186 | 0.039 | 0.55 | NO |
| 37 | CISH | CISH | CISH | 7756 | 0.031 | 0.52 | NO |
| 38 | MAP2K1 | MAP2K1 | MAP2K1 | 7825 | 0.03 | 0.52 | NO |
| 39 | MAPK8 | MAPK8 | MAPK8 | 8009 | 0.027 | 0.52 | NO |
| 40 | RHOA | RHOA | RHOA | 8044 | 0.026 | 0.52 | NO |
| 41 | JUN | JUN | JUN | 8203 | 0.024 | 0.51 | NO |
| 42 | PPP2R5D | PPP2R5D | PPP2R5D | 8425 | 0.022 | 0.5 | NO |
| 43 | IRS2 | IRS2 | IRS2 | 8551 | 0.02 | 0.5 | NO |
| 44 | CDK2 | CDK2 | CDK2 | 8580 | 0.02 | 0.5 | NO |
| 45 | RAF1 | RAF1 | RAF1 | 8915 | 0.016 | 0.48 | NO |
| 46 | STAM | STAM | STAM | 9189 | 0.012 | 0.47 | NO |
| 47 | STAM2 | STAM2 | STAM2 | 10230 | -0.00015 | 0.41 | NO |
| 48 | FOS | FOS | FOS | 10406 | -0.002 | 0.4 | NO |
| 49 | IRS1 | IRS1 | IRS1 | 11125 | -0.01 | 0.37 | NO |
| 50 | MAPK9 | MAPK9 | MAPK9 | 11534 | -0.015 | 0.35 | NO |
| 51 | KRAS | KRAS | KRAS | 12329 | -0.025 | 0.31 | NO |
| 52 | RASA1 | RASA1 | RASA1 | 12790 | -0.032 | 0.29 | NO |
| 53 | MAP2K2 | MAP2K2 | MAP2K2 | 13732 | -0.046 | 0.24 | NO |
| 54 | MAPK3 | MAPK3 | MAPK3 | 13954 | -0.05 | 0.24 | NO |
| 55 | HRAS | HRAS | HRAS | 15336 | -0.081 | 0.17 | NO |
Figure S99. Get High-res Image This plot shows mRNAseq_cNMF expression data heatmap (on the left) a RunningEnrichmentScore(RES) plot (on the top right) and a Signal2Noise(S2N) plot (on the bottom right) of genes in the pathway: KEGG APOPTOSIS.
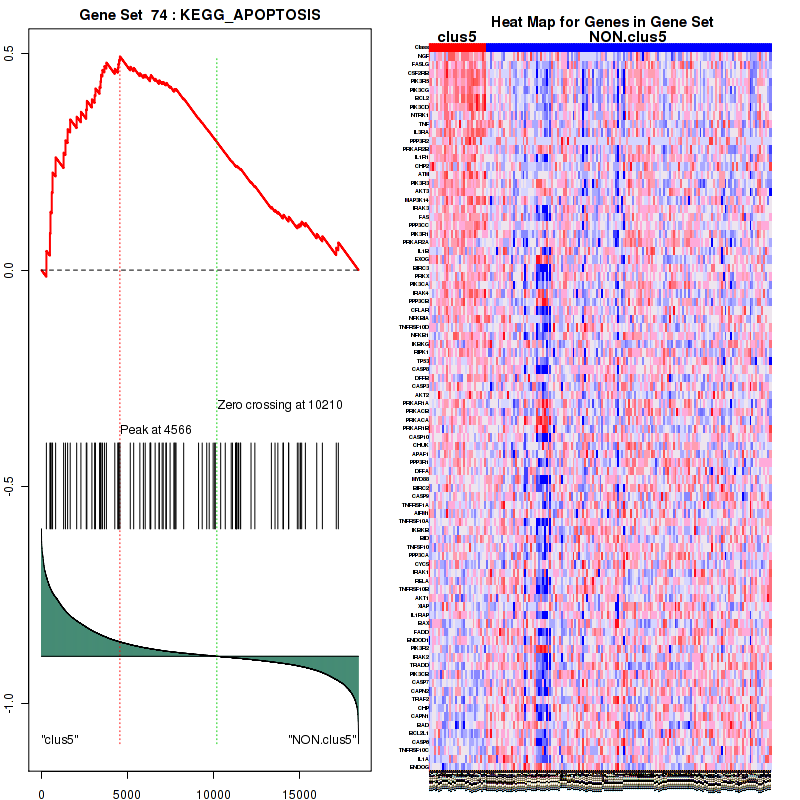
Figure S100. Get High-res Image For the top 5 core enriched genes in the pathway: KEGG APOPTOSIS, this volcano plot shows how much they are up/down-regulated and significant. The significance was calculated by empirical bayesian fit
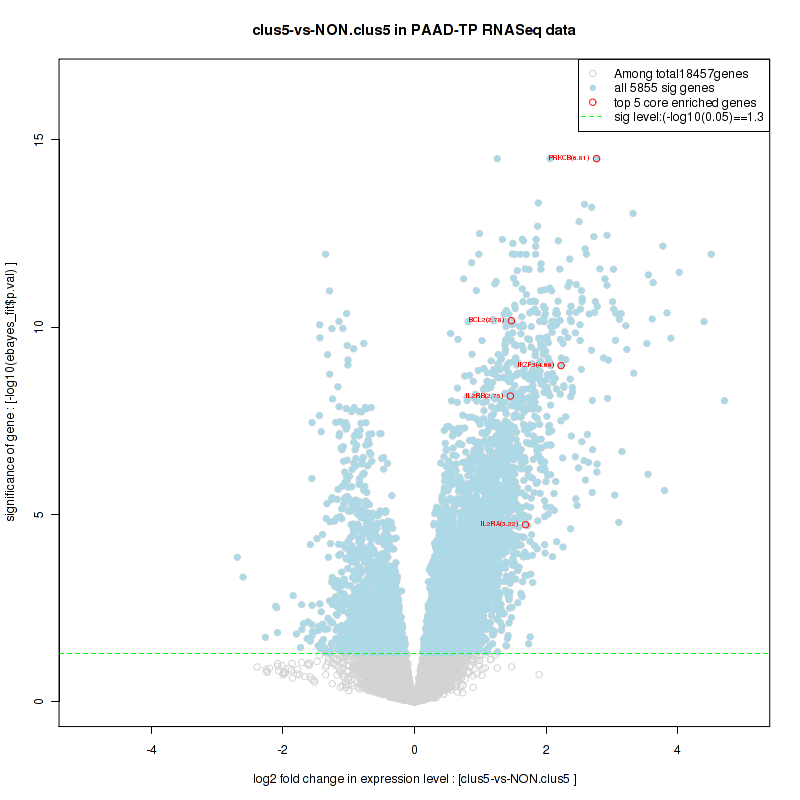
For the top enriched genes, if you want to check whether they are
-
up-regulated, please check the list of up-regulated genes
-
down-regulated, please check the list of down-regulated genes
For the top enriched genes, if you want to check whether they are
-
highly expressed genes, please check the list of high (top 30%) expressed genes
-
low expressed genes, please check the list of low (bottom 30%) expressed genes
An expression pattern of top(30%)/middle(30%)/low(30%) in this subtype against other subtypes is available in a heatmap
For the top enriched genes, if you want to check whether they are
-
significantly differently expressed genes by eBayes lm fit, please check the list of significant genes
-
Gene set database = c2.cp.v4.0.symbols.gmt
-
Expression data file = PAAD-TP.uncv2.mRNAseq_RSEM_normalized_log2.txt
-
Phenotype data file = PAAD-TP.mergedcluster.txt
For the Gene Set Enrichment Analysis (GSEA), Broad GSEA-P-R.1.0 version is used with class2: canonical pathways geneses from MSigDB. Further details about statistics are available inThe Broad GSEA website.
In addition to the links below, the full results of the analysis summarized in this report can also be downloaded programmatically using firehose_get, or interactively from either the Broad GDAC website or TCGA Data Coordination Center Portal.