This report serves to describe the mutational landscape and properties of a given individual set, as well as rank genes and genesets according to mutational significance. MutSig v2.0 was used to generate the results found in this report.
-
Working with individual set: THCA-TP
-
Number of patients in set: 496
The input for this pipeline is a set of individuals with the following files associated for each:
-
An annotated .maf file describing the mutations called for the respective individual, and their properties.
-
A .wig file that contains information about the coverage of the sample.
-
MAF used for this analysis:THCA-TP.final_analysis_set.maf
-
Blacklist used for this analysis: pancan_mutation_blacklist.v14.hg19.txt
-
Significantly mutated genes (q ≤ 0.1): 30
-
Mutations seen in COSMIC: 385
-
Significantly mutated genes in COSMIC territory: 16
-
Significantly mutated genesets: 90
-
Significantly mutated genesets: (excluding sig. mutated genes):5
-
Read 496 MAFs of type "maf1"
-
Total number of mutations in input MAFs: 15662
-
After removing 107 mutations outside chr1-24: 15555
-
After removing 3213 blacklisted mutations: 12342
-
After removing 1779 noncoding mutations: 10563
-
After collapsing adjacent/redundant mutations: 10050
-
Number of mutations before filtering: 10050
-
After removing 597 mutations outside gene set: 9453
-
After removing 6 mutations outside category set: 9447
Table 1. Get Full Table Table representing breakdown of mutations by type.
| type | count |
|---|---|
| De_novo_Start_InFrame | 11 |
| De_novo_Start_OutOfFrame | 18 |
| Frame_Shift_Del | 404 |
| Frame_Shift_Ins | 107 |
| In_Frame_Del | 165 |
| In_Frame_Ins | 28 |
| Missense_Mutation | 5832 |
| Nonsense_Mutation | 300 |
| Nonstop_Mutation | 10 |
| Silent | 2275 |
| Splice_Site | 287 |
| Start_Codon_Del | 2 |
| Start_Codon_Ins | 1 |
| Start_Codon_SNP | 7 |
| Total | 9447 |
Table 2. Get Full Table A breakdown of mutation rates per category discovered for this individual set.
| category | n | N | rate | rate_per_mb | relative_rate | exp_ns_s_ratio |
|---|---|---|---|---|---|---|
| *CpG->T | 1159 | 807310784 | 1.4e-06 | 1.4 | 2.9 | 2.1 |
| *Cp(A/C/T)->T | 1353 | 6606127664 | 2e-07 | 0.2 | 0.41 | 1.7 |
| A->G | 1059 | 7116374150 | 1.5e-07 | 0.15 | 0.3 | 2.3 |
| transver | 2268 | 14529812598 | 1.6e-07 | 0.16 | 0.32 | 5 |
| indel+null | 1327 | 14529812598 | 9.1e-08 | 0.091 | 0.19 | NaN |
| double_null | 6 | 14529812598 | 4.1e-10 | 0.00041 | 0.00084 | NaN |
| Total | 7172 | 14529812598 | 4.9e-07 | 0.49 | 1 | 3.5 |
The x axis represents the samples. The y axis represents the exons, one row per exon, and they are sorted by average coverage across samples. For exons with exactly the same average coverage, they are sorted next by the %GC of the exon. (The secondary sort is especially useful for the zero-coverage exons at the bottom). If the figure is unpopulated, then full coverage is assumed (e.g. MutSig CV doesn't use WIGs and assumes full coverage).
Figure 1.
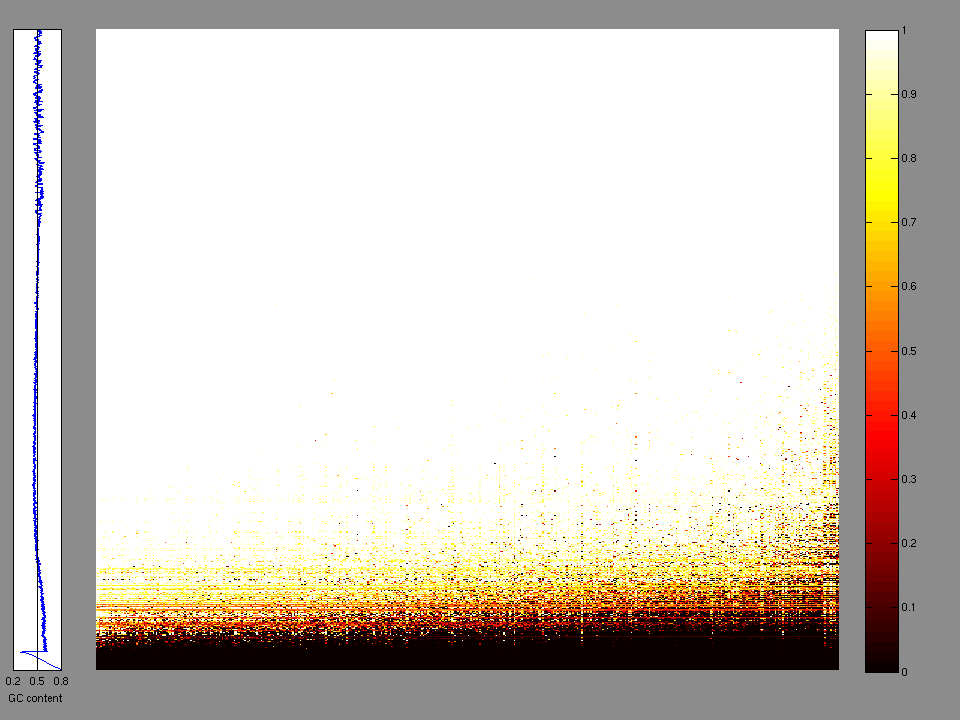
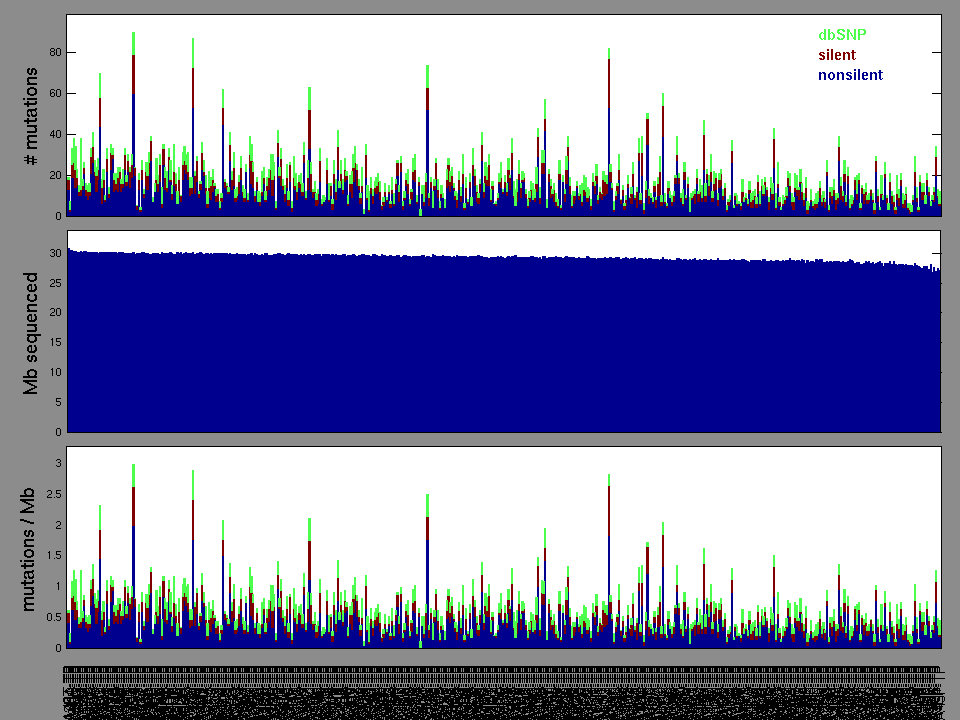
Figure 2. Patients counts and rates file used to generate this plot: THCA-TP.patients.counts_and_rates.txt
The mutation spectrum is depicted in the lego plots below in which the 96 possible mutation types are subdivided into six large blocks, color-coded to reflect the base substitution type. Each large block is further subdivided into the 16 possible pairs of 5' and 3' neighbors, as listed in the 4x4 trinucleotide context legend. The height of each block corresponds to the mutation frequency for that kind of mutation (counts of mutations normalized by the base coverage in a given bin). The shape of the spectrum is a signature for dominant mutational mechanisms in different tumor types.
Figure 3. Get High-res Image SNV Mutation rate lego plot for entire set. Each bin is normalized by base coverage for that bin. Colors represent the six SNV types on the upper right. The three-base context for each mutation is labeled in the 4x4 legend on the lower right. The fractional breakdown of SNV counts is shown in the pie chart on the upper left. If this figure is blank, not enough information was provided in the MAF to generate it.
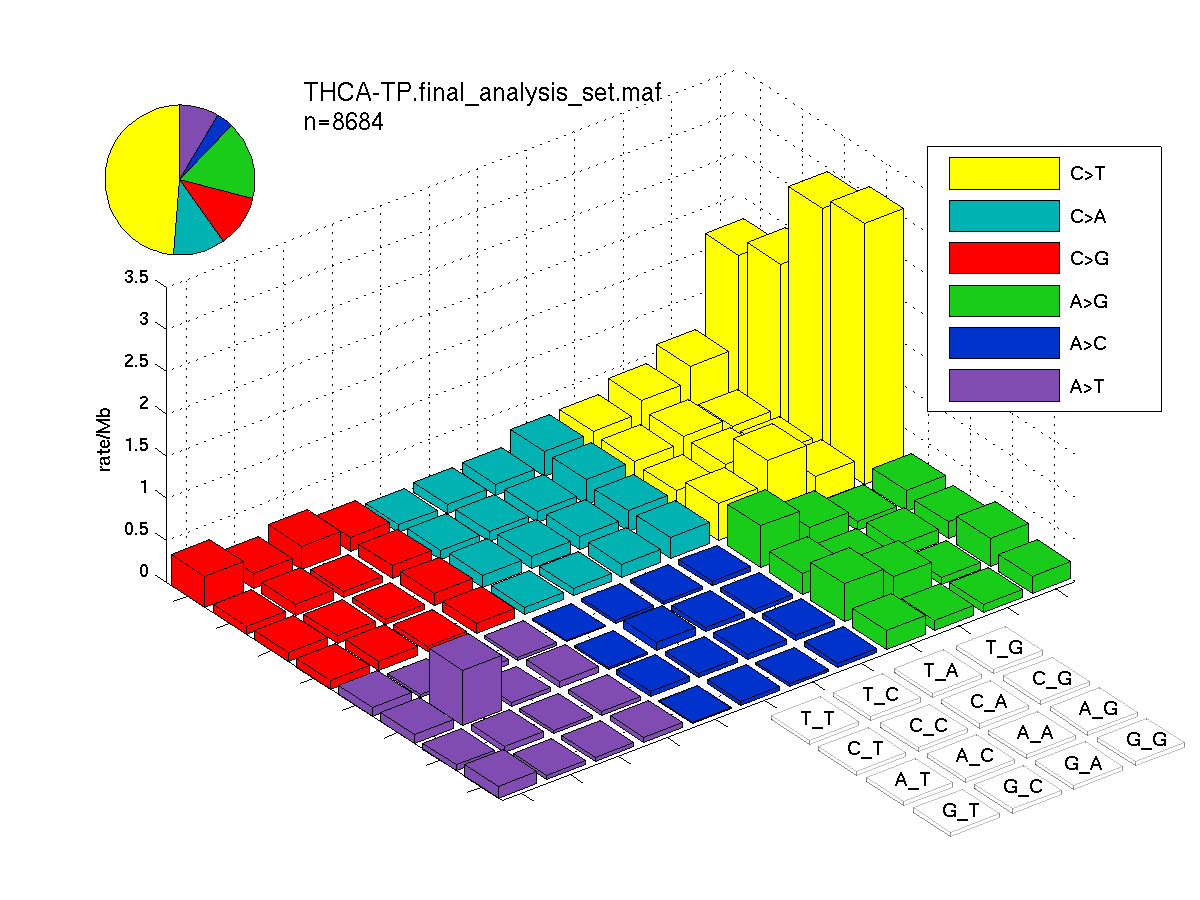
Figure 4. Get High-res Image SNV Mutation rate lego plots for 4 slices of mutation allele fraction (0<=AF<0.1, 0.1<=AF<0.25, 0.25<=AF<0.5, & 0.5<=AF) . The color code and three-base context legends are the same as the previous figure. If this figure is blank, not enough information was provided in the MAF to generate it.
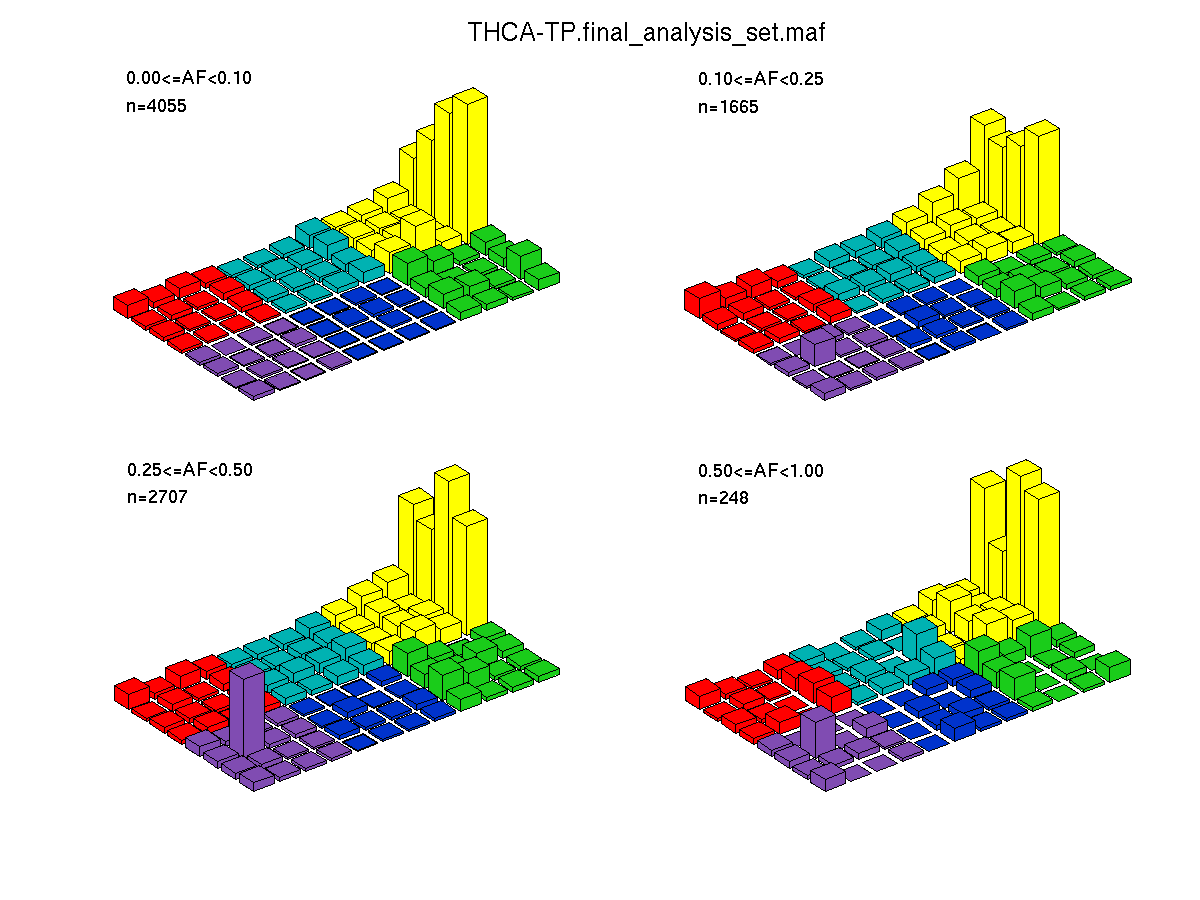
Figure 5. Get High-res Image The matrix in the center of the figure represents individual mutations in patient samples, color-coded by type of mutation, for the significantly mutated genes. The rate of synonymous and non-synonymous mutations is displayed at the top of the matrix. The barplot on the left of the matrix shows the number of mutations in each gene. The percentages represent the fraction of tumors with at least one mutation in the specified gene. The barplot to the right of the matrix displays the q-values for the most significantly mutated genes. The purple boxplots below the matrix (only displayed if required columns are present in the provided MAF) represent the distributions of allelic fractions observed in each sample. The plot at the bottom represents the base substitution distribution of individual samples, using the same categories that were used to calculate significance.
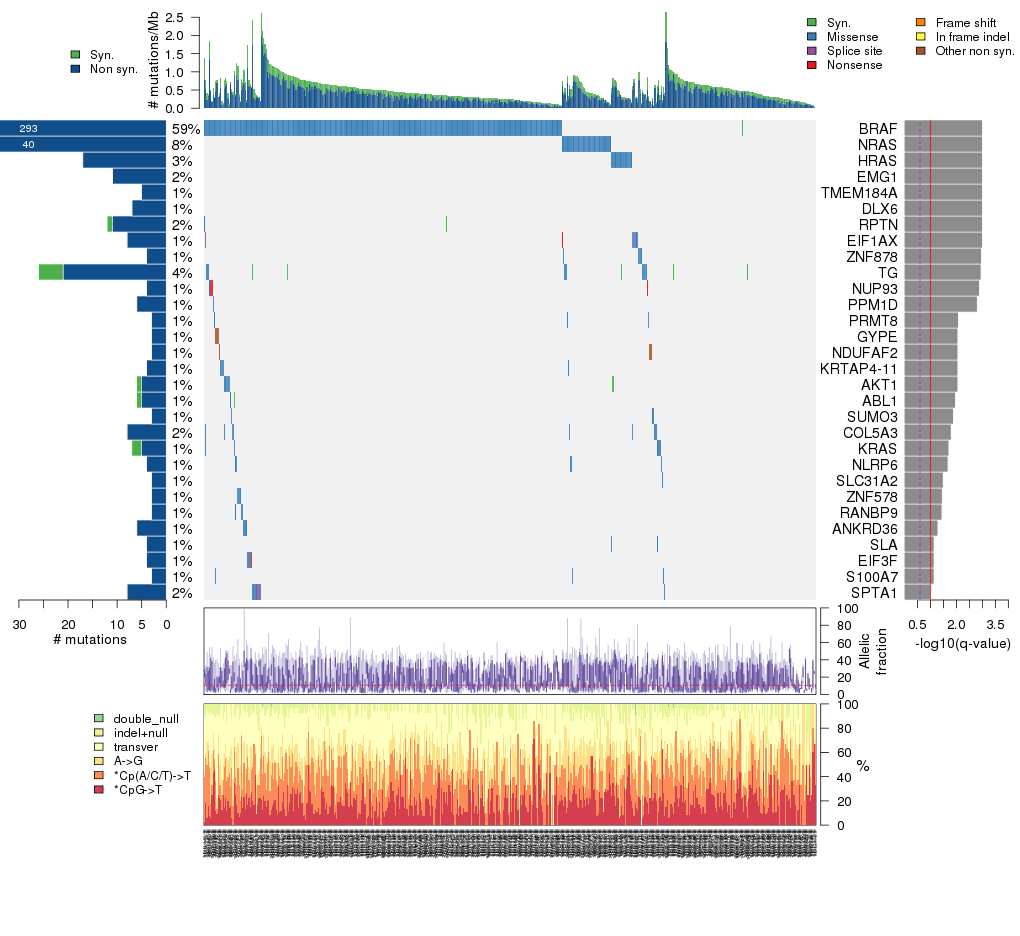
Column Descriptions:
-
N = number of sequenced bases in this gene across the individual set
-
n = number of (nonsilent) mutations in this gene across the individual set
-
npat = number of patients (individuals) with at least one nonsilent mutation
-
nsite = number of unique sites having a non-silent mutation
-
nsil = number of silent mutations in this gene across the individual set
-
n1 = number of nonsilent mutations of type: *CpG->T
-
n2 = number of nonsilent mutations of type: *Cp(A/C/T)->T
-
n3 = number of nonsilent mutations of type: A->G
-
n4 = number of nonsilent mutations of type: transver
-
n5 = number of nonsilent mutations of type: indel+null
-
n6 = number of nonsilent mutations of type: double_null
-
p_classic = p-value for the observed amount of nonsilent mutations being elevated in this gene
-
p_ns_s = p-value for the observed nonsilent/silent ratio being elevated in this gene
-
p_cons = p-value for enrichment of mutations at evolutionarily most-conserved sites in gene
-
p_joint = p-value for clustering + conservation
-
p = p-value (overall)
-
q = q-value, False Discovery Rate (Benjamini-Hochberg procedure)
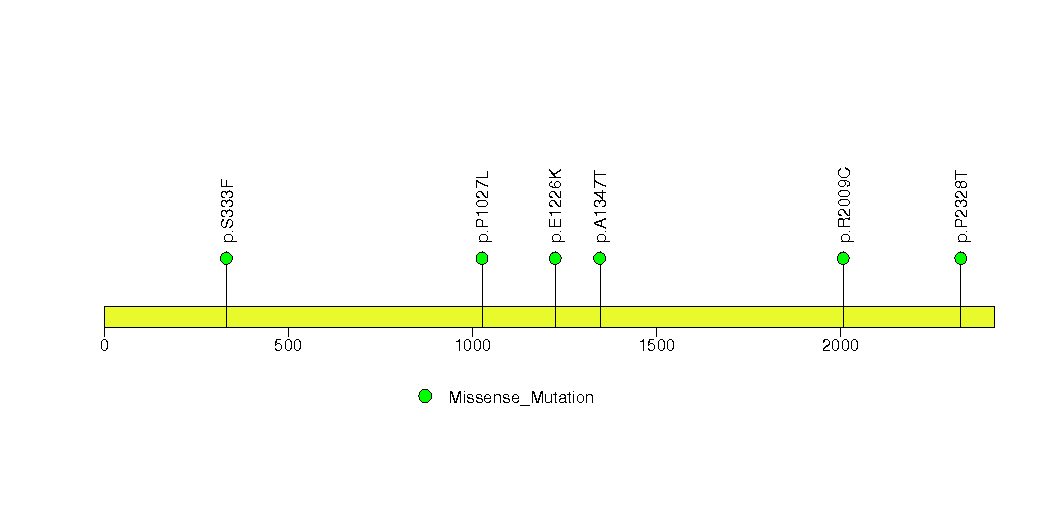
Table 3. Get Full Table A Ranked List of Significantly Mutated Genes. Number of significant genes found: 30. Number of genes displayed: 35. Click on a gene name to display its stick figure depicting the distribution of mutations and mutation types across the chosen gene (this feature may not be available for all significant genes).
| rank | gene | description | N | n | npat | nsite | nsil | n1 | n2 | n3 | n4 | n5 | n6 | p_classic | p_ns_s | p_clust | p_cons | p_joint | p | q |
|---|---|---|---|---|---|---|---|---|---|---|---|---|---|---|---|---|---|---|---|---|
| 1 | BRAF | v-raf murine sarcoma viral oncogene homolog B1 | 1103063 | 291 | 291 | 3 | 2 | 0 | 0 | 2 | 288 | 1 | 0 | <1.00e-15 | <1.00e-15 | 0 | 0 | 0 | <1.00e-15 | <3.62e-12 |
| 2 | NRAS | neuroblastoma RAS viral (v-ras) oncogene homolog | 290637 | 40 | 40 | 2 | 0 | 0 | 0 | 31 | 9 | 0 | 0 | 2.55e-15 | 1.34e-06 | 0 | 0.000038 | 0 | <1.00e-15 | <3.62e-12 |
| 3 | HRAS | v-Ha-ras Harvey rat sarcoma viral oncogene homolog | 321984 | 17 | 17 | 2 | 0 | 0 | 0 | 14 | 3 | 0 | 0 | 1.01e-14 | 0.0575 | 0 | 0.000045 | 0 | <1.00e-15 | <3.62e-12 |
| 4 | EMG1 | EMG1 nucleolar protein homolog (S. cerevisiae) | 329497 | 11 | 11 | 2 | 0 | 0 | 0 | 0 | 0 | 11 | 0 | 4.77e-15 | 1.000 | 0 | 0.99 | 0 | <1.00e-15 | <3.62e-12 |
| 5 | TMEM184A | transmembrane protein 184A | 559188 | 5 | 5 | 1 | 0 | 0 | 0 | 0 | 0 | 5 | 0 | 1.50e-05 | 1.000 | 0 | 1 | 0 | <1.00e-15 | <3.62e-12 |
| 6 | DLX6 | distal-less homeobox 6 | 198621 | 7 | 7 | 3 | 0 | 0 | 0 | 0 | 0 | 7 | 0 | 5.25e-12 | 1.000 | 1.8e-06 | 0.99 | 6.4e-06 | 1.33e-15 | 4.02e-12 |
| 7 | RPTN | repetin | 1172030 | 11 | 10 | 6 | 1 | 0 | 2 | 0 | 0 | 9 | 0 | 1.00e-10 | 0.745 | 0.00018 | 0.0077 | 1e-05 | 3.56e-14 | 9.21e-11 |
| 8 | EIF1AX | eukaryotic translation initiation factor 1A, X-linked | 218439 | 8 | 7 | 7 | 0 | 0 | 3 | 0 | 2 | 2 | 1 | 2.56e-12 | 0.183 | 0.072 | 0.12 | 0.084 | 6.53e-12 | 1.48e-08 |
| 9 | ZNF878 | zinc finger protein 878 | 797461 | 4 | 4 | 1 | 0 | 0 | 0 | 0 | 4 | 0 | 0 | 7.31e-05 | 0.542 | 4e-07 | 1 | 0.000026 | 4.06e-08 | 8.17e-05 |
| 10 | TG | thyroglobulin | 4161323 | 21 | 21 | 21 | 5 | 1 | 1 | 1 | 5 | 13 | 0 | 2.63e-08 | 0.907 | 0.076 | 0.75 | 0.14 | 7.43e-08 | 0.000134 |
| 11 | NUP93 | nucleoporin 93kDa | 1260705 | 4 | 4 | 2 | 0 | 0 | 1 | 0 | 0 | 3 | 0 | 0.000734 | 0.118 | 4e-06 | 0.27 | 0.000012 | 1.78e-07 | 0.000292 |
| 12 | PPM1D | protein phosphatase 1D magnesium-dependent, delta isoform | 775885 | 6 | 6 | 6 | 0 | 0 | 1 | 0 | 0 | 5 | 0 | 4.64e-07 | 0.700 | 0.016 | 0.86 | 0.044 | 3.86e-07 | 0.000582 |
| 13 | PRMT8 | protein arginine methyltransferase 8 | 600533 | 3 | 3 | 2 | 0 | 0 | 0 | 2 | 1 | 0 | 0 | 0.000976 | 0.549 | 0.00025 | 1 | 0.00034 | 5.34e-06 | 0.00743 |
| 14 | GYPE | glycophorin E | 114552 | 3 | 3 | 1 | 0 | 0 | 0 | 0 | 0 | 3 | 0 | 6.46e-06 | 0.546 | NaN | NaN | NaN | 6.46e-06 | 0.00789 |
| 15 | NDUFAF2 | NADH dehydrogenase (ubiquinone) 1 alpha subcomplex, assembly factor 2 | 212396 | 3 | 3 | 1 | 0 | 0 | 0 | 0 | 0 | 3 | 0 | 7.35e-06 | 0.294 | NaN | NaN | NaN | 7.35e-06 | 0.00789 |
| 16 | KRTAP4-11 | keratin associated protein 4-11 | 254777 | 4 | 4 | 3 | 0 | 3 | 0 | 0 | 1 | 0 | 0 | 6.53e-07 | 0.756 | 0.55 | 0.72 | 0.73 | 7.38e-06 | 0.00789 |
| 17 | AKT1 | v-akt murine thymoma viral oncogene homolog 1 | 715150 | 5 | 5 | 3 | 1 | 0 | 3 | 0 | 2 | 0 | 0 | 1.83e-05 | 0.303 | 0.016 | 0.31 | 0.026 | 7.41e-06 | 0.00789 |
| 18 | ABL1 | c-abl oncogene 1, receptor tyrosine kinase | 1718428 | 5 | 5 | 2 | 1 | 0 | 1 | 0 | 0 | 4 | 0 | 0.000357 | 0.834 | 0.0016 | 0.086 | 0.0018 | 9.94e-06 | 0.00999 |
| 19 | SUMO3 | SMT3 suppressor of mif two 3 homolog 3 (S. cerevisiae) | 150357 | 3 | 3 | 1 | 0 | 0 | 0 | 0 | 3 | 0 | 0 | 1.25e-05 | 0.652 | NaN | NaN | NaN | 1.25e-05 | 0.0119 |
| 20 | COL5A3 | collagen, type V, alpha 3 | 2407158 | 8 | 8 | 8 | 0 | 3 | 1 | 0 | 3 | 1 | 0 | 1.35e-05 | 0.0991 | 0.05 | 1 | 0.084 | 1.66e-05 | 0.0150 |
| 21 | KRAS | v-Ki-ras2 Kirsten rat sarcoma viral oncogene homolog | 338314 | 5 | 5 | 3 | 2 | 0 | 0 | 1 | 4 | 0 | 0 | 0.00902 | 0.909 | 0.01 | 0.0011 | 0.00017 | 2.21e-05 | 0.0190 |
| 22 | NLRP6 | NLR family, pyrin domain containing 6 | 907843 | 4 | 4 | 2 | 0 | 0 | 0 | 3 | 1 | 0 | 0 | 0.000345 | 0.467 | 0.071 | 0.0057 | 0.005 | 2.46e-05 | 0.0202 |
| 23 | SLC31A2 | solute carrier family 31 (copper transporters), member 2 | 210165 | 3 | 3 | 2 | 0 | 0 | 0 | 0 | 1 | 2 | 0 | 4.00e-05 | 0.811 | NaN | NaN | NaN | 4.00e-05 | 0.0315 |
| 24 | ZNF578 | zinc finger protein 578 | 885308 | 3 | 3 | 2 | 0 | 0 | 2 | 0 | 1 | 0 | 0 | 0.00242 | 0.428 | 0.0052 | 0.01 | 0.0014 | 4.53e-05 | 0.0341 |
| 25 | RANBP9 | RAN binding protein 9 | 873865 | 3 | 3 | 1 | 0 | 0 | 0 | 0 | 3 | 0 | 0 | 0.00762 | 0.607 | 0.00012 | 1 | 0.00047 | 4.87e-05 | 0.0352 |
| 26 | ANKRD36 | ankyrin repeat domain 36 | 874610 | 6 | 5 | 6 | 0 | 0 | 1 | 2 | 1 | 2 | 0 | 2.98e-05 | 0.255 | 0.094 | 0.51 | 0.19 | 7.33e-05 | 0.0510 |
| 27 | SLA | Src-like-adaptor | 409991 | 4 | 4 | 4 | 0 | 0 | 0 | 1 | 1 | 2 | 0 | 1.00e-05 | 0.626 | 0.84 | 0.56 | 0.87 | 0.000111 | 0.0715 |
| 28 | EIF3F | eukaryotic translation initiation factor 3, subunit F | 538571 | 4 | 4 | 4 | 0 | 1 | 0 | 2 | 0 | 1 | 0 | 0.000154 | 0.220 | 0.049 | 0.3 | 0.058 | 0.000113 | 0.0715 |
| 29 | S100A7 | S100 calcium binding protein A7 | 155744 | 3 | 3 | 3 | 0 | 0 | 0 | 0 | 3 | 0 | 0 | 4.57e-05 | 0.679 | 0.1 | 0.8 | 0.2 | 0.000115 | 0.0715 |
| 30 | SPTA1 | spectrin, alpha, erythrocytic 1 (elliptocytosis 2) | 3697508 | 8 | 8 | 8 | 0 | 1 | 4 | 0 | 1 | 2 | 0 | 0.000160 | 0.0356 | 0.69 | 0.016 | 0.084 | 0.000165 | 0.0996 |
| 31 | TPTE2 | transmembrane phosphoinositide 3-phosphatase and tensin homolog 2 | 794356 | 6 | 5 | 5 | 1 | 0 | 0 | 0 | 5 | 1 | 0 | 3.28e-05 | 0.559 | 0.28 | 0.95 | 0.43 | 0.000173 | 0.101 |
| 32 | BMP2K | BMP2 inducible kinase | 1645768 | 3 | 3 | 1 | 1 | 0 | 0 | 0 | 3 | 0 | 0 | 0.0279 | 0.819 | 0.000082 | 0.94 | 0.00085 | 0.000275 | 0.156 |
| 33 | PRSS55 | protease, serine, 55 | 530125 | 4 | 4 | 4 | 0 | 0 | 1 | 1 | 2 | 0 | 0 | 9.82e-05 | 0.310 | 0.28 | 0.073 | 0.3 | 0.000332 | 0.182 |
| 34 | TUBGCP6 | tubulin, gamma complex associated protein 6 | 2447040 | 3 | 3 | 1 | 1 | 0 | 0 | 3 | 0 | 0 | 0 | 0.0736 | 0.788 | 0.00011 | 1 | 0.00043 | 0.000359 | 0.191 |
| 35 | OR56A1 | olfactory receptor, family 56, subfamily A, member 1 | 476393 | 2 | 2 | 2 | 0 | 1 | 1 | 0 | 0 | 0 | 0 | 0.00683 | 0.342 | 0.16 | 0.0039 | 0.0049 | 0.000377 | 0.195 |
Figure S1. This figure depicts the distribution of mutations and mutation types across the BRAF significant gene.
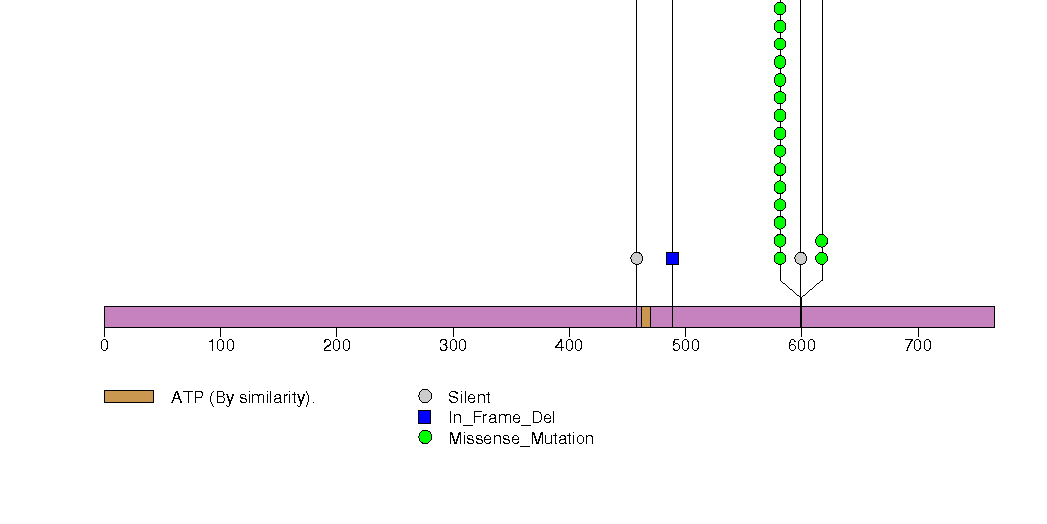
Figure S2. This figure depicts the distribution of mutations and mutation types across the NRAS significant gene.
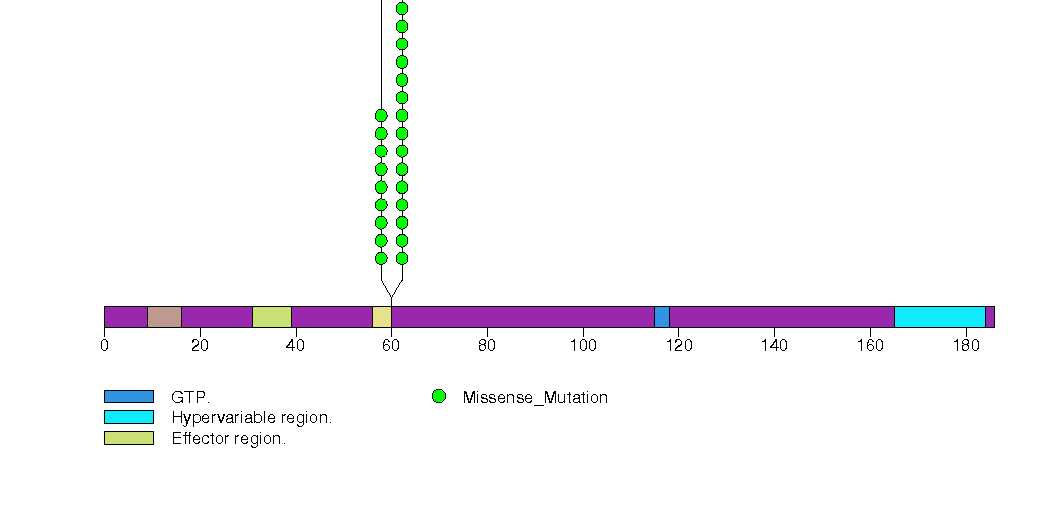
Figure S3. This figure depicts the distribution of mutations and mutation types across the HRAS significant gene.
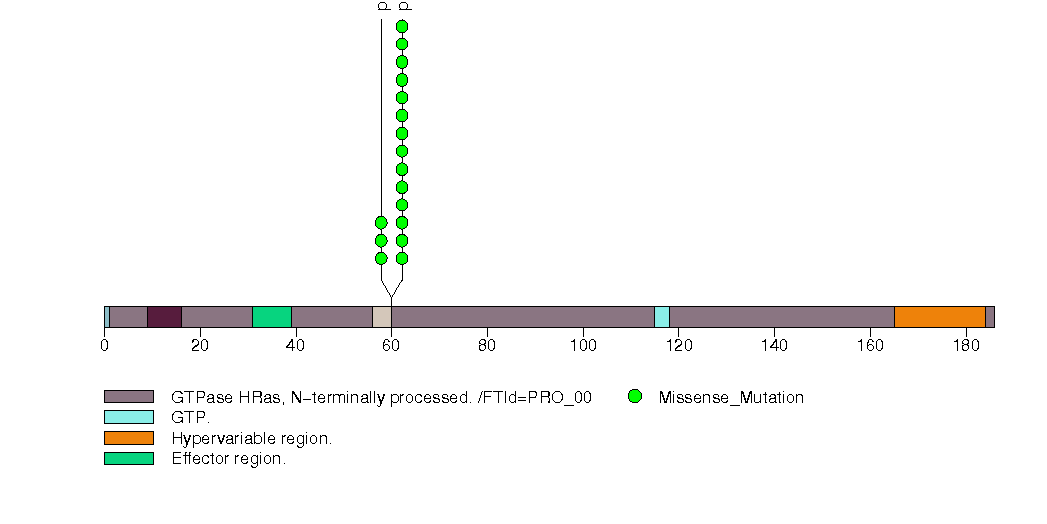
Figure S4. This figure depicts the distribution of mutations and mutation types across the TMEM184A significant gene.
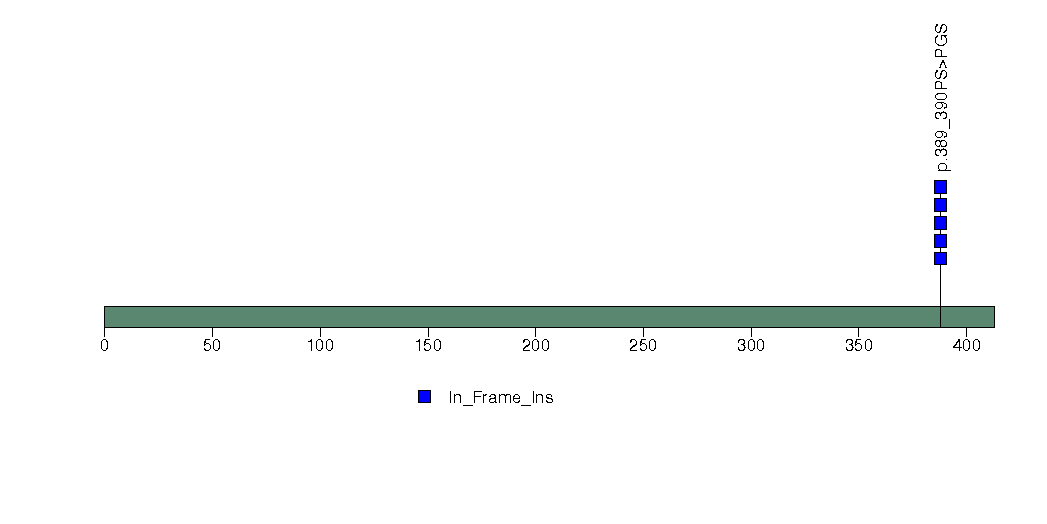
Figure S5. This figure depicts the distribution of mutations and mutation types across the DLX6 significant gene.
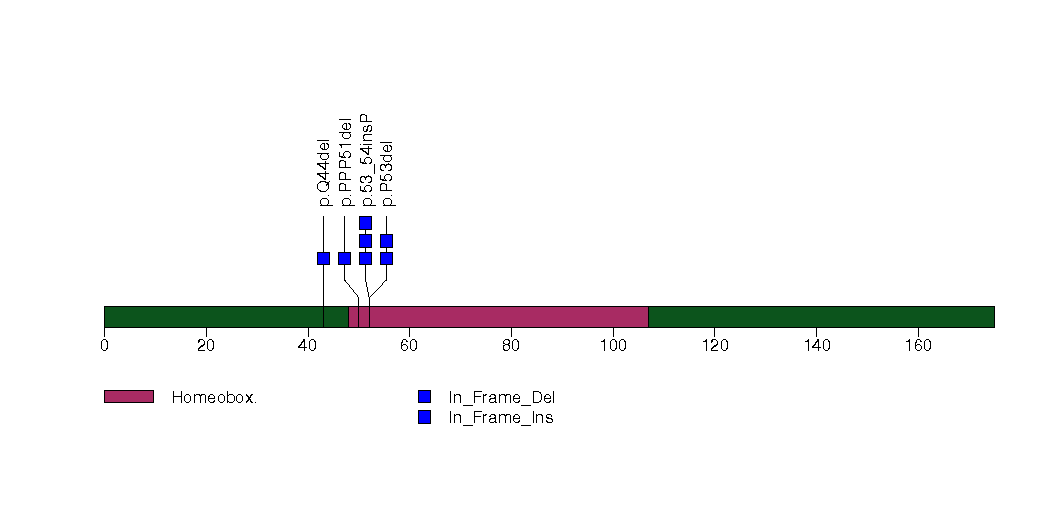
Figure S6. This figure depicts the distribution of mutations and mutation types across the RPTN significant gene.
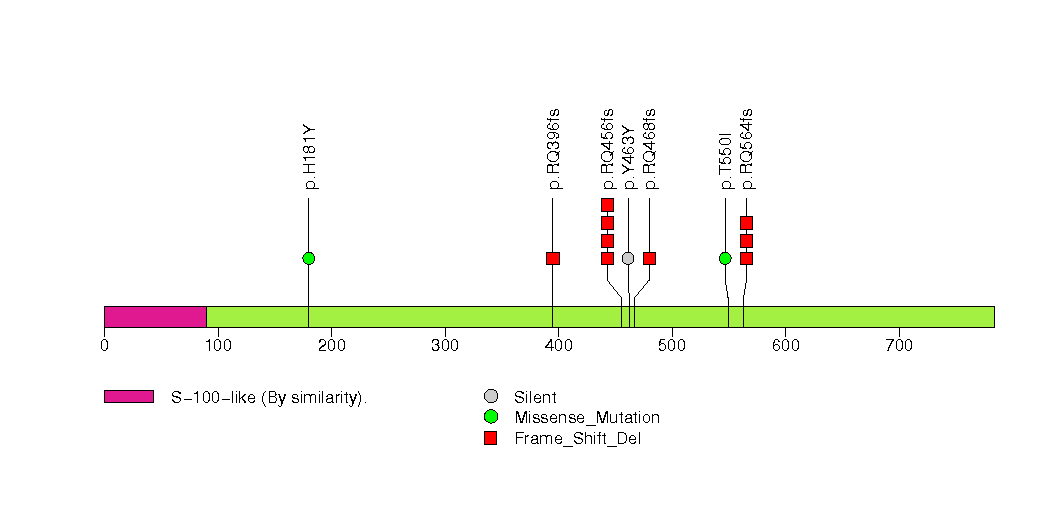
Figure S7. This figure depicts the distribution of mutations and mutation types across the EIF1AX significant gene.
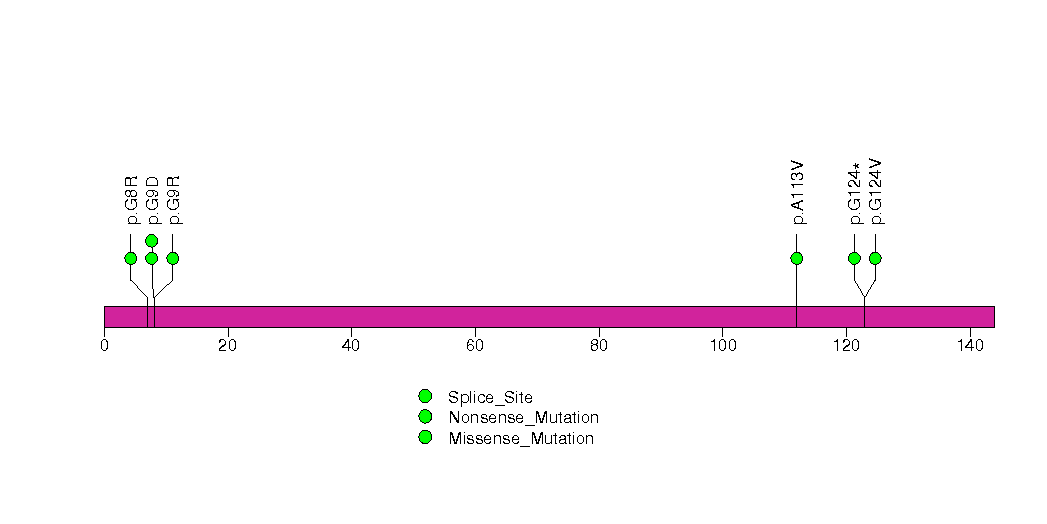
Figure S8. This figure depicts the distribution of mutations and mutation types across the ZNF878 significant gene.
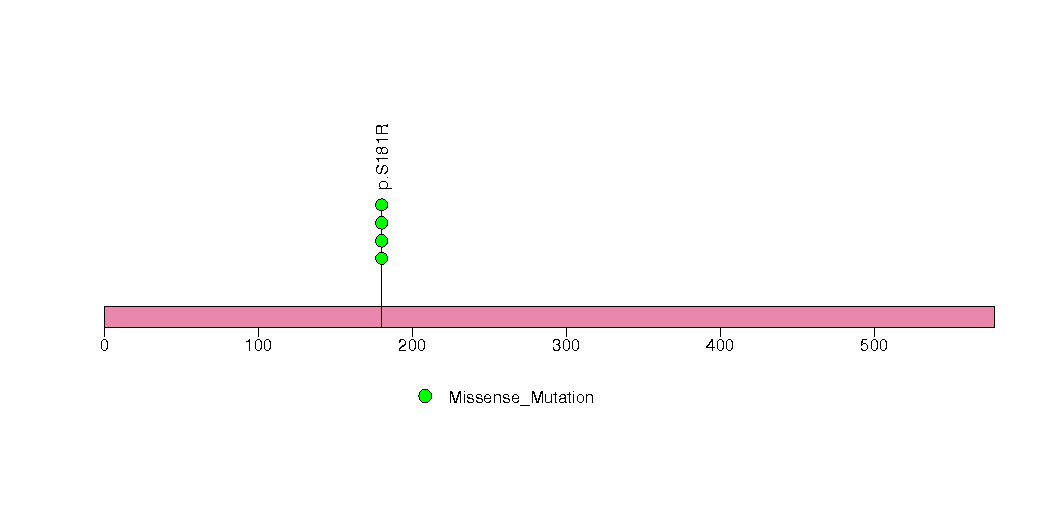
Figure S9. This figure depicts the distribution of mutations and mutation types across the TG significant gene.
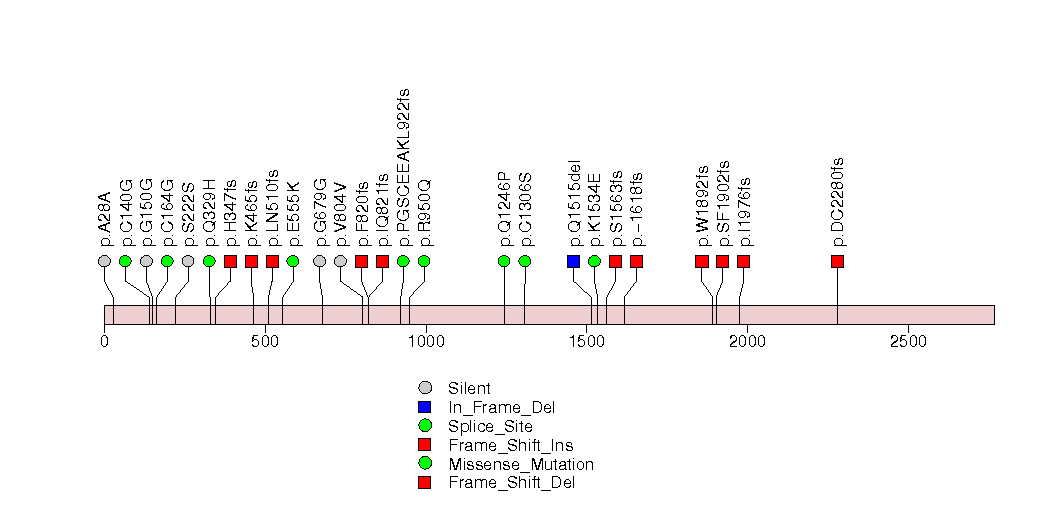
Figure S10. This figure depicts the distribution of mutations and mutation types across the NUP93 significant gene.
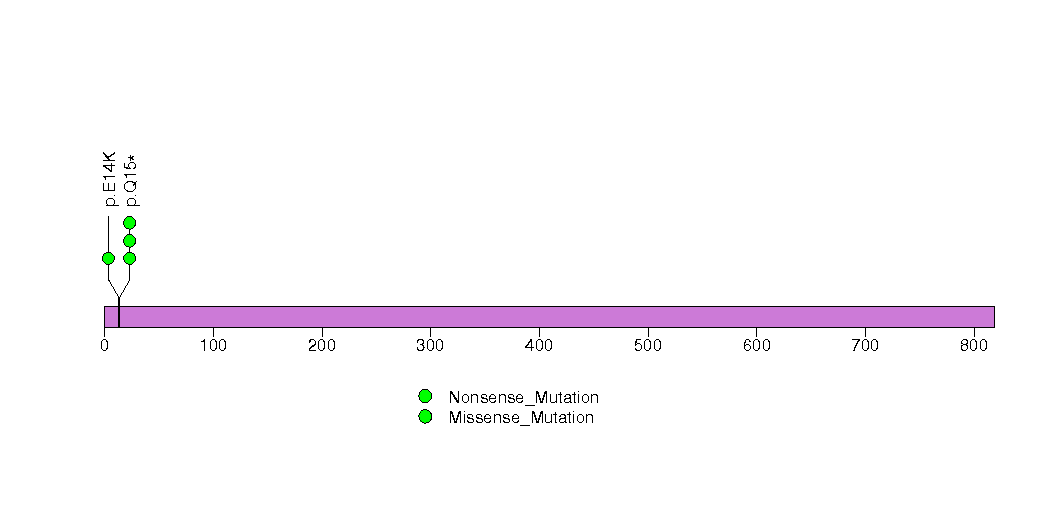
Figure S11. This figure depicts the distribution of mutations and mutation types across the PPM1D significant gene.
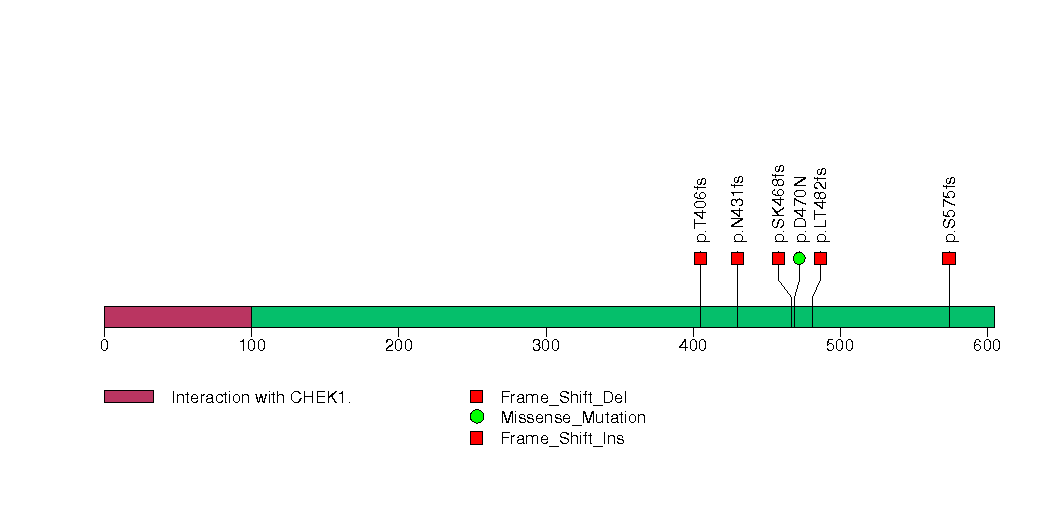
Figure S12. This figure depicts the distribution of mutations and mutation types across the PRMT8 significant gene.
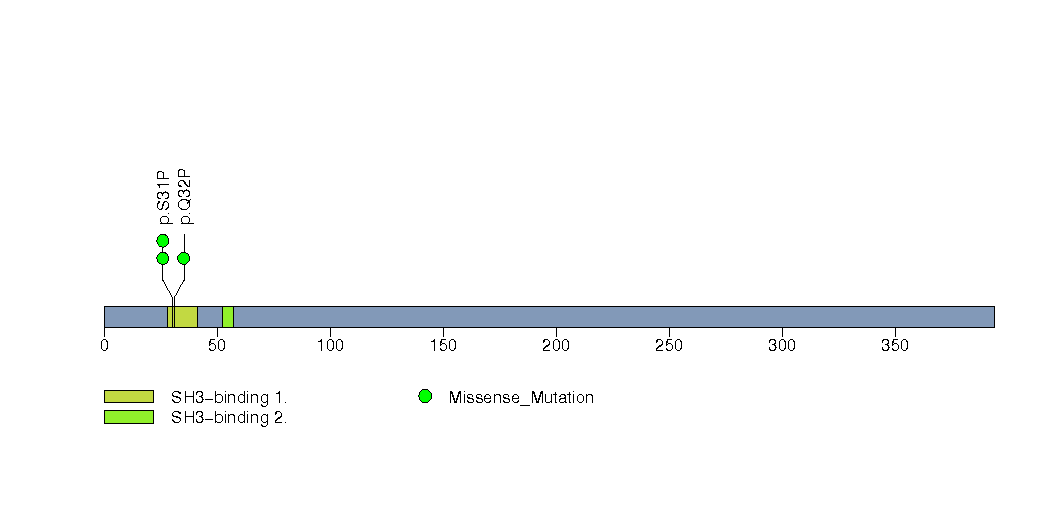
Figure S13. This figure depicts the distribution of mutations and mutation types across the KRTAP4-11 significant gene.
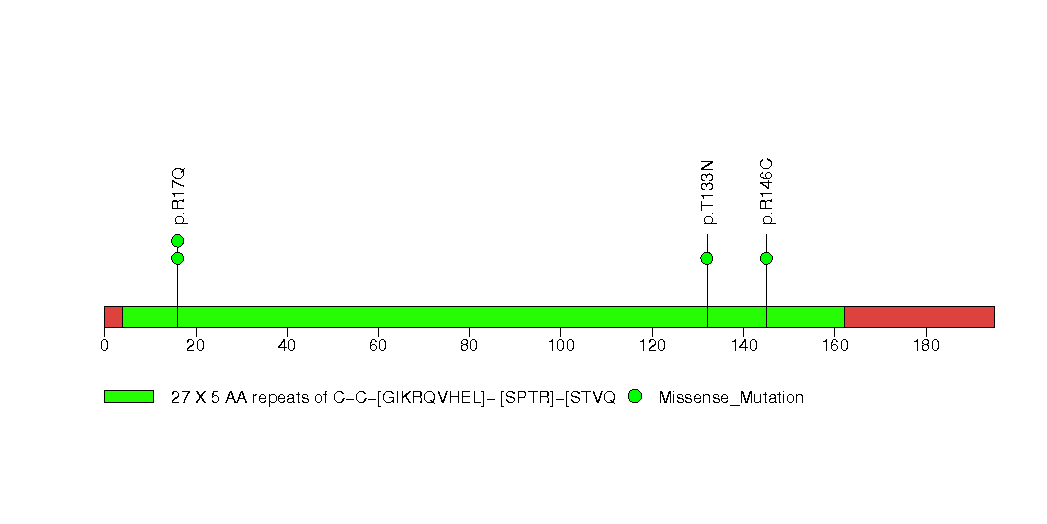
Figure S14. This figure depicts the distribution of mutations and mutation types across the AKT1 significant gene.
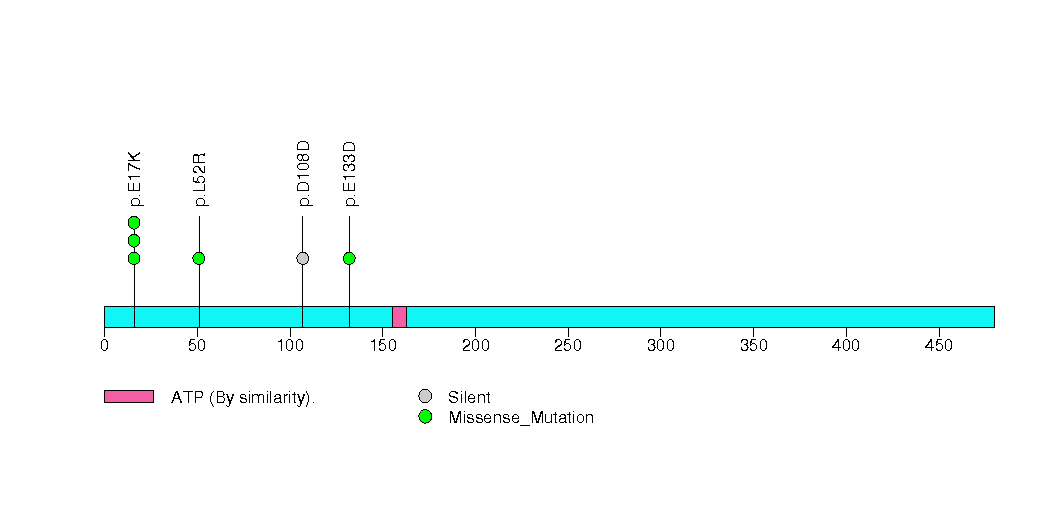
Figure S15. This figure depicts the distribution of mutations and mutation types across the ABL1 significant gene.
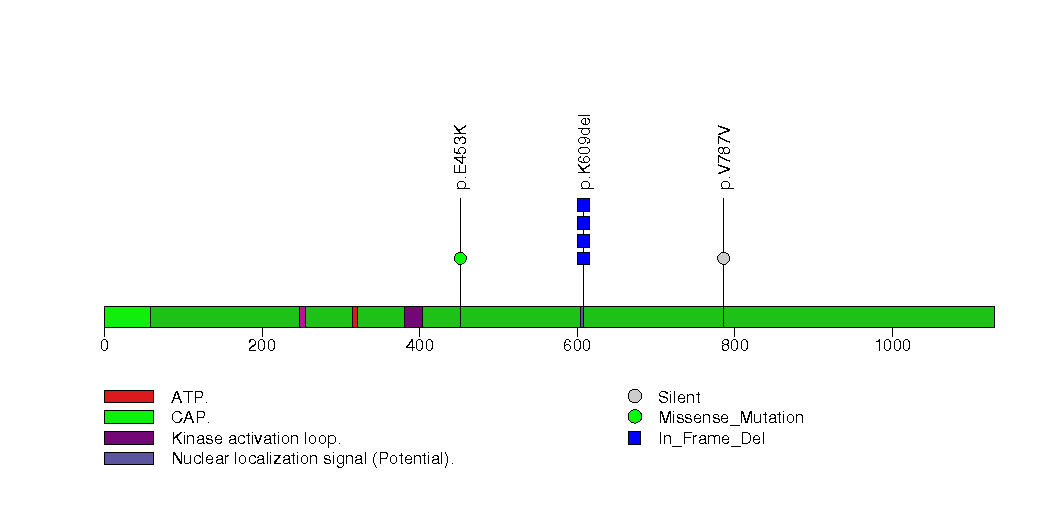
Figure S16. This figure depicts the distribution of mutations and mutation types across the COL5A3 significant gene.
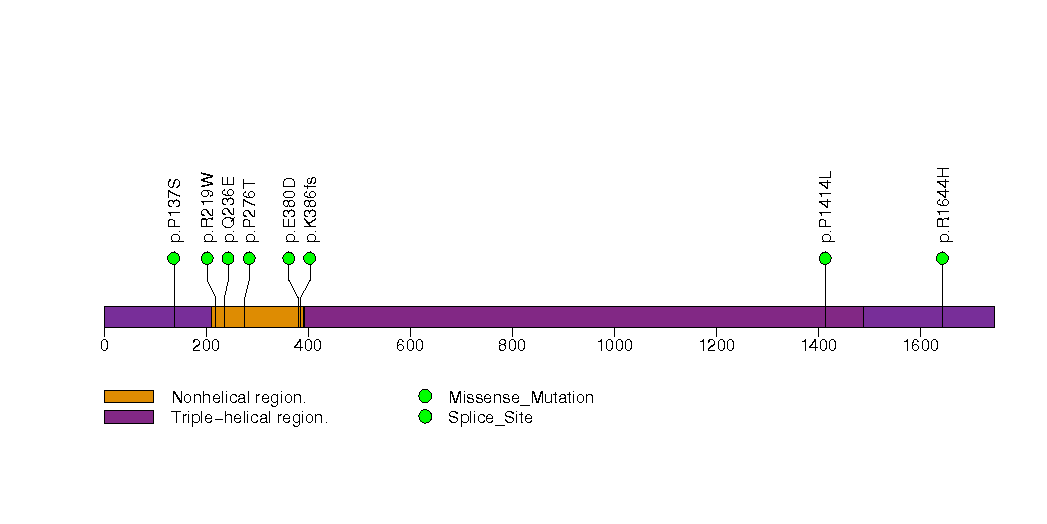
Figure S17. This figure depicts the distribution of mutations and mutation types across the KRAS significant gene.
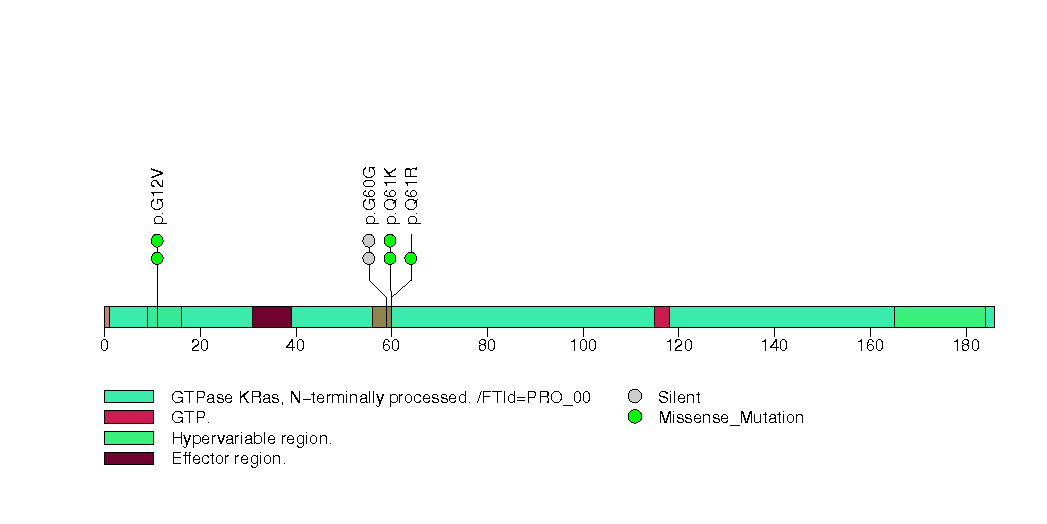
Figure S18. This figure depicts the distribution of mutations and mutation types across the NLRP6 significant gene.
Figure S19. This figure depicts the distribution of mutations and mutation types across the SLC31A2 significant gene.
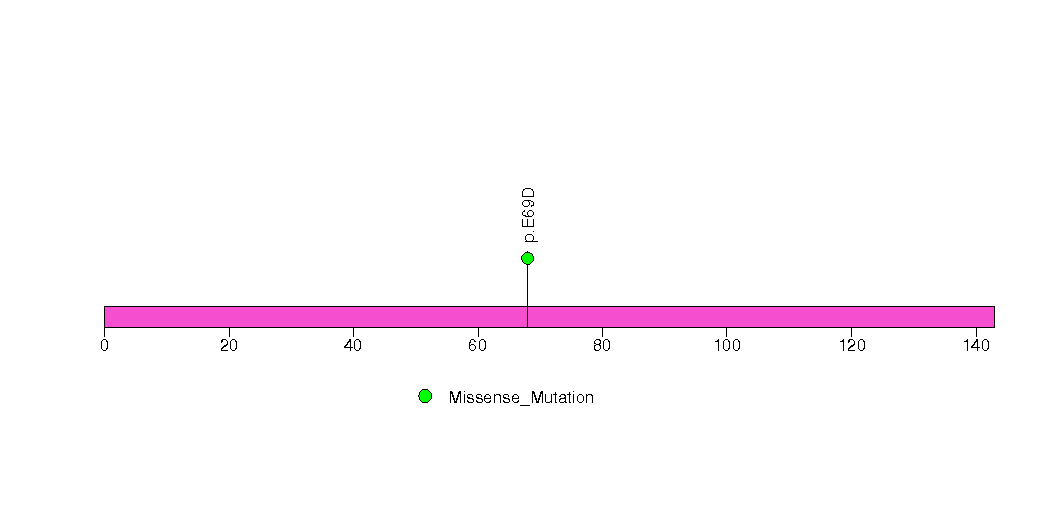
Figure S20. This figure depicts the distribution of mutations and mutation types across the ZNF578 significant gene.
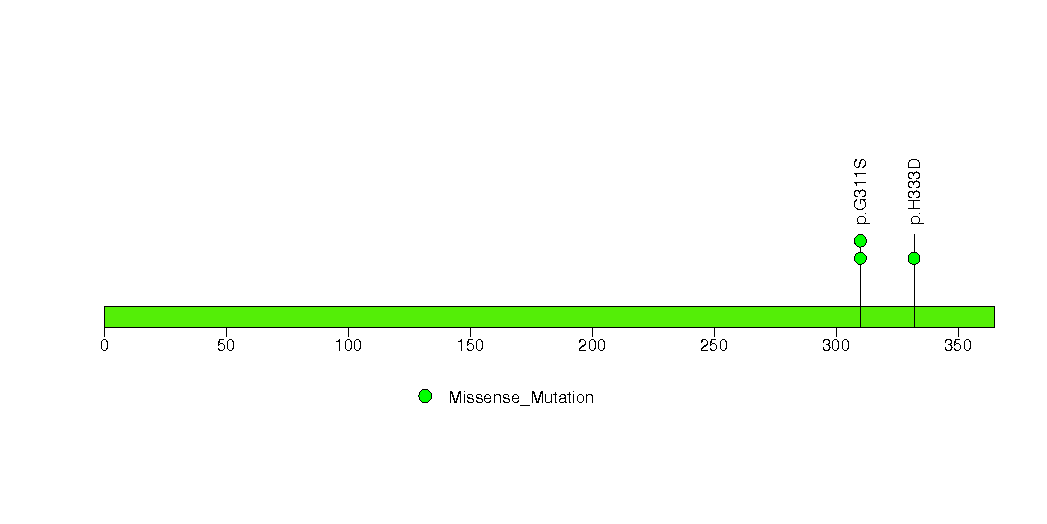
Figure S21. This figure depicts the distribution of mutations and mutation types across the RANBP9 significant gene.
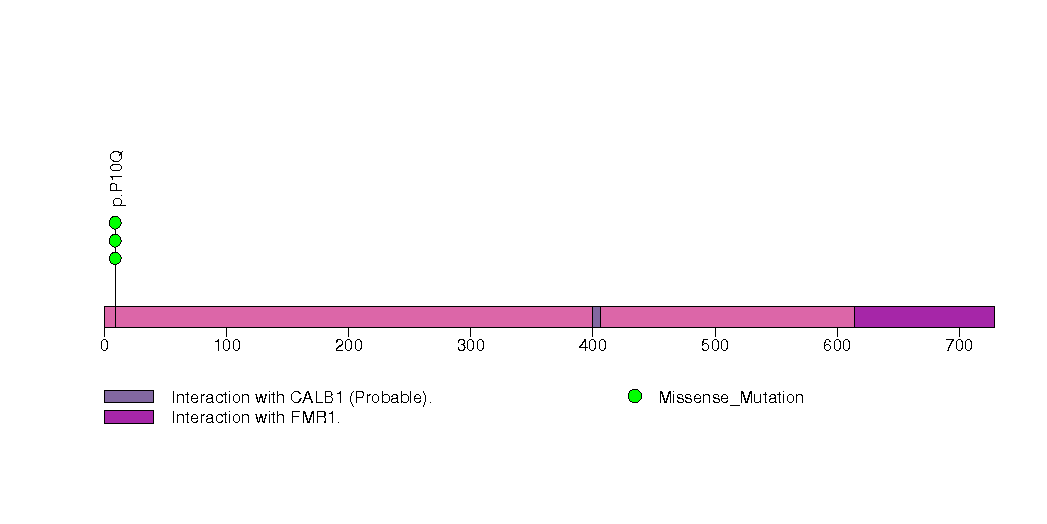
Figure S22. This figure depicts the distribution of mutations and mutation types across the ANKRD36 significant gene.
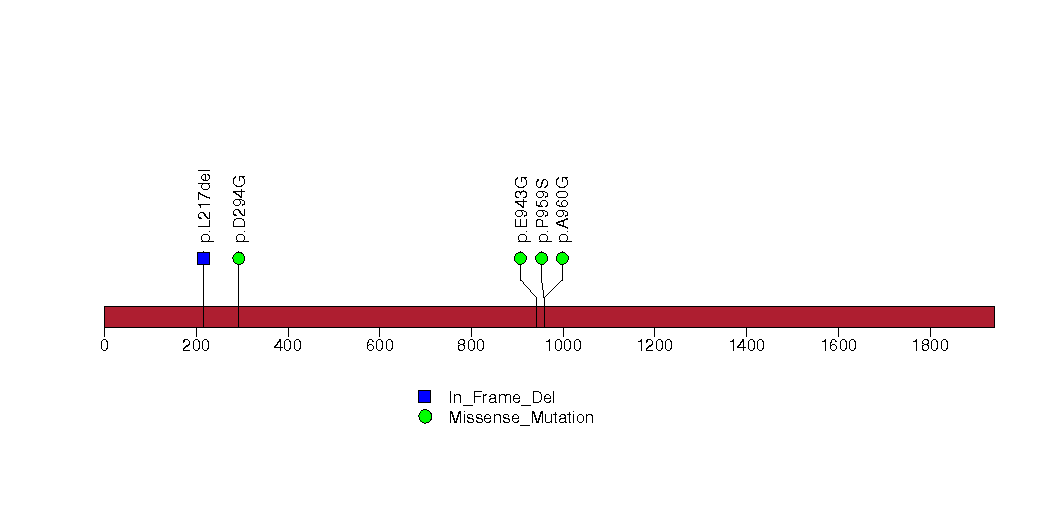
Figure S23. This figure depicts the distribution of mutations and mutation types across the SLA significant gene.
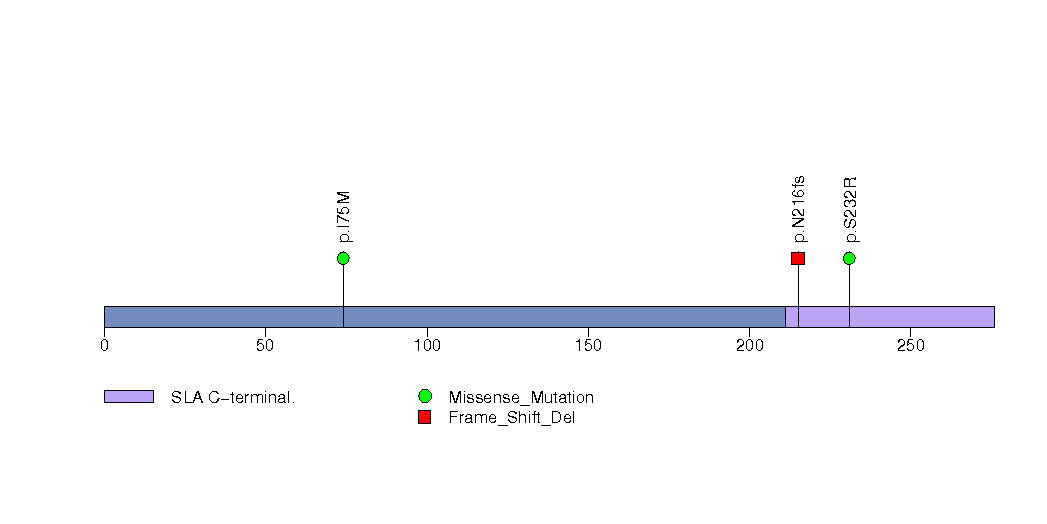
Figure S24. This figure depicts the distribution of mutations and mutation types across the S100A7 significant gene.
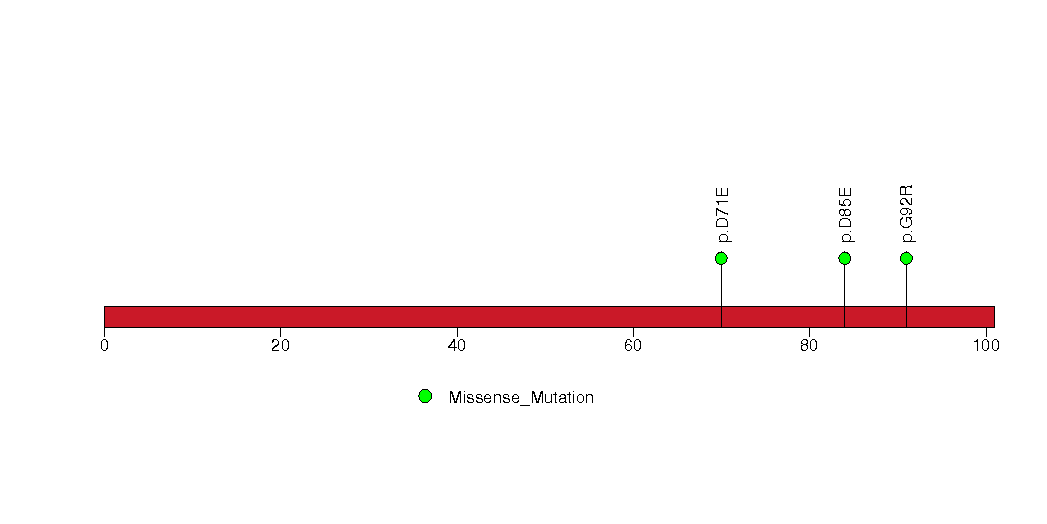
Figure S25. This figure depicts the distribution of mutations and mutation types across the SPTA1 significant gene.
In this analysis, COSMIC is used as a filter to increase power by restricting the territory of each gene. Cosmic version: v48.
Table 4. Get Full Table Significantly mutated genes (COSMIC territory only). To access the database please go to: COSMIC. Number of significant genes found: 16. Number of genes displayed: 10
| rank | gene | description | n | cos | n_cos | N_cos | cos_ev | p | q |
|---|---|---|---|---|---|---|---|---|---|
| 1 | HRAS | v-Ha-ras Harvey rat sarcoma viral oncogene homolog | 17 | 19 | 17 | 9424 | 3536 | 3.3e-13 | 1.3e-09 |
| 2 | NRAS | neuroblastoma RAS viral (v-ras) oncogene homolog | 40 | 33 | 40 | 16368 | 51920 | 5.8e-13 | 1.3e-09 |
| 3 | BRAF | v-raf murine sarcoma viral oncogene homolog B1 | 291 | 89 | 290 | 44144 | 4168112 | 1.5e-12 | 2.3e-09 |
| 4 | KRAS | v-Ki-ras2 Kirsten rat sarcoma viral oncogene homolog | 5 | 52 | 5 | 25792 | 29804 | 3.7e-12 | 4.1e-09 |
| 5 | PRNP | prion protein (p27-30) (Creutzfeldt-Jakob disease, Gerstmann-Strausler-Scheinker syndrome, fatal familial insomnia) | 2 | 1 | 2 | 496 | 2 | 3e-08 | 0.000027 |
| 6 | PIK3CA | phosphoinositide-3-kinase, catalytic, alpha polypeptide | 3 | 220 | 3 | 109120 | 51 | 0.000025 | 0.019 |
| 7 | TP53 | tumor protein p53 | 4 | 356 | 3 | 176576 | 68 | 0.0001 | 0.067 |
| 8 | C4BPA | complement component 4 binding protein, alpha | 1 | 1 | 1 | 496 | 1 | 0.00024 | 0.069 |
| 9 | CNKSR1 | connector enhancer of kinase suppressor of Ras 1 | 2 | 1 | 1 | 496 | 1 | 0.00024 | 0.069 |
| 10 | PCGF2 | polycomb group ring finger 2 | 2 | 1 | 1 | 496 | 1 | 0.00024 | 0.069 |
Note:
n - number of (nonsilent) mutations in this gene across the individual set.
cos = number of unique mutated sites in this gene in COSMIC
n_cos = overlap between n and cos.
N_cos = number of individuals times cos.
cos_ev = total evidence: number of reports in COSMIC for mutations seen in this gene.
p = p-value for seeing the observed amount of overlap in this gene)
q = q-value, False Discovery Rate (Benjamini-Hochberg procedure)
Table 5. Get Full Table A Ranked List of Significantly Mutated Genesets. (Source: MSigDB GSEA Cannonical Pathway Set).Number of significant genesets found: 90. Number of genesets displayed: 10
| rank | geneset | description | genes | N_genes | mut_tally | N | n | npat | nsite | nsil | n1 | n2 | n3 | n4 | n5 | n6 | p_ns_s | p | q |
|---|---|---|---|---|---|---|---|---|---|---|---|---|---|---|---|---|---|---|---|
| 1 | HSA04010_MAPK_SIGNALING_PATHWAY | Genes involved in MAPK signaling pathway | ACVR1B, ACVR1C, AKT1, AKT2, AKT3, ARRB1, ARRB2, ATF2, ATF4, BDNF, BRAF, CACNA1A, CACNA1B, CACNA1C, CACNA1D, CACNA1E, CACNA1F, CACNA1G, CACNA1H, CACNA1I, CACNA1S, CACNA2D1, CACNA2D2, CACNA2D3, CACNA2D4, CACNB1, CACNB2, CACNB3, CACNB4, CACNG1, CACNG2, CACNG3, CACNG4, CACNG5, CACNG6, CACNG7, CACNG8, CASP3, CD14, CDC25B, CDC42, CHP, CHUK, CRK, CRKL, DAXX, DDIT3, DUSP1, DUSP10, DUSP14, DUSP16, DUSP2, DUSP3, DUSP4, DUSP5, DUSP6, DUSP7, DUSP8, DUSP9, ECSIT, EGF, EGFR, ELK1, ELK4, EVI1, FAS, FASLG, FGF1, FGF10, FGF11, FGF12, FGF13, FGF14, FGF16, FGF17, FGF18, FGF19, FGF2, FGF20, FGF21, FGF22, FGF23, FGF3, FGF4, FGF5, FGF6, FGF7, FGF8, FGF9, FGFR1, FGFR2, FGFR3, FGFR4, FLNA, FLNB, FLNC, FOS, GADD45A, GADD45B, GADD45G, GNA12, GNG12, GRB2, HRAS, IKBKB, IKBKG, IL1A, IL1B, IL1R1, IL1R2, JUN, JUND, KRAS, LOC653852, MAP2K1, MAP2K1IP1, MAP2K2, MAP2K3, MAP2K4, MAP2K5, MAP2K6, MAP2K7, MAP3K1, MAP3K10, MAP3K12, MAP3K13, MAP3K14, MAP3K2, MAP3K3, MAP3K4, MAP3K5, MAP3K6, MAP3K7, MAP3K7IP1, MAP3K7IP2, MAP3K8, MAP4K1, MAP4K2, MAP4K3, MAP4K4, MAPK1, MAPK10, MAPK11, MAPK12, MAPK13, MAPK14, MAPK3, MAPK7, MAPK8, MAPK8IP1, MAPK8IP2, MAPK8IP3, MAPK9, MAPKAPK2, MAPKAPK3, MAPKAPK5, MAPT, MAX, MEF2C, MKNK1, MKNK2, MOS, MRAS, MYC, NF1, NFATC2, NFATC4, NFKB1, NFKB2, NGFB, NLK, NR4A1, NRAS, NTF3, NTF5, NTRK1, NTRK2, PAK1, PAK2, PDGFA, PDGFB, PDGFRA, PDGFRB, PLA2G10, PLA2G12A, PLA2G12B, PLA2G1B, PLA2G2A, PLA2G2D, PLA2G2E, PLA2G2F, PLA2G3, PLA2G4A, PLA2G5, PLA2G6, PPM1A, PPM1B, PPP3CA, PPP3CB, PPP3CC, PPP3R1, PPP3R2, PPP5C, PRKACA, PRKACB, PRKACG, PRKCA, PRKCB1, PRKCG, PRKX, PRKY, PTPN5, PTPN7, PTPRR, RAC1, RAC2, RAC3, RAF1, RAP1A, RAP1B, RAPGEF2, RASA1, RASA2, RASGRF1, RASGRF2, RASGRP1, RASGRP2, RASGRP3, RASGRP4, RPS6KA1, RPS6KA2, RPS6KA3, RPS6KA4, RPS6KA5, RPS6KA6, RRAS, RRAS2, SOS1, SOS2, SRF, STK3, STK4, STMN1, TAOK1, TAOK2, TAOK3, TGFB1, TGFB2, TGFB3, TGFBR1, TGFBR2, TNF, TNFRSF1A, TP53, TRAF2, TRAF6, ZAK | 247 | AKT1(5), AKT2(1), AKT3(1), ARRB1(1), ARRB2(1), BRAF(291), CACNA1A(2), CACNA1B(3), CACNA1C(2), CACNA1D(4), CACNA1E(5), CACNA1G(3), CACNA1H(1), CACNA1S(1), CACNA2D1(5), CACNA2D3(1), CACNA2D4(2), CACNB3(1), CACNG7(1), CDC42(1), DUSP5(1), DUSP7(1), ECSIT(2), FGF20(1), FGF5(1), FGF7(1), FGFR2(1), FLNA(1), FLNC(4), HRAS(17), IL1R1(2), JUN(1), KRAS(5), MAP2K1(1), MAP2K6(1), MAP3K1(3), MAP3K3(3), MAP3K6(1), MAP3K8(1), MAP4K4(1), MAPK10(1), MAPK8IP2(1), MAPKAPK3(1), MYC(1), NF1(2), NFATC4(3), NRAS(40), PDGFRB(1), PLA2G2A(1), PLA2G5(2), PLA2G6(1), PTPRR(2), RAP1A(1), RASA1(2), RASGRF2(2), RASGRP1(1), RPS6KA1(1), RPS6KA4(1), SOS1(2), SOS2(2), TAOK2(2), TAOK3(1), TGFBR1(1), TGFBR2(1), TNFRSF1A(1), TP53(4) | 210566400 | 459 | 378 | 114 | 39 | 20 | 26 | 60 | 330 | 23 | 0 | <1.00e-15 | <1.00e-15 | <6.84e-14 |
| 2 | HSA04730_LONG_TERM_DEPRESSION | Genes involved in long-term depression | ARAF, BRAF, C7orf16, CACNA1A, CRH, CRHR1, GNA11, GNA12, GNA13, GNAI1, GNAI2, GNAI3, GNAO1, GNAQ, GNAS, GNAZ, GRIA1, GRIA2, GRIA3, GRID2, GRM1, GRM5, GUCY1A2, GUCY1A3, GUCY1B3, GUCY2C, GUCY2D, GUCY2F, HRAS, IGF1, IGF1R, ITPR1, ITPR2, ITPR3, KRAS, LYN, MAP2K1, MAP2K2, MAPK1, MAPK3, NOS1, NOS2A, NOS3, NPR1, NPR2, NRAS, PLA2G10, PLA2G12A, PLA2G12B, PLA2G1B, PLA2G2A, PLA2G2D, PLA2G2E, PLA2G2F, PLA2G3, PLA2G4A, PLA2G5, PLA2G6, PLCB1, PLCB2, PLCB3, PLCB4, PPP2CA, PPP2CB, PPP2R1A, PPP2R1B, PPP2R2A, PPP2R2B, PPP2R2C, PRKCA, PRKCB1, PRKCG, PRKG1, PRKG2, RAF1, RYR1 | 74 | BRAF(291), CACNA1A(2), CRH(1), CRHR1(1), GNAS(3), GRIA1(1), GRIA2(2), GRID2(1), GRM1(3), GUCY1A3(1), HRAS(17), IGF1R(3), ITPR1(2), ITPR2(6), KRAS(5), LYN(1), MAP2K1(1), NOS1(1), NPR1(2), NRAS(40), PLA2G2A(1), PLA2G5(2), PLA2G6(1), PLCB1(1), PLCB2(1), PLCB3(1), PLCB4(1), PPP2R1A(3), PPP2R1B(1), PPP2R2B(1), PRKG1(1), RYR1(8) | 81240079 | 406 | 368 | 61 | 13 | 15 | 8 | 52 | 323 | 8 | 0 | <1.00e-15 | <1.00e-15 | <6.84e-14 |
| 3 | HSA04720_LONG_TERM_POTENTIATION | Genes involved in long-term potentiation | ADCY1, ADCY8, ARAF, ATF4, BRAF, CACNA1C, CALM1, CALM2, CALM3, CALML3, CALML6, CAMK2A, CAMK2B, CAMK2D, CAMK2G, CAMK4, CHP, CREBBP, EP300, GNAQ, GRIA1, GRIA2, GRIN1, GRIN2A, GRIN2B, GRIN2C, GRIN2D, GRM1, GRM5, HRAS, ITPR1, ITPR2, ITPR3, KRAS, MAP2K1, MAP2K2, MAPK1, MAPK3, NRAS, PLCB1, PLCB2, PLCB3, PLCB4, PPP1CA, PPP1CB, PPP1CC, PPP1R12A, PPP1R1A, PPP3CA, PPP3CB, PPP3CC, PPP3R1, PPP3R2, PRKACA, PRKACB, PRKACG, PRKCA, PRKCB1, PRKCG, PRKX, PRKY, RAF1, RAP1A, RAP1B, RAPGEF3, RPS6KA1, RPS6KA2, RPS6KA3, RPS6KA6 | 67 | ADCY8(1), BRAF(291), CACNA1C(2), CALML6(1), CAMK2A(1), CAMK2B(1), CREBBP(1), GRIA1(1), GRIA2(2), GRIN2A(2), GRIN2B(4), GRIN2D(3), GRM1(3), HRAS(17), ITPR1(2), ITPR2(6), KRAS(5), MAP2K1(1), NRAS(40), PLCB1(1), PLCB2(1), PLCB3(1), PLCB4(1), RAP1A(1), RPS6KA1(1) | 73321784 | 390 | 363 | 47 | 14 | 12 | 7 | 51 | 312 | 8 | 0 | <1.00e-15 | <1.00e-15 | <6.84e-14 |
| 4 | HSA04510_FOCAL_ADHESION | Genes involved in focal adhesion | ACTB, ACTG1, ACTN1, ACTN2, ACTN3, ACTN4, AKT1, AKT2, AKT3, ARHGAP5, BAD, BCAR1, BCL2, BIRC2, BIRC3, BIRC4, BRAF, CAPN2, CAV1, CAV2, CAV3, CCND1, CCND2, CCND3, CDC42, CHAD, COL11A1, COL11A2, COL1A1, COL1A2, COL2A1, COL3A1, COL4A1, COL4A2, COL4A4, COL4A6, COL5A1, COL5A2, COL5A3, COL6A1, COL6A2, COL6A3, COL6A6, COMP, CRK, CRKL, CTNNB1, DIAPH1, DOCK1, EGF, EGFR, ELK1, ERBB2, FARP2, FIGF, FLNA, FLNB, FLNC, FLT1, FN1, FYN, GRB2, GRLF1, GSK3B, HGF, HRAS, IBSP, IGF1, IGF1R, ILK, ITGA1, ITGA10, ITGA11, ITGA2, ITGA2B, ITGA3, ITGA4, ITGA5, ITGA6, ITGA7, ITGA8, ITGA9, ITGAV, ITGB1, ITGB3, ITGB4, ITGB5, ITGB6, ITGB7, ITGB8, JUN, KDR, LAMA1, LAMA2, LAMA3, LAMA4, LAMA5, LAMB1, LAMB2, LAMB3, LAMB4, LAMC1, LAMC2, LAMC3, LOC653852, MAP2K1, MAPK1, MAPK10, MAPK3, MAPK8, MAPK9, MET, MLCK, MRCL3, MRLC2, MYL2, MYL5, MYL7, MYL8P, MYL9, MYLC2PL, MYLK, MYLK2, MYLPF, PAK1, PAK2, PAK3, PAK4, PAK6, PAK7, PARVA, PARVB, PARVG, PDGFA, PDGFB, PDGFC, PDGFD, PDGFRA, PDGFRB, PDPK1, PGF, PIK3CA, PIK3CB, PIK3CD, PIK3CG, PIK3R1, PIK3R2, PIK3R3, PIK3R5, PIP5K1C, PPP1CA, PPP1CB, PPP1CC, PPP1R12A, PRKCA, PRKCB1, PRKCG, PTEN, PTK2, PXN, RAC1, RAC2, RAC3, RAF1, RAP1A, RAP1B, RAPGEF1, RELN, RHOA, ROCK1, ROCK2, SHC1, SHC2, SHC3, SHC4, SOS1, SOS2, SPP1, SRC, THBS1, THBS2, THBS3, THBS4, TLN1, TLN2, TNC, TNN, TNR, TNXB, VASP, VAV1, VAV2, VAV3, VCL, VEGFA, VEGFB, VEGFC, VTN, VWF, ZYX | 192 | ACTB(1), ACTG1(1), AKT1(5), AKT2(1), AKT3(1), BAD(1), BRAF(291), CDC42(1), COL11A1(1), COL11A2(2), COL1A1(1), COL2A1(1), COL3A1(2), COL4A1(3), COL4A2(2), COL4A4(2), COL4A6(1), COL5A1(4), COL5A3(8), COL6A2(3), COL6A3(2), COL6A6(3), CTNNB1(2), ERBB2(1), FARP2(1), FIGF(1), FLNA(1), FLNC(4), FN1(3), FYN(1), HRAS(17), IGF1R(3), ITGA10(3), ITGA3(2), ITGA7(2), ITGA8(1), ITGA9(1), ITGAV(1), ITGB1(2), ITGB3(1), ITGB8(1), JUN(1), KDR(2), LAMA2(1), LAMA3(3), LAMA4(4), LAMA5(2), LAMB1(1), LAMB2(1), LAMB4(1), LAMC1(2), LAMC2(1), LAMC3(2), MAP2K1(1), MAPK10(1), MET(2), MYLK(4), PAK3(2), PAK7(2), PDGFRB(1), PIK3CA(3), PIK3CB(1), PIK3CD(2), PIK3CG(1), PIK3R1(2), PIK3R5(5), PTEN(2), RAP1A(1), RAPGEF1(2), RELN(2), SHC1(1), SOS1(2), SOS2(2), SRC(2), THBS1(1), THBS2(2), THBS3(1), THBS4(1), TLN1(1), TLN2(3), TNC(1), TNN(1), TNR(3), TNXB(3), VAV2(1), VCL(2), VEGFA(1), VTN(1), VWF(1), ZYX(1) | 273450375 | 471 | 354 | 166 | 55 | 29 | 34 | 29 | 351 | 27 | 1 | 4.12e-11 | <1.00e-15 | <6.84e-14 |
| 5 | HSA04320_DORSO_VENTRAL_AXIS_FORMATION | Genes involved in dorso-ventral axis formation | BRAF, CPEB1, EGFR, ERBB2, ERBB4, ETS1, ETS2, ETV6, ETV7, FMN2, GRB2, KRAS, MAP2K1, MAPK1, MAPK3, NOTCH1, NOTCH2, NOTCH3, NOTCH4, PIWIL1, PIWIL2, PIWIL3, PIWIL4, RAF1, SOS1, SOS2, SPIRE1, SPIRE2 | 28 | BRAF(291), ERBB2(1), ERBB4(3), ETS1(2), KRAS(5), MAP2K1(1), NOTCH2(1), NOTCH3(1), NOTCH4(4), PIWIL1(1), PIWIL2(2), SOS1(2), SOS2(2) | 38572470 | 316 | 301 | 26 | 11 | 2 | 4 | 7 | 300 | 3 | 0 | 2.66e-15 | <1.00e-15 | <6.84e-14 |
| 6 | ST_ADRENERGIC | Adrenergic receptors respond to epinephrine and norepinephrine signaling. | AKT1, APC, AR, ASAH1, BF, BRAF, CAMP, CCL13, CCL15, CCL16, DAG1, EGFR, GAS, GNA11, GNA15, GNAI1, GNAQ, ITPKA, ITPKB, ITPR1, ITPR2, ITPR3, KCNJ3, KCNJ5, KCNJ9, MAPK1, MAPK10, MAPK14, PHKA2, PIK3CA, PIK3CD, PIK3R1, PITX2, PTX1, PTX3, RAF1, SRC | 34 | AKT1(5), APC(3), BRAF(291), CAMP(1), ITPR1(2), ITPR2(6), KCNJ9(1), MAPK10(1), PHKA2(3), PIK3CA(3), PIK3CD(2), PIK3R1(2), PITX2(2), SRC(2) | 39418229 | 324 | 301 | 34 | 8 | 7 | 5 | 2 | 302 | 8 | 0 | <1.00e-15 | <1.00e-15 | <6.84e-14 |
| 7 | ST_G_ALPHA_I_PATHWAY | Gi and Go proteins are members of the same family that transduce cellular signals through both their alpha and beta subunits. | AKT1, AKT2, AKT3, ASAH1, BF, BRAF, DAG1, DRD2, EGFR, EPHB2, GRB2, ITPKA, ITPKB, ITPR1, ITPR2, ITPR3, KCNJ3, KCNJ5, KCNJ9, MAPK1, PI3, PIK3CB, PITX2, PLCB1, PLCB2, PLCB3, PLCB4, RAF1, RAP1GA1, RGS20, SHC1, SOS1, SOS2, SRC, STAT3, TERF2IP | 34 | AKT1(5), AKT2(1), AKT3(1), BRAF(291), ITPR1(2), ITPR2(6), KCNJ9(1), PIK3CB(1), PITX2(2), PLCB1(1), PLCB2(1), PLCB3(1), PLCB4(1), SHC1(1), SOS1(2), SOS2(2), SRC(2) | 43042654 | 321 | 299 | 31 | 6 | 8 | 7 | 3 | 300 | 3 | 0 | <1.00e-15 | <1.00e-15 | <6.84e-14 |
| 8 | HSA04150_MTOR_SIGNALING_PATHWAY | Genes involved in mTOR signaling pathway | AKT1, AKT2, AKT3, BRAF, CAB39, DDIT4, EIF4B, EIF4EBP1, FIGF, FRAP1, GBL, HIF1A, IGF1, INS, KIAA1303, LYK5, MAPK1, MAPK3, PDPK1, PGF, PIK3CA, PIK3CB, PIK3CD, PIK3CG, PIK3R1, PIK3R2, PIK3R3, PIK3R5, PRKAA1, PRKAA2, RHEB, RICTOR, RPS6, RPS6KA1, RPS6KA2, RPS6KA3, RPS6KA6, RPS6KB1, RPS6KB2, STK11, TSC1, TSC2, ULK1, ULK2, ULK3, VEGFA, VEGFB, VEGFC | 44 | AKT1(5), AKT2(1), AKT3(1), BRAF(291), DDIT4(1), FIGF(1), HIF1A(1), PIK3CA(3), PIK3CB(1), PIK3CD(2), PIK3CG(1), PIK3R1(2), PIK3R5(5), RICTOR(1), RPS6KA1(1), RPS6KB2(1), ULK3(1), VEGFA(1) | 39206098 | 320 | 296 | 30 | 10 | 4 | 6 | 5 | 297 | 8 | 0 | <1.00e-15 | <1.00e-15 | <6.84e-14 |
| 9 | TRKAPATHWAY | Nerve growth factor (NGF) promotes neuronal survival and proliferation by binding its receptor TrkA, which activates PI3K/AKT, Ras, and the MAP kinase pathway. | AKT1, DPM2, GRB2, HRAS, KLK2, NGFB, NTRK1, PIK3CA, PIK3R1, PLCG1, PRKCA, PRKCB1, SHC1, SOS1 | 12 | AKT1(5), HRAS(17), PIK3CA(3), PIK3R1(2), PLCG1(1), SHC1(1), SOS1(2) | 11466569 | 31 | 31 | 14 | 1 | 2 | 4 | 14 | 9 | 2 | 0 | 0.000739 | <1.00e-15 | <6.84e-14 |
| 10 | ST_G_ALPHA_S_PATHWAY | The G-alpha-s protein activates adenylyl cyclases, which catalyze cAMP formation. | ASAH1, BF, BFAR, BRAF, CAMP, CREB1, CREB3, CREB5, EPAC, GAS, GRF2, MAPK1, RAF1, SNX13, SRC, TERF2IP | 12 | BFAR(2), BRAF(291), CAMP(1), SNX13(1), SRC(2) | 8121202 | 297 | 291 | 9 | 4 | 3 | 0 | 2 | 289 | 3 | 0 | <1.00e-15 | 1.22e-15 | 7.52e-14 |
Table 6. Get Full Table A Ranked List of Significantly Mutated Genesets (Excluding Significantly Mutated Genes). Number of significant genesets found: 5. Number of genesets displayed: 10
| rank | geneset | description | genes | N_genes | mut_tally | N | n | npat | nsite | nsil | n1 | n2 | n3 | n4 | n5 | n6 | p_ns_s | p | q |
|---|---|---|---|---|---|---|---|---|---|---|---|---|---|---|---|---|---|---|---|
| 1 | PLK3PATHWAY | Active Plk3 phosphorylates CDC25c, blocking the G2/M transition, and phosphorylates p53 to induce apoptosis. | ATM, ATR, CDC25C, CHEK1, CHEK2, CNK, TP53, YWHAH | 7 | ATM(7), ATR(3), CHEK1(1), CHEK2(4), TP53(4) | 11753511 | 19 | 19 | 19 | 1 | 0 | 2 | 3 | 6 | 8 | 0 | 0.053 | 6.2e-06 | 0.0038 |
| 2 | P53PATHWAY | p53 induces cell cycle arrest or apoptosis under conditions of DNA damage. | APAF1, ATM, BAX, BCL2, CCND1, CCNE1, CDK2, CDK4, CDKN1A, E2F1, GADD45A, MDM2, PCNA, RB1, TIMP3, TP53 | 16 | APAF1(4), ATM(7), CDKN1A(1), RB1(2), TP53(4) | 13321231 | 18 | 18 | 18 | 0 | 1 | 4 | 3 | 4 | 6 | 0 | 0.0095 | 8e-05 | 0.025 |
| 3 | ARFPATHWAY | Cyclin-dependent kinase inhibitor 2A is a tumor suppressor that induces G1 arrest and can activate the p53 pathway, leading to G2/M arrest. | ABL1, CDKN2A, E2F1, MDM2, MYC, PIK3CA, PIK3R1, POLR1A, POLR1B, POLR1C, POLR1D, RAC1, RB1, TBX2, TP53, TWIST1 | 15 | CDKN2A(1), MYC(1), PIK3CA(3), PIK3R1(2), POLR1A(1), POLR1B(2), RB1(2), TBX2(1), TP53(4), TWIST1(1) | 13251283 | 18 | 18 | 18 | 0 | 3 | 1 | 1 | 4 | 9 | 0 | 0.0082 | 0.00022 | 0.035 |
| 4 | ATMPATHWAY | The tumor-suppressing protein kinase ATM responds to radiation-induced DNA damage by blocking cell-cycle progression and activating DNA repair. | ABL1, ATM, BRCA1, CDKN1A, CHEK1, CHEK2, GADD45A, JUN, MAPK8, MDM2, MRE11A, NBS1, NFKB1, NFKBIA, RAD50, RAD51, RBBP8, RELA, TP53, TP73 | 18 | ATM(7), BRCA1(1), CDKN1A(1), CHEK1(1), CHEK2(4), JUN(1), RAD51(1), TP53(4), TP73(3) | 20228606 | 23 | 22 | 23 | 1 | 1 | 6 | 4 | 6 | 6 | 0 | 0.012 | 0.00023 | 0.035 |
| 5 | ATRBRCAPATHWAY | BRCA1 and 2 block cell cycle progression in response to DNA damage and promote double-stranded break repair; mutations induce breast cancer susceptibility. | ATM, ATR, BRCA1, BRCA2, CHEK1, CHEK2, FANCA, FANCC, FANCD2, FANCE, FANCF, FANCG, HUS1, MRE11A, NBS1, RAD1, RAD17, RAD50, RAD51, RAD9A, TP53, TREX1 | 21 | ATM(7), ATR(3), BRCA1(1), BRCA2(3), CHEK1(1), CHEK2(4), FANCC(1), FANCD2(3), FANCF(1), FANCG(2), RAD17(2), RAD51(1), TP53(4), TREX1(1) | 32415292 | 34 | 32 | 33 | 3 | 0 | 6 | 7 | 10 | 11 | 0 | 0.018 | 0.00042 | 0.052 |
| 6 | RBPATHWAY | The ATM protein kinase recognizes DNA damage and blocks cell cycle progression by phosphorylating chk1 and p53, which normally inhibits Rb to allow G1/S transitions. | ATM, CDC2, CDC25A, CDC25B, CDC25C, CDK2, CDK4, CHEK1, MYT1, RB1, TP53, WEE1, YWHAH | 12 | ATM(7), CHEK1(1), MYT1(1), RB1(2), TP53(4), WEE1(1) | 12935159 | 16 | 15 | 16 | 1 | 1 | 3 | 2 | 4 | 6 | 0 | 0.095 | 0.0011 | 0.12 |
| 7 | SULFUR_METABOLISM | BPNT1, PAPSS1, PAPSS2, SULT1A2, SULT1A3, SULT1A3, SULT1A4, SULT1E1, SULT2A1, SUOX | 7 | PAPSS1(2), SULT1E1(1), SULT2A1(1), SUOX(3) | 4511431 | 7 | 7 | 7 | 0 | 1 | 1 | 0 | 1 | 4 | 0 | 0.18 | 0.0017 | 0.13 | |
| 8 | SA_PTEN_PATHWAY | PTEN is a tumor suppressor that dephosphorylates the lipid messenger phosphatidylinositol triphosphate. | AKT1, AKT2, AKT3, BPNT1, GRB2, ILK, MAPK1, MAPK3, PDK1, PIK3CA, PIK3CD, PIP3-E, PTEN, PTK2B, RBL2, SHC1, SOS1 | 15 | AKT2(1), AKT3(1), PIK3CA(3), PIK3CD(2), PTEN(2), PTK2B(2), RBL2(1), SHC1(1), SOS1(2) | 14325600 | 15 | 15 | 15 | 1 | 3 | 4 | 0 | 4 | 3 | 1 | 0.063 | 0.0017 | 0.13 |
| 9 | ST_PHOSPHOINOSITIDE_3_KINASE_PATHWAY | The phosphoinositide-3 kinase pathway produces the lipid second messenger PIP3 and regulates cell growth, survival, and movement. | A1BG, AKT1, AKT2, AKT3, BAD, BTK, CDKN2A, CSL4, DAF, DAPP1, FOXO1A, GRB2, GSK3A, GSK3B, IARS, IGFBP1, INPP5D, P14, PDK1, PIK3CA, PPP1R13B, PSCD3, PTEN, RPS6KA1, RPS6KA2, RPS6KA3, RPS6KB1, SFN, SHC1, SOS1, SOS2, TEC, YWHAB, YWHAE, YWHAG, YWHAH, YWHAQ, YWHAZ | 32 | AKT2(1), AKT3(1), BAD(1), CDKN2A(1), IARS(3), IGFBP1(1), INPP5D(1), PIK3CA(3), PPP1R13B(1), PTEN(2), RPS6KA1(1), SHC1(1), SOS1(2), SOS2(2), YWHAE(1), YWHAG(1) | 25875881 | 23 | 23 | 23 | 1 | 2 | 5 | 1 | 7 | 7 | 1 | 0.018 | 0.0024 | 0.16 |
| 10 | HSA00401_NOVOBIOCIN_BIOSYNTHESIS | Genes involved in novobiocin biosynthesis | GOT1, GOT2, TAT | 3 | GOT1(1), GOT2(2), TAT(1) | 1942591 | 4 | 4 | 4 | 0 | 1 | 0 | 0 | 2 | 1 | 0 | 0.49 | 0.009 | 0.55 |
In brief, we tabulate the number of mutations and the number of covered bases for each gene. The counts are broken down by mutation context category: four context categories that are discovered by MutSig, and one for indel and 'null' mutations, which include indels, nonsense mutations, splice-site mutations, and non-stop (read-through) mutations. For each gene, we calculate the probability of seeing the observed constellation of mutations, i.e. the product P1 x P2 x ... x Pm, or a more extreme one, given the background mutation rates calculated across the dataset. [1]
In addition to the links below, the full results of the analysis summarized in this report can also be downloaded programmatically using firehose_get, or interactively from either the Broad GDAC website or TCGA Data Coordination Center Portal.