This report serves to describe the mutational landscape and properties of a given individual set, as well as rank genes and genesets according to mutational significance. MutSig v2.0 was used to generate the results found in this report.
-
Working with individual set: BRCA-TP
-
Number of patients in set: 977
The input for this pipeline is a set of individuals with the following files associated for each:
-
An annotated .maf file describing the mutations called for the respective individual, and their properties.
-
A .wig file that contains information about the coverage of the sample.
-
MAF used for this analysis:BRCA-TP.final_analysis_set.maf
-
Blacklist used for this analysis: pancan_mutation_blacklist.v14.hg19.txt
-
Significantly mutated genes (q ≤ 0.1): 42
-
Mutations seen in COSMIC: 887
-
Significantly mutated genes in COSMIC territory: 19
-
Significantly mutated genesets: 111
-
Significantly mutated genesets: (excluding sig. mutated genes):0
-
Read 977 MAFs of type "maf1"
-
Total number of mutations in input MAFs: 89929
-
After removing 39 mutations outside chr1-24: 89890
-
After removing 1732 blacklisted mutations: 88158
-
After removing 6950 noncoding mutations: 81208
-
After collapsing adjacent/redundant mutations: 78029
-
Number of mutations before filtering: 78029
-
After removing 7347 mutations outside gene set: 70682
-
After removing 274 mutations outside category set: 70408
-
After removing 35 "impossible" mutations in
-
gene-patient-category bins of zero coverage: 62752
Table 1. Get Full Table Table representing breakdown of mutations by type.
| type | count |
|---|---|
| De_novo_Start_InFrame | 3 |
| De_novo_Start_OutOfFrame | 13 |
| Frame_Shift_Del | 2219 |
| Frame_Shift_Ins | 1578 |
| In_Frame_Del | 427 |
| In_Frame_Ins | 103 |
| Missense_Mutation | 43996 |
| Nonsense_Mutation | 3570 |
| Nonstop_Mutation | 52 |
| Silent | 16058 |
| Splice_Site | 2327 |
| Start_Codon_Del | 6 |
| Start_Codon_Ins | 4 |
| Start_Codon_SNP | 47 |
| Stop_Codon_Del | 2 |
| Stop_Codon_Ins | 3 |
| Total | 70408 |
Table 2. Get Full Table A breakdown of mutation rates per category discovered for this individual set.
| category | n | N | rate | rate_per_mb | relative_rate | exp_ns_s_ratio |
|---|---|---|---|---|---|---|
| *CpG->mut | 8384 | 1431991223 | 5.9e-06 | 5.9 | 3 | 2.5 |
| Tp*Cp(A/C/T)->mut | 15598 | 3343111034 | 4.7e-06 | 4.7 | 2.4 | 3.4 |
| (A/C/G)p*Cp(A/C/T)->mut | 9397 | 9075750236 | 1e-06 | 1 | 0.52 | 3.4 |
| A->mut | 10636 | 13648491865 | 7.8e-07 | 0.78 | 0.39 | 3.8 |
| indel+null | 10064 | 27499344358 | 3.7e-07 | 0.37 | 0.19 | NaN |
| double_null | 237 | 27499344358 | 8.6e-09 | 0.0086 | 0.0044 | NaN |
| Total | 54316 | 27499344358 | 2e-06 | 2 | 1 | 3.5 |
The x axis represents the samples. The y axis represents the exons, one row per exon, and they are sorted by average coverage across samples. For exons with exactly the same average coverage, they are sorted next by the %GC of the exon. (The secondary sort is especially useful for the zero-coverage exons at the bottom). If the figure is unpopulated, then full coverage is assumed (e.g. MutSig CV doesn't use WIGs and assumes full coverage).
Figure 1.
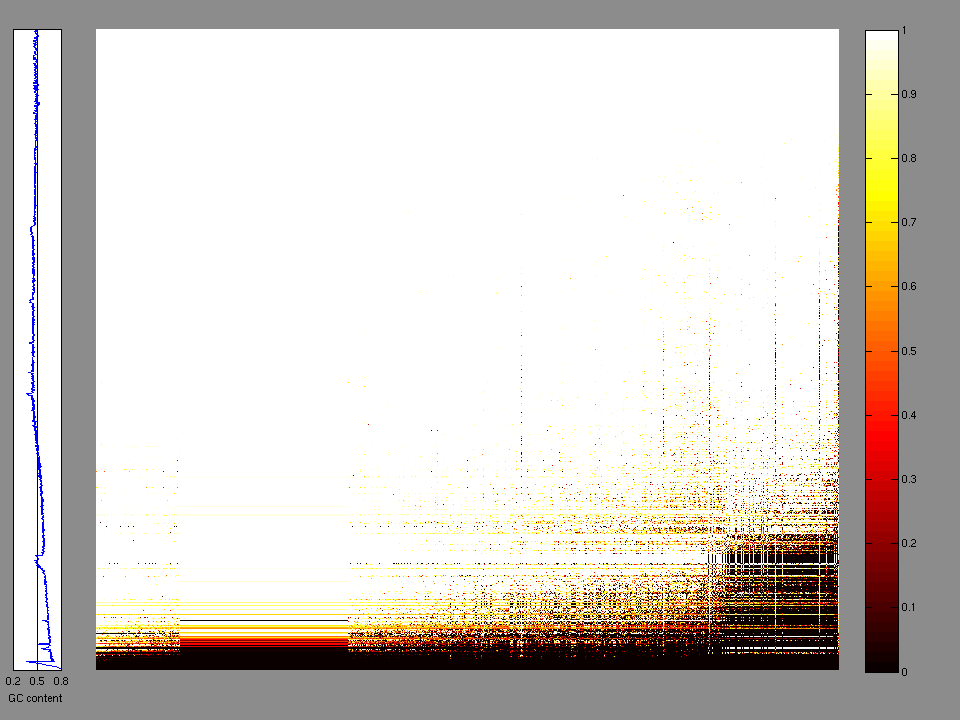
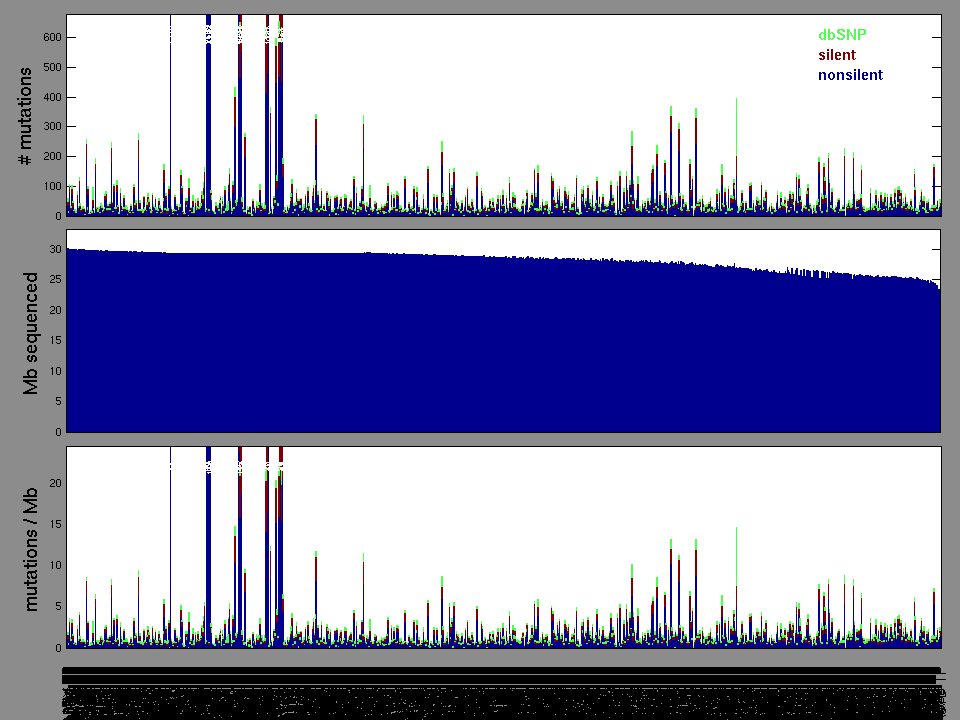
Figure 2. Patients counts and rates file used to generate this plot: BRCA-TP.patients.counts_and_rates.txt
The mutation spectrum is depicted in the lego plots below in which the 96 possible mutation types are subdivided into six large blocks, color-coded to reflect the base substitution type. Each large block is further subdivided into the 16 possible pairs of 5' and 3' neighbors, as listed in the 4x4 trinucleotide context legend. The height of each block corresponds to the mutation frequency for that kind of mutation (counts of mutations normalized by the base coverage in a given bin). The shape of the spectrum is a signature for dominant mutational mechanisms in different tumor types.
Figure 3. Get High-res Image SNV Mutation rate lego plot for entire set. Each bin is normalized by base coverage for that bin. Colors represent the six SNV types on the upper right. The three-base context for each mutation is labeled in the 4x4 legend on the lower right. The fractional breakdown of SNV counts is shown in the pie chart on the upper left. If this figure is blank, not enough information was provided in the MAF to generate it.
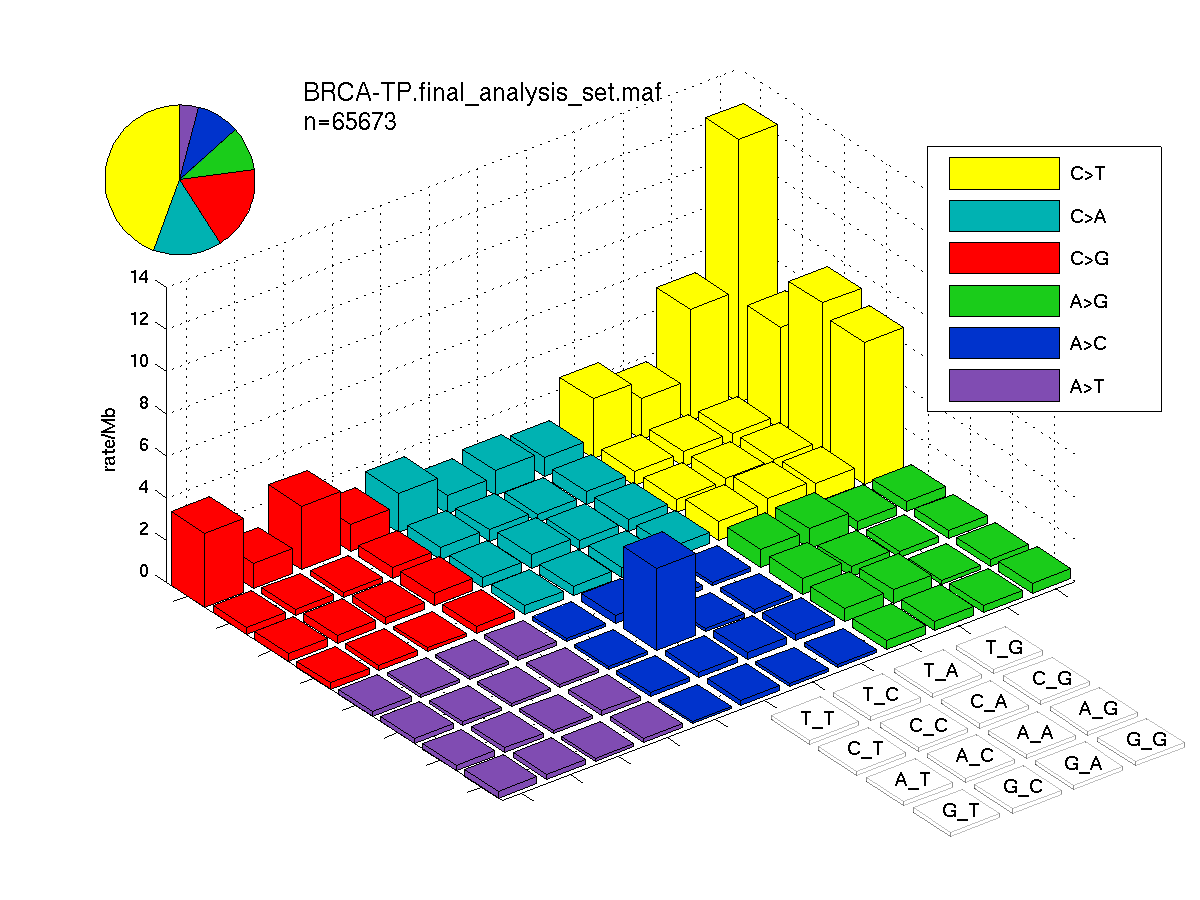
Figure 4. Get High-res Image SNV Mutation rate lego plots for 4 slices of mutation allele fraction (0<=AF<0.1, 0.1<=AF<0.25, 0.25<=AF<0.5, & 0.5<=AF) . The color code and three-base context legends are the same as the previous figure. If this figure is blank, not enough information was provided in the MAF to generate it.

Column Descriptions:
-
N = number of sequenced bases in this gene across the individual set
-
n = number of (nonsilent) mutations in this gene across the individual set
-
npat = number of patients (individuals) with at least one nonsilent mutation
-
nsite = number of unique sites having a non-silent mutation
-
nsil = number of silent mutations in this gene across the individual set
-
n1 = number of nonsilent mutations of type: *CpG->mut
-
n2 = number of nonsilent mutations of type: Tp*Cp(A/C/T)->mut
-
n3 = number of nonsilent mutations of type: (A/C/G)p*Cp(A/C/T)->mut
-
n4 = number of nonsilent mutations of type: A->mut
-
n5 = number of nonsilent mutations of type: indel+null
-
n6 = number of nonsilent mutations of type: double_null
-
p_classic = p-value for the observed amount of nonsilent mutations being elevated in this gene
-
p_ns_s = p-value for the observed nonsilent/silent ratio being elevated in this gene
-
p_cons = p-value for enrichment of mutations at evolutionarily most-conserved sites in gene
-
p_joint = p-value for clustering + conservation
-
p = p-value (overall)
-
q = q-value, False Discovery Rate (Benjamini-Hochberg procedure)
Table 3. Get Full Table A Ranked List of Significantly Mutated Genes. Number of significant genes found: 42. Number of genes displayed: 35. Click on a gene name to display its stick figure depicting the distribution of mutations and mutation types across the chosen gene (this feature may not be available for all significant genes).
| rank | gene | description | N | n | npat | nsite | nsil | n1 | n2 | n3 | n4 | n5 | n6 | p_classic | p_ns_s | p_clust | p_cons | p_joint | p | q |
|---|---|---|---|---|---|---|---|---|---|---|---|---|---|---|---|---|---|---|---|---|
| 1 | RUNX1 | runt-related transcription factor 1 (acute myeloid leukemia 1; aml1 oncogene) | 1051659 | 29 | 29 | 23 | 2 | 0 | 2 | 5 | 4 | 17 | 1 | 1.37e-14 | 0.232 | 0.0098 | 0.00031 | 0.0002 | 1.11e-16 | 1.88e-12 |
| 2 | CBFB | core-binding factor, beta subunit | 459284 | 23 | 23 | 21 | 1 | 1 | 0 | 6 | 4 | 12 | 0 | 3.00e-15 | 0.113 | 0.0057 | 0.12 | 0.0086 | 9.99e-16 | 2.12e-12 |
| 3 | PIK3CA | phosphoinositide-3-kinase, catalytic, alpha polypeptide | 3200341 | 351 | 316 | 53 | 6 | 5 | 134 | 16 | 183 | 13 | 0 | <1.00e-15 | <1.00e-15 | 0 | 0 | 0 | <1.00e-15 | <2.12e-12 |
| 4 | TP53 | tumor protein p53 | 1238133 | 299 | 296 | 161 | 4 | 45 | 22 | 38 | 67 | 127 | 0 | 3.55e-15 | <1.00e-15 | 0 | 0 | 0 | <1.00e-15 | <2.12e-12 |
| 5 | GATA3 | GATA binding protein 3 | 998421 | 100 | 97 | 56 | 2 | 1 | 1 | 2 | 5 | 90 | 1 | 1.89e-15 | 0.352 | 0 | 0.41 | 0 | <1.00e-15 | <2.12e-12 |
| 6 | FOXA1 | forkhead box A1 | 1009017 | 23 | 23 | 16 | 0 | 1 | 8 | 3 | 7 | 3 | 1 | 1.05e-14 | 0.00969 | 2e-07 | 0.051 | 0 | <1.00e-15 | <2.12e-12 |
| 7 | SF3B1 | splicing factor 3b, subunit 1, 155kDa | 3939945 | 16 | 16 | 9 | 2 | 0 | 2 | 1 | 12 | 1 | 0 | 0.00228 | 0.173 | 0 | 0.026 | 0 | <1.00e-15 | <2.12e-12 |
| 8 | TNFSF8 | tumor necrosis factor (ligand) superfamily, member 8 | 699445 | 2 | 2 | 2 | 0 | 0 | 0 | 0 | 1 | 1 | 0 | 0.277 | 0.507 | 0.49 | 0 | 0 | <1.00e-15 | <2.12e-12 |
| 9 | PTEN | phosphatase and tensin homolog (mutated in multiple advanced cancers 1) | 1212494 | 35 | 35 | 32 | 0 | 0 | 3 | 3 | 7 | 21 | 1 | 6.88e-15 | 0.0215 | 0.0024 | 0.75 | 0.0053 | 1.44e-15 | 2.72e-12 |
| 10 | MAP2K4 | mitogen-activated protein kinase kinase 4 | 1094202 | 32 | 32 | 28 | 0 | 3 | 2 | 5 | 2 | 20 | 0 | <1.00e-15 | 0.0102 | 0.12 | 0.5 | 0.21 | <7.77e-15 | <1.32e-11 |
| 11 | CDH1 | cadherin 1, type 1, E-cadherin (epithelial) | 2544201 | 109 | 107 | 90 | 1 | 4 | 7 | 4 | 1 | 93 | 0 | <1.00e-15 | 6.69e-07 | 0.22 | 0.73 | 0.31 | <1.14e-14 | <1.76e-11 |
| 12 | TBX3 | T-box 3 (ulnar mammary syndrome) | 1280215 | 27 | 27 | 26 | 1 | 4 | 2 | 1 | 1 | 19 | 0 | 6.44e-15 | 0.130 | 0.035 | 0.83 | 0.067 | 1.57e-14 | 2.21e-11 |
| 13 | MAP3K1 | mitogen-activated protein kinase kinase kinase 1 | 4026466 | 80 | 71 | 72 | 1 | 1 | 3 | 5 | 7 | 46 | 18 | 3.11e-15 | 0.0122 | 0.75 | 0.69 | 1 | 1.07e-13 | 1.40e-10 |
| 14 | ERBB2 | v-erb-b2 erythroblastic leukemia viral oncogene homolog 2, neuro/glioblastoma derived oncogene homolog (avian) | 3493901 | 21 | 20 | 14 | 2 | 3 | 7 | 3 | 8 | 0 | 0 | 4.14e-06 | 0.0445 | 0.000023 | 0.0011 | 5.2e-06 | 5.50e-10 | 6.67e-07 |
| 15 | CDKN1B | cyclin-dependent kinase inhibitor 1B (p27, Kip1) | 500131 | 10 | 10 | 9 | 1 | 0 | 0 | 0 | 0 | 8 | 2 | 2.80e-09 | 0.586 | 0.16 | 0.65 | 0.3 | 1.86e-08 | 2.10e-05 |
| 16 | HIST1H3B | histone cluster 1, H3b | 380829 | 11 | 11 | 11 | 2 | 3 | 3 | 2 | 1 | 2 | 0 | 7.83e-08 | 0.242 | 0.022 | 0.18 | 0.019 | 3.22e-08 | 3.42e-05 |
| 17 | NCOR1 | nuclear receptor co-repressor 1 | 7287573 | 41 | 40 | 39 | 2 | 2 | 10 | 5 | 2 | 22 | 0 | 8.55e-09 | 0.0296 | 0.51 | 0.26 | 0.64 | 1.10e-07 | 0.000110 |
| 18 | GPS2 | G protein pathway suppressor 2 | 948419 | 10 | 10 | 10 | 1 | 0 | 0 | 0 | 0 | 10 | 0 | 4.01e-07 | 0.799 | 0.023 | 0.14 | 0.017 | 1.36e-07 | 0.000128 |
| 19 | AQP12A | aquaporin 12A | 324535 | 6 | 6 | 4 | 0 | 0 | 1 | 2 | 3 | 0 | 0 | 4.66e-06 | 0.198 | 0.56 | 0.0032 | 0.013 | 1.05e-06 | 0.000937 |
| 20 | ACTL6B | actin-like 6B | 1186698 | 10 | 10 | 6 | 0 | 2 | 0 | 1 | 0 | 7 | 0 | 1.13e-05 | 0.306 | 0.0038 | 0.98 | 0.0073 | 1.43e-06 | 0.00122 |
| 21 | RB1 | retinoblastoma 1 (including osteosarcoma) | 2645506 | 22 | 19 | 21 | 3 | 1 | 1 | 1 | 2 | 17 | 0 | 1.25e-07 | 0.498 | 0.74 | 0.57 | 0.83 | 1.76e-06 | 0.00142 |
| 22 | PIK3R1 | phosphoinositide-3-kinase, regulatory subunit 1 (alpha) | 2281896 | 15 | 14 | 14 | 2 | 0 | 2 | 2 | 4 | 6 | 1 | 0.000657 | 0.619 | 0.000069 | 0.46 | 0.00019 | 2.15e-06 | 0.00166 |
| 23 | KRAS | v-Ki-ras2 Kirsten rat sarcoma viral oncogene homolog | 689307 | 6 | 6 | 3 | 0 | 0 | 1 | 5 | 0 | 0 | 0 | 0.000135 | 0.402 | 0.0017 | 0.059 | 0.0014 | 3.15e-06 | 0.00233 |
| 24 | ZFP36L2 | zinc finger protein 36, C3H type-like 2 | 360184 | 7 | 7 | 7 | 1 | 3 | 0 | 1 | 0 | 3 | 0 | 2.45e-06 | 0.438 | 0.24 | 0.29 | 0.33 | 1.23e-05 | 0.00869 |
| 25 | ZFP36L1 | zinc finger protein 36, C3H type-like 1 | 908013 | 8 | 8 | 8 | 0 | 0 | 0 | 1 | 1 | 6 | 0 | 2.23e-05 | 0.505 | 0.017 | 0.54 | 0.045 | 1.48e-05 | 0.0100 |
| 26 | FAM86B1 | family with sequence similarity 86, member B1 | 335001 | 7 | 6 | 6 | 1 | 3 | 2 | 0 | 1 | 1 | 0 | 1.39e-06 | 0.333 | 0.49 | 0.48 | 0.82 | 1.67e-05 | 0.0109 |
| 27 | FBXW7 | F-box and WD repeat domain containing 7 | 2522313 | 15 | 15 | 13 | 1 | 5 | 4 | 1 | 3 | 2 | 0 | 1.70e-05 | 0.153 | 0.14 | 0.037 | 0.078 | 1.93e-05 | 0.0122 |
| 28 | TBL1XR1 | transducin (beta)-like 1 X-linked receptor 1 | 1550025 | 10 | 10 | 8 | 0 | 0 | 2 | 0 | 1 | 5 | 2 | 5.57e-06 | 0.352 | 0.27 | 0.81 | 0.45 | 3.46e-05 | 0.0210 |
| 29 | MYB | v-myb myeloblastosis viral oncogene homolog (avian) | 2261316 | 12 | 12 | 12 | 0 | 1 | 0 | 2 | 1 | 8 | 0 | 4.37e-05 | 0.227 | 0.14 | 0.041 | 0.068 | 4.10e-05 | 0.0240 |
| 30 | PTGER2 | prostaglandin E receptor 2 (subtype EP2), 53kDa | 738145 | 3 | 3 | 3 | 1 | 0 | 0 | 0 | 1 | 2 | 0 | 0.207 | 0.729 | 0.00021 | 0.67 | 0.000016 | 4.46e-05 | 0.0252 |
| 31 | CTCF | CCCTC-binding factor (zinc finger protein) | 2152284 | 17 | 17 | 15 | 3 | 1 | 3 | 1 | 5 | 7 | 0 | 0.00515 | 0.527 | 0.0078 | 0.0007 | 0.00079 | 5.45e-05 | 0.0298 |
| 32 | CASP8 | caspase 8, apoptosis-related cysteine peptidase | 1709033 | 10 | 10 | 10 | 1 | 1 | 1 | 1 | 3 | 4 | 0 | 0.000108 | 0.255 | 0.034 | 0.18 | 0.043 | 6.14e-05 | 0.0318 |
| 33 | TCP10 | t-complex 10 homolog (mouse) | 729598 | 10 | 8 | 7 | 0 | 5 | 0 | 2 | 2 | 1 | 0 | 3.21e-05 | 0.0472 | 0.077 | 0.83 | 0.14 | 6.18e-05 | 0.0318 |
| 34 | WSCD2 | WSC domain containing 2 | 1546082 | 14 | 13 | 14 | 2 | 6 | 3 | 4 | 0 | 1 | 0 | 1.53e-05 | 0.131 | 0.7 | 0.14 | 0.32 | 6.47e-05 | 0.0323 |
| 35 | ZP4 | zona pellucida glycoprotein 4 | 1628063 | 13 | 13 | 13 | 1 | 0 | 5 | 3 | 1 | 4 | 0 | 1.04e-05 | 0.110 | 0.77 | 0.23 | 0.56 | 7.51e-05 | 0.0364 |
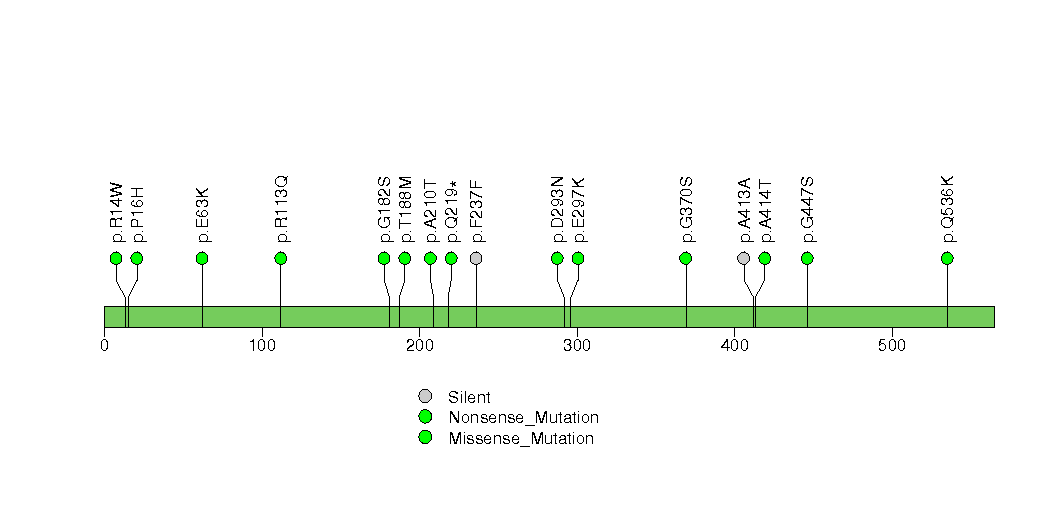
Figure S1. This figure depicts the distribution of mutations and mutation types across the RUNX1 significant gene.
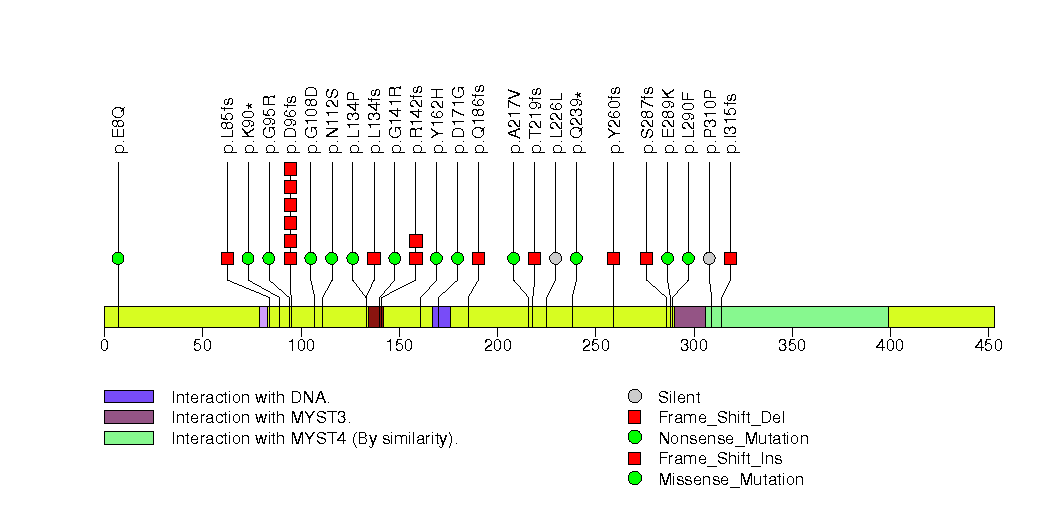
Figure S2. This figure depicts the distribution of mutations and mutation types across the CBFB significant gene.
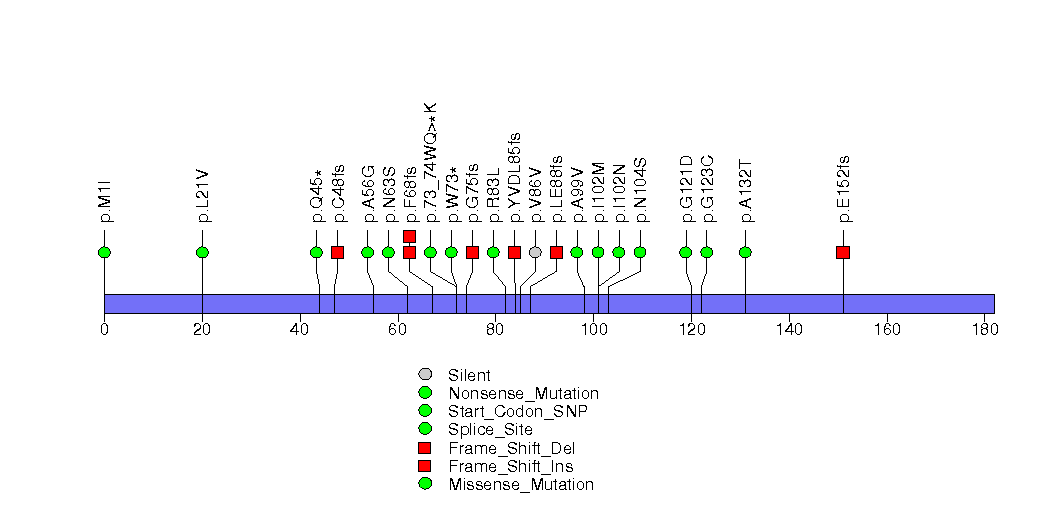
Figure S3. This figure depicts the distribution of mutations and mutation types across the PIK3CA significant gene.
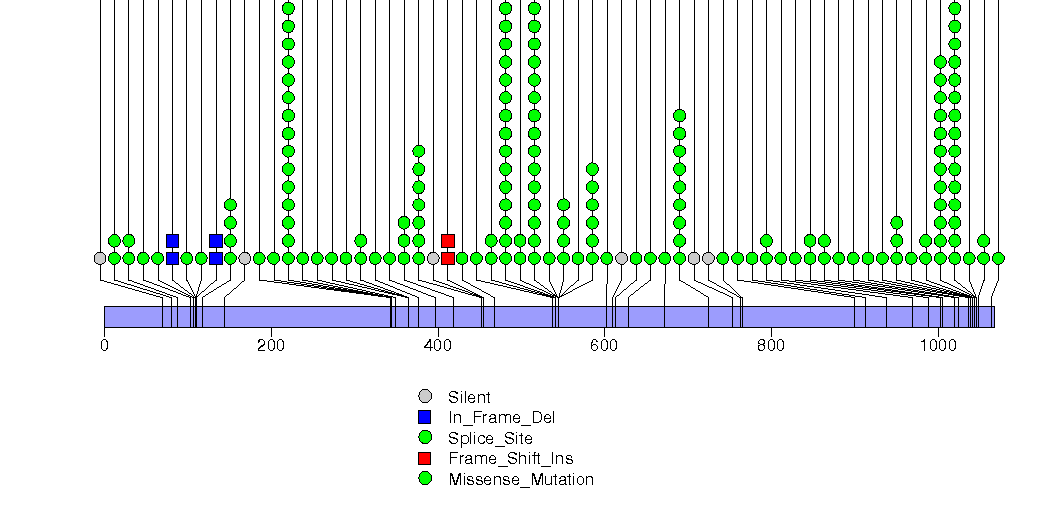
Figure S4. This figure depicts the distribution of mutations and mutation types across the TP53 significant gene.
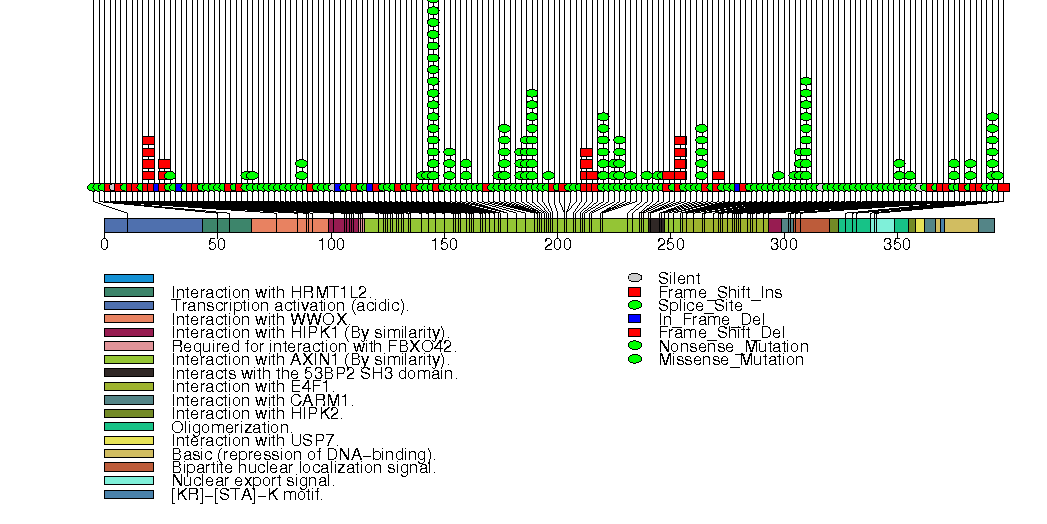
Figure S5. This figure depicts the distribution of mutations and mutation types across the GATA3 significant gene.
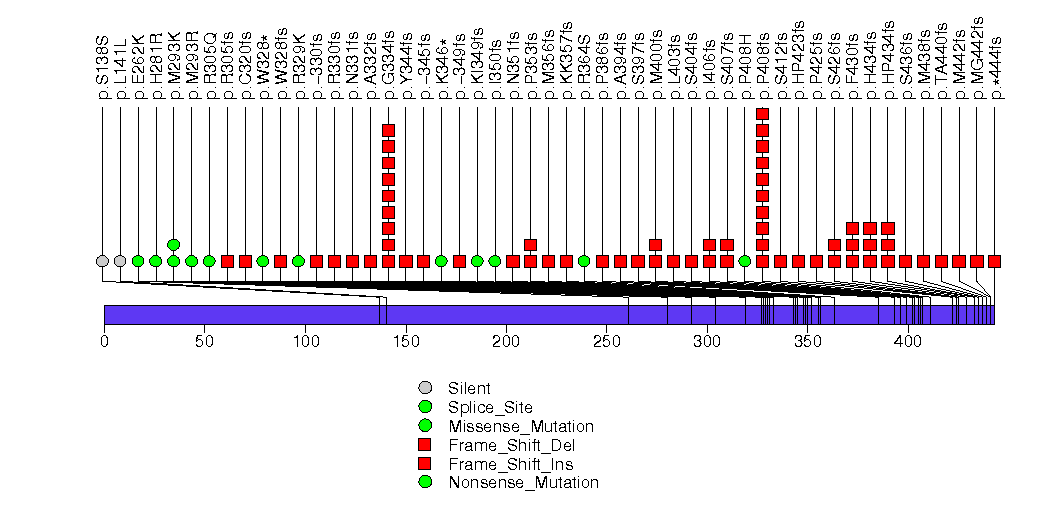
Figure S6. This figure depicts the distribution of mutations and mutation types across the FOXA1 significant gene.
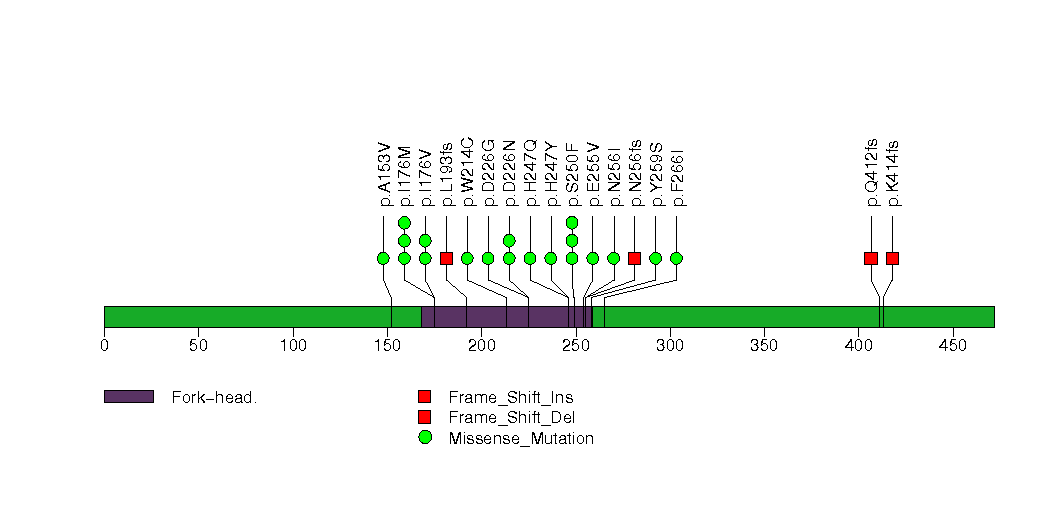
Figure S7. This figure depicts the distribution of mutations and mutation types across the SF3B1 significant gene.
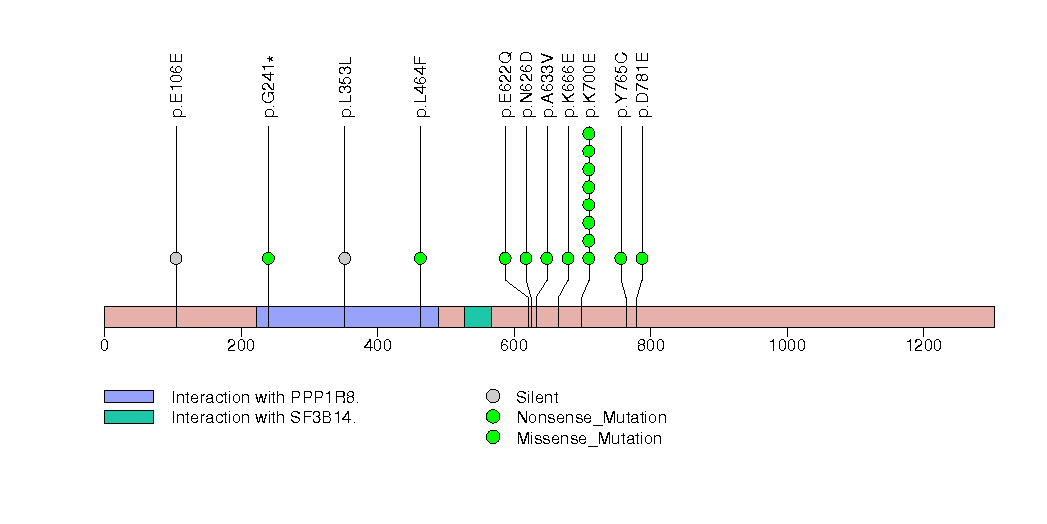
Figure S8. This figure depicts the distribution of mutations and mutation types across the TNFSF8 significant gene.
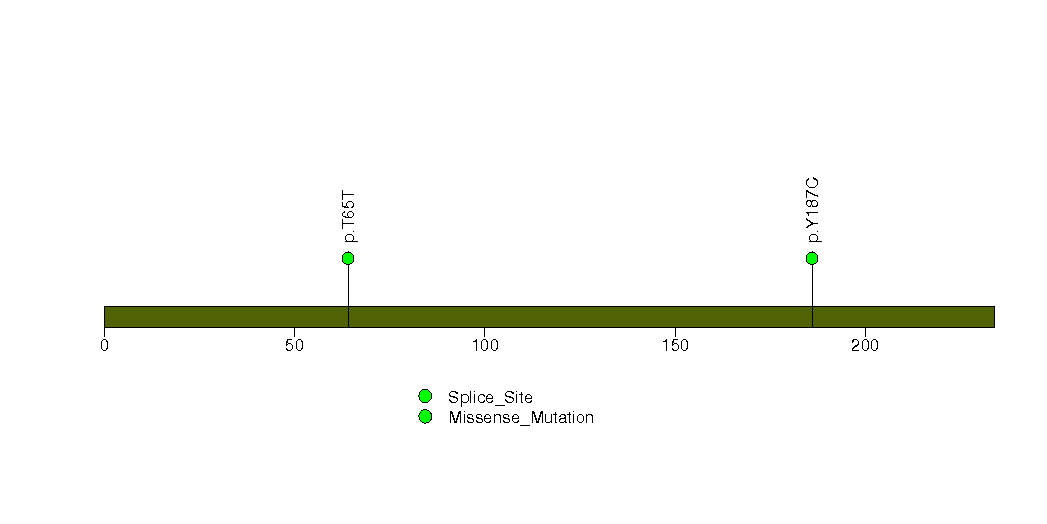
Figure S9. This figure depicts the distribution of mutations and mutation types across the PTEN significant gene.
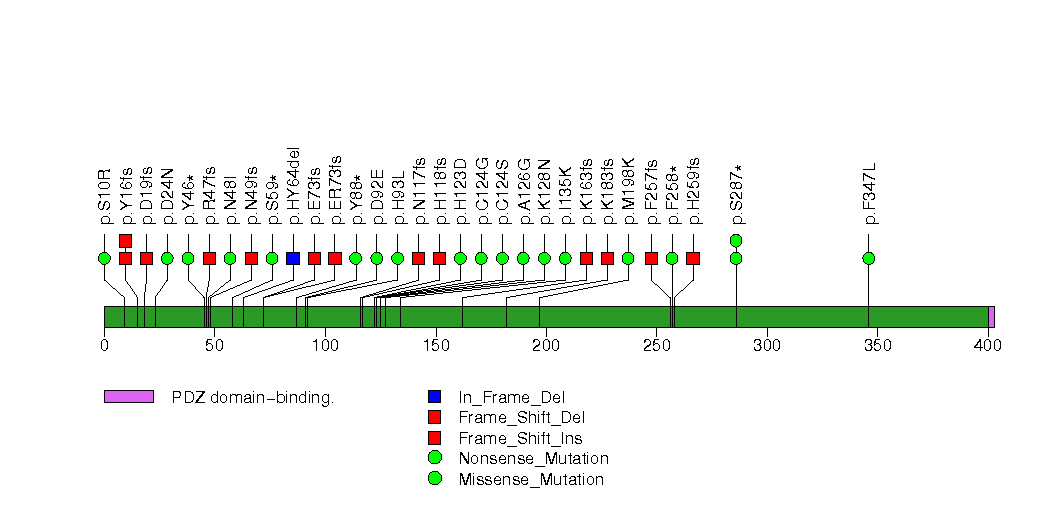
Figure S10. This figure depicts the distribution of mutations and mutation types across the MAP2K4 significant gene.
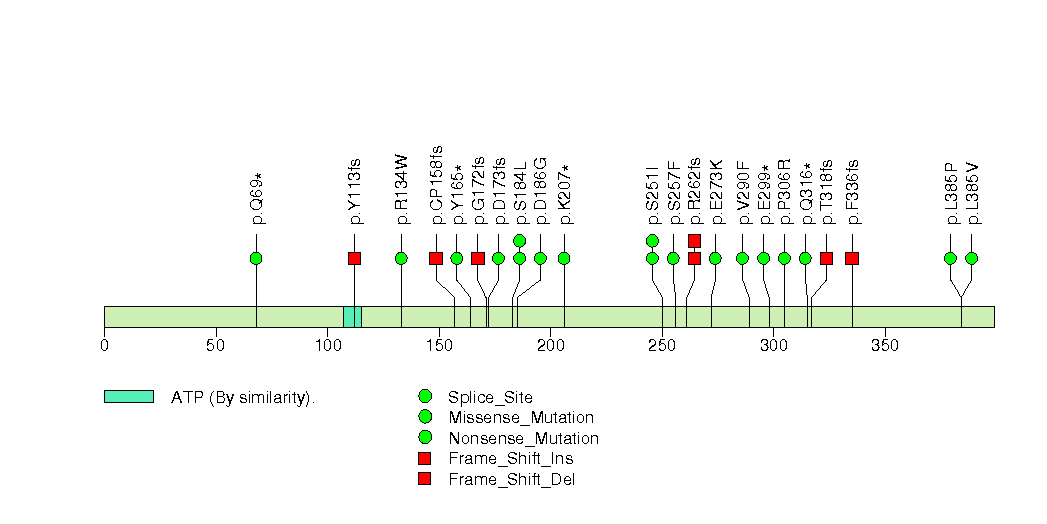
Figure S11. This figure depicts the distribution of mutations and mutation types across the CDH1 significant gene.
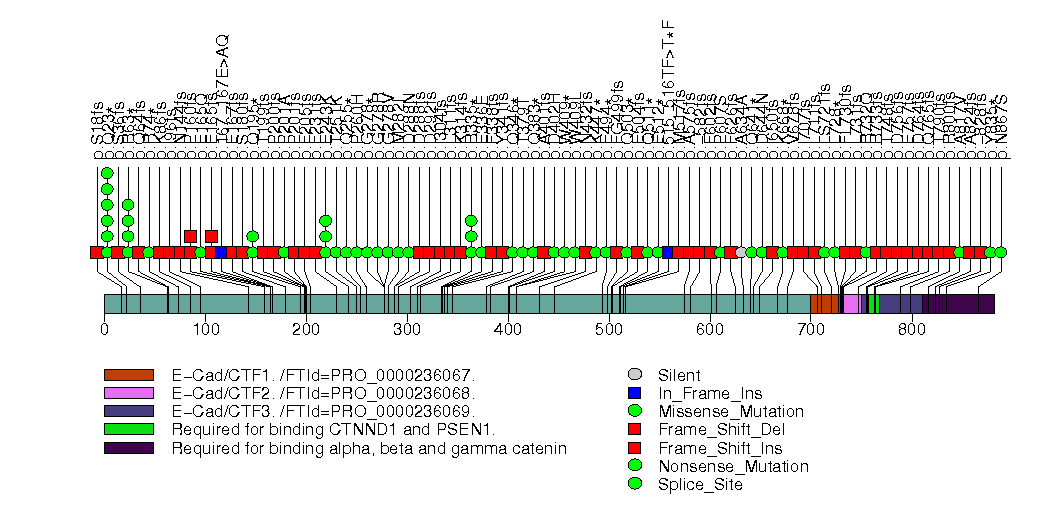
Figure S12. This figure depicts the distribution of mutations and mutation types across the TBX3 significant gene.
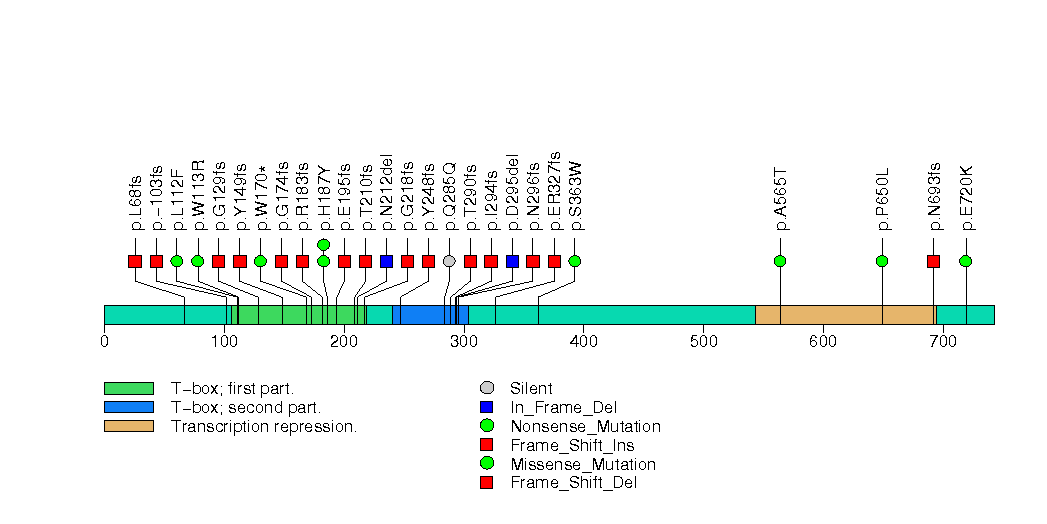
Figure S13. This figure depicts the distribution of mutations and mutation types across the MAP3K1 significant gene.
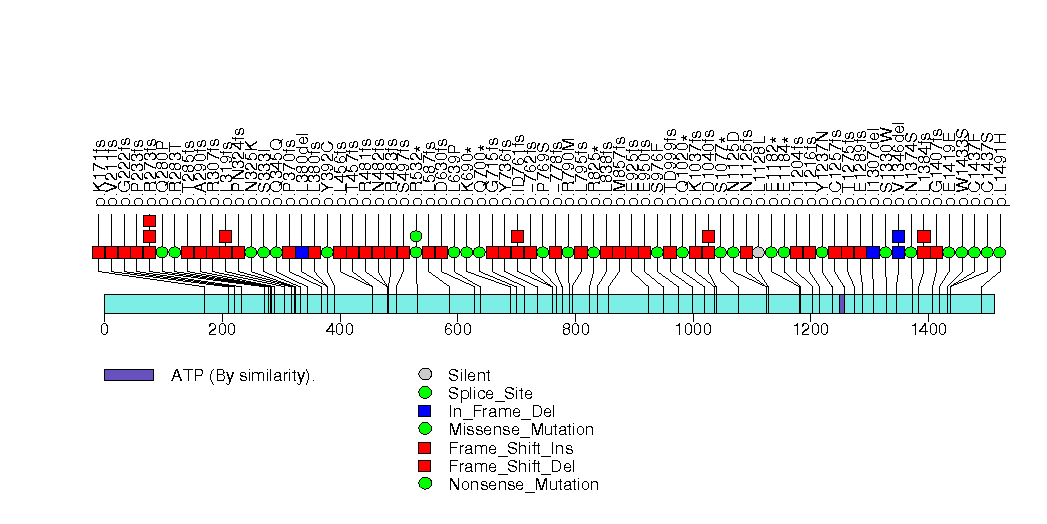
Figure S14. This figure depicts the distribution of mutations and mutation types across the ERBB2 significant gene.
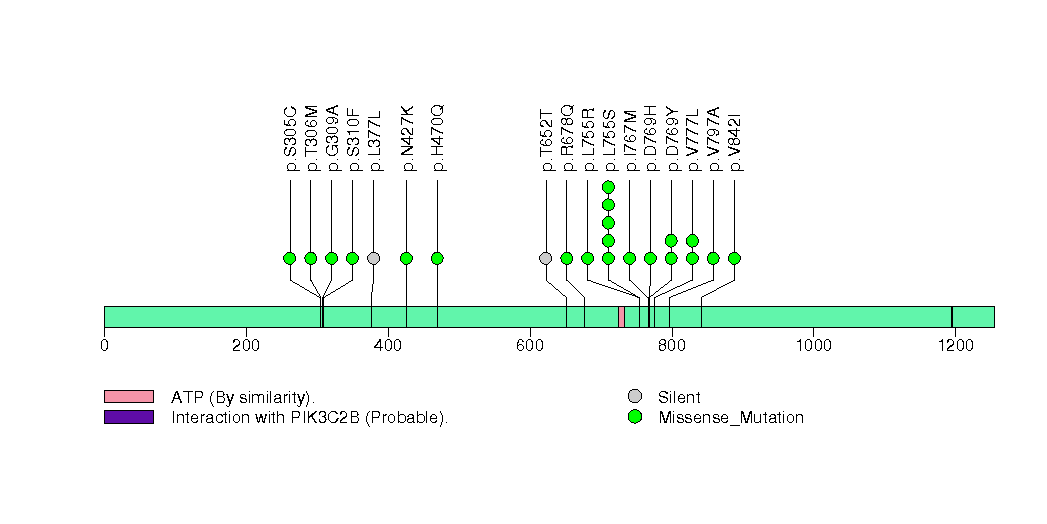
Figure S15. This figure depicts the distribution of mutations and mutation types across the CDKN1B significant gene.
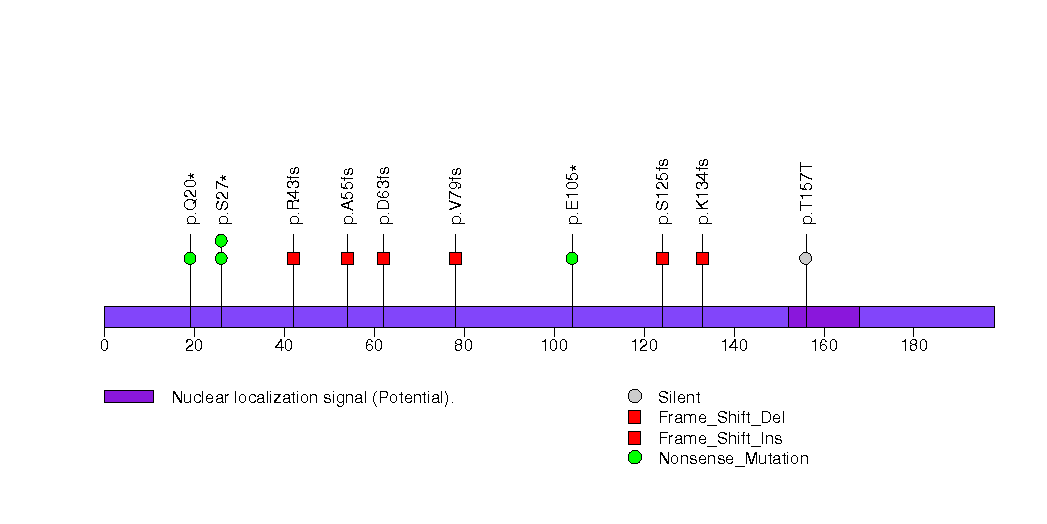
Figure S16. This figure depicts the distribution of mutations and mutation types across the HIST1H3B significant gene.
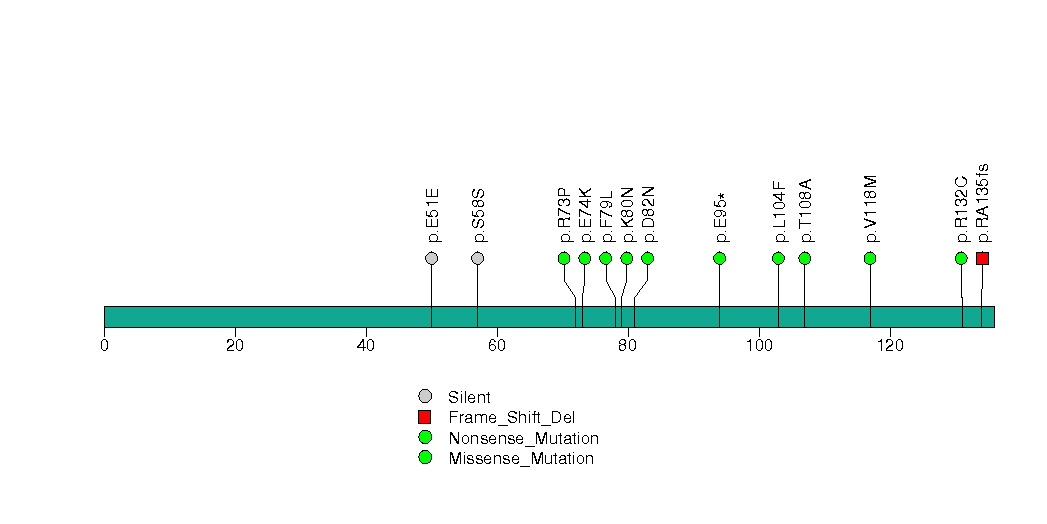
Figure S17. This figure depicts the distribution of mutations and mutation types across the NCOR1 significant gene.
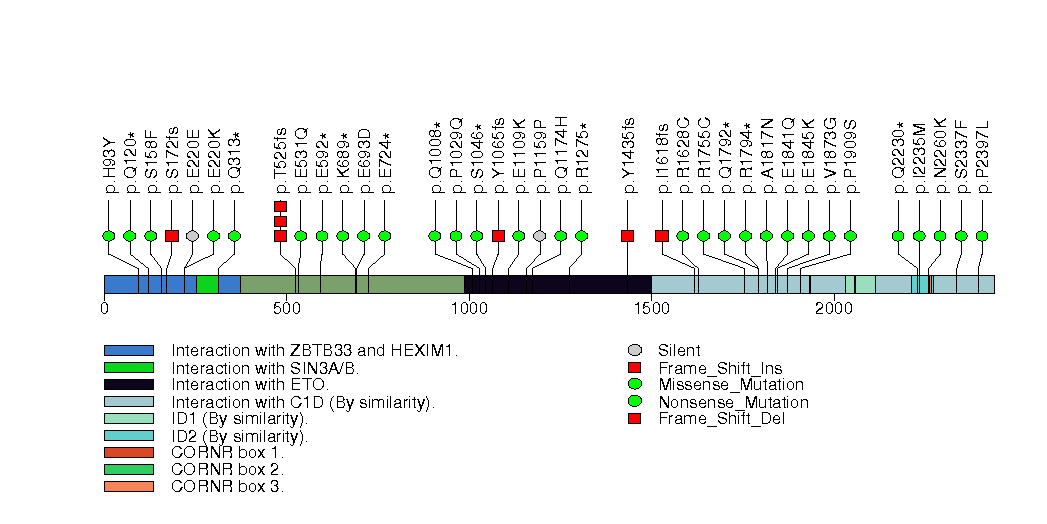
Figure S18. This figure depicts the distribution of mutations and mutation types across the GPS2 significant gene.
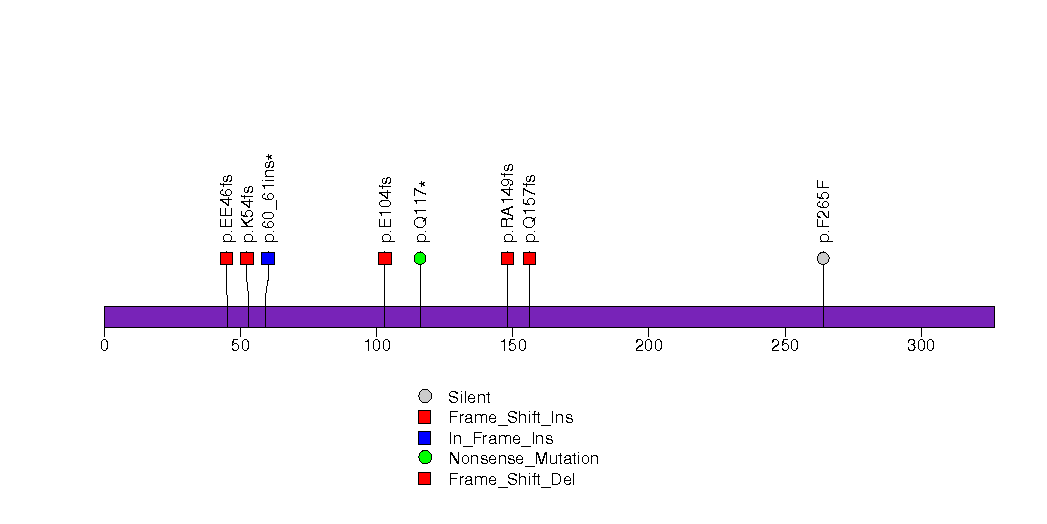
Figure S19. This figure depicts the distribution of mutations and mutation types across the AQP12A significant gene.
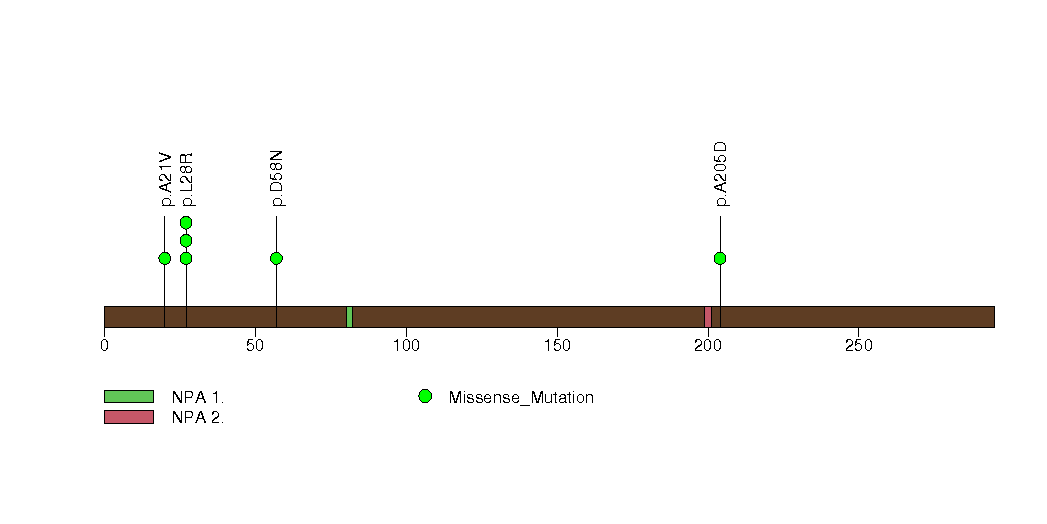
Figure S20. This figure depicts the distribution of mutations and mutation types across the ACTL6B significant gene.
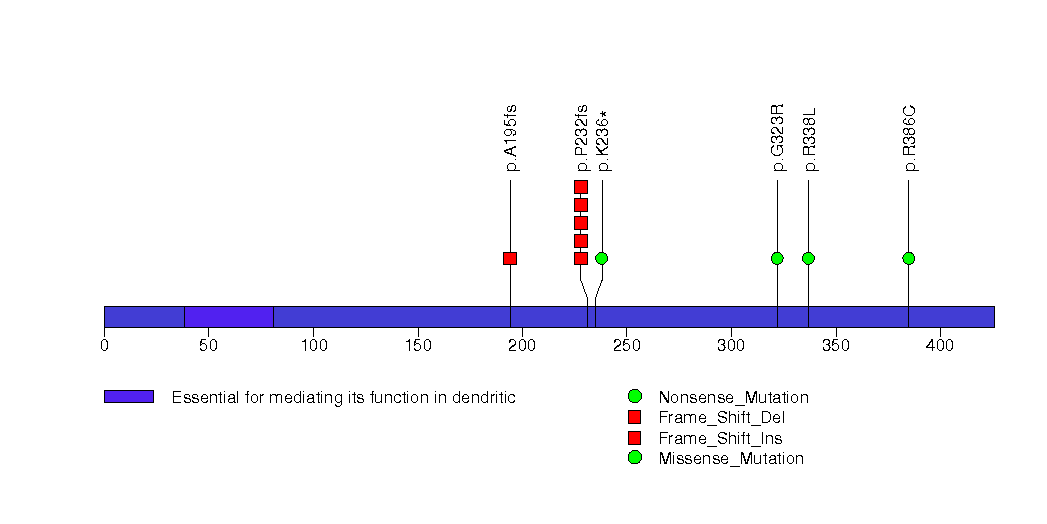
Figure S21. This figure depicts the distribution of mutations and mutation types across the RB1 significant gene.
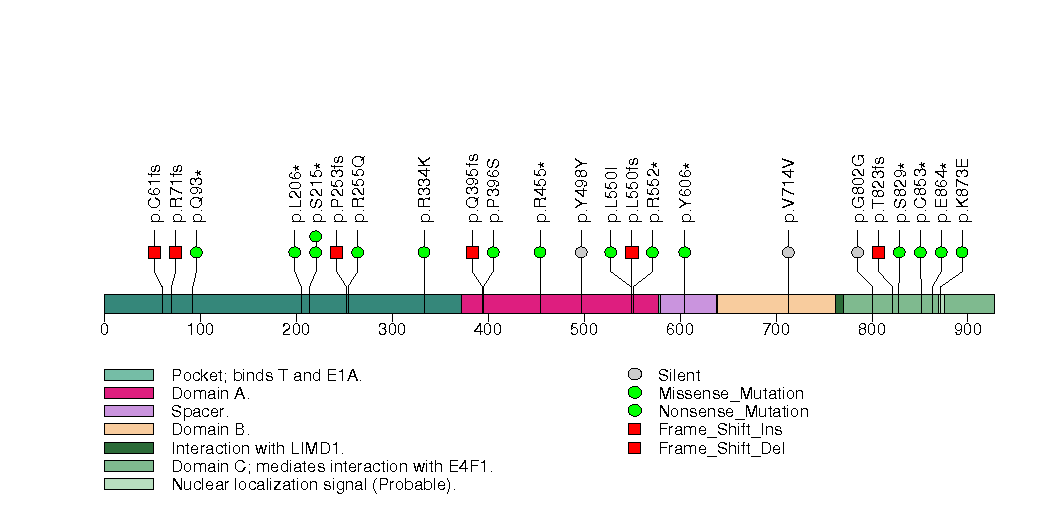
Figure S22. This figure depicts the distribution of mutations and mutation types across the PIK3R1 significant gene.
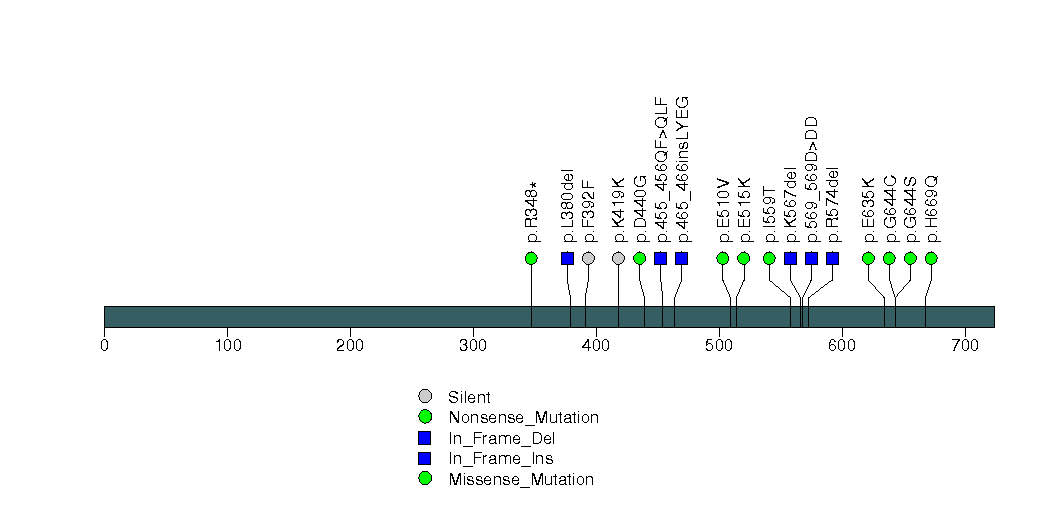
Figure S23. This figure depicts the distribution of mutations and mutation types across the KRAS significant gene.
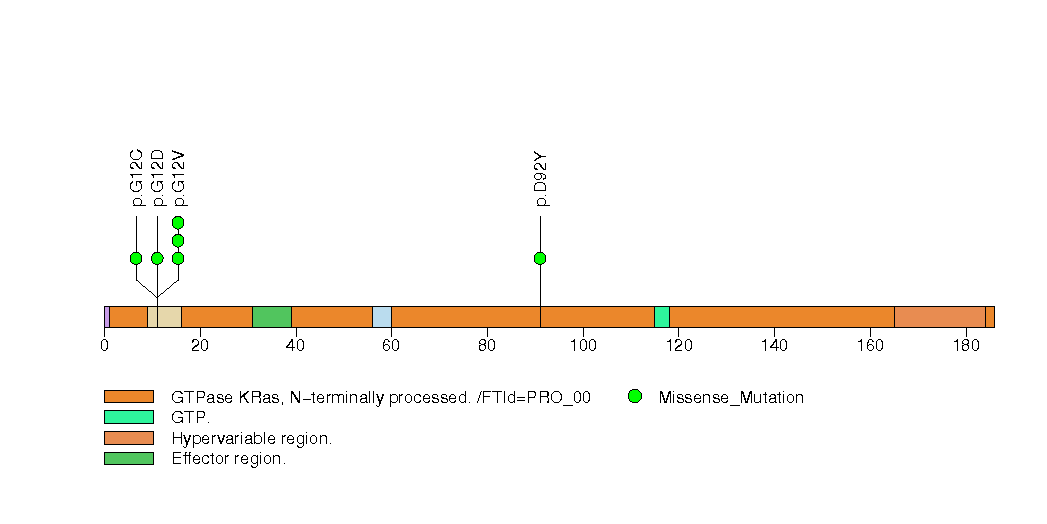
Figure S24. This figure depicts the distribution of mutations and mutation types across the ZFP36L2 significant gene.
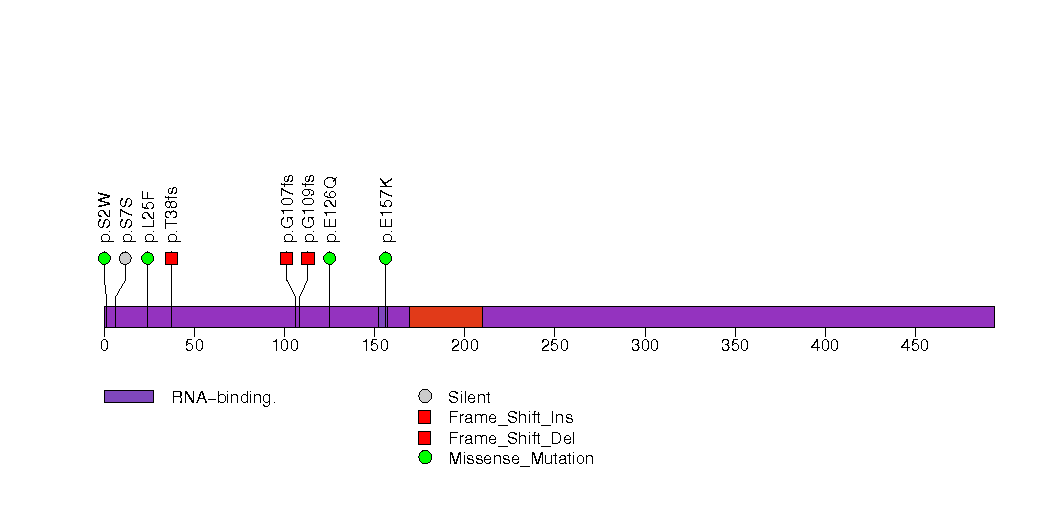
Figure S25. This figure depicts the distribution of mutations and mutation types across the ZFP36L1 significant gene.
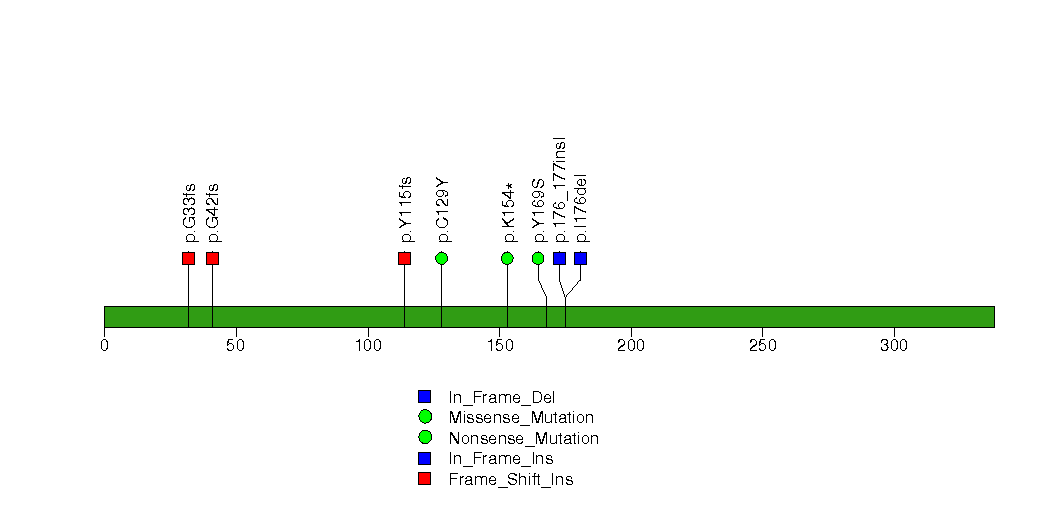
Figure S26. This figure depicts the distribution of mutations and mutation types across the FAM86B1 significant gene.
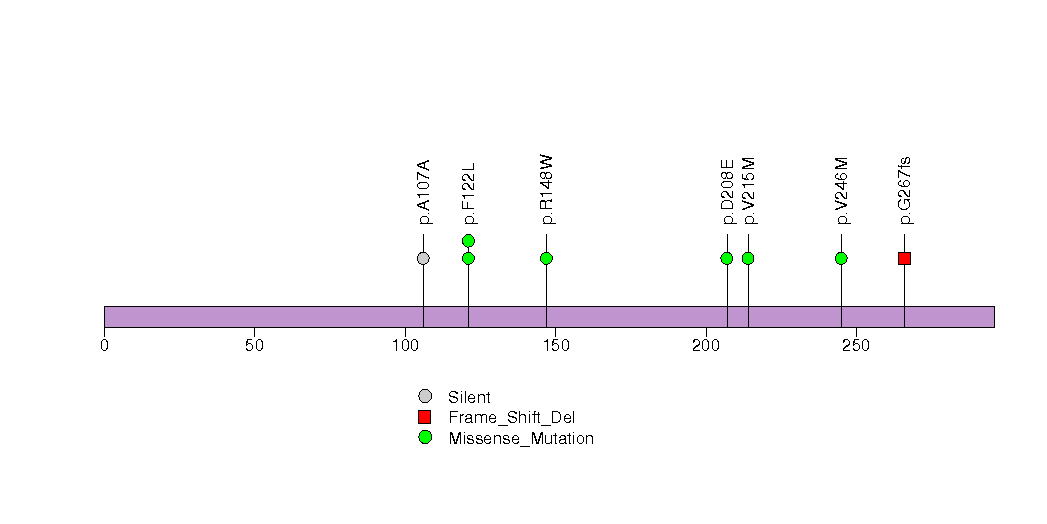
Figure S27. This figure depicts the distribution of mutations and mutation types across the FBXW7 significant gene.
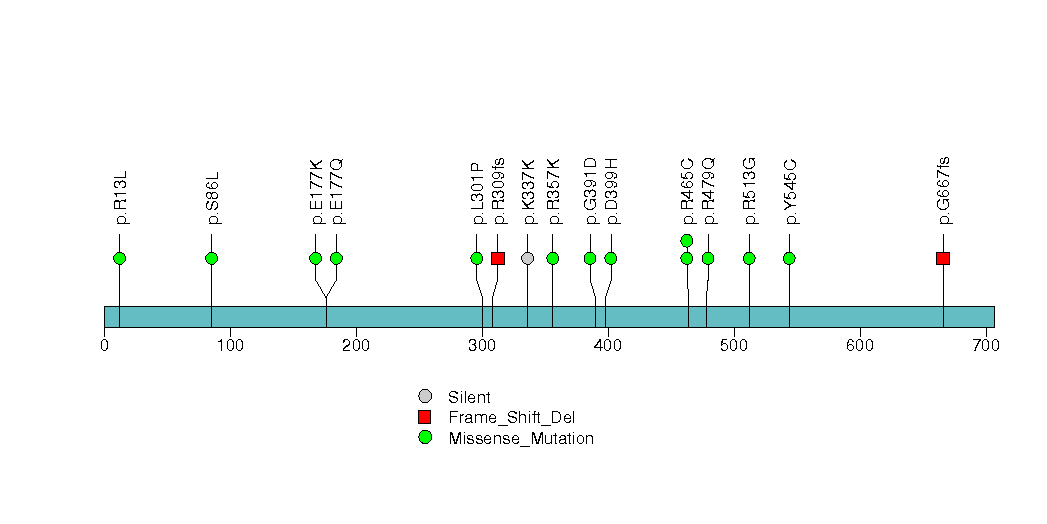
Figure S28. This figure depicts the distribution of mutations and mutation types across the TBL1XR1 significant gene.
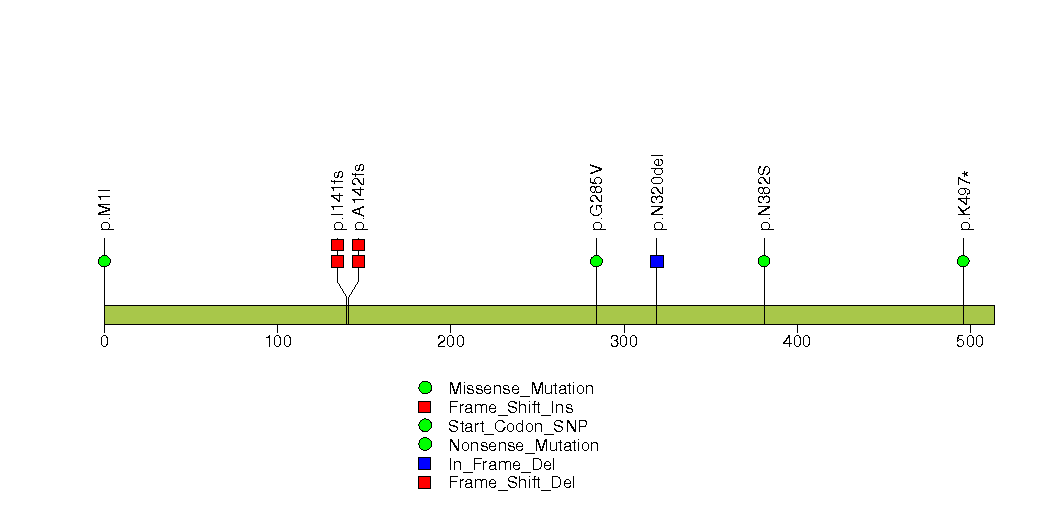
Figure S29. This figure depicts the distribution of mutations and mutation types across the MYB significant gene.
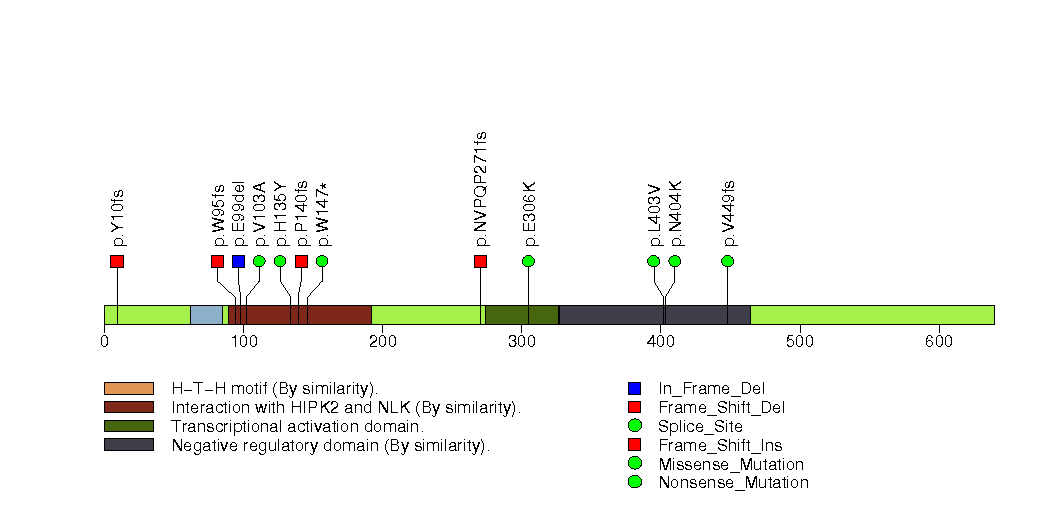
Figure S30. This figure depicts the distribution of mutations and mutation types across the PTGER2 significant gene.
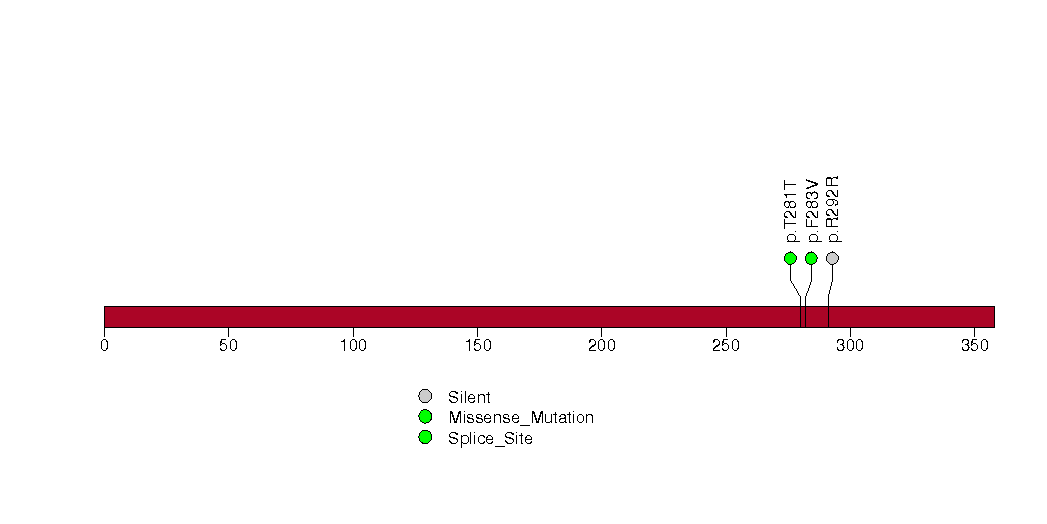
Figure S31. This figure depicts the distribution of mutations and mutation types across the CTCF significant gene.
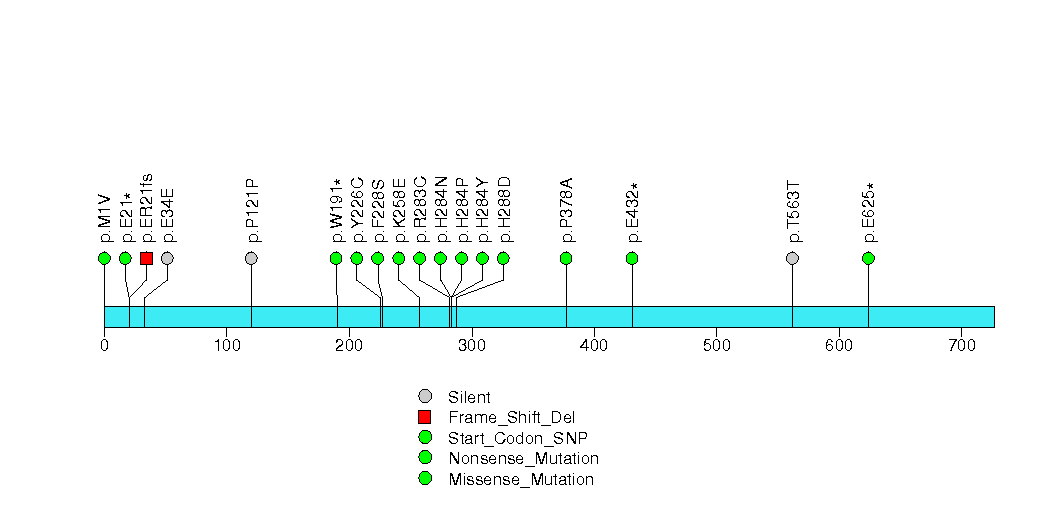
Figure S32. This figure depicts the distribution of mutations and mutation types across the TCP10 significant gene.
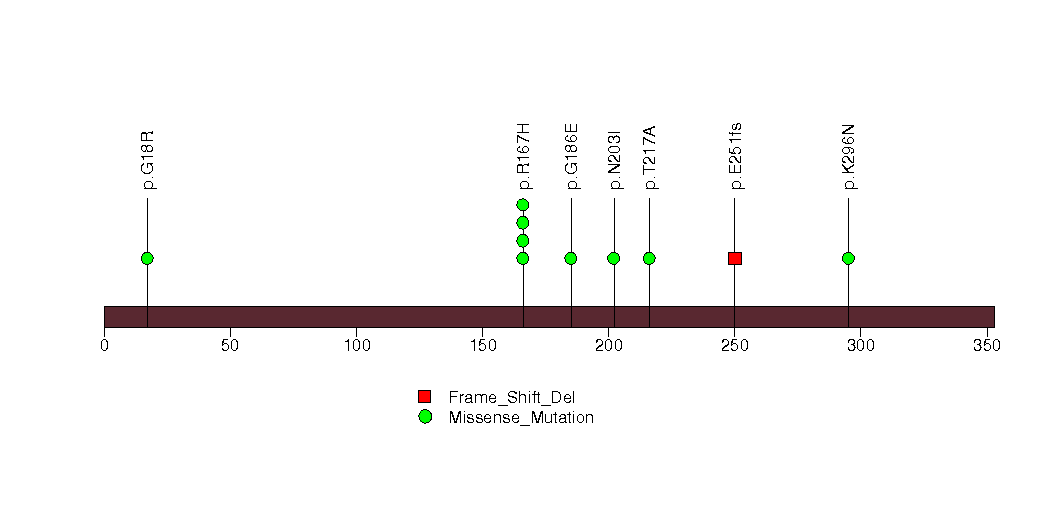
Figure S33. This figure depicts the distribution of mutations and mutation types across the WSCD2 significant gene.
In this analysis, COSMIC is used as a filter to increase power by restricting the territory of each gene. Cosmic version: v48.
Table 4. Get Full Table Significantly mutated genes (COSMIC territory only). To access the database please go to: COSMIC. Number of significant genes found: 19. Number of genes displayed: 10
| rank | gene | description | n | cos | n_cos | N_cos | cos_ev | p | q |
|---|---|---|---|---|---|---|---|---|---|
| 1 | PIK3CA | phosphoinositide-3-kinase, catalytic, alpha polypeptide | 351 | 220 | 325 | 214940 | 195319 | 0 | 0 |
| 2 | TP53 | tumor protein p53 | 299 | 356 | 279 | 347812 | 52914 | 0 | 0 |
| 3 | CDH1 | cadherin 1, type 1, E-cadherin (epithelial) | 109 | 185 | 36 | 180745 | 67 | 0 | 0 |
| 4 | PTEN | phosphatase and tensin homolog (mutated in multiple advanced cancers 1) | 35 | 767 | 34 | 749359 | 393 | 0 | 0 |
| 5 | MAP2K4 | mitogen-activated protein kinase kinase 4 | 32 | 15 | 6 | 14655 | 10 | 1.6e-12 | 1.2e-09 |
| 6 | GATA3 | GATA binding protein 3 | 100 | 34 | 33 | 33218 | 234 | 1.7e-12 | 1.2e-09 |
| 7 | ERBB2 | v-erb-b2 erythroblastic leukemia viral oncogene homolog 2, neuro/glioblastoma derived oncogene homolog (avian) | 21 | 42 | 13 | 41034 | 91 | 2.1e-12 | 1.3e-09 |
| 8 | RUNX1 | runt-related transcription factor 1 (acute myeloid leukemia 1; aml1 oncogene) | 29 | 178 | 13 | 173906 | 49 | 6.7e-12 | 3.7e-09 |
| 9 | RB1 | retinoblastoma 1 (including osteosarcoma) | 22 | 267 | 10 | 260859 | 23 | 2.4e-10 | 1.1e-07 |
| 10 | KRAS | v-Ki-ras2 Kirsten rat sarcoma viral oncogene homolog | 6 | 52 | 6 | 50804 | 72781 | 1.3e-09 | 5.7e-07 |
Note:
n - number of (nonsilent) mutations in this gene across the individual set.
cos = number of unique mutated sites in this gene in COSMIC
n_cos = overlap between n and cos.
N_cos = number of individuals times cos.
cos_ev = total evidence: number of reports in COSMIC for mutations seen in this gene.
p = p-value for seeing the observed amount of overlap in this gene)
q = q-value, False Discovery Rate (Benjamini-Hochberg procedure)
Table 5. Get Full Table A Ranked List of Significantly Mutated Genesets. (Source: MSigDB GSEA Cannonical Pathway Set).Number of significant genesets found: 111. Number of genesets displayed: 10
| rank | geneset | description | genes | N_genes | mut_tally | N | n | npat | nsite | nsil | n1 | n2 | n3 | n4 | n5 | n6 | p_ns_s | p | q |
|---|---|---|---|---|---|---|---|---|---|---|---|---|---|---|---|---|---|---|---|
| 1 | FCER1PATHWAY | In mast cells, Fc epsilon receptor 1 activates BTK, PKC, and the MAP kinase pathway to promote degranulation and arachnidonic acid release. | BTK, CALM1, CALM2, CALM3, ELK1, FCER1A, FCER1G, FOS, GRB2, HRAS, JUN, LYN, MAP2K1, MAP2K4, MAP2K7, MAP3K1, MAPK1, MAPK3, MAPK8, NFATC1, NFATC2, NFATC3, NFATC4, PAK2, PIK3CA, PIK3R1, PLA2G4A, PLCG1, PPP3CA, PPP3CB, PPP3CC, PRKCB1, RAF1, SHC1, SOS1, SYK, SYT1, VAV1 | 37 | BTK(7), CALM2(1), ELK1(4), FCER1A(4), HRAS(2), JUN(3), LYN(6), MAP2K1(5), MAP2K4(32), MAP2K7(1), MAP3K1(80), MAPK1(1), MAPK3(1), MAPK8(2), NFATC1(5), NFATC2(4), NFATC3(7), NFATC4(6), PAK2(2), PIK3CA(351), PIK3R1(15), PLA2G4A(7), PLCG1(8), PPP3CA(5), PPP3CB(2), RAF1(4), SHC1(2), SOS1(5), SYK(4), SYT1(1), VAV1(6) | 59937742 | 583 | 426 | 272 | 39 | 30 | 171 | 44 | 218 | 101 | 19 | <1.00e-15 | <1.00e-15 | <1.99e-14 |
| 2 | PPARAPATHWAY | Peroxisome proliferators regulate gene expression via PPAR/RXR heterodimers which bind to peroxisome-proliferator response elements (PPREs). | ACOX1, APOA1, APOA2, CD36, CITED2, CPT1B, CREBBP, DUSP1, DUT, EHHADH, EP300, FABP1, FAT, FRA8B, HSD17B4, HSPA1A, HSPCA, INS, JUN, LPL, MAPK1, MAPK3, ME1, MRPL11, MYC, NCOA1, NCOR1, NCOR2, NFKBIA, NOS2A, NR0B2, NR1H3, NR2F1, NRIP1, PDGFA, PIK3CA, PIK3R1, PPARA, PPARBP, PPARGC1, PRKACB, PRKACG, PRKAR1A, PRKAR1B, PRKAR2A, PRKAR2B, PRKCA, PRKCB1, PTGS2, RB1, RELA, RXRA, SP1, SRA1, STAT5A, STAT5B, TNF | 49 | ACOX1(3), APOA1(3), CD36(4), CITED2(2), CPT1B(4), CREBBP(15), DUSP1(1), DUT(1), EHHADH(4), EP300(13), FABP1(2), HSD17B4(8), JUN(3), LPL(1), MAPK1(1), MAPK3(1), MRPL11(1), MYC(1), NCOA1(5), NCOR1(41), NCOR2(8), NFKBIA(3), NR0B2(2), NR1H3(2), NR2F1(1), NRIP1(10), PIK3CA(351), PIK3R1(15), PPARA(4), PRKACB(1), PRKACG(3), PRKAR1A(4), PRKAR2A(2), PRKAR2B(2), PRKCA(4), PTGS2(6), RB1(22), RELA(3), RXRA(2), SP1(6), STAT5A(6), STAT5B(5) | 88375670 | 576 | 422 | 274 | 52 | 34 | 180 | 46 | 217 | 97 | 2 | <1.00e-15 | <1.00e-15 | <1.99e-14 |
| 3 | APOPTOSIS_GENMAPP | APAF1, BAK1, BCL2L7P1, BAX, BCL2, BCL2L1, BID, BIRC2, BIRC3, BIRC4, CASP2, CASP3, CASP6, CASP7, CASP8, CASP9, CYCS, FADD, FAS, FASLG, GZMB, IKBKG, JUN, MAP2K4, MAP3K1, MAP3K14, MAPK10, MCL1, MDM2, MYC, NFKB1, NFKBIA, PARP1, PRF1, RELA, RIPK1, TNF, TNFRSF1A, TNFRSF1B, TNFSF10, TP53, TRADD, TRAF1, TRAF2 | 41 | APAF1(11), BAK1(3), BAX(3), BCL2L1(1), BID(3), BIRC2(3), BIRC3(4), CASP2(3), CASP3(1), CASP6(2), CASP7(2), CASP8(10), CASP9(2), FAS(1), FASLG(2), JUN(3), MAP2K4(32), MAP3K1(80), MAPK10(4), MCL1(1), MDM2(3), MYC(1), NFKB1(5), NFKBIA(3), PARP1(6), PRF1(2), RELA(3), RIPK1(5), TNFRSF1A(4), TNFRSF1B(2), TP53(299), TRAF1(2), TRAF2(1) | 52249364 | 507 | 420 | 356 | 22 | 66 | 60 | 64 | 87 | 212 | 18 | <1.00e-15 | <1.00e-15 | <1.99e-14 | |
| 4 | SIG_PIP3_SIGNALING_IN_B_LYMPHOCYTES | Genes related to PIP3 signaling in B lymphocytes | AKT1, AKT2, AKT3, BCR, BTK, CD19, CDKN2A, DAPP1, FLOT1, FLOT2, FOXO3A, GAB1, ITPR1, ITPR2, ITPR3, LYN, NR0B2, P101-PI3K, PDK1, PHF11, PIK3CA, PITX2, PLCG2, PPP1R13B, PREX1, PSCD3, PTEN, PTPRC, RPS6KA1, RPS6KA2, RPS6KA3, RPS6KB1, SAG, SYK, TEC, VAV1 | 33 | AKT1(2), AKT2(4), AKT3(5), BCR(3), BTK(7), CD19(6), CDKN2A(1), DAPP1(2), FLOT1(2), FLOT2(2), GAB1(2), ITPR1(15), ITPR2(18), ITPR3(14), LYN(6), NR0B2(2), PDK1(2), PHF11(3), PIK3CA(351), PITX2(5), PLCG2(8), PPP1R13B(4), PREX1(9), PTEN(35), PTPRC(8), RPS6KA1(6), RPS6KA2(5), RPS6KA3(8), RPS6KB1(4), SAG(3), SYK(4), TEC(6), VAV1(6) | 79116874 | 558 | 414 | 255 | 45 | 41 | 179 | 43 | 231 | 63 | 1 | <1.00e-15 | <1.00e-15 | <1.99e-14 |
| 5 | EGFPATHWAY | The epidermal growth factor (EGF) peptide stimulates the EGF receptor to promote cell proliferation via the MAP kinase and Ras pathways. | CSNK2A1, EGF, EGFR, ELK1, FOS, GRB2, HRAS, JAK1, JUN, MAP2K1, MAP2K4, MAP3K1, MAPK3, MAPK8, PIK3CA, PIK3R1, PLCG1, PRKCA, PRKCB1, RAF1, RASA1, SHC1, SOS1, SRF, STAT1, STAT3, STAT5A | 26 | CSNK2A1(3), EGF(5), EGFR(5), ELK1(4), HRAS(2), JAK1(11), JUN(3), MAP2K1(5), MAP2K4(32), MAP3K1(80), MAPK3(1), MAPK8(2), PIK3CA(351), PIK3R1(15), PLCG1(8), PRKCA(4), RAF1(4), RASA1(2), SHC1(2), SOS1(5), SRF(1), STAT1(4), STAT3(5), STAT5A(6) | 53850802 | 560 | 408 | 248 | 33 | 24 | 158 | 39 | 217 | 103 | 19 | <1.00e-15 | <1.00e-15 | <1.99e-14 |
| 6 | SIG_INSULIN_RECEPTOR_PATHWAY_IN_CARDIAC_MYOCYTES | Genes related to the insulin receptor pathway | AKT1, AKT2, AKT3, BRD4, CAP1, CBL, CDC42, CDKN2A, F2RL2, FLOT1, FLOT2, FOXO1A, GRB2, GSK3A, GSK3B, IGFBP1, INPPL1, IRS1, IRS2, IRS4, LNPEP, MAPK1, MAPK3, PARD3, PARD6A, PDK1, PIK3CA, PIK3CD, PIK3R1, PPYR1, PSCD3, PTEN, PTPN1, RAF1, RPS6KA1, RPS6KA2, RPS6KA3, RPS6KB1, SERPINB6, SFN, SHC1, SLC2A4, SORBS1, SOS1, SOS2, YWHAB, YWHAE, YWHAG, YWHAH, YWHAQ, YWHAZ | 48 | AKT1(2), AKT2(4), AKT3(5), BRD4(3), CAP1(2), CBL(4), CDKN2A(1), F2RL2(2), FLOT1(2), FLOT2(2), GSK3A(5), GSK3B(2), INPPL1(6), IRS1(4), IRS4(7), LNPEP(2), MAPK1(1), MAPK3(1), PARD3(8), PARD6A(1), PDK1(2), PIK3CA(351), PIK3CD(6), PIK3R1(15), PTEN(35), RAF1(4), RPS6KA1(6), RPS6KA2(5), RPS6KA3(8), RPS6KB1(4), SERPINB6(2), SFN(1), SHC1(2), SLC2A4(1), SORBS1(7), SOS1(5), SOS2(6), YWHAB(2), YWHAG(1), YWHAZ(3) | 80302320 | 530 | 406 | 227 | 52 | 31 | 178 | 32 | 221 | 65 | 3 | 1.19e-14 | <1.00e-15 | <1.99e-14 |
| 7 | HCMVPATHWAY | Cytomegalovirus activates MAP kinase pathways in the host cell, inducing transcription of viral genes. | AKT1, CREB1, MAP2K1, MAP2K2, MAP2K3, MAP2K6, MAP3K1, MAPK1, MAPK14, MAPK3, NFKB1, PIK3CA, PIK3R1, RB1, RELA, SP1 | 16 | AKT1(2), CREB1(1), MAP2K1(5), MAP2K2(2), MAP2K3(3), MAP2K6(1), MAP3K1(80), MAPK1(1), MAPK14(1), MAPK3(1), NFKB1(5), PIK3CA(351), PIK3R1(15), RB1(22), RELA(3), SP1(6) | 28315648 | 499 | 393 | 191 | 19 | 13 | 151 | 29 | 204 | 83 | 19 | <1.00e-15 | <1.00e-15 | <1.99e-14 |
| 8 | ST_PHOSPHOINOSITIDE_3_KINASE_PATHWAY | The phosphoinositide-3 kinase pathway produces the lipid second messenger PIP3 and regulates cell growth, survival, and movement. | A1BG, AKT1, AKT2, AKT3, BAD, BTK, CDKN2A, CSL4, DAF, DAPP1, FOXO1A, GRB2, GSK3A, GSK3B, IARS, IGFBP1, INPP5D, P14, PDK1, PIK3CA, PPP1R13B, PSCD3, PTEN, RPS6KA1, RPS6KA2, RPS6KA3, RPS6KB1, SFN, SHC1, SOS1, SOS2, TEC, YWHAB, YWHAE, YWHAG, YWHAH, YWHAQ, YWHAZ | 33 | AKT1(2), AKT2(4), AKT3(5), BAD(1), BTK(7), CDKN2A(1), DAPP1(2), GSK3A(5), GSK3B(2), IARS(8), INPP5D(4), PDK1(2), PIK3CA(351), PPP1R13B(4), PTEN(35), RPS6KA1(6), RPS6KA2(5), RPS6KA3(8), RPS6KB1(4), SFN(1), SHC1(2), SOS1(5), SOS2(6), TEC(6), YWHAB(2), YWHAG(1), YWHAZ(3) | 51274772 | 482 | 379 | 180 | 27 | 23 | 165 | 31 | 205 | 57 | 1 | <1.00e-15 | <1.00e-15 | <1.99e-14 |
| 9 | INOSITOL_PHOSPHATE_METABOLISM | IMPA1, INPP1, INPP4A, INPP4B, INPP5A, INPPL1, ITPKA, ITPKB, MIOX, OCRL, PIK3C2A, PIK3C2B, PIK3C2G, PIK3CA, PIK3CB, PIK3CG, PIK4CA, PIK4CA, LOC220686, PIP5K2B, PLCB1, PLCB2, PLCB3, PLCB4, PLCD1, PLCG1, PLCG2 | 23 | INPP1(1), INPP4A(5), INPP4B(7), INPP5A(1), INPPL1(6), ITPKA(1), ITPKB(8), OCRL(8), PIK3C2A(5), PIK3C2B(12), PIK3C2G(8), PIK3CA(351), PIK3CB(8), PIK3CG(5), PLCB1(12), PLCB2(7), PLCB3(2), PLCB4(15), PLCD1(3), PLCG1(8), PLCG2(8) | 64214840 | 481 | 376 | 182 | 33 | 26 | 172 | 33 | 204 | 45 | 1 | <1.00e-15 | <1.00e-15 | <1.99e-14 | |
| 10 | SIG_CD40PATHWAYMAP | Genes related to CD40 signaling | DUSP1, GORASP1, IKBKG, MAP2K4, MAP2K7, MAPK1, MAPK10, MAPK11, MAPK12, MAPK13, MAPK14, MAPK3, MAPK8, MAPK8IP1, MAPK8IP2, MAPK8IP3, MAPK9, MAPKAPK5, NFKB1, NFKB2, NFKBIA, NFKBIB, NFKBIE, NFKBIL1, NFKBIL2, PIK3CA, PIK3CD, PIK3R1, SYT1, TNFRSF5, TRAF2, TRAF3, TRAF5, TRAF6 | 32 | DUSP1(1), GORASP1(1), MAP2K4(32), MAP2K7(1), MAPK1(1), MAPK10(4), MAPK13(1), MAPK14(1), MAPK3(1), MAPK8(2), MAPK8IP1(1), MAPK8IP2(2), MAPK8IP3(8), MAPK9(1), NFKB1(5), NFKB2(5), NFKBIA(3), NFKBIB(1), NFKBIE(2), PIK3CA(351), PIK3CD(6), PIK3R1(15), SYT1(1), TRAF2(1), TRAF3(3), TRAF5(3), TRAF6(4) | 45041575 | 457 | 376 | 154 | 23 | 24 | 149 | 31 | 200 | 51 | 2 | <1.00e-15 | <1.00e-15 | <1.99e-14 |
Table 6. Get Full Table A Ranked List of Significantly Mutated Genesets (Excluding Significantly Mutated Genes). Number of significant genesets found: 0. Number of genesets displayed: 10
| rank | geneset | description | genes | N_genes | mut_tally | N | n | npat | nsite | nsil | n1 | n2 | n3 | n4 | n5 | n6 | p_ns_s | p | q |
|---|---|---|---|---|---|---|---|---|---|---|---|---|---|---|---|---|---|---|---|
| 1 | TCRMOLECULE | T Cell Receptor and CD3 Complex | CD3D, CD3E, CD3G, CD3Z, TRA@, TRB@ | 3 | CD3E(3), CD3G(3) | 1708219 | 6 | 6 | 6 | 0 | 0 | 2 | 1 | 2 | 1 | 0 | 0.27 | 0.096 | 1 |
| 2 | HSA00660_C5_BRANCHED_DIBASIC_ACID_METABOLISM | Genes involved in C5-branched dibasic acid metabolism | ILVBL, SUCLA2 | 2 | ILVBL(5), SUCLA2(1) | 3044170 | 6 | 6 | 6 | 1 | 2 | 1 | 0 | 2 | 1 | 0 | 0.48 | 0.37 | 1 |
| 3 | HSA00627_1,4_DICHLOROBENZENE_DEGRADATION | Genes involved in 1,4-dichlorobenzene degradation | CMBL | 1 | CMBL(1) | 739599 | 1 | 1 | 1 | 0 | 0 | 0 | 0 | 1 | 0 | 0 | 0.8 | 0.39 | 1 |
| 4 | TCAPOPTOSISPATHWAY | HIV infection upregulates Fas ligand in macrophages and CD4 in helper T cells, leading to widespread Fas-induced T cell apoptosis. | CCR5, CD28, CD3D, CD3E, CD3G, CD3Z, CD4, TNFRSF6, TNFSF6, TRA@, TRB@ | 6 | CCR5(1), CD28(2), CD3E(3), CD3G(3), CD4(4) | 4752811 | 13 | 12 | 13 | 3 | 1 | 3 | 2 | 3 | 4 | 0 | 0.52 | 0.46 | 1 |
| 5 | ST_PAC1_RECEPTOR_PATHWAY | The signaling peptide PACAP binds to its receptor, PAC1R, which activates adenylyl cyclase and phospholipase C. | ASAH1, CAMP, DAG1, GAS, GNAQ, ITPKA, ITPKB, PACAP | 6 | ASAH1(1), DAG1(2), GNAQ(1), ITPKA(1), ITPKB(8) | 7947000 | 13 | 13 | 13 | 1 | 2 | 4 | 1 | 3 | 3 | 0 | 0.14 | 0.47 | 1 |
| 6 | HSA00601_GLYCOSPHINGOLIPID_BIOSYNTHESIS_LACTOSERIES | Genes involved in glycosphingolipid biosynthesis - lactoseries | ABO, B3GALT1, B3GALT2, B3GALT5, B3GNT5, FUT1, FUT2, FUT3, ST3GAL3, ST3GAL4 | 9 | B3GALT1(3), B3GALT2(2), B3GALT5(2), B3GNT5(4), FUT1(1), FUT3(3), ST3GAL3(4), ST3GAL4(2) | 9411230 | 21 | 18 | 21 | 2 | 5 | 6 | 7 | 3 | 0 | 0 | 0.049 | 0.49 | 1 |
| 7 | HSA00902_MONOTERPENOID_BIOSYNTHESIS | Genes involved in monoterpenoid biosynthesis | CYP2C19, CYP2C9 | 2 | CYP2C19(6), CYP2C9(3) | 2944424 | 9 | 9 | 9 | 2 | 1 | 4 | 2 | 2 | 0 | 0 | 0.49 | 0.51 | 1 |
| 8 | FBW7PATHWAY | Cyclin E interacts with cell cycle checkpoint kinase cdk2 to allow transcription of genes required for S phase, including transcription of additional cyclin E. | CCNE1, CDC34, CDK2, CUL1, E2F1, FBXW7, RB1, SKP1A, TFDP1 | 6 | CCNE1(2), CDC34(1), CDK2(2), CUL1(2), E2F1(5), TFDP1(3) | 7066982 | 15 | 15 | 14 | 3 | 4 | 3 | 2 | 1 | 5 | 0 | 0.52 | 0.53 | 1 |
| 9 | IFNGPATHWAY | IFN gamma signaling pathway | IFNG, IFNGR1, IFNGR2, JAK1, JAK2, STAT1 | 6 | IFNG(2), IFNGR1(2), JAK1(11), JAK2(7), STAT1(4) | 12001014 | 26 | 24 | 26 | 2 | 2 | 5 | 6 | 5 | 8 | 0 | 0.077 | 0.54 | 1 |
| 10 | HSA00643_STYRENE_DEGRADATION | Genes involved in styrene degradation | FAH, GSTZ1, HGD | 3 | FAH(2), GSTZ1(1), HGD(4) | 3252093 | 7 | 7 | 7 | 2 | 1 | 0 | 2 | 3 | 1 | 0 | 0.71 | 0.56 | 1 |
In brief, we tabulate the number of mutations and the number of covered bases for each gene. The counts are broken down by mutation context category: four context categories that are discovered by MutSig, and one for indel and 'null' mutations, which include indels, nonsense mutations, splice-site mutations, and non-stop (read-through) mutations. For each gene, we calculate the probability of seeing the observed constellation of mutations, i.e. the product P1 x P2 x ... x Pm, or a more extreme one, given the background mutation rates calculated across the dataset. [1]
In addition to the links below, the full results of the analysis summarized in this report can also be downloaded programmatically using firehose_get, or interactively from either the Broad GDAC website or TCGA Data Coordination Center Portal.