This pipeline computes the correlation between cancer subtypes identified by different molecular patterns and selected clinical features.
Testing the association between subtypes identified by 12 different clustering approaches and 8 clinical features across 515 patients, 48 significant findings detected with P value < 0.05 and Q value < 0.25.
-
CNMF clustering analysis on array-based mRNA expression data identified 3 subtypes that correlate to 'HISTOLOGICAL_TYPE'.
-
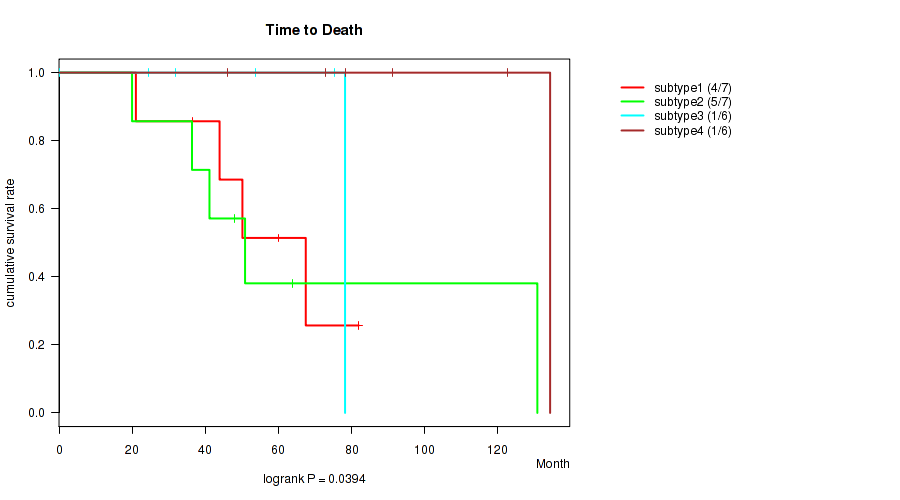
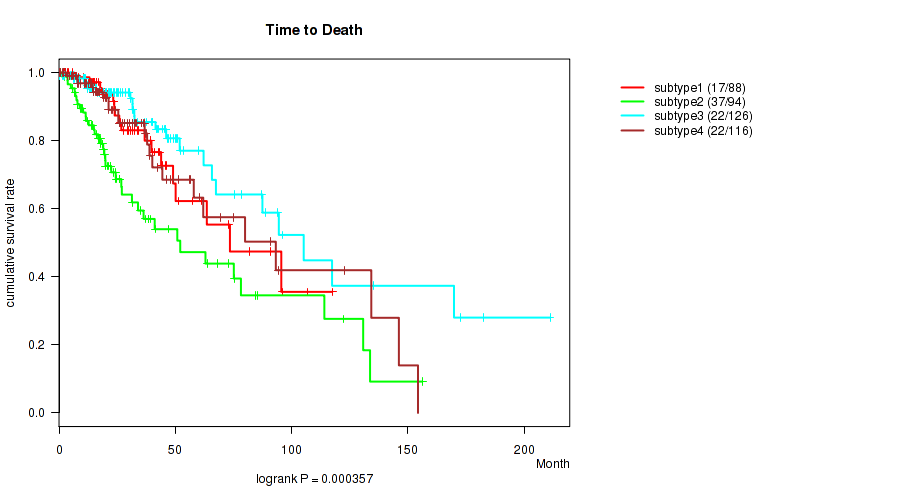
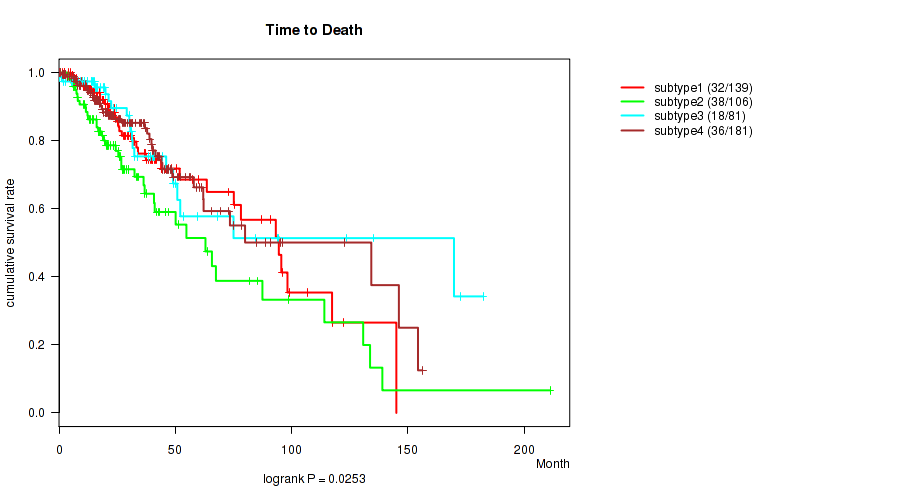
Consensus hierarchical clustering analysis on array-based mRNA expression data identified 4 subtypes that correlate to 'Time to Death' and 'HISTOLOGICAL_TYPE'.
-
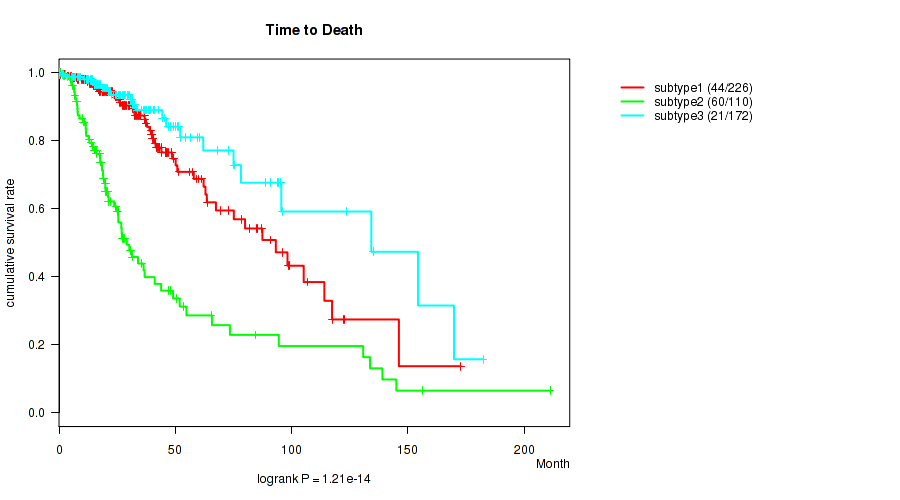
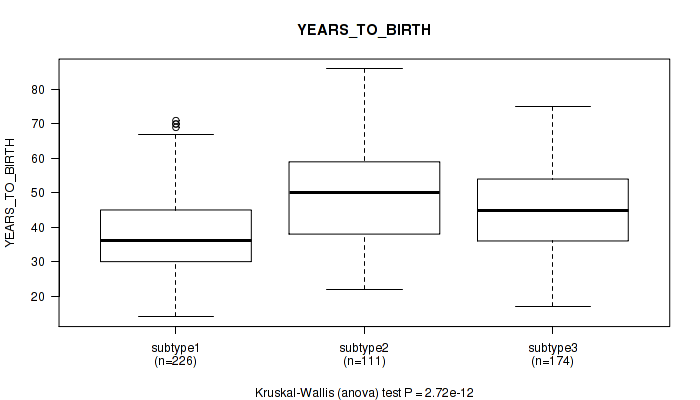
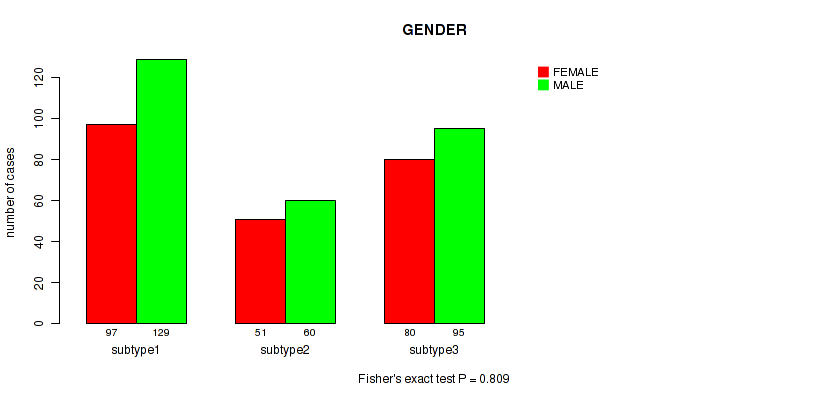
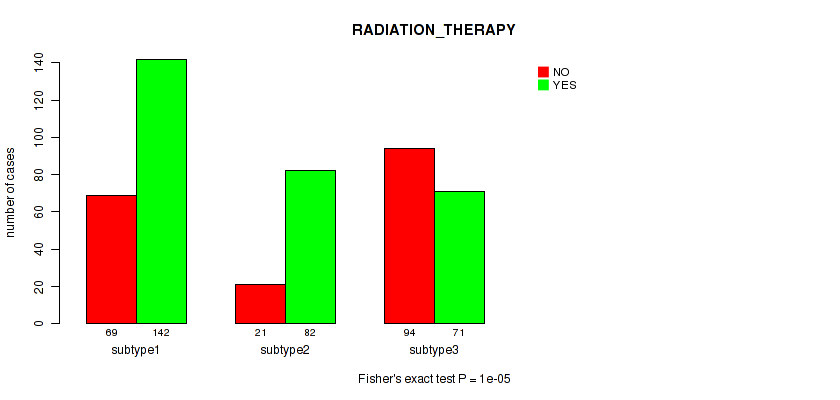
3 subtypes identified in current cancer cohort by 'Copy Number Ratio CNMF subtypes'. These subtypes correlate to 'Time to Death', 'YEARS_TO_BIRTH', 'RADIATION_THERAPY', 'KARNOFSKY_PERFORMANCE_SCORE', 'HISTOLOGICAL_TYPE', and 'RACE'.
-
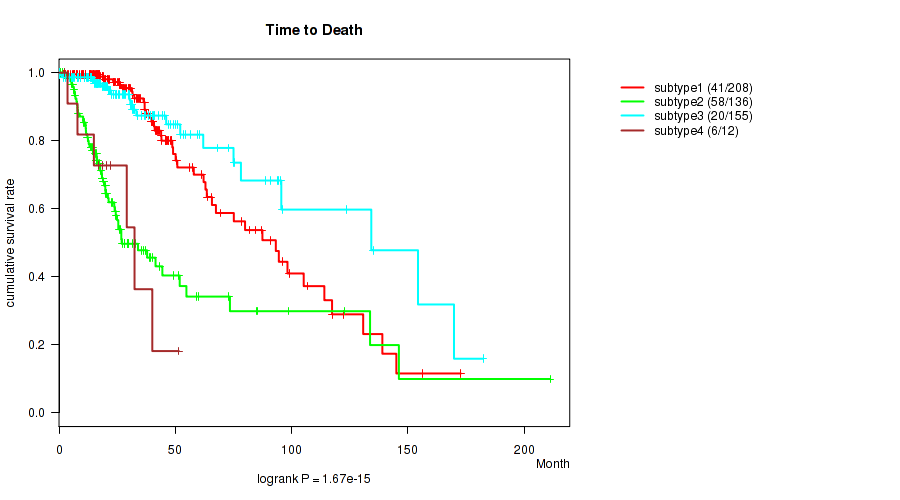
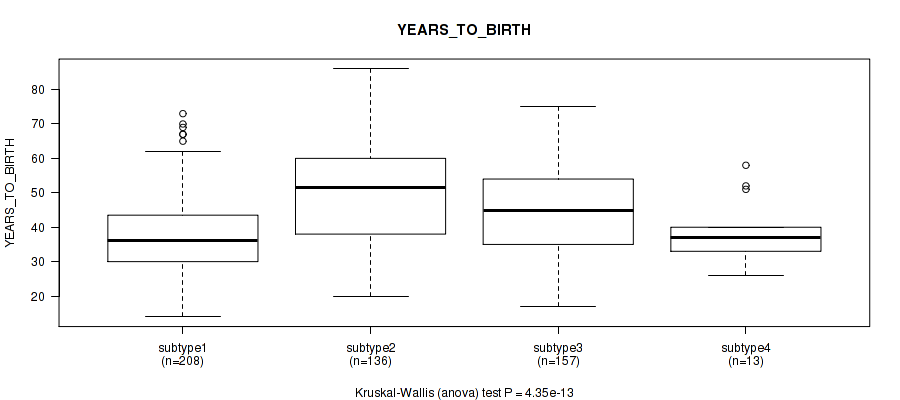
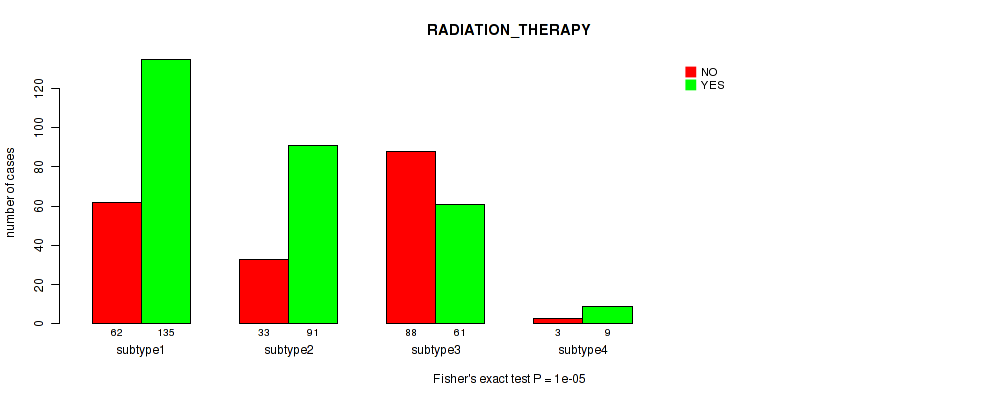
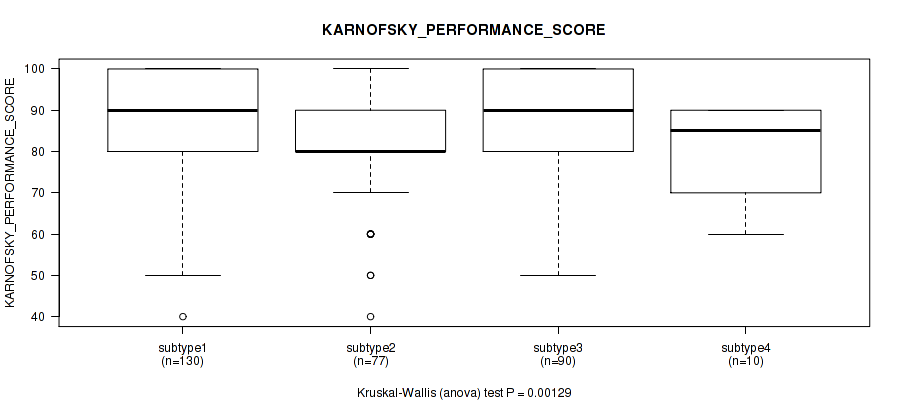
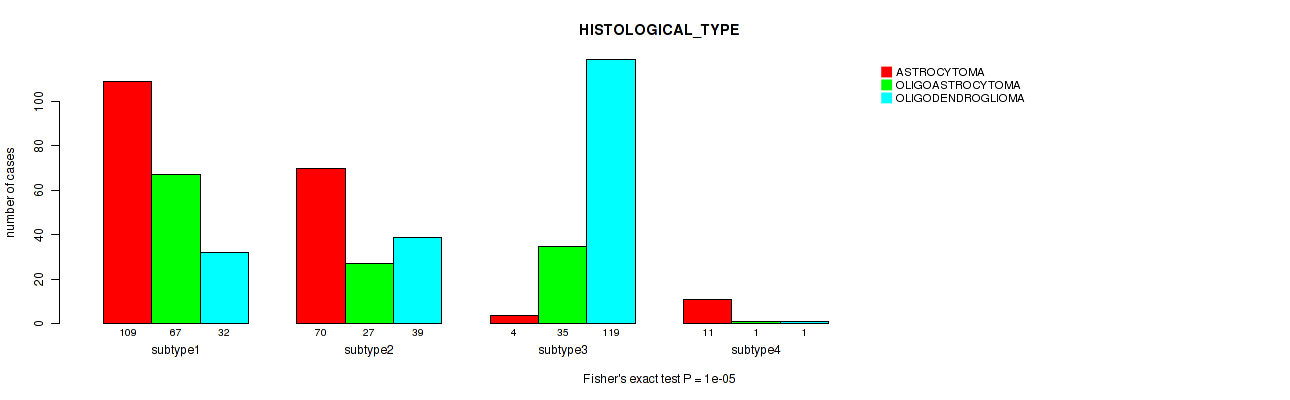
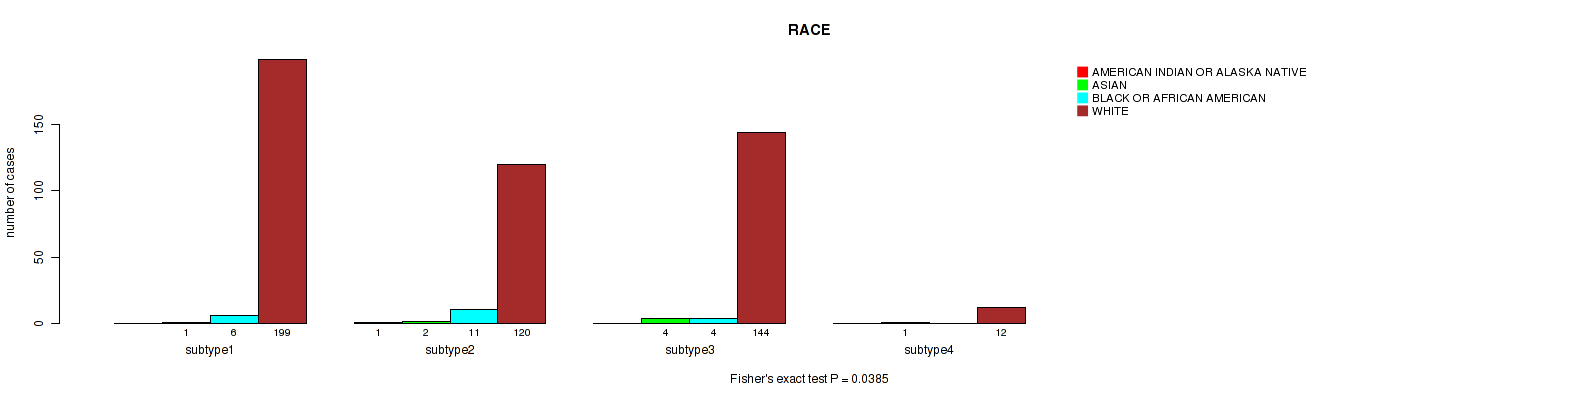
4 subtypes identified in current cancer cohort by 'METHLYATION CNMF'. These subtypes correlate to 'Time to Death', 'YEARS_TO_BIRTH', 'RADIATION_THERAPY', 'KARNOFSKY_PERFORMANCE_SCORE', 'HISTOLOGICAL_TYPE', and 'RACE'.
-
CNMF clustering analysis on RPPA data identified 4 subtypes that correlate to 'Time to Death', 'GENDER', and 'HISTOLOGICAL_TYPE'.
-
Consensus hierarchical clustering analysis on RPPA data identified 3 subtypes that correlate to 'Time to Death' and 'HISTOLOGICAL_TYPE'.
-
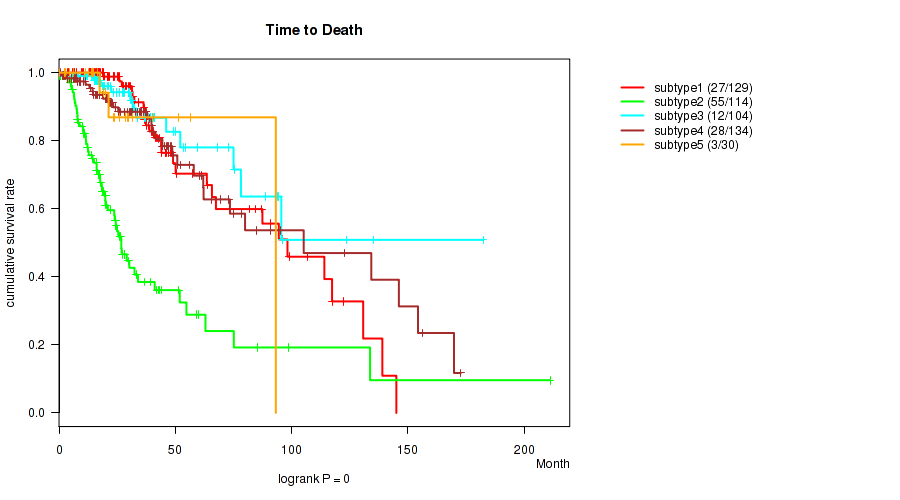
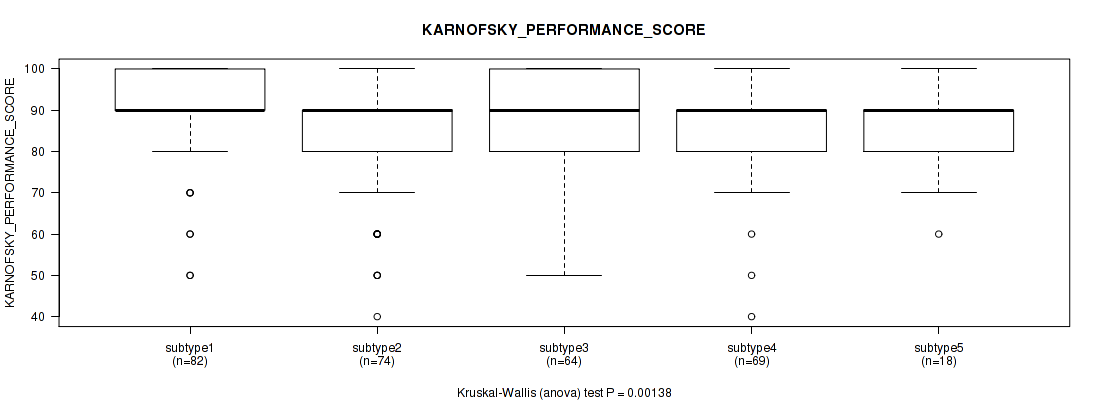
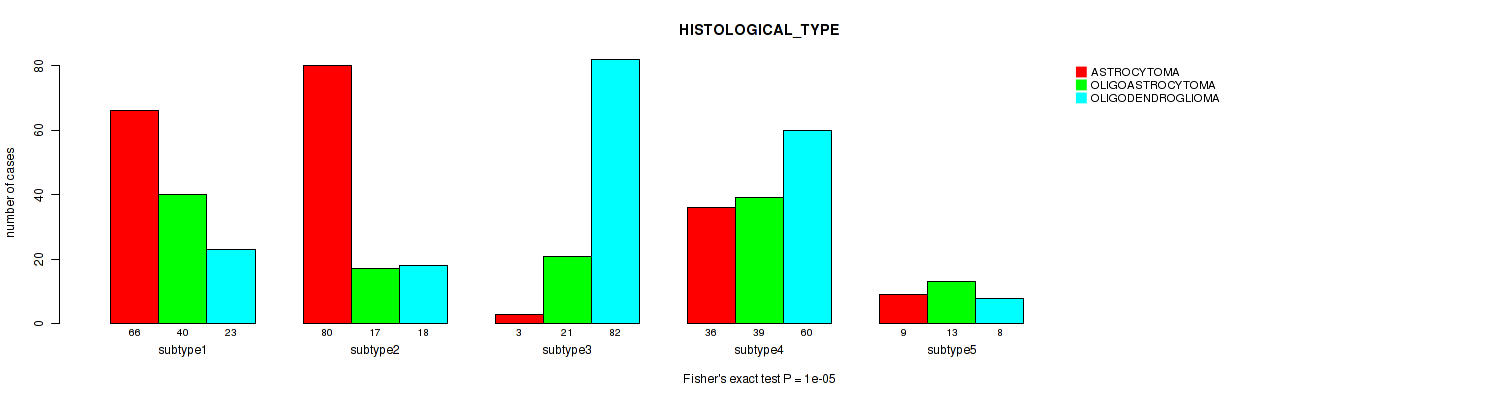
CNMF clustering analysis on sequencing-based mRNA expression data identified 5 subtypes that correlate to 'Time to Death', 'YEARS_TO_BIRTH', 'RADIATION_THERAPY', 'KARNOFSKY_PERFORMANCE_SCORE', and 'HISTOLOGICAL_TYPE'.
-
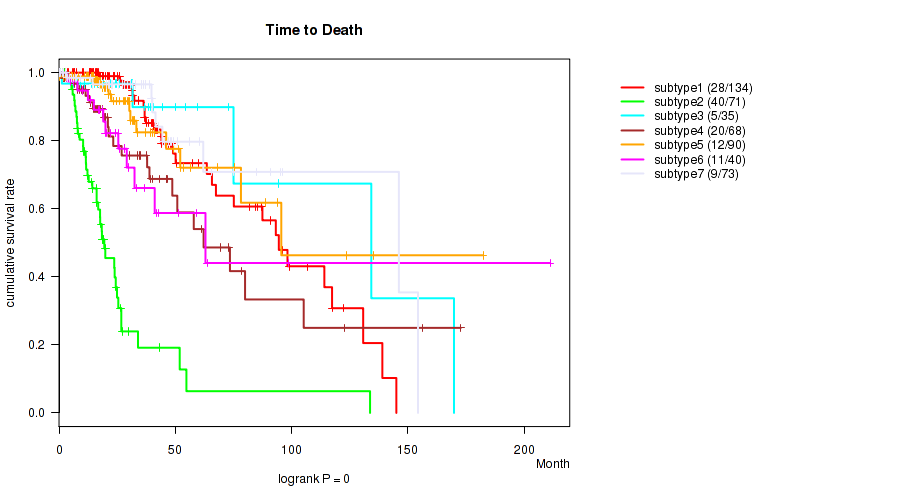
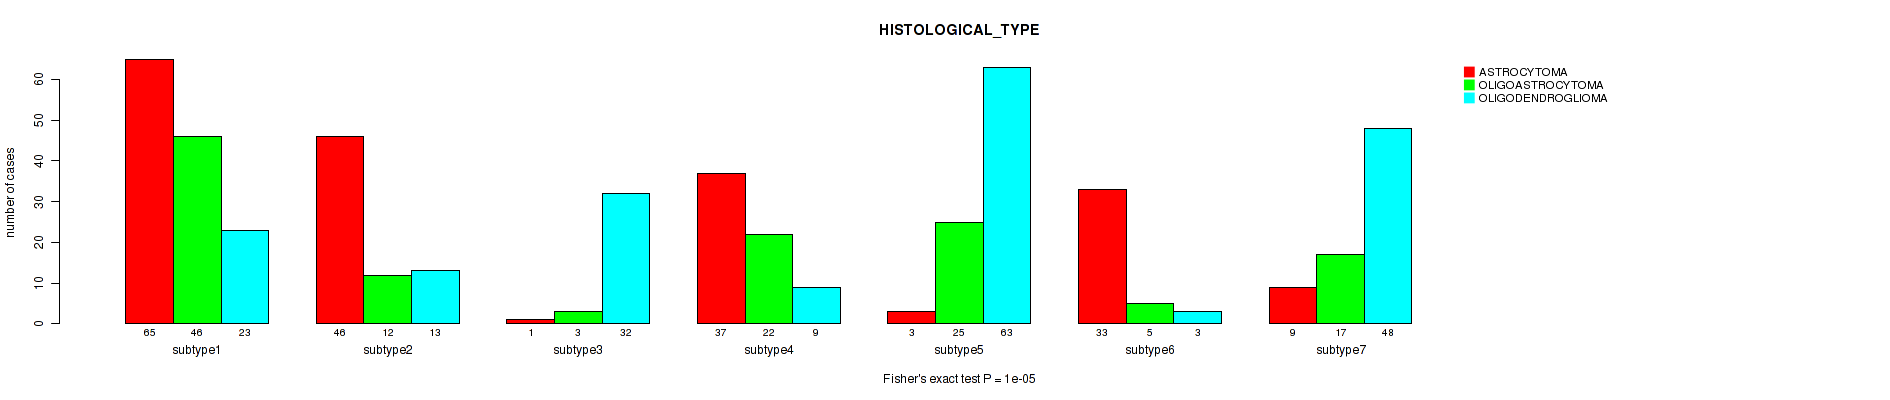
Consensus hierarchical clustering analysis on sequencing-based mRNA expression data identified 7 subtypes that correlate to 'Time to Death', 'YEARS_TO_BIRTH', 'RADIATION_THERAPY', 'KARNOFSKY_PERFORMANCE_SCORE', and 'HISTOLOGICAL_TYPE'.
-
4 subtypes identified in current cancer cohort by 'MIRSEQ CNMF'. These subtypes correlate to 'Time to Death', 'RADIATION_THERAPY', and 'HISTOLOGICAL_TYPE'.
-
3 subtypes identified in current cancer cohort by 'MIRSEQ CHIERARCHICAL'. These subtypes correlate to 'Time to Death', 'YEARS_TO_BIRTH', 'RADIATION_THERAPY', 'KARNOFSKY_PERFORMANCE_SCORE', and 'HISTOLOGICAL_TYPE'.
-
4 subtypes identified in current cancer cohort by 'MIRseq Mature CNMF subtypes'. These subtypes correlate to 'Time to Death', 'RADIATION_THERAPY', 'KARNOFSKY_PERFORMANCE_SCORE', and 'HISTOLOGICAL_TYPE'.
-
6 subtypes identified in current cancer cohort by 'MIRseq Mature cHierClus subtypes'. These subtypes correlate to 'Time to Death', 'YEARS_TO_BIRTH', 'RADIATION_THERAPY', 'KARNOFSKY_PERFORMANCE_SCORE', 'HISTOLOGICAL_TYPE', and 'RACE'.
Table 1. Get Full Table Overview of the association between subtypes identified by 12 different clustering approaches and 8 clinical features. Shown in the table are P values (Q values). Thresholded by P value < 0.05 and Q value < 0.25, 48 significant findings detected.
|
Clinical Features |
Time to Death |
YEARS TO BIRTH |
GENDER |
RADIATION THERAPY |
KARNOFSKY PERFORMANCE SCORE |
HISTOLOGICAL TYPE |
RACE | ETHNICITY |
| Statistical Tests | logrank test | Kruskal-Wallis (anova) | Fisher's exact test | Fisher's exact test | Kruskal-Wallis (anova) | Fisher's exact test | Fisher's exact test | Fisher's exact test |
| mRNA CNMF subtypes |
0.374 (0.479) |
0.247 (0.37) |
0.102 (0.179) |
0.697 (0.76) |
0.475 (0.562) |
0.0232 (0.0518) |
0.514 (0.595) |
1 (1.00) |
| mRNA cHierClus subtypes |
0.0394 (0.0805) |
0.0787 (0.143) |
0.149 (0.246) |
0.841 (0.849) |
0.364 (0.473) |
0.00846 (0.0193) |
0.222 (0.343) |
0.427 (0.526) |
| Copy Number Ratio CNMF subtypes |
1.21e-14 (1.94e-13) |
2.72e-12 (2.61e-11) |
0.809 (0.835) |
1e-05 (3.69e-05) |
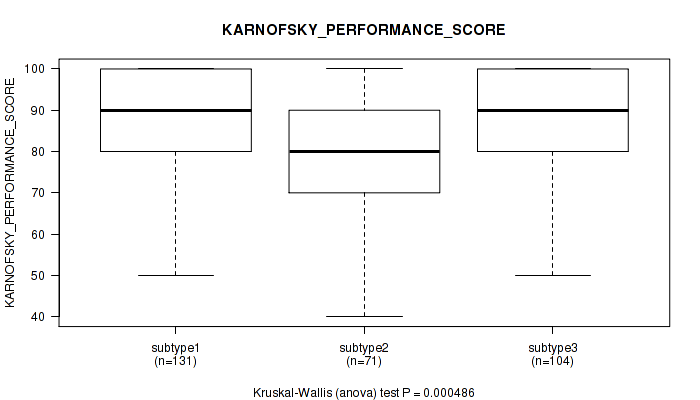
0.000486 (0.00142) |
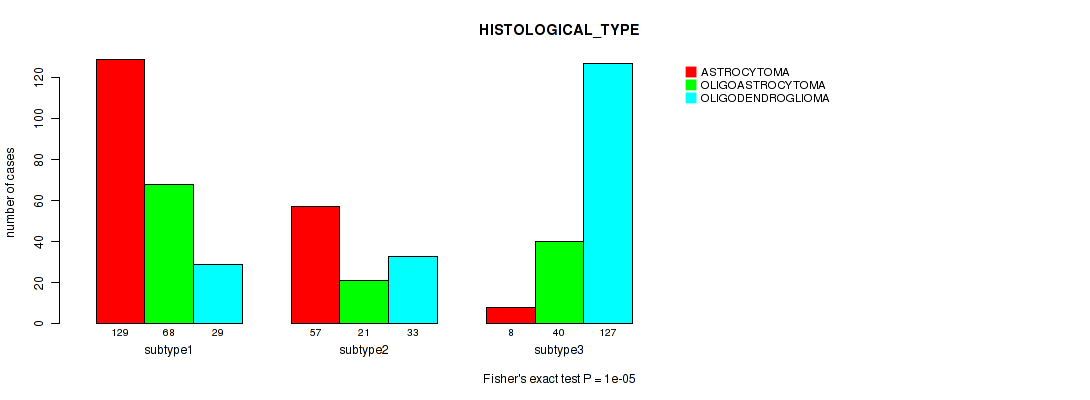
1e-05 (3.69e-05) |
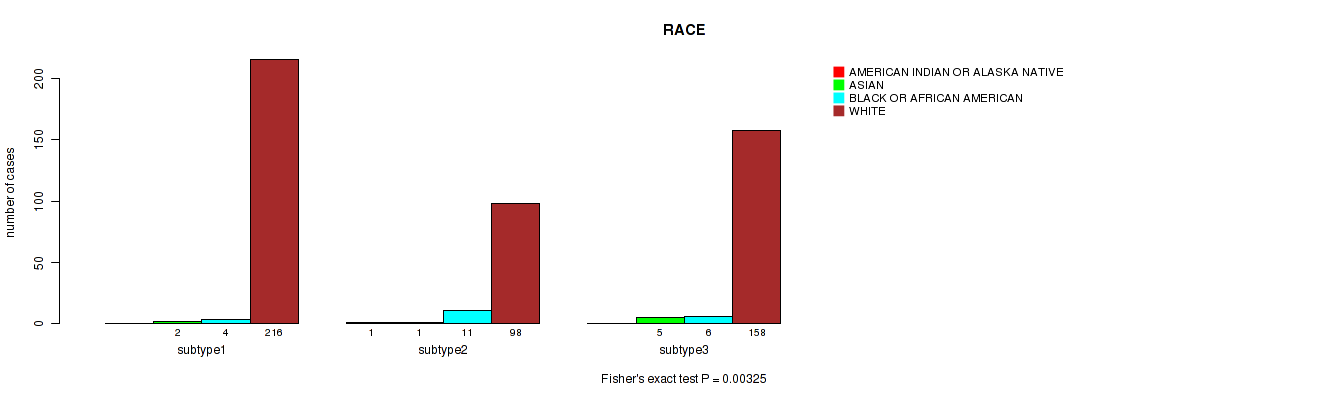
0.00325 (0.00807) |
0.793 (0.835) |
| METHLYATION CNMF |
1.67e-15 (3.2e-14) |
4.35e-13 (4.64e-12) |
0.305 (0.412) |
1e-05 (3.69e-05) |
0.00129 (0.00354) |
1e-05 (3.69e-05) |
0.0385 (0.0803) |
0.619 (0.685) |
| RPPA CNMF subtypes |
0.000357 (0.00111) |
0.0502 (0.0983) |
0.00328 (0.00807) |
0.391 (0.494) |
0.155 (0.253) |
0.0011 (0.00311) |
0.48 (0.562) |
0.552 (0.631) |
| RPPA cHierClus subtypes |
0.00217 (0.00563) |
0.0687 (0.127) |
0.406 (0.506) |
0.065 (0.122) |
0.458 (0.557) |
1e-05 (3.69e-05) |
0.756 (0.806) |
0.284 (0.395) |
| RNAseq CNMF subtypes |
0 (0) |
4.21e-11 (3.67e-10) |
0.708 (0.764) |
1e-05 (3.69e-05) |
0.00138 (0.00368) |
1e-05 (3.69e-05) |
0.329 (0.439) |
0.121 (0.203) |
| RNAseq cHierClus subtypes |
0 (0) |
1.45e-15 (3.2e-14) |
0.282 (0.395) |
1e-05 (3.69e-05) |
0.000445 (0.00134) |
1e-05 (3.69e-05) |
0.177 (0.283) |
0.834 (0.849) |
| MIRSEQ CNMF |
0.0253 (0.0539) |
0.804 (0.835) |
0.621 (0.685) |
0.00551 (0.0129) |
0.0898 (0.16) |
1e-05 (3.69e-05) |
0.302 (0.412) |
0.259 (0.377) |
| MIRSEQ CHIERARCHICAL |
3.47e-14 (4.77e-13) |
1.78e-08 (1.43e-07) |
0.283 (0.395) |
2e-05 (7.11e-05) |
0.000189 (0.000606) |
1e-05 (3.69e-05) |
0.562 (0.635) |
0.235 (0.357) |
| MIRseq Mature CNMF subtypes |
0.000159 (0.000528) |
0.112 (0.192) |
0.473 (0.562) |
5e-05 (0.000171) |
0.0239 (0.0522) |
1e-05 (3.69e-05) |
0.348 (0.457) |
0.0636 (0.122) |
| MIRseq Mature cHierClus subtypes |
0 (0) |
1.88e-13 (2.26e-12) |
0.217 (0.342) |
1e-05 (3.69e-05) |
0.00414 (0.00993) |
1e-05 (3.69e-05) |
0.0453 (0.0907) |
0.259 (0.377) |
Table S1. Description of clustering approach #1: 'mRNA CNMF subtypes'
| Cluster Labels | 1 | 2 | 3 |
|---|---|---|---|
| Number of samples | 9 | 10 | 8 |
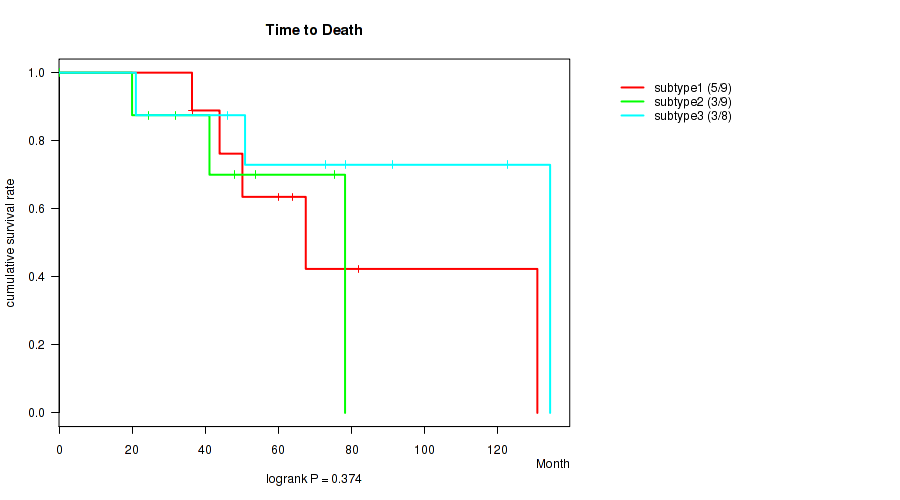
P value = 0.374 (logrank test), Q value = 0.48
Table S2. Clustering Approach #1: 'mRNA CNMF subtypes' versus Clinical Feature #1: 'Time to Death'
| nPatients | nDeath | Duration Range (Median), Month | |
|---|---|---|---|
| ALL | 26 | 11 | 0.3 - 134.3 (52.2) |
| subtype1 | 9 | 5 | 36.4 - 130.8 (60.1) |
| subtype2 | 9 | 3 | 0.3 - 78.2 (41.1) |
| subtype3 | 8 | 3 | 21.0 - 134.3 (75.6) |
Figure S1. Get High-res Image Clustering Approach #1: 'mRNA CNMF subtypes' versus Clinical Feature #1: 'Time to Death'
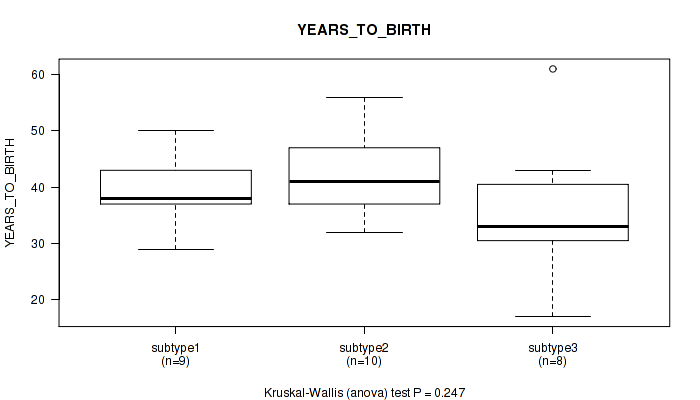
P value = 0.247 (Kruskal-Wallis (anova)), Q value = 0.37
Table S3. Clustering Approach #1: 'mRNA CNMF subtypes' versus Clinical Feature #2: 'YEARS_TO_BIRTH'
| nPatients | Mean (Std.Dev) | |
|---|---|---|
| ALL | 27 | 39.3 (9.1) |
| subtype1 | 9 | 39.2 (6.2) |
| subtype2 | 10 | 42.3 (7.6) |
| subtype3 | 8 | 35.8 (12.6) |
Figure S2. Get High-res Image Clustering Approach #1: 'mRNA CNMF subtypes' versus Clinical Feature #2: 'YEARS_TO_BIRTH'
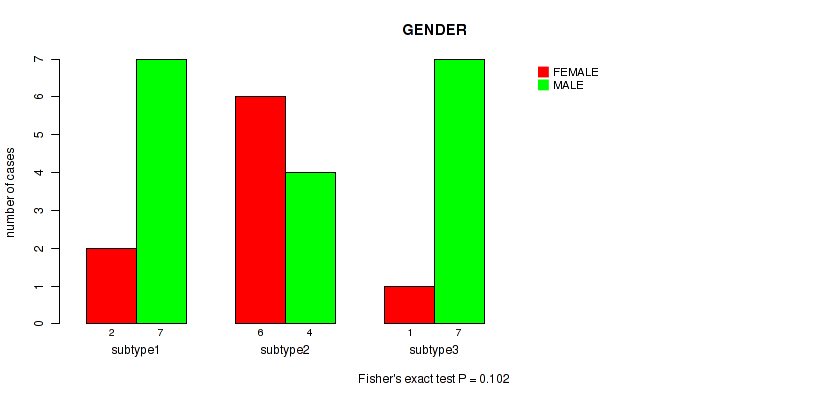
P value = 0.102 (Fisher's exact test), Q value = 0.18
Table S4. Clustering Approach #1: 'mRNA CNMF subtypes' versus Clinical Feature #3: 'GENDER'
| nPatients | FEMALE | MALE |
|---|---|---|
| ALL | 9 | 18 |
| subtype1 | 2 | 7 |
| subtype2 | 6 | 4 |
| subtype3 | 1 | 7 |
Figure S3. Get High-res Image Clustering Approach #1: 'mRNA CNMF subtypes' versus Clinical Feature #3: 'GENDER'
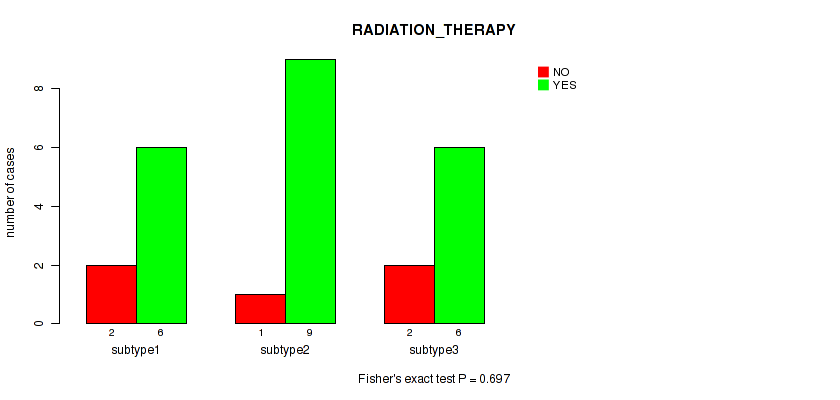
P value = 0.697 (Fisher's exact test), Q value = 0.76
Table S5. Clustering Approach #1: 'mRNA CNMF subtypes' versus Clinical Feature #4: 'RADIATION_THERAPY'
| nPatients | NO | YES |
|---|---|---|
| ALL | 5 | 21 |
| subtype1 | 2 | 6 |
| subtype2 | 1 | 9 |
| subtype3 | 2 | 6 |
Figure S4. Get High-res Image Clustering Approach #1: 'mRNA CNMF subtypes' versus Clinical Feature #4: 'RADIATION_THERAPY'
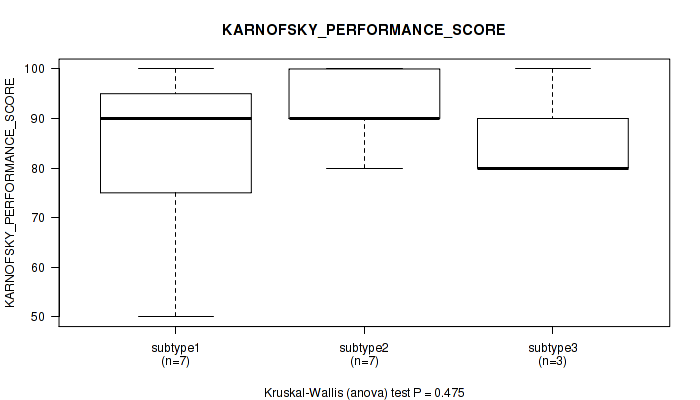
P value = 0.475 (Kruskal-Wallis (anova)), Q value = 0.56
Table S6. Clustering Approach #1: 'mRNA CNMF subtypes' versus Clinical Feature #5: 'KARNOFSKY_PERFORMANCE_SCORE'
| nPatients | Mean (Std.Dev) | |
|---|---|---|
| ALL | 17 | 87.6 (13.5) |
| subtype1 | 7 | 82.9 (18.0) |
| subtype2 | 7 | 92.9 (7.6) |
| subtype3 | 3 | 86.7 (11.5) |
Figure S5. Get High-res Image Clustering Approach #1: 'mRNA CNMF subtypes' versus Clinical Feature #5: 'KARNOFSKY_PERFORMANCE_SCORE'
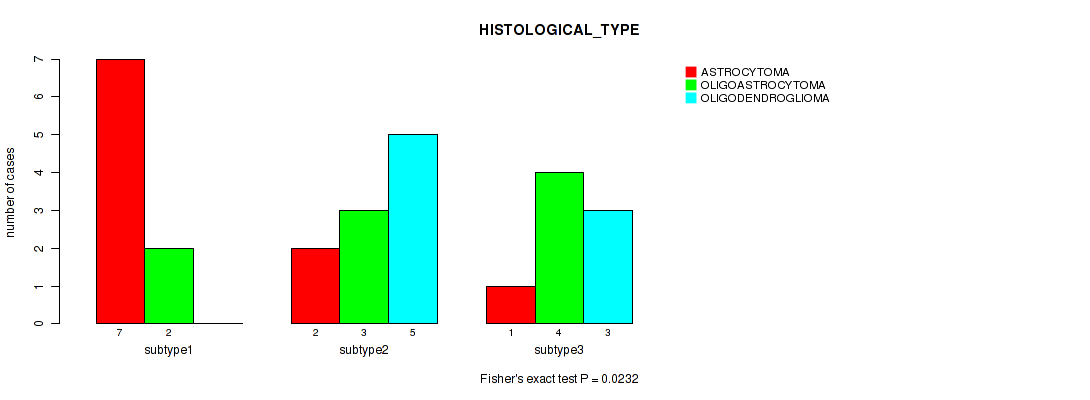
P value = 0.0232 (Fisher's exact test), Q value = 0.052
Table S7. Clustering Approach #1: 'mRNA CNMF subtypes' versus Clinical Feature #6: 'HISTOLOGICAL_TYPE'
| nPatients | ASTROCYTOMA | OLIGOASTROCYTOMA | OLIGODENDROGLIOMA |
|---|---|---|---|
| ALL | 10 | 9 | 8 |
| subtype1 | 7 | 2 | 0 |
| subtype2 | 2 | 3 | 5 |
| subtype3 | 1 | 4 | 3 |
Figure S6. Get High-res Image Clustering Approach #1: 'mRNA CNMF subtypes' versus Clinical Feature #6: 'HISTOLOGICAL_TYPE'
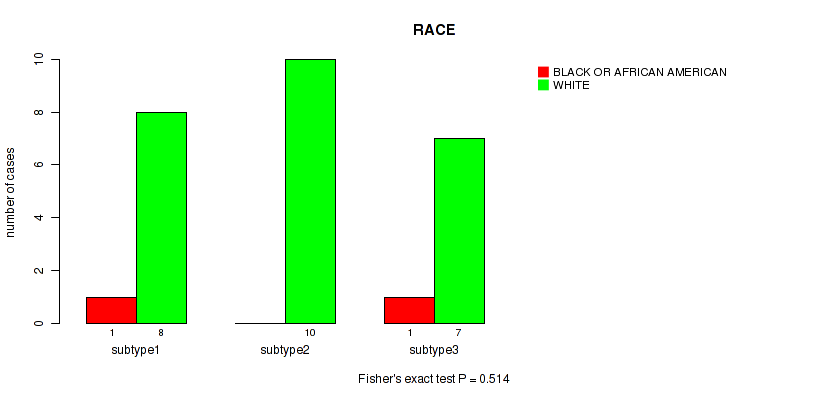
P value = 0.514 (Fisher's exact test), Q value = 0.59
Table S8. Clustering Approach #1: 'mRNA CNMF subtypes' versus Clinical Feature #7: 'RACE'
| nPatients | BLACK OR AFRICAN AMERICAN | WHITE |
|---|---|---|
| ALL | 2 | 25 |
| subtype1 | 1 | 8 |
| subtype2 | 0 | 10 |
| subtype3 | 1 | 7 |
Figure S7. Get High-res Image Clustering Approach #1: 'mRNA CNMF subtypes' versus Clinical Feature #7: 'RACE'
P value = 1 (Fisher's exact test), Q value = 1
Table S9. Clustering Approach #1: 'mRNA CNMF subtypes' versus Clinical Feature #8: 'ETHNICITY'
| nPatients | HISPANIC OR LATINO | NOT HISPANIC OR LATINO |
|---|---|---|
| ALL | 1 | 20 |
| subtype1 | 0 | 6 |
| subtype2 | 1 | 7 |
| subtype3 | 0 | 7 |
Figure S8. Get High-res Image Clustering Approach #1: 'mRNA CNMF subtypes' versus Clinical Feature #8: 'ETHNICITY'
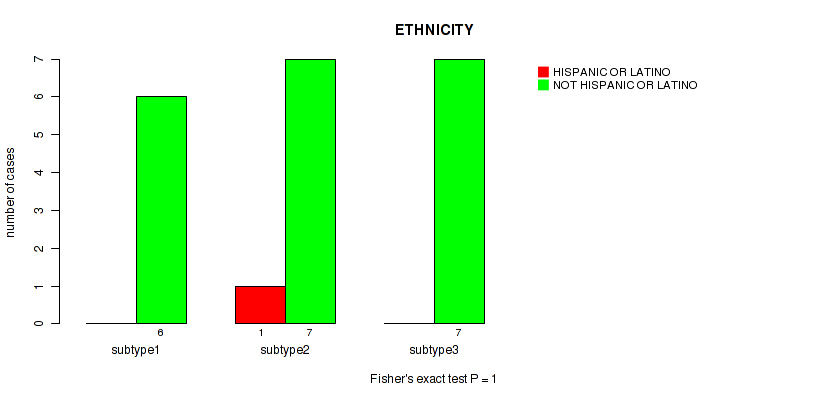
Table S10. Description of clustering approach #2: 'mRNA cHierClus subtypes'
| Cluster Labels | 1 | 2 | 3 | 4 |
|---|---|---|---|---|
| Number of samples | 7 | 7 | 7 | 6 |
P value = 0.0394 (logrank test), Q value = 0.08
Table S11. Clustering Approach #2: 'mRNA cHierClus subtypes' versus Clinical Feature #1: 'Time to Death'
| nPatients | nDeath | Duration Range (Median), Month | |
|---|---|---|---|
| ALL | 26 | 11 | 0.3 - 134.3 (52.2) |
| subtype1 | 7 | 4 | 21.0 - 82.0 (50.1) |
| subtype2 | 7 | 5 | 20.0 - 130.8 (47.9) |
| subtype3 | 6 | 1 | 0.3 - 78.2 (42.7) |
| subtype4 | 6 | 1 | 46.1 - 134.3 (84.7) |
Figure S9. Get High-res Image Clustering Approach #2: 'mRNA cHierClus subtypes' versus Clinical Feature #1: 'Time to Death'
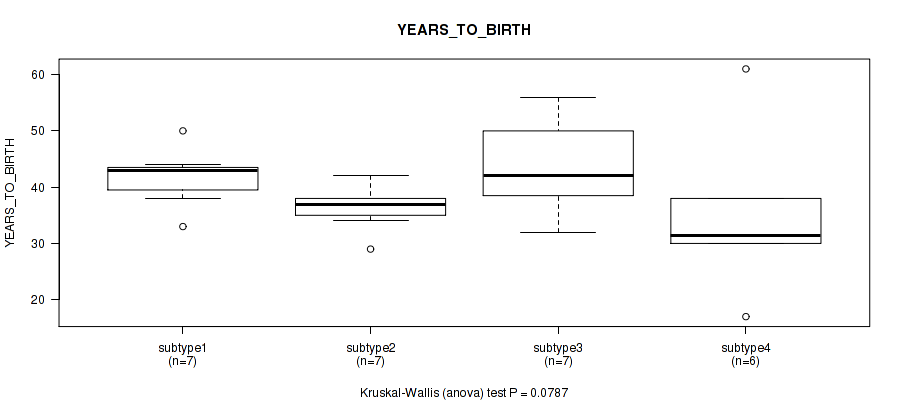
P value = 0.0787 (Kruskal-Wallis (anova)), Q value = 0.14
Table S12. Clustering Approach #2: 'mRNA cHierClus subtypes' versus Clinical Feature #2: 'YEARS_TO_BIRTH'
| nPatients | Mean (Std.Dev) | |
|---|---|---|
| ALL | 27 | 39.3 (9.1) |
| subtype1 | 7 | 41.7 (5.3) |
| subtype2 | 7 | 36.3 (4.0) |
| subtype3 | 7 | 43.9 (8.6) |
| subtype4 | 6 | 34.8 (14.6) |
Figure S10. Get High-res Image Clustering Approach #2: 'mRNA cHierClus subtypes' versus Clinical Feature #2: 'YEARS_TO_BIRTH'
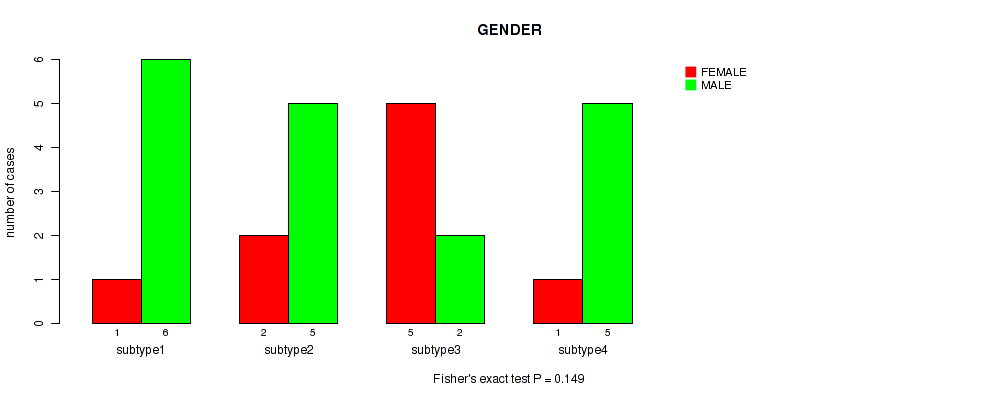
P value = 0.149 (Fisher's exact test), Q value = 0.25
Table S13. Clustering Approach #2: 'mRNA cHierClus subtypes' versus Clinical Feature #3: 'GENDER'
| nPatients | FEMALE | MALE |
|---|---|---|
| ALL | 9 | 18 |
| subtype1 | 1 | 6 |
| subtype2 | 2 | 5 |
| subtype3 | 5 | 2 |
| subtype4 | 1 | 5 |
Figure S11. Get High-res Image Clustering Approach #2: 'mRNA cHierClus subtypes' versus Clinical Feature #3: 'GENDER'
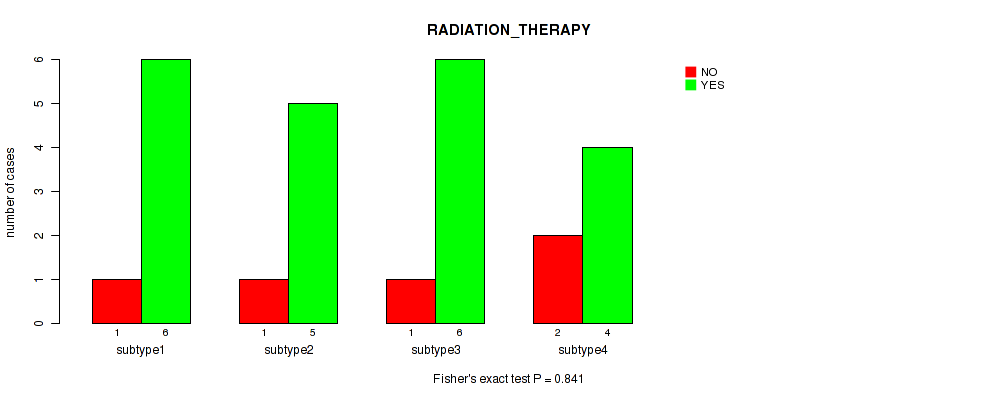
P value = 0.841 (Fisher's exact test), Q value = 0.85
Table S14. Clustering Approach #2: 'mRNA cHierClus subtypes' versus Clinical Feature #4: 'RADIATION_THERAPY'
| nPatients | NO | YES |
|---|---|---|
| ALL | 5 | 21 |
| subtype1 | 1 | 6 |
| subtype2 | 1 | 5 |
| subtype3 | 1 | 6 |
| subtype4 | 2 | 4 |
Figure S12. Get High-res Image Clustering Approach #2: 'mRNA cHierClus subtypes' versus Clinical Feature #4: 'RADIATION_THERAPY'
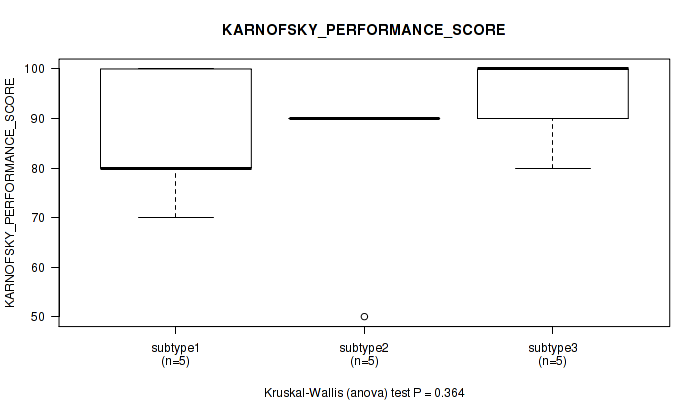
P value = 0.364 (Kruskal-Wallis (anova)), Q value = 0.47
Table S15. Clustering Approach #2: 'mRNA cHierClus subtypes' versus Clinical Feature #5: 'KARNOFSKY_PERFORMANCE_SCORE'
| nPatients | Mean (Std.Dev) | |
|---|---|---|
| ALL | 17 | 87.6 (13.5) |
| subtype1 | 5 | 86.0 (13.4) |
| subtype2 | 5 | 82.0 (17.9) |
| subtype3 | 5 | 94.0 (8.9) |
| subtype4 | 2 | 90.0 (14.1) |
Figure S13. Get High-res Image Clustering Approach #2: 'mRNA cHierClus subtypes' versus Clinical Feature #5: 'KARNOFSKY_PERFORMANCE_SCORE'
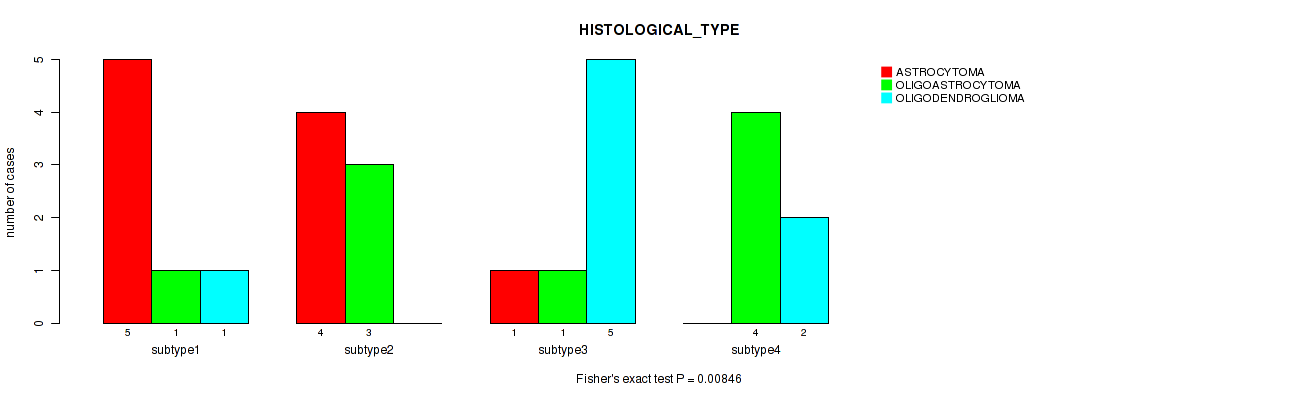
P value = 0.00846 (Fisher's exact test), Q value = 0.019
Table S16. Clustering Approach #2: 'mRNA cHierClus subtypes' versus Clinical Feature #6: 'HISTOLOGICAL_TYPE'
| nPatients | ASTROCYTOMA | OLIGOASTROCYTOMA | OLIGODENDROGLIOMA |
|---|---|---|---|
| ALL | 10 | 9 | 8 |
| subtype1 | 5 | 1 | 1 |
| subtype2 | 4 | 3 | 0 |
| subtype3 | 1 | 1 | 5 |
| subtype4 | 0 | 4 | 2 |
Figure S14. Get High-res Image Clustering Approach #2: 'mRNA cHierClus subtypes' versus Clinical Feature #6: 'HISTOLOGICAL_TYPE'
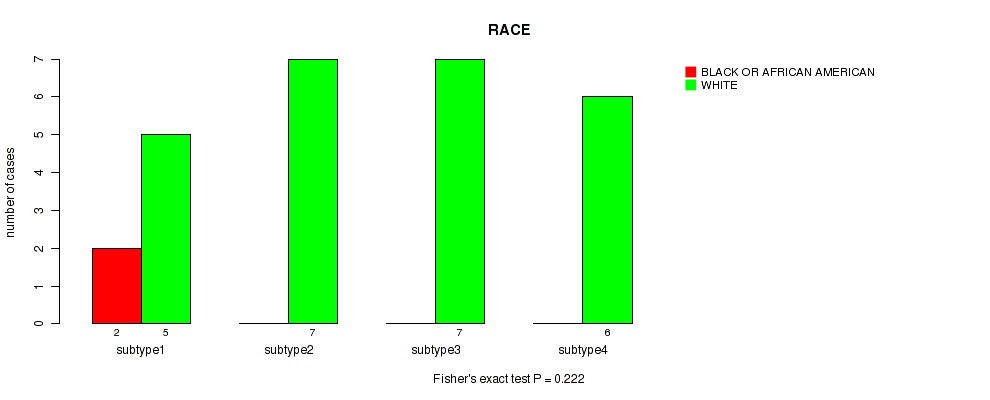
P value = 0.222 (Fisher's exact test), Q value = 0.34
Table S17. Clustering Approach #2: 'mRNA cHierClus subtypes' versus Clinical Feature #7: 'RACE'
| nPatients | BLACK OR AFRICAN AMERICAN | WHITE |
|---|---|---|
| ALL | 2 | 25 |
| subtype1 | 2 | 5 |
| subtype2 | 0 | 7 |
| subtype3 | 0 | 7 |
| subtype4 | 0 | 6 |
Figure S15. Get High-res Image Clustering Approach #2: 'mRNA cHierClus subtypes' versus Clinical Feature #7: 'RACE'
P value = 0.427 (Fisher's exact test), Q value = 0.53
Table S18. Clustering Approach #2: 'mRNA cHierClus subtypes' versus Clinical Feature #8: 'ETHNICITY'
| nPatients | HISPANIC OR LATINO | NOT HISPANIC OR LATINO |
|---|---|---|
| ALL | 1 | 20 |
| subtype1 | 0 | 4 |
| subtype2 | 0 | 6 |
| subtype3 | 1 | 4 |
| subtype4 | 0 | 6 |
Figure S16. Get High-res Image Clustering Approach #2: 'mRNA cHierClus subtypes' versus Clinical Feature #8: 'ETHNICITY'
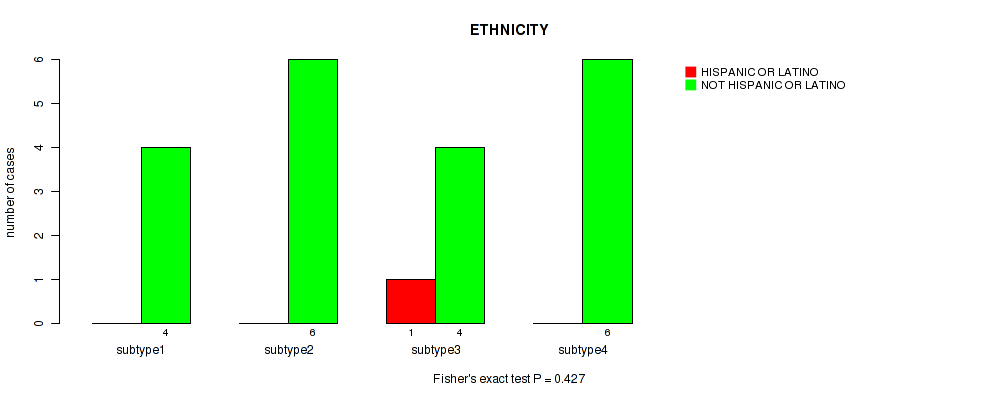
Table S19. Description of clustering approach #3: 'Copy Number Ratio CNMF subtypes'
| Cluster Labels | 1 | 2 | 3 |
|---|---|---|---|
| Number of samples | 226 | 111 | 175 |
P value = 1.21e-14 (logrank test), Q value = 1.9e-13
Table S20. Clustering Approach #3: 'Copy Number Ratio CNMF subtypes' versus Clinical Feature #1: 'Time to Death'
| nPatients | nDeath | Duration Range (Median), Month | |
|---|---|---|---|
| ALL | 508 | 125 | 0.0 - 211.2 (22.4) |
| subtype1 | 226 | 44 | 0.1 - 172.8 (24.3) |
| subtype2 | 110 | 60 | 0.2 - 211.2 (19.3) |
| subtype3 | 172 | 21 | 0.0 - 182.3 (23.2) |
Figure S17. Get High-res Image Clustering Approach #3: 'Copy Number Ratio CNMF subtypes' versus Clinical Feature #1: 'Time to Death'
P value = 2.72e-12 (Kruskal-Wallis (anova)), Q value = 2.6e-11
Table S21. Clustering Approach #3: 'Copy Number Ratio CNMF subtypes' versus Clinical Feature #2: 'YEARS_TO_BIRTH'
| nPatients | Mean (Std.Dev) | |
|---|---|---|
| ALL | 511 | 43.0 (13.3) |
| subtype1 | 226 | 38.4 (12.3) |
| subtype2 | 111 | 48.8 (13.6) |
| subtype3 | 174 | 45.2 (12.5) |
Figure S18. Get High-res Image Clustering Approach #3: 'Copy Number Ratio CNMF subtypes' versus Clinical Feature #2: 'YEARS_TO_BIRTH'
P value = 0.809 (Fisher's exact test), Q value = 0.84
Table S22. Clustering Approach #3: 'Copy Number Ratio CNMF subtypes' versus Clinical Feature #3: 'GENDER'
| nPatients | FEMALE | MALE |
|---|---|---|
| ALL | 228 | 284 |
| subtype1 | 97 | 129 |
| subtype2 | 51 | 60 |
| subtype3 | 80 | 95 |
Figure S19. Get High-res Image Clustering Approach #3: 'Copy Number Ratio CNMF subtypes' versus Clinical Feature #3: 'GENDER'
P value = 1e-05 (Fisher's exact test), Q value = 3.7e-05
Table S23. Clustering Approach #3: 'Copy Number Ratio CNMF subtypes' versus Clinical Feature #4: 'RADIATION_THERAPY'
| nPatients | NO | YES |
|---|---|---|
| ALL | 184 | 295 |
| subtype1 | 69 | 142 |
| subtype2 | 21 | 82 |
| subtype3 | 94 | 71 |
Figure S20. Get High-res Image Clustering Approach #3: 'Copy Number Ratio CNMF subtypes' versus Clinical Feature #4: 'RADIATION_THERAPY'
P value = 0.000486 (Kruskal-Wallis (anova)), Q value = 0.0014
Table S24. Clustering Approach #3: 'Copy Number Ratio CNMF subtypes' versus Clinical Feature #5: 'KARNOFSKY_PERFORMANCE_SCORE'
| nPatients | Mean (Std.Dev) | |
|---|---|---|
| ALL | 306 | 86.7 (12.6) |
| subtype1 | 131 | 88.3 (11.0) |
| subtype2 | 71 | 81.3 (14.6) |
| subtype3 | 104 | 88.3 (12.1) |
Figure S21. Get High-res Image Clustering Approach #3: 'Copy Number Ratio CNMF subtypes' versus Clinical Feature #5: 'KARNOFSKY_PERFORMANCE_SCORE'
P value = 1e-05 (Fisher's exact test), Q value = 3.7e-05
Table S25. Clustering Approach #3: 'Copy Number Ratio CNMF subtypes' versus Clinical Feature #6: 'HISTOLOGICAL_TYPE'
| nPatients | ASTROCYTOMA | OLIGOASTROCYTOMA | OLIGODENDROGLIOMA |
|---|---|---|---|
| ALL | 194 | 129 | 189 |
| subtype1 | 129 | 68 | 29 |
| subtype2 | 57 | 21 | 33 |
| subtype3 | 8 | 40 | 127 |
Figure S22. Get High-res Image Clustering Approach #3: 'Copy Number Ratio CNMF subtypes' versus Clinical Feature #6: 'HISTOLOGICAL_TYPE'
P value = 0.00325 (Fisher's exact test), Q value = 0.0081
Table S26. Clustering Approach #3: 'Copy Number Ratio CNMF subtypes' versus Clinical Feature #7: 'RACE'
| nPatients | AMERICAN INDIAN OR ALASKA NATIVE | ASIAN | BLACK OR AFRICAN AMERICAN | WHITE |
|---|---|---|---|---|
| ALL | 1 | 8 | 21 | 472 |
| subtype1 | 0 | 2 | 4 | 216 |
| subtype2 | 1 | 1 | 11 | 98 |
| subtype3 | 0 | 5 | 6 | 158 |
Figure S23. Get High-res Image Clustering Approach #3: 'Copy Number Ratio CNMF subtypes' versus Clinical Feature #7: 'RACE'
P value = 0.793 (Fisher's exact test), Q value = 0.84
Table S27. Clustering Approach #3: 'Copy Number Ratio CNMF subtypes' versus Clinical Feature #8: 'ETHNICITY'
| nPatients | HISPANIC OR LATINO | NOT HISPANIC OR LATINO |
|---|---|---|
| ALL | 32 | 446 |
| subtype1 | 13 | 198 |
| subtype2 | 6 | 97 |
| subtype3 | 13 | 151 |
Figure S24. Get High-res Image Clustering Approach #3: 'Copy Number Ratio CNMF subtypes' versus Clinical Feature #8: 'ETHNICITY'
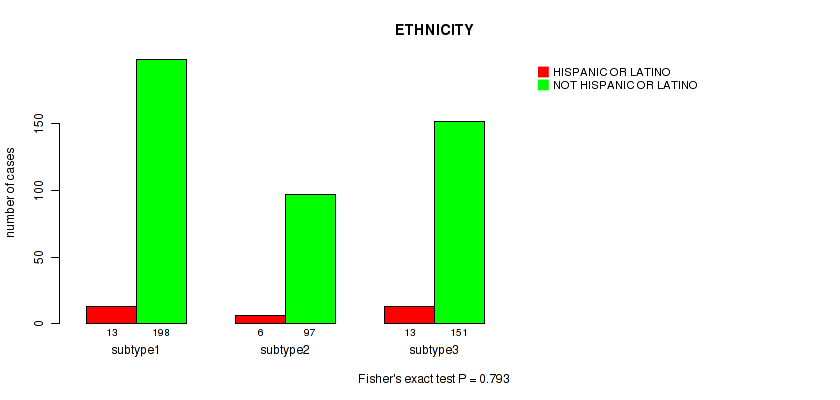
Table S28. Description of clustering approach #4: 'METHLYATION CNMF'
| Cluster Labels | 1 | 2 | 3 | 4 |
|---|---|---|---|---|
| Number of samples | 208 | 136 | 158 | 13 |
P value = 1.67e-15 (logrank test), Q value = 3.2e-14
Table S29. Clustering Approach #4: 'METHLYATION CNMF' versus Clinical Feature #1: 'Time to Death'
| nPatients | nDeath | Duration Range (Median), Month | |
|---|---|---|---|
| ALL | 511 | 125 | 0.0 - 211.2 (22.3) |
| subtype1 | 208 | 41 | 0.0 - 172.8 (27.7) |
| subtype2 | 136 | 58 | 0.1 - 211.2 (17.9) |
| subtype3 | 155 | 20 | 0.1 - 182.3 (23.2) |
| subtype4 | 12 | 6 | 2.3 - 51.5 (19.6) |
Figure S25. Get High-res Image Clustering Approach #4: 'METHLYATION CNMF' versus Clinical Feature #1: 'Time to Death'
P value = 4.35e-13 (Kruskal-Wallis (anova)), Q value = 4.6e-12
Table S30. Clustering Approach #4: 'METHLYATION CNMF' versus Clinical Feature #2: 'YEARS_TO_BIRTH'
| nPatients | Mean (Std.Dev) | |
|---|---|---|
| ALL | 514 | 42.9 (13.4) |
| subtype1 | 208 | 37.7 (11.2) |
| subtype2 | 136 | 48.9 (14.5) |
| subtype3 | 157 | 45.0 (12.8) |
| subtype4 | 13 | 39.2 (9.1) |
Figure S26. Get High-res Image Clustering Approach #4: 'METHLYATION CNMF' versus Clinical Feature #2: 'YEARS_TO_BIRTH'
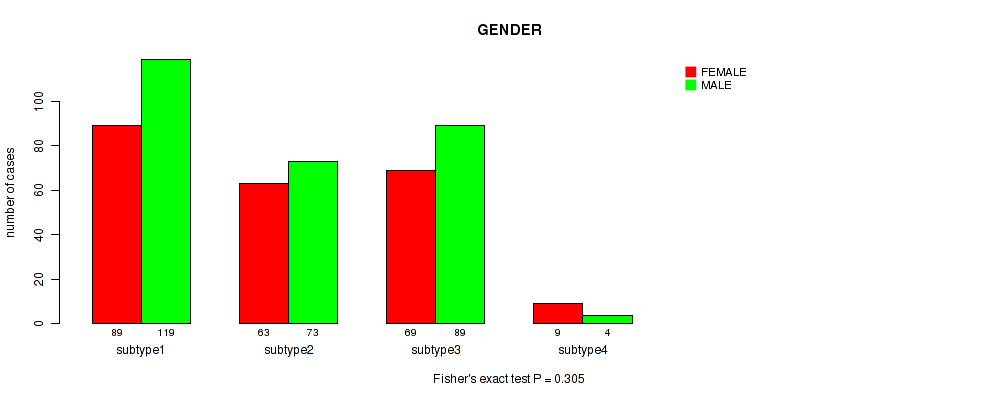
P value = 0.305 (Fisher's exact test), Q value = 0.41
Table S31. Clustering Approach #4: 'METHLYATION CNMF' versus Clinical Feature #3: 'GENDER'
| nPatients | FEMALE | MALE |
|---|---|---|
| ALL | 230 | 285 |
| subtype1 | 89 | 119 |
| subtype2 | 63 | 73 |
| subtype3 | 69 | 89 |
| subtype4 | 9 | 4 |
Figure S27. Get High-res Image Clustering Approach #4: 'METHLYATION CNMF' versus Clinical Feature #3: 'GENDER'
P value = 1e-05 (Fisher's exact test), Q value = 3.7e-05
Table S32. Clustering Approach #4: 'METHLYATION CNMF' versus Clinical Feature #4: 'RADIATION_THERAPY'
| nPatients | NO | YES |
|---|---|---|
| ALL | 186 | 296 |
| subtype1 | 62 | 135 |
| subtype2 | 33 | 91 |
| subtype3 | 88 | 61 |
| subtype4 | 3 | 9 |
Figure S28. Get High-res Image Clustering Approach #4: 'METHLYATION CNMF' versus Clinical Feature #4: 'RADIATION_THERAPY'
P value = 0.00129 (Kruskal-Wallis (anova)), Q value = 0.0035
Table S33. Clustering Approach #4: 'METHLYATION CNMF' versus Clinical Feature #5: 'KARNOFSKY_PERFORMANCE_SCORE'
| nPatients | Mean (Std.Dev) | |
|---|---|---|
| ALL | 307 | 86.6 (12.6) |
| subtype1 | 130 | 88.0 (11.8) |
| subtype2 | 77 | 82.9 (13.6) |
| subtype3 | 90 | 88.7 (12.1) |
| subtype4 | 10 | 80.0 (12.5) |
Figure S29. Get High-res Image Clustering Approach #4: 'METHLYATION CNMF' versus Clinical Feature #5: 'KARNOFSKY_PERFORMANCE_SCORE'
P value = 1e-05 (Fisher's exact test), Q value = 3.7e-05
Table S34. Clustering Approach #4: 'METHLYATION CNMF' versus Clinical Feature #6: 'HISTOLOGICAL_TYPE'
| nPatients | ASTROCYTOMA | OLIGOASTROCYTOMA | OLIGODENDROGLIOMA |
|---|---|---|---|
| ALL | 194 | 130 | 191 |
| subtype1 | 109 | 67 | 32 |
| subtype2 | 70 | 27 | 39 |
| subtype3 | 4 | 35 | 119 |
| subtype4 | 11 | 1 | 1 |
Figure S30. Get High-res Image Clustering Approach #4: 'METHLYATION CNMF' versus Clinical Feature #6: 'HISTOLOGICAL_TYPE'
P value = 0.0385 (Fisher's exact test), Q value = 0.08
Table S35. Clustering Approach #4: 'METHLYATION CNMF' versus Clinical Feature #7: 'RACE'
| nPatients | AMERICAN INDIAN OR ALASKA NATIVE | ASIAN | BLACK OR AFRICAN AMERICAN | WHITE |
|---|---|---|---|---|
| ALL | 1 | 8 | 21 | 475 |
| subtype1 | 0 | 1 | 6 | 199 |
| subtype2 | 1 | 2 | 11 | 120 |
| subtype3 | 0 | 4 | 4 | 144 |
| subtype4 | 0 | 1 | 0 | 12 |
Figure S31. Get High-res Image Clustering Approach #4: 'METHLYATION CNMF' versus Clinical Feature #7: 'RACE'
P value = 0.619 (Fisher's exact test), Q value = 0.68
Table S36. Clustering Approach #4: 'METHLYATION CNMF' versus Clinical Feature #8: 'ETHNICITY'
| nPatients | HISPANIC OR LATINO | NOT HISPANIC OR LATINO |
|---|---|---|
| ALL | 32 | 449 |
| subtype1 | 14 | 178 |
| subtype2 | 6 | 122 |
| subtype3 | 12 | 136 |
| subtype4 | 0 | 13 |
Figure S32. Get High-res Image Clustering Approach #4: 'METHLYATION CNMF' versus Clinical Feature #8: 'ETHNICITY'
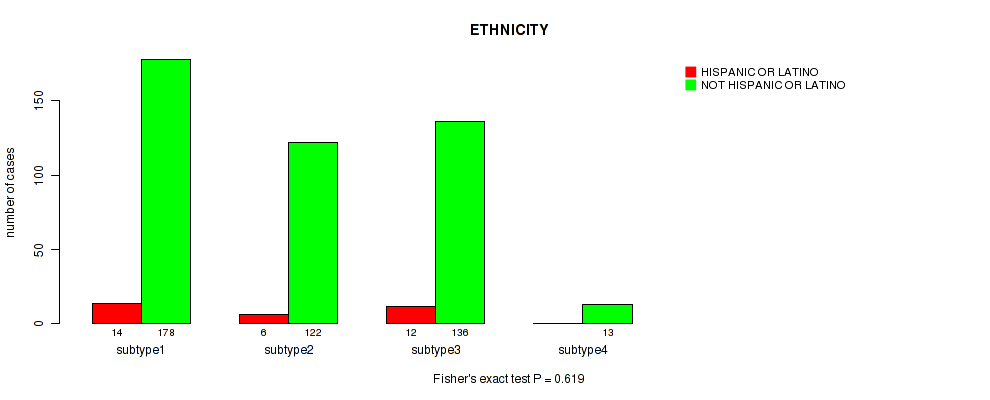
Table S37. Description of clustering approach #5: 'RPPA CNMF subtypes'
| Cluster Labels | 1 | 2 | 3 | 4 |
|---|---|---|---|---|
| Number of samples | 90 | 95 | 126 | 117 |
P value = 0.000357 (logrank test), Q value = 0.0011
Table S38. Clustering Approach #5: 'RPPA CNMF subtypes' versus Clinical Feature #1: 'Time to Death'
| nPatients | nDeath | Duration Range (Median), Month | |
|---|---|---|---|
| ALL | 424 | 98 | 0.0 - 211.2 (21.0) |
| subtype1 | 88 | 17 | 0.0 - 117.5 (23.6) |
| subtype2 | 94 | 37 | 0.1 - 156.2 (19.5) |
| subtype3 | 126 | 22 | 0.1 - 211.2 (24.8) |
| subtype4 | 116 | 22 | 0.1 - 154.4 (18.6) |
Figure S33. Get High-res Image Clustering Approach #5: 'RPPA CNMF subtypes' versus Clinical Feature #1: 'Time to Death'
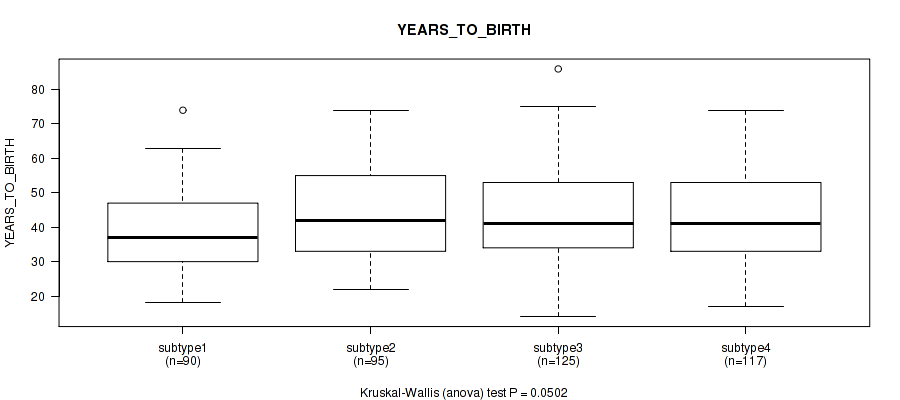
P value = 0.0502 (Kruskal-Wallis (anova)), Q value = 0.098
Table S39. Clustering Approach #5: 'RPPA CNMF subtypes' versus Clinical Feature #2: 'YEARS_TO_BIRTH'
| nPatients | Mean (Std.Dev) | |
|---|---|---|
| ALL | 427 | 42.7 (13.3) |
| subtype1 | 90 | 39.2 (12.0) |
| subtype2 | 95 | 44.0 (13.9) |
| subtype3 | 125 | 43.3 (13.1) |
| subtype4 | 117 | 43.7 (13.8) |
Figure S34. Get High-res Image Clustering Approach #5: 'RPPA CNMF subtypes' versus Clinical Feature #2: 'YEARS_TO_BIRTH'
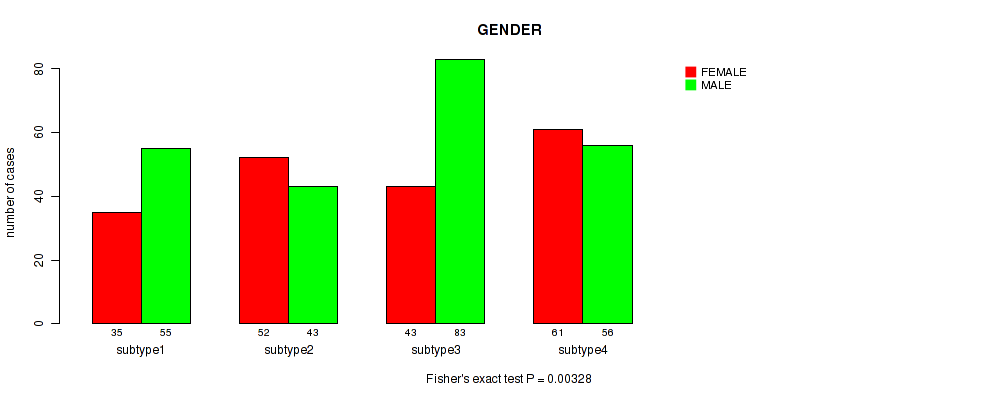
P value = 0.00328 (Fisher's exact test), Q value = 0.0081
Table S40. Clustering Approach #5: 'RPPA CNMF subtypes' versus Clinical Feature #3: 'GENDER'
| nPatients | FEMALE | MALE |
|---|---|---|
| ALL | 191 | 237 |
| subtype1 | 35 | 55 |
| subtype2 | 52 | 43 |
| subtype3 | 43 | 83 |
| subtype4 | 61 | 56 |
Figure S35. Get High-res Image Clustering Approach #5: 'RPPA CNMF subtypes' versus Clinical Feature #3: 'GENDER'
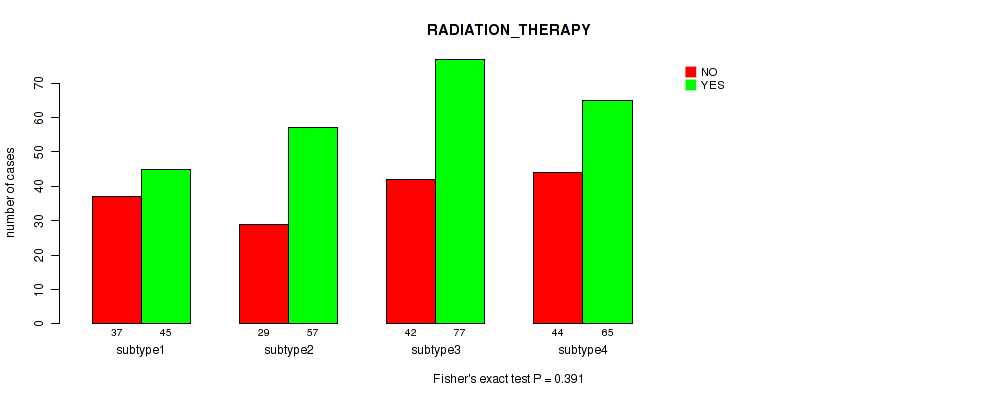
P value = 0.391 (Fisher's exact test), Q value = 0.49
Table S41. Clustering Approach #5: 'RPPA CNMF subtypes' versus Clinical Feature #4: 'RADIATION_THERAPY'
| nPatients | NO | YES |
|---|---|---|
| ALL | 152 | 244 |
| subtype1 | 37 | 45 |
| subtype2 | 29 | 57 |
| subtype3 | 42 | 77 |
| subtype4 | 44 | 65 |
Figure S36. Get High-res Image Clustering Approach #5: 'RPPA CNMF subtypes' versus Clinical Feature #4: 'RADIATION_THERAPY'
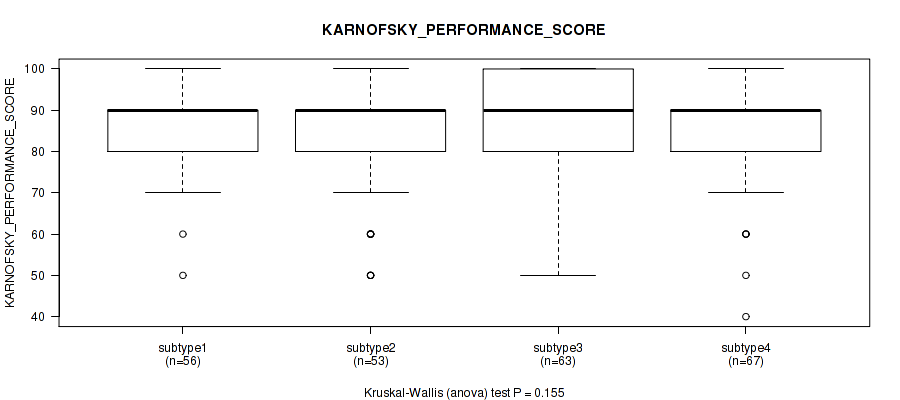
P value = 0.155 (Kruskal-Wallis (anova)), Q value = 0.25
Table S42. Clustering Approach #5: 'RPPA CNMF subtypes' versus Clinical Feature #5: 'KARNOFSKY_PERFORMANCE_SCORE'
| nPatients | Mean (Std.Dev) | |
|---|---|---|
| ALL | 239 | 85.7 (12.8) |
| subtype1 | 56 | 86.8 (10.8) |
| subtype2 | 53 | 82.5 (14.7) |
| subtype3 | 63 | 88.3 (11.7) |
| subtype4 | 67 | 85.1 (13.3) |
Figure S37. Get High-res Image Clustering Approach #5: 'RPPA CNMF subtypes' versus Clinical Feature #5: 'KARNOFSKY_PERFORMANCE_SCORE'
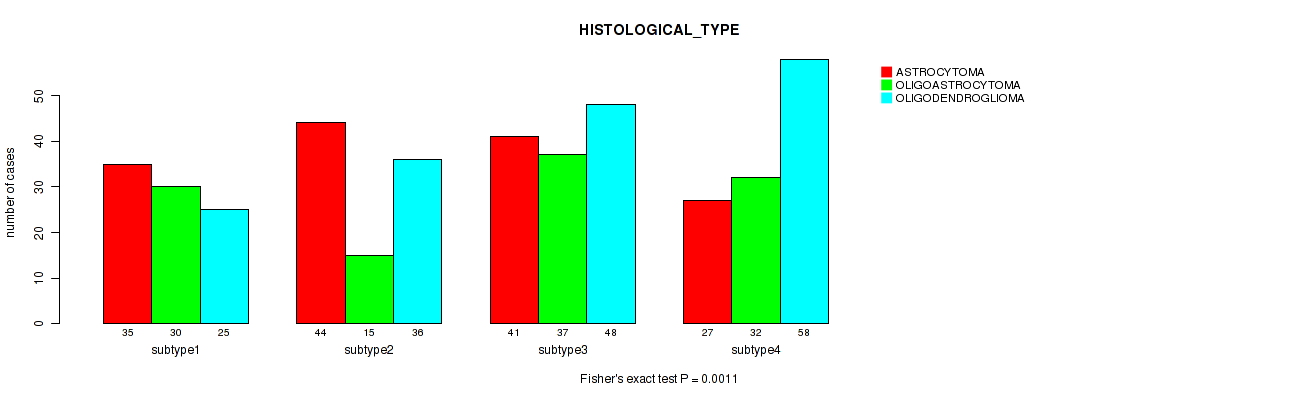
P value = 0.0011 (Fisher's exact test), Q value = 0.0031
Table S43. Clustering Approach #5: 'RPPA CNMF subtypes' versus Clinical Feature #6: 'HISTOLOGICAL_TYPE'
| nPatients | ASTROCYTOMA | OLIGOASTROCYTOMA | OLIGODENDROGLIOMA |
|---|---|---|---|
| ALL | 147 | 114 | 167 |
| subtype1 | 35 | 30 | 25 |
| subtype2 | 44 | 15 | 36 |
| subtype3 | 41 | 37 | 48 |
| subtype4 | 27 | 32 | 58 |
Figure S38. Get High-res Image Clustering Approach #5: 'RPPA CNMF subtypes' versus Clinical Feature #6: 'HISTOLOGICAL_TYPE'
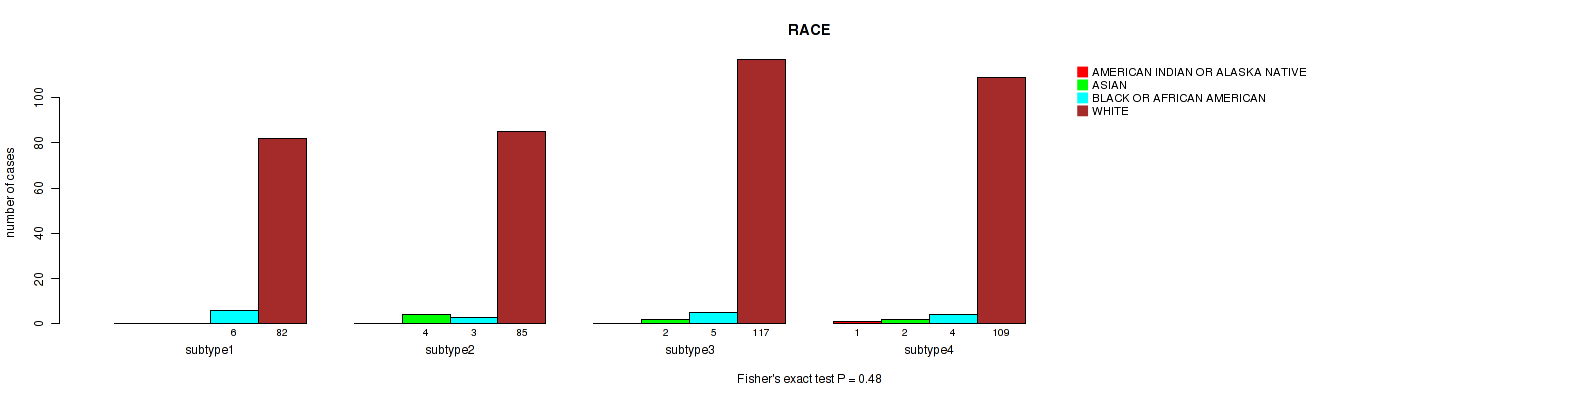
P value = 0.48 (Fisher's exact test), Q value = 0.56
Table S44. Clustering Approach #5: 'RPPA CNMF subtypes' versus Clinical Feature #7: 'RACE'
| nPatients | AMERICAN INDIAN OR ALASKA NATIVE | ASIAN | BLACK OR AFRICAN AMERICAN | WHITE |
|---|---|---|---|---|
| ALL | 1 | 8 | 18 | 393 |
| subtype1 | 0 | 0 | 6 | 82 |
| subtype2 | 0 | 4 | 3 | 85 |
| subtype3 | 0 | 2 | 5 | 117 |
| subtype4 | 1 | 2 | 4 | 109 |
Figure S39. Get High-res Image Clustering Approach #5: 'RPPA CNMF subtypes' versus Clinical Feature #7: 'RACE'
P value = 0.552 (Fisher's exact test), Q value = 0.63
Table S45. Clustering Approach #5: 'RPPA CNMF subtypes' versus Clinical Feature #8: 'ETHNICITY'
| nPatients | HISPANIC OR LATINO | NOT HISPANIC OR LATINO |
|---|---|---|
| ALL | 26 | 377 |
| subtype1 | 8 | 76 |
| subtype2 | 6 | 83 |
| subtype3 | 7 | 111 |
| subtype4 | 5 | 107 |
Figure S40. Get High-res Image Clustering Approach #5: 'RPPA CNMF subtypes' versus Clinical Feature #8: 'ETHNICITY'
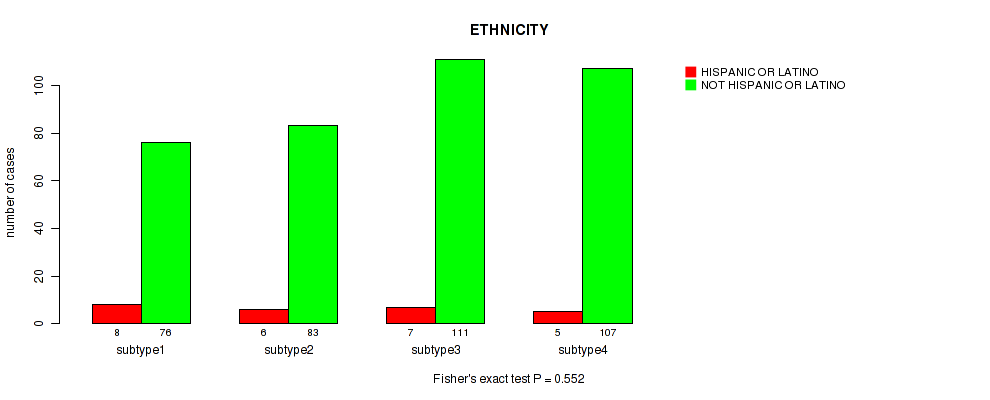
Table S46. Description of clustering approach #6: 'RPPA cHierClus subtypes'
| Cluster Labels | 1 | 2 | 3 |
|---|---|---|---|
| Number of samples | 83 | 160 | 185 |
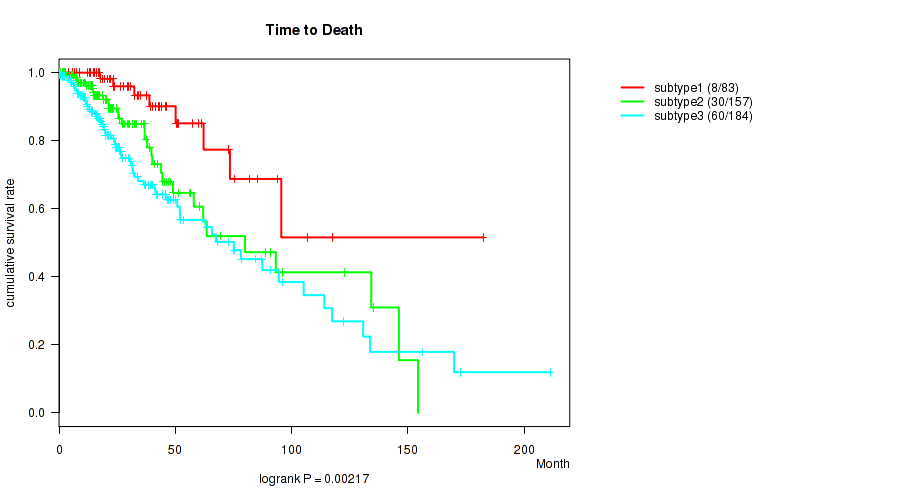
P value = 0.00217 (logrank test), Q value = 0.0056
Table S47. Clustering Approach #6: 'RPPA cHierClus subtypes' versus Clinical Feature #1: 'Time to Death'
| nPatients | nDeath | Duration Range (Median), Month | |
|---|---|---|---|
| ALL | 424 | 98 | 0.0 - 211.2 (21.0) |
| subtype1 | 83 | 8 | 0.0 - 182.3 (23.7) |
| subtype2 | 157 | 30 | 0.1 - 154.4 (18.6) |
| subtype3 | 184 | 60 | 0.1 - 211.2 (21.8) |
Figure S41. Get High-res Image Clustering Approach #6: 'RPPA cHierClus subtypes' versus Clinical Feature #1: 'Time to Death'
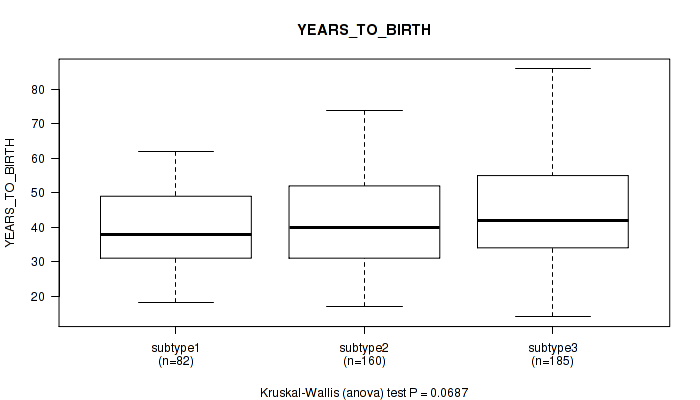
P value = 0.0687 (Kruskal-Wallis (anova)), Q value = 0.13
Table S48. Clustering Approach #6: 'RPPA cHierClus subtypes' versus Clinical Feature #2: 'YEARS_TO_BIRTH'
| nPatients | Mean (Std.Dev) | |
|---|---|---|
| ALL | 427 | 42.7 (13.3) |
| subtype1 | 82 | 40.0 (11.5) |
| subtype2 | 160 | 42.2 (13.3) |
| subtype3 | 185 | 44.3 (14.0) |
Figure S42. Get High-res Image Clustering Approach #6: 'RPPA cHierClus subtypes' versus Clinical Feature #2: 'YEARS_TO_BIRTH'
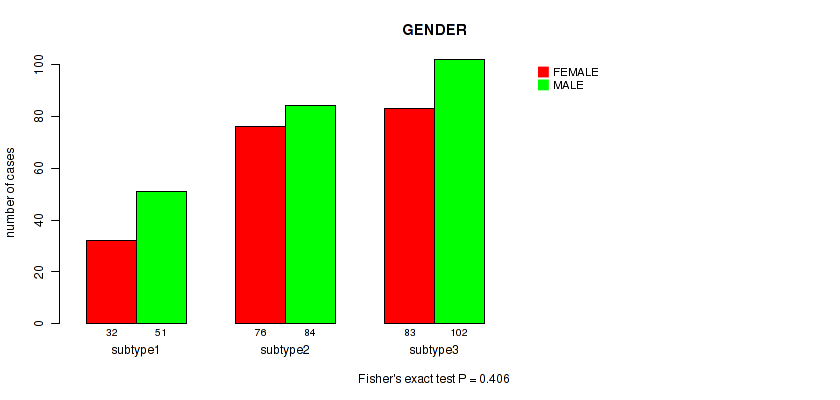
P value = 0.406 (Fisher's exact test), Q value = 0.51
Table S49. Clustering Approach #6: 'RPPA cHierClus subtypes' versus Clinical Feature #3: 'GENDER'
| nPatients | FEMALE | MALE |
|---|---|---|
| ALL | 191 | 237 |
| subtype1 | 32 | 51 |
| subtype2 | 76 | 84 |
| subtype3 | 83 | 102 |
Figure S43. Get High-res Image Clustering Approach #6: 'RPPA cHierClus subtypes' versus Clinical Feature #3: 'GENDER'
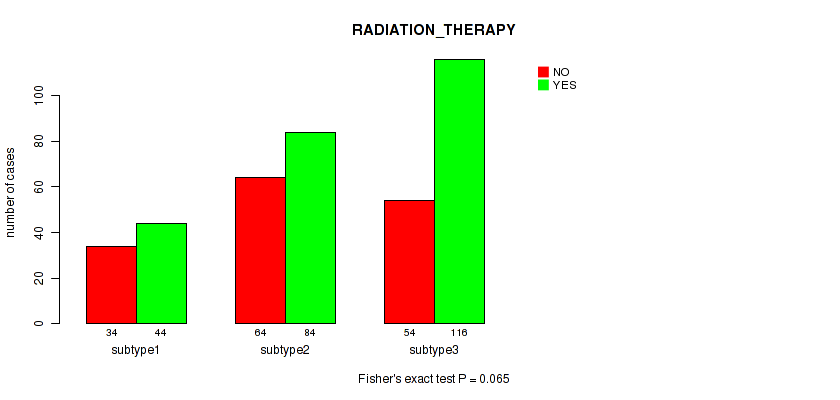
P value = 0.065 (Fisher's exact test), Q value = 0.12
Table S50. Clustering Approach #6: 'RPPA cHierClus subtypes' versus Clinical Feature #4: 'RADIATION_THERAPY'
| nPatients | NO | YES |
|---|---|---|
| ALL | 152 | 244 |
| subtype1 | 34 | 44 |
| subtype2 | 64 | 84 |
| subtype3 | 54 | 116 |
Figure S44. Get High-res Image Clustering Approach #6: 'RPPA cHierClus subtypes' versus Clinical Feature #4: 'RADIATION_THERAPY'
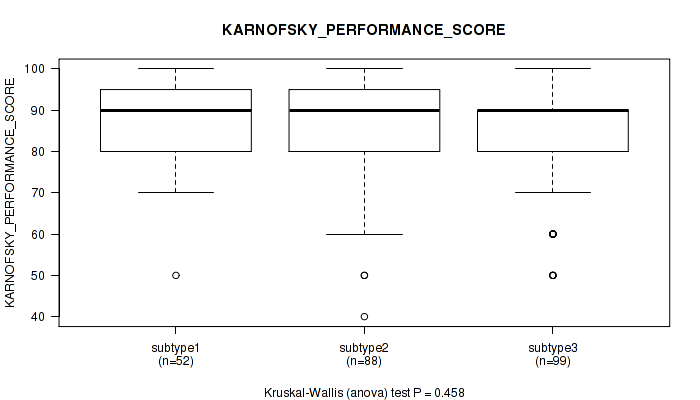
P value = 0.458 (Kruskal-Wallis (anova)), Q value = 0.56
Table S51. Clustering Approach #6: 'RPPA cHierClus subtypes' versus Clinical Feature #5: 'KARNOFSKY_PERFORMANCE_SCORE'
| nPatients | Mean (Std.Dev) | |
|---|---|---|
| ALL | 239 | 85.7 (12.8) |
| subtype1 | 52 | 88.1 (10.1) |
| subtype2 | 88 | 85.7 (13.2) |
| subtype3 | 99 | 84.5 (13.6) |
Figure S45. Get High-res Image Clustering Approach #6: 'RPPA cHierClus subtypes' versus Clinical Feature #5: 'KARNOFSKY_PERFORMANCE_SCORE'
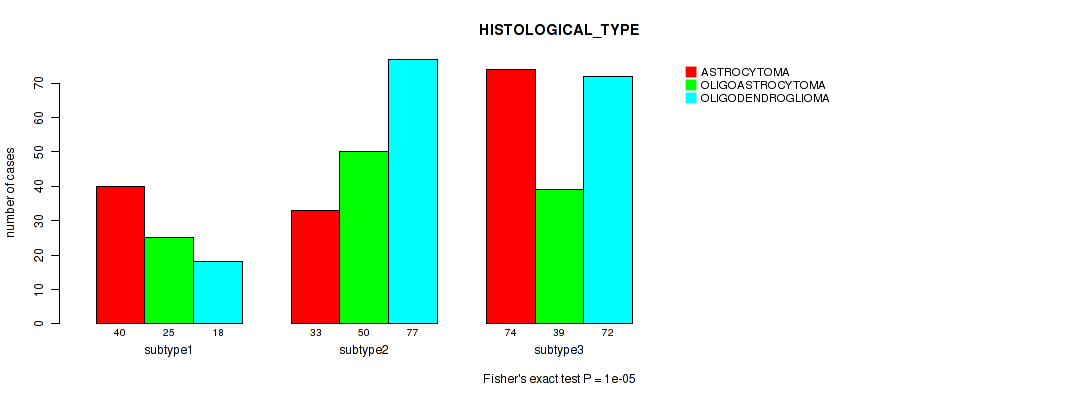
P value = 1e-05 (Fisher's exact test), Q value = 3.7e-05
Table S52. Clustering Approach #6: 'RPPA cHierClus subtypes' versus Clinical Feature #6: 'HISTOLOGICAL_TYPE'
| nPatients | ASTROCYTOMA | OLIGOASTROCYTOMA | OLIGODENDROGLIOMA |
|---|---|---|---|
| ALL | 147 | 114 | 167 |
| subtype1 | 40 | 25 | 18 |
| subtype2 | 33 | 50 | 77 |
| subtype3 | 74 | 39 | 72 |
Figure S46. Get High-res Image Clustering Approach #6: 'RPPA cHierClus subtypes' versus Clinical Feature #6: 'HISTOLOGICAL_TYPE'
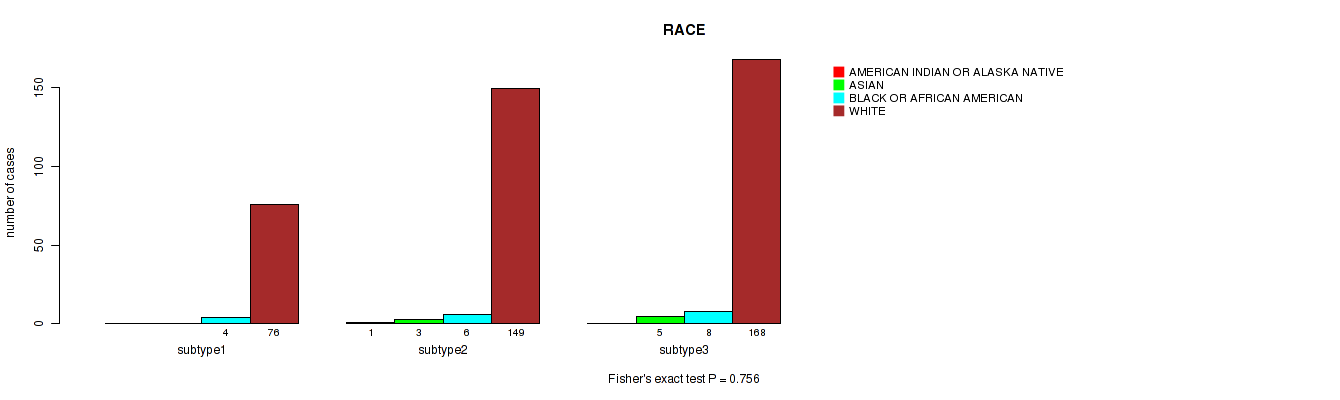
P value = 0.756 (Fisher's exact test), Q value = 0.81
Table S53. Clustering Approach #6: 'RPPA cHierClus subtypes' versus Clinical Feature #7: 'RACE'
| nPatients | AMERICAN INDIAN OR ALASKA NATIVE | ASIAN | BLACK OR AFRICAN AMERICAN | WHITE |
|---|---|---|---|---|
| ALL | 1 | 8 | 18 | 393 |
| subtype1 | 0 | 0 | 4 | 76 |
| subtype2 | 1 | 3 | 6 | 149 |
| subtype3 | 0 | 5 | 8 | 168 |
Figure S47. Get High-res Image Clustering Approach #6: 'RPPA cHierClus subtypes' versus Clinical Feature #7: 'RACE'
P value = 0.284 (Fisher's exact test), Q value = 0.39
Table S54. Clustering Approach #6: 'RPPA cHierClus subtypes' versus Clinical Feature #8: 'ETHNICITY'
| nPatients | HISPANIC OR LATINO | NOT HISPANIC OR LATINO |
|---|---|---|
| ALL | 26 | 377 |
| subtype1 | 8 | 67 |
| subtype2 | 8 | 146 |
| subtype3 | 10 | 164 |
Figure S48. Get High-res Image Clustering Approach #6: 'RPPA cHierClus subtypes' versus Clinical Feature #8: 'ETHNICITY'
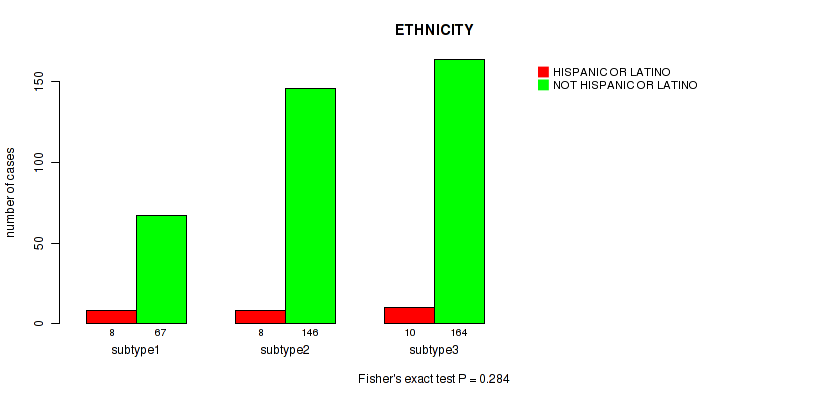
Table S55. Description of clustering approach #7: 'RNAseq CNMF subtypes'
| Cluster Labels | 1 | 2 | 3 | 4 | 5 |
|---|---|---|---|---|---|
| Number of samples | 129 | 115 | 106 | 135 | 30 |
P value = 0 (logrank test), Q value = 0
Table S56. Clustering Approach #7: 'RNAseq CNMF subtypes' versus Clinical Feature #1: 'Time to Death'
| nPatients | nDeath | Duration Range (Median), Month | |
|---|---|---|---|
| ALL | 511 | 125 | 0.0 - 211.2 (22.3) |
| subtype1 | 129 | 27 | 0.0 - 145.1 (28.9) |
| subtype2 | 114 | 55 | 0.1 - 211.2 (17.7) |
| subtype3 | 104 | 12 | 0.1 - 182.3 (22.8) |
| subtype4 | 134 | 28 | 0.1 - 172.8 (25.5) |
| subtype5 | 30 | 3 | 0.2 - 93.2 (19.7) |
Figure S49. Get High-res Image Clustering Approach #7: 'RNAseq CNMF subtypes' versus Clinical Feature #1: 'Time to Death'
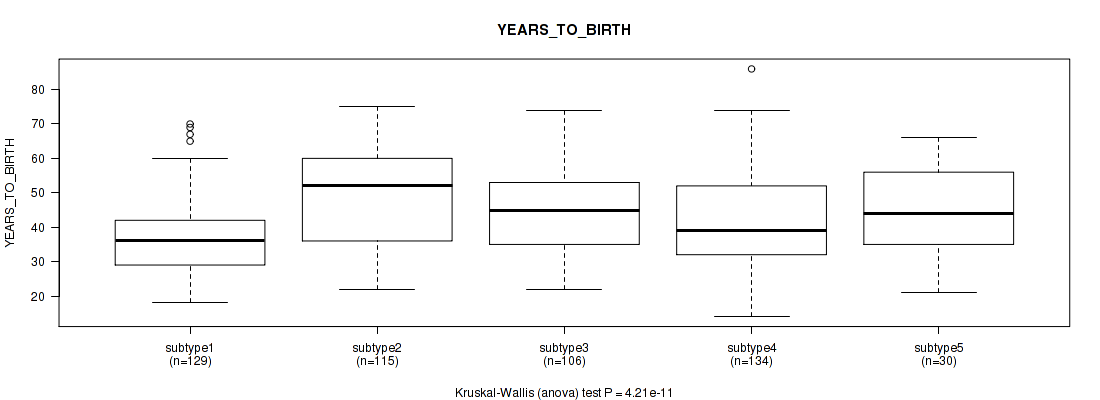
P value = 4.21e-11 (Kruskal-Wallis (anova)), Q value = 3.7e-10
Table S57. Clustering Approach #7: 'RNAseq CNMF subtypes' versus Clinical Feature #2: 'YEARS_TO_BIRTH'
| nPatients | Mean (Std.Dev) | |
|---|---|---|
| ALL | 514 | 42.9 (13.4) |
| subtype1 | 129 | 36.6 (10.6) |
| subtype2 | 115 | 48.9 (14.0) |
| subtype3 | 106 | 45.0 (12.3) |
| subtype4 | 134 | 41.9 (13.8) |
| subtype5 | 30 | 44.6 (11.7) |
Figure S50. Get High-res Image Clustering Approach #7: 'RNAseq CNMF subtypes' versus Clinical Feature #2: 'YEARS_TO_BIRTH'
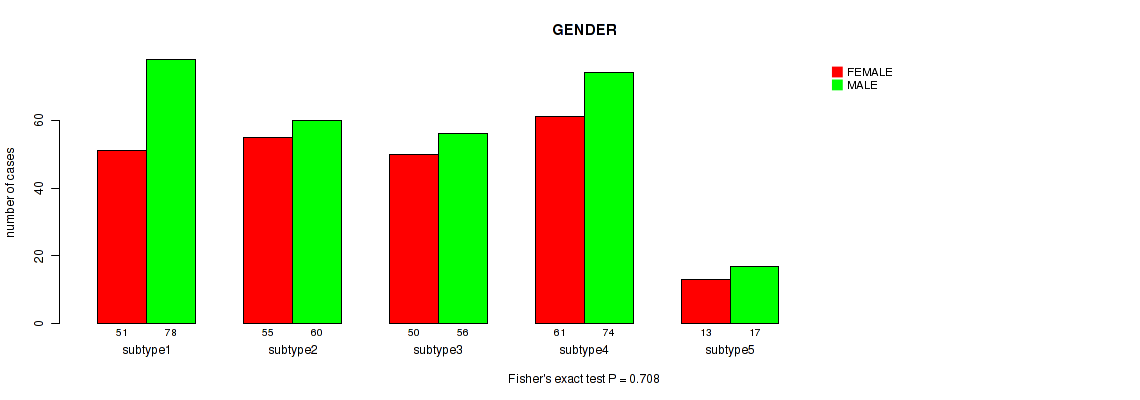
P value = 0.708 (Fisher's exact test), Q value = 0.76
Table S58. Clustering Approach #7: 'RNAseq CNMF subtypes' versus Clinical Feature #3: 'GENDER'
| nPatients | FEMALE | MALE |
|---|---|---|
| ALL | 230 | 285 |
| subtype1 | 51 | 78 |
| subtype2 | 55 | 60 |
| subtype3 | 50 | 56 |
| subtype4 | 61 | 74 |
| subtype5 | 13 | 17 |
Figure S51. Get High-res Image Clustering Approach #7: 'RNAseq CNMF subtypes' versus Clinical Feature #3: 'GENDER'
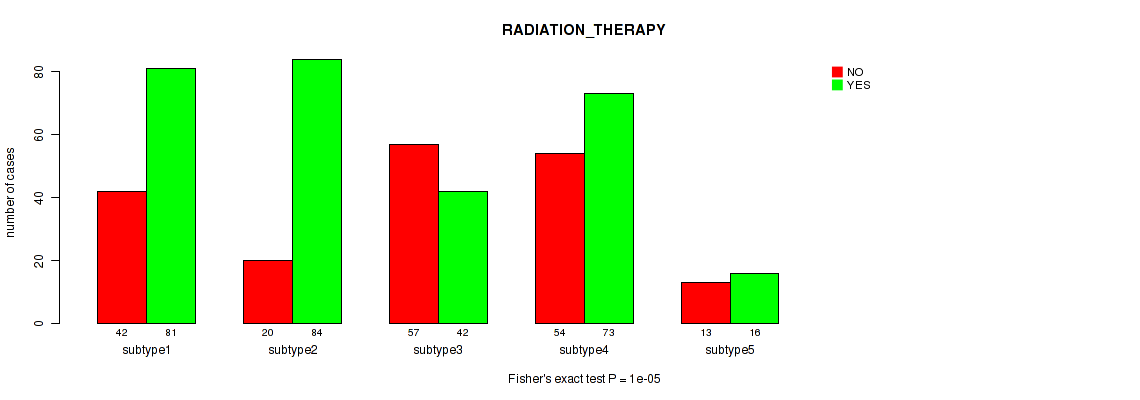
P value = 1e-05 (Fisher's exact test), Q value = 3.7e-05
Table S59. Clustering Approach #7: 'RNAseq CNMF subtypes' versus Clinical Feature #4: 'RADIATION_THERAPY'
| nPatients | NO | YES |
|---|---|---|
| ALL | 186 | 296 |
| subtype1 | 42 | 81 |
| subtype2 | 20 | 84 |
| subtype3 | 57 | 42 |
| subtype4 | 54 | 73 |
| subtype5 | 13 | 16 |
Figure S52. Get High-res Image Clustering Approach #7: 'RNAseq CNMF subtypes' versus Clinical Feature #4: 'RADIATION_THERAPY'
P value = 0.00138 (Kruskal-Wallis (anova)), Q value = 0.0037
Table S60. Clustering Approach #7: 'RNAseq CNMF subtypes' versus Clinical Feature #5: 'KARNOFSKY_PERFORMANCE_SCORE'
| nPatients | Mean (Std.Dev) | |
|---|---|---|
| ALL | 307 | 86.6 (12.6) |
| subtype1 | 82 | 89.3 (10.9) |
| subtype2 | 74 | 82.3 (14.2) |
| subtype3 | 64 | 89.5 (11.9) |
| subtype4 | 69 | 85.4 (12.6) |
| subtype5 | 18 | 87.2 (10.7) |
Figure S53. Get High-res Image Clustering Approach #7: 'RNAseq CNMF subtypes' versus Clinical Feature #5: 'KARNOFSKY_PERFORMANCE_SCORE'
P value = 1e-05 (Fisher's exact test), Q value = 3.7e-05
Table S61. Clustering Approach #7: 'RNAseq CNMF subtypes' versus Clinical Feature #6: 'HISTOLOGICAL_TYPE'
| nPatients | ASTROCYTOMA | OLIGOASTROCYTOMA | OLIGODENDROGLIOMA |
|---|---|---|---|
| ALL | 194 | 130 | 191 |
| subtype1 | 66 | 40 | 23 |
| subtype2 | 80 | 17 | 18 |
| subtype3 | 3 | 21 | 82 |
| subtype4 | 36 | 39 | 60 |
| subtype5 | 9 | 13 | 8 |
Figure S54. Get High-res Image Clustering Approach #7: 'RNAseq CNMF subtypes' versus Clinical Feature #6: 'HISTOLOGICAL_TYPE'
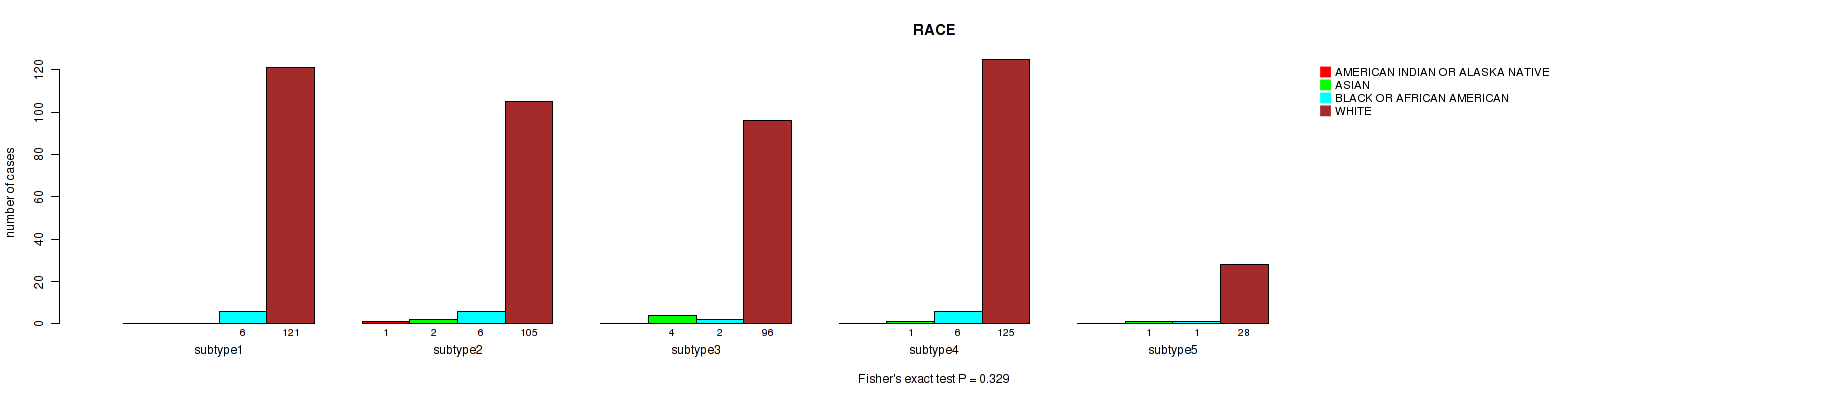
P value = 0.329 (Fisher's exact test), Q value = 0.44
Table S62. Clustering Approach #7: 'RNAseq CNMF subtypes' versus Clinical Feature #7: 'RACE'
| nPatients | AMERICAN INDIAN OR ALASKA NATIVE | ASIAN | BLACK OR AFRICAN AMERICAN | WHITE |
|---|---|---|---|---|
| ALL | 1 | 8 | 21 | 475 |
| subtype1 | 0 | 0 | 6 | 121 |
| subtype2 | 1 | 2 | 6 | 105 |
| subtype3 | 0 | 4 | 2 | 96 |
| subtype4 | 0 | 1 | 6 | 125 |
| subtype5 | 0 | 1 | 1 | 28 |
Figure S55. Get High-res Image Clustering Approach #7: 'RNAseq CNMF subtypes' versus Clinical Feature #7: 'RACE'
P value = 0.121 (Fisher's exact test), Q value = 0.2
Table S63. Clustering Approach #7: 'RNAseq CNMF subtypes' versus Clinical Feature #8: 'ETHNICITY'
| nPatients | HISPANIC OR LATINO | NOT HISPANIC OR LATINO |
|---|---|---|
| ALL | 32 | 449 |
| subtype1 | 8 | 110 |
| subtype2 | 3 | 105 |
| subtype3 | 11 | 87 |
| subtype4 | 7 | 121 |
| subtype5 | 3 | 26 |
Figure S56. Get High-res Image Clustering Approach #7: 'RNAseq CNMF subtypes' versus Clinical Feature #8: 'ETHNICITY'
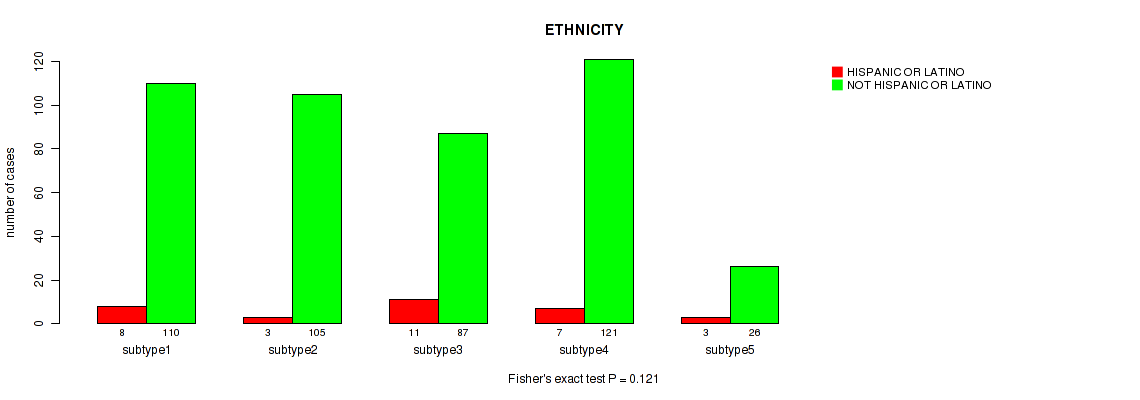
Table S64. Description of clustering approach #8: 'RNAseq cHierClus subtypes'
| Cluster Labels | 1 | 2 | 3 | 4 | 5 | 6 | 7 |
|---|---|---|---|---|---|---|---|
| Number of samples | 134 | 71 | 36 | 68 | 91 | 41 | 74 |
P value = 0 (logrank test), Q value = 0
Table S65. Clustering Approach #8: 'RNAseq cHierClus subtypes' versus Clinical Feature #1: 'Time to Death'
| nPatients | nDeath | Duration Range (Median), Month | |
|---|---|---|---|
| ALL | 511 | 125 | 0.0 - 211.2 (22.3) |
| subtype1 | 134 | 28 | 0.0 - 145.1 (29.5) |
| subtype2 | 71 | 40 | 0.1 - 133.7 (14.3) |
| subtype3 | 35 | 5 | 0.1 - 169.8 (26.1) |
| subtype4 | 68 | 20 | 0.1 - 172.8 (19.8) |
| subtype5 | 90 | 12 | 0.1 - 182.3 (22.8) |
| subtype6 | 40 | 11 | 0.1 - 211.2 (24.2) |
| subtype7 | 73 | 9 | 0.1 - 154.4 (27.2) |
Figure S57. Get High-res Image Clustering Approach #8: 'RNAseq cHierClus subtypes' versus Clinical Feature #1: 'Time to Death'
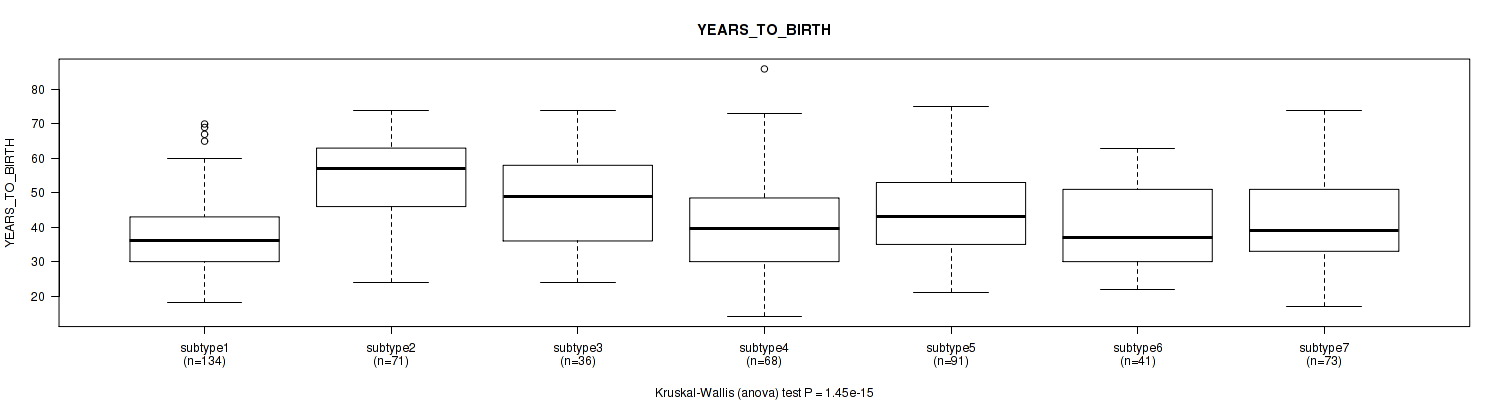
P value = 1.45e-15 (Kruskal-Wallis (anova)), Q value = 3.2e-14
Table S66. Clustering Approach #8: 'RNAseq cHierClus subtypes' versus Clinical Feature #2: 'YEARS_TO_BIRTH'
| nPatients | Mean (Std.Dev) | |
|---|---|---|
| ALL | 514 | 42.9 (13.4) |
| subtype1 | 134 | 37.2 (10.6) |
| subtype2 | 71 | 53.9 (12.3) |
| subtype3 | 36 | 49.0 (13.9) |
| subtype4 | 68 | 41.0 (14.2) |
| subtype5 | 91 | 44.4 (12.3) |
| subtype6 | 41 | 39.9 (11.4) |
| subtype7 | 73 | 41.5 (12.9) |
Figure S58. Get High-res Image Clustering Approach #8: 'RNAseq cHierClus subtypes' versus Clinical Feature #2: 'YEARS_TO_BIRTH'
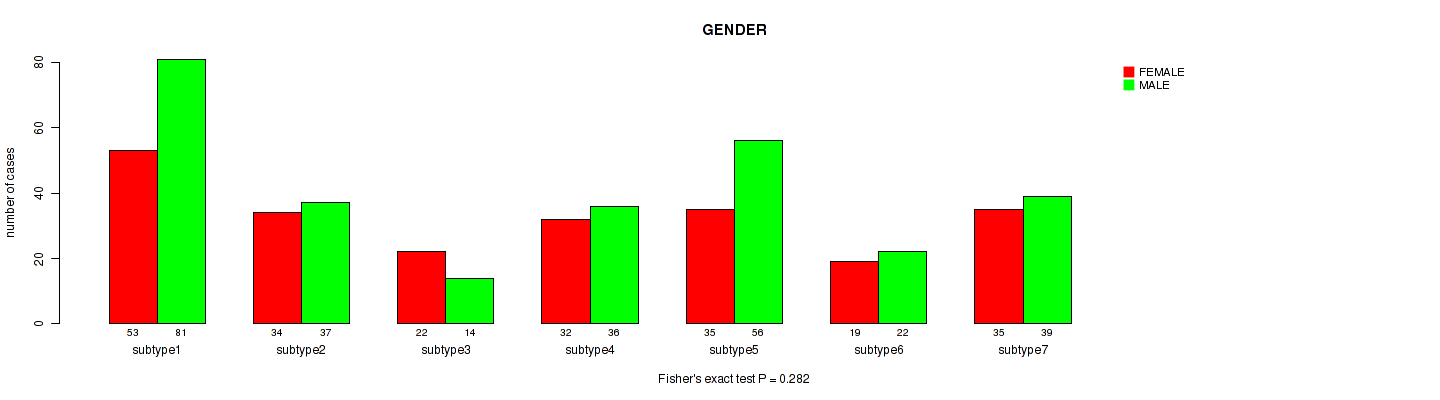
P value = 0.282 (Fisher's exact test), Q value = 0.39
Table S67. Clustering Approach #8: 'RNAseq cHierClus subtypes' versus Clinical Feature #3: 'GENDER'
| nPatients | FEMALE | MALE |
|---|---|---|
| ALL | 230 | 285 |
| subtype1 | 53 | 81 |
| subtype2 | 34 | 37 |
| subtype3 | 22 | 14 |
| subtype4 | 32 | 36 |
| subtype5 | 35 | 56 |
| subtype6 | 19 | 22 |
| subtype7 | 35 | 39 |
Figure S59. Get High-res Image Clustering Approach #8: 'RNAseq cHierClus subtypes' versus Clinical Feature #3: 'GENDER'
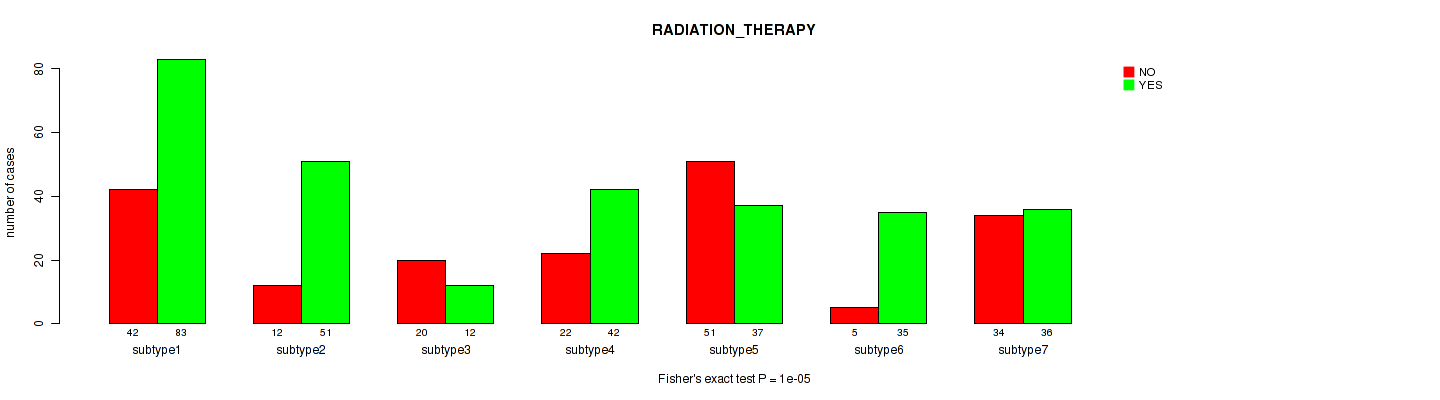
P value = 1e-05 (Fisher's exact test), Q value = 3.7e-05
Table S68. Clustering Approach #8: 'RNAseq cHierClus subtypes' versus Clinical Feature #4: 'RADIATION_THERAPY'
| nPatients | NO | YES |
|---|---|---|
| ALL | 186 | 296 |
| subtype1 | 42 | 83 |
| subtype2 | 12 | 51 |
| subtype3 | 20 | 12 |
| subtype4 | 22 | 42 |
| subtype5 | 51 | 37 |
| subtype6 | 5 | 35 |
| subtype7 | 34 | 36 |
Figure S60. Get High-res Image Clustering Approach #8: 'RNAseq cHierClus subtypes' versus Clinical Feature #4: 'RADIATION_THERAPY'
P value = 0.000445 (Kruskal-Wallis (anova)), Q value = 0.0013
Table S69. Clustering Approach #8: 'RNAseq cHierClus subtypes' versus Clinical Feature #5: 'KARNOFSKY_PERFORMANCE_SCORE'
| nPatients | Mean (Std.Dev) | |
|---|---|---|
| ALL | 307 | 86.6 (12.6) |
| subtype1 | 84 | 89.3 (11.6) |
| subtype2 | 41 | 79.8 (15.1) |
| subtype3 | 23 | 89.1 (14.1) |
| subtype4 | 36 | 85.3 (11.8) |
| subtype5 | 53 | 89.2 (11.4) |
| subtype6 | 31 | 83.9 (11.5) |
| subtype7 | 39 | 86.7 (11.3) |
Figure S61. Get High-res Image Clustering Approach #8: 'RNAseq cHierClus subtypes' versus Clinical Feature #5: 'KARNOFSKY_PERFORMANCE_SCORE'
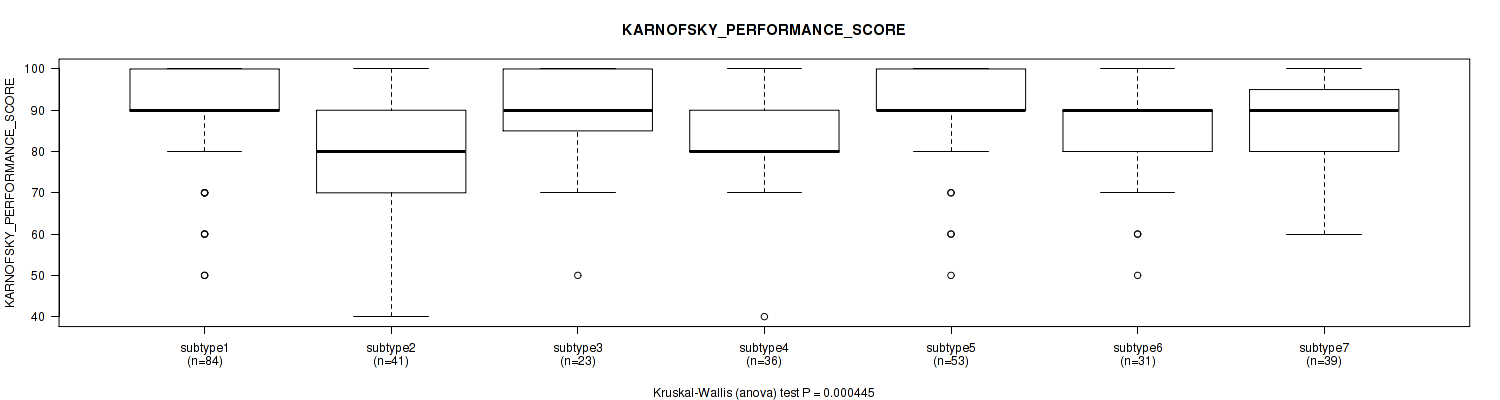
P value = 1e-05 (Fisher's exact test), Q value = 3.7e-05
Table S70. Clustering Approach #8: 'RNAseq cHierClus subtypes' versus Clinical Feature #6: 'HISTOLOGICAL_TYPE'
| nPatients | ASTROCYTOMA | OLIGOASTROCYTOMA | OLIGODENDROGLIOMA |
|---|---|---|---|
| ALL | 194 | 130 | 191 |
| subtype1 | 65 | 46 | 23 |
| subtype2 | 46 | 12 | 13 |
| subtype3 | 1 | 3 | 32 |
| subtype4 | 37 | 22 | 9 |
| subtype5 | 3 | 25 | 63 |
| subtype6 | 33 | 5 | 3 |
| subtype7 | 9 | 17 | 48 |
Figure S62. Get High-res Image Clustering Approach #8: 'RNAseq cHierClus subtypes' versus Clinical Feature #6: 'HISTOLOGICAL_TYPE'
P value = 0.177 (Fisher's exact test), Q value = 0.28
Table S71. Clustering Approach #8: 'RNAseq cHierClus subtypes' versus Clinical Feature #7: 'RACE'
| nPatients | AMERICAN INDIAN OR ALASKA NATIVE | ASIAN | BLACK OR AFRICAN AMERICAN | WHITE |
|---|---|---|---|---|
| ALL | 1 | 8 | 21 | 475 |
| subtype1 | 0 | 0 | 6 | 126 |
| subtype2 | 1 | 1 | 6 | 62 |
| subtype3 | 0 | 1 | 1 | 31 |
| subtype4 | 0 | 1 | 3 | 62 |
| subtype5 | 0 | 4 | 2 | 83 |
| subtype6 | 0 | 1 | 0 | 40 |
| subtype7 | 0 | 0 | 3 | 71 |
Figure S63. Get High-res Image Clustering Approach #8: 'RNAseq cHierClus subtypes' versus Clinical Feature #7: 'RACE'

P value = 0.834 (Fisher's exact test), Q value = 0.85
Table S72. Clustering Approach #8: 'RNAseq cHierClus subtypes' versus Clinical Feature #8: 'ETHNICITY'
| nPatients | HISPANIC OR LATINO | NOT HISPANIC OR LATINO |
|---|---|---|
| ALL | 32 | 449 |
| subtype1 | 9 | 112 |
| subtype2 | 3 | 64 |
| subtype3 | 3 | 29 |
| subtype4 | 4 | 58 |
| subtype5 | 8 | 78 |
| subtype6 | 2 | 39 |
| subtype7 | 3 | 69 |
Figure S64. Get High-res Image Clustering Approach #8: 'RNAseq cHierClus subtypes' versus Clinical Feature #8: 'ETHNICITY'
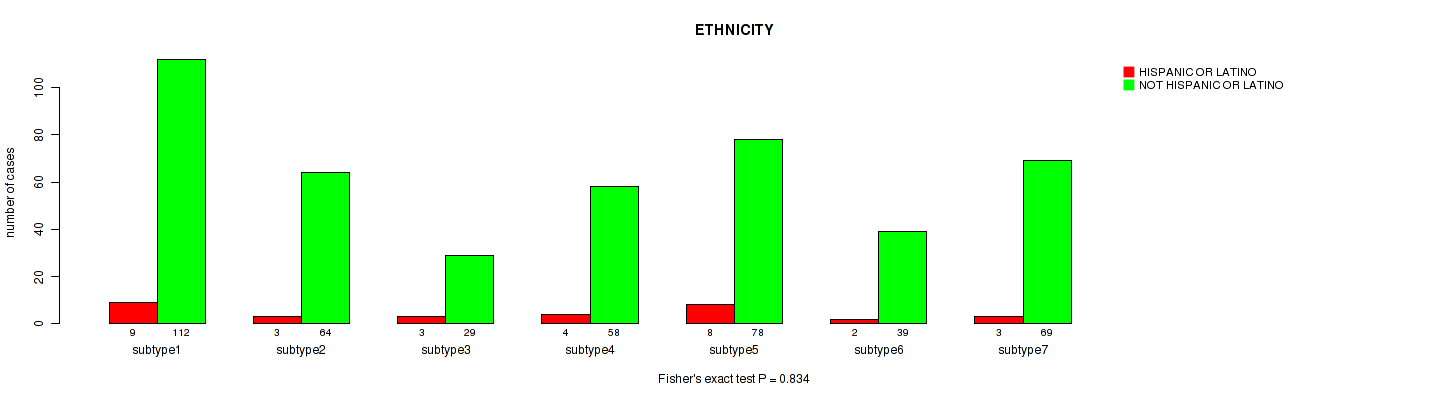
Table S73. Description of clustering approach #9: 'MIRSEQ CNMF'
| Cluster Labels | 1 | 2 | 3 | 4 |
|---|---|---|---|---|
| Number of samples | 140 | 106 | 83 | 182 |
P value = 0.0253 (logrank test), Q value = 0.054
Table S74. Clustering Approach #9: 'MIRSEQ CNMF' versus Clinical Feature #1: 'Time to Death'
| nPatients | nDeath | Duration Range (Median), Month | |
|---|---|---|---|
| ALL | 507 | 124 | 0.0 - 211.2 (22.4) |
| subtype1 | 139 | 32 | 0.0 - 145.1 (23.5) |
| subtype2 | 106 | 38 | 0.1 - 211.2 (21.1) |
| subtype3 | 81 | 18 | 0.1 - 182.3 (24.9) |
| subtype4 | 181 | 36 | 0.1 - 156.2 (21.4) |
Figure S65. Get High-res Image Clustering Approach #9: 'MIRSEQ CNMF' versus Clinical Feature #1: 'Time to Death'
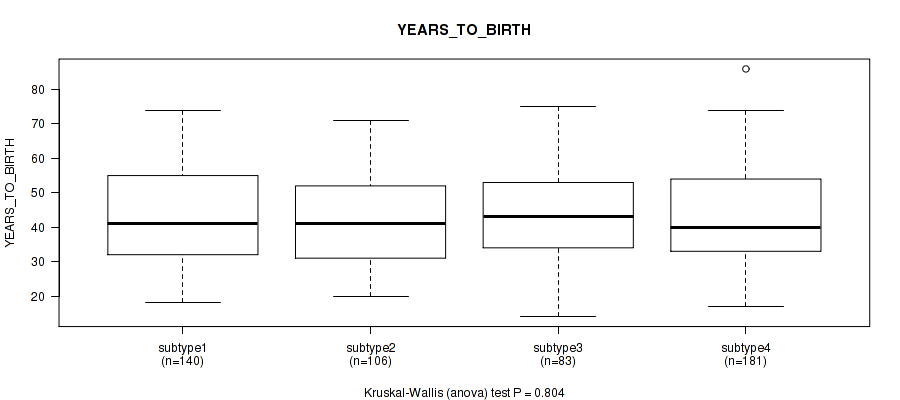
P value = 0.804 (Kruskal-Wallis (anova)), Q value = 0.84
Table S75. Clustering Approach #9: 'MIRSEQ CNMF' versus Clinical Feature #2: 'YEARS_TO_BIRTH'
| nPatients | Mean (Std.Dev) | |
|---|---|---|
| ALL | 510 | 43.0 (13.4) |
| subtype1 | 140 | 42.5 (13.4) |
| subtype2 | 106 | 42.4 (13.2) |
| subtype3 | 83 | 44.1 (13.2) |
| subtype4 | 181 | 43.1 (13.7) |
Figure S66. Get High-res Image Clustering Approach #9: 'MIRSEQ CNMF' versus Clinical Feature #2: 'YEARS_TO_BIRTH'
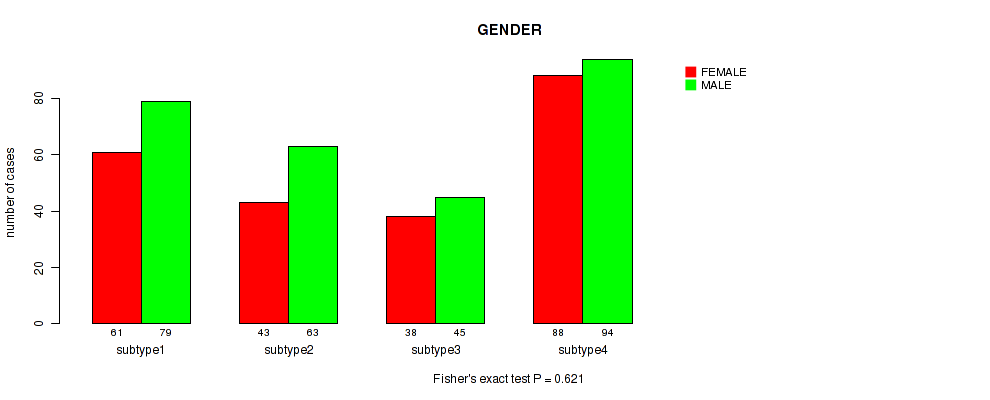
P value = 0.621 (Fisher's exact test), Q value = 0.68
Table S76. Clustering Approach #9: 'MIRSEQ CNMF' versus Clinical Feature #3: 'GENDER'
| nPatients | FEMALE | MALE |
|---|---|---|
| ALL | 230 | 281 |
| subtype1 | 61 | 79 |
| subtype2 | 43 | 63 |
| subtype3 | 38 | 45 |
| subtype4 | 88 | 94 |
Figure S67. Get High-res Image Clustering Approach #9: 'MIRSEQ CNMF' versus Clinical Feature #3: 'GENDER'
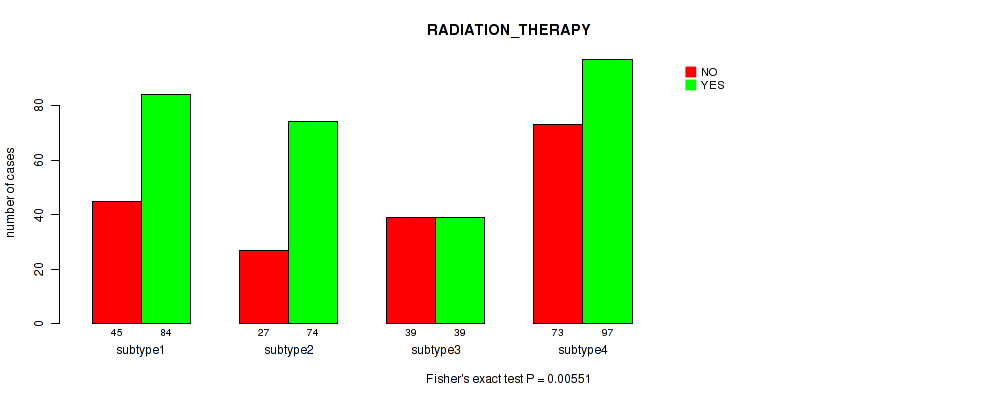
P value = 0.00551 (Fisher's exact test), Q value = 0.013
Table S77. Clustering Approach #9: 'MIRSEQ CNMF' versus Clinical Feature #4: 'RADIATION_THERAPY'
| nPatients | NO | YES |
|---|---|---|
| ALL | 184 | 294 |
| subtype1 | 45 | 84 |
| subtype2 | 27 | 74 |
| subtype3 | 39 | 39 |
| subtype4 | 73 | 97 |
Figure S68. Get High-res Image Clustering Approach #9: 'MIRSEQ CNMF' versus Clinical Feature #4: 'RADIATION_THERAPY'
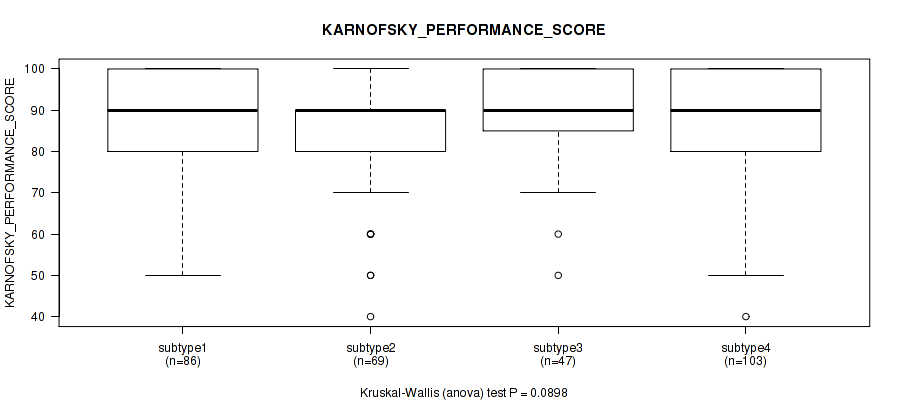
P value = 0.0898 (Kruskal-Wallis (anova)), Q value = 0.16
Table S78. Clustering Approach #9: 'MIRSEQ CNMF' versus Clinical Feature #5: 'KARNOFSKY_PERFORMANCE_SCORE'
| nPatients | Mean (Std.Dev) | |
|---|---|---|
| ALL | 305 | 86.7 (12.6) |
| subtype1 | 86 | 86.7 (12.6) |
| subtype2 | 69 | 84.2 (12.9) |
| subtype3 | 47 | 89.4 (11.9) |
| subtype4 | 103 | 87.0 (12.7) |
Figure S69. Get High-res Image Clustering Approach #9: 'MIRSEQ CNMF' versus Clinical Feature #5: 'KARNOFSKY_PERFORMANCE_SCORE'
P value = 1e-05 (Fisher's exact test), Q value = 3.7e-05
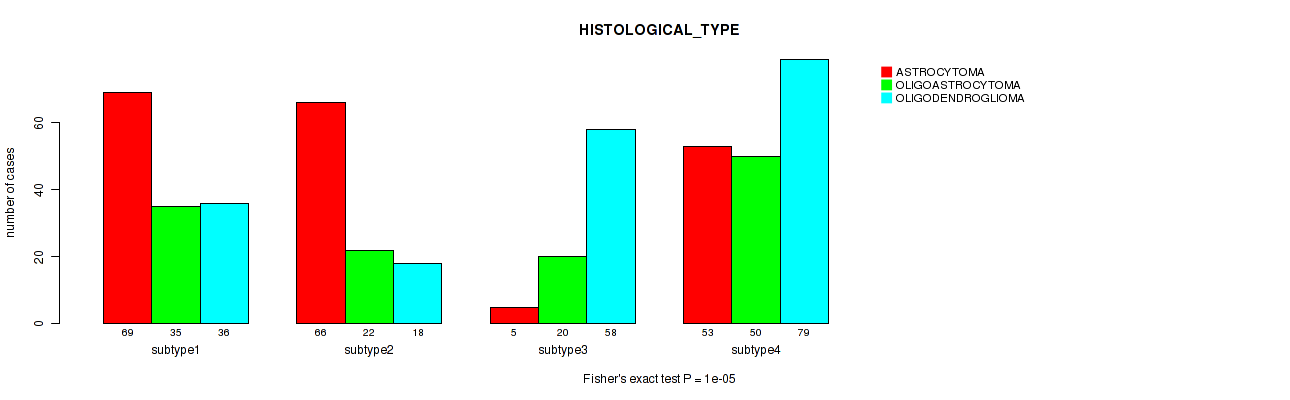
Table S79. Clustering Approach #9: 'MIRSEQ CNMF' versus Clinical Feature #6: 'HISTOLOGICAL_TYPE'
| nPatients | ASTROCYTOMA | OLIGOASTROCYTOMA | OLIGODENDROGLIOMA |
|---|---|---|---|
| ALL | 193 | 127 | 191 |
| subtype1 | 69 | 35 | 36 |
| subtype2 | 66 | 22 | 18 |
| subtype3 | 5 | 20 | 58 |
| subtype4 | 53 | 50 | 79 |
Figure S70. Get High-res Image Clustering Approach #9: 'MIRSEQ CNMF' versus Clinical Feature #6: 'HISTOLOGICAL_TYPE'
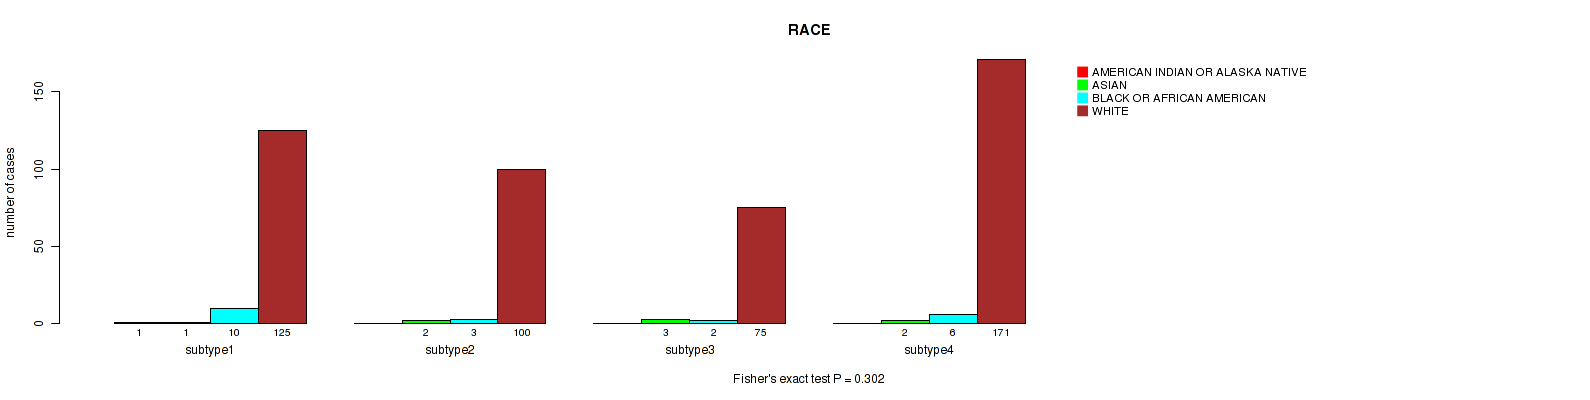
P value = 0.302 (Fisher's exact test), Q value = 0.41
Table S80. Clustering Approach #9: 'MIRSEQ CNMF' versus Clinical Feature #7: 'RACE'
| nPatients | AMERICAN INDIAN OR ALASKA NATIVE | ASIAN | BLACK OR AFRICAN AMERICAN | WHITE |
|---|---|---|---|---|
| ALL | 1 | 8 | 21 | 471 |
| subtype1 | 1 | 1 | 10 | 125 |
| subtype2 | 0 | 2 | 3 | 100 |
| subtype3 | 0 | 3 | 2 | 75 |
| subtype4 | 0 | 2 | 6 | 171 |
Figure S71. Get High-res Image Clustering Approach #9: 'MIRSEQ CNMF' versus Clinical Feature #7: 'RACE'
P value = 0.259 (Fisher's exact test), Q value = 0.38
Table S81. Clustering Approach #9: 'MIRSEQ CNMF' versus Clinical Feature #8: 'ETHNICITY'
| nPatients | HISPANIC OR LATINO | NOT HISPANIC OR LATINO |
|---|---|---|
| ALL | 32 | 445 |
| subtype1 | 9 | 121 |
| subtype2 | 3 | 94 |
| subtype3 | 8 | 67 |
| subtype4 | 12 | 163 |
Figure S72. Get High-res Image Clustering Approach #9: 'MIRSEQ CNMF' versus Clinical Feature #8: 'ETHNICITY'
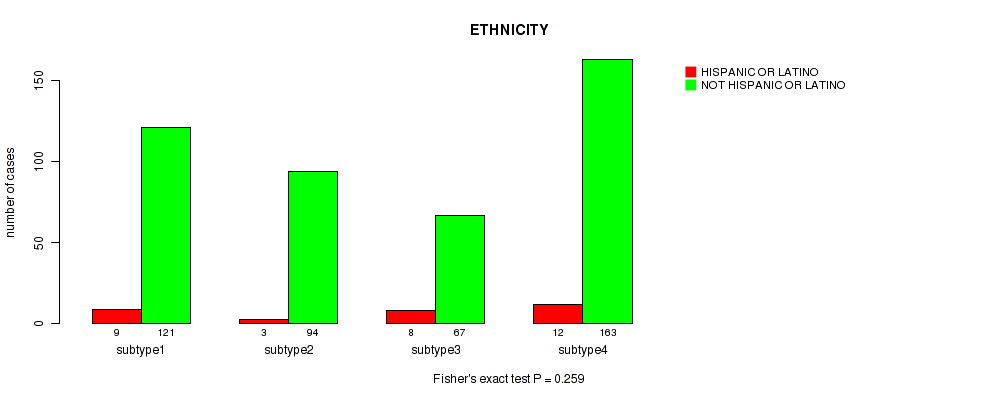
Table S82. Description of clustering approach #10: 'MIRSEQ CHIERARCHICAL'
| Cluster Labels | 1 | 2 | 3 |
|---|---|---|---|
| Number of samples | 222 | 186 | 103 |
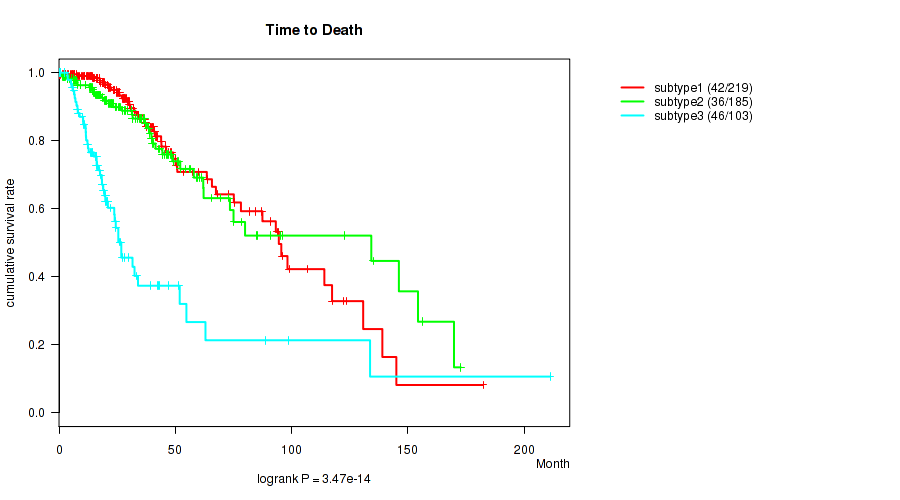
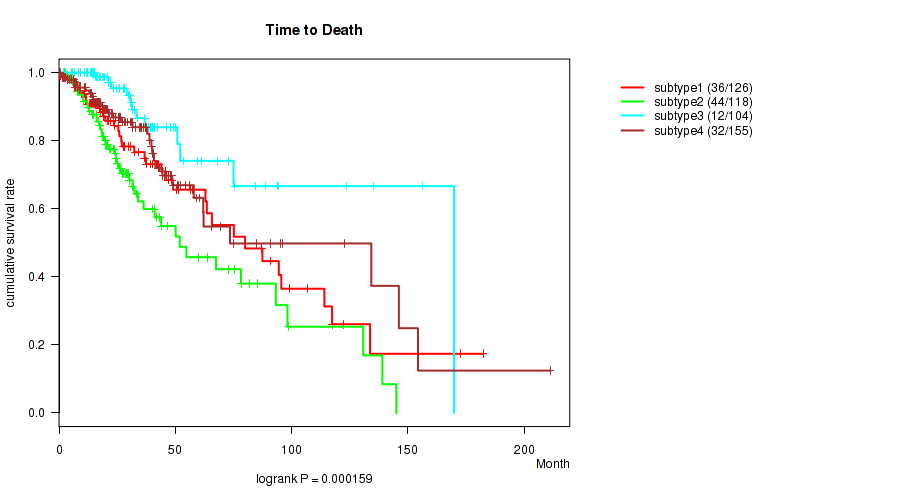
P value = 3.47e-14 (logrank test), Q value = 4.8e-13
Table S83. Clustering Approach #10: 'MIRSEQ CHIERARCHICAL' versus Clinical Feature #1: 'Time to Death'
| nPatients | nDeath | Duration Range (Median), Month | |
|---|---|---|---|
| ALL | 507 | 124 | 0.0 - 211.2 (22.4) |
| subtype1 | 219 | 42 | 0.0 - 182.3 (27.4) |
| subtype2 | 185 | 36 | 0.1 - 172.8 (23.3) |
| subtype3 | 103 | 46 | 0.1 - 211.2 (17.5) |
Figure S73. Get High-res Image Clustering Approach #10: 'MIRSEQ CHIERARCHICAL' versus Clinical Feature #1: 'Time to Death'
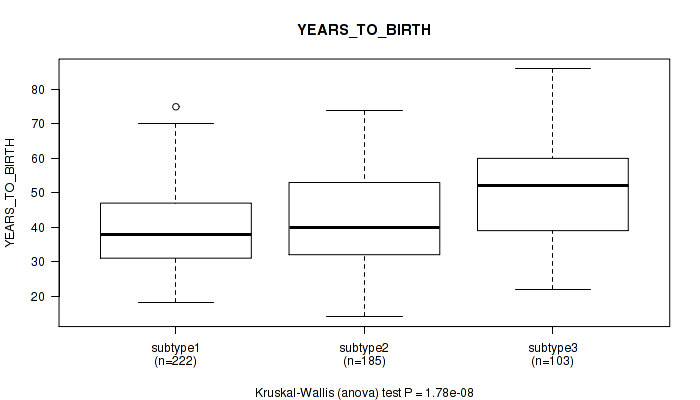
P value = 1.78e-08 (Kruskal-Wallis (anova)), Q value = 1.4e-07
Table S84. Clustering Approach #10: 'MIRSEQ CHIERARCHICAL' versus Clinical Feature #2: 'YEARS_TO_BIRTH'
| nPatients | Mean (Std.Dev) | |
|---|---|---|
| ALL | 510 | 43.0 (13.4) |
| subtype1 | 222 | 40.0 (11.5) |
| subtype2 | 185 | 42.6 (13.8) |
| subtype3 | 103 | 50.0 (13.8) |
Figure S74. Get High-res Image Clustering Approach #10: 'MIRSEQ CHIERARCHICAL' versus Clinical Feature #2: 'YEARS_TO_BIRTH'
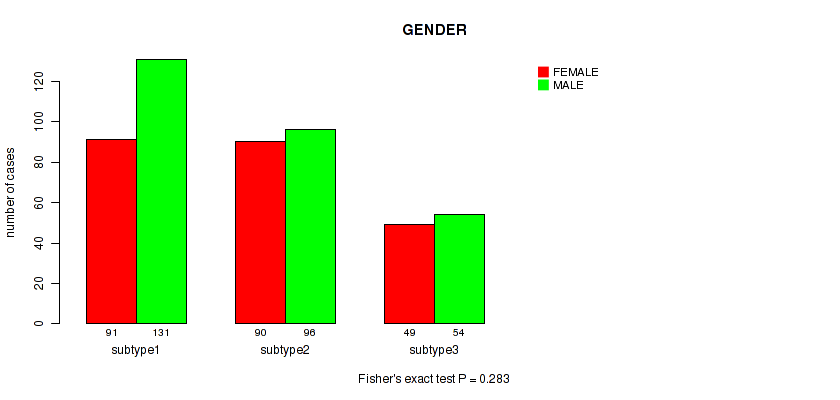
P value = 0.283 (Fisher's exact test), Q value = 0.39
Table S85. Clustering Approach #10: 'MIRSEQ CHIERARCHICAL' versus Clinical Feature #3: 'GENDER'
| nPatients | FEMALE | MALE |
|---|---|---|
| ALL | 230 | 281 |
| subtype1 | 91 | 131 |
| subtype2 | 90 | 96 |
| subtype3 | 49 | 54 |
Figure S75. Get High-res Image Clustering Approach #10: 'MIRSEQ CHIERARCHICAL' versus Clinical Feature #3: 'GENDER'
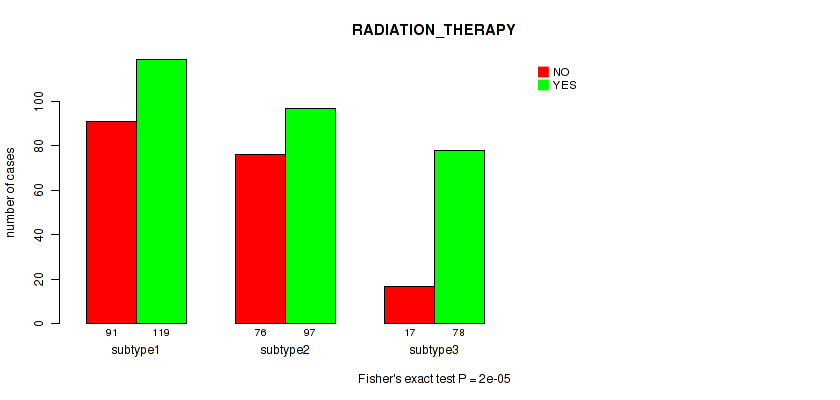
P value = 2e-05 (Fisher's exact test), Q value = 7.1e-05
Table S86. Clustering Approach #10: 'MIRSEQ CHIERARCHICAL' versus Clinical Feature #4: 'RADIATION_THERAPY'
| nPatients | NO | YES |
|---|---|---|
| ALL | 184 | 294 |
| subtype1 | 91 | 119 |
| subtype2 | 76 | 97 |
| subtype3 | 17 | 78 |
Figure S76. Get High-res Image Clustering Approach #10: 'MIRSEQ CHIERARCHICAL' versus Clinical Feature #4: 'RADIATION_THERAPY'
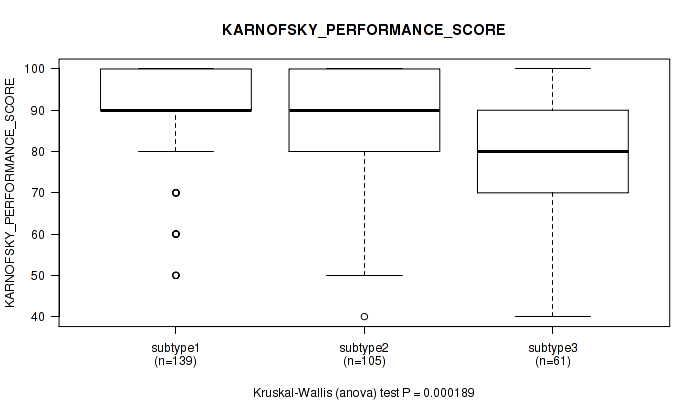
P value = 0.000189 (Kruskal-Wallis (anova)), Q value = 0.00061
Table S87. Clustering Approach #10: 'MIRSEQ CHIERARCHICAL' versus Clinical Feature #5: 'KARNOFSKY_PERFORMANCE_SCORE'
| nPatients | Mean (Std.Dev) | |
|---|---|---|
| ALL | 305 | 86.7 (12.6) |
| subtype1 | 139 | 88.9 (11.1) |
| subtype2 | 105 | 87.0 (12.5) |
| subtype3 | 61 | 80.8 (14.3) |
Figure S77. Get High-res Image Clustering Approach #10: 'MIRSEQ CHIERARCHICAL' versus Clinical Feature #5: 'KARNOFSKY_PERFORMANCE_SCORE'
P value = 1e-05 (Fisher's exact test), Q value = 3.7e-05
Table S88. Clustering Approach #10: 'MIRSEQ CHIERARCHICAL' versus Clinical Feature #6: 'HISTOLOGICAL_TYPE'
| nPatients | ASTROCYTOMA | OLIGOASTROCYTOMA | OLIGODENDROGLIOMA |
|---|---|---|---|
| ALL | 193 | 127 | 191 |
| subtype1 | 76 | 67 | 79 |
| subtype2 | 48 | 44 | 94 |
| subtype3 | 69 | 16 | 18 |
Figure S78. Get High-res Image Clustering Approach #10: 'MIRSEQ CHIERARCHICAL' versus Clinical Feature #6: 'HISTOLOGICAL_TYPE'
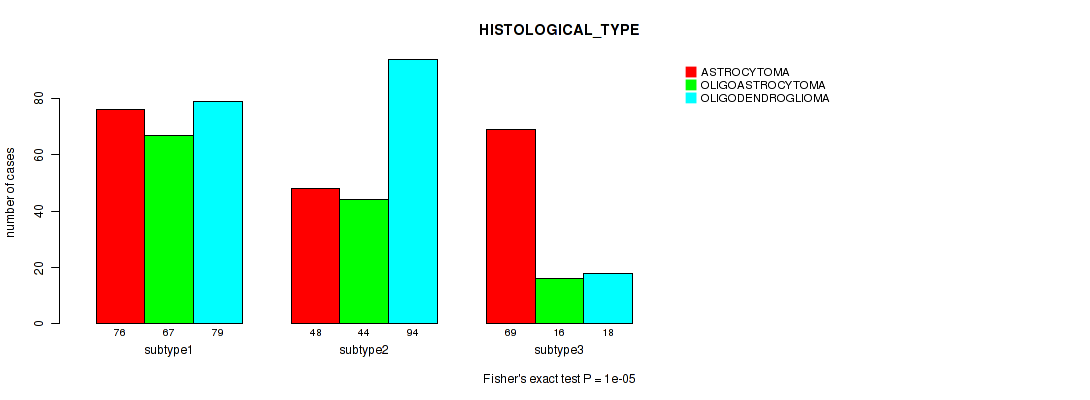
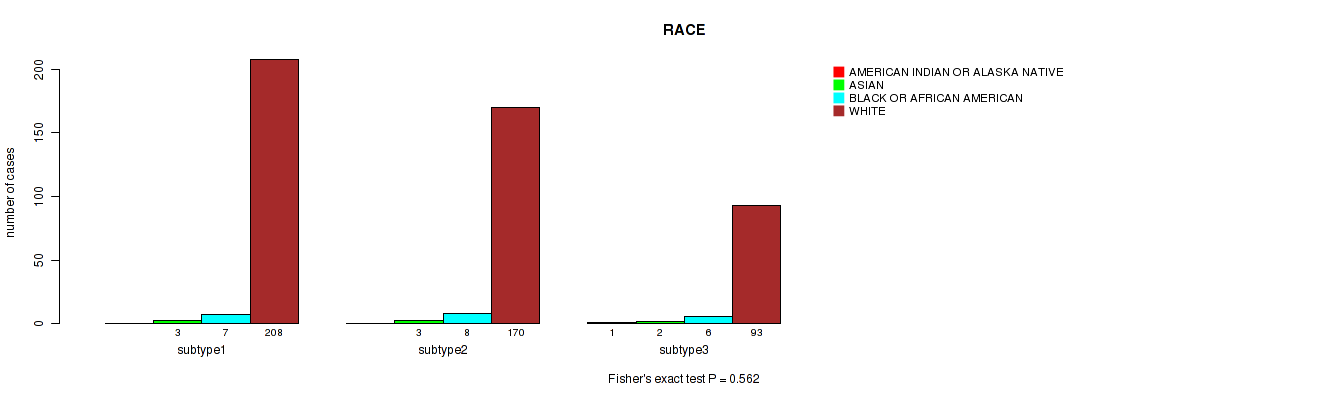
P value = 0.562 (Fisher's exact test), Q value = 0.63
Table S89. Clustering Approach #10: 'MIRSEQ CHIERARCHICAL' versus Clinical Feature #7: 'RACE'
| nPatients | AMERICAN INDIAN OR ALASKA NATIVE | ASIAN | BLACK OR AFRICAN AMERICAN | WHITE |
|---|---|---|---|---|
| ALL | 1 | 8 | 21 | 471 |
| subtype1 | 0 | 3 | 7 | 208 |
| subtype2 | 0 | 3 | 8 | 170 |
| subtype3 | 1 | 2 | 6 | 93 |
Figure S79. Get High-res Image Clustering Approach #10: 'MIRSEQ CHIERARCHICAL' versus Clinical Feature #7: 'RACE'
P value = 0.235 (Fisher's exact test), Q value = 0.36
Table S90. Clustering Approach #10: 'MIRSEQ CHIERARCHICAL' versus Clinical Feature #8: 'ETHNICITY'
| nPatients | HISPANIC OR LATINO | NOT HISPANIC OR LATINO |
|---|---|---|
| ALL | 32 | 445 |
| subtype1 | 17 | 188 |
| subtype2 | 12 | 164 |
| subtype3 | 3 | 93 |
Figure S80. Get High-res Image Clustering Approach #10: 'MIRSEQ CHIERARCHICAL' versus Clinical Feature #8: 'ETHNICITY'
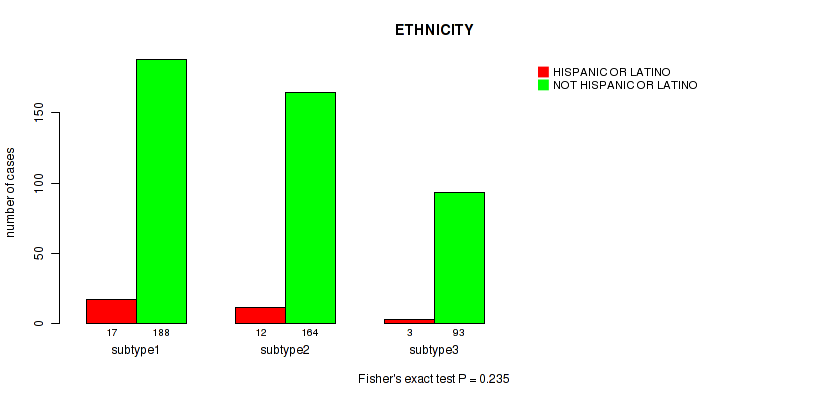
Table S91. Description of clustering approach #11: 'MIRseq Mature CNMF subtypes'
| Cluster Labels | 1 | 2 | 3 | 4 |
|---|---|---|---|---|
| Number of samples | 126 | 119 | 106 | 156 |
P value = 0.000159 (logrank test), Q value = 0.00053
Table S92. Clustering Approach #11: 'MIRseq Mature CNMF subtypes' versus Clinical Feature #1: 'Time to Death'
| nPatients | nDeath | Duration Range (Median), Month | |
|---|---|---|---|
| ALL | 503 | 124 | 0.0 - 211.2 (22.4) |
| subtype1 | 126 | 36 | 0.0 - 182.3 (21.2) |
| subtype2 | 118 | 44 | 0.1 - 145.1 (21.9) |
| subtype3 | 104 | 12 | 0.1 - 169.8 (25.4) |
| subtype4 | 155 | 32 | 0.1 - 211.2 (21.3) |
Figure S81. Get High-res Image Clustering Approach #11: 'MIRseq Mature CNMF subtypes' versus Clinical Feature #1: 'Time to Death'
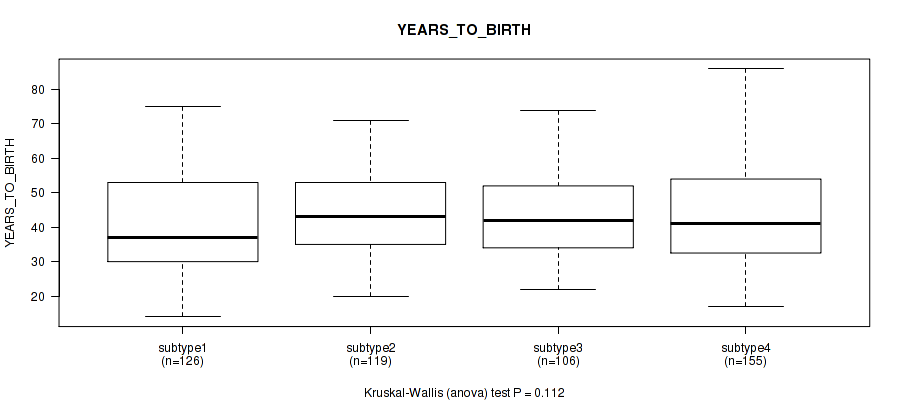
P value = 0.112 (Kruskal-Wallis (anova)), Q value = 0.19
Table S93. Clustering Approach #11: 'MIRseq Mature CNMF subtypes' versus Clinical Feature #2: 'YEARS_TO_BIRTH'
| nPatients | Mean (Std.Dev) | |
|---|---|---|
| ALL | 506 | 43.0 (13.4) |
| subtype1 | 126 | 41.0 (14.1) |
| subtype2 | 119 | 44.5 (12.9) |
| subtype3 | 106 | 43.0 (12.0) |
| subtype4 | 155 | 43.5 (14.0) |
Figure S82. Get High-res Image Clustering Approach #11: 'MIRseq Mature CNMF subtypes' versus Clinical Feature #2: 'YEARS_TO_BIRTH'
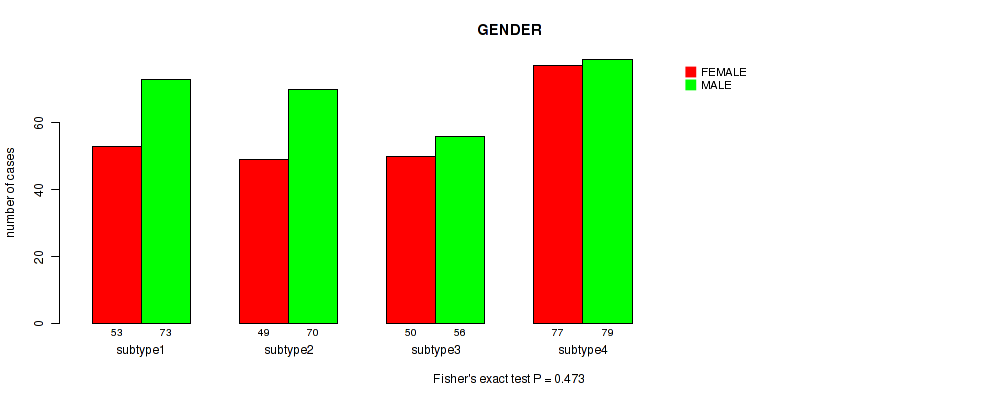
P value = 0.473 (Fisher's exact test), Q value = 0.56
Table S94. Clustering Approach #11: 'MIRseq Mature CNMF subtypes' versus Clinical Feature #3: 'GENDER'
| nPatients | FEMALE | MALE |
|---|---|---|
| ALL | 229 | 278 |
| subtype1 | 53 | 73 |
| subtype2 | 49 | 70 |
| subtype3 | 50 | 56 |
| subtype4 | 77 | 79 |
Figure S83. Get High-res Image Clustering Approach #11: 'MIRseq Mature CNMF subtypes' versus Clinical Feature #3: 'GENDER'
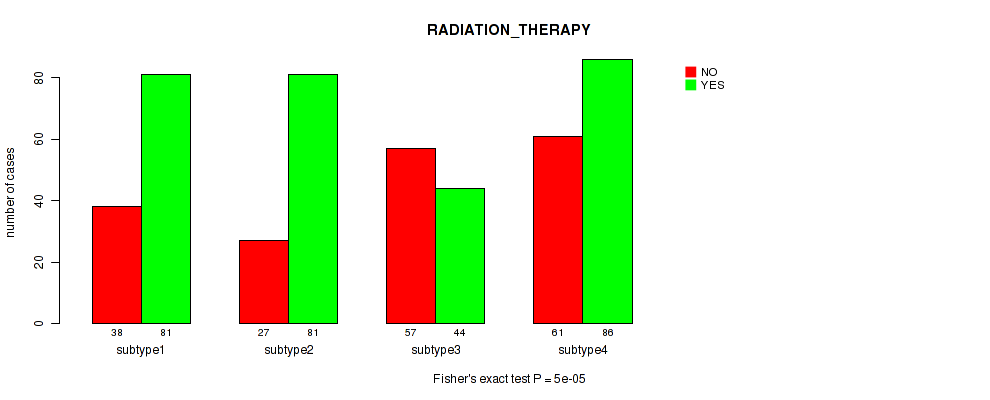
P value = 5e-05 (Fisher's exact test), Q value = 0.00017
Table S95. Clustering Approach #11: 'MIRseq Mature CNMF subtypes' versus Clinical Feature #4: 'RADIATION_THERAPY'
| nPatients | NO | YES |
|---|---|---|
| ALL | 183 | 292 |
| subtype1 | 38 | 81 |
| subtype2 | 27 | 81 |
| subtype3 | 57 | 44 |
| subtype4 | 61 | 86 |
Figure S84. Get High-res Image Clustering Approach #11: 'MIRseq Mature CNMF subtypes' versus Clinical Feature #4: 'RADIATION_THERAPY'
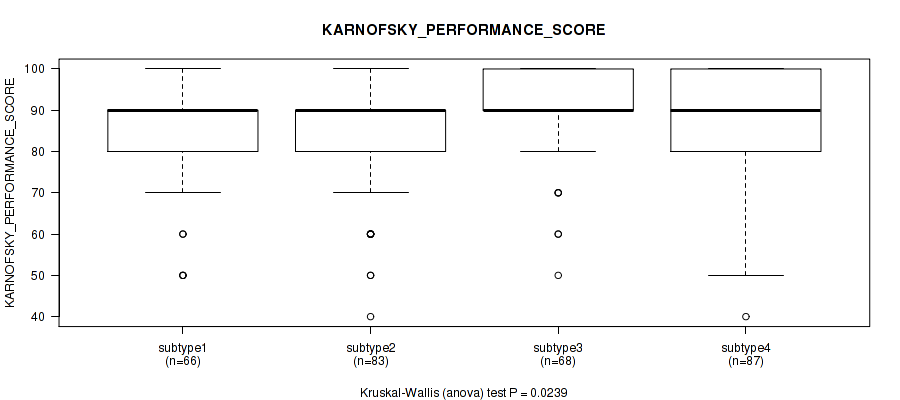
P value = 0.0239 (Kruskal-Wallis (anova)), Q value = 0.052
Table S96. Clustering Approach #11: 'MIRseq Mature CNMF subtypes' versus Clinical Feature #5: 'KARNOFSKY_PERFORMANCE_SCORE'
| nPatients | Mean (Std.Dev) | |
|---|---|---|
| ALL | 304 | 86.7 (12.6) |
| subtype1 | 66 | 86.7 (12.4) |
| subtype2 | 83 | 84.3 (13.4) |
| subtype3 | 68 | 90.1 (11.0) |
| subtype4 | 87 | 86.3 (12.8) |
Figure S85. Get High-res Image Clustering Approach #11: 'MIRseq Mature CNMF subtypes' versus Clinical Feature #5: 'KARNOFSKY_PERFORMANCE_SCORE'
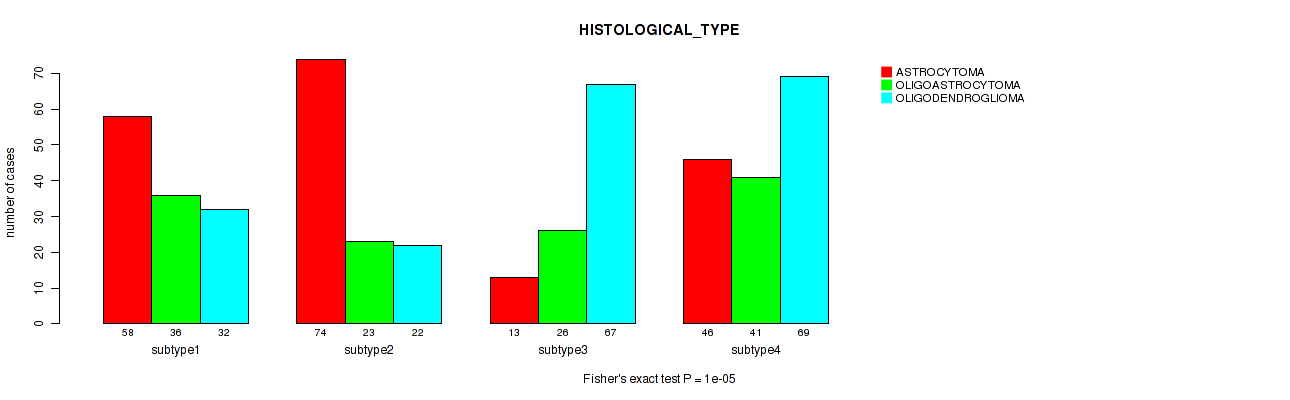
P value = 1e-05 (Fisher's exact test), Q value = 3.7e-05
Table S97. Clustering Approach #11: 'MIRseq Mature CNMF subtypes' versus Clinical Feature #6: 'HISTOLOGICAL_TYPE'
| nPatients | ASTROCYTOMA | OLIGOASTROCYTOMA | OLIGODENDROGLIOMA |
|---|---|---|---|
| ALL | 191 | 126 | 190 |
| subtype1 | 58 | 36 | 32 |
| subtype2 | 74 | 23 | 22 |
| subtype3 | 13 | 26 | 67 |
| subtype4 | 46 | 41 | 69 |
Figure S86. Get High-res Image Clustering Approach #11: 'MIRseq Mature CNMF subtypes' versus Clinical Feature #6: 'HISTOLOGICAL_TYPE'
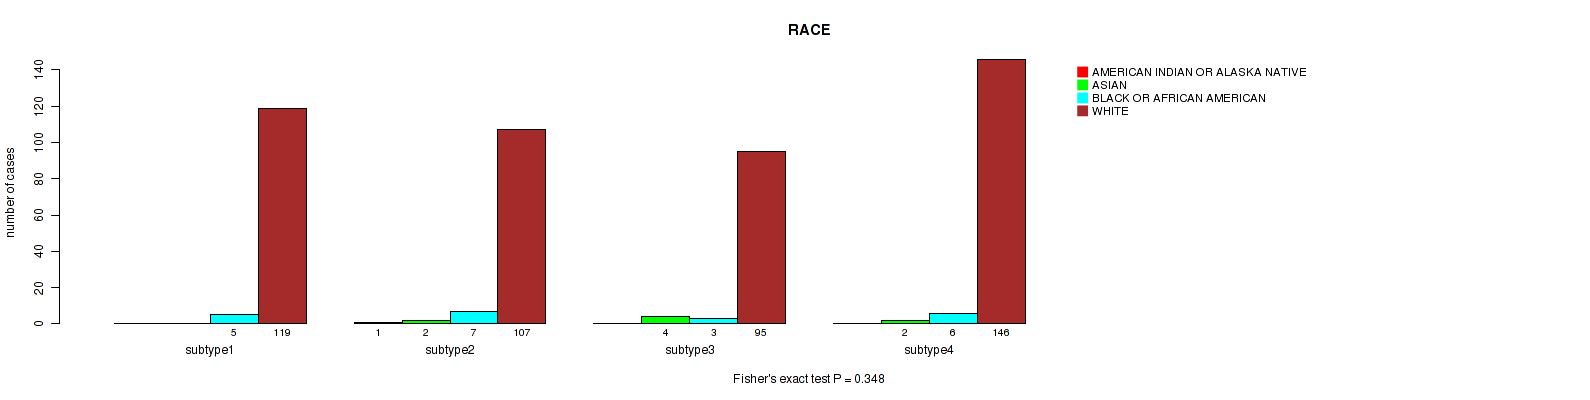
P value = 0.348 (Fisher's exact test), Q value = 0.46
Table S98. Clustering Approach #11: 'MIRseq Mature CNMF subtypes' versus Clinical Feature #7: 'RACE'
| nPatients | AMERICAN INDIAN OR ALASKA NATIVE | ASIAN | BLACK OR AFRICAN AMERICAN | WHITE |
|---|---|---|---|---|
| ALL | 1 | 8 | 21 | 467 |
| subtype1 | 0 | 0 | 5 | 119 |
| subtype2 | 1 | 2 | 7 | 107 |
| subtype3 | 0 | 4 | 3 | 95 |
| subtype4 | 0 | 2 | 6 | 146 |
Figure S87. Get High-res Image Clustering Approach #11: 'MIRseq Mature CNMF subtypes' versus Clinical Feature #7: 'RACE'
P value = 0.0636 (Fisher's exact test), Q value = 0.12
Table S99. Clustering Approach #11: 'MIRseq Mature CNMF subtypes' versus Clinical Feature #8: 'ETHNICITY'
| nPatients | HISPANIC OR LATINO | NOT HISPANIC OR LATINO |
|---|---|---|
| ALL | 32 | 441 |
| subtype1 | 5 | 114 |
| subtype2 | 6 | 102 |
| subtype3 | 13 | 86 |
| subtype4 | 8 | 139 |
Figure S88. Get High-res Image Clustering Approach #11: 'MIRseq Mature CNMF subtypes' versus Clinical Feature #8: 'ETHNICITY'
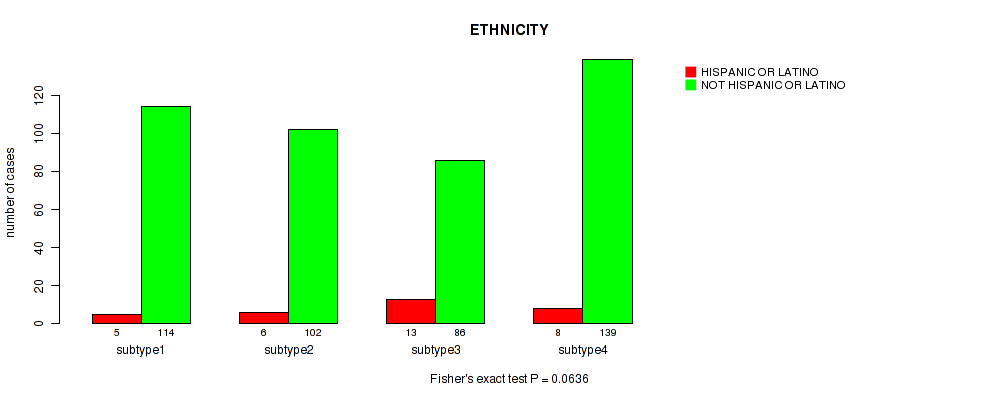
Table S100. Description of clustering approach #12: 'MIRseq Mature cHierClus subtypes'
| Cluster Labels | 1 | 2 | 3 | 4 | 5 | 6 |
|---|---|---|---|---|---|---|
| Number of samples | 98 | 77 | 120 | 57 | 63 | 92 |
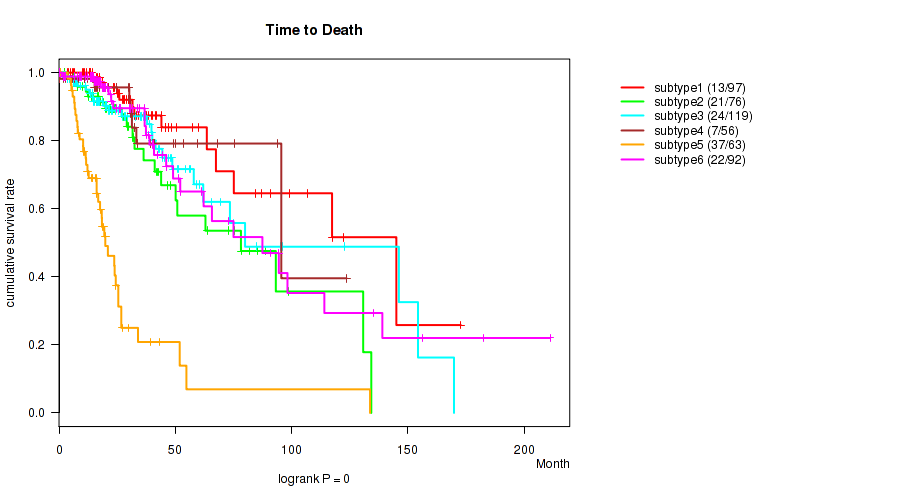
P value = 0 (logrank test), Q value = 0
Table S101. Clustering Approach #12: 'MIRseq Mature cHierClus subtypes' versus Clinical Feature #1: 'Time to Death'
| nPatients | nDeath | Duration Range (Median), Month | |
|---|---|---|---|
| ALL | 503 | 124 | 0.0 - 211.2 (22.4) |
| subtype1 | 97 | 13 | 0.0 - 172.8 (27.4) |
| subtype2 | 76 | 21 | 0.1 - 134.3 (26.0) |
| subtype3 | 119 | 24 | 0.1 - 169.8 (21.6) |
| subtype4 | 56 | 7 | 0.1 - 123.7 (24.7) |
| subtype5 | 63 | 37 | 0.1 - 133.7 (15.7) |
| subtype6 | 92 | 22 | 0.1 - 211.2 (22.4) |
Figure S89. Get High-res Image Clustering Approach #12: 'MIRseq Mature cHierClus subtypes' versus Clinical Feature #1: 'Time to Death'
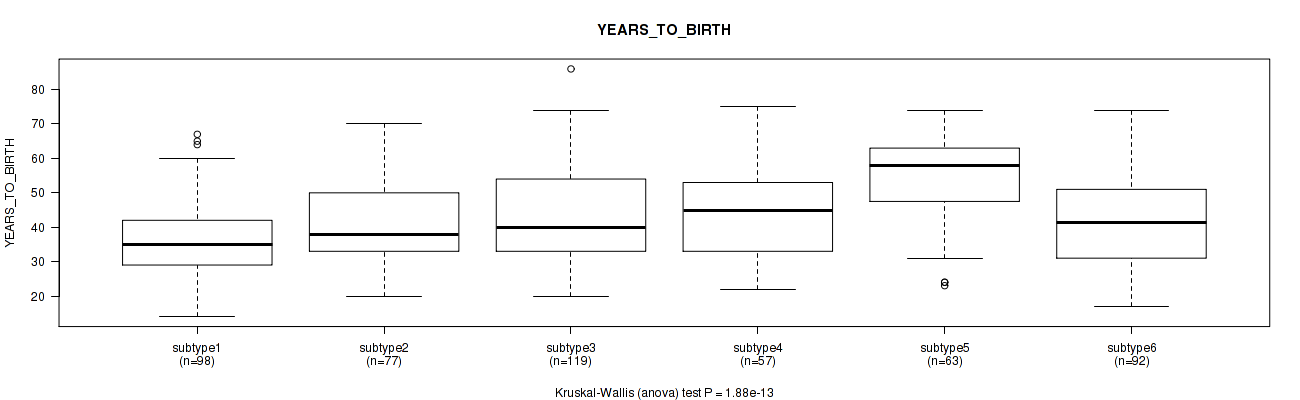
P value = 1.88e-13 (Kruskal-Wallis (anova)), Q value = 2.3e-12
Table S102. Clustering Approach #12: 'MIRseq Mature cHierClus subtypes' versus Clinical Feature #2: 'YEARS_TO_BIRTH'
| nPatients | Mean (Std.Dev) | |
|---|---|---|
| ALL | 506 | 43.0 (13.4) |
| subtype1 | 98 | 36.6 (11.2) |
| subtype2 | 77 | 41.4 (11.5) |
| subtype3 | 119 | 43.0 (13.9) |
| subtype4 | 57 | 44.1 (12.6) |
| subtype5 | 63 | 54.6 (11.7) |
| subtype6 | 92 | 42.6 (13.1) |
Figure S90. Get High-res Image Clustering Approach #12: 'MIRseq Mature cHierClus subtypes' versus Clinical Feature #2: 'YEARS_TO_BIRTH'
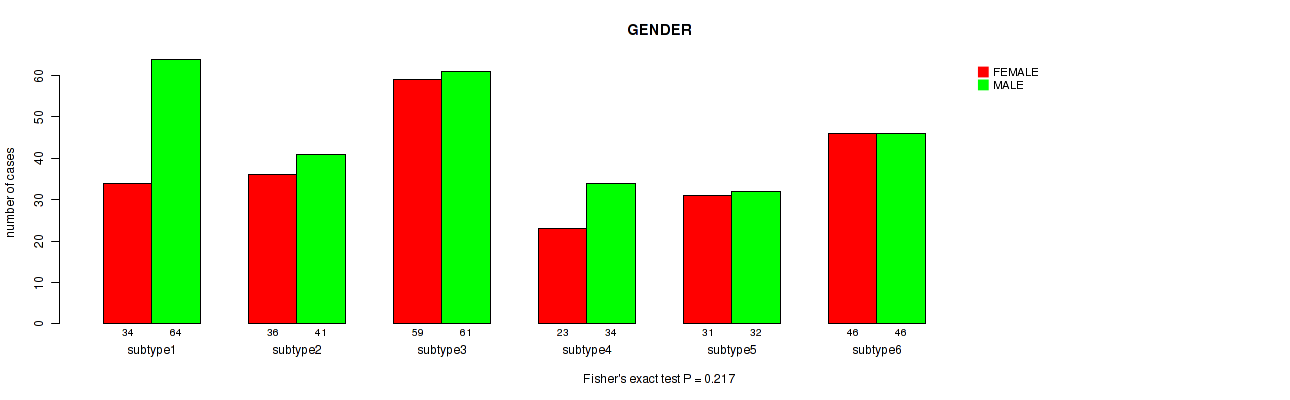
P value = 0.217 (Fisher's exact test), Q value = 0.34
Table S103. Clustering Approach #12: 'MIRseq Mature cHierClus subtypes' versus Clinical Feature #3: 'GENDER'
| nPatients | FEMALE | MALE |
|---|---|---|
| ALL | 229 | 278 |
| subtype1 | 34 | 64 |
| subtype2 | 36 | 41 |
| subtype3 | 59 | 61 |
| subtype4 | 23 | 34 |
| subtype5 | 31 | 32 |
| subtype6 | 46 | 46 |
Figure S91. Get High-res Image Clustering Approach #12: 'MIRseq Mature cHierClus subtypes' versus Clinical Feature #3: 'GENDER'
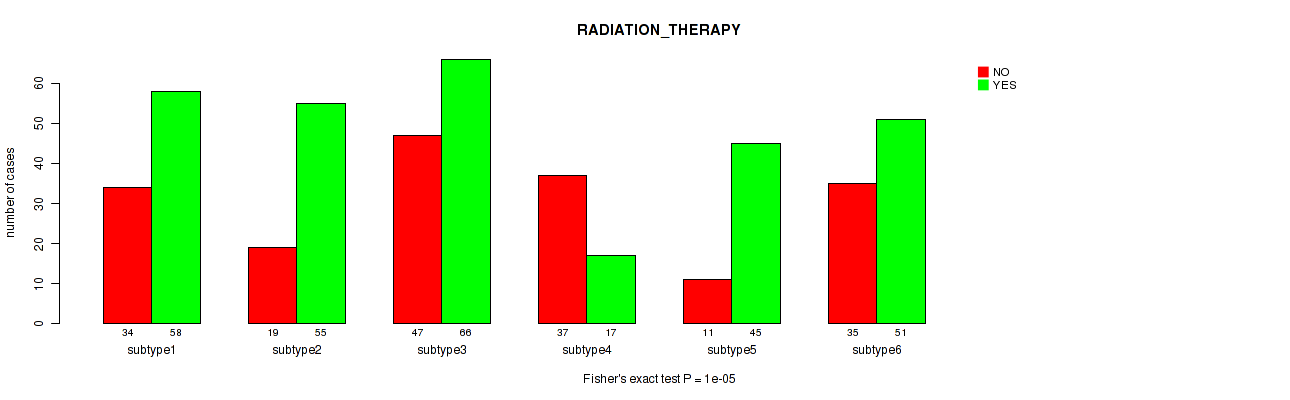
P value = 1e-05 (Fisher's exact test), Q value = 3.7e-05
Table S104. Clustering Approach #12: 'MIRseq Mature cHierClus subtypes' versus Clinical Feature #4: 'RADIATION_THERAPY'
| nPatients | NO | YES |
|---|---|---|
| ALL | 183 | 292 |
| subtype1 | 34 | 58 |
| subtype2 | 19 | 55 |
| subtype3 | 47 | 66 |
| subtype4 | 37 | 17 |
| subtype5 | 11 | 45 |
| subtype6 | 35 | 51 |
Figure S92. Get High-res Image Clustering Approach #12: 'MIRseq Mature cHierClus subtypes' versus Clinical Feature #4: 'RADIATION_THERAPY'
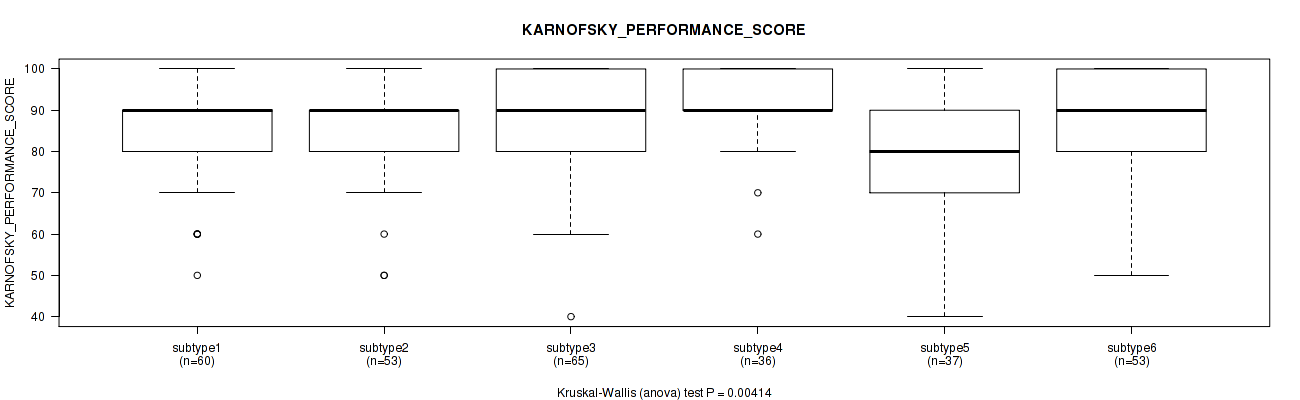
P value = 0.00414 (Kruskal-Wallis (anova)), Q value = 0.0099
Table S105. Clustering Approach #12: 'MIRseq Mature cHierClus subtypes' versus Clinical Feature #5: 'KARNOFSKY_PERFORMANCE_SCORE'
| nPatients | Mean (Std.Dev) | |
|---|---|---|
| ALL | 304 | 86.7 (12.6) |
| subtype1 | 60 | 87.3 (11.8) |
| subtype2 | 53 | 86.8 (11.2) |
| subtype3 | 65 | 85.7 (12.5) |
| subtype4 | 36 | 91.4 (9.9) |
| subtype5 | 37 | 79.7 (15.9) |
| subtype6 | 53 | 88.9 (12.4) |
Figure S93. Get High-res Image Clustering Approach #12: 'MIRseq Mature cHierClus subtypes' versus Clinical Feature #5: 'KARNOFSKY_PERFORMANCE_SCORE'
P value = 1e-05 (Fisher's exact test), Q value = 3.7e-05
Table S106. Clustering Approach #12: 'MIRseq Mature cHierClus subtypes' versus Clinical Feature #6: 'HISTOLOGICAL_TYPE'
| nPatients | ASTROCYTOMA | OLIGOASTROCYTOMA | OLIGODENDROGLIOMA |
|---|---|---|---|
| ALL | 191 | 126 | 190 |
| subtype1 | 55 | 27 | 16 |
| subtype2 | 35 | 20 | 22 |
| subtype3 | 35 | 28 | 57 |
| subtype4 | 2 | 11 | 44 |
| subtype5 | 41 | 11 | 11 |
| subtype6 | 23 | 29 | 40 |
Figure S94. Get High-res Image Clustering Approach #12: 'MIRseq Mature cHierClus subtypes' versus Clinical Feature #6: 'HISTOLOGICAL_TYPE'
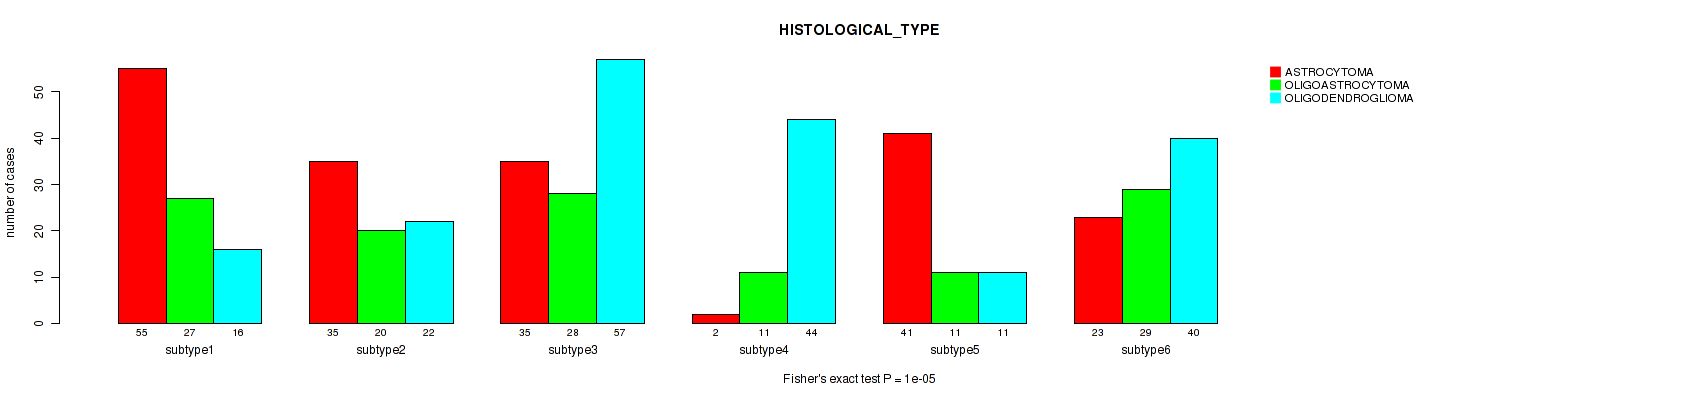
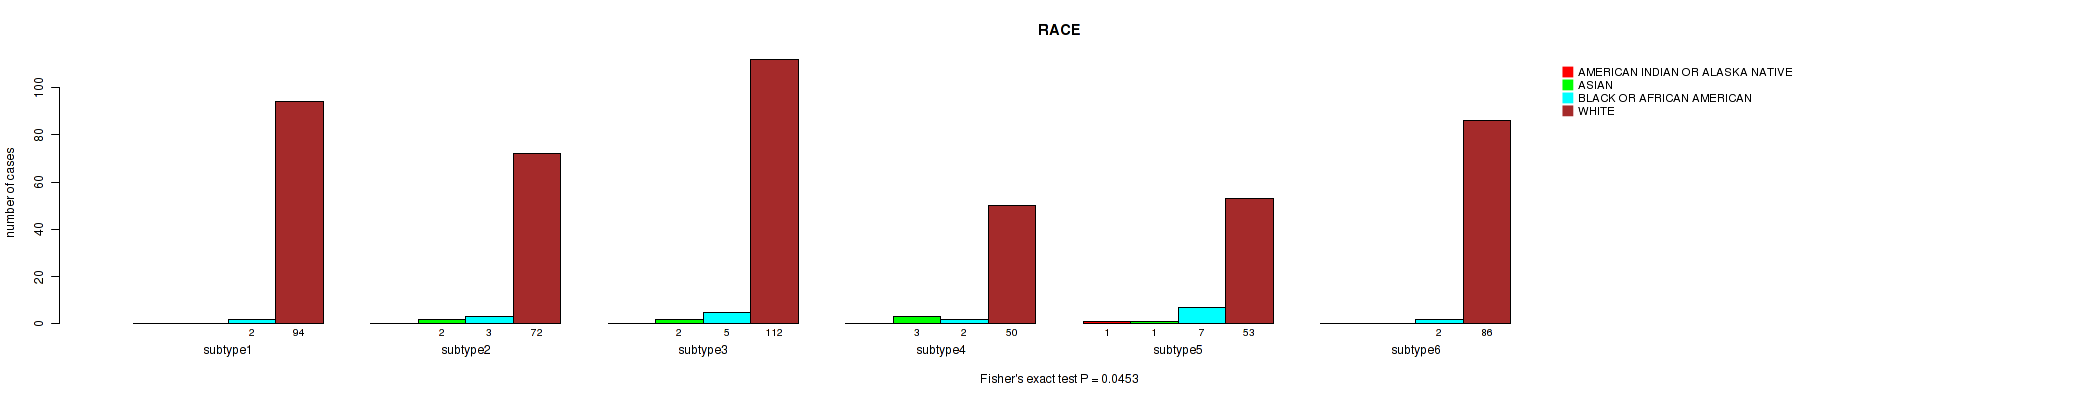
P value = 0.0453 (Fisher's exact test), Q value = 0.091
Table S107. Clustering Approach #12: 'MIRseq Mature cHierClus subtypes' versus Clinical Feature #7: 'RACE'
| nPatients | AMERICAN INDIAN OR ALASKA NATIVE | ASIAN | BLACK OR AFRICAN AMERICAN | WHITE |
|---|---|---|---|---|
| ALL | 1 | 8 | 21 | 467 |
| subtype1 | 0 | 0 | 2 | 94 |
| subtype2 | 0 | 2 | 3 | 72 |
| subtype3 | 0 | 2 | 5 | 112 |
| subtype4 | 0 | 3 | 2 | 50 |
| subtype5 | 1 | 1 | 7 | 53 |
| subtype6 | 0 | 0 | 2 | 86 |
Figure S95. Get High-res Image Clustering Approach #12: 'MIRseq Mature cHierClus subtypes' versus Clinical Feature #7: 'RACE'
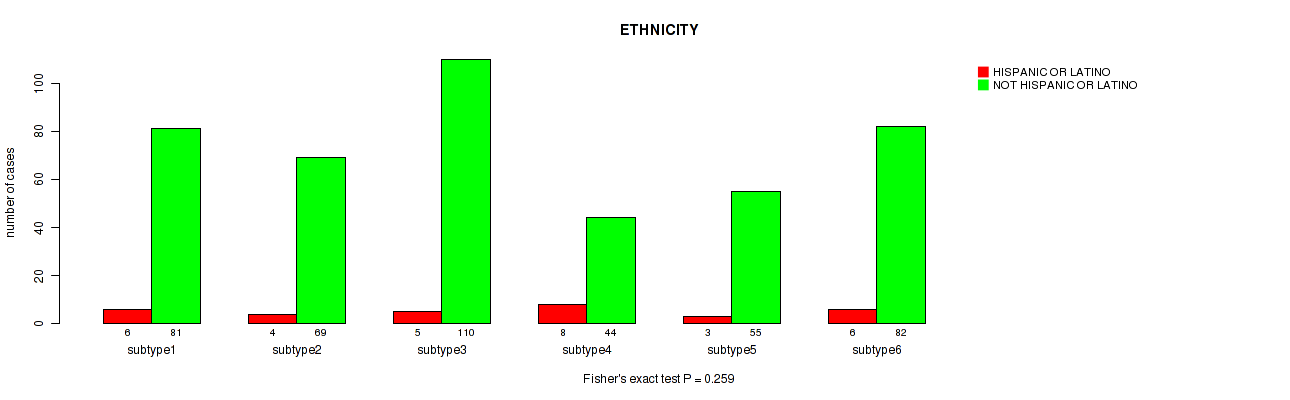
P value = 0.259 (Fisher's exact test), Q value = 0.38
Table S108. Clustering Approach #12: 'MIRseq Mature cHierClus subtypes' versus Clinical Feature #8: 'ETHNICITY'
| nPatients | HISPANIC OR LATINO | NOT HISPANIC OR LATINO |
|---|---|---|
| ALL | 32 | 441 |
| subtype1 | 6 | 81 |
| subtype2 | 4 | 69 |
| subtype3 | 5 | 110 |
| subtype4 | 8 | 44 |
| subtype5 | 3 | 55 |
| subtype6 | 6 | 82 |
Figure S96. Get High-res Image Clustering Approach #12: 'MIRseq Mature cHierClus subtypes' versus Clinical Feature #8: 'ETHNICITY'
-
Cluster data file = /xchip/cga/gdac-prod/tcga-gdac/jobResults/GDAC_mergedClustering/LGG-TP/22553887/LGG-TP.mergedcluster.txt
-
Clinical data file = /xchip/cga/gdac-prod/tcga-gdac/jobResults/Append_Data/LGG-TP/22506744/LGG-TP.merged_data.txt
-
Number of patients = 515
-
Number of clustering approaches = 12
-
Number of selected clinical features = 8
-
Exclude small clusters that include fewer than K patients, K = 3
consensus non-negative matrix factorization clustering approach (Brunet et al. 2004)
Resampling-based clustering method (Monti et al. 2003)
For survival clinical features, the Kaplan-Meier survival curves of tumors with and without gene mutations were plotted and the statistical significance P values were estimated by logrank test (Bland and Altman 2004) using the 'survdiff' function in R
For binary clinical features, two-tailed Fisher's exact tests (Fisher 1922) were used to estimate the P values using the 'fisher.test' function in R
For multiple hypothesis correction, Q value is the False Discovery Rate (FDR) analogue of the P value (Benjamini and Hochberg 1995), defined as the minimum FDR at which the test may be called significant. We used the 'Benjamini and Hochberg' method of 'p.adjust' function in R to convert P values into Q values.
In addition to the links below, the full results of the analysis summarized in this report can also be downloaded programmatically using firehose_get, or interactively from either the Broad GDAC website or TCGA Data Coordination Center Portal.