This pipeline computes the correlation between significantly recurrent gene mutations and selected clinical features.
Testing the association between mutation status of 7 genes and 7 clinical features across 80 patients, 3 significant findings detected with Q value < 0.25.
-
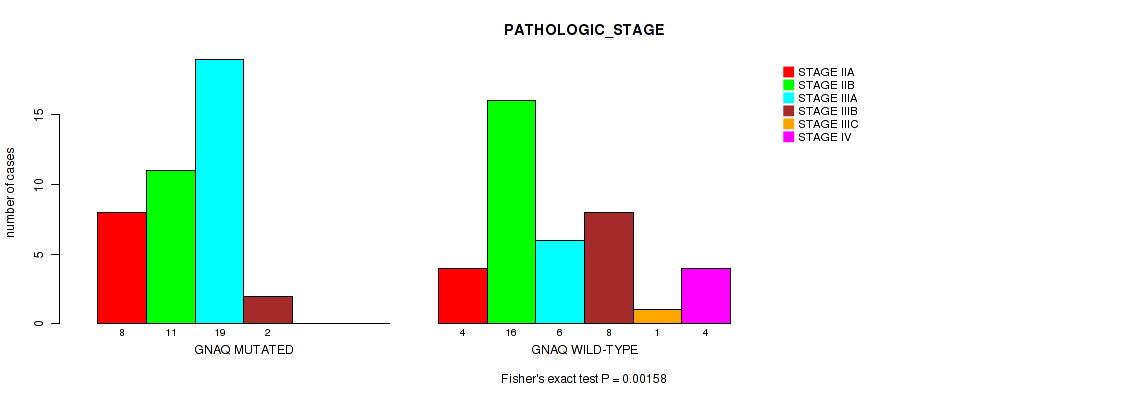
GNAQ mutation correlated to 'PATHOLOGIC_STAGE'.
-
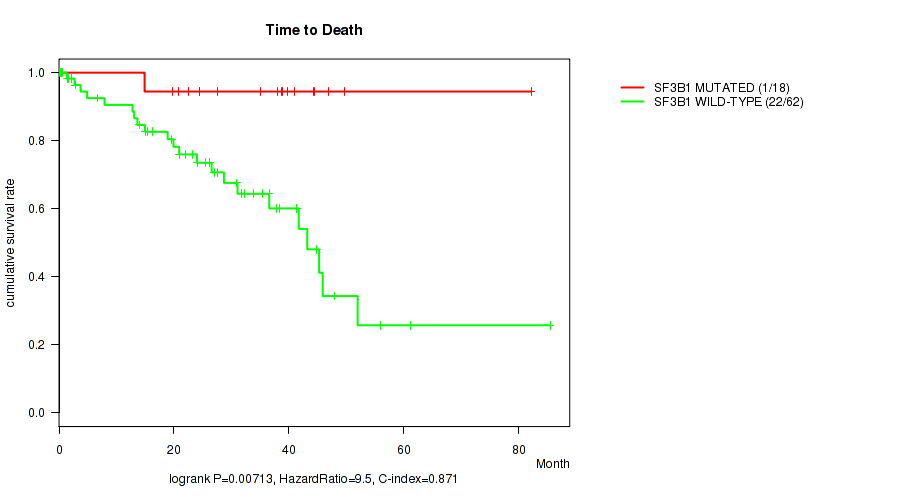
SF3B1 mutation correlated to 'Time to Death'.
-
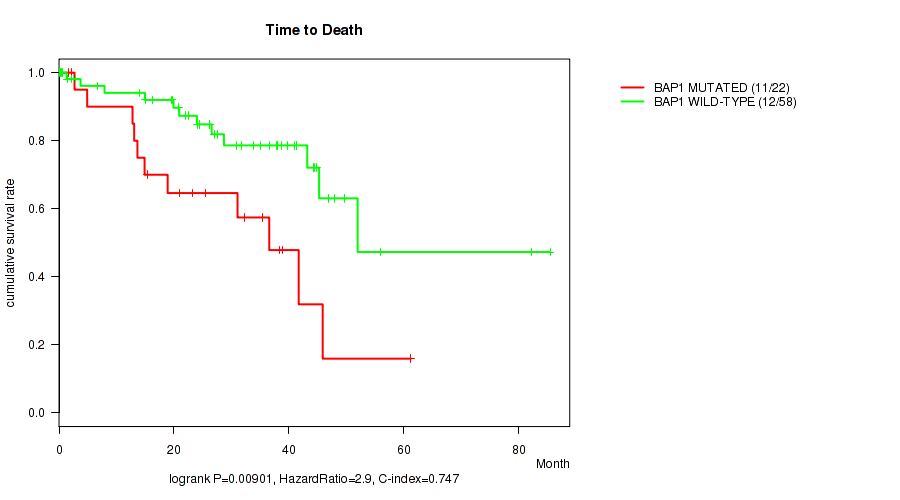
BAP1 mutation correlated to 'Time to Death'.
Table 1. Get Full Table Overview of the association between mutation status of 7 genes and 7 clinical features. Shown in the table are P values (Q values). Thresholded by Q value < 0.25, 3 significant findings detected.
|
Clinical Features |
Time to Death |
YEARS TO BIRTH |
PATHOLOGIC STAGE |
PATHOLOGY T STAGE |
PATHOLOGY M STAGE |
GENDER |
RADIATION THERAPY |
||
| nMutated (%) | nWild-Type | logrank test | Wilcoxon-test | Fisher's exact test | Fisher's exact test | Fisher's exact test | Fisher's exact test | Fisher's exact test | |
| GNAQ | 40 (50%) | 40 |
0.0429 (0.487) |
0.467 (1.00) |
0.00158 (0.0774) |
0.801 (1.00) |
0.0515 (0.487) |
1 (1.00) |
0.615 (1.00) |
| SF3B1 | 18 (22%) | 62 |
0.00713 (0.147) |
0.231 (1.00) |
0.879 (1.00) |
0.881 (1.00) |
0.573 (1.00) |
0.596 (1.00) |
0.545 (1.00) |
| BAP1 | 22 (28%) | 58 |
0.00901 (0.147) |
0.119 (0.73) |
0.434 (1.00) |
0.43 (1.00) |
0.265 (1.00) |
0.458 (1.00) |
1 (1.00) |
| GNA11 | 36 (45%) | 44 |
0.203 (1.00) |
0.749 (1.00) |
0.0597 (0.487) |
0.837 (1.00) |
0.307 (1.00) |
0.653 (1.00) |
0.0828 (0.579) |
| EIF1AX | 10 (12%) | 70 |
0.255 (1.00) |
0.419 (1.00) |
1 (1.00) |
0.666 (1.00) |
1 (1.00) |
0.32 (1.00) |
1 (1.00) |
| CYSLTR2 | 3 (4%) | 77 |
0.676 (1.00) |
0.425 (1.00) |
0.684 (1.00) |
0.78 (1.00) |
1 (1.00) |
1 (1.00) |
1 (1.00) |
| SFRS2 | 3 (4%) | 77 |
0.832 (1.00) |
0.704 (1.00) |
1 (1.00) |
0.578 (1.00) |
1 (1.00) |
1 (1.00) |
1 (1.00) |
P value = 0.00158 (Fisher's exact test), Q value = 0.077
Table S1. Gene #1: 'GNAQ MUTATION STATUS' versus Clinical Feature #3: 'PATHOLOGIC_STAGE'
| nPatients | STAGE IIA | STAGE IIB | STAGE IIIA | STAGE IIIB | STAGE IIIC | STAGE IV |
|---|---|---|---|---|---|---|
| ALL | 12 | 27 | 25 | 10 | 1 | 4 |
| GNAQ MUTATED | 8 | 11 | 19 | 2 | 0 | 0 |
| GNAQ WILD-TYPE | 4 | 16 | 6 | 8 | 1 | 4 |
Figure S1. Get High-res Image Gene #1: 'GNAQ MUTATION STATUS' versus Clinical Feature #3: 'PATHOLOGIC_STAGE'
P value = 0.00713 (logrank test), Q value = 0.15
Table S2. Gene #4: 'SF3B1 MUTATION STATUS' versus Clinical Feature #1: 'Time to Death'
| nPatients | nDeath | Duration Range (Median), Month | |
|---|---|---|---|
| ALL | 80 | 23 | 0.1 - 85.5 (25.8) |
| SF3B1 MUTATED | 18 | 1 | 14.9 - 82.2 (38.4) |
| SF3B1 WILD-TYPE | 62 | 22 | 0.1 - 85.5 (23.7) |
Figure S2. Get High-res Image Gene #4: 'SF3B1 MUTATION STATUS' versus Clinical Feature #1: 'Time to Death'
P value = 0.00901 (logrank test), Q value = 0.15
Table S3. Gene #5: 'BAP1 MUTATION STATUS' versus Clinical Feature #1: 'Time to Death'
| nPatients | nDeath | Duration Range (Median), Month | |
|---|---|---|---|
| ALL | 80 | 23 | 0.1 - 85.5 (25.8) |
| BAP1 MUTATED | 22 | 11 | 1.6 - 61.2 (22.1) |
| BAP1 WILD-TYPE | 58 | 12 | 0.1 - 85.5 (26.4) |
Figure S3. Get High-res Image Gene #5: 'BAP1 MUTATION STATUS' versus Clinical Feature #1: 'Time to Death'
-
Mutation data file = sample_sig_gene_table.txt from Mutsig_2CV pipeline
-
Processed Mutation data file = /xchip/cga/gdac-prod/tcga-gdac/jobResults/GDAC_Correlate_Genomic_Events_Preprocess/UVM-TP/22572045/transformed.cor.cli.txt
-
Clinical data file = /xchip/cga/gdac-prod/tcga-gdac/jobResults/Append_Data/UVM-TP/22507229/UVM-TP.merged_data.txt
-
Number of patients = 80
-
Number of significantly mutated genes = 7
-
Number of selected clinical features = 7
-
Exclude genes that fewer than K tumors have mutations, K = 3
For survival clinical features, the Kaplan-Meier survival curves of tumors with and without gene mutations were plotted and the statistical significance P values were estimated by logrank test (Bland and Altman 2004) using the 'survdiff' function in R
For binary or multi-class clinical features (nominal or ordinal), two-tailed Fisher's exact tests (Fisher 1922) were used to estimate the P values using the 'fisher.test' function in R
For multiple hypothesis correction, Q value is the False Discovery Rate (FDR) analogue of the P value (Benjamini and Hochberg 1995), defined as the minimum FDR at which the test may be called significant. We used the 'Benjamini and Hochberg' method of 'p.adjust' function in R to convert P values into Q values.
In addition to the links below, the full results of the analysis summarized in this report can also be downloaded programmatically using firehose_get, or interactively from either the Broad GDAC website or TCGA Data Coordination Center Portal.