(All_Metastatic cohort)
This pipeline computes the correlation between significant arm-level copy number variations (cnvs) and selected clinical features.
Testing the association between copy number variation 77 arm-level results and 8 clinical features across 173 patients, 2 significant findings detected with Q value < 0.25.
-
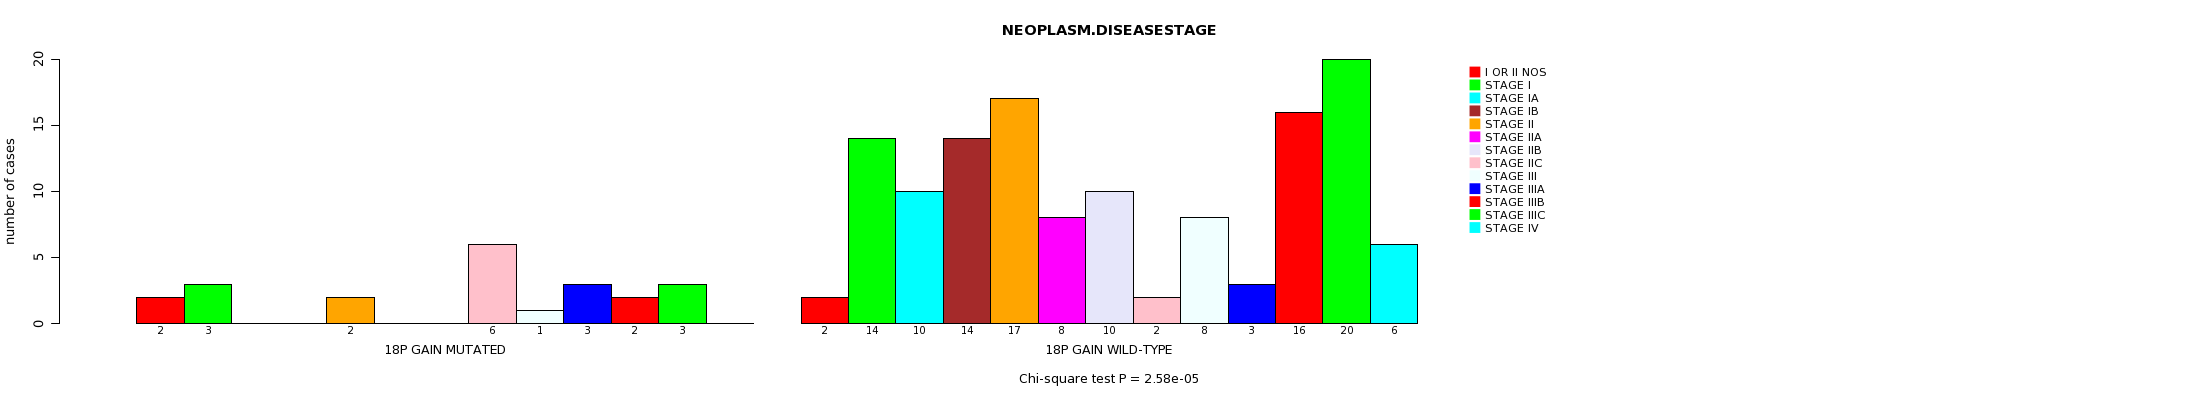
18p gain cnv correlated to 'NEOPLASM.DISEASESTAGE'.
-
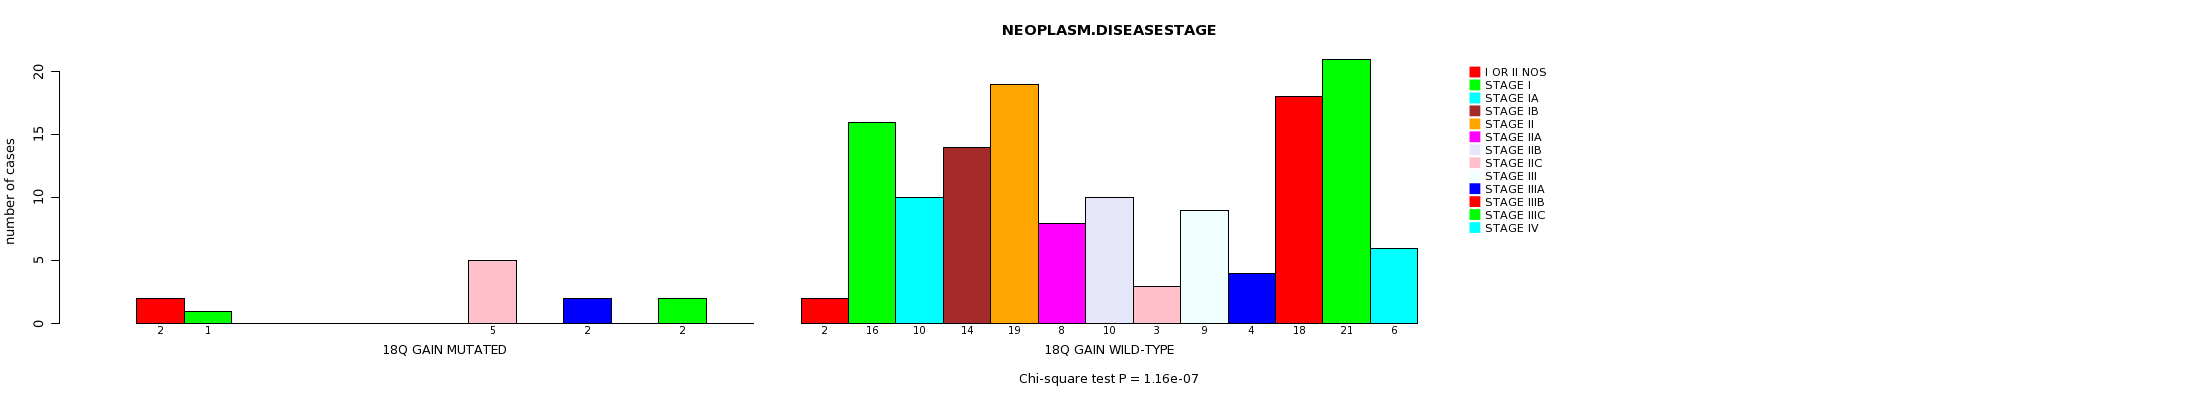
18q gain cnv correlated to 'NEOPLASM.DISEASESTAGE'.
Table 1. Get Full Table Overview of the association between significant copy number variation of 77 arm-level results and 8 clinical features. Shown in the table are P values (Q values). Thresholded by Q value < 0.25, 2 significant findings detected.
|
Clinical Features |
Time to Death |
AGE |
PRIMARY SITE OF DISEASE |
GENDER |
DISTANT METASTASIS |
LYMPH NODE METASTASIS |
TUMOR STAGECODE |
NEOPLASM DISEASESTAGE |
||
| nCNV (%) | nWild-Type | logrank test | t-test | Fisher's exact test | Fisher's exact test | Chi-square test | Chi-square test | t-test | Chi-square test | |
| 18p gain | 22 (13%) | 151 |
0.822 (1.00) |
0.0745 (1.00) |
0.744 (1.00) |
0.252 (1.00) |
0.516 (1.00) |
0.429 (1.00) |
2.58e-05 (0.0136) |
|
| 18q gain | 12 (7%) | 161 |
0.95 (1.00) |
0.506 (1.00) |
0.213 (1.00) |
0.541 (1.00) |
0.96 (1.00) |
0.49 (1.00) |
1.16e-07 (6.15e-05) |
|
| 1p gain | 22 (13%) | 151 |
0.134 (1.00) |
0.142 (1.00) |
0.414 (1.00) |
0.492 (1.00) |
0.863 (1.00) |
0.382 (1.00) |
0.0462 (1.00) |
|
| 1q gain | 59 (34%) | 114 |
0.318 (1.00) |
0.778 (1.00) |
0.11 (1.00) |
1 (1.00) |
0.638 (1.00) |
0.217 (1.00) |
0.519 (1.00) |
|
| 2p gain | 18 (10%) | 155 |
0.679 (1.00) |
0.17 (1.00) |
0.59 (1.00) |
0.444 (1.00) |
0.907 (1.00) |
0.159 (1.00) |
0.818 (1.00) |
|
| 2q gain | 16 (9%) | 157 |
0.863 (1.00) |
0.432 (1.00) |
0.578 (1.00) |
0.599 (1.00) |
0.927 (1.00) |
0.194 (1.00) |
0.857 (1.00) |
|
| 3p gain | 18 (10%) | 155 |
0.311 (1.00) |
0.678 (1.00) |
0.00209 (1.00) |
0.317 (1.00) |
0.907 (1.00) |
0.529 (1.00) |
0.705 (1.00) |
|
| 3q gain | 23 (13%) | 150 |
0.285 (1.00) |
0.445 (1.00) |
0.00433 (1.00) |
0.364 (1.00) |
0.851 (1.00) |
0.33 (1.00) |
0.793 (1.00) |
|
| 4p gain | 17 (10%) | 156 |
0.206 (1.00) |
0.0496 (1.00) |
0.821 (1.00) |
0.601 (1.00) |
0.927 (1.00) |
0.31 (1.00) |
0.0337 (1.00) |
|
| 4q gain | 13 (8%) | 160 |
0.181 (1.00) |
0.0491 (1.00) |
0.776 (1.00) |
1 (1.00) |
0.966 (1.00) |
0.451 (1.00) |
0.0829 (1.00) |
|
| 5p gain | 19 (11%) | 154 |
0.67 (1.00) |
0.271 (1.00) |
0.073 (1.00) |
0.805 (1.00) |
0.165 (1.00) |
0.633 (1.00) |
0.513 (1.00) |
|
| 5q gain | 7 (4%) | 166 |
0.117 (1.00) |
0.125 (1.00) |
0.708 (1.00) |
0.988 (1.00) |
0.545 (1.00) |
0.584 (1.00) |
||
| 6p gain | 58 (34%) | 115 |
0.192 (1.00) |
0.229 (1.00) |
0.052 (1.00) |
0.141 (1.00) |
0.648 (1.00) |
0.582 (1.00) |
0.463 (1.00) |
|
| 6q gain | 12 (7%) | 161 |
0.95 (1.00) |
0.811 (1.00) |
0.633 (1.00) |
0.541 (1.00) |
0.186 (1.00) |
0.941 (1.00) |
0.47 (1.00) |
|
| 7p gain | 73 (42%) | 100 |
0.122 (1.00) |
0.837 (1.00) |
0.322 (1.00) |
0.345 (1.00) |
0.0406 (1.00) |
0.146 (1.00) |
0.117 (1.00) |
|
| 7q gain | 74 (43%) | 99 |
0.365 (1.00) |
0.534 (1.00) |
0.437 (1.00) |
0.876 (1.00) |
0.0506 (1.00) |
0.175 (1.00) |
0.0178 (1.00) |
|
| 8p gain | 35 (20%) | 138 |
0.52 (1.00) |
0.736 (1.00) |
0.287 (1.00) |
0.34 (1.00) |
0.0464 (1.00) |
0.677 (1.00) |
0.515 (1.00) |
|
| 8q gain | 54 (31%) | 119 |
0.424 (1.00) |
0.548 (1.00) |
0.326 (1.00) |
0.4 (1.00) |
0.159 (1.00) |
0.492 (1.00) |
0.717 (1.00) |
|
| 9p gain | 3 (2%) | 170 |
0.0336 (1.00) |
0.731 (1.00) |
0.56 (1.00) |
0.997 (1.00) |
0.0276 (1.00) |
0.489 (1.00) |
||
| 9q gain | 3 (2%) | 170 |
0.877 (1.00) |
1 (1.00) |
0.56 (1.00) |
0.997 (1.00) |
0.176 (1.00) |
0.936 (1.00) |
||
| 11p gain | 11 (6%) | 162 |
0.993 (1.00) |
0.27 (1.00) |
0.741 (1.00) |
0.533 (1.00) |
0.966 (1.00) |
0.103 (1.00) |
0.809 (1.00) |
|
| 11q gain | 8 (5%) | 165 |
0.928 (1.00) |
0.303 (1.00) |
0.674 (1.00) |
0.487 (1.00) |
0.983 (1.00) |
0.929 (1.00) |
0.667 (1.00) |
|
| 12p gain | 19 (11%) | 154 |
0.44 (1.00) |
0.582 (1.00) |
0.411 (1.00) |
0.621 (1.00) |
0.165 (1.00) |
0.152 (1.00) |
0.142 (1.00) |
|
| 12q gain | 7 (4%) | 166 |
0.935 (1.00) |
0.916 (1.00) |
0.856 (1.00) |
0.251 (1.00) |
0.988 (1.00) |
0.0172 (1.00) |
0.108 (1.00) |
|
| 13q gain | 30 (17%) | 143 |
0.452 (1.00) |
0.904 (1.00) |
0.0144 (1.00) |
0.84 (1.00) |
0.577 (1.00) |
0.125 (1.00) |
0.106 (1.00) |
|
| 14q gain | 14 (8%) | 159 |
0.565 (1.00) |
0.782 (1.00) |
1 (1.00) |
0.57 (1.00) |
0.952 (1.00) |
0.719 (1.00) |
0.894 (1.00) |
|
| 15q gain | 26 (15%) | 147 |
0.614 (1.00) |
0.363 (1.00) |
0.776 (1.00) |
1 (1.00) |
0.825 (1.00) |
0.487 (1.00) |
0.933 (1.00) |
|
| 16p gain | 13 (8%) | 160 |
0.204 (1.00) |
0.99 (1.00) |
0.256 (1.00) |
1 (1.00) |
0.944 (1.00) |
0.679 (1.00) |
0.517 (1.00) |
|
| 16q gain | 12 (7%) | 161 |
0.359 (1.00) |
0.663 (1.00) |
0.451 (1.00) |
0.768 (1.00) |
0.952 (1.00) |
0.29 (1.00) |
0.727 (1.00) |
|
| 17p gain | 14 (8%) | 159 |
0.879 (1.00) |
0.926 (1.00) |
0.405 (1.00) |
0.4 (1.00) |
0.228 (1.00) |
0.94 (1.00) |
0.13 (1.00) |
|
| 17q gain | 22 (13%) | 151 |
0.0905 (1.00) |
0.051 (1.00) |
0.861 (1.00) |
0.252 (1.00) |
0.494 (1.00) |
0.598 (1.00) |
0.175 (1.00) |
|
| 19p gain | 11 (6%) | 162 |
0.542 (1.00) |
0.313 (1.00) |
0.0869 (1.00) |
0.752 (1.00) |
0.966 (1.00) |
0.969 (1.00) |
0.0866 (1.00) |
|
| 19q gain | 15 (9%) | 158 |
0.483 (1.00) |
0.107 (1.00) |
0.4 (1.00) |
0.0976 (1.00) |
0.936 (1.00) |
0.609 (1.00) |
0.146 (1.00) |
|
| 20p gain | 53 (31%) | 120 |
0.727 (1.00) |
0.519 (1.00) |
0.554 (1.00) |
0.735 (1.00) |
0.159 (1.00) |
0.709 (1.00) |
0.646 (1.00) |
|
| 20q gain | 65 (38%) | 108 |
0.749 (1.00) |
0.991 (1.00) |
0.554 (1.00) |
0.522 (1.00) |
0.086 (1.00) |
0.947 (1.00) |
0.612 (1.00) |
|
| 21q gain | 21 (12%) | 152 |
0.0191 (1.00) |
0.918 (1.00) |
0.433 (1.00) |
0.474 (1.00) |
0.194 (1.00) |
0.335 (1.00) |
0.0289 (1.00) |
|
| 22q gain | 46 (27%) | 127 |
0.49 (1.00) |
0.947 (1.00) |
0.0724 (1.00) |
0.292 (1.00) |
0.656 (1.00) |
0.0482 (1.00) |
0.0397 (1.00) |
|
| Xq gain | 3 (2%) | 170 |
0.0703 (1.00) |
0.291 (1.00) |
0.284 (1.00) |
|||||
| 1p loss | 13 (8%) | 160 |
0.648 (1.00) |
0.71 (1.00) |
0.658 (1.00) |
1 (1.00) |
0.966 (1.00) |
0.173 (1.00) |
0.263 (1.00) |
|
| 1q loss | 6 (3%) | 167 |
0.952 (1.00) |
0.455 (1.00) |
0.126 (1.00) |
0.678 (1.00) |
0.988 (1.00) |
0.523 (1.00) |
0.887 (1.00) |
|
| 2p loss | 15 (9%) | 158 |
0.676 (1.00) |
0.802 (1.00) |
0.599 (1.00) |
1 (1.00) |
0.952 (1.00) |
0.974 (1.00) |
0.322 (1.00) |
|
| 2q loss | 14 (8%) | 159 |
0.727 (1.00) |
0.432 (1.00) |
0.79 (1.00) |
0.4 (1.00) |
0.228 (1.00) |
0.91 (1.00) |
0.182 (1.00) |
|
| 3p loss | 12 (7%) | 161 |
0.299 (1.00) |
0.263 (1.00) |
0.285 (1.00) |
1 (1.00) |
0.966 (1.00) |
0.206 (1.00) |
0.0474 (1.00) |
|
| 3q loss | 12 (7%) | 161 |
0.302 (1.00) |
0.363 (1.00) |
0.31 (1.00) |
0.541 (1.00) |
0.966 (1.00) |
0.206 (1.00) |
0.361 (1.00) |
|
| 4p loss | 19 (11%) | 154 |
0.964 (1.00) |
0.459 (1.00) |
0.284 (1.00) |
0.0256 (1.00) |
0.383 (1.00) |
0.888 (1.00) |
0.764 (1.00) |
|
| 4q loss | 18 (10%) | 155 |
0.811 (1.00) |
0.532 (1.00) |
0.433 (1.00) |
0.0708 (1.00) |
0.000543 (0.286) |
0.755 (1.00) |
0.728 (1.00) |
|
| 5p loss | 23 (13%) | 150 |
0.667 (1.00) |
0.513 (1.00) |
0.258 (1.00) |
1 (1.00) |
0.886 (1.00) |
0.947 (1.00) |
0.977 (1.00) |
|
| 5q loss | 37 (21%) | 136 |
0.796 (1.00) |
0.623 (1.00) |
0.252 (1.00) |
0.705 (1.00) |
0.451 (1.00) |
0.678 (1.00) |
0.824 (1.00) |
|
| 6p loss | 17 (10%) | 156 |
0.958 (1.00) |
0.998 (1.00) |
0.154 (1.00) |
1 (1.00) |
0.907 (1.00) |
0.86 (1.00) |
0.189 (1.00) |
|
| 6q loss | 69 (40%) | 104 |
0.415 (1.00) |
0.0916 (1.00) |
0.0965 (1.00) |
1 (1.00) |
0.553 (1.00) |
0.776 (1.00) |
0.532 (1.00) |
|
| 7p loss | 3 (2%) | 170 |
0.583 (1.00) |
0.291 (1.00) |
0.56 (1.00) |
0.997 (1.00) |
0.978 (1.00) |
0.381 (1.00) |
||
| 7q loss | 3 (2%) | 170 |
0.583 (1.00) |
0.291 (1.00) |
0.56 (1.00) |
0.997 (1.00) |
0.978 (1.00) |
0.381 (1.00) |
||
| 8p loss | 22 (13%) | 151 |
0.251 (1.00) |
0.917 (1.00) |
0.23 (1.00) |
1 (1.00) |
0.471 (1.00) |
0.579 (1.00) |
0.452 (1.00) |
|
| 8q loss | 3 (2%) | 170 |
0.627 (1.00) |
0.475 (1.00) |
0.0565 (1.00) |
0.997 (1.00) |
0.349 (1.00) |
0.448 (1.00) |
||
| 9p loss | 100 (58%) | 73 |
0.0303 (1.00) |
0.445 (1.00) |
0.0275 (1.00) |
0.753 (1.00) |
0.553 (1.00) |
0.0269 (1.00) |
0.0628 (1.00) |
|
| 9q loss | 75 (43%) | 98 |
0.228 (1.00) |
0.0934 (1.00) |
0.0997 (1.00) |
0.0403 (1.00) |
0.235 (1.00) |
0.356 (1.00) |
0.026 (1.00) |
|
| 10p loss | 77 (45%) | 96 |
0.108 (1.00) |
0.186 (1.00) |
0.195 (1.00) |
0.0604 (1.00) |
0.393 (1.00) |
0.18 (1.00) |
0.676 (1.00) |
|
| 10q loss | 84 (49%) | 89 |
0.232 (1.00) |
0.00474 (1.00) |
0.135 (1.00) |
0.212 (1.00) |
0.184 (1.00) |
0.437 (1.00) |
0.732 (1.00) |
|
| 11p loss | 45 (26%) | 128 |
0.732 (1.00) |
0.286 (1.00) |
0.433 (1.00) |
0.113 (1.00) |
0.0817 (1.00) |
0.263 (1.00) |
0.0406 (1.00) |
|
| 11q loss | 48 (28%) | 125 |
0.907 (1.00) |
0.949 (1.00) |
0.312 (1.00) |
0.163 (1.00) |
0.112 (1.00) |
0.282 (1.00) |
0.0126 (1.00) |
|
| 12p loss | 10 (6%) | 163 |
0.273 (1.00) |
0.787 (1.00) |
0.52 (1.00) |
0.513 (1.00) |
0.143 (1.00) |
0.246 (1.00) |
0.55 (1.00) |
|
| 12q loss | 19 (11%) | 154 |
0.934 (1.00) |
0.956 (1.00) |
0.233 (1.00) |
0.216 (1.00) |
0.165 (1.00) |
0.484 (1.00) |
0.765 (1.00) |
|
| 13q loss | 26 (15%) | 147 |
0.7 (1.00) |
0.645 (1.00) |
0.0837 (1.00) |
0.67 (1.00) |
0.00556 (1.00) |
0.0972 (1.00) |
0.485 (1.00) |
|
| 14q loss | 42 (24%) | 131 |
0.895 (1.00) |
0.46 (1.00) |
0.754 (1.00) |
0.718 (1.00) |
0.102 (1.00) |
0.426 (1.00) |
0.46 (1.00) |
|
| 15q loss | 11 (6%) | 162 |
0.475 (1.00) |
0.294 (1.00) |
0.178 (1.00) |
0.752 (1.00) |
0.143 (1.00) |
0.466 (1.00) |
0.876 (1.00) |
|
| 16p loss | 14 (8%) | 159 |
0.352 (1.00) |
0.375 (1.00) |
0.532 (1.00) |
0.4 (1.00) |
0.96 (1.00) |
0.801 (1.00) |
0.248 (1.00) |
|
| 16q loss | 31 (18%) | 142 |
0.129 (1.00) |
0.768 (1.00) |
0.463 (1.00) |
0.689 (1.00) |
0.42 (1.00) |
0.853 (1.00) |
0.221 (1.00) |
|
| 17p loss | 38 (22%) | 135 |
0.942 (1.00) |
0.537 (1.00) |
0.206 (1.00) |
0.575 (1.00) |
0.554 (1.00) |
0.722 (1.00) |
0.728 (1.00) |
|
| 17q loss | 17 (10%) | 156 |
0.307 (1.00) |
0.849 (1.00) |
0.729 (1.00) |
1 (1.00) |
0.11 (1.00) |
0.171 (1.00) |
0.629 (1.00) |
|
| 18p loss | 35 (20%) | 138 |
0.895 (1.00) |
0.523 (1.00) |
0.146 (1.00) |
0.568 (1.00) |
0.71 (1.00) |
0.129 (1.00) |
0.218 (1.00) |
|
| 18q loss | 33 (19%) | 140 |
0.882 (1.00) |
0.447 (1.00) |
0.165 (1.00) |
0.693 (1.00) |
0.618 (1.00) |
0.304 (1.00) |
0.137 (1.00) |
|
| 19p loss | 15 (9%) | 158 |
0.771 (1.00) |
0.393 (1.00) |
0.599 (1.00) |
0.0266 (1.00) |
0.0853 (1.00) |
0.614 (1.00) |
0.263 (1.00) |
|
| 19q loss | 16 (9%) | 157 |
0.539 (1.00) |
0.708 (1.00) |
0.0387 (1.00) |
0.178 (1.00) |
0.0447 (1.00) |
0.431 (1.00) |
0.485 (1.00) |
|
| 20p loss | 7 (4%) | 166 |
0.219 (1.00) |
0.342 (1.00) |
0.238 (1.00) |
0.708 (1.00) |
0.0379 (1.00) |
0.874 (1.00) |
0.658 (1.00) |
|
| 21q loss | 21 (12%) | 152 |
0.868 (1.00) |
0.887 (1.00) |
0.857 (1.00) |
0.812 (1.00) |
0.875 (1.00) |
0.726 (1.00) |
0.137 (1.00) |
|
| 22q loss | 13 (8%) | 160 |
0.344 (1.00) |
0.668 (1.00) |
0.346 (1.00) |
0.568 (1.00) |
0.27 (1.00) |
0.992 (1.00) |
0.325 (1.00) |
|
| Xq loss | 6 (3%) | 167 |
0.797 (1.00) |
0.636 (1.00) |
0.595 (1.00) |
0.0329 (1.00) |
0.991 (1.00) |
0.983 (1.00) |
0.504 (1.00) |
P value = 2.58e-05 (Chi-square test), Q value = 0.014
Table S1. Gene #30: '18p gain mutation analysis' versus Clinical Feature #8: 'NEOPLASM.DISEASESTAGE'
| nPatients | I OR II NOS | STAGE I | STAGE IA | STAGE IB | STAGE II | STAGE IIA | STAGE IIB | STAGE IIC | STAGE III | STAGE IIIA | STAGE IIIB | STAGE IIIC | STAGE IV |
|---|---|---|---|---|---|---|---|---|---|---|---|---|---|
| ALL | 4 | 17 | 10 | 14 | 19 | 8 | 10 | 8 | 9 | 6 | 18 | 23 | 6 |
| 18P GAIN MUTATED | 2 | 3 | 0 | 0 | 2 | 0 | 0 | 6 | 1 | 3 | 2 | 3 | 0 |
| 18P GAIN WILD-TYPE | 2 | 14 | 10 | 14 | 17 | 8 | 10 | 2 | 8 | 3 | 16 | 20 | 6 |
Figure S1. Get High-res Image Gene #30: '18p gain mutation analysis' versus Clinical Feature #8: 'NEOPLASM.DISEASESTAGE'
P value = 1.16e-07 (Chi-square test), Q value = 6.2e-05
Table S2. Gene #31: '18q gain mutation analysis' versus Clinical Feature #8: 'NEOPLASM.DISEASESTAGE'
| nPatients | I OR II NOS | STAGE I | STAGE IA | STAGE IB | STAGE II | STAGE IIA | STAGE IIB | STAGE IIC | STAGE III | STAGE IIIA | STAGE IIIB | STAGE IIIC | STAGE IV |
|---|---|---|---|---|---|---|---|---|---|---|---|---|---|
| ALL | 4 | 17 | 10 | 14 | 19 | 8 | 10 | 8 | 9 | 6 | 18 | 23 | 6 |
| 18Q GAIN MUTATED | 2 | 1 | 0 | 0 | 0 | 0 | 0 | 5 | 0 | 2 | 0 | 2 | 0 |
| 18Q GAIN WILD-TYPE | 2 | 16 | 10 | 14 | 19 | 8 | 10 | 3 | 9 | 4 | 18 | 21 | 6 |
Figure S2. Get High-res Image Gene #31: '18q gain mutation analysis' versus Clinical Feature #8: 'NEOPLASM.DISEASESTAGE'
-
Mutation data file = broad_values_by_arm.mutsig.cluster.txt
-
Clinical data file = SKCM-All_Metastatic.clin.merged.picked.txt
-
Number of patients = 173
-
Number of significantly arm-level cnvs = 77
-
Number of selected clinical features = 8
-
Exclude genes that fewer than K tumors have mutations, K = 3
For survival clinical features, the Kaplan-Meier survival curves of tumors with and without gene mutations were plotted and the statistical significance P values were estimated by logrank test (Bland and Altman 2004) using the 'survdiff' function in R
For continuous numerical clinical features, two-tailed Student's t test with unequal variance (Lehmann and Romano 2005) was applied to compare the clinical values between tumors with and without gene mutations using 't.test' function in R
For binary or multi-class clinical features (nominal or ordinal), two-tailed Fisher's exact tests (Fisher 1922) were used to estimate the P values using the 'fisher.test' function in R
For multi-class clinical features (nominal or ordinal), Chi-square tests (Greenwood and Nikulin 1996) were used to estimate the P values using the 'chisq.test' function in R
For multiple hypothesis correction, Q value is the False Discovery Rate (FDR) analogue of the P value (Benjamini and Hochberg 1995), defined as the minimum FDR at which the test may be called significant. We used the 'Benjamini and Hochberg' method of 'p.adjust' function in R to convert P values into Q values.
This is an experimental feature. The full results of the analysis summarized in this report can be downloaded from the TCGA Data Coordination Center.