(All_Metastatic cohort)
This pipeline computes the correlation between significantly recurrent gene mutations and selected clinical features.
Testing the association between mutation status of 111 genes and 8 clinical features across 161 patients, 9 significant findings detected with Q value < 0.25.
-
OXA1L mutation correlated to 'LYMPH.NODE.METASTASIS'.
-
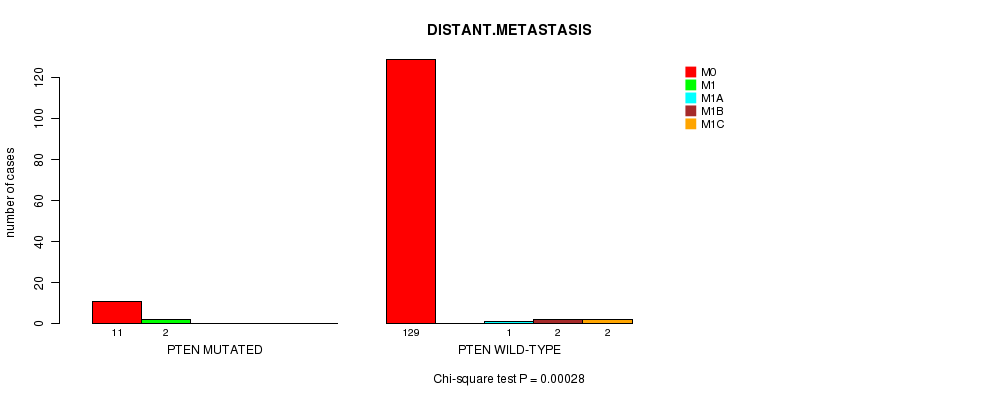
PTEN mutation correlated to 'DISTANT.METASTASIS'.
-
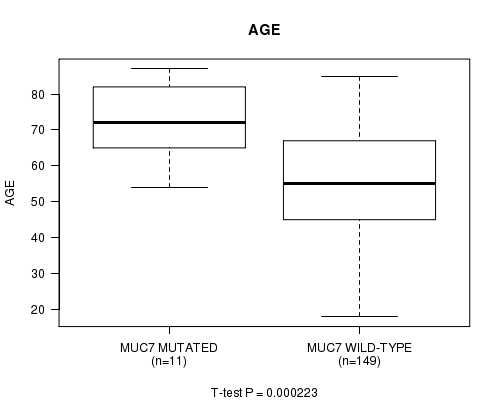
MUC7 mutation correlated to 'AGE'.
-
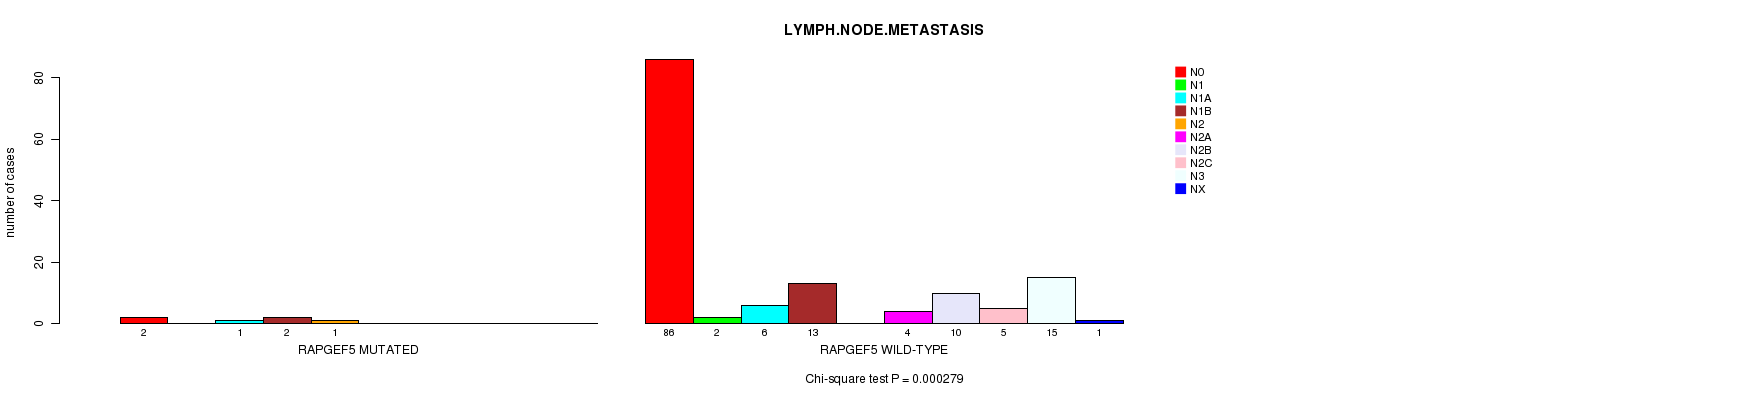
RAPGEF5 mutation correlated to 'LYMPH.NODE.METASTASIS'.
-
ANKRD20A4 mutation correlated to 'LYMPH.NODE.METASTASIS'.
-
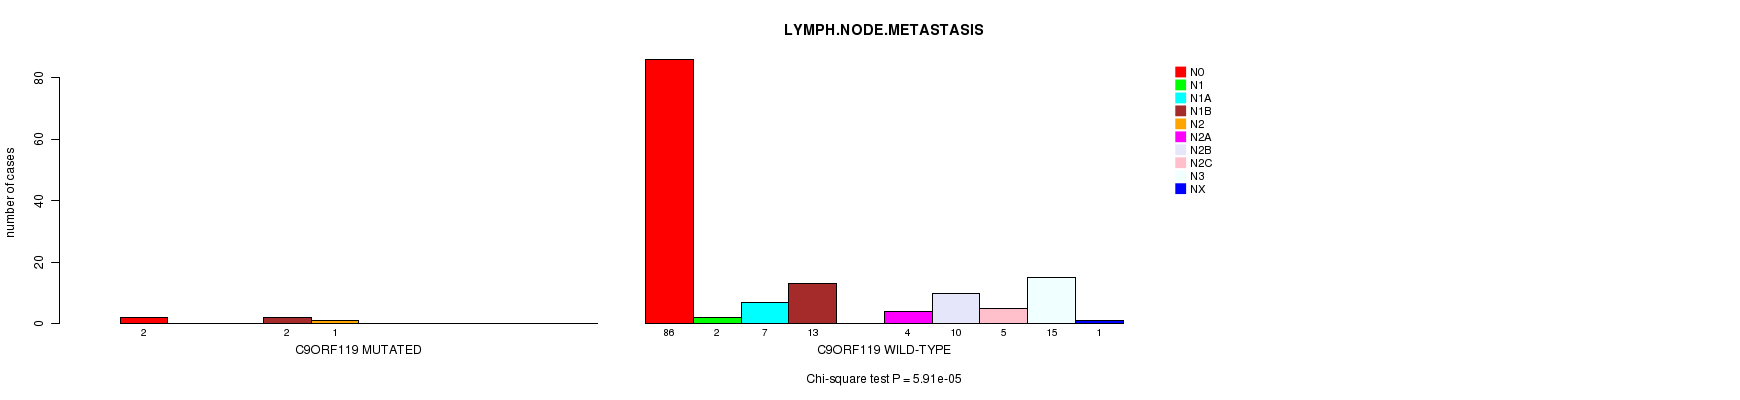
C9ORF119 mutation correlated to 'LYMPH.NODE.METASTASIS'.
-
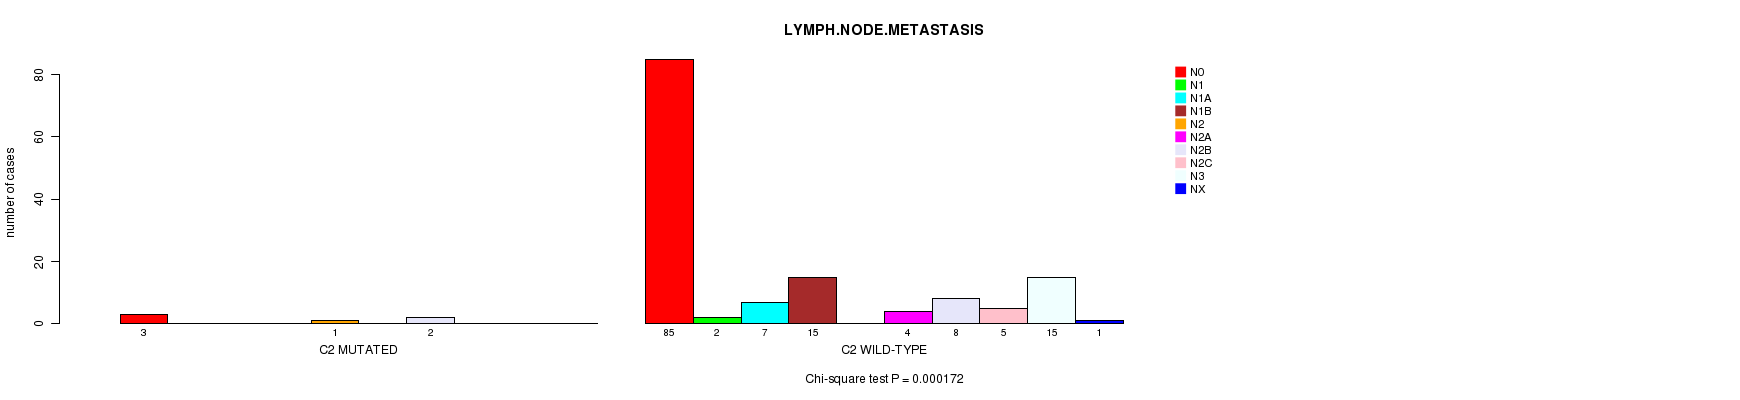
C2 mutation correlated to 'LYMPH.NODE.METASTASIS'.
-
SPINK13 mutation correlated to 'LYMPH.NODE.METASTASIS'.
-
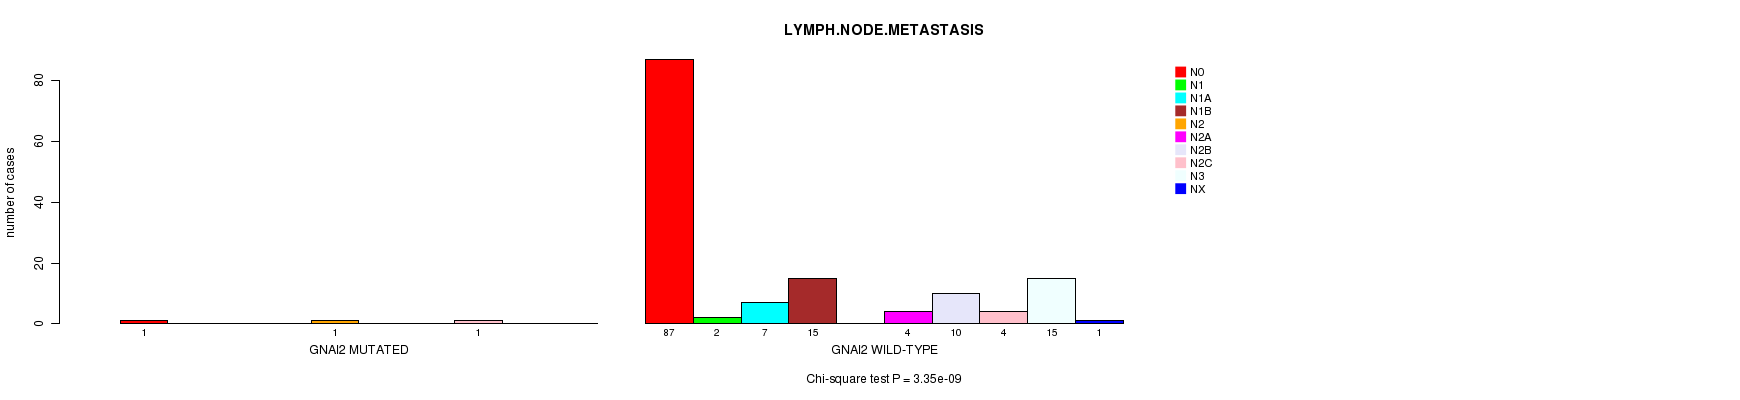
GNAI2 mutation correlated to 'LYMPH.NODE.METASTASIS'.
Table 1. Get Full Table Overview of the association between mutation status of 111 genes and 8 clinical features. Shown in the table are P values (Q values). Thresholded by Q value < 0.25, 9 significant findings detected.
|
Clinical Features |
Time to Death |
AGE |
PRIMARY SITE OF DISEASE |
GENDER |
DISTANT METASTASIS |
LYMPH NODE METASTASIS |
TUMOR STAGECODE |
NEOPLASM DISEASESTAGE |
||
| nMutated (%) | nWild-Type | logrank test | t-test | Fisher's exact test | Fisher's exact test | Chi-square test | Chi-square test | t-test | Chi-square test | |
| OXA1L | 5 (3%) | 156 |
0.695 (1.00) |
0.613 (1.00) |
0.656 (1.00) |
1 (1.00) |
0.992 (1.00) |
0.00012 (0.0914) |
0.48 (1.00) |
|
| PTEN | 13 (8%) | 148 |
0.703 (1.00) |
0.234 (1.00) |
0.473 (1.00) |
0.551 (1.00) |
0.00028 (0.213) |
0.835 (1.00) |
0.0325 (1.00) |
|
| MUC7 | 11 (7%) | 150 |
0.36 (1.00) |
0.000223 (0.17) |
0.819 (1.00) |
0.747 (1.00) |
0.964 (1.00) |
0.828 (1.00) |
0.576 (1.00) |
|
| RAPGEF5 | 8 (5%) | 153 |
0.997 (1.00) |
0.36 (1.00) |
0.1 (1.00) |
0.26 (1.00) |
0.989 (1.00) |
0.000279 (0.212) |
0.331 (1.00) |
|
| ANKRD20A4 | 4 (2%) | 157 |
0.449 (1.00) |
0.531 (1.00) |
0.778 (1.00) |
0.297 (1.00) |
0.995 (1.00) |
1.62e-05 (0.0124) |
0.564 (1.00) |
|
| C9ORF119 | 5 (3%) | 156 |
0.333 (1.00) |
0.34 (1.00) |
1 (1.00) |
0.159 (1.00) |
0.992 (1.00) |
5.91e-05 (0.0451) |
0.817 (1.00) |
|
| C2 | 7 (4%) | 154 |
0.485 (1.00) |
0.883 (1.00) |
0.742 (1.00) |
1 (1.00) |
0.989 (1.00) |
0.000172 (0.131) |
0.349 (1.00) |
|
| SPINK13 | 6 (4%) | 155 |
0.0886 (1.00) |
0.168 (1.00) |
0.84 (1.00) |
0.416 (1.00) |
0.989 (1.00) |
3.89e-05 (0.0297) |
0.817 (1.00) |
|
| GNAI2 | 4 (2%) | 157 |
0.133 (1.00) |
0.531 (1.00) |
0.44 (1.00) |
0.624 (1.00) |
0.997 (1.00) |
3.35e-09 (2.57e-06) |
0.572 (1.00) |
|
| TP53 | 26 (16%) | 135 |
0.687 (1.00) |
0.07 (1.00) |
0.221 (1.00) |
0.828 (1.00) |
0.59 (1.00) |
0.0964 (1.00) |
0.464 (1.00) |
|
| BRAF | 82 (51%) | 79 |
0.256 (1.00) |
0.0963 (1.00) |
0.126 (1.00) |
0.746 (1.00) |
0.568 (1.00) |
0.835 (1.00) |
0.635 (1.00) |
|
| C15ORF23 | 11 (7%) | 150 |
0.579 (1.00) |
0.67 (1.00) |
0.819 (1.00) |
0.747 (1.00) |
0.97 (1.00) |
0.488 (1.00) |
0.679 (1.00) |
|
| CDKN2A | 27 (17%) | 134 |
0.571 (1.00) |
0.995 (1.00) |
0.671 (1.00) |
1 (1.00) |
0.826 (1.00) |
0.746 (1.00) |
0.366 (1.00) |
|
| NRAS | 49 (30%) | 112 |
0.7 (1.00) |
0.394 (1.00) |
0.454 (1.00) |
1 (1.00) |
0.618 (1.00) |
0.91 (1.00) |
0.591 (1.00) |
|
| STK19 | 10 (6%) | 151 |
0.415 (1.00) |
0.335 (1.00) |
1 (1.00) |
0.5 (1.00) |
0.975 (1.00) |
0.965 (1.00) |
0.76 (1.00) |
|
| RAC1 | 12 (7%) | 149 |
0.0898 (1.00) |
0.415 (1.00) |
0.579 (1.00) |
1 (1.00) |
0.97 (1.00) |
0.895 (1.00) |
0.303 (1.00) |
|
| IDH1 | 8 (5%) | 153 |
0.697 (1.00) |
0.00483 (1.00) |
1 (1.00) |
0.466 (1.00) |
0.981 (1.00) |
0.981 (1.00) |
0.703 (1.00) |
|
| ACSM2B | 31 (19%) | 130 |
0.352 (1.00) |
0.861 (1.00) |
0.0877 (1.00) |
0.00183 (1.00) |
0.771 (1.00) |
0.351 (1.00) |
0.822 (1.00) |
|
| PPP6C | 15 (9%) | 146 |
0.00412 (1.00) |
0.647 (1.00) |
0.646 (1.00) |
1 (1.00) |
0.402 (1.00) |
0.0481 (1.00) |
0.755 (1.00) |
|
| LCE1B | 9 (6%) | 152 |
0.0619 (1.00) |
0.75 (1.00) |
0.0817 (1.00) |
0.726 (1.00) |
0.981 (1.00) |
0.933 (1.00) |
0.674 (1.00) |
|
| OR51S1 | 17 (11%) | 144 |
0.668 (1.00) |
0.424 (1.00) |
0.197 (1.00) |
1 (1.00) |
0.934 (1.00) |
0.0496 (1.00) |
0.201 (1.00) |
|
| NAP1L2 | 17 (11%) | 144 |
0.29 (1.00) |
0.0518 (1.00) |
0.0722 (1.00) |
0.426 (1.00) |
0.925 (1.00) |
0.0605 (1.00) |
0.635 (1.00) |
|
| PRB2 | 24 (15%) | 137 |
0.528 (1.00) |
0.00385 (1.00) |
0.158 (1.00) |
0.0374 (1.00) |
0.862 (1.00) |
0.412 (1.00) |
0.287 (1.00) |
|
| TAF1A | 10 (6%) | 151 |
0.107 (1.00) |
0.57 (1.00) |
0.893 (1.00) |
0.5 (1.00) |
0.179 (1.00) |
0.733 (1.00) |
0.823 (1.00) |
|
| HIST1H2AA | 7 (4%) | 154 |
0.734 (1.00) |
0.975 (1.00) |
0.0409 (1.00) |
0.708 (1.00) |
0.985 (1.00) |
0.955 (1.00) |
0.751 (1.00) |
|
| FRG2B | 10 (6%) | 151 |
0.639 (1.00) |
0.0224 (1.00) |
0.808 (1.00) |
0.5 (1.00) |
0.97 (1.00) |
0.916 (1.00) |
0.566 (1.00) |
|
| CDH9 | 27 (17%) | 134 |
0.245 (1.00) |
0.385 (1.00) |
0.0132 (1.00) |
1 (1.00) |
0.813 (1.00) |
0.204 (1.00) |
0.0904 (1.00) |
|
| PRAMEF11 | 15 (9%) | 146 |
0.0347 (1.00) |
0.0848 (1.00) |
0.751 (1.00) |
0.784 (1.00) |
0.942 (1.00) |
0.0513 (1.00) |
0.854 (1.00) |
|
| HBG2 | 7 (4%) | 154 |
0.486 (1.00) |
0.156 (1.00) |
0.854 (1.00) |
1 (1.00) |
0.985 (1.00) |
0.00722 (1.00) |
0.758 (1.00) |
|
| DDX3X | 16 (10%) | 145 |
0.57 (1.00) |
0.538 (1.00) |
0.54 (1.00) |
0.172 (1.00) |
0.00456 (1.00) |
0.991 (1.00) |
0.704 (1.00) |
|
| PRB4 | 18 (11%) | 143 |
0.0555 (1.00) |
0.123 (1.00) |
0.307 (1.00) |
0.205 (1.00) |
0.438 (1.00) |
0.12 (1.00) |
0.874 (1.00) |
|
| GRXCR1 | 15 (9%) | 146 |
0.178 (1.00) |
0.0286 (1.00) |
0.517 (1.00) |
1 (1.00) |
0.942 (1.00) |
0.78 (1.00) |
0.318 (1.00) |
|
| HHLA2 | 12 (7%) | 149 |
0.723 (1.00) |
0.301 (1.00) |
0.133 (1.00) |
1 (1.00) |
0.964 (1.00) |
0.0249 (1.00) |
0.908 (1.00) |
|
| RBM11 | 11 (7%) | 150 |
0.526 (1.00) |
0.194 (1.00) |
0.673 (1.00) |
0.747 (1.00) |
0.227 (1.00) |
0.0329 (1.00) |
0.367 (1.00) |
|
| FUT9 | 17 (11%) | 144 |
0.291 (1.00) |
0.0352 (1.00) |
0.389 (1.00) |
0.602 (1.00) |
0.916 (1.00) |
0.157 (1.00) |
0.256 (1.00) |
|
| TTN | 127 (79%) | 34 |
0.186 (1.00) |
0.837 (1.00) |
1 (1.00) |
0.166 (1.00) |
0.496 (1.00) |
0.353 (1.00) |
0.376 (1.00) |
|
| HBD | 9 (6%) | 152 |
0.0883 (1.00) |
0.856 (1.00) |
0.376 (1.00) |
0.726 (1.00) |
0.975 (1.00) |
0.945 (1.00) |
0.349 (1.00) |
|
| KIAA1257 | 7 (4%) | 154 |
0.22 (1.00) |
0.333 (1.00) |
0.538 (1.00) |
0.424 (1.00) |
0.992 (1.00) |
0.885 (1.00) |
0.729 (1.00) |
|
| USP17L2 | 16 (10%) | 145 |
0.93 (1.00) |
0.662 (1.00) |
0.0759 (1.00) |
0.172 (1.00) |
0.934 (1.00) |
0.145 (1.00) |
0.113 (1.00) |
|
| CADM2 | 18 (11%) | 143 |
0.432 (1.00) |
0.944 (1.00) |
0.622 (1.00) |
1 (1.00) |
0.906 (1.00) |
0.136 (1.00) |
0.409 (1.00) |
|
| GFRAL | 24 (15%) | 137 |
0.971 (1.00) |
0.82 (1.00) |
0.177 (1.00) |
0.82 (1.00) |
0.59 (1.00) |
0.122 (1.00) |
0.0761 (1.00) |
|
| OR4N2 | 19 (12%) | 142 |
0.824 (1.00) |
0.363 (1.00) |
0.189 (1.00) |
0.0112 (1.00) |
0.0769 (1.00) |
0.277 (1.00) |
0.663 (1.00) |
|
| UGT2B15 | 17 (11%) | 144 |
0.647 (1.00) |
0.36 (1.00) |
0.773 (1.00) |
0.112 (1.00) |
0.117 (1.00) |
0.126 (1.00) |
0.14 (1.00) |
|
| UNC119B | 3 (2%) | 158 |
0.999 (1.00) |
0.375 (1.00) |
1 (1.00) |
1 (1.00) |
0.997 (1.00) |
0.99 (1.00) |
0.555 (1.00) |
|
| C8A | 21 (13%) | 140 |
0.497 (1.00) |
0.106 (1.00) |
1 (1.00) |
0.0906 (1.00) |
0.0914 (1.00) |
0.38 (1.00) |
0.426 (1.00) |
|
| ELF5 | 4 (2%) | 157 |
0.562 (1.00) |
0.775 (1.00) |
0.6 (1.00) |
1 (1.00) |
0.997 (1.00) |
0.28 (1.00) |
0.97 (1.00) |
|
| SPAG16 | 13 (8%) | 148 |
0.501 (1.00) |
0.753 (1.00) |
0.848 (1.00) |
0.377 (1.00) |
0.964 (1.00) |
0.0615 (1.00) |
0.582 (1.00) |
|
| PHGDH | 8 (5%) | 153 |
0.776 (1.00) |
0.695 (1.00) |
0.588 (1.00) |
0.0273 (1.00) |
0.989 (1.00) |
0.00217 (1.00) |
0.143 (1.00) |
|
| COPG2 | 3 (2%) | 158 |
0.454 (1.00) |
0.997 (1.00) |
0.725 (1.00) |
1 (1.00) |
0.997 (1.00) |
0.99 (1.00) |
0.0442 (1.00) |
|
| GML | 8 (5%) | 153 |
0.898 (1.00) |
0.114 (1.00) |
1 (1.00) |
0.26 (1.00) |
0.985 (1.00) |
0.746 (1.00) |
0.965 (1.00) |
|
| TBC1D3B | 3 (2%) | 158 |
0.00198 (1.00) |
0.404 (1.00) |
0.285 (1.00) |
1 (1.00) |
||||
| TFEC | 15 (9%) | 146 |
0.37 (1.00) |
0.111 (1.00) |
1 (1.00) |
1 (1.00) |
0.942 (1.00) |
0.00562 (1.00) |
0.571 (1.00) |
|
| TRAT1 | 11 (7%) | 150 |
0.0369 (1.00) |
0.545 (1.00) |
0.0648 (1.00) |
0.533 (1.00) |
0.97 (1.00) |
0.0218 (1.00) |
0.86 (1.00) |
|
| PRR23B | 11 (7%) | 150 |
0.206 (1.00) |
0.813 (1.00) |
0.0825 (1.00) |
1 (1.00) |
0.97 (1.00) |
0.042 (1.00) |
0.907 (1.00) |
|
| LIN7A | 9 (6%) | 152 |
0.647 (1.00) |
0.581 (1.00) |
0.376 (1.00) |
0.488 (1.00) |
0.985 (1.00) |
0.00709 (1.00) |
0.576 (1.00) |
|
| PARM1 | 14 (9%) | 147 |
0.288 (1.00) |
0.234 (1.00) |
0.283 (1.00) |
0.577 (1.00) |
0.95 (1.00) |
0.00212 (1.00) |
0.167 (1.00) |
|
| CCK | 5 (3%) | 156 |
0.112 (1.00) |
0.725 (1.00) |
0.656 (1.00) |
0.653 (1.00) |
0.995 (1.00) |
0.024 (1.00) |
0.795 (1.00) |
|
| TCEB3C | 23 (14%) | 138 |
0.334 (1.00) |
0.472 (1.00) |
0.864 (1.00) |
0.16 (1.00) |
0.862 (1.00) |
0.533 (1.00) |
0.458 (1.00) |
|
| DEFB118 | 7 (4%) | 154 |
0.0924 (1.00) |
0.64 (1.00) |
0.742 (1.00) |
1 (1.00) |
0.985 (1.00) |
0.0094 (1.00) |
0.762 (1.00) |
|
| VEGFC | 16 (10%) | 145 |
0.93 (1.00) |
0.899 (1.00) |
0.394 (1.00) |
0.589 (1.00) |
0.942 (1.00) |
0.0142 (1.00) |
0.331 (1.00) |
|
| MARCH11 | 8 (5%) | 153 |
0.226 (1.00) |
0.789 (1.00) |
0.208 (1.00) |
0.711 (1.00) |
0.0895 (1.00) |
0.0156 (1.00) |
0.289 (1.00) |
|
| ZFP106 | 6 (4%) | 155 |
0.524 (1.00) |
0.000615 (0.466) |
0.491 (1.00) |
0.0864 (1.00) |
0.989 (1.00) |
0.81 (1.00) |
0.382 (1.00) |
|
| PDE1A | 26 (16%) | 135 |
0.666 (1.00) |
0.13 (1.00) |
0.0187 (1.00) |
0.657 (1.00) |
0.838 (1.00) |
0.136 (1.00) |
0.708 (1.00) |
|
| OR4F6 | 12 (7%) | 149 |
0.319 (1.00) |
0.202 (1.00) |
0.916 (1.00) |
0.538 (1.00) |
0.227 (1.00) |
0.0866 (1.00) |
0.585 (1.00) |
|
| CD2 | 15 (9%) | 146 |
0.387 (1.00) |
0.261 (1.00) |
0.0406 (1.00) |
0.784 (1.00) |
0.0891 (1.00) |
0.182 (1.00) |
0.439 (1.00) |
|
| EIF3D | 3 (2%) | 158 |
0.0444 (1.00) |
0.481 (1.00) |
0.725 (1.00) |
0.299 (1.00) |
0.997 (1.00) |
0.979 (1.00) |
0.628 (1.00) |
|
| MKX | 11 (7%) | 150 |
0.373 (1.00) |
0.684 (1.00) |
0.0593 (1.00) |
0.747 (1.00) |
0.981 (1.00) |
0.0156 (1.00) |
0.0422 (1.00) |
|
| ARL16 | 5 (3%) | 156 |
0.212 (1.00) |
0.0271 (1.00) |
0.0592 (1.00) |
0.653 (1.00) |
0.992 (1.00) |
0.885 (1.00) |
0.157 (1.00) |
|
| OR2L3 | 13 (8%) | 148 |
0.999 (1.00) |
0.928 (1.00) |
0.222 (1.00) |
1 (1.00) |
0.0189 (1.00) |
0.057 (1.00) |
0.0699 (1.00) |
|
| DEFB119 | 6 (4%) | 155 |
0.19 (1.00) |
0.188 (1.00) |
0.155 (1.00) |
1 (1.00) |
0.992 (1.00) |
0.943 (1.00) |
0.513 (1.00) |
|
| KLHL4 | 16 (10%) | 145 |
0.0678 (1.00) |
0.902 (1.00) |
0.252 (1.00) |
0.589 (1.00) |
0.95 (1.00) |
0.124 (1.00) |
0.59 (1.00) |
|
| NR1H4 | 10 (6%) | 151 |
0.381 (1.00) |
0.448 (1.00) |
1 (1.00) |
0.328 (1.00) |
0.975 (1.00) |
0.0042 (1.00) |
0.363 (1.00) |
|
| IL32 | 7 (4%) | 154 |
0.0335 (1.00) |
0.702 (1.00) |
0.538 (1.00) |
0.708 (1.00) |
0.985 (1.00) |
0.833 (1.00) |
0.00832 (1.00) |
|
| DGAT2L6 | 9 (6%) | 152 |
0.368 (1.00) |
0.349 (1.00) |
0.0312 (1.00) |
1 (1.00) |
0.975 (1.00) |
0.0113 (1.00) |
0.762 (1.00) |
|
| OR8D4 | 9 (6%) | 152 |
0.035 (1.00) |
0.625 (1.00) |
0.482 (1.00) |
1 (1.00) |
0.981 (1.00) |
0.014 (1.00) |
0.967 (1.00) |
|
| GRXCR2 | 12 (7%) | 149 |
0.268 (1.00) |
0.951 (1.00) |
0.055 (1.00) |
1 (1.00) |
0.97 (1.00) |
0.0342 (1.00) |
0.683 (1.00) |
|
| OR5H2 | 12 (7%) | 149 |
0.293 (1.00) |
0.0158 (1.00) |
1 (1.00) |
0.76 (1.00) |
0.957 (1.00) |
0.023 (1.00) |
0.515 (1.00) |
|
| SIGLEC14 | 8 (5%) | 153 |
0.724 (1.00) |
0.042 (1.00) |
0.118 (1.00) |
0.0273 (1.00) |
0.985 (1.00) |
0.0094 (1.00) |
0.42 (1.00) |
|
| ZNF479 | 15 (9%) | 146 |
0.313 (1.00) |
0.267 (1.00) |
0.806 (1.00) |
0.784 (1.00) |
0.362 (1.00) |
0.125 (1.00) |
0.785 (1.00) |
|
| GH2 | 10 (6%) | 151 |
0.547 (1.00) |
0.483 (1.00) |
0.466 (1.00) |
0.747 (1.00) |
0.981 (1.00) |
0.00432 (1.00) |
0.0533 (1.00) |
|
| GK2 | 21 (13%) | 140 |
0.206 (1.00) |
0.727 (1.00) |
0.105 (1.00) |
1 (1.00) |
0.896 (1.00) |
0.0829 (1.00) |
0.0679 (1.00) |
|
| C2ORF40 | 4 (2%) | 157 |
0.84 (1.00) |
0.404 (1.00) |
0.0637 (1.00) |
0.624 (1.00) |
0.997 (1.00) |
0.979 (1.00) |
||
| CXCR2 | 11 (7%) | 150 |
0.0546 (1.00) |
0.675 (1.00) |
0.606 (1.00) |
1 (1.00) |
0.964 (1.00) |
0.0472 (1.00) |
0.269 (1.00) |
|
| RPTN | 27 (17%) | 134 |
0.252 (1.00) |
0.165 (1.00) |
0.062 (1.00) |
0.513 (1.00) |
0.838 (1.00) |
0.0846 (1.00) |
0.0456 (1.00) |
|
| PRIM2 | 9 (6%) | 152 |
0.279 (1.00) |
0.5 (1.00) |
0.299 (1.00) |
0.156 (1.00) |
0.132 (1.00) |
0.0067 (1.00) |
0.0239 (1.00) |
|
| MUM1L1 | 17 (11%) | 144 |
0.4 (1.00) |
0.675 (1.00) |
0.498 (1.00) |
1 (1.00) |
0.916 (1.00) |
0.0802 (1.00) |
0.349 (1.00) |
|
| TLL1 | 33 (20%) | 128 |
0.941 (1.00) |
0.169 (1.00) |
0.293 (1.00) |
0.426 (1.00) |
0.674 (1.00) |
0.146 (1.00) |
0.405 (1.00) |
|
| PRC1 | 9 (6%) | 152 |
0.635 (1.00) |
0.445 (1.00) |
0.551 (1.00) |
0.488 (1.00) |
0.981 (1.00) |
0.717 (1.00) |
0.931 (1.00) |
|
| GLRB | 19 (12%) | 142 |
0.612 (1.00) |
0.189 (1.00) |
0.0396 (1.00) |
0.801 (1.00) |
0.896 (1.00) |
0.241 (1.00) |
0.818 (1.00) |
|
| AREG | 6 (4%) | 155 |
0.491 (1.00) |
0.294 (1.00) |
0.84 (1.00) |
0.67 (1.00) |
0.992 (1.00) |
0.000342 (0.259) |
0.454 (1.00) |
|
| ACD | 7 (4%) | 154 |
0.912 (1.00) |
0.563 (1.00) |
0.0286 (1.00) |
0.424 (1.00) |
0.985 (1.00) |
0.00442 (1.00) |
0.384 (1.00) |
|
| C2ORF39 | 8 (5%) | 153 |
0.583 (1.00) |
0.22 (1.00) |
1 (1.00) |
0.711 (1.00) |
0.053 (1.00) |
0.00709 (1.00) |
0.576 (1.00) |
|
| RERG | 9 (6%) | 152 |
0.669 (1.00) |
0.0961 (1.00) |
0.482 (1.00) |
0.488 (1.00) |
0.985 (1.00) |
0.0016 (1.00) |
0.438 (1.00) |
|
| TUBB8 | 8 (5%) | 153 |
0.691 (1.00) |
0.352 (1.00) |
1 (1.00) |
0.711 (1.00) |
0.989 (1.00) |
0.00217 (1.00) |
0.693 (1.00) |
|
| AGXT2 | 16 (10%) | 145 |
0.353 (1.00) |
0.386 (1.00) |
0.216 (1.00) |
1 (1.00) |
0.942 (1.00) |
0.113 (1.00) |
0.611 (1.00) |
|
| C9 | 12 (7%) | 149 |
0.705 (1.00) |
0.679 (1.00) |
0.834 (1.00) |
0.76 (1.00) |
0.97 (1.00) |
0.0321 (1.00) |
0.901 (1.00) |
|
| CX3CL1 | 3 (2%) | 158 |
0.427 (1.00) |
0.938 (1.00) |
0.469 (1.00) |
1 (1.00) |
||||
| DEFB112 | 6 (4%) | 155 |
0.236 (1.00) |
0.462 (1.00) |
0.0332 (1.00) |
1 (1.00) |
0.989 (1.00) |
0.00157 (1.00) |
0.727 (1.00) |
|
| FAM19A1 | 7 (4%) | 154 |
0.433 (1.00) |
0.964 (1.00) |
1 (1.00) |
0.708 (1.00) |
0.989 (1.00) |
0.76 (1.00) |
0.813 (1.00) |
|
| LONRF2 | 13 (8%) | 148 |
0.0182 (1.00) |
0.885 (1.00) |
0.558 (1.00) |
0.77 (1.00) |
0.975 (1.00) |
0.297 (1.00) |
0.458 (1.00) |
|
| NAP1L4 | 6 (4%) | 155 |
0.326 (1.00) |
0.34 (1.00) |
0.84 (1.00) |
0.67 (1.00) |
0.989 (1.00) |
0.628 (1.00) |
0.606 (1.00) |
|
| OR5J2 | 11 (7%) | 150 |
0.673 (1.00) |
0.757 (1.00) |
0.673 (1.00) |
0.213 (1.00) |
0.975 (1.00) |
0.996 (1.00) |
0.833 (1.00) |
|
| POM121 | 11 (7%) | 150 |
0.258 (1.00) |
0.984 (1.00) |
0.338 (1.00) |
0.747 (1.00) |
0.97 (1.00) |
0.0371 (1.00) |
0.0149 (1.00) |
|
| RBM22 | 4 (2%) | 157 |
0.733 (1.00) |
0.327 (1.00) |
0.6 (1.00) |
0.297 (1.00) |
0.995 (1.00) |
0.985 (1.00) |
0.721 (1.00) |
|
| SLC10A2 | 15 (9%) | 146 |
0.494 (1.00) |
0.238 (1.00) |
0.154 (1.00) |
0.784 (1.00) |
0.942 (1.00) |
0.032 (1.00) |
0.0825 (1.00) |
|
| C4ORF22 | 8 (5%) | 153 |
0.693 (1.00) |
0.545 (1.00) |
0.281 (1.00) |
0.711 (1.00) |
0.985 (1.00) |
0.993 (1.00) |
0.771 (1.00) |
|
| CLEC14A | 15 (9%) | 146 |
0.183 (1.00) |
0.926 (1.00) |
1 (1.00) |
0.26 (1.00) |
0.957 (1.00) |
0.0304 (1.00) |
0.422 (1.00) |
|
| IGF2BP3 | 3 (2%) | 158 |
0.854 (1.00) |
0.687 (1.00) |
0.469 (1.00) |
1 (1.00) |
||||
| RBM46 | 11 (7%) | 150 |
0.998 (1.00) |
0.134 (1.00) |
0.0703 (1.00) |
0.533 (1.00) |
0.964 (1.00) |
0.0653 (1.00) |
0.829 (1.00) |
|
| SERPINB4 | 21 (13%) | 140 |
0.928 (1.00) |
0.209 (1.00) |
0.378 (1.00) |
0.0278 (1.00) |
0.121 (1.00) |
0.348 (1.00) |
0.902 (1.00) |
|
| SORT1 | 5 (3%) | 156 |
0.34 (1.00) |
0.6 (1.00) |
0.0592 (1.00) |
0.653 (1.00) |
0.992 (1.00) |
0.696 (1.00) |
0.147 (1.00) |
P value = 0.00012 (Chi-square test), Q value = 0.091
Table S1. Gene #6: 'OXA1L MUTATION STATUS' versus Clinical Feature #6: 'LYMPH.NODE.METASTASIS'
| nPatients | N0 | N1 | N1A | N1B | N2 | N2A | N2B | N2C | N3 | NX |
|---|---|---|---|---|---|---|---|---|---|---|
| ALL | 88 | 2 | 7 | 15 | 1 | 4 | 10 | 5 | 15 | 1 |
| OXA1L MUTATED | 2 | 0 | 1 | 1 | 1 | 0 | 0 | 0 | 0 | 0 |
| OXA1L WILD-TYPE | 86 | 2 | 6 | 14 | 0 | 4 | 10 | 5 | 15 | 1 |
Figure S1. Get High-res Image Gene #6: 'OXA1L MUTATION STATUS' versus Clinical Feature #6: 'LYMPH.NODE.METASTASIS'

P value = 0.00028 (Chi-square test), Q value = 0.21
Table S2. Gene #8: 'PTEN MUTATION STATUS' versus Clinical Feature #5: 'DISTANT.METASTASIS'
| nPatients | M0 | M1 | M1A | M1B | M1C |
|---|---|---|---|---|---|
| ALL | 140 | 2 | 1 | 2 | 2 |
| PTEN MUTATED | 11 | 2 | 0 | 0 | 0 |
| PTEN WILD-TYPE | 129 | 0 | 1 | 2 | 2 |
Figure S2. Get High-res Image Gene #8: 'PTEN MUTATION STATUS' versus Clinical Feature #5: 'DISTANT.METASTASIS'
P value = 0.000223 (t-test), Q value = 0.17
Table S3. Gene #14: 'MUC7 MUTATION STATUS' versus Clinical Feature #2: 'AGE'
| nPatients | Mean (Std.Dev) | |
|---|---|---|
| ALL | 160 | 56.3 (15.8) |
| MUC7 MUTATED | 11 | 72.7 (10.9) |
| MUC7 WILD-TYPE | 149 | 55.1 (15.5) |
Figure S3. Get High-res Image Gene #14: 'MUC7 MUTATION STATUS' versus Clinical Feature #2: 'AGE'
P value = 0.000279 (Chi-square test), Q value = 0.21
Table S4. Gene #39: 'RAPGEF5 MUTATION STATUS' versus Clinical Feature #6: 'LYMPH.NODE.METASTASIS'
| nPatients | N0 | N1 | N1A | N1B | N2 | N2A | N2B | N2C | N3 | NX |
|---|---|---|---|---|---|---|---|---|---|---|
| ALL | 88 | 2 | 7 | 15 | 1 | 4 | 10 | 5 | 15 | 1 |
| RAPGEF5 MUTATED | 2 | 0 | 1 | 2 | 1 | 0 | 0 | 0 | 0 | 0 |
| RAPGEF5 WILD-TYPE | 86 | 2 | 6 | 13 | 0 | 4 | 10 | 5 | 15 | 1 |
Figure S4. Get High-res Image Gene #39: 'RAPGEF5 MUTATION STATUS' versus Clinical Feature #6: 'LYMPH.NODE.METASTASIS'
P value = 1.62e-05 (Chi-square test), Q value = 0.012
Table S5. Gene #41: 'ANKRD20A4 MUTATION STATUS' versus Clinical Feature #6: 'LYMPH.NODE.METASTASIS'
| nPatients | N0 | N1 | N1A | N1B | N2 | N2A | N2B | N2C | N3 | NX |
|---|---|---|---|---|---|---|---|---|---|---|
| ALL | 88 | 2 | 7 | 15 | 1 | 4 | 10 | 5 | 15 | 1 |
| ANKRD20A4 MUTATED | 2 | 0 | 0 | 1 | 1 | 0 | 0 | 0 | 0 | 0 |
| ANKRD20A4 WILD-TYPE | 86 | 2 | 7 | 14 | 0 | 4 | 10 | 5 | 15 | 1 |
Figure S5. Get High-res Image Gene #41: 'ANKRD20A4 MUTATION STATUS' versus Clinical Feature #6: 'LYMPH.NODE.METASTASIS'

P value = 5.91e-05 (Chi-square test), Q value = 0.045
Table S6. Gene #51: 'C9ORF119 MUTATION STATUS' versus Clinical Feature #6: 'LYMPH.NODE.METASTASIS'
| nPatients | N0 | N1 | N1A | N1B | N2 | N2A | N2B | N2C | N3 | NX |
|---|---|---|---|---|---|---|---|---|---|---|
| ALL | 88 | 2 | 7 | 15 | 1 | 4 | 10 | 5 | 15 | 1 |
| C9ORF119 MUTATED | 2 | 0 | 0 | 2 | 1 | 0 | 0 | 0 | 0 | 0 |
| C9ORF119 WILD-TYPE | 86 | 2 | 7 | 13 | 0 | 4 | 10 | 5 | 15 | 1 |
Figure S6. Get High-res Image Gene #51: 'C9ORF119 MUTATION STATUS' versus Clinical Feature #6: 'LYMPH.NODE.METASTASIS'
P value = 0.000172 (Chi-square test), Q value = 0.13
Table S7. Gene #77: 'C2 MUTATION STATUS' versus Clinical Feature #6: 'LYMPH.NODE.METASTASIS'
| nPatients | N0 | N1 | N1A | N1B | N2 | N2A | N2B | N2C | N3 | NX |
|---|---|---|---|---|---|---|---|---|---|---|
| ALL | 88 | 2 | 7 | 15 | 1 | 4 | 10 | 5 | 15 | 1 |
| C2 MUTATED | 3 | 0 | 0 | 0 | 1 | 0 | 2 | 0 | 0 | 0 |
| C2 WILD-TYPE | 85 | 2 | 7 | 15 | 0 | 4 | 8 | 5 | 15 | 1 |
Figure S7. Get High-res Image Gene #77: 'C2 MUTATION STATUS' versus Clinical Feature #6: 'LYMPH.NODE.METASTASIS'
P value = 3.89e-05 (Chi-square test), Q value = 0.03
Table S8. Gene #89: 'SPINK13 MUTATION STATUS' versus Clinical Feature #6: 'LYMPH.NODE.METASTASIS'
| nPatients | N0 | N1 | N1A | N1B | N2 | N2A | N2B | N2C | N3 | NX |
|---|---|---|---|---|---|---|---|---|---|---|
| ALL | 88 | 2 | 7 | 15 | 1 | 4 | 10 | 5 | 15 | 1 |
| SPINK13 MUTATED | 2 | 0 | 0 | 3 | 1 | 0 | 0 | 0 | 0 | 0 |
| SPINK13 WILD-TYPE | 86 | 2 | 7 | 12 | 0 | 4 | 10 | 5 | 15 | 1 |
Figure S8. Get High-res Image Gene #89: 'SPINK13 MUTATION STATUS' versus Clinical Feature #6: 'LYMPH.NODE.METASTASIS'

P value = 3.35e-09 (Chi-square test), Q value = 2.6e-06
Table S9. Gene #107: 'GNAI2 MUTATION STATUS' versus Clinical Feature #6: 'LYMPH.NODE.METASTASIS'
| nPatients | N0 | N1 | N1A | N1B | N2 | N2A | N2B | N2C | N3 | NX |
|---|---|---|---|---|---|---|---|---|---|---|
| ALL | 88 | 2 | 7 | 15 | 1 | 4 | 10 | 5 | 15 | 1 |
| GNAI2 MUTATED | 1 | 0 | 0 | 0 | 1 | 0 | 0 | 1 | 0 | 0 |
| GNAI2 WILD-TYPE | 87 | 2 | 7 | 15 | 0 | 4 | 10 | 4 | 15 | 1 |
Figure S9. Get High-res Image Gene #107: 'GNAI2 MUTATION STATUS' versus Clinical Feature #6: 'LYMPH.NODE.METASTASIS'
-
Mutation data file = SKCM-All_Metastatic.mutsig.cluster.txt
-
Clinical data file = SKCM-All_Metastatic.clin.merged.picked.txt
-
Number of patients = 161
-
Number of significantly mutated genes = 111
-
Number of selected clinical features = 8
-
Exclude genes that fewer than K tumors have mutations, K = 3
For survival clinical features, the Kaplan-Meier survival curves of tumors with and without gene mutations were plotted and the statistical significance P values were estimated by logrank test (Bland and Altman 2004) using the 'survdiff' function in R
For continuous numerical clinical features, two-tailed Student's t test with unequal variance (Lehmann and Romano 2005) was applied to compare the clinical values between tumors with and without gene mutations using 't.test' function in R
For binary or multi-class clinical features (nominal or ordinal), two-tailed Fisher's exact tests (Fisher 1922) were used to estimate the P values using the 'fisher.test' function in R
For multi-class clinical features (nominal or ordinal), Chi-square tests (Greenwood and Nikulin 1996) were used to estimate the P values using the 'chisq.test' function in R
For multiple hypothesis correction, Q value is the False Discovery Rate (FDR) analogue of the P value (Benjamini and Hochberg 1995), defined as the minimum FDR at which the test may be called significant. We used the 'Benjamini and Hochberg' method of 'p.adjust' function in R to convert P values into Q values.
This is an experimental feature. The full results of the analysis summarized in this report can be downloaded from the TCGA Data Coordination Center.