(All_Samples cohort)
This pipeline computes the correlation between significantly recurrent gene mutations and selected clinical features.
Testing the association between mutation status of 106 genes and 9 clinical features across 184 patients, 9 significant findings detected with Q value < 0.25.
-
OXA1L mutation correlated to 'LYMPH.NODE.METASTASIS'.
-
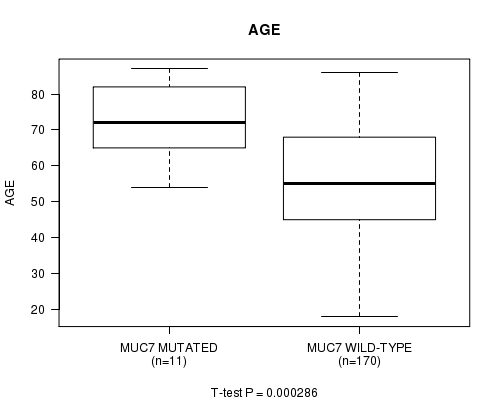
MUC7 mutation correlated to 'AGE'.
-
ANKRD20A4 mutation correlated to 'LYMPH.NODE.METASTASIS'.
-
ZMAT4 mutation correlated to 'LYMPH.NODE.METASTASIS'.
-
C9ORF119 mutation correlated to 'LYMPH.NODE.METASTASIS'.
-
SPINK13 mutation correlated to 'LYMPH.NODE.METASTASIS'.
-
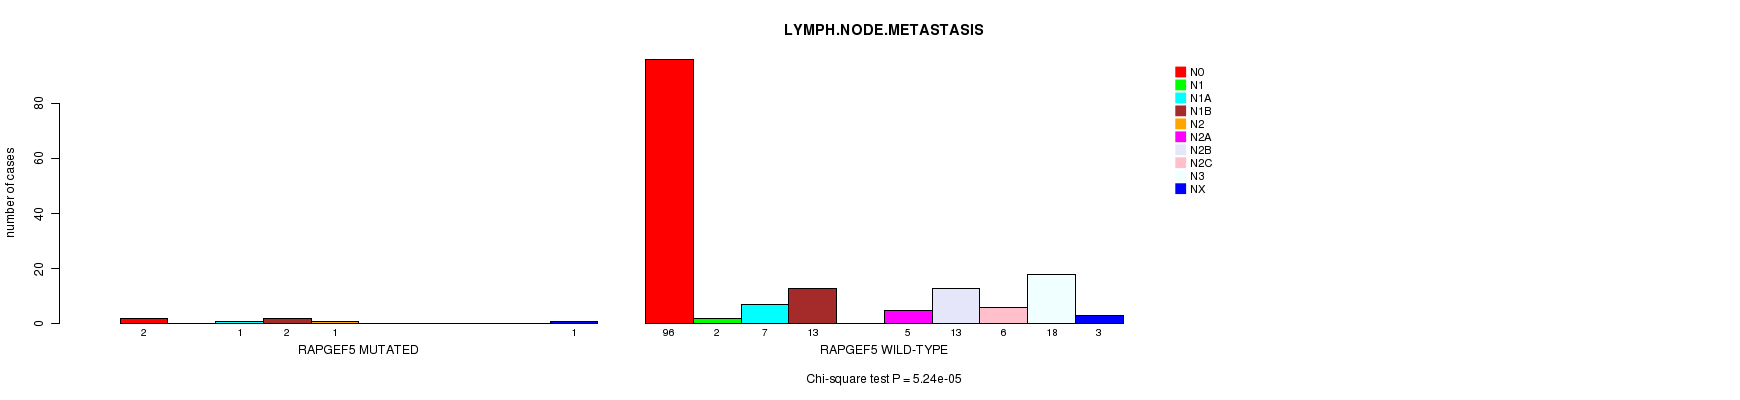
RAPGEF5 mutation correlated to 'LYMPH.NODE.METASTASIS'.
-
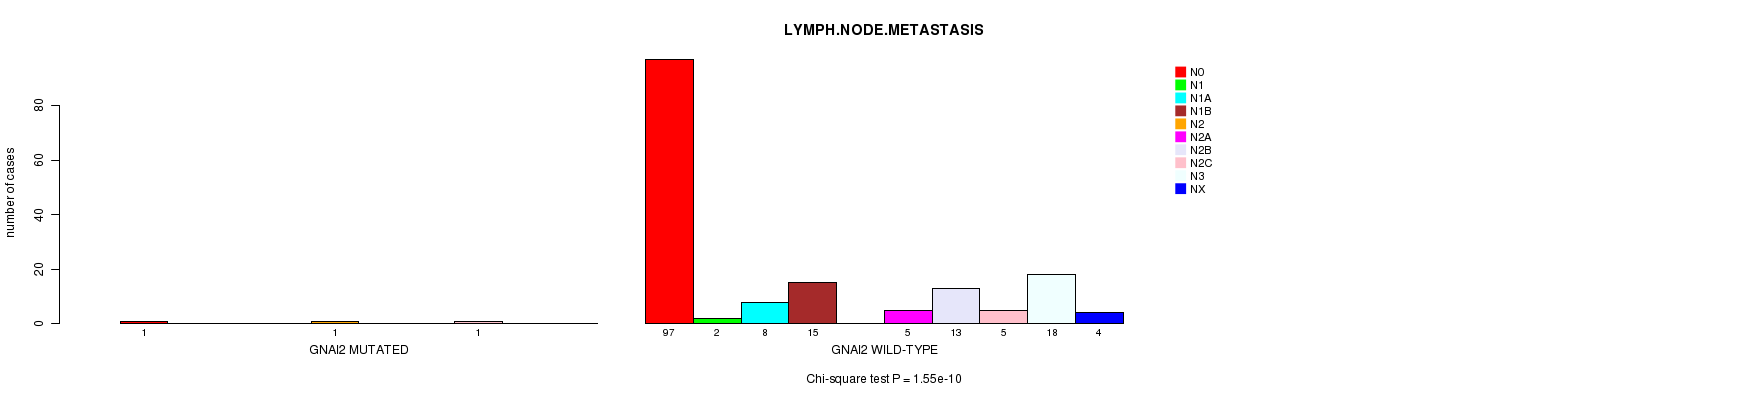
GNAI2 mutation correlated to 'LYMPH.NODE.METASTASIS'.
-
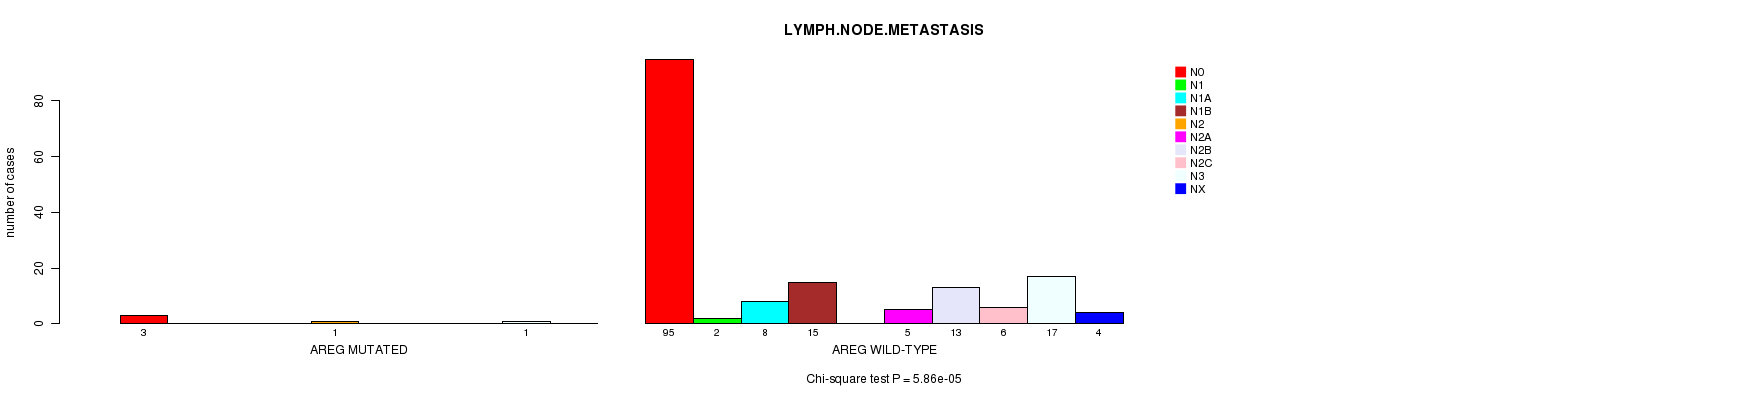
AREG mutation correlated to 'LYMPH.NODE.METASTASIS'.
Table 1. Get Full Table Overview of the association between mutation status of 106 genes and 9 clinical features. Shown in the table are P values (Q values). Thresholded by Q value < 0.25, 9 significant findings detected.
|
Clinical Features |
Time to Death |
AGE |
PRIMARY SITE OF DISEASE |
GENDER |
RADIATIONS RADIATION REGIMENINDICATION |
DISTANT METASTASIS |
LYMPH NODE METASTASIS |
TUMOR STAGECODE |
NEOPLASM DISEASESTAGE |
||
| nMutated (%) | nWild-Type | logrank test | t-test | Fisher's exact test | Fisher's exact test | Fisher's exact test | Chi-square test | Chi-square test | t-test | Chi-square test | |
| OXA1L | 5 (3%) | 179 |
0.638 (1.00) |
0.633 (1.00) |
0.73 (1.00) |
1 (1.00) |
1 (1.00) |
0.992 (1.00) |
1.73e-05 (0.0145) |
0.404 (1.00) |
|
| MUC7 | 11 (6%) | 173 |
0.306 (1.00) |
0.000286 (0.238) |
0.701 (1.00) |
0.749 (1.00) |
1 (1.00) |
0.964 (1.00) |
0.767 (1.00) |
0.454 (1.00) |
|
| ANKRD20A4 | 4 (2%) | 180 |
0.415 (1.00) |
0.574 (1.00) |
0.862 (1.00) |
0.298 (1.00) |
1 (1.00) |
0.995 (1.00) |
1.35e-06 (0.00113) |
0.453 (1.00) |
|
| ZMAT4 | 5 (3%) | 179 |
0.244 (1.00) |
0.000375 (0.312) |
0.196 (1.00) |
0.656 (1.00) |
0.0797 (1.00) |
0.992 (1.00) |
8.12e-06 (0.0068) |
0.926 (1.00) |
|
| C9ORF119 | 5 (3%) | 179 |
0.309 (1.00) |
0.354 (1.00) |
1 (1.00) |
0.162 (1.00) |
1 (1.00) |
0.992 (1.00) |
5.79e-06 (0.00486) |
0.757 (1.00) |
|
| SPINK13 | 6 (3%) | 178 |
0.116 (1.00) |
0.181 (1.00) |
0.918 (1.00) |
0.422 (1.00) |
1 (1.00) |
0.989 (1.00) |
3.33e-06 (0.00279) |
0.743 (1.00) |
|
| RAPGEF5 | 9 (5%) | 175 |
0.93 (1.00) |
0.415 (1.00) |
0.15 (1.00) |
0.493 (1.00) |
1 (1.00) |
0.985 (1.00) |
5.24e-05 (0.0438) |
0.385 (1.00) |
|
| GNAI2 | 4 (2%) | 180 |
0.178 (1.00) |
0.505 (1.00) |
0.657 (1.00) |
0.619 (1.00) |
1 (1.00) |
0.997 (1.00) |
1.55e-10 (1.31e-07) |
0.443 (1.00) |
|
| AREG | 6 (3%) | 178 |
0.452 (1.00) |
0.281 (1.00) |
0.918 (1.00) |
0.668 (1.00) |
1 (1.00) |
0.992 (1.00) |
5.86e-05 (0.0489) |
0.339 (1.00) |
|
| BRAF | 98 (53%) | 86 |
0.312 (1.00) |
0.0806 (1.00) |
0.0393 (1.00) |
0.54 (1.00) |
0.1 (1.00) |
0.481 (1.00) |
0.637 (1.00) |
0.455 (1.00) |
|
| C15ORF23 | 11 (6%) | 173 |
0.516 (1.00) |
0.707 (1.00) |
0.701 (1.00) |
0.749 (1.00) |
1 (1.00) |
0.97 (1.00) |
0.362 (1.00) |
0.506 (1.00) |
|
| CDKN2A | 28 (15%) | 156 |
0.726 (1.00) |
0.999 (1.00) |
0.109 (1.00) |
1 (1.00) |
0.392 (1.00) |
0.832 (1.00) |
0.67 (1.00) |
0.266 (1.00) |
|
| NRAS | 52 (28%) | 132 |
0.944 (1.00) |
0.568 (1.00) |
0.0922 (1.00) |
1 (1.00) |
0.56 (1.00) |
0.575 (1.00) |
0.738 (1.00) |
0.459 (1.00) |
|
| STK19 | 10 (5%) | 174 |
0.486 (1.00) |
0.315 (1.00) |
0.844 (1.00) |
0.335 (1.00) |
1 (1.00) |
0.976 (1.00) |
0.969 (1.00) |
0.674 (1.00) |
|
| TP53 | 29 (16%) | 155 |
0.668 (1.00) |
0.0284 (1.00) |
0.718 (1.00) |
1 (1.00) |
0.404 (1.00) |
0.794 (1.00) |
0.11 (1.00) |
0.643 (1.00) |
|
| TTN | 144 (78%) | 40 |
0.195 (1.00) |
0.832 (1.00) |
0.91 (1.00) |
0.195 (1.00) |
0.523 (1.00) |
0.64 (1.00) |
0.442 (1.00) |
0.174 (1.00) |
|
| UGT2B15 | 18 (10%) | 166 |
0.558 (1.00) |
0.611 (1.00) |
0.703 (1.00) |
0.301 (1.00) |
1 (1.00) |
0.184 (1.00) |
0.0326 (1.00) |
0.119 (1.00) |
|
| PTEN | 17 (9%) | 167 |
0.641 (1.00) |
0.372 (1.00) |
0.936 (1.00) |
0.608 (1.00) |
0.254 (1.00) |
0.000969 (0.803) |
0.686 (1.00) |
0.168 (1.00) |
|
| RAC1 | 12 (7%) | 172 |
0.128 (1.00) |
0.45 (1.00) |
0.503 (1.00) |
1 (1.00) |
0.184 (1.00) |
0.97 (1.00) |
0.895 (1.00) |
0.609 (1.00) |
|
| PPP6C | 18 (10%) | 166 |
0.00329 (1.00) |
0.936 (1.00) |
0.978 (1.00) |
1 (1.00) |
1 (1.00) |
0.673 (1.00) |
0.0698 (1.00) |
0.877 (1.00) |
|
| PRB2 | 28 (15%) | 156 |
0.404 (1.00) |
0.00198 (1.00) |
0.117 (1.00) |
0.0915 (1.00) |
1 (1.00) |
0.82 (1.00) |
0.146 (1.00) |
0.162 (1.00) |
|
| IDH1 | 10 (5%) | 174 |
0.912 (1.00) |
0.2 (1.00) |
0.752 (1.00) |
0.748 (1.00) |
1 (1.00) |
0.359 (1.00) |
0.942 (1.00) |
0.688 (1.00) |
|
| NAP1L2 | 18 (10%) | 166 |
0.216 (1.00) |
0.251 (1.00) |
0.624 (1.00) |
0.446 (1.00) |
1 (1.00) |
0.673 (1.00) |
0.0506 (1.00) |
0.561 (1.00) |
|
| FIGLA | 3 (2%) | 181 |
0.0444 (1.00) |
0.507 (1.00) |
0.816 (1.00) |
0.554 (1.00) |
0.0484 (1.00) |
0.928 (1.00) |
|||
| RBM11 | 13 (7%) | 171 |
0.625 (1.00) |
0.101 (1.00) |
0.658 (1.00) |
0.384 (1.00) |
0.198 (1.00) |
0.527 (1.00) |
0.0486 (1.00) |
0.566 (1.00) |
|
| HBG2 | 7 (4%) | 177 |
0.436 (1.00) |
0.168 (1.00) |
0.871 (1.00) |
1 (1.00) |
1 (1.00) |
0.985 (1.00) |
0.0022 (1.00) |
0.823 (1.00) |
|
| LCE1B | 9 (5%) | 175 |
0.0861 (1.00) |
0.708 (1.00) |
0.95 (1.00) |
0.724 (1.00) |
1 (1.00) |
0.981 (1.00) |
0.923 (1.00) |
0.511 (1.00) |
|
| DDX3X | 17 (9%) | 167 |
0.486 (1.00) |
0.621 (1.00) |
0.682 (1.00) |
0.118 (1.00) |
1 (1.00) |
0.00283 (1.00) |
0.938 (1.00) |
0.711 (1.00) |
|
| CDH9 | 29 (16%) | 155 |
0.27 (1.00) |
0.329 (1.00) |
0.066 (1.00) |
1 (1.00) |
1 (1.00) |
0.794 (1.00) |
0.142 (1.00) |
0.0607 (1.00) |
|
| HIST1H2AA | 7 (4%) | 177 |
0.675 (1.00) |
0.999 (1.00) |
0.556 (1.00) |
0.703 (1.00) |
1 (1.00) |
0.985 (1.00) |
0.93 (1.00) |
0.64 (1.00) |
|
| GFRAL | 25 (14%) | 159 |
0.941 (1.00) |
0.945 (1.00) |
0.155 (1.00) |
0.823 (1.00) |
0.356 (1.00) |
0.528 (1.00) |
0.158 (1.00) |
0.0611 (1.00) |
|
| TBC1D3B | 4 (2%) | 180 |
0.0276 (1.00) |
0.318 (1.00) |
0.27 (1.00) |
1 (1.00) |
1 (1.00) |
0.997 (1.00) |
0.958 (1.00) |
0.666 (1.00) |
|
| HHLA2 | 13 (7%) | 171 |
0.59 (1.00) |
0.205 (1.00) |
0.225 (1.00) |
0.773 (1.00) |
0.198 (1.00) |
0.958 (1.00) |
0.009 (1.00) |
0.887 (1.00) |
|
| COPG2 | 3 (2%) | 181 |
0.424 (1.00) |
0.986 (1.00) |
0.816 (1.00) |
1 (1.00) |
1 (1.00) |
0.997 (1.00) |
0.987 (1.00) |
0.0148 (1.00) |
|
| IL32 | 8 (4%) | 176 |
0.0287 (1.00) |
0.764 (1.00) |
0.586 (1.00) |
1 (1.00) |
0.126 (1.00) |
0.985 (1.00) |
0.878 (1.00) |
0.00296 (1.00) |
|
| PRB4 | 18 (10%) | 166 |
0.0419 (1.00) |
0.143 (1.00) |
0.108 (1.00) |
0.301 (1.00) |
1 (1.00) |
0.644 (1.00) |
0.0674 (1.00) |
0.776 (1.00) |
|
| NBPF7 | 9 (5%) | 175 |
0.0292 (1.00) |
0.0335 (1.00) |
0.467 (1.00) |
0.16 (1.00) |
0.00625 (1.00) |
0.981 (1.00) |
0.00404 (1.00) |
0.772 (1.00) |
|
| POM121 | 12 (7%) | 172 |
0.219 (1.00) |
0.968 (1.00) |
0.337 (1.00) |
0.542 (1.00) |
1 (1.00) |
0.964 (1.00) |
0.0261 (1.00) |
0.0167 (1.00) |
|
| ARID2 | 28 (15%) | 156 |
0.79 (1.00) |
0.0461 (1.00) |
0.418 (1.00) |
0.284 (1.00) |
0.392 (1.00) |
0.856 (1.00) |
0.126 (1.00) |
0.251 (1.00) |
|
| MAP2K1 | 9 (5%) | 175 |
0.774 (1.00) |
0.439 (1.00) |
0.0663 (1.00) |
1 (1.00) |
1 (1.00) |
0.0831 (1.00) |
0.288 (1.00) |
0.915 (1.00) |
|
| DEFB118 | 7 (4%) | 177 |
0.0832 (1.00) |
0.612 (1.00) |
0.765 (1.00) |
1 (1.00) |
1 (1.00) |
0.985 (1.00) |
0.0027 (1.00) |
0.641 (1.00) |
|
| HBD | 9 (5%) | 175 |
0.125 (1.00) |
0.885 (1.00) |
0.302 (1.00) |
0.724 (1.00) |
1 (1.00) |
0.976 (1.00) |
0.894 (1.00) |
0.25 (1.00) |
|
| GLRB | 22 (12%) | 162 |
0.53 (1.00) |
0.222 (1.00) |
0.0603 (1.00) |
0.814 (1.00) |
1 (1.00) |
0.766 (1.00) |
0.259 (1.00) |
0.93 (1.00) |
|
| NR1H4 | 12 (7%) | 172 |
0.596 (1.00) |
0.629 (1.00) |
0.898 (1.00) |
0.217 (1.00) |
1 (1.00) |
0.964 (1.00) |
0.0128 (1.00) |
0.548 (1.00) |
|
| OR51S1 | 19 (10%) | 165 |
0.595 (1.00) |
0.232 (1.00) |
0.876 (1.00) |
0.803 (1.00) |
0.28 (1.00) |
0.918 (1.00) |
0.0538 (1.00) |
0.322 (1.00) |
|
| TFEC | 15 (8%) | 169 |
0.316 (1.00) |
0.128 (1.00) |
0.656 (1.00) |
1 (1.00) |
1 (1.00) |
0.943 (1.00) |
0.00122 (1.00) |
0.478 (1.00) |
|
| UNC119B | 3 (2%) | 181 |
0.956 (1.00) |
0.369 (1.00) |
1 (1.00) |
1 (1.00) |
1 (1.00) |
0.997 (1.00) |
0.987 (1.00) |
0.441 (1.00) |
|
| ZNF479 | 18 (10%) | 166 |
0.438 (1.00) |
0.129 (1.00) |
0.74 (1.00) |
1 (1.00) |
1 (1.00) |
0.383 (1.00) |
0.217 (1.00) |
0.853 (1.00) |
|
| FAM19A1 | 9 (5%) | 175 |
0.346 (1.00) |
0.701 (1.00) |
0.665 (1.00) |
1 (1.00) |
0.14 (1.00) |
0.981 (1.00) |
0.529 (1.00) |
0.761 (1.00) |
|
| GIMAP7 | 13 (7%) | 171 |
0.812 (1.00) |
0.0371 (1.00) |
0.83 (1.00) |
0.14 (1.00) |
0.198 (1.00) |
0.958 (1.00) |
0.519 (1.00) |
0.25 (1.00) |
|
| KLHL4 | 18 (10%) | 166 |
0.114 (1.00) |
0.592 (1.00) |
0.371 (1.00) |
0.799 (1.00) |
1 (1.00) |
0.935 (1.00) |
0.0813 (1.00) |
0.518 (1.00) |
|
| NOTCH2NL | 9 (5%) | 175 |
0.941 (1.00) |
0.801 (1.00) |
0.175 (1.00) |
0.493 (1.00) |
1 (1.00) |
0.981 (1.00) |
0.356 (1.00) |
0.319 (1.00) |
|
| PRC1 | 9 (5%) | 175 |
0.72 (1.00) |
0.42 (1.00) |
0.608 (1.00) |
0.493 (1.00) |
1 (1.00) |
0.981 (1.00) |
0.775 (1.00) |
0.941 (1.00) |
|
| PDE1A | 27 (15%) | 157 |
0.83 (1.00) |
0.135 (1.00) |
0.103 (1.00) |
0.521 (1.00) |
1 (1.00) |
0.832 (1.00) |
0.0725 (1.00) |
0.509 (1.00) |
|
| GML | 9 (5%) | 175 |
0.893 (1.00) |
0.0617 (1.00) |
1 (1.00) |
0.16 (1.00) |
0.14 (1.00) |
0.981 (1.00) |
0.529 (1.00) |
0.913 (1.00) |
|
| OR4N2 | 21 (11%) | 163 |
0.86 (1.00) |
0.255 (1.00) |
0.891 (1.00) |
0.00709 (1.00) |
0.306 (1.00) |
0.0681 (1.00) |
0.192 (1.00) |
0.683 (1.00) |
|
| ACSM2B | 33 (18%) | 151 |
0.513 (1.00) |
0.832 (1.00) |
0.2 (1.00) |
0.00837 (1.00) |
0.449 (1.00) |
0.754 (1.00) |
0.14 (1.00) |
0.862 (1.00) |
|
| USP17L2 | 16 (9%) | 168 |
0.936 (1.00) |
0.718 (1.00) |
0.638 (1.00) |
0.177 (1.00) |
1 (1.00) |
0.935 (1.00) |
0.0758 (1.00) |
0.0453 (1.00) |
|
| TAF1A | 10 (5%) | 174 |
0.148 (1.00) |
0.54 (1.00) |
0.646 (1.00) |
0.335 (1.00) |
1 (1.00) |
0.119 (1.00) |
0.802 (1.00) |
0.762 (1.00) |
|
| OR5H2 | 13 (7%) | 171 |
0.231 (1.00) |
0.0145 (1.00) |
1 (1.00) |
1 (1.00) |
1 (1.00) |
0.951 (1.00) |
0.0178 (1.00) |
0.587 (1.00) |
|
| PHGDH | 8 (4%) | 176 |
0.852 (1.00) |
0.727 (1.00) |
0.558 (1.00) |
0.0521 (1.00) |
1 (1.00) |
0.989 (1.00) |
0.000456 (0.379) |
0.0751 (1.00) |
|
| BAGE2 | 12 (7%) | 172 |
0.519 (1.00) |
0.979 (1.00) |
0.12 (1.00) |
1 (1.00) |
1 (1.00) |
0.421 (1.00) |
0.0377 (1.00) |
0.361 (1.00) |
|
| FUT9 | 18 (10%) | 166 |
0.225 (1.00) |
0.0357 (1.00) |
0.409 (1.00) |
0.607 (1.00) |
1 (1.00) |
0.909 (1.00) |
0.0859 (1.00) |
0.201 (1.00) |
|
| MPP7 | 22 (12%) | 162 |
0.876 (1.00) |
0.0158 (1.00) |
1 (1.00) |
0.237 (1.00) |
1 (1.00) |
0.466 (1.00) |
0.114 (1.00) |
0.93 (1.00) |
|
| TRAT1 | 11 (6%) | 173 |
0.0646 (1.00) |
0.582 (1.00) |
0.922 (1.00) |
0.527 (1.00) |
1 (1.00) |
0.97 (1.00) |
0.00975 (1.00) |
0.765 (1.00) |
|
| TUBB8 | 9 (5%) | 175 |
0.891 (1.00) |
0.63 (1.00) |
1 (1.00) |
0.493 (1.00) |
0.14 (1.00) |
0.985 (1.00) |
0.0022 (1.00) |
0.8 (1.00) |
|
| ACD | 8 (4%) | 176 |
0.837 (1.00) |
0.852 (1.00) |
0.205 (1.00) |
0.262 (1.00) |
1 (1.00) |
0.981 (1.00) |
0.00461 (1.00) |
0.418 (1.00) |
|
| C8A | 23 (12%) | 161 |
0.48 (1.00) |
0.0682 (1.00) |
1 (1.00) |
0.0623 (1.00) |
0.332 (1.00) |
0.0797 (1.00) |
0.345 (1.00) |
0.45 (1.00) |
|
| KIAA1257 | 8 (4%) | 176 |
0.259 (1.00) |
0.343 (1.00) |
0.682 (1.00) |
0.262 (1.00) |
1 (1.00) |
0.989 (1.00) |
0.919 (1.00) |
0.766 (1.00) |
|
| SNAP91 | 22 (12%) | 162 |
0.634 (1.00) |
0.184 (1.00) |
0.507 (1.00) |
0.0956 (1.00) |
1 (1.00) |
0.489 (1.00) |
0.258 (1.00) |
0.931 (1.00) |
|
| CCK | 5 (3%) | 179 |
0.102 (1.00) |
0.756 (1.00) |
0.73 (1.00) |
0.656 (1.00) |
1 (1.00) |
0.995 (1.00) |
0.00752 (1.00) |
0.7 (1.00) |
|
| ANXA10 | 11 (6%) | 173 |
0.375 (1.00) |
0.832 (1.00) |
0.828 (1.00) |
0.332 (1.00) |
0.00948 (1.00) |
0.976 (1.00) |
0.01 (1.00) |
0.627 (1.00) |
|
| LIN7A | 9 (5%) | 175 |
0.725 (1.00) |
0.61 (1.00) |
0.302 (1.00) |
0.493 (1.00) |
1 (1.00) |
0.985 (1.00) |
0.00212 (1.00) |
0.428 (1.00) |
|
| C2 | 8 (4%) | 176 |
0.824 (1.00) |
0.678 (1.00) |
0.796 (1.00) |
0.713 (1.00) |
1 (1.00) |
0.985 (1.00) |
0.000522 (0.434) |
0.262 (1.00) |
|
| DGAT2L6 | 10 (5%) | 174 |
0.331 (1.00) |
0.37 (1.00) |
0.405 (1.00) |
0.748 (1.00) |
1 (1.00) |
0.976 (1.00) |
0.00413 (1.00) |
0.705 (1.00) |
|
| OR2L3 | 15 (8%) | 169 |
0.901 (1.00) |
0.895 (1.00) |
0.139 (1.00) |
0.782 (1.00) |
1 (1.00) |
0.0202 (1.00) |
0.0695 (1.00) |
0.235 (1.00) |
|
| ZNF679 | 16 (9%) | 168 |
0.96 (1.00) |
0.279 (1.00) |
0.78 (1.00) |
1 (1.00) |
1 (1.00) |
0.935 (1.00) |
0.794 (1.00) |
0.264 (1.00) |
|
| NAP1L4 | 7 (4%) | 177 |
0.207 (1.00) |
0.171 (1.00) |
0.817 (1.00) |
0.703 (1.00) |
0.11 (1.00) |
0.985 (1.00) |
0.386 (1.00) |
0.395 (1.00) |
|
| PARM1 | 14 (8%) | 170 |
0.36 (1.00) |
0.261 (1.00) |
0.243 (1.00) |
0.773 (1.00) |
1 (1.00) |
0.951 (1.00) |
0.000642 (0.533) |
0.11 (1.00) |
|
| DEFB119 | 6 (3%) | 178 |
0.237 (1.00) |
0.174 (1.00) |
0.214 (1.00) |
1 (1.00) |
1 (1.00) |
0.992 (1.00) |
0.953 (1.00) |
0.362 (1.00) |
|
| RGS18 | 8 (4%) | 176 |
0.839 (1.00) |
0.239 (1.00) |
0.39 (1.00) |
0.0521 (1.00) |
1 (1.00) |
0.985 (1.00) |
0.948 (1.00) |
0.889 (1.00) |
|
| VEGFC | 16 (9%) | 168 |
0.944 (1.00) |
0.849 (1.00) |
0.208 (1.00) |
0.587 (1.00) |
1 (1.00) |
0.943 (1.00) |
0.0113 (1.00) |
0.185 (1.00) |
|
| ARL16 | 5 (3%) | 179 |
0.191 (1.00) |
0.0305 (1.00) |
0.0513 (1.00) |
0.656 (1.00) |
1 (1.00) |
0.992 (1.00) |
0.853 (1.00) |
0.0868 (1.00) |
|
| CACNA1H | 20 (11%) | 164 |
0.41 (1.00) |
0.689 (1.00) |
0.945 (1.00) |
0.63 (1.00) |
1 (1.00) |
0.918 (1.00) |
0.169 (1.00) |
0.507 (1.00) |
|
| CCNE2 | 10 (5%) | 174 |
0.0495 (1.00) |
0.915 (1.00) |
0.0701 (1.00) |
0.748 (1.00) |
1 (1.00) |
0.97 (1.00) |
0.896 (1.00) |
0.326 (1.00) |
|
| FRG2B | 11 (6%) | 173 |
0.732 (1.00) |
0.0269 (1.00) |
0.958 (1.00) |
0.206 (1.00) |
1 (1.00) |
0.964 (1.00) |
0.859 (1.00) |
0.581 (1.00) |
|
| SPAG16 | 14 (8%) | 170 |
0.597 (1.00) |
0.437 (1.00) |
0.943 (1.00) |
0.773 (1.00) |
1 (1.00) |
0.958 (1.00) |
0.0382 (1.00) |
0.373 (1.00) |
|
| USP29 | 30 (16%) | 154 |
0.238 (1.00) |
0.0293 (1.00) |
0.721 (1.00) |
0.302 (1.00) |
1 (1.00) |
0.82 (1.00) |
0.206 (1.00) |
0.15 (1.00) |
|
| GH2 | 10 (5%) | 174 |
0.482 (1.00) |
0.517 (1.00) |
0.391 (1.00) |
1 (1.00) |
1 (1.00) |
0.981 (1.00) |
0.00166 (1.00) |
0.0335 (1.00) |
|
| ST18 | 36 (20%) | 148 |
0.847 (1.00) |
0.173 (1.00) |
0.743 (1.00) |
1 (1.00) |
1 (1.00) |
0.74 (1.00) |
0.353 (1.00) |
0.273 (1.00) |
|
| CCDC102B | 21 (11%) | 163 |
0.448 (1.00) |
0.502 (1.00) |
0.891 (1.00) |
1 (1.00) |
1 (1.00) |
0.899 (1.00) |
0.0766 (1.00) |
0.834 (1.00) |
|
| B2M | 4 (2%) | 180 |
0.535 (1.00) |
0.383 (1.00) |
0.862 (1.00) |
0.298 (1.00) |
1 (1.00) |
0.997 (1.00) |
0.987 (1.00) |
0.595 (1.00) |
|
| CD2 | 15 (8%) | 169 |
0.328 (1.00) |
0.291 (1.00) |
0.36 (1.00) |
0.782 (1.00) |
1 (1.00) |
0.0477 (1.00) |
0.0983 (1.00) |
0.658 (1.00) |
|
| SLC38A4 | 24 (13%) | 160 |
0.982 (1.00) |
0.12 (1.00) |
0.39 (1.00) |
0.0405 (1.00) |
1 (1.00) |
0.867 (1.00) |
0.304 (1.00) |
0.963 (1.00) |
|
| OR8D4 | 9 (5%) | 175 |
0.0307 (1.00) |
0.656 (1.00) |
0.394 (1.00) |
1 (1.00) |
1 (1.00) |
0.981 (1.00) |
0.0051 (1.00) |
0.934 (1.00) |
|
| MKX | 11 (6%) | 173 |
0.319 (1.00) |
0.719 (1.00) |
0.679 (1.00) |
0.749 (1.00) |
1 (1.00) |
0.981 (1.00) |
0.00501 (1.00) |
0.0131 (1.00) |
|
| SPATA8 | 8 (4%) | 176 |
0.702 (1.00) |
0.0348 (1.00) |
1 (1.00) |
1 (1.00) |
1 (1.00) |
0.981 (1.00) |
0.00243 (1.00) |
0.312 (1.00) |
|
| GPR137 | 8 (4%) | 176 |
0.0484 (1.00) |
0.965 (1.00) |
0.648 (1.00) |
0.0521 (1.00) |
1 (1.00) |
0.985 (1.00) |
0.0022 (1.00) |
0.856 (1.00) |
|
| GRXCR2 | 12 (7%) | 172 |
0.229 (1.00) |
0.906 (1.00) |
0.577 (1.00) |
1 (1.00) |
1 (1.00) |
0.97 (1.00) |
0.0145 (1.00) |
0.578 (1.00) |
|
| C2ORF40 | 4 (2%) | 180 |
0.891 (1.00) |
0.422 (1.00) |
0.0647 (1.00) |
0.619 (1.00) |
1 (1.00) |
0.997 (1.00) |
0.958 (1.00) |
||
| CADM2 | 18 (10%) | 166 |
0.349 (1.00) |
0.999 (1.00) |
0.361 (1.00) |
1 (1.00) |
1 (1.00) |
0.909 (1.00) |
0.0626 (1.00) |
0.494 (1.00) |
|
| OR5J2 | 11 (6%) | 173 |
0.605 (1.00) |
0.805 (1.00) |
0.543 (1.00) |
0.206 (1.00) |
1 (1.00) |
0.976 (1.00) |
0.994 (1.00) |
0.715 (1.00) |
|
| SIGLEC14 | 8 (4%) | 176 |
0.652 (1.00) |
0.0468 (1.00) |
0.164 (1.00) |
0.0521 (1.00) |
1 (1.00) |
0.985 (1.00) |
0.0027 (1.00) |
0.267 (1.00) |
|
| CX3CL1 | 3 (2%) | 181 |
0.408 (1.00) |
0.925 (1.00) |
0.635 (1.00) |
1 (1.00) |
1 (1.00) |
||||
| OR52J3 | 12 (7%) | 172 |
0.215 (1.00) |
0.296 (1.00) |
0.611 (1.00) |
1 (1.00) |
1 (1.00) |
0.964 (1.00) |
0.0213 (1.00) |
0.752 (1.00) |
|
| RUNDC3B | 13 (7%) | 171 |
0.692 (1.00) |
0.111 (1.00) |
0.855 (1.00) |
0.14 (1.00) |
0.198 (1.00) |
0.964 (1.00) |
0.057 (1.00) |
0.913 (1.00) |
P value = 1.73e-05 (Chi-square test), Q value = 0.014
Table S1. Gene #5: 'OXA1L MUTATION STATUS' versus Clinical Feature #7: 'LYMPH.NODE.METASTASIS'
| nPatients | N0 | N1 | N1A | N1B | N2 | N2A | N2B | N2C | N3 | NX |
|---|---|---|---|---|---|---|---|---|---|---|
| ALL | 98 | 2 | 8 | 15 | 1 | 5 | 13 | 6 | 18 | 4 |
| OXA1L MUTATED | 2 | 0 | 1 | 1 | 1 | 0 | 0 | 0 | 0 | 0 |
| OXA1L WILD-TYPE | 96 | 2 | 7 | 14 | 0 | 5 | 13 | 6 | 18 | 4 |
Figure S1. Get High-res Image Gene #5: 'OXA1L MUTATION STATUS' versus Clinical Feature #7: 'LYMPH.NODE.METASTASIS'

P value = 0.000286 (t-test), Q value = 0.24
Table S2. Gene #20: 'MUC7 MUTATION STATUS' versus Clinical Feature #2: 'AGE'
| nPatients | Mean (Std.Dev) | |
|---|---|---|
| ALL | 181 | 56.6 (15.7) |
| MUC7 MUTATED | 11 | 72.7 (10.9) |
| MUC7 WILD-TYPE | 170 | 55.5 (15.4) |
Figure S2. Get High-res Image Gene #20: 'MUC7 MUTATION STATUS' versus Clinical Feature #2: 'AGE'
P value = 1.35e-06 (Chi-square test), Q value = 0.0011
Table S3. Gene #36: 'ANKRD20A4 MUTATION STATUS' versus Clinical Feature #7: 'LYMPH.NODE.METASTASIS'
| nPatients | N0 | N1 | N1A | N1B | N2 | N2A | N2B | N2C | N3 | NX |
|---|---|---|---|---|---|---|---|---|---|---|
| ALL | 98 | 2 | 8 | 15 | 1 | 5 | 13 | 6 | 18 | 4 |
| ANKRD20A4 MUTATED | 2 | 0 | 0 | 1 | 1 | 0 | 0 | 0 | 0 | 0 |
| ANKRD20A4 WILD-TYPE | 96 | 2 | 8 | 14 | 0 | 5 | 13 | 6 | 18 | 4 |
Figure S3. Get High-res Image Gene #36: 'ANKRD20A4 MUTATION STATUS' versus Clinical Feature #7: 'LYMPH.NODE.METASTASIS'

P value = 8.12e-06 (Chi-square test), Q value = 0.0068
Table S4. Gene #48: 'ZMAT4 MUTATION STATUS' versus Clinical Feature #7: 'LYMPH.NODE.METASTASIS'
| nPatients | N0 | N1 | N1A | N1B | N2 | N2A | N2B | N2C | N3 | NX |
|---|---|---|---|---|---|---|---|---|---|---|
| ALL | 98 | 2 | 8 | 15 | 1 | 5 | 13 | 6 | 18 | 4 |
| ZMAT4 MUTATED | 2 | 0 | 0 | 0 | 1 | 0 | 1 | 1 | 0 | 0 |
| ZMAT4 WILD-TYPE | 96 | 2 | 8 | 15 | 0 | 5 | 12 | 5 | 18 | 4 |
Figure S4. Get High-res Image Gene #48: 'ZMAT4 MUTATION STATUS' versus Clinical Feature #7: 'LYMPH.NODE.METASTASIS'
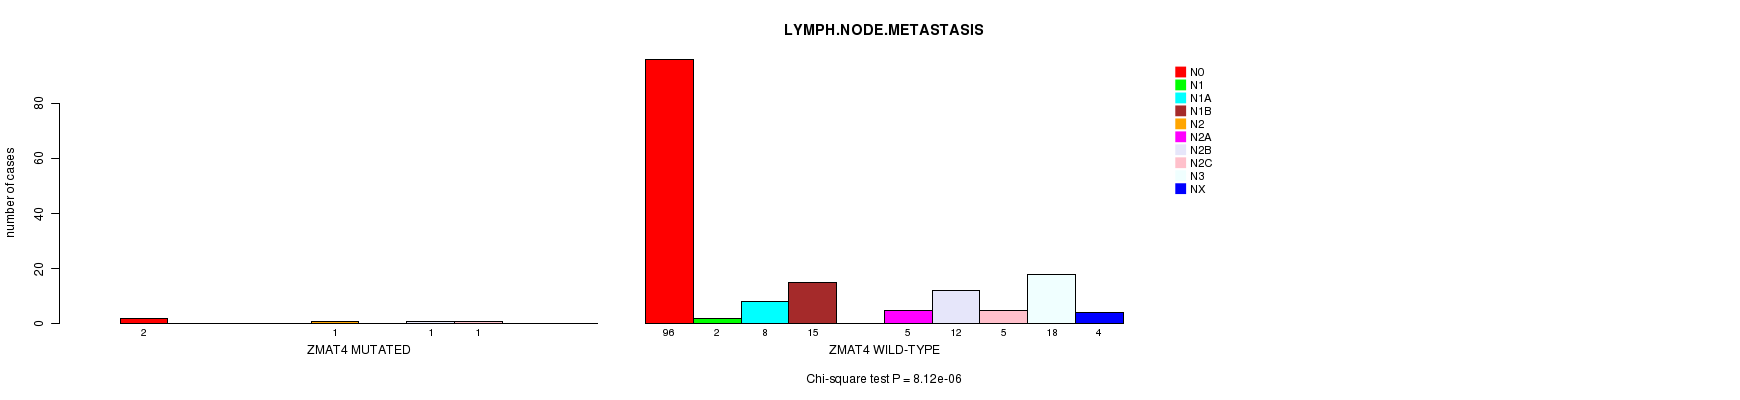
P value = 5.79e-06 (Chi-square test), Q value = 0.0049
Table S5. Gene #61: 'C9ORF119 MUTATION STATUS' versus Clinical Feature #7: 'LYMPH.NODE.METASTASIS'
| nPatients | N0 | N1 | N1A | N1B | N2 | N2A | N2B | N2C | N3 | NX |
|---|---|---|---|---|---|---|---|---|---|---|
| ALL | 98 | 2 | 8 | 15 | 1 | 5 | 13 | 6 | 18 | 4 |
| C9ORF119 MUTATED | 2 | 0 | 0 | 2 | 1 | 0 | 0 | 0 | 0 | 0 |
| C9ORF119 WILD-TYPE | 96 | 2 | 8 | 13 | 0 | 5 | 13 | 6 | 18 | 4 |
Figure S5. Get High-res Image Gene #61: 'C9ORF119 MUTATION STATUS' versus Clinical Feature #7: 'LYMPH.NODE.METASTASIS'
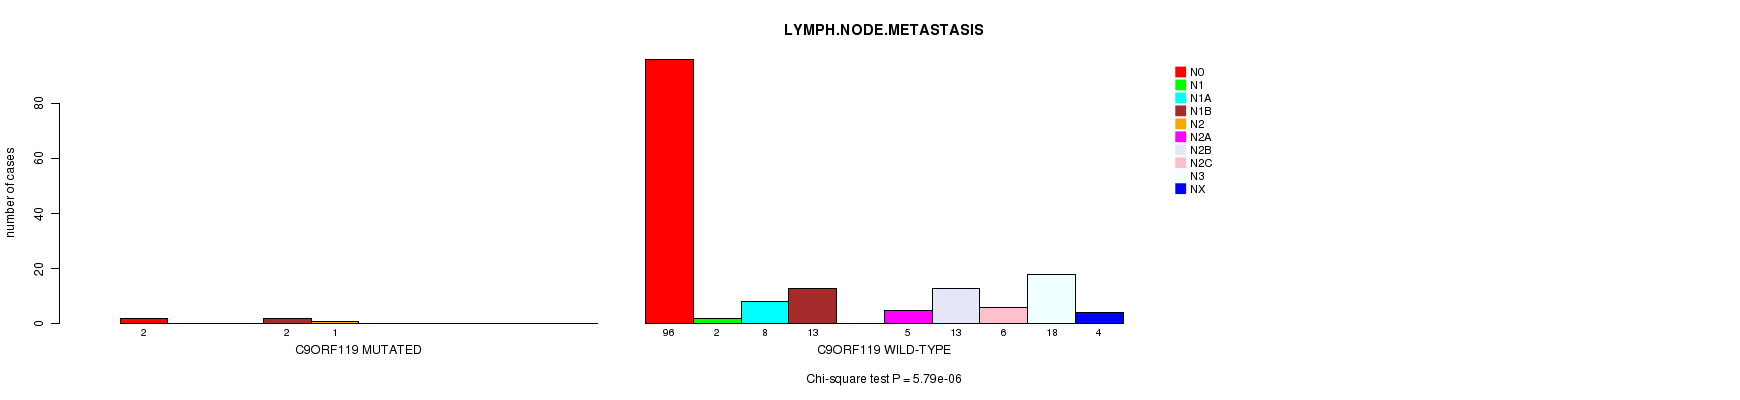
P value = 3.33e-06 (Chi-square test), Q value = 0.0028
Table S6. Gene #68: 'SPINK13 MUTATION STATUS' versus Clinical Feature #7: 'LYMPH.NODE.METASTASIS'
| nPatients | N0 | N1 | N1A | N1B | N2 | N2A | N2B | N2C | N3 | NX |
|---|---|---|---|---|---|---|---|---|---|---|
| ALL | 98 | 2 | 8 | 15 | 1 | 5 | 13 | 6 | 18 | 4 |
| SPINK13 MUTATED | 2 | 0 | 0 | 3 | 1 | 0 | 0 | 0 | 0 | 0 |
| SPINK13 WILD-TYPE | 96 | 2 | 8 | 12 | 0 | 5 | 13 | 6 | 18 | 4 |
Figure S6. Get High-res Image Gene #68: 'SPINK13 MUTATION STATUS' versus Clinical Feature #7: 'LYMPH.NODE.METASTASIS'
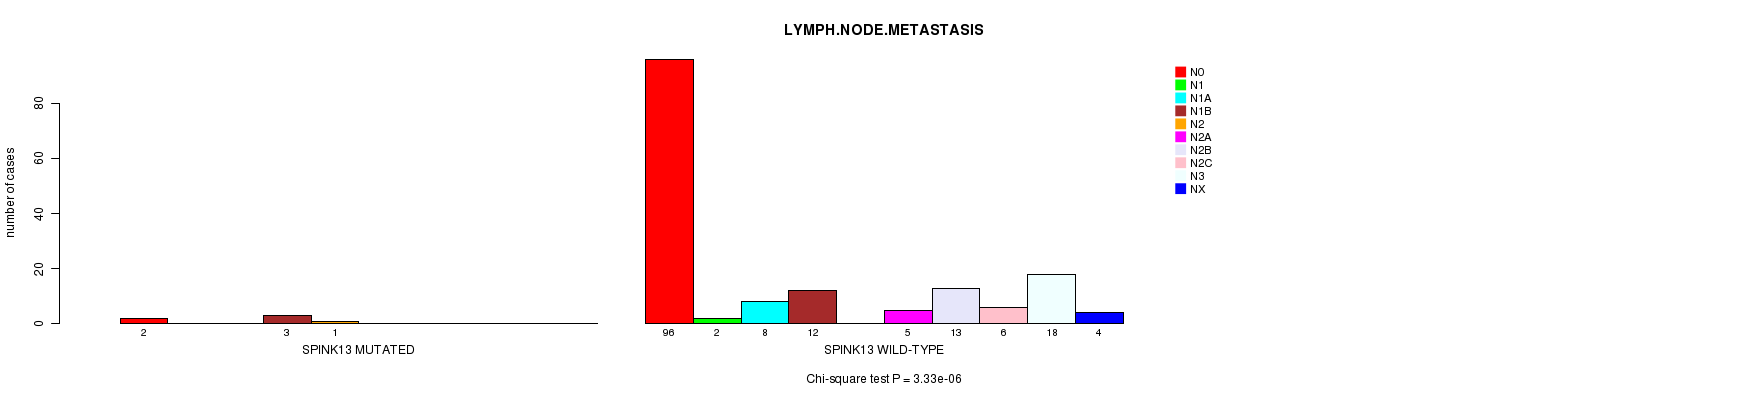
P value = 5.24e-05 (Chi-square test), Q value = 0.044
Table S7. Gene #73: 'RAPGEF5 MUTATION STATUS' versus Clinical Feature #7: 'LYMPH.NODE.METASTASIS'
| nPatients | N0 | N1 | N1A | N1B | N2 | N2A | N2B | N2C | N3 | NX |
|---|---|---|---|---|---|---|---|---|---|---|
| ALL | 98 | 2 | 8 | 15 | 1 | 5 | 13 | 6 | 18 | 4 |
| RAPGEF5 MUTATED | 2 | 0 | 1 | 2 | 1 | 0 | 0 | 0 | 0 | 1 |
| RAPGEF5 WILD-TYPE | 96 | 2 | 7 | 13 | 0 | 5 | 13 | 6 | 18 | 3 |
Figure S7. Get High-res Image Gene #73: 'RAPGEF5 MUTATION STATUS' versus Clinical Feature #7: 'LYMPH.NODE.METASTASIS'
P value = 1.55e-10 (Chi-square test), Q value = 1.3e-07
Table S8. Gene #103: 'GNAI2 MUTATION STATUS' versus Clinical Feature #7: 'LYMPH.NODE.METASTASIS'
| nPatients | N0 | N1 | N1A | N1B | N2 | N2A | N2B | N2C | N3 | NX |
|---|---|---|---|---|---|---|---|---|---|---|
| ALL | 98 | 2 | 8 | 15 | 1 | 5 | 13 | 6 | 18 | 4 |
| GNAI2 MUTATED | 1 | 0 | 0 | 0 | 1 | 0 | 0 | 1 | 0 | 0 |
| GNAI2 WILD-TYPE | 97 | 2 | 8 | 15 | 0 | 5 | 13 | 5 | 18 | 4 |
Figure S8. Get High-res Image Gene #103: 'GNAI2 MUTATION STATUS' versus Clinical Feature #7: 'LYMPH.NODE.METASTASIS'
P value = 5.86e-05 (Chi-square test), Q value = 0.049
Table S9. Gene #105: 'AREG MUTATION STATUS' versus Clinical Feature #7: 'LYMPH.NODE.METASTASIS'
| nPatients | N0 | N1 | N1A | N1B | N2 | N2A | N2B | N2C | N3 | NX |
|---|---|---|---|---|---|---|---|---|---|---|
| ALL | 98 | 2 | 8 | 15 | 1 | 5 | 13 | 6 | 18 | 4 |
| AREG MUTATED | 3 | 0 | 0 | 0 | 1 | 0 | 0 | 0 | 1 | 0 |
| AREG WILD-TYPE | 95 | 2 | 8 | 15 | 0 | 5 | 13 | 6 | 17 | 4 |
Figure S9. Get High-res Image Gene #105: 'AREG MUTATION STATUS' versus Clinical Feature #7: 'LYMPH.NODE.METASTASIS'
-
Mutation data file = SKCM-All_Samples.mutsig.cluster.txt
-
Clinical data file = SKCM-All_Samples.clin.merged.picked.txt
-
Number of patients = 184
-
Number of significantly mutated genes = 106
-
Number of selected clinical features = 9
-
Exclude genes that fewer than K tumors have mutations, K = 3
For survival clinical features, the Kaplan-Meier survival curves of tumors with and without gene mutations were plotted and the statistical significance P values were estimated by logrank test (Bland and Altman 2004) using the 'survdiff' function in R
For continuous numerical clinical features, two-tailed Student's t test with unequal variance (Lehmann and Romano 2005) was applied to compare the clinical values between tumors with and without gene mutations using 't.test' function in R
For binary or multi-class clinical features (nominal or ordinal), two-tailed Fisher's exact tests (Fisher 1922) were used to estimate the P values using the 'fisher.test' function in R
For multi-class clinical features (nominal or ordinal), Chi-square tests (Greenwood and Nikulin 1996) were used to estimate the P values using the 'chisq.test' function in R
For multiple hypothesis correction, Q value is the False Discovery Rate (FDR) analogue of the P value (Benjamini and Hochberg 1995), defined as the minimum FDR at which the test may be called significant. We used the 'Benjamini and Hochberg' method of 'p.adjust' function in R to convert P values into Q values.
This is an experimental feature. The full results of the analysis summarized in this report can be downloaded from the TCGA Data Coordination Center.