(BRAF_Hotspot_Mutants cohort)
This pipeline computes the correlation between significant arm-level copy number variations (cnvs) and selected clinical features.
Testing the association between copy number variation 70 arm-level results and 8 clinical features across 67 patients, one significant finding detected with Q value < 0.25.
-
18q gain cnv correlated to 'NEOPLASM.DISEASESTAGE'.
Table 1. Get Full Table Overview of the association between significant copy number variation of 70 arm-level results and 8 clinical features. Shown in the table are P values (Q values). Thresholded by Q value < 0.25, one significant finding detected.
|
Clinical Features |
Time to Death |
AGE |
PRIMARY SITE OF DISEASE |
GENDER |
DISTANT METASTASIS |
LYMPH NODE METASTASIS |
TUMOR STAGECODE |
NEOPLASM DISEASESTAGE |
||
| nCNV (%) | nWild-Type | logrank test | t-test | Fisher's exact test | Fisher's exact test | Chi-square test | Chi-square test | t-test | Chi-square test | |
| 18q gain | 4 (6%) | 63 |
0.794 (1.00) |
0.475 (1.00) |
0.294 (1.00) |
0.991 (1.00) |
0.953 (1.00) |
4.1e-05 (0.0195) |
||
| 1p gain | 3 (4%) | 64 |
0.254 (1.00) |
0.0768 (1.00) |
0.249 (1.00) |
0.991 (1.00) |
0.962 (1.00) |
0.139 (1.00) |
||
| 1q gain | 16 (24%) | 51 |
0.686 (1.00) |
0.802 (1.00) |
0.106 (1.00) |
0.762 (1.00) |
0.786 (1.00) |
0.648 (1.00) |
0.774 (1.00) |
|
| 2p gain | 6 (9%) | 61 |
0.076 (1.00) |
0.00329 (1.00) |
0.192 (1.00) |
0.167 (1.00) |
0.964 (1.00) |
0.0207 (1.00) |
0.689 (1.00) |
|
| 2q gain | 6 (9%) | 61 |
0.076 (1.00) |
0.00329 (1.00) |
0.192 (1.00) |
0.167 (1.00) |
0.964 (1.00) |
0.0207 (1.00) |
0.689 (1.00) |
|
| 3p gain | 4 (6%) | 63 |
0.696 (1.00) |
0.469 (1.00) |
0.0247 (1.00) |
0.593 (1.00) |
0.984 (1.00) |
0.415 (1.00) |
0.92 (1.00) |
|
| 3q gain | 5 (7%) | 62 |
0.68 (1.00) |
0.55 (1.00) |
0.0514 (1.00) |
1 (1.00) |
0.975 (1.00) |
0.567 (1.00) |
0.968 (1.00) |
|
| 4p gain | 5 (7%) | 62 |
0.824 (1.00) |
0.0886 (1.00) |
1 (1.00) |
1 (1.00) |
0.975 (1.00) |
0.277 (1.00) |
0.065 (1.00) |
|
| 4q gain | 5 (7%) | 62 |
0.824 (1.00) |
0.225 (1.00) |
0.758 (1.00) |
1 (1.00) |
0.984 (1.00) |
0.339 (1.00) |
0.137 (1.00) |
|
| 5p gain | 7 (10%) | 60 |
0.318 (1.00) |
0.831 (1.00) |
0.47 (1.00) |
1 (1.00) |
0.0823 (1.00) |
0.799 (1.00) |
0.227 (1.00) |
|
| 6p gain | 15 (22%) | 52 |
0.379 (1.00) |
0.695 (1.00) |
0.529 (1.00) |
0.542 (1.00) |
0.311 (1.00) |
0.894 (1.00) |
0.715 (1.00) |
|
| 6q gain | 5 (7%) | 62 |
0.687 (1.00) |
0.581 (1.00) |
1 (1.00) |
0.0202 (1.00) |
0.941 (1.00) |
0.501 (1.00) |
||
| 7p gain | 40 (60%) | 27 |
0.224 (1.00) |
0.635 (1.00) |
0.394 (1.00) |
0.0363 (1.00) |
0.379 (1.00) |
0.408 (1.00) |
0.524 (1.00) |
|
| 7q gain | 44 (66%) | 23 |
0.275 (1.00) |
0.483 (1.00) |
0.388 (1.00) |
0.027 (1.00) |
0.4 (1.00) |
0.514 (1.00) |
0.249 (1.00) |
|
| 8p gain | 12 (18%) | 55 |
0.242 (1.00) |
0.859 (1.00) |
0.593 (1.00) |
0.086 (1.00) |
0.246 (1.00) |
0.189 (1.00) |
0.537 (1.00) |
|
| 8q gain | 23 (34%) | 44 |
0.14 (1.00) |
0.702 (1.00) |
0.941 (1.00) |
0.0606 (1.00) |
0.25 (1.00) |
0.388 (1.00) |
0.541 (1.00) |
|
| 11p gain | 5 (7%) | 62 |
0.116 (1.00) |
0.758 (1.00) |
1 (1.00) |
0.975 (1.00) |
0.183 (1.00) |
0.248 (1.00) |
||
| 11q gain | 3 (4%) | 64 |
0.123 (1.00) |
1 (1.00) |
1 (1.00) |
0.991 (1.00) |
0.962 (1.00) |
0.507 (1.00) |
||
| 12p gain | 11 (16%) | 56 |
0.595 (1.00) |
0.0175 (1.00) |
0.704 (1.00) |
0.0862 (1.00) |
0.246 (1.00) |
0.271 (1.00) |
0.241 (1.00) |
|
| 12q gain | 5 (7%) | 62 |
0.705 (1.00) |
0.592 (1.00) |
1 (1.00) |
0.163 (1.00) |
0.975 (1.00) |
0.0166 (1.00) |
0.294 (1.00) |
|
| 13q gain | 8 (12%) | 59 |
0.383 (1.00) |
0.326 (1.00) |
0.318 (1.00) |
1 (1.00) |
0.951 (1.00) |
0.00839 (1.00) |
0.0353 (1.00) |
|
| 14q gain | 5 (7%) | 62 |
0.544 (1.00) |
0.606 (1.00) |
0.581 (1.00) |
0.163 (1.00) |
0.975 (1.00) |
0.01 (1.00) |
0.689 (1.00) |
|
| 15q gain | 11 (16%) | 56 |
0.372 (1.00) |
0.02 (1.00) |
0.884 (1.00) |
0.316 (1.00) |
0.878 (1.00) |
0.478 (1.00) |
0.507 (1.00) |
|
| 16p gain | 5 (7%) | 62 |
0.34 (1.00) |
0.0672 (1.00) |
0.581 (1.00) |
1 (1.00) |
0.975 (1.00) |
0.238 (1.00) |
0.137 (1.00) |
|
| 16q gain | 6 (9%) | 61 |
0.34 (1.00) |
0.0374 (1.00) |
0.794 (1.00) |
0.655 (1.00) |
0.964 (1.00) |
0.0622 (1.00) |
0.282 (1.00) |
|
| 17p gain | 7 (10%) | 60 |
0.52 (1.00) |
0.374 (1.00) |
0.689 (1.00) |
1 (1.00) |
0.964 (1.00) |
0.953 (1.00) |
0.311 (1.00) |
|
| 17q gain | 6 (9%) | 61 |
0.52 (1.00) |
0.0546 (1.00) |
1 (1.00) |
1 (1.00) |
0.964 (1.00) |
0.953 (1.00) |
0.311 (1.00) |
|
| 18p gain | 10 (15%) | 57 |
0.545 (1.00) |
0.342 (1.00) |
0.882 (1.00) |
0.478 (1.00) |
0.166 (1.00) |
0.207 (1.00) |
0.077 (1.00) |
|
| 19p gain | 6 (9%) | 61 |
0.479 (1.00) |
0.794 (1.00) |
0.655 (1.00) |
0.0467 (1.00) |
0.899 (1.00) |
0.0183 (1.00) |
||
| 19q gain | 7 (10%) | 60 |
0.503 (1.00) |
0.352 (1.00) |
0.47 (1.00) |
0.675 (1.00) |
0.951 (1.00) |
0.661 (1.00) |
0.0134 (1.00) |
|
| 20p gain | 24 (36%) | 43 |
0.17 (1.00) |
0.0232 (1.00) |
0.892 (1.00) |
0.0564 (1.00) |
0.284 (1.00) |
0.657 (1.00) |
0.38 (1.00) |
|
| 20q gain | 28 (42%) | 39 |
0.389 (1.00) |
0.095 (1.00) |
1 (1.00) |
0.00818 (1.00) |
0.233 (1.00) |
0.638 (1.00) |
0.424 (1.00) |
|
| 21q gain | 4 (6%) | 63 |
0.0329 (1.00) |
0.0895 (1.00) |
0.294 (1.00) |
0.984 (1.00) |
0.402 (1.00) |
0.35 (1.00) |
||
| 22q gain | 17 (25%) | 50 |
0.85 (1.00) |
0.419 (1.00) |
0.0189 (1.00) |
0.147 (1.00) |
0.127 (1.00) |
0.0658 (1.00) |
0.485 (1.00) |
|
| 1p loss | 6 (9%) | 61 |
0.831 (1.00) |
0.936 (1.00) |
0.794 (1.00) |
0.655 (1.00) |
0.964 (1.00) |
0.0343 (1.00) |
0.824 (1.00) |
|
| 1q loss | 4 (6%) | 63 |
0.588 (1.00) |
0.214 (1.00) |
0.137 (1.00) |
1 (1.00) |
0.984 (1.00) |
0.17 (1.00) |
0.845 (1.00) |
|
| 2p loss | 7 (10%) | 60 |
0.943 (1.00) |
0.781 (1.00) |
0.831 (1.00) |
0.206 (1.00) |
0.964 (1.00) |
0.844 (1.00) |
0.335 (1.00) |
|
| 2q loss | 7 (10%) | 60 |
0.696 (1.00) |
0.654 (1.00) |
0.831 (1.00) |
0.034 (1.00) |
0.0467 (1.00) |
0.899 (1.00) |
0.157 (1.00) |
|
| 3p loss | 9 (13%) | 58 |
0.893 (1.00) |
0.827 (1.00) |
0.0217 (1.00) |
0.461 (1.00) |
0.951 (1.00) |
0.5 (1.00) |
0.723 (1.00) |
|
| 3q loss | 9 (13%) | 58 |
0.881 (1.00) |
0.5 (1.00) |
0.176 (1.00) |
0.142 (1.00) |
0.935 (1.00) |
0.62 (1.00) |
0.615 (1.00) |
|
| 4p loss | 4 (6%) | 63 |
0.0146 (1.00) |
1 (1.00) |
1 (1.00) |
0.000558 (0.264) |
0.891 (1.00) |
|||
| 4q loss | 4 (6%) | 63 |
0.0146 (1.00) |
1 (1.00) |
1 (1.00) |
0.000558 (0.264) |
0.891 (1.00) |
|||
| 5p loss | 9 (13%) | 58 |
0.0475 (1.00) |
0.662 (1.00) |
0.156 (1.00) |
0.707 (1.00) |
0.964 (1.00) |
0.84 (1.00) |
0.503 (1.00) |
|
| 5q loss | 20 (30%) | 47 |
0.35 (1.00) |
0.504 (1.00) |
0.257 (1.00) |
1 (1.00) |
0.422 (1.00) |
0.922 (1.00) |
0.663 (1.00) |
|
| 6p loss | 6 (9%) | 61 |
0.943 (1.00) |
0.599 (1.00) |
0.0523 (1.00) |
0.386 (1.00) |
0.964 (1.00) |
0.165 (1.00) |
0.872 (1.00) |
|
| 6q loss | 31 (46%) | 36 |
0.558 (1.00) |
0.0639 (1.00) |
0.223 (1.00) |
0.608 (1.00) |
0.534 (1.00) |
0.299 (1.00) |
0.473 (1.00) |
|
| 8p loss | 7 (10%) | 60 |
0.453 (1.00) |
0.415 (1.00) |
0.831 (1.00) |
0.675 (1.00) |
0.0823 (1.00) |
0.835 (1.00) |
0.225 (1.00) |
|
| 9p loss | 38 (57%) | 29 |
0.758 (1.00) |
0.103 (1.00) |
0.14 (1.00) |
1 (1.00) |
0.297 (1.00) |
0.368 (1.00) |
0.323 (1.00) |
|
| 9q loss | 29 (43%) | 38 |
0.544 (1.00) |
0.875 (1.00) |
0.048 (1.00) |
0.114 (1.00) |
0.199 (1.00) |
0.54 (1.00) |
0.122 (1.00) |
|
| 10p loss | 36 (54%) | 31 |
0.782 (1.00) |
0.955 (1.00) |
0.163 (1.00) |
0.122 (1.00) |
0.233 (1.00) |
0.0557 (1.00) |
0.591 (1.00) |
|
| 10q loss | 45 (67%) | 22 |
0.928 (1.00) |
0.59 (1.00) |
0.0838 (1.00) |
0.0264 (1.00) |
0.233 (1.00) |
0.0304 (1.00) |
0.61 (1.00) |
|
| 11p loss | 13 (19%) | 54 |
0.468 (1.00) |
0.786 (1.00) |
0.313 (1.00) |
0.101 (1.00) |
0.0269 (1.00) |
0.0735 (1.00) |
0.135 (1.00) |
|
| 11q loss | 15 (22%) | 52 |
0.321 (1.00) |
0.714 (1.00) |
0.305 (1.00) |
0.0679 (1.00) |
0.0815 (1.00) |
0.194 (1.00) |
0.0948 (1.00) |
|
| 12p loss | 3 (4%) | 64 |
0.658 (1.00) |
0.639 (1.00) |
0.0321 (1.00) |
0.0595 (1.00) |
0.584 (1.00) |
0.694 (1.00) |
||
| 12q loss | 4 (6%) | 63 |
0.62 (1.00) |
1 (1.00) |
0.1 (1.00) |
0.0595 (1.00) |
0.584 (1.00) |
0.694 (1.00) |
||
| 13q loss | 10 (15%) | 57 |
0.952 (1.00) |
0.299 (1.00) |
0.179 (1.00) |
0.718 (1.00) |
0.0804 (1.00) |
0.331 (1.00) |
0.582 (1.00) |
|
| 14q loss | 18 (27%) | 49 |
0.262 (1.00) |
0.238 (1.00) |
1 (1.00) |
0.771 (1.00) |
0.195 (1.00) |
0.5 (1.00) |
0.296 (1.00) |
|
| 15q loss | 6 (9%) | 61 |
0.945 (1.00) |
0.654 (1.00) |
0.0852 (1.00) |
0.0467 (1.00) |
0.84 (1.00) |
0.639 (1.00) |
||
| 16p loss | 5 (7%) | 62 |
0.906 (1.00) |
0.244 (1.00) |
1 (1.00) |
0.321 (1.00) |
0.984 (1.00) |
0.915 (1.00) |
0.586 (1.00) |
|
| 16q loss | 10 (15%) | 57 |
0.769 (1.00) |
0.402 (1.00) |
1 (1.00) |
0.277 (1.00) |
0.123 (1.00) |
0.175 (1.00) |
0.149 (1.00) |
|
| 17p loss | 12 (18%) | 55 |
0.31 (1.00) |
0.616 (1.00) |
0.261 (1.00) |
0.187 (1.00) |
0.21 (1.00) |
0.425 (1.00) |
0.741 (1.00) |
|
| 17q loss | 5 (7%) | 62 |
0.785 (1.00) |
0.758 (1.00) |
1 (1.00) |
0.288 (1.00) |
0.809 (1.00) |
0.658 (1.00) |
||
| 18p loss | 16 (24%) | 51 |
0.773 (1.00) |
0.892 (1.00) |
0.0226 (1.00) |
0.762 (1.00) |
0.777 (1.00) |
0.322 (1.00) |
0.118 (1.00) |
|
| 18q loss | 17 (25%) | 50 |
0.708 (1.00) |
0.322 (1.00) |
0.297 (1.00) |
0.551 (1.00) |
0.386 (1.00) |
0.748 (1.00) |
0.218 (1.00) |
|
| 19p loss | 6 (9%) | 61 |
0.618 (1.00) |
0.299 (1.00) |
1 (1.00) |
0.0852 (1.00) |
0.00915 (1.00) |
0.0325 (1.00) |
0.246 (1.00) |
|
| 19q loss | 8 (12%) | 59 |
0.936 (1.00) |
0.82 (1.00) |
0.132 (1.00) |
0.423 (1.00) |
0.00915 (1.00) |
0.0397 (1.00) |
0.454 (1.00) |
|
| 20p loss | 3 (4%) | 64 |
0.735 (1.00) |
0.731 (1.00) |
0.639 (1.00) |
1 (1.00) |
0.991 (1.00) |
0.962 (1.00) |
0.328 (1.00) |
|
| 21q loss | 8 (12%) | 59 |
0.486 (1.00) |
0.558 (1.00) |
1 (1.00) |
1 (1.00) |
0.935 (1.00) |
0.413 (1.00) |
0.00595 (1.00) |
|
| 22q loss | 4 (6%) | 63 |
0.656 (1.00) |
0.0806 (1.00) |
1 (1.00) |
1 (1.00) |
0.984 (1.00) |
0.904 (1.00) |
0.54 (1.00) |
|
| Xq loss | 4 (6%) | 63 |
0.861 (1.00) |
0.441 (1.00) |
0.34 (1.00) |
0.1 (1.00) |
0.991 (1.00) |
0.953 (1.00) |
0.0304 (1.00) |
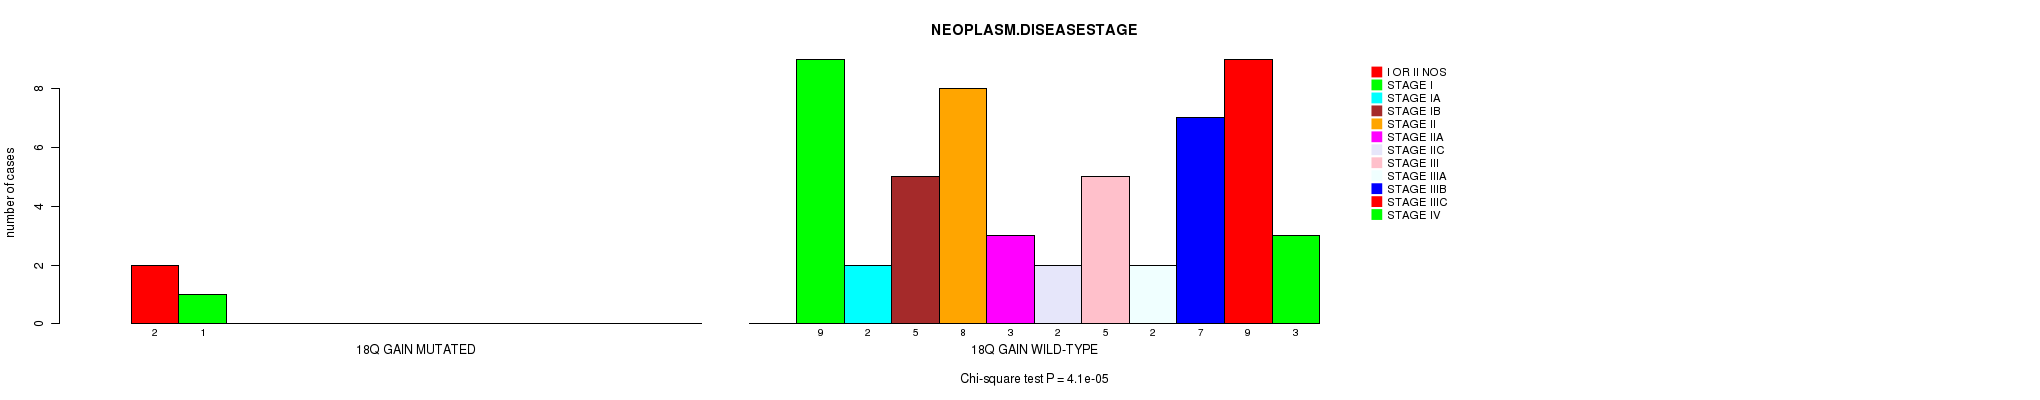
P value = 4.1e-05 (Chi-square test), Q value = 0.019
Table S1. Gene #28: '18q gain mutation analysis' versus Clinical Feature #8: 'NEOPLASM.DISEASESTAGE'
| nPatients | I OR II NOS | STAGE I | STAGE IA | STAGE IB | STAGE II | STAGE IIA | STAGE IIC | STAGE III | STAGE IIIA | STAGE IIIB | STAGE IIIC | STAGE IV |
|---|---|---|---|---|---|---|---|---|---|---|---|---|
| ALL | 2 | 10 | 2 | 5 | 8 | 3 | 2 | 5 | 2 | 7 | 9 | 3 |
| 18Q GAIN MUTATED | 2 | 1 | 0 | 0 | 0 | 0 | 0 | 0 | 0 | 0 | 0 | 0 |
| 18Q GAIN WILD-TYPE | 0 | 9 | 2 | 5 | 8 | 3 | 2 | 5 | 2 | 7 | 9 | 3 |
Figure S1. Get High-res Image Gene #28: '18q gain mutation analysis' versus Clinical Feature #8: 'NEOPLASM.DISEASESTAGE'
-
Mutation data file = broad_values_by_arm.mutsig.cluster.txt
-
Clinical data file = SKCM-BRAF_Hotspot_Mutants.clin.merged.picked.txt
-
Number of patients = 67
-
Number of significantly arm-level cnvs = 70
-
Number of selected clinical features = 8
-
Exclude genes that fewer than K tumors have mutations, K = 3
For survival clinical features, the Kaplan-Meier survival curves of tumors with and without gene mutations were plotted and the statistical significance P values were estimated by logrank test (Bland and Altman 2004) using the 'survdiff' function in R
For continuous numerical clinical features, two-tailed Student's t test with unequal variance (Lehmann and Romano 2005) was applied to compare the clinical values between tumors with and without gene mutations using 't.test' function in R
For binary or multi-class clinical features (nominal or ordinal), two-tailed Fisher's exact tests (Fisher 1922) were used to estimate the P values using the 'fisher.test' function in R
For multi-class clinical features (nominal or ordinal), Chi-square tests (Greenwood and Nikulin 1996) were used to estimate the P values using the 'chisq.test' function in R
For multiple hypothesis correction, Q value is the False Discovery Rate (FDR) analogue of the P value (Benjamini and Hochberg 1995), defined as the minimum FDR at which the test may be called significant. We used the 'Benjamini and Hochberg' method of 'p.adjust' function in R to convert P values into Q values.
This is an experimental feature. The full results of the analysis summarized in this report can be downloaded from the TCGA Data Coordination Center.