(Regional_LN cohort)
This pipeline computes the correlation between significantly recurrent gene mutations and selected clinical features.
Testing the association between mutation status of 74 genes and 7 clinical features across 105 patients, 7 significant findings detected with Q value < 0.25.
-
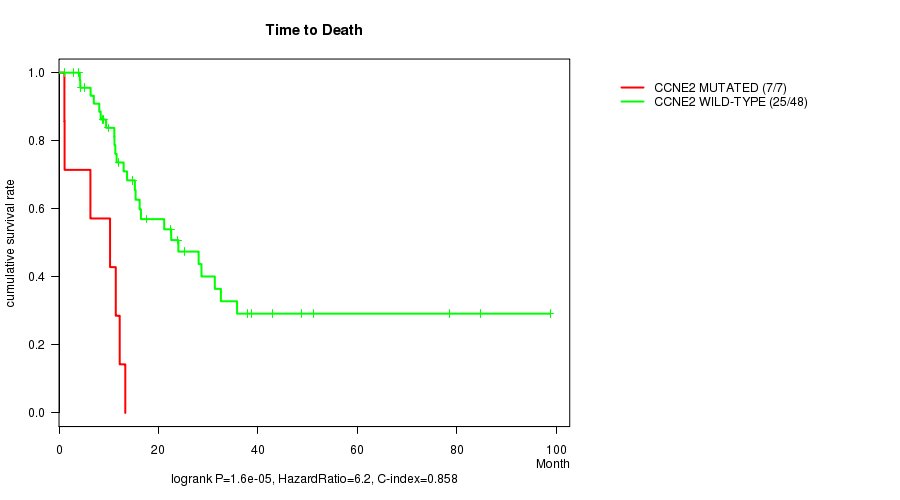
CCNE2 mutation correlated to 'Time to Death'.
-
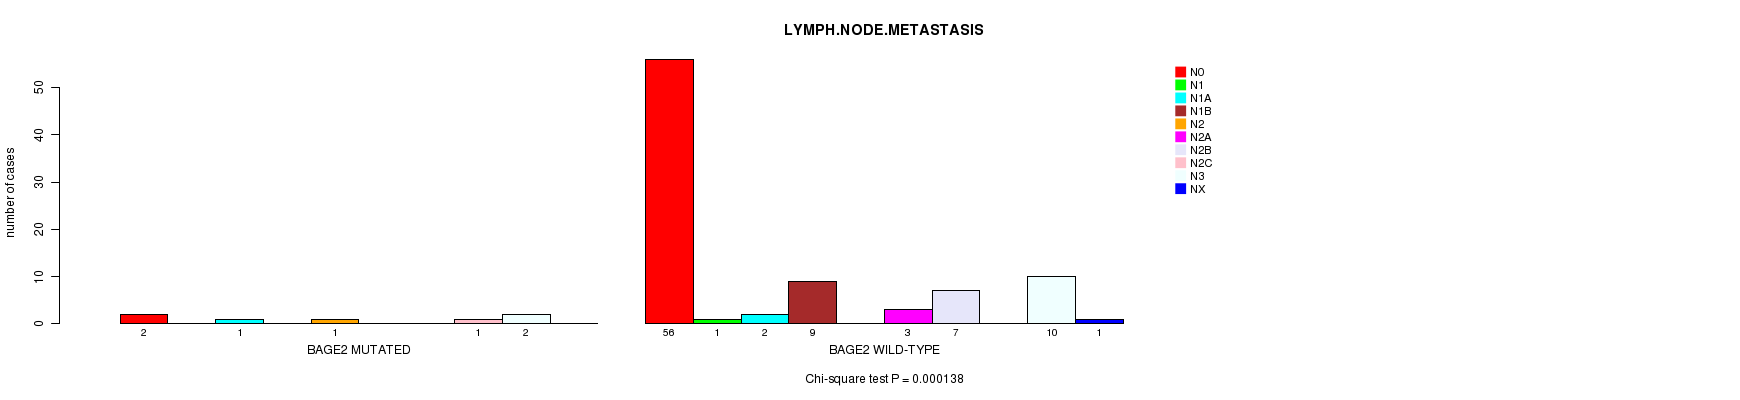
BAGE2 mutation correlated to 'LYMPH.NODE.METASTASIS'.
-
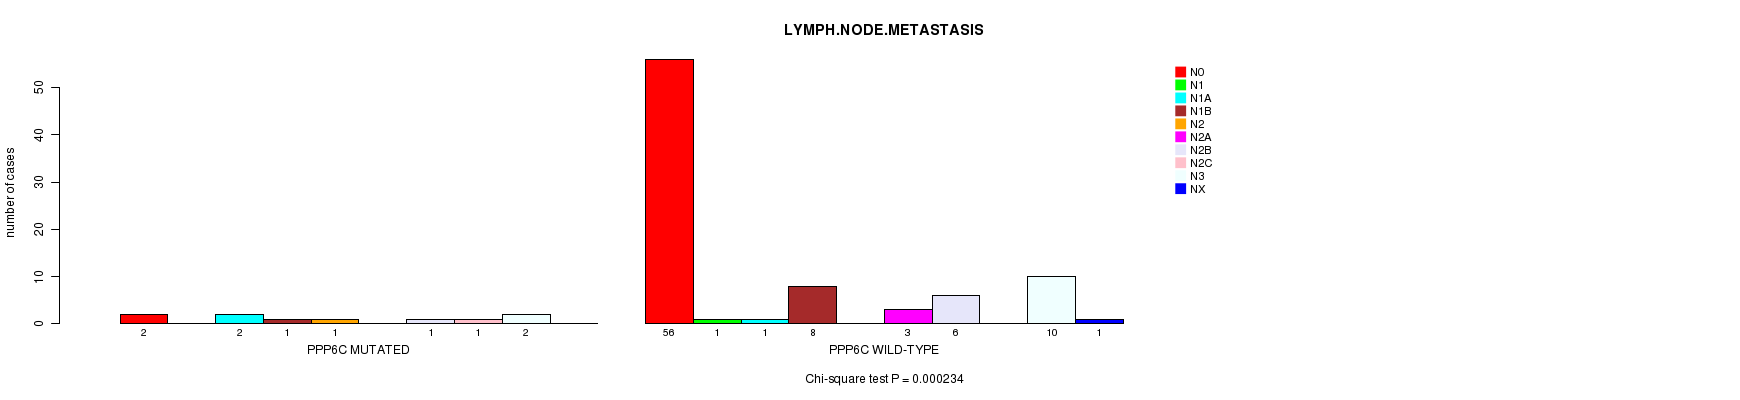
PPP6C mutation correlated to 'LYMPH.NODE.METASTASIS'.
-
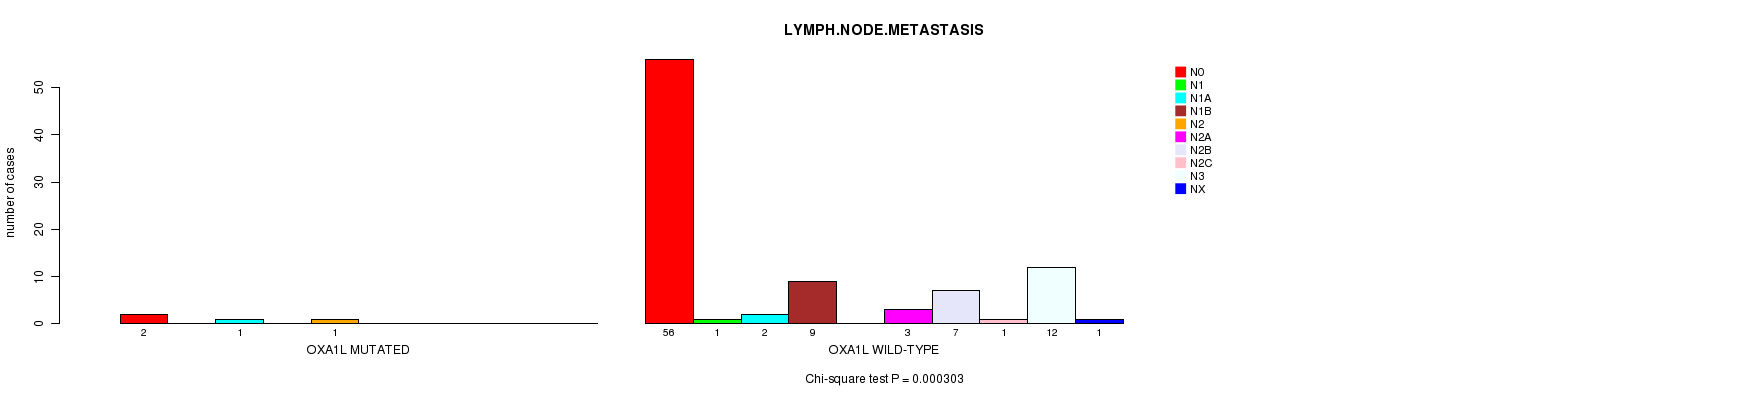
OXA1L mutation correlated to 'LYMPH.NODE.METASTASIS'.
-
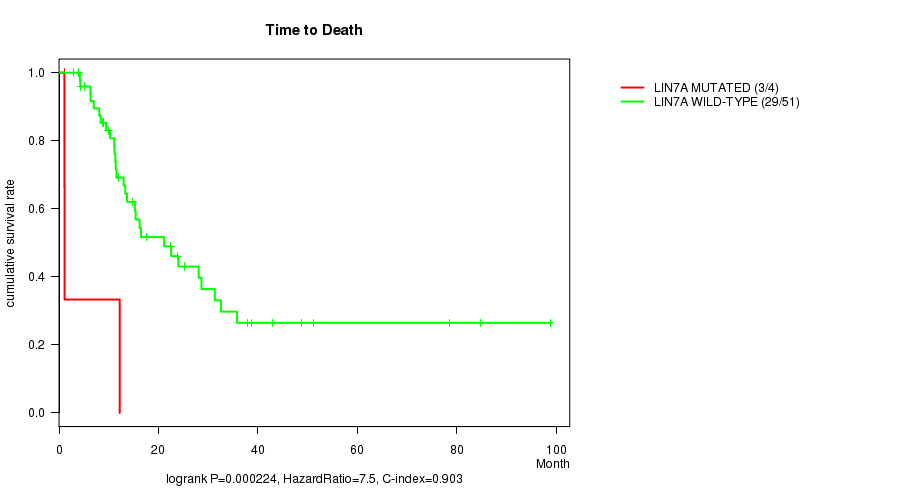
LIN7A mutation correlated to 'Time to Death'.
-
VGLL1 mutation correlated to 'LYMPH.NODE.METASTASIS'.
-
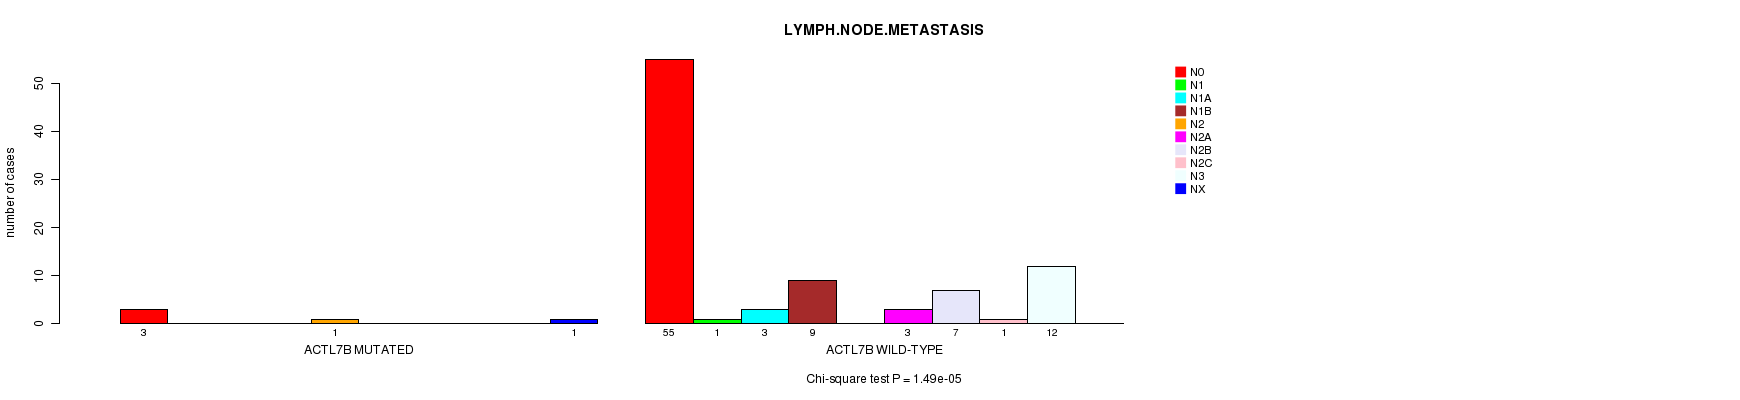
ACTL7B mutation correlated to 'LYMPH.NODE.METASTASIS'.
Table 1. Get Full Table Overview of the association between mutation status of 74 genes and 7 clinical features. Shown in the table are P values (Q values). Thresholded by Q value < 0.25, 7 significant findings detected.
|
Clinical Features |
Time to Death |
AGE | GENDER |
DISTANT METASTASIS |
LYMPH NODE METASTASIS |
TUMOR STAGECODE |
NEOPLASM DISEASESTAGE |
||
| nMutated (%) | nWild-Type | logrank test | t-test | Fisher's exact test | Fisher's exact test | Chi-square test | t-test | Chi-square test | |
| CCNE2 | 10 (10%) | 95 |
1.6e-05 (0.00697) |
0.804 (1.00) |
0.477 (1.00) |
1 (1.00) |
0.939 (1.00) |
0.344 (1.00) |
|
| BAGE2 | 7 (7%) | 98 |
0.478 (1.00) |
0.203 (1.00) |
0.419 (1.00) |
0.126 (1.00) |
0.000138 (0.0598) |
0.0694 (1.00) |
|
| PPP6C | 10 (10%) | 95 |
0.934 (1.00) |
0.843 (1.00) |
0.72 (1.00) |
0.209 (1.00) |
0.000234 (0.101) |
0.58 (1.00) |
|
| OXA1L | 4 (4%) | 101 |
0.136 (1.00) |
1 (1.00) |
1 (1.00) |
0.000303 (0.13) |
0.0748 (1.00) |
||
| LIN7A | 8 (8%) | 97 |
0.000224 (0.0967) |
0.662 (1.00) |
1 (1.00) |
1 (1.00) |
0.052 (1.00) |
0.712 (1.00) |
|
| VGLL1 | 3 (3%) | 102 |
0.111 (1.00) |
0.553 (1.00) |
1 (1.00) |
0.00012 (0.0523) |
0.451 (1.00) |
||
| ACTL7B | 7 (7%) | 98 |
0.848 (1.00) |
0.419 (1.00) |
1 (1.00) |
1.49e-05 (0.0065) |
0.0874 (1.00) |
||
| BRAF | 59 (56%) | 46 |
0.435 (1.00) |
0.298 (1.00) |
1 (1.00) |
1 (1.00) |
0.564 (1.00) |
0.817 (1.00) |
|
| CDKN2A | 16 (15%) | 89 |
0.871 (1.00) |
0.919 (1.00) |
0.773 (1.00) |
1 (1.00) |
0.871 (1.00) |
0.686 (1.00) |
|
| NRAS | 29 (28%) | 76 |
0.635 (1.00) |
0.266 (1.00) |
0.816 (1.00) |
0.744 (1.00) |
0.72 (1.00) |
0.949 (1.00) |
|
| STK19 | 7 (7%) | 98 |
0.424 (1.00) |
0.598 (1.00) |
0.419 (1.00) |
1 (1.00) |
0.997 (1.00) |
0.909 (1.00) |
|
| TTN | 83 (79%) | 22 |
0.208 (1.00) |
0.888 (1.00) |
0.44 (1.00) |
0.177 (1.00) |
0.0997 (1.00) |
0.301 (1.00) |
|
| TP53 | 18 (17%) | 87 |
0.59 (1.00) |
0.00159 (0.682) |
0.397 (1.00) |
1 (1.00) |
0.386 (1.00) |
0.383 (1.00) |
|
| PTEN | 11 (10%) | 94 |
0.163 (1.00) |
0.163 (1.00) |
0.295 (1.00) |
0.229 (1.00) |
0.937 (1.00) |
0.155 (1.00) |
|
| TPTE | 29 (28%) | 76 |
0.612 (1.00) |
0.223 (1.00) |
0.816 (1.00) |
1 (1.00) |
0.856 (1.00) |
0.487 (1.00) |
|
| PRB4 | 15 (14%) | 90 |
0.305 (1.00) |
0.0512 (1.00) |
0.221 (1.00) |
1 (1.00) |
0.319 (1.00) |
0.839 (1.00) |
|
| CDH9 | 22 (21%) | 83 |
0.738 (1.00) |
0.102 (1.00) |
1 (1.00) |
1 (1.00) |
0.517 (1.00) |
0.309 (1.00) |
|
| SERPINB4 | 17 (16%) | 88 |
0.412 (1.00) |
0.417 (1.00) |
0.0904 (1.00) |
1 (1.00) |
0.226 (1.00) |
0.768 (1.00) |
|
| PRB2 | 19 (18%) | 86 |
0.124 (1.00) |
0.00736 (1.00) |
0.175 (1.00) |
1 (1.00) |
0.595 (1.00) |
0.466 (1.00) |
|
| TCEB3C | 14 (13%) | 91 |
0.47 (1.00) |
0.481 (1.00) |
0.223 (1.00) |
1 (1.00) |
0.956 (1.00) |
0.845 (1.00) |
|
| ADH1C | 17 (16%) | 88 |
0.438 (1.00) |
0.0388 (1.00) |
0.773 (1.00) |
1 (1.00) |
0.0633 (1.00) |
0.231 (1.00) |
|
| C15ORF23 | 7 (7%) | 98 |
0.469 (1.00) |
0.78 (1.00) |
1 (1.00) |
1 (1.00) |
0.798 (1.00) |
0.903 (1.00) |
|
| SDR16C5 | 16 (15%) | 89 |
0.221 (1.00) |
0.114 (1.00) |
0.773 (1.00) |
0.503 (1.00) |
0.597 (1.00) |
0.342 (1.00) |
|
| PDE1A | 19 (18%) | 86 |
0.714 (1.00) |
0.141 (1.00) |
1 (1.00) |
1 (1.00) |
0.109 (1.00) |
0.522 (1.00) |
|
| TLL1 | 24 (23%) | 81 |
0.747 (1.00) |
0.144 (1.00) |
0.799 (1.00) |
1 (1.00) |
0.224 (1.00) |
0.373 (1.00) |
|
| RAC1 | 7 (7%) | 98 |
0.83 (1.00) |
0.522 (1.00) |
0.671 (1.00) |
1 (1.00) |
0.922 (1.00) |
0.679 (1.00) |
|
| RERG | 8 (8%) | 97 |
0.734 (1.00) |
0.0304 (1.00) |
1 (1.00) |
1 (1.00) |
0.0311 (1.00) |
0.304 (1.00) |
|
| OR52L1 | 12 (11%) | 93 |
0.704 (1.00) |
0.845 (1.00) |
1 (1.00) |
1 (1.00) |
0.0469 (1.00) |
0.799 (1.00) |
|
| HBD | 8 (8%) | 97 |
0.546 (1.00) |
0.858 (1.00) |
0.691 (1.00) |
1 (1.00) |
0.992 (1.00) |
0.562 (1.00) |
|
| VEGFC | 12 (11%) | 93 |
0.509 (1.00) |
0.823 (1.00) |
1 (1.00) |
1 (1.00) |
0.24 (1.00) |
0.337 (1.00) |
|
| OR1N2 | 13 (12%) | 92 |
0.897 (1.00) |
0.726 (1.00) |
0.336 (1.00) |
1 (1.00) |
0.223 (1.00) |
0.685 (1.00) |
|
| HNF4G | 12 (11%) | 93 |
0.259 (1.00) |
0.105 (1.00) |
1 (1.00) |
0.0231 (1.00) |
0.559 (1.00) |
||
| TRAT1 | 6 (6%) | 99 |
0.00681 (1.00) |
0.331 (1.00) |
1 (1.00) |
1 (1.00) |
0.0349 (1.00) |
0.721 (1.00) |
|
| AREG | 5 (5%) | 100 |
0.445 (1.00) |
0.631 (1.00) |
1 (1.00) |
0.00334 (1.00) |
0.528 (1.00) |
||
| ST18 | 24 (23%) | 81 |
0.662 (1.00) |
0.0401 (1.00) |
0.621 (1.00) |
1 (1.00) |
0.585 (1.00) |
0.545 (1.00) |
|
| TAF1A | 8 (8%) | 97 |
0.135 (1.00) |
0.843 (1.00) |
0.691 (1.00) |
0.301 (1.00) |
0.678 (1.00) |
0.735 (1.00) |
|
| GRXCR2 | 9 (9%) | 96 |
0.568 (1.00) |
0.455 (1.00) |
0.722 (1.00) |
1 (1.00) |
0.0863 (1.00) |
0.474 (1.00) |
|
| OR9K2 | 11 (10%) | 94 |
0.687 (1.00) |
0.058 (1.00) |
0.501 (1.00) |
1 (1.00) |
0.186 (1.00) |
0.457 (1.00) |
|
| A2BP1 | 14 (13%) | 91 |
0.66 (1.00) |
0.297 (1.00) |
0.754 (1.00) |
1 (1.00) |
0.315 (1.00) |
0.215 (1.00) |
|
| HIST1H2AA | 5 (5%) | 100 |
0.787 (1.00) |
0.631 (1.00) |
1 (1.00) |
0.979 (1.00) |
0.99 (1.00) |
||
| LILRA1 | 21 (20%) | 84 |
0.407 (1.00) |
0.618 (1.00) |
0.294 (1.00) |
0.597 (1.00) |
0.313 (1.00) |
0.974 (1.00) |
|
| GALNTL5 | 10 (10%) | 95 |
0.384 (1.00) |
0.428 (1.00) |
0.275 (1.00) |
1 (1.00) |
0.028 (1.00) |
0.503 (1.00) |
|
| HSD11B1 | 6 (6%) | 99 |
0.499 (1.00) |
0.177 (1.00) |
0.357 (1.00) |
1 (1.00) |
0.0131 (1.00) |
0.514 (1.00) |
|
| ANKRD20A4 | 4 (4%) | 101 |
0.218 (1.00) |
0.455 (1.00) |
0.317 (1.00) |
1 (1.00) |
0.00258 (1.00) |
0.297 (1.00) |
|
| GPR141 | 8 (8%) | 97 |
0.0436 (1.00) |
0.375 (1.00) |
1 (1.00) |
1 (1.00) |
0.0799 (1.00) |
0.452 (1.00) |
|
| NAP1L2 | 10 (10%) | 95 |
0.829 (1.00) |
0.0919 (1.00) |
0.72 (1.00) |
1 (1.00) |
0.0586 (1.00) |
0.855 (1.00) |
|
| C18ORF26 | 13 (12%) | 92 |
0.06 (1.00) |
0.704 (1.00) |
0.336 (1.00) |
1 (1.00) |
0.18 (1.00) |
0.312 (1.00) |
|
| DEFB110 | 5 (5%) | 100 |
0.28 (1.00) |
0.963 (1.00) |
0.318 (1.00) |
1 (1.00) |
0.00258 (1.00) |
0.378 (1.00) |
|
| IDH1 | 6 (6%) | 99 |
0.963 (1.00) |
0.0206 (1.00) |
0.357 (1.00) |
1 (1.00) |
0.984 (1.00) |
0.378 (1.00) |
|
| SNAP91 | 15 (14%) | 90 |
0.453 (1.00) |
0.238 (1.00) |
0.221 (1.00) |
0.503 (1.00) |
0.515 (1.00) |
0.202 (1.00) |
|
| CA1 | 6 (6%) | 99 |
0.152 (1.00) |
0.668 (1.00) |
1 (1.00) |
0.712 (1.00) |
0.891 (1.00) |
||
| SERPINB11 | 12 (11%) | 93 |
0.874 (1.00) |
0.675 (1.00) |
0.0166 (1.00) |
1 (1.00) |
0.177 (1.00) |
0.488 (1.00) |
|
| UGT2B15 | 13 (12%) | 92 |
0.887 (1.00) |
0.359 (1.00) |
0.102 (1.00) |
0.394 (1.00) |
0.211 (1.00) |
0.484 (1.00) |
|
| ACSM2B | 21 (20%) | 84 |
0.504 (1.00) |
0.95 (1.00) |
0.00611 (1.00) |
1 (1.00) |
0.614 (1.00) |
0.946 (1.00) |
|
| C16ORF78 | 8 (8%) | 97 |
0.671 (1.00) |
0.383 (1.00) |
1 (1.00) |
1 (1.00) |
0.0585 (1.00) |
0.507 (1.00) |
|
| TFEC | 10 (10%) | 95 |
0.128 (1.00) |
0.158 (1.00) |
0.72 (1.00) |
1 (1.00) |
0.00184 (0.789) |
0.533 (1.00) |
|
| TRHDE | 24 (23%) | 81 |
0.276 (1.00) |
0.0878 (1.00) |
0.134 (1.00) |
1 (1.00) |
0.442 (1.00) |
0.48 (1.00) |
|
| OR5AC2 | 13 (12%) | 92 |
0.322 (1.00) |
0.783 (1.00) |
0.751 (1.00) |
1 (1.00) |
0.838 (1.00) |
0.394 (1.00) |
|
| CCDC102B | 11 (10%) | 94 |
0.465 (1.00) |
0.928 (1.00) |
1 (1.00) |
1 (1.00) |
0.187 (1.00) |
0.6 (1.00) |
|
| GRXCR1 | 12 (11%) | 93 |
0.501 (1.00) |
0.019 (1.00) |
1 (1.00) |
1 (1.00) |
0.937 (1.00) |
0.42 (1.00) |
|
| OR4M2 | 13 (12%) | 92 |
0.858 (1.00) |
0.00192 (0.82) |
1 (1.00) |
1 (1.00) |
0.475 (1.00) |
0.537 (1.00) |
|
| PLAC8L1 | 3 (3%) | 102 |
0.226 (1.00) |
0.553 (1.00) |
1 (1.00) |
0.991 (1.00) |
0.783 (1.00) |
||
| POM121 | 10 (10%) | 95 |
0.0543 (1.00) |
0.921 (1.00) |
0.72 (1.00) |
1 (1.00) |
0.0981 (1.00) |
0.0476 (1.00) |
|
| RBM11 | 9 (9%) | 96 |
0.238 (1.00) |
0.0272 (1.00) |
1 (1.00) |
1 (1.00) |
0.0733 (1.00) |
0.644 (1.00) |
|
| RUNX1T1 | 16 (15%) | 89 |
0.814 (1.00) |
0.127 (1.00) |
0.141 (1.00) |
1 (1.00) |
0.4 (1.00) |
0.984 (1.00) |
|
| RGS7 | 17 (16%) | 88 |
0.339 (1.00) |
0.0121 (1.00) |
1 (1.00) |
0.27 (1.00) |
0.0912 (1.00) |
0.845 (1.00) |
|
| CLVS2 | 11 (10%) | 94 |
0.496 (1.00) |
0.442 (1.00) |
0.501 (1.00) |
1 (1.00) |
0.147 (1.00) |
0.845 (1.00) |
|
| DEFB118 | 6 (6%) | 99 |
0.66 (1.00) |
0.715 (1.00) |
1 (1.00) |
1 (1.00) |
0.0446 (1.00) |
0.589 (1.00) |
|
| OR52A5 | 12 (11%) | 93 |
0.221 (1.00) |
0.272 (1.00) |
1 (1.00) |
1 (1.00) |
0.18 (1.00) |
0.623 (1.00) |
|
| SPTLC3 | 13 (12%) | 92 |
0.689 (1.00) |
0.875 (1.00) |
1 (1.00) |
1 (1.00) |
0.319 (1.00) |
0.281 (1.00) |
|
| PHGDH | 7 (7%) | 98 |
0.59 (1.00) |
0.156 (1.00) |
0.102 (1.00) |
1 (1.00) |
0.0446 (1.00) |
0.0424 (1.00) |
|
| RGPD3 | 18 (17%) | 87 |
0.494 (1.00) |
0.00612 (1.00) |
0.0204 (1.00) |
0.575 (1.00) |
0.152 (1.00) |
0.774 (1.00) |
|
| WDR12 | 7 (7%) | 98 |
0.0135 (1.00) |
0.552 (1.00) |
0.102 (1.00) |
1 (1.00) |
0.97 (1.00) |
0.968 (1.00) |
|
| MPP7 | 13 (12%) | 92 |
0.816 (1.00) |
0.138 (1.00) |
0.336 (1.00) |
0.25 (1.00) |
0.323 (1.00) |
0.67 (1.00) |
P value = 1.6e-05 (logrank test), Q value = 0.007
Table S1. Gene #16: 'CCNE2 MUTATION STATUS' versus Clinical Feature #1: 'Time to Death'
| nPatients | nDeath | Duration Range (Median), Month | |
|---|---|---|---|
| ALL | 55 | 32 | 1.0 - 98.8 (13.3) |
| CCNE2 MUTATED | 7 | 7 | 1.1 - 13.3 (10.3) |
| CCNE2 WILD-TYPE | 48 | 25 | 1.0 - 98.8 (15.0) |
Figure S1. Get High-res Image Gene #16: 'CCNE2 MUTATION STATUS' versus Clinical Feature #1: 'Time to Death'
P value = 0.000138 (Chi-square test), Q value = 0.06
Table S2. Gene #25: 'BAGE2 MUTATION STATUS' versus Clinical Feature #5: 'LYMPH.NODE.METASTASIS'
| nPatients | N0 | N1 | N1A | N1B | N2 | N2A | N2B | N2C | N3 | NX |
|---|---|---|---|---|---|---|---|---|---|---|
| ALL | 58 | 1 | 3 | 9 | 1 | 3 | 7 | 1 | 12 | 1 |
| BAGE2 MUTATED | 2 | 0 | 1 | 0 | 1 | 0 | 0 | 1 | 2 | 0 |
| BAGE2 WILD-TYPE | 56 | 1 | 2 | 9 | 0 | 3 | 7 | 0 | 10 | 1 |
Figure S2. Get High-res Image Gene #25: 'BAGE2 MUTATION STATUS' versus Clinical Feature #5: 'LYMPH.NODE.METASTASIS'
P value = 0.000234 (Chi-square test), Q value = 0.1
Table S3. Gene #27: 'PPP6C MUTATION STATUS' versus Clinical Feature #5: 'LYMPH.NODE.METASTASIS'
| nPatients | N0 | N1 | N1A | N1B | N2 | N2A | N2B | N2C | N3 | NX |
|---|---|---|---|---|---|---|---|---|---|---|
| ALL | 58 | 1 | 3 | 9 | 1 | 3 | 7 | 1 | 12 | 1 |
| PPP6C MUTATED | 2 | 0 | 2 | 1 | 1 | 0 | 1 | 1 | 2 | 0 |
| PPP6C WILD-TYPE | 56 | 1 | 1 | 8 | 0 | 3 | 6 | 0 | 10 | 1 |
Figure S3. Get High-res Image Gene #27: 'PPP6C MUTATION STATUS' versus Clinical Feature #5: 'LYMPH.NODE.METASTASIS'
P value = 0.000303 (Chi-square test), Q value = 0.13
Table S4. Gene #35: 'OXA1L MUTATION STATUS' versus Clinical Feature #5: 'LYMPH.NODE.METASTASIS'
| nPatients | N0 | N1 | N1A | N1B | N2 | N2A | N2B | N2C | N3 | NX |
|---|---|---|---|---|---|---|---|---|---|---|
| ALL | 58 | 1 | 3 | 9 | 1 | 3 | 7 | 1 | 12 | 1 |
| OXA1L MUTATED | 2 | 0 | 1 | 0 | 1 | 0 | 0 | 0 | 0 | 0 |
| OXA1L WILD-TYPE | 56 | 1 | 2 | 9 | 0 | 3 | 7 | 1 | 12 | 1 |
Figure S4. Get High-res Image Gene #35: 'OXA1L MUTATION STATUS' versus Clinical Feature #5: 'LYMPH.NODE.METASTASIS'
P value = 0.000224 (logrank test), Q value = 0.097
Table S5. Gene #39: 'LIN7A MUTATION STATUS' versus Clinical Feature #1: 'Time to Death'
| nPatients | nDeath | Duration Range (Median), Month | |
|---|---|---|---|
| ALL | 55 | 32 | 1.0 - 98.8 (13.3) |
| LIN7A MUTATED | 4 | 3 | 1.0 - 12.2 (1.1) |
| LIN7A WILD-TYPE | 51 | 29 | 2.9 - 98.8 (14.7) |
Figure S5. Get High-res Image Gene #39: 'LIN7A MUTATION STATUS' versus Clinical Feature #1: 'Time to Death'
P value = 0.00012 (Chi-square test), Q value = 0.052
Table S6. Gene #40: 'VGLL1 MUTATION STATUS' versus Clinical Feature #5: 'LYMPH.NODE.METASTASIS'
| nPatients | N0 | N1 | N1A | N1B | N2 | N2A | N2B | N2C | N3 | NX |
|---|---|---|---|---|---|---|---|---|---|---|
| ALL | 58 | 1 | 3 | 9 | 1 | 3 | 7 | 1 | 12 | 1 |
| VGLL1 MUTATED | 1 | 0 | 0 | 0 | 1 | 0 | 0 | 0 | 1 | 0 |
| VGLL1 WILD-TYPE | 57 | 1 | 3 | 9 | 0 | 3 | 7 | 1 | 11 | 1 |
Figure S6. Get High-res Image Gene #40: 'VGLL1 MUTATION STATUS' versus Clinical Feature #5: 'LYMPH.NODE.METASTASIS'

P value = 1.49e-05 (Chi-square test), Q value = 0.0065
Table S7. Gene #70: 'ACTL7B MUTATION STATUS' versus Clinical Feature #5: 'LYMPH.NODE.METASTASIS'
| nPatients | N0 | N1 | N1A | N1B | N2 | N2A | N2B | N2C | N3 | NX |
|---|---|---|---|---|---|---|---|---|---|---|
| ALL | 58 | 1 | 3 | 9 | 1 | 3 | 7 | 1 | 12 | 1 |
| ACTL7B MUTATED | 3 | 0 | 0 | 0 | 1 | 0 | 0 | 0 | 0 | 1 |
| ACTL7B WILD-TYPE | 55 | 1 | 3 | 9 | 0 | 3 | 7 | 1 | 12 | 0 |
Figure S7. Get High-res Image Gene #70: 'ACTL7B MUTATION STATUS' versus Clinical Feature #5: 'LYMPH.NODE.METASTASIS'
-
Mutation data file = SKCM-Regional_LN.mutsig.cluster.txt
-
Clinical data file = SKCM-Regional_LN.clin.merged.picked.txt
-
Number of patients = 105
-
Number of significantly mutated genes = 74
-
Number of selected clinical features = 7
-
Exclude genes that fewer than K tumors have mutations, K = 3
For survival clinical features, the Kaplan-Meier survival curves of tumors with and without gene mutations were plotted and the statistical significance P values were estimated by logrank test (Bland and Altman 2004) using the 'survdiff' function in R
For continuous numerical clinical features, two-tailed Student's t test with unequal variance (Lehmann and Romano 2005) was applied to compare the clinical values between tumors with and without gene mutations using 't.test' function in R
For binary or multi-class clinical features (nominal or ordinal), two-tailed Fisher's exact tests (Fisher 1922) were used to estimate the P values using the 'fisher.test' function in R
For multi-class clinical features (nominal or ordinal), Chi-square tests (Greenwood and Nikulin 1996) were used to estimate the P values using the 'chisq.test' function in R
For multiple hypothesis correction, Q value is the False Discovery Rate (FDR) analogue of the P value (Benjamini and Hochberg 1995), defined as the minimum FDR at which the test may be called significant. We used the 'Benjamini and Hochberg' method of 'p.adjust' function in R to convert P values into Q values.
This is an experimental feature. The full results of the analysis summarized in this report can be downloaded from the TCGA Data Coordination Center.