(Regional_Metastatic cohort)
This pipeline computes the correlation between significantly recurrent gene mutations and selected clinical features.
Testing the association between mutation status of 72 genes and 8 clinical features across 137 patients, 4 significant findings detected with Q value < 0.25.
-
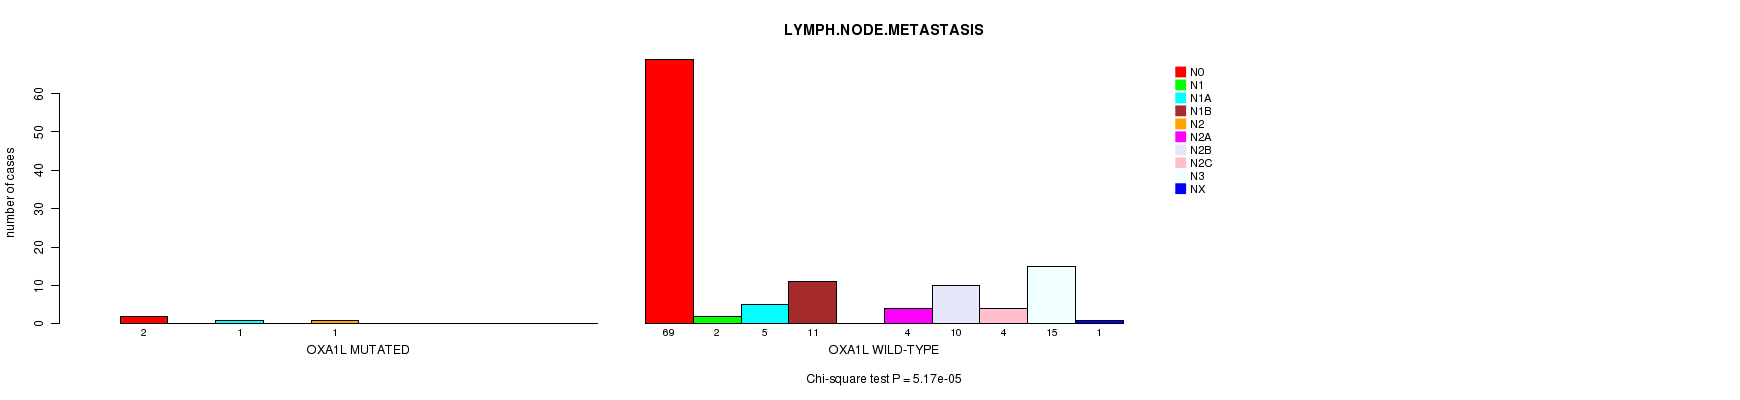
OXA1L mutation correlated to 'LYMPH.NODE.METASTASIS'.
-
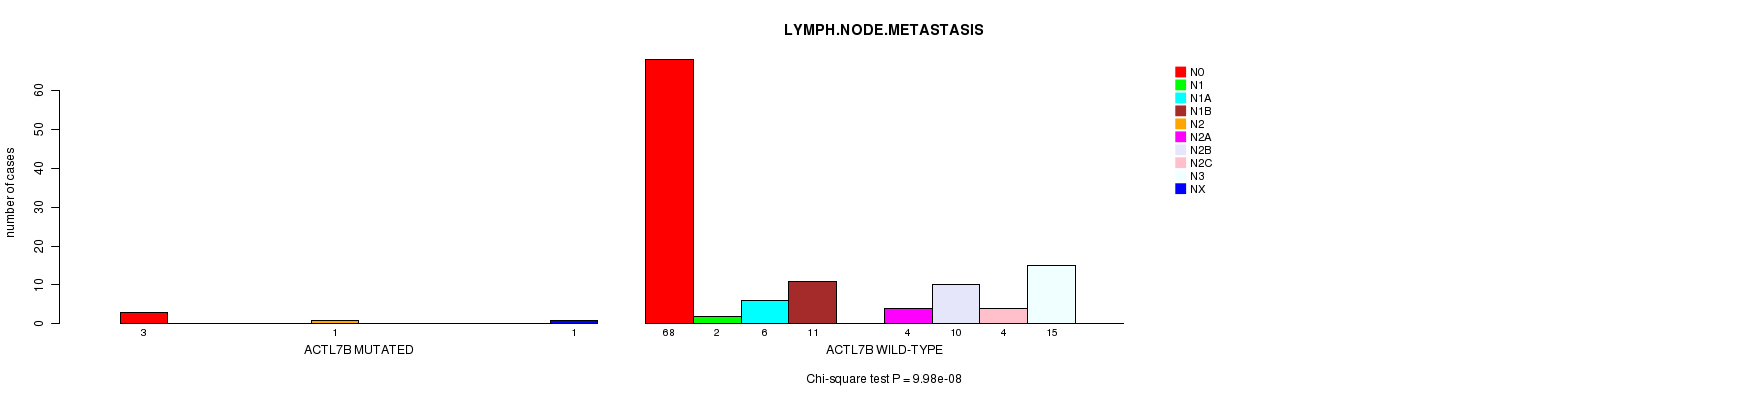
ACTL7B mutation correlated to 'LYMPH.NODE.METASTASIS'.
-
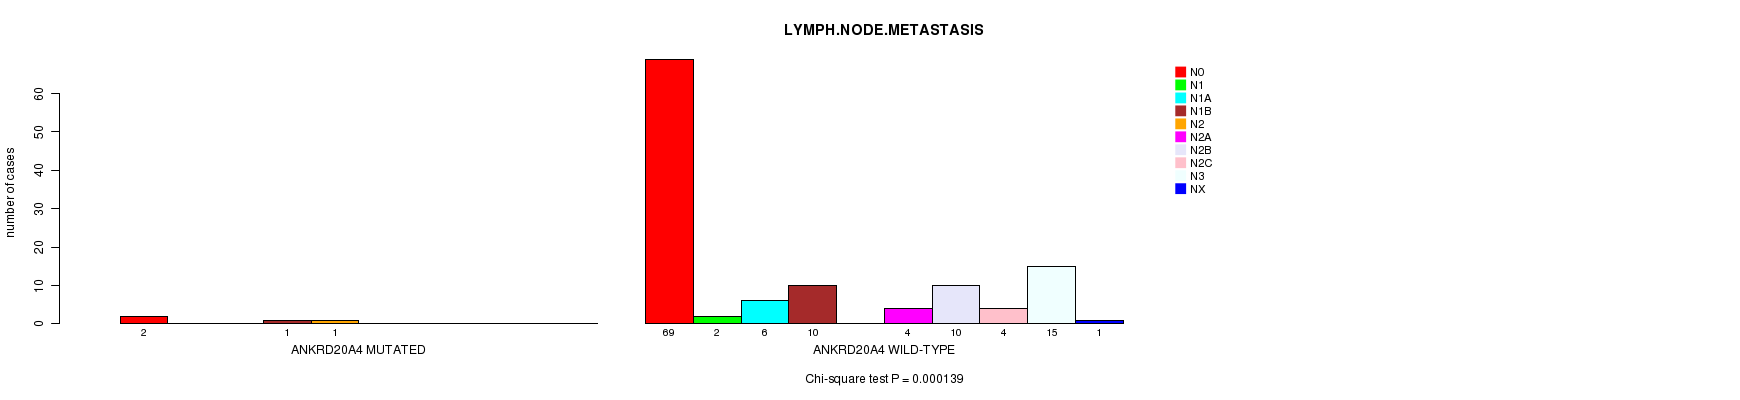
ANKRD20A4 mutation correlated to 'LYMPH.NODE.METASTASIS'.
-
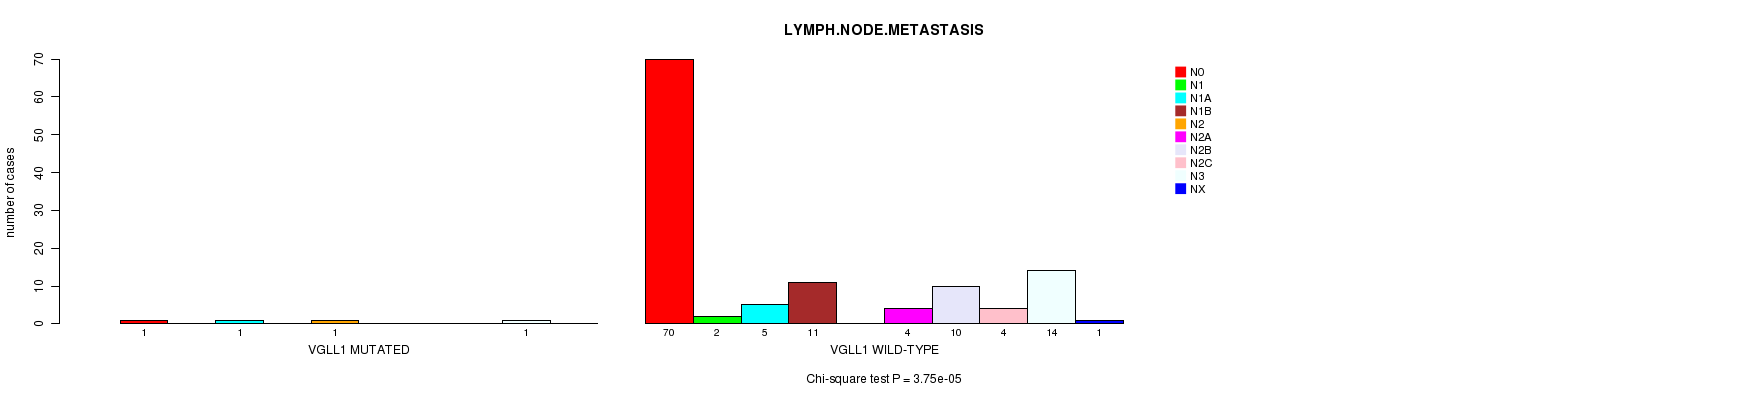
VGLL1 mutation correlated to 'LYMPH.NODE.METASTASIS'.
Table 1. Get Full Table Overview of the association between mutation status of 72 genes and 8 clinical features. Shown in the table are P values (Q values). Thresholded by Q value < 0.25, 4 significant findings detected.
|
Clinical Features |
Time to Death |
AGE |
PRIMARY SITE OF DISEASE |
GENDER |
DISTANT METASTASIS |
LYMPH NODE METASTASIS |
TUMOR STAGECODE |
NEOPLASM DISEASESTAGE |
||
| nMutated (%) | nWild-Type | logrank test | t-test | Fisher's exact test | Fisher's exact test | Chi-square test | Chi-square test | t-test | Chi-square test | |
| OXA1L | 4 (3%) | 133 |
0.509 (1.00) |
0.151 (1.00) |
0.573 (1.00) |
1 (1.00) |
0.996 (1.00) |
5.17e-05 (0.0258) |
0.294 (1.00) |
|
| ACTL7B | 8 (6%) | 129 |
0.352 (1.00) |
0.595 (1.00) |
0.681 (1.00) |
1 (1.00) |
0.994 (1.00) |
9.98e-08 (5e-05) |
0.0953 (1.00) |
|
| ANKRD20A4 | 4 (3%) | 133 |
0.471 (1.00) |
0.529 (1.00) |
0.573 (1.00) |
0.3 (1.00) |
0.996 (1.00) |
0.000139 (0.0691) |
0.627 (1.00) |
|
| VGLL1 | 5 (4%) | 132 |
0.983 (1.00) |
0.229 (1.00) |
0.332 (1.00) |
0.168 (1.00) |
0.996 (1.00) |
3.75e-05 (0.0187) |
0.929 (1.00) |
|
| CDKN2A | 23 (17%) | 114 |
0.585 (1.00) |
0.781 (1.00) |
0.42 (1.00) |
0.629 (1.00) |
0.9 (1.00) |
0.625 (1.00) |
0.749 (1.00) |
|
| TP53 | 23 (17%) | 114 |
0.464 (1.00) |
0.0129 (1.00) |
1 (1.00) |
1 (1.00) |
0.918 (1.00) |
0.08 (1.00) |
0.223 (1.00) |
|
| BRAF | 73 (53%) | 64 |
0.683 (1.00) |
0.127 (1.00) |
0.232 (1.00) |
0.592 (1.00) |
0.608 (1.00) |
0.575 (1.00) |
0.521 (1.00) |
|
| C15ORF23 | 10 (7%) | 127 |
0.85 (1.00) |
0.652 (1.00) |
0.698 (1.00) |
1 (1.00) |
0.982 (1.00) |
0.629 (1.00) |
0.602 (1.00) |
|
| ERVFRDE1 | 3 (2%) | 134 |
0.00791 (1.00) |
0.685 (1.00) |
0.553 (1.00) |
0.551 (1.00) |
||||
| NRAS | 39 (28%) | 98 |
0.85 (1.00) |
0.212 (1.00) |
0.823 (1.00) |
0.841 (1.00) |
0.795 (1.00) |
0.66 (1.00) |
0.523 (1.00) |
|
| PTEN | 12 (9%) | 125 |
0.642 (1.00) |
0.213 (1.00) |
0.294 (1.00) |
0.536 (1.00) |
0.0442 (1.00) |
0.845 (1.00) |
0.08 (1.00) |
|
| PPP6C | 14 (10%) | 123 |
0.0232 (1.00) |
0.721 (1.00) |
0.739 (1.00) |
1 (1.00) |
0.0785 (1.00) |
0.0621 (1.00) |
0.685 (1.00) |
|
| PRB4 | 16 (12%) | 121 |
0.13 (1.00) |
0.0506 (1.00) |
0.117 (1.00) |
0.262 (1.00) |
0.956 (1.00) |
0.148 (1.00) |
0.907 (1.00) |
|
| RAC1 | 9 (7%) | 128 |
0.498 (1.00) |
0.55 (1.00) |
1 (1.00) |
0.718 (1.00) |
0.989 (1.00) |
0.935 (1.00) |
0.499 (1.00) |
|
| CDH9 | 23 (17%) | 114 |
0.201 (1.00) |
0.119 (1.00) |
0.0156 (1.00) |
0.812 (1.00) |
0.89 (1.00) |
0.267 (1.00) |
0.207 (1.00) |
|
| STK19 | 9 (7%) | 128 |
0.524 (1.00) |
0.444 (1.00) |
1 (1.00) |
0.484 (1.00) |
0.986 (1.00) |
0.996 (1.00) |
0.927 (1.00) |
|
| ADH1C | 20 (15%) | 117 |
0.445 (1.00) |
0.286 (1.00) |
0.407 (1.00) |
0.451 (1.00) |
0.935 (1.00) |
0.117 (1.00) |
0.642 (1.00) |
|
| TCEB3C | 19 (14%) | 118 |
0.703 (1.00) |
0.611 (1.00) |
0.772 (1.00) |
0.115 (1.00) |
0.927 (1.00) |
0.478 (1.00) |
0.296 (1.00) |
|
| DDX3X | 14 (10%) | 123 |
0.252 (1.00) |
0.88 (1.00) |
0.315 (1.00) |
0.14 (1.00) |
0.00912 (1.00) |
0.993 (1.00) |
0.834 (1.00) |
|
| TRAT1 | 9 (7%) | 128 |
0.0232 (1.00) |
0.232 (1.00) |
0.436 (1.00) |
1 (1.00) |
0.986 (1.00) |
0.0127 (1.00) |
0.917 (1.00) |
|
| TTN | 108 (79%) | 29 |
0.124 (1.00) |
0.805 (1.00) |
1 (1.00) |
0.185 (1.00) |
0.252 (1.00) |
0.209 (1.00) |
0.836 (1.00) |
|
| GH2 | 10 (7%) | 127 |
0.574 (1.00) |
0.477 (1.00) |
0.698 (1.00) |
1 (1.00) |
0.986 (1.00) |
0.0136 (1.00) |
0.0294 (1.00) |
|
| TFEC | 13 (9%) | 124 |
0.337 (1.00) |
0.207 (1.00) |
1 (1.00) |
0.543 (1.00) |
0.968 (1.00) |
0.00767 (1.00) |
0.648 (1.00) |
|
| IDH1 | 7 (5%) | 130 |
0.548 (1.00) |
0.0124 (1.00) |
1 (1.00) |
0.224 (1.00) |
0.989 (1.00) |
0.987 (1.00) |
0.582 (1.00) |
|
| WDR12 | 9 (7%) | 128 |
0.887 (1.00) |
0.375 (1.00) |
1 (1.00) |
0.272 (1.00) |
0.989 (1.00) |
0.727 (1.00) |
0.951 (1.00) |
|
| RGS18 | 7 (5%) | 130 |
0.853 (1.00) |
0.337 (1.00) |
0.354 (1.00) |
0.095 (1.00) |
0.992 (1.00) |
0.878 (1.00) |
0.82 (1.00) |
|
| POF1B | 17 (12%) | 120 |
0.298 (1.00) |
0.0388 (1.00) |
0.546 (1.00) |
0.79 (1.00) |
0.942 (1.00) |
0.169 (1.00) |
0.945 (1.00) |
|
| OR5AC2 | 16 (12%) | 121 |
0.897 (1.00) |
0.813 (1.00) |
0.763 (1.00) |
1 (1.00) |
0.949 (1.00) |
0.706 (1.00) |
0.4 (1.00) |
|
| VEGFC | 13 (9%) | 124 |
0.358 (1.00) |
0.872 (1.00) |
0.299 (1.00) |
1 (1.00) |
0.968 (1.00) |
0.0184 (1.00) |
0.424 (1.00) |
|
| RERG | 9 (7%) | 128 |
0.712 (1.00) |
0.0934 (1.00) |
0.685 (1.00) |
0.718 (1.00) |
0.989 (1.00) |
0.00774 (1.00) |
0.519 (1.00) |
|
| CCNE2 | 10 (7%) | 127 |
0.0237 (1.00) |
0.875 (1.00) |
0.116 (1.00) |
0.732 (1.00) |
0.978 (1.00) |
0.887 (1.00) |
0.492 (1.00) |
|
| GPR141 | 12 (9%) | 125 |
0.663 (1.00) |
0.996 (1.00) |
0.474 (1.00) |
0.751 (1.00) |
0.968 (1.00) |
0.0775 (1.00) |
0.393 (1.00) |
|
| GK2 | 17 (12%) | 120 |
0.336 (1.00) |
0.603 (1.00) |
0.228 (1.00) |
0.79 (1.00) |
0.949 (1.00) |
0.117 (1.00) |
0.26 (1.00) |
|
| NAP1L2 | 12 (9%) | 125 |
0.827 (1.00) |
0.033 (1.00) |
0.732 (1.00) |
0.751 (1.00) |
0.968 (1.00) |
0.0523 (1.00) |
0.724 (1.00) |
|
| SNAP91 | 18 (13%) | 119 |
0.877 (1.00) |
0.204 (1.00) |
0.565 (1.00) |
0.117 (1.00) |
0.607 (1.00) |
0.47 (1.00) |
0.587 (1.00) |
|
| PRB2 | 20 (15%) | 117 |
0.751 (1.00) |
0.00623 (1.00) |
0.0436 (1.00) |
0.0732 (1.00) |
0.927 (1.00) |
0.361 (1.00) |
0.407 (1.00) |
|
| TLL1 | 27 (20%) | 110 |
0.95 (1.00) |
0.125 (1.00) |
0.128 (1.00) |
0.181 (1.00) |
0.847 (1.00) |
0.0945 (1.00) |
0.122 (1.00) |
|
| HBD | 8 (6%) | 129 |
0.196 (1.00) |
0.809 (1.00) |
0.198 (1.00) |
1 (1.00) |
0.986 (1.00) |
0.98 (1.00) |
0.441 (1.00) |
|
| GRXCR2 | 11 (8%) | 126 |
0.37 (1.00) |
0.694 (1.00) |
1 (1.00) |
0.751 (1.00) |
0.982 (1.00) |
0.0341 (1.00) |
0.554 (1.00) |
|
| NOTCH2NL | 9 (7%) | 128 |
0.924 (1.00) |
0.838 (1.00) |
0.213 (1.00) |
0.718 (1.00) |
0.986 (1.00) |
0.352 (1.00) |
0.442 (1.00) |
|
| AREG | 6 (4%) | 131 |
0.492 (1.00) |
0.293 (1.00) |
1 (1.00) |
0.403 (1.00) |
0.994 (1.00) |
0.00215 (1.00) |
0.527 (1.00) |
|
| HBG2 | 6 (4%) | 131 |
0.252 (1.00) |
0.336 (1.00) |
0.624 (1.00) |
1 (1.00) |
0.992 (1.00) |
0.0069 (1.00) |
0.454 (1.00) |
|
| SERPINB4 | 20 (15%) | 117 |
0.827 (1.00) |
0.283 (1.00) |
0.407 (1.00) |
0.0195 (1.00) |
0.201 (1.00) |
0.371 (1.00) |
0.939 (1.00) |
|
| SPTLC3 | 14 (10%) | 123 |
0.303 (1.00) |
0.713 (1.00) |
0.188 (1.00) |
0.773 (1.00) |
0.956 (1.00) |
0.148 (1.00) |
0.232 (1.00) |
|
| TAF1A | 9 (7%) | 128 |
0.024 (1.00) |
0.884 (1.00) |
0.685 (1.00) |
0.484 (1.00) |
0.222 (1.00) |
0.737 (1.00) |
0.798 (1.00) |
|
| CLVS2 | 13 (9%) | 124 |
0.666 (1.00) |
0.223 (1.00) |
0.732 (1.00) |
0.218 (1.00) |
0.968 (1.00) |
0.0794 (1.00) |
0.806 (1.00) |
|
| CCDC102B | 15 (11%) | 122 |
0.794 (1.00) |
0.486 (1.00) |
0.751 (1.00) |
0.773 (1.00) |
0.962 (1.00) |
0.115 (1.00) |
0.814 (1.00) |
|
| OR4N2 | 15 (11%) | 122 |
0.859 (1.00) |
0.247 (1.00) |
0.751 (1.00) |
0.02 (1.00) |
0.0604 (1.00) |
0.26 (1.00) |
0.814 (1.00) |
|
| OR8D4 | 9 (7%) | 128 |
0.0395 (1.00) |
0.62 (1.00) |
0.685 (1.00) |
1 (1.00) |
0.986 (1.00) |
0.0366 (1.00) |
0.98 (1.00) |
|
| RBM11 | 10 (7%) | 127 |
0.836 (1.00) |
0.0147 (1.00) |
0.452 (1.00) |
0.495 (1.00) |
0.978 (1.00) |
0.0381 (1.00) |
0.434 (1.00) |
|
| DEFB118 | 7 (5%) | 130 |
0.107 (1.00) |
0.64 (1.00) |
1 (1.00) |
1 (1.00) |
0.989 (1.00) |
0.0275 (1.00) |
0.781 (1.00) |
|
| GRXCR1 | 13 (9%) | 124 |
0.332 (1.00) |
0.0168 (1.00) |
0.299 (1.00) |
1 (1.00) |
0.968 (1.00) |
0.845 (1.00) |
0.506 (1.00) |
|
| RGPD3 | 22 (16%) | 115 |
0.981 (1.00) |
0.00584 (1.00) |
0.784 (1.00) |
0.0465 (1.00) |
0.705 (1.00) |
0.245 (1.00) |
0.863 (1.00) |
|
| CA1 | 8 (6%) | 129 |
0.851 (1.00) |
0.881 (1.00) |
1 (1.00) |
0.267 (1.00) |
0.992 (1.00) |
0.891 (1.00) |
0.936 (1.00) |
|
| HNF4G | 15 (11%) | 122 |
0.0487 (1.00) |
0.114 (1.00) |
1 (1.00) |
0.385 (1.00) |
0.956 (1.00) |
0.012 (1.00) |
0.774 (1.00) |
|
| SPAG16 | 12 (9%) | 125 |
0.658 (1.00) |
0.706 (1.00) |
1 (1.00) |
0.337 (1.00) |
0.978 (1.00) |
0.0759 (1.00) |
0.842 (1.00) |
|
| PCDHB8 | 23 (17%) | 114 |
0.559 (1.00) |
0.498 (1.00) |
0.788 (1.00) |
0.231 (1.00) |
0.927 (1.00) |
0.377 (1.00) |
0.576 (1.00) |
|
| HIST1H2AA | 5 (4%) | 132 |
0.567 (1.00) |
0.822 (1.00) |
0.591 (1.00) |
1 (1.00) |
0.994 (1.00) |
0.963 (1.00) |
0.973 (1.00) |
|
| OR10K2 | 14 (10%) | 123 |
0.148 (1.00) |
0.0061 (1.00) |
0.739 (1.00) |
0.14 (1.00) |
0.968 (1.00) |
0.174 (1.00) |
0.59 (1.00) |
|
| PHGDH | 8 (6%) | 129 |
0.722 (1.00) |
0.692 (1.00) |
0.681 (1.00) |
0.0514 (1.00) |
0.992 (1.00) |
0.00742 (1.00) |
0.116 (1.00) |
|
| OR9K2 | 11 (8%) | 126 |
0.604 (1.00) |
0.0753 (1.00) |
0.067 (1.00) |
0.334 (1.00) |
0.973 (1.00) |
0.0952 (1.00) |
0.684 (1.00) |
|
| LIN7A | 8 (6%) | 129 |
0.875 (1.00) |
0.716 (1.00) |
0.198 (1.00) |
0.718 (1.00) |
0.992 (1.00) |
0.00897 (1.00) |
0.858 (1.00) |
|
| USP17L2 | 13 (9%) | 124 |
0.751 (1.00) |
0.549 (1.00) |
0.182 (1.00) |
0.218 (1.00) |
0.968 (1.00) |
0.123 (1.00) |
0.251 (1.00) |
|
| CYLC2 | 14 (10%) | 123 |
0.468 (1.00) |
0.171 (1.00) |
0.52 (1.00) |
0.14 (1.00) |
0.968 (1.00) |
0.0488 (1.00) |
0.735 (1.00) |
|
| DEFB110 | 5 (4%) | 132 |
0.12 (1.00) |
0.994 (1.00) |
0.591 (1.00) |
0.168 (1.00) |
0.994 (1.00) |
0.000646 (0.32) |
0.671 (1.00) |
|
| LCE1B | 7 (5%) | 130 |
0.0484 (1.00) |
0.734 (1.00) |
0.665 (1.00) |
1 (1.00) |
0.992 (1.00) |
0.928 (1.00) |
0.864 (1.00) |
|
| PARM1 | 10 (7%) | 127 |
0.228 (1.00) |
0.488 (1.00) |
0.698 (1.00) |
0.495 (1.00) |
0.982 (1.00) |
0.0267 (1.00) |
0.0858 (1.00) |
|
| ACSM2B | 24 (18%) | 113 |
0.406 (1.00) |
0.529 (1.00) |
0.195 (1.00) |
0.00368 (1.00) |
0.89 (1.00) |
0.413 (1.00) |
0.971 (1.00) |
|
| BAGE2 | 7 (5%) | 130 |
0.737 (1.00) |
0.237 (1.00) |
0.2 (1.00) |
0.687 (1.00) |
0.000505 (0.251) |
0.00247 (1.00) |
0.207 (1.00) |
|
| CECR6 | 6 (4%) | 131 |
0.338 (1.00) |
0.953 (1.00) |
1 (1.00) |
1 (1.00) |
0.992 (1.00) |
0.577 (1.00) |
0.553 (1.00) |
|
| OR4M2 | 15 (11%) | 122 |
0.774 (1.00) |
0.000531 (0.263) |
0.52 (1.00) |
0.773 (1.00) |
0.956 (1.00) |
0.348 (1.00) |
0.228 (1.00) |
|
| CERKL | 10 (7%) | 127 |
0.62 (1.00) |
0.981 (1.00) |
0.698 (1.00) |
1 (1.00) |
0.982 (1.00) |
0.0547 (1.00) |
0.858 (1.00) |
P value = 5.17e-05 (Chi-square test), Q value = 0.026
Table S1. Gene #37: 'OXA1L MUTATION STATUS' versus Clinical Feature #6: 'LYMPH.NODE.METASTASIS'
| nPatients | N0 | N1 | N1A | N1B | N2 | N2A | N2B | N2C | N3 | NX |
|---|---|---|---|---|---|---|---|---|---|---|
| ALL | 71 | 2 | 6 | 11 | 1 | 4 | 10 | 4 | 15 | 1 |
| OXA1L MUTATED | 2 | 0 | 1 | 0 | 1 | 0 | 0 | 0 | 0 | 0 |
| OXA1L WILD-TYPE | 69 | 2 | 5 | 11 | 0 | 4 | 10 | 4 | 15 | 1 |
Figure S1. Get High-res Image Gene #37: 'OXA1L MUTATION STATUS' versus Clinical Feature #6: 'LYMPH.NODE.METASTASIS'
P value = 9.98e-08 (Chi-square test), Q value = 5e-05
Table S2. Gene #53: 'ACTL7B MUTATION STATUS' versus Clinical Feature #6: 'LYMPH.NODE.METASTASIS'
| nPatients | N0 | N1 | N1A | N1B | N2 | N2A | N2B | N2C | N3 | NX |
|---|---|---|---|---|---|---|---|---|---|---|
| ALL | 71 | 2 | 6 | 11 | 1 | 4 | 10 | 4 | 15 | 1 |
| ACTL7B MUTATED | 3 | 0 | 0 | 0 | 1 | 0 | 0 | 0 | 0 | 1 |
| ACTL7B WILD-TYPE | 68 | 2 | 6 | 11 | 0 | 4 | 10 | 4 | 15 | 0 |
Figure S2. Get High-res Image Gene #53: 'ACTL7B MUTATION STATUS' versus Clinical Feature #6: 'LYMPH.NODE.METASTASIS'
P value = 0.000139 (Chi-square test), Q value = 0.069
Table S3. Gene #62: 'ANKRD20A4 MUTATION STATUS' versus Clinical Feature #6: 'LYMPH.NODE.METASTASIS'
| nPatients | N0 | N1 | N1A | N1B | N2 | N2A | N2B | N2C | N3 | NX |
|---|---|---|---|---|---|---|---|---|---|---|
| ALL | 71 | 2 | 6 | 11 | 1 | 4 | 10 | 4 | 15 | 1 |
| ANKRD20A4 MUTATED | 2 | 0 | 0 | 1 | 1 | 0 | 0 | 0 | 0 | 0 |
| ANKRD20A4 WILD-TYPE | 69 | 2 | 6 | 10 | 0 | 4 | 10 | 4 | 15 | 1 |
Figure S3. Get High-res Image Gene #62: 'ANKRD20A4 MUTATION STATUS' versus Clinical Feature #6: 'LYMPH.NODE.METASTASIS'
P value = 3.75e-05 (Chi-square test), Q value = 0.019
Table S4. Gene #64: 'VGLL1 MUTATION STATUS' versus Clinical Feature #6: 'LYMPH.NODE.METASTASIS'
| nPatients | N0 | N1 | N1A | N1B | N2 | N2A | N2B | N2C | N3 | NX |
|---|---|---|---|---|---|---|---|---|---|---|
| ALL | 71 | 2 | 6 | 11 | 1 | 4 | 10 | 4 | 15 | 1 |
| VGLL1 MUTATED | 1 | 0 | 1 | 0 | 1 | 0 | 0 | 0 | 1 | 0 |
| VGLL1 WILD-TYPE | 70 | 2 | 5 | 11 | 0 | 4 | 10 | 4 | 14 | 1 |
Figure S4. Get High-res Image Gene #64: 'VGLL1 MUTATION STATUS' versus Clinical Feature #6: 'LYMPH.NODE.METASTASIS'
-
Mutation data file = SKCM-Regional_Metastatic.mutsig.cluster.txt
-
Clinical data file = SKCM-Regional_Metastatic.clin.merged.picked.txt
-
Number of patients = 137
-
Number of significantly mutated genes = 72
-
Number of selected clinical features = 8
-
Exclude genes that fewer than K tumors have mutations, K = 3
For survival clinical features, the Kaplan-Meier survival curves of tumors with and without gene mutations were plotted and the statistical significance P values were estimated by logrank test (Bland and Altman 2004) using the 'survdiff' function in R
For continuous numerical clinical features, two-tailed Student's t test with unequal variance (Lehmann and Romano 2005) was applied to compare the clinical values between tumors with and without gene mutations using 't.test' function in R
For binary or multi-class clinical features (nominal or ordinal), two-tailed Fisher's exact tests (Fisher 1922) were used to estimate the P values using the 'fisher.test' function in R
For multi-class clinical features (nominal or ordinal), Chi-square tests (Greenwood and Nikulin 1996) were used to estimate the P values using the 'chisq.test' function in R
For multiple hypothesis correction, Q value is the False Discovery Rate (FDR) analogue of the P value (Benjamini and Hochberg 1995), defined as the minimum FDR at which the test may be called significant. We used the 'Benjamini and Hochberg' method of 'p.adjust' function in R to convert P values into Q values.
This is an experimental feature. The full results of the analysis summarized in this report can be downloaded from the TCGA Data Coordination Center.