(Regional_Metastatic cohort)
This report serves to describe the mutational landscape and properties of a given individual set, as well as rank genes and genesets according to mutational significance. MutSig v1.5 was used to generate the results found in this report.
-
Working with individual set: SKCM-Regional_Metastatic
-
Number of patients in set: 137
The input for this pipeline is a set of individuals with the following files associated for each:
-
An annotated .maf file describing the mutations called for the respective individual, and their properties.
-
A .wig file that contains information about the coverage of the sample.
-
MAF used for this analysis:SKCM-Regional_Metastatic.final_analysis_set.maf
-
Significantly mutated genes (q ≤ 0.1): 66
-
Mutations seen in COSMIC: 414
-
Significantly mutated genes in COSMIC territory: 30
-
Genes with clustered mutations (≤ 3 aa apart): 1850
-
Significantly mutated genesets: 2
-
Significantly mutated genesets: (excluding sig. mutated genes):0
-
Read 137 MAFs of type "Broad"
-
Total number of mutations in input MAFs: 136253
-
After removing 493 blacklisted mutations: 135760
-
After removing 2491 noncoding mutations: 133269
-
Number of mutations before filtering: 133269
-
After removing 1671 mutations outside gene set: 131598
-
After removing 138 mutations outside category set: 131460
-
After removing 4 "impossible" mutations in
-
gene-patient-category bins of zero coverage: 129647
Table 1. Get Full Table Table representing breakdown of mutations by type.
| type | count |
|---|---|
| Frame_Shift_Del | 496 |
| Frame_Shift_Ins | 179 |
| In_Frame_Del | 208 |
| In_Frame_Ins | 30 |
| Missense_Mutation | 79863 |
| Nonsense_Mutation | 4791 |
| Nonstop_Mutation | 28 |
| Silent | 44640 |
| Splice_Site | 1188 |
| Translation_Start_Site | 37 |
| Total | 131460 |
Table 2. Get Full Table A breakdown of mutation rates per category discovered for this individual set.
| category | n | N | rate | rate_per_mb | relative_rate | exp_ns_s_ratio |
|---|---|---|---|---|---|---|
| (C/T)p*C->T | 62535 | 1086024614 | 0.000058 | 58 | 2.6 | 1.6 |
| (A/G)p*C->T | 6722 | 911139542 | 7.4e-06 | 7.4 | 0.33 | 1.9 |
| A->G | 3074 | 1930142433 | 1.6e-06 | 1.6 | 0.072 | 2.3 |
| transver | 7563 | 3927306589 | 1.9e-06 | 1.9 | 0.087 | 5 |
| indel+null | 6803 | 3927306589 | 1.7e-06 | 1.7 | 0.078 | NaN |
| double_null | 120 | 3927306589 | 3.1e-08 | 0.031 | 0.0014 | NaN |
| Total | 86817 | 3927306589 | 0.000022 | 22 | 1 | 3.5 |
The x axis represents the samples. The y axis represents the exons, one row per exon, and they are sorted by average coverage across samples. For exons with exactly the same average coverage, they are sorted next by the %GC of the exon. (The secondary sort is especially useful for the zero-coverage exons at the bottom).
Figure 1.
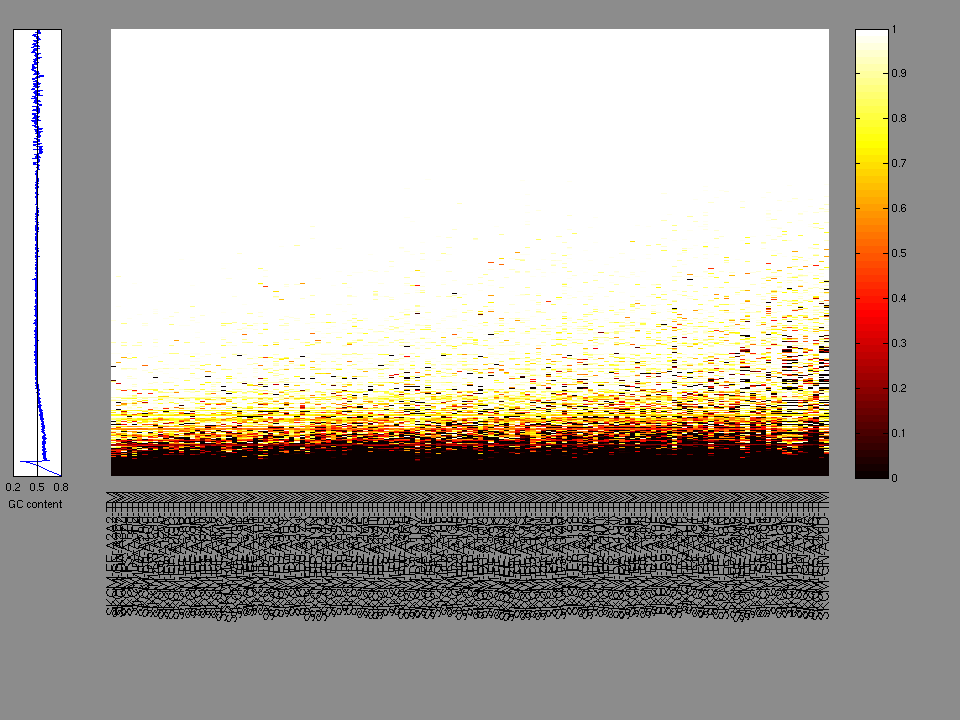
Figure 2. Patients counts and rates file used to generate this plot: SKCM-Regional_Metastatic.patients.counts_and_rates.txt
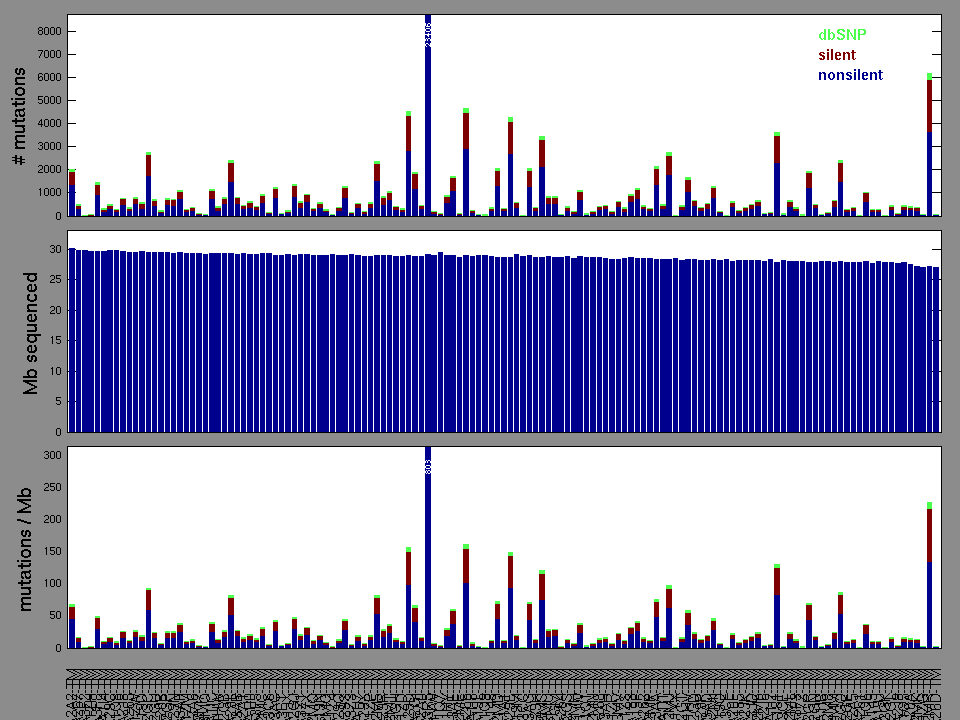
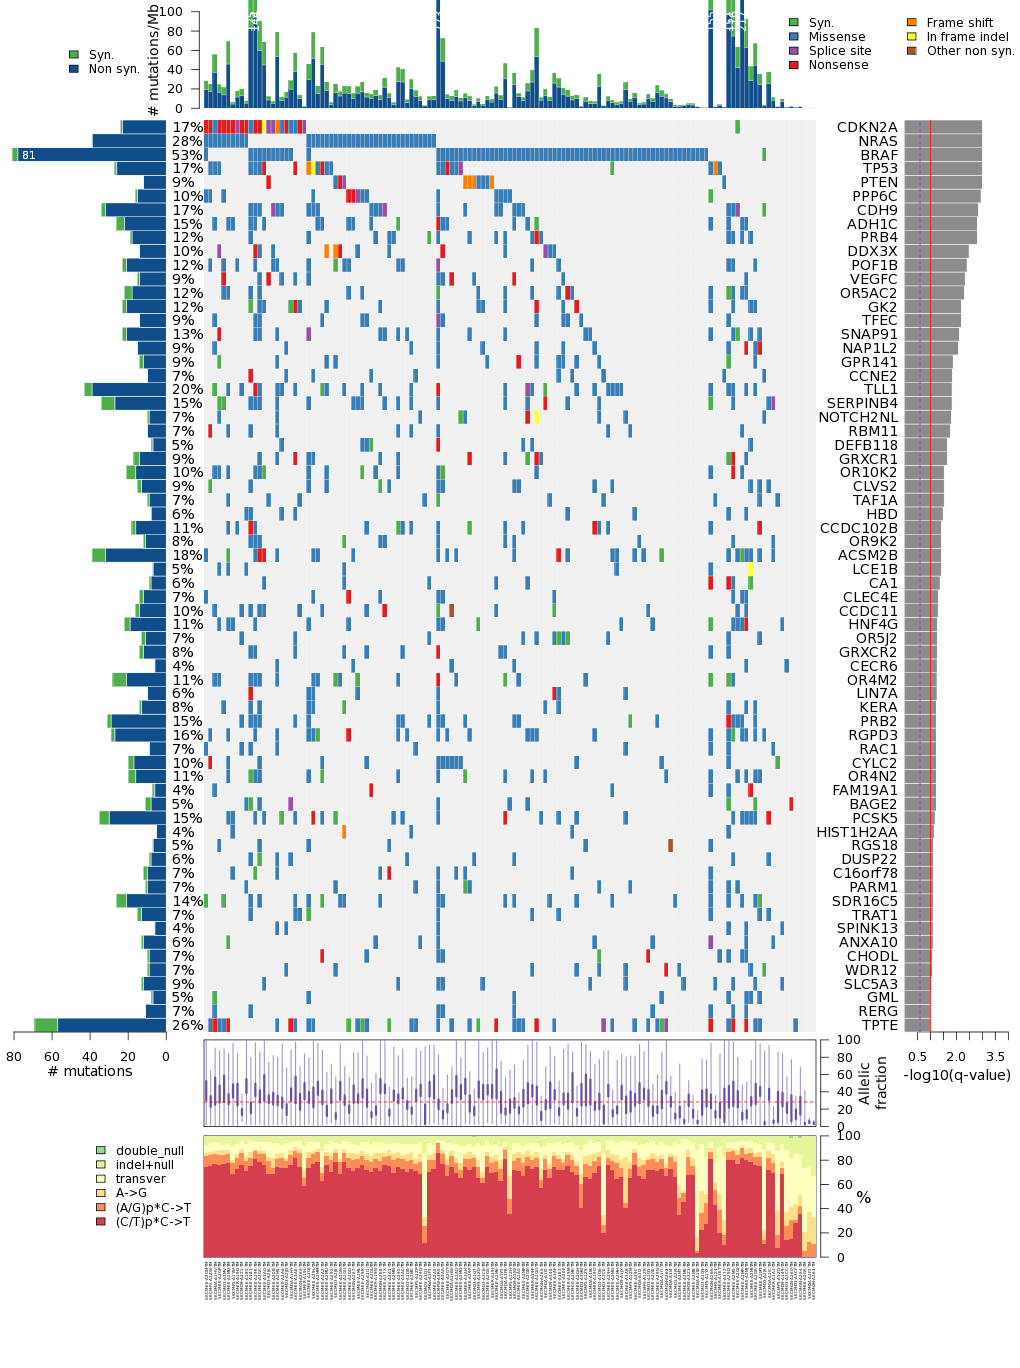
Figure 3. Get High-res Image The matrix in the center of the figure represents individual mutations in patient samples, color-coded by type of mutation, for the significantly mutated genes. The rate of synonymous and non-synonymous mutations is displayed at the top of the matrix. The barplot on the left of the matrix shows the number of mutations in each gene. The percentages represent the fraction of tumors with at least one mutation in the specified gene. The barplot to the right of the matrix displays the q-values for the most significantly mutated genes. The purple boxplots below the matrix (only displayed if required columns are present in the provided MAF) represent the distributions of allelic fractions observed in each sample. The plot at the bottom represents the base substitution distribution of individual samples, using the same categories that were used to calculate significance.
Column Descriptions:
-
N = number of sequenced bases in this gene across the individual set
-
n = number of (nonsilent) mutations in this gene across the individual set
-
npat = number of patients (individuals) with at least one nonsilent mutation
-
nsite = number of unique sites having a non-silent mutation
-
nsil = number of silent mutations in this gene across the individual set
-
n1 = number of nonsilent mutations of type: (C/T)p*C->T
-
n2 = number of nonsilent mutations of type: (A/G)p*C->T
-
n3 = number of nonsilent mutations of type: A->G
-
n4 = number of nonsilent mutations of type: transver
-
n5 = number of nonsilent mutations of type: indel+null
-
n6 = number of nonsilent mutations of type: double_null
-
p_ns_s = p-value for the observed nonsilent/silent ratio being elevated in this gene
-
p = p-value (overall)
-
q = q-value, False Discovery Rate (Benjamini-Hochberg procedure)
Table 3. Get Full Table A Ranked List of Significantly Mutated Genes. Number of significant genes found: 66. Number of genes displayed: 35. Click on a gene name to display its stick figure depicting the distribution of mutations and mutation types across the chosen gene (this feature may not be available for all significant genes).
| rank | gene | description | N | n | npat | nsite | nsil | n1 | n2 | n3 | n4 | n5 | n6 | p_ns_s | p | q |
|---|---|---|---|---|---|---|---|---|---|---|---|---|---|---|---|---|
| 1 | CDKN2A | cyclin-dependent kinase inhibitor 2A (melanoma, p16, inhibits CDK4) | 127245 | 23 | 23 | 13 | 1 | 4 | 0 | 0 | 1 | 18 | 0 | 0.0073 | 3.3e-15 | 2.6e-11 |
| 2 | NRAS | neuroblastoma RAS viral (v-ras) oncogene homolog | 80273 | 39 | 39 | 6 | 0 | 1 | 1 | 12 | 25 | 0 | 0 | 0.000069 | 3.8e-15 | 2.6e-11 |
| 3 | BRAF | v-raf murine sarcoma viral oncogene homolog B1 | 303705 | 78 | 73 | 16 | 3 | 12 | 1 | 2 | 63 | 0 | 0 | 0.000025 | 4.3e-15 | 2.6e-11 |
| 4 | TP53 | tumor protein p53 | 166589 | 26 | 23 | 23 | 1 | 13 | 0 | 2 | 3 | 8 | 0 | 0.00089 | 7.1e-15 | 3.2e-11 |
| 5 | PTEN | phosphatase and tensin homolog (mutated in multiple advanced cancers 1) | 153968 | 12 | 12 | 12 | 0 | 0 | 0 | 2 | 3 | 7 | 0 | 0.16 | 2e-10 | 7e-07 |
| 6 | PPP6C | protein phosphatase 6, catalytic subunit | 137456 | 15 | 14 | 11 | 1 | 12 | 0 | 0 | 0 | 3 | 0 | 0.036 | 4.1e-08 | 0.00012 |
| 7 | CDH9 | cadherin 9, type 2 (T1-cadherin) | 318377 | 32 | 23 | 31 | 2 | 25 | 2 | 0 | 2 | 3 | 0 | 0.0017 | 1.5e-07 | 0.00038 |
| 8 | ADH1C | alcohol dehydrogenase 1C (class I), gamma polypeptide | 155776 | 22 | 20 | 18 | 4 | 15 | 2 | 0 | 4 | 1 | 0 | 0.027 | 2.4e-07 | 0.00049 |
| 9 | PRB4 | proline-rich protein BstNI subfamily 4 | 103572 | 18 | 16 | 14 | 1 | 16 | 0 | 0 | 1 | 1 | 0 | 0.16 | 2.4e-07 | 0.00049 |
| 10 | DDX3X | DEAD (Asp-Glu-Ala-Asp) box polypeptide 3, X-linked | 268460 | 14 | 14 | 14 | 0 | 4 | 1 | 1 | 1 | 7 | 0 | 0.063 | 1.2e-06 | 0.0022 |
| 11 | POF1B | premature ovarian failure, 1B | 201955 | 21 | 17 | 20 | 2 | 15 | 3 | 1 | 1 | 1 | 0 | 0.014 | 1.8e-06 | 0.0029 |
| 12 | VEGFC | vascular endothelial growth factor C | 161178 | 14 | 13 | 13 | 1 | 9 | 1 | 0 | 0 | 4 | 0 | 0.018 | 2.4e-06 | 0.0036 |
| 13 | OR5AC2 | olfactory receptor, family 5, subfamily AC, member 2 | 127342 | 18 | 16 | 16 | 4 | 17 | 0 | 0 | 0 | 1 | 0 | 0.026 | 2.7e-06 | 0.0038 |
| 14 | GK2 | glycerol kinase 2 | 227421 | 21 | 17 | 19 | 2 | 14 | 1 | 1 | 2 | 3 | 0 | 0.026 | 4.2e-06 | 0.0051 |
| 15 | TFEC | transcription factor EC | 139819 | 14 | 13 | 14 | 0 | 11 | 1 | 0 | 1 | 1 | 0 | 0.018 | 4.2e-06 | 0.0051 |
| 16 | SNAP91 | synaptosomal-associated protein, 91kDa homolog (mouse) | 211873 | 21 | 18 | 21 | 2 | 15 | 2 | 1 | 1 | 2 | 0 | 0.033 | 5.8e-06 | 0.0066 |
| 17 | NAP1L2 | nucleosome assembly protein 1-like 2 | 186787 | 15 | 12 | 15 | 0 | 8 | 1 | 2 | 2 | 2 | 0 | 0.007 | 6.7e-06 | 0.0071 |
| 18 | GPR141 | G protein-coupled receptor 141 | 126217 | 12 | 12 | 9 | 2 | 9 | 0 | 1 | 1 | 1 | 0 | 0.0048 | 0.000012 | 0.012 |
| 19 | CCNE2 | cyclin E2 | 172467 | 10 | 10 | 7 | 0 | 2 | 0 | 0 | 7 | 1 | 0 | 0.14 | 0.000014 | 0.013 |
| 20 | TLL1 | tolloid-like 1 | 406878 | 39 | 27 | 34 | 4 | 33 | 1 | 1 | 1 | 3 | 0 | 0.008 | 0.000015 | 0.014 |
| 21 | SERPINB4 | serpin peptidase inhibitor, clade B (ovalbumin), member 4 | 150678 | 27 | 20 | 24 | 7 | 21 | 0 | 1 | 3 | 2 | 0 | 0.019 | 0.000016 | 0.014 |
| 22 | NOTCH2NL | Notch homolog 2 (Drosophila) N-terminal like | 99063 | 9 | 9 | 9 | 1 | 4 | 0 | 1 | 2 | 2 | 0 | 0.24 | 0.000018 | 0.014 |
| 23 | RBM11 | RNA binding motif protein 11 | 89907 | 10 | 10 | 9 | 0 | 7 | 0 | 0 | 2 | 1 | 0 | 0.087 | 2e-05 | 0.016 |
| 24 | DEFB118 | defensin, beta 118 | 51651 | 7 | 7 | 6 | 1 | 5 | 0 | 0 | 1 | 1 | 0 | 0.36 | 0.000028 | 0.02 |
| 25 | GRXCR1 | glutaredoxin, cysteine rich 1 | 118890 | 14 | 13 | 12 | 3 | 9 | 0 | 1 | 0 | 4 | 0 | 0.16 | 0.000028 | 0.02 |
| 26 | OR10K2 | olfactory receptor, family 10, subfamily K, member 2 | 119561 | 16 | 14 | 14 | 5 | 11 | 1 | 0 | 3 | 1 | 0 | 0.021 | 0.000041 | 0.028 |
| 27 | CLVS2 | clavesin 2 | 133322 | 13 | 13 | 11 | 2 | 12 | 1 | 0 | 0 | 0 | 0 | 0.024 | 0.000043 | 0.028 |
| 28 | TAF1A | TATA box binding protein (TBP)-associated factor, RNA polymerase I, A, 48kDa | 190811 | 9 | 9 | 7 | 1 | 1 | 0 | 0 | 8 | 0 | 0 | 0.5 | 0.000044 | 0.028 |
| 29 | HBD | hemoglobin, delta | 61670 | 8 | 8 | 7 | 0 | 7 | 1 | 0 | 0 | 0 | 0 | 0.0059 | 5e-05 | 0.031 |
| 30 | CCDC102B | coiled-coil domain containing 102B | 207986 | 16 | 15 | 15 | 2 | 11 | 1 | 0 | 1 | 3 | 0 | 0.043 | 0.000058 | 0.035 |
| 31 | OR9K2 | olfactory receptor, family 9, subfamily K, member 2 | 136898 | 11 | 11 | 10 | 1 | 8 | 2 | 1 | 0 | 0 | 0 | 0.032 | 0.000064 | 0.037 |
| 32 | ACSM2B | acyl-CoA synthetase medium-chain family member 2B | 236928 | 32 | 24 | 27 | 7 | 26 | 2 | 0 | 1 | 3 | 0 | 0.008 | 0.000067 | 0.037 |
| 33 | LCE1B | late cornified envelope 1B | 49317 | 7 | 7 | 7 | 0 | 6 | 0 | 0 | 0 | 1 | 0 | 0.18 | 0.000068 | 0.037 |
| 34 | CA1 | carbonic anhydrase I | 96920 | 8 | 8 | 8 | 1 | 3 | 1 | 0 | 2 | 2 | 0 | 0.21 | 0.000078 | 0.041 |
| 35 | CLEC4E | C-type lectin domain family 4, member E | 93708 | 12 | 10 | 11 | 2 | 8 | 0 | 3 | 0 | 1 | 0 | 0.092 | 0.000089 | 0.046 |
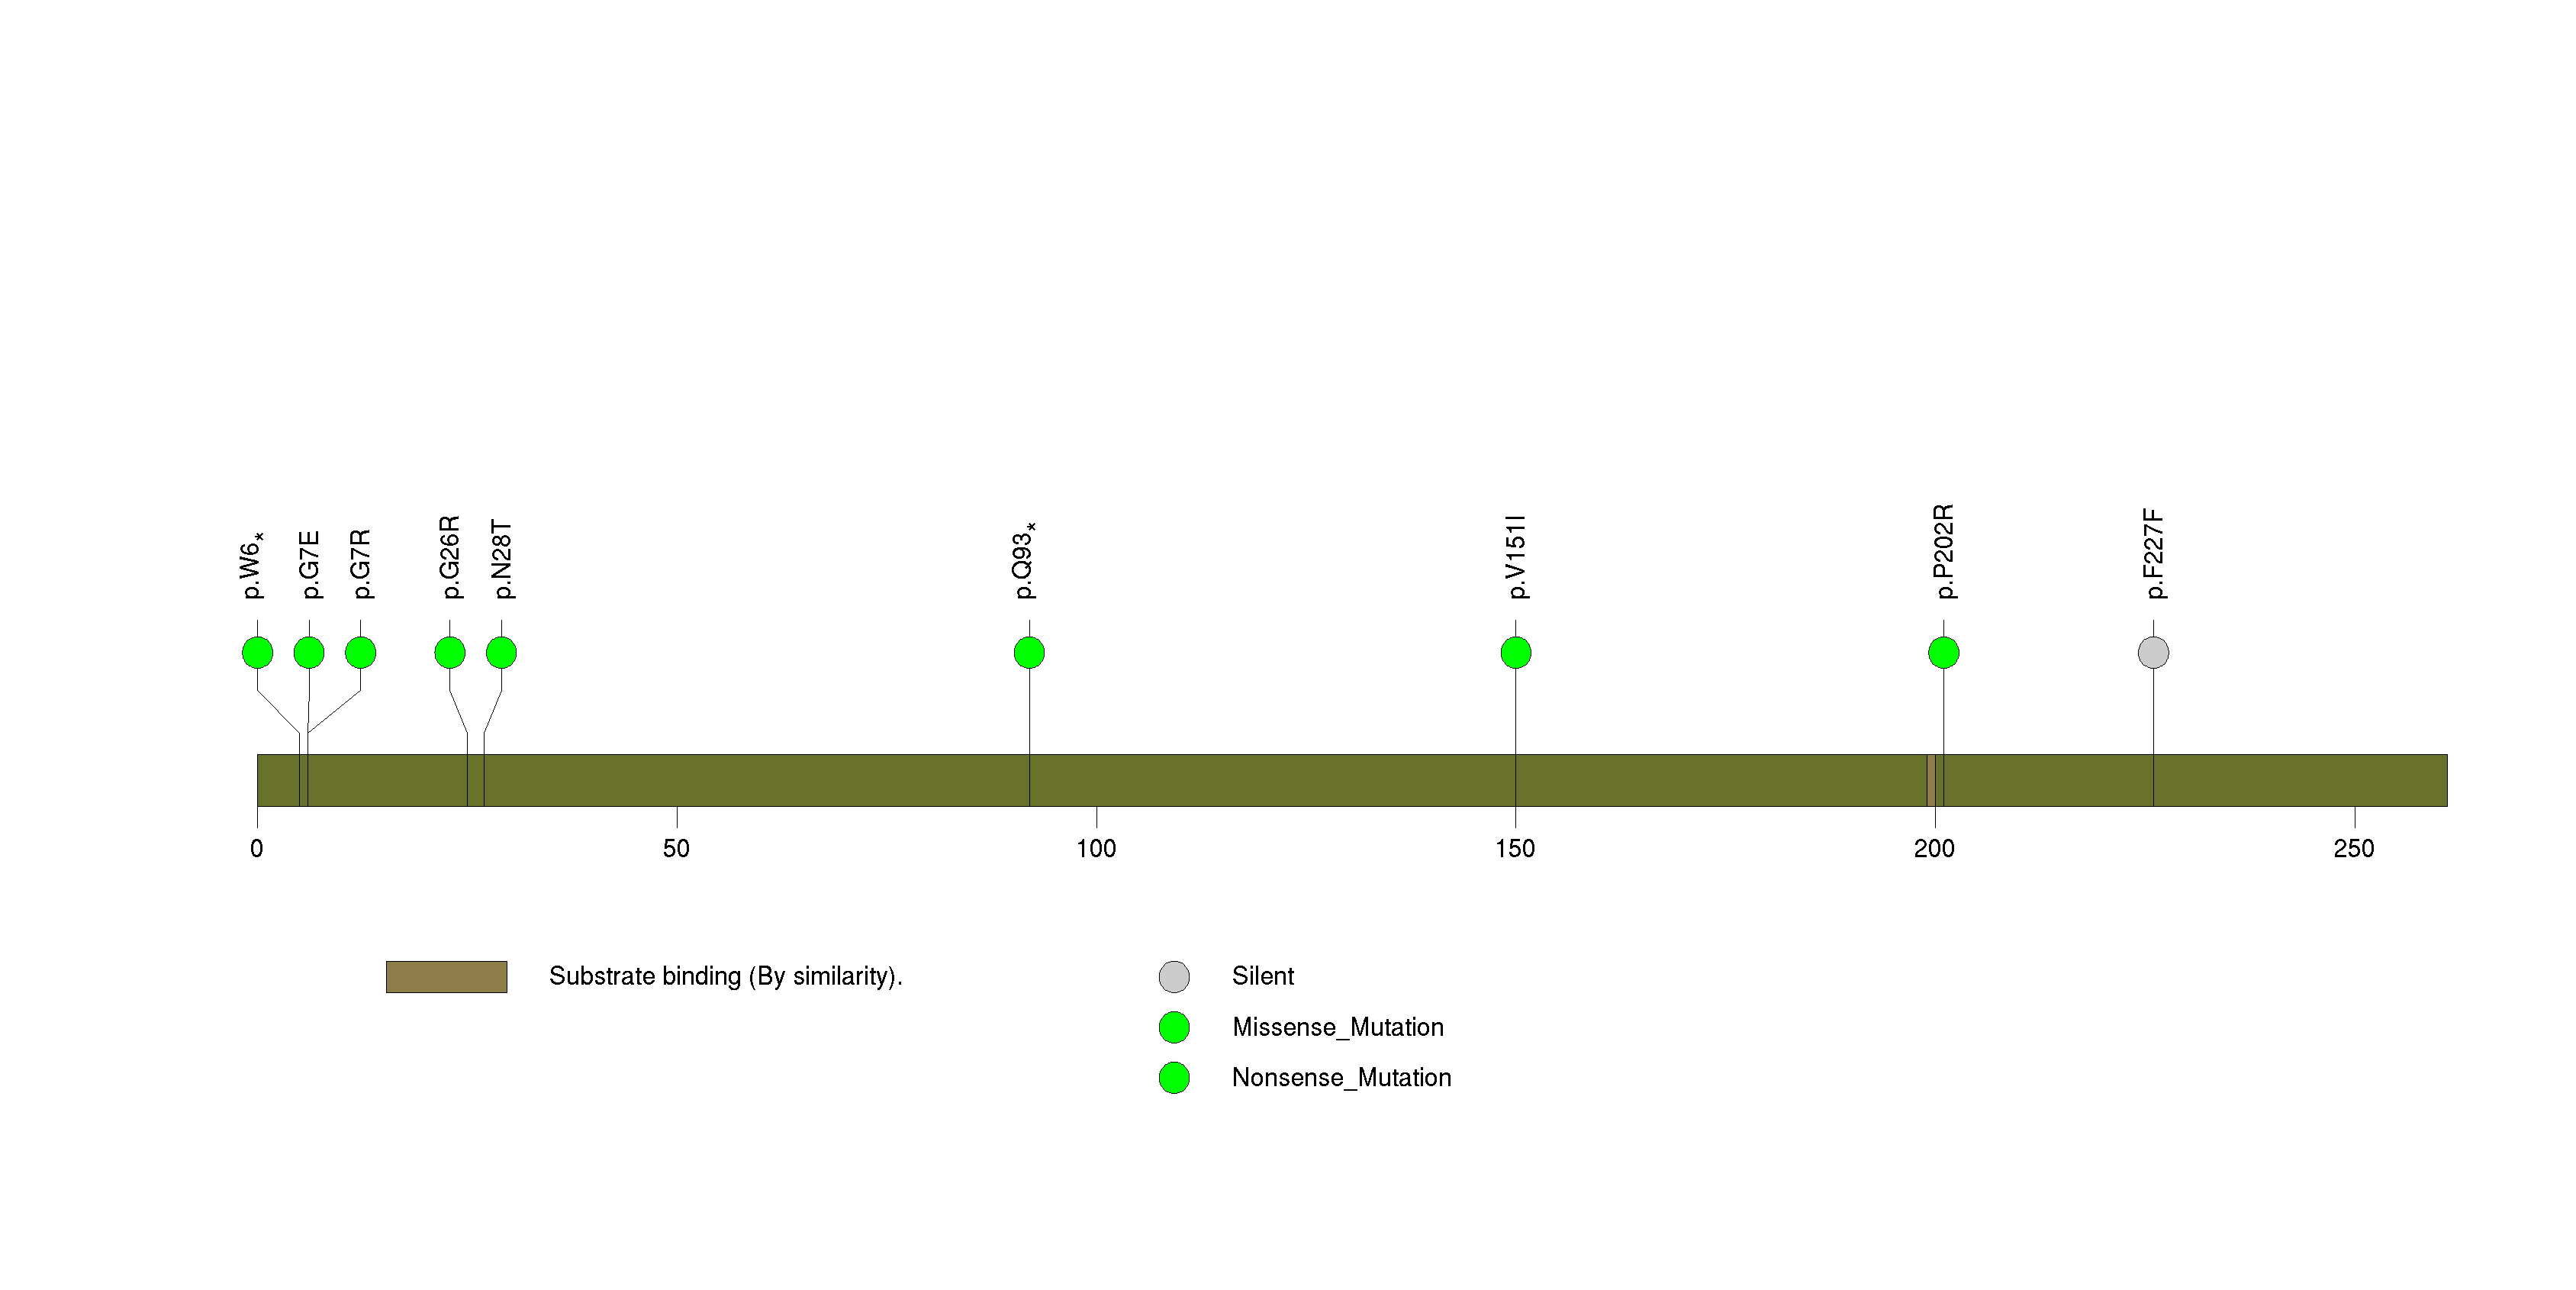
Figure S1. This figure depicts the distribution of mutations and mutation types across the CDKN2A significant gene.
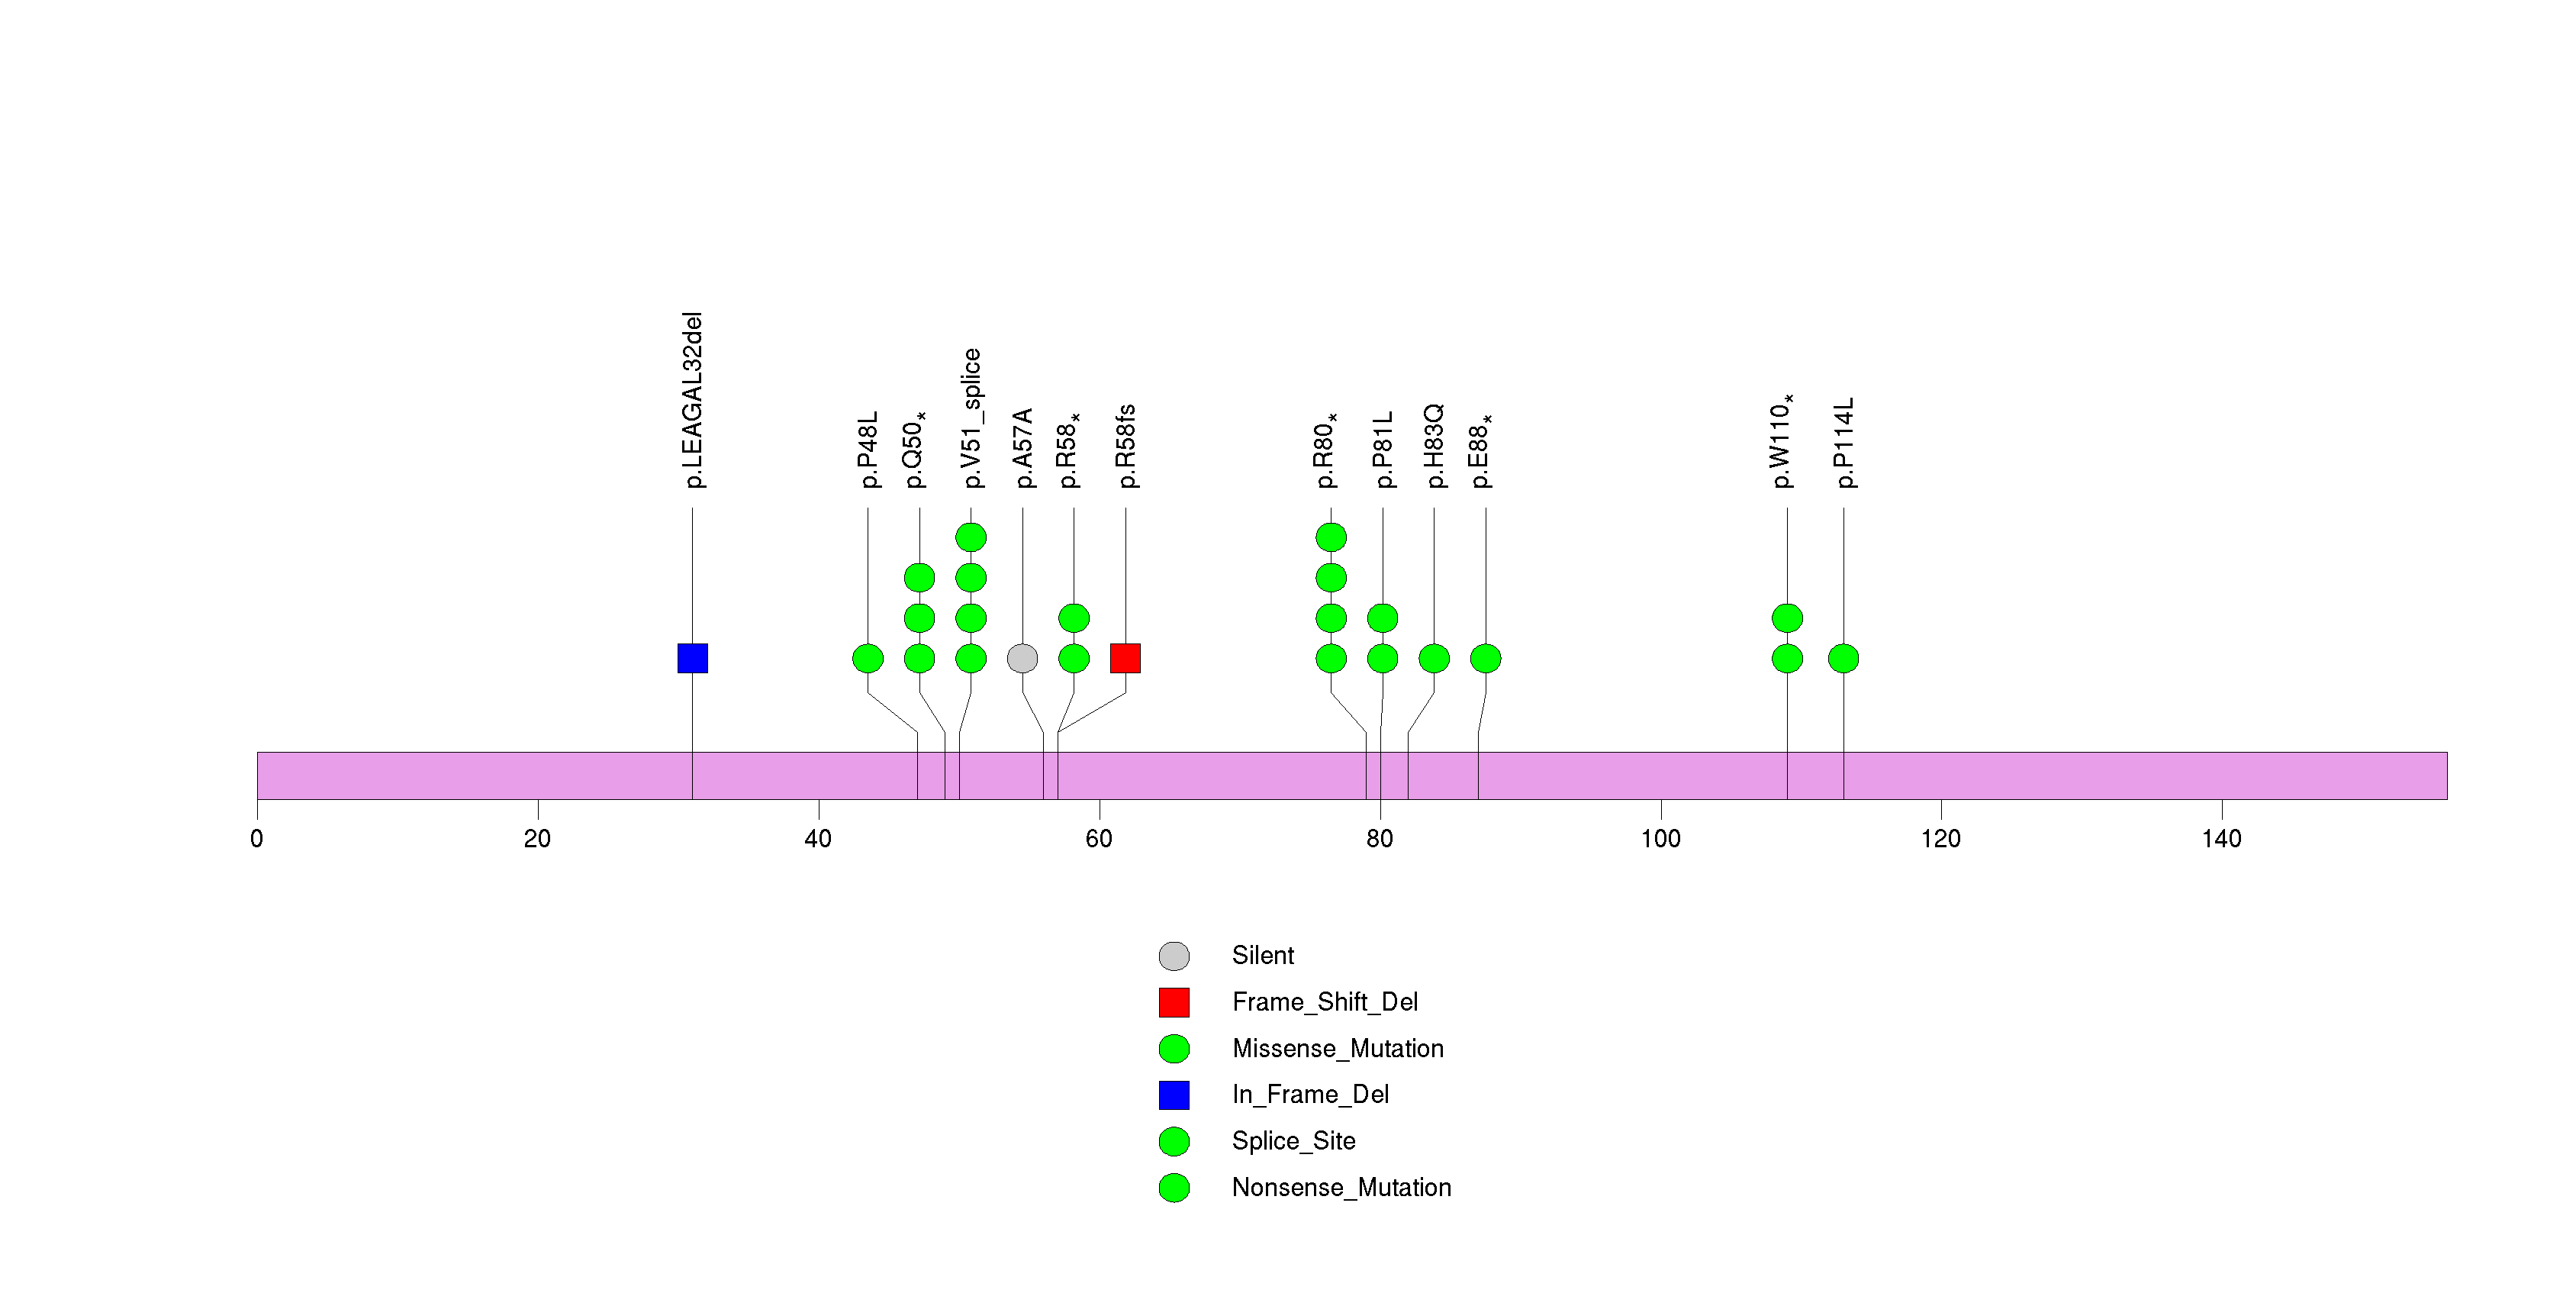
Figure S2. This figure depicts the distribution of mutations and mutation types across the NRAS significant gene.
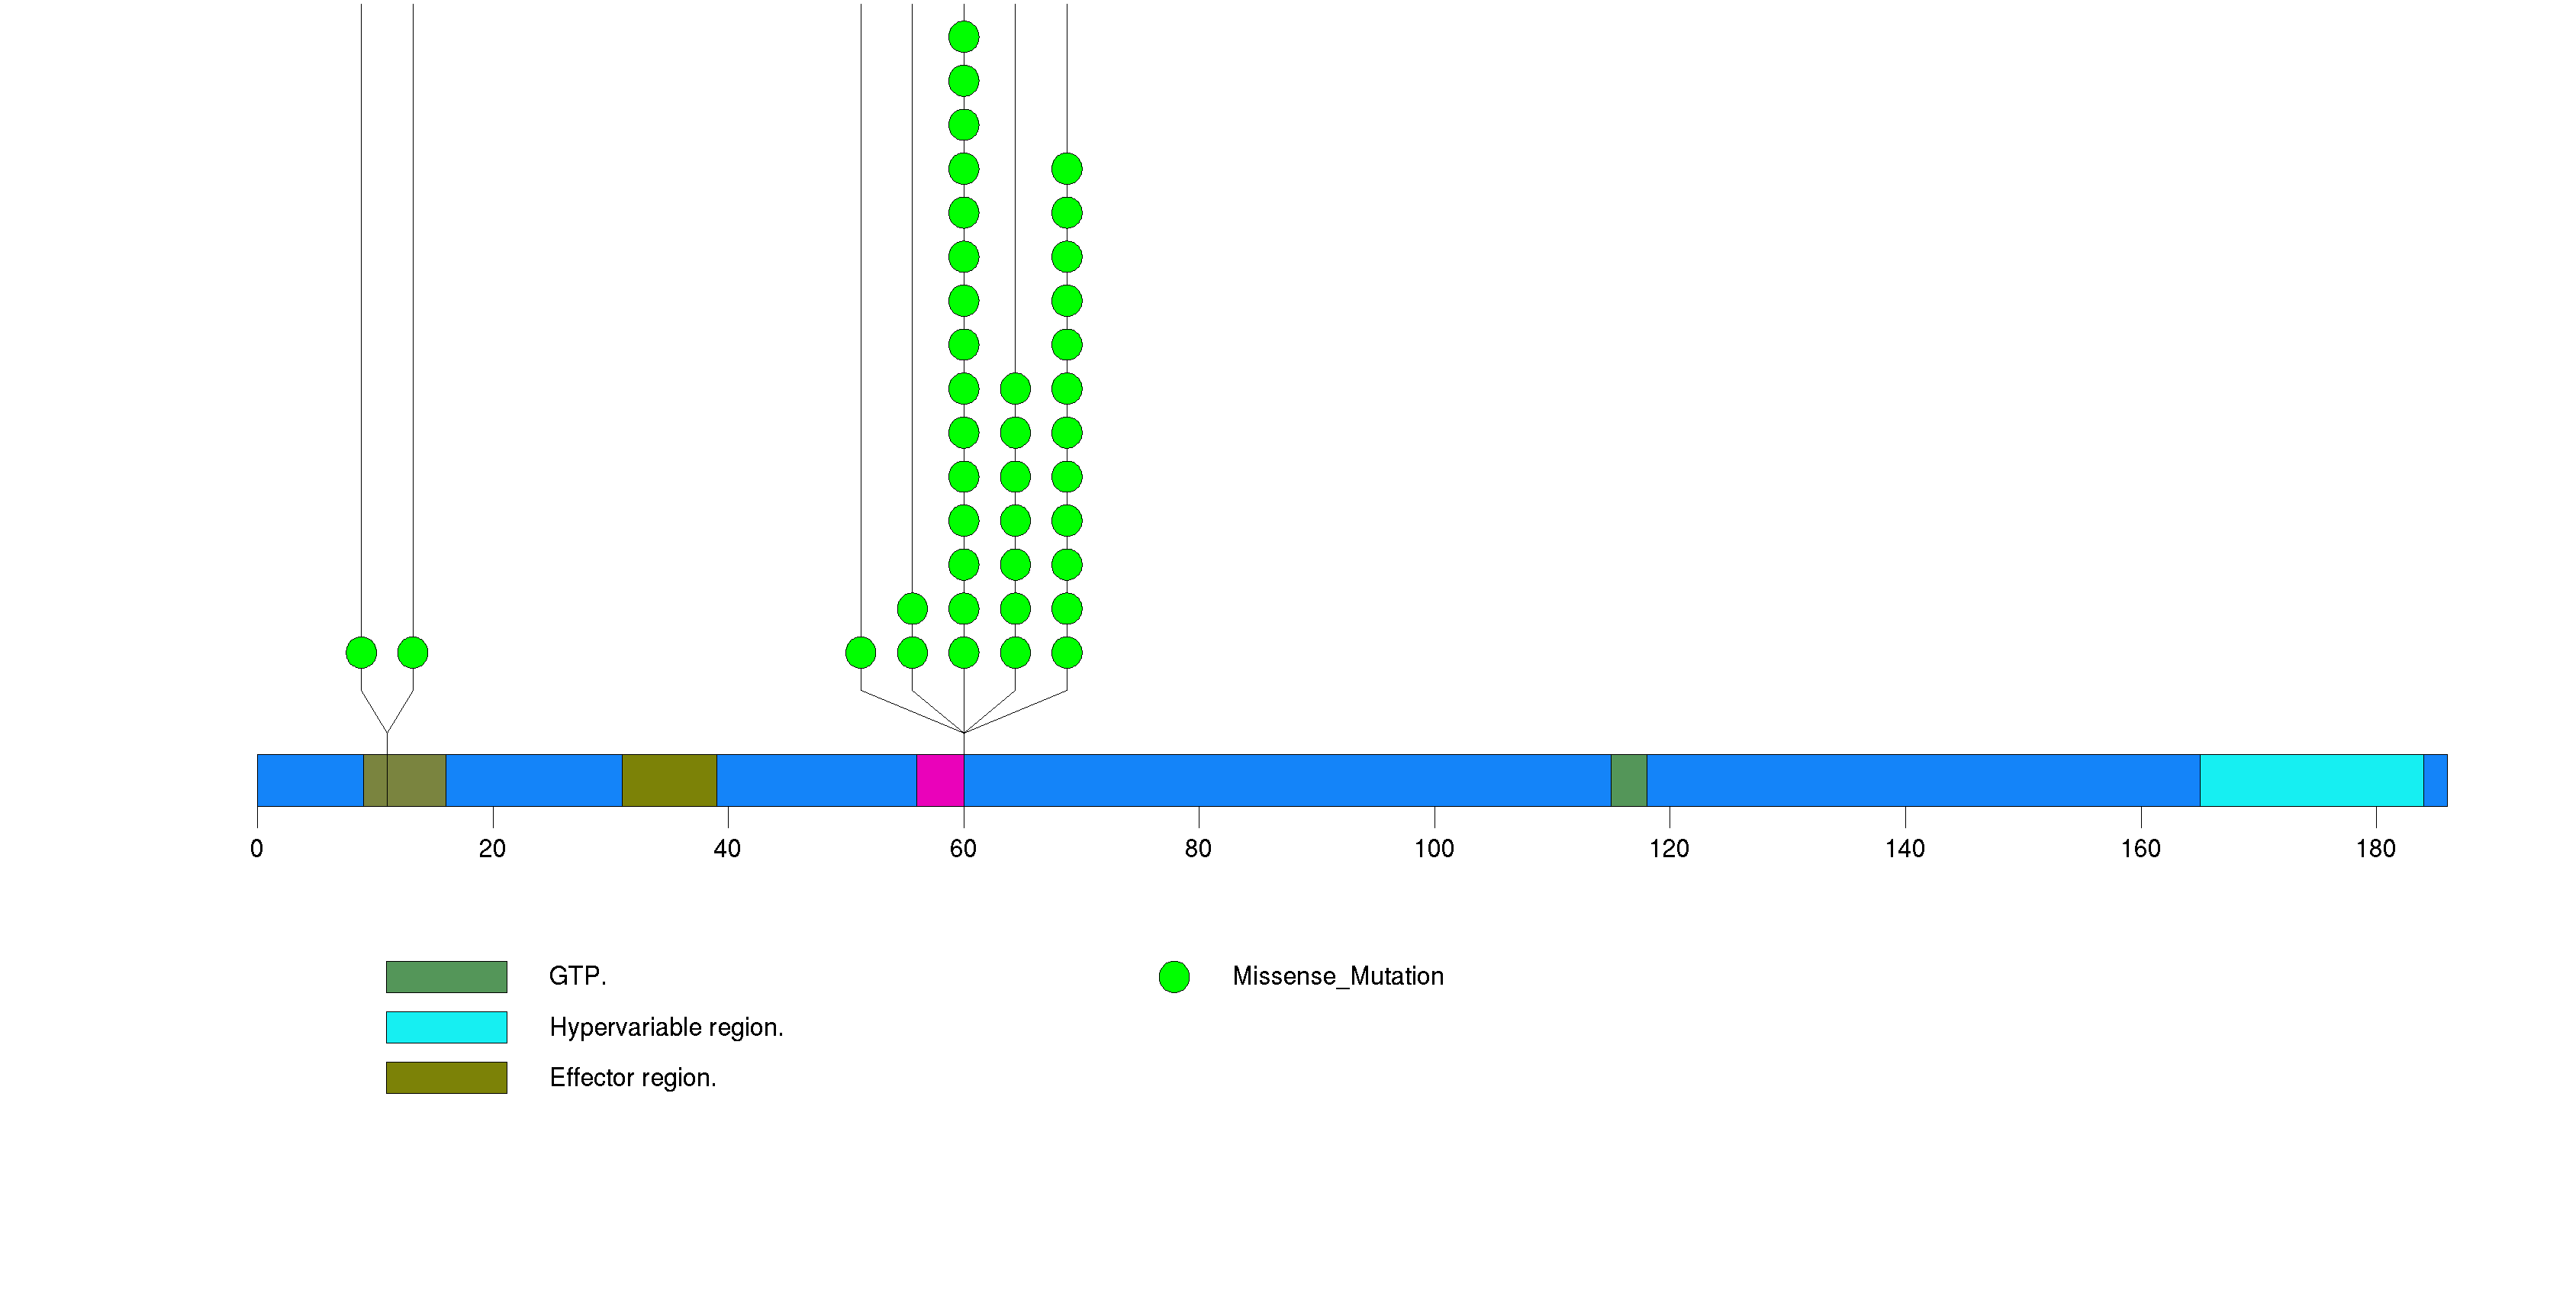
Figure S3. This figure depicts the distribution of mutations and mutation types across the BRAF significant gene.
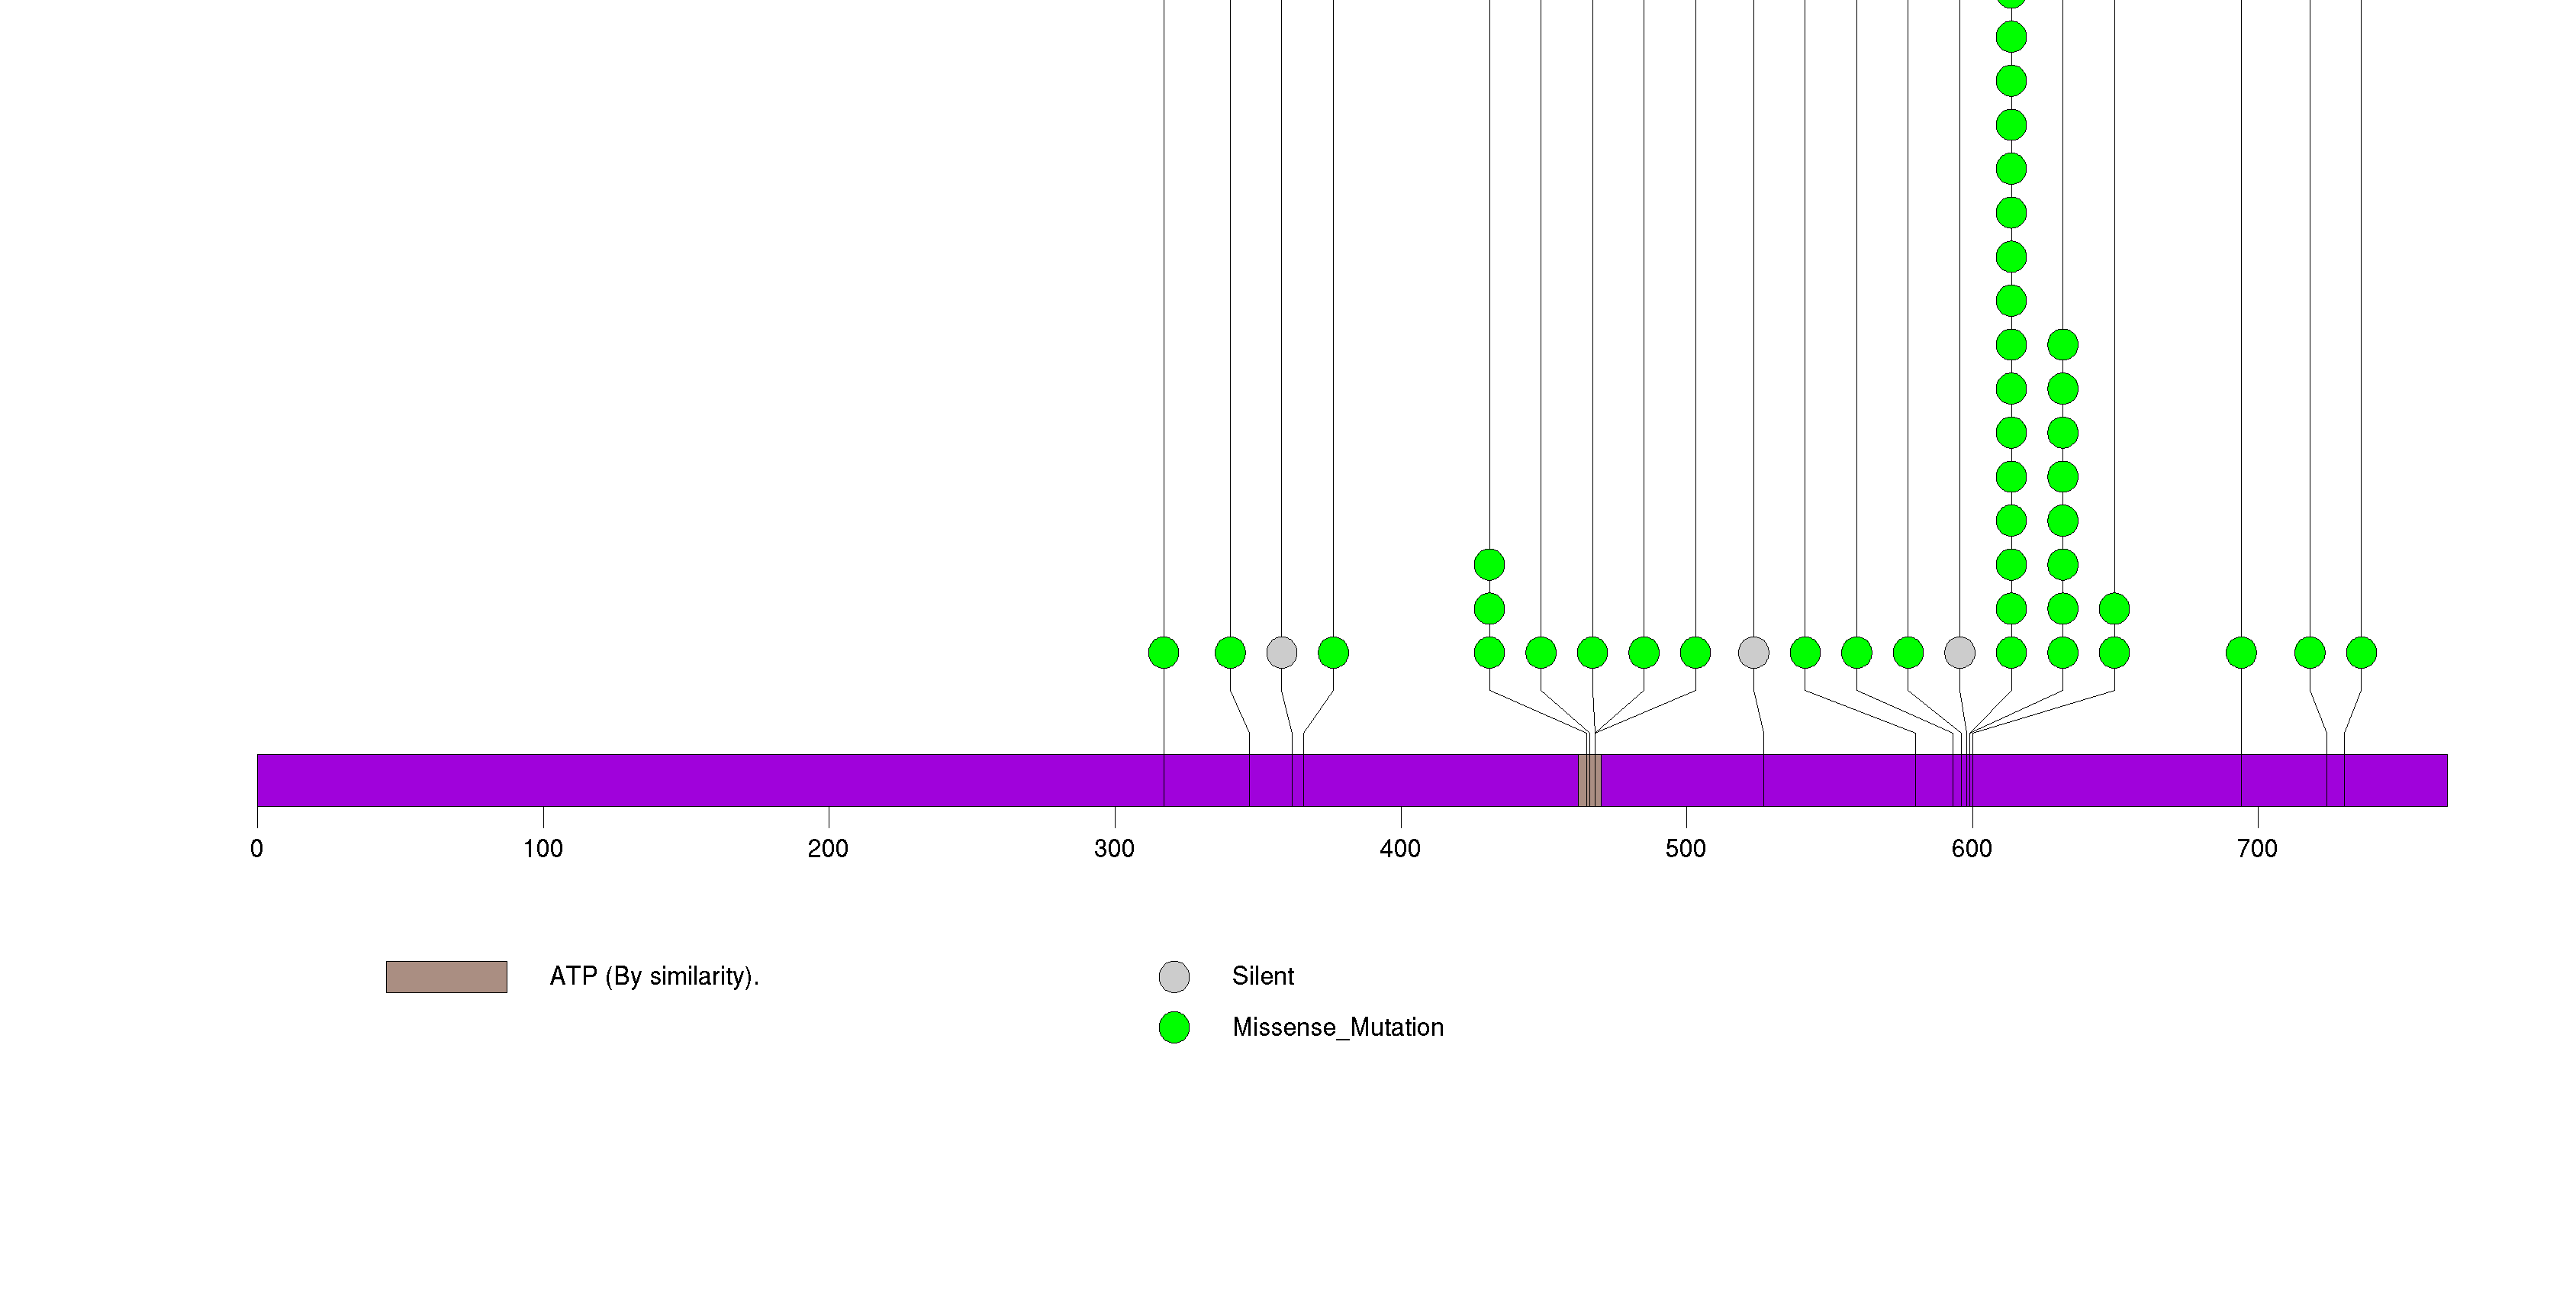
Figure S4. This figure depicts the distribution of mutations and mutation types across the TP53 significant gene.
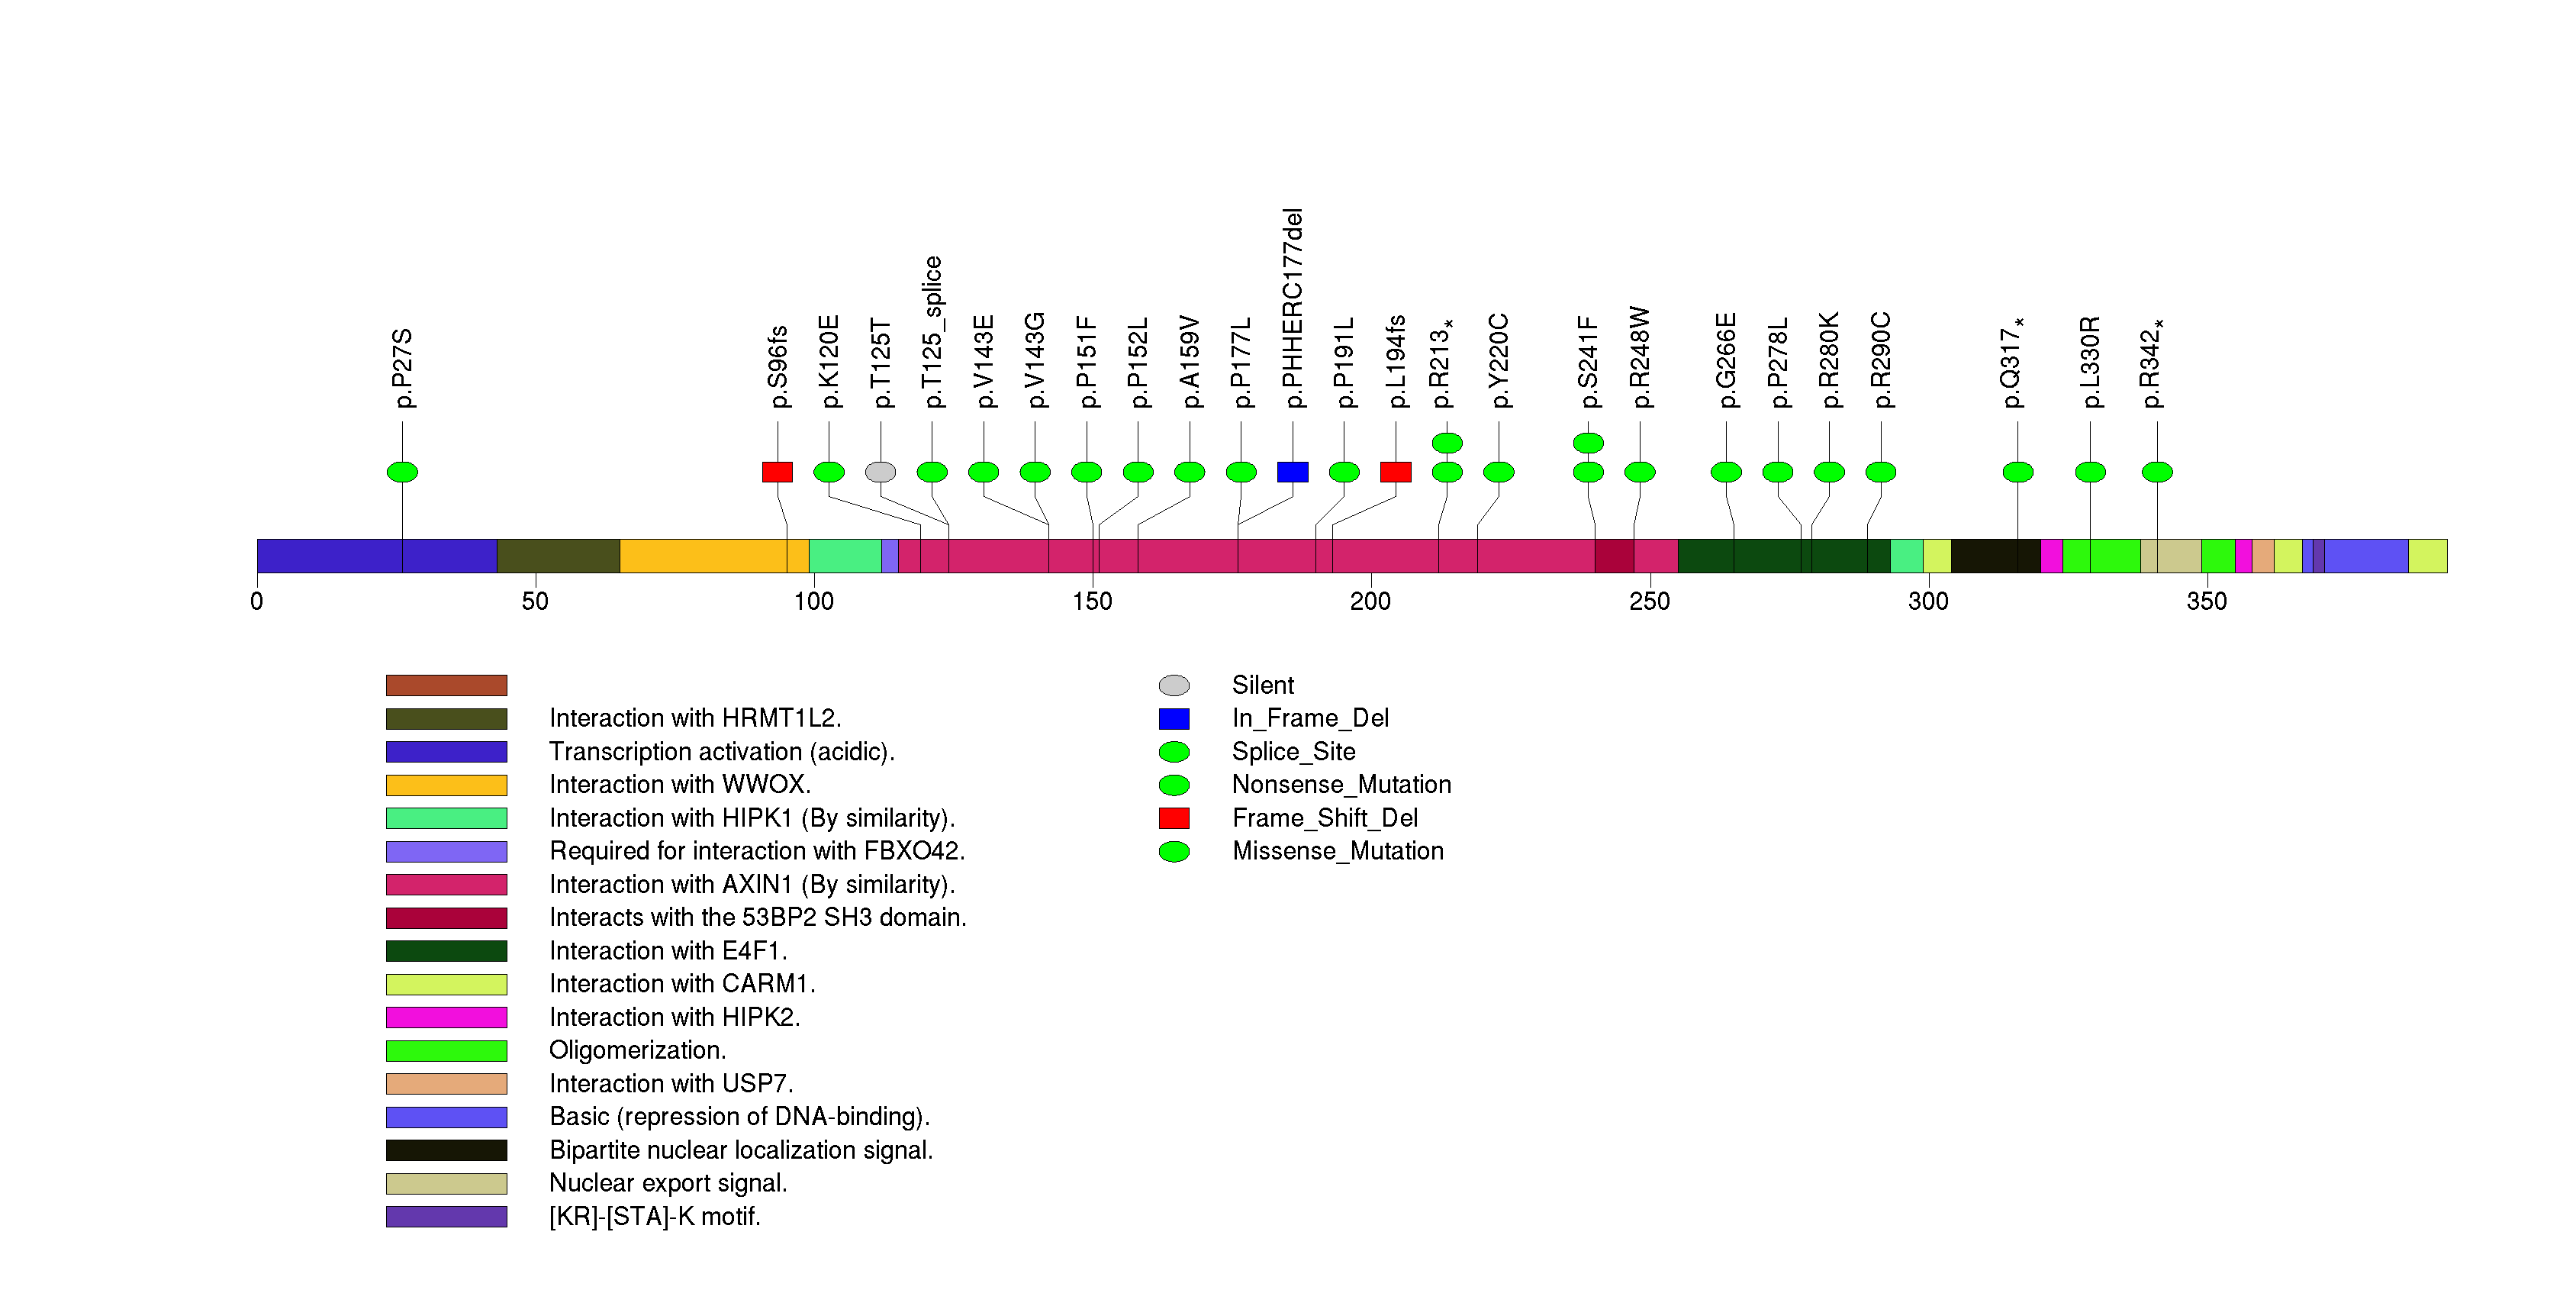
Figure S5. This figure depicts the distribution of mutations and mutation types across the PTEN significant gene.
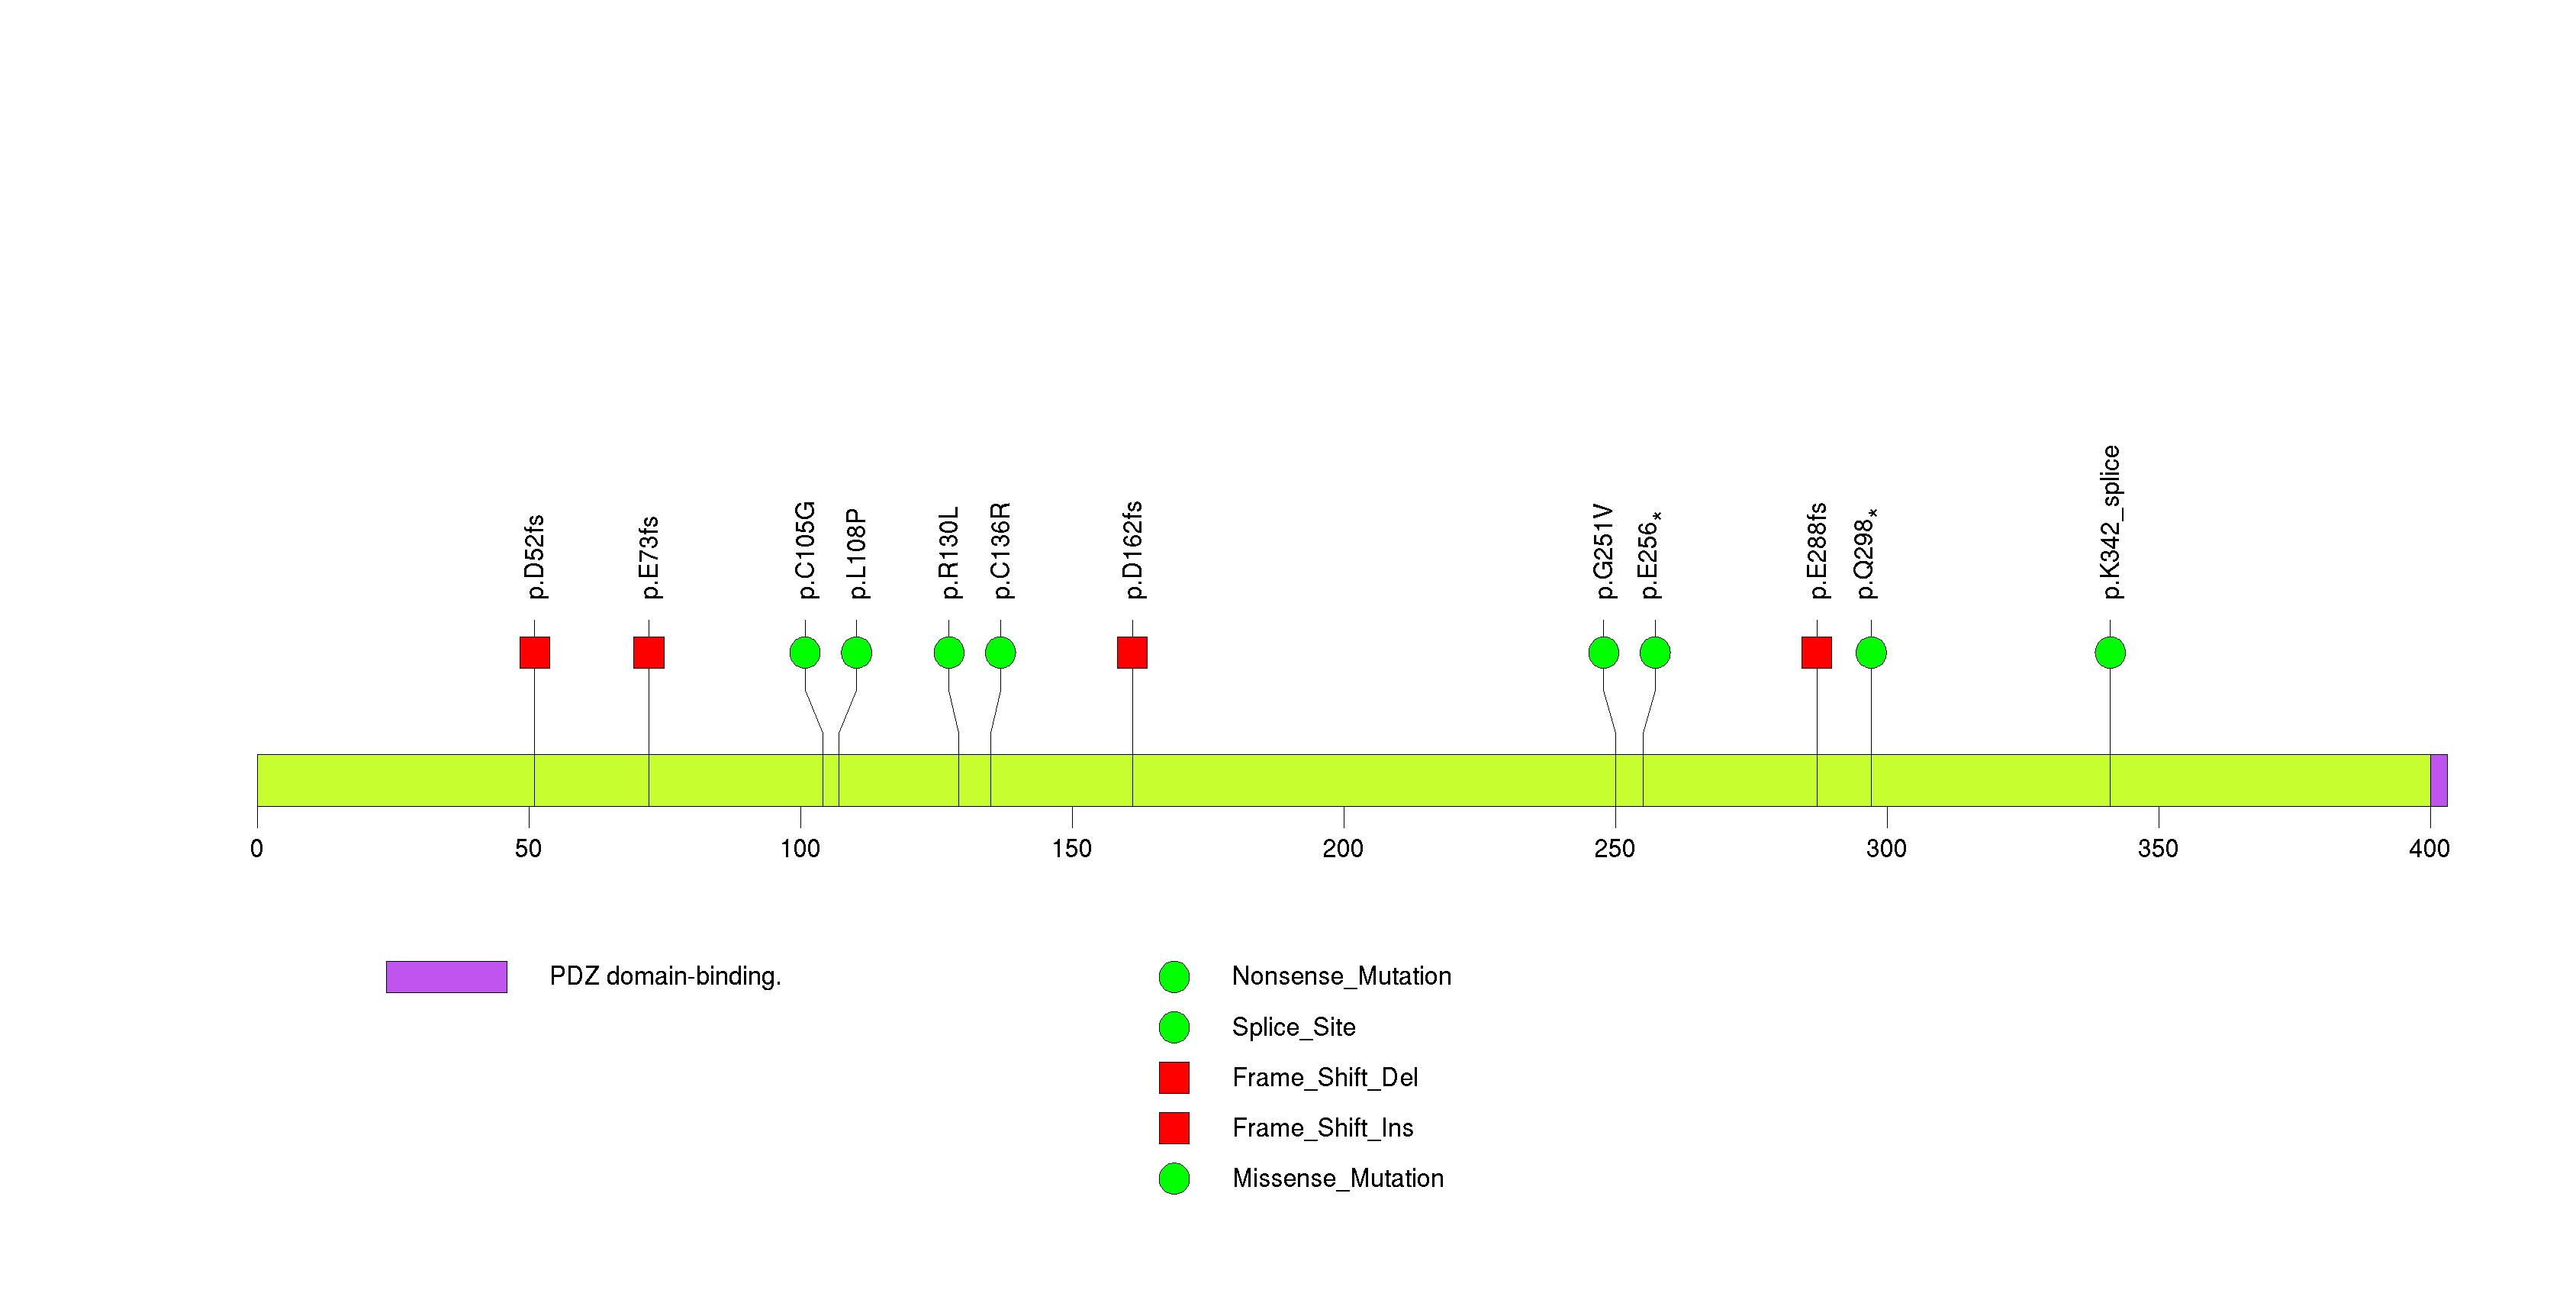
Figure S6. This figure depicts the distribution of mutations and mutation types across the PPP6C significant gene.
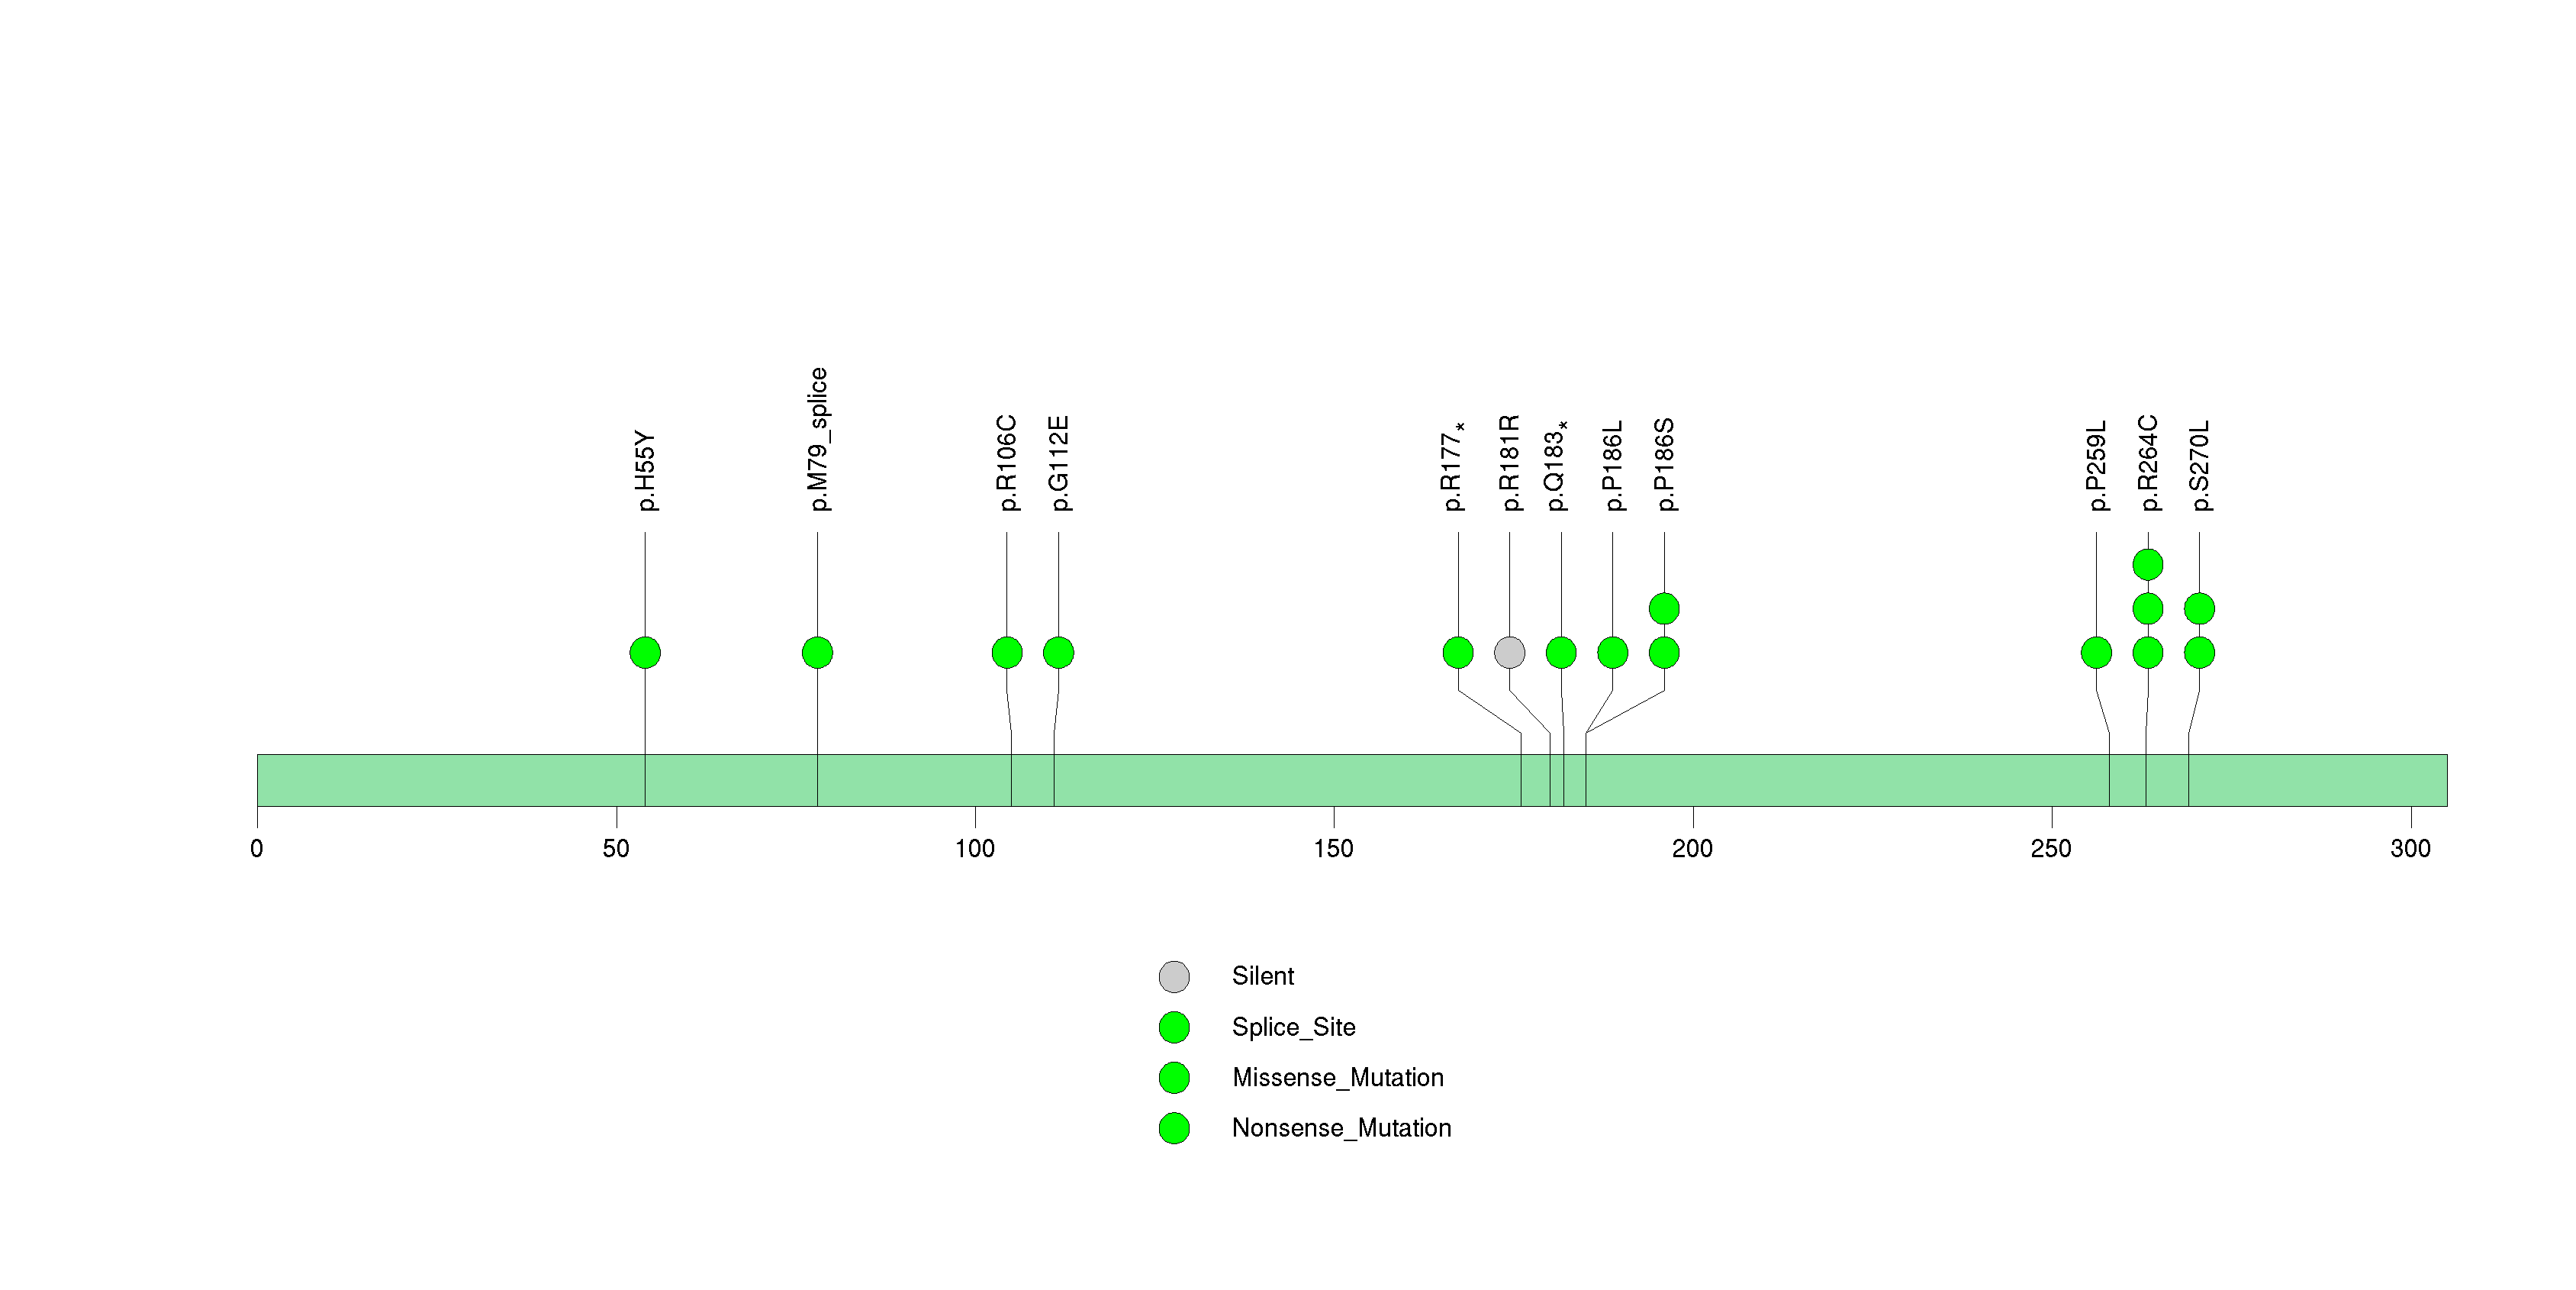
Figure S7. This figure depicts the distribution of mutations and mutation types across the CDH9 significant gene.
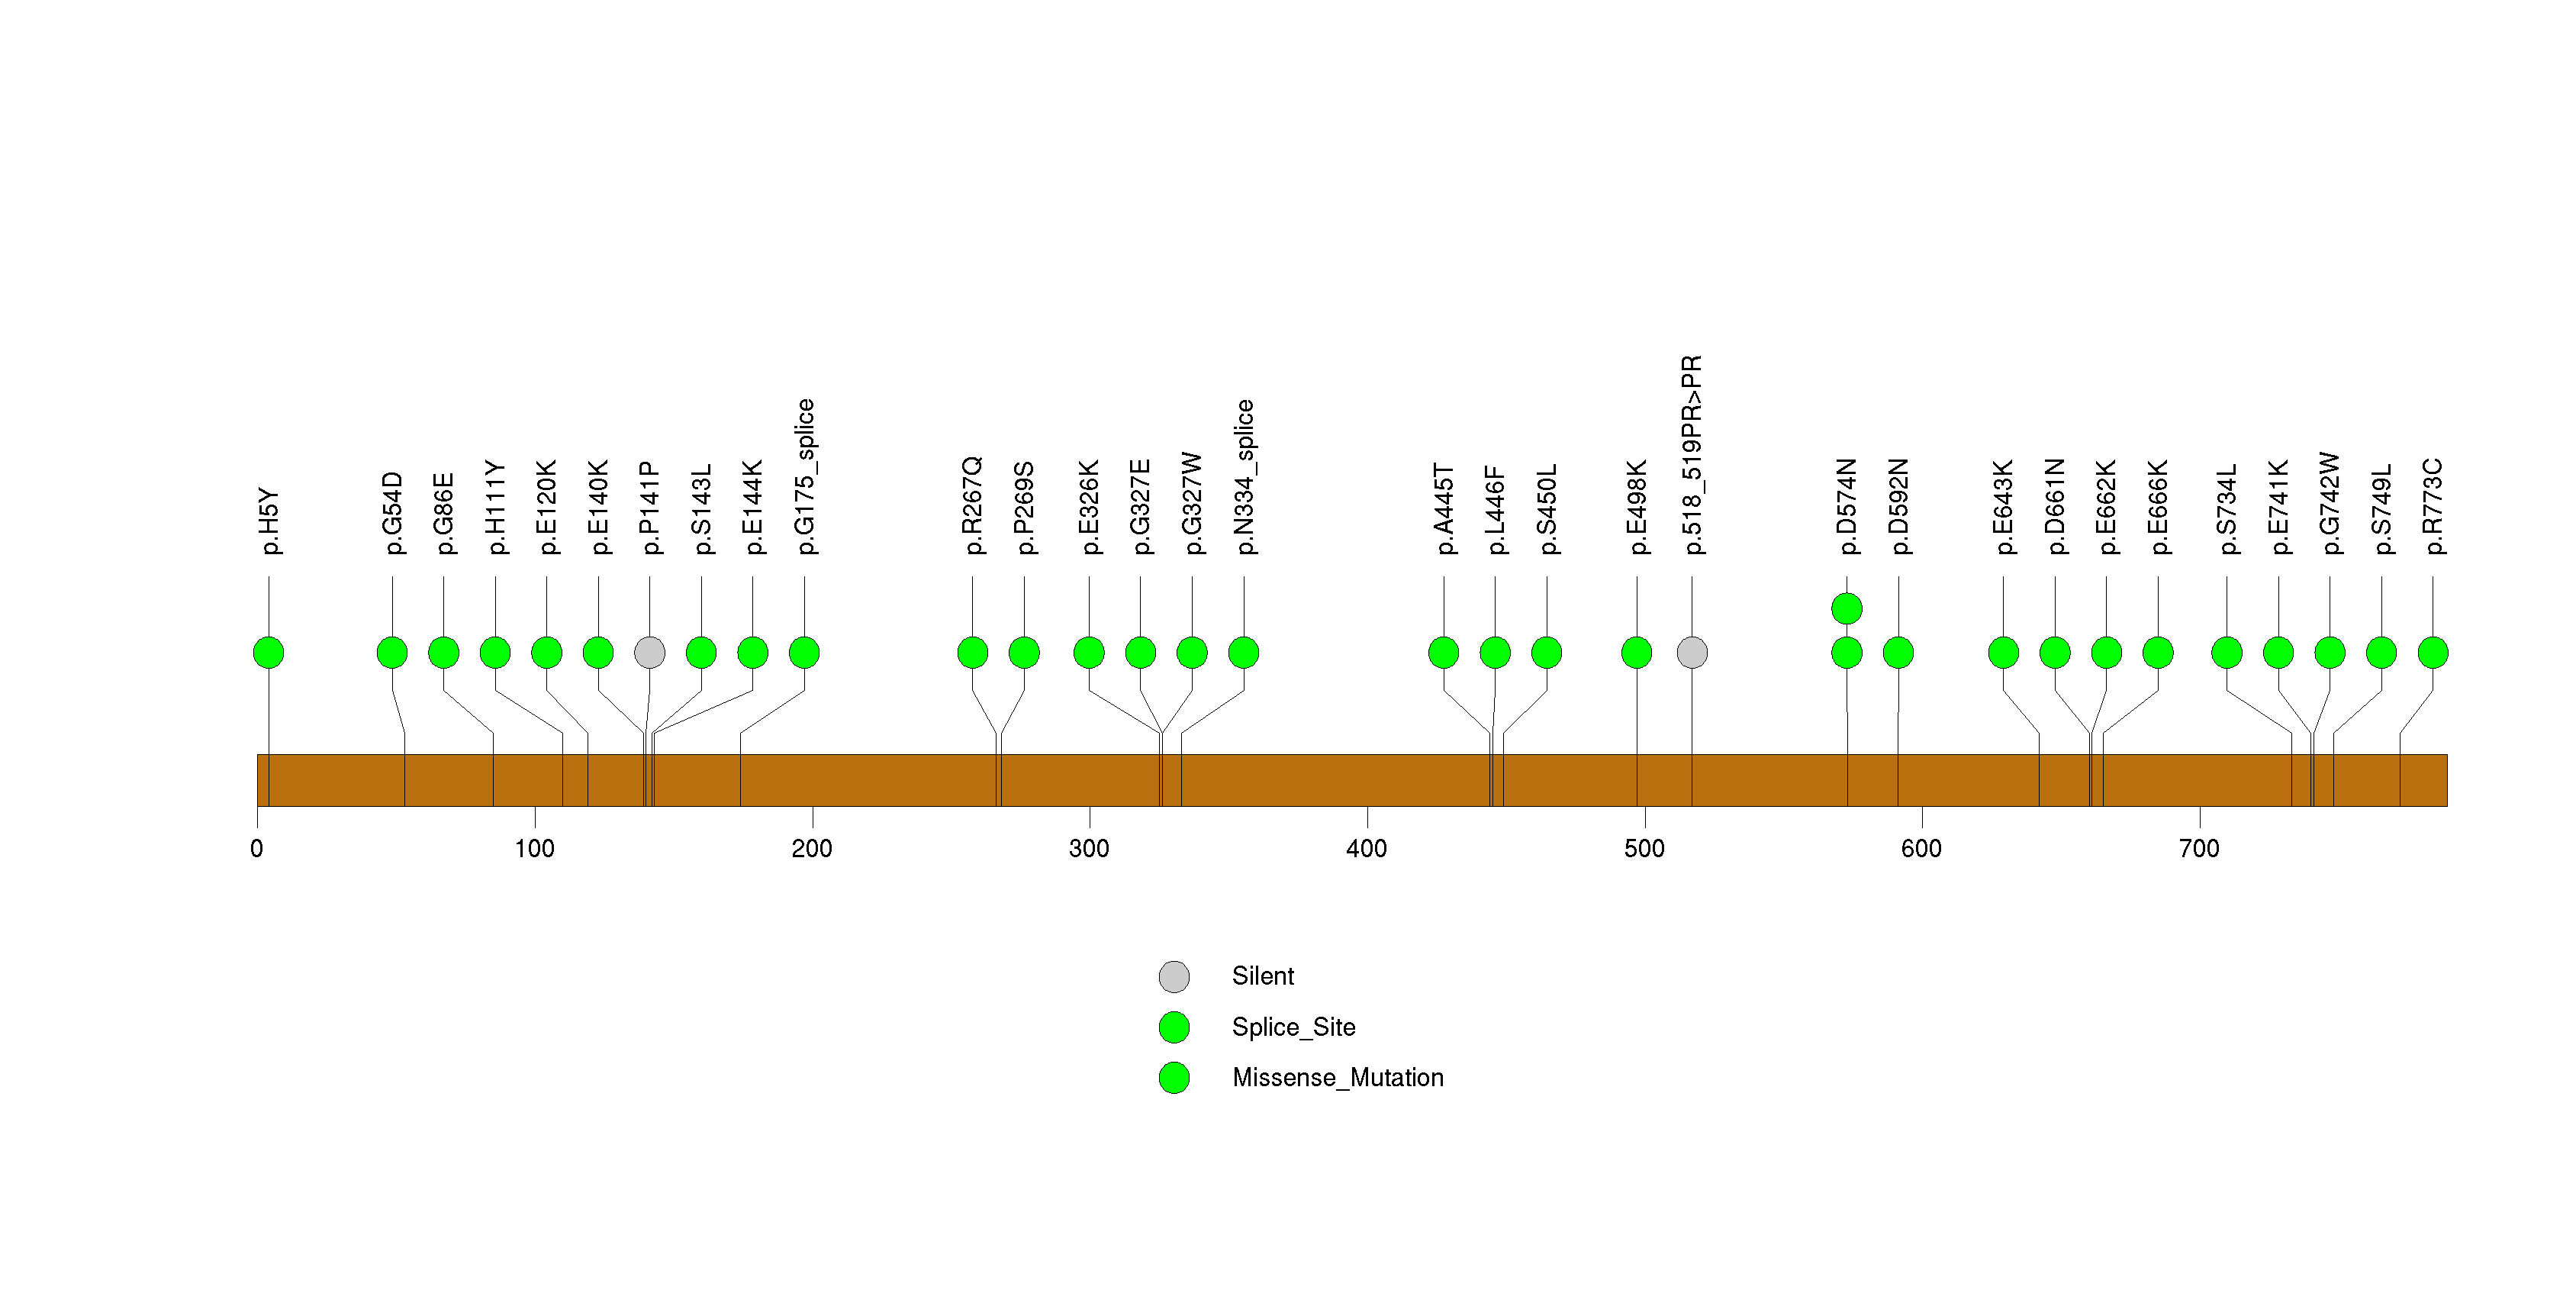
Figure S8. This figure depicts the distribution of mutations and mutation types across the ADH1C significant gene.
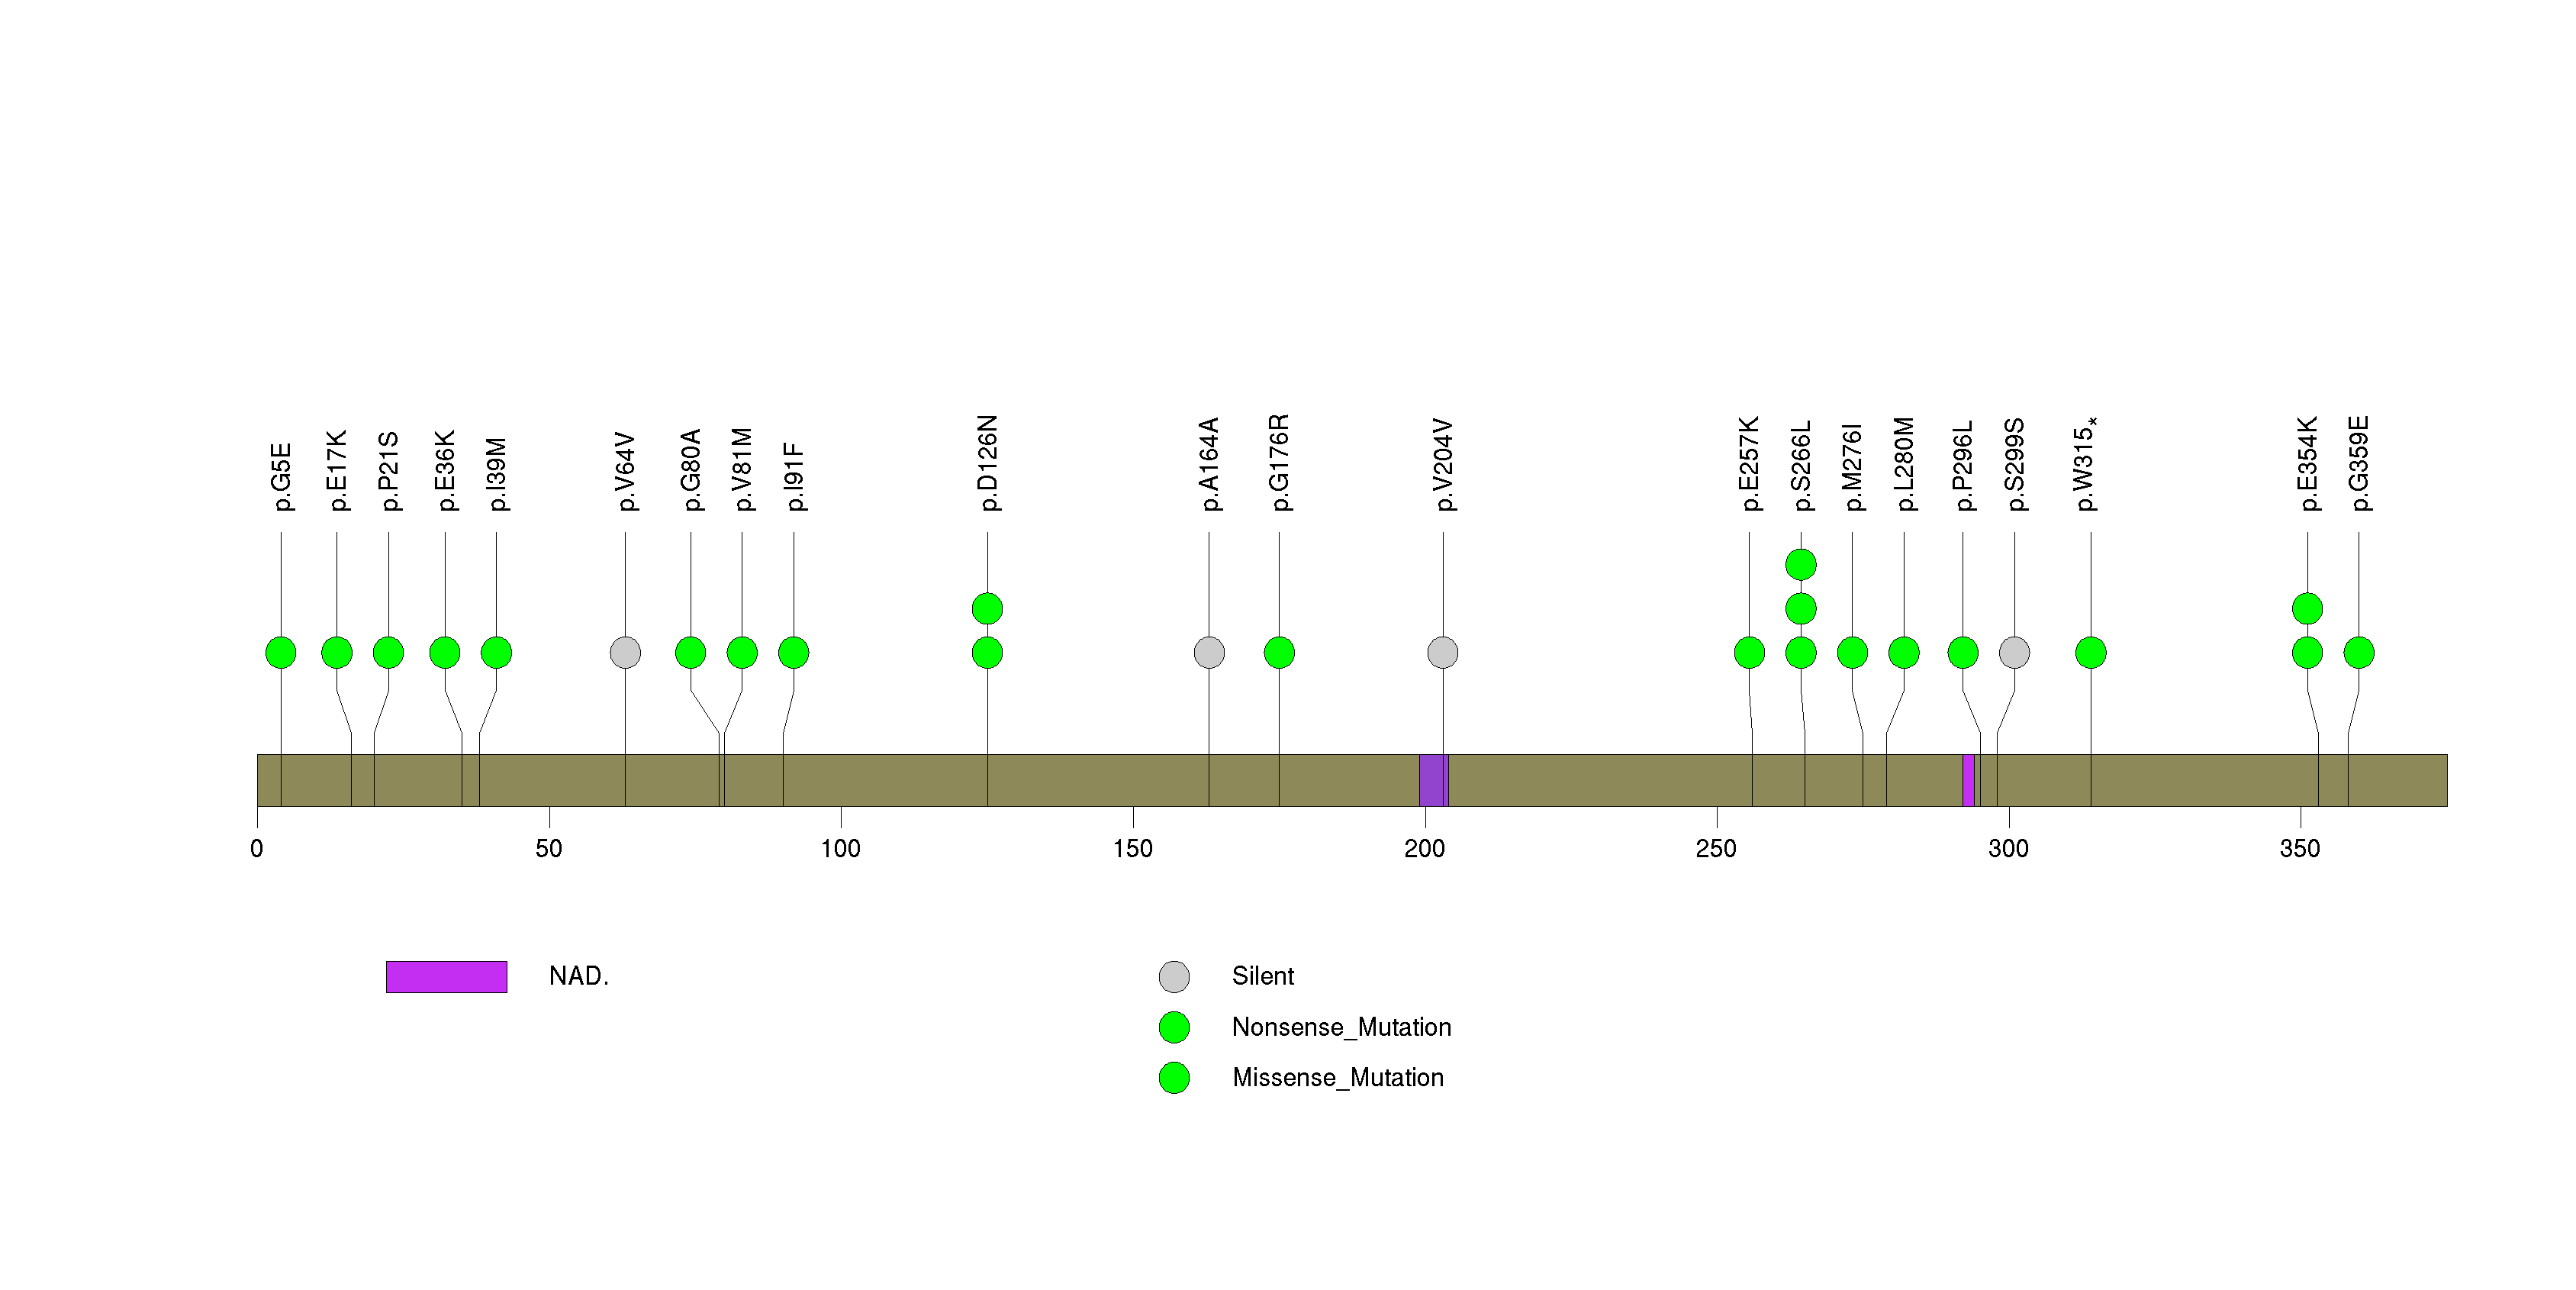
Figure S9. This figure depicts the distribution of mutations and mutation types across the PRB4 significant gene.
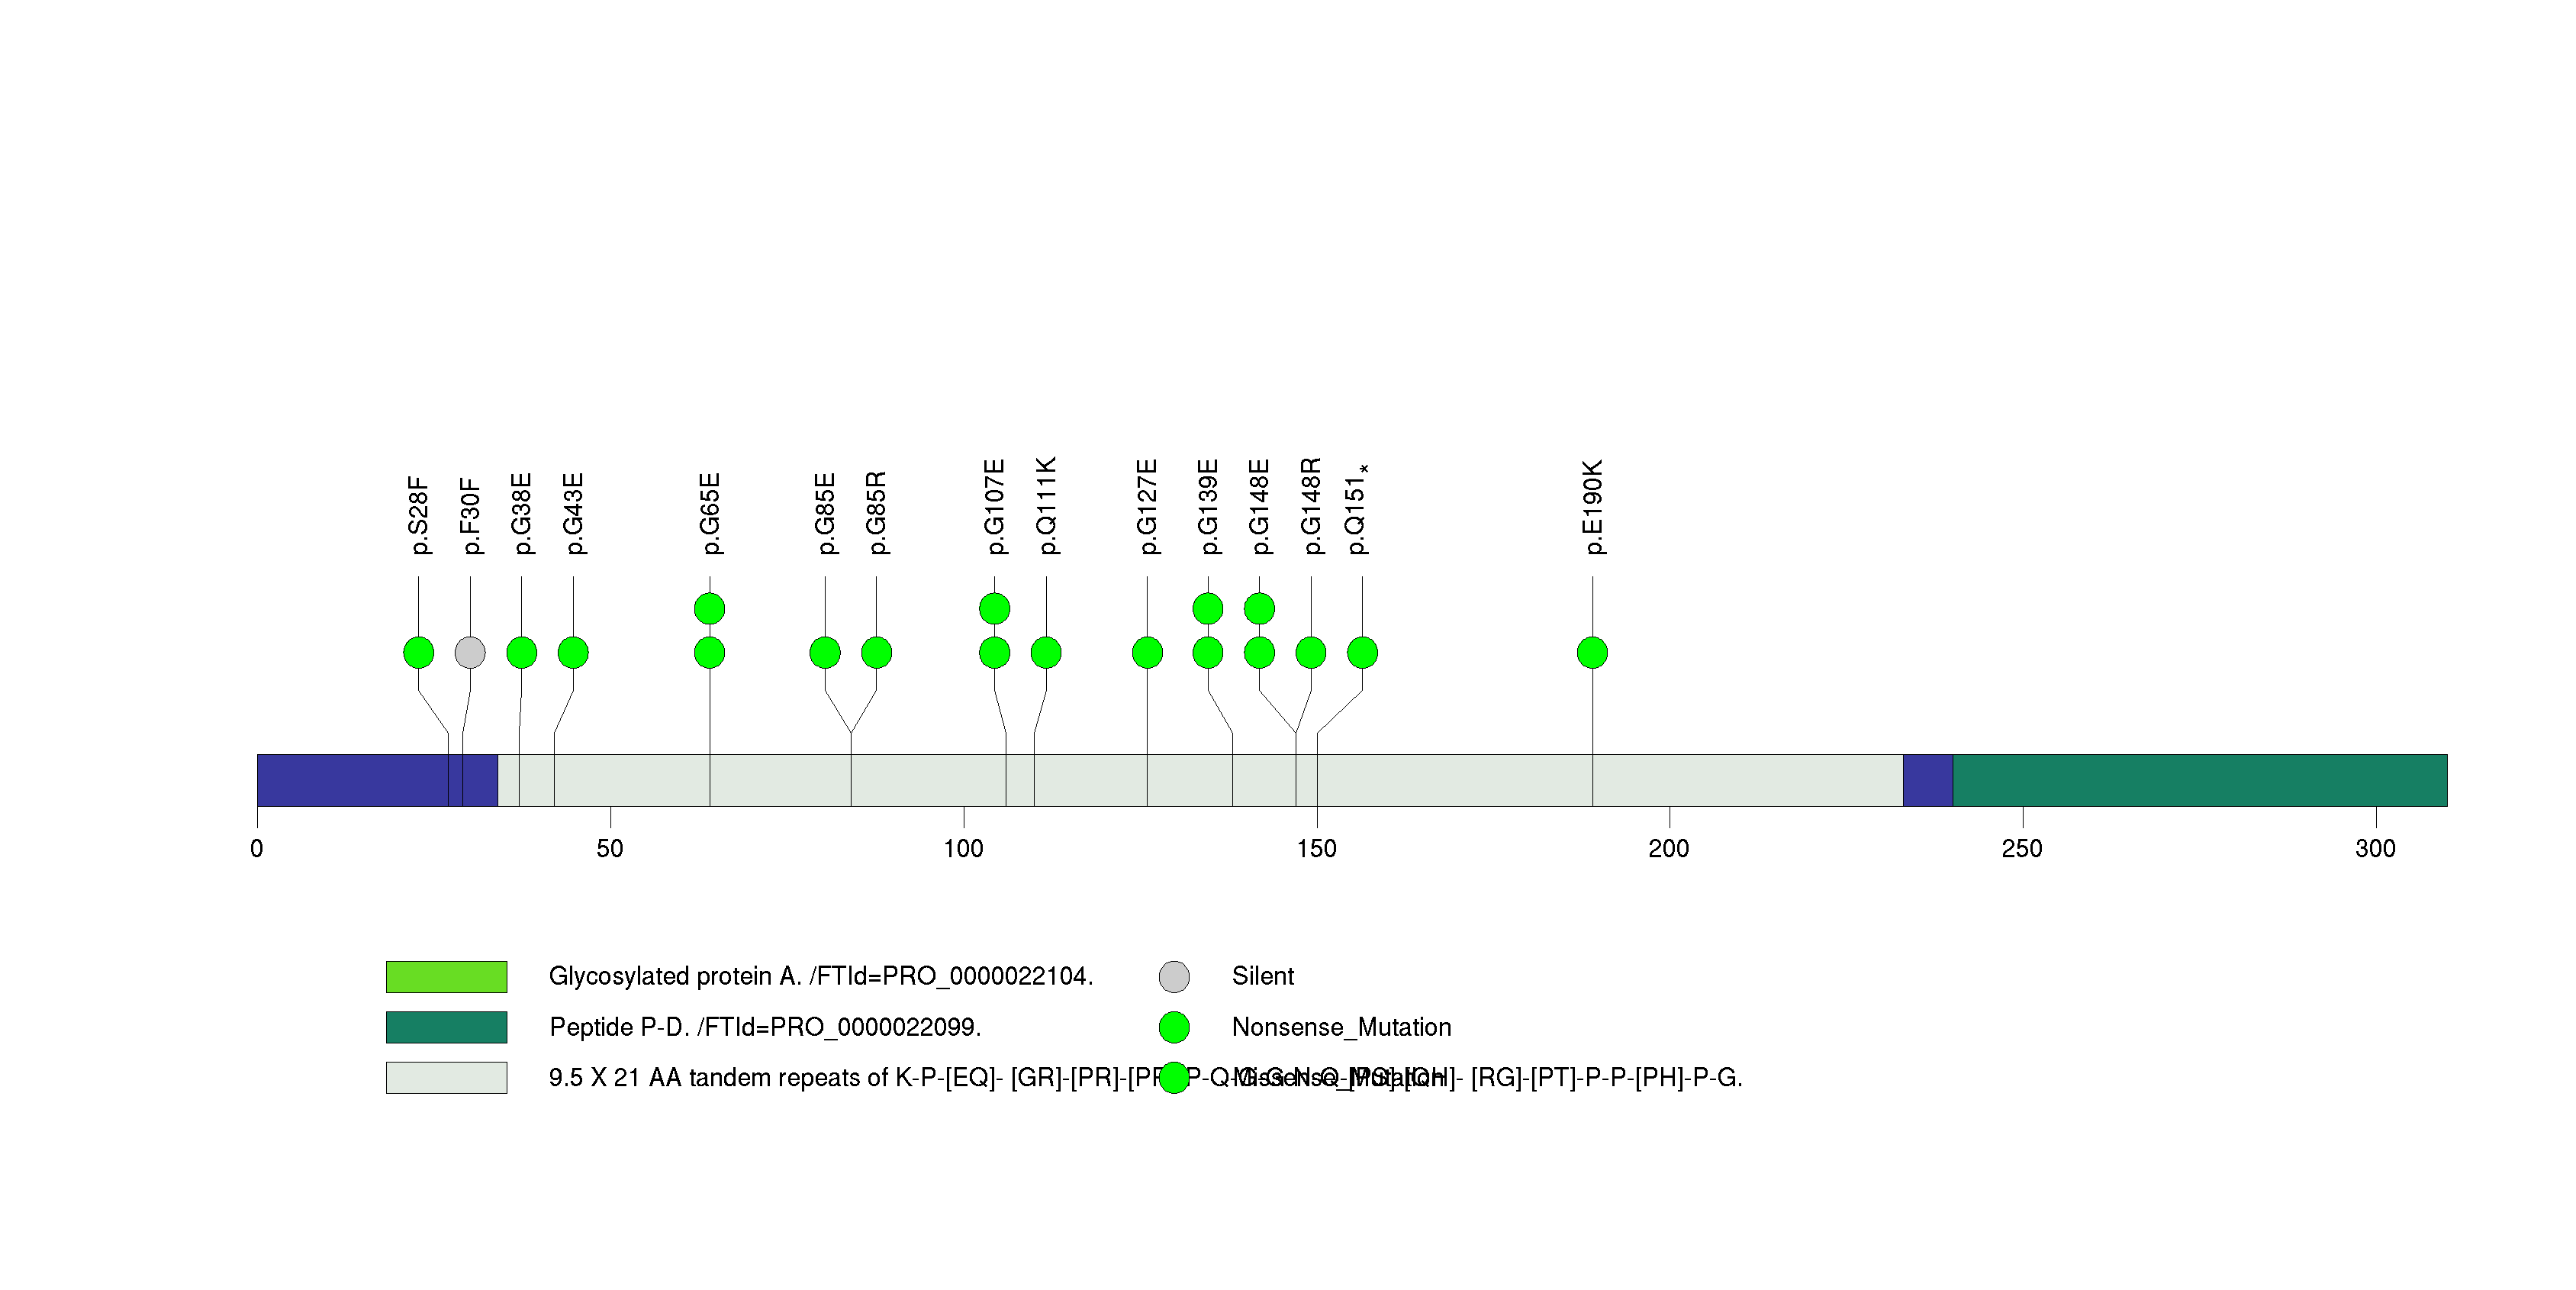
Figure S10. This figure depicts the distribution of mutations and mutation types across the DDX3X significant gene.
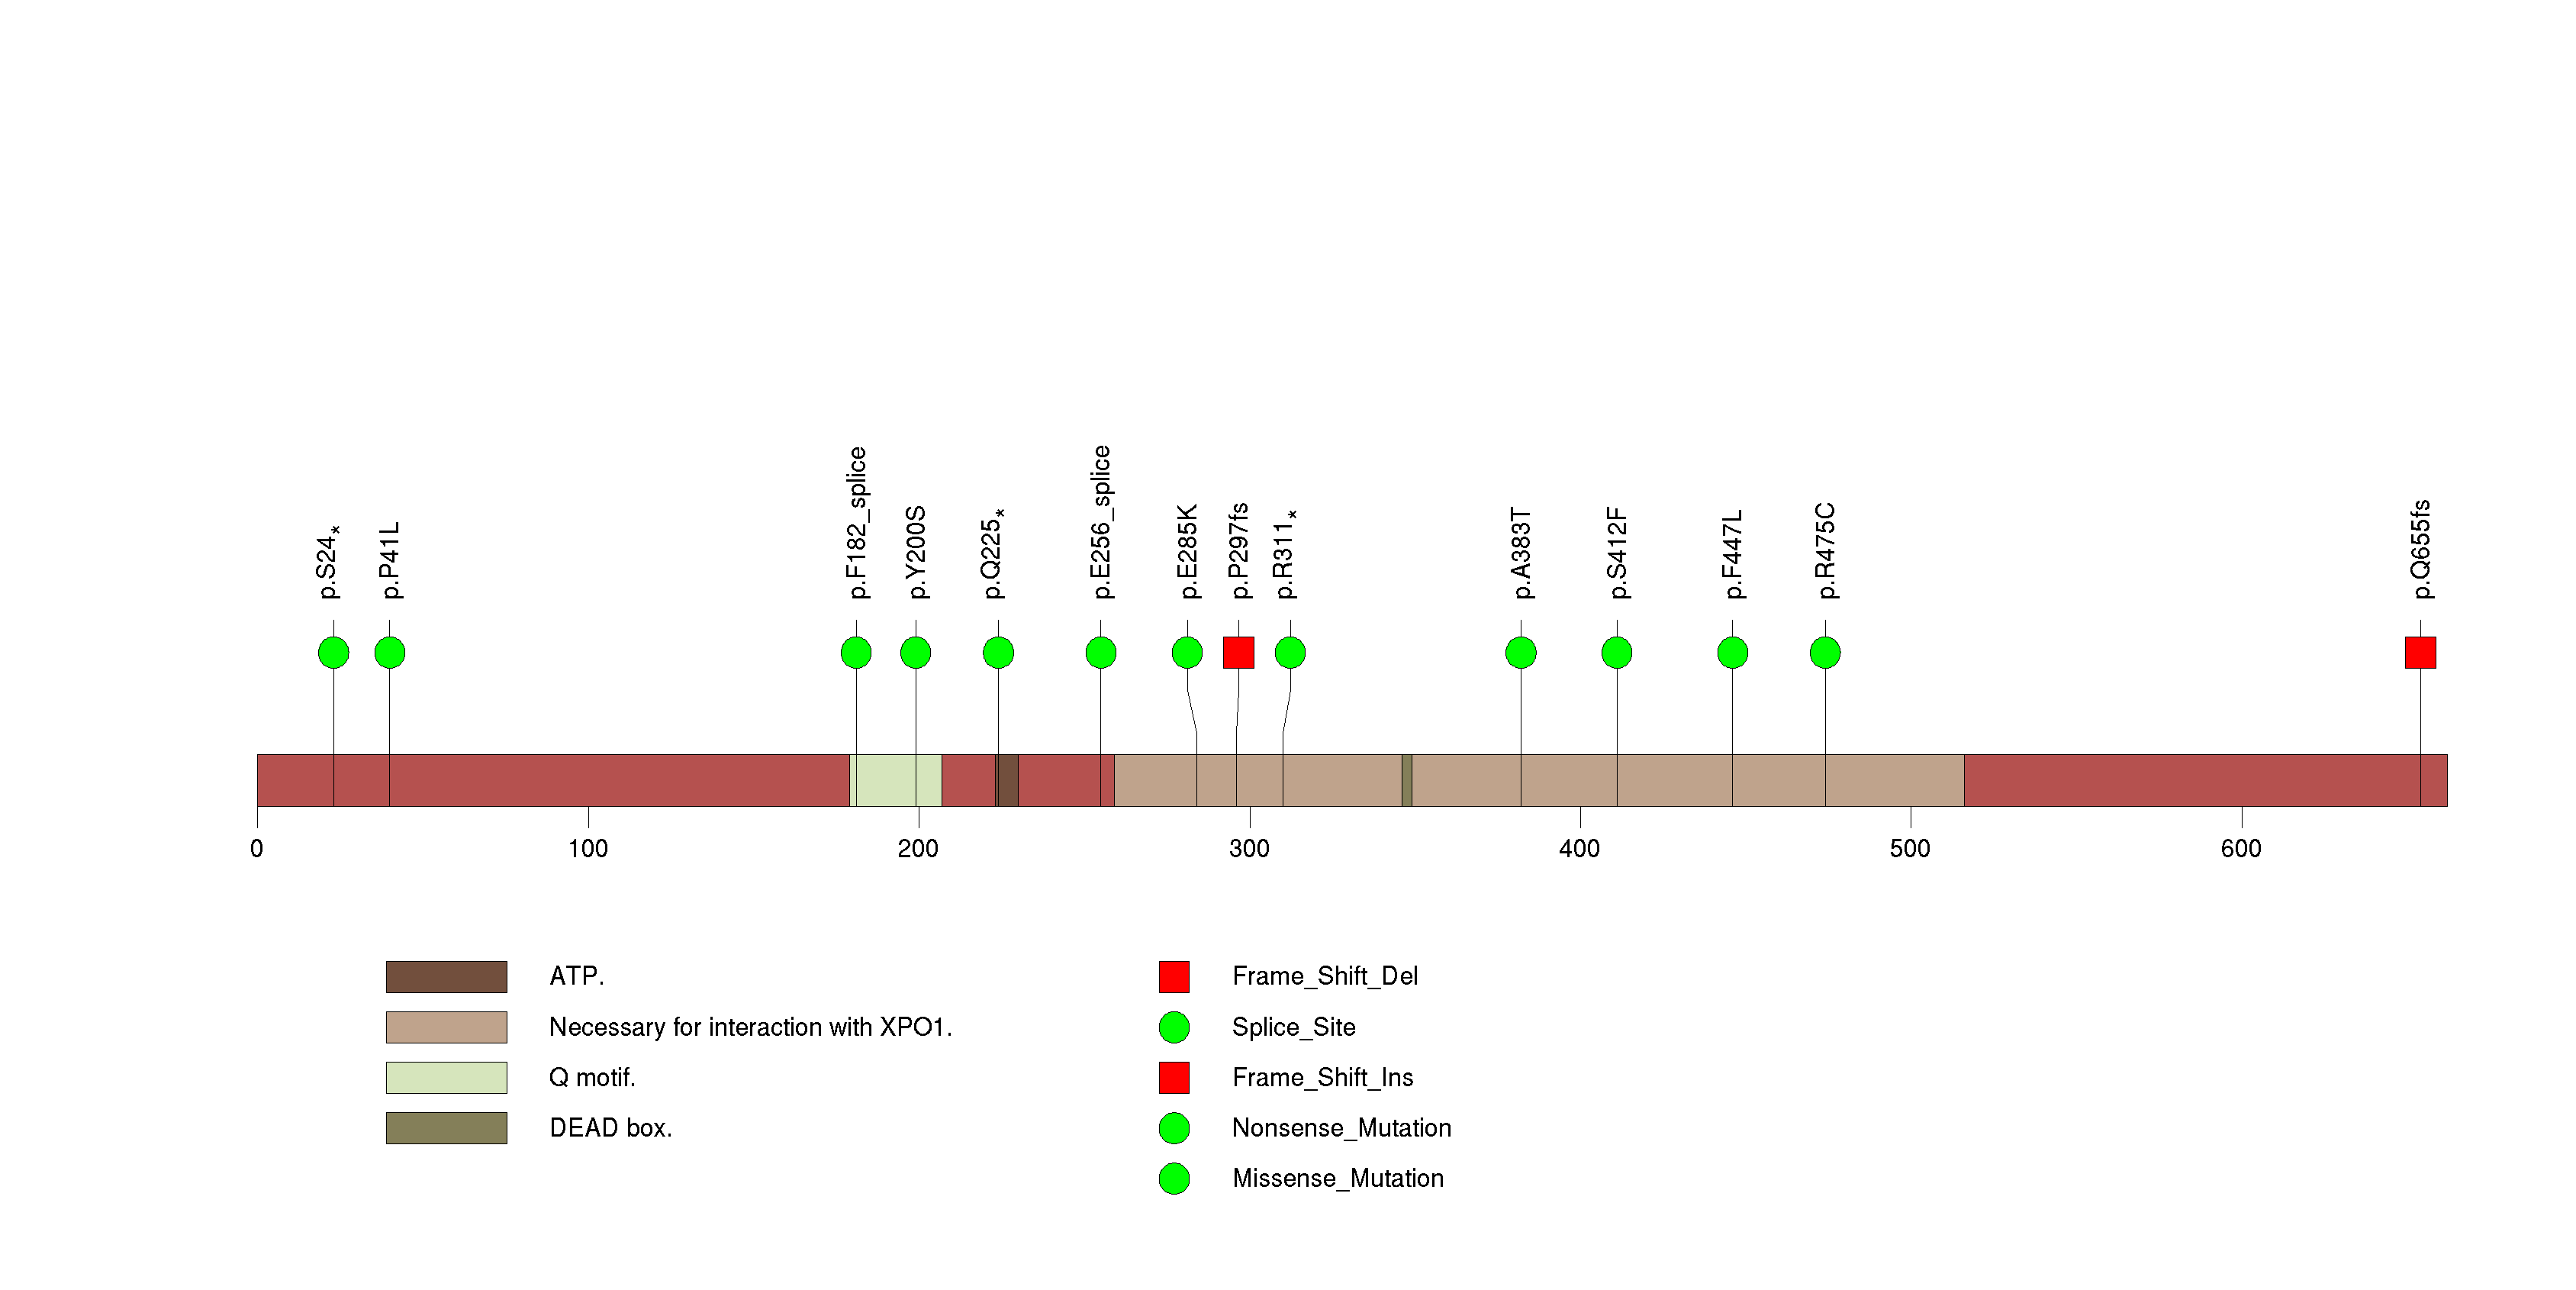
Figure S11. This figure depicts the distribution of mutations and mutation types across the POF1B significant gene.
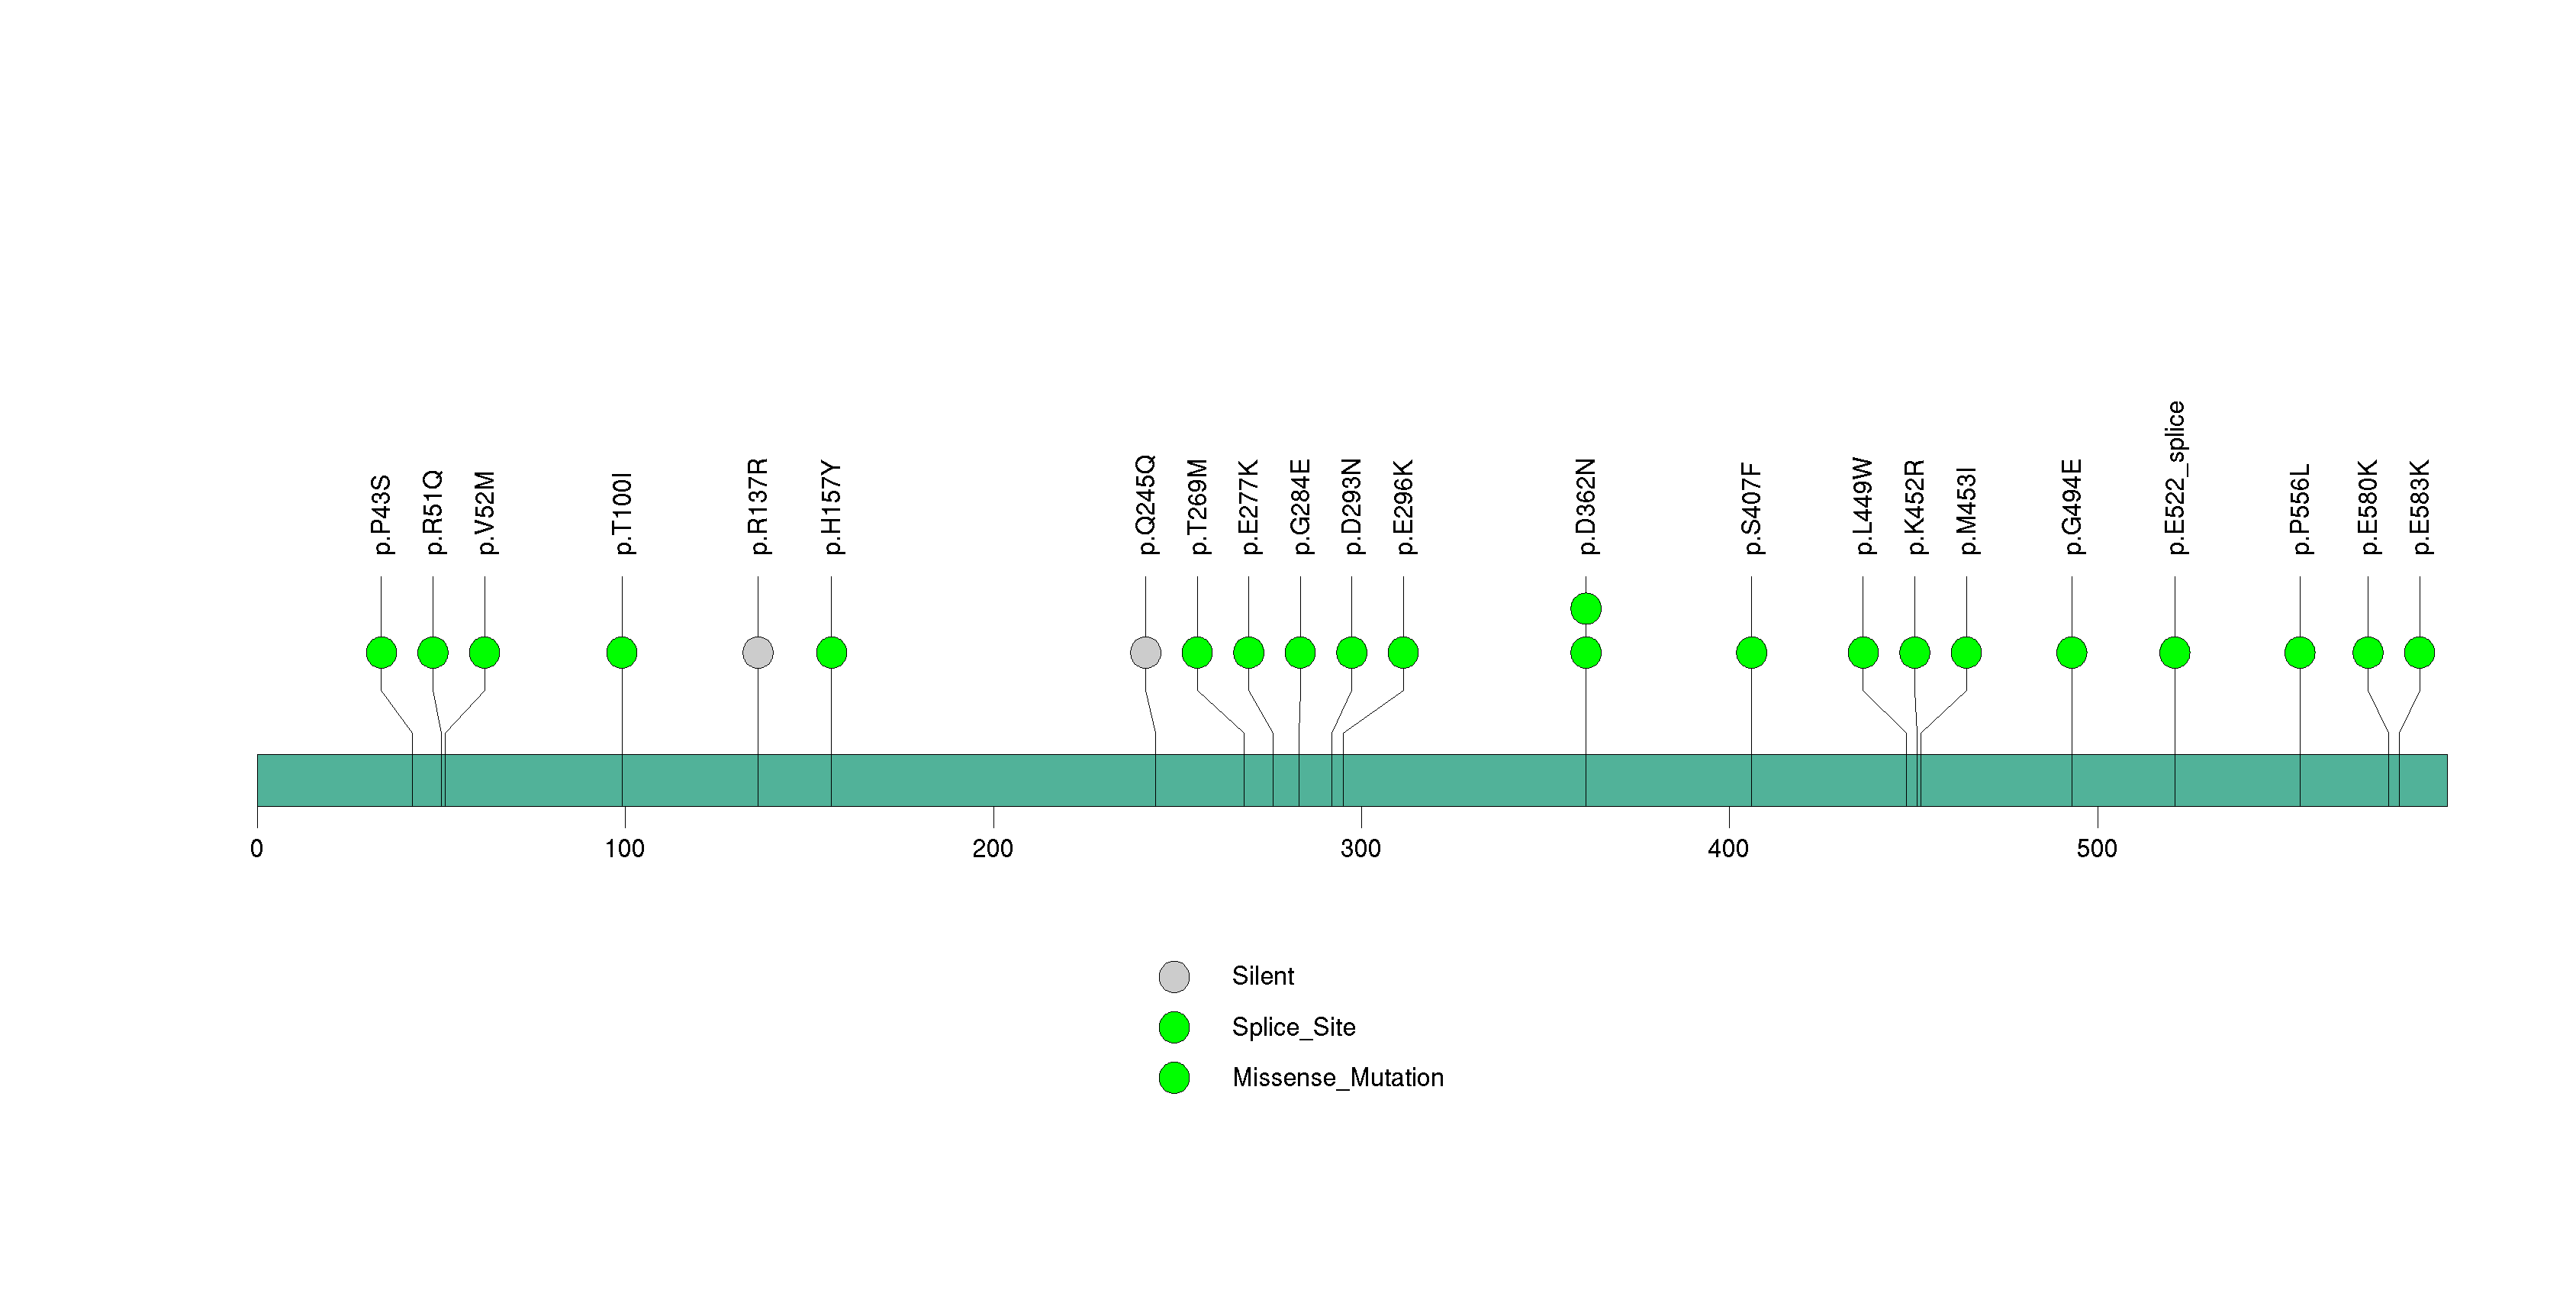
Figure S12. This figure depicts the distribution of mutations and mutation types across the OR5AC2 significant gene.

Figure S13. This figure depicts the distribution of mutations and mutation types across the GK2 significant gene.
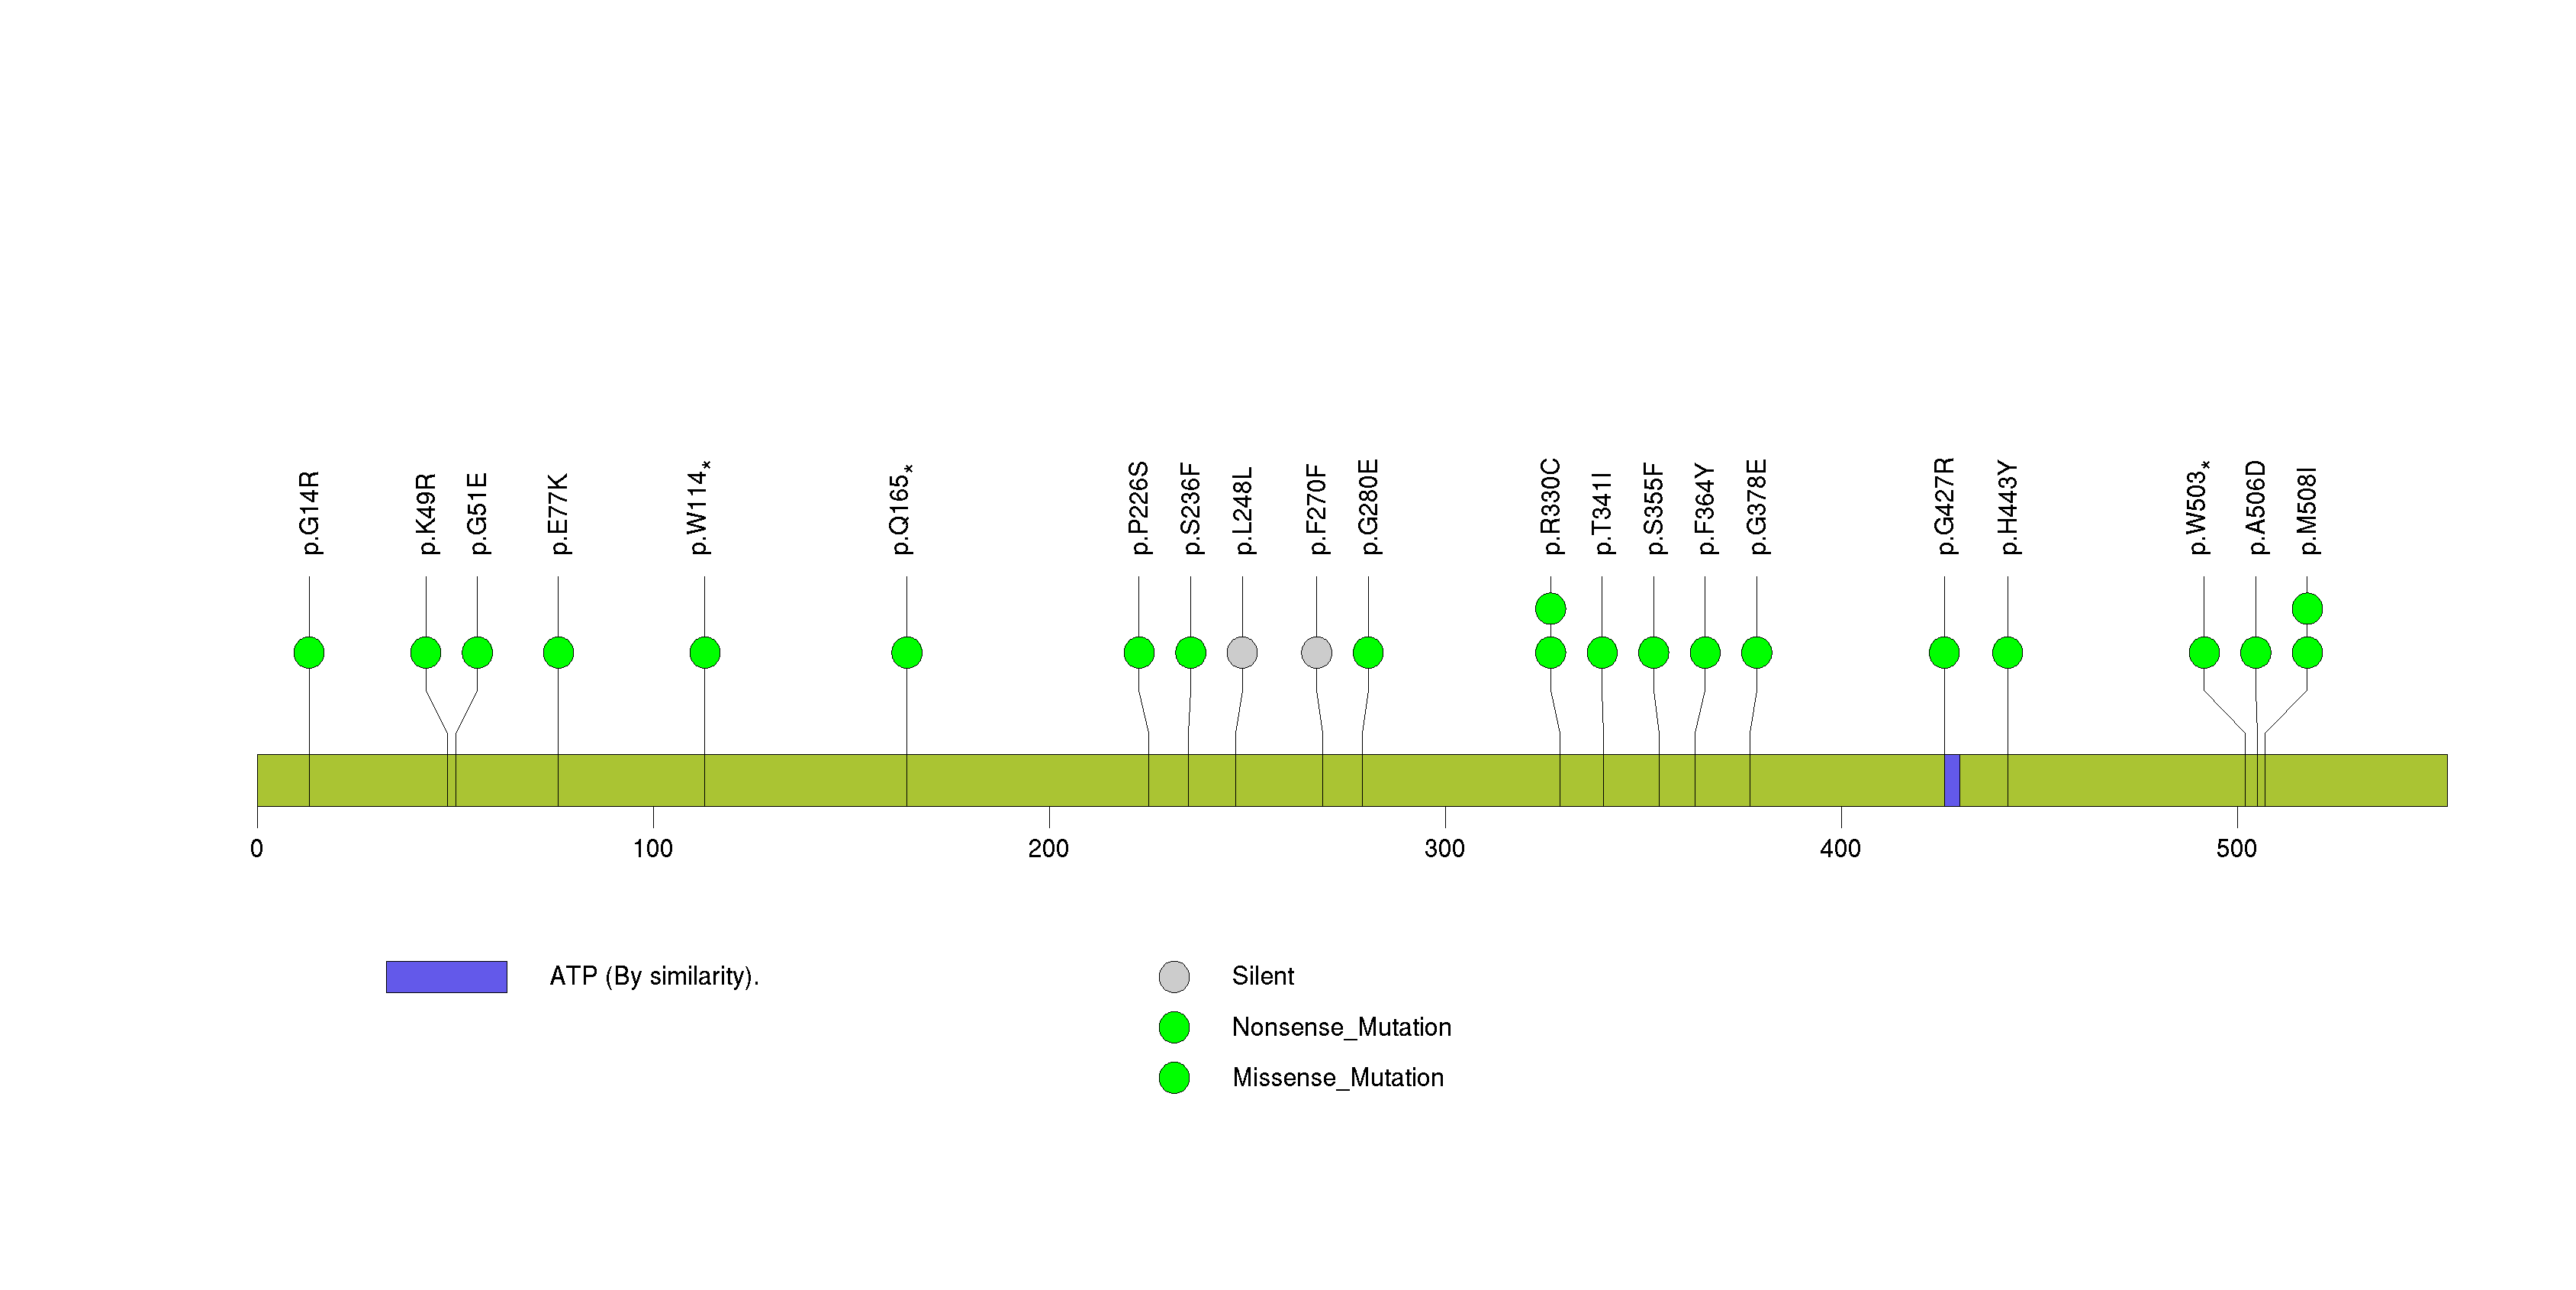
Figure S14. This figure depicts the distribution of mutations and mutation types across the TFEC significant gene.
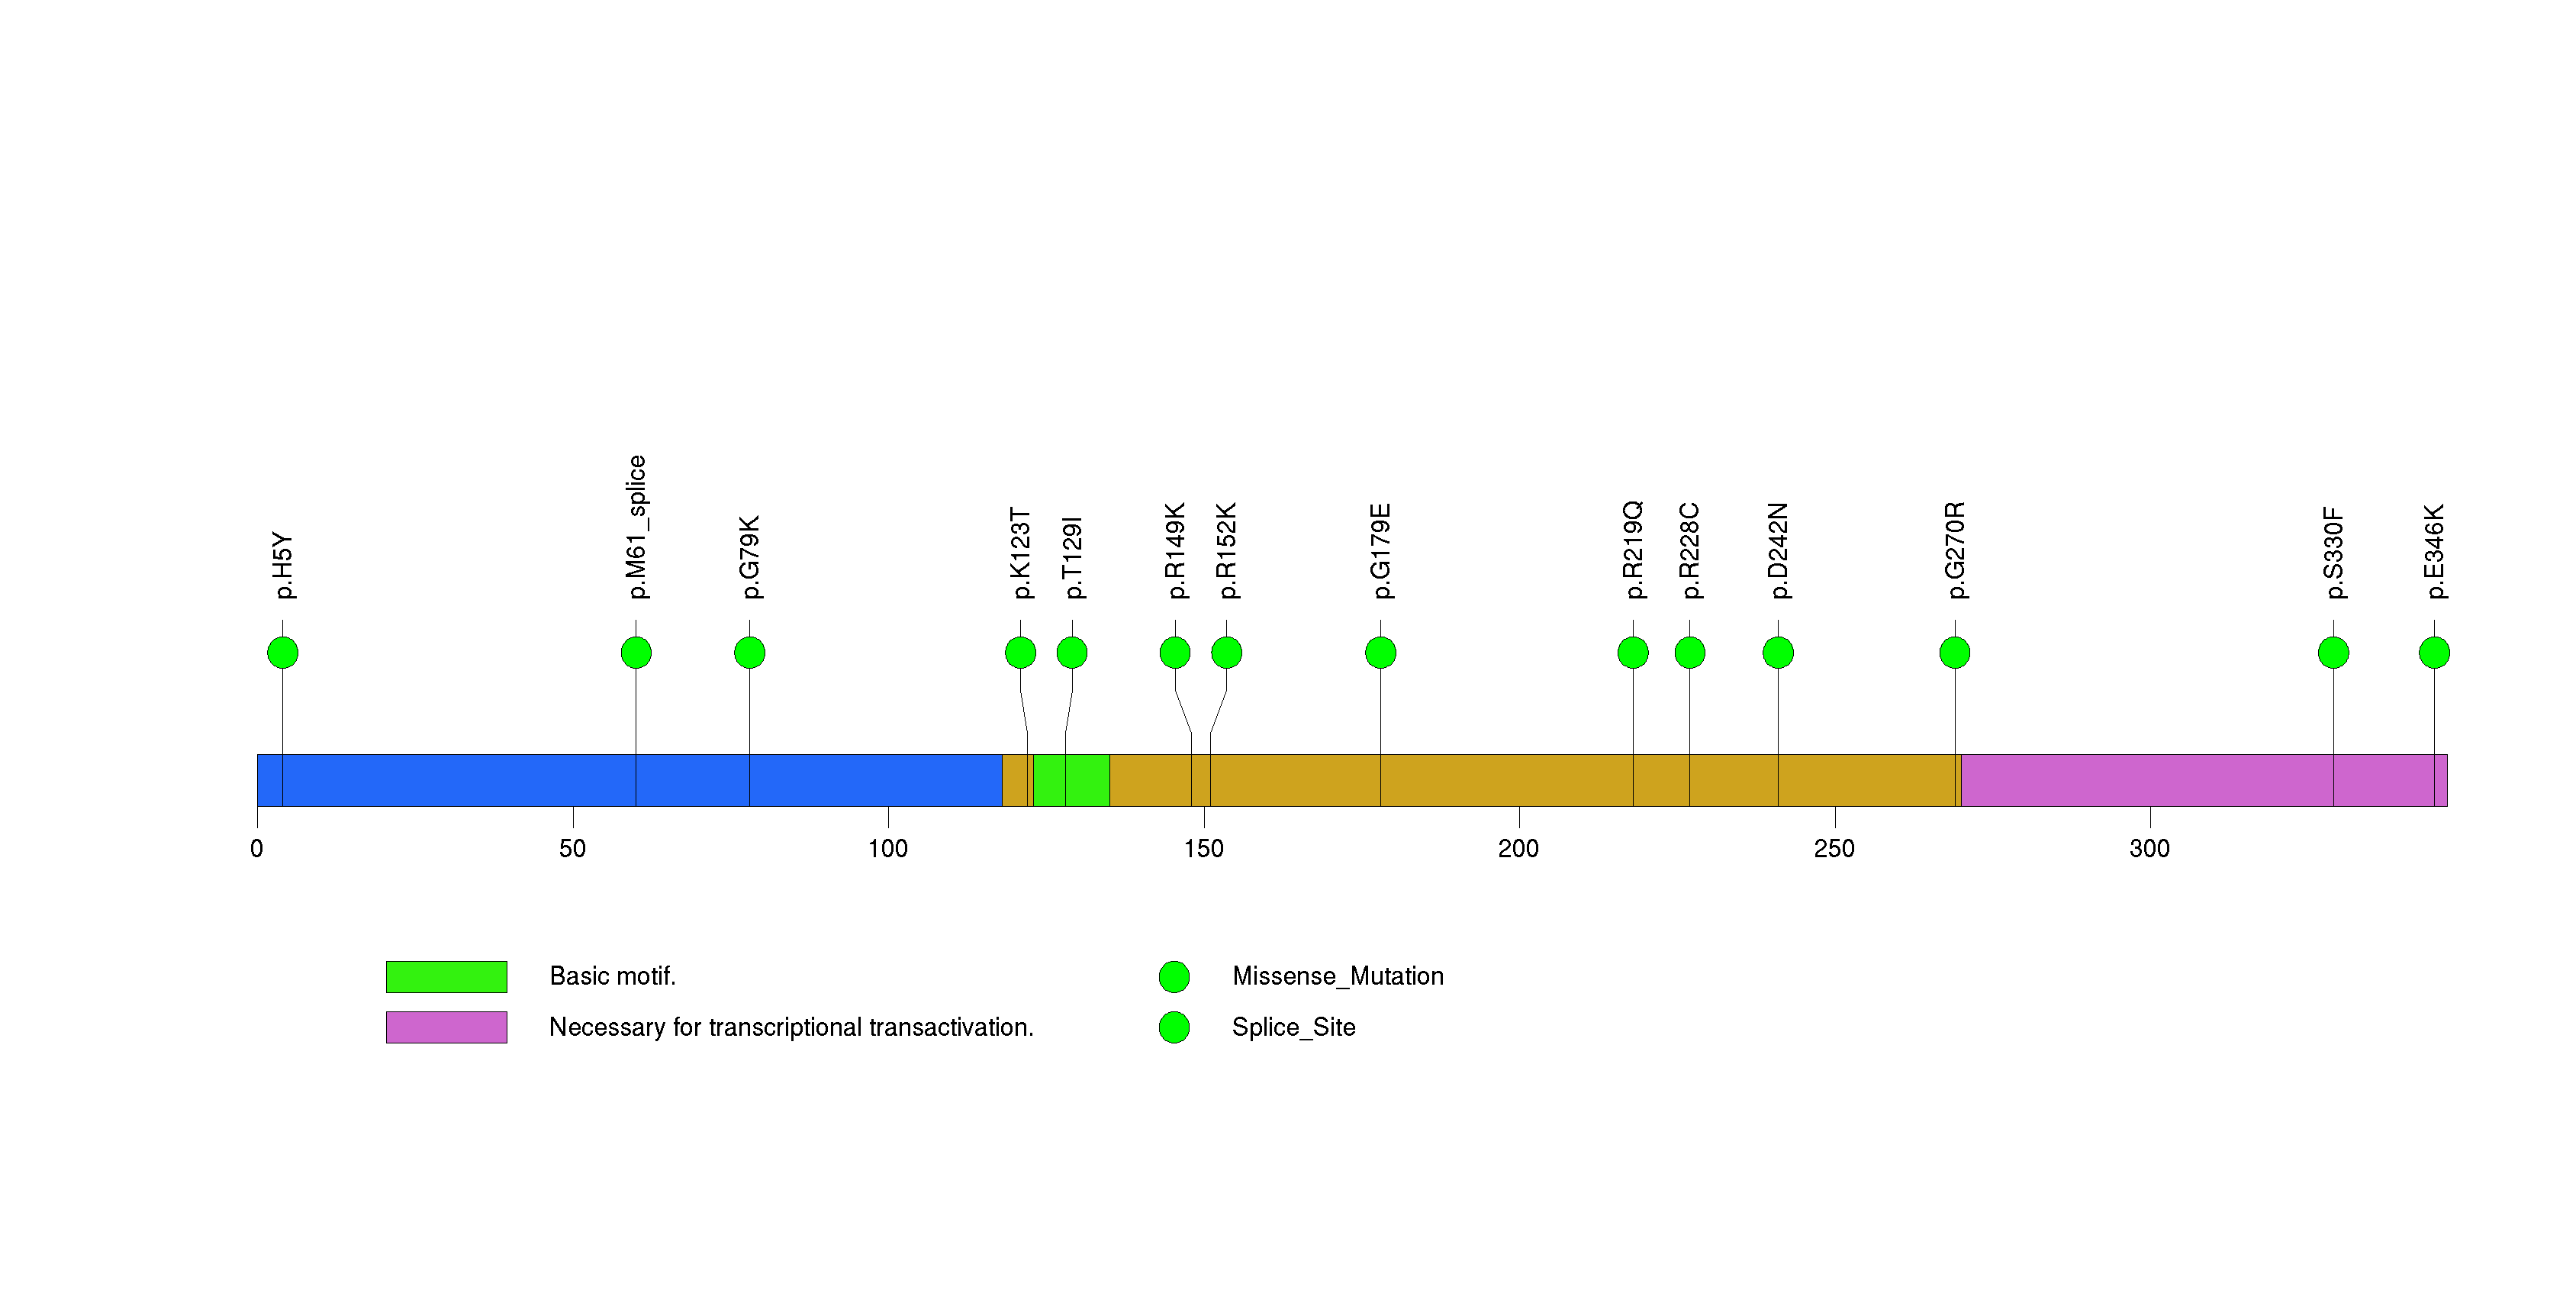
Figure S15. This figure depicts the distribution of mutations and mutation types across the SNAP91 significant gene.
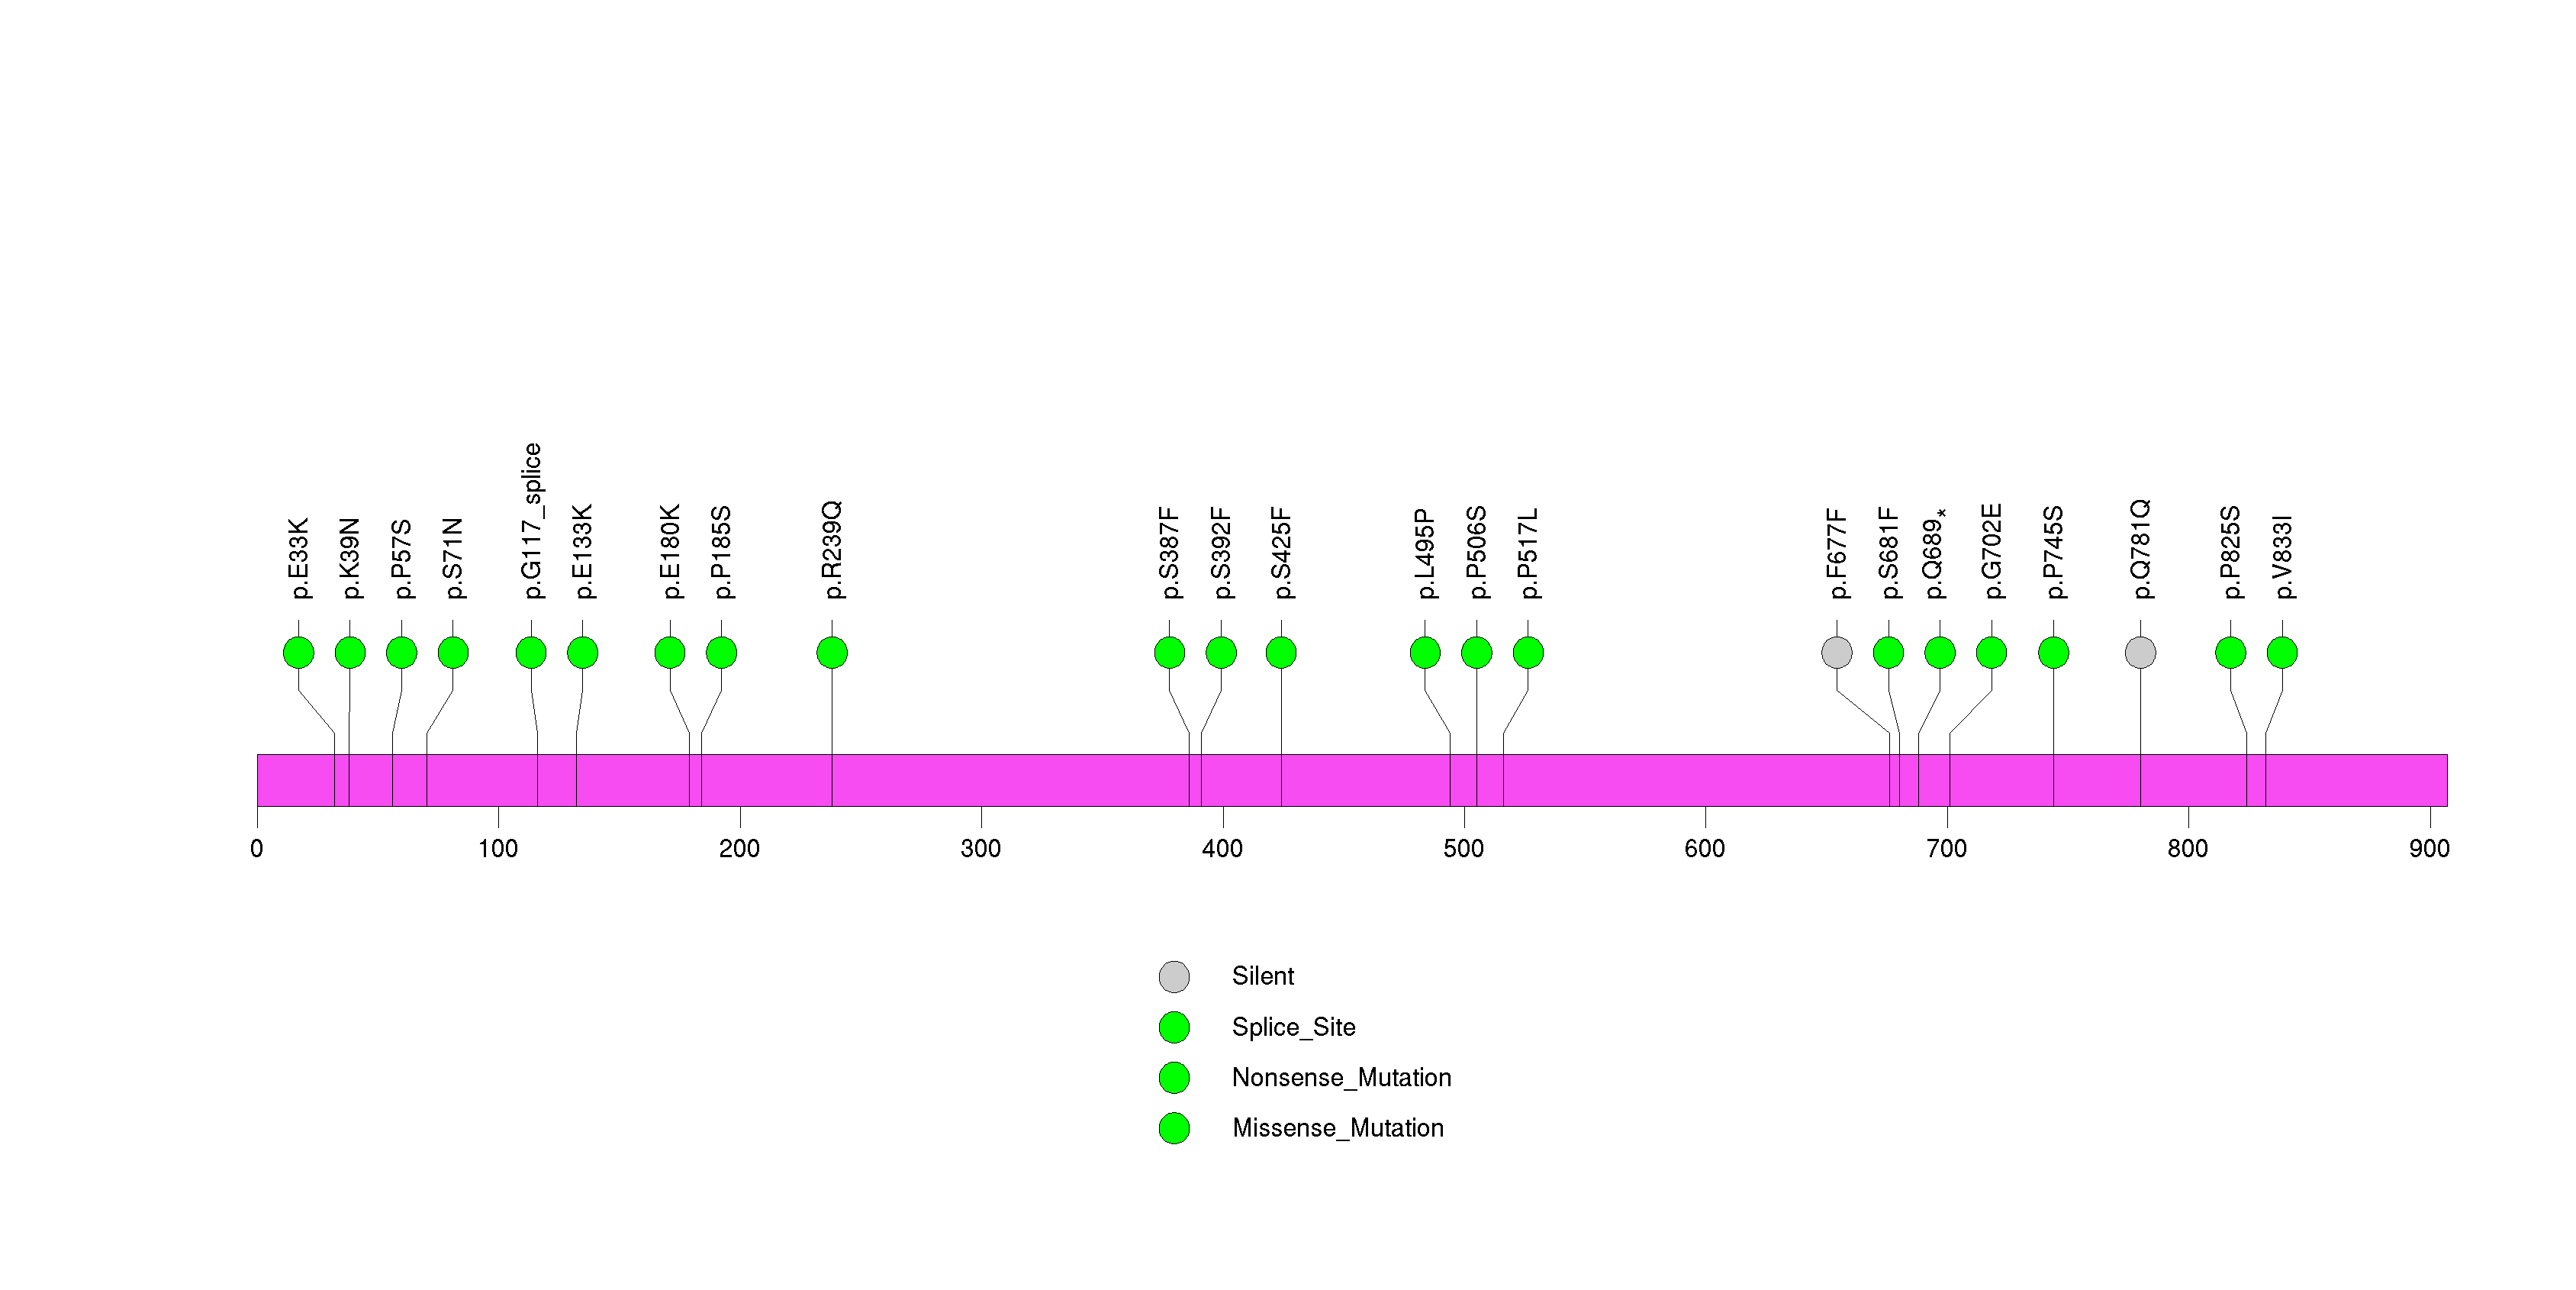
Figure S16. This figure depicts the distribution of mutations and mutation types across the NAP1L2 significant gene.
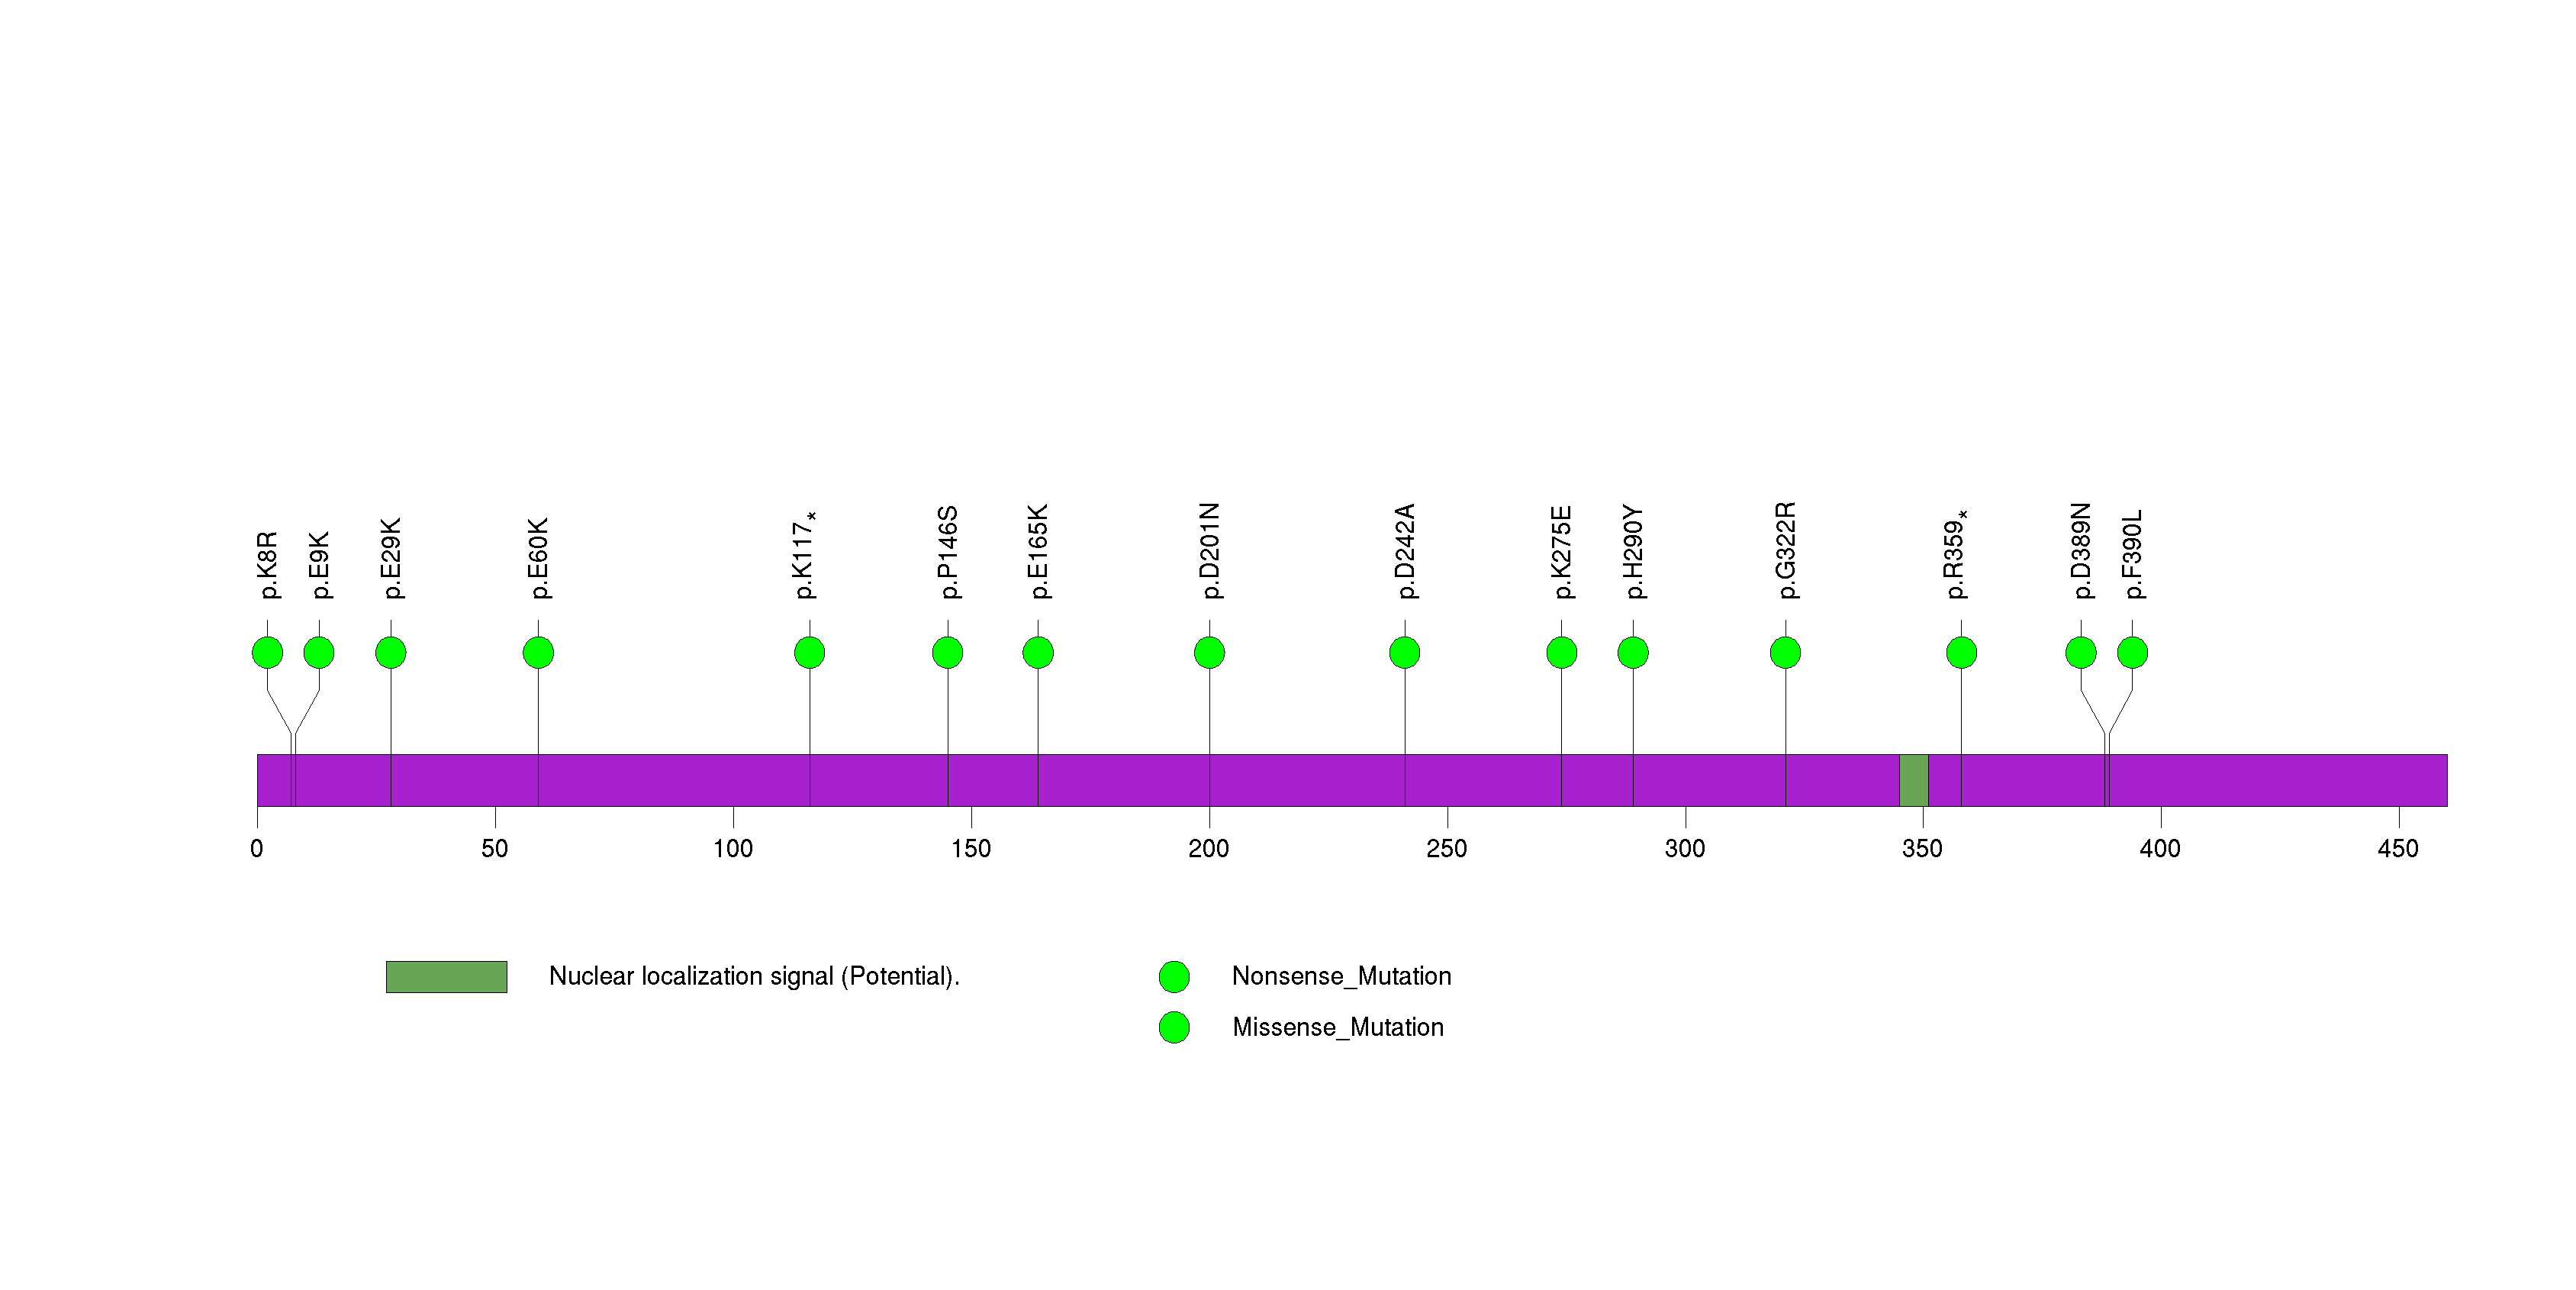
Figure S17. This figure depicts the distribution of mutations and mutation types across the GPR141 significant gene.
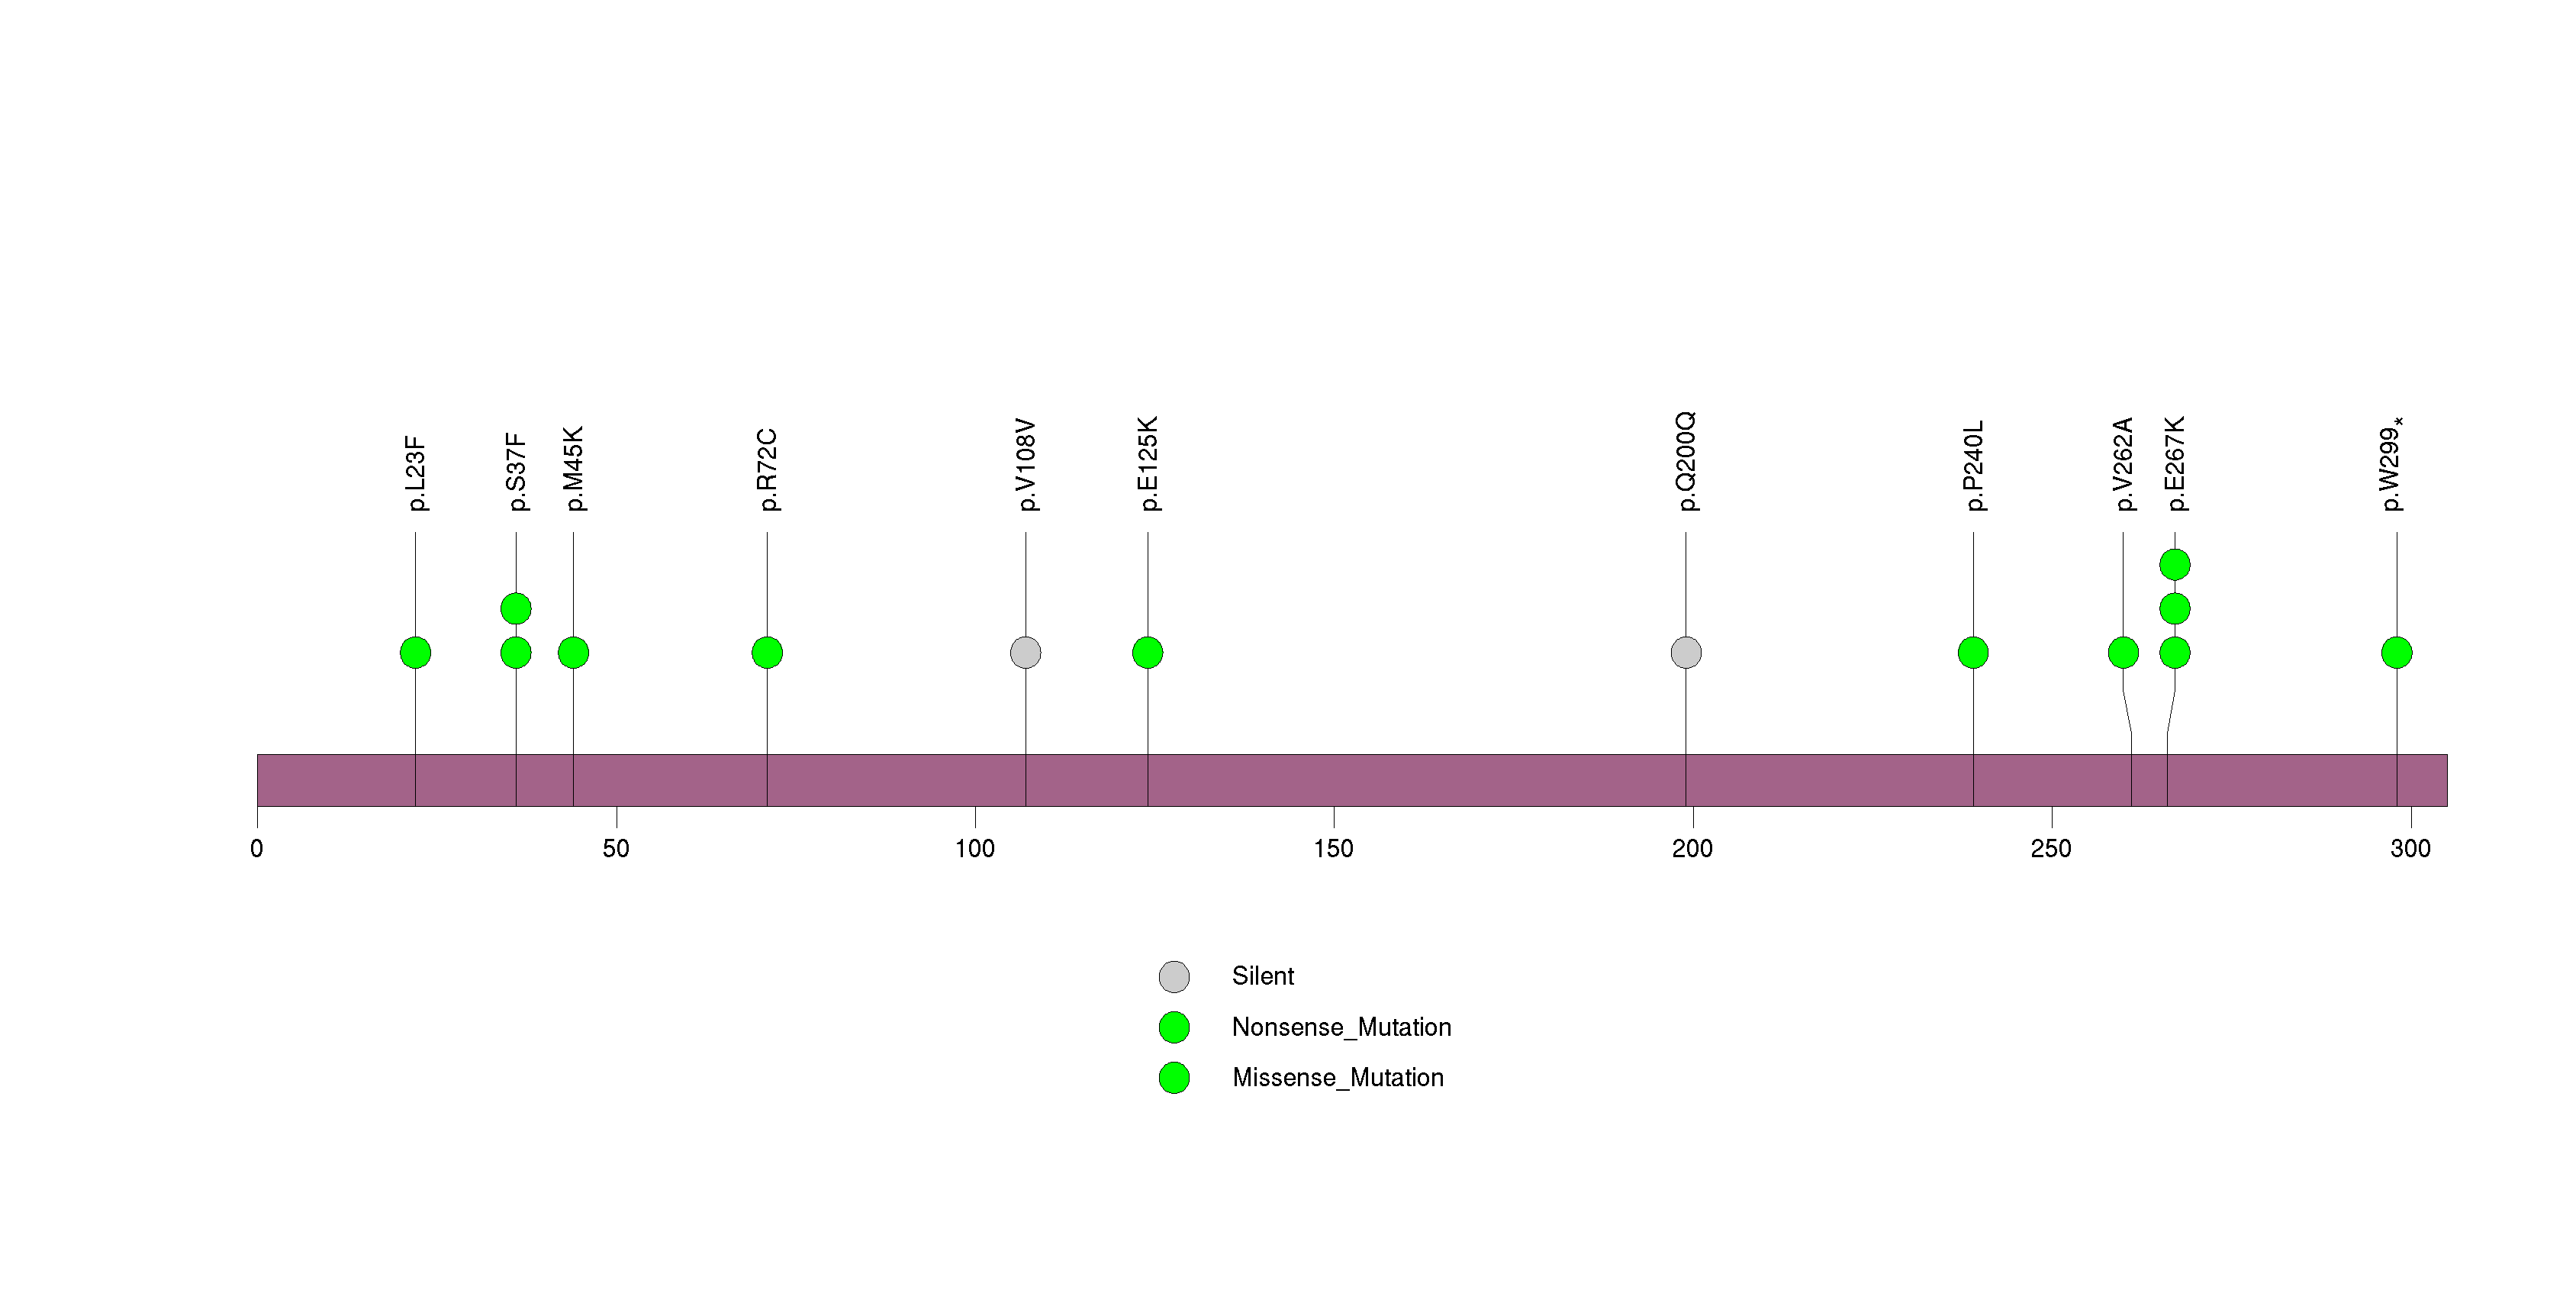
Figure S18. This figure depicts the distribution of mutations and mutation types across the CCNE2 significant gene.
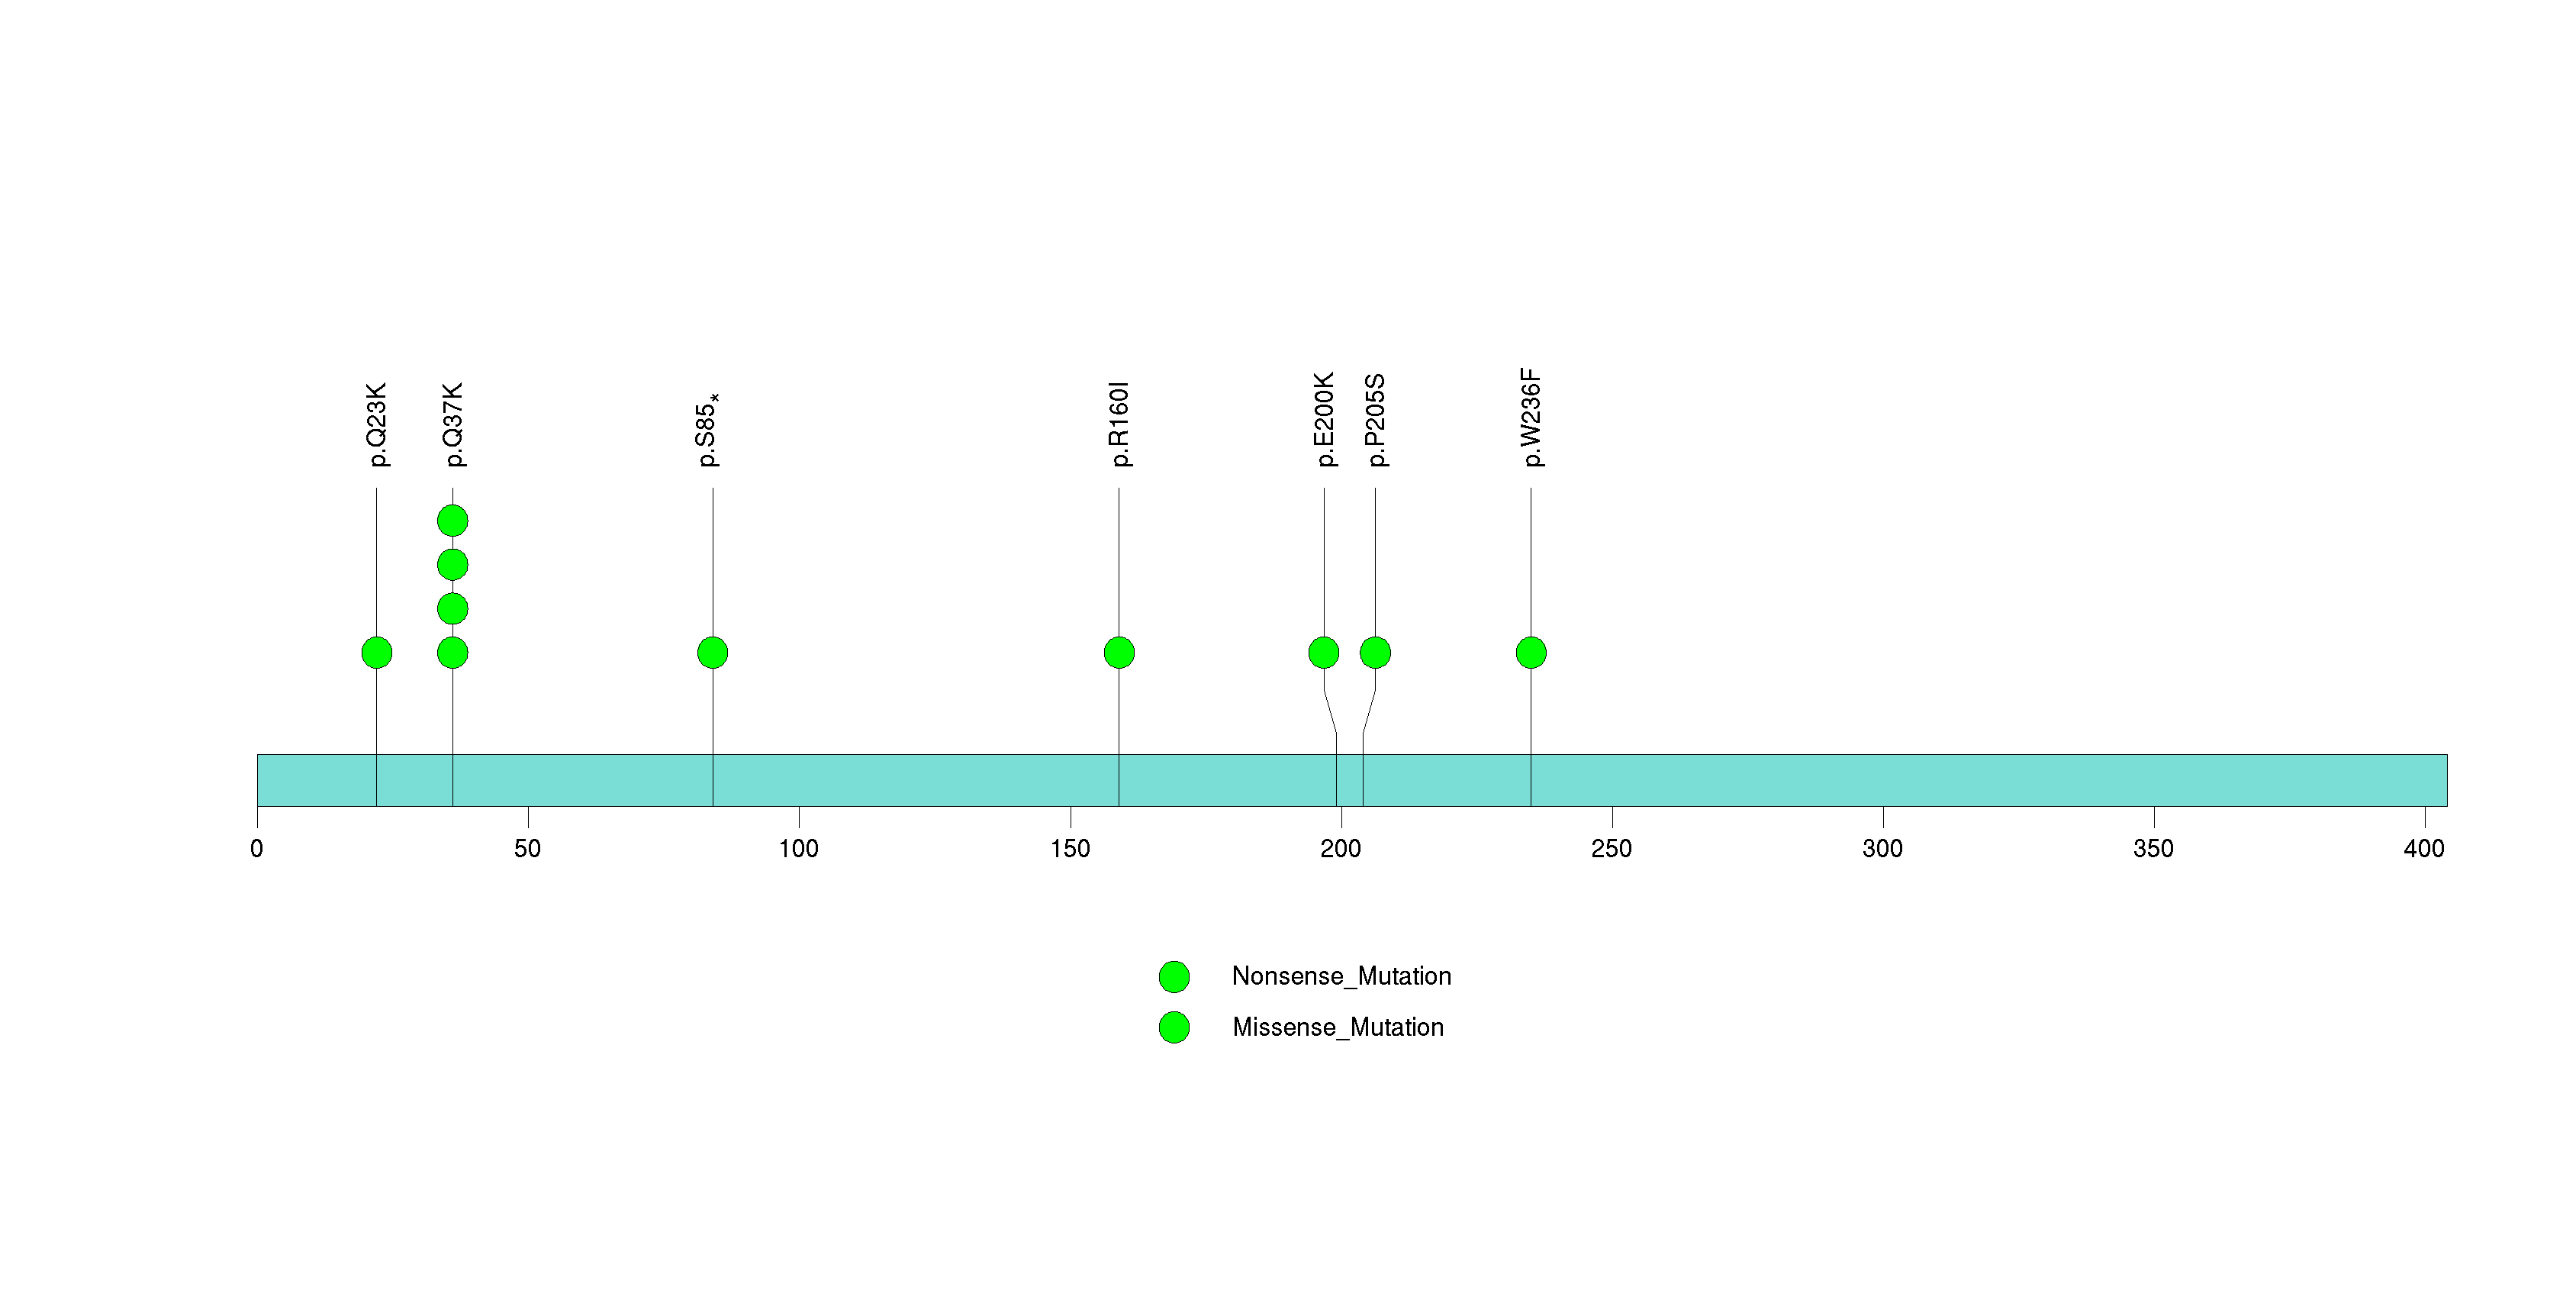
Figure S19. This figure depicts the distribution of mutations and mutation types across the TLL1 significant gene.
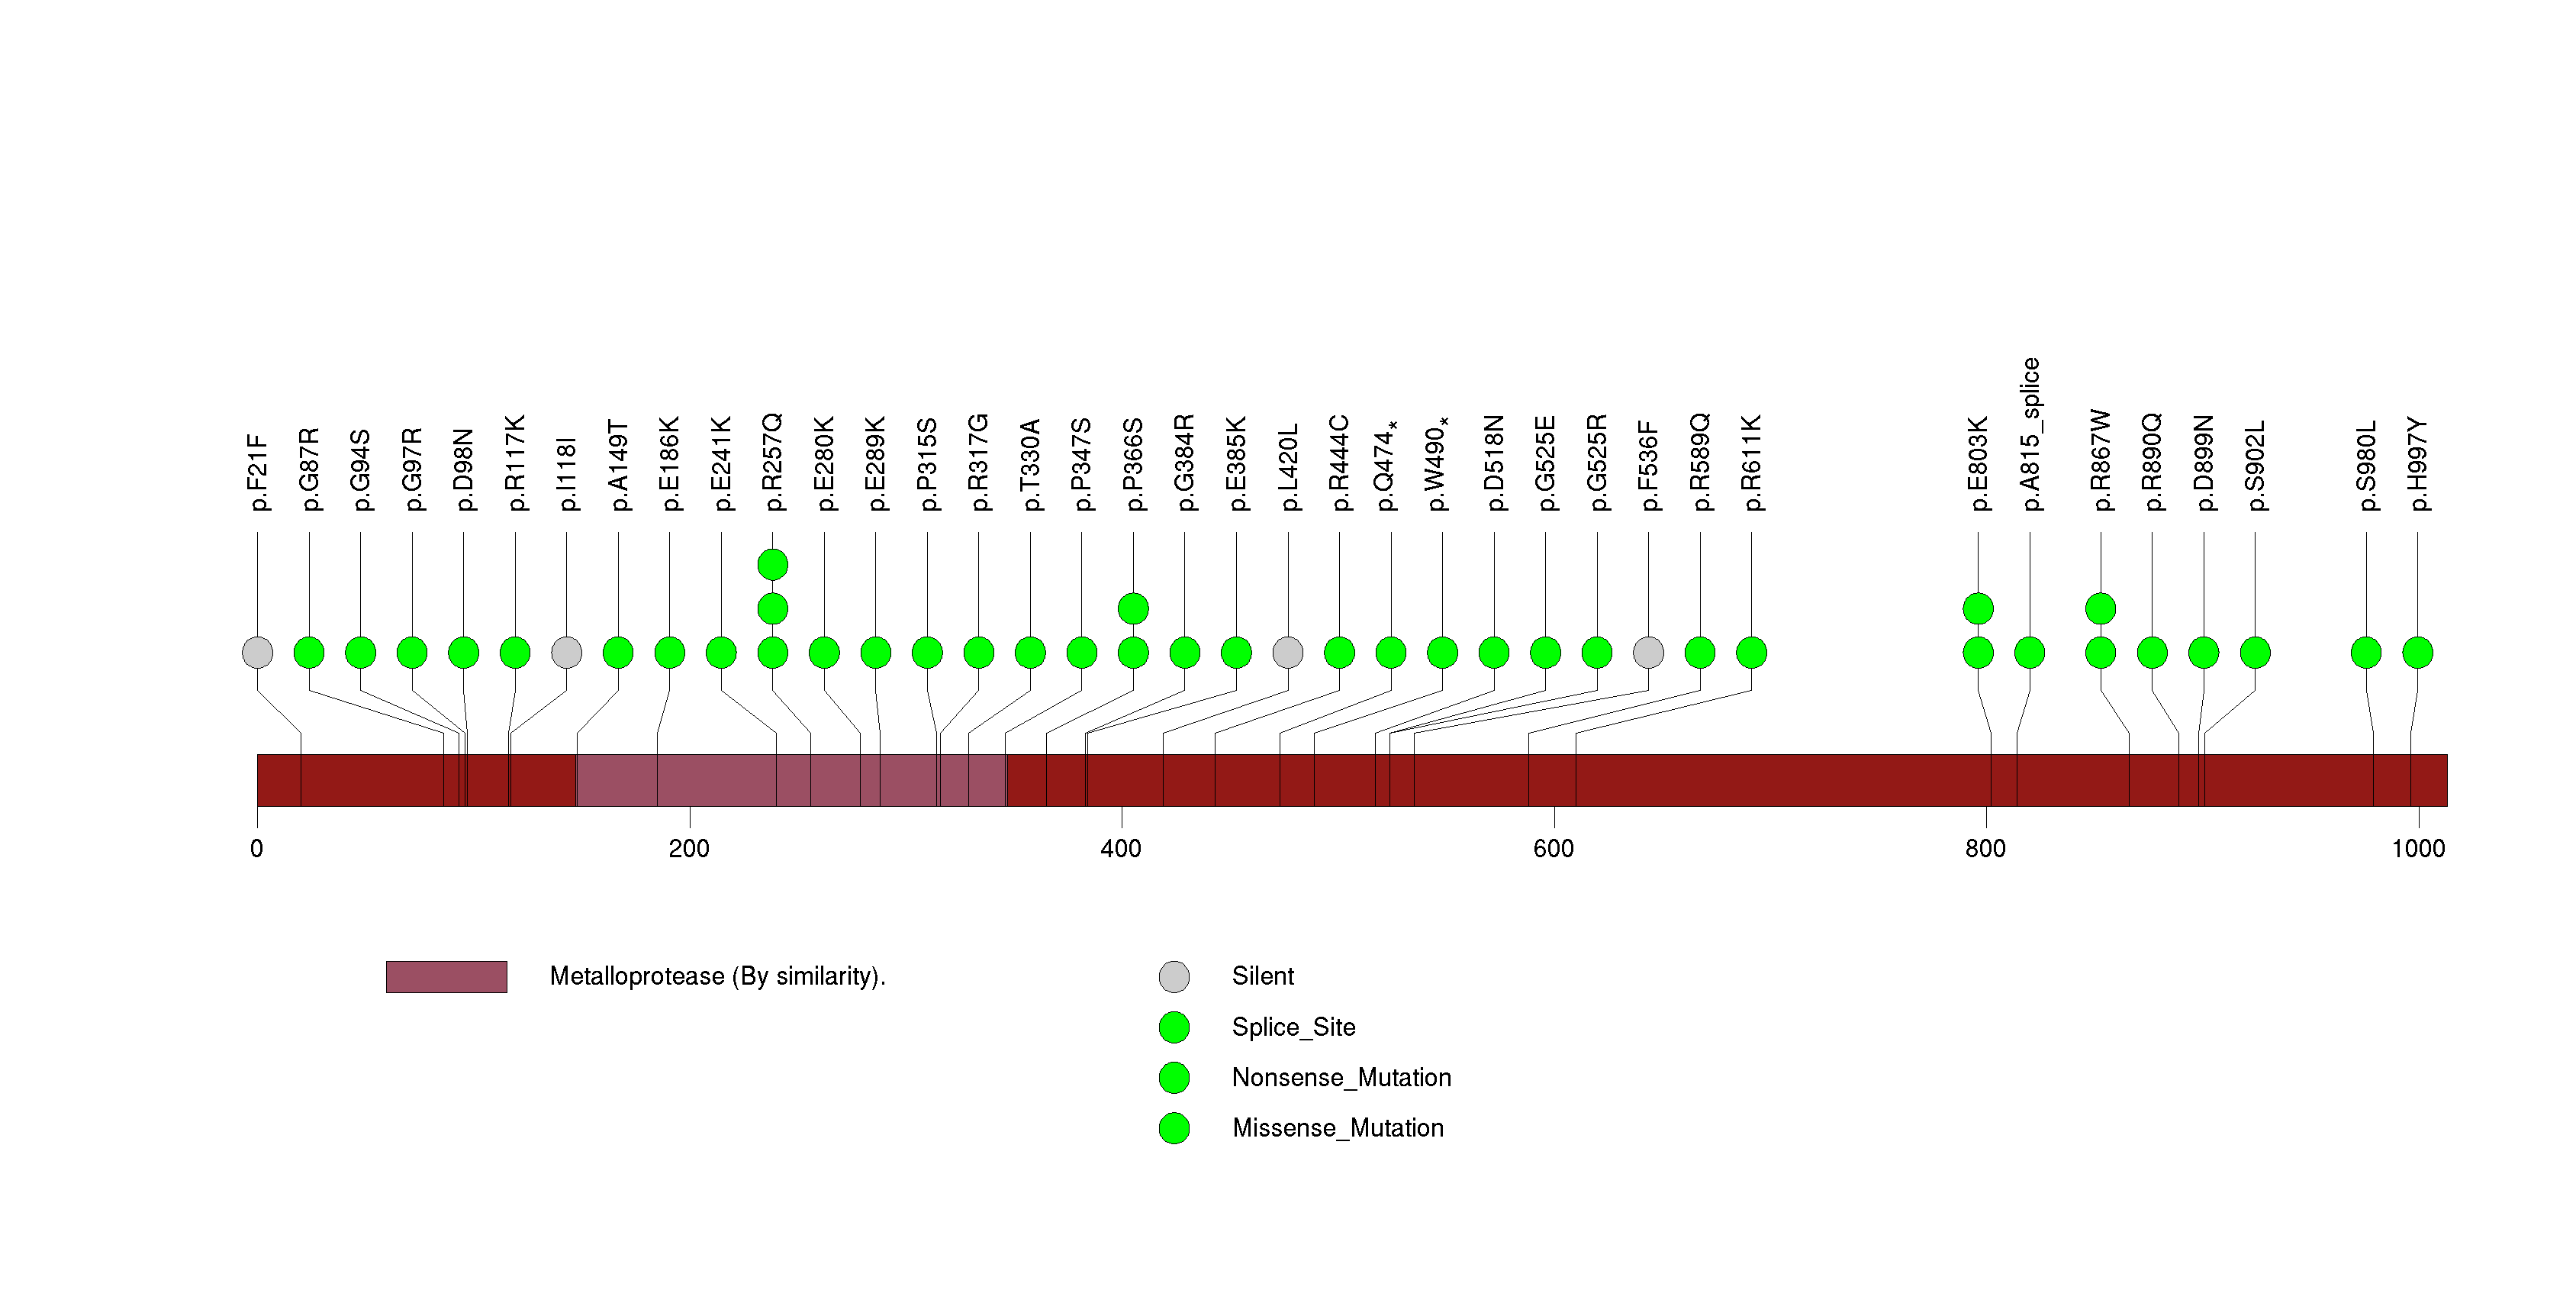
Figure S20. This figure depicts the distribution of mutations and mutation types across the SERPINB4 significant gene.
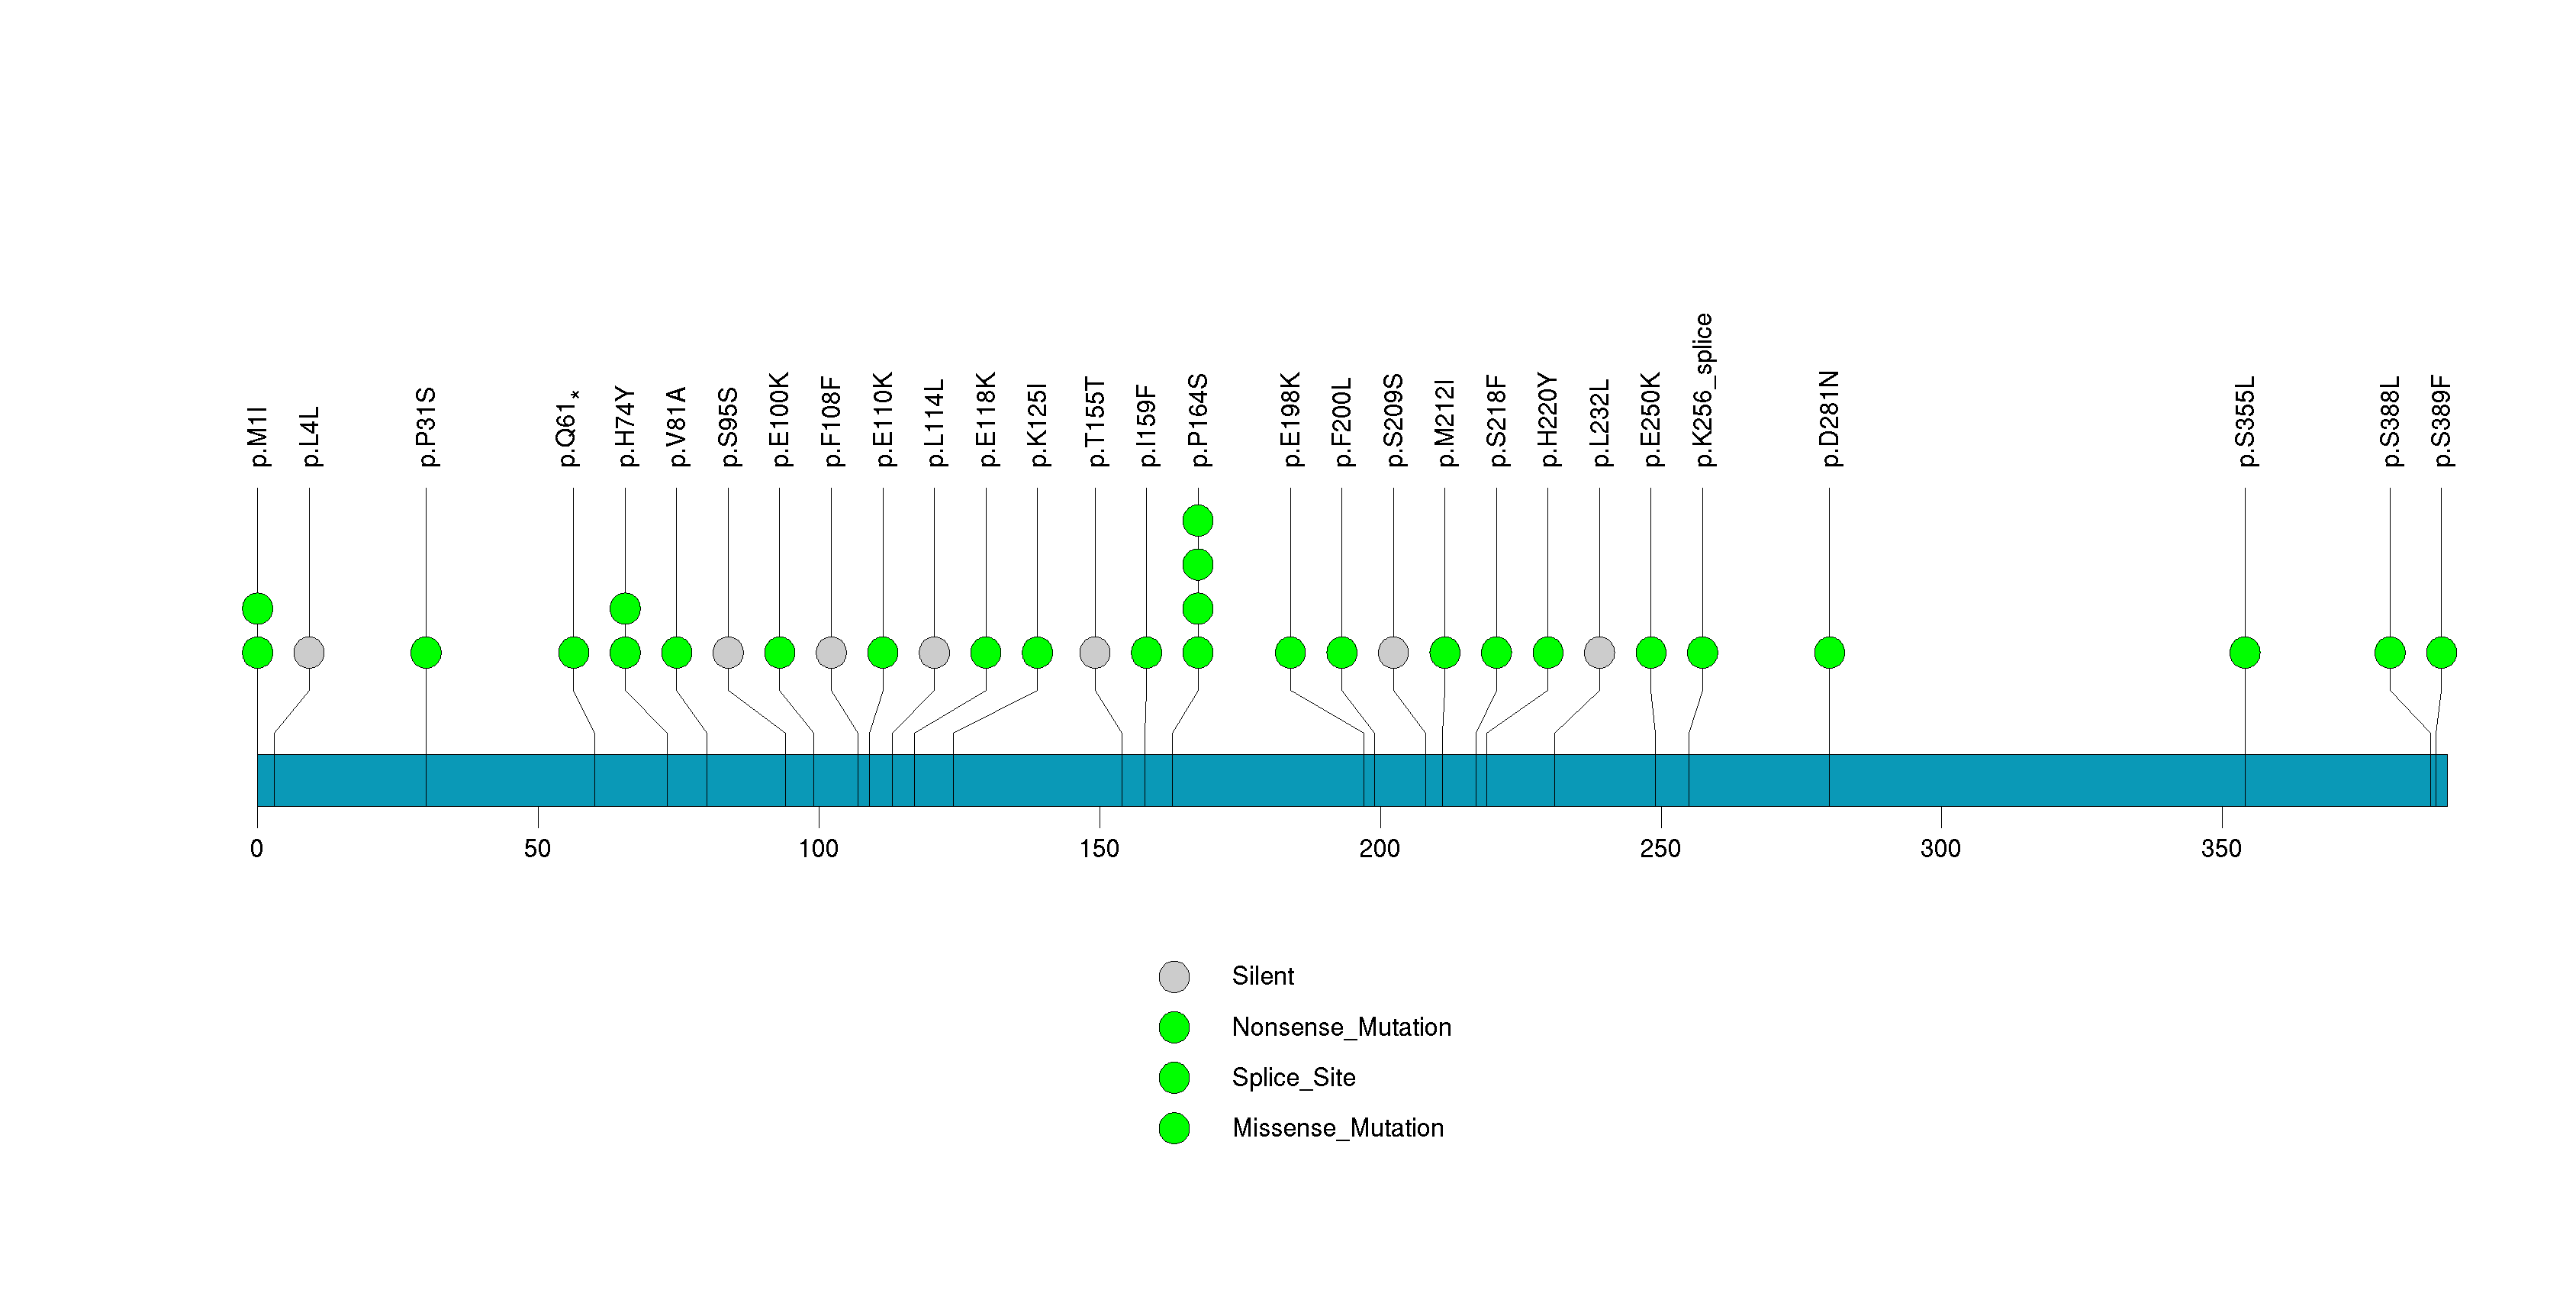
Figure S21. This figure depicts the distribution of mutations and mutation types across the NOTCH2NL significant gene.
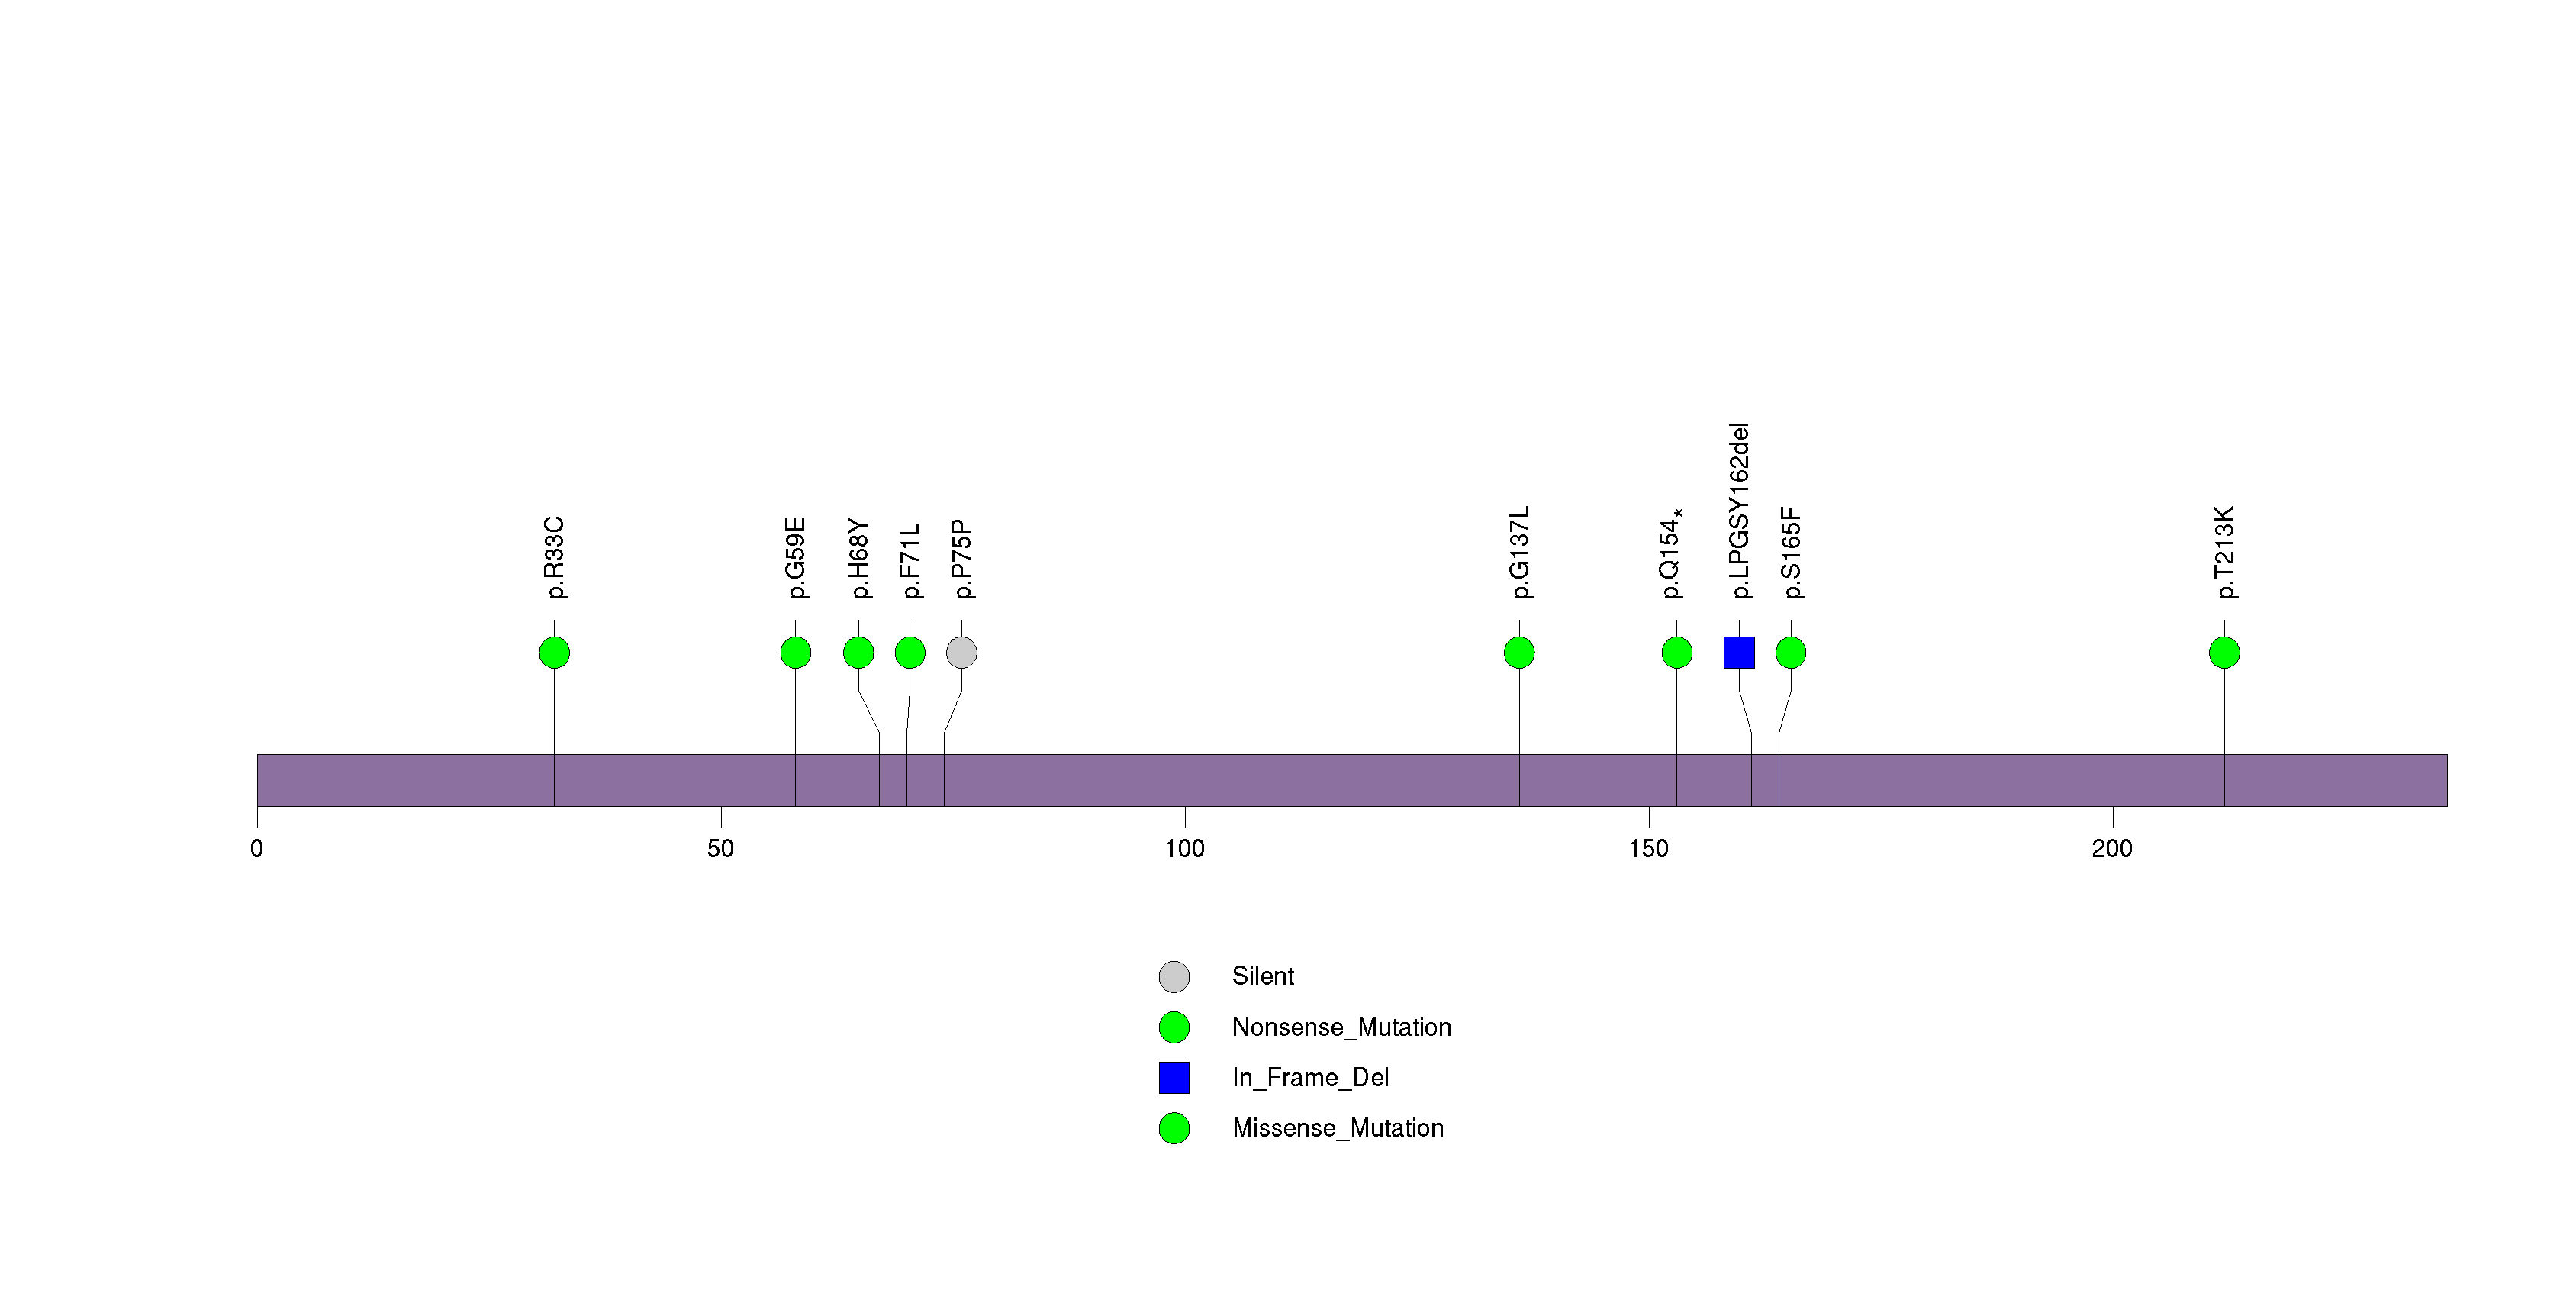
Figure S22. This figure depicts the distribution of mutations and mutation types across the RBM11 significant gene.
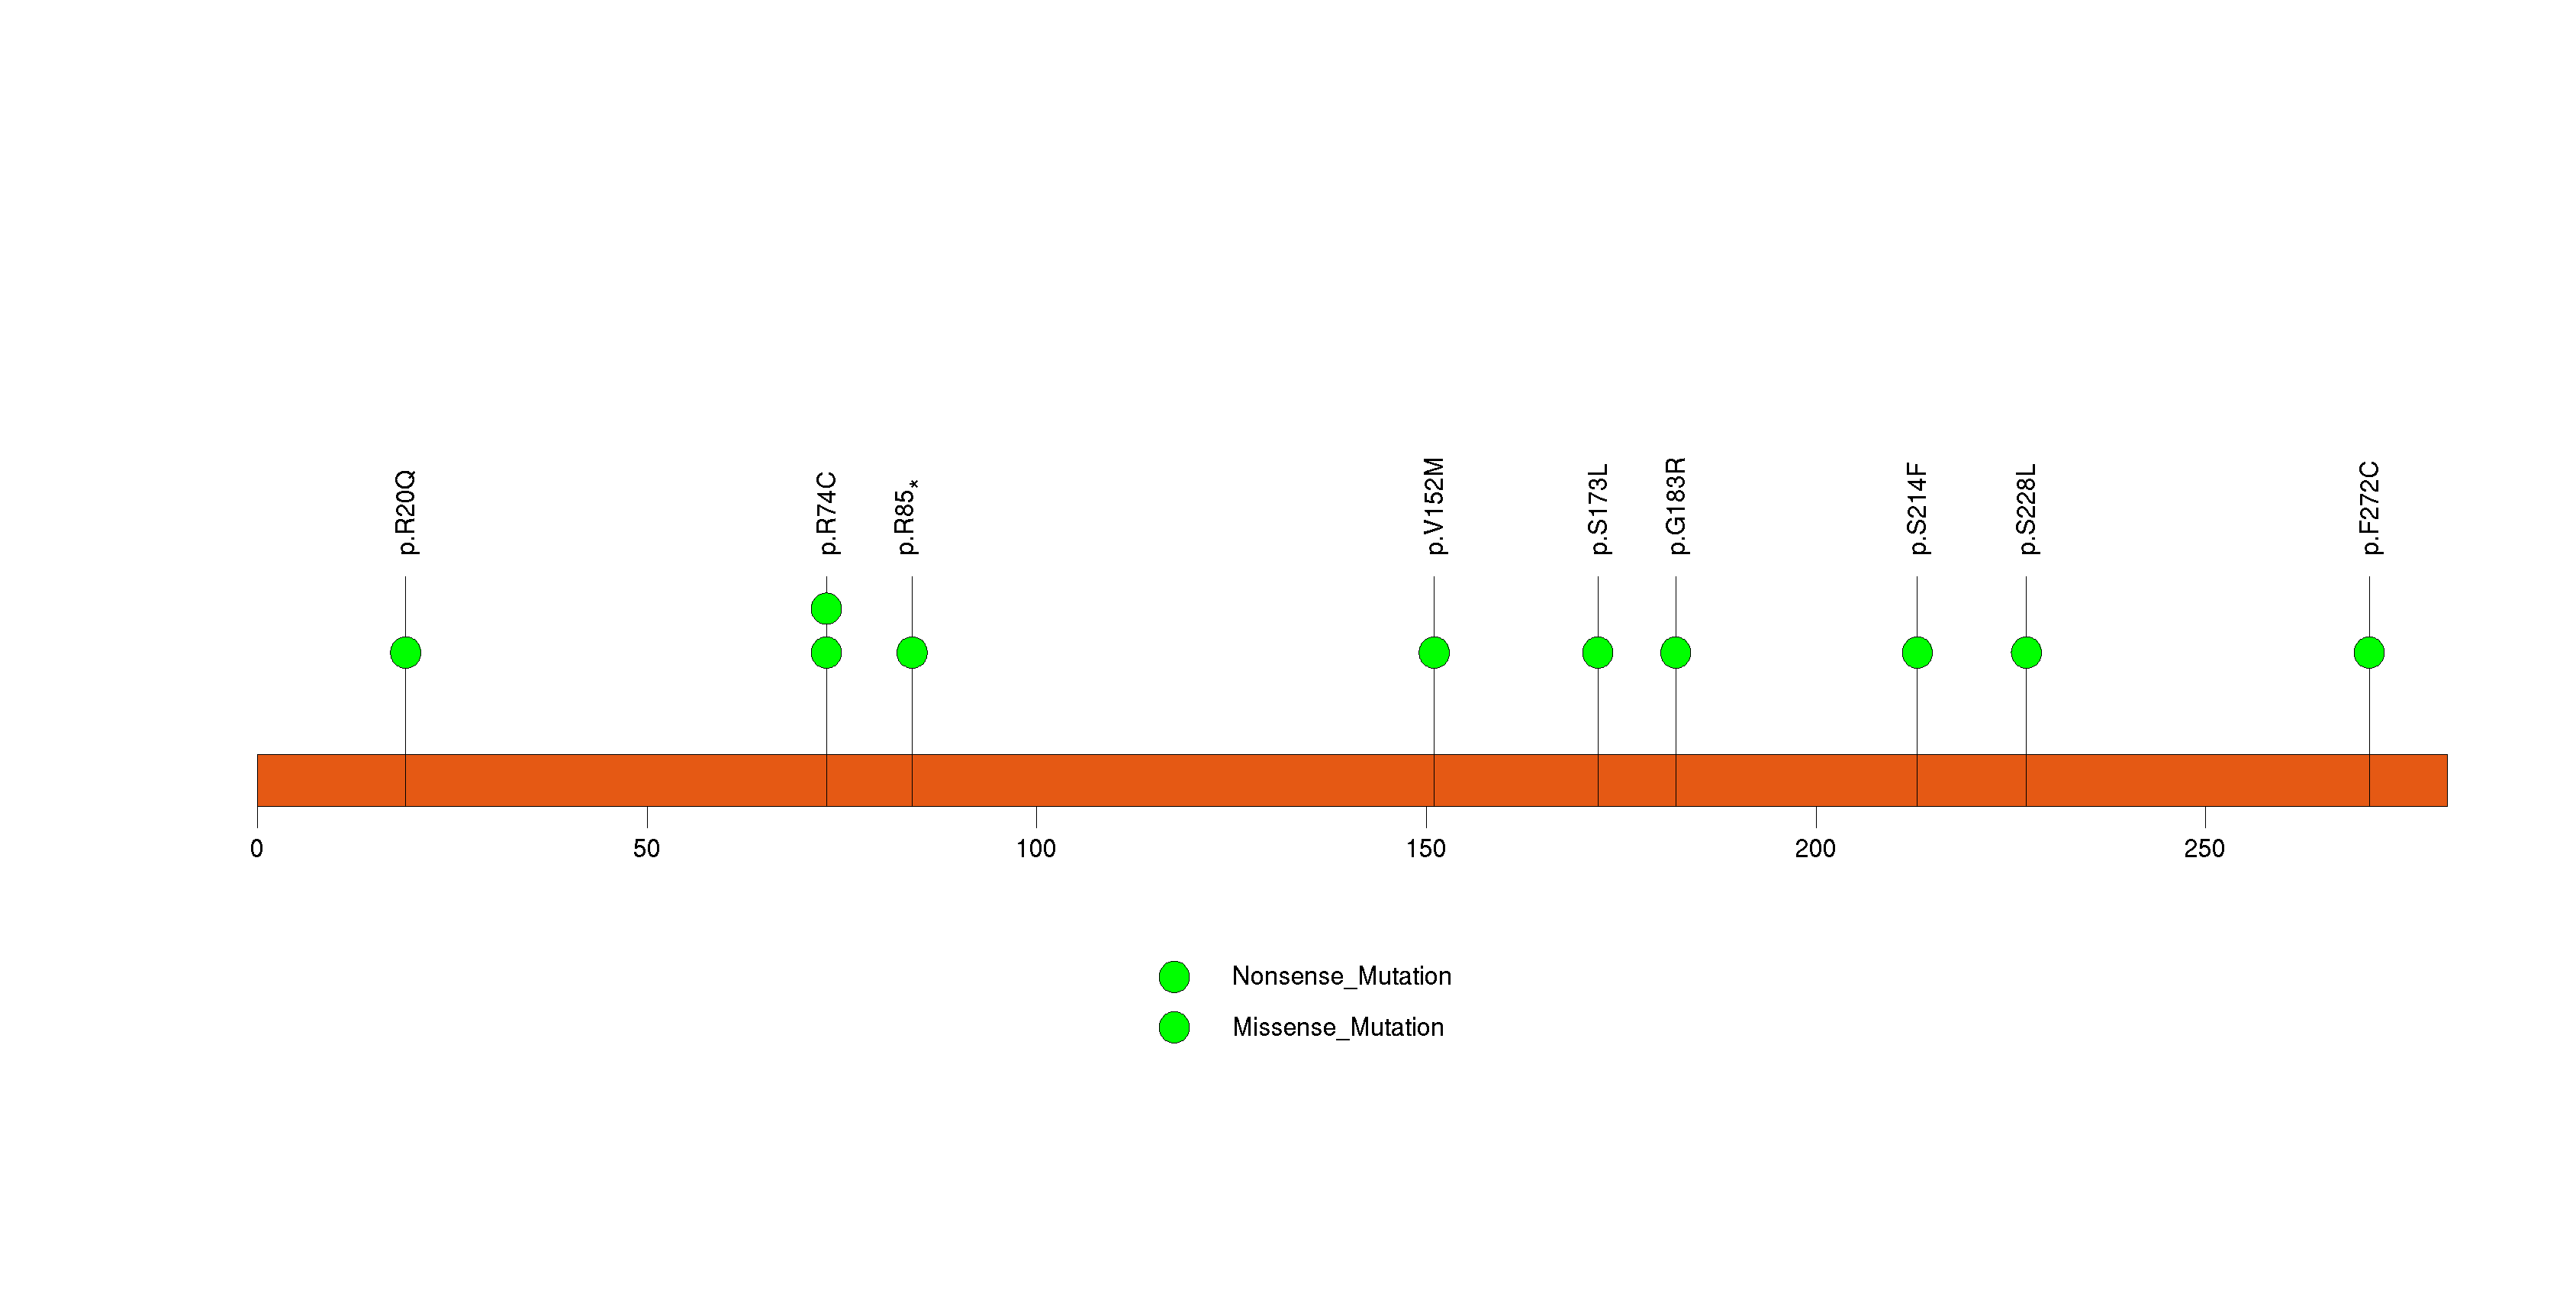
Figure S23. This figure depicts the distribution of mutations and mutation types across the GRXCR1 significant gene.
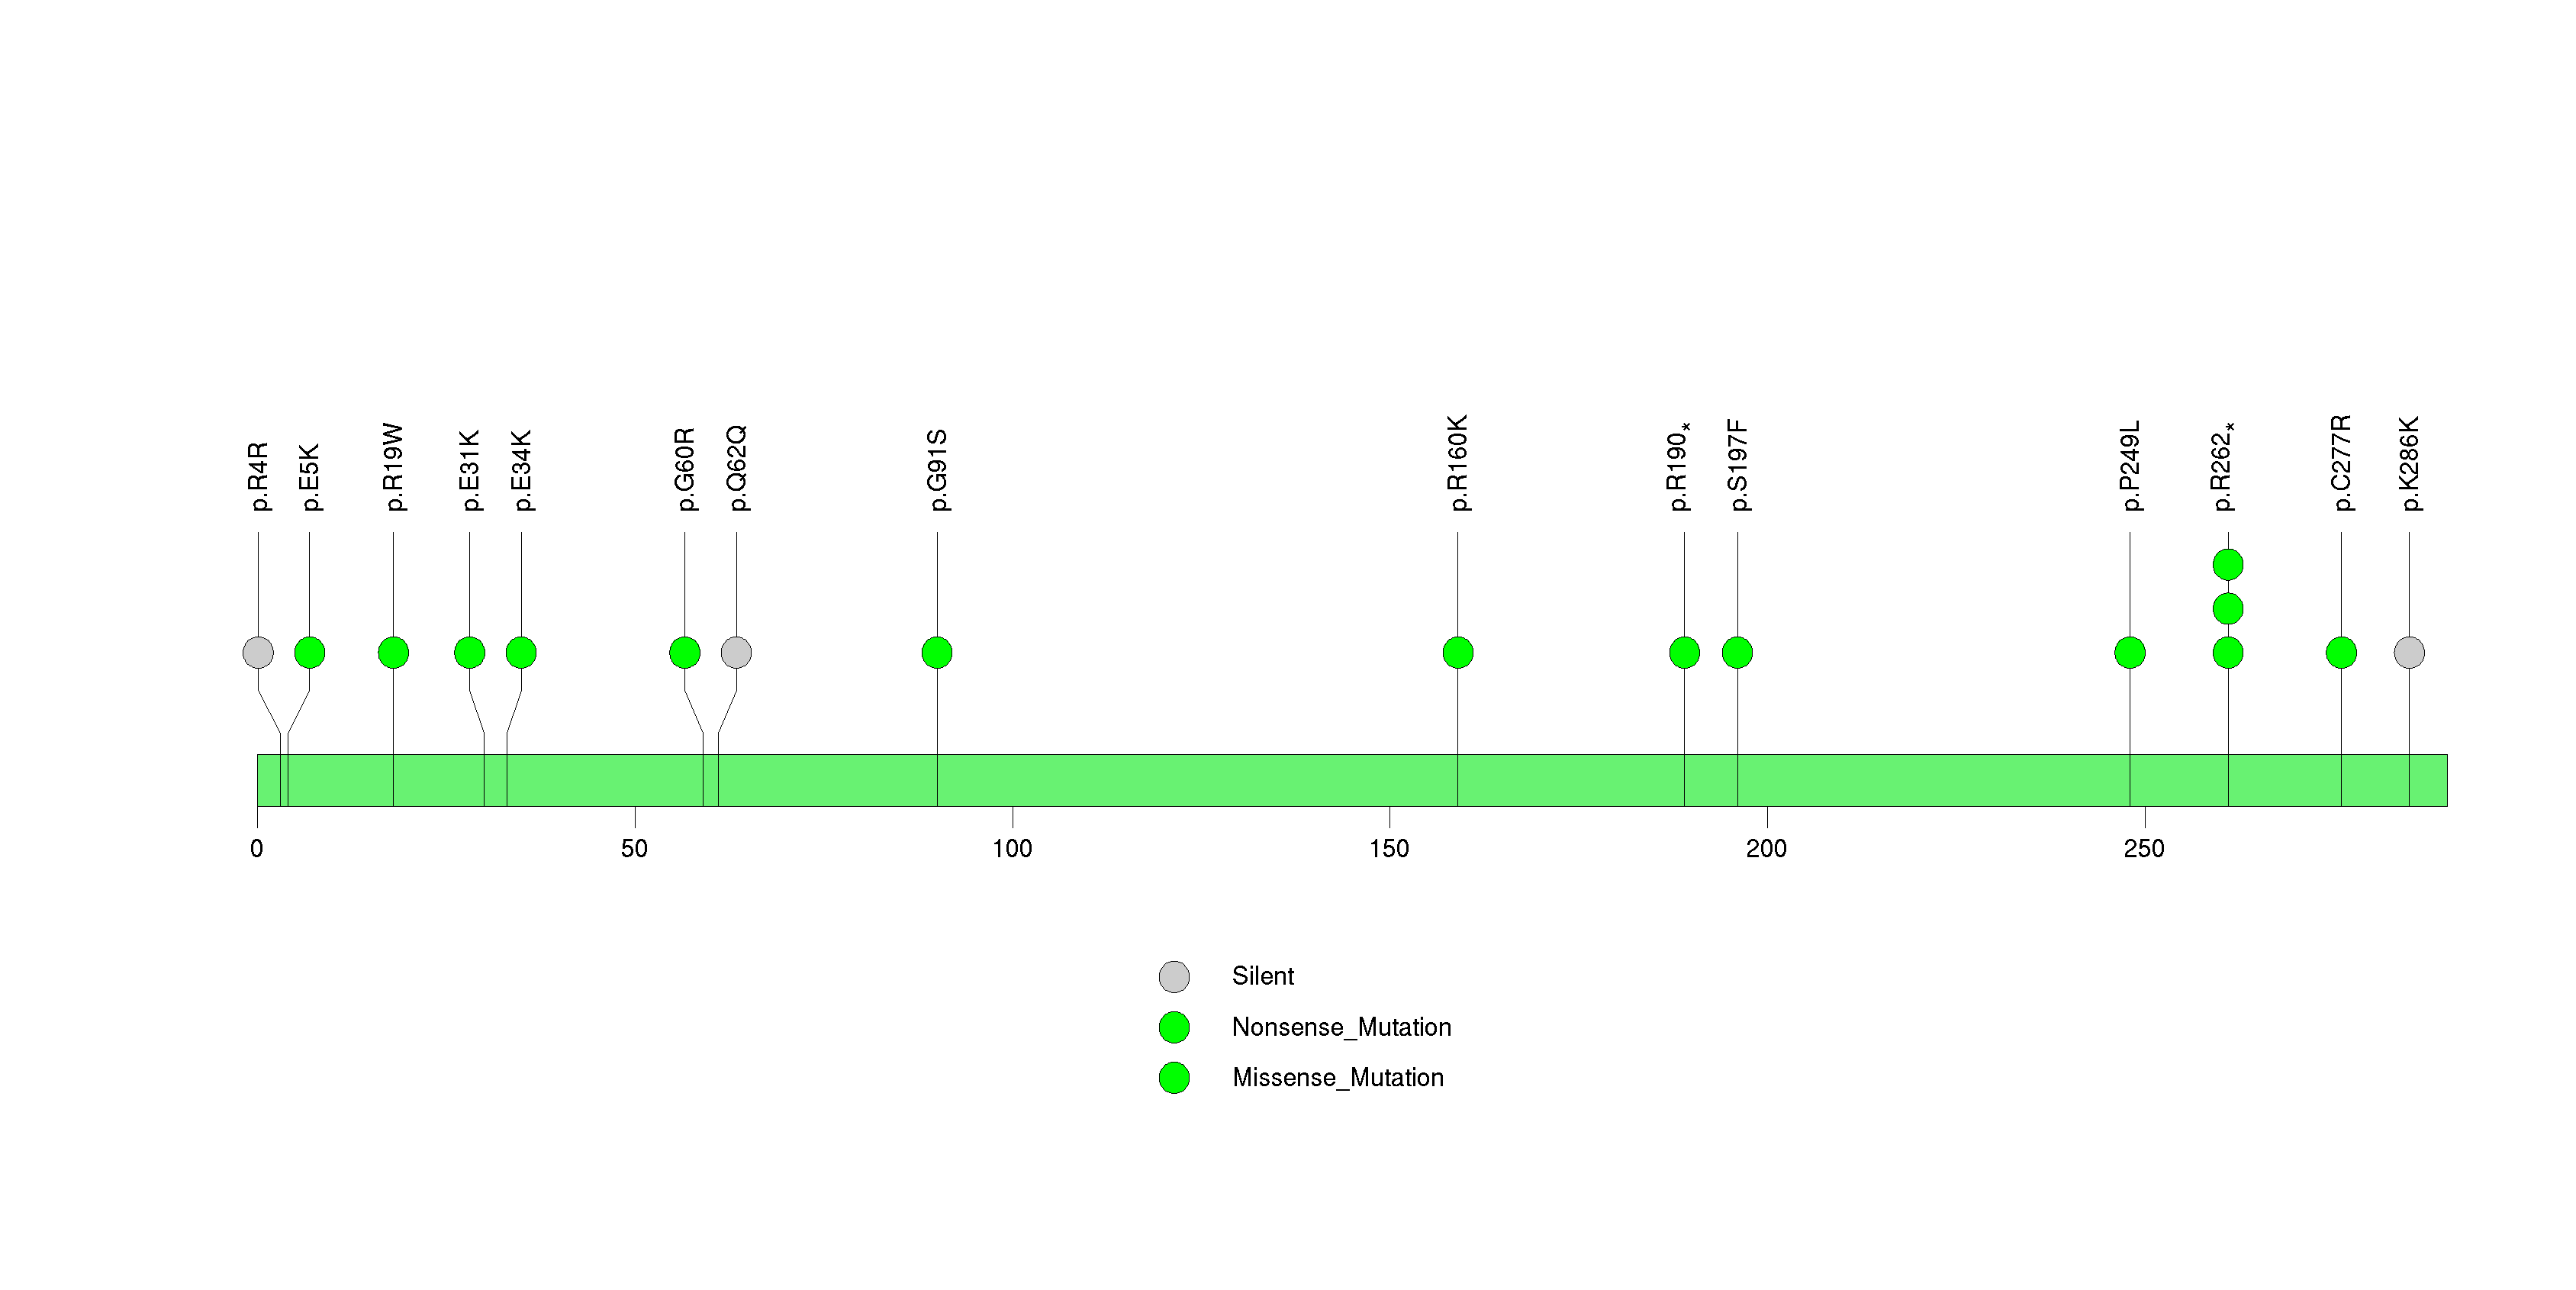
Figure S24. This figure depicts the distribution of mutations and mutation types across the OR10K2 significant gene.
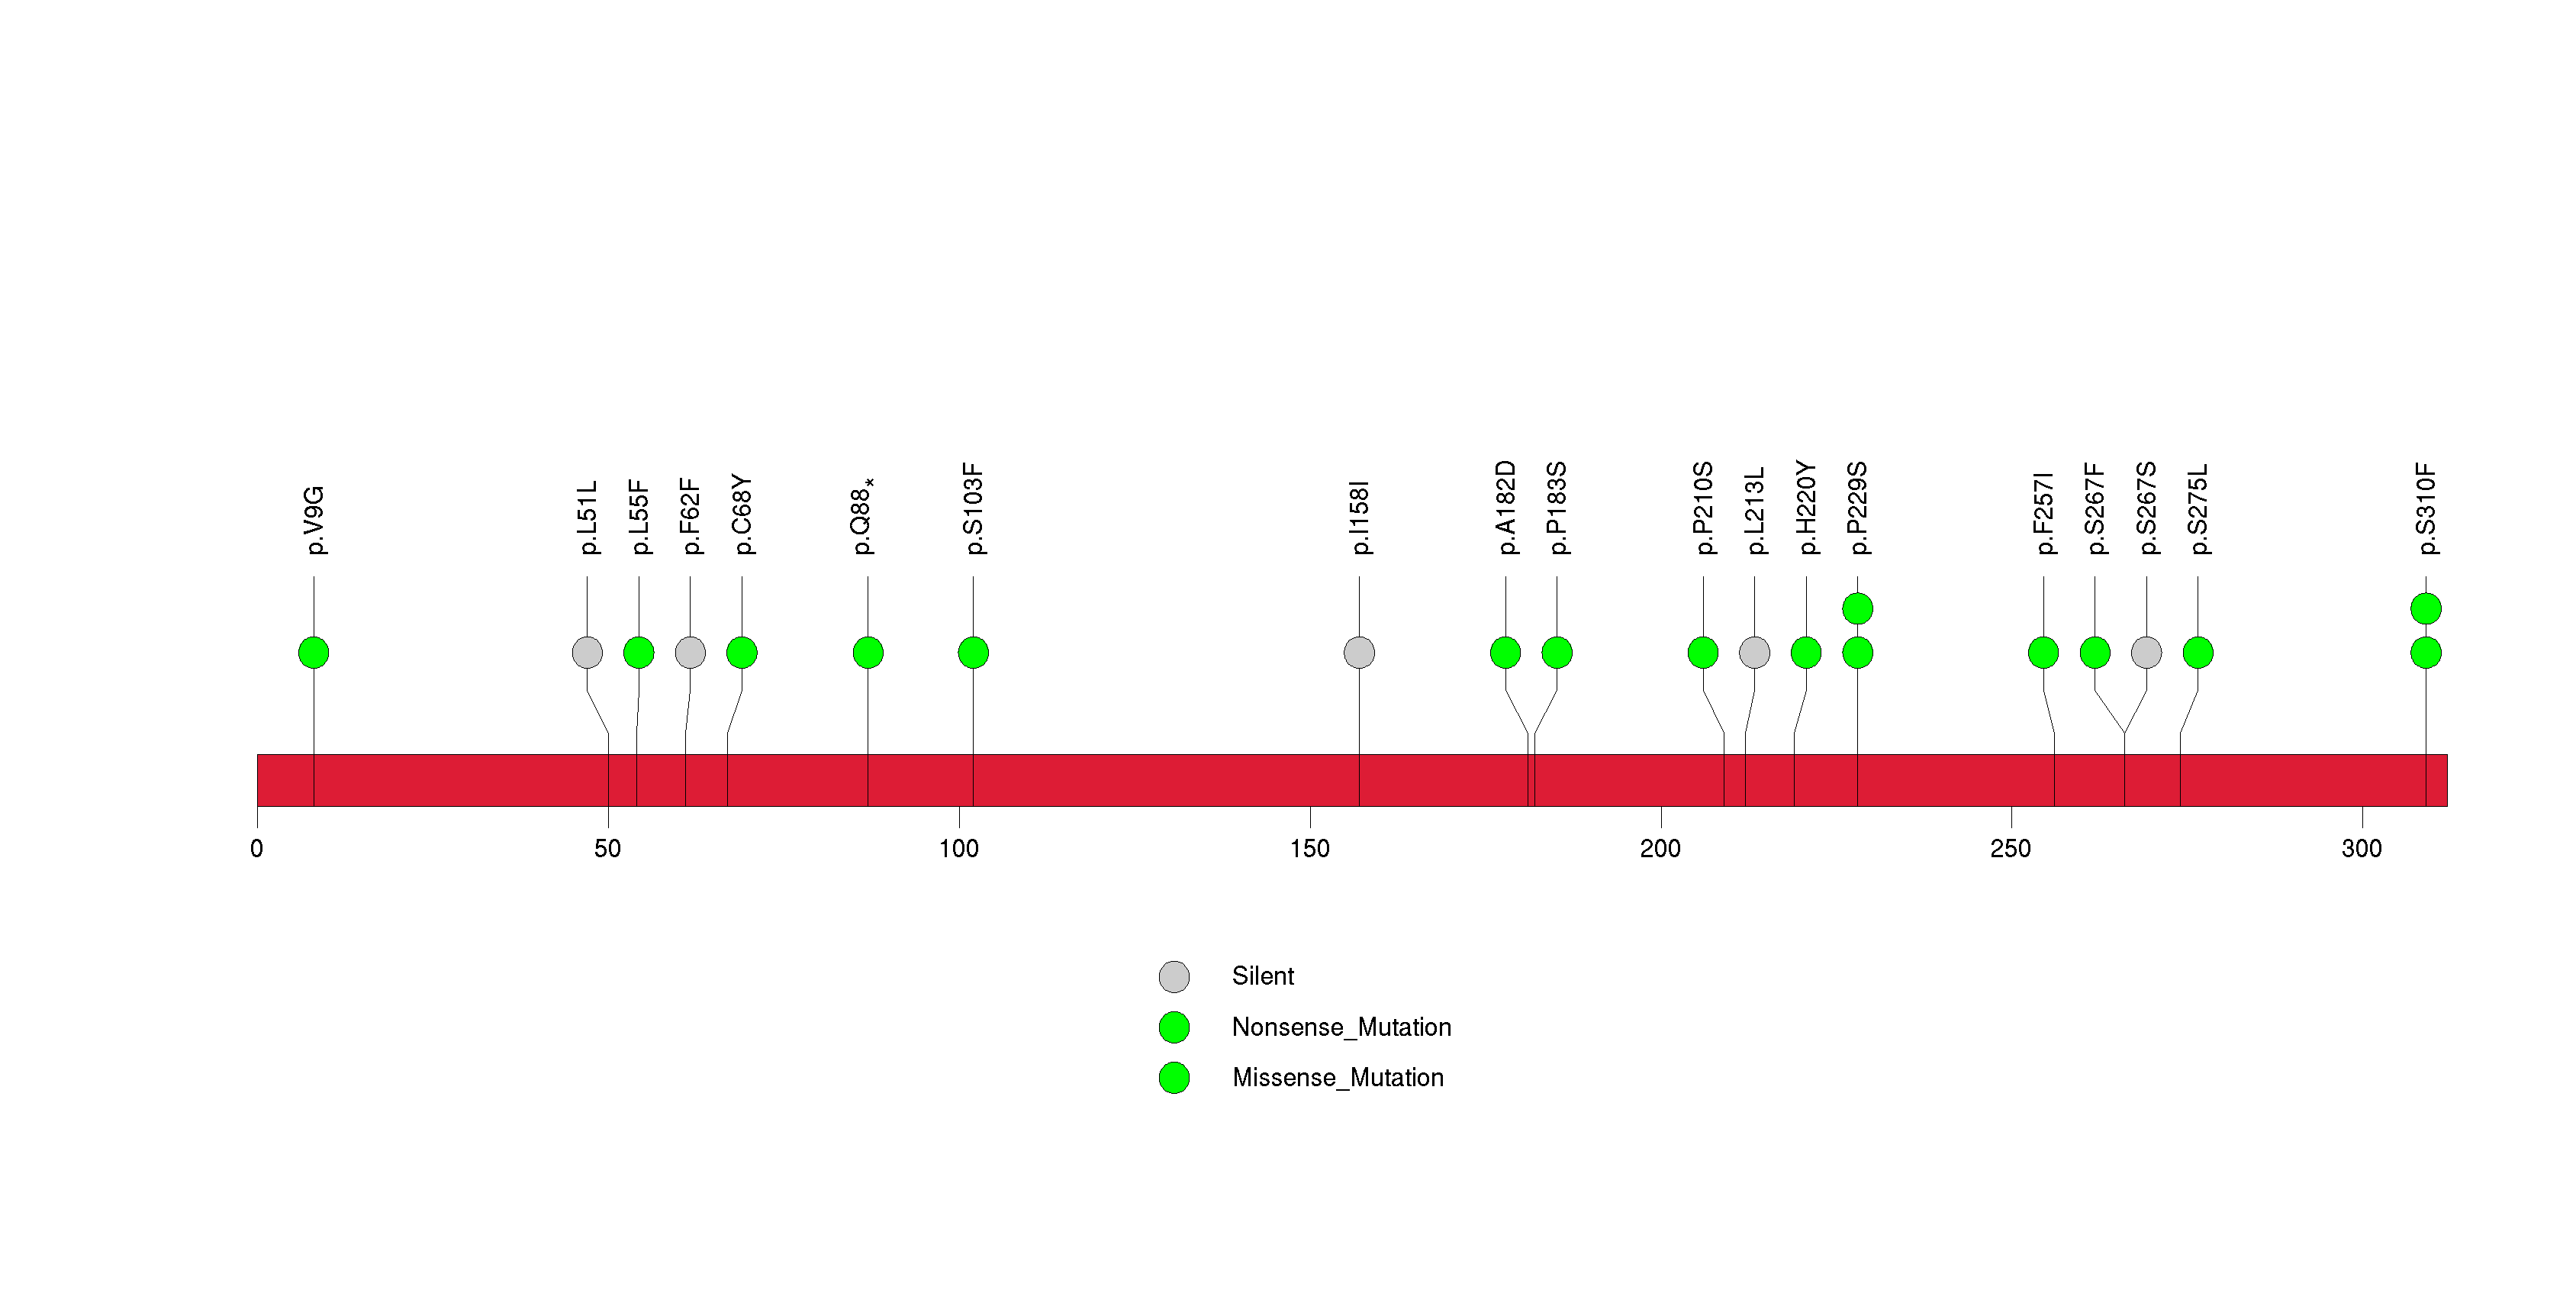
Figure S25. This figure depicts the distribution of mutations and mutation types across the CLVS2 significant gene.
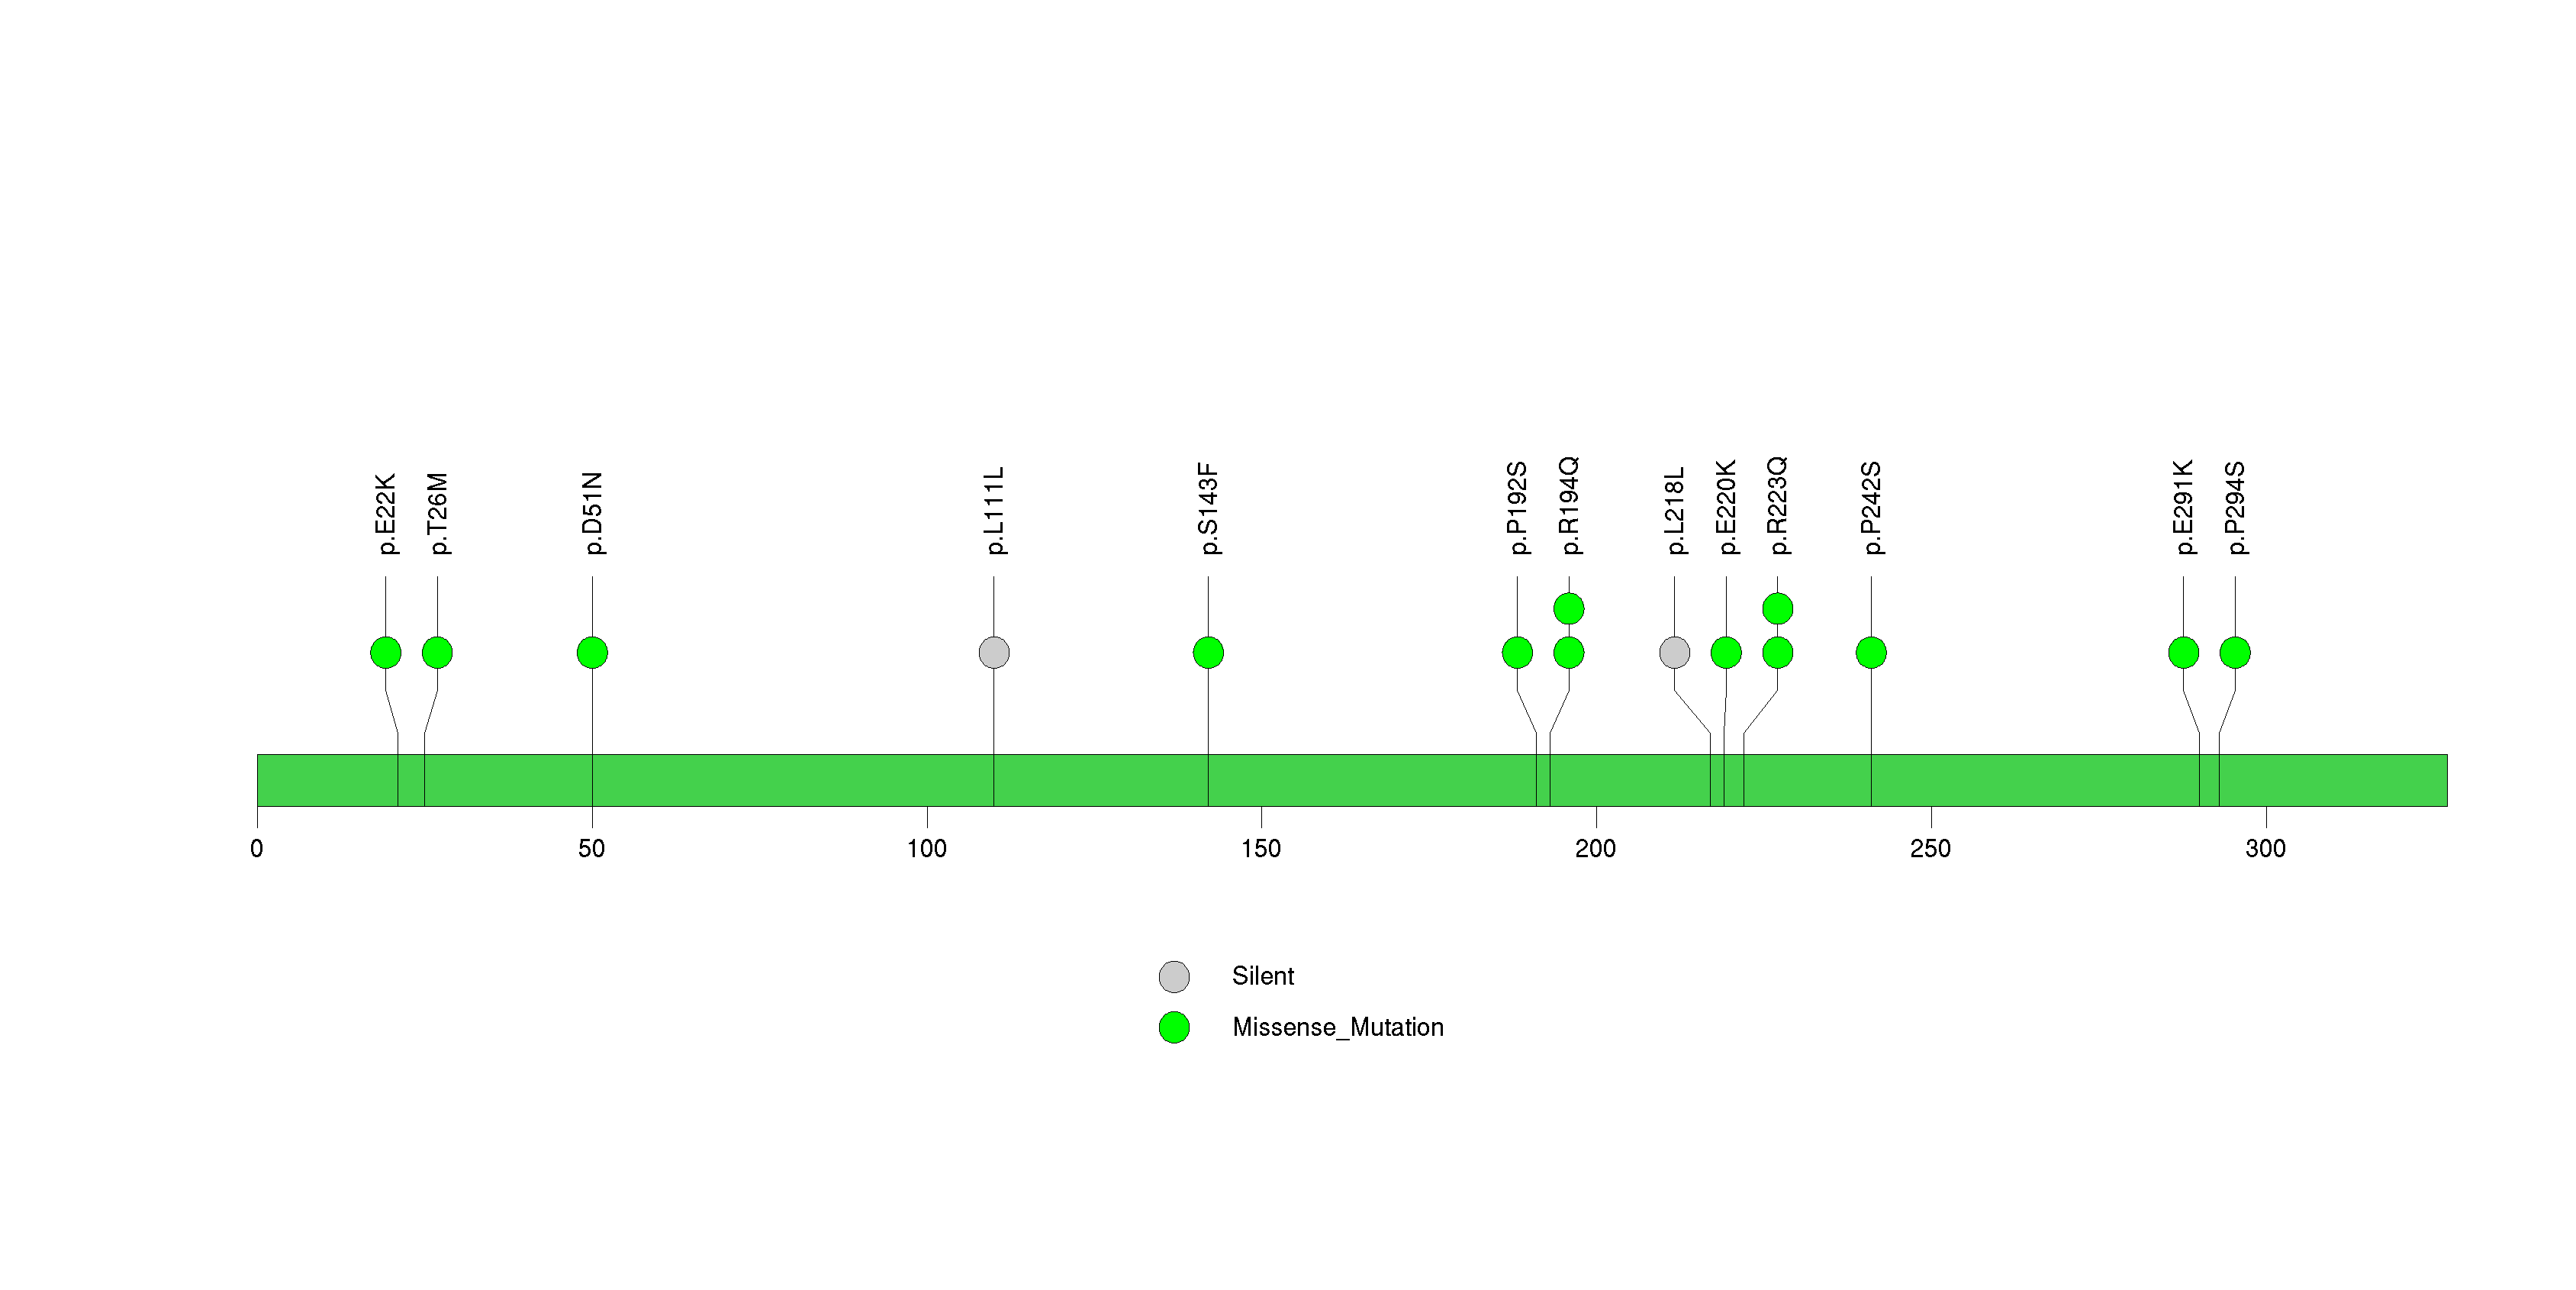
Figure S26. This figure depicts the distribution of mutations and mutation types across the TAF1A significant gene.
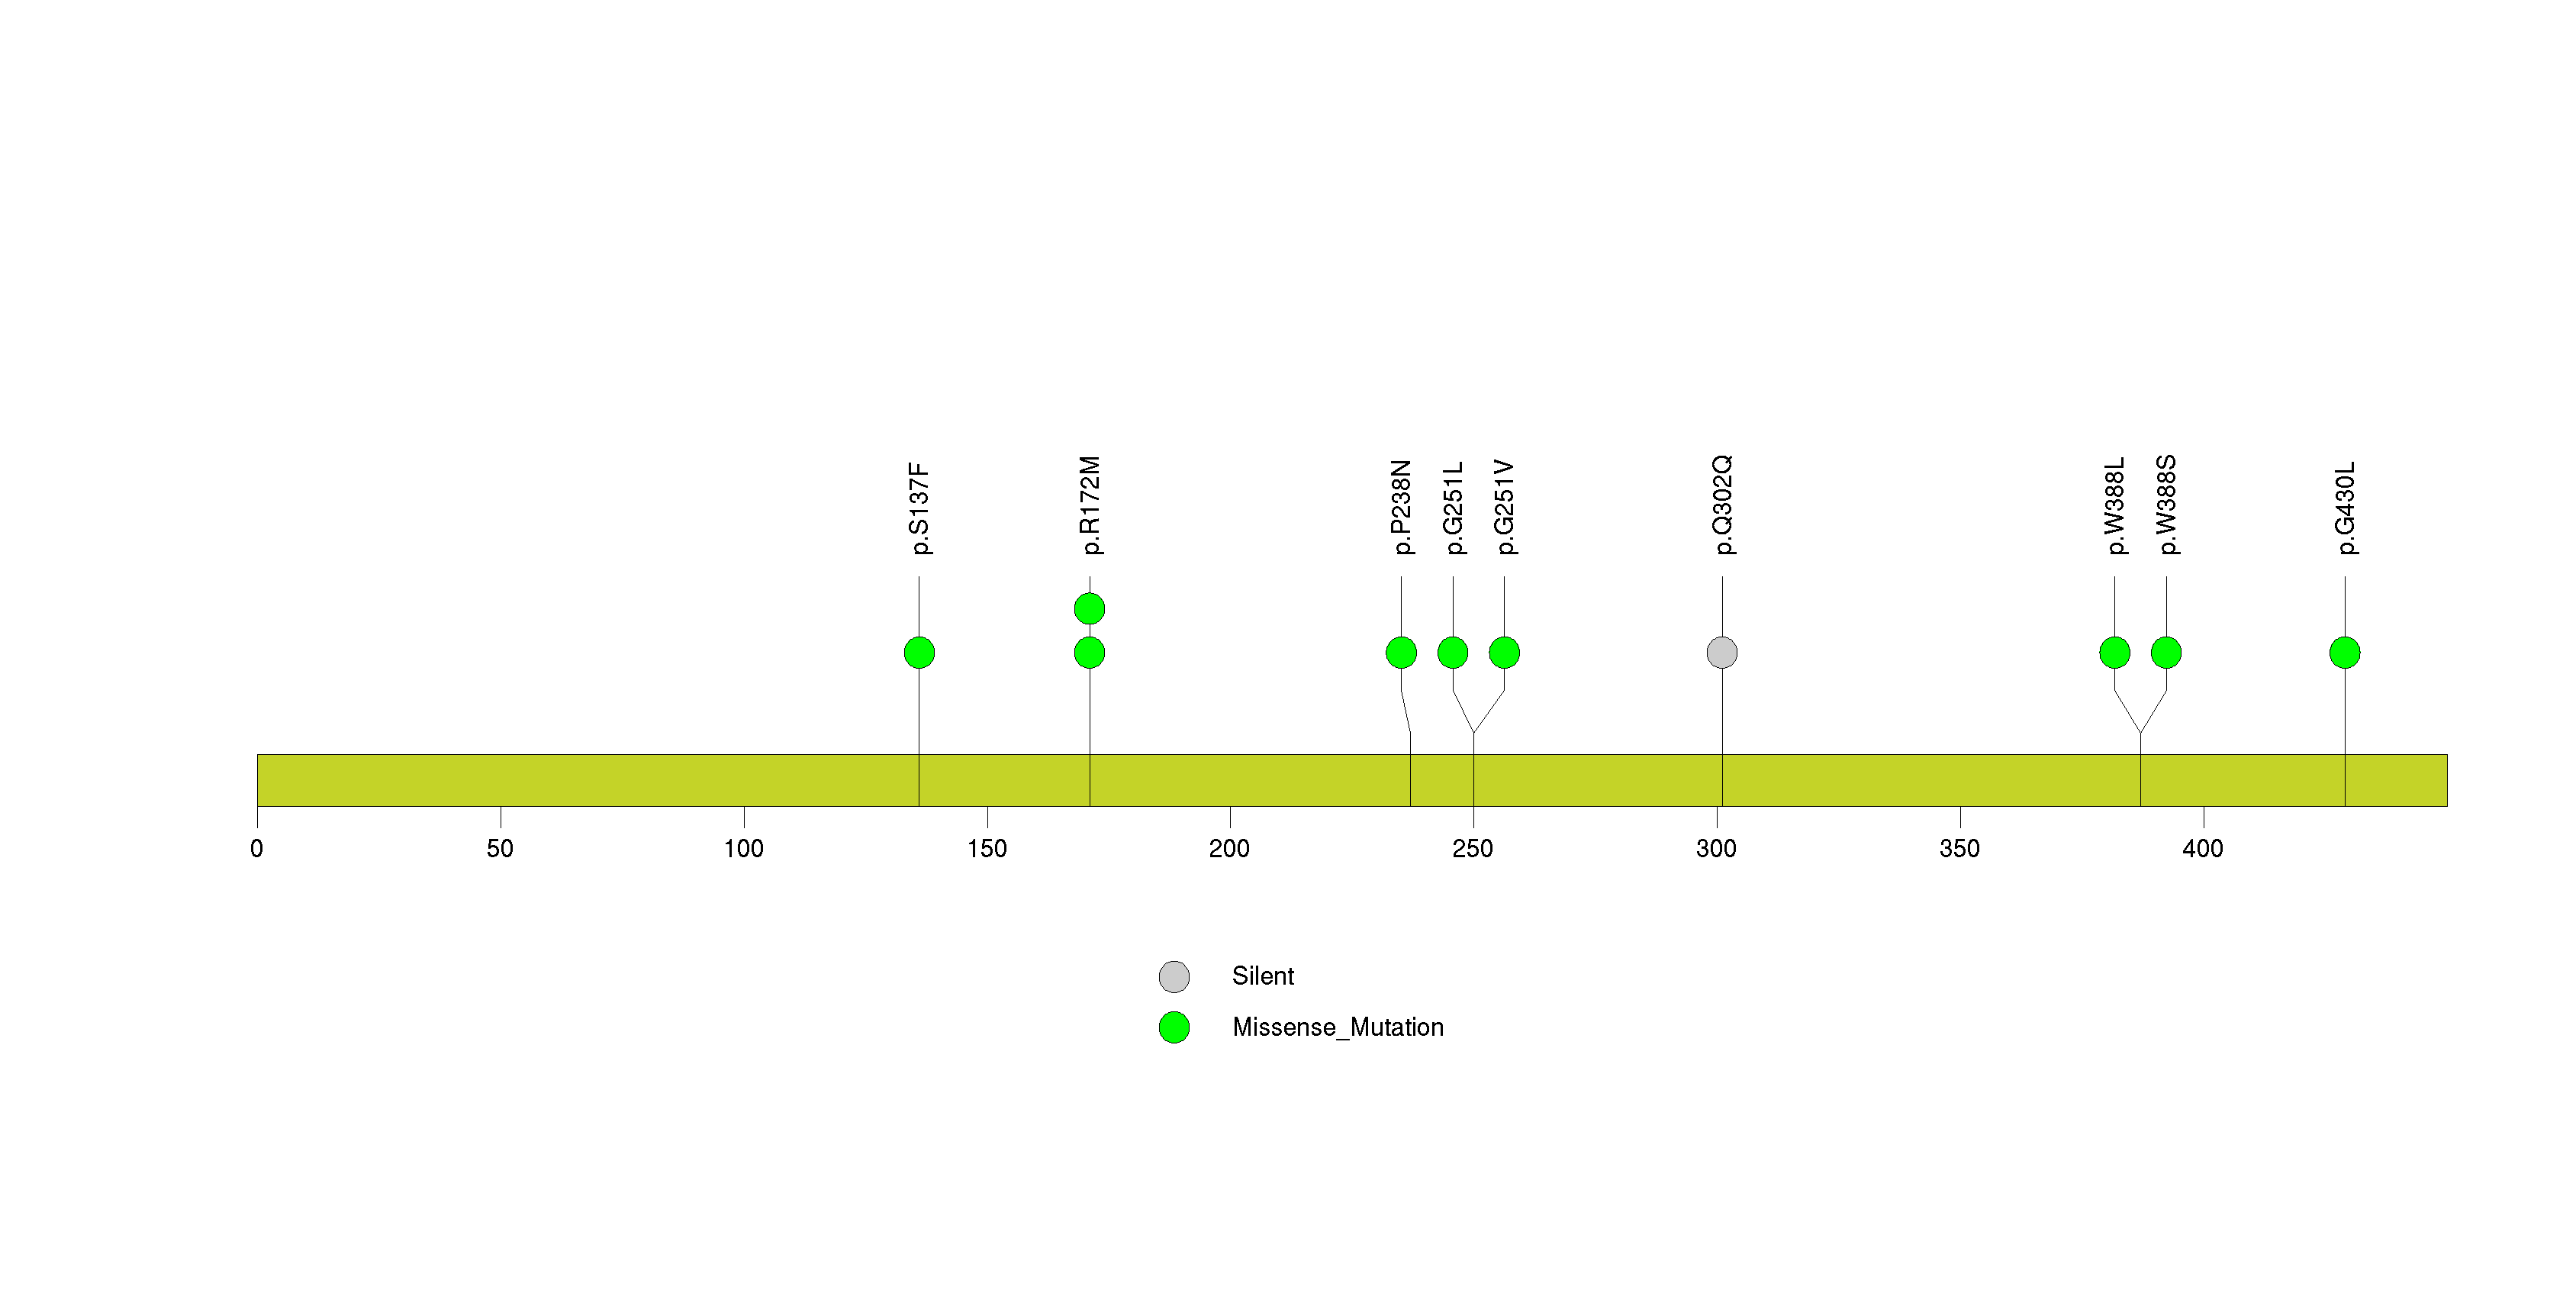
Figure S27. This figure depicts the distribution of mutations and mutation types across the HBD significant gene.

Figure S28. This figure depicts the distribution of mutations and mutation types across the CCDC102B significant gene.
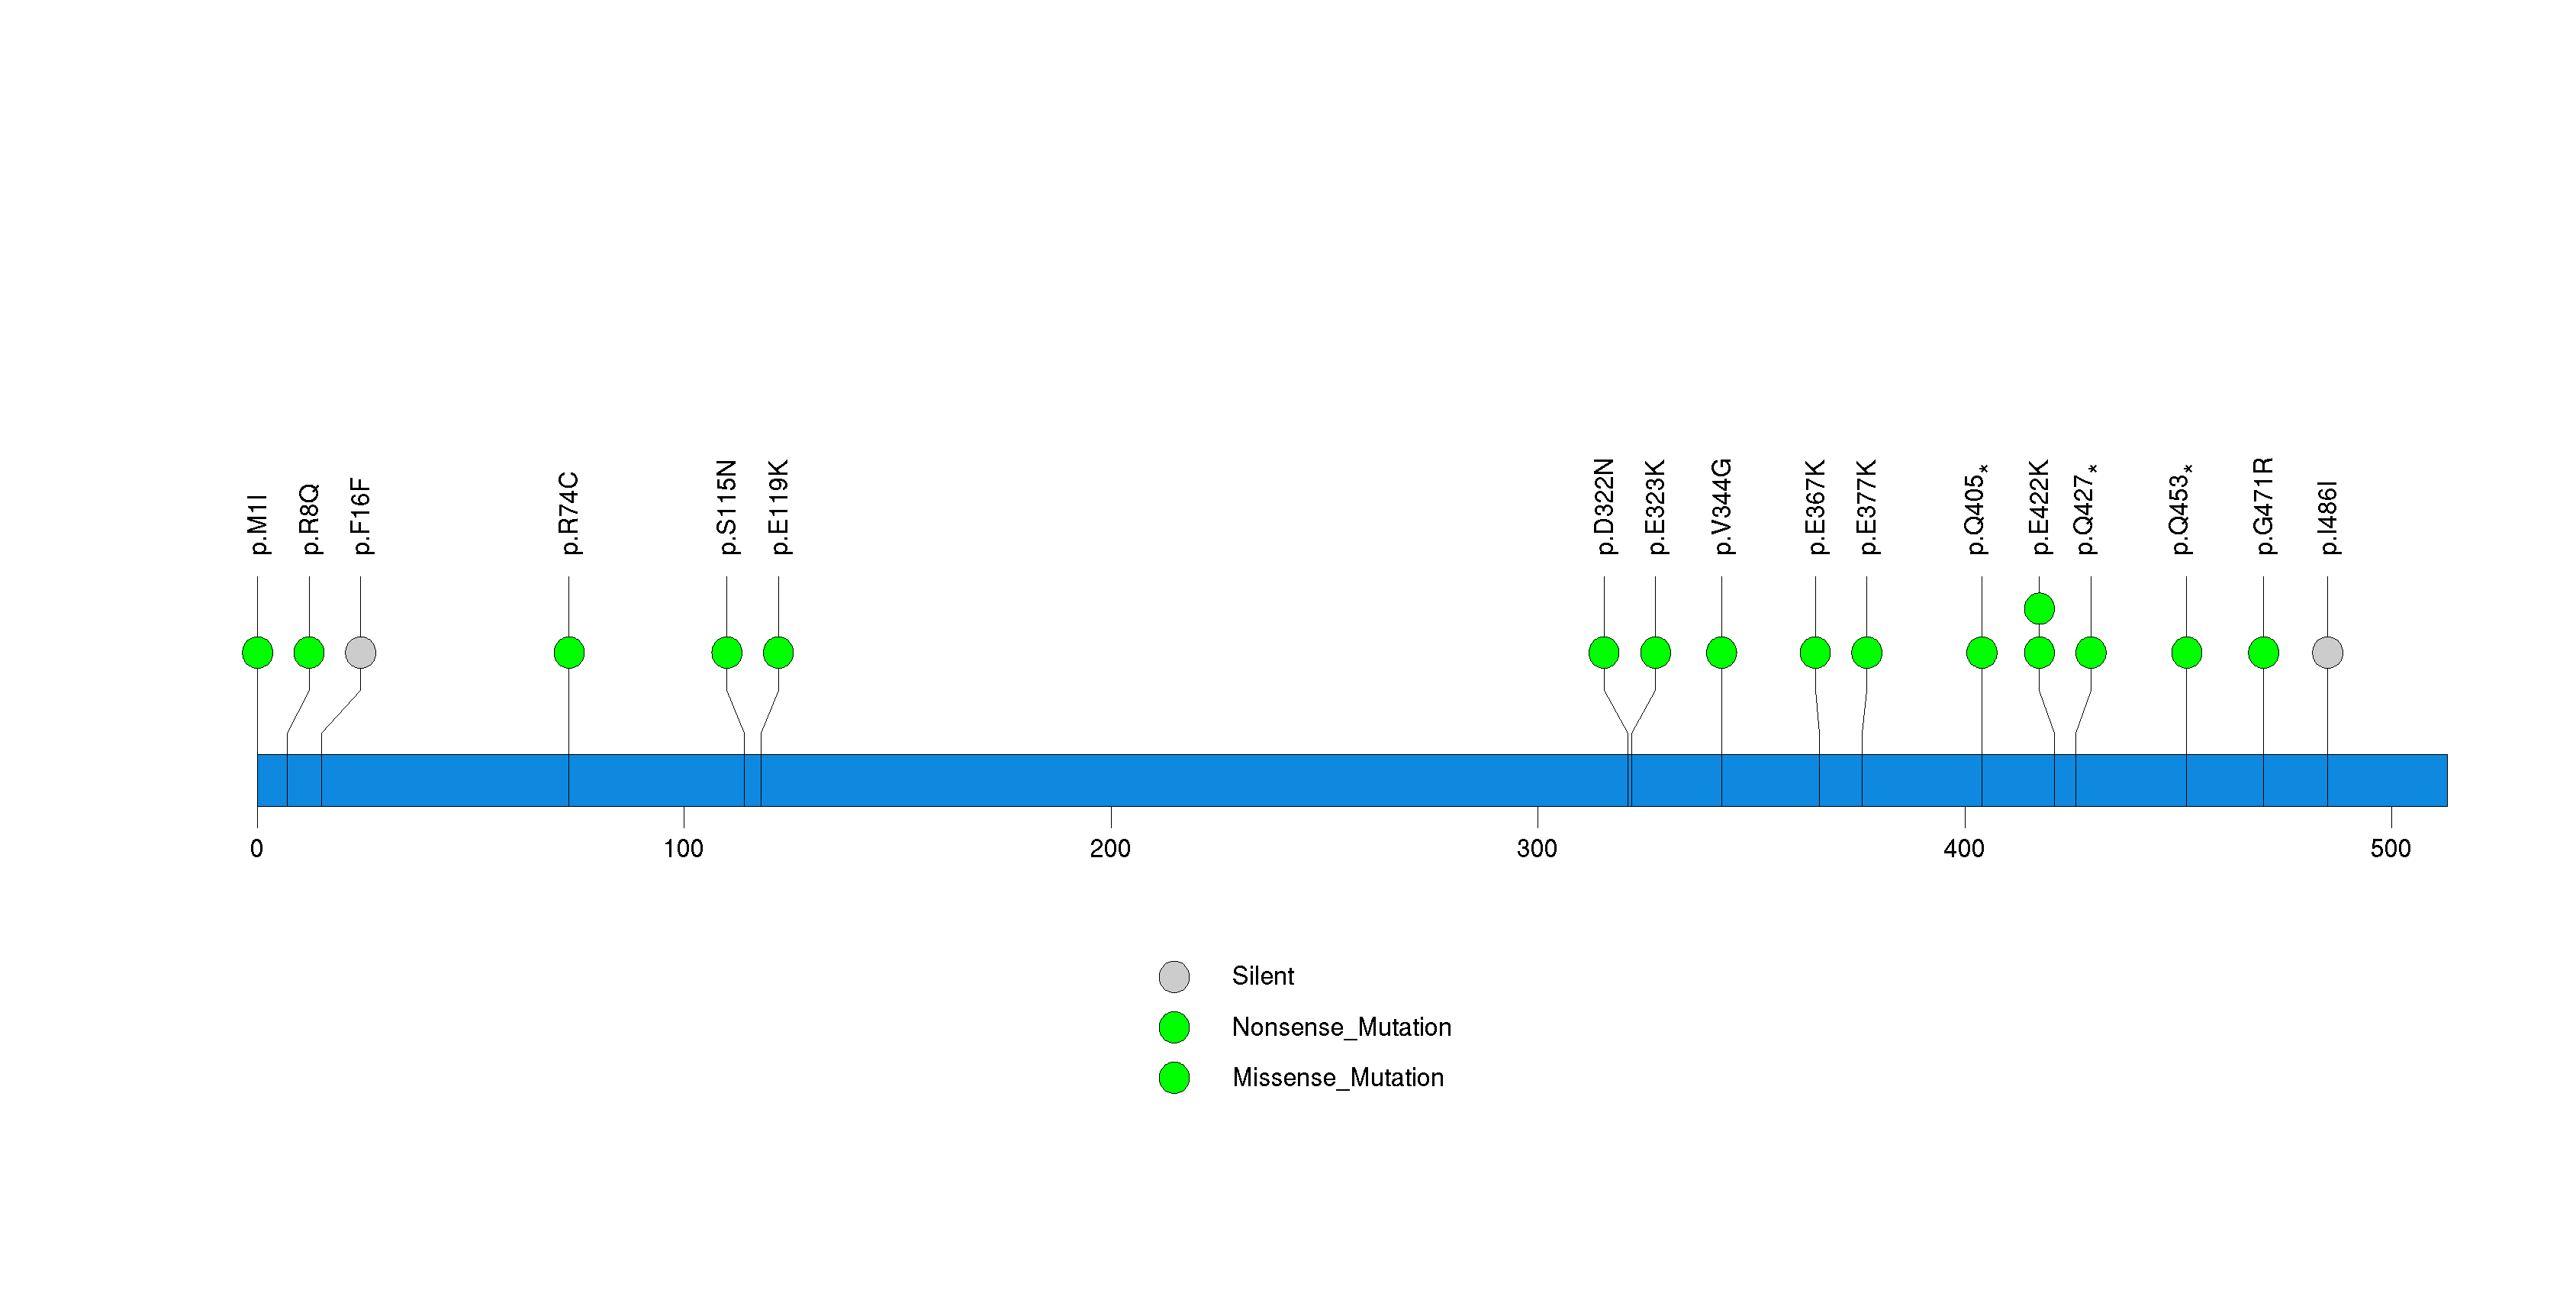
Figure S29. This figure depicts the distribution of mutations and mutation types across the OR9K2 significant gene.
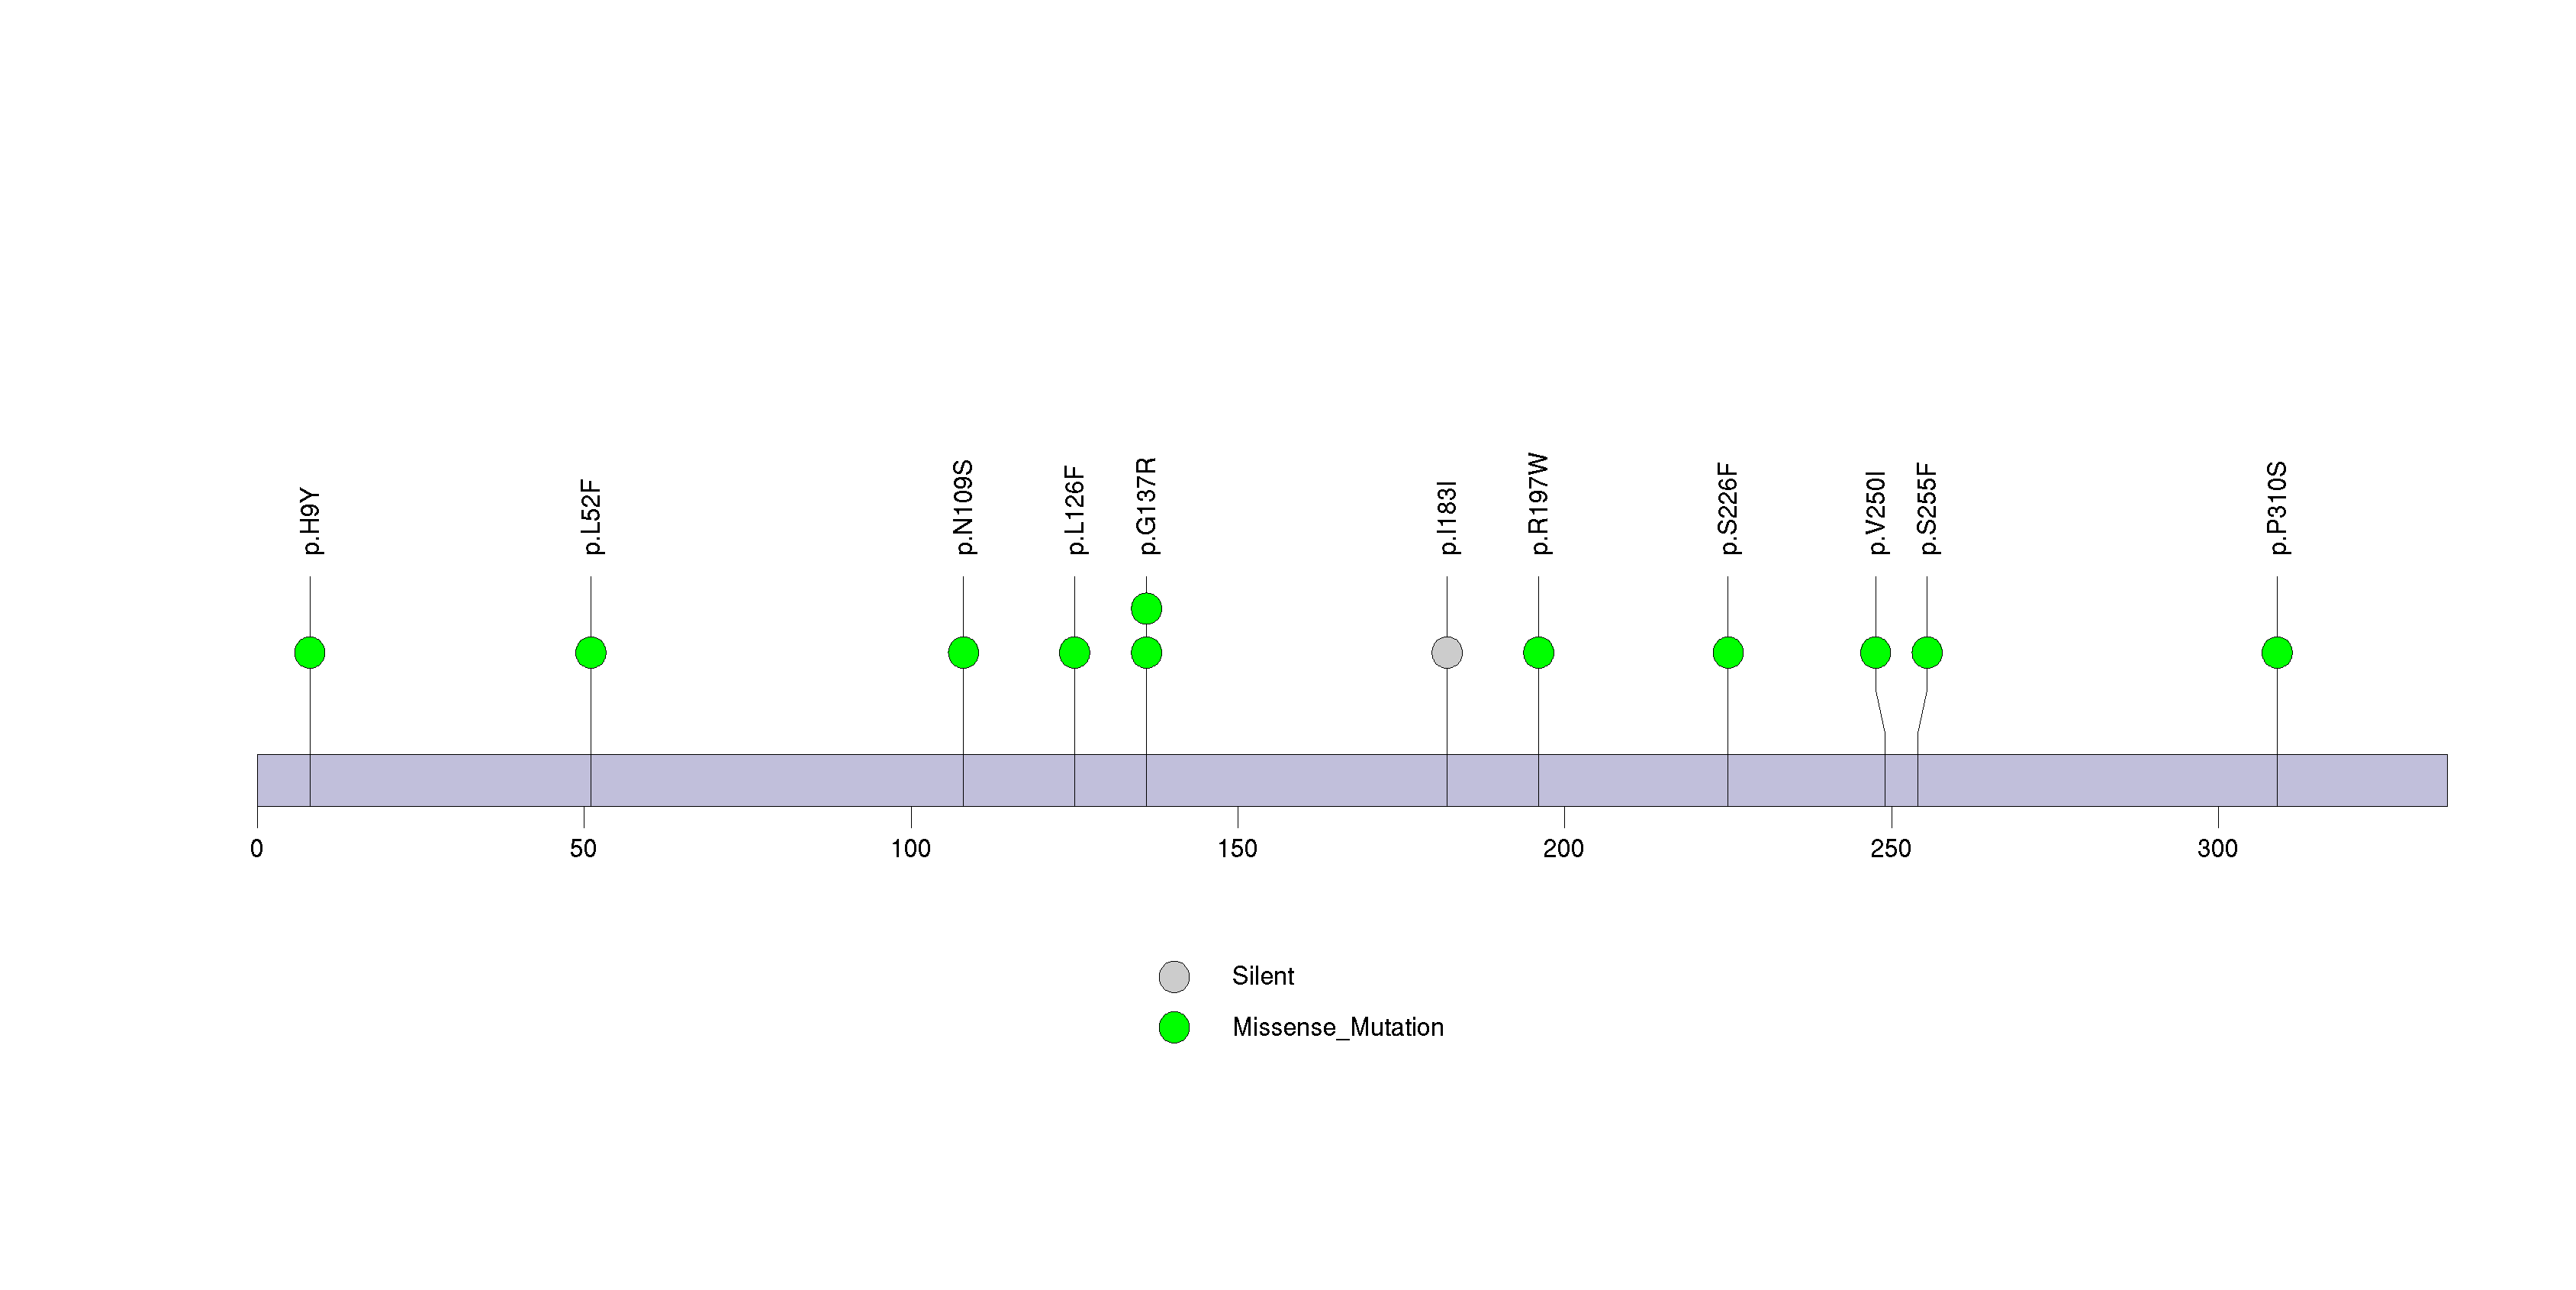
Figure S30. This figure depicts the distribution of mutations and mutation types across the ACSM2B significant gene.
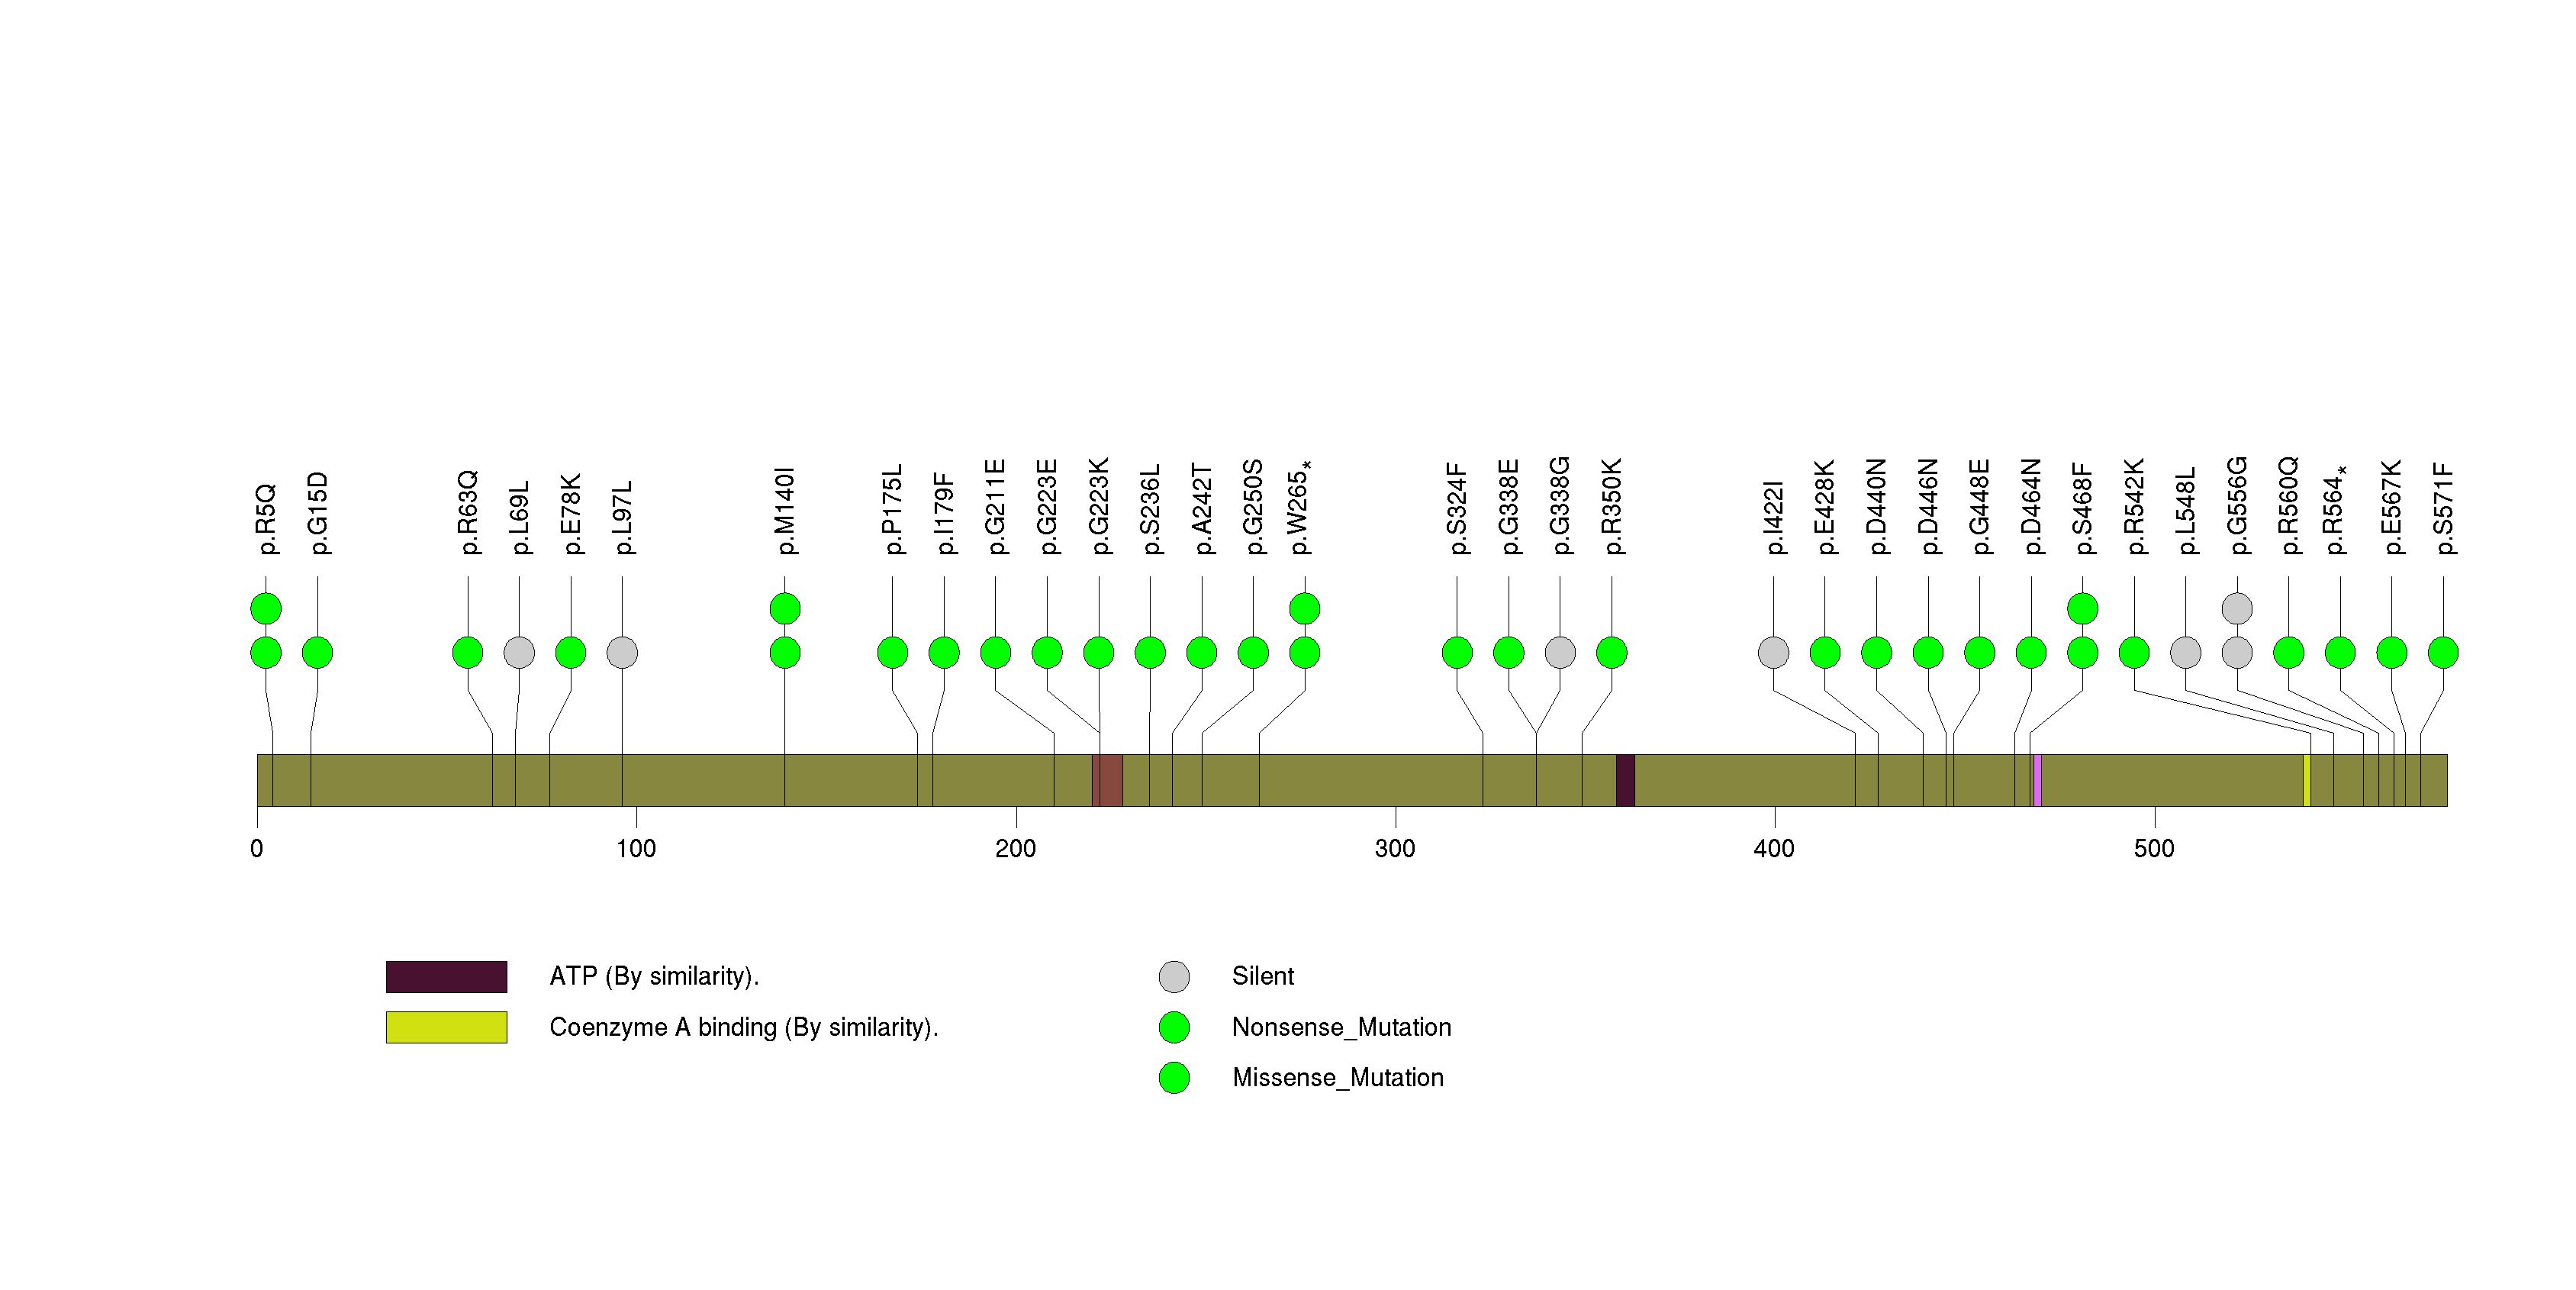
Figure S31. This figure depicts the distribution of mutations and mutation types across the LCE1B significant gene.
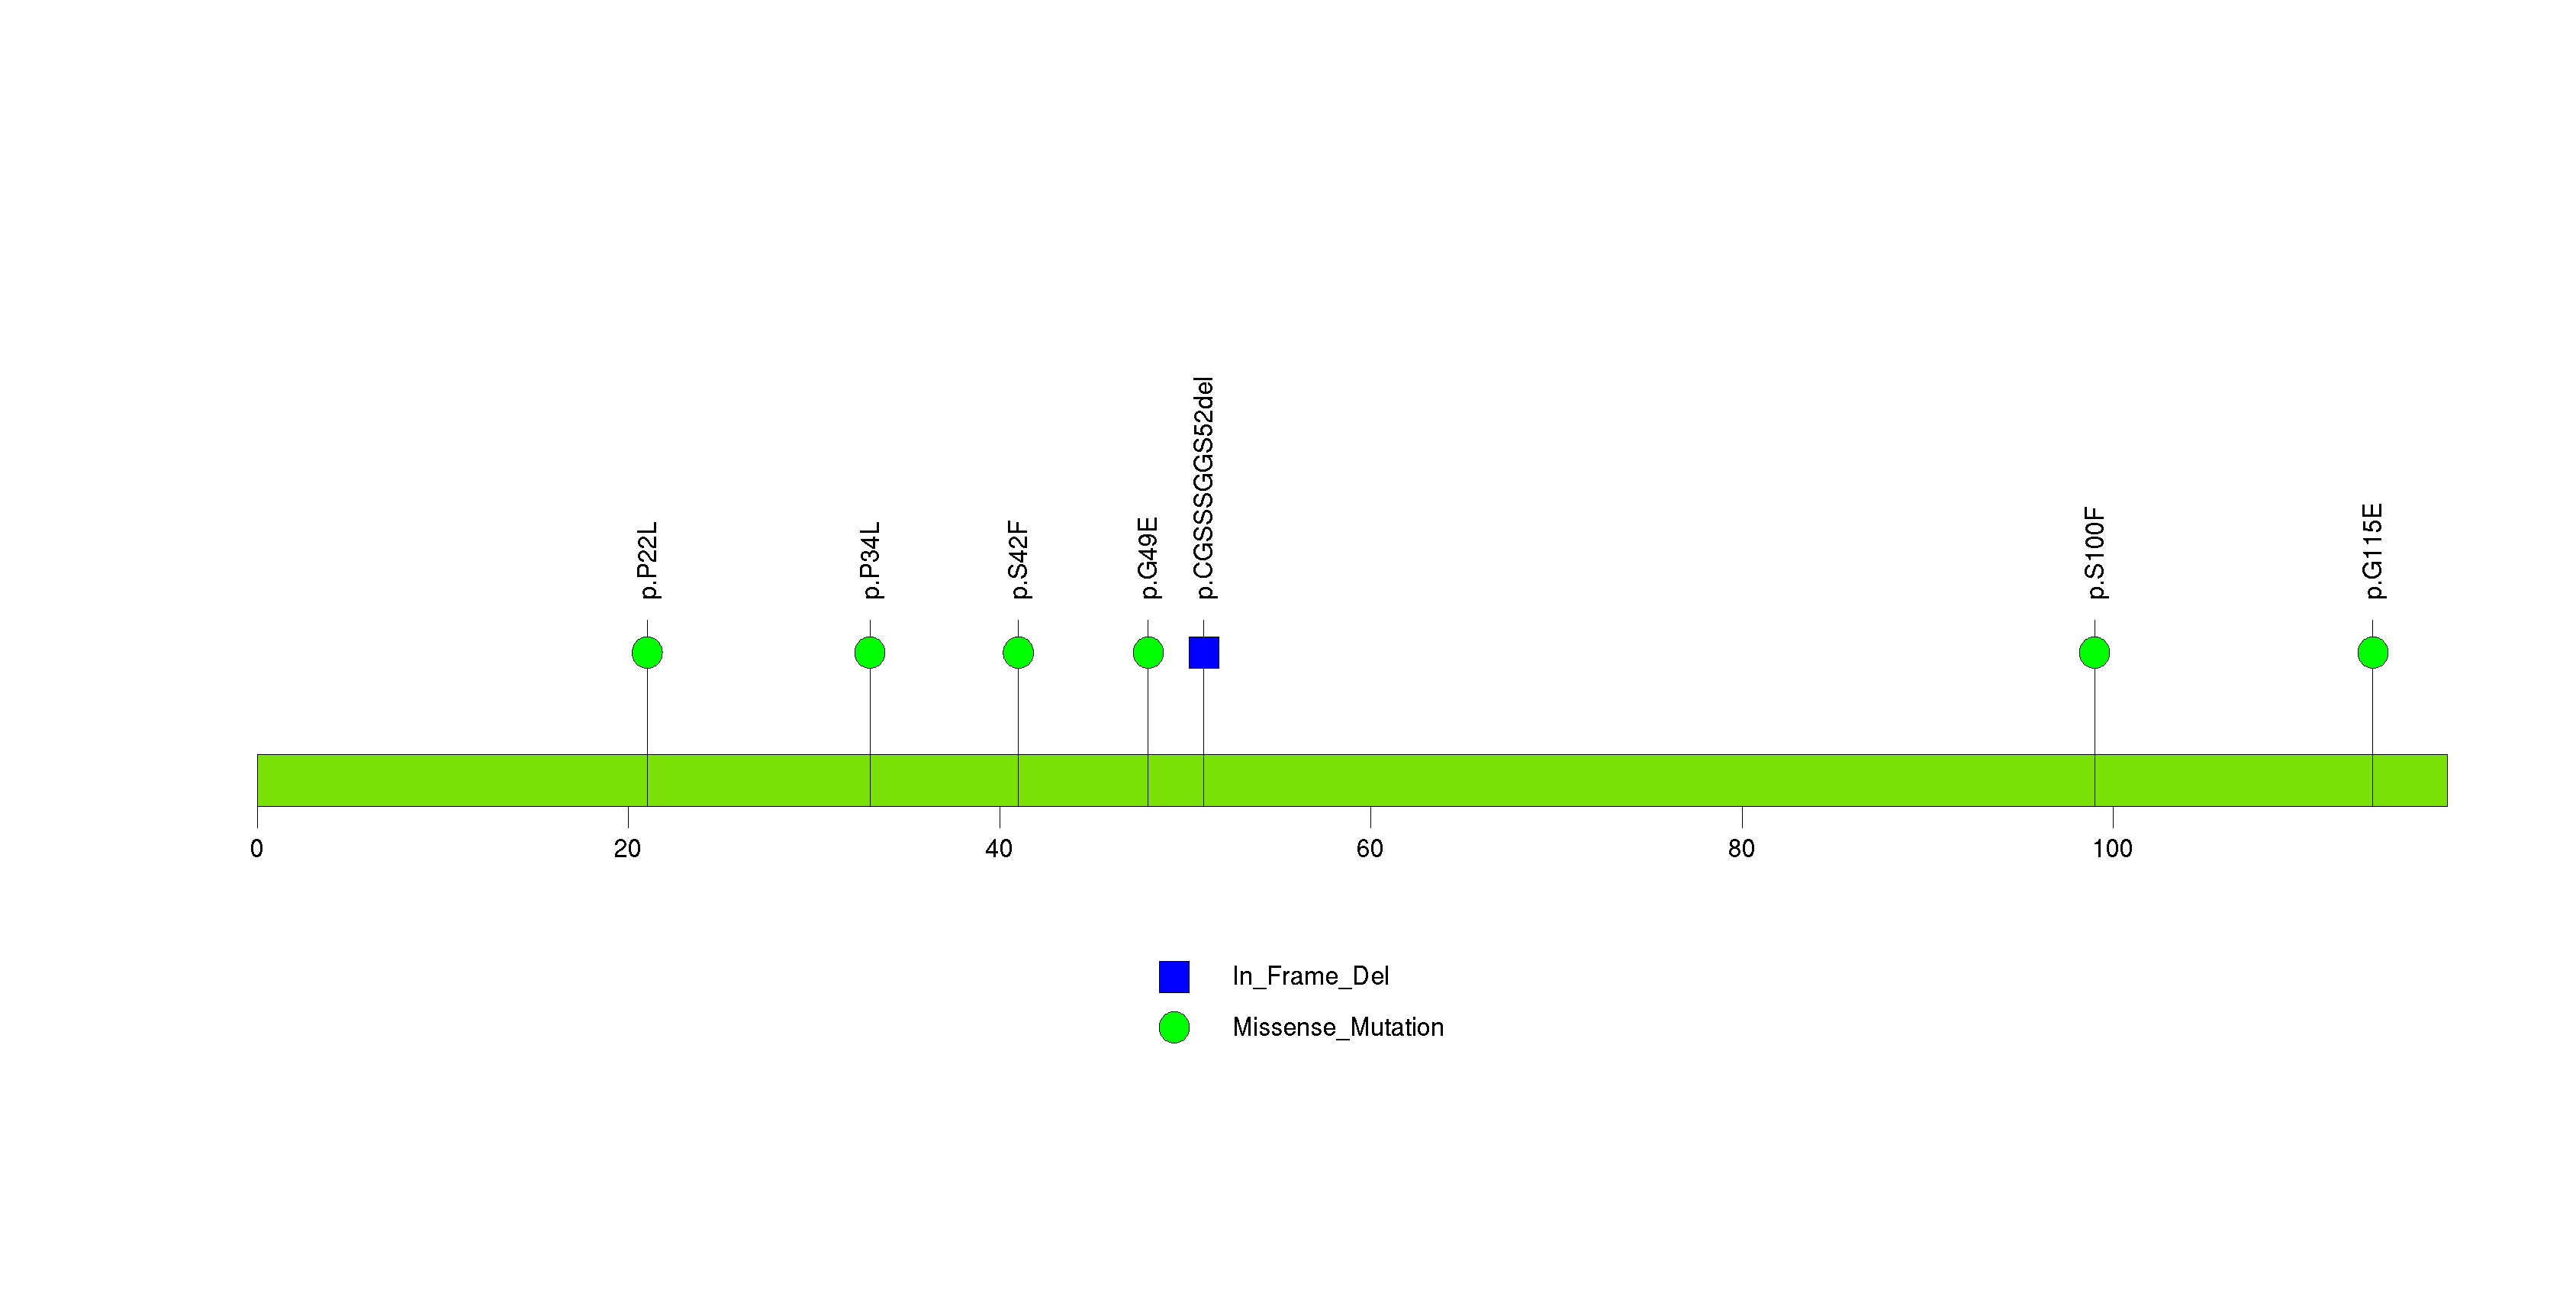
Figure S32. This figure depicts the distribution of mutations and mutation types across the CA1 significant gene.
In this analysis, COSMIC is used as a filter to increase power by restricting the territory of each gene. Cosmic version: v48.
Table 4. Get Full Table Significantly mutated genes (COSMIC territory only). To access the database please go to: COSMIC. Number of significant genes found: 30. Number of genes displayed: 10
| rank | gene | description | n | cos | n_cos | N_cos | cos_ev | p | q |
|---|---|---|---|---|---|---|---|---|---|
| 1 | IDH1 | isocitrate dehydrogenase 1 (NADP+), soluble | 7 | 5 | 6 | 685 | 8952 | 3.4e-14 | 1.5e-10 |
| 2 | STK19 | serine/threonine kinase 19 | 11 | 2 | 5 | 274 | 10 | 7.2e-14 | 1.6e-10 |
| 3 | NRAS | neuroblastoma RAS viral (v-ras) oncogene homolog | 39 | 33 | 39 | 4521 | 49232 | 1.1e-13 | 1.6e-10 |
| 4 | BRAF | v-raf murine sarcoma viral oncogene homolog B1 | 78 | 89 | 72 | 12193 | 890854 | 2.5e-13 | 2.8e-10 |
| 5 | TP53 | tumor protein p53 | 26 | 356 | 24 | 48772 | 2841 | 4.4e-13 | 3.3e-10 |
| 6 | CDKN2A | cyclin-dependent kinase inhibitor 2A (melanoma, p16, inhibits CDK4) | 23 | 332 | 23 | 45484 | 1003 | 4.4e-13 | 3.3e-10 |
| 7 | EPHA7 | EPH receptor A7 | 29 | 13 | 4 | 1781 | 4 | 9.7e-08 | 0.000062 |
| 8 | RIPK4 | receptor-interacting serine-threonine kinase 4 | 6 | 3 | 3 | 411 | 3 | 1.2e-07 | 7e-05 |
| 9 | EPHA4 | EPH receptor A4 | 11 | 5 | 3 | 685 | 3 | 5.7e-07 | 0.00029 |
| 10 | TTN | titin | 717 | 65 | 5 | 8905 | 5 | 2.1e-06 | 0.00095 |
Note:
n - number of (nonsilent) mutations in this gene across the individual set.
cos = number of unique mutated sites in this gene in COSMIC
n_cos = overlap between n and cos.
N_cos = number of individuals times cos.
cos_ev = total evidence: number of reports in COSMIC for mutations seen in this gene.
p = p-value for seeing the observed amount of overlap in this gene)
q = q-value, False Discovery Rate (Benjamini-Hochberg procedure)
Table 5. Get Full Table Genes with Clustered Mutations
| num | gene | desc | n | mindist | nmuts0 | nmuts3 | nmuts12 | npairs0 | npairs3 | npairs12 |
|---|---|---|---|---|---|---|---|---|---|---|
| 1252 | BRAF | v-raf murine sarcoma viral oncogene homolog B1 | 78 | 0 | 1282 | 1451 | 1507 | 1282 | 1451 | 1507 |
| 8535 | NRAS | neuroblastoma RAS viral (v-ras) oncogene homolog | 39 | 0 | 562 | 562 | 562 | 562 | 562 | 562 |
| 3654 | DNAH5 | dynein, axonemal, heavy chain 5 | 203 | 0 | 53 | 65 | 168 | 53 | 65 | 168 |
| 13457 | TTN | titin | 717 | 0 | 51 | 79 | 184 | 51 | 79 | 184 |
| 7993 | MUC16 | mucin 16, cell surface associated | 522 | 0 | 50 | 102 | 277 | 50 | 102 | 277 |
| 9361 | PCLO | piccolo (presynaptic cytomatrix protein) | 182 | 0 | 25 | 43 | 102 | 25 | 43 | 102 |
| 13204 | TPTE | transmembrane phosphatase with tensin homology | 57 | 0 | 21 | 36 | 94 | 21 | 36 | 94 |
| 12184 | SPTLC3 | serine palmitoyltransferase, long chain base subunit 3 | 17 | 0 | 21 | 21 | 29 | 21 | 21 | 29 |
| 2878 | CNTN5 | contactin 5 | 55 | 0 | 20 | 31 | 56 | 20 | 31 | 56 |
| 10914 | RP1 | retinitis pigmentosa 1 (autosomal dominant) | 114 | 0 | 17 | 37 | 88 | 17 | 37 | 88 |
Note:
n - number of mutations in this gene in the individual set.
mindist - distance (in aa) between closest pair of mutations in this gene
npairs3 - how many pairs of mutations are within 3 aa of each other.
npairs12 - how many pairs of mutations are within 12 aa of each other.
Table 6. Get Full Table A Ranked List of Significantly Mutated Genesets. (Source: MSigDB GSEA Cannonical Pathway Set).Number of significant genesets found: 2. Number of genesets displayed: 10
| rank | geneset | description | genes | N_genes | mut_tally | N | n | npat | nsite | nsil | n1 | n2 | n3 | n4 | n5 | n6 | p_ns_s | p | q |
|---|---|---|---|---|---|---|---|---|---|---|---|---|---|---|---|---|---|---|---|
| 1 | ST_G_ALPHA_S_PATHWAY | The G-alpha-s protein activates adenylyl cyclases, which catalyze cAMP formation. | ASAH1, BF, BFAR, BRAF, CAMP, CREB1, CREB3, CREB5, EPAC, GAS, GRF2, MAPK1, RAF1, SNX13, SRC, TERF2IP | 12 | BRAF(78), CAMP(1), CREB5(7), MAPK1(3), RAF1(2), SNX13(1), SRC(1) | 2251916 | 93 | 80 | 31 | 23 | 25 | 3 | 2 | 63 | 0 | 0 | 0.13 | 0.000068 | 0.04 |
| 2 | SA_G1_AND_S_PHASES | Cdk2, 4, and 6 bind cyclin D in G1, while cdk2/cyclin E promotes the G1/S transition. | ARF1, ARF3, CCND1, CDK2, CDK4, CDKN1A, CDKN1B, CDKN2A, CFL1, E2F1, E2F2, MDM2, NXT1, PRB1, TP53 | 15 | CCND1(1), CDK4(2), CDKN1A(2), CDKN1B(1), CDKN2A(23), CFL1(1), E2F1(5), E2F2(3), MDM2(2), NXT1(2), PRB1(18), TP53(26) | 1704325 | 86 | 52 | 72 | 14 | 40 | 3 | 4 | 10 | 29 | 0 | 2e-05 | 0.00013 | 0.04 |
| 3 | SA_REG_CASCADE_OF_CYCLIN_EXPR | Expression of cyclins regulates progression through the cell cycle by activating cyclin-dependent kinases. | CCNA1, CCNA2, CCND1, CCNE1, CCNE2, CDK2, CDK4, CDKN1B, CDKN2A, E2F1, E2F2, E2F4, PRB1 | 13 | CCNA1(12), CCND1(1), CCNE1(3), CCNE2(10), CDK4(2), CDKN1B(1), CDKN2A(23), E2F1(5), E2F2(3), PRB1(18) | 1815524 | 78 | 54 | 64 | 13 | 41 | 0 | 4 | 12 | 21 | 0 | 0.00011 | 0.00092 | 0.19 |
| 4 | PEPIPATHWAY | Proepithelin (PEPI) induces epithelial cells to secrete IL-8, which promotes elastase secretion by neutrophils. | ELA1, ELA2, ELA2A, ELA2B, ELA3B, GRN, IL8, SLPI | 3 | GRN(4), IL8(1), SLPI(5) | 346525 | 10 | 10 | 10 | 2 | 4 | 1 | 0 | 4 | 1 | 0 | 0.23 | 0.14 | 1 |
| 5 | FOSBPATHWAY | FOSB gene expression and drug abuse | CDK5, FOSB, GRIA2, JUND, PPP1R1B | 5 | CDK5(3), FOSB(5), GRIA2(22), PPP1R1B(1) | 731255 | 31 | 25 | 28 | 8 | 22 | 1 | 0 | 4 | 4 | 0 | 0.033 | 0.15 | 1 |
| 6 | HSA00472_D_ARGININE_AND_D_ORNITHINE_METABOLISM | Genes involved in D-arginine and D-ornithine metabolism | DAO | 1 | DAO(8) | 144360 | 8 | 8 | 8 | 2 | 7 | 1 | 0 | 0 | 0 | 0 | 0.17 | 0.22 | 1 |
| 7 | TERTPATHWAY | hTERC, the RNA subunit of telomerase, and hTERT, the catalytic protein subunit, are required for telomerase activity and are overexpressed in many cancers. | HDAC1, MAX, MYC, SP1, SP3, TP53, WT1, ZNF42 | 7 | HDAC1(1), MYC(2), SP1(4), SP3(1), TP53(26), WT1(4) | 1428799 | 38 | 29 | 35 | 5 | 18 | 2 | 5 | 4 | 9 | 0 | 0.0032 | 0.22 | 1 |
| 8 | 1_AND_2_METHYLNAPHTHALENE_DEGRADATION | ADH1A, ADH1A, ADH1B, ADH1C, ADH1B, ADH1C, ADH4, ADH6, ADH7, ADHFE1 | 7 | ADH1A(10), ADH1B(17), ADH1C(22), ADH4(7), ADH6(7), ADH7(12), ADHFE1(3) | 1133089 | 78 | 50 | 71 | 20 | 59 | 5 | 4 | 8 | 2 | 0 | 0.0013 | 0.51 | 1 | |
| 9 | SLRPPATHWAY | Small leucine-rich proteoglycans (SLRPs) interact with and reorganize collagen fibers in the extracellular matrix. | BGN, DCN, DSPG3, FMOD, KERA, LUM | 5 | BGN(5), DCN(14), FMOD(3), KERA(13), LUM(7) | 704012 | 42 | 28 | 41 | 13 | 34 | 3 | 2 | 1 | 2 | 0 | 0.0046 | 0.64 | 1 |
| 10 | HSA00830_RETINOL_METABOLISM | Genes involved in retinol metabolism | ALDH1A1, ALDH1A2, BCMO1, RDH5 | 4 | ALDH1A1(3), ALDH1A2(9), BCMO1(10), RDH5(1) | 785999 | 23 | 20 | 22 | 7 | 15 | 2 | 1 | 3 | 2 | 0 | 0.066 | 0.78 | 1 |
Table 7. Get Full Table A Ranked List of Significantly Mutated Genesets (Excluding Significantly Mutated Genes). Number of significant genesets found: 0. Number of genesets displayed: 10
| rank | geneset | description | genes | N_genes | mut_tally | N | n | npat | nsite | nsil | n1 | n2 | n3 | n4 | n5 | n6 | p_ns_s | p | q |
|---|---|---|---|---|---|---|---|---|---|---|---|---|---|---|---|---|---|---|---|
| 1 | PEPIPATHWAY | Proepithelin (PEPI) induces epithelial cells to secrete IL-8, which promotes elastase secretion by neutrophils. | ELA1, ELA2, ELA2A, ELA2B, ELA3B, GRN, IL8, SLPI | 3 | GRN(4), IL8(1), SLPI(5) | 346525 | 10 | 10 | 10 | 2 | 4 | 1 | 0 | 4 | 1 | 0 | 0.23 | 0.14 | 1 |
| 2 | FOSBPATHWAY | FOSB gene expression and drug abuse | CDK5, FOSB, GRIA2, JUND, PPP1R1B | 5 | CDK5(3), FOSB(5), GRIA2(22), PPP1R1B(1) | 731255 | 31 | 25 | 28 | 8 | 22 | 1 | 0 | 4 | 4 | 0 | 0.033 | 0.15 | 1 |
| 3 | HSA00472_D_ARGININE_AND_D_ORNITHINE_METABOLISM | Genes involved in D-arginine and D-ornithine metabolism | DAO | 1 | DAO(8) | 144360 | 8 | 8 | 8 | 2 | 7 | 1 | 0 | 0 | 0 | 0 | 0.17 | 0.22 | 1 |
| 4 | HSA00830_RETINOL_METABOLISM | Genes involved in retinol metabolism | ALDH1A1, ALDH1A2, BCMO1, RDH5 | 4 | ALDH1A1(3), ALDH1A2(9), BCMO1(10), RDH5(1) | 785999 | 23 | 20 | 22 | 7 | 15 | 2 | 1 | 3 | 2 | 0 | 0.066 | 0.78 | 1 |
| 5 | BOTULINPATHWAY | Blockade of Neurotransmitter Relase by Botulinum Toxin | CHRM1, CHRNA1, SNAP25, STX1A, VAMP2 | 5 | CHRM1(4), CHRNA1(3), SNAP25(5), STX1A(2) | 659260 | 14 | 11 | 12 | 3 | 10 | 0 | 0 | 1 | 3 | 0 | 0.052 | 0.82 | 1 |
| 6 | HSA00627_1,4_DICHLOROBENZENE_DEGRADATION | Genes involved in 1,4-dichlorobenzene degradation | CMBL | 1 | CMBL(1) | 103800 | 1 | 1 | 1 | 1 | 1 | 0 | 0 | 0 | 0 | 0 | 0.9 | 0.88 | 1 |
| 7 | 1_AND_2_METHYLNAPHTHALENE_DEGRADATION | ADH1A, ADH1A, ADH1B, ADH1C, ADH1B, ADH1C, ADH4, ADH6, ADH7, ADHFE1 | 6 | ADH1A(10), ADH1B(17), ADH4(7), ADH6(7), ADH7(12), ADHFE1(3) | 977313 | 56 | 41 | 53 | 16 | 44 | 3 | 4 | 4 | 1 | 0 | 0.013 | 0.89 | 1 | |
| 8 | BETAOXIDATIONPATHWAY | Beta-Oxidation of Fatty Acids | ACADL, ACADM, ACADS, ACAT1, ECHS1, HADHA | 6 | ACADL(2), ACADM(5), ACADS(2), HADHA(7) | 1105580 | 16 | 14 | 16 | 4 | 10 | 1 | 1 | 4 | 0 | 0 | 0.2 | 0.91 | 1 |
| 9 | TCRMOLECULE | T Cell Receptor and CD3 Complex | CD3D, CD3E, CD3G, CD3Z, TRA@, TRB@ | 3 | CD3D(5), CD3E(2) | 226627 | 7 | 5 | 7 | 3 | 6 | 0 | 0 | 0 | 1 | 0 | 0.5 | 0.93 | 1 |
| 10 | HSA00031_INOSITOL_METABOLISM | Genes involved in inositol metabolism | ALDH6A1, TPI1 | 2 | ALDH6A1(2) | 334020 | 2 | 2 | 2 | 1 | 1 | 0 | 0 | 1 | 0 | 0 | 0.74 | 0.94 | 1 |
In brief, we tabulate the number of mutations and the number of covered bases for each gene. The counts are broken down by mutation context category: four context categories that are discovered by MutSig, and one for indel and 'null' mutations, which include indels, nonsense mutations, splice-site mutations, and non-stop (read-through) mutations. For each gene, we calculate the probability of seeing the observed constellation of mutations, i.e. the product P1 x P2 x ... x Pm, or a more extreme one, given the background mutation rates calculated across the dataset. [1]
This is an experimental feature. The full results of the analysis summarized in this report can be downloaded from the TCGA Data Coordination Center.