(WT cohort)
This report serves to describe the mutational landscape and properties of a given individual set, as well as rank genes and genesets according to mutational significance. MutSig v2.0 was used to generate the results found in this report.
-
Working with individual set: SKCM-WT
-
Number of patients in set: 34
The input for this pipeline is a set of individuals with the following files associated for each:
-
An annotated .maf file describing the mutations called for the respective individual, and their properties.
-
A .wig file that contains information about the coverage of the sample.
-
MAF used for this analysis:SKCM-WT.final_analysis_set.maf
-
Significantly mutated genes (q ≤ 0.1): 5
-
Mutations seen in COSMIC: 53
-
Significantly mutated genes in COSMIC territory: 5
-
Genes with clustered mutations (≤ 3 aa apart): 156
-
Significantly mutated genesets: 0
-
Significantly mutated genesets: (excluding sig. mutated genes):0
-
Read 34 MAFs of type "Broad"
-
Total number of mutations in input MAFs: 19965
-
After removing 101 blacklisted mutations: 19864
-
After removing 334 noncoding mutations: 19530
-
Number of mutations before filtering: 19530
-
After removing 261 mutations outside gene set: 19269
-
After removing 23 mutations outside category set: 19246
-
After removing 4 "impossible" mutations in
-
gene-patient-category bins of zero coverage: 18958
Table 1. Get Full Table Table representing breakdown of mutations by type.
| type | count |
|---|---|
| Frame_Shift_Del | 104 |
| Frame_Shift_Ins | 31 |
| In_Frame_Del | 22 |
| In_Frame_Ins | 9 |
| Missense_Mutation | 11627 |
| Nonsense_Mutation | 695 |
| Nonstop_Mutation | 5 |
| Silent | 6564 |
| Splice_Site | 182 |
| Translation_Start_Site | 7 |
| Total | 19246 |
Table 2. Get Full Table A breakdown of mutation rates per category discovered for this individual set.
| category | n | N | rate | rate_per_mb | relative_rate | exp_ns_s_ratio |
|---|---|---|---|---|---|---|
| (C/T)p*C->T | 8682 | 266510991 | 0.000033 | 33 | 2.5 | 1.6 |
| (A/G)p*C->T | 995 | 223586921 | 4.5e-06 | 4.5 | 0.34 | 1.9 |
| A->G | 532 | 473016329 | 1.1e-06 | 1.1 | 0.085 | 2.3 |
| transver | 1422 | 963114241 | 1.5e-06 | 1.5 | 0.11 | 5 |
| indel+null | 1030 | 963114241 | 1.1e-06 | 1.1 | 0.081 | NaN |
| double_null | 18 | 963114241 | 1.9e-08 | 0.019 | 0.0014 | NaN |
| Total | 12679 | 963114241 | 0.000013 | 13 | 1 | 3.5 |
The x axis represents the samples. The y axis represents the exons, one row per exon, and they are sorted by average coverage across samples. For exons with exactly the same average coverage, they are sorted next by the %GC of the exon. (The secondary sort is especially useful for the zero-coverage exons at the bottom).
Figure 1.
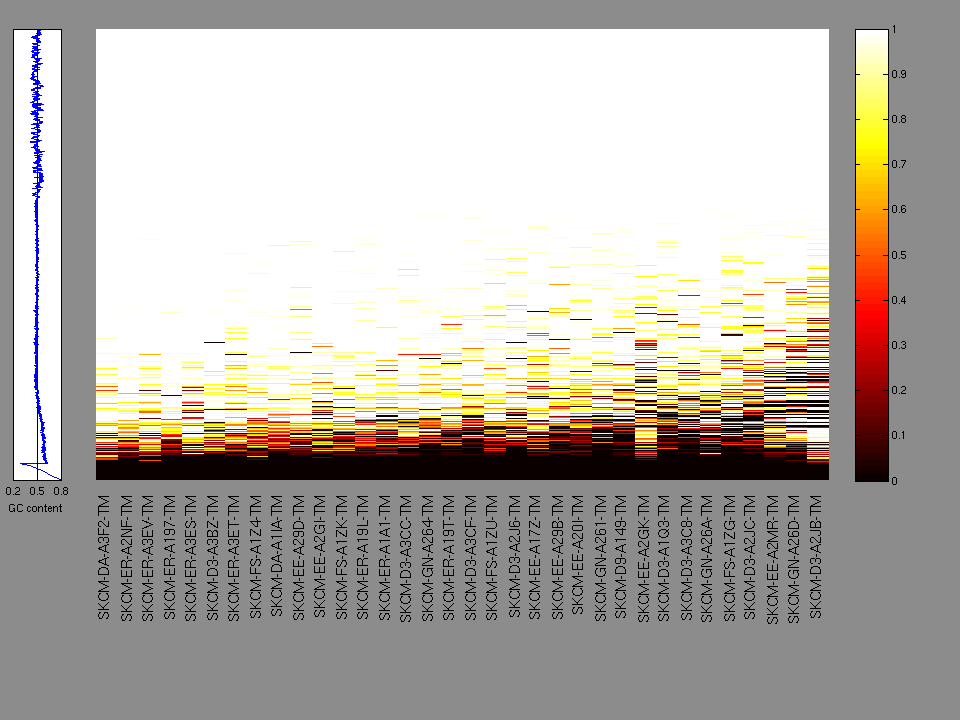
Figure 2. Patients counts and rates file used to generate this plot: SKCM-WT.patients.counts_and_rates.txt
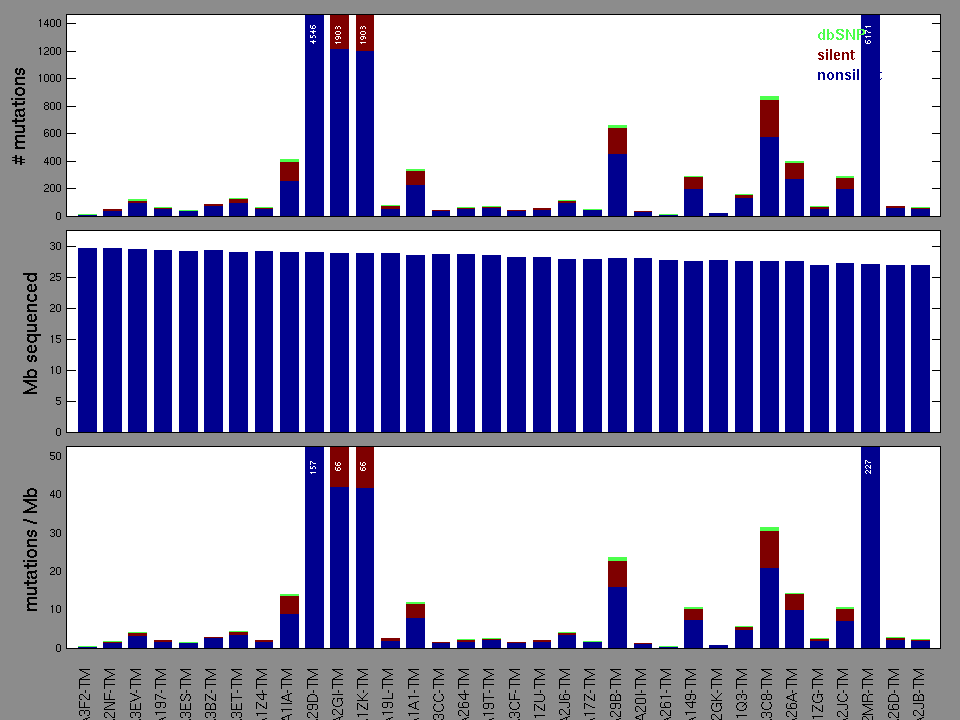
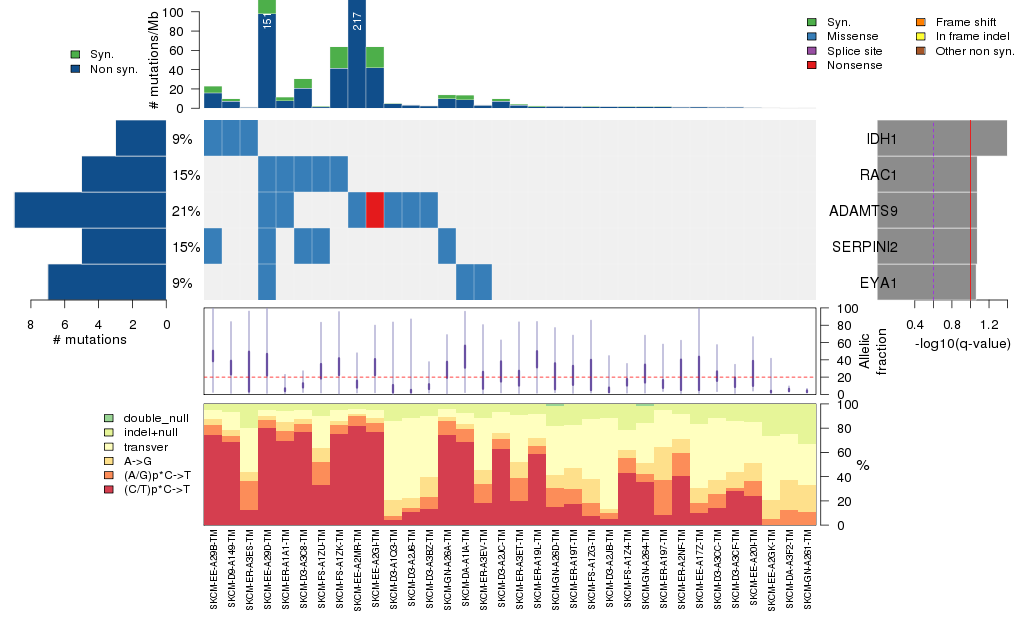
Figure 3. Get High-res Image The matrix in the center of the figure represents individual mutations in patient samples, color-coded by type of mutation, for the significantly mutated genes. The rate of synonymous and non-synonymous mutations is displayed at the top of the matrix. The barplot on the left of the matrix shows the number of mutations in each gene. The percentages represent the fraction of tumors with at least one mutation in the specified gene. The barplot to the right of the matrix displays the q-values for the most significantly mutated genes. The purple boxplots below the matrix (only displayed if required columns are present in the provided MAF) represent the distributions of allelic fractions observed in each sample. The plot at the bottom represents the base substitution distribution of individual samples, using the same categories that were used to calculate significance.
Column Descriptions:
-
N = number of sequenced bases in this gene across the individual set
-
n = number of (nonsilent) mutations in this gene across the individual set
-
npat = number of patients (individuals) with at least one nonsilent mutation
-
nsite = number of unique sites having a non-silent mutation
-
nsil = number of silent mutations in this gene across the individual set
-
n1 = number of nonsilent mutations of type: (C/T)p*C->T
-
n2 = number of nonsilent mutations of type: (A/G)p*C->T
-
n3 = number of nonsilent mutations of type: A->G
-
n4 = number of nonsilent mutations of type: transver
-
n5 = number of nonsilent mutations of type: indel+null
-
n6 = number of nonsilent mutations of type: double_null
-
p_classic = p-value for the observed amount of nonsilent mutations being elevated in this gene
-
p_ns_s = p-value for the observed nonsilent/silent ratio being elevated in this gene
-
p_cons = p-value for enrichment of mutations at evolutionarily most-conserved sites in gene
-
p_joint = p-value for clustering + conservation
-
p = p-value (overall)
-
q = q-value, False Discovery Rate (Benjamini-Hochberg procedure)
Table 3. Get Full Table A Ranked List of Significantly Mutated Genes. Number of significant genes found: 5. Number of genes displayed: 35. Click on a gene name to display its stick figure depicting the distribution of mutations and mutation types across the chosen gene (this feature may not be available for all significant genes).
| rank | gene | description | N | n | npat | nsite | nsil | n1 | n2 | n3 | n4 | n5 | n6 | p_classic | p_ns_s | p_cons | p_joint | p | q |
|---|---|---|---|---|---|---|---|---|---|---|---|---|---|---|---|---|---|---|---|
| 1 | IDH1 | isocitrate dehydrogenase 1 (NADP+), soluble | 42629 | 3 | 3 | 2 | 0 | 2 | 0 | 0 | 1 | 0 | 0 | 0.00041 | 0.34 | 0.81 | 0.00031 | 2.2e-06 | 0.039 |
| 2 | RAC1 | ras-related C3 botulinum toxin substrate 1 (rho family, small GTP binding protein Rac1) | 20840 | 5 | 5 | 4 | 0 | 4 | 0 | 0 | 1 | 0 | 0 | 4.6e-06 | 0.11 | 0.62 | 0.17 | 0.000012 | 0.084 |
| 3 | ADAMTS9 | ADAM metallopeptidase with thrombospondin type 1 motif, 9 | 202507 | 9 | 7 | 8 | 0 | 3 | 0 | 2 | 3 | 1 | 0 | 0.0005 | 0.062 | 0.092 | 0.0022 | 0.000016 | 0.084 |
| 4 | SERPINI2 | serpin peptidase inhibitor, clade I (pancpin), member 2 | 41024 | 5 | 5 | 5 | 0 | 3 | 0 | 1 | 1 | 0 | 0 | 4.4e-06 | 0.18 | 0.59 | 0.29 | 0.000018 | 0.084 |
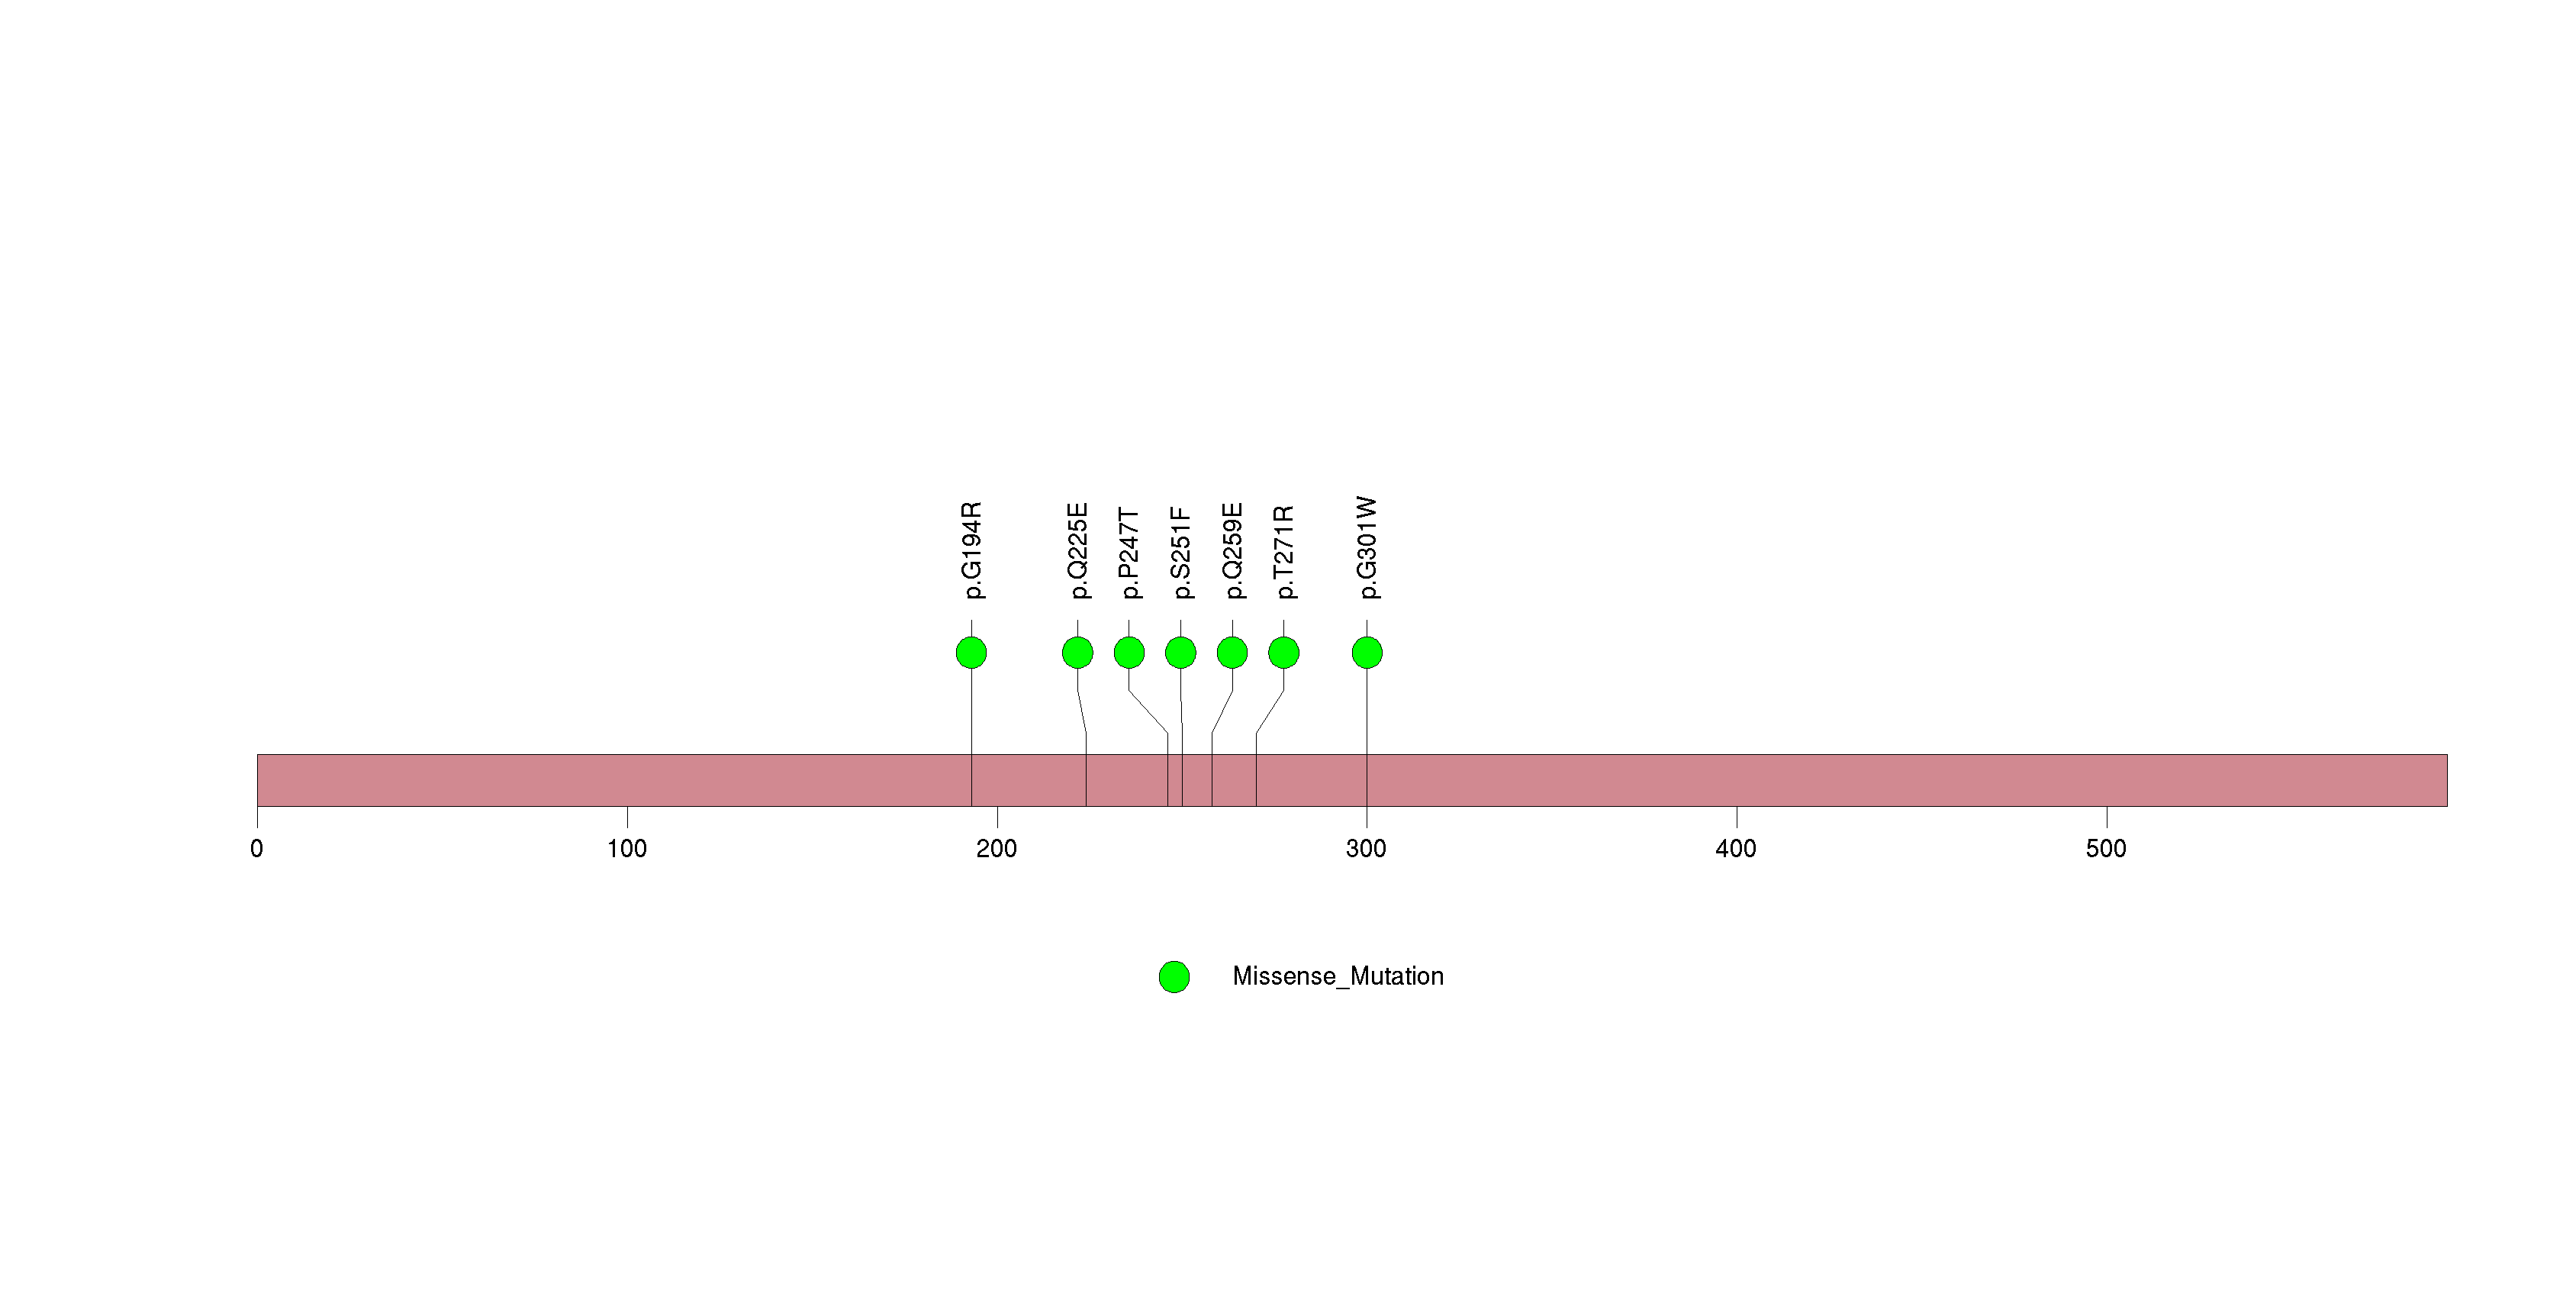
| 5 | EYA1 | eyes absent homolog 1 (Drosophila) | 59360 | 7 | 3 | 7 | 0 | 2 | 0 | 0 | 5 | 0 | 0 | 0.0045 | 0.2 | 0.47 | 0.00037 | 0.000024 | 0.086 |
| 6 | ESRP1 | epithelial splicing regulatory protein 1 | 71635 | 6 | 6 | 6 | 0 | 2 | 0 | 0 | 3 | 1 | 0 | 0.000023 | 0.16 | 0.96 | 0.11 | 0.000035 | 0.1 |
| 7 | PCDHB5 | protocadherin beta 5 | 81328 | 6 | 5 | 6 | 1 | 4 | 0 | 0 | 1 | 1 | 0 | 0.00011 | 0.17 | 1 | 0.04 | 6e-05 | 0.14 |
| 8 | PLCB4 | phospholipase C, beta 4 | 118270 | 9 | 6 | 8 | 0 | 5 | 0 | 1 | 1 | 2 | 0 | 0.000037 | 0.046 | 0.93 | 0.12 | 0.000061 | 0.14 |
| 9 | CCNE2 | cyclin E2 | 42806 | 3 | 3 | 2 | 1 | 0 | 0 | 0 | 3 | 0 | 0 | 0.00077 | 0.84 | 0.58 | 0.016 | 0.00015 | 0.3 |
| 10 | TAF1A | TATA box binding protein (TBP)-associated factor, RNA polymerase I, A, 48kDa | 47345 | 4 | 4 | 3 | 0 | 1 | 0 | 0 | 3 | 0 | 0 | 0.000044 | 0.46 | 0.29 | 0.32 | 0.00017 | 0.3 |
| 11 | MUC7 | mucin 7, secreted | 38240 | 6 | 5 | 5 | 0 | 4 | 0 | 2 | 0 | 0 | 0 | 0.000042 | 0.083 | 0.27 | 0.43 | 0.00022 | 0.33 |
| 12 | HMGCR | 3-hydroxy-3-methylglutaryl-Coenzyme A reductase | 93262 | 3 | 3 | 2 | 0 | 0 | 0 | 0 | 1 | 2 | 0 | 0.0037 | 0.57 | 0.18 | 0.005 | 0.00022 | 0.33 |
| 13 | CTNND2 | catenin (cadherin-associated protein), delta 2 (neural plakophilin-related arm-repeat protein) | 113745 | 11 | 8 | 10 | 0 | 7 | 0 | 0 | 3 | 1 | 0 | 0.000072 | 0.0098 | 0.28 | 0.38 | 0.00031 | 0.4 |
| 14 | TUBA1B | tubulin, alpha 1b | 44856 | 4 | 4 | 3 | 0 | 1 | 0 | 0 | 3 | 0 | 0 | 0.000041 | 0.33 | 0.93 | 0.74 | 0.00034 | 0.4 |
| 15 | FBXL6 | F-box and leucine-rich repeat protein 6 | 45068 | 2 | 2 | 2 | 0 | 0 | 0 | 0 | 1 | 1 | 0 | 0.016 | 0.43 | 0.0037 | 0.002 | 0.00036 | 0.4 |
| 16 | CLCC1 | chloride channel CLIC-like 1 | 57643 | 4 | 4 | 4 | 0 | 0 | 0 | 0 | 4 | 0 | 0 | 0.000064 | 0.52 | 0.59 | 0.5 | 0.00036 | 0.4 |
| 17 | PLXDC2 | plexin domain containing 2 | 46175 | 5 | 4 | 5 | 1 | 4 | 0 | 1 | 0 | 0 | 0 | 0.00037 | 0.35 | 0.23 | 0.093 | 0.00039 | 0.4 |
| 18 | TDRD9 | tudor domain containing 9 | 82474 | 4 | 3 | 4 | 0 | 1 | 0 | 0 | 1 | 2 | 0 | 0.0029 | 0.22 | 0.58 | 0.012 | 0.0004 | 0.4 |
| 19 | FLG2 | filaggrin family member 2 | 243668 | 10 | 8 | 10 | 1 | 7 | 0 | 2 | 1 | 0 | 0 | 0.00029 | 0.23 | 0.65 | 0.14 | 0.00044 | 0.42 |
| 20 | KRTAP5-1 | keratin associated protein 5-1 | 28538 | 4 | 4 | 4 | 0 | 1 | 0 | 0 | 2 | 1 | 0 | 0.000049 | 0.46 | 0.79 | 1 | 0.00053 | 0.48 |
| 21 | CYLC1 | cylicin, basic protein of sperm head cytoskeleton 1 | 28932 | 4 | 4 | 4 | 1 | 3 | 1 | 0 | 0 | 0 | 0 | 0.000058 | 0.59 | 0.8 | 1 | 0.00062 | 0.52 |
| 22 | SPZ1 | spermatogenic leucine zipper 1 | 43915 | 3 | 3 | 3 | 1 | 0 | 1 | 0 | 2 | 0 | 0 | 0.00079 | 0.79 | 0.34 | 0.078 | 0.00066 | 0.52 |
| 23 | GNA11 | guanine nucleotide binding protein (G protein), alpha 11 (Gq class) | 33844 | 3 | 3 | 2 | 0 | 1 | 0 | 0 | 2 | 0 | 0 | 0.00046 | 0.31 | 0.81 | 0.14 | 0.00067 | 0.52 |
| 24 | GLRA1 | glycine receptor, alpha 1 | 46942 | 4 | 3 | 4 | 0 | 1 | 0 | 1 | 0 | 2 | 0 | 0.0013 | 0.19 | 0.24 | 0.051 | 0.00071 | 0.52 |
| 25 | CDH6 | cadherin 6, type 2, K-cadherin (fetal kidney) | 79373 | 7 | 5 | 7 | 1 | 5 | 0 | 1 | 0 | 1 | 0 | 0.00068 | 0.16 | 0.92 | 0.1 | 0.00072 | 0.52 |
| 26 | C14orf68 | chromosome 14 open reading frame 68 | 30580 | 3 | 3 | 3 | 1 | 1 | 0 | 0 | 2 | 0 | 0 | 0.003 | 0.58 | 0.42 | 0.026 | 0.00083 | 0.57 |
| 27 | OR6N1 | olfactory receptor, family 6, subfamily N, member 1 | 31310 | 3 | 3 | 3 | 1 | 1 | 0 | 0 | 1 | 0 | 1 | 0.000088 | 0.39 | 0.84 | 0.93 | 0.00086 | 0.57 |
| 28 | OR51M1 | olfactory receptor, family 51, subfamily M, member 1 | 31569 | 5 | 4 | 5 | 1 | 4 | 1 | 0 | 0 | 0 | 0 | 0.0001 | 0.14 | 0.76 | 0.9 | 0.00095 | 0.61 |
| 29 | WNT7A | wingless-type MMTV integration site family, member 7A | 35562 | 3 | 3 | 3 | 1 | 2 | 1 | 0 | 0 | 0 | 0 | 0.01 | 0.38 | 0.77 | 0.0096 | 0.001 | 0.62 |
| 30 | PSG6 | pregnancy specific beta-1-glycoprotein 6 | 44166 | 6 | 4 | 6 | 1 | 4 | 1 | 1 | 0 | 0 | 0 | 0.00018 | 0.2 | 0.72 | 0.57 | 0.001 | 0.63 |
| 31 | DPEP2 | dipeptidase 2 | 43329 | 5 | 2 | 5 | 0 | 3 | 0 | 0 | 2 | 0 | 0 | 0.039 | 0.11 | 0.34 | 0.0031 | 0.0012 | 0.7 |
| 32 | CDKN2A | cyclin-dependent kinase inhibitor 2A (melanoma, p16, inhibits CDK4) | 32920 | 2 | 2 | 2 | 1 | 0 | 0 | 0 | 0 | 2 | 0 | 0.0017 | 0.79 | 0.037 | 0.073 | 0.0012 | 0.7 |
| 33 | CLDN2 | claudin 2 | 23697 | 3 | 3 | 3 | 0 | 2 | 0 | 0 | 1 | 0 | 0 | 0.0024 | 0.24 | 0.016 | 0.056 | 0.0013 | 0.71 |
| 34 | DPY19L4 | dpy-19-like 4 (C. elegans) | 76205 | 3 | 3 | 3 | 0 | 1 | 0 | 0 | 0 | 1 | 1 | 0.0011 | 0.52 | 0.76 | 0.12 | 0.0013 | 0.71 |
| 35 | PSG1 | pregnancy specific beta-1-glycoprotein 1 | 45452 | 3 | 3 | 3 | 1 | 1 | 0 | 0 | 1 | 1 | 0 | 0.0015 | 0.6 | NaN | NaN | 0.0015 | 0.78 |
Figure S1. This figure depicts the distribution of mutations and mutation types across the IDH1 significant gene.
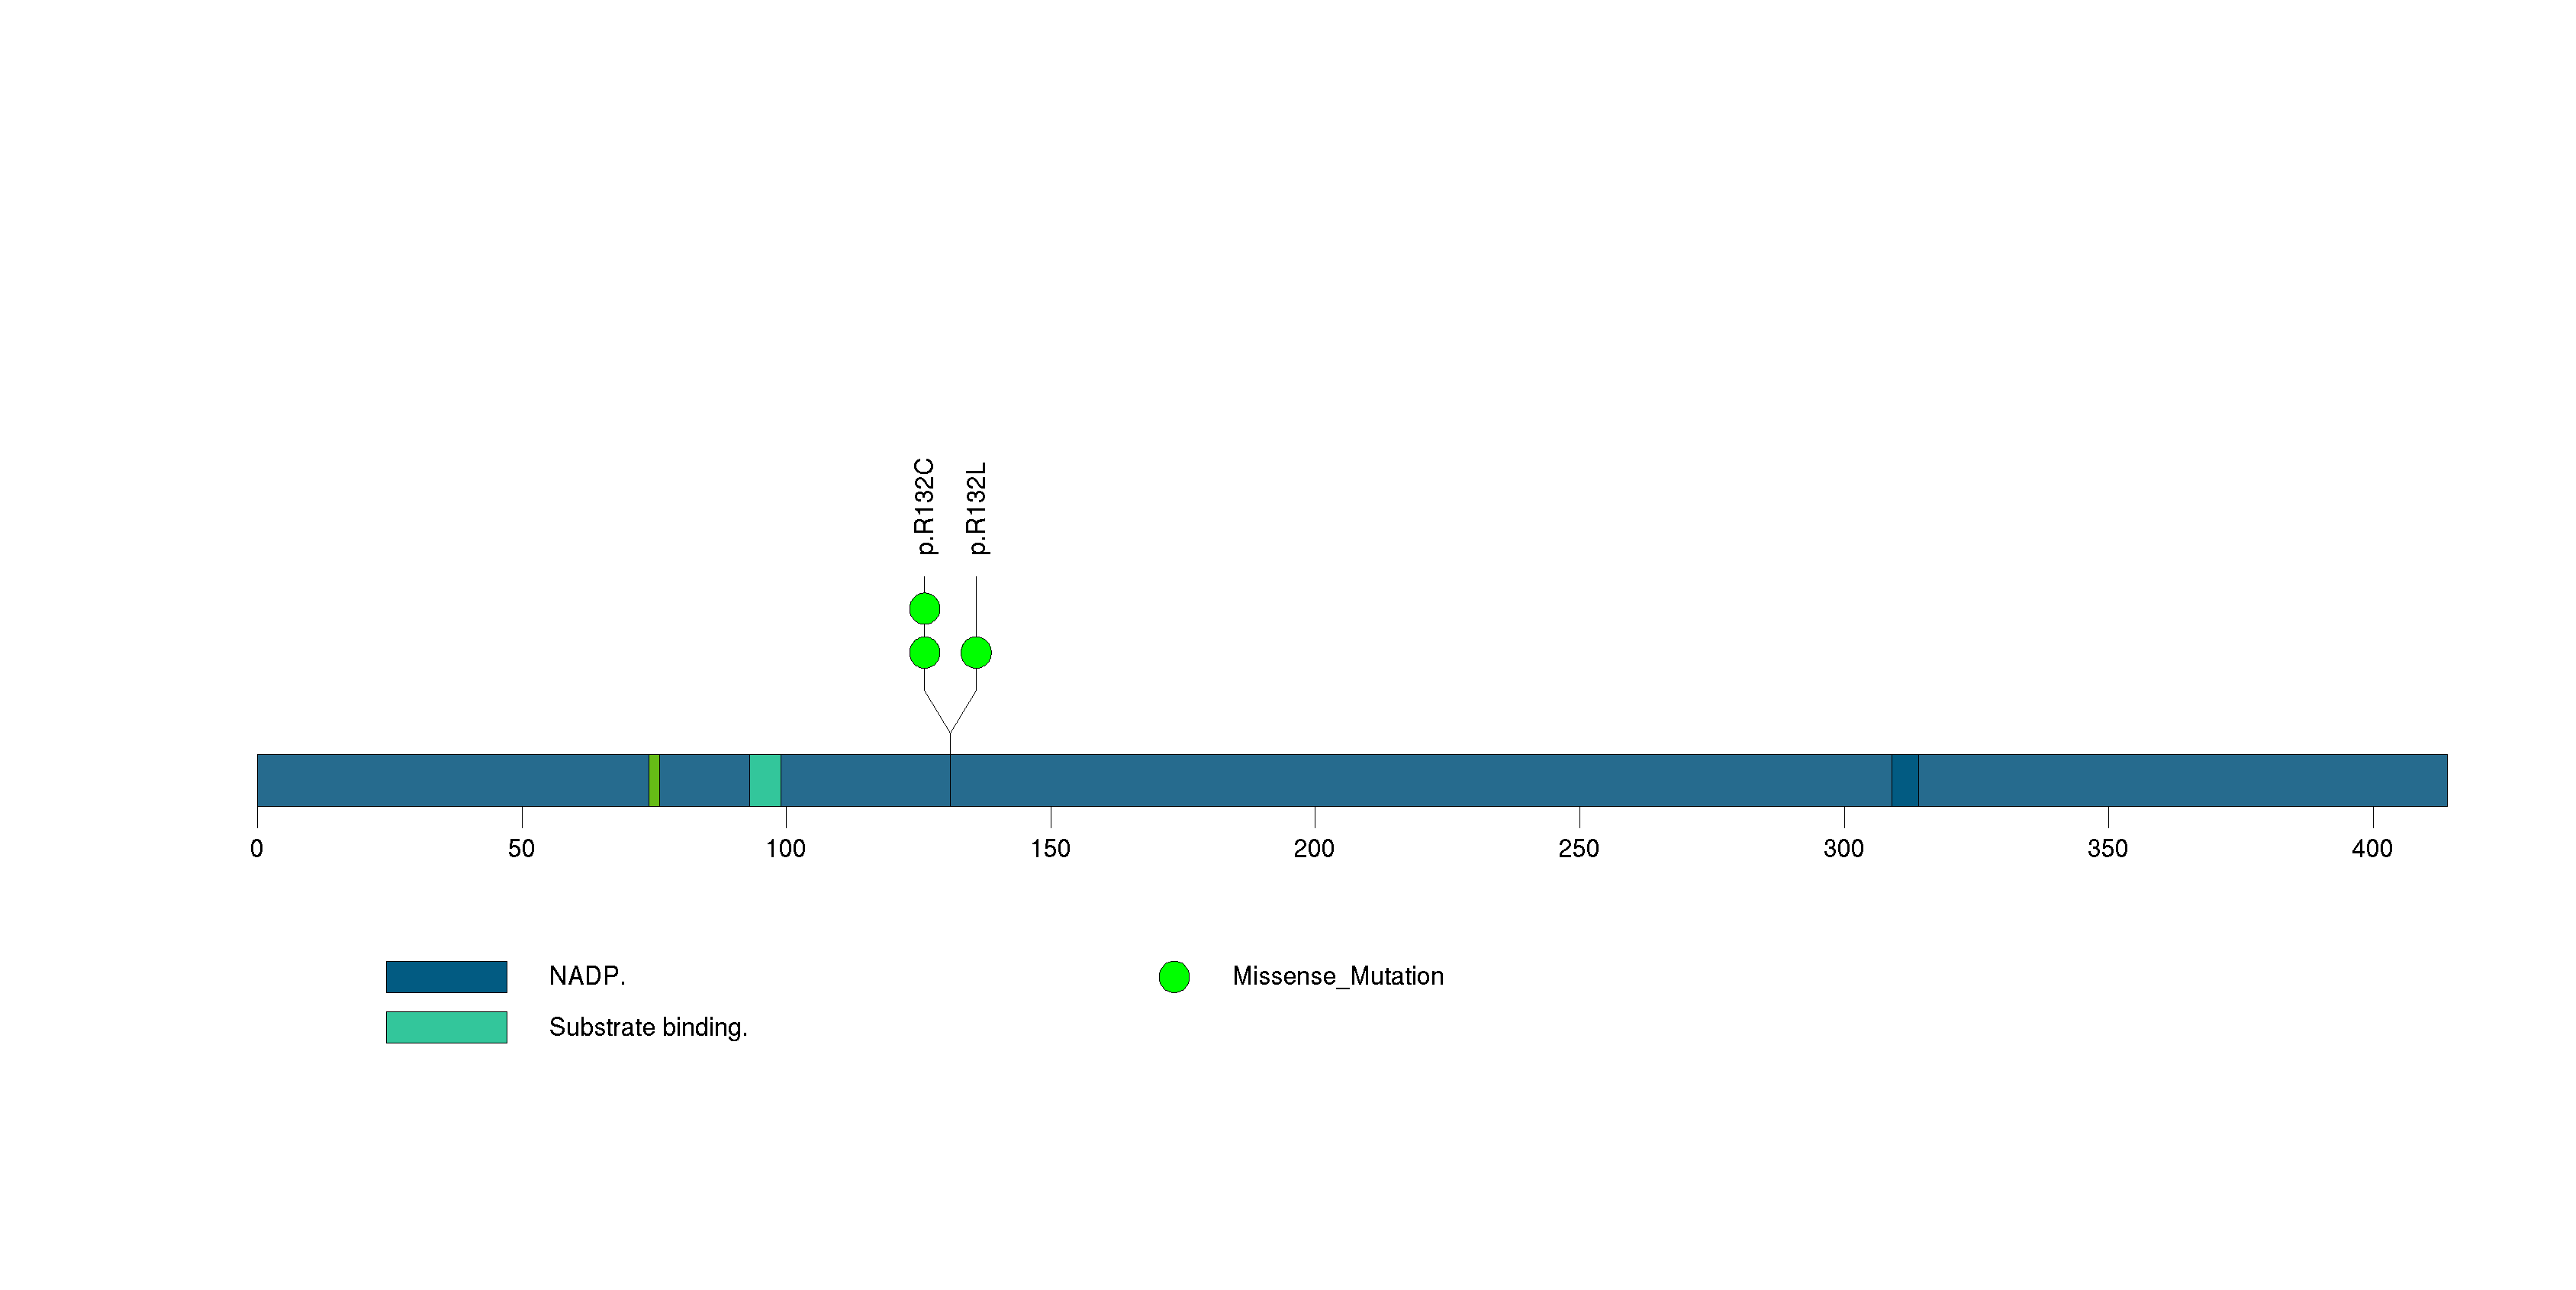
Figure S2. This figure depicts the distribution of mutations and mutation types across the RAC1 significant gene.
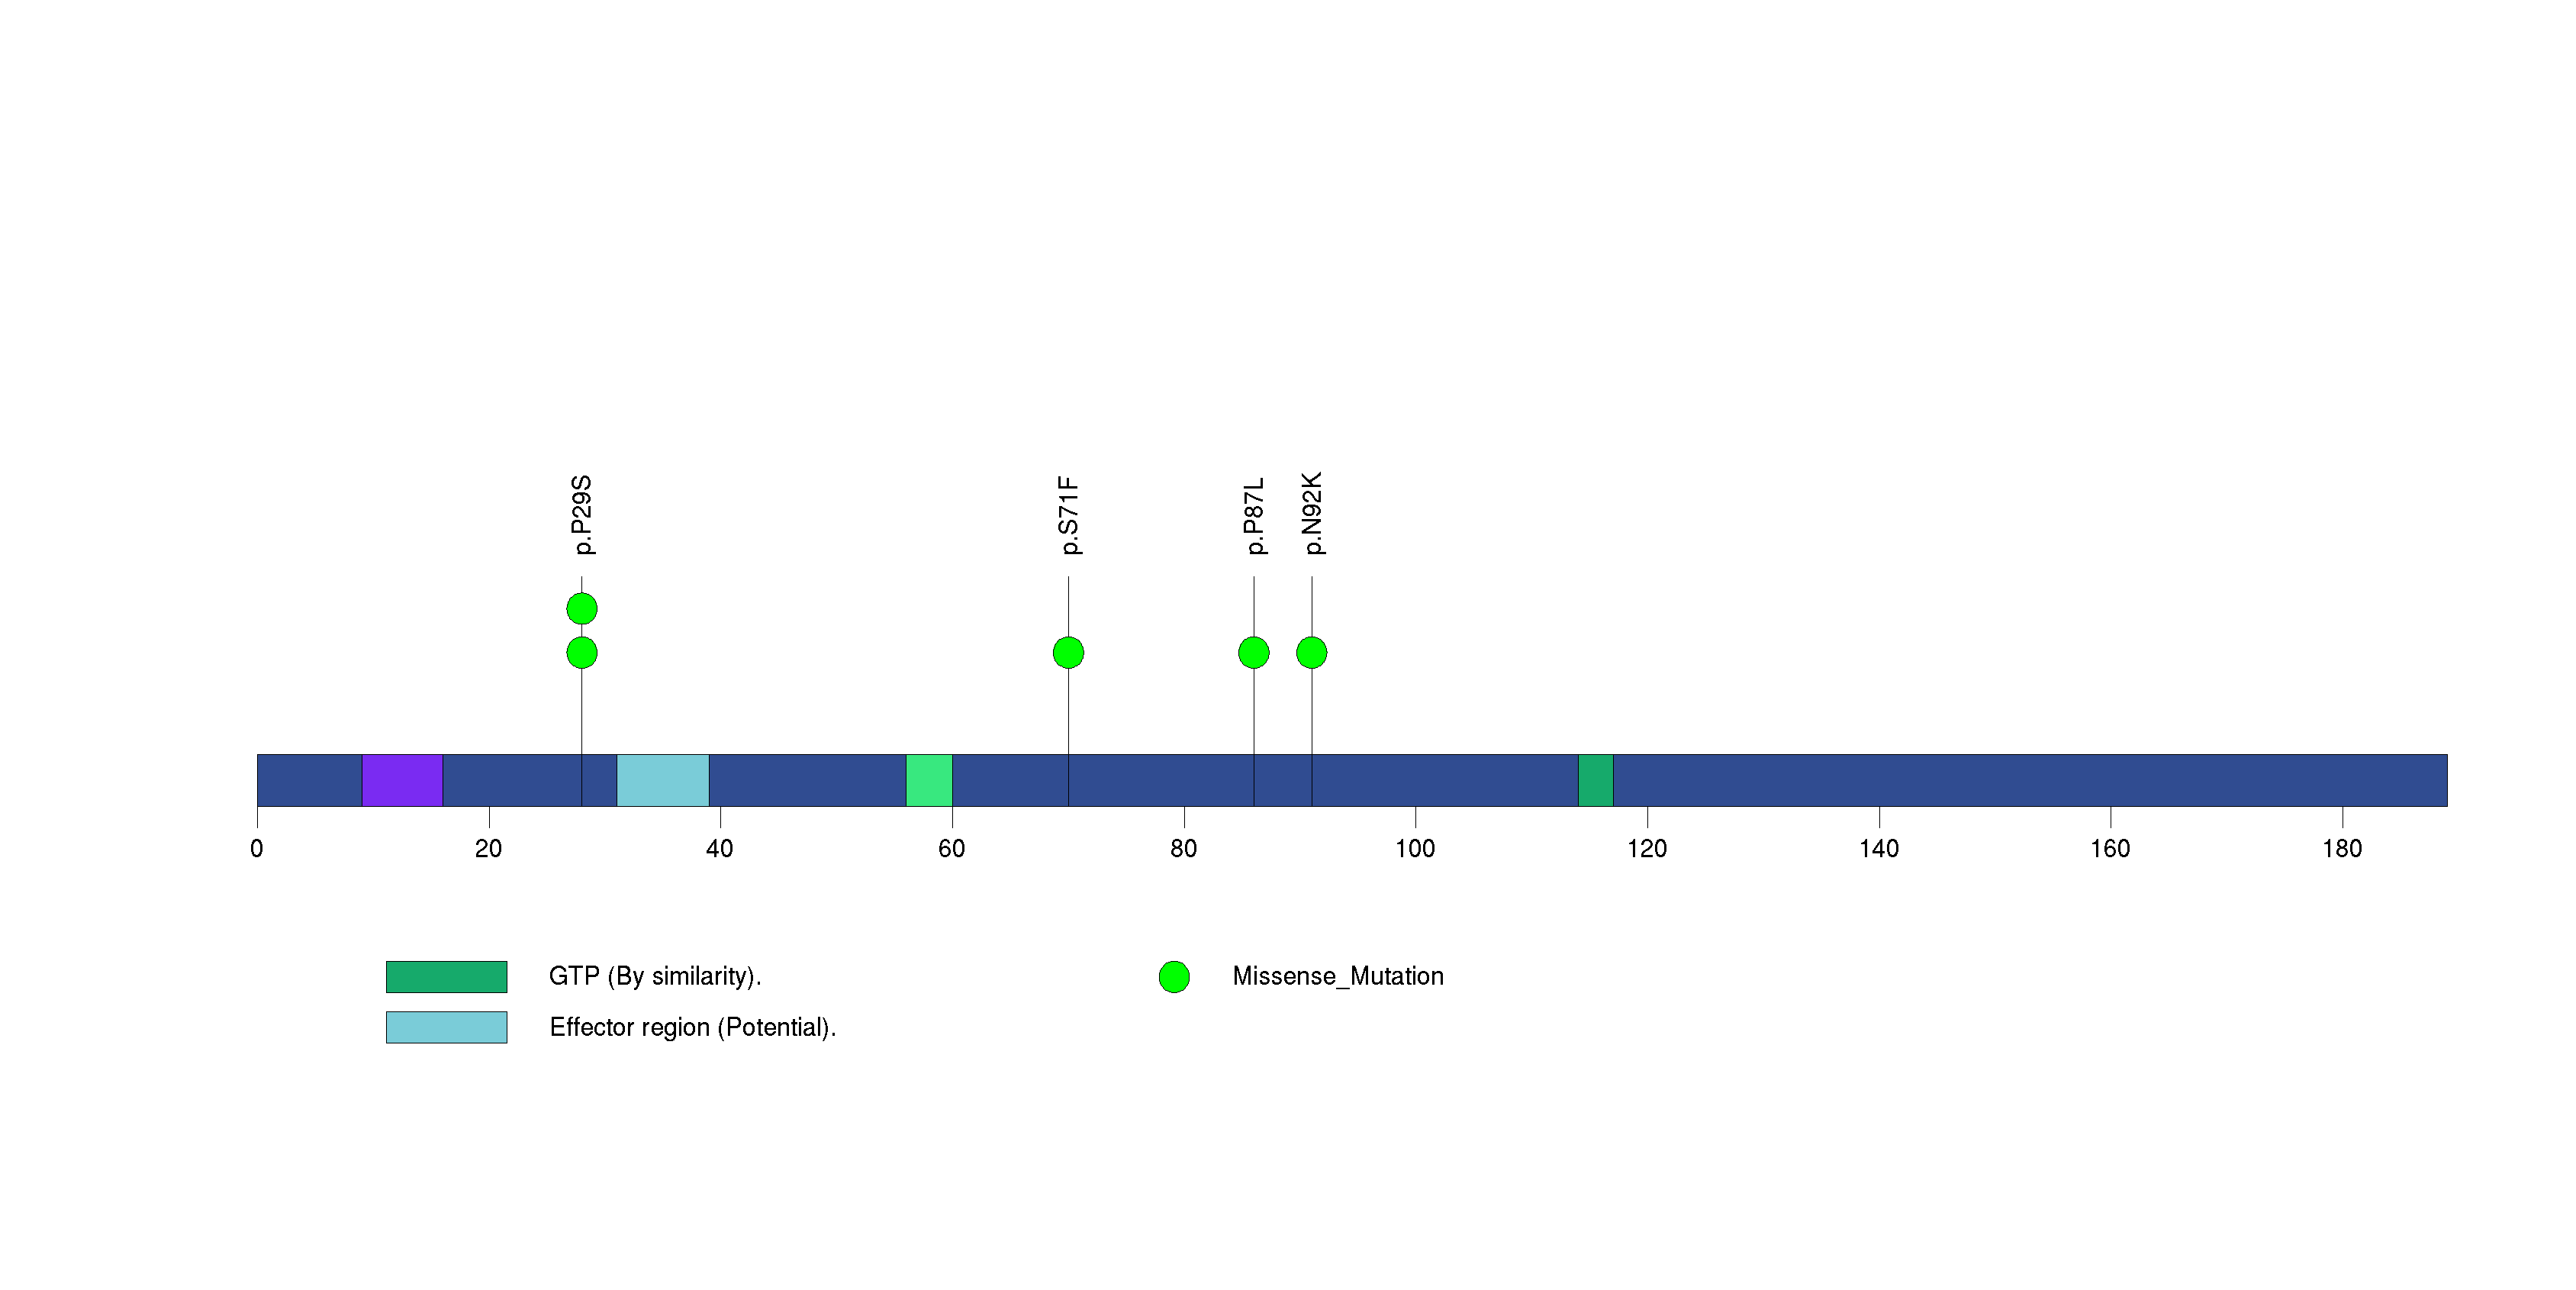
Figure S3. This figure depicts the distribution of mutations and mutation types across the ADAMTS9 significant gene.
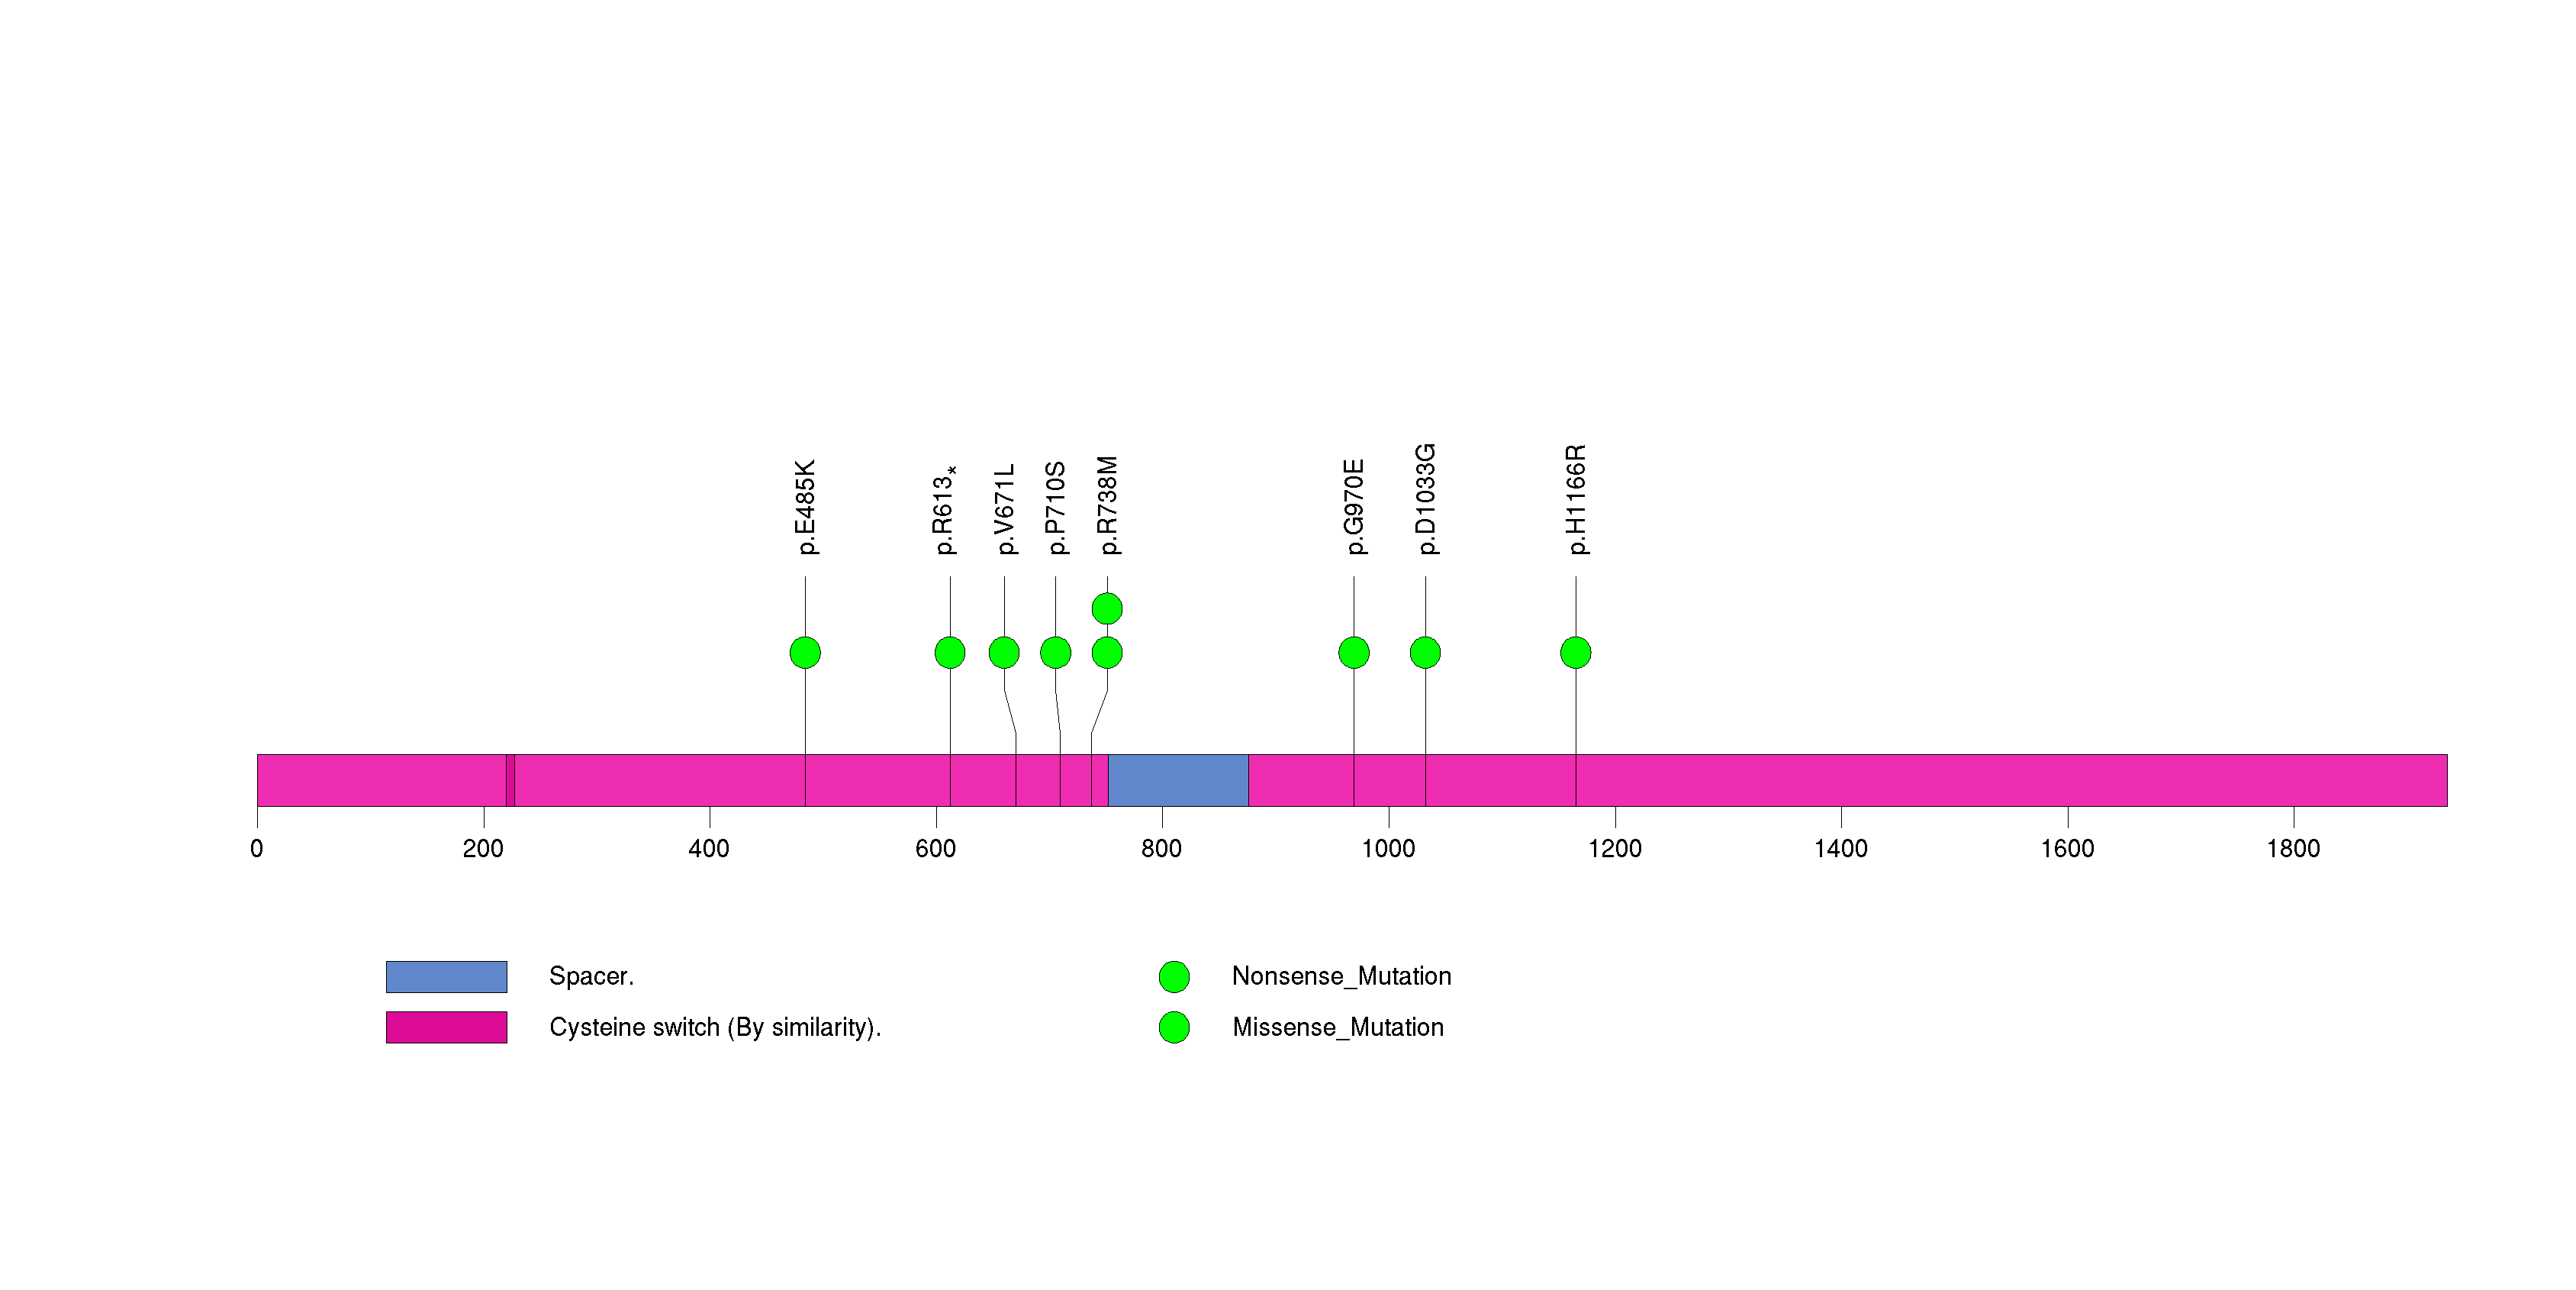
Figure S4. This figure depicts the distribution of mutations and mutation types across the SERPINI2 significant gene.
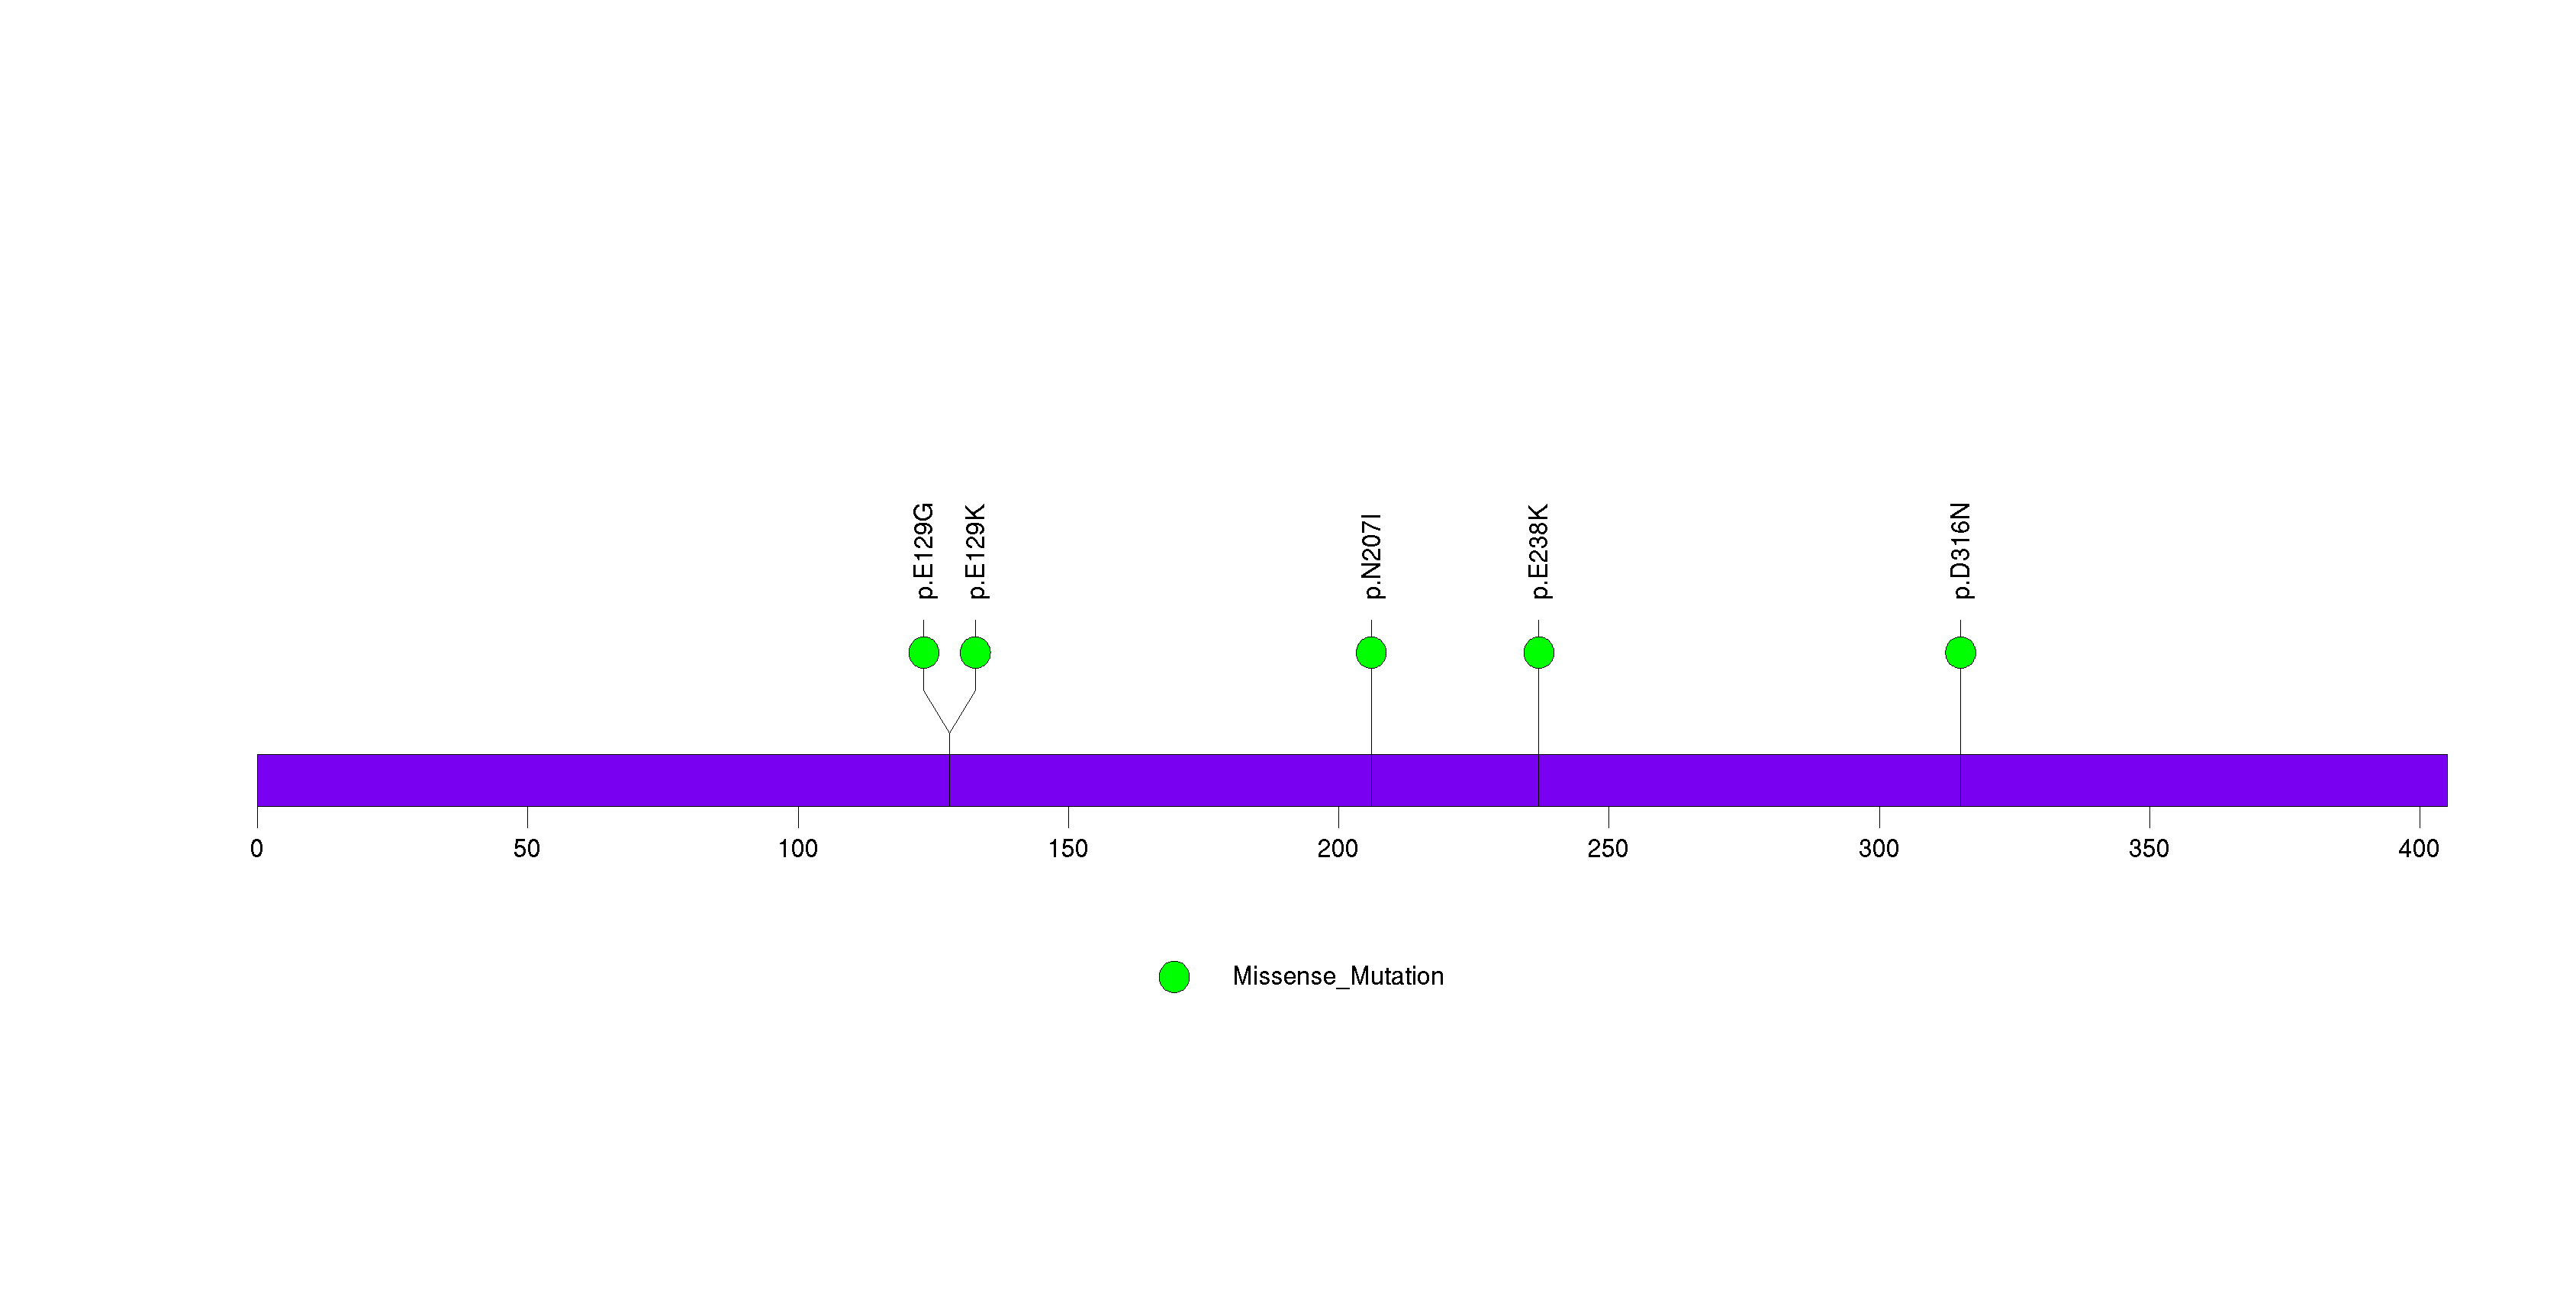
Figure S5. This figure depicts the distribution of mutations and mutation types across the EYA1 significant gene.
In this analysis, COSMIC is used as a filter to increase power by restricting the territory of each gene. Cosmic version: v48.
Table 4. Get Full Table Significantly mutated genes (COSMIC territory only). To access the database please go to: COSMIC. Number of significant genes found: 5. Number of genes displayed: 10
| rank | gene | description | n | cos | n_cos | N_cos | cos_ev | p | q |
|---|---|---|---|---|---|---|---|---|---|
| 1 | IDH1 | isocitrate dehydrogenase 1 (NADP+), soluble | 3 | 5 | 3 | 170 | 4476 | 1.8e-09 | 8.3e-06 |
| 2 | LGR6 | leucine-rich repeat-containing G protein-coupled receptor 6 | 5 | 4 | 2 | 136 | 2 | 1.6e-06 | 0.0028 |
| 3 | KRAS | v-Ki-ras2 Kirsten rat sarcoma viral oncogene homolog | 3 | 52 | 3 | 1768 | 14972 | 2.1e-06 | 0.0028 |
| 4 | EPHA4 | EPH receptor A4 | 3 | 5 | 2 | 170 | 2 | 2.5e-06 | 0.0028 |
| 5 | KIT | v-kit Hardy-Zuckerman 4 feline sarcoma viral oncogene homolog | 4 | 240 | 4 | 8160 | 606 | 5.1e-06 | 0.0046 |
| 6 | ARHGDIG | Rho GDP dissociation inhibitor (GDI) gamma | 1 | 1 | 1 | 34 | 1 | 0.00045 | 0.17 |
| 7 | ARNT | aryl hydrocarbon receptor nuclear translocator | 1 | 1 | 1 | 34 | 1 | 0.00045 | 0.17 |
| 8 | CACNB2 | calcium channel, voltage-dependent, beta 2 subunit | 2 | 1 | 1 | 34 | 1 | 0.00045 | 0.17 |
| 9 | LRRC4C | leucine rich repeat containing 4C | 4 | 1 | 1 | 34 | 1 | 0.00045 | 0.17 |
| 10 | MSTN | myostatin | 2 | 1 | 1 | 34 | 1 | 0.00045 | 0.17 |
Note:
n - number of (nonsilent) mutations in this gene across the individual set.
cos = number of unique mutated sites in this gene in COSMIC
n_cos = overlap between n and cos.
N_cos = number of individuals times cos.
cos_ev = total evidence: number of reports in COSMIC for mutations seen in this gene.
p = p-value for seeing the observed amount of overlap in this gene)
q = q-value, False Discovery Rate (Benjamini-Hochberg procedure)
Table 5. Get Full Table Genes with Clustered Mutations
| num | gene | desc | n | mindist | nmuts0 | nmuts3 | nmuts12 | npairs0 | npairs3 | npairs12 |
|---|---|---|---|---|---|---|---|---|---|---|
| 2750 | IDH1 | isocitrate dehydrogenase 1 (NADP+), soluble | 3 | 0 | 3 | 3 | 3 | 3 | 3 | 3 |
| 6123 | TMC5 | transmembrane channel-like 5 | 6 | 0 | 3 | 3 | 3 | 3 | 3 | 3 |
| 3730 | MUC16 | mucin 16, cell surface associated | 73 | 0 | 2 | 2 | 4 | 2 | 2 | 4 |
| 3840 | NBPF9 | neuroblastoma breakpoint family, member 9 | 6 | 0 | 2 | 2 | 4 | 2 | 2 | 4 |
| 2273 | GABRA6 | gamma-aminobutyric acid (GABA) A receptor, alpha 6 | 5 | 0 | 1 | 3 | 3 | 1 | 3 | 3 |
| 4375 | PAPPA2 | pappalysin 2 | 9 | 0 | 1 | 2 | 2 | 1 | 2 | 2 |
| 169 | ADH1B | alcohol dehydrogenase 1B (class I), beta polypeptide | 4 | 0 | 1 | 1 | 3 | 1 | 1 | 3 |
| 704 | C15orf2 | chromosome 15 open reading frame 2 | 16 | 0 | 1 | 1 | 3 | 1 | 1 | 3 |
| 1 | A1CF | APOBEC1 complementation factor | 4 | 0 | 1 | 1 | 2 | 1 | 1 | 2 |
| 3874 | NEBL | nebulette | 6 | 0 | 1 | 1 | 2 | 1 | 1 | 2 |
Note:
n - number of mutations in this gene in the individual set.
mindist - distance (in aa) between closest pair of mutations in this gene
npairs3 - how many pairs of mutations are within 3 aa of each other.
npairs12 - how many pairs of mutations are within 12 aa of each other.
Table 6. Get Full Table A Ranked List of Significantly Mutated Genesets. (Source: MSigDB GSEA Cannonical Pathway Set).Number of significant genesets found: 0. Number of genesets displayed: 10
| rank | geneset | description | genes | N_genes | mut_tally | N | n | npat | nsite | nsil | n1 | n2 | n3 | n4 | n5 | n6 | p_ns_s | p | q |
|---|---|---|---|---|---|---|---|---|---|---|---|---|---|---|---|---|---|---|---|
| 1 | SA_G1_AND_S_PHASES | Cdk2, 4, and 6 bind cyclin D in G1, while cdk2/cyclin E promotes the G1/S transition. | ARF1, ARF3, CCND1, CDK2, CDK4, CDKN1A, CDKN1B, CDKN2A, CFL1, E2F1, E2F2, MDM2, NXT1, PRB1, TP53 | 15 | CDKN2A(2), E2F1(1), PRB1(5), TP53(2) | 422815 | 10 | 6 | 10 | 3 | 4 | 0 | 1 | 1 | 4 | 0 | 0.34 | 0.0015 | 0.92 |
| 2 | ACTINYPATHWAY | The Arp 2/3 complex localizes to the Y-junction of polymerizing actin fibers that enable lamellipod extension and consequent cell motility. | ABI-2, ACTA1, ACTR2, ACTR3, ARPC1A, ARPC1B, ARPC2, ARPC3, ARPC4, NCK1, NCKAP1, NTRK1, PIR, PSMA7, RAC1, WASF1, WASF2, WASF3, WASL | 18 | ARPC1B(3), NCKAP1(1), NTRK1(4), RAC1(5) | 752925 | 13 | 12 | 12 | 2 | 7 | 0 | 2 | 3 | 1 | 0 | 0.15 | 0.0075 | 1 |
| 3 | ARFPATHWAY | Cyclin-dependent kinase inhibitor 2A is a tumor suppressor that induces G1 arrest and can activate the p53 pathway, leading to G2/M arrest. | ABL1, CDKN2A, E2F1, MDM2, MYC, PIK3CA, PIK3R1, POLR1A, POLR1B, POLR1C, POLR1D, RAC1, RB1, TBX2, TP53, TWIST1 | 16 | CDKN2A(2), E2F1(1), POLR1A(2), POLR1B(1), RAC1(5), RB1(1), TP53(2) | 1001094 | 14 | 11 | 13 | 3 | 7 | 0 | 1 | 2 | 4 | 0 | 0.16 | 0.0089 | 1 |
| 4 | SALMONELLAPATHWAY | Salmonella induces membrane ruffling in infected cells via bacterial proteins including SipA, SipC, and SopE, which alter actin structure. | ACTA1, ACTR2, ACTR3, ARPC1A, ARPC1B, ARPC2, ARPC3, ARPC4, CDC42, RAC1, WASF1, WASL | 12 | ARPC1B(3), RAC1(5) | 400383 | 8 | 8 | 7 | 1 | 6 | 0 | 1 | 1 | 0 | 0 | 0.15 | 0.018 | 1 |
| 5 | TERTPATHWAY | hTERC, the RNA subunit of telomerase, and hTERT, the catalytic protein subunit, are required for telomerase activity and are overexpressed in many cancers. | HDAC1, MAX, MYC, SP1, SP3, TP53, WT1, ZNF42 | 7 | SP1(2), TP53(2) | 351795 | 4 | 4 | 4 | 1 | 0 | 0 | 2 | 1 | 1 | 0 | 0.69 | 0.025 | 1 |
| 6 | SELENOAMINO_ACID_METABOLISM | AHCY, CBS, CTH, GGT1, MARS, MARS2, MAT1A, MAT2B, PAPSS1, PAPSS2, SCLY, SEPHS1 | 12 | AHCY(1), MARS(3), MAT1A(2), PAPSS1(1), PAPSS2(3), SCLY(1) | 615278 | 11 | 7 | 11 | 2 | 7 | 2 | 0 | 1 | 1 | 0 | 0.077 | 0.055 | 1 | |
| 7 | SA_REG_CASCADE_OF_CYCLIN_EXPR | Expression of cyclins regulates progression through the cell cycle by activating cyclin-dependent kinases. | CCNA1, CCNA2, CCND1, CCNE1, CCNE2, CDK2, CDK4, CDKN1B, CDKN2A, E2F1, E2F2, E2F4, PRB1 | 13 | CCNE1(1), CCNE2(3), CDKN2A(2), E2F1(1), PRB1(5) | 448780 | 12 | 8 | 11 | 3 | 5 | 0 | 0 | 4 | 3 | 0 | 0.27 | 0.055 | 1 |
| 8 | CAPROLACTAM_DEGRADATION | AKR1A1, ECHS1, EHHADH, HADHA, SDS | 5 | AKR1A1(1), EHHADH(2), HADHA(2), SDS(1) | 240462 | 6 | 5 | 6 | 0 | 5 | 0 | 0 | 0 | 1 | 0 | 0.044 | 0.065 | 1 | |
| 9 | ACE_INHIBITOR_PATHWAY_PHARMGKB | ACE, AGT, AGTR1, AGTR2, BDKRB2, KNG1, NOS3, REN | 8 | ACE(2), AGTR1(2), AGTR2(1), BDKRB2(3), KNG1(1), NOS3(3), REN(2) | 489373 | 14 | 8 | 14 | 4 | 6 | 0 | 1 | 4 | 3 | 0 | 0.13 | 0.072 | 1 | |
| 10 | CIRCADIANPATHWAY | A heterodimer composed of Bmal1 and Clock acts as a transcription factor for proteins that regulate circadian rhythms, such as Per and Cry. | ARNTL, CLOCK, CRY1, CRY2, CSNK1E, PER1 | 6 | CLOCK(2), CRY1(2), PER1(1) | 417978 | 5 | 4 | 4 | 0 | 1 | 1 | 0 | 1 | 2 | 0 | 0.35 | 0.082 | 1 |
Table 7. Get Full Table A Ranked List of Significantly Mutated Genesets (Excluding Significantly Mutated Genes). Number of significant genesets found: 0. Number of genesets displayed: 10
| rank | geneset | description | genes | N_genes | mut_tally | N | n | npat | nsite | nsil | n1 | n2 | n3 | n4 | n5 | n6 | p_ns_s | p | q |
|---|---|---|---|---|---|---|---|---|---|---|---|---|---|---|---|---|---|---|---|
| 1 | SA_G1_AND_S_PHASES | Cdk2, 4, and 6 bind cyclin D in G1, while cdk2/cyclin E promotes the G1/S transition. | ARF1, ARF3, CCND1, CDK2, CDK4, CDKN1A, CDKN1B, CDKN2A, CFL1, E2F1, E2F2, MDM2, NXT1, PRB1, TP53 | 15 | CDKN2A(2), E2F1(1), PRB1(5), TP53(2) | 422815 | 10 | 6 | 10 | 3 | 4 | 0 | 1 | 1 | 4 | 0 | 0.34 | 0.0015 | 0.92 |
| 2 | TERTPATHWAY | hTERC, the RNA subunit of telomerase, and hTERT, the catalytic protein subunit, are required for telomerase activity and are overexpressed in many cancers. | HDAC1, MAX, MYC, SP1, SP3, TP53, WT1, ZNF42 | 7 | SP1(2), TP53(2) | 351795 | 4 | 4 | 4 | 1 | 0 | 0 | 2 | 1 | 1 | 0 | 0.69 | 0.025 | 1 |
| 3 | SELENOAMINO_ACID_METABOLISM | AHCY, CBS, CTH, GGT1, MARS, MARS2, MAT1A, MAT2B, PAPSS1, PAPSS2, SCLY, SEPHS1 | 12 | AHCY(1), MARS(3), MAT1A(2), PAPSS1(1), PAPSS2(3), SCLY(1) | 615278 | 11 | 7 | 11 | 2 | 7 | 2 | 0 | 1 | 1 | 0 | 0.077 | 0.055 | 1 | |
| 4 | SA_REG_CASCADE_OF_CYCLIN_EXPR | Expression of cyclins regulates progression through the cell cycle by activating cyclin-dependent kinases. | CCNA1, CCNA2, CCND1, CCNE1, CCNE2, CDK2, CDK4, CDKN1B, CDKN2A, E2F1, E2F2, E2F4, PRB1 | 13 | CCNE1(1), CCNE2(3), CDKN2A(2), E2F1(1), PRB1(5) | 448780 | 12 | 8 | 11 | 3 | 5 | 0 | 0 | 4 | 3 | 0 | 0.27 | 0.055 | 1 |
| 5 | CAPROLACTAM_DEGRADATION | AKR1A1, ECHS1, EHHADH, HADHA, SDS | 5 | AKR1A1(1), EHHADH(2), HADHA(2), SDS(1) | 240462 | 6 | 5 | 6 | 0 | 5 | 0 | 0 | 0 | 1 | 0 | 0.044 | 0.065 | 1 | |
| 6 | ACE_INHIBITOR_PATHWAY_PHARMGKB | ACE, AGT, AGTR1, AGTR2, BDKRB2, KNG1, NOS3, REN | 8 | ACE(2), AGTR1(2), AGTR2(1), BDKRB2(3), KNG1(1), NOS3(3), REN(2) | 489373 | 14 | 8 | 14 | 4 | 6 | 0 | 1 | 4 | 3 | 0 | 0.13 | 0.072 | 1 | |
| 7 | CIRCADIANPATHWAY | A heterodimer composed of Bmal1 and Clock acts as a transcription factor for proteins that regulate circadian rhythms, such as Per and Cry. | ARNTL, CLOCK, CRY1, CRY2, CSNK1E, PER1 | 6 | CLOCK(2), CRY1(2), PER1(1) | 417978 | 5 | 4 | 4 | 0 | 1 | 1 | 0 | 1 | 2 | 0 | 0.35 | 0.082 | 1 |
| 8 | NICOTINATE_AND_NICOTINAMIDE_METABOLISM | AOX1, CD38, ENPP1, ENPP3, NADSYN1, NMNAT1, NMNAT2, NNMT, NNT, NP, NT5C, NT5E, NT5M, QPRT | 13 | AOX1(3), CD38(2), ENPP1(1), ENPP3(1), NADSYN1(2), NNMT(1), NT5E(1), QPRT(1) | 714118 | 12 | 7 | 12 | 2 | 7 | 1 | 0 | 2 | 2 | 0 | 0.13 | 0.084 | 1 | |
| 9 | FXRPATHWAY | The nuclear receptor transcription factors FXR and LXR are activated by cholesterol metabolites and regulate cholesterol homeostasis. | FABP6, LDLR, NR0B2, NR1H3, NR1H4, RXRA | 6 | LDLR(3), NR1H4(2), RXRA(1) | 270174 | 6 | 4 | 6 | 1 | 3 | 2 | 1 | 0 | 0 | 0 | 0.17 | 0.087 | 1 |
| 10 | HSA00643_STYRENE_DEGRADATION | Genes involved in styrene degradation | FAH, GSTZ1, HGD | 3 | FAH(1), HGD(2) | 111602 | 3 | 3 | 3 | 2 | 1 | 1 | 1 | 0 | 0 | 0 | 0.75 | 0.093 | 1 |
In brief, we tabulate the number of mutations and the number of covered bases for each gene. The counts are broken down by mutation context category: four context categories that are discovered by MutSig, and one for indel and 'null' mutations, which include indels, nonsense mutations, splice-site mutations, and non-stop (read-through) mutations. For each gene, we calculate the probability of seeing the observed constellation of mutations, i.e. the product P1 x P2 x ... x Pm, or a more extreme one, given the background mutation rates calculated across the dataset. [1]
This is an experimental feature. The full results of the analysis summarized in this report can be downloaded from the TCGA Data Coordination Center.