This pipeline computes the correlation between significantly recurrent gene mutations and selected clinical features.
Testing the association between mutation status of 19 genes and 5 clinical features across 201 patients, 3 significant findings detected with Q value < 0.25.
-
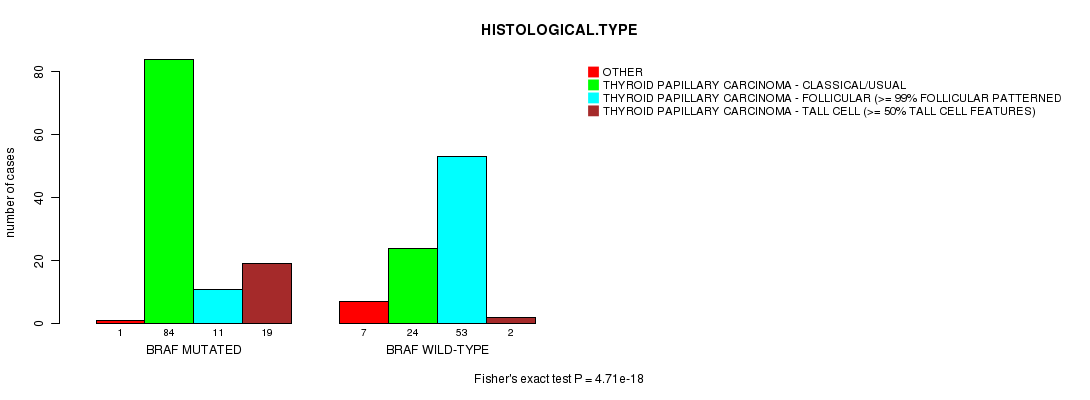
BRAF mutation correlated to 'HISTOLOGICAL.TYPE'.
-
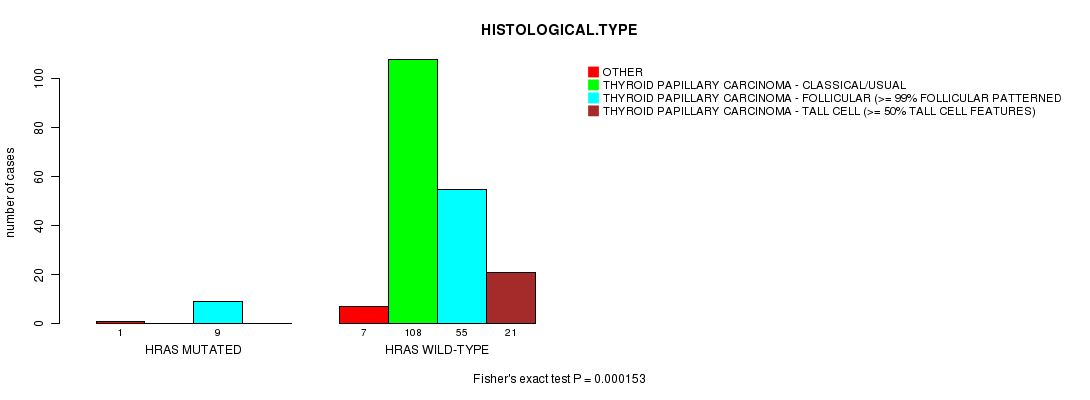
HRAS mutation correlated to 'HISTOLOGICAL.TYPE'.
-
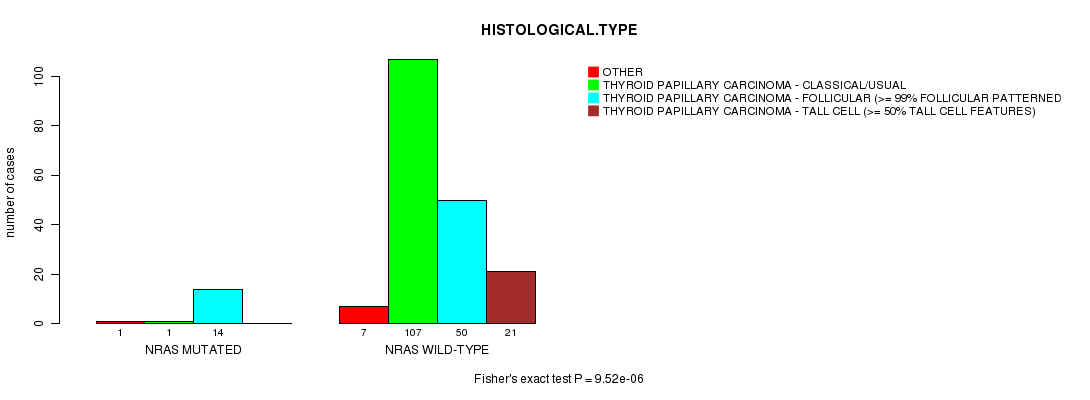
NRAS mutation correlated to 'HISTOLOGICAL.TYPE'.
Table 1. Get Full Table Overview of the association between mutation status of 19 genes and 5 clinical features. Shown in the table are P values (Q values). Thresholded by Q value < 0.25, 3 significant findings detected.
|
Clinical Features |
AGE | GENDER |
HISTOLOGICAL TYPE |
RADIATIONS RADIATION REGIMENINDICATION |
NEOADJUVANT THERAPY |
||
| nMutated (%) | nWild-Type | t-test | Fisher's exact test | Fisher's exact test | Fisher's exact test | Fisher's exact test | |
| BRAF | 115 (57%) | 86 |
0.445 (1.00) |
0.517 (1.00) |
4.71e-18 (4.47e-16) |
0.0144 (1.00) |
0.577 (1.00) |
| HRAS | 10 (5%) | 191 |
0.732 (1.00) |
0.721 (1.00) |
0.000153 (0.0142) |
1 (1.00) |
1 (1.00) |
| NRAS | 16 (8%) | 185 |
0.818 (1.00) |
0.132 (1.00) |
9.52e-06 (0.000895) |
0.604 (1.00) |
1 (1.00) |
| POLDIP2 | 5 (2%) | 196 |
0.917 (1.00) |
0.11 (1.00) |
0.604 (1.00) |
0.267 (1.00) |
1 (1.00) |
| EMG1 | 4 (2%) | 197 |
0.686 (1.00) |
0.574 (1.00) |
1 (1.00) |
1 (1.00) |
1 (1.00) |
| EIF1AX | 3 (1%) | 198 |
0.432 (1.00) |
0.165 (1.00) |
0.0366 (1.00) |
1 (1.00) |
1 (1.00) |
| ZNF845 | 3 (1%) | 198 |
0.0965 (1.00) |
0.57 (1.00) |
0.559 (1.00) |
1 (1.00) |
1 (1.00) |
| CCDC15 | 5 (2%) | 196 |
0.139 (1.00) |
1 (1.00) |
0.121 (1.00) |
1 (1.00) |
1 (1.00) |
| TG | 9 (4%) | 192 |
0.359 (1.00) |
1 (1.00) |
0.0109 (0.999) |
1 (1.00) |
0.129 (1.00) |
| CHEK2 | 3 (1%) | 198 |
0.53 (1.00) |
1 (1.00) |
0.0985 (1.00) |
1 (1.00) |
1 (1.00) |
| PPM1D | 5 (2%) | 196 |
0.545 (1.00) |
1 (1.00) |
0.842 (1.00) |
1 (1.00) |
1 (1.00) |
| ZNF799 | 3 (1%) | 198 |
0.946 (1.00) |
1 (1.00) |
0.559 (1.00) |
1 (1.00) |
1 (1.00) |
| SLC26A11 | 3 (1%) | 198 |
0.392 (1.00) |
0.165 (1.00) |
0.723 (1.00) |
1 (1.00) |
1 (1.00) |
| KRAS | 3 (1%) | 198 |
0.888 (1.00) |
0.57 (1.00) |
0.0985 (1.00) |
1 (1.00) |
1 (1.00) |
| ARID1B | 5 (2%) | 196 |
0.52 (1.00) |
1 (1.00) |
0.219 (1.00) |
1 (1.00) |
1 (1.00) |
| COL5A3 | 4 (2%) | 197 |
0.666 (1.00) |
0.574 (1.00) |
0.289 (1.00) |
1 (1.00) |
1 (1.00) |
| DNMT3A | 4 (2%) | 197 |
0.665 (1.00) |
1 (1.00) |
0.626 (1.00) |
1 (1.00) |
1 (1.00) |
| ARFGEF2 | 4 (2%) | 197 |
0.0446 (1.00) |
1 (1.00) |
0.626 (1.00) |
1 (1.00) |
1 (1.00) |
| ZFHX3 | 4 (2%) | 197 |
0.71 (1.00) |
0.574 (1.00) |
0.289 (1.00) |
0.22 (1.00) |
0.0588 (1.00) |
P value = 4.71e-18 (Fisher's exact test), Q value = 4.5e-16
Table S1. Gene #1: 'BRAF MUTATION STATUS' versus Clinical Feature #3: 'HISTOLOGICAL.TYPE'
| nPatients | OTHER | THYROID PAPILLARY CARCINOMA - CLASSICAL/USUAL | THYROID PAPILLARY CARCINOMA - FOLLICULAR (>= 99% FOLLICULAR PATTERNED) | THYROID PAPILLARY CARCINOMA - TALL CELL (>= 50% TALL CELL FEATURES) |
|---|---|---|---|---|
| ALL | 8 | 108 | 64 | 21 |
| BRAF MUTATED | 1 | 84 | 11 | 19 |
| BRAF WILD-TYPE | 7 | 24 | 53 | 2 |
Figure S1. Get High-res Image Gene #1: 'BRAF MUTATION STATUS' versus Clinical Feature #3: 'HISTOLOGICAL.TYPE'
P value = 0.000153 (Fisher's exact test), Q value = 0.014
Table S2. Gene #2: 'HRAS MUTATION STATUS' versus Clinical Feature #3: 'HISTOLOGICAL.TYPE'
| nPatients | OTHER | THYROID PAPILLARY CARCINOMA - CLASSICAL/USUAL | THYROID PAPILLARY CARCINOMA - FOLLICULAR (>= 99% FOLLICULAR PATTERNED) | THYROID PAPILLARY CARCINOMA - TALL CELL (>= 50% TALL CELL FEATURES) |
|---|---|---|---|---|
| ALL | 8 | 108 | 64 | 21 |
| HRAS MUTATED | 1 | 0 | 9 | 0 |
| HRAS WILD-TYPE | 7 | 108 | 55 | 21 |
Figure S2. Get High-res Image Gene #2: 'HRAS MUTATION STATUS' versus Clinical Feature #3: 'HISTOLOGICAL.TYPE'
P value = 9.52e-06 (Fisher's exact test), Q value = 0.00089
Table S3. Gene #3: 'NRAS MUTATION STATUS' versus Clinical Feature #3: 'HISTOLOGICAL.TYPE'
| nPatients | OTHER | THYROID PAPILLARY CARCINOMA - CLASSICAL/USUAL | THYROID PAPILLARY CARCINOMA - FOLLICULAR (>= 99% FOLLICULAR PATTERNED) | THYROID PAPILLARY CARCINOMA - TALL CELL (>= 50% TALL CELL FEATURES) |
|---|---|---|---|---|
| ALL | 8 | 108 | 64 | 21 |
| NRAS MUTATED | 1 | 1 | 14 | 0 |
| NRAS WILD-TYPE | 7 | 107 | 50 | 21 |
Figure S3. Get High-res Image Gene #3: 'NRAS MUTATION STATUS' versus Clinical Feature #3: 'HISTOLOGICAL.TYPE'
-
Mutation data file = THCA.mutsig.cluster.txt
-
Clinical data file = THCA.clin.merged.picked.txt
-
Number of patients = 201
-
Number of significantly mutated genes = 19
-
Number of selected clinical features = 5
-
Exclude genes that fewer than K tumors have mutations, K = 3
For continuous numerical clinical features, two-tailed Student's t test with unequal variance (Lehmann and Romano 2005) was applied to compare the clinical values between tumors with and without gene mutations using 't.test' function in R
For binary or multi-class clinical features (nominal or ordinal), two-tailed Fisher's exact tests (Fisher 1922) were used to estimate the P values using the 'fisher.test' function in R
For multiple hypothesis correction, Q value is the False Discovery Rate (FDR) analogue of the P value (Benjamini and Hochberg 1995), defined as the minimum FDR at which the test may be called significant. We used the 'Benjamini and Hochberg' method of 'p.adjust' function in R to convert P values into Q values.
This is an experimental feature. The full results of the analysis summarized in this report can be downloaded from the TCGA Data Coordination Center.