This pipeline computes the correlation between significantly recurrent gene mutations and selected clinical features.
Testing the association between mutation status of 100 genes and 5 clinical features across 507 patients, 2 significant findings detected with Q value < 0.25.
-
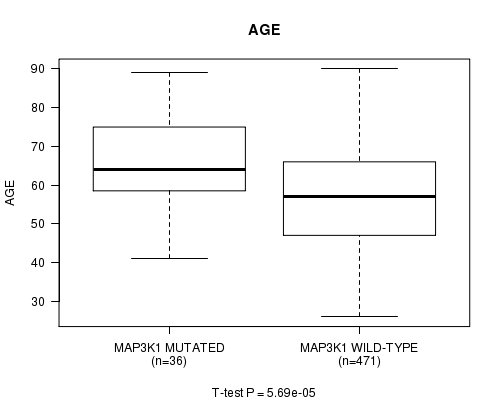
MAP3K1 mutation correlated to 'AGE'.
-
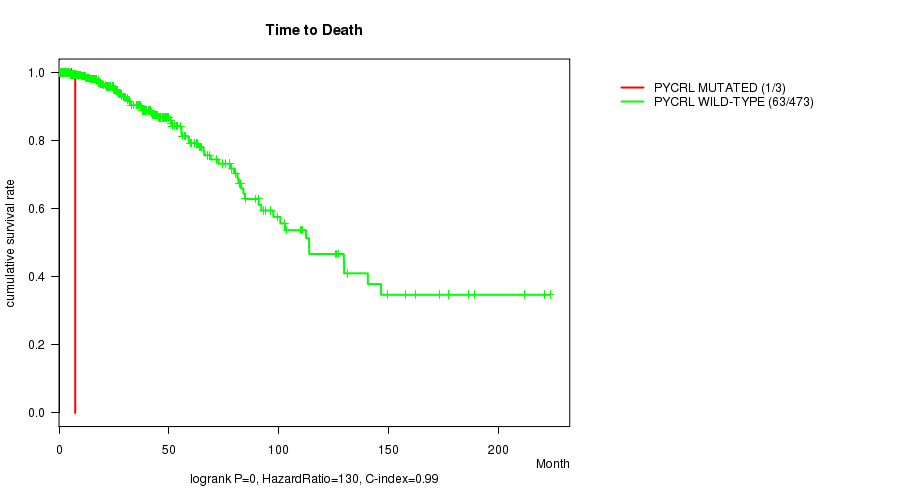
PYCRL mutation correlated to 'Time to Death'.
Table 1. Get Full Table Overview of the association between mutation status of 100 genes and 5 clinical features. Shown in the table are P values (Q values). Thresholded by Q value < 0.25, 2 significant findings detected.
|
Clinical Features |
Time to Death |
AGE | GENDER |
RADIATIONS RADIATION REGIMENINDICATION |
NEOADJUVANT THERAPY |
||
| nMutated (%) | nWild-Type | logrank test | t-test | Fisher's exact test | Fisher's exact test | Fisher's exact test | |
| MAP3K1 | 36 (7%) | 471 |
0.643 (1.00) |
5.69e-05 (0.0283) |
1 (1.00) |
0.246 (1.00) |
0.861 (1.00) |
| PYCRL | 3 (1%) | 504 |
0 (0) |
0.633 (1.00) |
1 (1.00) |
1 (1.00) |
1 (1.00) |
| PIK3CA | 158 (31%) | 349 |
0.858 (1.00) |
0.0765 (1.00) |
1 (1.00) |
0.52 (1.00) |
1 (1.00) |
| TP53 | 139 (27%) | 368 |
0.786 (1.00) |
0.498 (1.00) |
0.195 (1.00) |
0.435 (1.00) |
0.544 (1.00) |
| GATA3 | 53 (10%) | 454 |
0.608 (1.00) |
0.0149 (1.00) |
0.486 (1.00) |
0.192 (1.00) |
0.302 (1.00) |
| MLL3 | 29 (6%) | 478 |
0.747 (1.00) |
0.0219 (1.00) |
1 (1.00) |
0.831 (1.00) |
0.332 (1.00) |
| CDH1 | 31 (6%) | 476 |
0.904 (1.00) |
0.096 (1.00) |
1 (1.00) |
1 (1.00) |
0.852 (1.00) |
| MAP2K4 | 18 (4%) | 489 |
0.103 (1.00) |
0.0249 (1.00) |
1 (1.00) |
0.422 (1.00) |
0.33 (1.00) |
| PIK3R1 | 14 (3%) | 493 |
0.213 (1.00) |
0.88 (1.00) |
1 (1.00) |
1 (1.00) |
1 (1.00) |
| PTEN | 14 (3%) | 493 |
0.241 (1.00) |
0.392 (1.00) |
1 (1.00) |
1 (1.00) |
0.787 (1.00) |
| RUNX1 | 14 (3%) | 493 |
0.176 (1.00) |
0.879 (1.00) |
1 (1.00) |
0.767 (1.00) |
0.586 (1.00) |
| TBX3 | 11 (2%) | 496 |
0.258 (1.00) |
0.0523 (1.00) |
1 (1.00) |
0.735 (1.00) |
0.538 (1.00) |
| AKT1 | 12 (2%) | 495 |
0.223 (1.00) |
0.548 (1.00) |
1 (1.00) |
0.194 (1.00) |
0.769 (1.00) |
| CTCF | 11 (2%) | 496 |
0.162 (1.00) |
0.777 (1.00) |
1 (1.00) |
1 (1.00) |
0.375 (1.00) |
| NCOR1 | 15 (3%) | 492 |
0.558 (1.00) |
0.327 (1.00) |
1 (1.00) |
0.769 (1.00) |
0.295 (1.00) |
| RPGR | 10 (2%) | 497 |
0.783 (1.00) |
0.81 (1.00) |
1 (1.00) |
0.735 (1.00) |
0.748 (1.00) |
| RB1 | 9 (2%) | 498 |
0.69 (1.00) |
0.305 (1.00) |
1 (1.00) |
0.455 (1.00) |
0.318 (1.00) |
| CBFB | 5 (1%) | 502 |
0.867 (1.00) |
0.14 (1.00) |
1 (1.00) |
1 (1.00) |
0.409 (1.00) |
| ZFP36L1 | 6 (1%) | 501 |
0.968 (1.00) |
0.166 (1.00) |
1 (1.00) |
0.195 (1.00) |
0.408 (1.00) |
| CDKN1B | 5 (1%) | 502 |
0.469 (1.00) |
0.982 (1.00) |
1 (1.00) |
1 (1.00) |
0.409 (1.00) |
| FOXA1 | 7 (1%) | 500 |
0.0014 (0.695) |
0.0231 (1.00) |
1 (1.00) |
1 (1.00) |
0.705 (1.00) |
| PRRX1 | 5 (1%) | 502 |
0.505 (1.00) |
0.785 (1.00) |
1 (1.00) |
0.13 (1.00) |
0.653 (1.00) |
| MUC4 | 13 (3%) | 494 |
0.366 (1.00) |
0.958 (1.00) |
1 (1.00) |
0.357 (1.00) |
0.78 (1.00) |
| AFF2 | 11 (2%) | 496 |
0.716 (1.00) |
0.0188 (1.00) |
1 (1.00) |
0.503 (1.00) |
1 (1.00) |
| DSPP | 6 (1%) | 501 |
0.242 (1.00) |
0.155 (1.00) |
1 (1.00) |
0.668 (1.00) |
1 (1.00) |
| ATN1 | 8 (2%) | 499 |
0.235 (1.00) |
0.72 (1.00) |
1 (1.00) |
0.456 (1.00) |
0.479 (1.00) |
| MYB | 7 (1%) | 500 |
0.219 (1.00) |
0.485 (1.00) |
1 (1.00) |
0.0935 (1.00) |
0.456 (1.00) |
| DALRD3 | 6 (1%) | 501 |
0.613 (1.00) |
0.0641 (1.00) |
1 (1.00) |
0.353 (1.00) |
0.696 (1.00) |
| GPS2 | 5 (1%) | 502 |
0.269 (1.00) |
0.668 (1.00) |
1 (1.00) |
0.618 (1.00) |
1 (1.00) |
| FAM166A | 4 (1%) | 503 |
0.961 (1.00) |
0.978 (1.00) |
1 (1.00) |
1 (1.00) |
0.312 (1.00) |
| NKAIN4 | 3 (1%) | 504 |
0.592 (1.00) |
0.168 (1.00) |
1 (1.00) |
0.0203 (1.00) |
0.572 (1.00) |
| PIWIL1 | 8 (2%) | 499 |
0.189 (1.00) |
0.718 (1.00) |
1 (1.00) |
1 (1.00) |
1 (1.00) |
| SF3B1 | 10 (2%) | 497 |
0.386 (1.00) |
0.378 (1.00) |
1 (1.00) |
1 (1.00) |
0.534 (1.00) |
| SAAL1 | 5 (1%) | 502 |
0.202 (1.00) |
0.819 (1.00) |
1 (1.00) |
0.618 (1.00) |
1 (1.00) |
| TMEM82 | 4 (1%) | 503 |
1 (1.00) |
0.269 (1.00) |
1 (1.00) |
0.579 (1.00) |
0.146 (1.00) |
| HIST1H2BC | 4 (1%) | 503 |
0.556 (1.00) |
0.657 (1.00) |
1 (1.00) |
1 (1.00) |
0.312 (1.00) |
| TBL1XR1 | 5 (1%) | 502 |
0.00337 (1.00) |
0.257 (1.00) |
1 (1.00) |
1 (1.00) |
0.409 (1.00) |
| WNT7A | 5 (1%) | 502 |
0.6 (1.00) |
0.938 (1.00) |
1 (1.00) |
0.618 (1.00) |
0.653 (1.00) |
| BID | 4 (1%) | 503 |
0.175 (1.00) |
0.0368 (1.00) |
1 (1.00) |
0.303 (1.00) |
0.312 (1.00) |
| LRFN4 | 4 (1%) | 503 |
0.159 (1.00) |
0.758 (1.00) |
1 (1.00) |
0.579 (1.00) |
0.312 (1.00) |
| TLE6 | 6 (1%) | 501 |
0.264 (1.00) |
0.488 (1.00) |
1 (1.00) |
1 (1.00) |
1 (1.00) |
| FER1L5 | 7 (1%) | 500 |
0.752 (1.00) |
0.0217 (1.00) |
1 (1.00) |
0.399 (1.00) |
0.0221 (1.00) |
| HIST1H1C | 4 (1%) | 503 |
0.766 (1.00) |
0.979 (1.00) |
0.0466 (1.00) |
0.579 (1.00) |
1 (1.00) |
| GPR32 | 5 (1%) | 502 |
0.733 (1.00) |
0.155 (1.00) |
1 (1.00) |
1 (1.00) |
1 (1.00) |
| MLLT4 | 7 (1%) | 500 |
0.0724 (1.00) |
0.306 (1.00) |
1 (1.00) |
0.68 (1.00) |
0.705 (1.00) |
| ITPKB | 7 (1%) | 500 |
0.489 (1.00) |
0.0247 (1.00) |
1 (1.00) |
0.198 (1.00) |
1 (1.00) |
| COL18A1 | 6 (1%) | 501 |
0.524 (1.00) |
0.19 (1.00) |
1 (1.00) |
0.668 (1.00) |
0.696 (1.00) |
| CCR2 | 4 (1%) | 503 |
0.85 (1.00) |
0.38 (1.00) |
1 (1.00) |
1 (1.00) |
1 (1.00) |
| HAUS5 | 6 (1%) | 501 |
0.67 (1.00) |
0.978 (1.00) |
1 (1.00) |
0.195 (1.00) |
1 (1.00) |
| MUC5B | 12 (2%) | 495 |
0.0251 (1.00) |
0.954 (1.00) |
1 (1.00) |
1 (1.00) |
0.565 (1.00) |
| LLGL2 | 5 (1%) | 502 |
0.445 (1.00) |
0.036 (1.00) |
1 (1.00) |
0.618 (1.00) |
1 (1.00) |
| CIRBP | 3 (1%) | 504 |
0.619 (1.00) |
0.096 (1.00) |
1 (1.00) |
1 (1.00) |
1 (1.00) |
| GPRIN2 | 4 (1%) | 503 |
0.208 (1.00) |
0.26 (1.00) |
1 (1.00) |
1 (1.00) |
0.312 (1.00) |
| KLRG2 | 3 (1%) | 504 |
0.307 (1.00) |
1 (1.00) |
0.184 (1.00) |
0.572 (1.00) |
|
| PQLC2 | 4 (1%) | 503 |
0.283 (1.00) |
0.0468 (1.00) |
1 (1.00) |
0.579 (1.00) |
0.645 (1.00) |
| GLI4 | 3 (1%) | 504 |
0.475 (1.00) |
0.574 (1.00) |
1 (1.00) |
0.565 (1.00) |
1 (1.00) |
| HLA-A | 4 (1%) | 503 |
0.21 (1.00) |
0.449 (1.00) |
1 (1.00) |
0.303 (1.00) |
1 (1.00) |
| UBC | 6 (1%) | 501 |
0.323 (1.00) |
0.736 (1.00) |
1 (1.00) |
0.668 (1.00) |
0.238 (1.00) |
| MYT1L | 8 (2%) | 499 |
0.888 (1.00) |
0.736 (1.00) |
1 (1.00) |
0.224 (1.00) |
0.723 (1.00) |
| PIP4K2C | 5 (1%) | 502 |
0.149 (1.00) |
0.759 (1.00) |
1 (1.00) |
0.618 (1.00) |
1 (1.00) |
| PPEF1 | 6 (1%) | 501 |
0.53 (1.00) |
0.588 (1.00) |
1 (1.00) |
1 (1.00) |
1 (1.00) |
| KCNQ2 | 4 (1%) | 503 |
0.41 (1.00) |
0.923 (1.00) |
1 (1.00) |
0.579 (1.00) |
0.146 (1.00) |
| LYSMD3 | 4 (1%) | 503 |
0.736 (1.00) |
0.58 (1.00) |
1 (1.00) |
1 (1.00) |
0.645 (1.00) |
| NF1 | 12 (2%) | 495 |
0.518 (1.00) |
0.646 (1.00) |
1 (1.00) |
0.194 (1.00) |
0.769 (1.00) |
| ARID1A | 8 (2%) | 499 |
0.975 (1.00) |
0.507 (1.00) |
1 (1.00) |
0.456 (1.00) |
0.148 (1.00) |
| ATP10B | 10 (2%) | 497 |
0.65 (1.00) |
0.286 (1.00) |
1 (1.00) |
0.735 (1.00) |
1 (1.00) |
| GRIN2A | 9 (2%) | 498 |
0.32 (1.00) |
0.733 (1.00) |
1 (1.00) |
0.455 (1.00) |
0.318 (1.00) |
| MED23 | 8 (2%) | 499 |
0.46 (1.00) |
0.0213 (1.00) |
1 (1.00) |
0.69 (1.00) |
0.723 (1.00) |
| FLG | 16 (3%) | 491 |
0.526 (1.00) |
0.345 (1.00) |
1 (1.00) |
0.777 (1.00) |
0.803 (1.00) |
| FMN2 | 7 (1%) | 500 |
0.754 (1.00) |
0.103 (1.00) |
1 (1.00) |
0.68 (1.00) |
0.456 (1.00) |
| KIAA1644 | 3 (1%) | 504 |
0.186 (1.00) |
0.85 (1.00) |
1 (1.00) |
0.565 (1.00) |
1 (1.00) |
| PRND | 3 (1%) | 504 |
0.737 (1.00) |
0.785 (1.00) |
1 (1.00) |
1 (1.00) |
0.572 (1.00) |
| SPTA1 | 12 (2%) | 495 |
0.0458 (1.00) |
0.342 (1.00) |
1 (1.00) |
0.194 (1.00) |
0.375 (1.00) |
| CHST2 | 3 (1%) | 504 |
0.647 (1.00) |
0.452 (1.00) |
1 (1.00) |
0.0203 (1.00) |
0.0705 (1.00) |
| RGS7 | 5 (1%) | 502 |
0.694 (1.00) |
0.71 (1.00) |
1 (1.00) |
0.618 (1.00) |
0.653 (1.00) |
| CCDC146 | 5 (1%) | 502 |
0.641 (1.00) |
0.564 (1.00) |
1 (1.00) |
0.618 (1.00) |
0.653 (1.00) |
| OPRM1 | 5 (1%) | 502 |
0.492 (1.00) |
0.276 (1.00) |
1 (1.00) |
1 (1.00) |
0.409 (1.00) |
| PCDHA8 | 6 (1%) | 501 |
0.00555 (1.00) |
0.944 (1.00) |
1 (1.00) |
0.195 (1.00) |
1 (1.00) |
| PIP5K1C | 3 (1%) | 504 |
0.683 (1.00) |
0.487 (1.00) |
1 (1.00) |
1 (1.00) |
1 (1.00) |
| CCND3 | 3 (1%) | 504 |
0.502 (1.00) |
0.147 (1.00) |
1 (1.00) |
1 (1.00) |
0.572 (1.00) |
| CCT6B | 5 (1%) | 502 |
0.167 (1.00) |
1 (1.00) |
0.058 (1.00) |
1 (1.00) |
1 (1.00) |
| OBSCN | 17 (3%) | 490 |
0.365 (1.00) |
0.368 (1.00) |
1 (1.00) |
1 (1.00) |
0.33 (1.00) |
| TPO | 6 (1%) | 501 |
0.406 (1.00) |
0.187 (1.00) |
1 (1.00) |
0.668 (1.00) |
1 (1.00) |
| SELL | 4 (1%) | 503 |
0.602 (1.00) |
0.717 (1.00) |
1 (1.00) |
1 (1.00) |
0.645 (1.00) |
| CCDC88B | 5 (1%) | 502 |
0.681 (1.00) |
0.0829 (1.00) |
1 (1.00) |
0.13 (1.00) |
0.653 (1.00) |
| SARM1 | 3 (1%) | 504 |
0.57 (1.00) |
0.771 (1.00) |
1 (1.00) |
0.565 (1.00) |
1 (1.00) |
| SPEN | 13 (3%) | 494 |
0.0978 (1.00) |
0.113 (1.00) |
1 (1.00) |
0.357 (1.00) |
1 (1.00) |
| EPS8L1 | 4 (1%) | 503 |
0.248 (1.00) |
0.175 (1.00) |
1 (1.00) |
1 (1.00) |
0.645 (1.00) |
| ZP4 | 5 (1%) | 502 |
0.515 (1.00) |
0.139 (1.00) |
1 (1.00) |
1 (1.00) |
1 (1.00) |
| C19ORF39 | 3 (1%) | 504 |
0.216 (1.00) |
0.106 (1.00) |
1 (1.00) |
1 (1.00) |
0.572 (1.00) |
| CCDC159 | 3 (1%) | 504 |
0.395 (1.00) |
0.341 (1.00) |
0.0352 (1.00) |
0.565 (1.00) |
1 (1.00) |
| H2BFWT | 3 (1%) | 504 |
0.589 (1.00) |
1 (1.00) |
1 (1.00) |
0.572 (1.00) |
|
| PHLDA1 | 3 (1%) | 504 |
0.945 (1.00) |
0.451 (1.00) |
1 (1.00) |
0.565 (1.00) |
1 (1.00) |
| MEFV | 6 (1%) | 501 |
0.545 (1.00) |
0.0209 (1.00) |
0.0693 (1.00) |
1 (1.00) |
0.408 (1.00) |
| NEK5 | 6 (1%) | 501 |
0.507 (1.00) |
0.0998 (1.00) |
1 (1.00) |
1 (1.00) |
1 (1.00) |
| KCNT2 | 8 (2%) | 499 |
0.695 (1.00) |
0.372 (1.00) |
1 (1.00) |
0.456 (1.00) |
0.479 (1.00) |
| LIF | 3 (1%) | 504 |
0.557 (1.00) |
0.555 (1.00) |
1 (1.00) |
0.565 (1.00) |
1 (1.00) |
| PRAME | 5 (1%) | 502 |
0.763 (1.00) |
0.756 (1.00) |
1 (1.00) |
0.618 (1.00) |
1 (1.00) |
| C1ORF65 | 4 (1%) | 503 |
0.176 (1.00) |
0.91 (1.00) |
1 (1.00) |
0.303 (1.00) |
1 (1.00) |
| LPO | 5 (1%) | 502 |
0.571 (1.00) |
0.022 (1.00) |
1 (1.00) |
0.618 (1.00) |
0.653 (1.00) |
P value = 5.69e-05 (t-test), Q value = 0.028
Table S1. Gene #4: 'MAP3K1 MUTATION STATUS' versus Clinical Feature #2: 'AGE'
| nPatients | Mean (Std.Dev) | |
|---|---|---|
| ALL | 507 | 57.8 (13.1) |
| MAP3K1 MUTATED | 36 | 65.9 (11.2) |
| MAP3K1 WILD-TYPE | 471 | 57.2 (13.1) |
Figure S1. Get High-res Image Gene #4: 'MAP3K1 MUTATION STATUS' versus Clinical Feature #2: 'AGE'
P value = 0 (logrank test), Q value = 0
Table S2. Gene #51: 'PYCRL MUTATION STATUS' versus Clinical Feature #1: 'Time to Death'
| nPatients | nDeath | Duration Range (Median), Month | |
|---|---|---|---|
| ALL | 476 | 64 | 0.1 - 223.4 (24.4) |
| PYCRL MUTATED | 3 | 1 | 2.5 - 7.4 (5.8) |
| PYCRL WILD-TYPE | 473 | 63 | 0.1 - 223.4 (24.5) |
Figure S2. Get High-res Image Gene #51: 'PYCRL MUTATION STATUS' versus Clinical Feature #1: 'Time to Death'
-
Mutation data file = BRCA.mutsig.cluster.txt
-
Clinical data file = BRCA.clin.merged.picked.txt
-
Number of patients = 507
-
Number of significantly mutated genes = 100
-
Number of selected clinical features = 5
-
Exclude genes that fewer than K tumors have mutations, K = 3
For survival clinical features, the Kaplan-Meier survival curves of tumors with and without gene mutations were plotted and the statistical significance P values were estimated by logrank test (Bland and Altman 2004) using the 'survdiff' function in R
For continuous numerical clinical features, two-tailed Student's t test with unequal variance (Lehmann and Romano 2005) was applied to compare the clinical values between tumors with and without gene mutations using 't.test' function in R
For binary or multi-class clinical features (nominal or ordinal), two-tailed Fisher's exact tests (Fisher 1922) were used to estimate the P values using the 'fisher.test' function in R
For multiple hypothesis correction, Q value is the False Discovery Rate (FDR) analogue of the P value (Benjamini and Hochberg 1995), defined as the minimum FDR at which the test may be called significant. We used the 'Benjamini and Hochberg' method of 'p.adjust' function in R to convert P values into Q values.
This is an experimental feature. Location of data archives could not be determined.