(primary solid tumor cohort)
This pipeline computes the correlation between significant arm-level copy number variations (cnvs) and subtypes.
Testing the association between copy number variation 29 arm-level results and 6 molecular subtypes across 187 patients, 9 significant findings detected with Q value < 0.25.
-
7p gain cnv correlated to 'CN_CNMF'.
-
8q gain cnv correlated to 'CN_CNMF'.
-
8p loss cnv correlated to 'METHLYATION_CNMF' and 'MIRSEQ_CNMF'.
-
13q loss cnv correlated to 'CN_CNMF'.
-
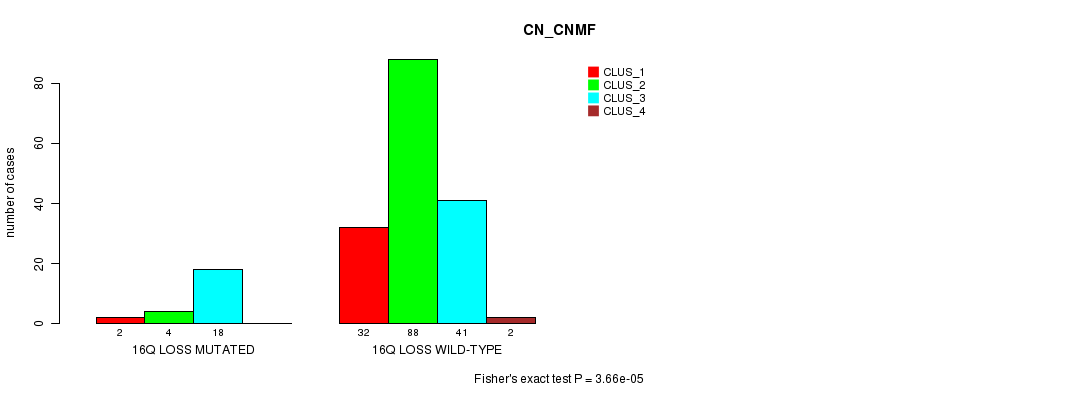
16q loss cnv correlated to 'CN_CNMF'.
-
17p loss cnv correlated to 'CN_CNMF'.
-
18p loss cnv correlated to 'CN_CNMF'.
-
18q loss cnv correlated to 'CN_CNMF'.
Table 1. Get Full Table Overview of the association between significant copy number variation of 29 arm-level results and 6 molecular subtypes. Shown in the table are P values (Q values). Thresholded by Q value < 0.25, 9 significant findings detected.
|
Molecular subtypes |
CN CNMF |
METHLYATION CNMF |
MRNASEQ CNMF |
MRNASEQ CHIERARCHICAL |
MIRSEQ CNMF |
MIRSEQ CHIERARCHICAL |
||
| nCNV (%) | nWild-Type | Fisher's exact test | Fisher's exact test | Fisher's exact test | Fisher's exact test | Fisher's exact test | Fisher's exact test | |
| 8p loss | 47 (25%) | 140 |
0.00278 (0.434) |
0.000129 (0.0208) |
0.00326 (0.505) |
0.0331 (1.00) |
0.000492 (0.0782) |
0.685 (1.00) |
| 7p gain | 16 (9%) | 171 |
0.000281 (0.045) |
0.0775 (1.00) |
0.109 (1.00) |
0.139 (1.00) |
0.429 (1.00) |
0.218 (1.00) |
| 8q gain | 19 (10%) | 168 |
5.57e-05 (0.00902) |
0.462 (1.00) |
0.0856 (1.00) |
0.243 (1.00) |
0.262 (1.00) |
0.112 (1.00) |
| 13q loss | 12 (6%) | 175 |
0.00145 (0.229) |
0.214 (1.00) |
0.0284 (1.00) |
0.0349 (1.00) |
0.248 (1.00) |
0.496 (1.00) |
| 16q loss | 24 (13%) | 163 |
3.66e-05 (0.00597) |
0.0391 (1.00) |
0.18 (1.00) |
0.199 (1.00) |
0.173 (1.00) |
0.615 (1.00) |
| 17p loss | 21 (11%) | 166 |
6.43e-06 (0.00106) |
0.0967 (1.00) |
0.0996 (1.00) |
0.0171 (1.00) |
0.641 (1.00) |
0.425 (1.00) |
| 18p loss | 18 (10%) | 169 |
2.52e-05 (0.00413) |
0.213 (1.00) |
0.363 (1.00) |
0.257 (1.00) |
0.0858 (1.00) |
0.0187 (1.00) |
| 18q loss | 24 (13%) | 163 |
1.1e-08 (1.83e-06) |
0.165 (1.00) |
0.0886 (1.00) |
0.219 (1.00) |
0.087 (1.00) |
0.0668 (1.00) |
| 1p gain | 3 (2%) | 184 |
0.0678 (1.00) |
0.0489 (1.00) |
||||
| 1q gain | 5 (3%) | 182 |
0.139 (1.00) |
0.275 (1.00) |
0.551 (1.00) |
0.3 (1.00) |
0.53 (1.00) |
0.822 (1.00) |
| 3p gain | 5 (3%) | 182 |
0.254 (1.00) |
0.519 (1.00) |
0.0637 (1.00) |
0.362 (1.00) |
0.15 (1.00) |
0.29 (1.00) |
| 3q gain | 6 (3%) | 181 |
0.138 (1.00) |
0.664 (1.00) |
0.0198 (1.00) |
0.00561 (0.864) |
0.262 (1.00) |
0.0588 (1.00) |
| 7q gain | 14 (7%) | 173 |
0.00226 (0.355) |
0.101 (1.00) |
0.182 (1.00) |
0.227 (1.00) |
0.663 (1.00) |
0.376 (1.00) |
| 8p gain | 8 (4%) | 179 |
0.0103 (1.00) |
0.347 (1.00) |
0.396 (1.00) |
0.0935 (1.00) |
0.907 (1.00) |
0.875 (1.00) |
| 9p gain | 3 (2%) | 184 |
0.0678 (1.00) |
0.483 (1.00) |
0.644 (1.00) |
0.625 (1.00) |
0.458 (1.00) |
0.393 (1.00) |
| 9q gain | 6 (3%) | 181 |
0.0762 (1.00) |
0.326 (1.00) |
0.132 (1.00) |
0.229 (1.00) |
0.651 (1.00) |
0.845 (1.00) |
| 10q gain | 4 (2%) | 183 |
0.278 (1.00) |
0.566 (1.00) |
0.211 (1.00) |
0.3 (1.00) |
0.53 (1.00) |
1 (1.00) |
| 12q gain | 3 (2%) | 184 |
0.201 (1.00) |
0.269 (1.00) |
||||
| 16p gain | 3 (2%) | 184 |
0.598 (1.00) |
0.783 (1.00) |
0.776 (1.00) |
0.261 (1.00) |
0.458 (1.00) |
0.774 (1.00) |
| 16q gain | 3 (2%) | 184 |
0.598 (1.00) |
0.783 (1.00) |
0.776 (1.00) |
0.261 (1.00) |
0.458 (1.00) |
0.774 (1.00) |
| 5q loss | 5 (3%) | 182 |
0.0138 (1.00) |
0.0647 (1.00) |
0.0637 (1.00) |
0.362 (1.00) |
0.114 (1.00) |
1 (1.00) |
| 6q loss | 7 (4%) | 180 |
0.0157 (1.00) |
0.116 (1.00) |
0.0714 (1.00) |
0.0935 (1.00) |
0.365 (1.00) |
0.125 (1.00) |
| 8q loss | 4 (2%) | 183 |
0.278 (1.00) |
0.389 (1.00) |
0.329 (1.00) |
0.388 (1.00) |
0.295 (1.00) |
0.395 (1.00) |
| 10p loss | 5 (3%) | 182 |
0.439 (1.00) |
0.396 (1.00) |
0.551 (1.00) |
0.3 (1.00) |
0.262 (1.00) |
0.0277 (1.00) |
| 10q loss | 5 (3%) | 182 |
0.439 (1.00) |
0.735 (1.00) |
0.625 (1.00) |
0.866 (1.00) |
0.57 (1.00) |
1 (1.00) |
| 12p loss | 10 (5%) | 177 |
0.198 (1.00) |
0.0197 (1.00) |
0.139 (1.00) |
0.0123 (1.00) |
0.0539 (1.00) |
0.246 (1.00) |
| 20p loss | 5 (3%) | 182 |
0.363 (1.00) |
0.0647 (1.00) |
0.211 (1.00) |
0.133 (1.00) |
0.00575 (0.879) |
0.0161 (1.00) |
| 21q loss | 4 (2%) | 183 |
0.278 (1.00) |
0.566 (1.00) |
0.329 (1.00) |
0.0963 (1.00) |
0.266 (1.00) |
1 (1.00) |
| 22q loss | 5 (3%) | 182 |
0.0646 (1.00) |
0.396 (1.00) |
0.377 (1.00) |
0.452 (1.00) |
0.419 (1.00) |
0.601 (1.00) |
P value = 0.000281 (Fisher's exact test), Q value = 0.045
Table S1. Gene #5: '7p gain mutation analysis' versus Clinical Feature #1: 'CN_CNMF'
| nPatients | CLUS_1 | CLUS_2 | CLUS_3 | CLUS_4 |
|---|---|---|---|---|
| ALL | 34 | 92 | 59 | 2 |
| 7P GAIN MUTATED | 1 | 2 | 13 | 0 |
| 7P GAIN WILD-TYPE | 33 | 90 | 46 | 2 |
Figure S1. Get High-res Image Gene #5: '7p gain mutation analysis' versus Clinical Feature #1: 'CN_CNMF'

P value = 5.57e-05 (Fisher's exact test), Q value = 0.009
Table S2. Gene #8: '8q gain mutation analysis' versus Clinical Feature #1: 'CN_CNMF'
| nPatients | CLUS_1 | CLUS_2 | CLUS_3 | CLUS_4 |
|---|---|---|---|---|
| ALL | 34 | 92 | 59 | 2 |
| 8Q GAIN MUTATED | 2 | 2 | 15 | 0 |
| 8Q GAIN WILD-TYPE | 32 | 90 | 44 | 2 |
Figure S2. Get High-res Image Gene #8: '8q gain mutation analysis' versus Clinical Feature #1: 'CN_CNMF'

P value = 0.000129 (Fisher's exact test), Q value = 0.021
Table S3. Gene #17: '8p loss mutation analysis' versus Clinical Feature #2: 'METHLYATION_CNMF'
| nPatients | CLUS_1 | CLUS_2 | CLUS_3 |
|---|---|---|---|
| ALL | 55 | 77 | 55 |
| 8P LOSS MUTATED | 11 | 31 | 5 |
| 8P LOSS WILD-TYPE | 44 | 46 | 50 |
Figure S3. Get High-res Image Gene #17: '8p loss mutation analysis' versus Clinical Feature #2: 'METHLYATION_CNMF'

P value = 0.000492 (Fisher's exact test), Q value = 0.078
Table S4. Gene #17: '8p loss mutation analysis' versus Clinical Feature #5: 'MIRSEQ_CNMF'
| nPatients | CLUS_1 | CLUS_2 | CLUS_3 | CLUS_4 |
|---|---|---|---|---|
| ALL | 45 | 46 | 25 | 60 |
| 8P LOSS MUTATED | 22 | 5 | 6 | 13 |
| 8P LOSS WILD-TYPE | 23 | 41 | 19 | 47 |
Figure S4. Get High-res Image Gene #17: '8p loss mutation analysis' versus Clinical Feature #5: 'MIRSEQ_CNMF'

P value = 0.00145 (Fisher's exact test), Q value = 0.23
Table S5. Gene #22: '13q loss mutation analysis' versus Clinical Feature #1: 'CN_CNMF'
| nPatients | CLUS_1 | CLUS_2 | CLUS_3 | CLUS_4 |
|---|---|---|---|---|
| ALL | 34 | 92 | 59 | 2 |
| 13Q LOSS MUTATED | 1 | 1 | 10 | 0 |
| 13Q LOSS WILD-TYPE | 33 | 91 | 49 | 2 |
Figure S5. Get High-res Image Gene #22: '13q loss mutation analysis' versus Clinical Feature #1: 'CN_CNMF'

P value = 3.66e-05 (Fisher's exact test), Q value = 0.006
Table S6. Gene #23: '16q loss mutation analysis' versus Clinical Feature #1: 'CN_CNMF'
| nPatients | CLUS_1 | CLUS_2 | CLUS_3 | CLUS_4 |
|---|---|---|---|---|
| ALL | 34 | 92 | 59 | 2 |
| 16Q LOSS MUTATED | 2 | 4 | 18 | 0 |
| 16Q LOSS WILD-TYPE | 32 | 88 | 41 | 2 |
Figure S6. Get High-res Image Gene #23: '16q loss mutation analysis' versus Clinical Feature #1: 'CN_CNMF'
P value = 6.43e-06 (Fisher's exact test), Q value = 0.0011
Table S7. Gene #24: '17p loss mutation analysis' versus Clinical Feature #1: 'CN_CNMF'
| nPatients | CLUS_1 | CLUS_2 | CLUS_3 | CLUS_4 |
|---|---|---|---|---|
| ALL | 34 | 92 | 59 | 2 |
| 17P LOSS MUTATED | 0 | 4 | 17 | 0 |
| 17P LOSS WILD-TYPE | 34 | 88 | 42 | 2 |
Figure S7. Get High-res Image Gene #24: '17p loss mutation analysis' versus Clinical Feature #1: 'CN_CNMF'

P value = 2.52e-05 (Fisher's exact test), Q value = 0.0041
Table S8. Gene #25: '18p loss mutation analysis' versus Clinical Feature #1: 'CN_CNMF'
| nPatients | CLUS_1 | CLUS_2 | CLUS_3 | CLUS_4 |
|---|---|---|---|---|
| ALL | 34 | 92 | 59 | 2 |
| 18P LOSS MUTATED | 1 | 2 | 15 | 0 |
| 18P LOSS WILD-TYPE | 33 | 90 | 44 | 2 |
Figure S8. Get High-res Image Gene #25: '18p loss mutation analysis' versus Clinical Feature #1: 'CN_CNMF'

P value = 1.1e-08 (Fisher's exact test), Q value = 1.8e-06
Table S9. Gene #26: '18q loss mutation analysis' versus Clinical Feature #1: 'CN_CNMF'
| nPatients | CLUS_1 | CLUS_2 | CLUS_3 | CLUS_4 |
|---|---|---|---|---|
| ALL | 34 | 92 | 59 | 2 |
| 18Q LOSS MUTATED | 0 | 3 | 21 | 0 |
| 18Q LOSS WILD-TYPE | 34 | 89 | 38 | 2 |
Figure S9. Get High-res Image Gene #26: '18q loss mutation analysis' versus Clinical Feature #1: 'CN_CNMF'

-
Mutation data file = broad_values_by_arm.mutsig.cluster.txt
-
Molecular subtypes file = PRAD-TP.transferedmergedcluster.txt
-
Number of patients = 187
-
Number of significantly arm-level cnvs = 29
-
Number of molecular subtypes = 6
-
Exclude genes that fewer than K tumors have mutations, K = 3
For binary or multi-class clinical features (nominal or ordinal), two-tailed Fisher's exact tests (Fisher 1922) were used to estimate the P values using the 'fisher.test' function in R
For multiple hypothesis correction, Q value is the False Discovery Rate (FDR) analogue of the P value (Benjamini and Hochberg 1995), defined as the minimum FDR at which the test may be called significant. We used the 'Benjamini and Hochberg' method of 'p.adjust' function in R to convert P values into Q values.
This is an experimental feature. The full results of the analysis summarized in this report can be downloaded from the TCGA Data Coordination Center.