(metastatic tumor cohort)
This pipeline computes the correlation between significant arm-level copy number variations (cnvs) and subtypes.
Testing the association between copy number variation 78 arm-level results and 8 molecular subtypes across 244 patients, 32 significant findings detected with Q value < 0.25.
-
1q gain cnv correlated to 'CN_CNMF'.
-
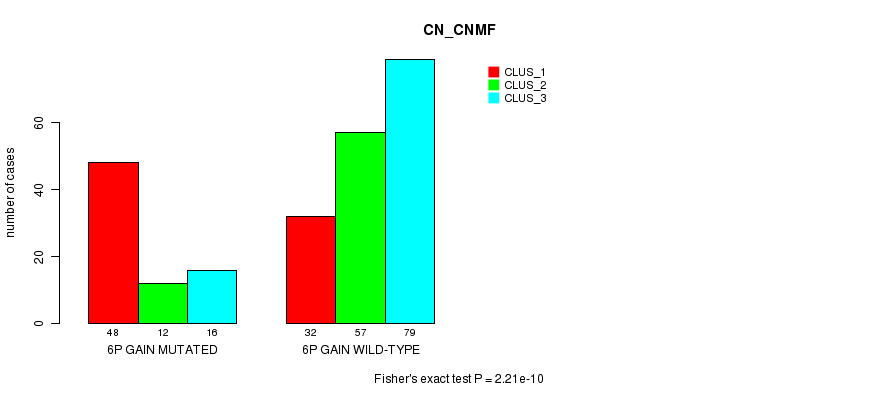
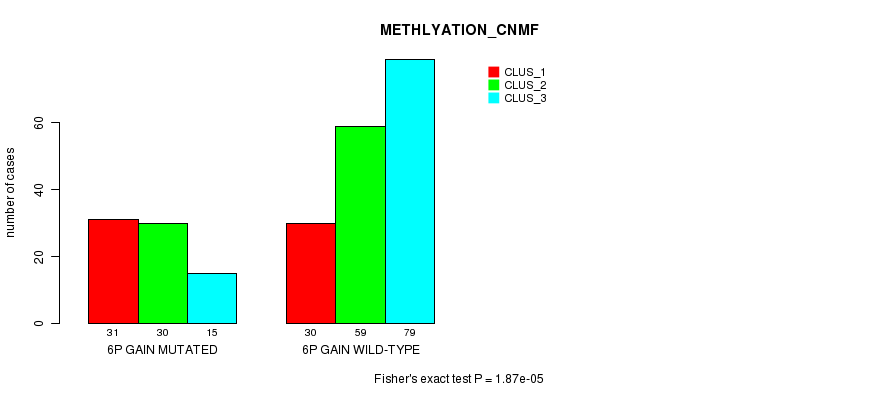
6p gain cnv correlated to 'CN_CNMF' and 'METHLYATION_CNMF'.
-
7p gain cnv correlated to 'CN_CNMF'.
-
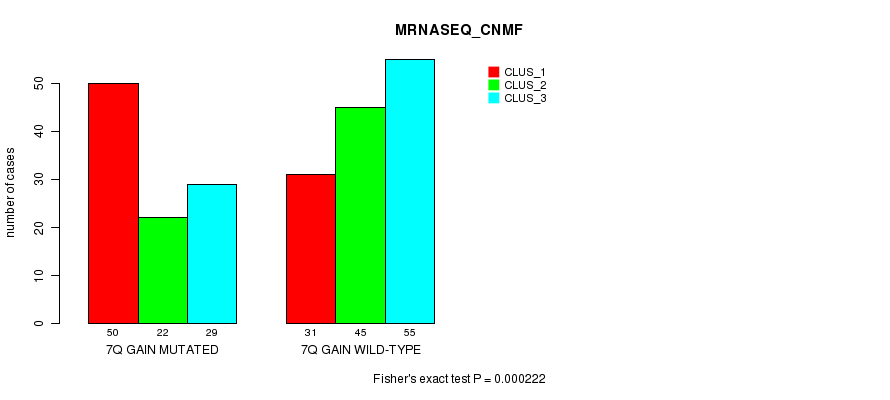
7q gain cnv correlated to 'CN_CNMF' and 'MRNASEQ_CNMF'.
-
8p gain cnv correlated to 'CN_CNMF'.
-
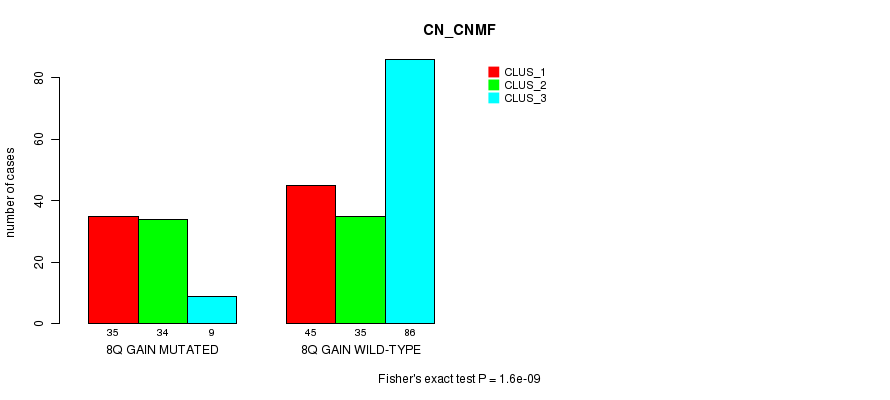
8q gain cnv correlated to 'CN_CNMF', 'METHLYATION_CNMF', and 'MRNASEQ_CNMF'.
-
11q gain cnv correlated to 'CN_CNMF'.
-
12p gain cnv correlated to 'CN_CNMF'.
-
13q gain cnv correlated to 'CN_CNMF' and 'METHLYATION_CNMF'.
-
15q gain cnv correlated to 'CN_CNMF'.
-
20p gain cnv correlated to 'CN_CNMF' and 'MRNASEQ_CNMF'.
-
20q gain cnv correlated to 'CN_CNMF'.
-
21q gain cnv correlated to 'METHLYATION_CNMF'.
-
6q loss cnv correlated to 'CN_CNMF'.
-
9p loss cnv correlated to 'CN_CNMF' and 'METHLYATION_CNMF'.
-
10p loss cnv correlated to 'CN_CNMF', 'METHLYATION_CNMF', and 'MRNASEQ_CNMF'.
-
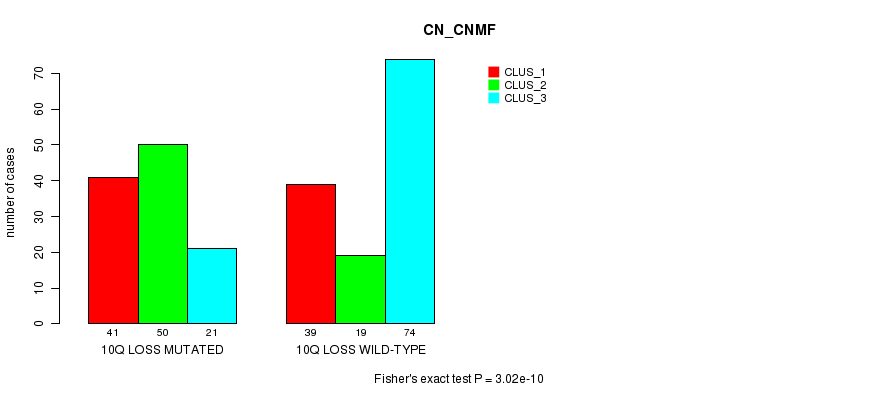
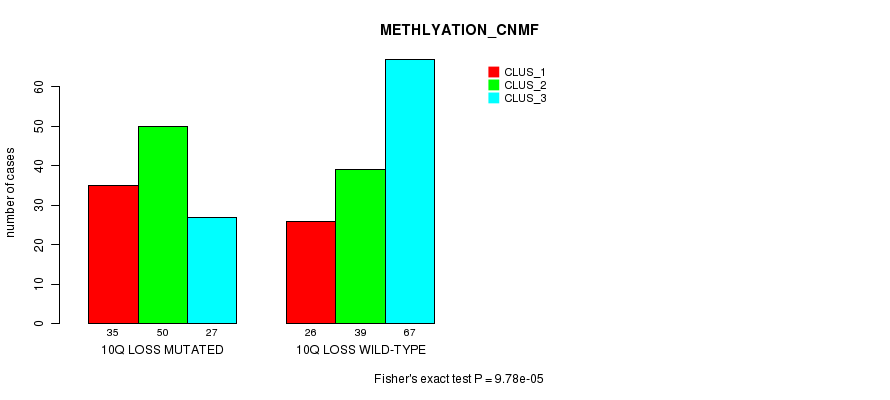
10q loss cnv correlated to 'CN_CNMF', 'METHLYATION_CNMF', and 'MRNASEQ_CNMF'.
-
11q loss cnv correlated to 'CN_CNMF'.
-
14q loss cnv correlated to 'CN_CNMF'.
-
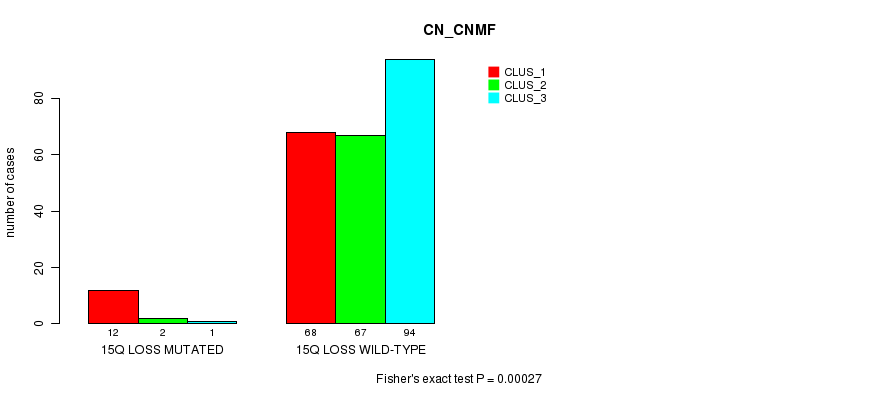
15q loss cnv correlated to 'CN_CNMF'.
-
18p loss cnv correlated to 'MRNASEQ_CNMF'.
Table 1. Get Full Table Overview of the association between significant copy number variation of 78 arm-level results and 8 molecular subtypes. Shown in the table are P values (Q values). Thresholded by Q value < 0.25, 32 significant findings detected.
|
Molecular subtypes |
CN CNMF |
METHLYATION CNMF |
RPPA CNMF |
RPPA CHIERARCHICAL |
MRNASEQ CNMF |
MRNASEQ CHIERARCHICAL |
MIRSEQ CNMF |
MIRSEQ CHIERARCHICAL |
||
| nCNV (%) | nWild-Type | Fisher's exact test | Fisher's exact test | Fisher's exact test | Chi-square test | Fisher's exact test | Fisher's exact test | Fisher's exact test | Fisher's exact test | |
| 8q gain | 78 (32%) | 166 |
1.6e-09 (9.87e-07) |
2.01e-05 (0.0121) |
0.603 (1.00) |
0.924 (1.00) |
0.000335 (0.199) |
0.0075 (1.00) |
0.558 (1.00) |
0.581 (1.00) |
| 10p loss | 103 (42%) | 141 |
2.19e-07 (0.000134) |
5.53e-05 (0.0333) |
0.44 (1.00) |
0.158 (1.00) |
1.13e-06 (0.000686) |
0.000864 (0.5) |
0.576 (1.00) |
0.163 (1.00) |
| 10q loss | 112 (46%) | 132 |
3.02e-10 (1.87e-07) |
9.78e-05 (0.0587) |
0.539 (1.00) |
0.192 (1.00) |
1.11e-06 (0.000675) |
0.000661 (0.387) |
0.985 (1.00) |
0.376 (1.00) |
| 6p gain | 76 (31%) | 168 |
2.21e-10 (1.37e-07) |
1.87e-05 (0.0113) |
0.0894 (1.00) |
0.589 (1.00) |
0.267 (1.00) |
0.0458 (1.00) |
0.0101 (1.00) |
0.00081 (0.471) |
| 7q gain | 104 (43%) | 140 |
6.52e-12 (4.05e-09) |
0.236 (1.00) |
0.13 (1.00) |
0.167 (1.00) |
0.000222 (0.133) |
0.0449 (1.00) |
0.306 (1.00) |
0.108 (1.00) |
| 13q gain | 39 (16%) | 205 |
7e-06 (0.00424) |
2.3e-05 (0.0138) |
0.399 (1.00) |
0.174 (1.00) |
0.00828 (1.00) |
0.0141 (1.00) |
0.502 (1.00) |
0.308 (1.00) |
| 20p gain | 70 (29%) | 174 |
6.08e-06 (0.00369) |
0.00195 (1.00) |
0.345 (1.00) |
0.904 (1.00) |
0.000149 (0.0891) |
0.00887 (1.00) |
0.0795 (1.00) |
0.269 (1.00) |
| 9p loss | 134 (55%) | 110 |
3.31e-08 (2.03e-05) |
1.93e-05 (0.0117) |
0.188 (1.00) |
0.131 (1.00) |
0.00292 (1.00) |
0.00297 (1.00) |
1 (1.00) |
0.407 (1.00) |
| 1q gain | 77 (32%) | 167 |
7.15e-09 (4.4e-06) |
0.00845 (1.00) |
0.366 (1.00) |
0.172 (1.00) |
0.0799 (1.00) |
0.385 (1.00) |
0.2 (1.00) |
0.0717 (1.00) |
| 7p gain | 101 (41%) | 143 |
3.05e-10 (1.89e-07) |
0.109 (1.00) |
0.195 (1.00) |
0.298 (1.00) |
0.000485 (0.285) |
0.0592 (1.00) |
0.831 (1.00) |
0.461 (1.00) |
| 8p gain | 49 (20%) | 195 |
1.16e-09 (7.16e-07) |
0.0118 (1.00) |
0.0562 (1.00) |
0.364 (1.00) |
0.00846 (1.00) |
0.0308 (1.00) |
0.707 (1.00) |
0.425 (1.00) |
| 11q gain | 15 (6%) | 229 |
0.000314 (0.186) |
0.413 (1.00) |
0.307 (1.00) |
0.72 (1.00) |
0.0146 (1.00) |
0.0364 (1.00) |
0.368 (1.00) |
0.154 (1.00) |
| 12p gain | 23 (9%) | 221 |
4.41e-07 (0.000269) |
0.147 (1.00) |
0.883 (1.00) |
0.928 (1.00) |
0.00172 (0.991) |
0.209 (1.00) |
0.306 (1.00) |
0.457 (1.00) |
| 15q gain | 35 (14%) | 209 |
2e-06 (0.00122) |
0.42 (1.00) |
0.567 (1.00) |
0.912 (1.00) |
0.504 (1.00) |
0.492 (1.00) |
1 (1.00) |
0.123 (1.00) |
| 20q gain | 89 (36%) | 155 |
1.66e-08 (1.02e-05) |
0.00199 (1.00) |
0.448 (1.00) |
0.802 (1.00) |
0.000771 (0.449) |
0.0585 (1.00) |
0.351 (1.00) |
0.512 (1.00) |
| 21q gain | 29 (12%) | 215 |
0.0384 (1.00) |
0.000261 (0.155) |
0.182 (1.00) |
0.402 (1.00) |
0.106 (1.00) |
0.0553 (1.00) |
0.538 (1.00) |
1 (1.00) |
| 6q loss | 90 (37%) | 154 |
0.000111 (0.0664) |
0.000705 (0.411) |
0.354 (1.00) |
0.454 (1.00) |
0.00416 (1.00) |
0.016 (1.00) |
0.535 (1.00) |
0.257 (1.00) |
| 11q loss | 64 (26%) | 180 |
0.000382 (0.226) |
0.0246 (1.00) |
0.916 (1.00) |
0.764 (1.00) |
0.0502 (1.00) |
0.00136 (0.784) |
0.609 (1.00) |
0.468 (1.00) |
| 14q loss | 54 (22%) | 190 |
6.92e-08 (4.24e-05) |
0.0508 (1.00) |
0.411 (1.00) |
0.276 (1.00) |
0.0043 (1.00) |
0.134 (1.00) |
1 (1.00) |
0.432 (1.00) |
| 15q loss | 15 (6%) | 229 |
0.00027 (0.161) |
0.0849 (1.00) |
0.651 (1.00) |
0.138 (1.00) |
0.634 (1.00) |
0.611 (1.00) |
0.267 (1.00) |
0.149 (1.00) |
| 18p loss | 48 (20%) | 196 |
0.00385 (1.00) |
0.00436 (1.00) |
0.372 (1.00) |
0.415 (1.00) |
0.000288 (0.171) |
0.0291 (1.00) |
0.932 (1.00) |
0.885 (1.00) |
| 1p gain | 28 (11%) | 216 |
0.00929 (1.00) |
0.265 (1.00) |
0.148 (1.00) |
0.517 (1.00) |
0.0811 (1.00) |
0.656 (1.00) |
0.965 (1.00) |
0.249 (1.00) |
| 2p gain | 30 (12%) | 214 |
0.00321 (1.00) |
0.307 (1.00) |
0.0696 (1.00) |
0.391 (1.00) |
0.0165 (1.00) |
0.0303 (1.00) |
0.173 (1.00) |
0.0171 (1.00) |
| 2q gain | 28 (11%) | 216 |
0.00246 (1.00) |
0.475 (1.00) |
0.0198 (1.00) |
0.384 (1.00) |
0.00492 (1.00) |
0.00564 (1.00) |
0.0227 (1.00) |
0.00574 (1.00) |
| 3p gain | 23 (9%) | 221 |
0.058 (1.00) |
0.0677 (1.00) |
1 (1.00) |
0.771 (1.00) |
0.242 (1.00) |
0.0815 (1.00) |
0.475 (1.00) |
0.325 (1.00) |
| 3q gain | 30 (12%) | 214 |
0.158 (1.00) |
0.164 (1.00) |
0.565 (1.00) |
0.594 (1.00) |
0.18 (1.00) |
0.232 (1.00) |
0.903 (1.00) |
0.482 (1.00) |
| 4p gain | 24 (10%) | 220 |
0.00178 (1.00) |
0.0523 (1.00) |
0.979 (1.00) |
0.469 (1.00) |
0.816 (1.00) |
0.769 (1.00) |
0.778 (1.00) |
0.848 (1.00) |
| 4q gain | 20 (8%) | 224 |
0.00101 (0.587) |
0.0357 (1.00) |
0.923 (1.00) |
0.945 (1.00) |
0.427 (1.00) |
0.538 (1.00) |
0.328 (1.00) |
0.881 (1.00) |
| 5p gain | 28 (11%) | 216 |
0.00966 (1.00) |
0.265 (1.00) |
0.758 (1.00) |
0.819 (1.00) |
0.906 (1.00) |
0.806 (1.00) |
0.135 (1.00) |
0.748 (1.00) |
| 5q gain | 14 (6%) | 230 |
0.0213 (1.00) |
0.389 (1.00) |
0.629 (1.00) |
0.404 (1.00) |
0.399 (1.00) |
0.634 (1.00) |
0.189 (1.00) |
0.319 (1.00) |
| 6q gain | 18 (7%) | 226 |
0.25 (1.00) |
0.0564 (1.00) |
1 (1.00) |
0.498 (1.00) |
0.661 (1.00) |
0.367 (1.00) |
0.762 (1.00) |
0.557 (1.00) |
| 9p gain | 9 (4%) | 235 |
0.761 (1.00) |
0.144 (1.00) |
0.12 (1.00) |
0.435 (1.00) |
0.395 (1.00) |
0.894 (1.00) |
0.555 (1.00) |
0.512 (1.00) |
| 9q gain | 10 (4%) | 234 |
0.0983 (1.00) |
0.468 (1.00) |
0.236 (1.00) |
0.6 (1.00) |
0.394 (1.00) |
0.823 (1.00) |
0.555 (1.00) |
0.512 (1.00) |
| 11p gain | 17 (7%) | 227 |
0.00986 (1.00) |
0.901 (1.00) |
0.147 (1.00) |
0.474 (1.00) |
0.0231 (1.00) |
0.0477 (1.00) |
0.371 (1.00) |
0.0963 (1.00) |
| 12q gain | 11 (5%) | 233 |
0.000691 (0.404) |
0.629 (1.00) |
0.847 (1.00) |
0.807 (1.00) |
0.0597 (1.00) |
0.0971 (1.00) |
0.564 (1.00) |
0.124 (1.00) |
| 14q gain | 16 (7%) | 228 |
0.0348 (1.00) |
0.0614 (1.00) |
0.0431 (1.00) |
0.257 (1.00) |
1 (1.00) |
0.748 (1.00) |
0.798 (1.00) |
0.676 (1.00) |
| 16p gain | 16 (7%) | 228 |
0.000554 (0.325) |
0.00913 (1.00) |
0.452 (1.00) |
0.724 (1.00) |
0.0132 (1.00) |
0.28 (1.00) |
0.592 (1.00) |
0.623 (1.00) |
| 16q gain | 15 (6%) | 229 |
0.0154 (1.00) |
0.0462 (1.00) |
0.192 (1.00) |
0.527 (1.00) |
0.0222 (1.00) |
0.364 (1.00) |
0.478 (1.00) |
0.342 (1.00) |
| 17p gain | 16 (7%) | 228 |
0.0636 (1.00) |
0.207 (1.00) |
0.719 (1.00) |
0.79 (1.00) |
0.464 (1.00) |
0.388 (1.00) |
0.213 (1.00) |
0.398 (1.00) |
| 17q gain | 28 (11%) | 216 |
0.0214 (1.00) |
0.0441 (1.00) |
0.702 (1.00) |
0.293 (1.00) |
0.298 (1.00) |
0.208 (1.00) |
0.108 (1.00) |
0.784 (1.00) |
| 18p gain | 27 (11%) | 217 |
0.0511 (1.00) |
0.161 (1.00) |
0.91 (1.00) |
0.801 (1.00) |
0.0676 (1.00) |
0.181 (1.00) |
0.0935 (1.00) |
0.211 (1.00) |
| 18q gain | 16 (7%) | 228 |
0.0348 (1.00) |
0.219 (1.00) |
0.536 (1.00) |
0.308 (1.00) |
0.276 (1.00) |
0.0795 (1.00) |
0.94 (1.00) |
0.787 (1.00) |
| 19p gain | 16 (7%) | 228 |
0.00812 (1.00) |
0.028 (1.00) |
0.623 (1.00) |
0.204 (1.00) |
0.00502 (1.00) |
0.0272 (1.00) |
0.165 (1.00) |
0.93 (1.00) |
| 19q gain | 20 (8%) | 224 |
0.00761 (1.00) |
0.0396 (1.00) |
0.415 (1.00) |
0.678 (1.00) |
0.000683 (0.4) |
0.0704 (1.00) |
0.651 (1.00) |
0.735 (1.00) |
| 22q gain | 59 (24%) | 185 |
0.00209 (1.00) |
0.197 (1.00) |
0.803 (1.00) |
0.933 (1.00) |
0.324 (1.00) |
0.811 (1.00) |
0.601 (1.00) |
0.469 (1.00) |
| Xq gain | 4 (2%) | 240 |
0.829 (1.00) |
0.835 (1.00) |
1 (1.00) |
0.507 (1.00) |
0.207 (1.00) |
0.0897 (1.00) |
0.535 (1.00) |
0.577 (1.00) |
| 1p loss | 15 (6%) | 229 |
0.0605 (1.00) |
0.0256 (1.00) |
0.383 (1.00) |
0.416 (1.00) |
0.0142 (1.00) |
0.101 (1.00) |
0.833 (1.00) |
0.787 (1.00) |
| 1q loss | 7 (3%) | 237 |
0.0637 (1.00) |
0.345 (1.00) |
0.545 (1.00) |
0.563 (1.00) |
0.182 (1.00) |
0.602 (1.00) |
0.612 (1.00) |
1 (1.00) |
| 2p loss | 18 (7%) | 226 |
0.00883 (1.00) |
0.106 (1.00) |
0.306 (1.00) |
0.0384 (1.00) |
0.695 (1.00) |
0.0771 (1.00) |
0.000482 (0.284) |
0.00592 (1.00) |
| 2q loss | 19 (8%) | 225 |
0.0225 (1.00) |
0.0171 (1.00) |
0.208 (1.00) |
0.15 (1.00) |
0.341 (1.00) |
0.0784 (1.00) |
0.000852 (0.494) |
0.028 (1.00) |
| 3p loss | 22 (9%) | 222 |
0.0585 (1.00) |
0.0761 (1.00) |
0.382 (1.00) |
0.364 (1.00) |
0.00405 (1.00) |
0.031 (1.00) |
0.877 (1.00) |
0.27 (1.00) |
| 3q loss | 19 (8%) | 225 |
0.0735 (1.00) |
0.0606 (1.00) |
0.421 (1.00) |
0.209 (1.00) |
0.105 (1.00) |
0.252 (1.00) |
0.863 (1.00) |
0.214 (1.00) |
| 4p loss | 30 (12%) | 214 |
0.322 (1.00) |
0.193 (1.00) |
0.342 (1.00) |
0.132 (1.00) |
0.00799 (1.00) |
0.00886 (1.00) |
0.793 (1.00) |
0.179 (1.00) |
| 4q loss | 31 (13%) | 213 |
0.142 (1.00) |
0.0664 (1.00) |
0.308 (1.00) |
0.0206 (1.00) |
0.00974 (1.00) |
0.00281 (1.00) |
0.391 (1.00) |
0.0453 (1.00) |
| 5p loss | 32 (13%) | 212 |
0.701 (1.00) |
0.262 (1.00) |
0.272 (1.00) |
0.333 (1.00) |
0.331 (1.00) |
0.142 (1.00) |
0.0624 (1.00) |
0.26 (1.00) |
| 5q loss | 46 (19%) | 198 |
0.515 (1.00) |
0.0436 (1.00) |
0.0689 (1.00) |
0.553 (1.00) |
0.273 (1.00) |
0.251 (1.00) |
0.637 (1.00) |
0.663 (1.00) |
| 6p loss | 28 (11%) | 216 |
0.00857 (1.00) |
0.215 (1.00) |
0.467 (1.00) |
0.347 (1.00) |
0.355 (1.00) |
0.232 (1.00) |
0.332 (1.00) |
0.213 (1.00) |
| 7p loss | 7 (3%) | 237 |
0.799 (1.00) |
0.0348 (1.00) |
0.664 (1.00) |
0.471 (1.00) |
0.795 (1.00) |
1 (1.00) |
0.419 (1.00) |
1 (1.00) |
| 7q loss | 6 (2%) | 238 |
0.676 (1.00) |
0.0911 (1.00) |
0.779 (1.00) |
0.703 (1.00) |
1 (1.00) |
0.878 (1.00) |
1 (1.00) |
0.839 (1.00) |
| 8p loss | 28 (11%) | 216 |
0.0679 (1.00) |
0.111 (1.00) |
0.057 (1.00) |
0.486 (1.00) |
0.0525 (1.00) |
0.201 (1.00) |
0.0804 (1.00) |
0.124 (1.00) |
| 8q loss | 5 (2%) | 239 |
1 (1.00) |
0.0705 (1.00) |
0.139 (1.00) |
0.515 (1.00) |
0.326 (1.00) |
0.0384 (1.00) |
0.844 (1.00) |
0.798 (1.00) |
| 9q loss | 100 (41%) | 144 |
0.00566 (1.00) |
0.000441 (0.26) |
0.448 (1.00) |
0.364 (1.00) |
0.238 (1.00) |
0.895 (1.00) |
0.496 (1.00) |
0.636 (1.00) |
| 11p loss | 57 (23%) | 187 |
0.00219 (1.00) |
0.0018 (1.00) |
0.484 (1.00) |
0.27 (1.00) |
0.0551 (1.00) |
0.00634 (1.00) |
0.12 (1.00) |
0.665 (1.00) |
| 12p loss | 15 (6%) | 229 |
0.167 (1.00) |
0.00881 (1.00) |
0.5 (1.00) |
0.814 (1.00) |
0.259 (1.00) |
0.298 (1.00) |
0.88 (1.00) |
0.704 (1.00) |
| 12q loss | 24 (10%) | 220 |
0.00538 (1.00) |
0.00239 (1.00) |
0.839 (1.00) |
0.875 (1.00) |
0.329 (1.00) |
0.241 (1.00) |
0.778 (1.00) |
0.848 (1.00) |
| 13q loss | 36 (15%) | 208 |
0.322 (1.00) |
0.454 (1.00) |
0.172 (1.00) |
0.656 (1.00) |
0.662 (1.00) |
0.971 (1.00) |
0.0827 (1.00) |
0.224 (1.00) |
| 16p loss | 22 (9%) | 222 |
0.0216 (1.00) |
0.00567 (1.00) |
0.956 (1.00) |
0.204 (1.00) |
0.199 (1.00) |
0.269 (1.00) |
0.042 (1.00) |
0.51 (1.00) |
| 16q loss | 46 (19%) | 198 |
0.00583 (1.00) |
0.0292 (1.00) |
0.571 (1.00) |
0.373 (1.00) |
0.0545 (1.00) |
0.286 (1.00) |
0.0407 (1.00) |
0.0961 (1.00) |
| 17p loss | 50 (20%) | 194 |
0.619 (1.00) |
0.175 (1.00) |
0.493 (1.00) |
0.688 (1.00) |
0.0673 (1.00) |
0.955 (1.00) |
0.646 (1.00) |
0.388 (1.00) |
| 17q loss | 22 (9%) | 222 |
0.0805 (1.00) |
0.514 (1.00) |
0.387 (1.00) |
0.47 (1.00) |
0.123 (1.00) |
0.357 (1.00) |
0.493 (1.00) |
1 (1.00) |
| 18q loss | 44 (18%) | 200 |
0.0128 (1.00) |
0.0182 (1.00) |
0.0502 (1.00) |
0.188 (1.00) |
0.0518 (1.00) |
0.221 (1.00) |
0.863 (1.00) |
0.616 (1.00) |
| 19p loss | 19 (8%) | 225 |
0.21 (1.00) |
0.54 (1.00) |
0.00578 (1.00) |
0.536 (1.00) |
0.142 (1.00) |
0.367 (1.00) |
0.472 (1.00) |
0.936 (1.00) |
| 19q loss | 19 (8%) | 225 |
0.22 (1.00) |
0.366 (1.00) |
0.654 (1.00) |
0.347 (1.00) |
0.395 (1.00) |
0.95 (1.00) |
0.707 (1.00) |
0.936 (1.00) |
| 20p loss | 12 (5%) | 232 |
0.528 (1.00) |
0.422 (1.00) |
0.153 (1.00) |
0.744 (1.00) |
0.755 (1.00) |
0.222 (1.00) |
0.184 (1.00) |
0.552 (1.00) |
| 20q loss | 3 (1%) | 241 |
0.503 (1.00) |
0.187 (1.00) |
0.508 (1.00) |
0.213 (1.00) |
1 (1.00) |
1 (1.00) |
||
| 21q loss | 28 (11%) | 216 |
0.261 (1.00) |
0.265 (1.00) |
0.823 (1.00) |
0.634 (1.00) |
0.436 (1.00) |
0.451 (1.00) |
0.809 (1.00) |
0.305 (1.00) |
| 22q loss | 19 (8%) | 225 |
0.498 (1.00) |
0.205 (1.00) |
0.591 (1.00) |
0.428 (1.00) |
0.644 (1.00) |
0.428 (1.00) |
0.208 (1.00) |
0.806 (1.00) |
| Xq loss | 10 (4%) | 234 |
0.277 (1.00) |
0.00329 (1.00) |
0.283 (1.00) |
0.188 (1.00) |
0.396 (1.00) |
0.0819 (1.00) |
0.404 (1.00) |
0.631 (1.00) |
P value = 7.15e-09 (Fisher's exact test), Q value = 4.4e-06
Table S1. Gene #2: '1q gain mutation analysis' versus Clinical Feature #1: 'CN_CNMF'
| nPatients | CLUS_1 | CLUS_2 | CLUS_3 |
|---|---|---|---|
| ALL | 80 | 69 | 95 |
| 1Q GAIN MUTATED | 46 | 16 | 15 |
| 1Q GAIN WILD-TYPE | 34 | 53 | 80 |
Figure S1. Get High-res Image Gene #2: '1q gain mutation analysis' versus Clinical Feature #1: 'CN_CNMF'

P value = 2.21e-10 (Fisher's exact test), Q value = 1.4e-07
Table S2. Gene #11: '6p gain mutation analysis' versus Clinical Feature #1: 'CN_CNMF'
| nPatients | CLUS_1 | CLUS_2 | CLUS_3 |
|---|---|---|---|
| ALL | 80 | 69 | 95 |
| 6P GAIN MUTATED | 48 | 12 | 16 |
| 6P GAIN WILD-TYPE | 32 | 57 | 79 |
Figure S2. Get High-res Image Gene #11: '6p gain mutation analysis' versus Clinical Feature #1: 'CN_CNMF'
P value = 1.87e-05 (Fisher's exact test), Q value = 0.011
Table S3. Gene #11: '6p gain mutation analysis' versus Clinical Feature #2: 'METHLYATION_CNMF'
| nPatients | CLUS_1 | CLUS_2 | CLUS_3 |
|---|---|---|---|
| ALL | 61 | 89 | 94 |
| 6P GAIN MUTATED | 31 | 30 | 15 |
| 6P GAIN WILD-TYPE | 30 | 59 | 79 |
Figure S3. Get High-res Image Gene #11: '6p gain mutation analysis' versus Clinical Feature #2: 'METHLYATION_CNMF'
P value = 3.05e-10 (Fisher's exact test), Q value = 1.9e-07
Table S4. Gene #13: '7p gain mutation analysis' versus Clinical Feature #1: 'CN_CNMF'
| nPatients | CLUS_1 | CLUS_2 | CLUS_3 |
|---|---|---|---|
| ALL | 80 | 69 | 95 |
| 7P GAIN MUTATED | 35 | 48 | 18 |
| 7P GAIN WILD-TYPE | 45 | 21 | 77 |
Figure S4. Get High-res Image Gene #13: '7p gain mutation analysis' versus Clinical Feature #1: 'CN_CNMF'

P value = 6.52e-12 (Fisher's exact test), Q value = 4.1e-09
Table S5. Gene #14: '7q gain mutation analysis' versus Clinical Feature #1: 'CN_CNMF'
| nPatients | CLUS_1 | CLUS_2 | CLUS_3 |
|---|---|---|---|
| ALL | 80 | 69 | 95 |
| 7Q GAIN MUTATED | 30 | 53 | 21 |
| 7Q GAIN WILD-TYPE | 50 | 16 | 74 |
Figure S5. Get High-res Image Gene #14: '7q gain mutation analysis' versus Clinical Feature #1: 'CN_CNMF'

P value = 0.000222 (Fisher's exact test), Q value = 0.13
Table S6. Gene #14: '7q gain mutation analysis' versus Clinical Feature #5: 'MRNASEQ_CNMF'
| nPatients | CLUS_1 | CLUS_2 | CLUS_3 |
|---|---|---|---|
| ALL | 81 | 67 | 84 |
| 7Q GAIN MUTATED | 50 | 22 | 29 |
| 7Q GAIN WILD-TYPE | 31 | 45 | 55 |
Figure S6. Get High-res Image Gene #14: '7q gain mutation analysis' versus Clinical Feature #5: 'MRNASEQ_CNMF'
P value = 1.16e-09 (Fisher's exact test), Q value = 7.2e-07
Table S7. Gene #15: '8p gain mutation analysis' versus Clinical Feature #1: 'CN_CNMF'
| nPatients | CLUS_1 | CLUS_2 | CLUS_3 |
|---|---|---|---|
| ALL | 80 | 69 | 95 |
| 8P GAIN MUTATED | 17 | 29 | 3 |
| 8P GAIN WILD-TYPE | 63 | 40 | 92 |
Figure S7. Get High-res Image Gene #15: '8p gain mutation analysis' versus Clinical Feature #1: 'CN_CNMF'

P value = 1.6e-09 (Fisher's exact test), Q value = 9.9e-07
Table S8. Gene #16: '8q gain mutation analysis' versus Clinical Feature #1: 'CN_CNMF'
| nPatients | CLUS_1 | CLUS_2 | CLUS_3 |
|---|---|---|---|
| ALL | 80 | 69 | 95 |
| 8Q GAIN MUTATED | 35 | 34 | 9 |
| 8Q GAIN WILD-TYPE | 45 | 35 | 86 |
Figure S8. Get High-res Image Gene #16: '8q gain mutation analysis' versus Clinical Feature #1: 'CN_CNMF'
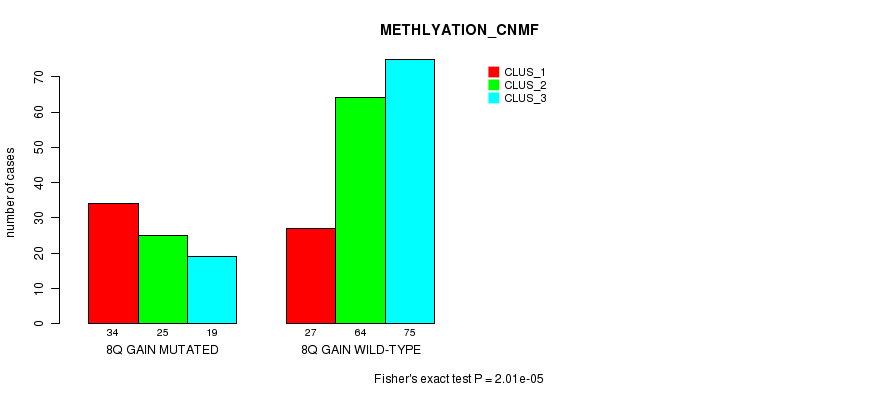
P value = 2.01e-05 (Fisher's exact test), Q value = 0.012
Table S9. Gene #16: '8q gain mutation analysis' versus Clinical Feature #2: 'METHLYATION_CNMF'
| nPatients | CLUS_1 | CLUS_2 | CLUS_3 |
|---|---|---|---|
| ALL | 61 | 89 | 94 |
| 8Q GAIN MUTATED | 34 | 25 | 19 |
| 8Q GAIN WILD-TYPE | 27 | 64 | 75 |
Figure S9. Get High-res Image Gene #16: '8q gain mutation analysis' versus Clinical Feature #2: 'METHLYATION_CNMF'
P value = 0.000335 (Fisher's exact test), Q value = 0.2
Table S10. Gene #16: '8q gain mutation analysis' versus Clinical Feature #5: 'MRNASEQ_CNMF'
| nPatients | CLUS_1 | CLUS_2 | CLUS_3 |
|---|---|---|---|
| ALL | 81 | 67 | 84 |
| 8Q GAIN MUTATED | 36 | 10 | 30 |
| 8Q GAIN WILD-TYPE | 45 | 57 | 54 |
Figure S10. Get High-res Image Gene #16: '8q gain mutation analysis' versus Clinical Feature #5: 'MRNASEQ_CNMF'

P value = 0.000314 (Fisher's exact test), Q value = 0.19
Table S11. Gene #20: '11q gain mutation analysis' versus Clinical Feature #1: 'CN_CNMF'
| nPatients | CLUS_1 | CLUS_2 | CLUS_3 |
|---|---|---|---|
| ALL | 80 | 69 | 95 |
| 11Q GAIN MUTATED | 3 | 11 | 1 |
| 11Q GAIN WILD-TYPE | 77 | 58 | 94 |
Figure S11. Get High-res Image Gene #20: '11q gain mutation analysis' versus Clinical Feature #1: 'CN_CNMF'

P value = 4.41e-07 (Fisher's exact test), Q value = 0.00027
Table S12. Gene #21: '12p gain mutation analysis' versus Clinical Feature #1: 'CN_CNMF'
| nPatients | CLUS_1 | CLUS_2 | CLUS_3 |
|---|---|---|---|
| ALL | 80 | 69 | 95 |
| 12P GAIN MUTATED | 7 | 16 | 0 |
| 12P GAIN WILD-TYPE | 73 | 53 | 95 |
Figure S12. Get High-res Image Gene #21: '12p gain mutation analysis' versus Clinical Feature #1: 'CN_CNMF'

P value = 7e-06 (Fisher's exact test), Q value = 0.0042
Table S13. Gene #23: '13q gain mutation analysis' versus Clinical Feature #1: 'CN_CNMF'
| nPatients | CLUS_1 | CLUS_2 | CLUS_3 |
|---|---|---|---|
| ALL | 80 | 69 | 95 |
| 13Q GAIN MUTATED | 22 | 14 | 3 |
| 13Q GAIN WILD-TYPE | 58 | 55 | 92 |
Figure S13. Get High-res Image Gene #23: '13q gain mutation analysis' versus Clinical Feature #1: 'CN_CNMF'

P value = 2.3e-05 (Fisher's exact test), Q value = 0.014
Table S14. Gene #23: '13q gain mutation analysis' versus Clinical Feature #2: 'METHLYATION_CNMF'
| nPatients | CLUS_1 | CLUS_2 | CLUS_3 |
|---|---|---|---|
| ALL | 61 | 89 | 94 |
| 13Q GAIN MUTATED | 19 | 16 | 4 |
| 13Q GAIN WILD-TYPE | 42 | 73 | 90 |
Figure S14. Get High-res Image Gene #23: '13q gain mutation analysis' versus Clinical Feature #2: 'METHLYATION_CNMF'

P value = 2e-06 (Fisher's exact test), Q value = 0.0012
Table S15. Gene #25: '15q gain mutation analysis' versus Clinical Feature #1: 'CN_CNMF'
| nPatients | CLUS_1 | CLUS_2 | CLUS_3 |
|---|---|---|---|
| ALL | 80 | 69 | 95 |
| 15Q GAIN MUTATED | 7 | 23 | 5 |
| 15Q GAIN WILD-TYPE | 73 | 46 | 90 |
Figure S15. Get High-res Image Gene #25: '15q gain mutation analysis' versus Clinical Feature #1: 'CN_CNMF'

P value = 6.08e-06 (Fisher's exact test), Q value = 0.0037
Table S16. Gene #34: '20p gain mutation analysis' versus Clinical Feature #1: 'CN_CNMF'
| nPatients | CLUS_1 | CLUS_2 | CLUS_3 |
|---|---|---|---|
| ALL | 80 | 69 | 95 |
| 20P GAIN MUTATED | 26 | 32 | 12 |
| 20P GAIN WILD-TYPE | 54 | 37 | 83 |
Figure S16. Get High-res Image Gene #34: '20p gain mutation analysis' versus Clinical Feature #1: 'CN_CNMF'

P value = 0.000149 (Fisher's exact test), Q value = 0.089
Table S17. Gene #34: '20p gain mutation analysis' versus Clinical Feature #5: 'MRNASEQ_CNMF'
| nPatients | CLUS_1 | CLUS_2 | CLUS_3 |
|---|---|---|---|
| ALL | 81 | 67 | 84 |
| 20P GAIN MUTATED | 37 | 10 | 21 |
| 20P GAIN WILD-TYPE | 44 | 57 | 63 |
Figure S17. Get High-res Image Gene #34: '20p gain mutation analysis' versus Clinical Feature #5: 'MRNASEQ_CNMF'

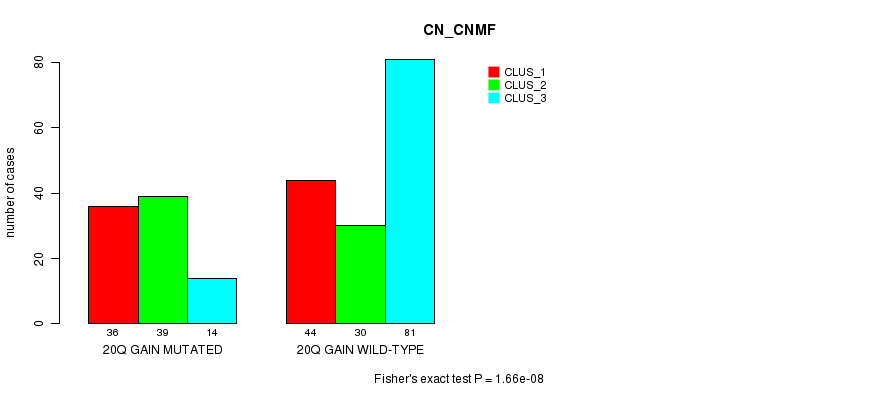
P value = 1.66e-08 (Fisher's exact test), Q value = 1e-05
Table S18. Gene #35: '20q gain mutation analysis' versus Clinical Feature #1: 'CN_CNMF'
| nPatients | CLUS_1 | CLUS_2 | CLUS_3 |
|---|---|---|---|
| ALL | 80 | 69 | 95 |
| 20Q GAIN MUTATED | 36 | 39 | 14 |
| 20Q GAIN WILD-TYPE | 44 | 30 | 81 |
Figure S18. Get High-res Image Gene #35: '20q gain mutation analysis' versus Clinical Feature #1: 'CN_CNMF'
P value = 0.000261 (Fisher's exact test), Q value = 0.16
Table S19. Gene #36: '21q gain mutation analysis' versus Clinical Feature #2: 'METHLYATION_CNMF'
| nPatients | CLUS_1 | CLUS_2 | CLUS_3 |
|---|---|---|---|
| ALL | 61 | 89 | 94 |
| 21Q GAIN MUTATED | 15 | 11 | 3 |
| 21Q GAIN WILD-TYPE | 46 | 78 | 91 |
Figure S19. Get High-res Image Gene #36: '21q gain mutation analysis' versus Clinical Feature #2: 'METHLYATION_CNMF'

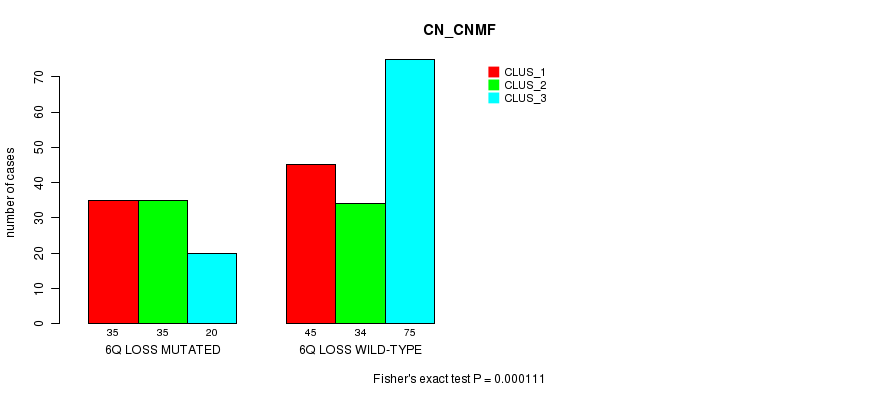
P value = 0.000111 (Fisher's exact test), Q value = 0.066
Table S20. Gene #50: '6q loss mutation analysis' versus Clinical Feature #1: 'CN_CNMF'
| nPatients | CLUS_1 | CLUS_2 | CLUS_3 |
|---|---|---|---|
| ALL | 80 | 69 | 95 |
| 6Q LOSS MUTATED | 35 | 35 | 20 |
| 6Q LOSS WILD-TYPE | 45 | 34 | 75 |
Figure S20. Get High-res Image Gene #50: '6q loss mutation analysis' versus Clinical Feature #1: 'CN_CNMF'
P value = 3.31e-08 (Fisher's exact test), Q value = 2e-05
Table S21. Gene #55: '9p loss mutation analysis' versus Clinical Feature #1: 'CN_CNMF'
| nPatients | CLUS_1 | CLUS_2 | CLUS_3 |
|---|---|---|---|
| ALL | 80 | 69 | 95 |
| 9P LOSS MUTATED | 56 | 48 | 30 |
| 9P LOSS WILD-TYPE | 24 | 21 | 65 |
Figure S21. Get High-res Image Gene #55: '9p loss mutation analysis' versus Clinical Feature #1: 'CN_CNMF'

P value = 1.93e-05 (Fisher's exact test), Q value = 0.012
Table S22. Gene #55: '9p loss mutation analysis' versus Clinical Feature #2: 'METHLYATION_CNMF'
| nPatients | CLUS_1 | CLUS_2 | CLUS_3 |
|---|---|---|---|
| ALL | 61 | 89 | 94 |
| 9P LOSS MUTATED | 40 | 60 | 34 |
| 9P LOSS WILD-TYPE | 21 | 29 | 60 |
Figure S22. Get High-res Image Gene #55: '9p loss mutation analysis' versus Clinical Feature #2: 'METHLYATION_CNMF'

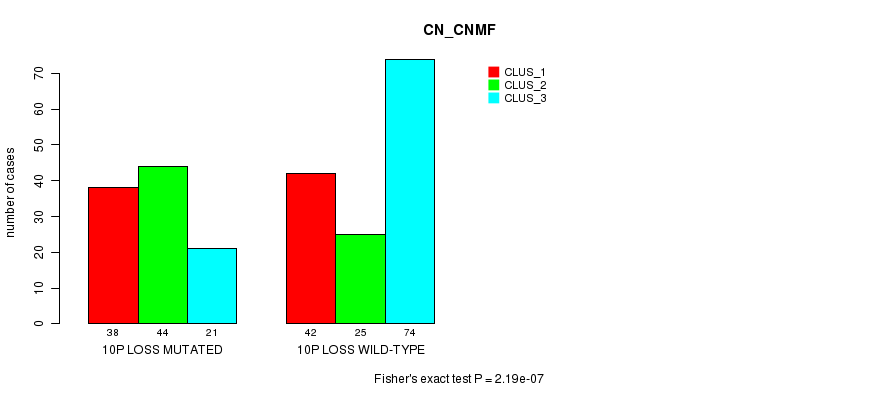
P value = 2.19e-07 (Fisher's exact test), Q value = 0.00013
Table S23. Gene #57: '10p loss mutation analysis' versus Clinical Feature #1: 'CN_CNMF'
| nPatients | CLUS_1 | CLUS_2 | CLUS_3 |
|---|---|---|---|
| ALL | 80 | 69 | 95 |
| 10P LOSS MUTATED | 38 | 44 | 21 |
| 10P LOSS WILD-TYPE | 42 | 25 | 74 |
Figure S23. Get High-res Image Gene #57: '10p loss mutation analysis' versus Clinical Feature #1: 'CN_CNMF'
P value = 5.53e-05 (Fisher's exact test), Q value = 0.033
Table S24. Gene #57: '10p loss mutation analysis' versus Clinical Feature #2: 'METHLYATION_CNMF'
| nPatients | CLUS_1 | CLUS_2 | CLUS_3 |
|---|---|---|---|
| ALL | 61 | 89 | 94 |
| 10P LOSS MUTATED | 36 | 43 | 24 |
| 10P LOSS WILD-TYPE | 25 | 46 | 70 |
Figure S24. Get High-res Image Gene #57: '10p loss mutation analysis' versus Clinical Feature #2: 'METHLYATION_CNMF'

P value = 1.13e-06 (Fisher's exact test), Q value = 0.00069
Table S25. Gene #57: '10p loss mutation analysis' versus Clinical Feature #5: 'MRNASEQ_CNMF'
| nPatients | CLUS_1 | CLUS_2 | CLUS_3 |
|---|---|---|---|
| ALL | 81 | 67 | 84 |
| 10P LOSS MUTATED | 51 | 14 | 35 |
| 10P LOSS WILD-TYPE | 30 | 53 | 49 |
Figure S25. Get High-res Image Gene #57: '10p loss mutation analysis' versus Clinical Feature #5: 'MRNASEQ_CNMF'

P value = 3.02e-10 (Fisher's exact test), Q value = 1.9e-07
Table S26. Gene #58: '10q loss mutation analysis' versus Clinical Feature #1: 'CN_CNMF'
| nPatients | CLUS_1 | CLUS_2 | CLUS_3 |
|---|---|---|---|
| ALL | 80 | 69 | 95 |
| 10Q LOSS MUTATED | 41 | 50 | 21 |
| 10Q LOSS WILD-TYPE | 39 | 19 | 74 |
Figure S26. Get High-res Image Gene #58: '10q loss mutation analysis' versus Clinical Feature #1: 'CN_CNMF'
P value = 9.78e-05 (Fisher's exact test), Q value = 0.059
Table S27. Gene #58: '10q loss mutation analysis' versus Clinical Feature #2: 'METHLYATION_CNMF'
| nPatients | CLUS_1 | CLUS_2 | CLUS_3 |
|---|---|---|---|
| ALL | 61 | 89 | 94 |
| 10Q LOSS MUTATED | 35 | 50 | 27 |
| 10Q LOSS WILD-TYPE | 26 | 39 | 67 |
Figure S27. Get High-res Image Gene #58: '10q loss mutation analysis' versus Clinical Feature #2: 'METHLYATION_CNMF'
P value = 1.11e-06 (Fisher's exact test), Q value = 0.00067
Table S28. Gene #58: '10q loss mutation analysis' versus Clinical Feature #5: 'MRNASEQ_CNMF'
| nPatients | CLUS_1 | CLUS_2 | CLUS_3 |
|---|---|---|---|
| ALL | 81 | 67 | 84 |
| 10Q LOSS MUTATED | 55 | 17 | 38 |
| 10Q LOSS WILD-TYPE | 26 | 50 | 46 |
Figure S28. Get High-res Image Gene #58: '10q loss mutation analysis' versus Clinical Feature #5: 'MRNASEQ_CNMF'

P value = 0.000382 (Fisher's exact test), Q value = 0.23
Table S29. Gene #60: '11q loss mutation analysis' versus Clinical Feature #1: 'CN_CNMF'
| nPatients | CLUS_1 | CLUS_2 | CLUS_3 |
|---|---|---|---|
| ALL | 80 | 69 | 95 |
| 11Q LOSS MUTATED | 33 | 17 | 14 |
| 11Q LOSS WILD-TYPE | 47 | 52 | 81 |
Figure S29. Get High-res Image Gene #60: '11q loss mutation analysis' versus Clinical Feature #1: 'CN_CNMF'

P value = 6.92e-08 (Fisher's exact test), Q value = 4.2e-05
Table S30. Gene #64: '14q loss mutation analysis' versus Clinical Feature #1: 'CN_CNMF'
| nPatients | CLUS_1 | CLUS_2 | CLUS_3 |
|---|---|---|---|
| ALL | 80 | 69 | 95 |
| 14Q LOSS MUTATED | 18 | 30 | 6 |
| 14Q LOSS WILD-TYPE | 62 | 39 | 89 |
Figure S30. Get High-res Image Gene #64: '14q loss mutation analysis' versus Clinical Feature #1: 'CN_CNMF'

P value = 0.00027 (Fisher's exact test), Q value = 0.16
Table S31. Gene #65: '15q loss mutation analysis' versus Clinical Feature #1: 'CN_CNMF'
| nPatients | CLUS_1 | CLUS_2 | CLUS_3 |
|---|---|---|---|
| ALL | 80 | 69 | 95 |
| 15Q LOSS MUTATED | 12 | 2 | 1 |
| 15Q LOSS WILD-TYPE | 68 | 67 | 94 |
Figure S31. Get High-res Image Gene #65: '15q loss mutation analysis' versus Clinical Feature #1: 'CN_CNMF'
P value = 0.000288 (Fisher's exact test), Q value = 0.17
Table S32. Gene #70: '18p loss mutation analysis' versus Clinical Feature #5: 'MRNASEQ_CNMF'
| nPatients | CLUS_1 | CLUS_2 | CLUS_3 |
|---|---|---|---|
| ALL | 81 | 67 | 84 |
| 18P LOSS MUTATED | 28 | 6 | 13 |
| 18P LOSS WILD-TYPE | 53 | 61 | 71 |
Figure S32. Get High-res Image Gene #70: '18p loss mutation analysis' versus Clinical Feature #5: 'MRNASEQ_CNMF'

-
Mutation data file = broad_values_by_arm.mutsig.cluster.txt
-
Molecular subtypes file = SKCM-TM.transferedmergedcluster.txt
-
Number of patients = 244
-
Number of significantly arm-level cnvs = 78
-
Number of molecular subtypes = 8
-
Exclude genes that fewer than K tumors have mutations, K = 3
For binary or multi-class clinical features (nominal or ordinal), two-tailed Fisher's exact tests (Fisher 1922) were used to estimate the P values using the 'fisher.test' function in R
For multi-class clinical features (nominal or ordinal), Chi-square tests (Greenwood and Nikulin 1996) were used to estimate the P values using the 'chisq.test' function in R
For multiple hypothesis correction, Q value is the False Discovery Rate (FDR) analogue of the P value (Benjamini and Hochberg 1995), defined as the minimum FDR at which the test may be called significant. We used the 'Benjamini and Hochberg' method of 'p.adjust' function in R to convert P values into Q values.
This is an experimental feature. The full results of the analysis summarized in this report can be downloaded from the TCGA Data Coordination Center.