This pipeline computes the correlation between significantly recurrent gene mutations and molecular subtypes.
Testing the association between mutation status of 25 genes and 8 molecular subtypes across 220 patients, 26 significant findings detected with P value < 0.05 and Q value < 0.25.
-
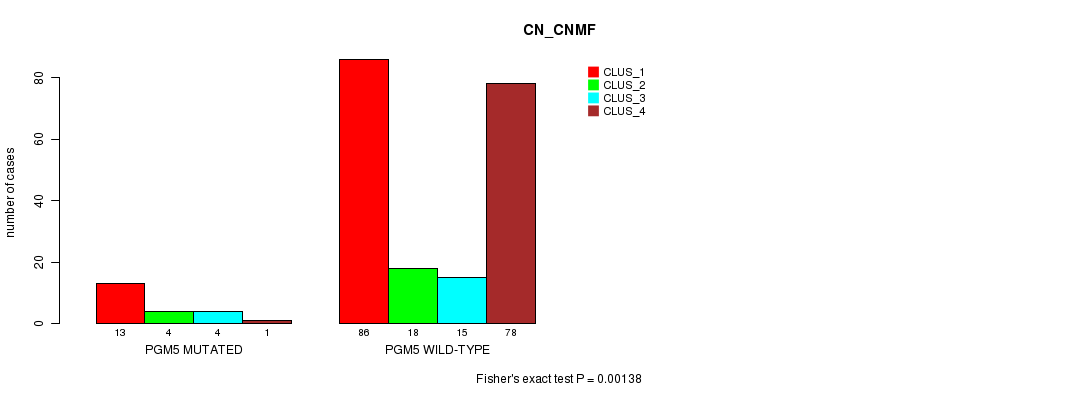
PGM5 mutation correlated to 'CN_CNMF' and 'METHLYATION_CNMF'.
-
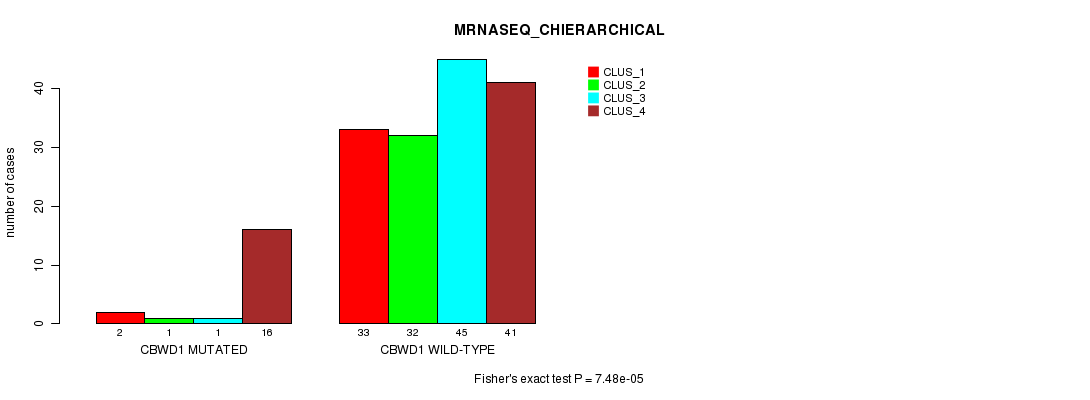
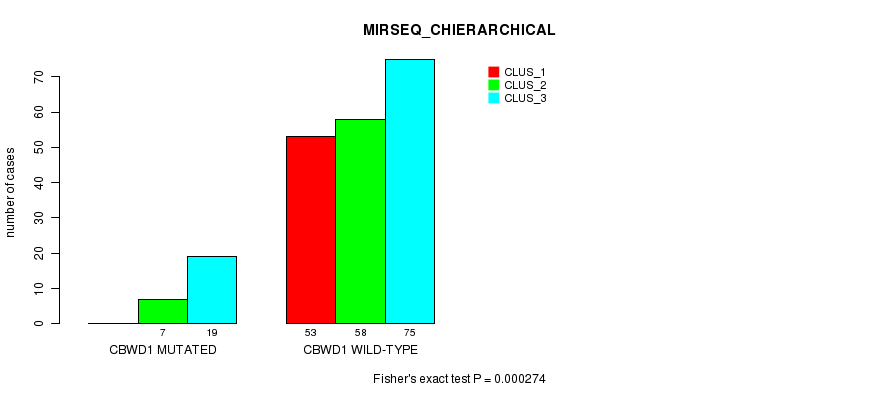
CBWD1 mutation correlated to 'CN_CNMF', 'METHLYATION_CNMF', 'MRNASEQ_CNMF', 'MRNASEQ_CHIERARCHICAL', 'MIRSEQ_CNMF', and 'MIRSEQ_CHIERARCHICAL'.
-
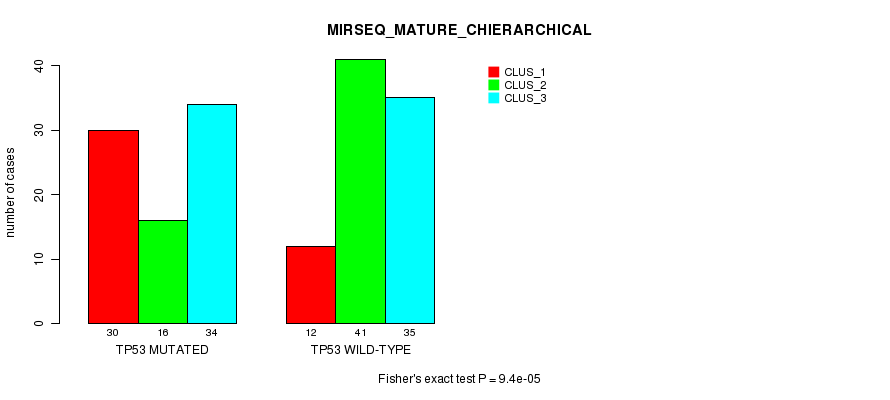
TP53 mutation correlated to 'CN_CNMF', 'METHLYATION_CNMF', 'MRNASEQ_CNMF', 'MIRSEQ_CNMF', 'MIRSEQ_CHIERARCHICAL', and 'MIRSEQ_MATURE_CHIERARCHICAL'.
-
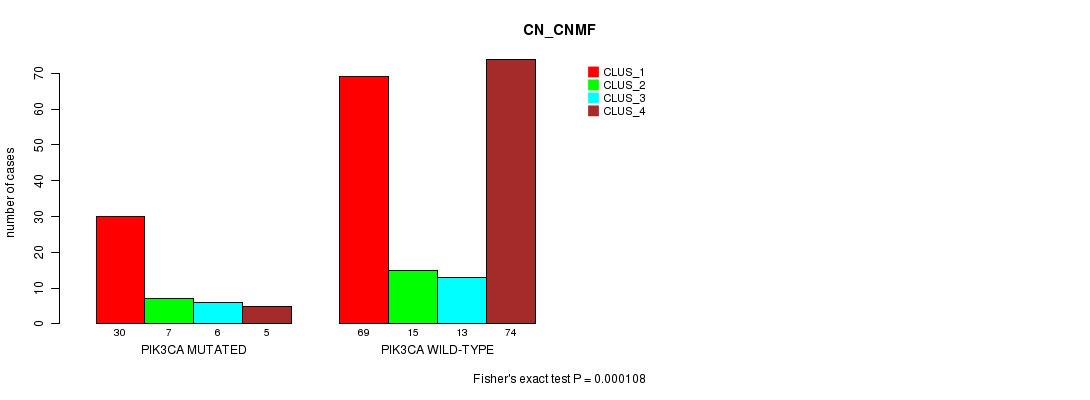
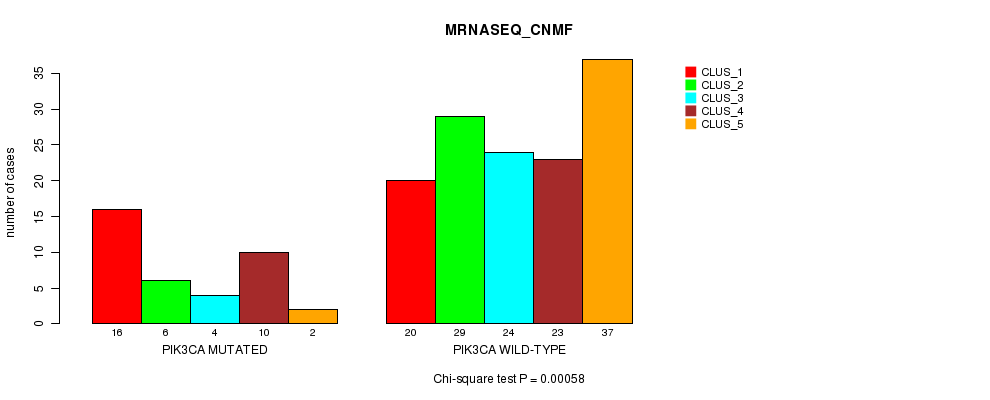
PIK3CA mutation correlated to 'CN_CNMF', 'METHLYATION_CNMF', 'MRNASEQ_CNMF', 'MRNASEQ_CHIERARCHICAL', and 'MIRSEQ_MATURE_CNMF'.
-
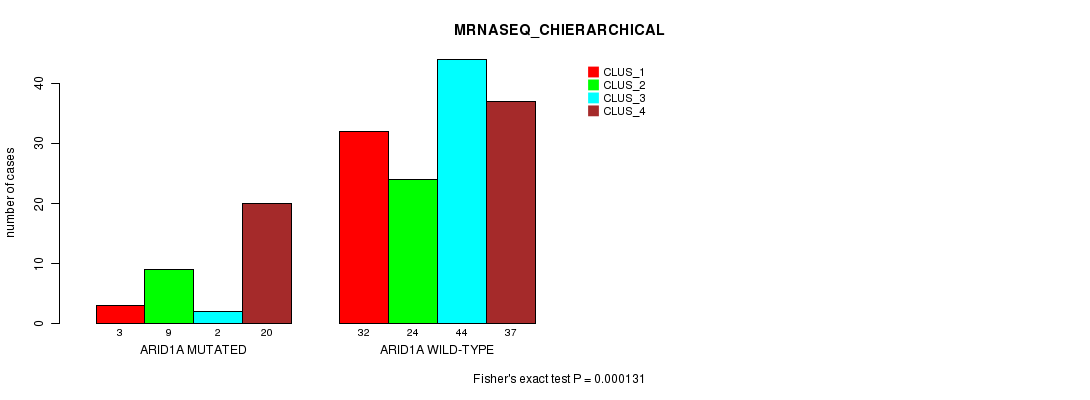
ARID1A mutation correlated to 'CN_CNMF', 'MRNASEQ_CNMF', and 'MRNASEQ_CHIERARCHICAL'.
-
RHOA mutation correlated to 'MIRSEQ_MATURE_CNMF'.
-
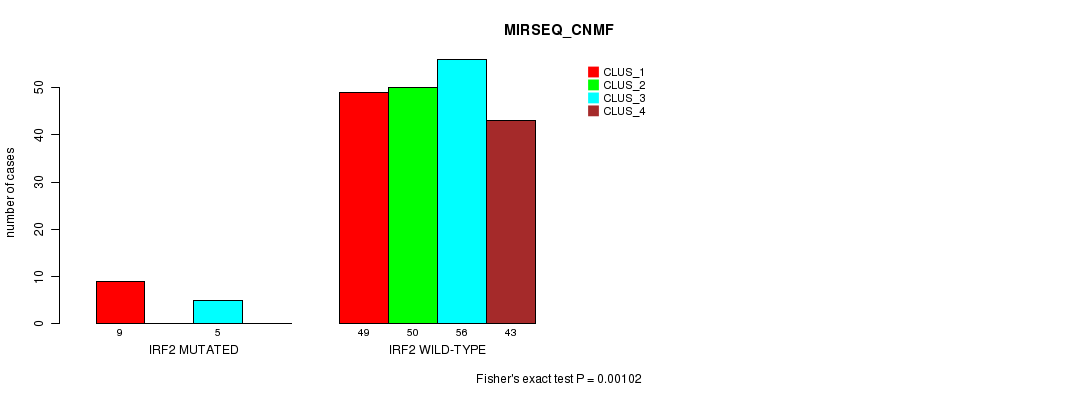
IRF2 mutation correlated to 'MIRSEQ_CNMF'.
-
APC mutation correlated to 'MIRSEQ_CNMF'.
-
BCOR mutation correlated to 'METHLYATION_CNMF'.
Table 1. Get Full Table Overview of the association between mutation status of 25 genes and 8 molecular subtypes. Shown in the table are P values (Q values). Thresholded by P value < 0.05 and Q value < 0.25, 26 significant findings detected.
|
Clinical Features |
CN CNMF |
METHLYATION CNMF |
MRNASEQ CNMF |
MRNASEQ CHIERARCHICAL |
MIRSEQ CNMF |
MIRSEQ CHIERARCHICAL |
MIRSEQ MATURE CNMF |
MIRSEQ MATURE CHIERARCHICAL |
||
| nMutated (%) | nWild-Type | Fisher's exact test | Fisher's exact test | Chi-square test | Fisher's exact test | Fisher's exact test | Fisher's exact test | Fisher's exact test | Fisher's exact test | |
| CBWD1 | 28 (13%) | 192 |
0.000149 (0.027) |
1.79e-06 (0.000348) |
0.000857 (0.15) |
7.48e-05 (0.0139) |
2.36e-05 (0.0045) |
0.000274 (0.049) |
0.078 (1.00) |
0.0267 (1.00) |
| TP53 | 99 (45%) | 121 |
4.33e-09 (8.49e-07) |
3.18e-05 (0.00605) |
7.74e-05 (0.0143) |
0.00381 (0.641) |
6.4e-06 (0.00124) |
9.12e-06 (0.00175) |
0.0704 (1.00) |
9.4e-05 (0.0173) |
| PIK3CA | 48 (22%) | 172 |
0.000108 (0.0198) |
1.83e-09 (3.6e-07) |
0.00058 (0.103) |
1.37e-07 (2.68e-05) |
0.0245 (1.00) |
0.0119 (1.00) |
0.000367 (0.0654) |
0.00471 (0.777) |
| ARID1A | 41 (19%) | 179 |
0.000215 (0.0387) |
0.00656 (1.00) |
3.52e-05 (0.00665) |
0.000131 (0.0238) |
0.0198 (1.00) |
0.0128 (1.00) |
0.761 (1.00) |
0.312 (1.00) |
| PGM5 | 22 (10%) | 198 |
0.00138 (0.237) |
4.28e-05 (0.00804) |
0.00635 (1.00) |
0.00164 (0.279) |
0.0126 (1.00) |
0.00398 (0.665) |
0.208 (1.00) |
0.168 (1.00) |
| RHOA | 13 (6%) | 207 |
0.142 (1.00) |
0.189 (1.00) |
0.829 (1.00) |
0.604 (1.00) |
0.106 (1.00) |
0.283 (1.00) |
0.000594 (0.105) |
0.297 (1.00) |
| IRF2 | 15 (7%) | 205 |
0.0906 (1.00) |
0.233 (1.00) |
0.434 (1.00) |
0.0297 (1.00) |
0.00102 (0.176) |
0.0125 (1.00) |
0.135 (1.00) |
0.249 (1.00) |
| APC | 33 (15%) | 187 |
0.97 (1.00) |
0.0207 (1.00) |
0.102 (1.00) |
0.0318 (1.00) |
0.000956 (0.166) |
0.0129 (1.00) |
0.0272 (1.00) |
0.0049 (0.803) |
| BCOR | 16 (7%) | 204 |
0.0156 (1.00) |
6.67e-05 (0.0125) |
0.0045 (0.747) |
0.0561 (1.00) |
0.00821 (1.00) |
0.00336 (0.567) |
0.183 (1.00) |
0.0259 (1.00) |
| TRIM48 | 14 (6%) | 206 |
0.252 (1.00) |
0.322 (1.00) |
0.41 (1.00) |
0.109 (1.00) |
0.126 (1.00) |
0.192 (1.00) |
0.0907 (1.00) |
1 (1.00) |
| KRAS | 25 (11%) | 195 |
0.00873 (1.00) |
0.127 (1.00) |
0.351 (1.00) |
0.128 (1.00) |
0.85 (1.00) |
0.96 (1.00) |
0.179 (1.00) |
0.674 (1.00) |
| SMAD4 | 19 (9%) | 201 |
0.648 (1.00) |
0.963 (1.00) |
0.0524 (1.00) |
0.226 (1.00) |
0.258 (1.00) |
0.16 (1.00) |
0.94 (1.00) |
0.462 (1.00) |
| MXRA8 | 11 (5%) | 209 |
0.118 (1.00) |
0.0232 (1.00) |
0.0909 (1.00) |
0.0394 (1.00) |
0.153 (1.00) |
0.00949 (1.00) |
0.428 (1.00) |
0.0635 (1.00) |
| CDH1 | 18 (8%) | 202 |
0.252 (1.00) |
0.458 (1.00) |
0.0314 (1.00) |
0.00564 (0.92) |
0.11 (1.00) |
0.0876 (1.00) |
0.278 (1.00) |
0.114 (1.00) |
| PTEN | 14 (6%) | 206 |
0.0057 (0.924) |
0.0152 (1.00) |
0.00155 (0.265) |
0.0452 (1.00) |
0.027 (1.00) |
0.0397 (1.00) |
0.1 (1.00) |
0.0575 (1.00) |
| B2M | 8 (4%) | 212 |
0.0258 (1.00) |
0.0232 (1.00) |
0.0329 (1.00) |
0.0968 (1.00) |
0.108 (1.00) |
0.287 (1.00) |
0.428 (1.00) |
0.0635 (1.00) |
| FBXW7 | 19 (9%) | 201 |
0.0833 (1.00) |
0.022 (1.00) |
0.0157 (1.00) |
0.292 (1.00) |
0.102 (1.00) |
0.0169 (1.00) |
0.0238 (1.00) |
0.0812 (1.00) |
| PTH2 | 4 (2%) | 216 |
1 (1.00) |
0.687 (1.00) |
0.281 (1.00) |
0.472 (1.00) |
0.672 (1.00) |
1 (1.00) |
1 (1.00) |
1 (1.00) |
| FAM46D | 6 (3%) | 214 |
1 (1.00) |
0.708 (1.00) |
0.222 (1.00) |
0.636 (1.00) |
0.56 (1.00) |
0.767 (1.00) |
1 (1.00) |
0.731 (1.00) |
| RNF43 | 9 (4%) | 211 |
0.175 (1.00) |
0.596 (1.00) |
0.202 (1.00) |
0.525 (1.00) |
0.338 (1.00) |
0.167 (1.00) |
0.521 (1.00) |
0.45 (1.00) |
| MAP2K7 | 14 (6%) | 206 |
0.00583 (0.938) |
0.0984 (1.00) |
0.41 (1.00) |
0.51 (1.00) |
0.133 (1.00) |
0.171 (1.00) |
0.33 (1.00) |
0.052 (1.00) |
| WSB2 | 7 (3%) | 213 |
0.341 (1.00) |
0.131 (1.00) |
0.215 (1.00) |
0.0394 (1.00) |
0.103 (1.00) |
0.0913 (1.00) |
0.0244 (1.00) |
0.00941 (1.00) |
| C13ORF33 | 6 (3%) | 214 |
0.364 (1.00) |
0.0165 (1.00) |
0.243 (1.00) |
0.407 (1.00) |
0.0768 (1.00) |
0.324 (1.00) |
0.274 (1.00) |
0.45 (1.00) |
| TRPS1 | 30 (14%) | 190 |
0.64 (1.00) |
0.0397 (1.00) |
0.0233 (1.00) |
0.24 (1.00) |
0.0327 (1.00) |
0.866 (1.00) |
0.378 (1.00) |
0.583 (1.00) |
| IAPP | 4 (2%) | 216 |
0.84 (1.00) |
0.763 (1.00) |
0.257 (1.00) |
0.449 (1.00) |
0.816 (1.00) |
P value = 0.00138 (Fisher's exact test), Q value = 0.24
Table S1. Gene #2: 'PGM5 MUTATION STATUS' versus Clinical Feature #1: 'CN_CNMF'
| nPatients | CLUS_1 | CLUS_2 | CLUS_3 | CLUS_4 |
|---|---|---|---|---|
| ALL | 99 | 22 | 19 | 79 |
| PGM5 MUTATED | 13 | 4 | 4 | 1 |
| PGM5 WILD-TYPE | 86 | 18 | 15 | 78 |
Figure S1. Get High-res Image Gene #2: 'PGM5 MUTATION STATUS' versus Clinical Feature #1: 'CN_CNMF'
P value = 4.28e-05 (Fisher's exact test), Q value = 0.008
Table S2. Gene #2: 'PGM5 MUTATION STATUS' versus Clinical Feature #2: 'METHLYATION_CNMF'
| nPatients | CLUS_1 | CLUS_2 | CLUS_3 | CLUS_4 |
|---|---|---|---|---|
| ALL | 27 | 51 | 44 | 53 |
| PGM5 MUTATED | 3 | 12 | 1 | 0 |
| PGM5 WILD-TYPE | 24 | 39 | 43 | 53 |
Figure S2. Get High-res Image Gene #2: 'PGM5 MUTATION STATUS' versus Clinical Feature #2: 'METHLYATION_CNMF'

P value = 0.000149 (Fisher's exact test), Q value = 0.027
Table S3. Gene #4: 'CBWD1 MUTATION STATUS' versus Clinical Feature #1: 'CN_CNMF'
| nPatients | CLUS_1 | CLUS_2 | CLUS_3 | CLUS_4 |
|---|---|---|---|---|
| ALL | 99 | 22 | 19 | 79 |
| CBWD1 MUTATED | 20 | 3 | 4 | 1 |
| CBWD1 WILD-TYPE | 79 | 19 | 15 | 78 |
Figure S3. Get High-res Image Gene #4: 'CBWD1 MUTATION STATUS' versus Clinical Feature #1: 'CN_CNMF'

P value = 1.79e-06 (Fisher's exact test), Q value = 0.00035
Table S4. Gene #4: 'CBWD1 MUTATION STATUS' versus Clinical Feature #2: 'METHLYATION_CNMF'
| nPatients | CLUS_1 | CLUS_2 | CLUS_3 | CLUS_4 |
|---|---|---|---|---|
| ALL | 27 | 51 | 44 | 53 |
| CBWD1 MUTATED | 4 | 16 | 2 | 0 |
| CBWD1 WILD-TYPE | 23 | 35 | 42 | 53 |
Figure S4. Get High-res Image Gene #4: 'CBWD1 MUTATION STATUS' versus Clinical Feature #2: 'METHLYATION_CNMF'

P value = 0.000857 (Chi-square test), Q value = 0.15
Table S5. Gene #4: 'CBWD1 MUTATION STATUS' versus Clinical Feature #3: 'MRNASEQ_CNMF'
| nPatients | CLUS_1 | CLUS_2 | CLUS_3 | CLUS_4 | CLUS_5 |
|---|---|---|---|---|---|
| ALL | 36 | 35 | 28 | 33 | 39 |
| CBWD1 MUTATED | 11 | 2 | 3 | 4 | 0 |
| CBWD1 WILD-TYPE | 25 | 33 | 25 | 29 | 39 |
Figure S5. Get High-res Image Gene #4: 'CBWD1 MUTATION STATUS' versus Clinical Feature #3: 'MRNASEQ_CNMF'

P value = 7.48e-05 (Fisher's exact test), Q value = 0.014
Table S6. Gene #4: 'CBWD1 MUTATION STATUS' versus Clinical Feature #4: 'MRNASEQ_CHIERARCHICAL'
| nPatients | CLUS_1 | CLUS_2 | CLUS_3 | CLUS_4 |
|---|---|---|---|---|
| ALL | 35 | 33 | 46 | 57 |
| CBWD1 MUTATED | 2 | 1 | 1 | 16 |
| CBWD1 WILD-TYPE | 33 | 32 | 45 | 41 |
Figure S6. Get High-res Image Gene #4: 'CBWD1 MUTATION STATUS' versus Clinical Feature #4: 'MRNASEQ_CHIERARCHICAL'
P value = 2.36e-05 (Fisher's exact test), Q value = 0.0045
Table S7. Gene #4: 'CBWD1 MUTATION STATUS' versus Clinical Feature #5: 'MIRSEQ_CNMF'
| nPatients | CLUS_1 | CLUS_2 | CLUS_3 | CLUS_4 |
|---|---|---|---|---|
| ALL | 58 | 50 | 61 | 43 |
| CBWD1 MUTATED | 14 | 1 | 11 | 0 |
| CBWD1 WILD-TYPE | 44 | 49 | 50 | 43 |
Figure S7. Get High-res Image Gene #4: 'CBWD1 MUTATION STATUS' versus Clinical Feature #5: 'MIRSEQ_CNMF'

P value = 0.000274 (Fisher's exact test), Q value = 0.049
Table S8. Gene #4: 'CBWD1 MUTATION STATUS' versus Clinical Feature #6: 'MIRSEQ_CHIERARCHICAL'
| nPatients | CLUS_1 | CLUS_2 | CLUS_3 |
|---|---|---|---|
| ALL | 53 | 65 | 94 |
| CBWD1 MUTATED | 0 | 7 | 19 |
| CBWD1 WILD-TYPE | 53 | 58 | 75 |
Figure S8. Get High-res Image Gene #4: 'CBWD1 MUTATION STATUS' versus Clinical Feature #6: 'MIRSEQ_CHIERARCHICAL'
P value = 4.33e-09 (Fisher's exact test), Q value = 8.5e-07
Table S9. Gene #5: 'TP53 MUTATION STATUS' versus Clinical Feature #1: 'CN_CNMF'
| nPatients | CLUS_1 | CLUS_2 | CLUS_3 | CLUS_4 |
|---|---|---|---|---|
| ALL | 99 | 22 | 19 | 79 |
| TP53 MUTATED | 22 | 15 | 9 | 52 |
| TP53 WILD-TYPE | 77 | 7 | 10 | 27 |
Figure S9. Get High-res Image Gene #5: 'TP53 MUTATION STATUS' versus Clinical Feature #1: 'CN_CNMF'

P value = 3.18e-05 (Fisher's exact test), Q value = 0.006
Table S10. Gene #5: 'TP53 MUTATION STATUS' versus Clinical Feature #2: 'METHLYATION_CNMF'
| nPatients | CLUS_1 | CLUS_2 | CLUS_3 | CLUS_4 |
|---|---|---|---|---|
| ALL | 27 | 51 | 44 | 53 |
| TP53 MUTATED | 5 | 25 | 15 | 37 |
| TP53 WILD-TYPE | 22 | 26 | 29 | 16 |
Figure S10. Get High-res Image Gene #5: 'TP53 MUTATION STATUS' versus Clinical Feature #2: 'METHLYATION_CNMF'

P value = 7.74e-05 (Chi-square test), Q value = 0.014
Table S11. Gene #5: 'TP53 MUTATION STATUS' versus Clinical Feature #3: 'MRNASEQ_CNMF'
| nPatients | CLUS_1 | CLUS_2 | CLUS_3 | CLUS_4 | CLUS_5 |
|---|---|---|---|---|---|
| ALL | 36 | 35 | 28 | 33 | 39 |
| TP53 MUTATED | 9 | 10 | 10 | 19 | 28 |
| TP53 WILD-TYPE | 27 | 25 | 18 | 14 | 11 |
Figure S11. Get High-res Image Gene #5: 'TP53 MUTATION STATUS' versus Clinical Feature #3: 'MRNASEQ_CNMF'

P value = 6.4e-06 (Fisher's exact test), Q value = 0.0012
Table S12. Gene #5: 'TP53 MUTATION STATUS' versus Clinical Feature #5: 'MIRSEQ_CNMF'
| nPatients | CLUS_1 | CLUS_2 | CLUS_3 | CLUS_4 |
|---|---|---|---|---|
| ALL | 58 | 50 | 61 | 43 |
| TP53 MUTATED | 20 | 16 | 26 | 34 |
| TP53 WILD-TYPE | 38 | 34 | 35 | 9 |
Figure S12. Get High-res Image Gene #5: 'TP53 MUTATION STATUS' versus Clinical Feature #5: 'MIRSEQ_CNMF'

P value = 9.12e-06 (Fisher's exact test), Q value = 0.0018
Table S13. Gene #5: 'TP53 MUTATION STATUS' versus Clinical Feature #6: 'MIRSEQ_CHIERARCHICAL'
| nPatients | CLUS_1 | CLUS_2 | CLUS_3 |
|---|---|---|---|
| ALL | 53 | 65 | 94 |
| TP53 MUTATED | 39 | 22 | 35 |
| TP53 WILD-TYPE | 14 | 43 | 59 |
Figure S13. Get High-res Image Gene #5: 'TP53 MUTATION STATUS' versus Clinical Feature #6: 'MIRSEQ_CHIERARCHICAL'

P value = 9.4e-05 (Fisher's exact test), Q value = 0.017
Table S14. Gene #5: 'TP53 MUTATION STATUS' versus Clinical Feature #8: 'MIRSEQ_MATURE_CHIERARCHICAL'
| nPatients | CLUS_1 | CLUS_2 | CLUS_3 |
|---|---|---|---|
| ALL | 42 | 57 | 69 |
| TP53 MUTATED | 30 | 16 | 34 |
| TP53 WILD-TYPE | 12 | 41 | 35 |
Figure S14. Get High-res Image Gene #5: 'TP53 MUTATION STATUS' versus Clinical Feature #8: 'MIRSEQ_MATURE_CHIERARCHICAL'
P value = 0.000108 (Fisher's exact test), Q value = 0.02
Table S15. Gene #6: 'PIK3CA MUTATION STATUS' versus Clinical Feature #1: 'CN_CNMF'
| nPatients | CLUS_1 | CLUS_2 | CLUS_3 | CLUS_4 |
|---|---|---|---|---|
| ALL | 99 | 22 | 19 | 79 |
| PIK3CA MUTATED | 30 | 7 | 6 | 5 |
| PIK3CA WILD-TYPE | 69 | 15 | 13 | 74 |
Figure S15. Get High-res Image Gene #6: 'PIK3CA MUTATION STATUS' versus Clinical Feature #1: 'CN_CNMF'
P value = 1.83e-09 (Fisher's exact test), Q value = 3.6e-07
Table S16. Gene #6: 'PIK3CA MUTATION STATUS' versus Clinical Feature #2: 'METHLYATION_CNMF'
| nPatients | CLUS_1 | CLUS_2 | CLUS_3 | CLUS_4 |
|---|---|---|---|---|
| ALL | 27 | 51 | 44 | 53 |
| PIK3CA MUTATED | 19 | 15 | 4 | 4 |
| PIK3CA WILD-TYPE | 8 | 36 | 40 | 49 |
Figure S16. Get High-res Image Gene #6: 'PIK3CA MUTATION STATUS' versus Clinical Feature #2: 'METHLYATION_CNMF'

P value = 0.00058 (Chi-square test), Q value = 0.1
Table S17. Gene #6: 'PIK3CA MUTATION STATUS' versus Clinical Feature #3: 'MRNASEQ_CNMF'
| nPatients | CLUS_1 | CLUS_2 | CLUS_3 | CLUS_4 | CLUS_5 |
|---|---|---|---|---|---|
| ALL | 36 | 35 | 28 | 33 | 39 |
| PIK3CA MUTATED | 16 | 6 | 4 | 10 | 2 |
| PIK3CA WILD-TYPE | 20 | 29 | 24 | 23 | 37 |
Figure S17. Get High-res Image Gene #6: 'PIK3CA MUTATION STATUS' versus Clinical Feature #3: 'MRNASEQ_CNMF'
P value = 1.37e-07 (Fisher's exact test), Q value = 2.7e-05
Table S18. Gene #6: 'PIK3CA MUTATION STATUS' versus Clinical Feature #4: 'MRNASEQ_CHIERARCHICAL'
| nPatients | CLUS_1 | CLUS_2 | CLUS_3 | CLUS_4 |
|---|---|---|---|---|
| ALL | 35 | 33 | 46 | 57 |
| PIK3CA MUTATED | 1 | 14 | 2 | 21 |
| PIK3CA WILD-TYPE | 34 | 19 | 44 | 36 |
Figure S18. Get High-res Image Gene #6: 'PIK3CA MUTATION STATUS' versus Clinical Feature #4: 'MRNASEQ_CHIERARCHICAL'

P value = 0.000367 (Fisher's exact test), Q value = 0.065
Table S19. Gene #6: 'PIK3CA MUTATION STATUS' versus Clinical Feature #7: 'MIRSEQ_MATURE_CNMF'
| nPatients | CLUS_1 | CLUS_2 | CLUS_3 |
|---|---|---|---|
| ALL | 54 | 48 | 66 |
| PIK3CA MUTATED | 23 | 6 | 10 |
| PIK3CA WILD-TYPE | 31 | 42 | 56 |
Figure S19. Get High-res Image Gene #6: 'PIK3CA MUTATION STATUS' versus Clinical Feature #7: 'MIRSEQ_MATURE_CNMF'

P value = 0.000215 (Fisher's exact test), Q value = 0.039
Table S20. Gene #7: 'ARID1A MUTATION STATUS' versus Clinical Feature #1: 'CN_CNMF'
| nPatients | CLUS_1 | CLUS_2 | CLUS_3 | CLUS_4 |
|---|---|---|---|---|
| ALL | 99 | 22 | 19 | 79 |
| ARID1A MUTATED | 30 | 2 | 4 | 5 |
| ARID1A WILD-TYPE | 69 | 20 | 15 | 74 |
Figure S20. Get High-res Image Gene #7: 'ARID1A MUTATION STATUS' versus Clinical Feature #1: 'CN_CNMF'

P value = 3.52e-05 (Chi-square test), Q value = 0.0066
Table S21. Gene #7: 'ARID1A MUTATION STATUS' versus Clinical Feature #3: 'MRNASEQ_CNMF'
| nPatients | CLUS_1 | CLUS_2 | CLUS_3 | CLUS_4 | CLUS_5 |
|---|---|---|---|---|---|
| ALL | 36 | 35 | 28 | 33 | 39 |
| ARID1A MUTATED | 17 | 7 | 3 | 6 | 1 |
| ARID1A WILD-TYPE | 19 | 28 | 25 | 27 | 38 |
Figure S21. Get High-res Image Gene #7: 'ARID1A MUTATION STATUS' versus Clinical Feature #3: 'MRNASEQ_CNMF'

P value = 0.000131 (Fisher's exact test), Q value = 0.024
Table S22. Gene #7: 'ARID1A MUTATION STATUS' versus Clinical Feature #4: 'MRNASEQ_CHIERARCHICAL'
| nPatients | CLUS_1 | CLUS_2 | CLUS_3 | CLUS_4 |
|---|---|---|---|---|
| ALL | 35 | 33 | 46 | 57 |
| ARID1A MUTATED | 3 | 9 | 2 | 20 |
| ARID1A WILD-TYPE | 32 | 24 | 44 | 37 |
Figure S22. Get High-res Image Gene #7: 'ARID1A MUTATION STATUS' versus Clinical Feature #4: 'MRNASEQ_CHIERARCHICAL'
P value = 0.000594 (Fisher's exact test), Q value = 0.1
Table S23. Gene #9: 'RHOA MUTATION STATUS' versus Clinical Feature #7: 'MIRSEQ_MATURE_CNMF'
| nPatients | CLUS_1 | CLUS_2 | CLUS_3 |
|---|---|---|---|
| ALL | 54 | 48 | 66 |
| RHOA MUTATED | 3 | 8 | 0 |
| RHOA WILD-TYPE | 51 | 40 | 66 |
Figure S23. Get High-res Image Gene #9: 'RHOA MUTATION STATUS' versus Clinical Feature #7: 'MIRSEQ_MATURE_CNMF'

P value = 0.00102 (Fisher's exact test), Q value = 0.18
Table S24. Gene #11: 'IRF2 MUTATION STATUS' versus Clinical Feature #5: 'MIRSEQ_CNMF'
| nPatients | CLUS_1 | CLUS_2 | CLUS_3 | CLUS_4 |
|---|---|---|---|---|
| ALL | 58 | 50 | 61 | 43 |
| IRF2 MUTATED | 9 | 0 | 5 | 0 |
| IRF2 WILD-TYPE | 49 | 50 | 56 | 43 |
Figure S24. Get High-res Image Gene #11: 'IRF2 MUTATION STATUS' versus Clinical Feature #5: 'MIRSEQ_CNMF'
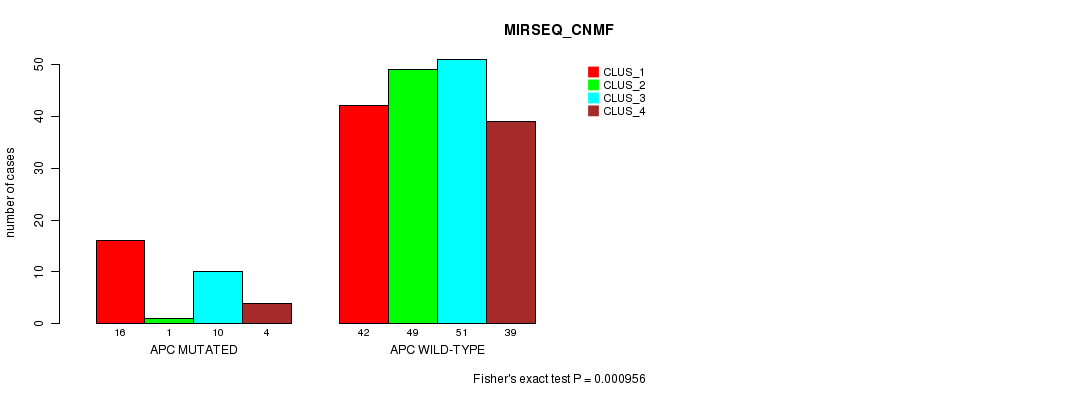
P value = 0.000956 (Fisher's exact test), Q value = 0.17
Table S25. Gene #19: 'APC MUTATION STATUS' versus Clinical Feature #5: 'MIRSEQ_CNMF'
| nPatients | CLUS_1 | CLUS_2 | CLUS_3 | CLUS_4 |
|---|---|---|---|---|
| ALL | 58 | 50 | 61 | 43 |
| APC MUTATED | 16 | 1 | 10 | 4 |
| APC WILD-TYPE | 42 | 49 | 51 | 39 |
Figure S25. Get High-res Image Gene #19: 'APC MUTATION STATUS' versus Clinical Feature #5: 'MIRSEQ_CNMF'
P value = 6.67e-05 (Fisher's exact test), Q value = 0.012
Table S26. Gene #22: 'BCOR MUTATION STATUS' versus Clinical Feature #2: 'METHLYATION_CNMF'
| nPatients | CLUS_1 | CLUS_2 | CLUS_3 | CLUS_4 |
|---|---|---|---|---|
| ALL | 27 | 51 | 44 | 53 |
| BCOR MUTATED | 7 | 2 | 1 | 0 |
| BCOR WILD-TYPE | 20 | 49 | 43 | 53 |
Figure S26. Get High-res Image Gene #22: 'BCOR MUTATION STATUS' versus Clinical Feature #2: 'METHLYATION_CNMF'

-
Mutation data file = STAD-TP.mutsig.cluster.txt
-
Molecular subtypes file = STAD-TP.transferedmergedcluster.txt
-
Number of patients = 220
-
Number of significantly mutated genes = 25
-
Number of Molecular subtypes = 8
-
Exclude genes that fewer than K tumors have mutations, K = 3
For binary or multi-class clinical features (nominal or ordinal), two-tailed Fisher's exact tests (Fisher 1922) were used to estimate the P values using the 'fisher.test' function in R
For multi-class clinical features (nominal or ordinal), Chi-square tests (Greenwood and Nikulin 1996) were used to estimate the P values using the 'chisq.test' function in R
For multiple hypothesis correction, Q value is the False Discovery Rate (FDR) analogue of the P value (Benjamini and Hochberg 1995), defined as the minimum FDR at which the test may be called significant. We used the 'Benjamini and Hochberg' method of 'p.adjust' function in R to convert P values into Q values.
This is an experimental feature. The full results of the analysis summarized in this report can be downloaded from the TCGA Data Coordination Center.