This pipeline computes the correlation between significant arm-level copy number variations (cnvs) and subtypes.
Testing the association between copy number variation 71 arm-level results and 2 molecular subtypes across 63 patients, 5 significant findings detected with Q value < 0.25.
-
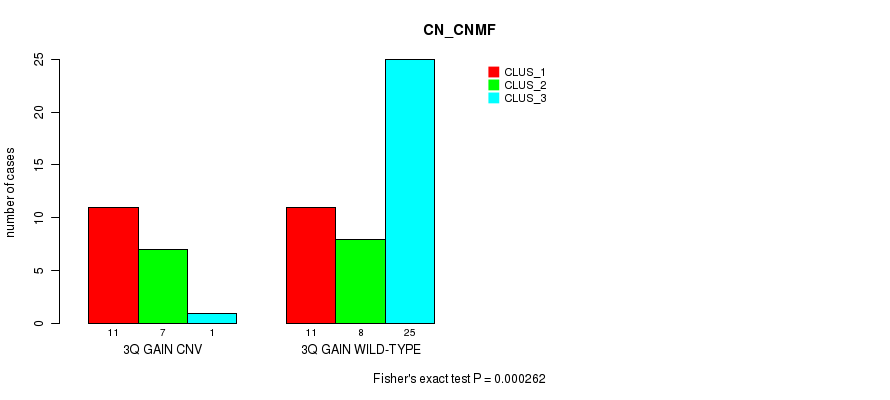
3q gain cnv correlated to 'CN_CNMF' and 'METHLYATION_CNMF'.
-
12p gain cnv correlated to 'CN_CNMF'.
-
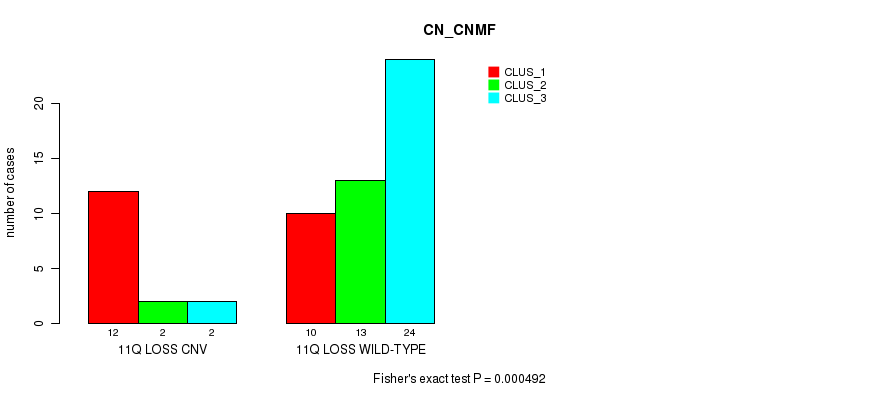
11q loss cnv correlated to 'CN_CNMF'.
-
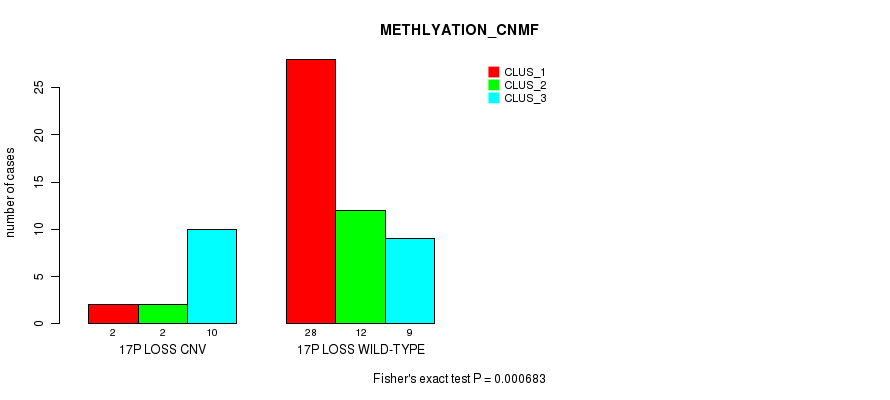
17p loss cnv correlated to 'METHLYATION_CNMF'.
Table 1. Get Full Table Overview of the association between significant copy number variation of 71 arm-level results and 2 molecular subtypes. Shown in the table are P values (Q values). Thresholded by Q value < 0.25, 5 significant findings detected.
|
Molecular subtypes |
CN CNMF |
METHLYATION CNMF |
||
| nCNV (%) | nWild-Type | Fisher's exact test | Fisher's exact test | |
| 3q gain | 0 (0%) | 44 |
0.000262 (0.037) |
3.6e-05 (0.00511) |
| 12p gain | 0 (0%) | 42 |
0.000606 (0.0842) |
0.00639 (0.856) |
| 11q loss | 0 (0%) | 47 |
0.000492 (0.0689) |
0.00757 (1.00) |
| 17p loss | 0 (0%) | 49 |
0.174 (1.00) |
0.000683 (0.0943) |
| 1p gain | 0 (0%) | 56 |
0.589 (1.00) |
0.668 (1.00) |
| 1q gain | 0 (0%) | 46 |
0.55 (1.00) |
0.816 (1.00) |
| 2p gain | 0 (0%) | 52 |
0.0965 (1.00) |
0.236 (1.00) |
| 2q gain | 0 (0%) | 56 |
0.0224 (1.00) |
0.158 (1.00) |
| 3p gain | 0 (0%) | 54 |
0.0188 (1.00) |
0.191 (1.00) |
| 4p gain | 0 (0%) | 59 |
0.346 (1.00) |
1 (1.00) |
| 5p gain | 0 (0%) | 43 |
0.579 (1.00) |
0.645 (1.00) |
| 6p gain | 0 (0%) | 58 |
0.611 (1.00) |
1 (1.00) |
| 6q gain | 0 (0%) | 60 |
0.0115 (1.00) |
1 (1.00) |
| 7p gain | 0 (0%) | 35 |
0.175 (1.00) |
0.413 (1.00) |
| 7q gain | 0 (0%) | 44 |
0.573 (1.00) |
0.329 (1.00) |
| 8p gain | 0 (0%) | 46 |
0.318 (1.00) |
0.139 (1.00) |
| 8q gain | 0 (0%) | 37 |
0.898 (1.00) |
0.538 (1.00) |
| 9p gain | 0 (0%) | 60 |
0.108 (1.00) |
0.308 (1.00) |
| 9q gain | 0 (0%) | 55 |
0.243 (1.00) |
0.379 (1.00) |
| 10p gain | 0 (0%) | 57 |
1 (1.00) |
0.391 (1.00) |
| 10q gain | 0 (0%) | 60 |
0.243 (1.00) |
1 (1.00) |
| 11p gain | 0 (0%) | 60 |
0.0115 (1.00) |
0.591 (1.00) |
| 11q gain | 0 (0%) | 60 |
0.0115 (1.00) |
0.792 (1.00) |
| 12q gain | 0 (0%) | 54 |
0.0952 (1.00) |
0.191 (1.00) |
| 13q gain | 0 (0%) | 55 |
0.382 (1.00) |
0.014 (1.00) |
| 14q gain | 0 (0%) | 54 |
0.813 (1.00) |
0.108 (1.00) |
| 15q gain | 0 (0%) | 59 |
0.669 (1.00) |
0.676 (1.00) |
| 16p gain | 0 (0%) | 58 |
1 (1.00) |
0.234 (1.00) |
| 16q gain | 0 (0%) | 59 |
0.669 (1.00) |
0.431 (1.00) |
| 17p gain | 0 (0%) | 56 |
0.0032 (0.435) |
0.0812 (1.00) |
| 17q gain | 0 (0%) | 56 |
0.0898 (1.00) |
0.513 (1.00) |
| 18p gain | 0 (0%) | 49 |
0.0147 (1.00) |
0.0725 (1.00) |
| 18q gain | 0 (0%) | 60 |
0.604 (1.00) |
0.792 (1.00) |
| 19p gain | 0 (0%) | 60 |
0.0115 (1.00) |
0.591 (1.00) |
| 19q gain | 0 (0%) | 56 |
0.00496 (0.67) |
0.252 (1.00) |
| 20p gain | 0 (0%) | 38 |
0.761 (1.00) |
0.602 (1.00) |
| 20q gain | 0 (0%) | 36 |
0.804 (1.00) |
0.342 (1.00) |
| 21q gain | 0 (0%) | 60 |
0.108 (1.00) |
0.308 (1.00) |
| 22q gain | 0 (0%) | 55 |
1 (1.00) |
0.379 (1.00) |
| Xq gain | 0 (0%) | 53 |
0.221 (1.00) |
0.0289 (1.00) |
| 3p loss | 0 (0%) | 37 |
0.581 (1.00) |
0.714 (1.00) |
| 3q loss | 0 (0%) | 59 |
0.543 (1.00) |
0.676 (1.00) |
| 4p loss | 0 (0%) | 40 |
0.0471 (1.00) |
0.0196 (1.00) |
| 4q loss | 0 (0%) | 45 |
0.139 (1.00) |
0.0134 (1.00) |
| 5p loss | 0 (0%) | 54 |
0.342 (1.00) |
0.214 (1.00) |
| 5q loss | 0 (0%) | 46 |
0.722 (1.00) |
0.0196 (1.00) |
| 6p loss | 0 (0%) | 53 |
0.299 (1.00) |
0.111 (1.00) |
| 6q loss | 0 (0%) | 56 |
0.272 (1.00) |
0.0812 (1.00) |
| 7p loss | 0 (0%) | 60 |
0.108 (1.00) |
0.308 (1.00) |
| 8p loss | 0 (0%) | 49 |
0.801 (1.00) |
0.737 (1.00) |
| 8q loss | 0 (0%) | 57 |
1 (1.00) |
0.547 (1.00) |
| 9p loss | 0 (0%) | 40 |
0.4 (1.00) |
0.146 (1.00) |
| 9q loss | 0 (0%) | 53 |
0.221 (1.00) |
0.167 (1.00) |
| 10p loss | 0 (0%) | 50 |
0.216 (1.00) |
0.24 (1.00) |
| 10q loss | 0 (0%) | 48 |
0.00218 (0.299) |
0.0178 (1.00) |
| 11p loss | 0 (0%) | 52 |
0.128 (1.00) |
0.0936 (1.00) |
| 12p loss | 0 (0%) | 55 |
0.635 (1.00) |
0.338 (1.00) |
| 12q loss | 0 (0%) | 57 |
0.641 (1.00) |
0.0916 (1.00) |
| 13q loss | 0 (0%) | 48 |
0.0272 (1.00) |
0.012 (1.00) |
| 14q loss | 0 (0%) | 56 |
1 (1.00) |
0.582 (1.00) |
| 15q loss | 0 (0%) | 54 |
0.469 (1.00) |
1 (1.00) |
| 16p loss | 0 (0%) | 53 |
0.109 (1.00) |
0.0762 (1.00) |
| 16q loss | 0 (0%) | 52 |
0.139 (1.00) |
0.525 (1.00) |
| 18p loss | 0 (0%) | 51 |
0.307 (1.00) |
0.282 (1.00) |
| 18q loss | 0 (0%) | 39 |
0.51 (1.00) |
0.0832 (1.00) |
| 19p loss | 0 (0%) | 54 |
0.139 (1.00) |
0.898 (1.00) |
| 19q loss | 0 (0%) | 57 |
0.178 (1.00) |
0.75 (1.00) |
| 20p loss | 0 (0%) | 58 |
0.193 (1.00) |
1 (1.00) |
| 21q loss | 0 (0%) | 36 |
0.764 (1.00) |
0.637 (1.00) |
| 22q loss | 0 (0%) | 52 |
0.274 (1.00) |
0.0237 (1.00) |
| Xq loss | 0 (0%) | 60 |
0.784 (1.00) |
0.438 (1.00) |
P value = 0.000262 (Fisher's exact test), Q value = 0.037
Table S1. Gene #6: '3q gain' versus Molecular Subtype #1: 'CN_CNMF'
| nPatients | CLUS_1 | CLUS_2 | CLUS_3 |
|---|---|---|---|
| ALL | 22 | 15 | 26 |
| 3Q GAIN CNV | 11 | 7 | 1 |
| 3Q GAIN WILD-TYPE | 11 | 8 | 25 |
Figure S1. Get High-res Image Gene #6: '3q gain' versus Molecular Subtype #1: 'CN_CNMF'
P value = 3.6e-05 (Fisher's exact test), Q value = 0.0051
Table S2. Gene #6: '3q gain' versus Molecular Subtype #2: 'METHLYATION_CNMF'
| nPatients | CLUS_1 | CLUS_2 | CLUS_3 |
|---|---|---|---|
| ALL | 30 | 14 | 19 |
| 3Q GAIN CNV | 17 | 1 | 1 |
| 3Q GAIN WILD-TYPE | 13 | 13 | 18 |
Figure S2. Get High-res Image Gene #6: '3q gain' versus Molecular Subtype #2: 'METHLYATION_CNMF'

P value = 0.000606 (Fisher's exact test), Q value = 0.084
Table S3. Gene #21: '12p gain' versus Molecular Subtype #1: 'CN_CNMF'
| nPatients | CLUS_1 | CLUS_2 | CLUS_3 |
|---|---|---|---|
| ALL | 22 | 15 | 26 |
| 12P GAIN CNV | 12 | 7 | 2 |
| 12P GAIN WILD-TYPE | 10 | 8 | 24 |
Figure S3. Get High-res Image Gene #21: '12p gain' versus Molecular Subtype #1: 'CN_CNMF'

P value = 0.000492 (Fisher's exact test), Q value = 0.069
Table S4. Gene #55: '11q loss' versus Molecular Subtype #1: 'CN_CNMF'
| nPatients | CLUS_1 | CLUS_2 | CLUS_3 |
|---|---|---|---|
| ALL | 22 | 15 | 26 |
| 11Q LOSS CNV | 12 | 2 | 2 |
| 11Q LOSS WILD-TYPE | 10 | 13 | 24 |
Figure S4. Get High-res Image Gene #55: '11q loss' versus Molecular Subtype #1: 'CN_CNMF'
P value = 0.000683 (Fisher's exact test), Q value = 0.094
Table S5. Gene #63: '17p loss' versus Molecular Subtype #2: 'METHLYATION_CNMF'
| nPatients | CLUS_1 | CLUS_2 | CLUS_3 |
|---|---|---|---|
| ALL | 30 | 14 | 19 |
| 17P LOSS CNV | 2 | 2 | 10 |
| 17P LOSS WILD-TYPE | 28 | 12 | 9 |
Figure S5. Get High-res Image Gene #63: '17p loss' versus Molecular Subtype #2: 'METHLYATION_CNMF'
-
Mutation data file = broad_values_by_arm.mutsig.cluster.txt
-
Molecular subtypes file = ESCA-TP.transferedmergedcluster.txt
-
Number of patients = 63
-
Number of significantly arm-level cnvs = 71
-
Number of molecular subtypes = 2
-
Exclude genes that fewer than K tumors have mutations, K = 3
For binary or multi-class clinical features (nominal or ordinal), two-tailed Fisher's exact tests (Fisher 1922) were used to estimate the P values using the 'fisher.test' function in R
For multiple hypothesis correction, Q value is the False Discovery Rate (FDR) analogue of the P value (Benjamini and Hochberg 1995), defined as the minimum FDR at which the test may be called significant. We used the 'Benjamini and Hochberg' method of 'p.adjust' function in R to convert P values into Q values.
In addition to the links below, the full results of the analysis summarized in this report can also be downloaded programmatically using firehose_get, or interactively from either the Broad GDAC website or TCGA Data Coordination Center Portal.