This report serves to describe the mutational landscape and properties of a given individual set, as well as rank genes and genesets according to mutational significance. MutSig v1.5 was used to generate the results found in this report.
-
Working with individual set: PRAD-TP
-
Number of patients in set: 83
The input for this pipeline is a set of individuals with the following files associated for each:
-
An annotated .maf file describing the mutations called for the respective individual, and their properties.
-
A .wig file that contains information about the coverage of the sample.
-
MAF used for this analysis:PRAD-TP.final_analysis_set.maf
-
Significantly mutated genes (q ≤ 0.1): 34
-
Mutations seen in COSMIC: 28
-
Significantly mutated genes in COSMIC territory: 7
-
Genes with clustered mutations (≤ 3 aa apart): 24
-
Significantly mutated genesets: 1
-
Significantly mutated genesets: (excluding sig. mutated genes):0
-
Read 83 MAFs of type "Broad"
-
Total number of mutations in input MAFs: 5917
-
After removing 18 mutations outside chr1-24: 5899
-
After removing 304 noncoding mutations: 5595
-
Number of mutations before filtering: 5595
-
After removing 207 mutations outside gene set: 5388
-
After removing 4 mutations outside category set: 5384
Table 1. Get Full Table Table representing breakdown of mutations by type.
| type | count |
|---|---|
| Frame_Shift_Del | 150 |
| Frame_Shift_Ins | 77 |
| In_Frame_Del | 51 |
| In_Frame_Ins | 13 |
| Missense_Mutation | 3294 |
| Nonsense_Mutation | 185 |
| Nonstop_Mutation | 2 |
| Silent | 1497 |
| Splice_Site | 102 |
| Translation_Start_Site | 13 |
| Total | 5384 |
Table 2. Get Full Table A breakdown of mutation rates per category discovered for this individual set.
| category | n | N | rate | rate_per_mb | relative_rate | exp_ns_s_ratio |
|---|---|---|---|---|---|---|
| *CpG->T | 840 | 138713067 | 6.1e-06 | 6.1 | 3.9 | 2.1 |
| *Np(A/C/T)->transit | 901 | 1965699488 | 4.6e-07 | 0.46 | 0.29 | 2 |
| *ApG->G | 107 | 381313535 | 2.8e-07 | 0.28 | 0.18 | 2.1 |
| transver | 1456 | 2485726090 | 5.9e-07 | 0.59 | 0.37 | 5 |
| indel+null | 580 | 2485726090 | 2.3e-07 | 0.23 | 0.15 | NaN |
| double_null | 3 | 2485726090 | 1.2e-09 | 0.0012 | 0.00077 | NaN |
| Total | 3887 | 2485726090 | 1.6e-06 | 1.6 | 1 | 3.5 |
The x axis represents the samples. The y axis represents the exons, one row per exon, and they are sorted by average coverage across samples. For exons with exactly the same average coverage, they are sorted next by the %GC of the exon. (The secondary sort is especially useful for the zero-coverage exons at the bottom).
Figure 1.
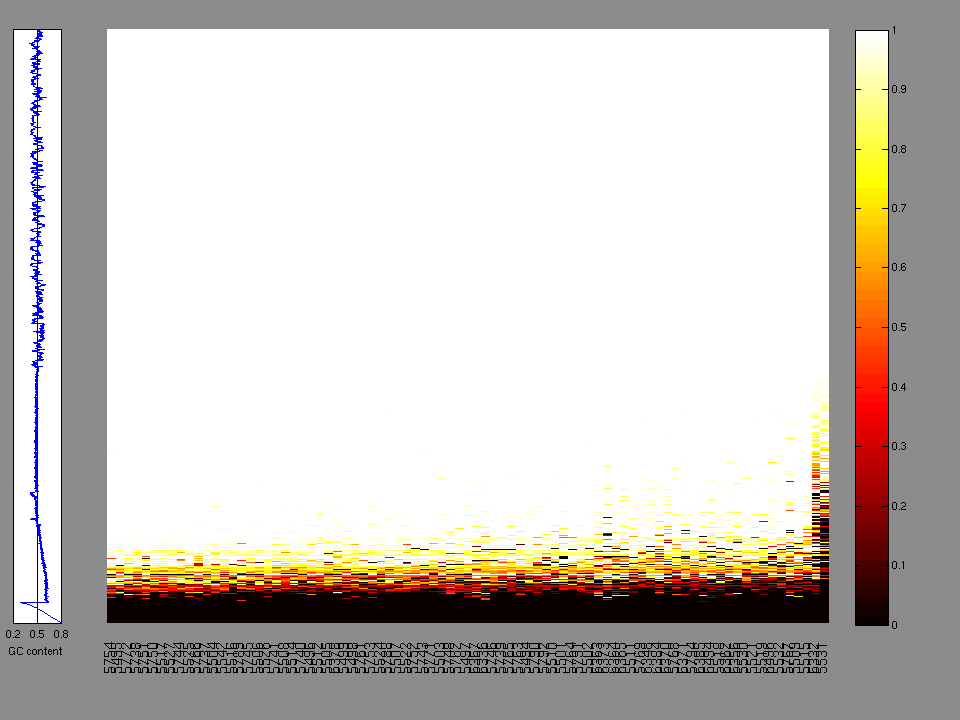
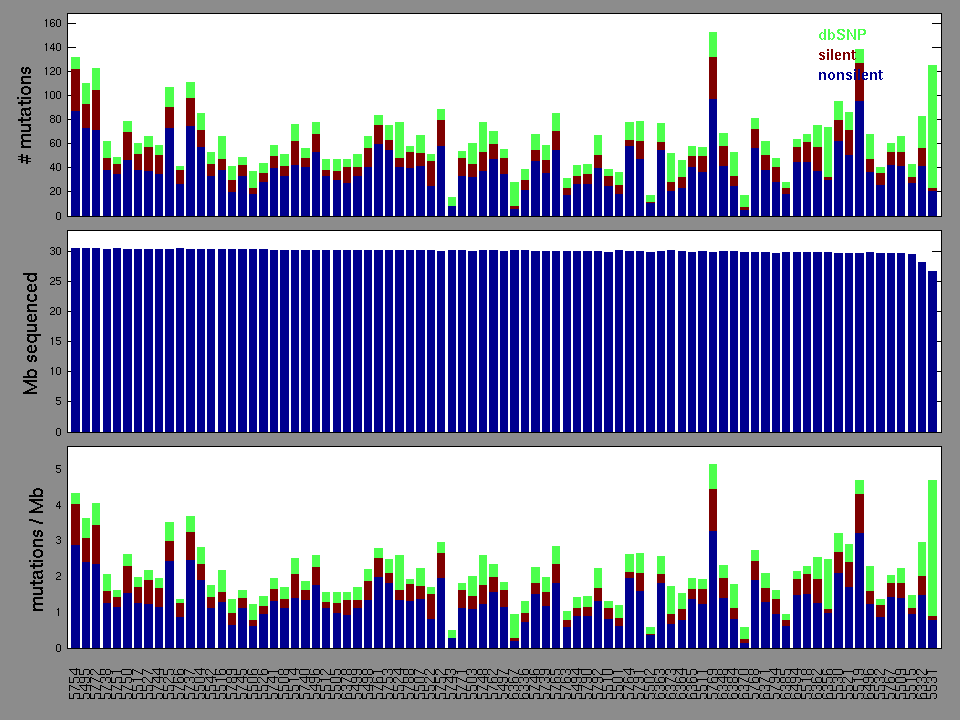
Figure 2. Patients counts and rates file used to generate this plot: PRAD-TP.patients.counts_and_rates.txt
The mutation spectrum is depicted in the lego plots below in which the 96 possible mutation types are subdivided into six large blocks, color-coded to reflect the base substitution type. Each large block is further subdivided into the 16 possible pairs of 5' and 3' neighbors, as listed in the 4x4 trinucleotide context legend. The height of each block corresponds to the mutation frequency for that kind of mutation (counts of mutations normalized by the base coverage in a given bin). The shape of the spectrum is a signature for dominant mutational mechanisms in different tumor types.
Figure 3. Get High-res Image SNV Mutation rate lego plot for entire set. Each bin is normalized by base coverage for that bin. Colors represent the six SNV types on the upper right. The three-base context for each mutation is labeled in the 4x4 legend on the lower right. The fractional breakdown of SNV counts is shown in the pie chart on the upper left. If this figure is blank, not enough information was provided in the MAF to generate it.

Figure 4. Get High-res Image SNV Mutation rate lego plots for 4 slices of mutation allele fraction (0<=AF<0.1, 0.1<=AF<0.25, 0.25<=AF<0.5, & 0.5<=AF) . The color code and three-base context legends are the same as the previous figure. If this figure is blank, not enough information was provided in the MAF to generate it.

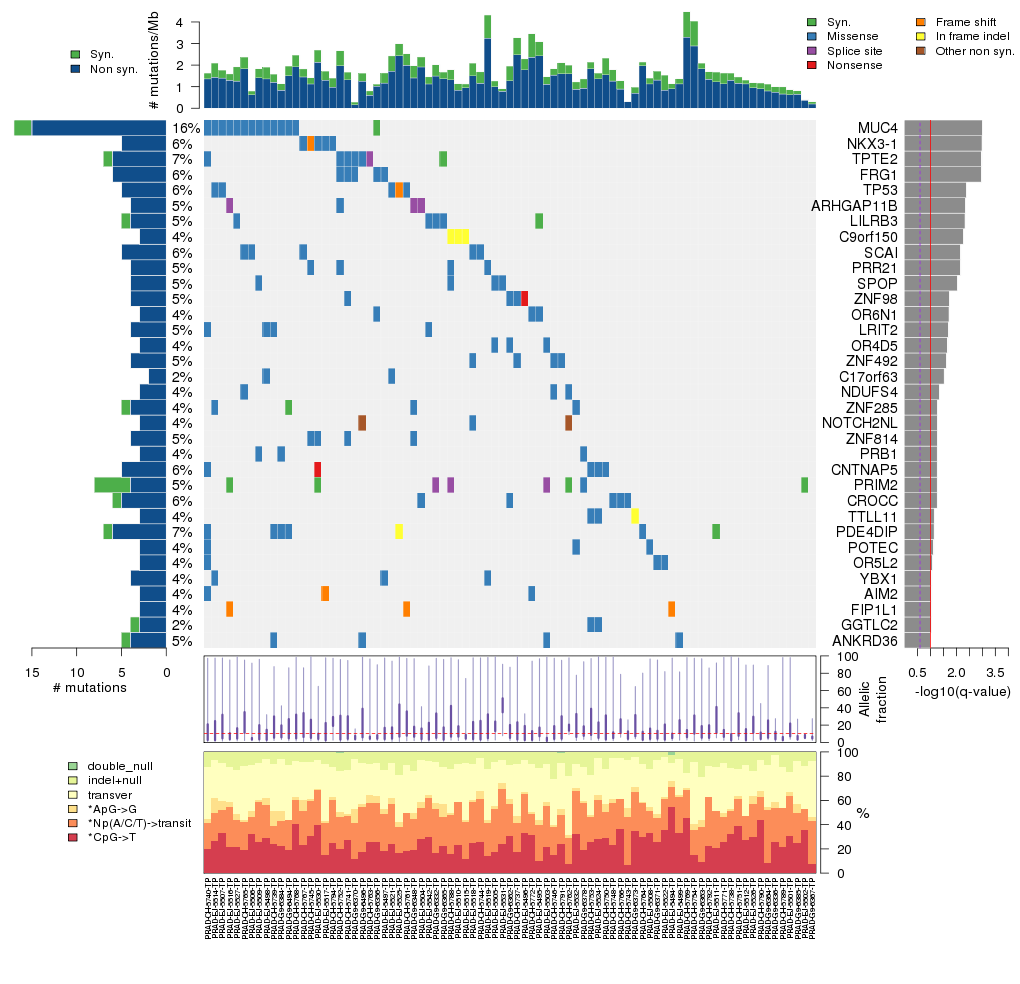
Figure 5. Get High-res Image The matrix in the center of the figure represents individual mutations in patient samples, color-coded by type of mutation, for the significantly mutated genes. The rate of synonymous and non-synonymous mutations is displayed at the top of the matrix. The barplot on the left of the matrix shows the number of mutations in each gene. The percentages represent the fraction of tumors with at least one mutation in the specified gene. The barplot to the right of the matrix displays the q-values for the most significantly mutated genes. The purple boxplots below the matrix (only displayed if required columns are present in the provided MAF) represent the distributions of allelic fractions observed in each sample. The plot at the bottom represents the base substitution distribution of individual samples, using the same categories that were used to calculate significance.
Column Descriptions:
-
N = number of sequenced bases in this gene across the individual set
-
n = number of (nonsilent) mutations in this gene across the individual set
-
npat = number of patients (individuals) with at least one nonsilent mutation
-
nsite = number of unique sites having a non-silent mutation
-
nsil = number of silent mutations in this gene across the individual set
-
n1 = number of nonsilent mutations of type: *CpG->T
-
n2 = number of nonsilent mutations of type: *Np(A/C/T)->transit
-
n3 = number of nonsilent mutations of type: *ApG->G
-
n4 = number of nonsilent mutations of type: transver
-
n5 = number of nonsilent mutations of type: indel+null
-
n6 = number of nonsilent mutations of type: double_null
-
p_ns_s = p-value for the observed nonsilent/silent ratio being elevated in this gene
-
p = p-value (overall)
-
q = q-value, False Discovery Rate (Benjamini-Hochberg procedure)
Table 3. Get Full Table A Ranked List of Significantly Mutated Genes. Number of significant genes found: 34. Number of genes displayed: 35. Click on a gene name to display its stick figure depicting the distribution of mutations and mutation types across the chosen gene (this feature may not be available for all significant genes).
| rank | gene | description | N | n | npat | nsite | nsil | n1 | n2 | n3 | n4 | n5 | n6 | p_ns_s | p | q |
|---|---|---|---|---|---|---|---|---|---|---|---|---|---|---|---|---|
| 1 | MUC4 | mucin 4, cell surface associated | 272535 | 15 | 13 | 9 | 2 | 3 | 4 | 0 | 8 | 0 | 0 | 0.13 | 8.9e-13 | 1.6e-08 |
| 2 | NKX3-1 | NK3 homeobox 1 | 43527 | 5 | 5 | 5 | 0 | 0 | 2 | 0 | 2 | 1 | 0 | 0.26 | 3.3e-09 | 3e-05 |
| 3 | TPTE2 | transmembrane phosphoinositide 3-phosphatase and tensin homolog 2 | 136261 | 6 | 6 | 6 | 1 | 1 | 2 | 0 | 2 | 1 | 0 | 0.48 | 6.1e-09 | 0.000037 |
| 4 | FRG1 | FSHD region gene 1 | 67208 | 6 | 5 | 4 | 0 | 0 | 2 | 0 | 3 | 1 | 0 | 0.32 | 1.2e-08 | 0.000052 |
| 5 | TP53 | tumor protein p53 | 105521 | 5 | 5 | 5 | 0 | 3 | 0 | 0 | 1 | 1 | 0 | 0.34 | 8.3e-07 | 0.003 |
| 6 | ARHGAP11B | Rho GTPase activating protein 11B | 68637 | 4 | 4 | 2 | 0 | 0 | 0 | 0 | 1 | 3 | 0 | 0.25 | 1.2e-06 | 0.0035 |
| 7 | LILRB3 | leukocyte immunoglobulin-like receptor, subfamily B (with TM and ITIM domains), member 3 | 120480 | 4 | 4 | 2 | 1 | 0 | 0 | 3 | 1 | 0 | 0 | 0.6 | 1.4e-06 | 0.0036 |
| 8 | C9orf150 | chromosome 9 open reading frame 150 | 47265 | 3 | 3 | 1 | 0 | 0 | 0 | 0 | 0 | 3 | 0 | 1 | 2e-06 | 0.0044 |
| 9 | SCAI | suppressor of cancer cell invasion | 157950 | 5 | 5 | 2 | 0 | 0 | 0 | 0 | 5 | 0 | 0 | 0.45 | 3.2e-06 | 0.0058 |
| 10 | PRR21 | proline rich 21 | 58941 | 4 | 4 | 4 | 0 | 1 | 1 | 0 | 2 | 0 | 0 | 0.26 | 3.2e-06 | 0.0058 |
| 11 | SPOP | speckle-type POZ protein | 96345 | 4 | 4 | 3 | 0 | 0 | 0 | 1 | 3 | 0 | 0 | 0.39 | 4.8e-06 | 0.0079 |
| 12 | ZNF98 | zinc finger protein 98 (F7175) | 122162 | 4 | 4 | 4 | 0 | 0 | 1 | 0 | 2 | 1 | 0 | 0.45 | 0.000011 | 0.017 |
| 13 | OR6N1 | olfactory receptor, family 6, subfamily N, member 1 | 78146 | 3 | 3 | 2 | 0 | 0 | 0 | 2 | 1 | 0 | 0 | 0.46 | 0.000013 | 0.018 |
| 14 | LRIT2 | leucine-rich repeat, immunoglobulin-like and transmembrane domains 2 | 138107 | 4 | 4 | 3 | 0 | 1 | 2 | 0 | 1 | 0 | 0 | 0.25 | 0.000014 | 0.018 |
| 15 | OR4D5 | olfactory receptor, family 4, subfamily D, member 5 | 79763 | 3 | 3 | 3 | 0 | 2 | 0 | 0 | 1 | 0 | 0 | 0.46 | 0.000017 | 0.02 |
| 16 | ZNF492 | zinc finger protein 492 | 123622 | 4 | 4 | 3 | 0 | 0 | 3 | 0 | 1 | 0 | 0 | 0.28 | 2e-05 | 0.023 |
| 17 | C17orf63 | chromosome 17 open reading frame 63 | 5972 | 2 | 2 | 1 | 0 | 0 | 0 | 0 | 2 | 0 | 0 | 0.65 | 0.000027 | 0.028 |
| 18 | NDUFS4 | NADH dehydrogenase (ubiquinone) Fe-S protein 4, 18kDa (NADH-coenzyme Q reductase) | 45401 | 3 | 3 | 1 | 0 | 0 | 0 | 0 | 3 | 0 | 0 | 0.58 | 0.000043 | 0.043 |
| 19 | ZNF285 | zinc finger protein 285 | 148155 | 4 | 3 | 2 | 1 | 0 | 0 | 2 | 2 | 0 | 0 | 0.74 | 0.000059 | 0.053 |
| 20 | NOTCH2NL | Notch homolog 2 (Drosophila) N-terminal like | 60118 | 3 | 3 | 2 | 0 | 0 | 3 | 0 | 0 | 0 | 0 | 0.3 | 0.000059 | 0.053 |
| 21 | ZNF814 | zinc finger protein 814 | 168858 | 4 | 4 | 2 | 0 | 0 | 2 | 0 | 2 | 0 | 0 | 0.34 | 0.000061 | 0.053 |
| 22 | PRB1 | proline-rich protein BstNI subfamily 1 | 82441 | 3 | 3 | 3 | 0 | 0 | 1 | 0 | 2 | 0 | 0 | 0.44 | 0.000068 | 0.053 |
| 23 | CNTNAP5 | contactin associated protein-like 5 | 309961 | 5 | 5 | 5 | 0 | 2 | 0 | 0 | 2 | 1 | 0 | 0.2 | 0.000071 | 0.053 |
| 24 | PRIM2 | primase, DNA, polypeptide 2 (58kDa) | 120943 | 4 | 4 | 2 | 4 | 0 | 0 | 0 | 1 | 3 | 0 | 1 | 0.000073 | 0.053 |
| 25 | CROCC | ciliary rootlet coiled-coil, rootletin | 295882 | 5 | 5 | 3 | 1 | 3 | 1 | 0 | 1 | 0 | 0 | 0.42 | 0.000074 | 0.053 |
| 26 | TTLL11 | tubulin tyrosine ligase-like family, member 11 | 83913 | 3 | 3 | 3 | 0 | 0 | 0 | 0 | 2 | 1 | 0 | 0.68 | 0.0001 | 0.07 |
| 27 | PDE4DIP | phosphodiesterase 4D interacting protein (myomegalin) | 720610 | 6 | 6 | 5 | 1 | 0 | 2 | 3 | 0 | 1 | 0 | 0.4 | 0.0001 | 0.071 |
| 28 | POTEC | POTE ankyrin domain family, member C | 130537 | 3 | 3 | 2 | 0 | 2 | 1 | 0 | 0 | 0 | 0 | 0.24 | 0.00011 | 0.072 |
| 29 | OR5L2 | olfactory receptor, family 5, subfamily L, member 2 | 78017 | 3 | 3 | 3 | 0 | 0 | 0 | 0 | 3 | 0 | 0 | 0.55 | 0.00013 | 0.082 |
| 30 | YBX1 | Y box binding protein 1 | 68945 | 4 | 3 | 2 | 0 | 0 | 2 | 0 | 2 | 0 | 0 | 0.32 | 0.00014 | 0.087 |
| 31 | AIM2 | absent in melanoma 2 | 87306 | 3 | 3 | 3 | 0 | 0 | 1 | 0 | 1 | 1 | 0 | 0.57 | 0.00015 | 0.087 |
| 32 | FIP1L1 | FIP1 like 1 (S. cerevisiae) | 152119 | 3 | 3 | 1 | 0 | 0 | 0 | 0 | 0 | 3 | 0 | 1 | 0.00015 | 0.087 |
| 33 | GGTLC2 | gamma-glutamyltransferase light chain 2 | 47824 | 3 | 2 | 3 | 1 | 0 | 0 | 1 | 2 | 0 | 0 | 0.73 | 0.00016 | 0.089 |
| 34 | ANKRD36 | ankyrin repeat domain 36 | 204931 | 4 | 4 | 2 | 1 | 0 | 0 | 0 | 4 | 0 | 0 | 0.71 | 0.00018 | 0.096 |
| 35 | OR52A1 | olfactory receptor, family 52, subfamily A, member 1 | 78103 | 2 | 2 | 2 | 0 | 2 | 0 | 0 | 0 | 0 | 0 | 0.84 | 0.0002 | 0.1 |
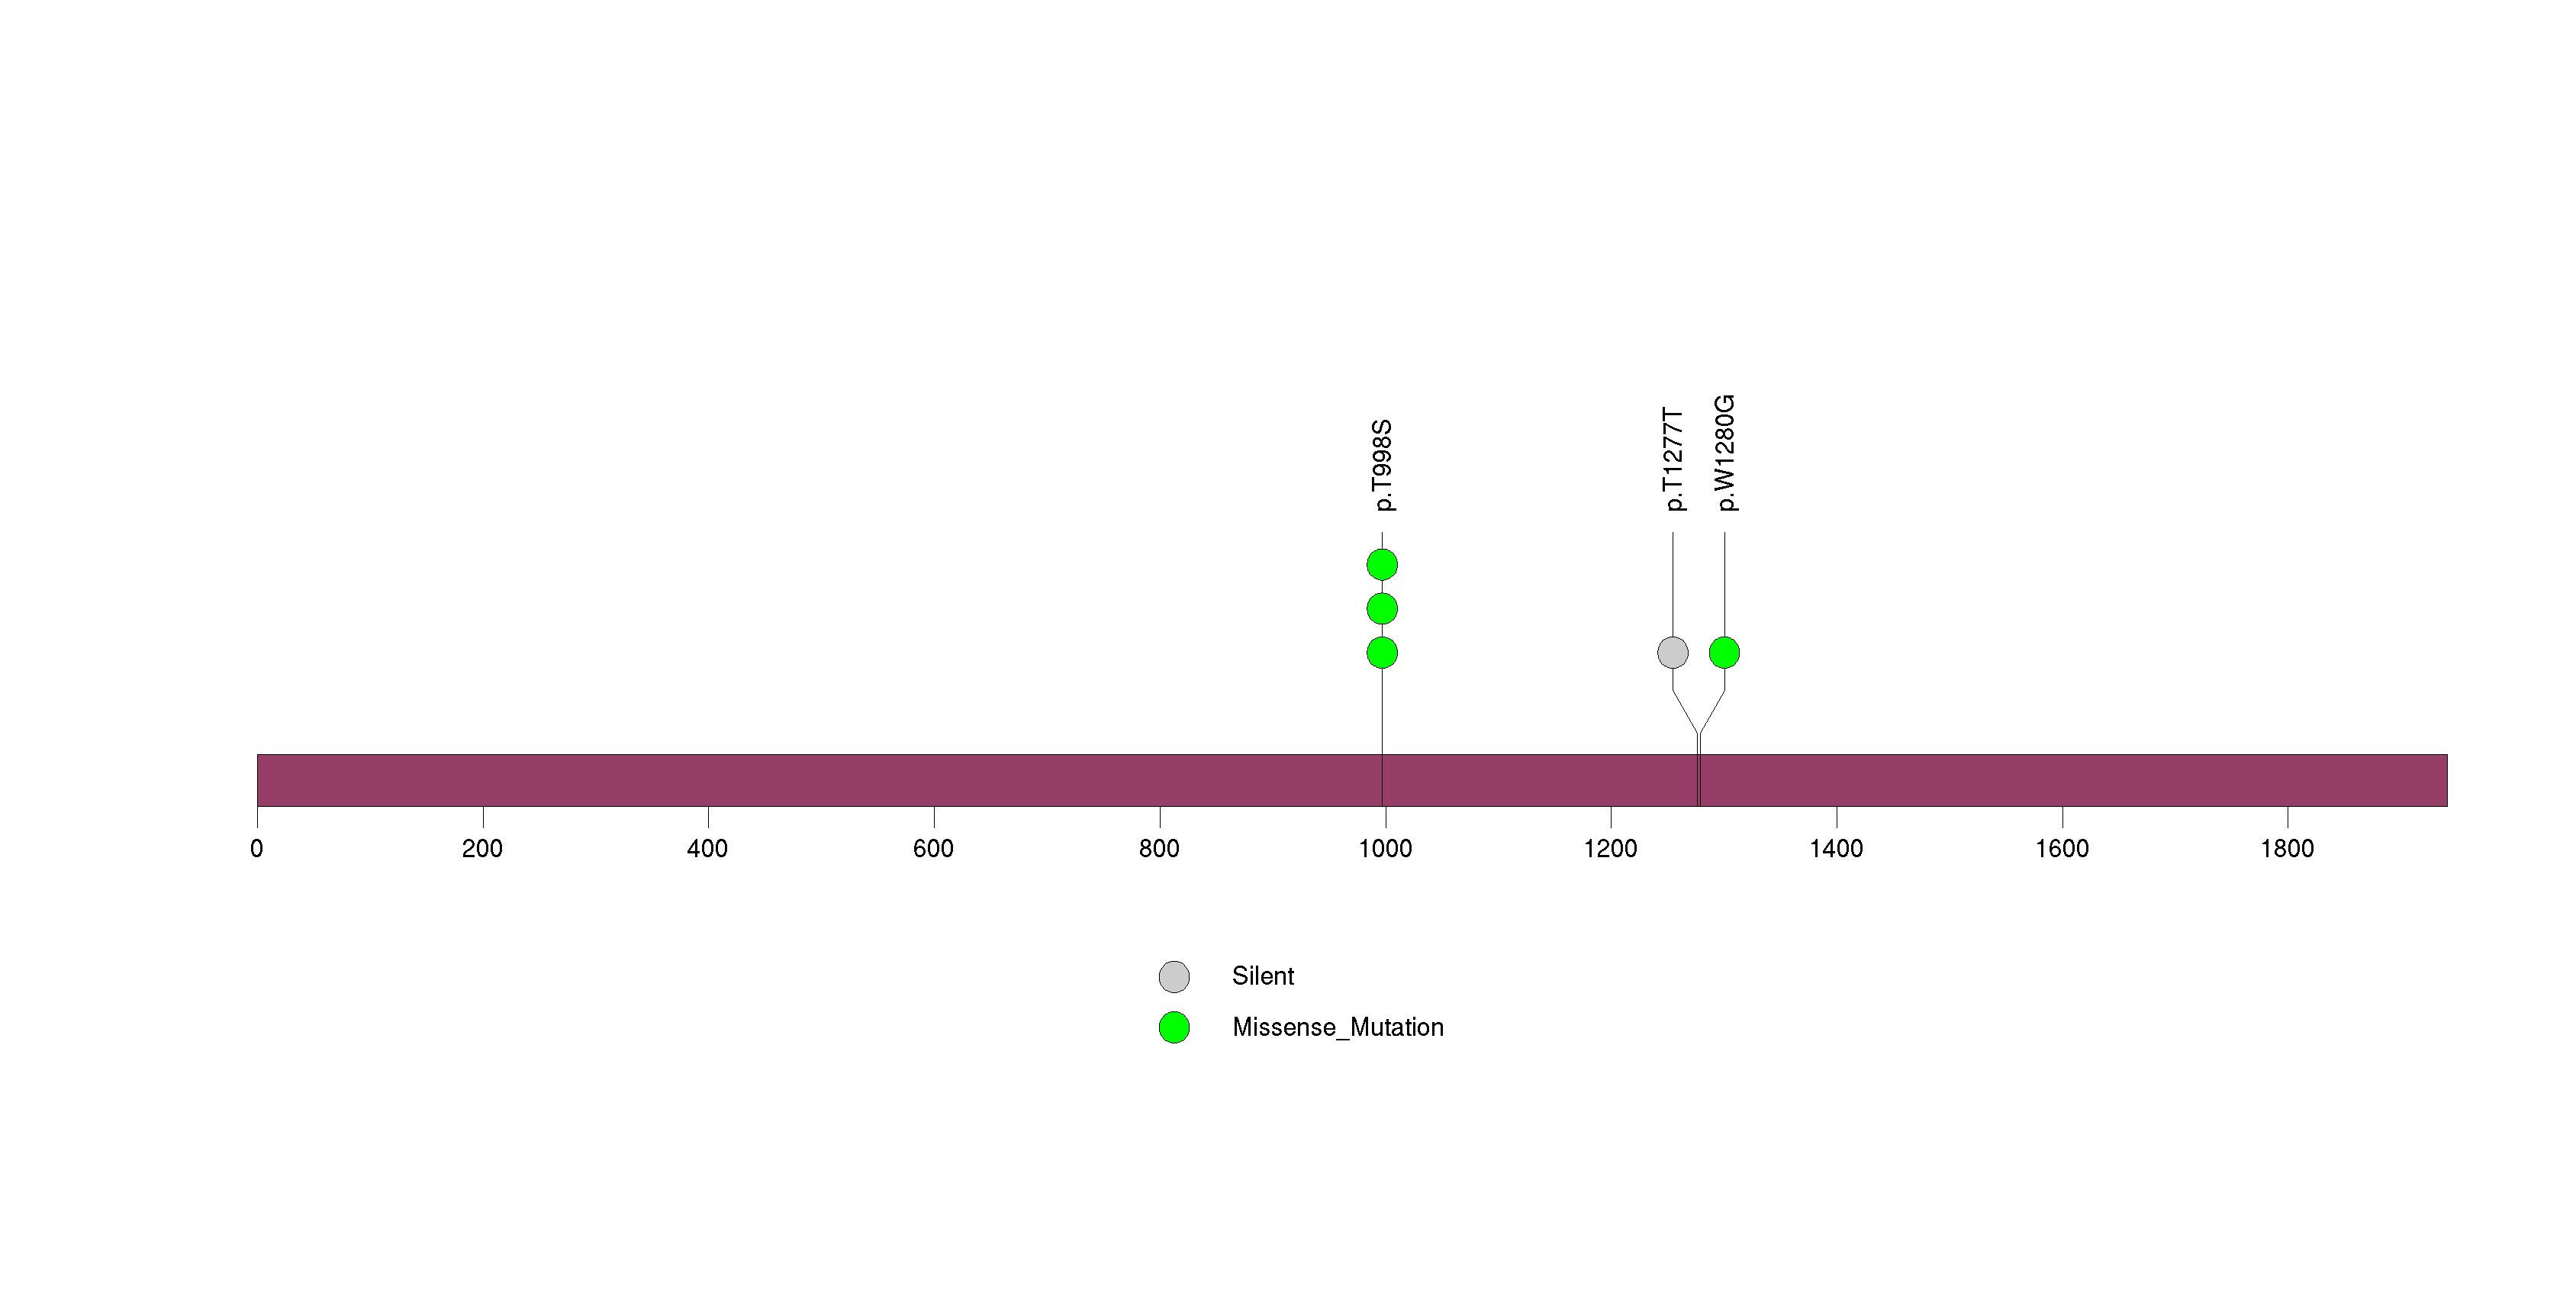
Figure S1. This figure depicts the distribution of mutations and mutation types across the MUC4 significant gene.
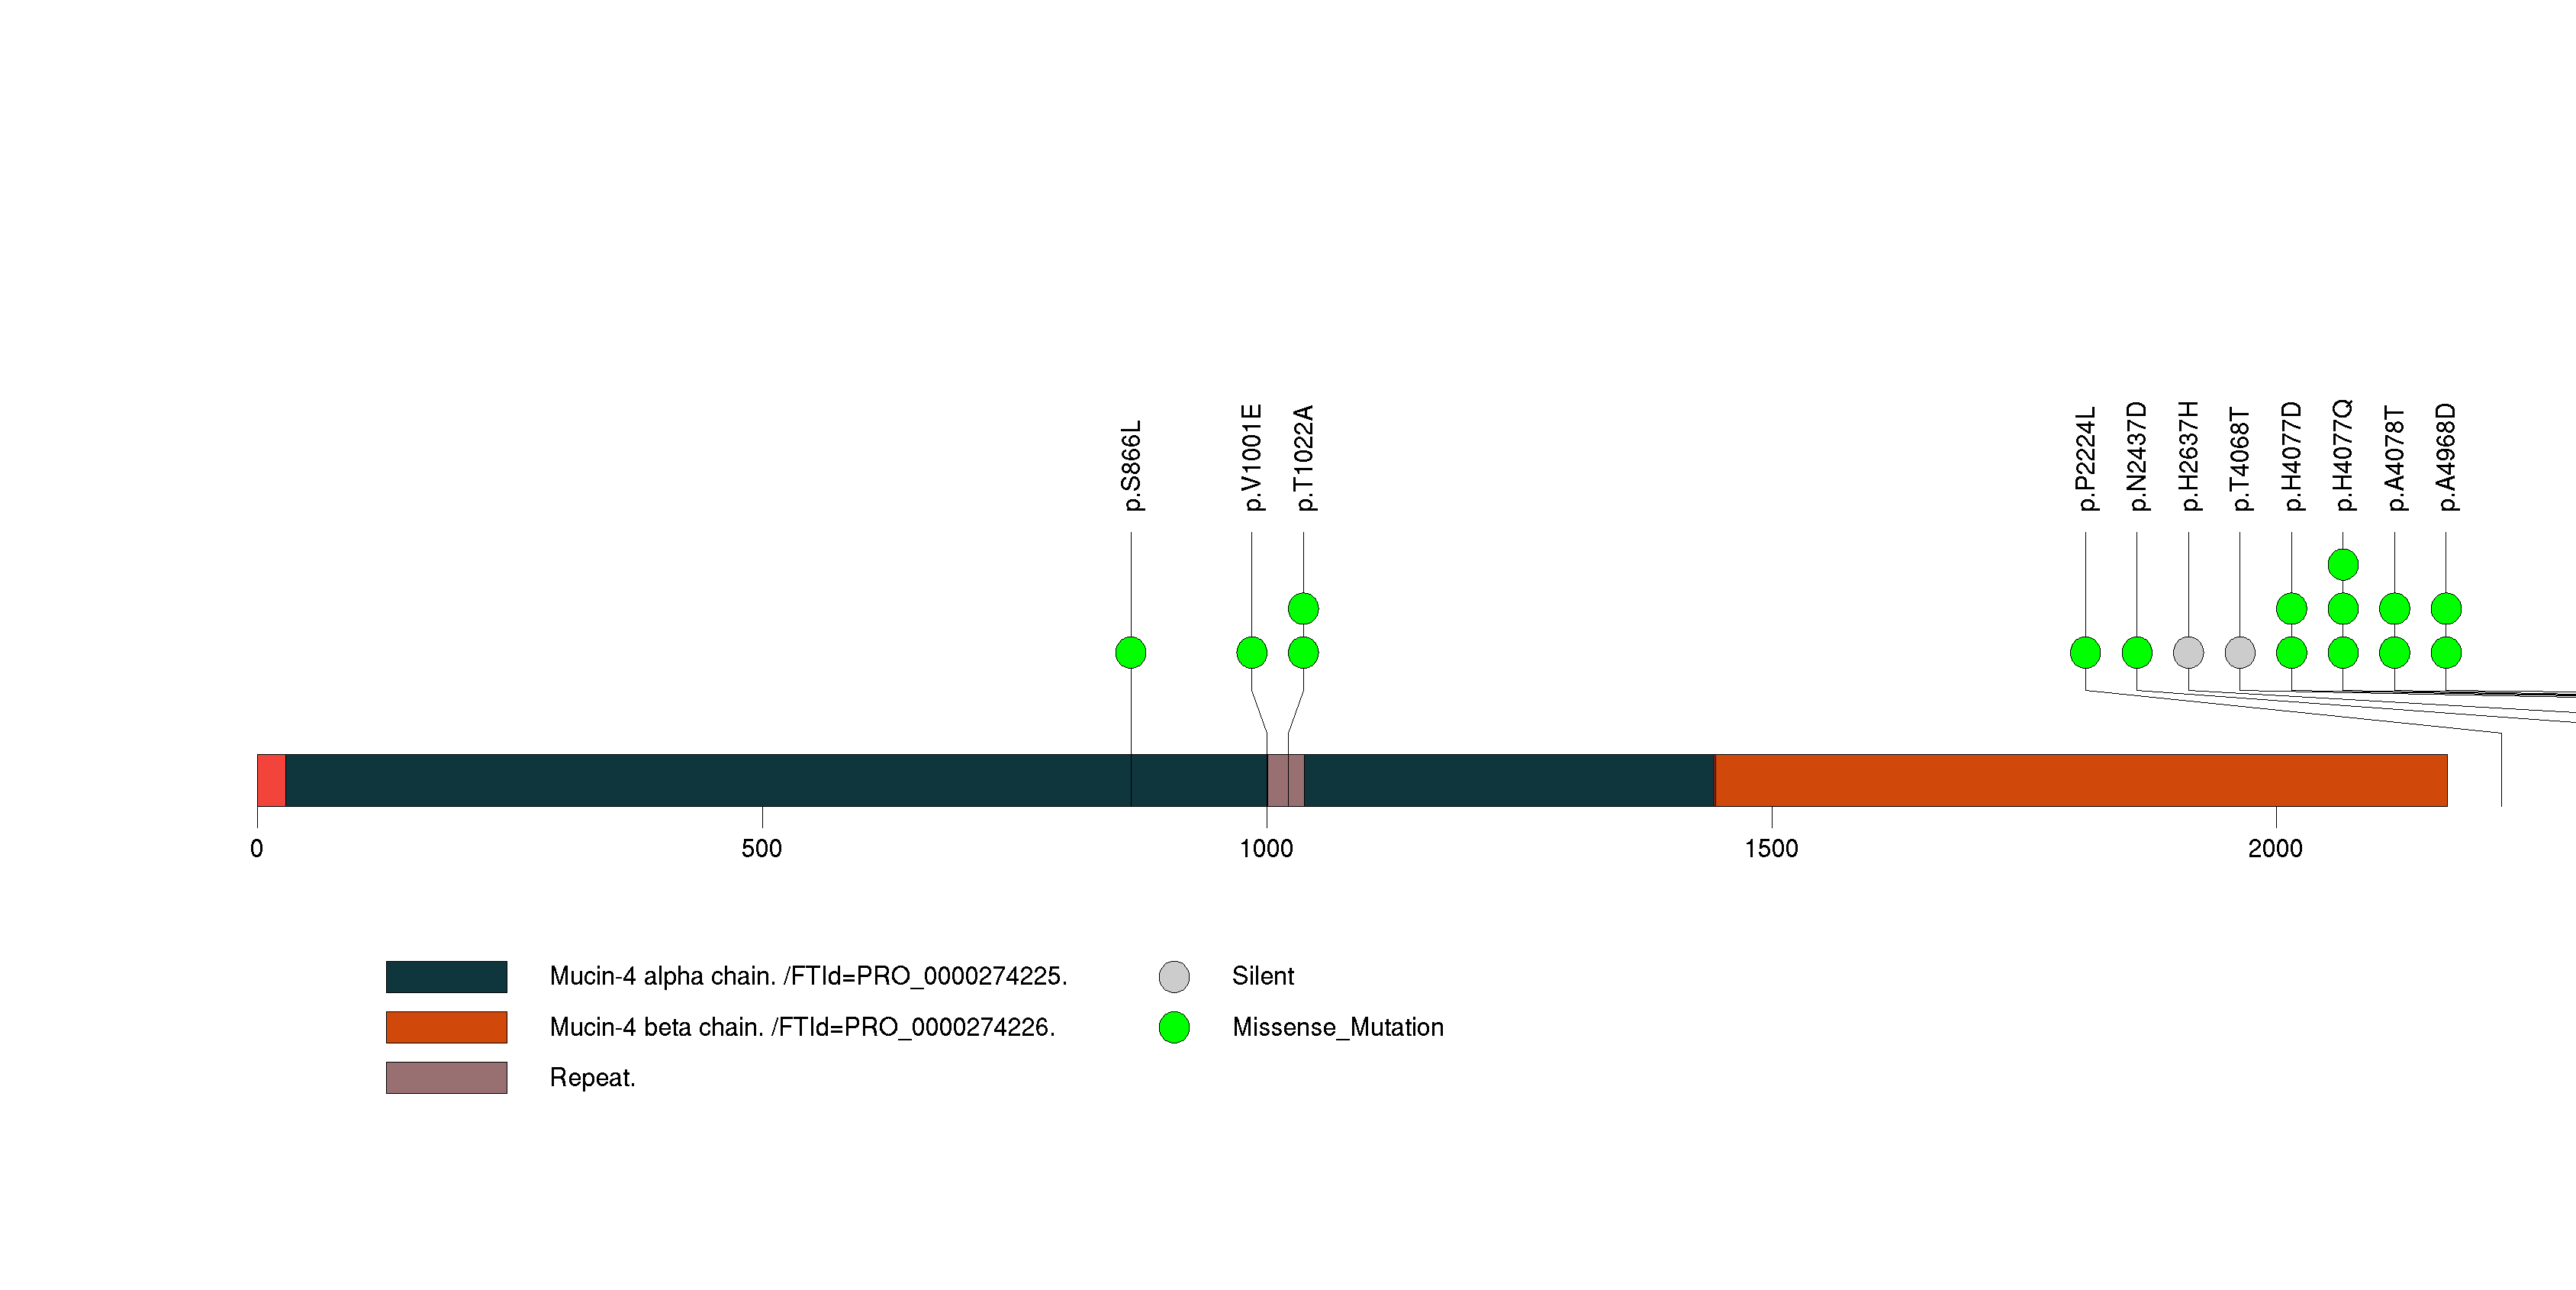
Figure S2. This figure depicts the distribution of mutations and mutation types across the NKX3-1 significant gene.
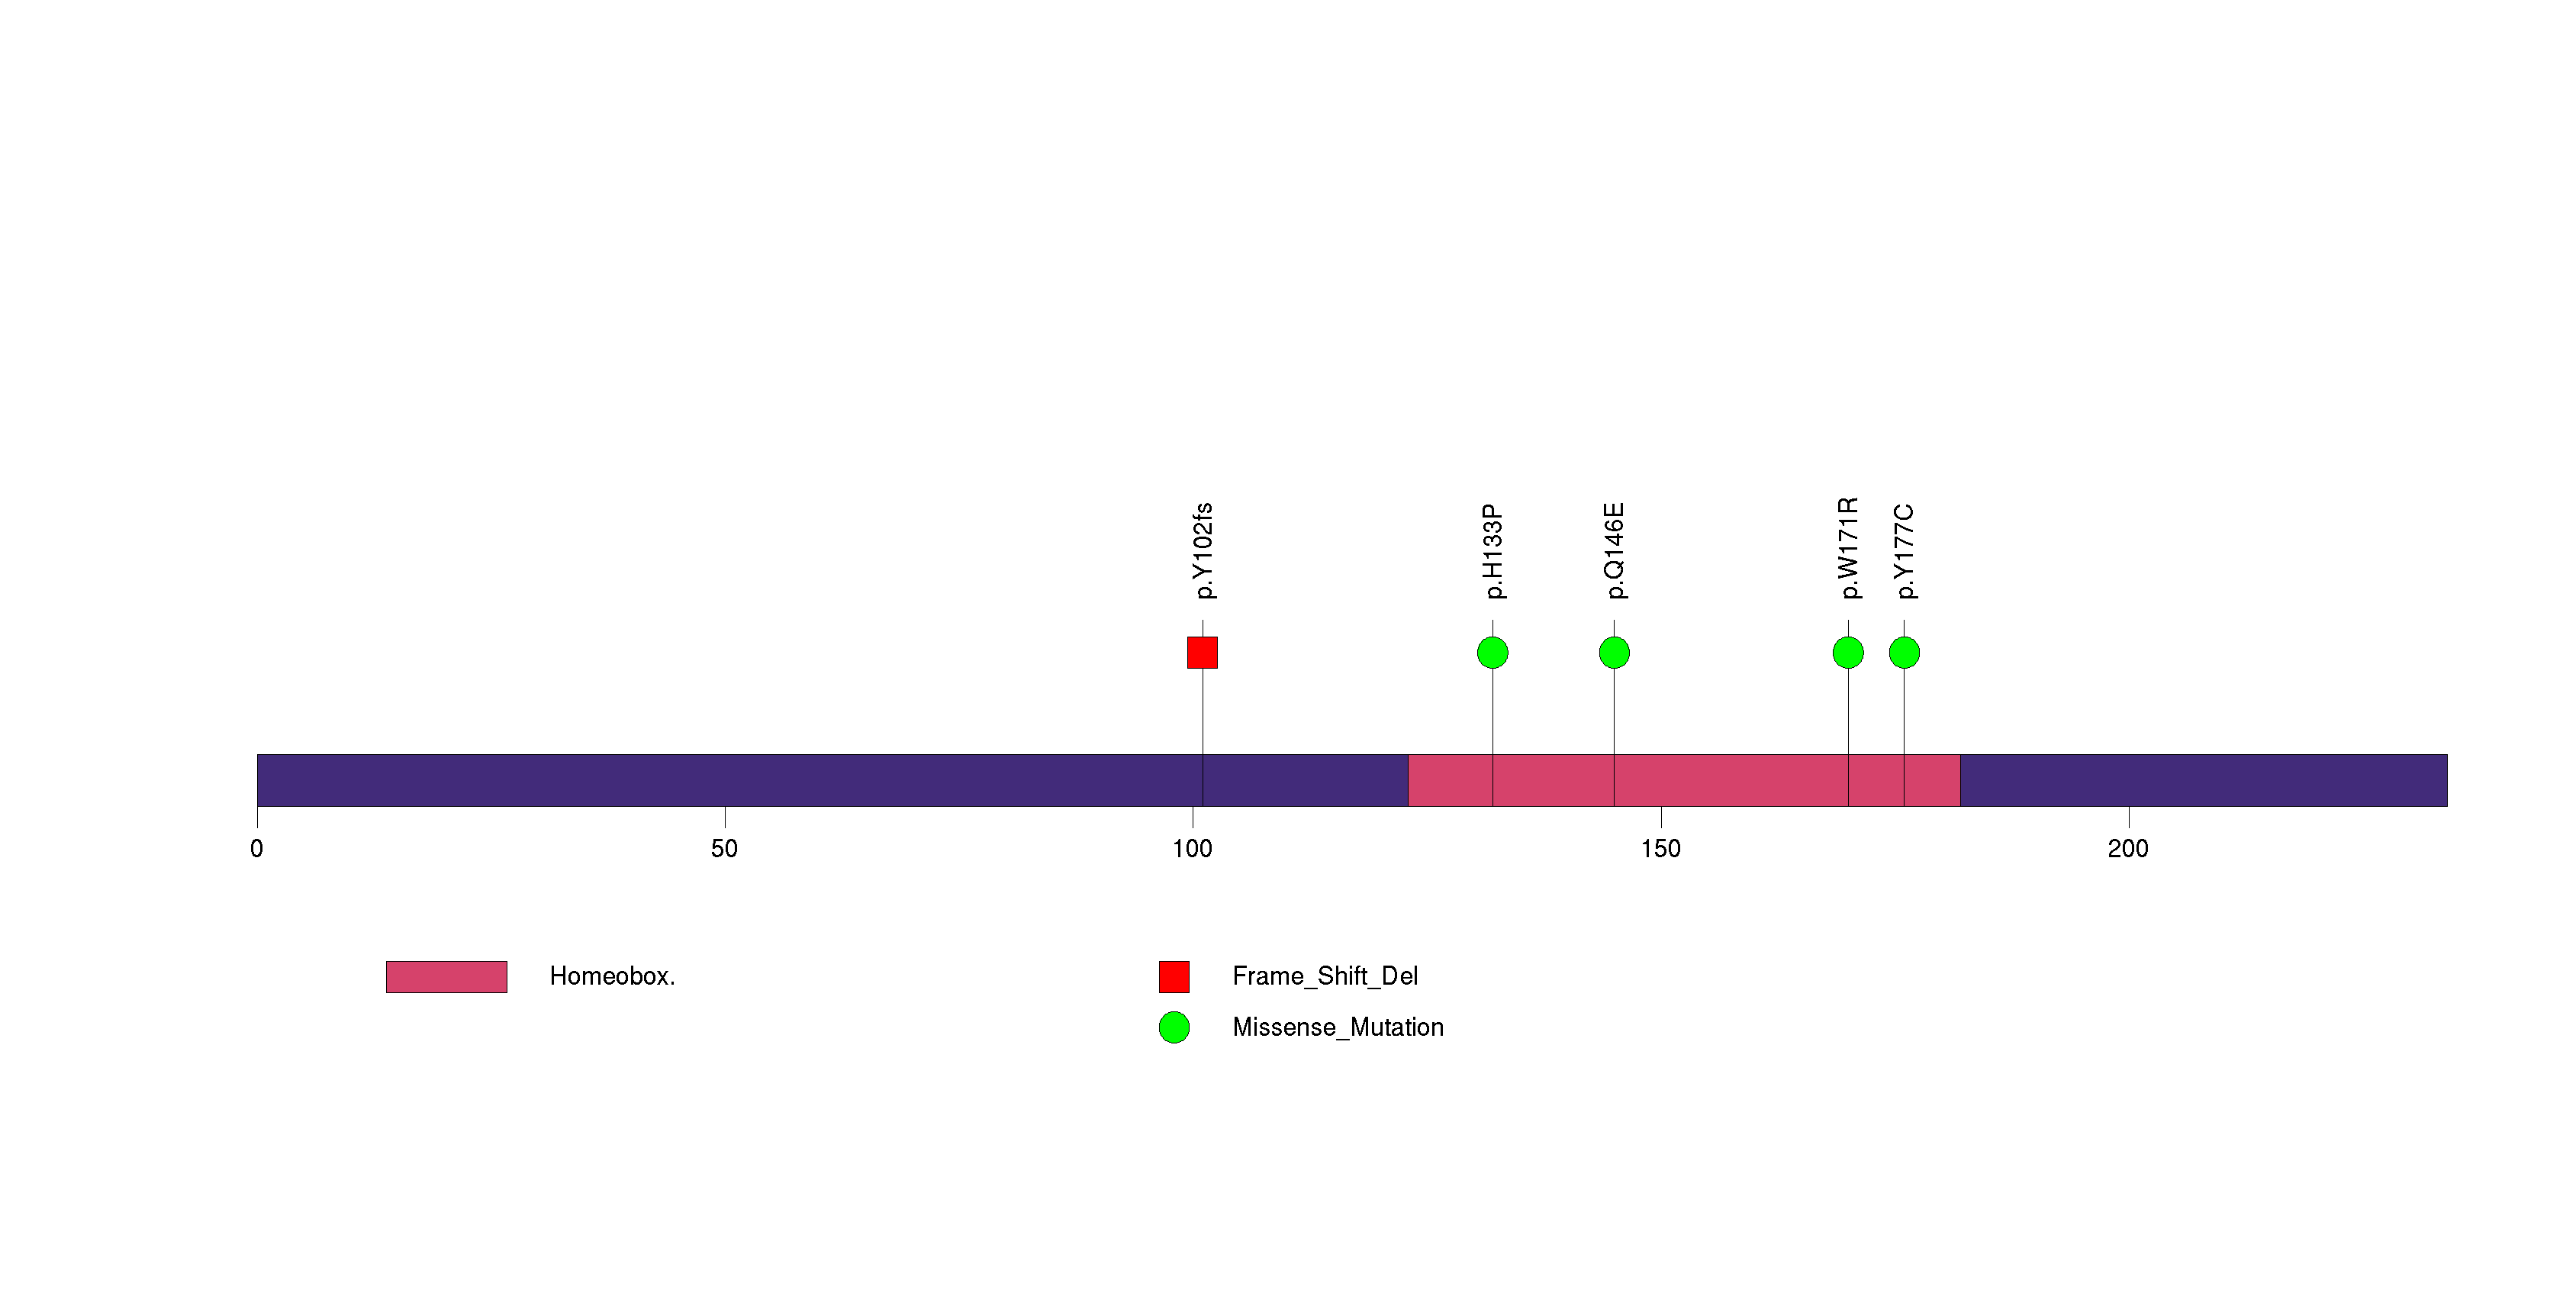
Figure S3. This figure depicts the distribution of mutations and mutation types across the TPTE2 significant gene.
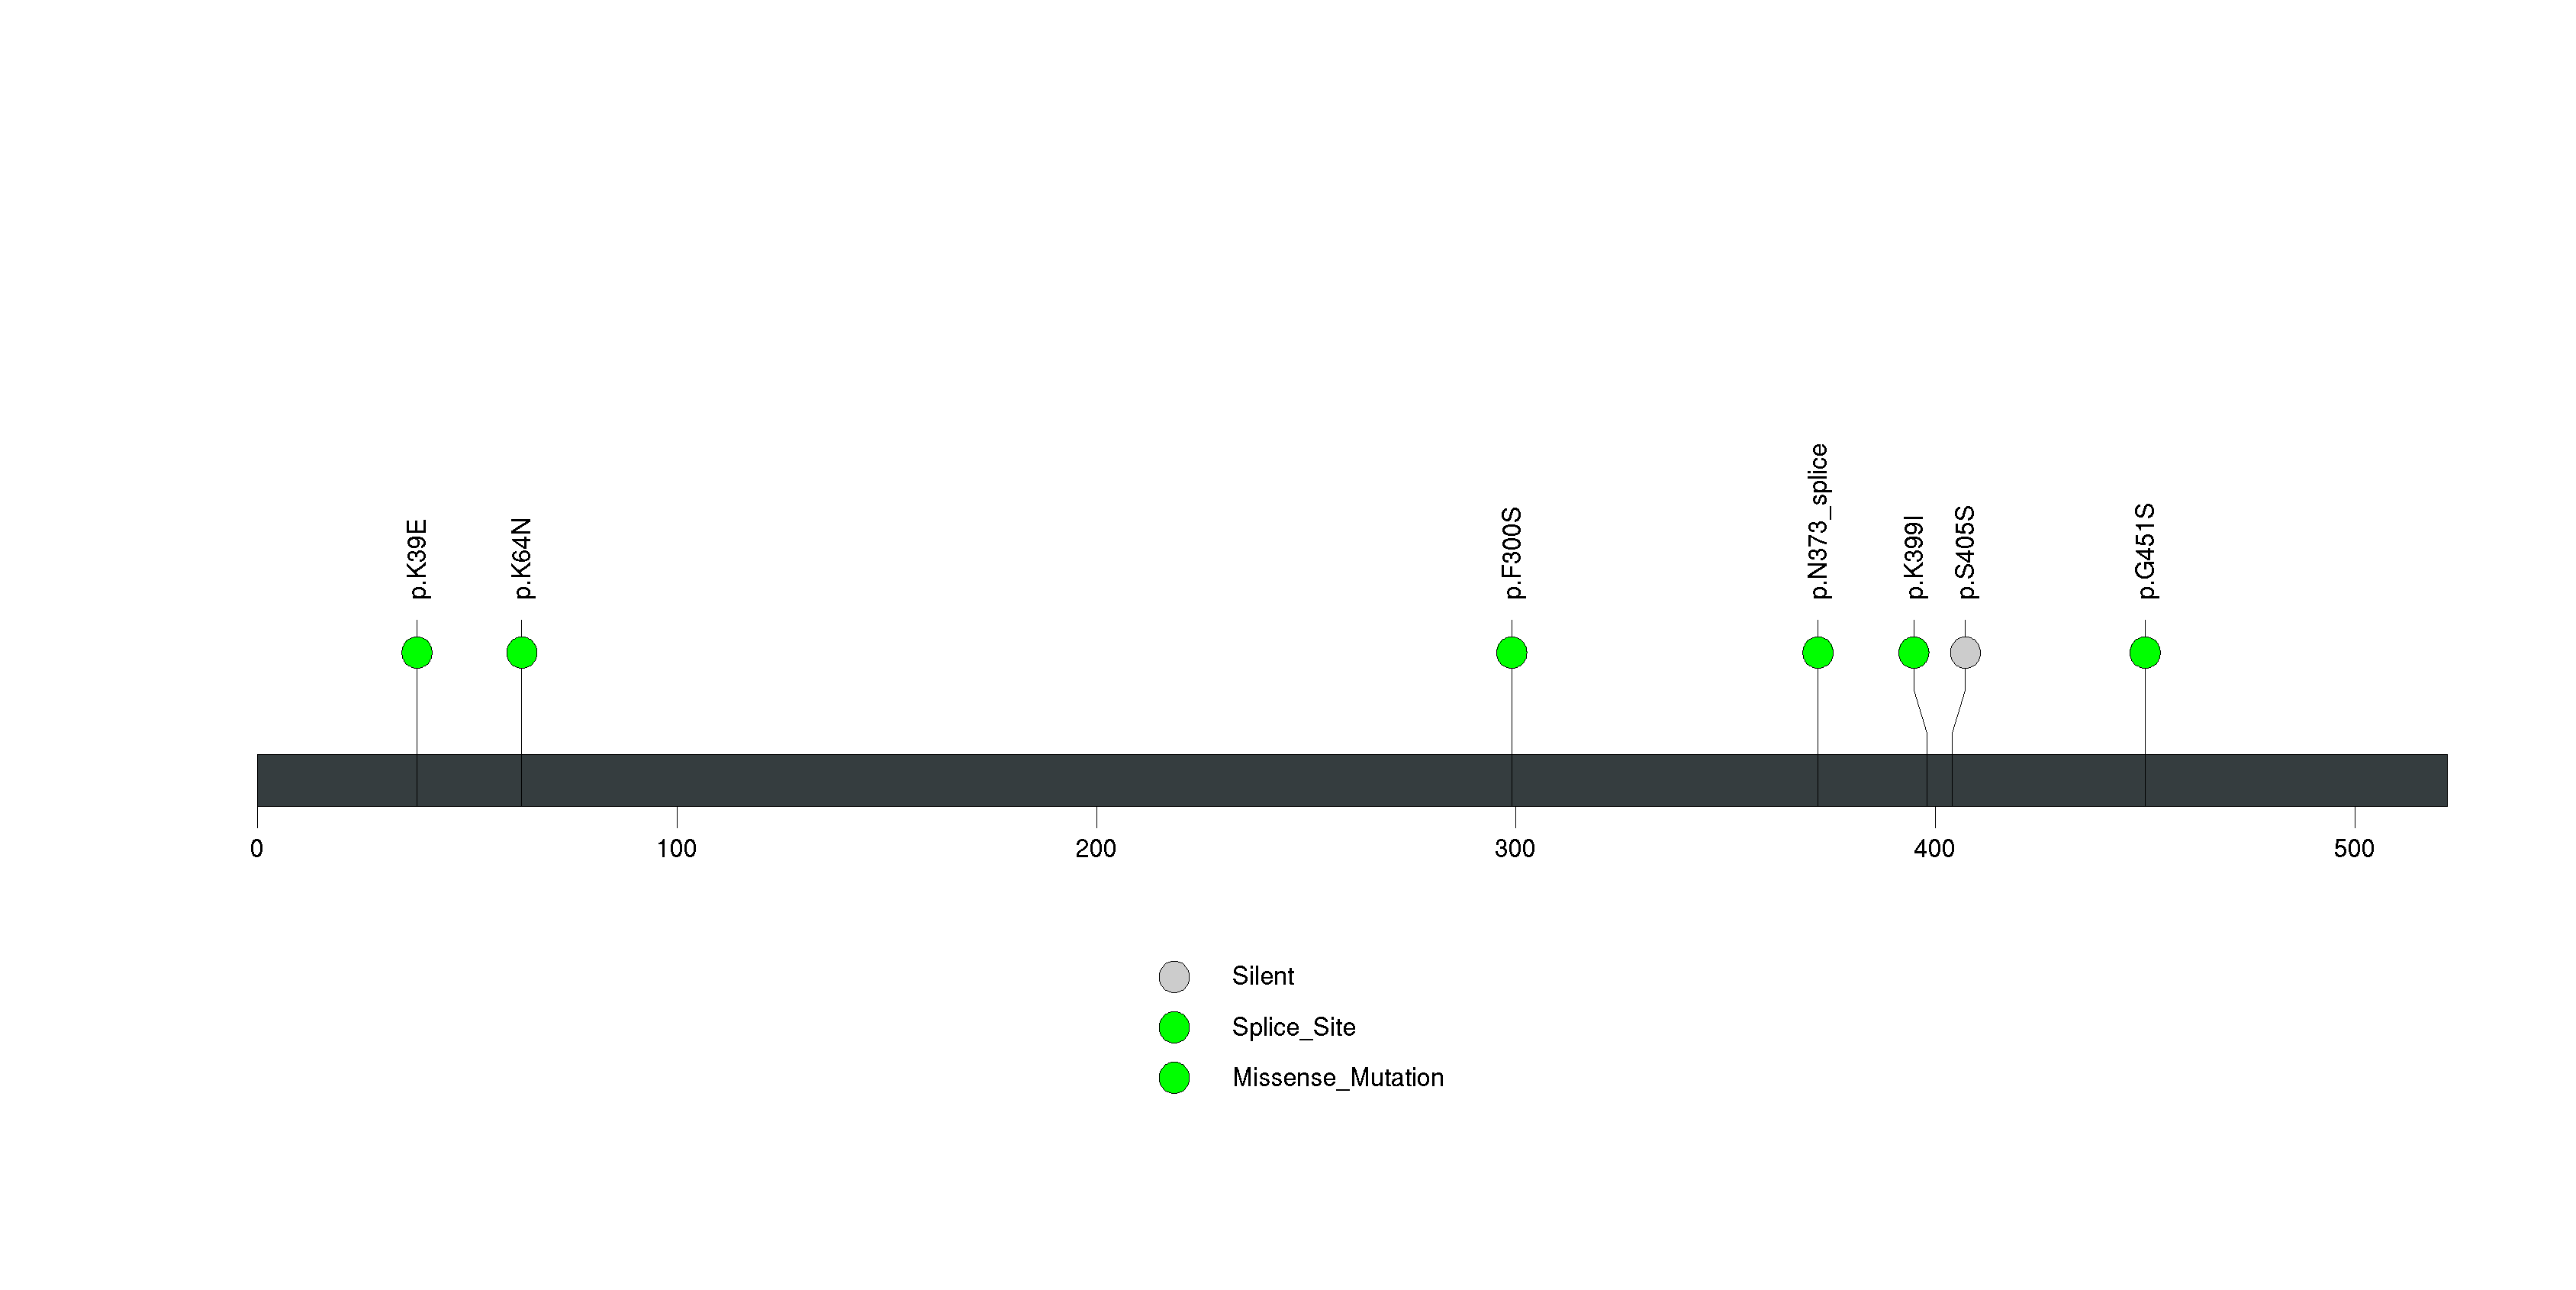
Figure S4. This figure depicts the distribution of mutations and mutation types across the FRG1 significant gene.
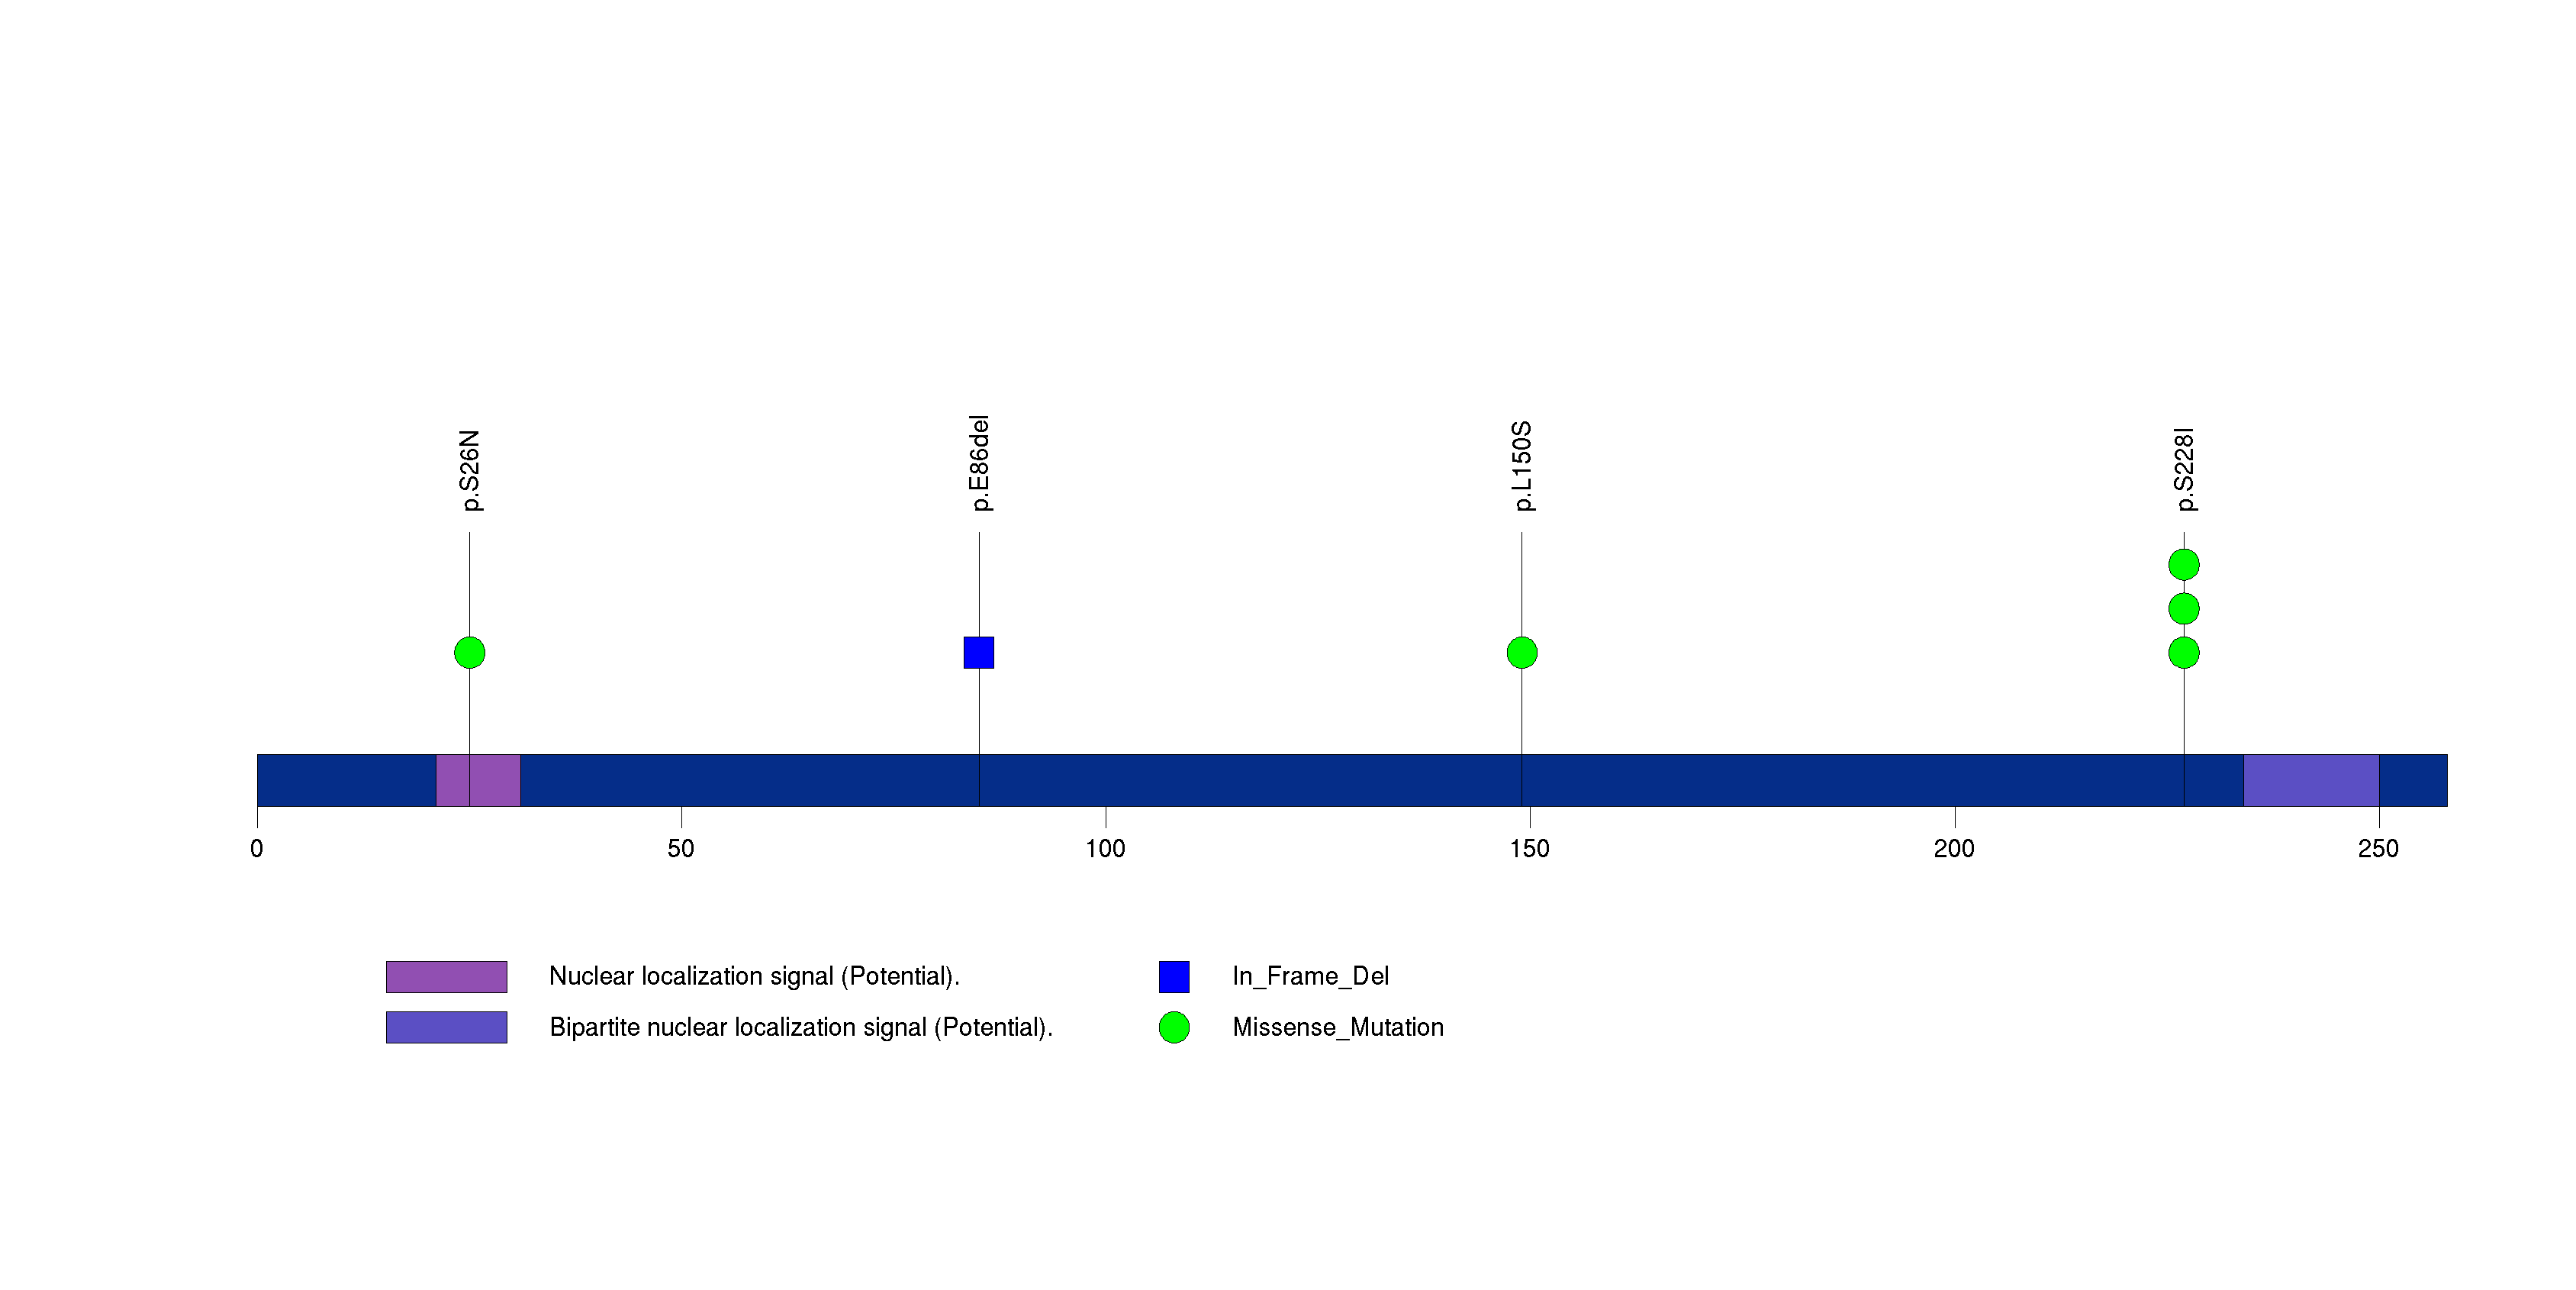
Figure S5. This figure depicts the distribution of mutations and mutation types across the TP53 significant gene.
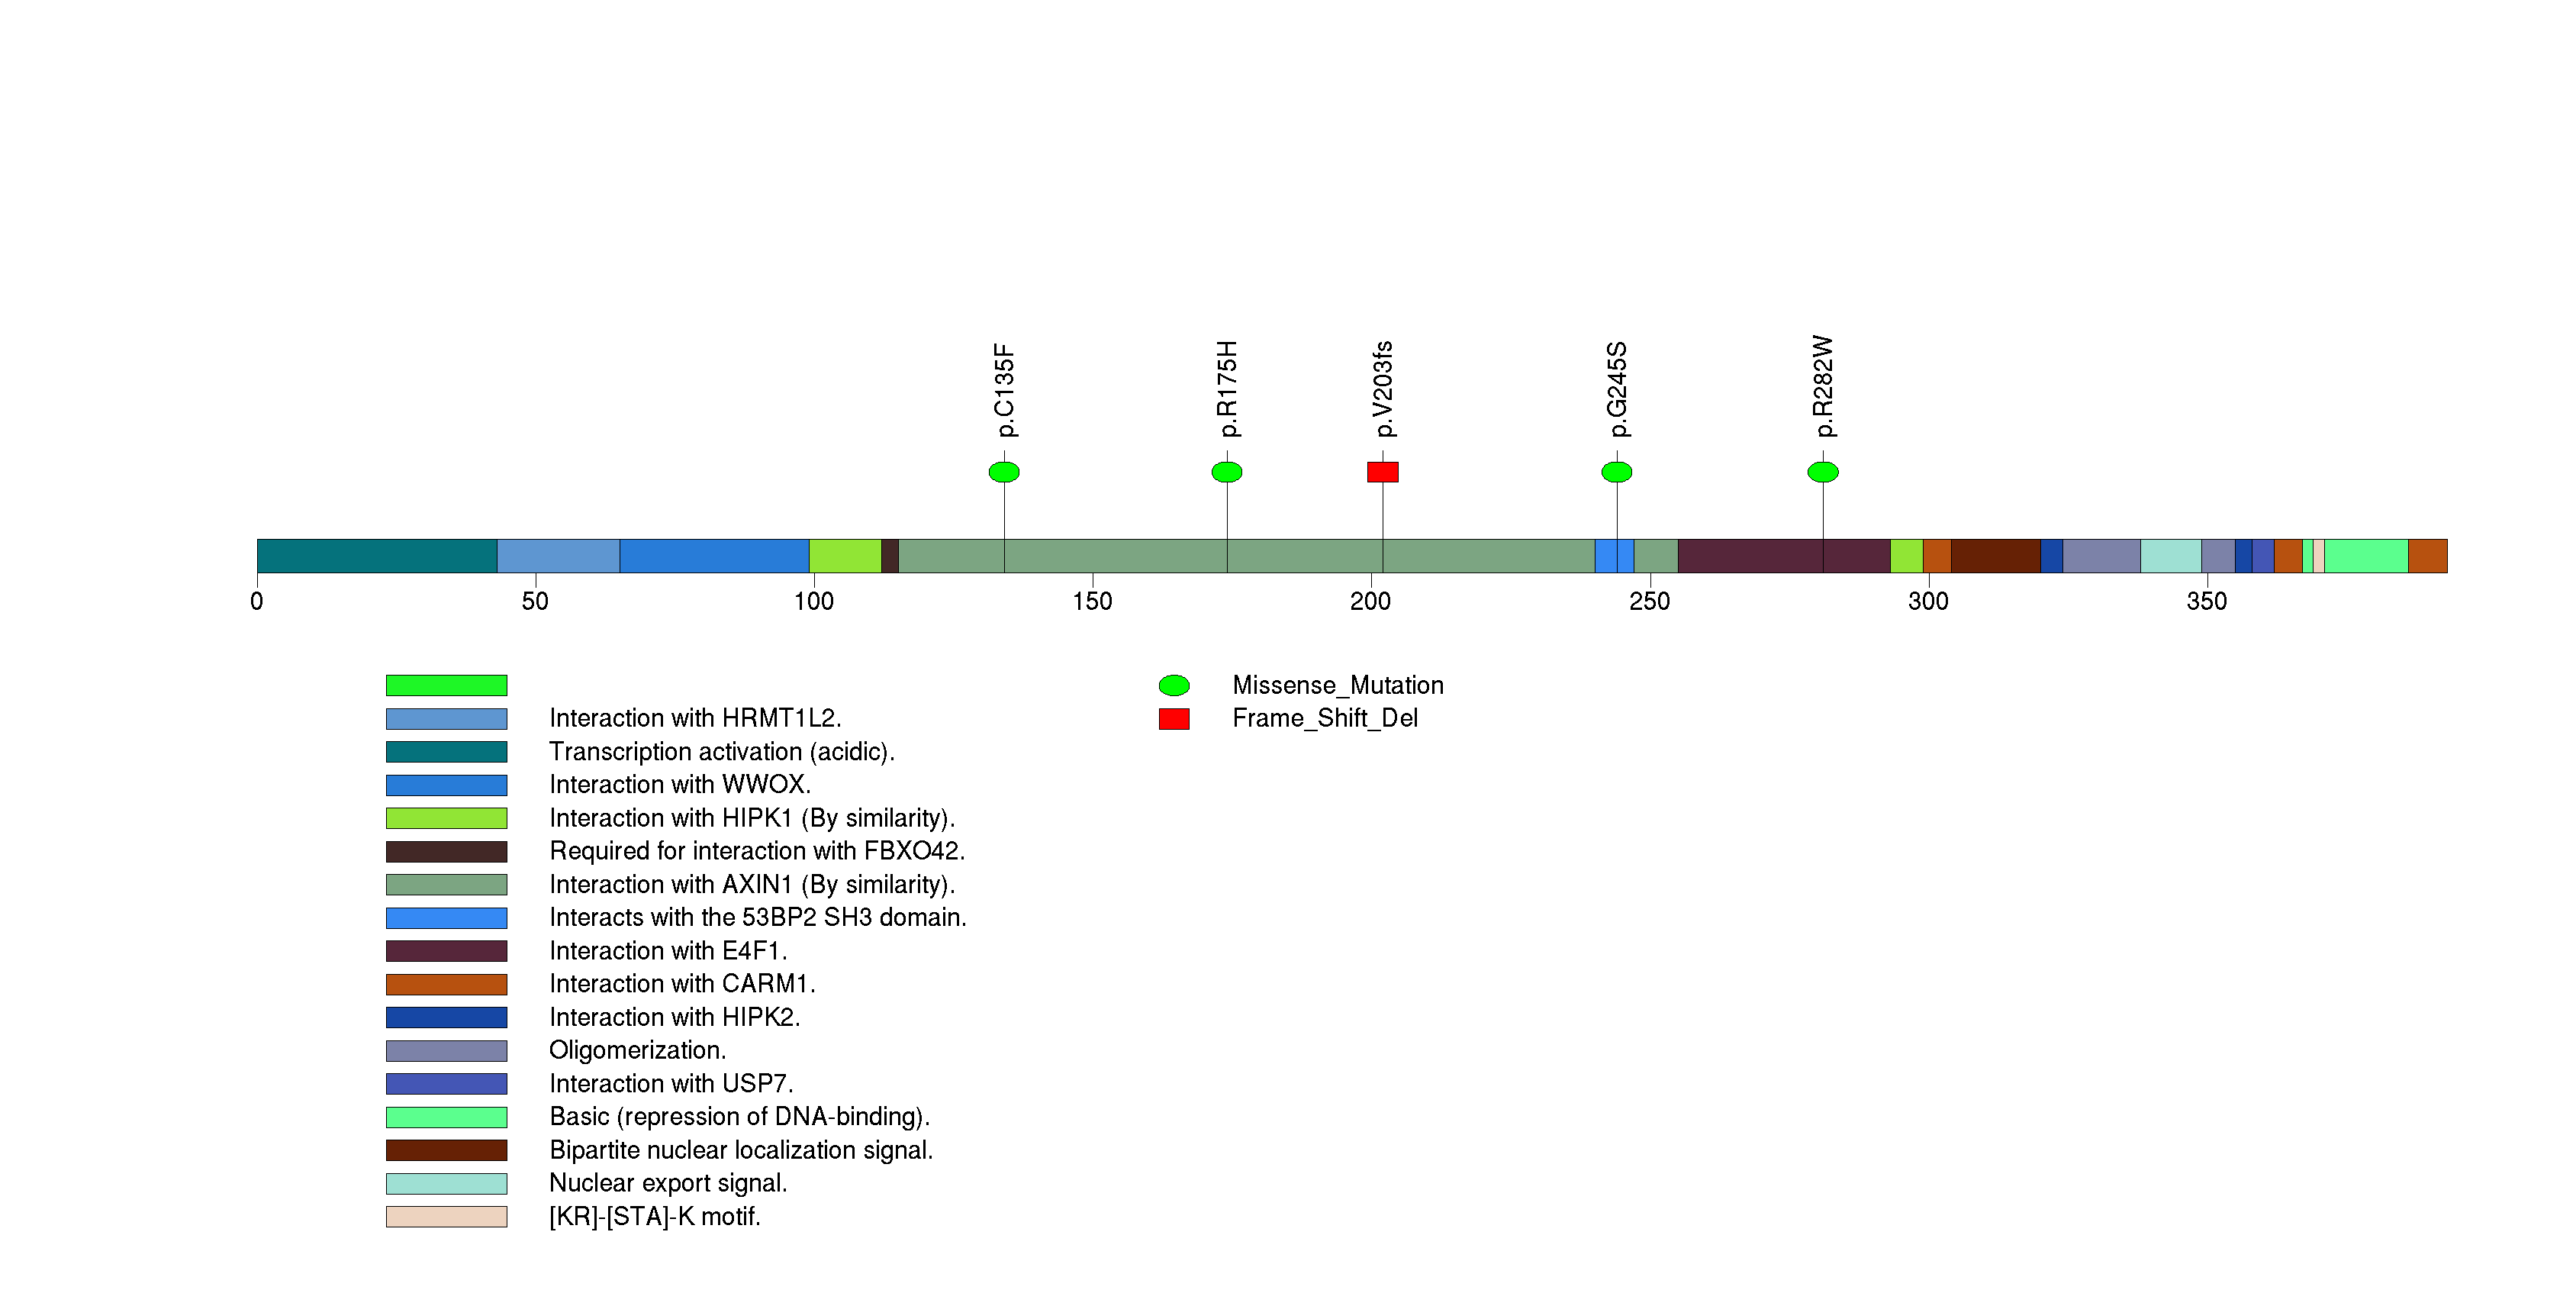
Figure S6. This figure depicts the distribution of mutations and mutation types across the ARHGAP11B significant gene.
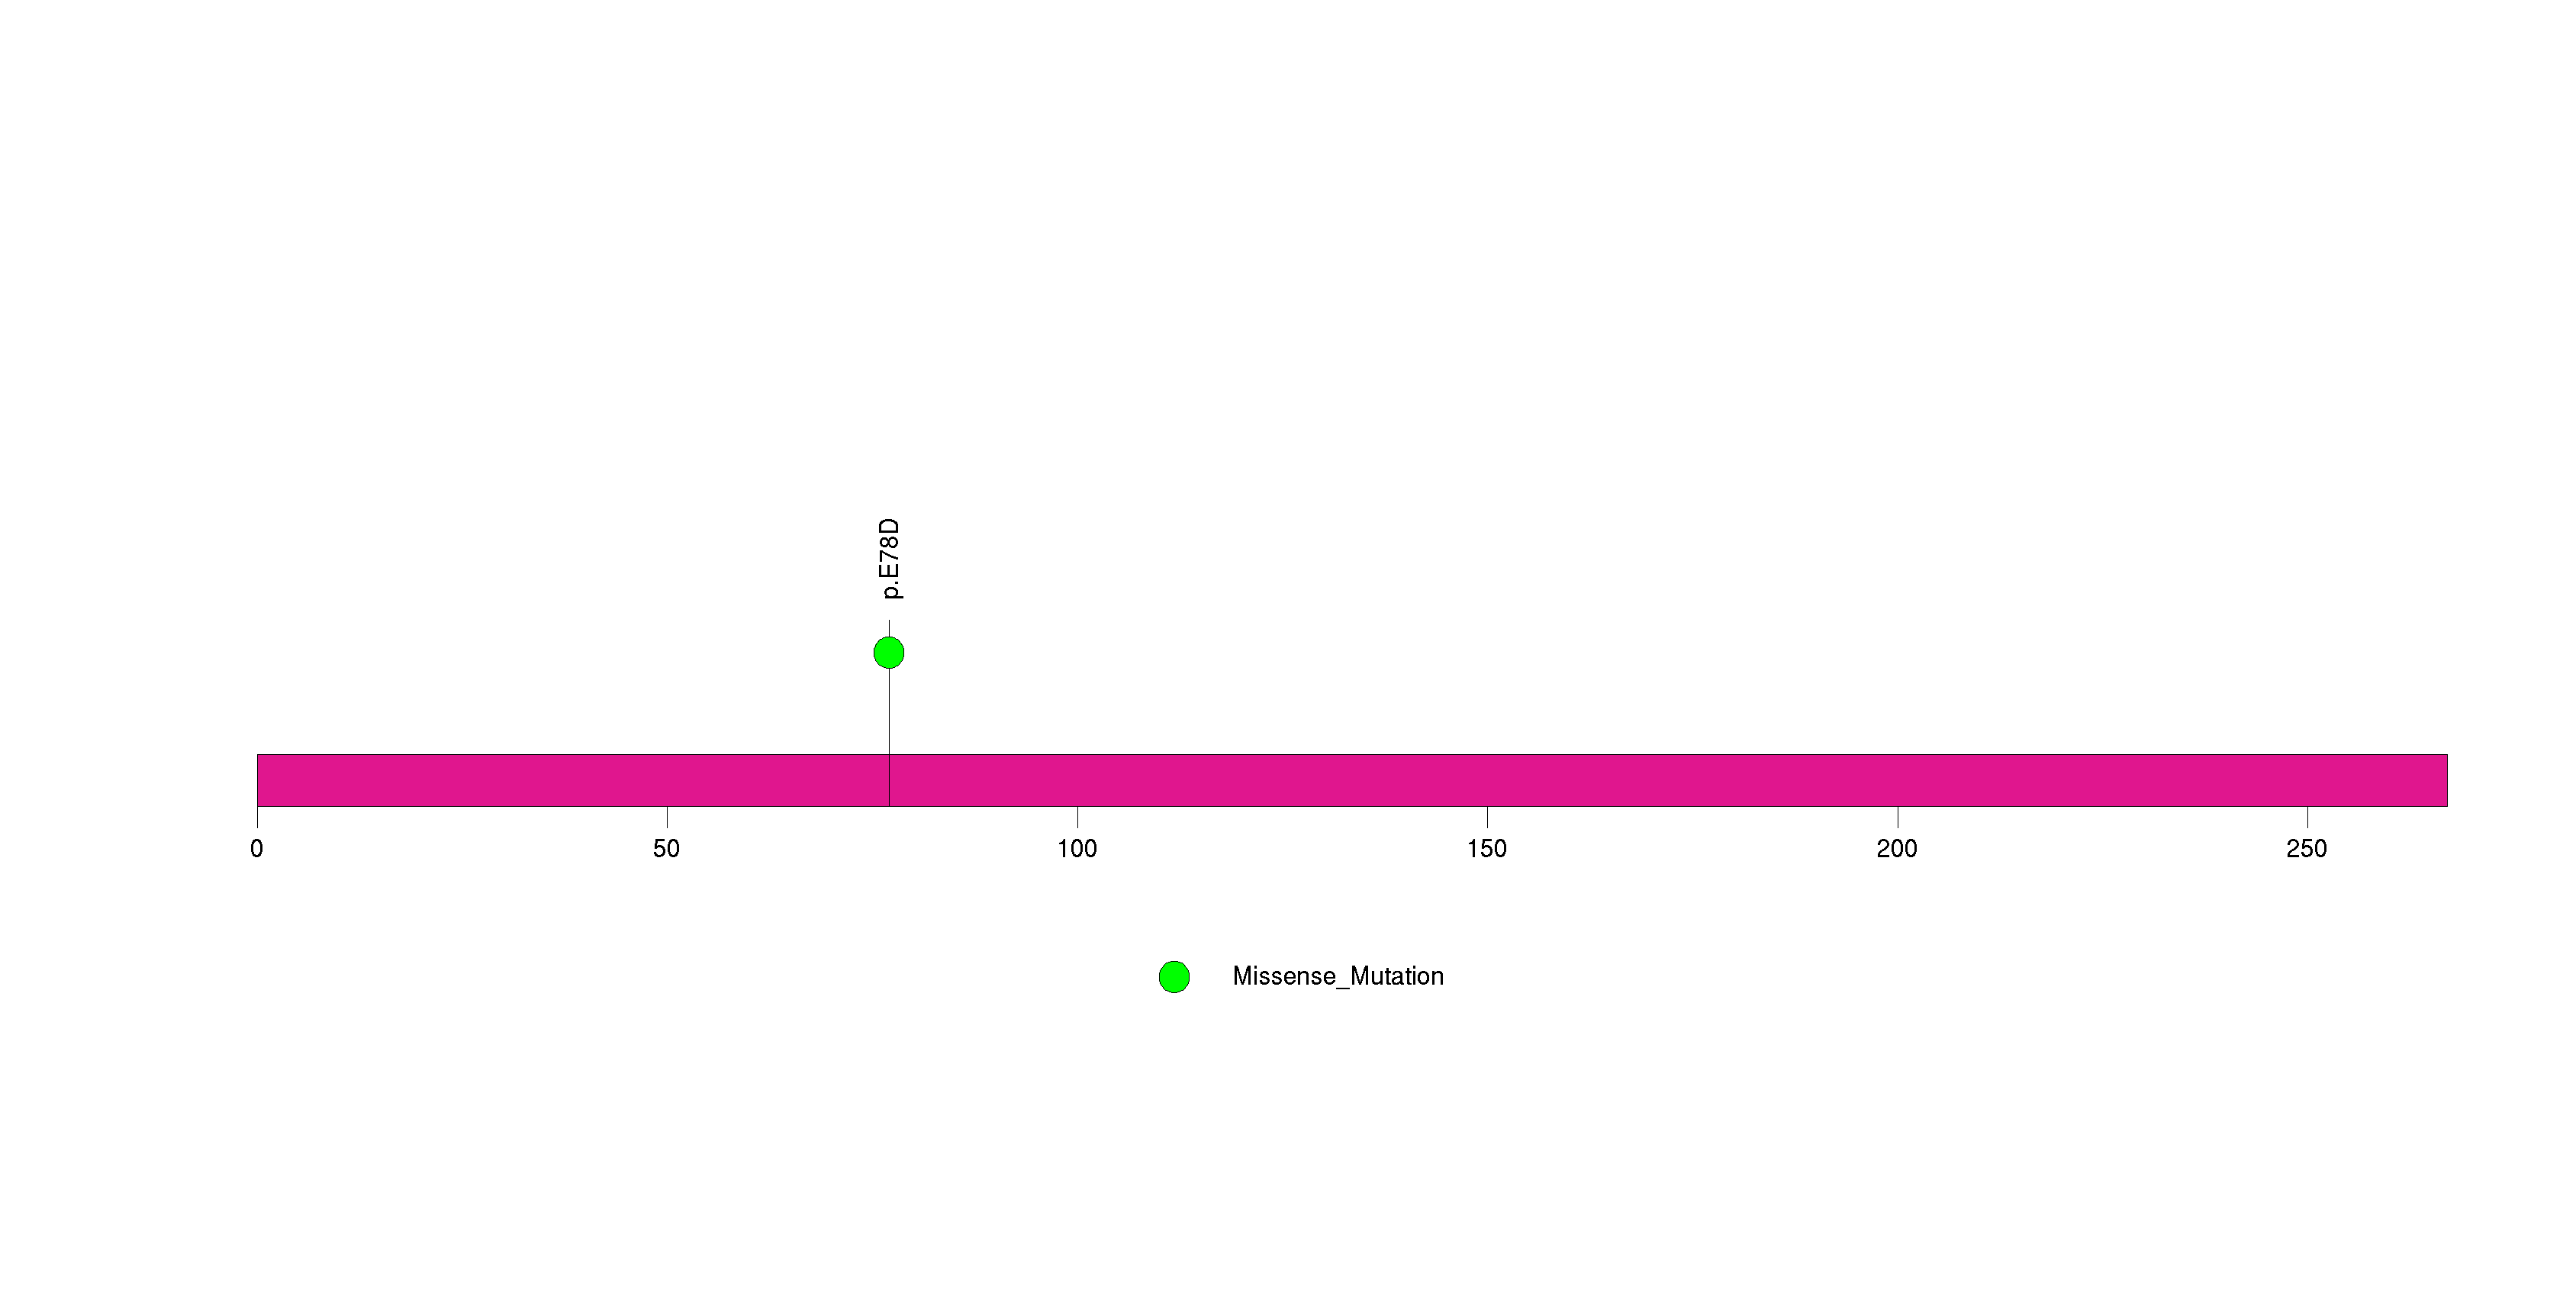
Figure S7. This figure depicts the distribution of mutations and mutation types across the LILRB3 significant gene.
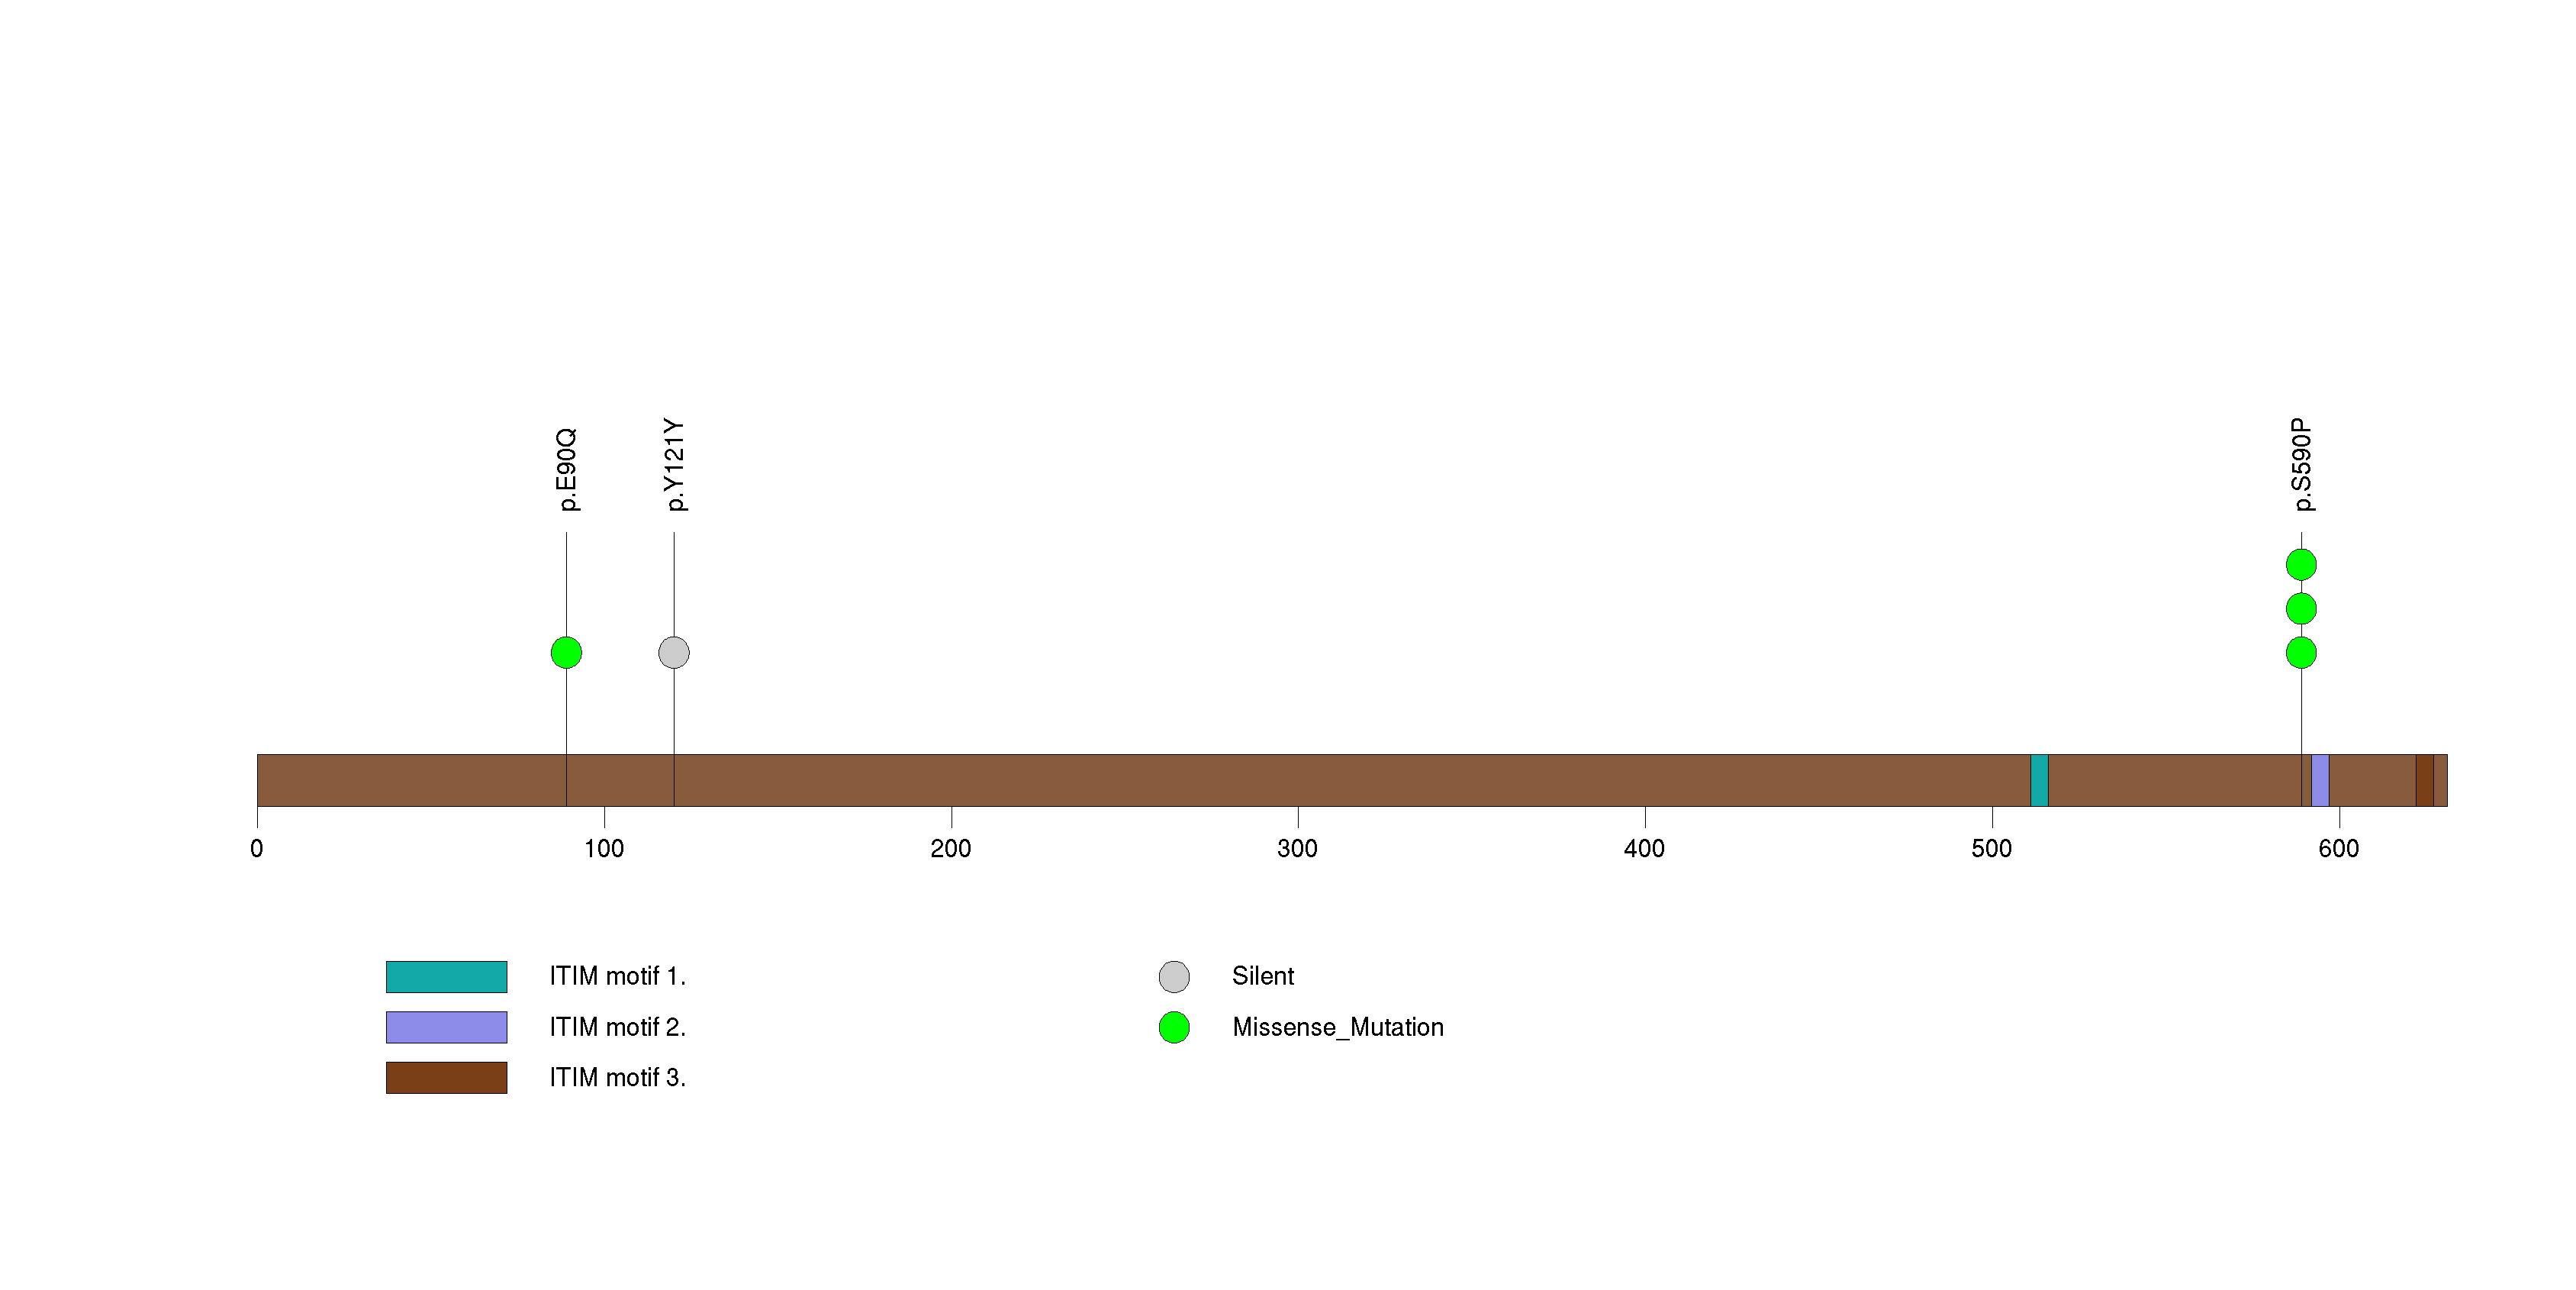
Figure S8. This figure depicts the distribution of mutations and mutation types across the C9orf150 significant gene.
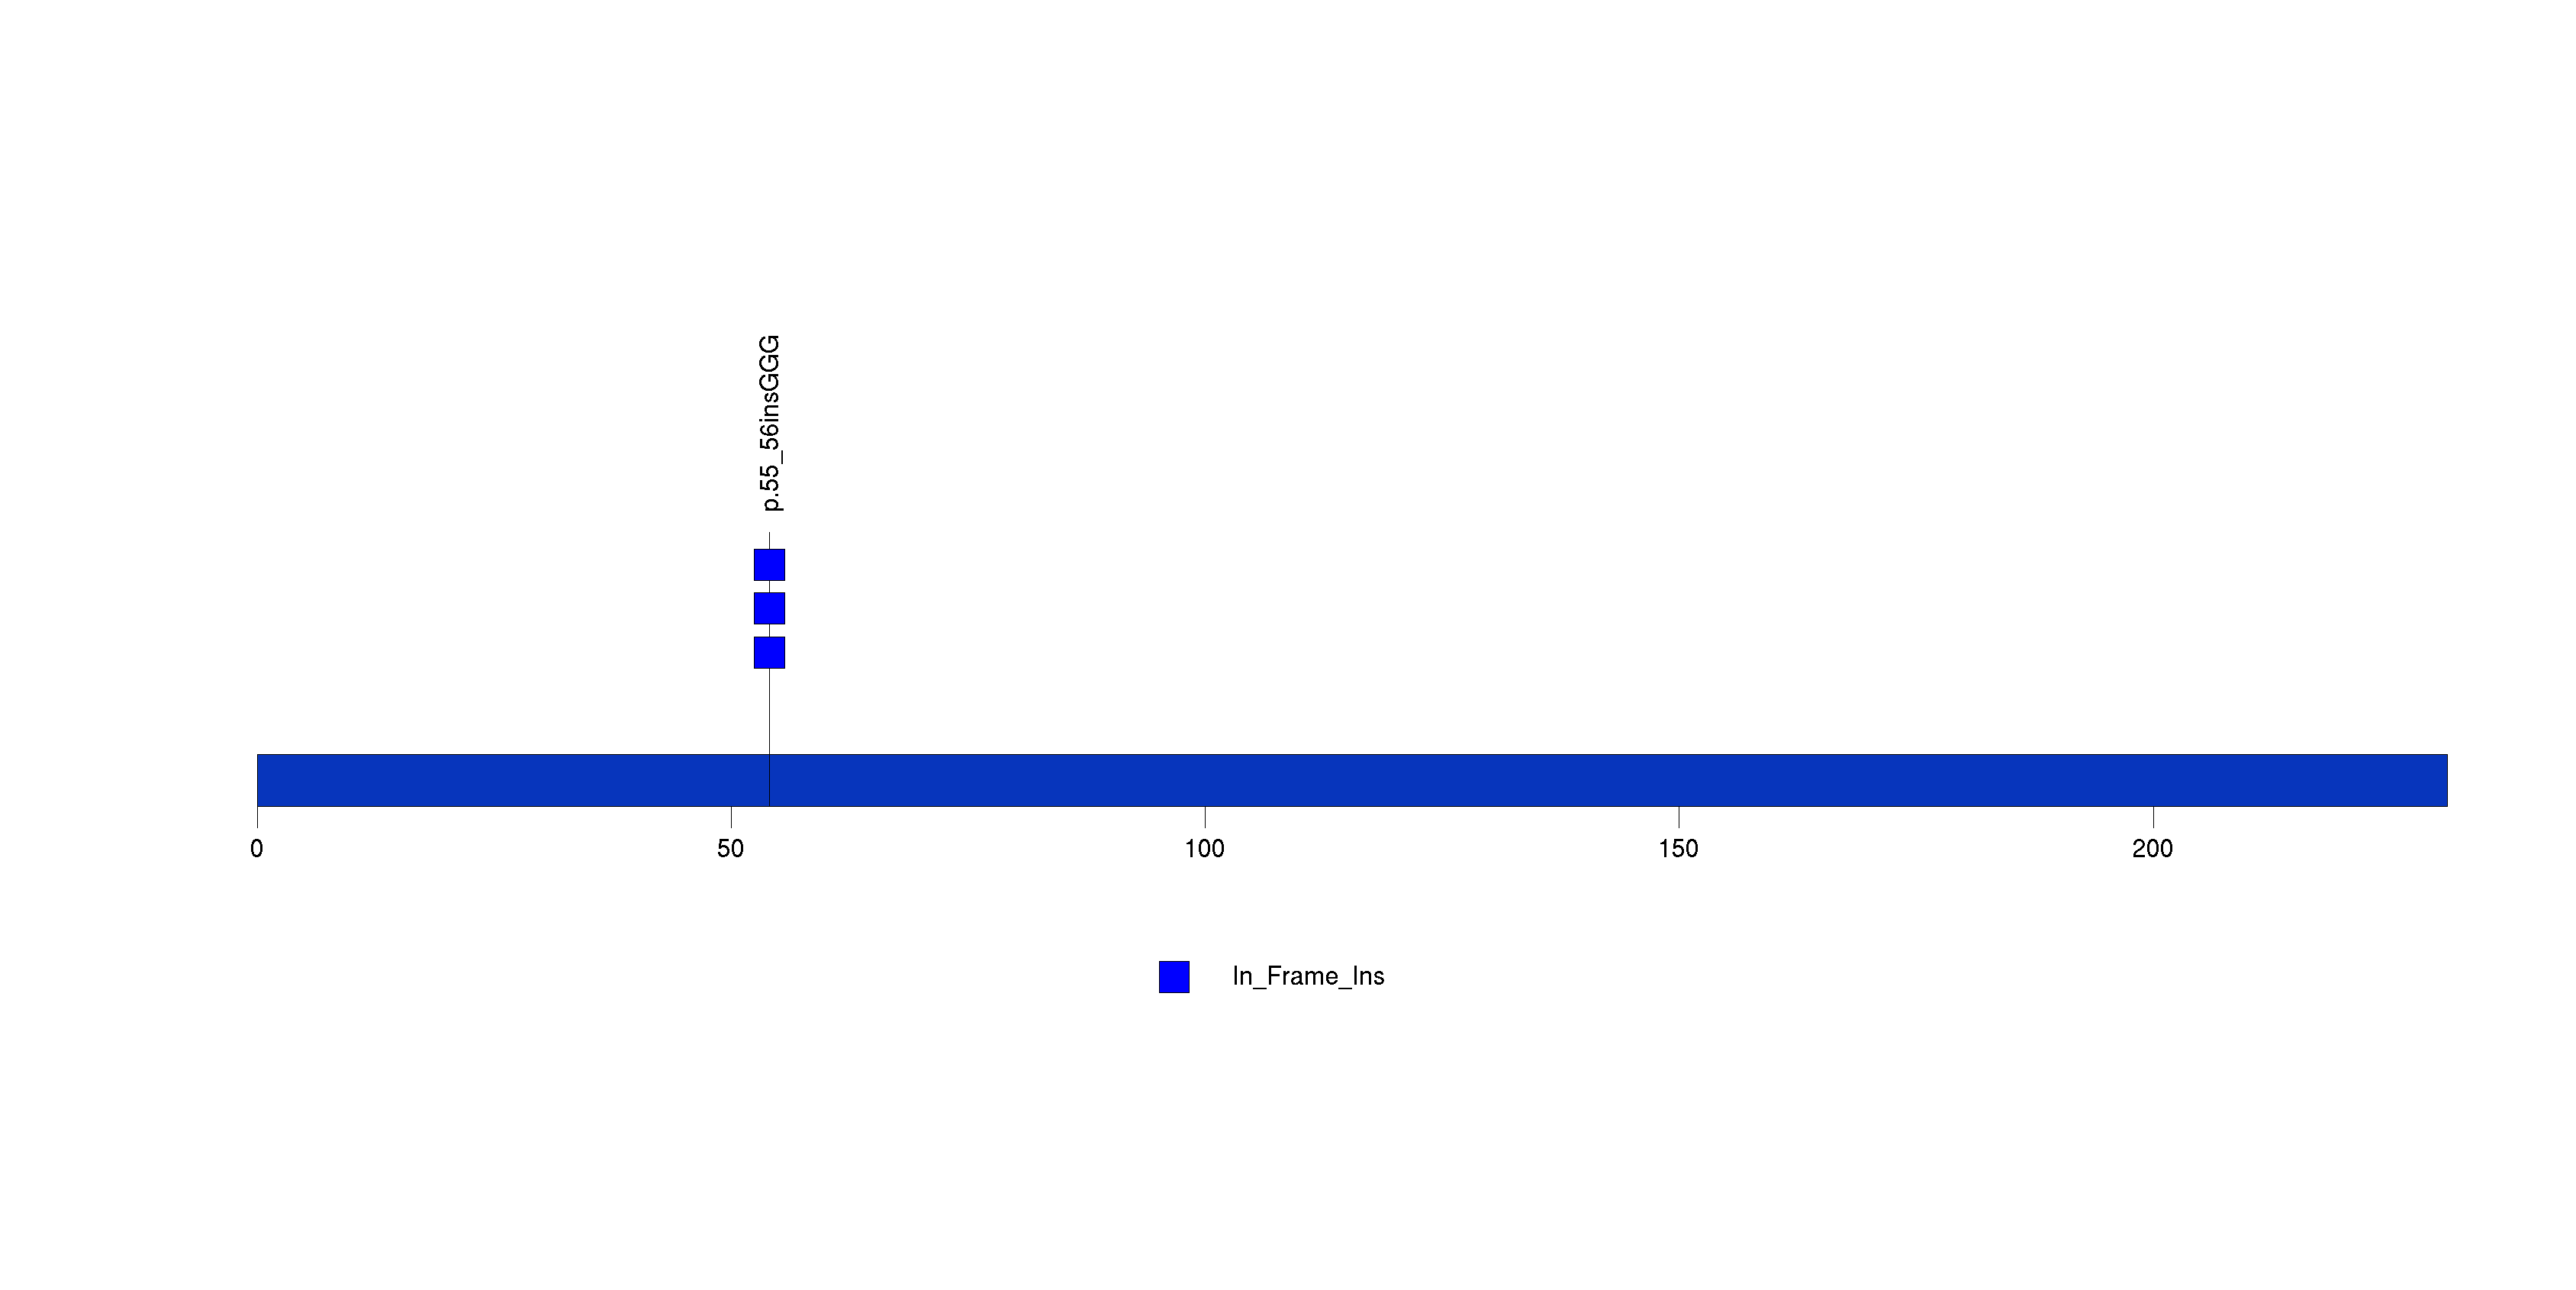
Figure S9. This figure depicts the distribution of mutations and mutation types across the SCAI significant gene.
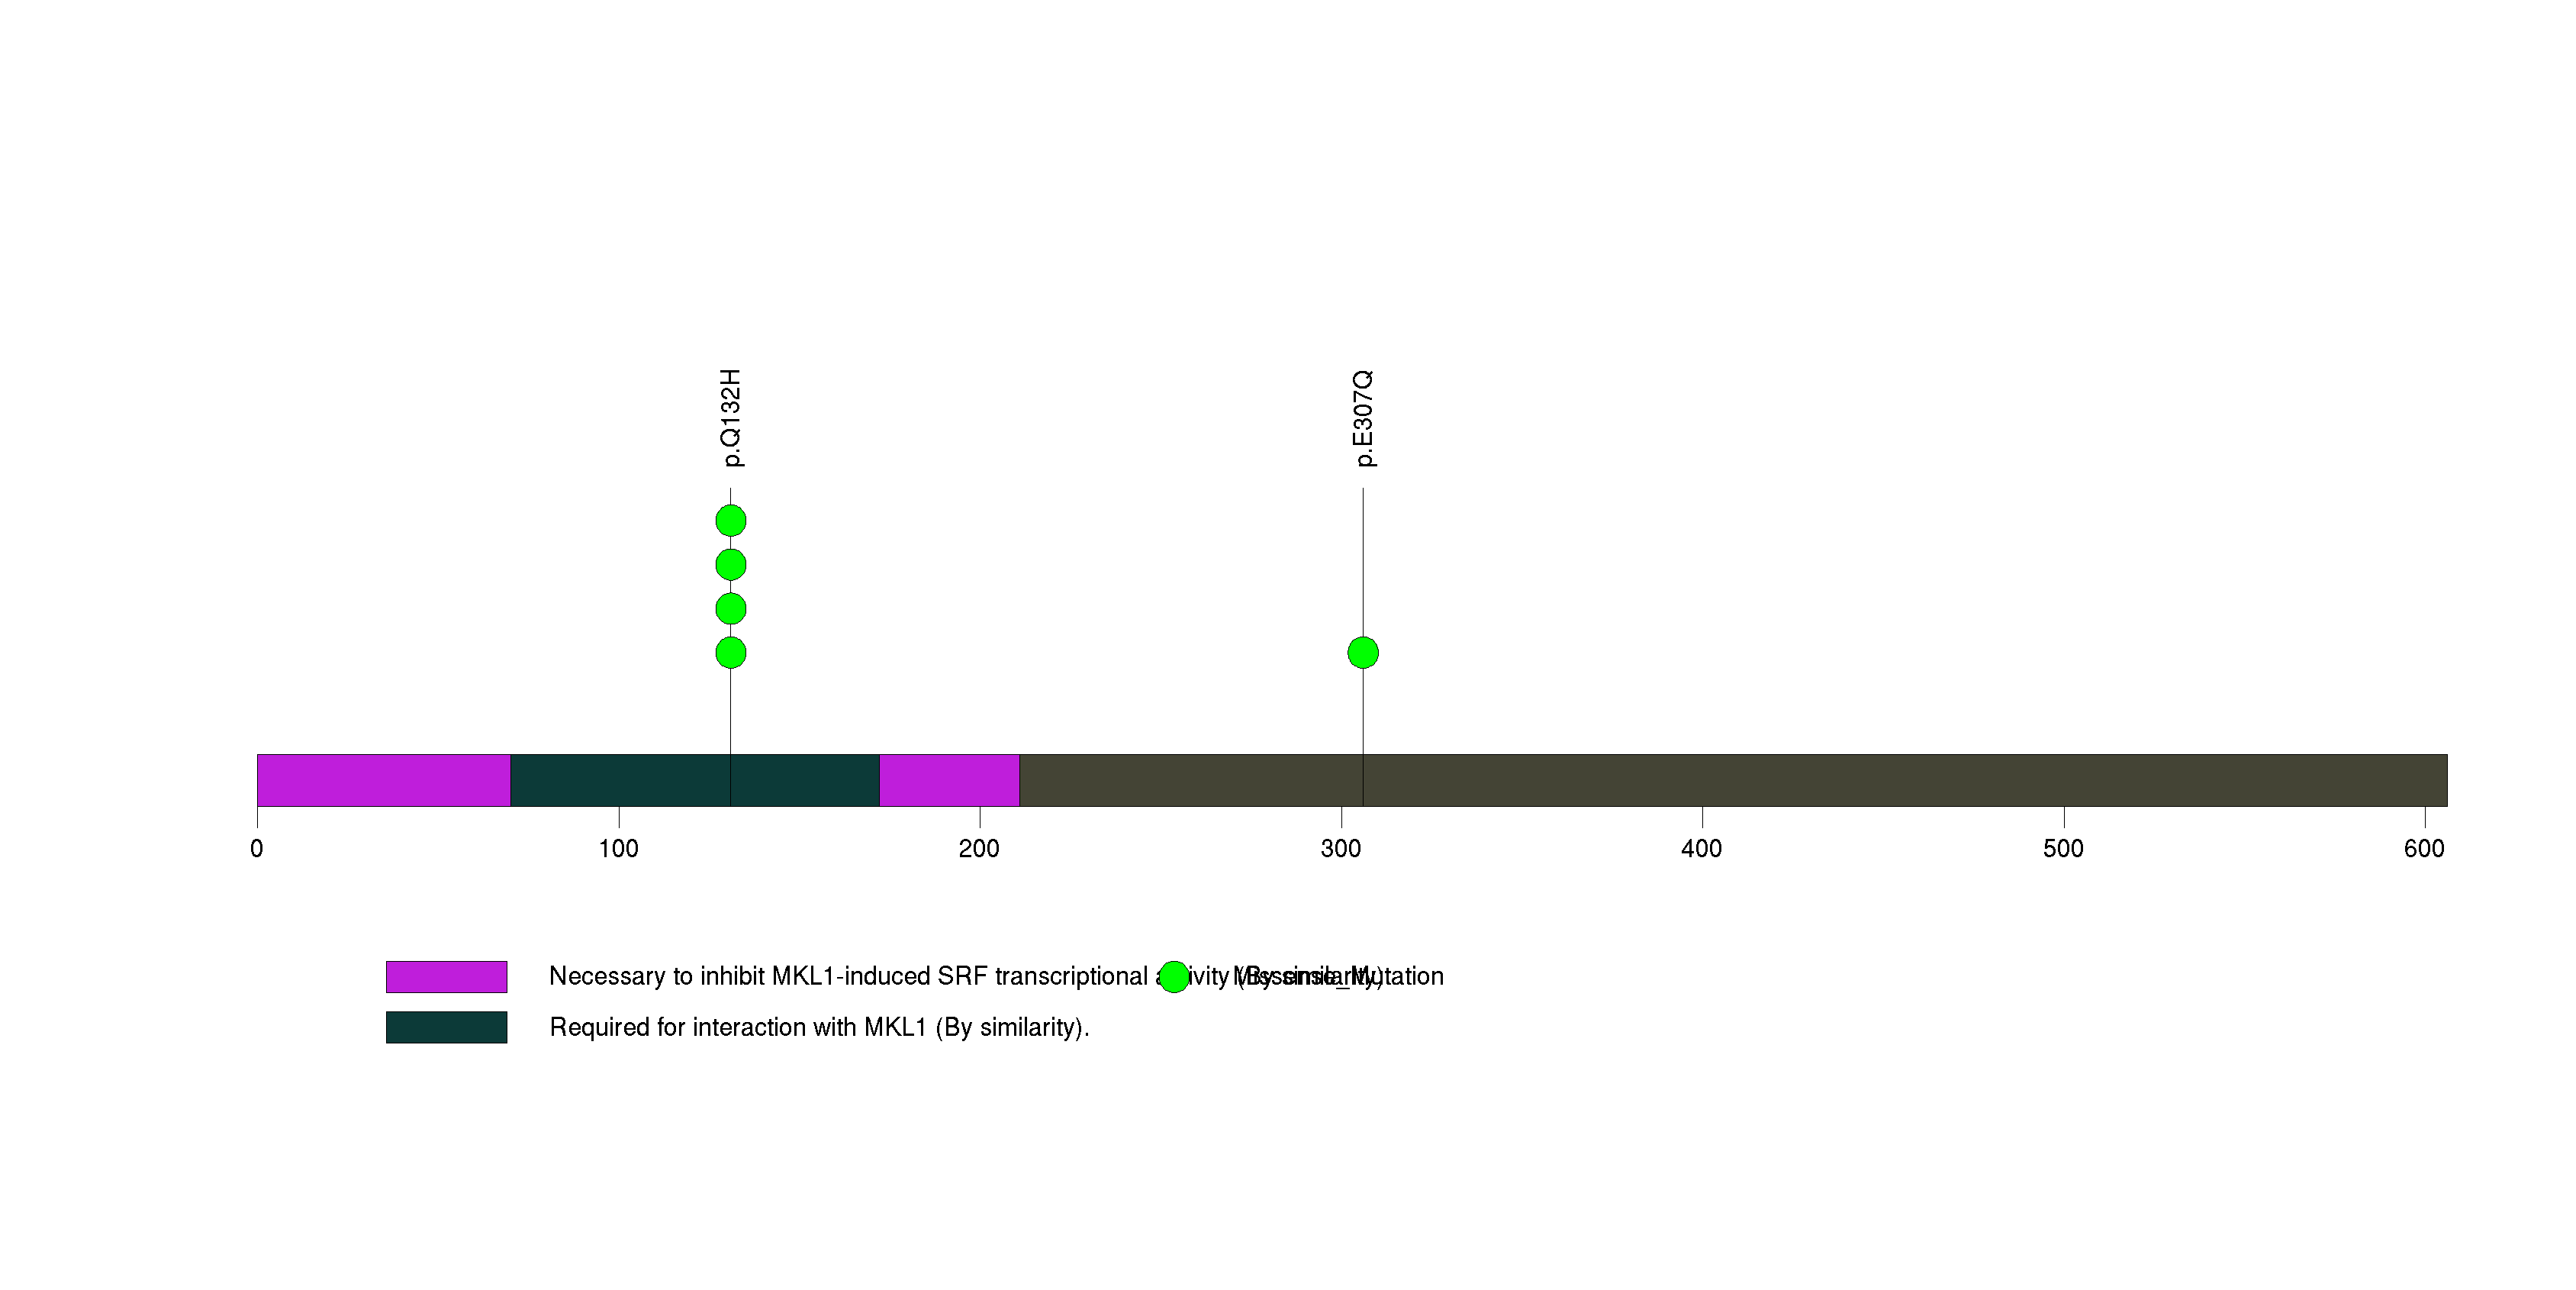
Figure S10. This figure depicts the distribution of mutations and mutation types across the PRR21 significant gene.
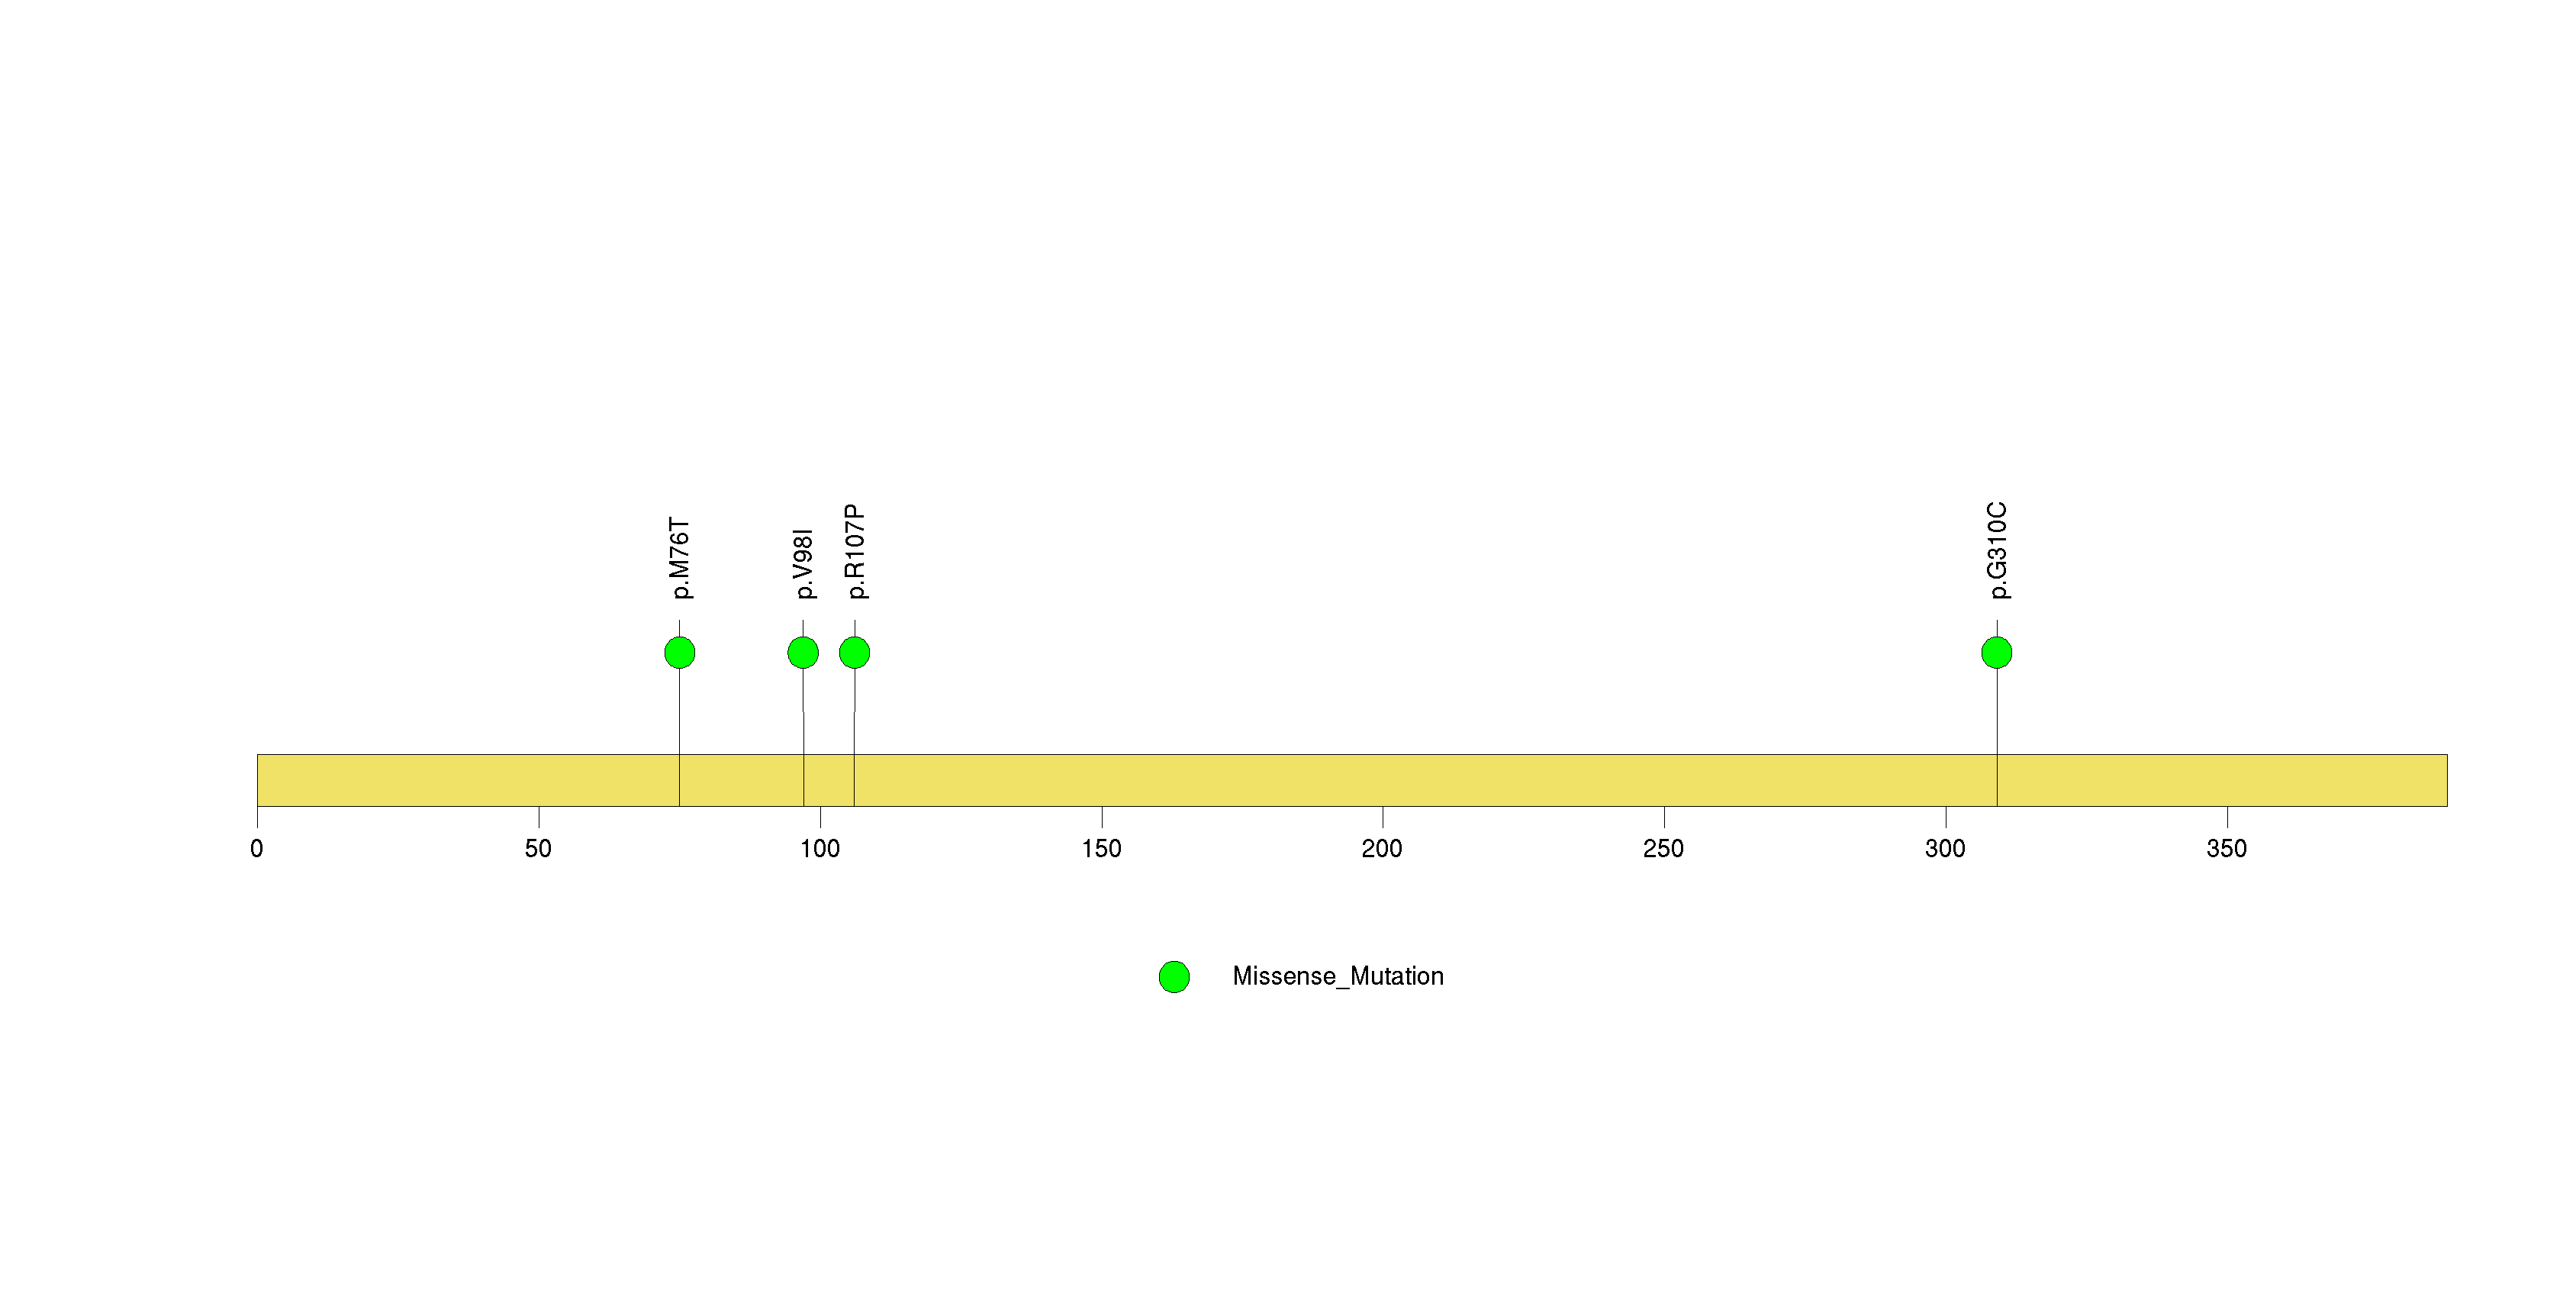
Figure S11. This figure depicts the distribution of mutations and mutation types across the SPOP significant gene.
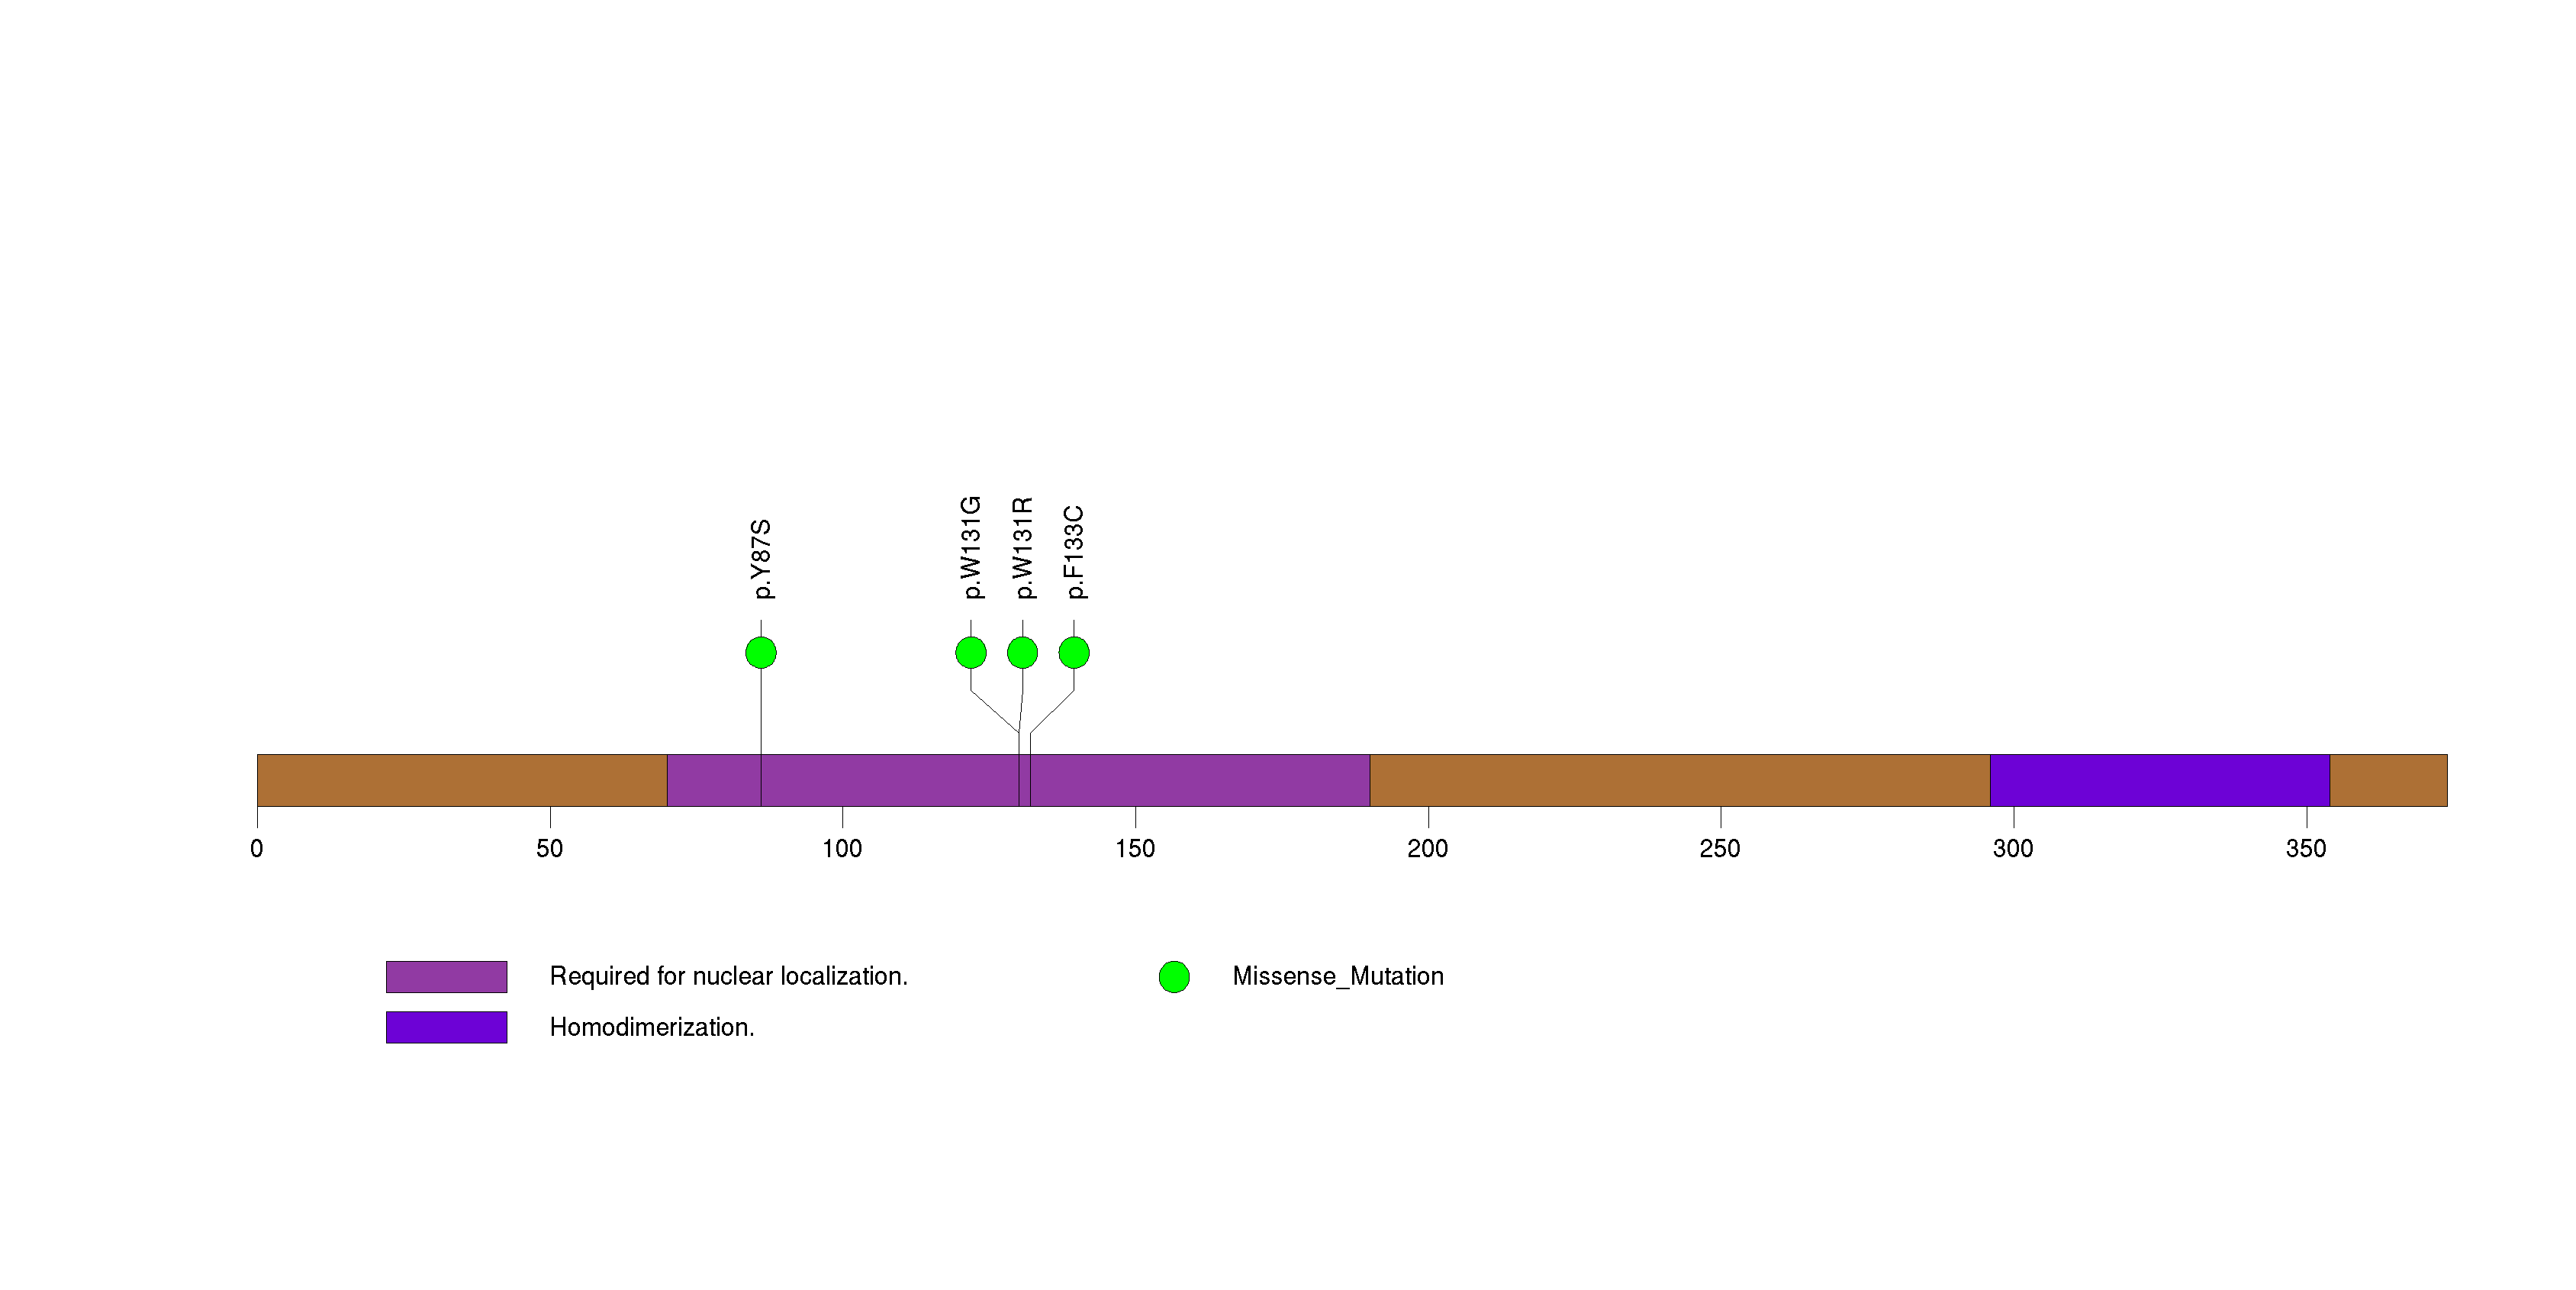
Figure S12. This figure depicts the distribution of mutations and mutation types across the ZNF98 significant gene.
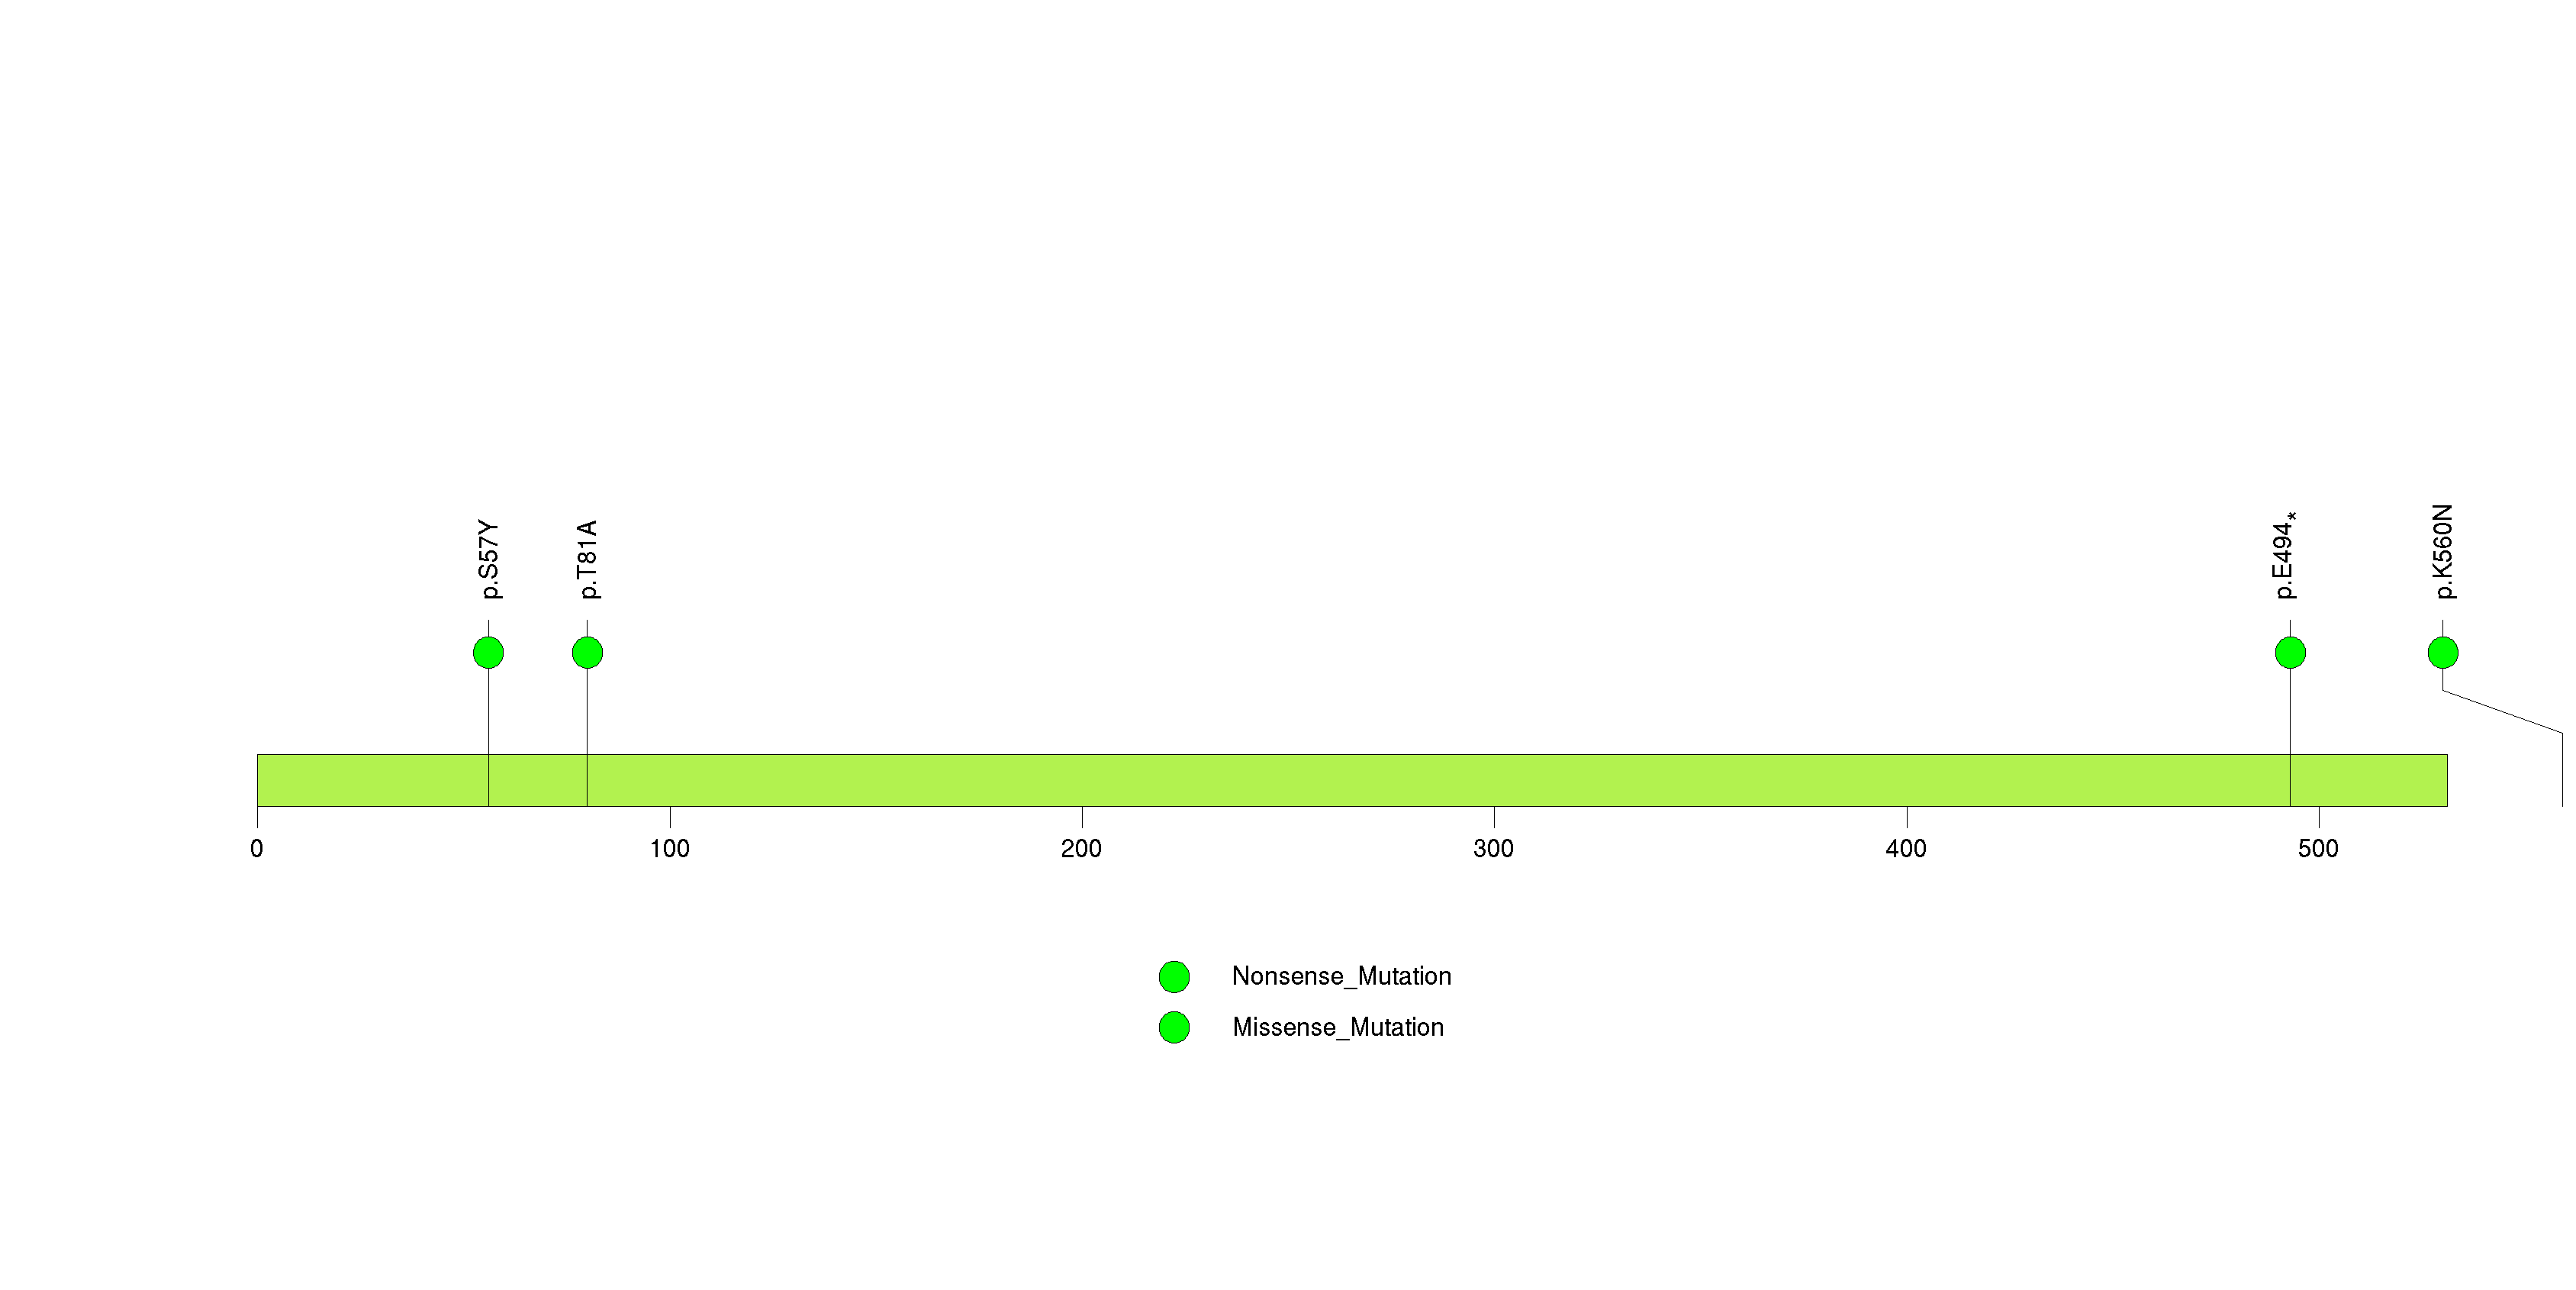
Figure S13. This figure depicts the distribution of mutations and mutation types across the OR6N1 significant gene.
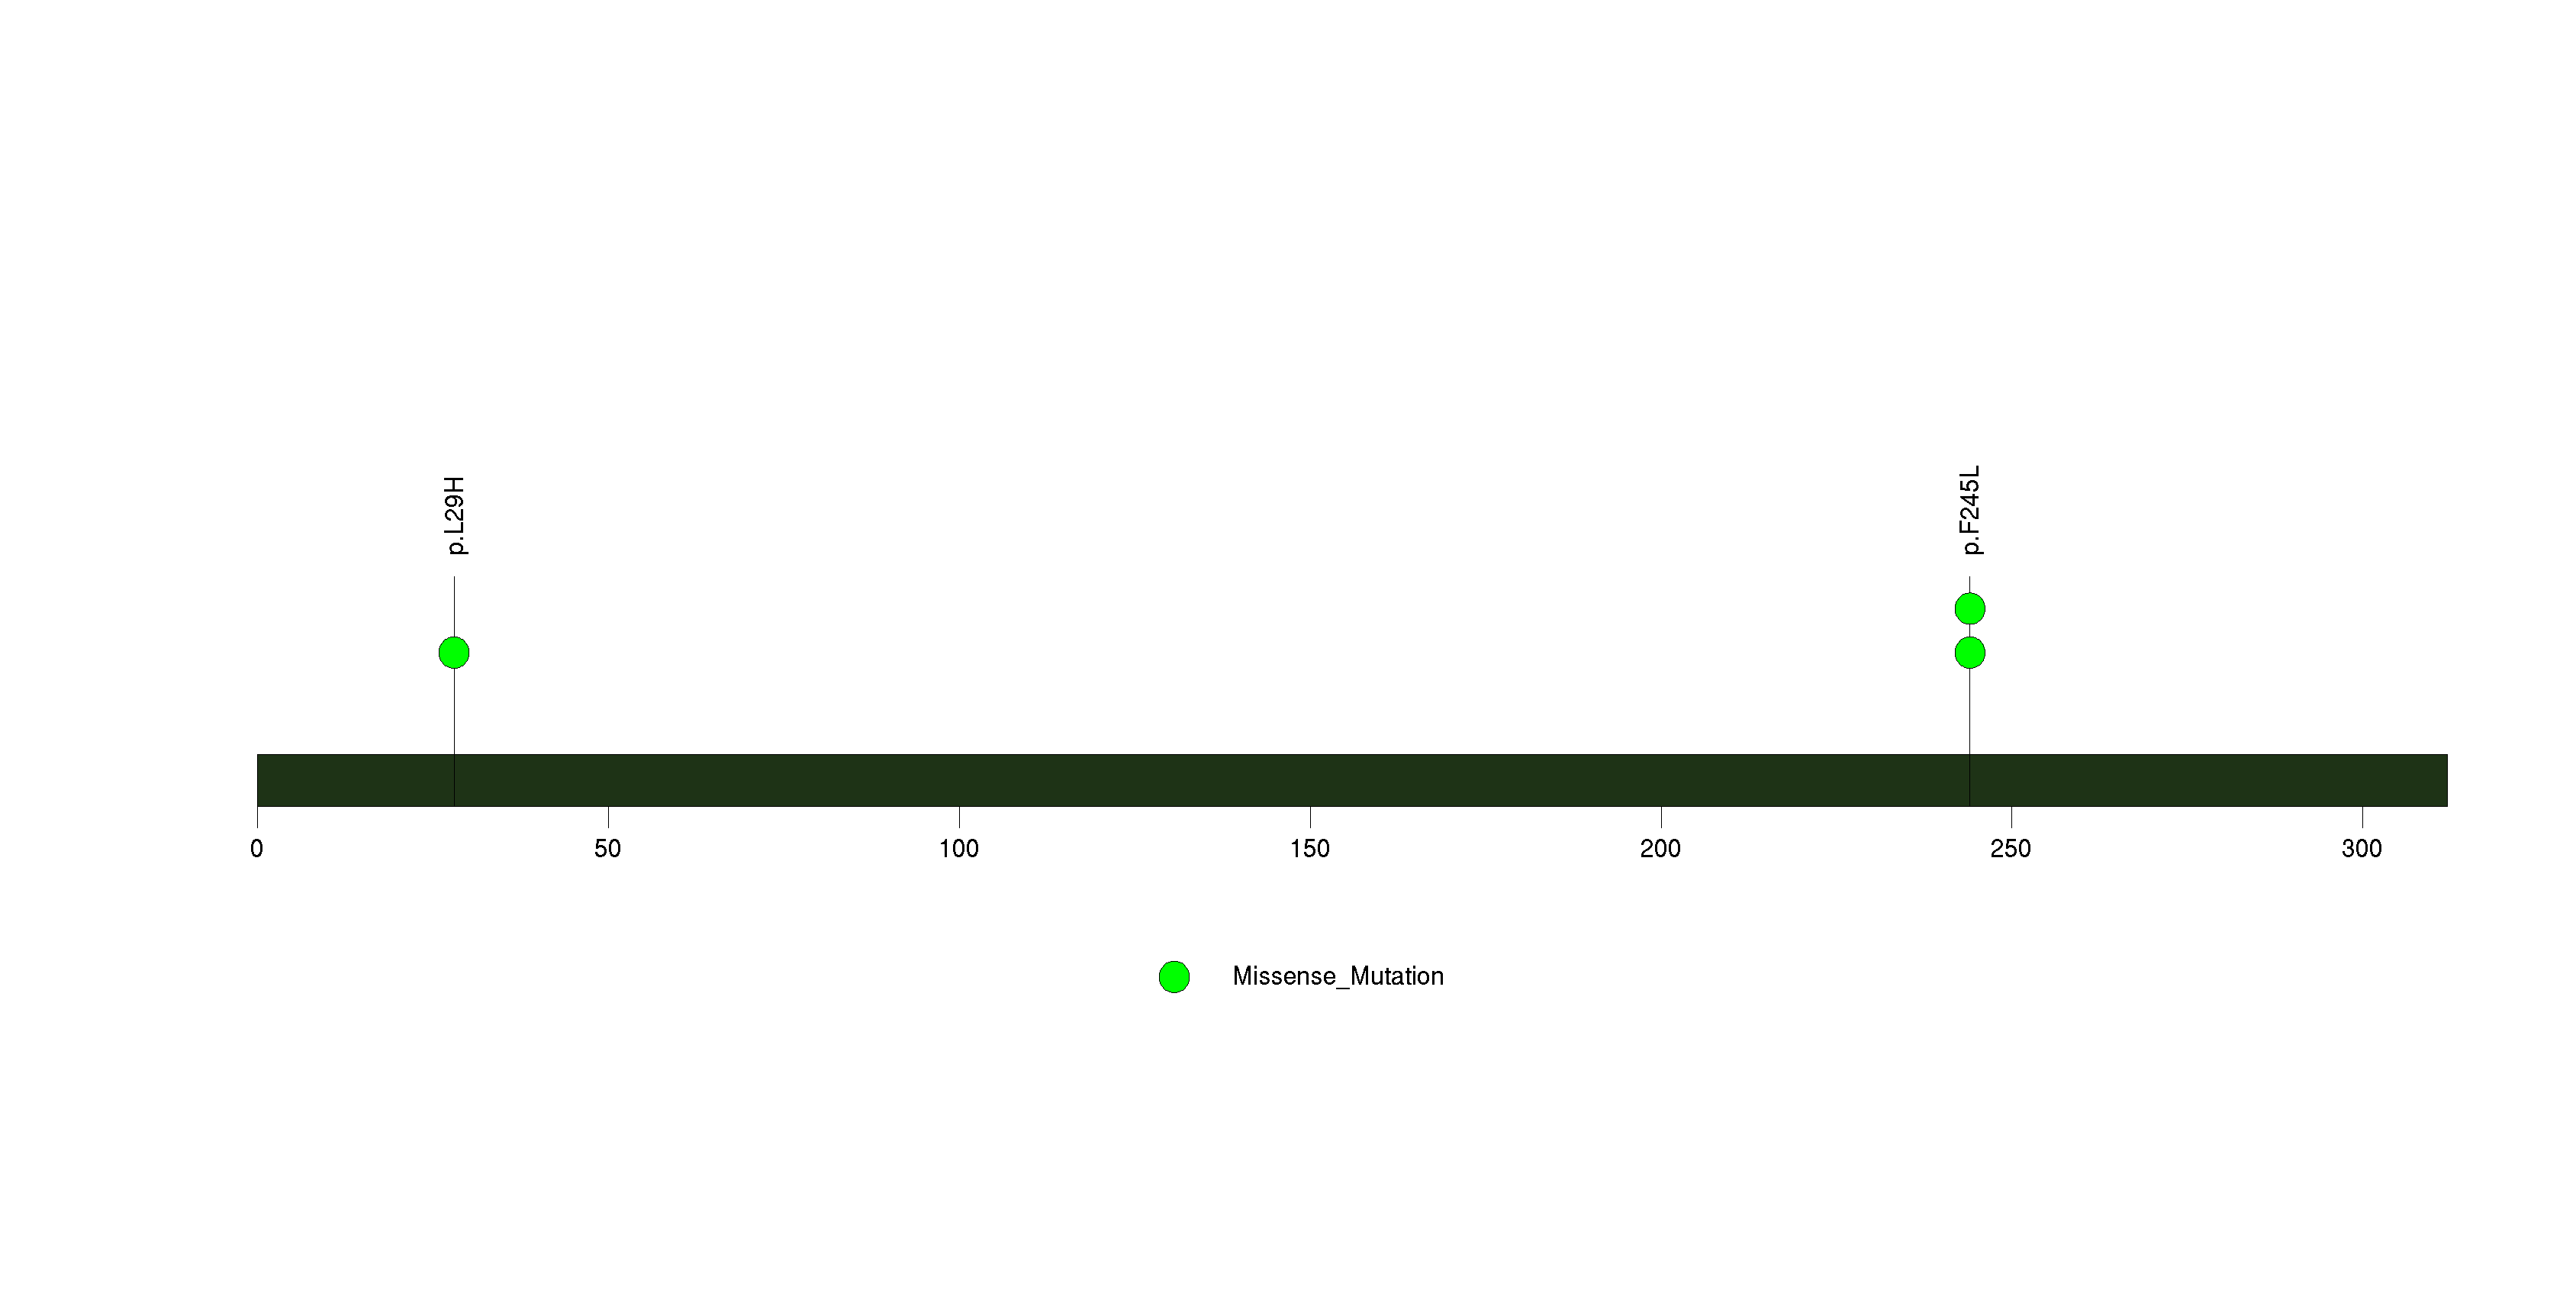
Figure S14. This figure depicts the distribution of mutations and mutation types across the LRIT2 significant gene.
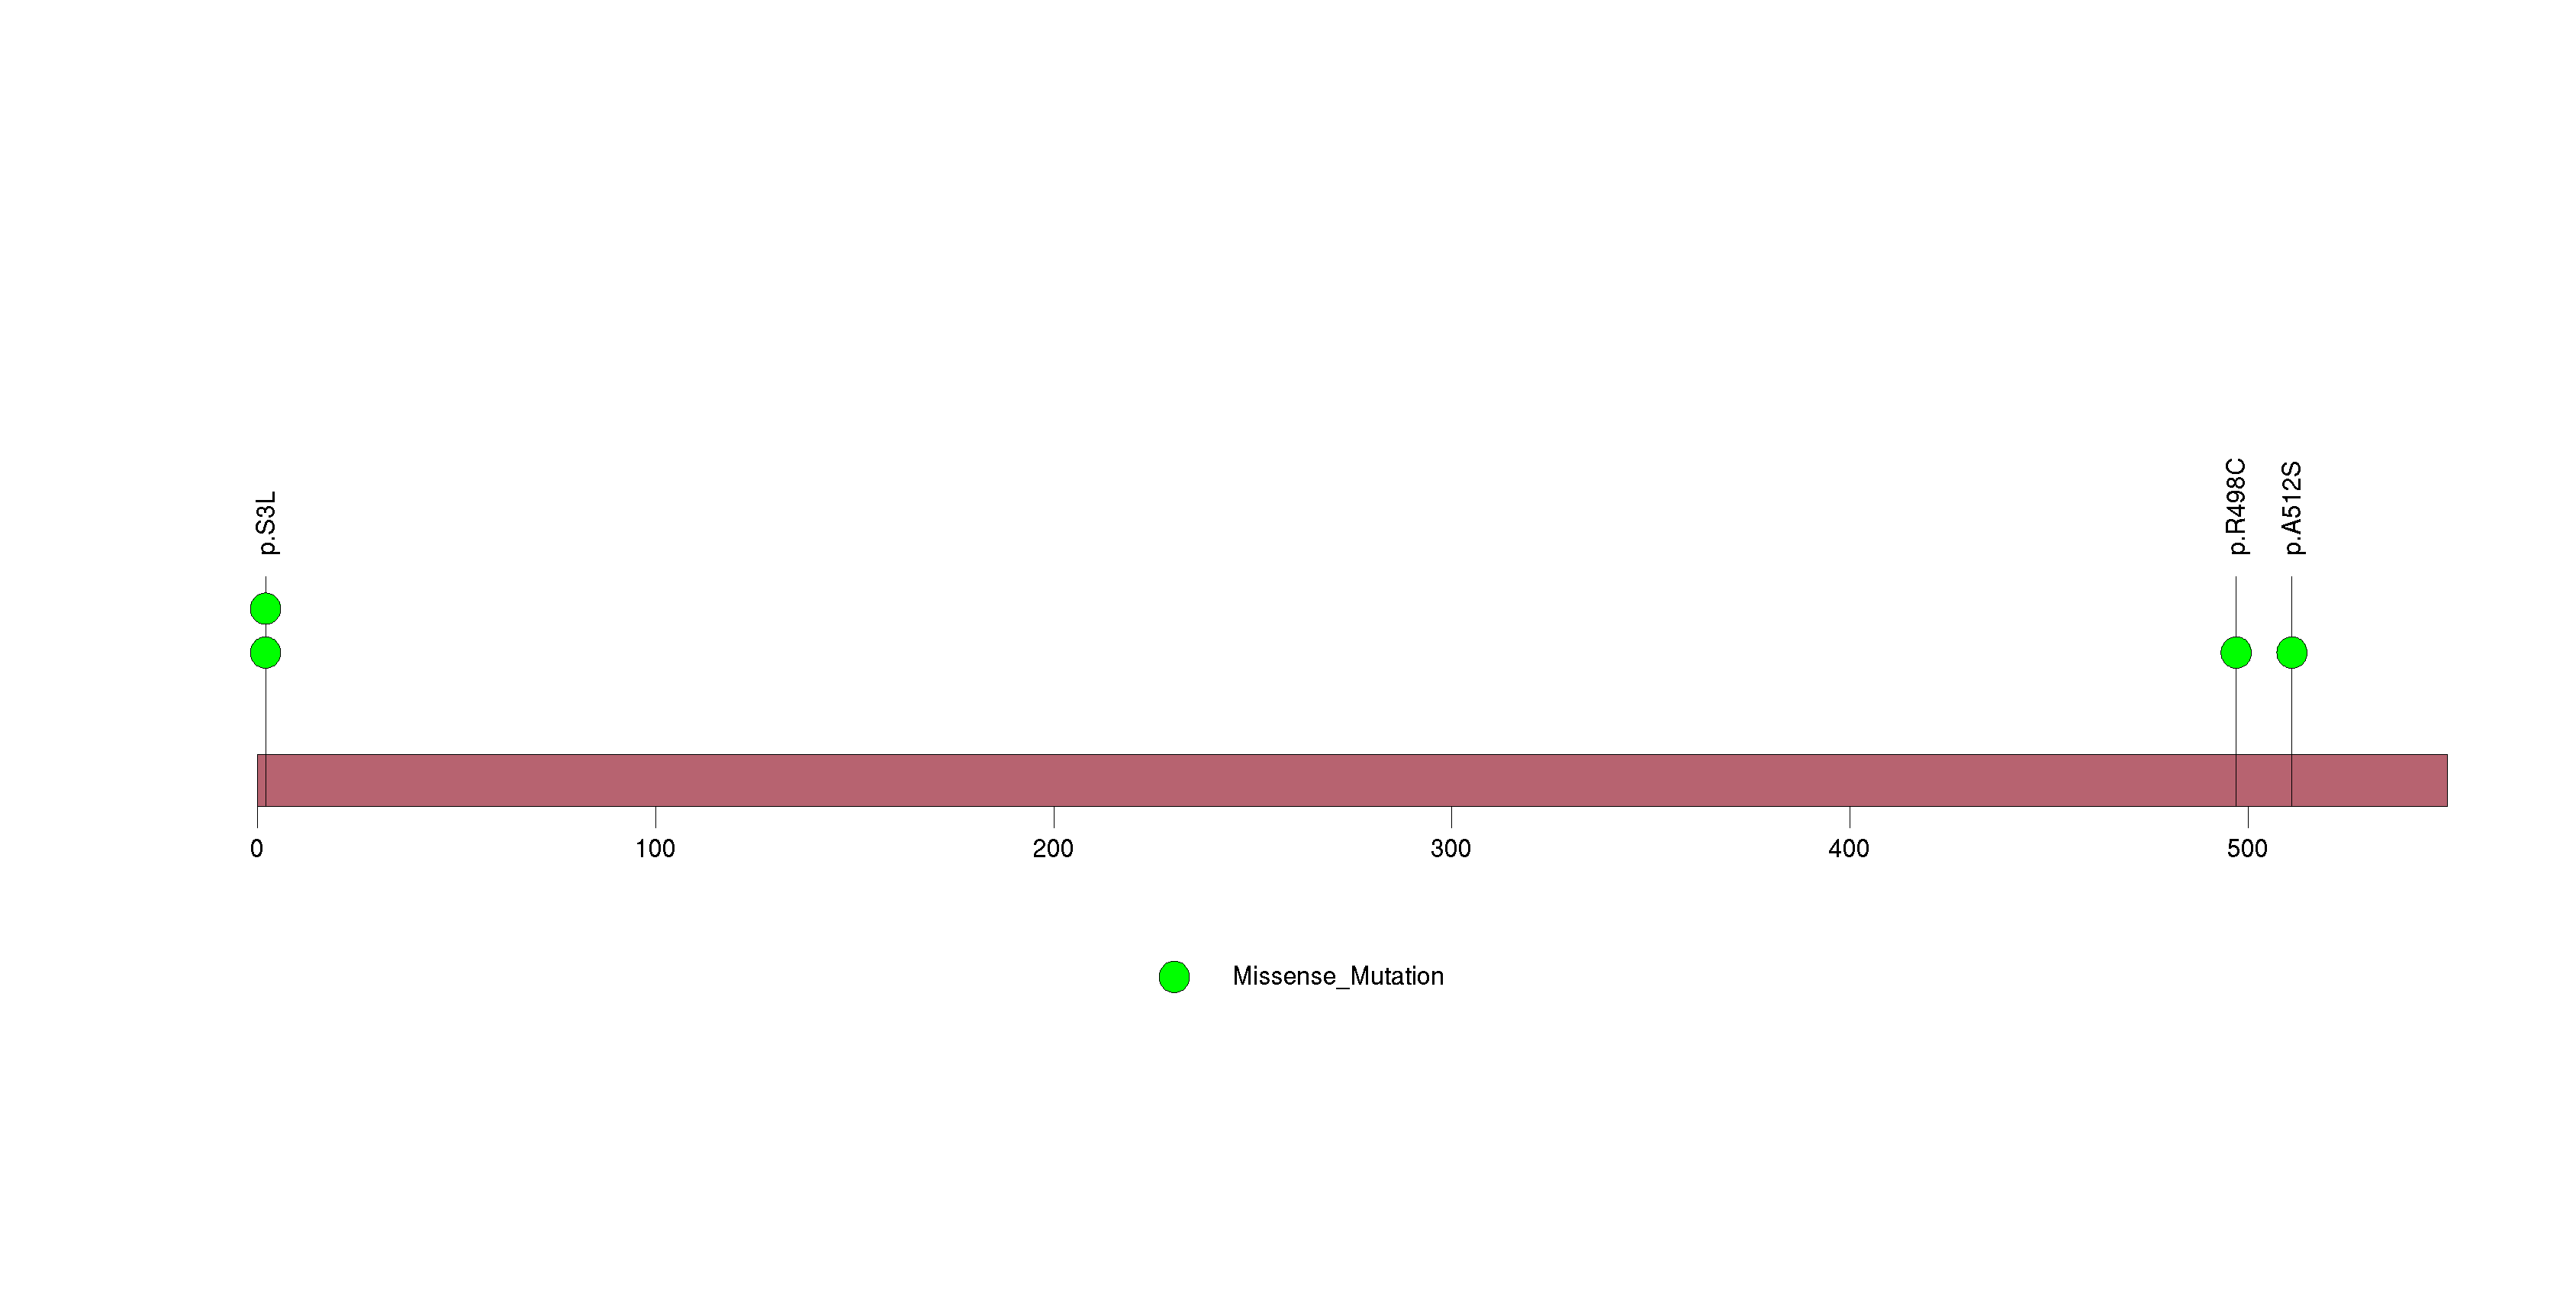
Figure S15. This figure depicts the distribution of mutations and mutation types across the OR4D5 significant gene.
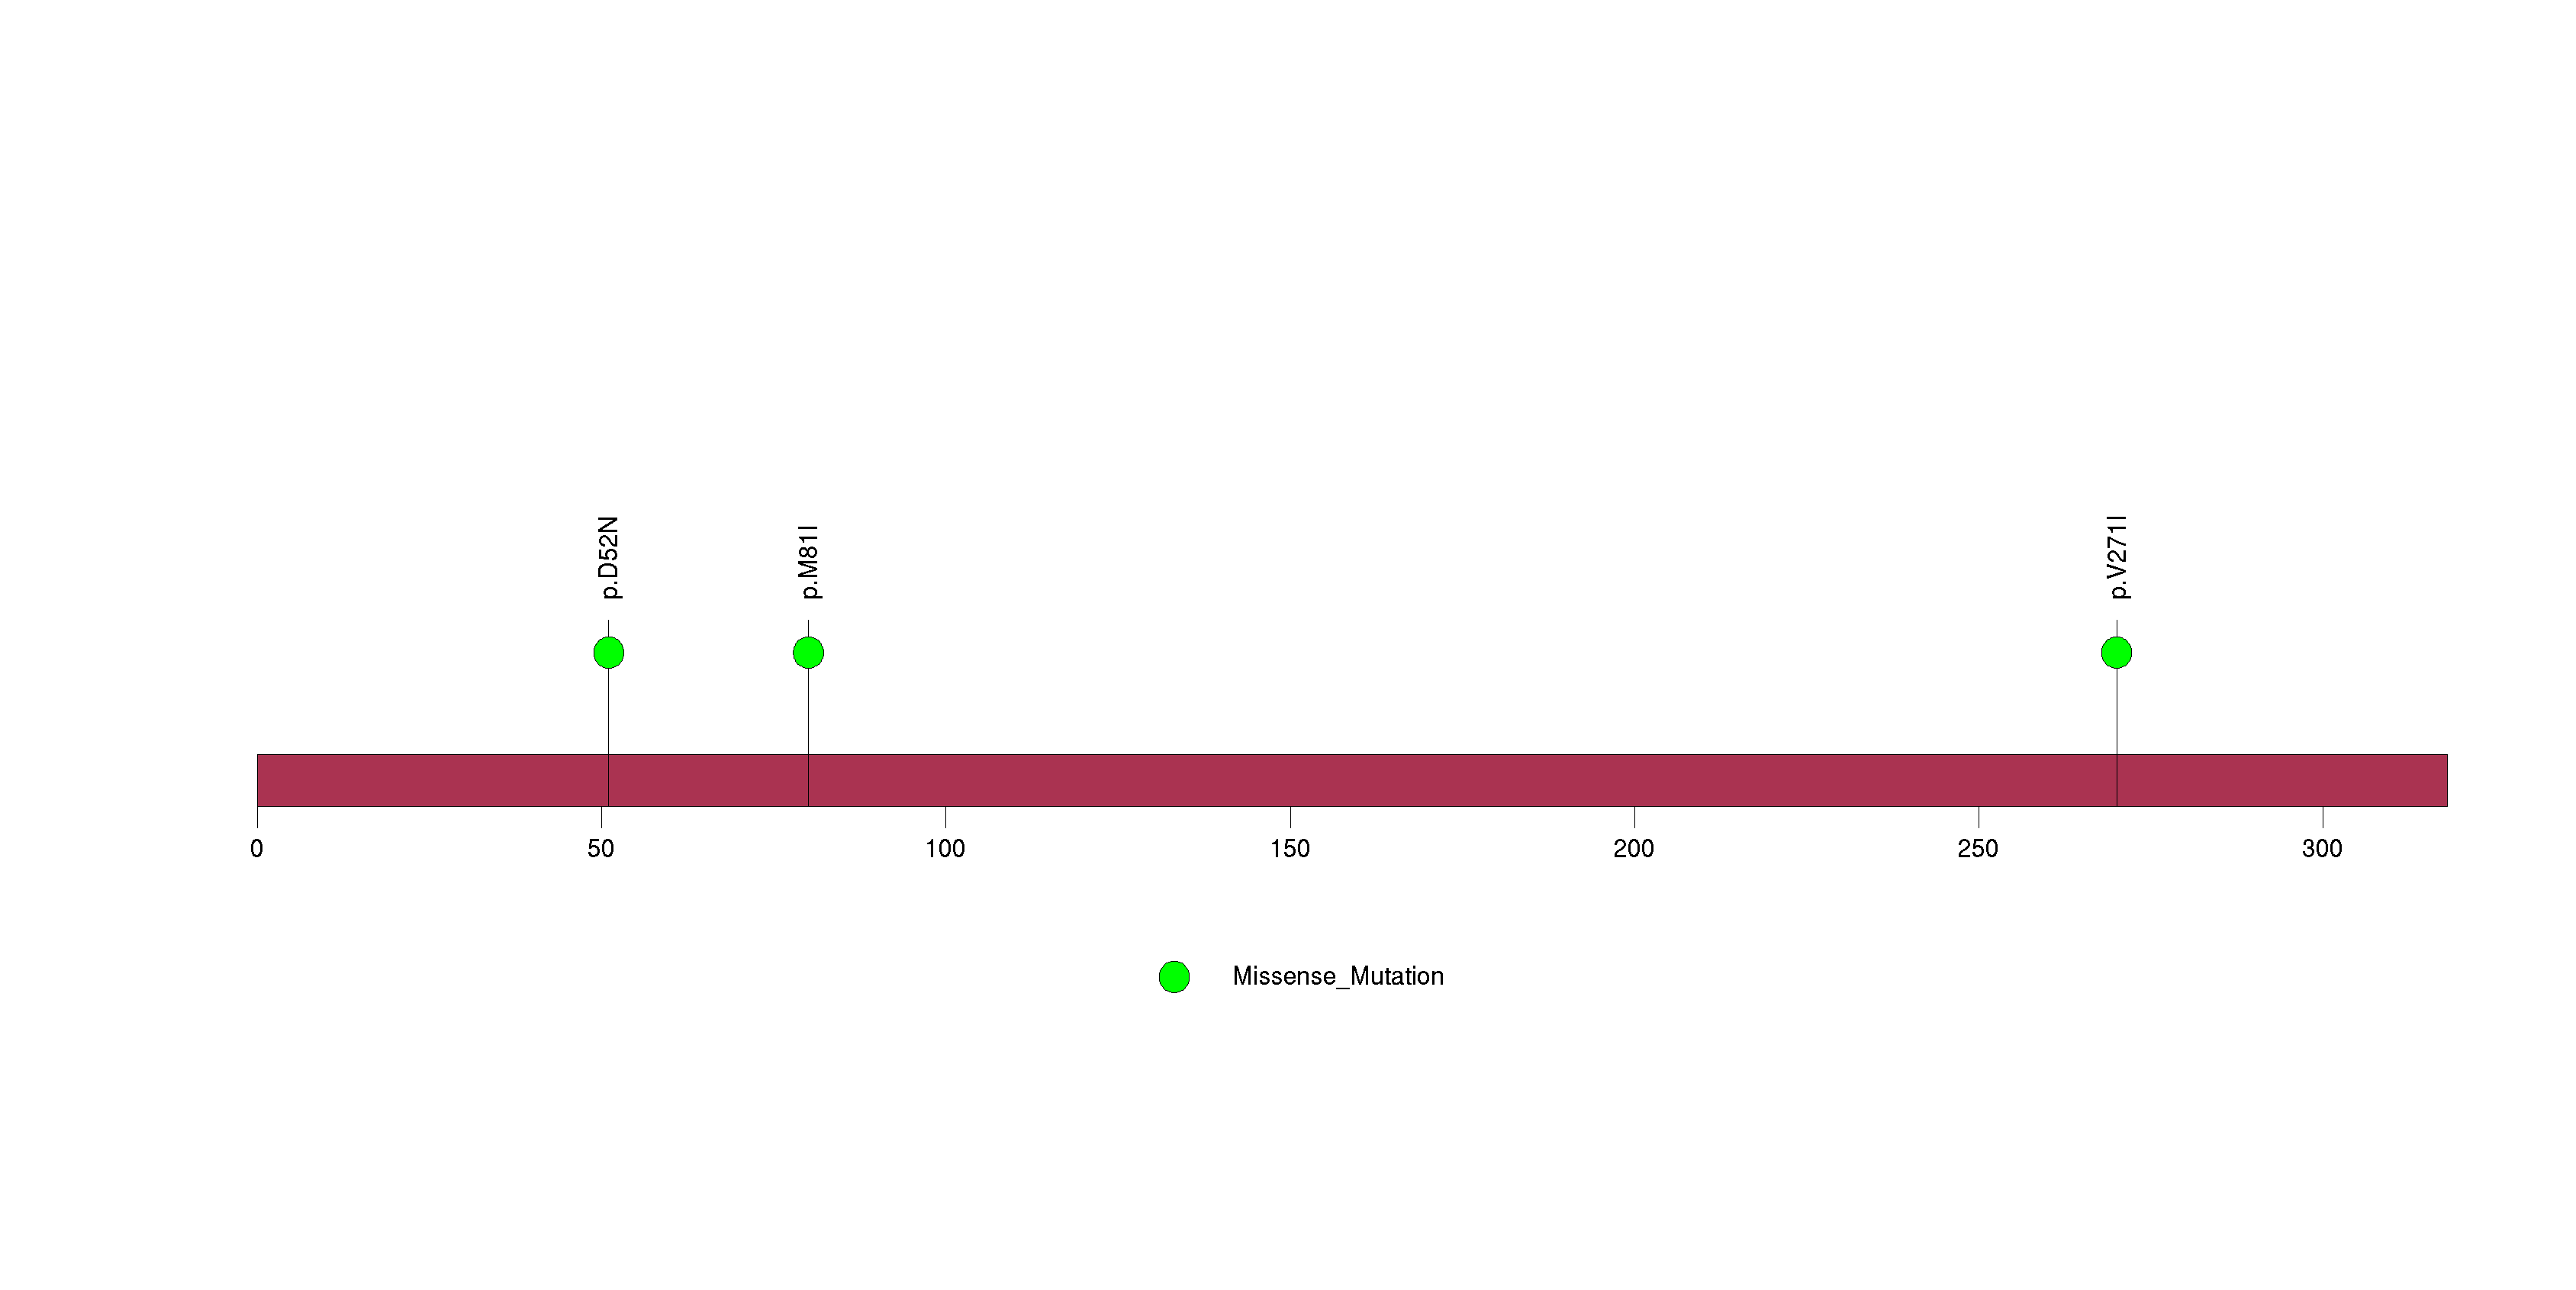
Figure S16. This figure depicts the distribution of mutations and mutation types across the ZNF492 significant gene.
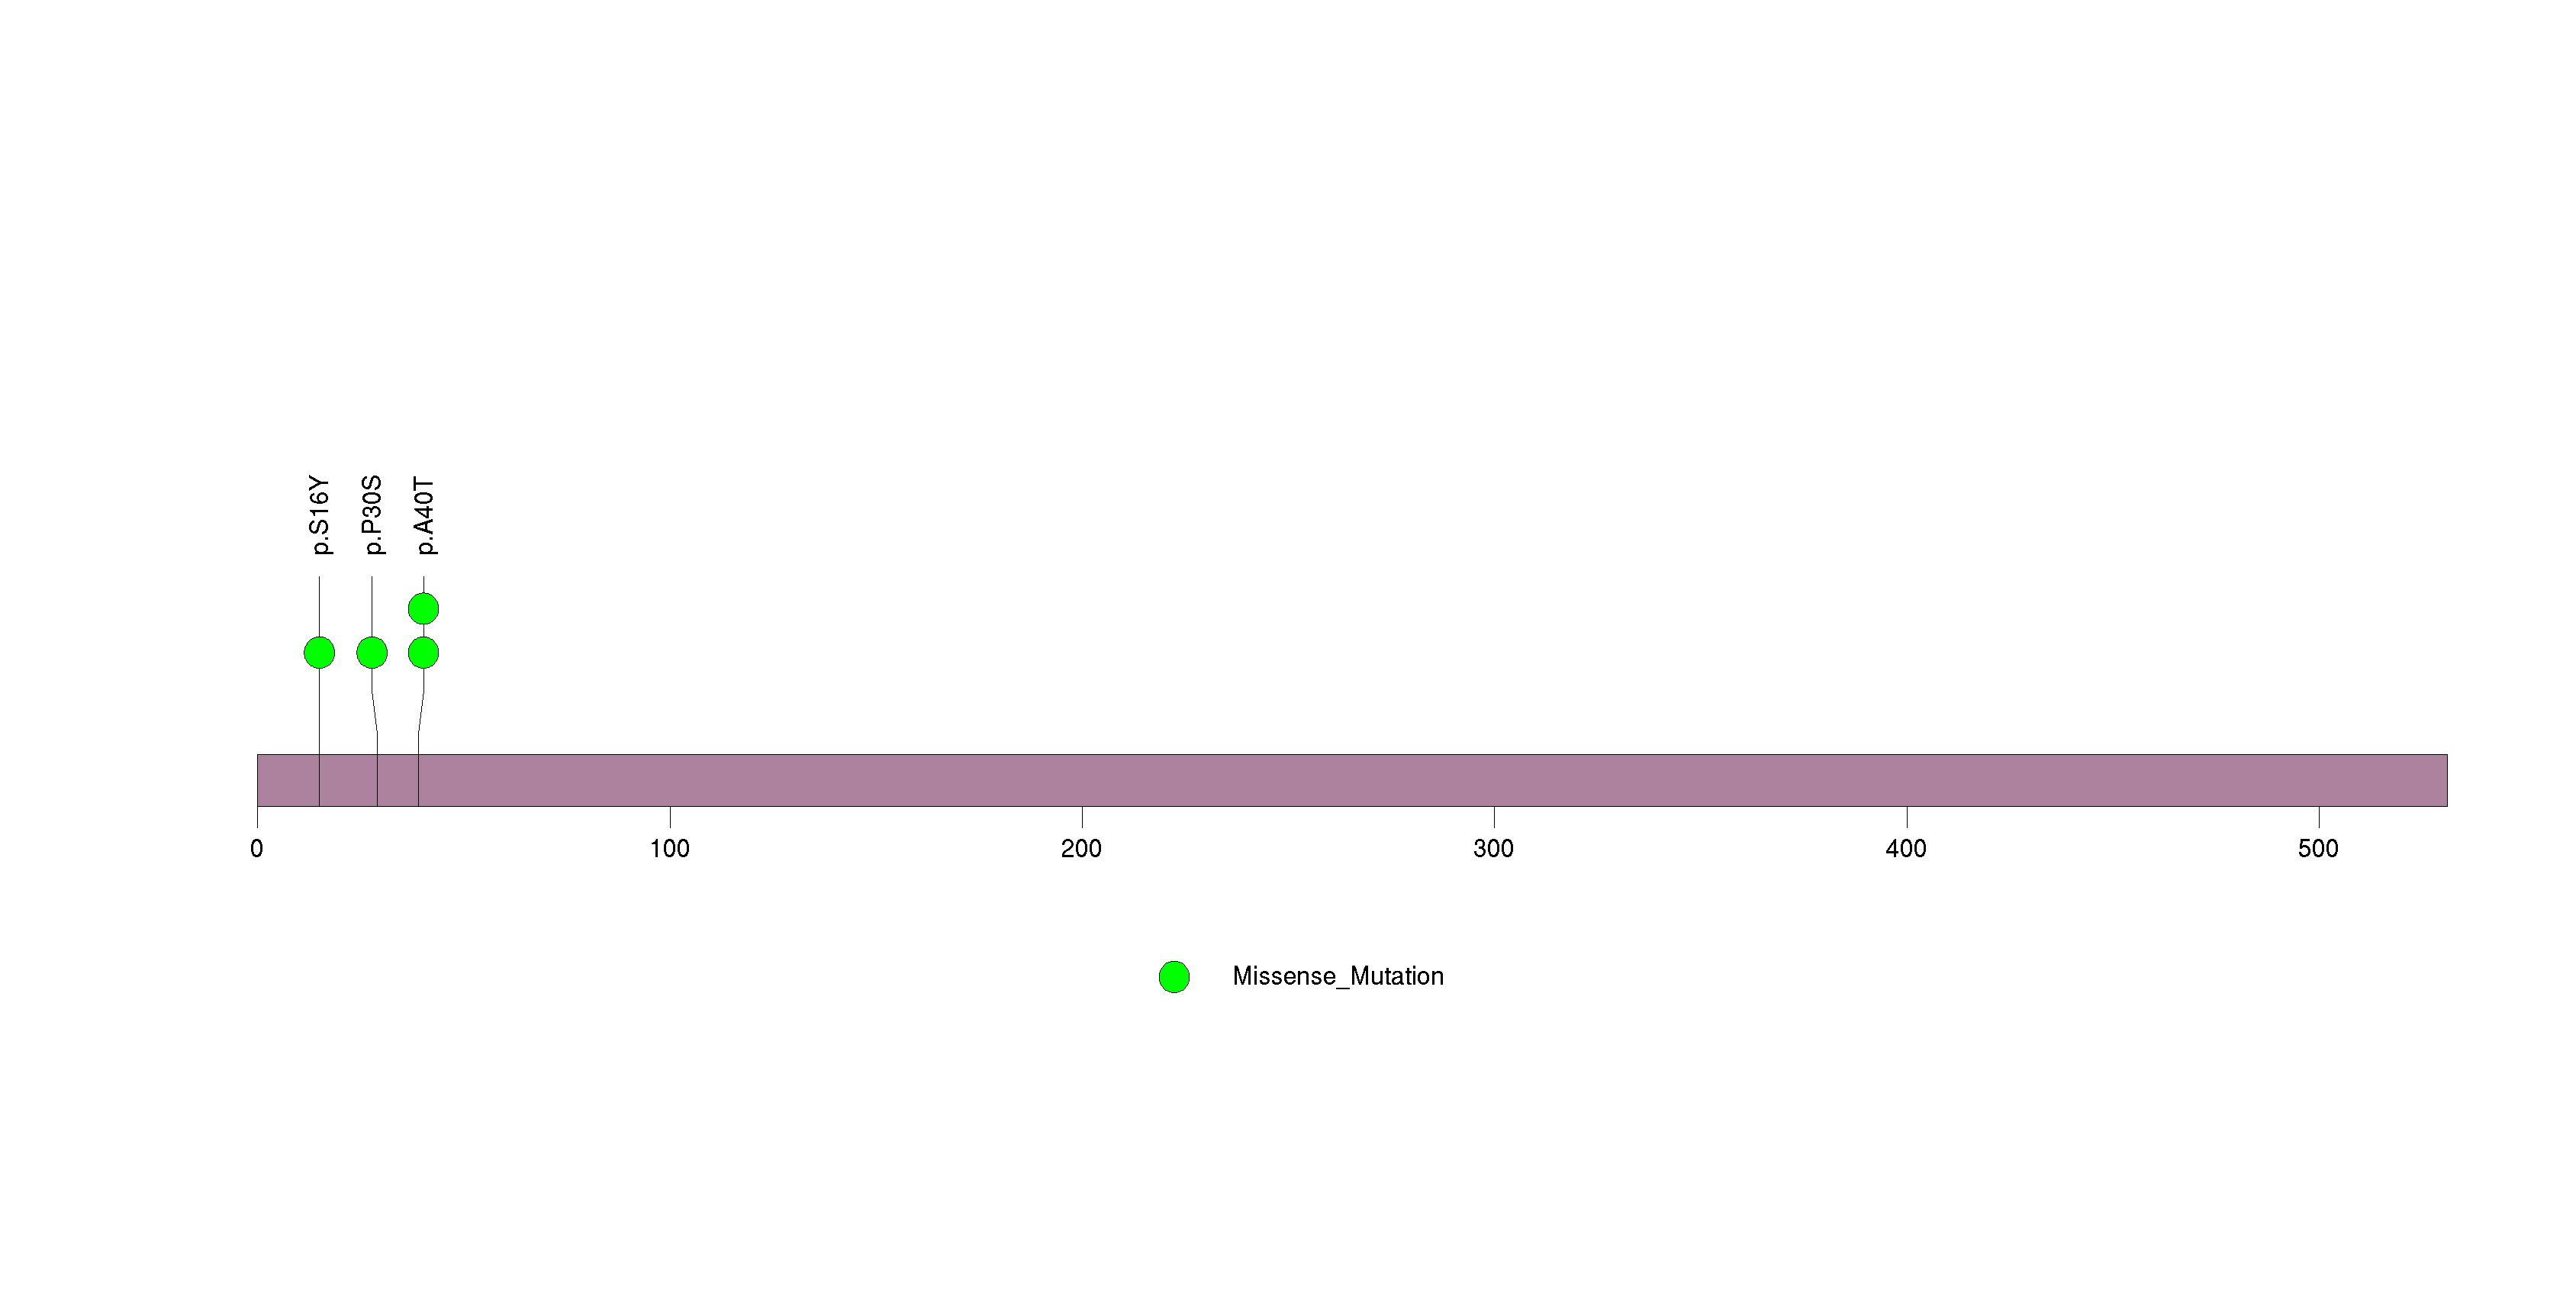
Figure S17. This figure depicts the distribution of mutations and mutation types across the C17orf63 significant gene.
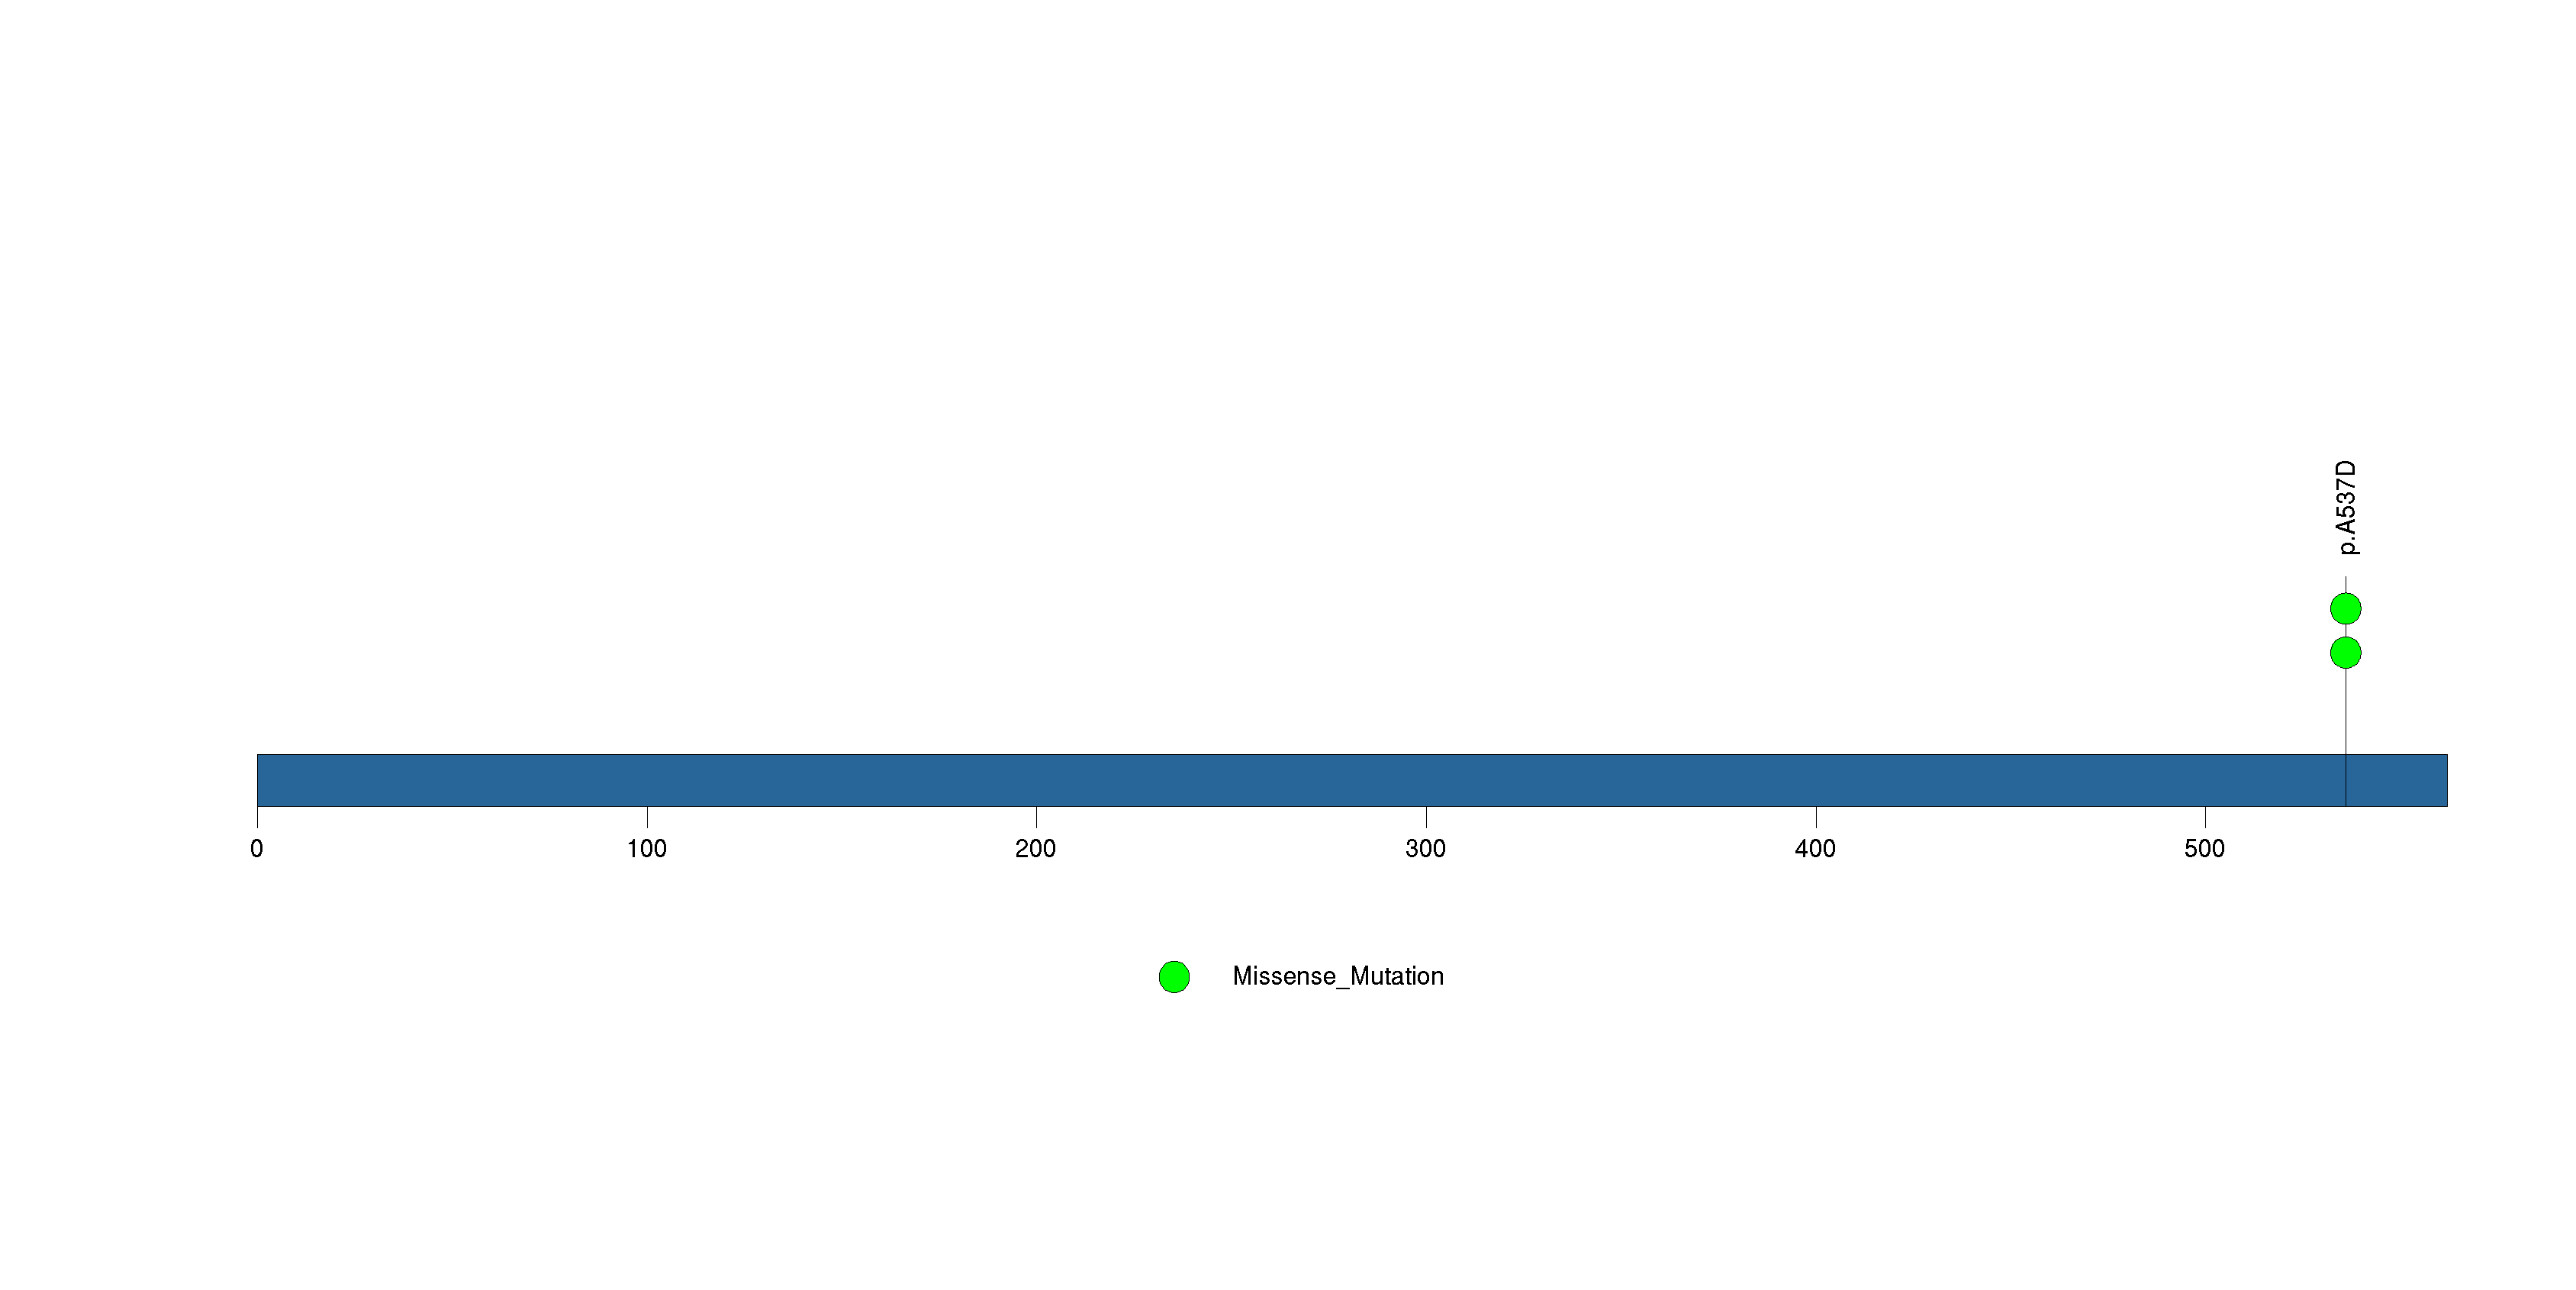
Figure S18. This figure depicts the distribution of mutations and mutation types across the NDUFS4 significant gene.
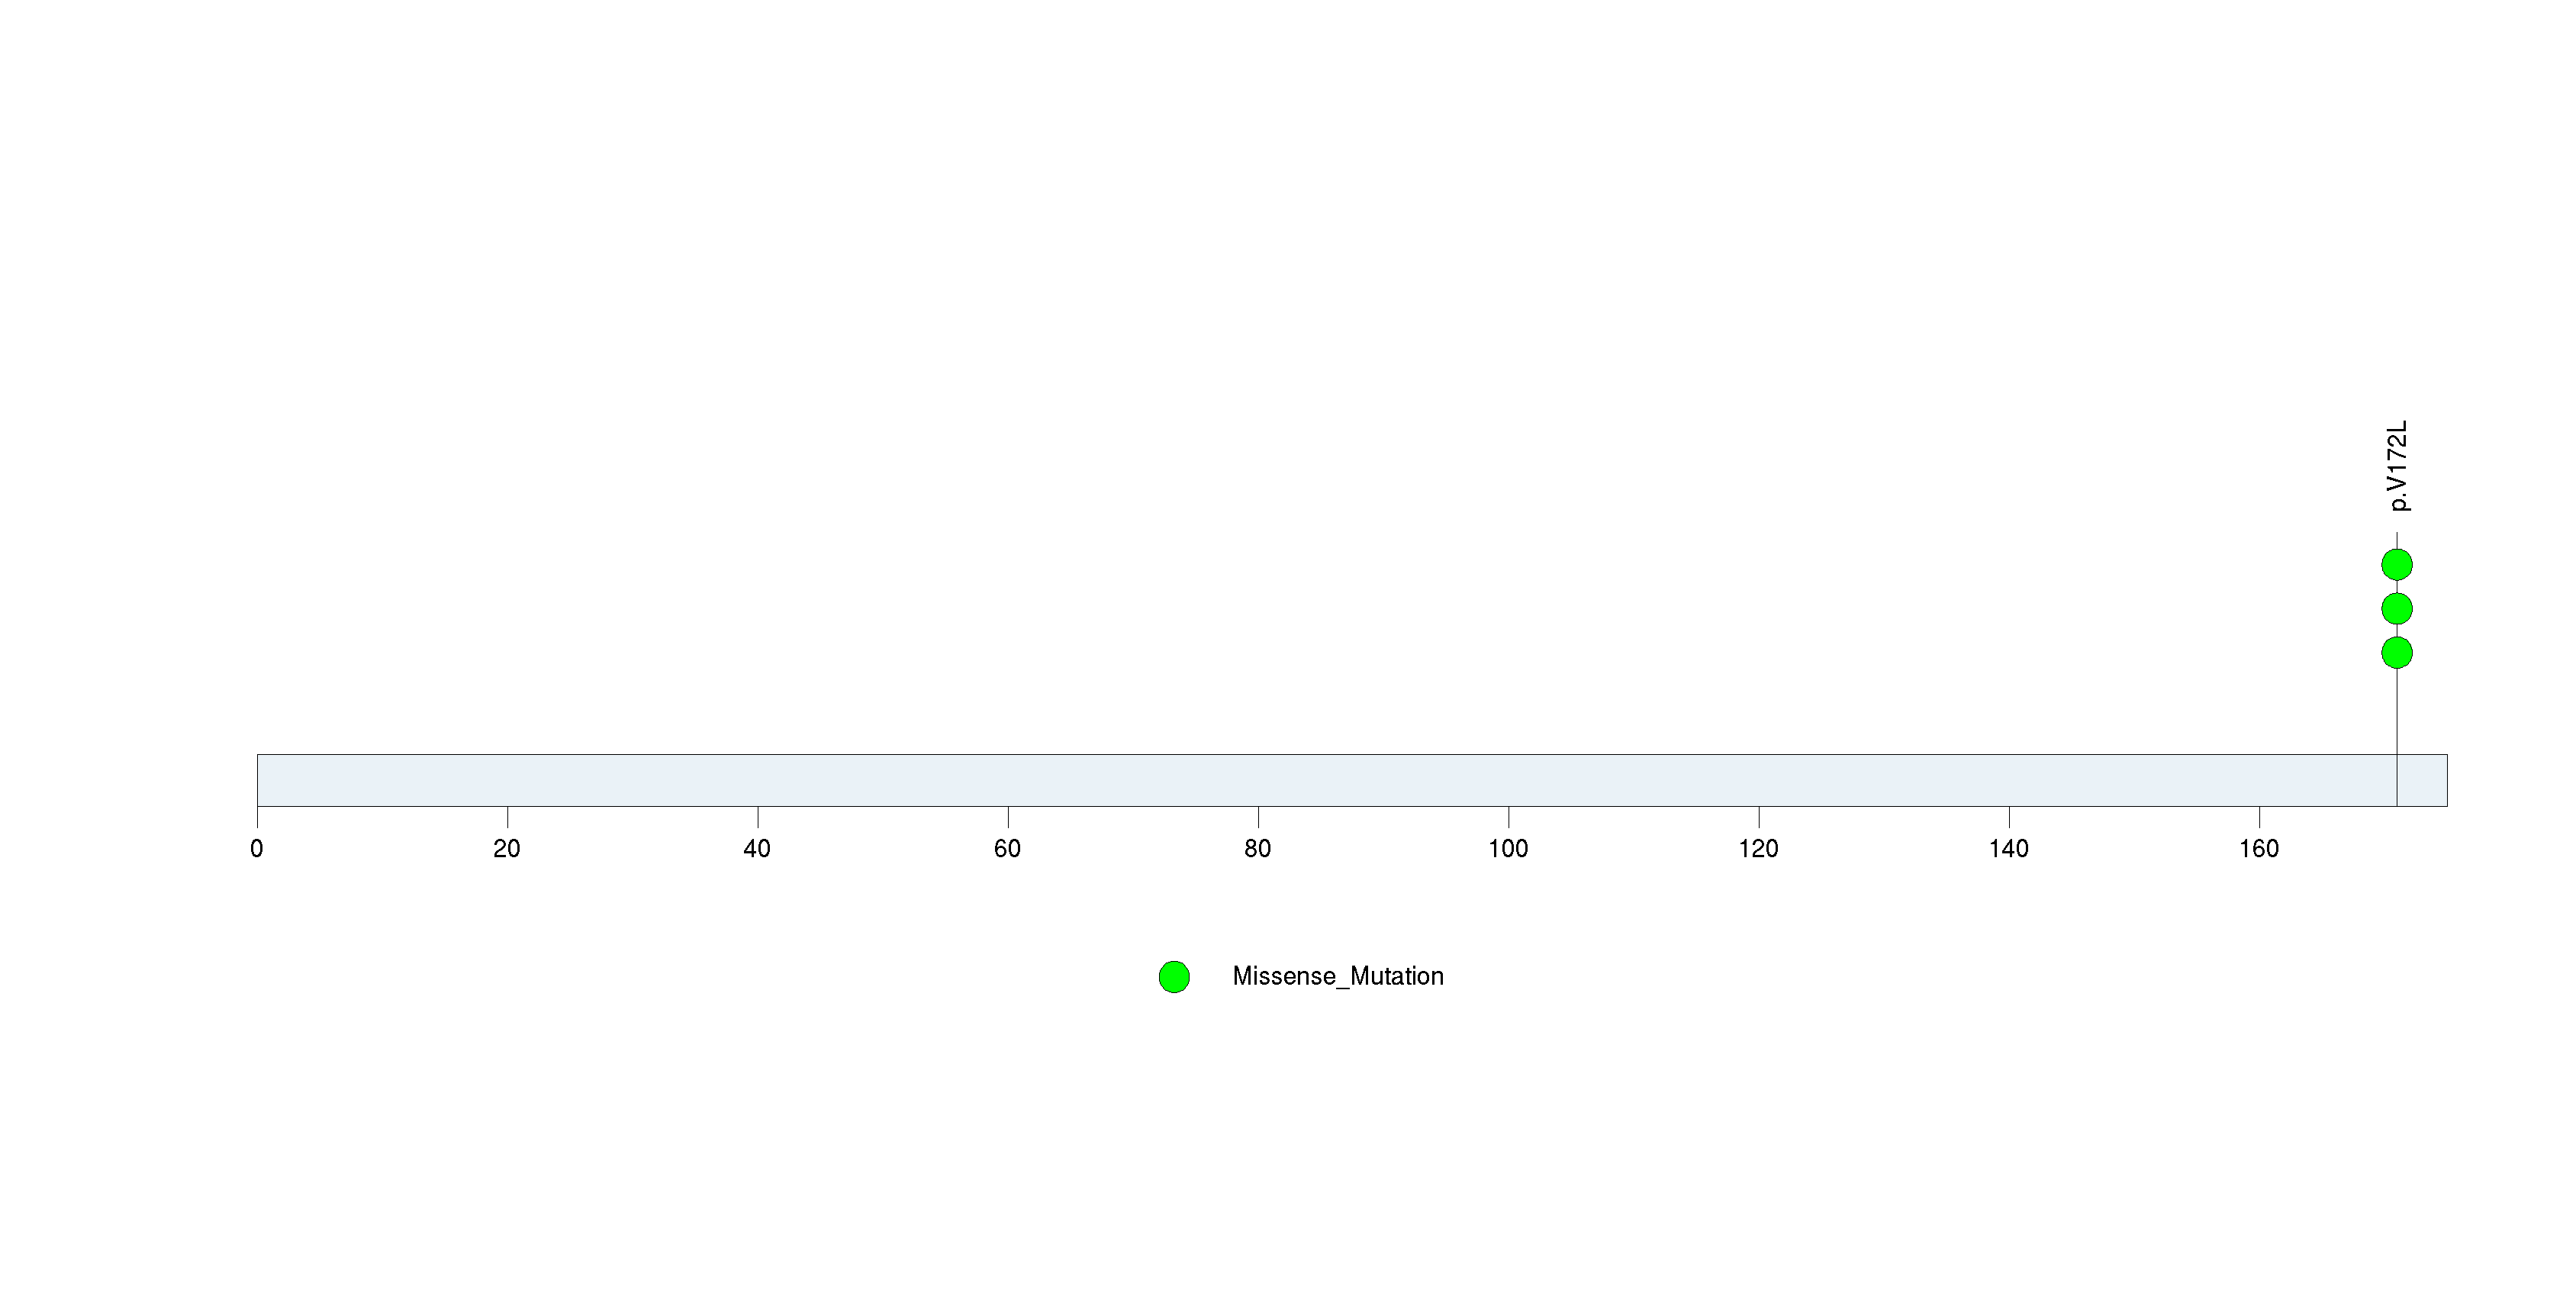
Figure S19. This figure depicts the distribution of mutations and mutation types across the ZNF285 significant gene.
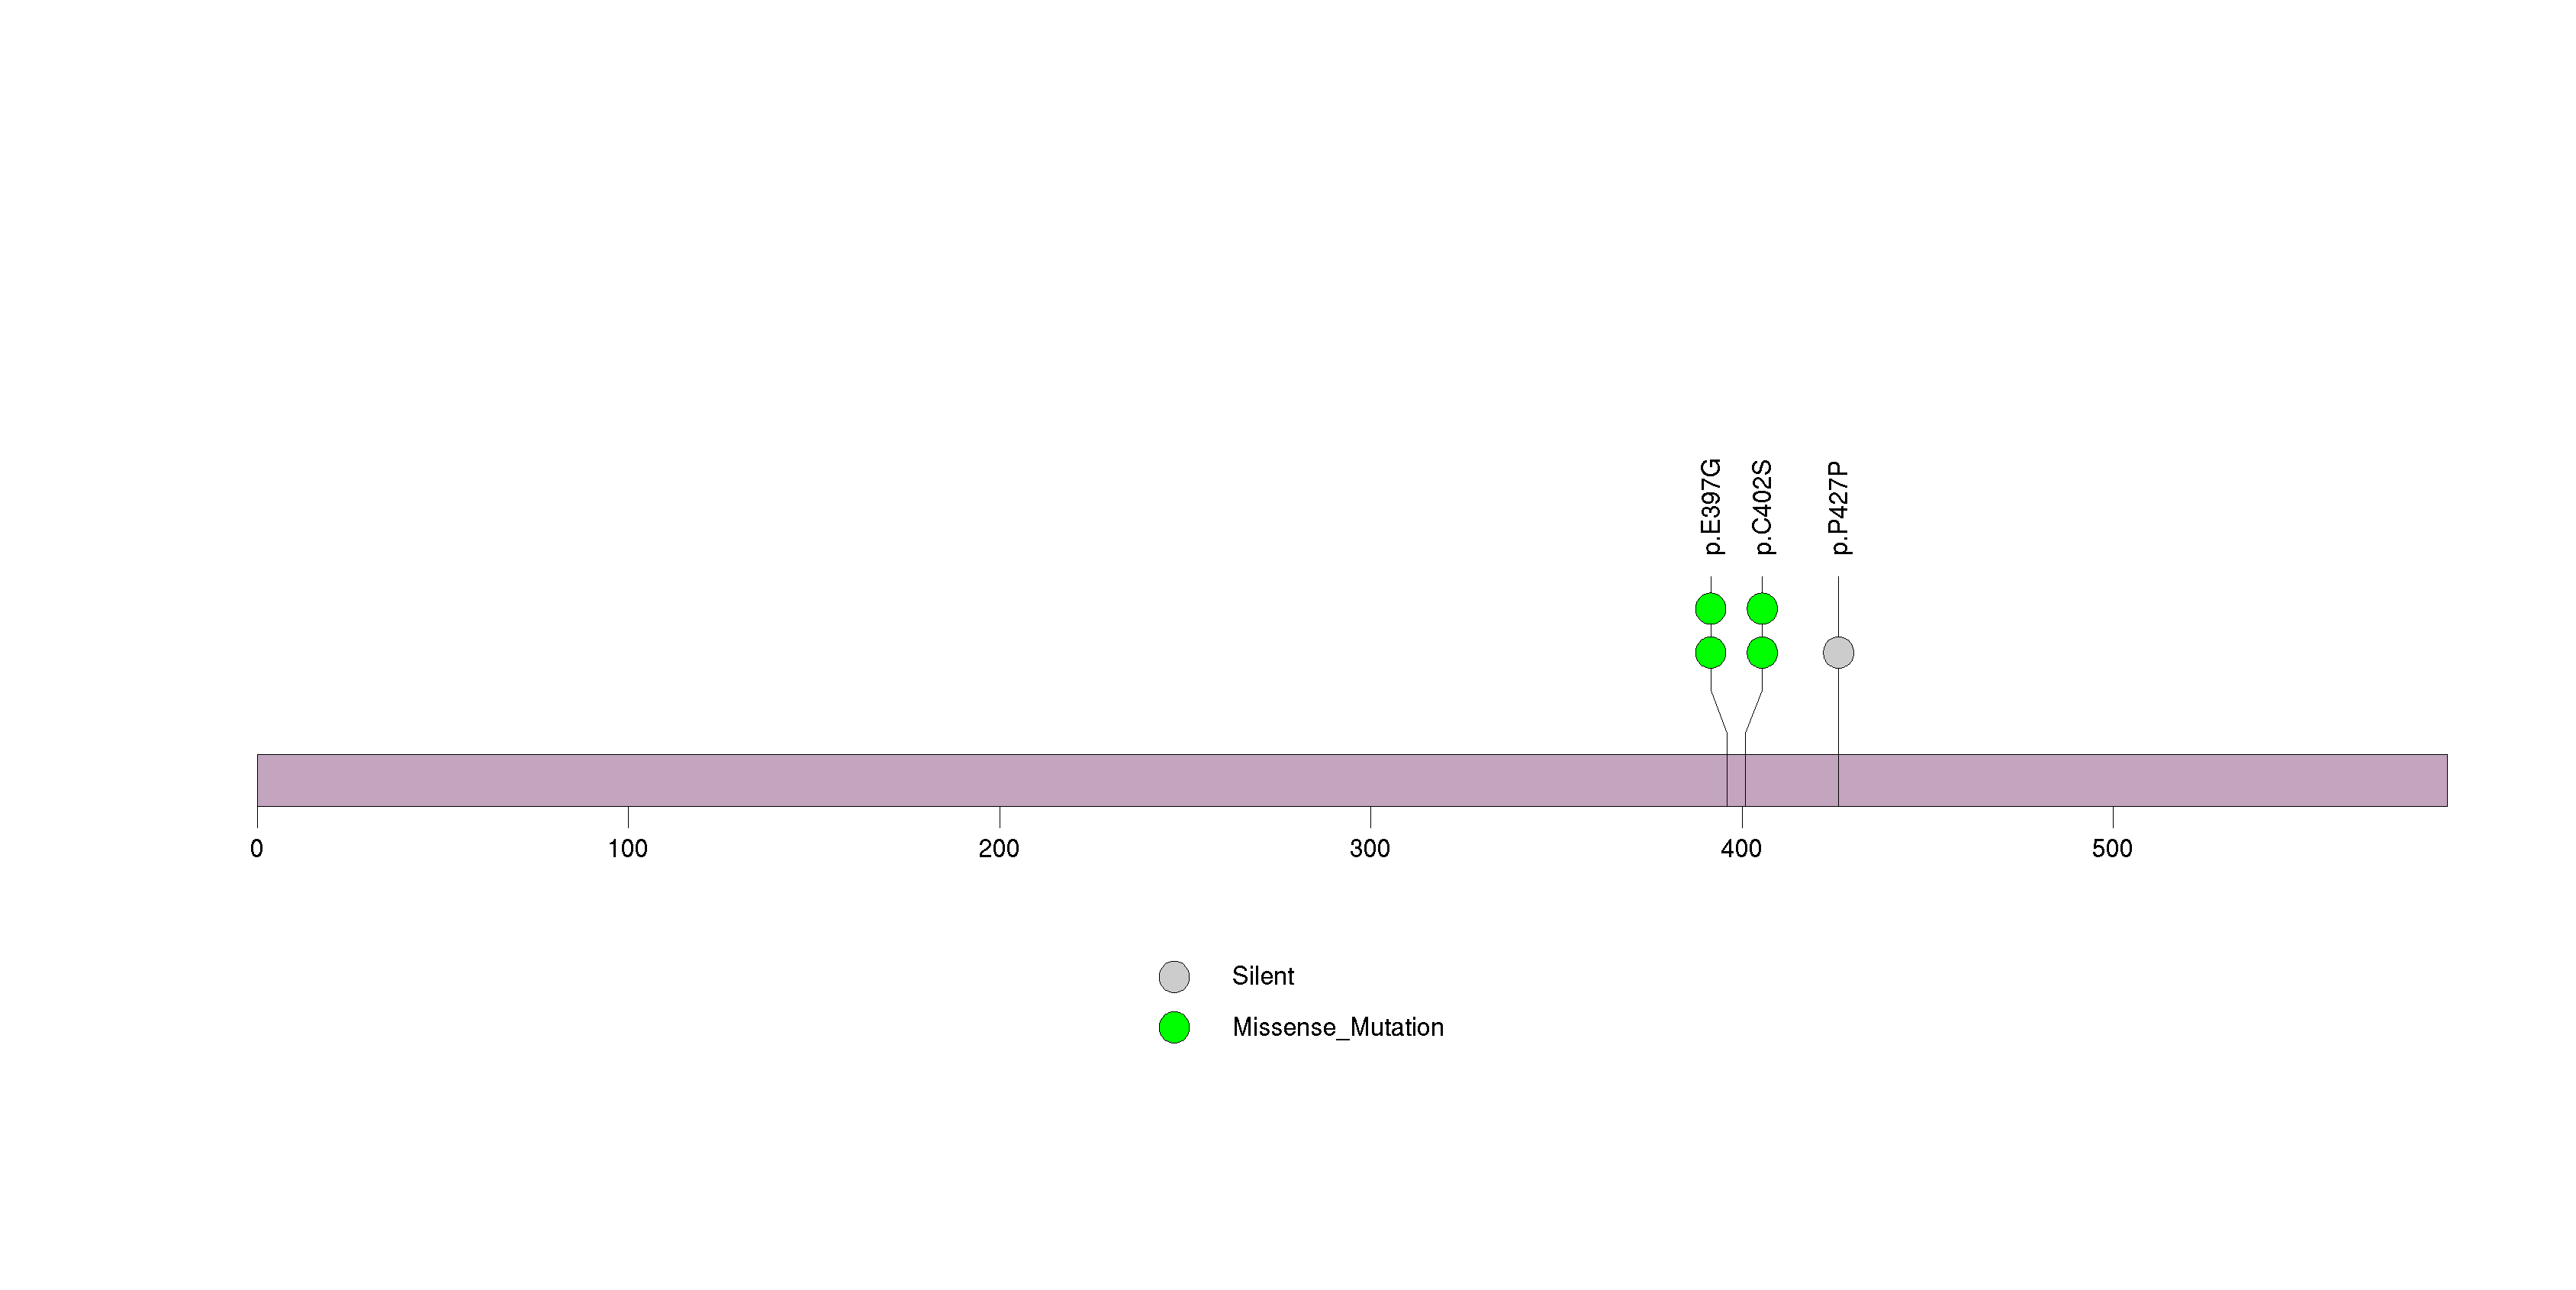
Figure S20. This figure depicts the distribution of mutations and mutation types across the NOTCH2NL significant gene.
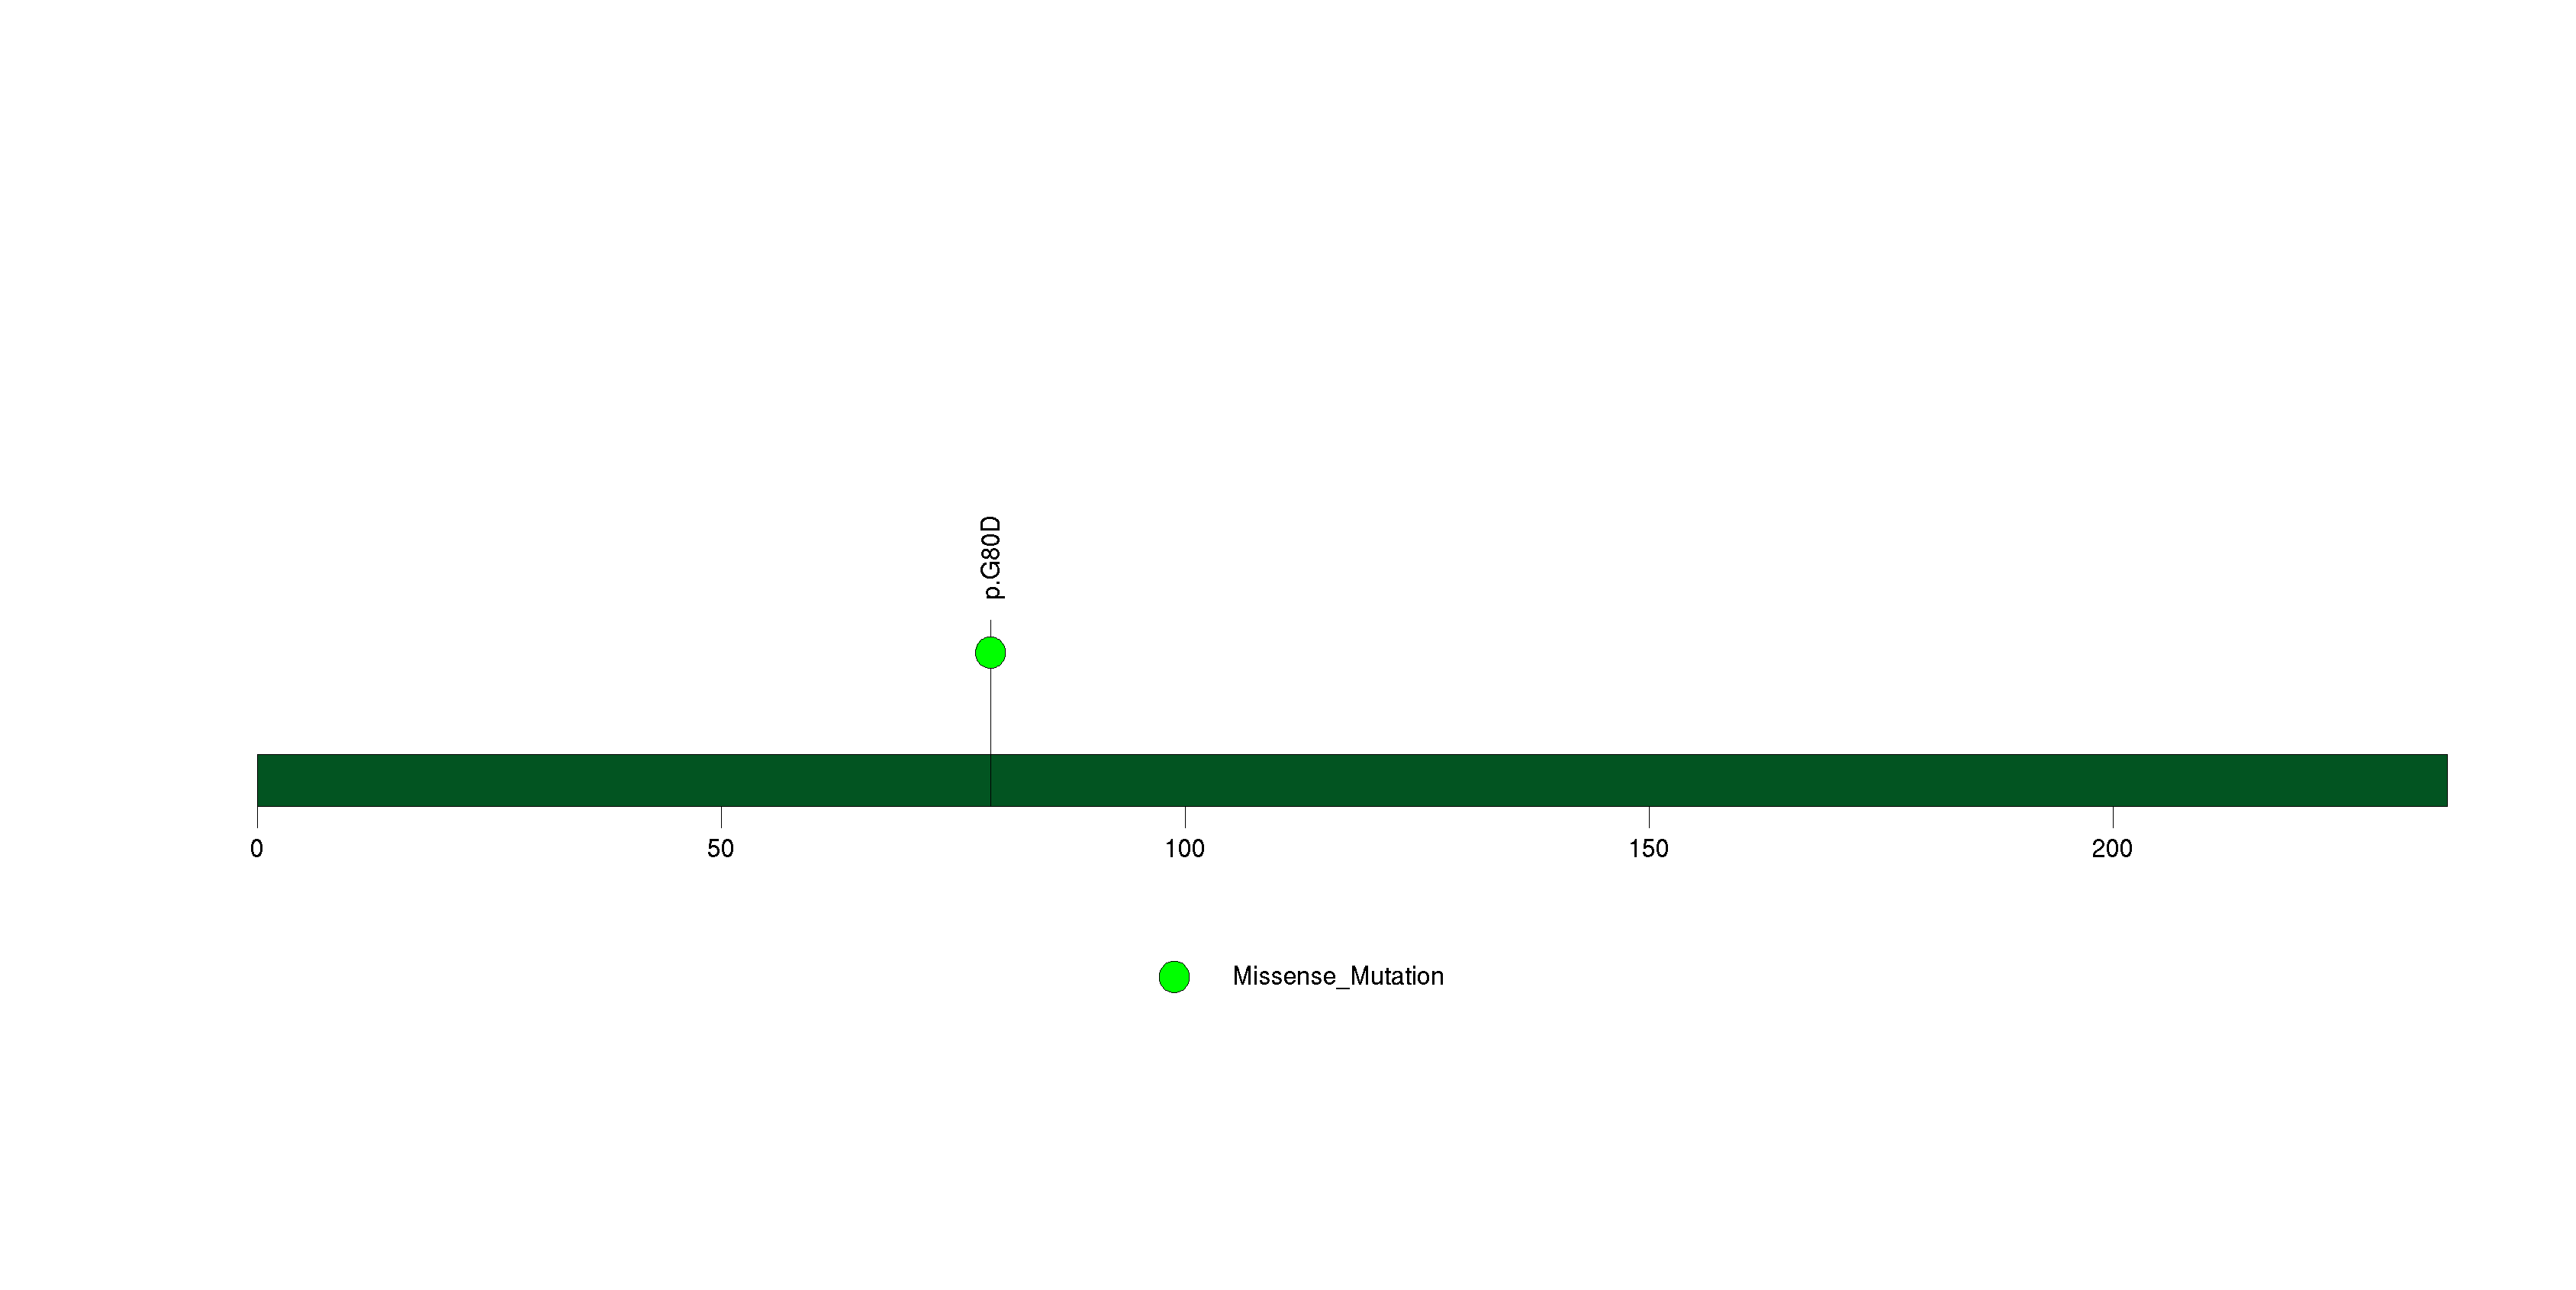
Figure S21. This figure depicts the distribution of mutations and mutation types across the ZNF814 significant gene.
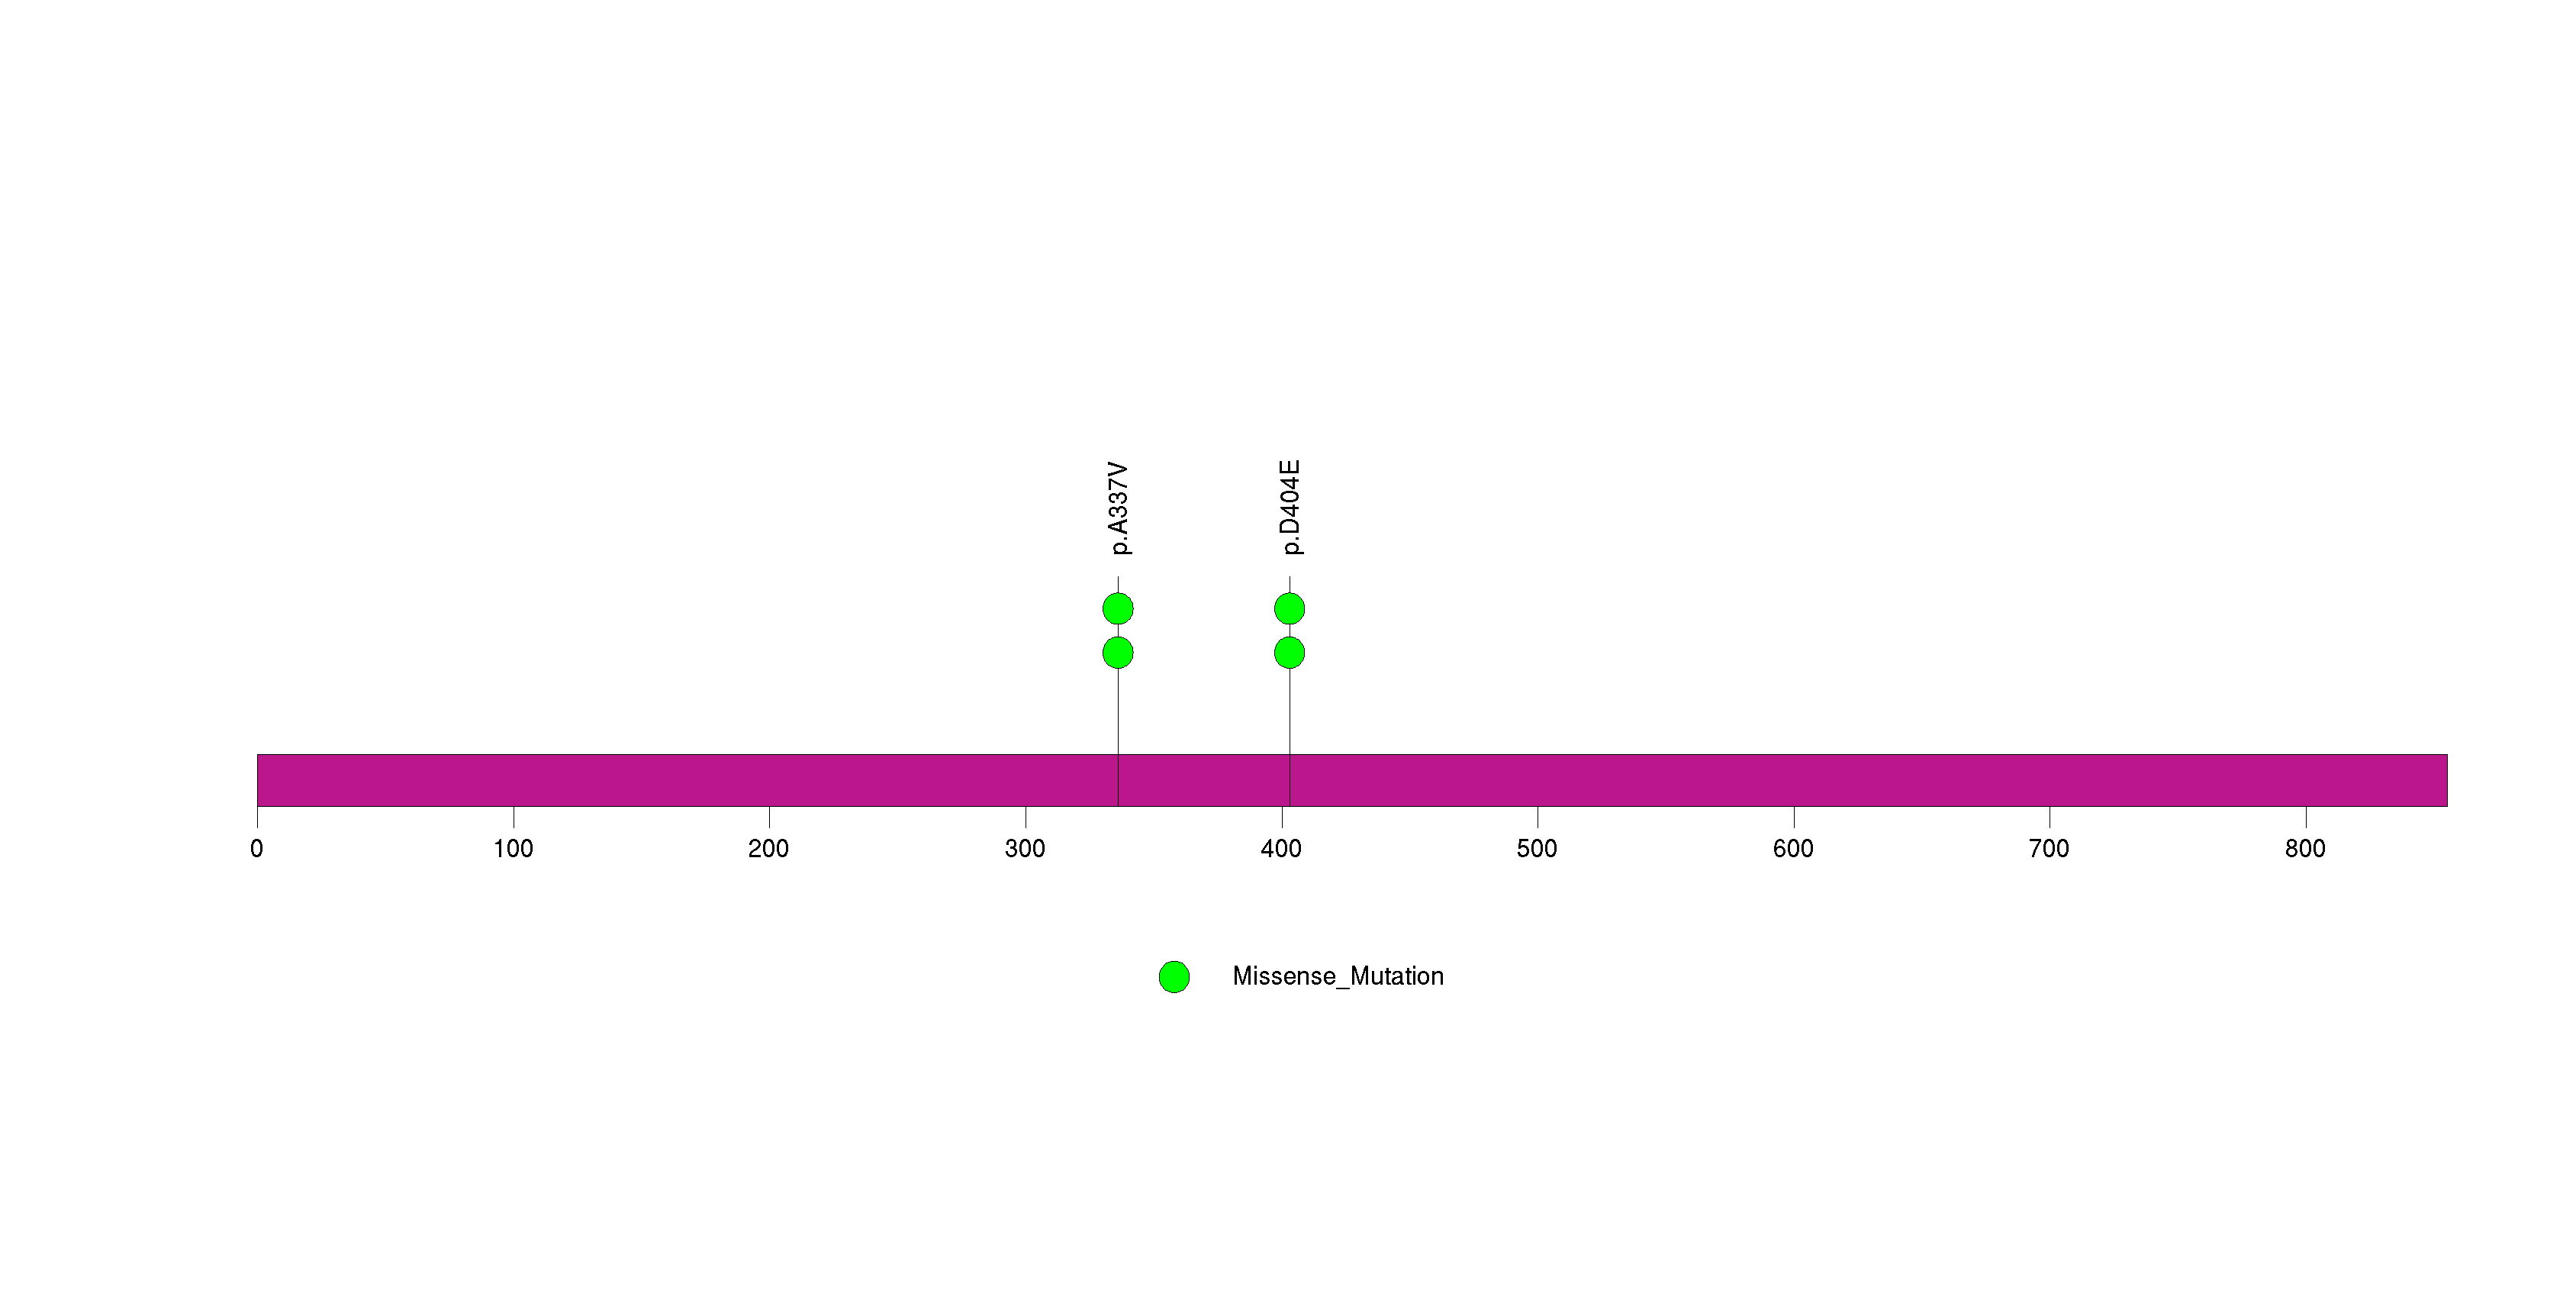
Figure S22. This figure depicts the distribution of mutations and mutation types across the PRB1 significant gene.
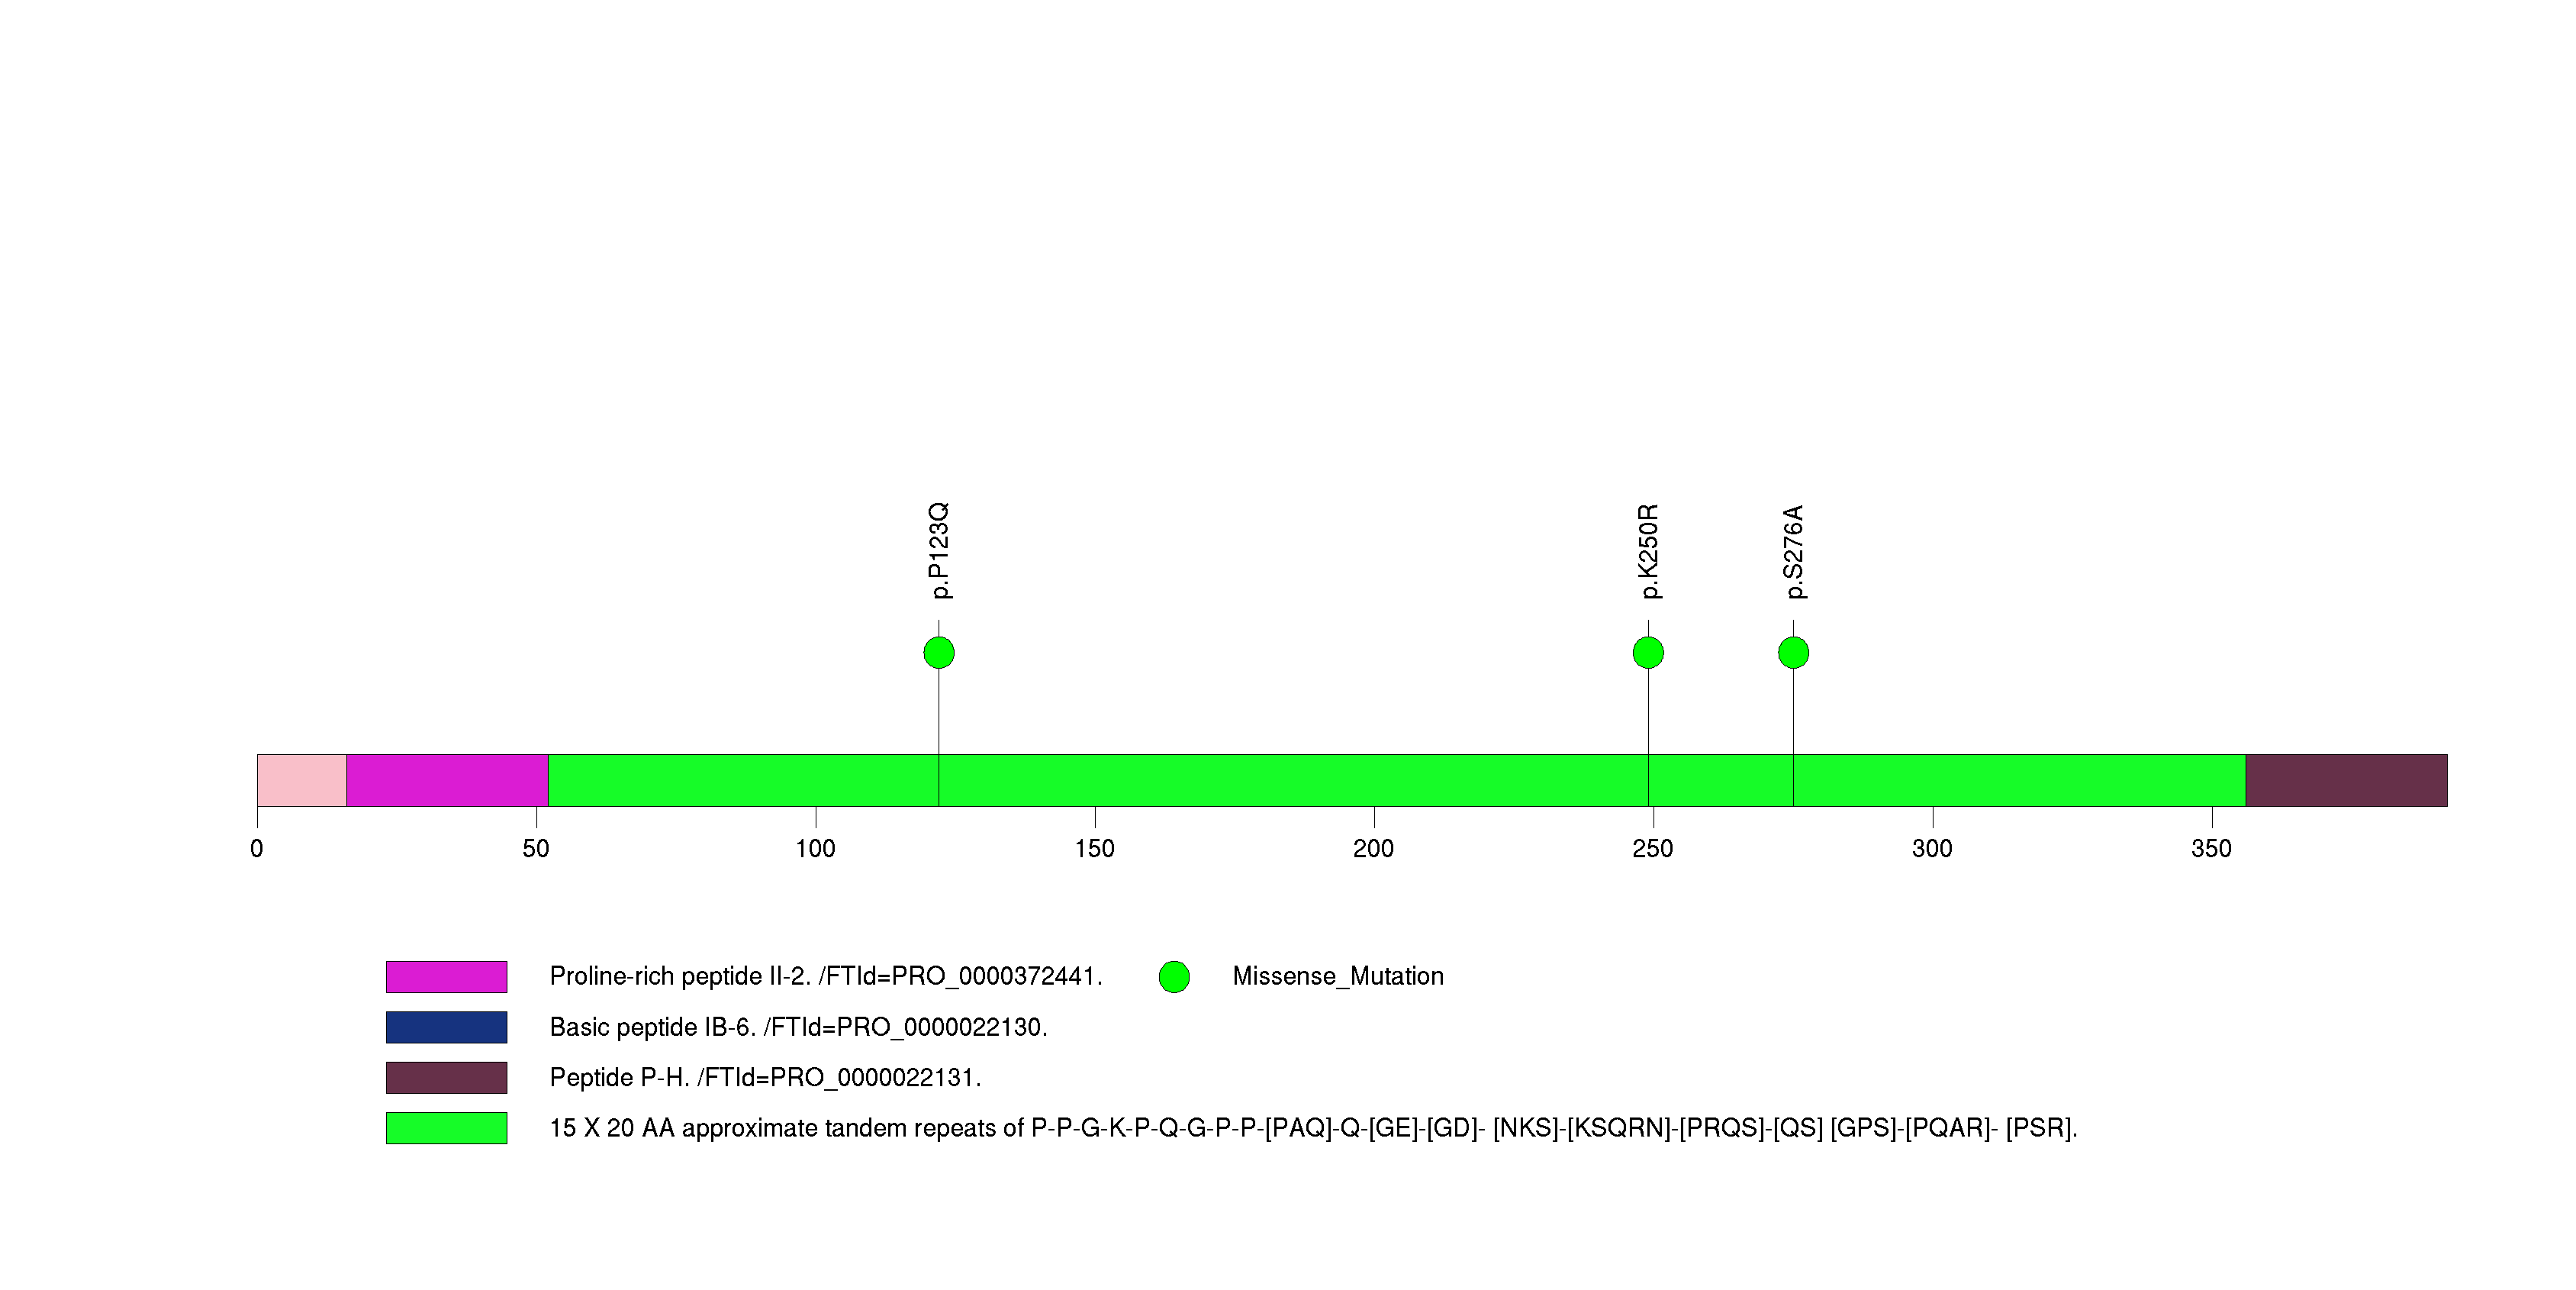
Figure S23. This figure depicts the distribution of mutations and mutation types across the CNTNAP5 significant gene.
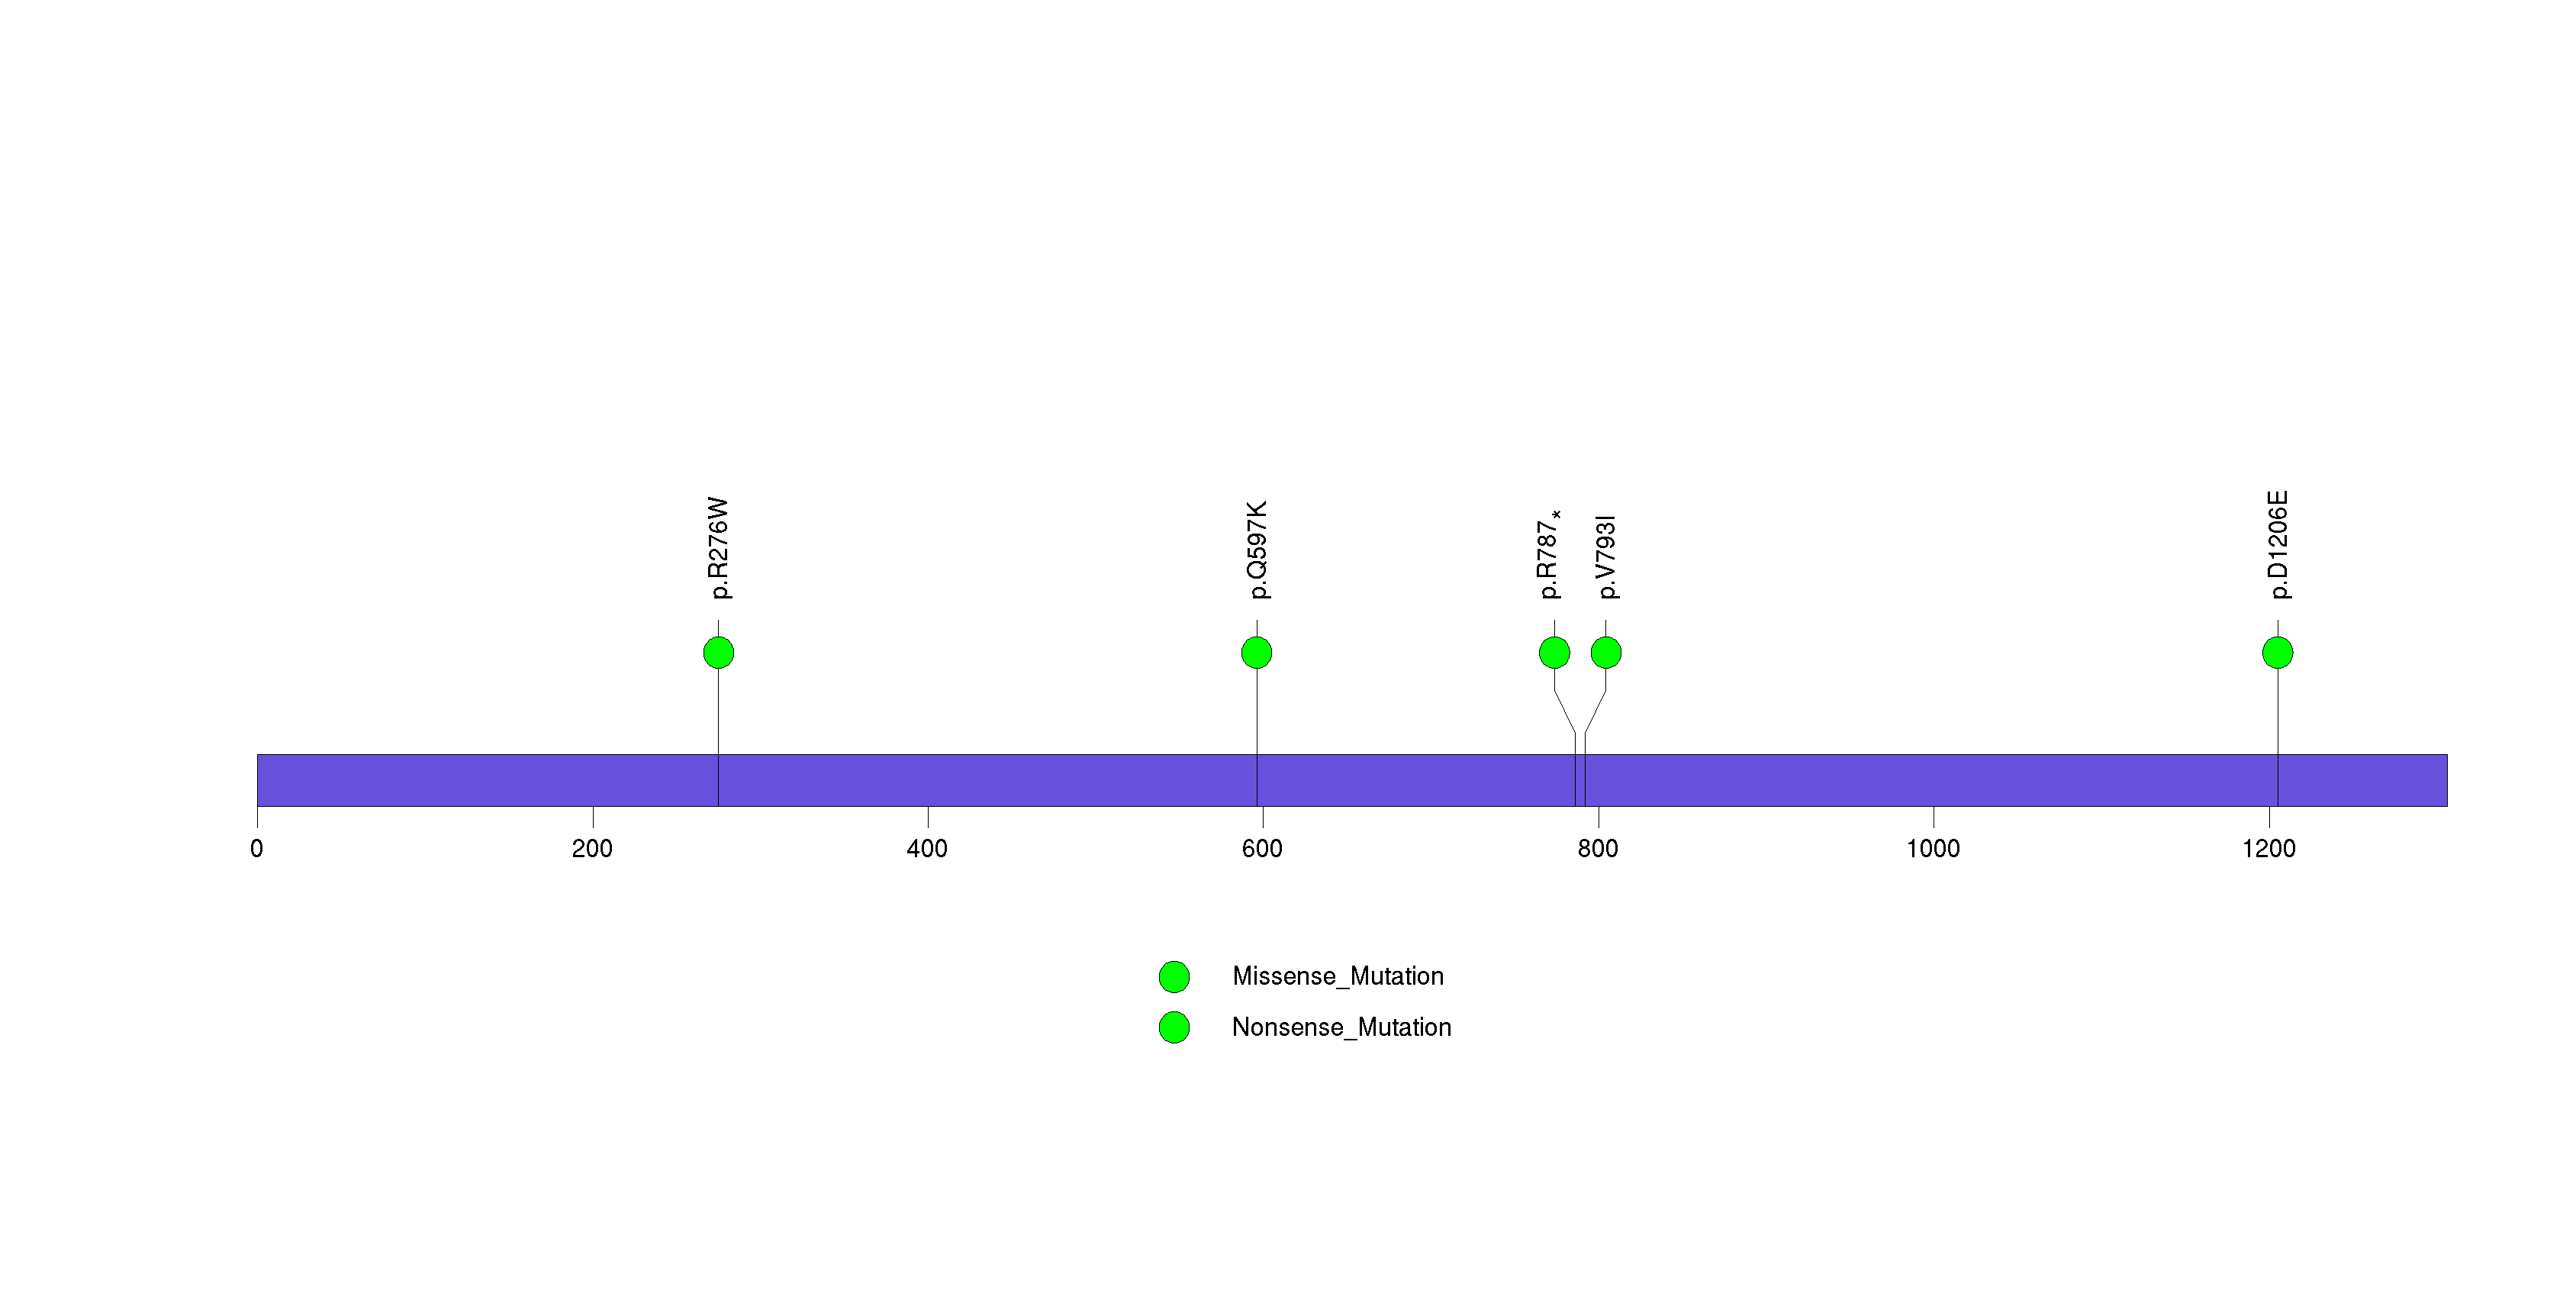
Figure S24. This figure depicts the distribution of mutations and mutation types across the PRIM2 significant gene.
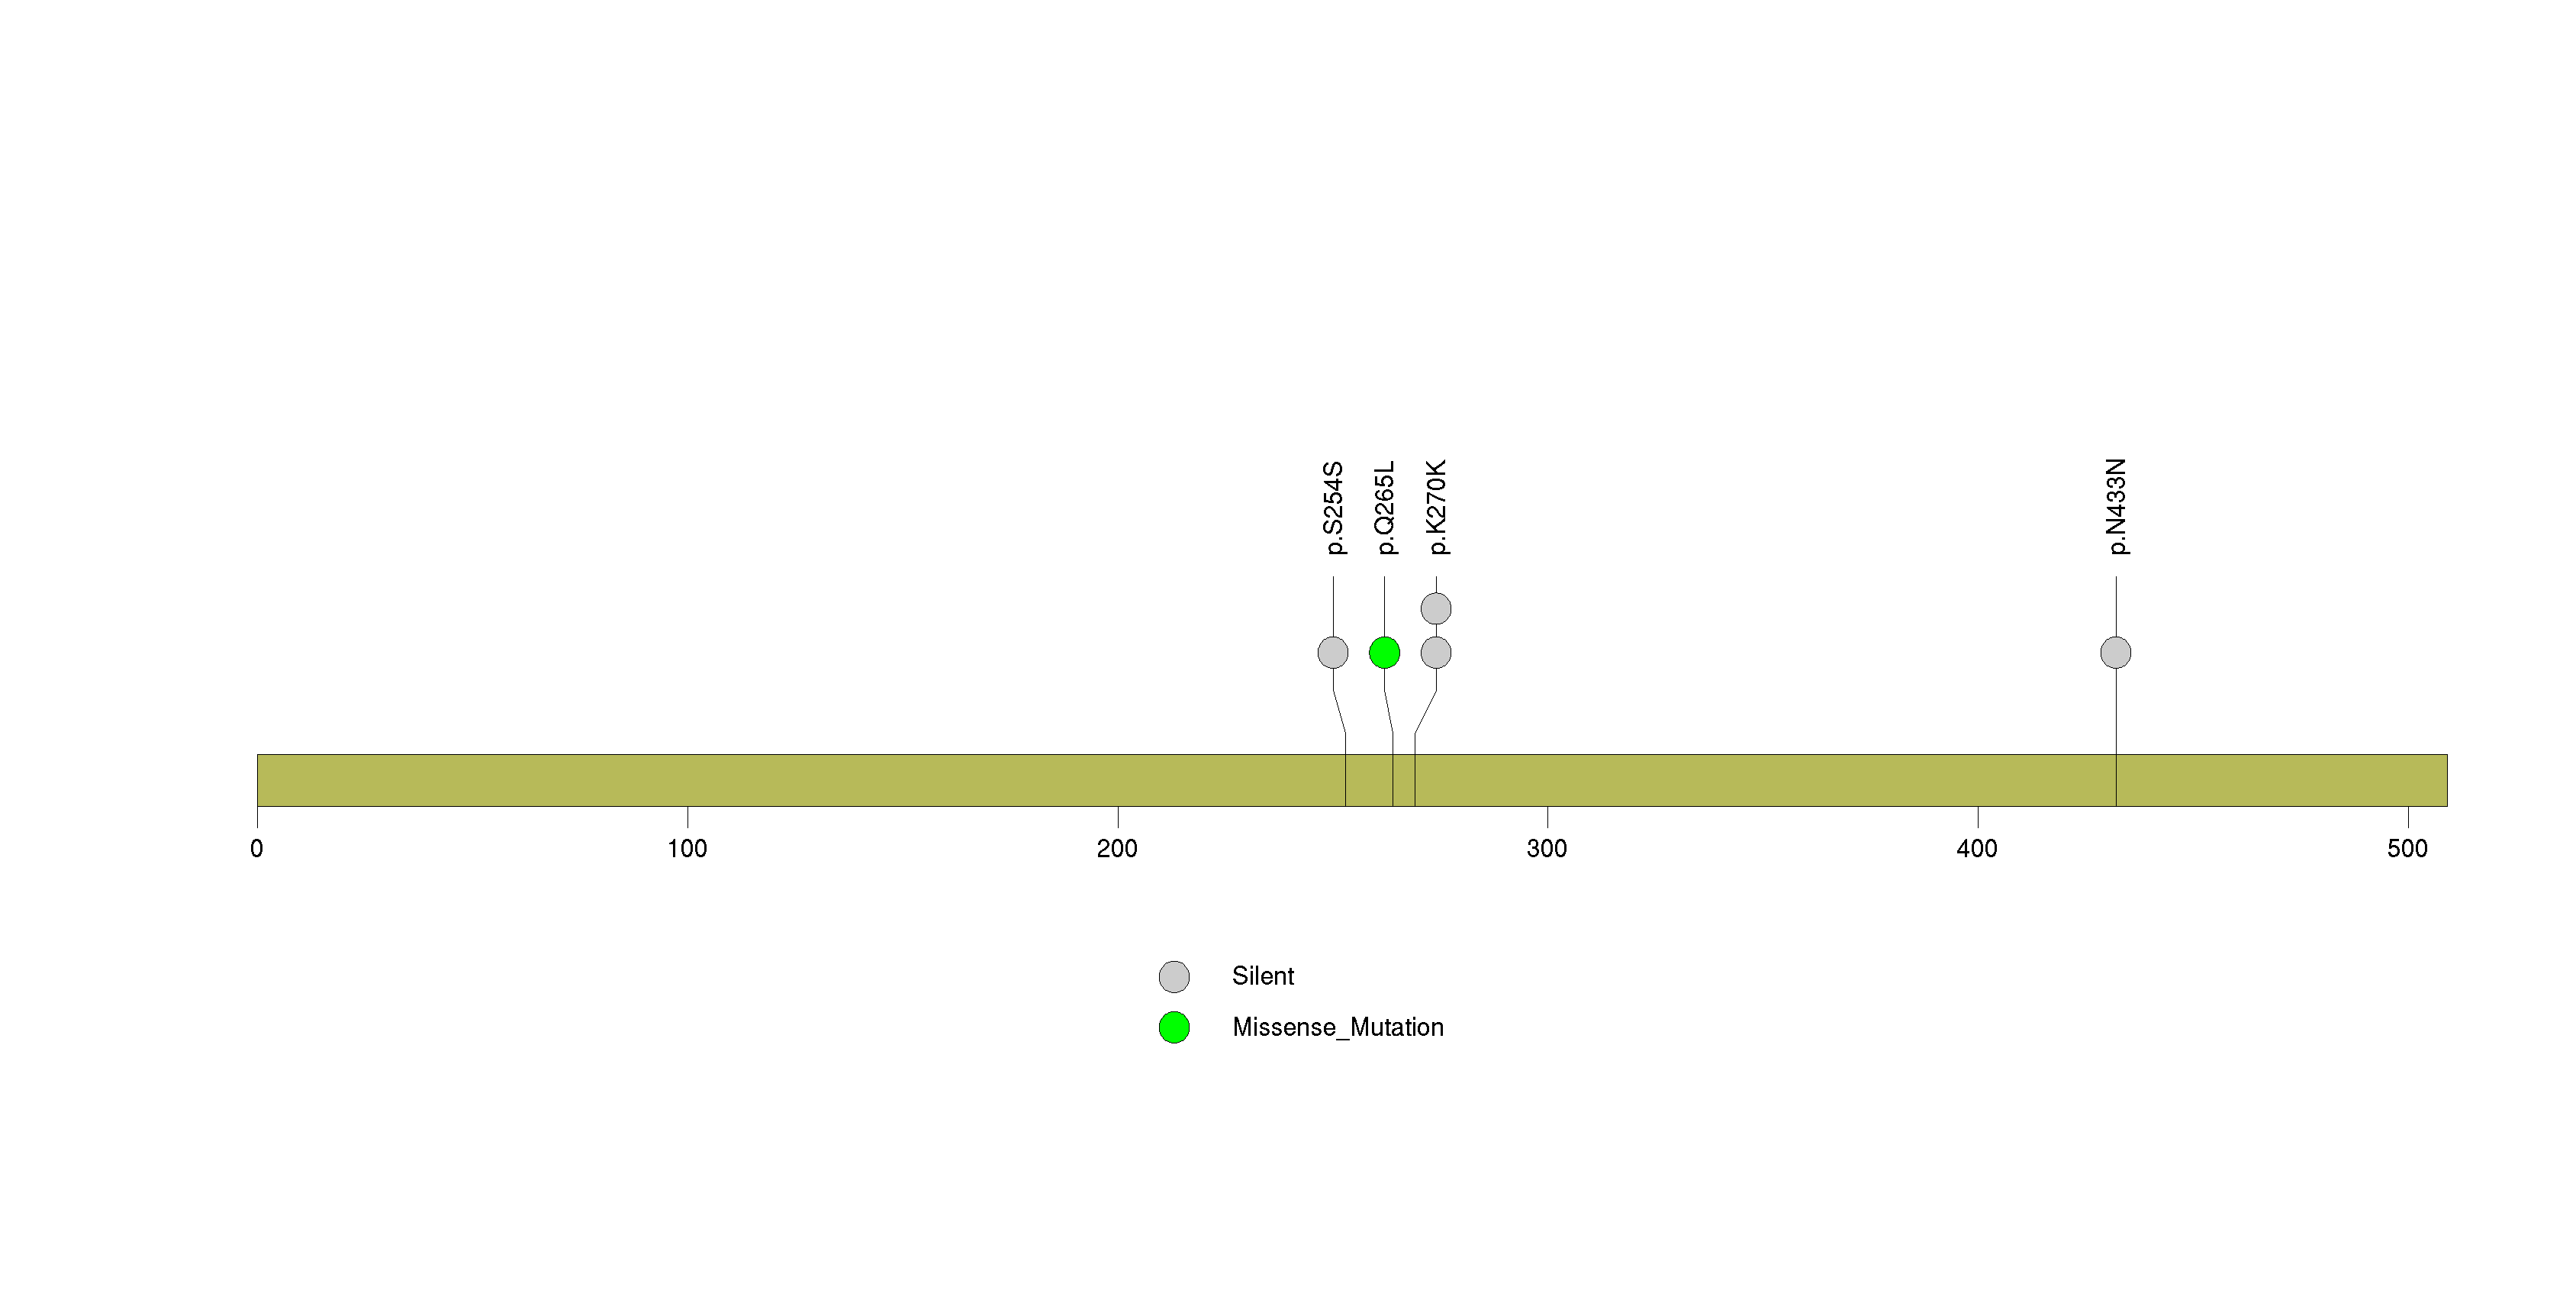
Figure S25. This figure depicts the distribution of mutations and mutation types across the CROCC significant gene.
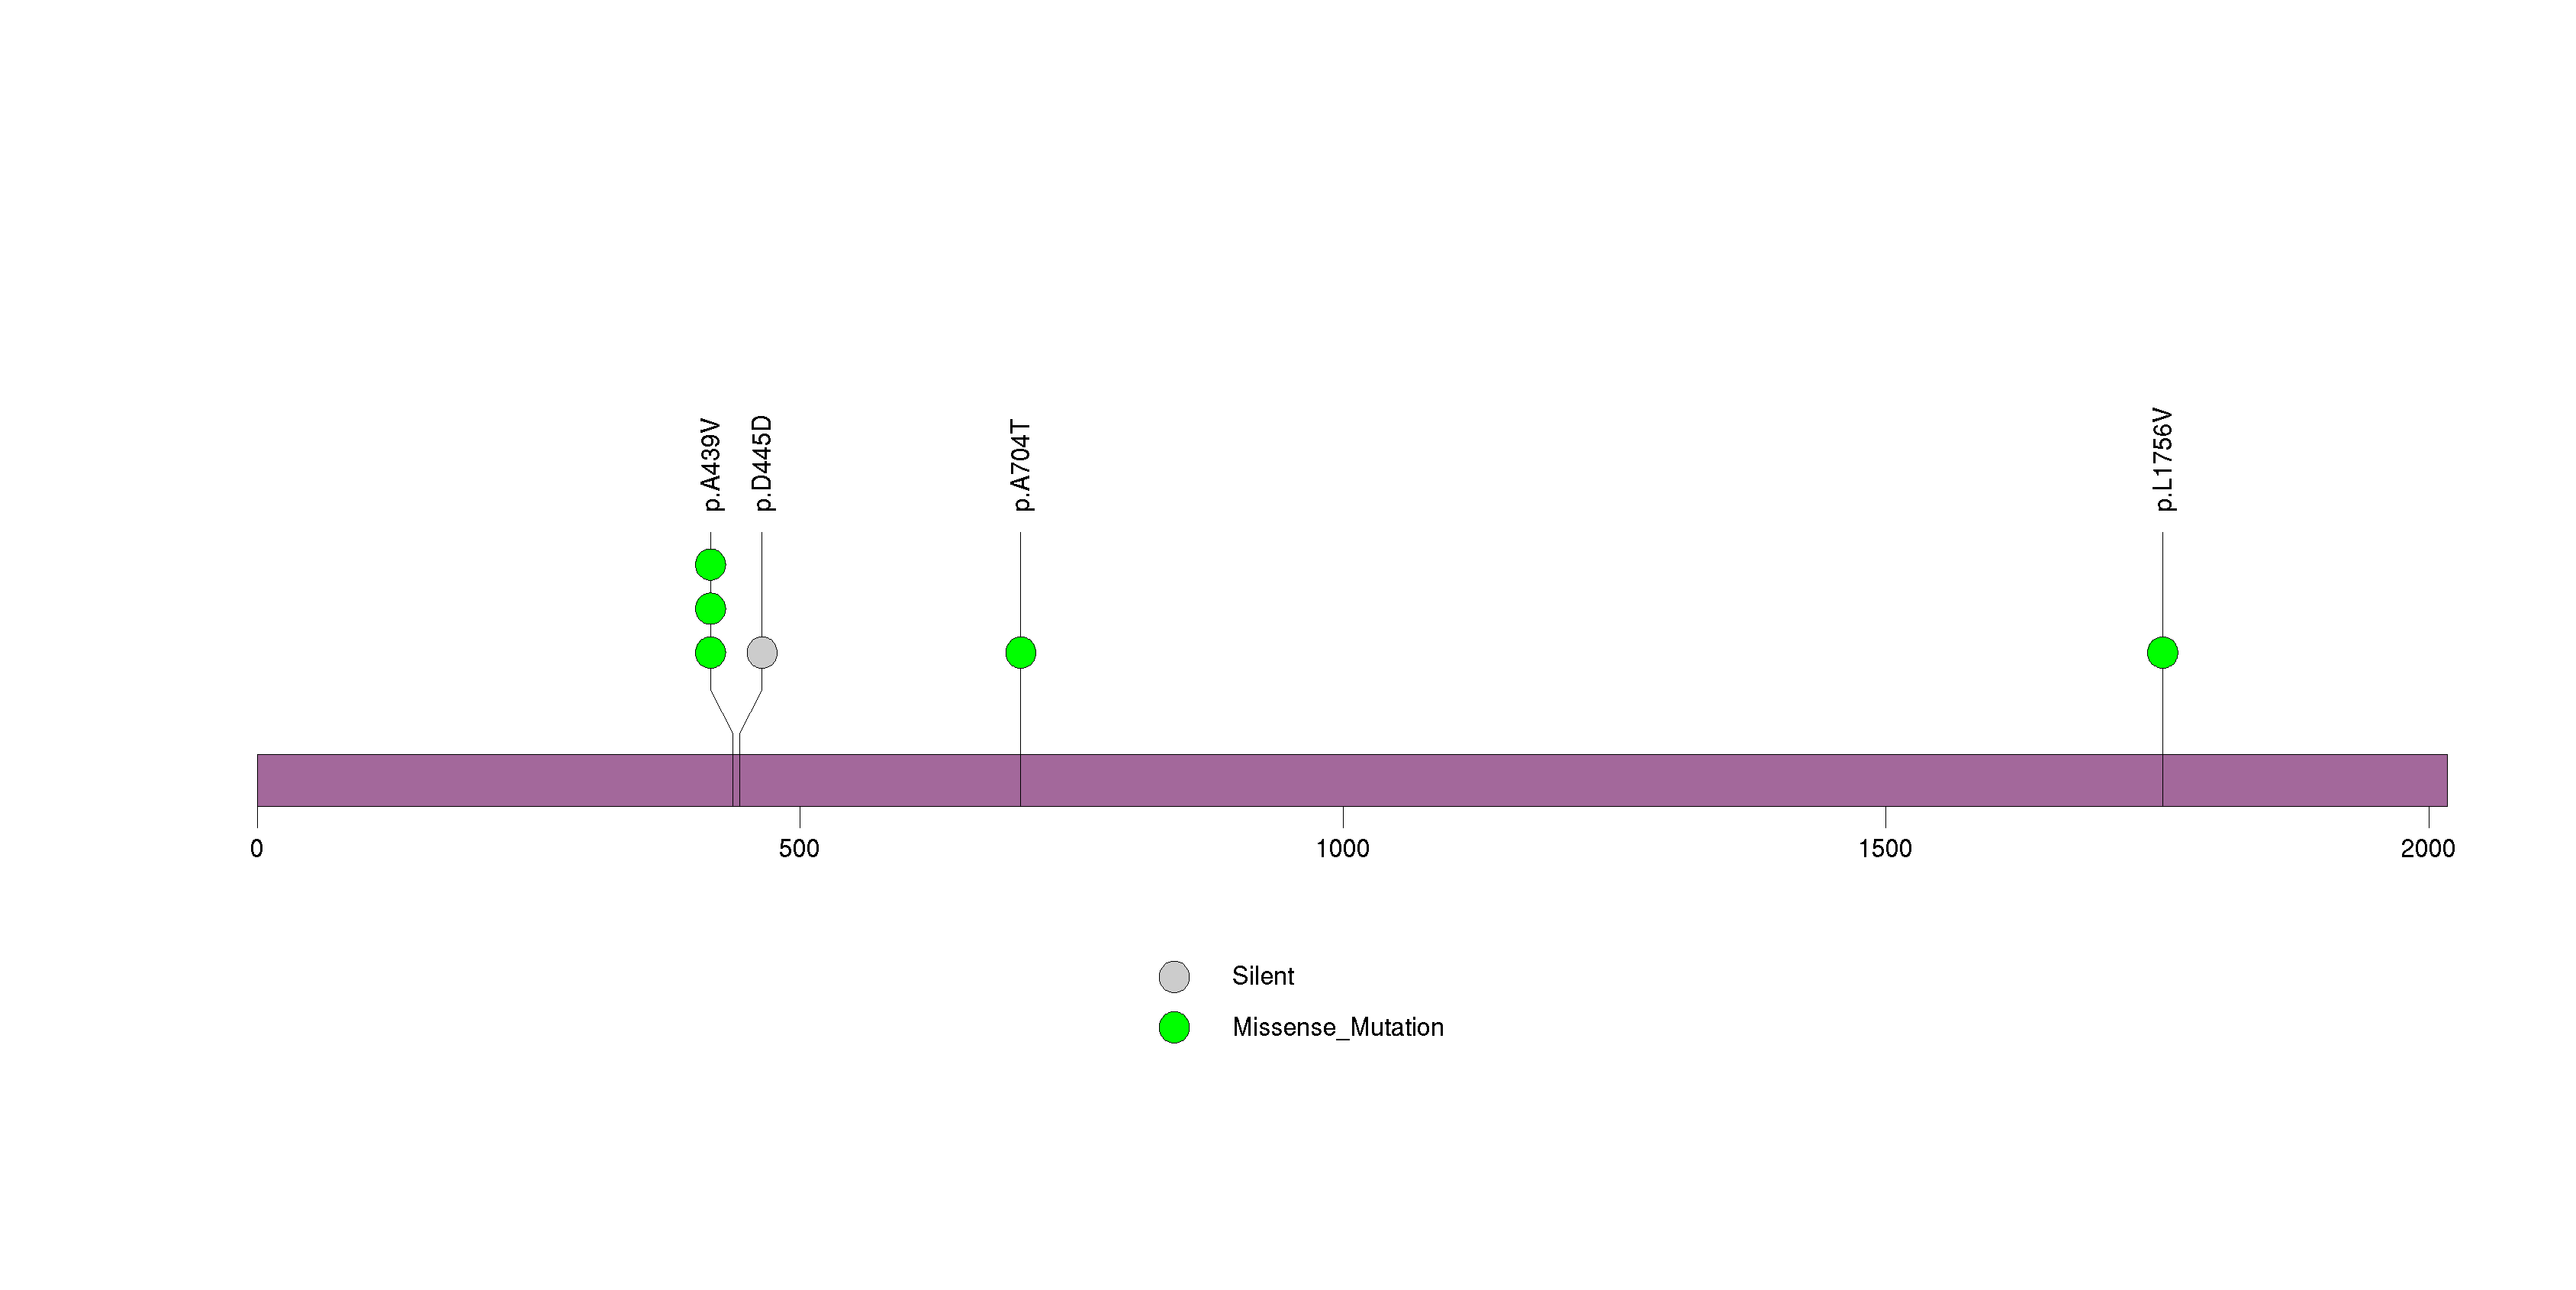
Figure S26. This figure depicts the distribution of mutations and mutation types across the TTLL11 significant gene.
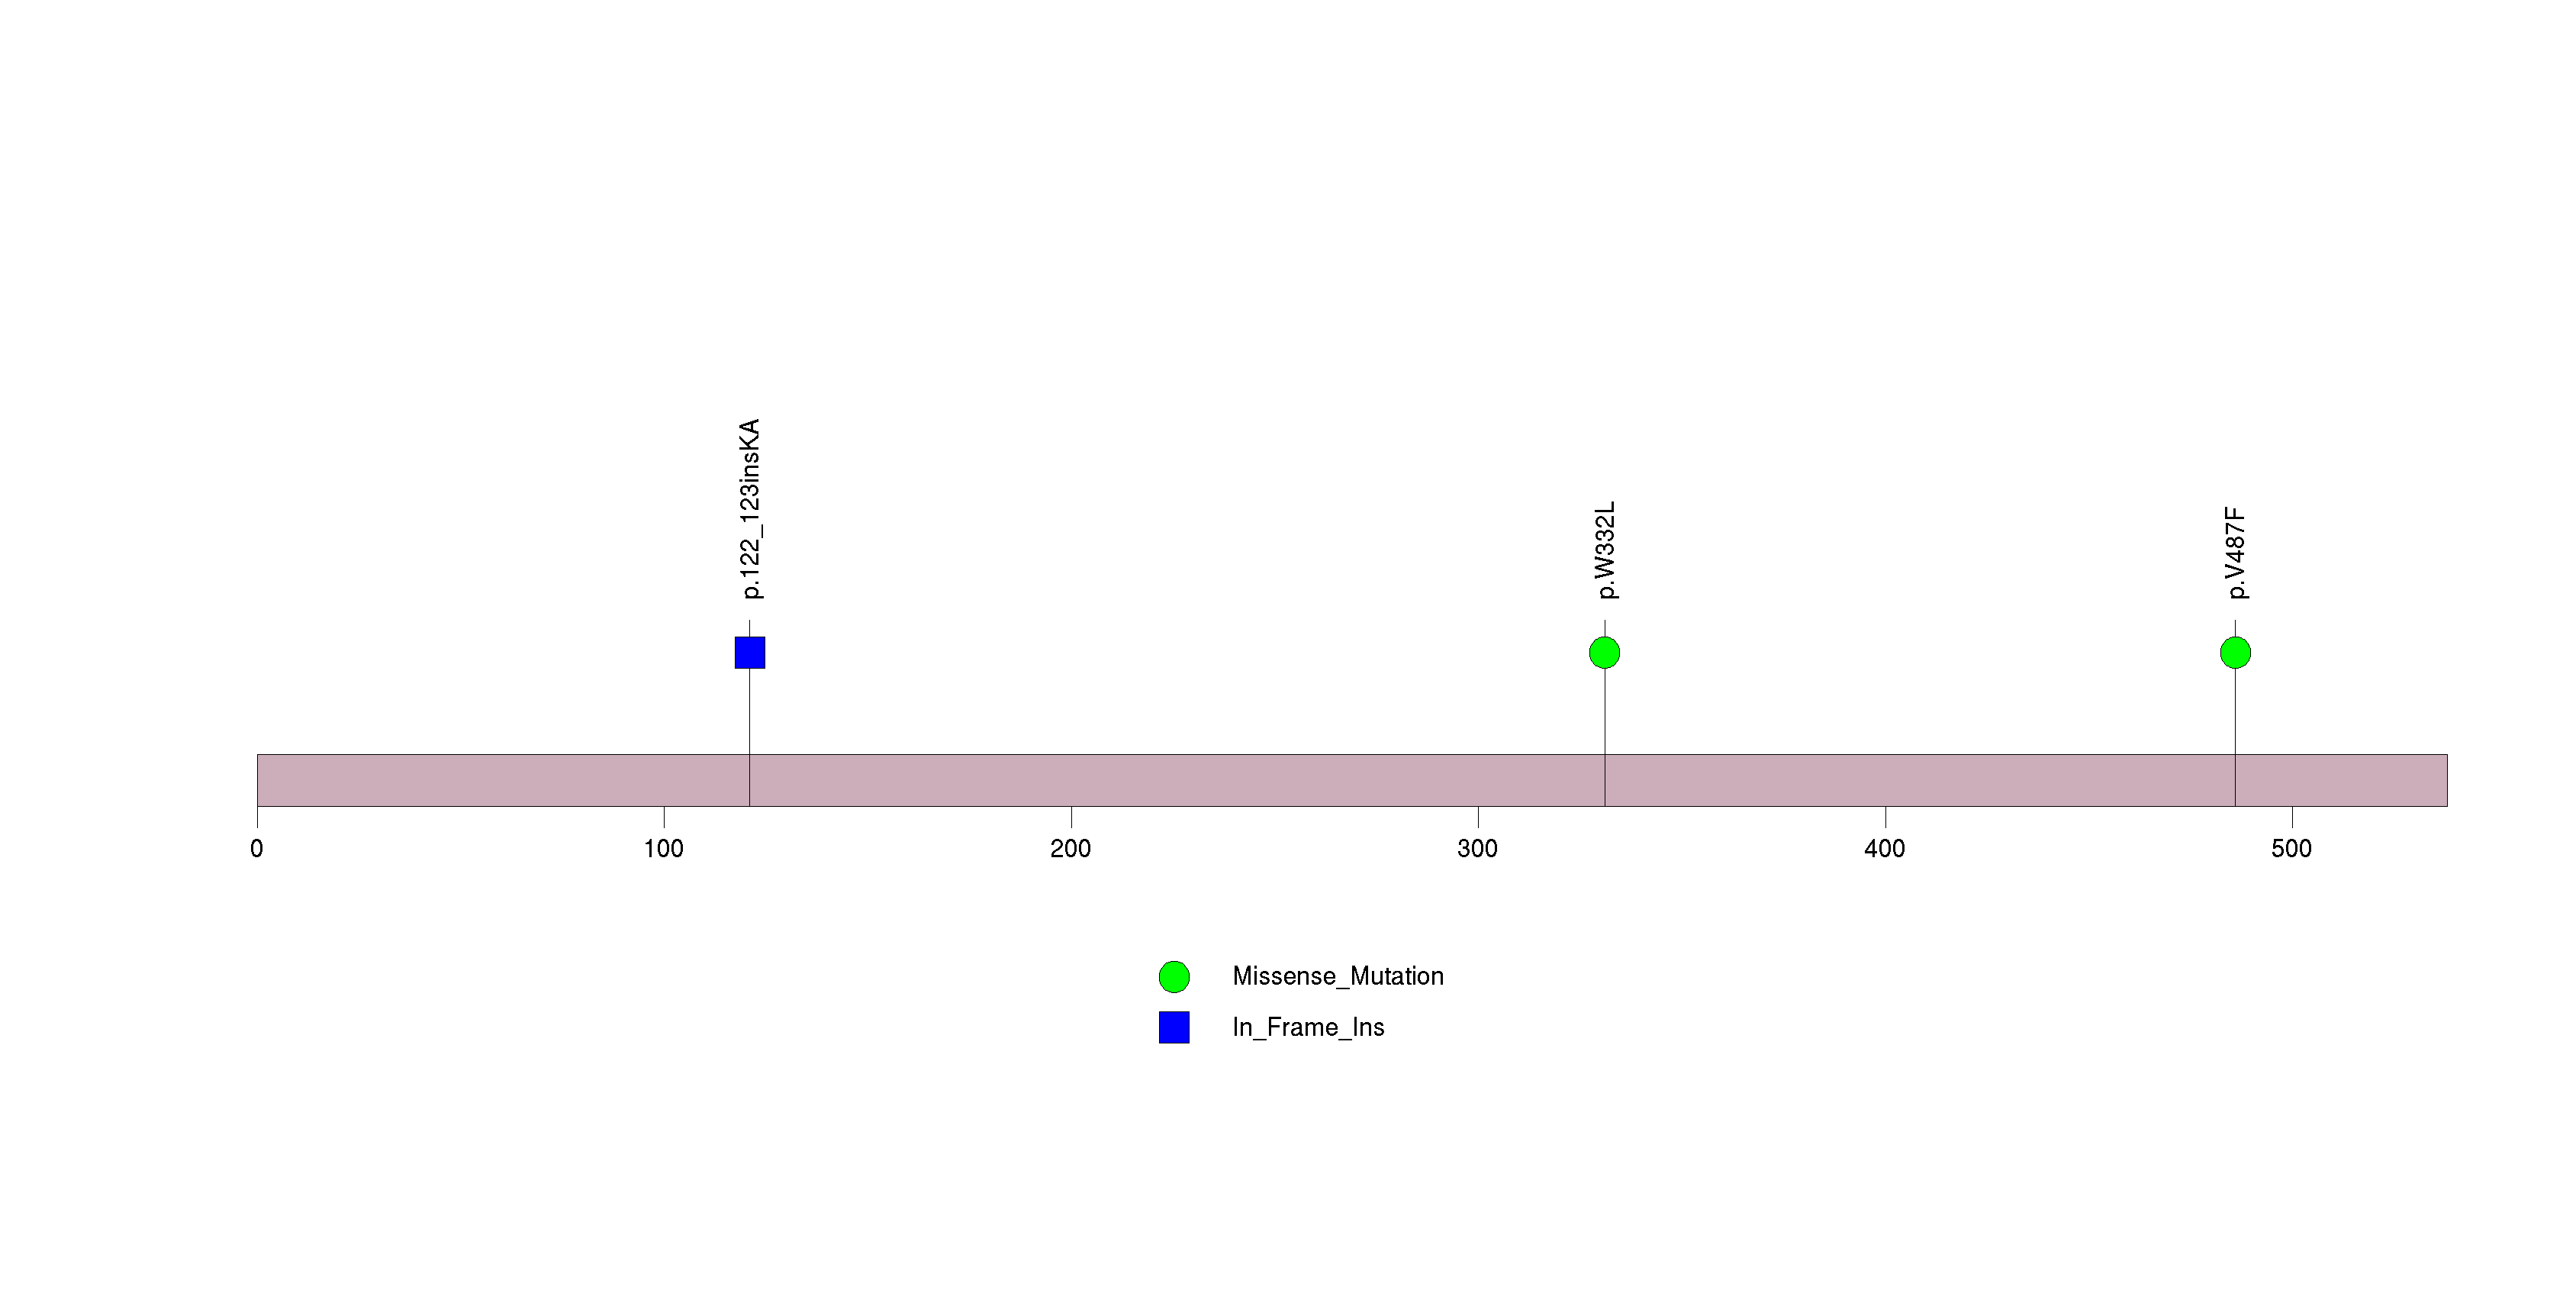
Figure S27. This figure depicts the distribution of mutations and mutation types across the PDE4DIP significant gene.
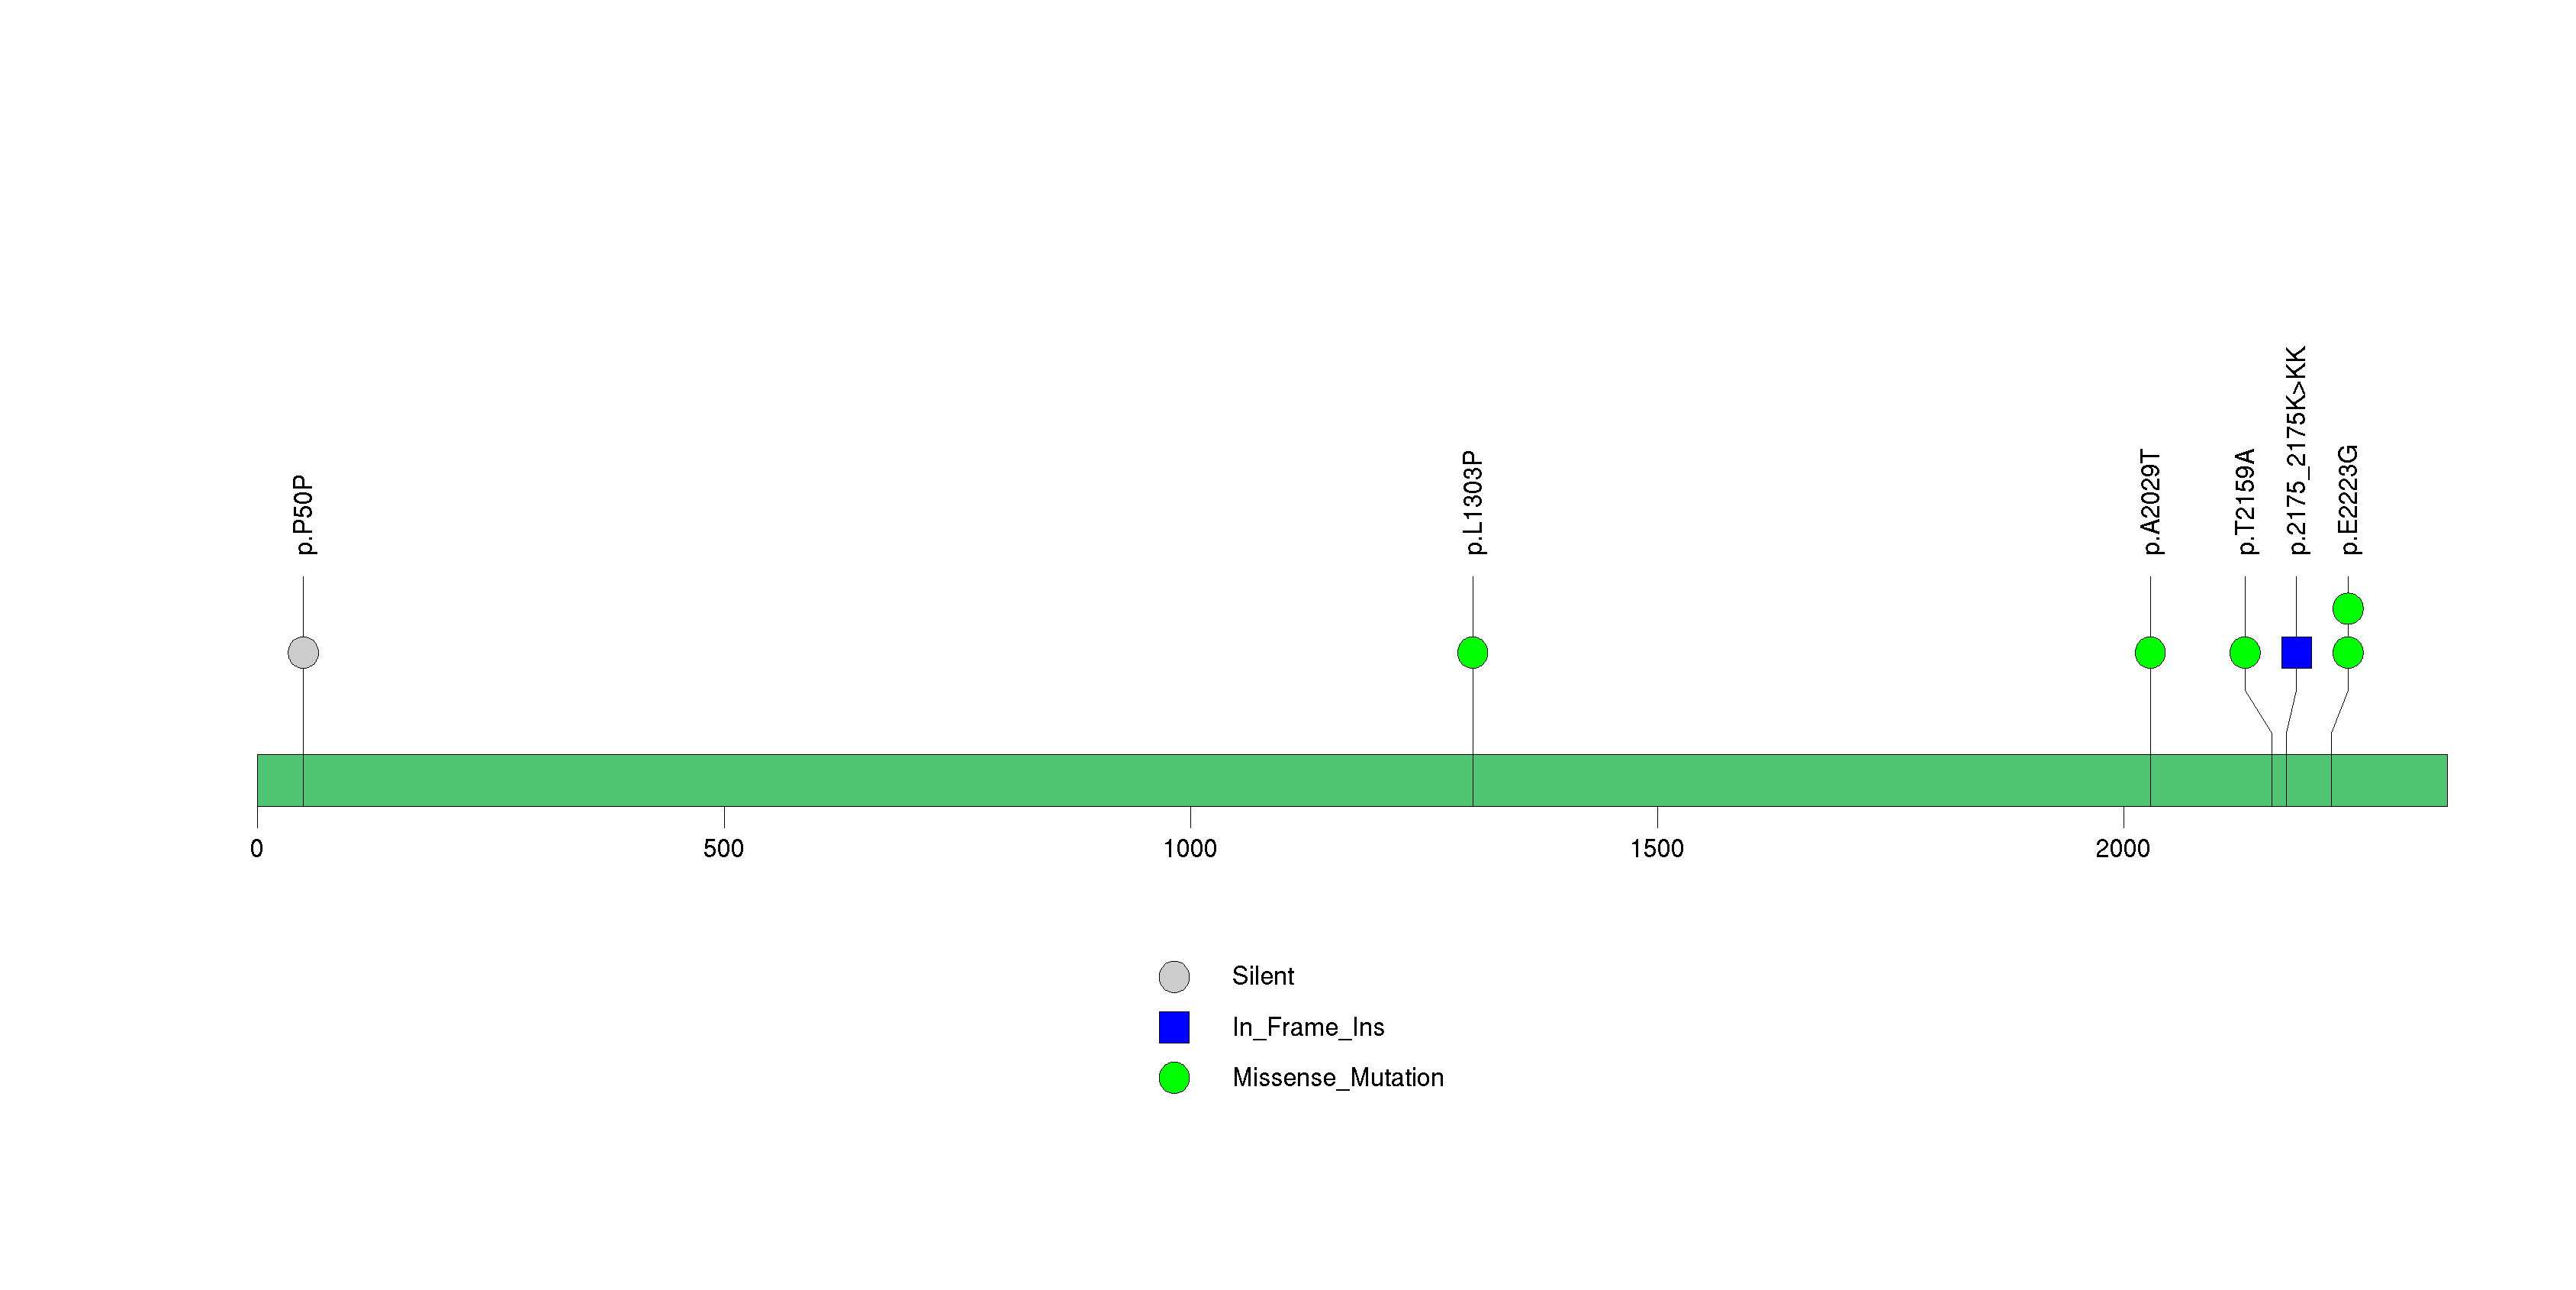
Figure S28. This figure depicts the distribution of mutations and mutation types across the POTEC significant gene.
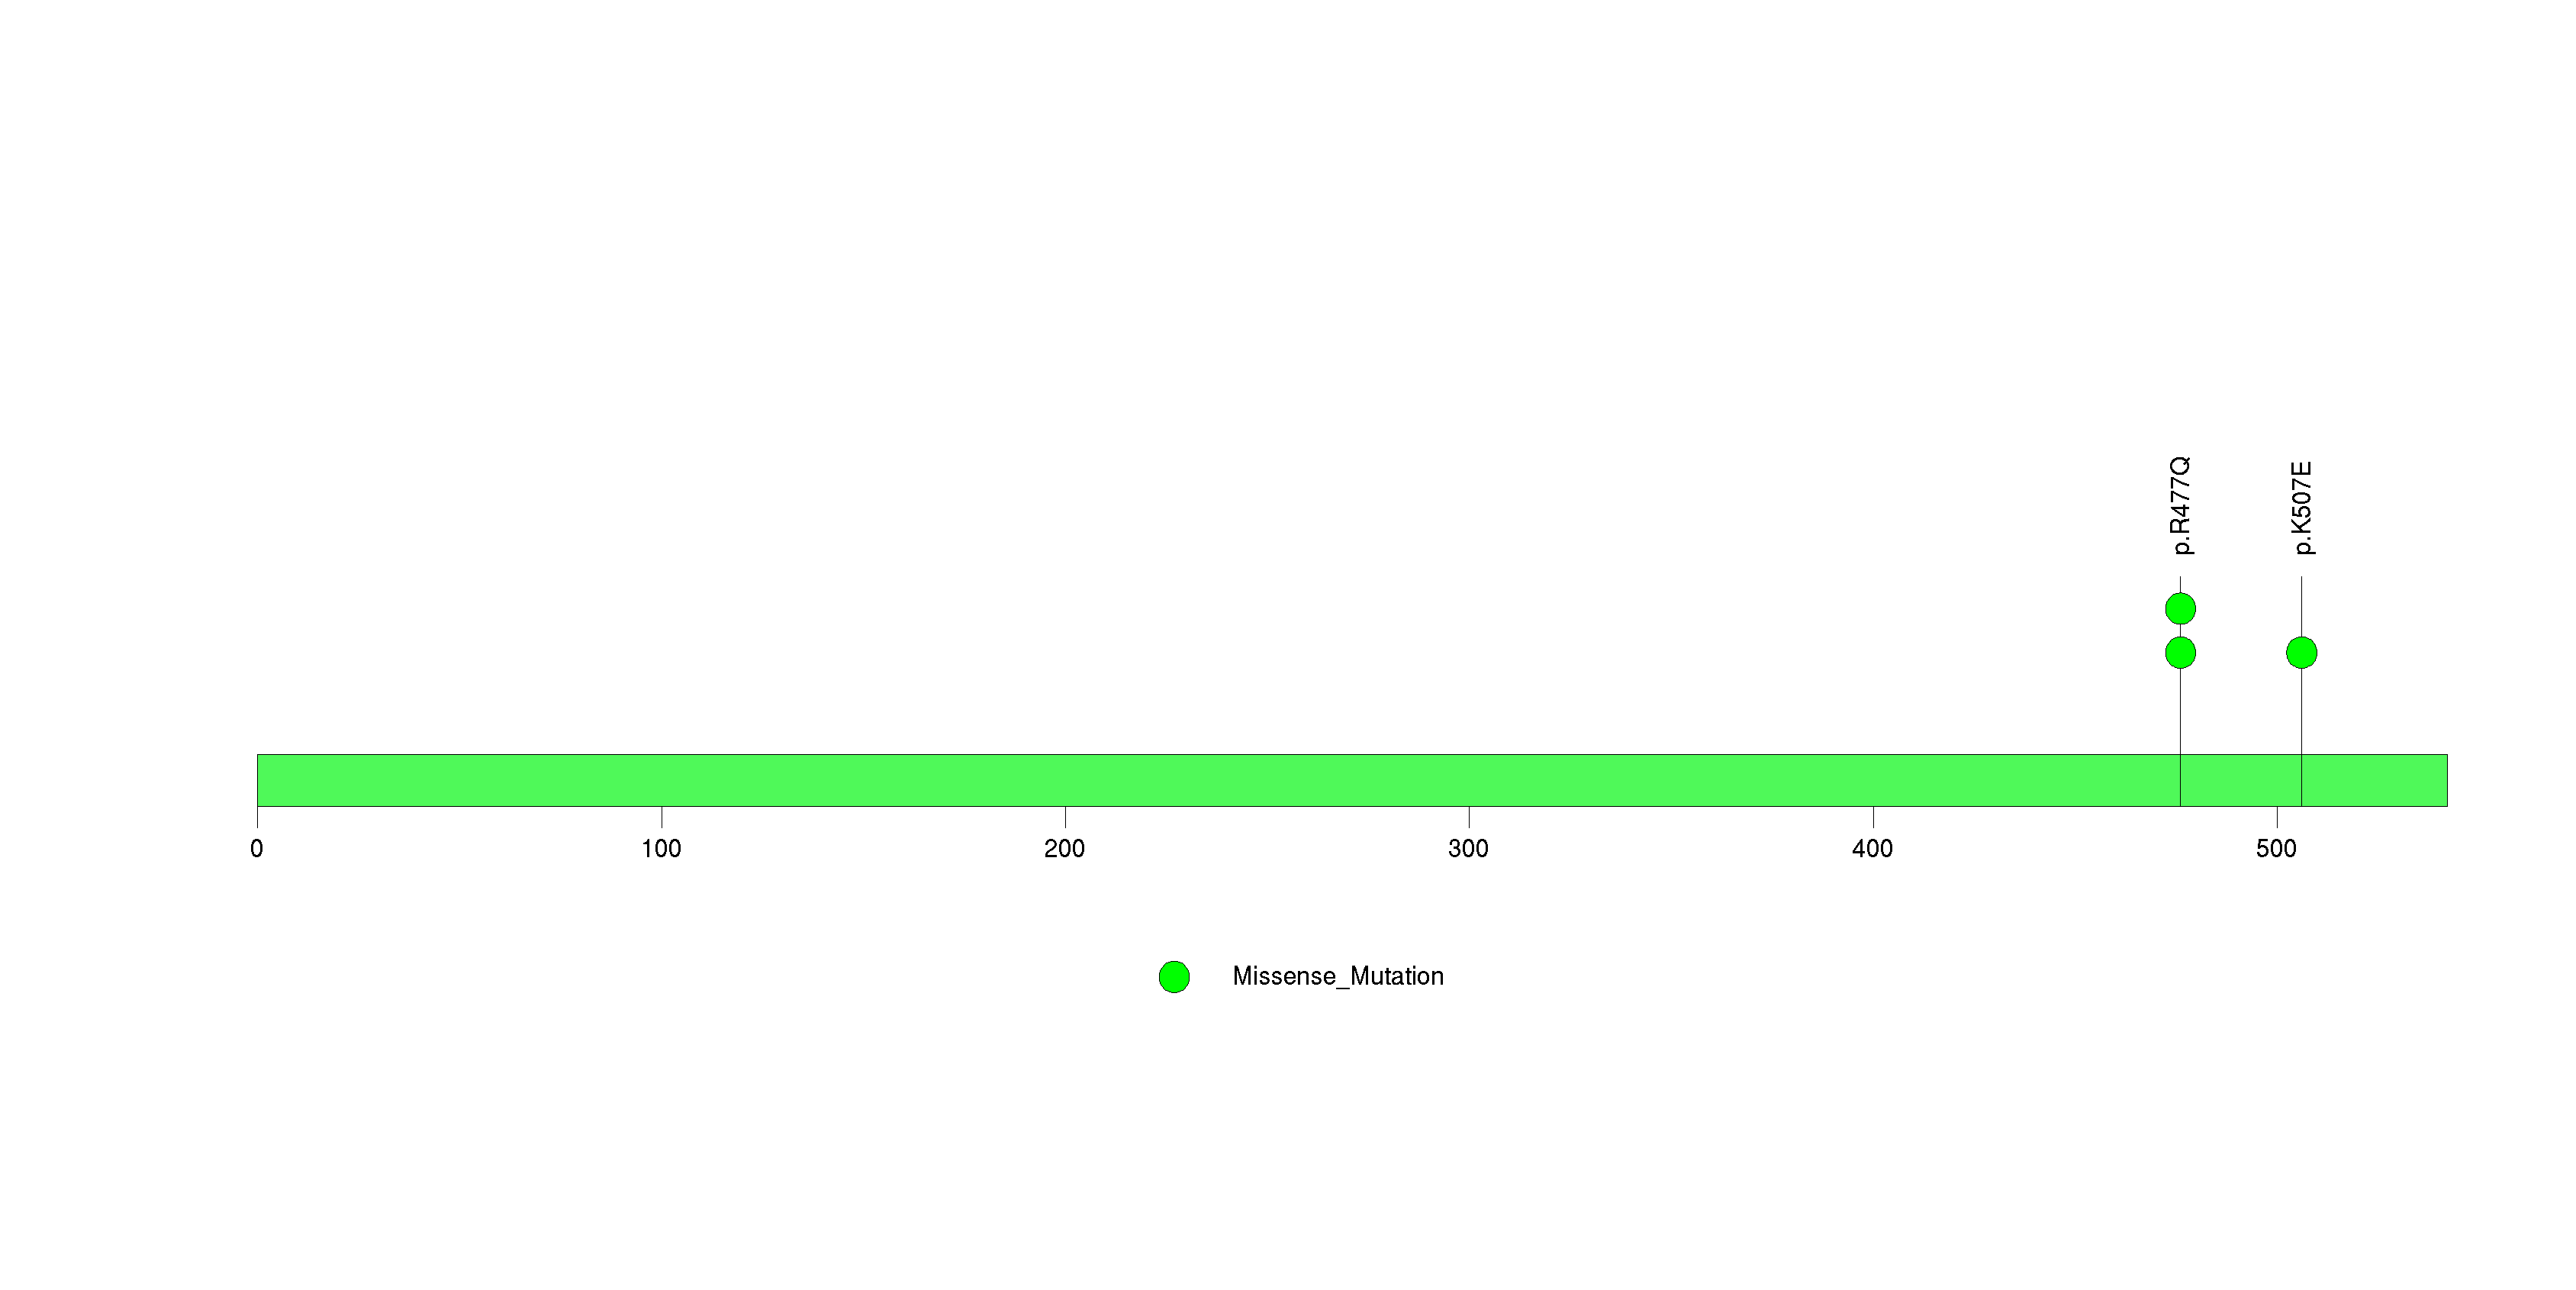
Figure S29. This figure depicts the distribution of mutations and mutation types across the OR5L2 significant gene.
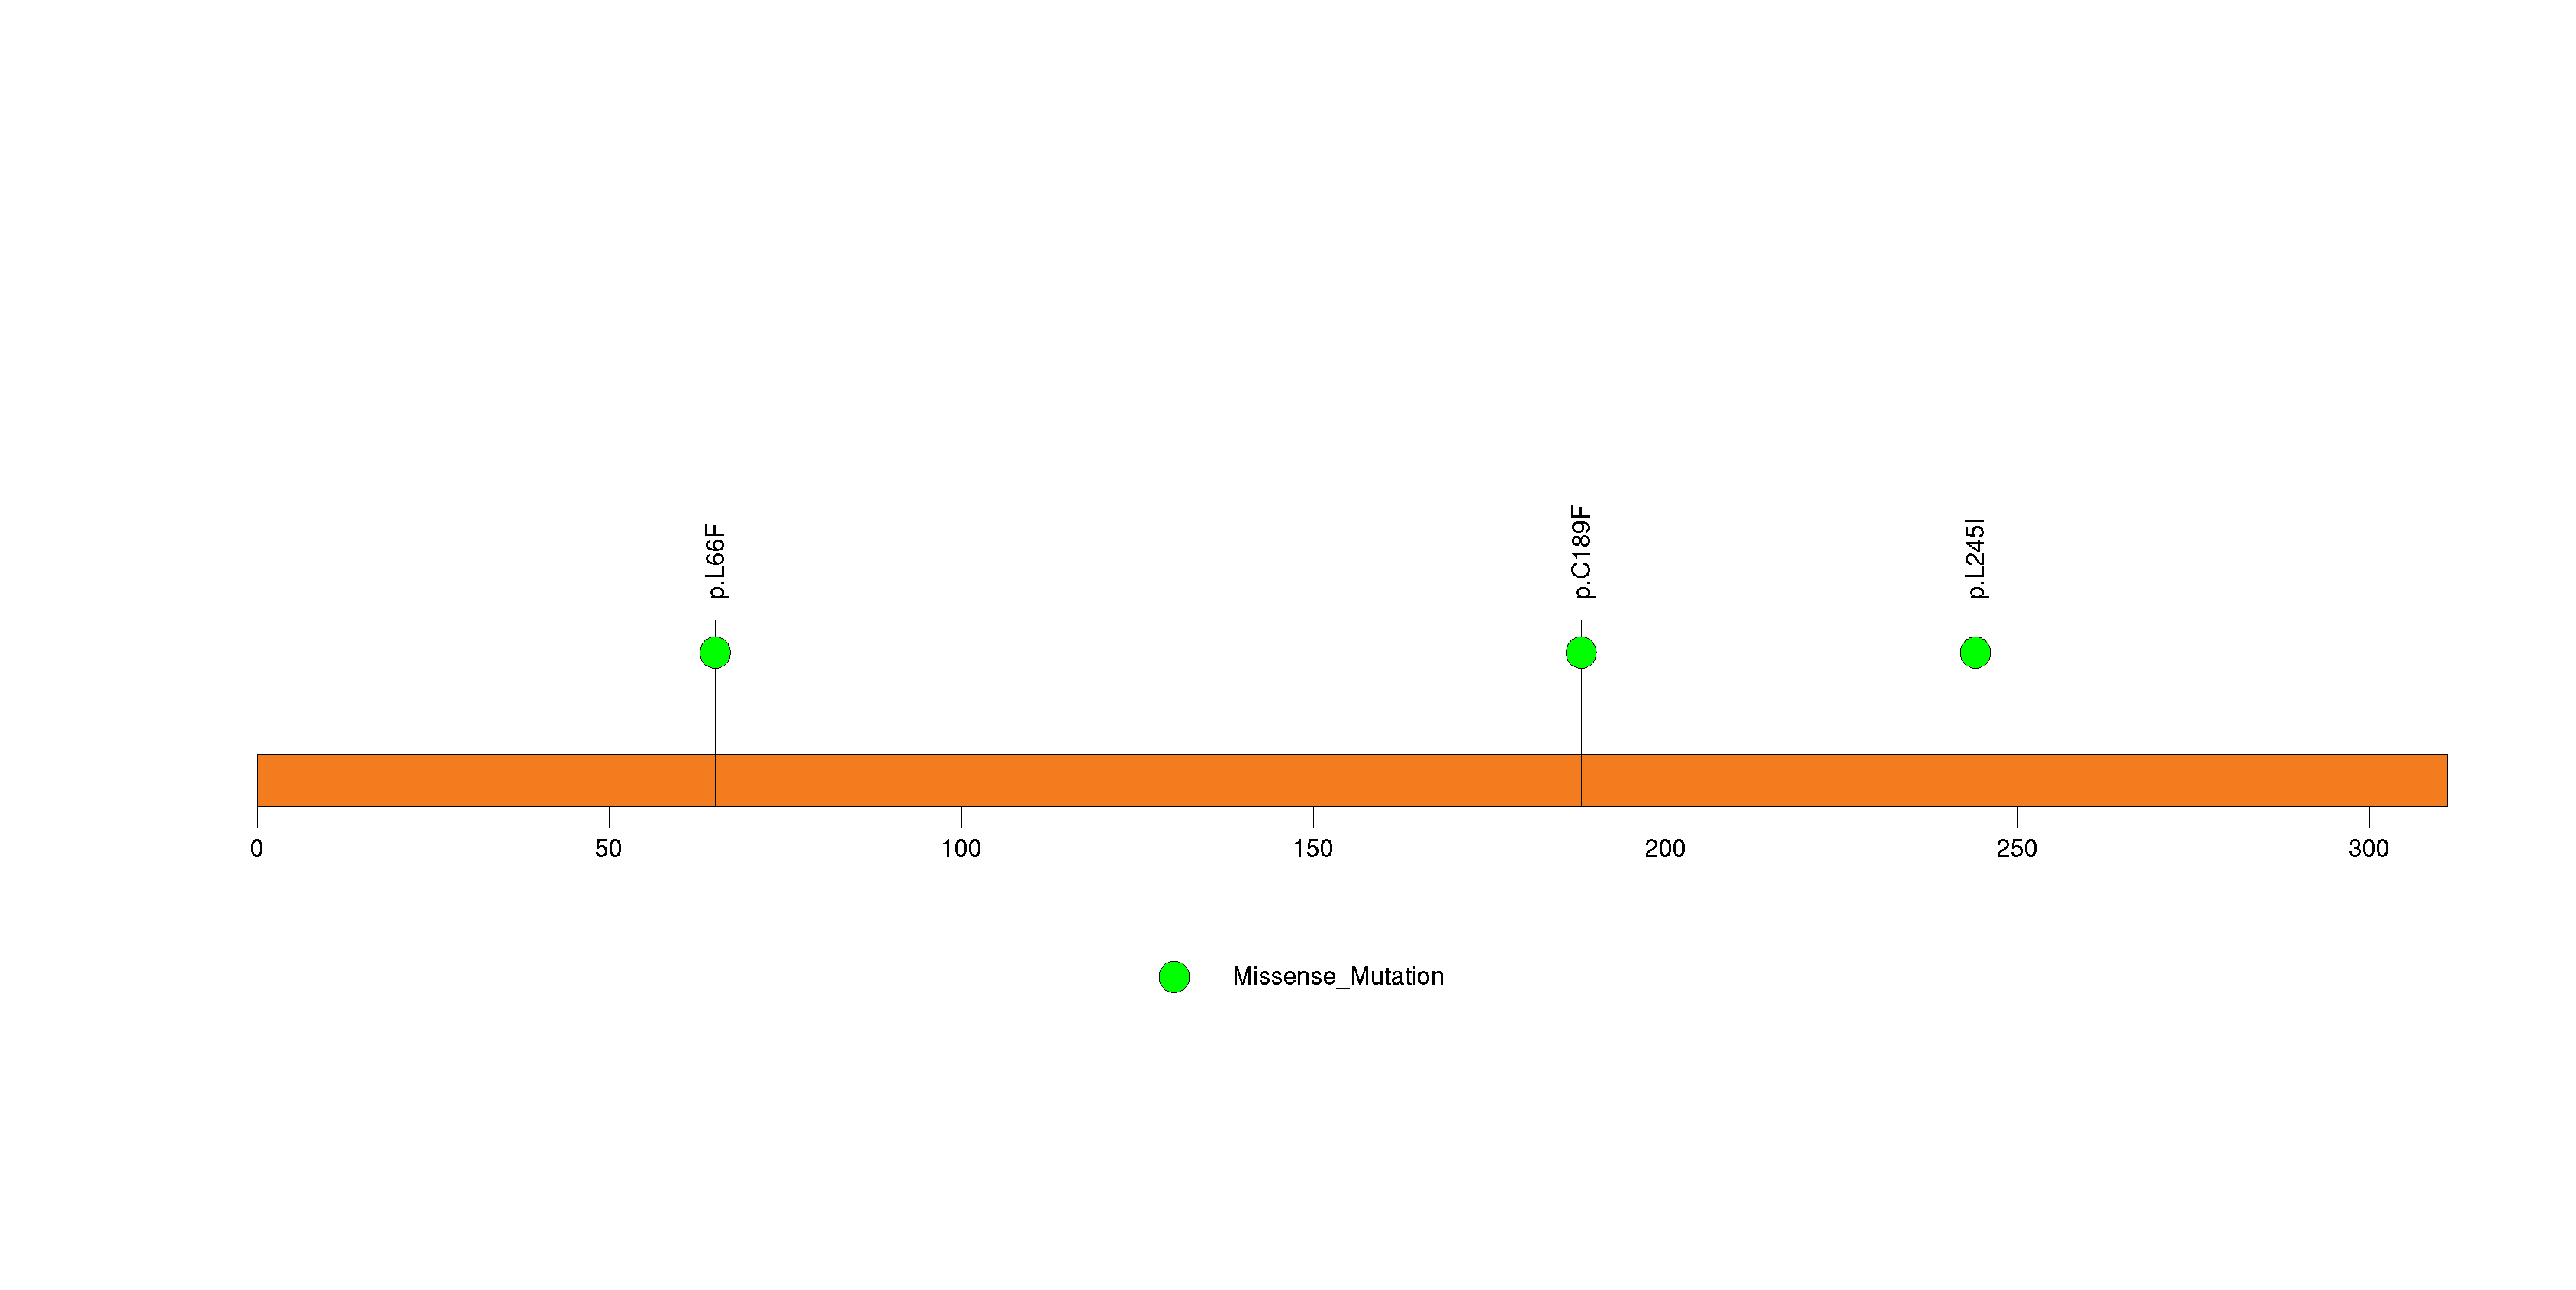
Figure S30. This figure depicts the distribution of mutations and mutation types across the YBX1 significant gene.
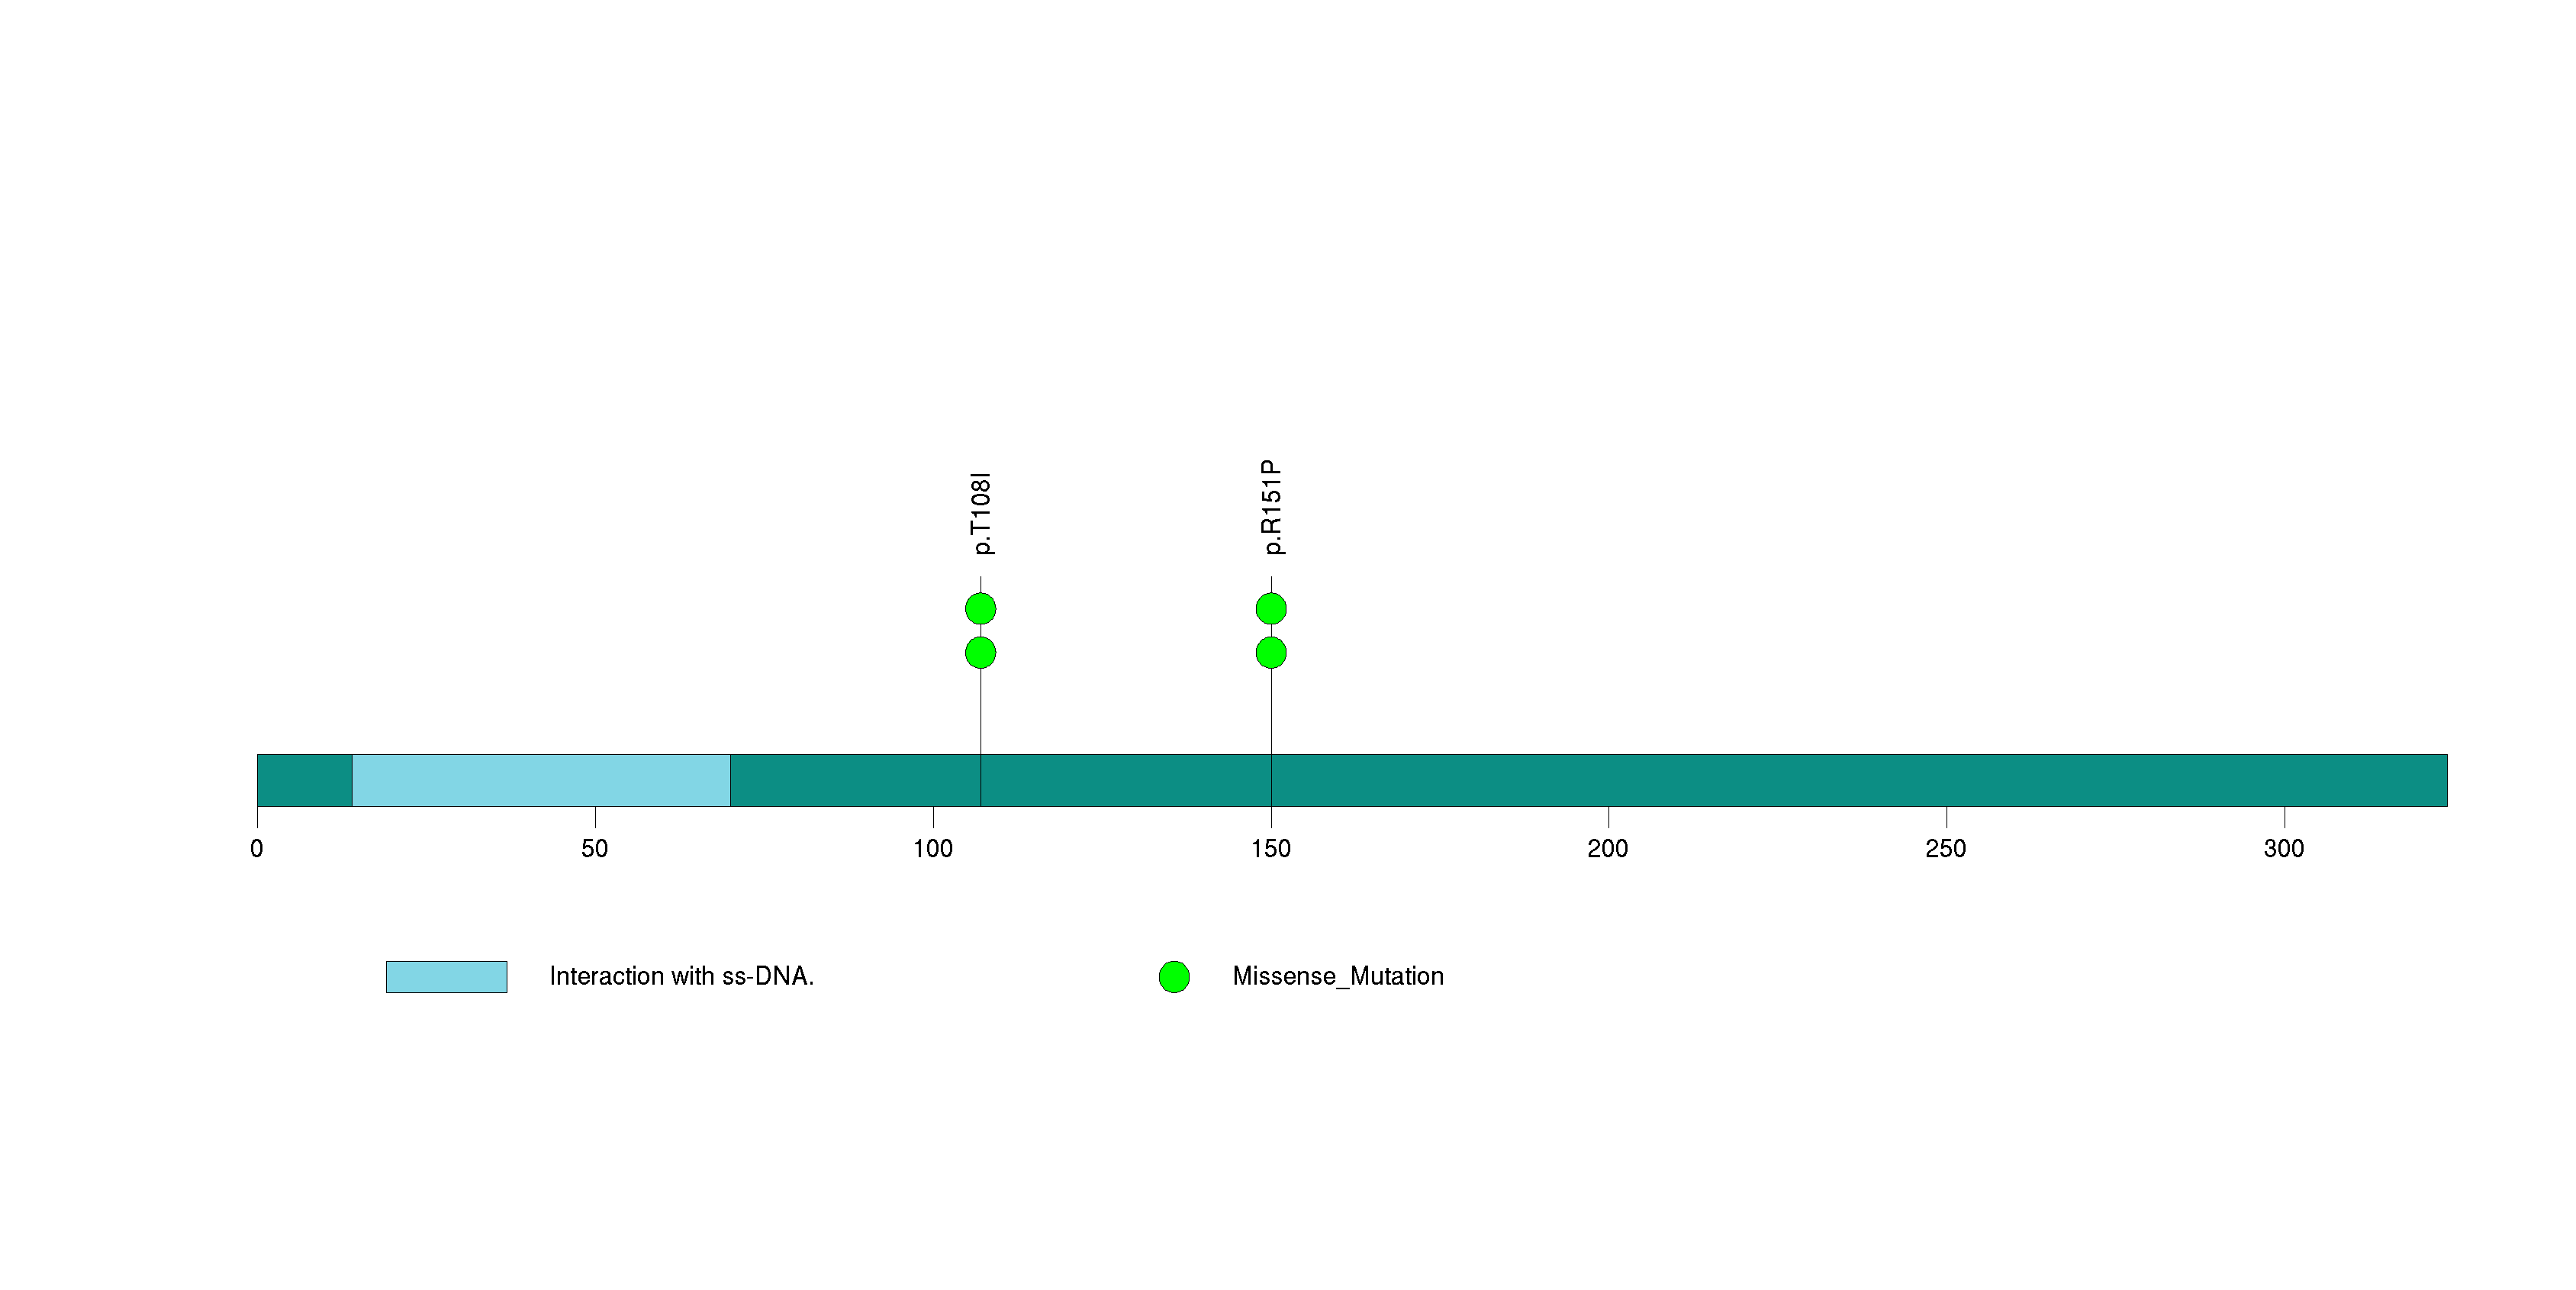
Figure S31. This figure depicts the distribution of mutations and mutation types across the AIM2 significant gene.
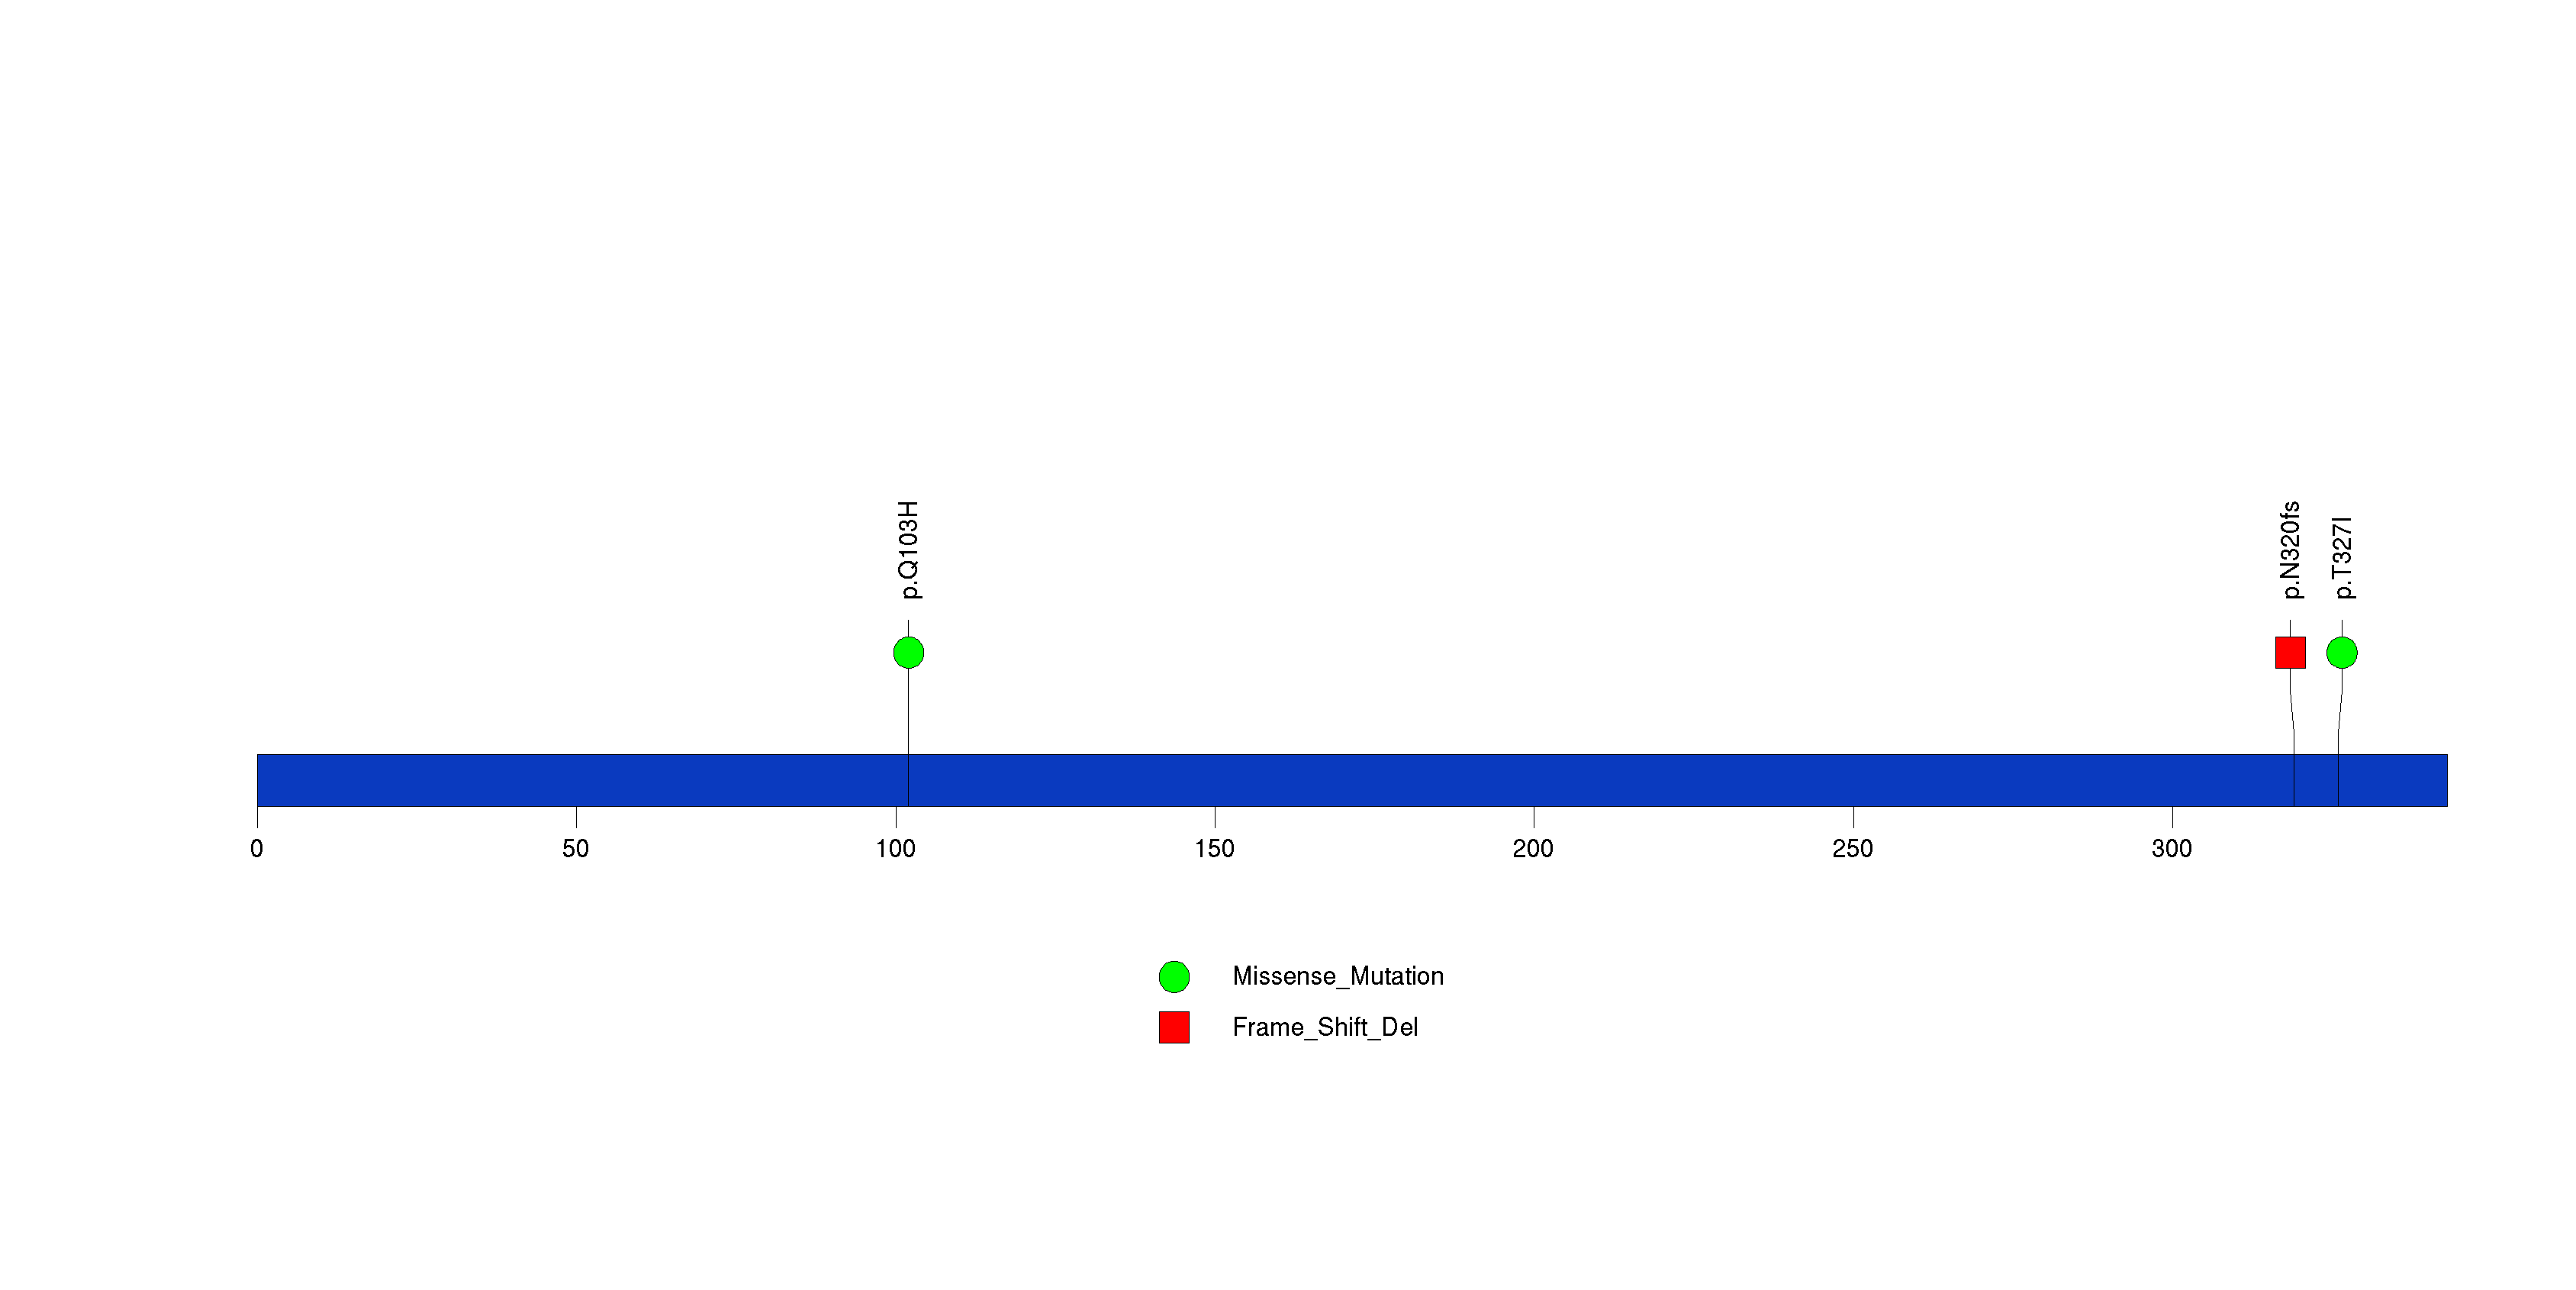
Figure S32. This figure depicts the distribution of mutations and mutation types across the FIP1L1 significant gene.
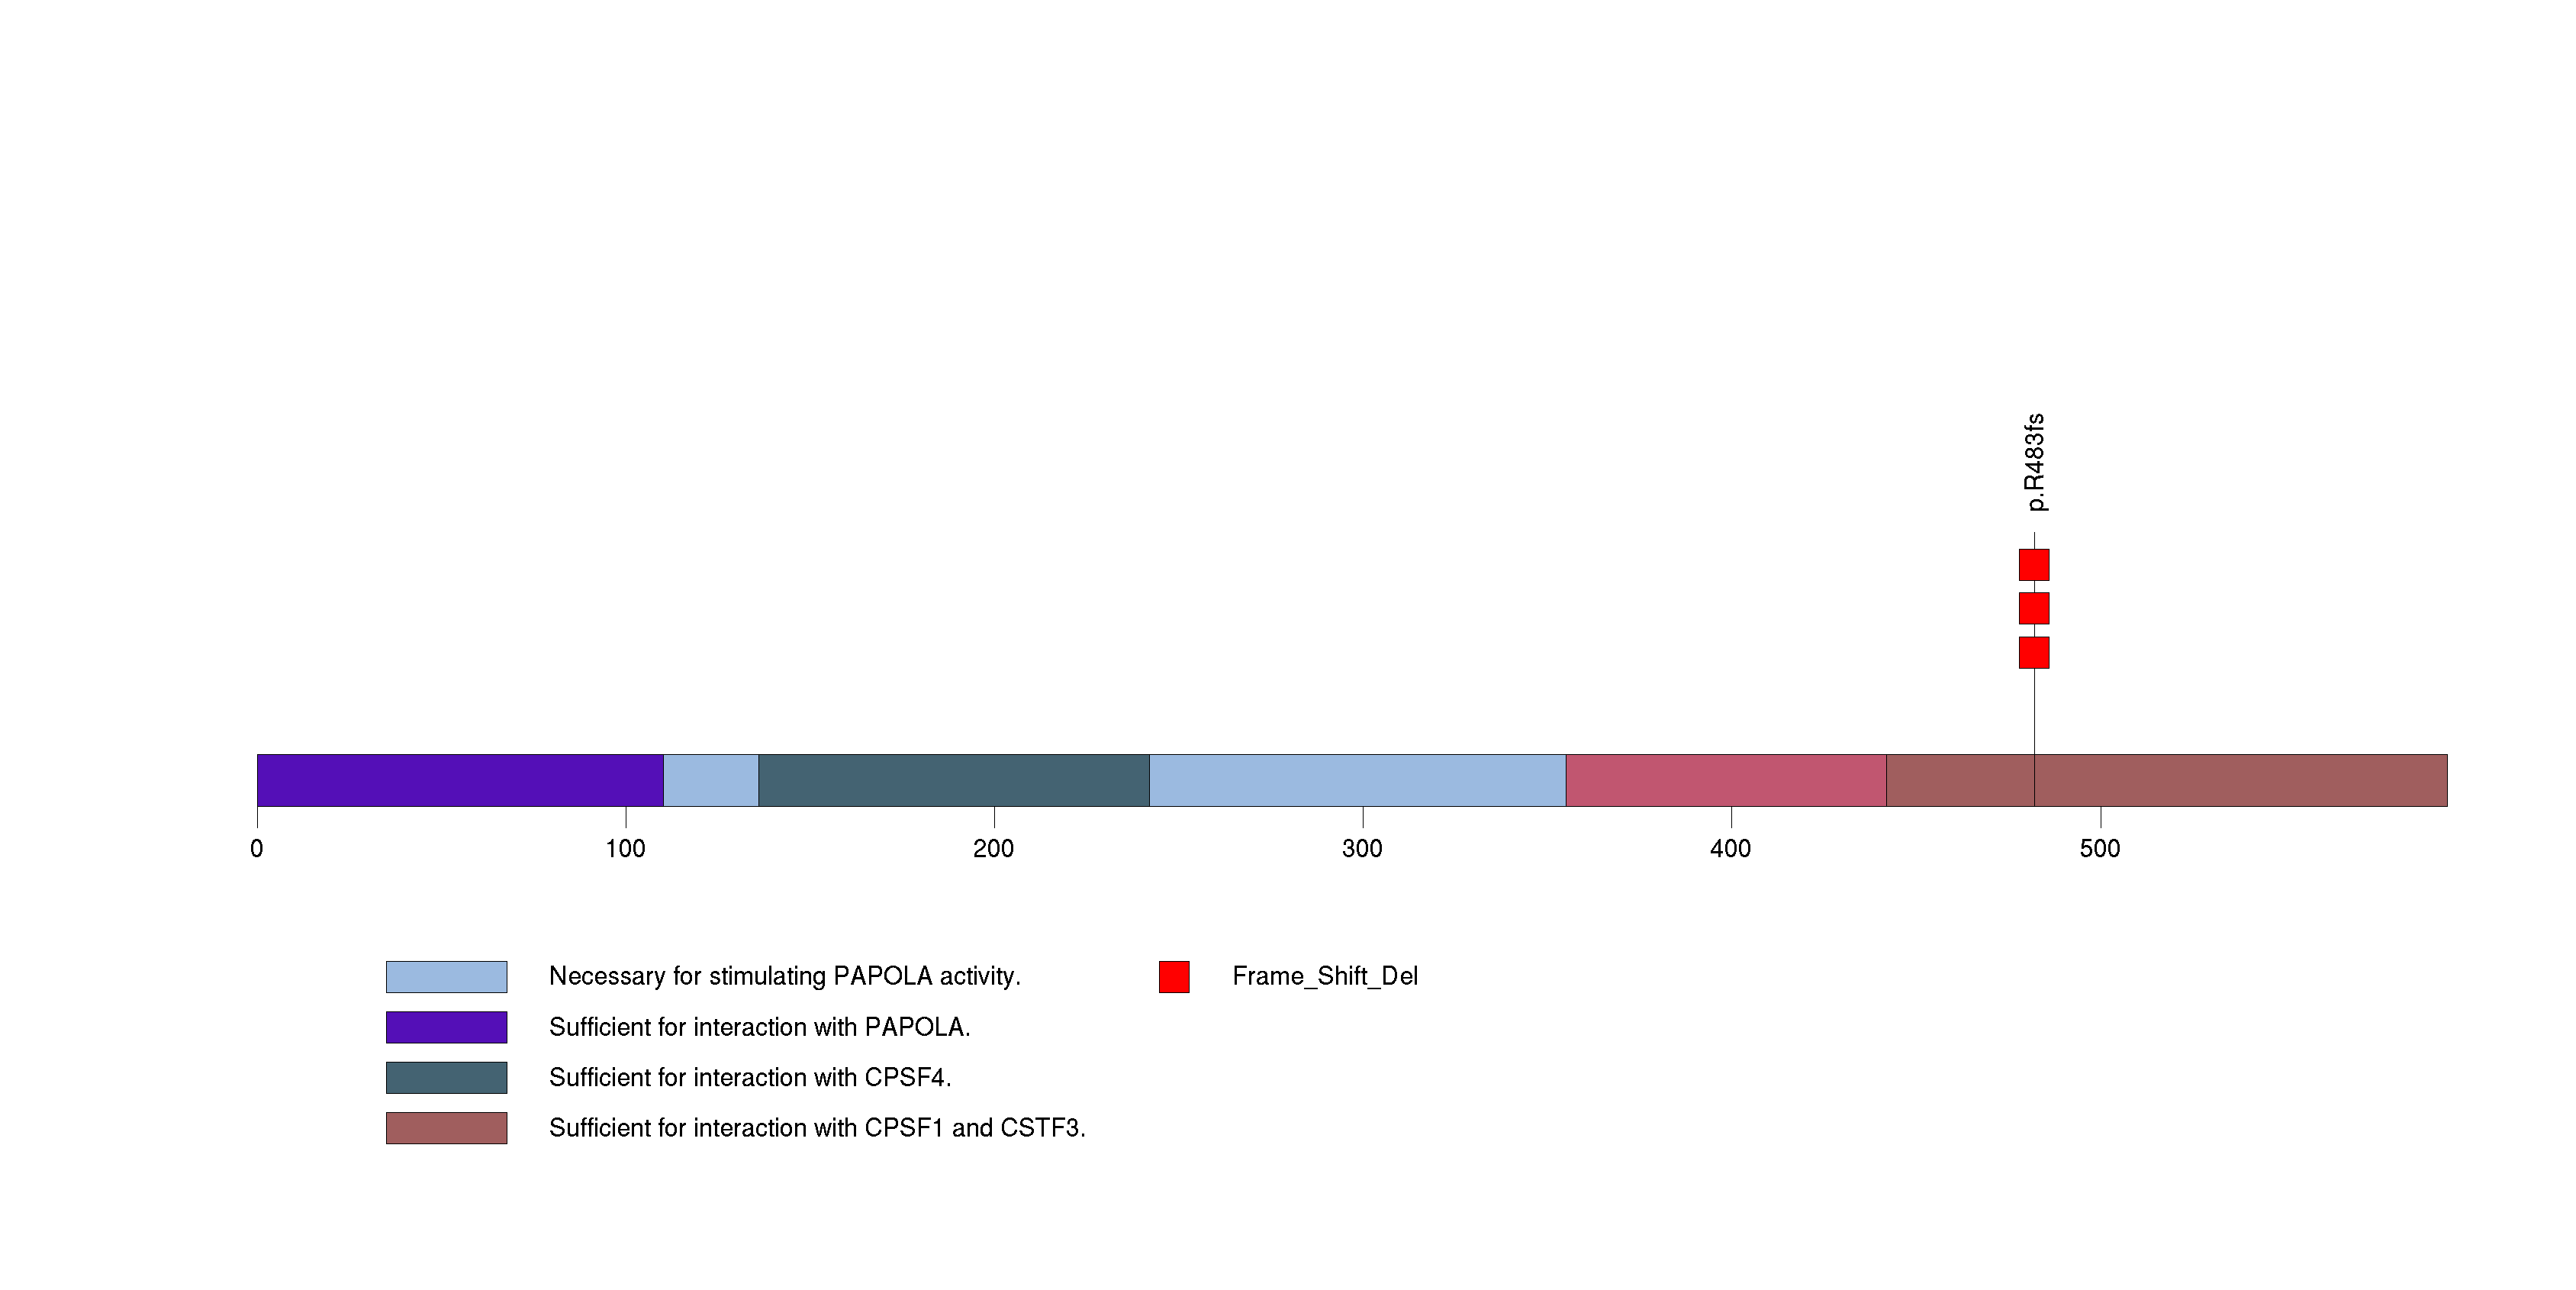
Figure S33. This figure depicts the distribution of mutations and mutation types across the GGTLC2 significant gene.
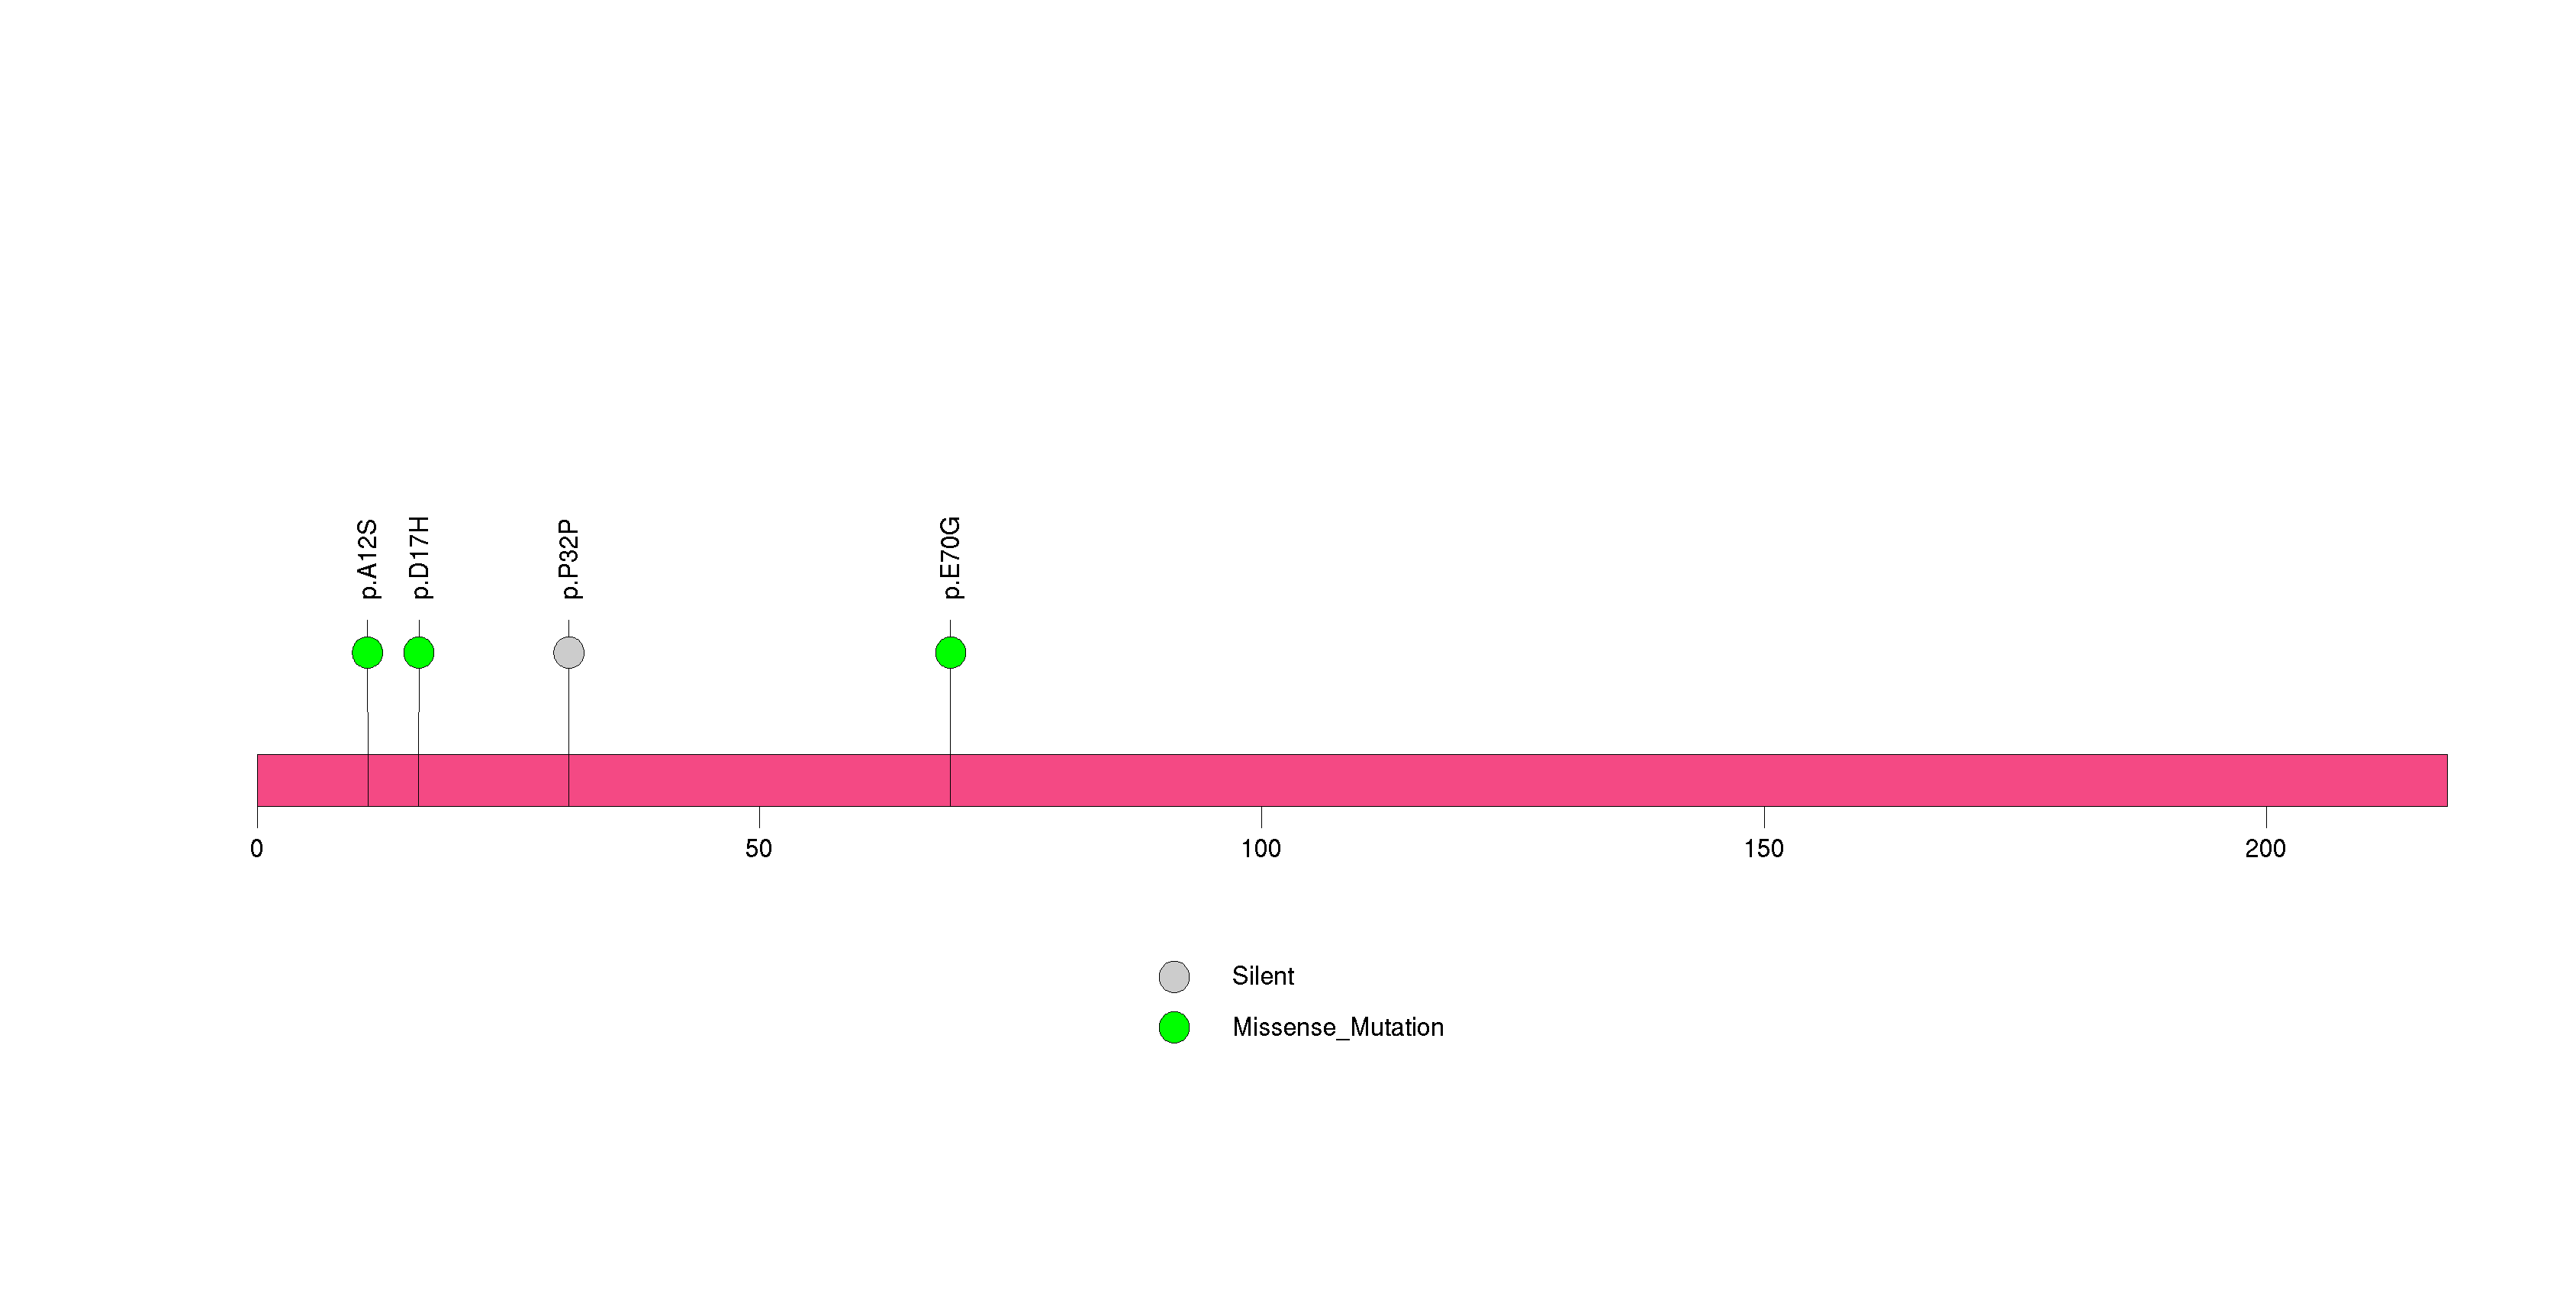
Figure S34. This figure depicts the distribution of mutations and mutation types across the ANKRD36 significant gene.
In this analysis, COSMIC is used as a filter to increase power by restricting the territory of each gene. Cosmic version: v48.
Table 4. Get Full Table Significantly mutated genes (COSMIC territory only). To access the database please go to: COSMIC. Number of significant genes found: 7. Number of genes displayed: 10
| rank | gene | description | n | cos | n_cos | N_cos | cos_ev | p | q |
|---|---|---|---|---|---|---|---|---|---|
| 1 | TP53 | tumor protein p53 | 5 | 356 | 5 | 29548 | 1608 | 1.7e-09 | 7.6e-06 |
| 2 | CHEK2 | CHK2 checkpoint homolog (S. pombe) | 2 | 2 | 2 | 166 | 2 | 3.3e-08 | 0.000076 |
| 3 | CTNNB1 | catenin (cadherin-associated protein), beta 1, 88kDa | 3 | 138 | 3 | 11454 | 1229 | 9.4e-07 | 0.0014 |
| 4 | ACSM2B | acyl-CoA synthetase medium-chain family member 2B | 1 | 1 | 1 | 83 | 1 | 0.00013 | 0.098 |
| 5 | BRE | brain and reproductive organ-expressed (TNFRSF1A modulator) | 1 | 1 | 1 | 83 | 1 | 0.00013 | 0.098 |
| 6 | KCNH1 | potassium voltage-gated channel, subfamily H (eag-related), member 1 | 1 | 1 | 1 | 83 | 1 | 0.00013 | 0.098 |
| 7 | PTEN | phosphatase and tensin homolog (mutated in multiple advanced cancers 1) | 3 | 767 | 3 | 63661 | 15 | 0.00015 | 0.099 |
| 8 | CHAT | choline acetyltransferase | 2 | 2 | 1 | 166 | 1 | 0.00026 | 0.13 |
| 9 | CYP4F2 | cytochrome P450, family 4, subfamily F, polypeptide 2 | 1 | 2 | 1 | 166 | 2 | 0.00026 | 0.13 |
| 10 | ACVR2A | activin A receptor, type IIA | 1 | 3 | 1 | 249 | 1 | 0.00039 | 0.16 |
Note:
n - number of (nonsilent) mutations in this gene across the individual set.
cos = number of unique mutated sites in this gene in COSMIC
n_cos = overlap between n and cos.
N_cos = number of individuals times cos.
cos_ev = total evidence: number of reports in COSMIC for mutations seen in this gene.
p = p-value for seeing the observed amount of overlap in this gene)
q = q-value, False Discovery Rate (Benjamini-Hochberg procedure)
Table 5. Get Full Table Genes with Clustered Mutations
| num | gene | desc | n | mindist | nmuts0 | nmuts3 | nmuts12 | npairs0 | npairs3 | npairs12 |
|---|---|---|---|---|---|---|---|---|---|---|
| 1657 | MUC4 | mucin 4, cell surface associated | 15 | 0 | 13 | 23 | 23 | 13 | 23 | 23 |
| 480 | CDC27 | cell division cycle 27 homolog (S. cerevisiae) | 10 | 0 | 6 | 8 | 9 | 6 | 8 | 9 |
| 2274 | SCAI | suppressor of cancer cell invasion | 5 | 0 | 6 | 6 | 6 | 6 | 6 | 6 |
| 92 | AGT | angiotensinogen (serpin peptidase inhibitor, clade A, member 8) | 3 | 0 | 3 | 3 | 3 | 3 | 3 | 3 |
| 144 | ANKRD36 | ankyrin repeat domain 36 | 4 | 0 | 3 | 3 | 3 | 3 | 3 | 3 |
| 464 | CCNF | cyclin F | 3 | 0 | 3 | 3 | 3 | 3 | 3 | 3 |
| 563 | CLSTN1 | calsyntenin 1 | 3 | 0 | 3 | 3 | 3 | 3 | 3 | 3 |
| 624 | CROCC | ciliary rootlet coiled-coil, rootletin | 5 | 0 | 3 | 3 | 3 | 3 | 3 | 3 |
| 665 | CYP2D6 | cytochrome P450, family 2, subfamily D, polypeptide 6 | 4 | 0 | 3 | 3 | 3 | 3 | 3 | 3 |
| 779 | DUSP27 | dual specificity phosphatase 27 (putative) | 3 | 0 | 3 | 3 | 3 | 3 | 3 | 3 |
Note:
n - number of mutations in this gene in the individual set.
mindist - distance (in aa) between closest pair of mutations in this gene
npairs3 - how many pairs of mutations are within 3 aa of each other.
npairs12 - how many pairs of mutations are within 12 aa of each other.
Table 6. Get Full Table A Ranked List of Significantly Mutated Genesets. (Source: MSigDB GSEA Cannonical Pathway Set).Number of significant genesets found: 1. Number of genesets displayed: 10
| rank | geneset | description | genes | N_genes | mut_tally | N | n | npat | nsite | nsil | n1 | n2 | n3 | n4 | n5 | n6 | p_ns_s | p | q |
|---|---|---|---|---|---|---|---|---|---|---|---|---|---|---|---|---|---|---|---|
| 1 | SA_G1_AND_S_PHASES | Cdk2, 4, and 6 bind cyclin D in G1, while cdk2/cyclin E promotes the G1/S transition. | ARF1, ARF3, CCND1, CDK2, CDK4, CDKN1A, CDKN1B, CDKN2A, CFL1, E2F1, E2F2, MDM2, NXT1, PRB1, TP53 | 15 | CDKN1B(2), PRB1(3), TP53(5) | 1062488 | 10 | 10 | 10 | 0 | 3 | 1 | 0 | 3 | 3 | 0 | 0.12 | 6.4e-06 | 0.0039 |
| 2 | P53HYPOXIAPATHWAY | Hypoxia induces p53 accumulation and consequent apoptosis with p53-mediated cell cycle arrest, which is present under conditions of DNA damage. | ABCB1, AKT1, ATM, BAX, CDKN1A, CPB2, CSNK1A1, CSNK1D, FHL2, GADD45A, HIC1, HIF1A, HSPA1A, HSPCA, IGFBP3, MAPK8, MDM2, NFKBIB, NQO1, TP53 | 19 | ABCB1(2), AKT1(1), ATM(5), TP53(5) | 2602579 | 13 | 12 | 13 | 0 | 4 | 6 | 0 | 2 | 1 | 0 | 0.015 | 0.00034 | 0.1 |
| 3 | SA_REG_CASCADE_OF_CYCLIN_EXPR | Expression of cyclins regulates progression through the cell cycle by activating cyclin-dependent kinases. | CCNA1, CCNA2, CCND1, CCNE1, CCNE2, CDK2, CDK4, CDKN1B, CDKN2A, E2F1, E2F2, E2F4, PRB1 | 13 | CCNA1(1), CCNE2(1), CDKN1B(2), PRB1(3) | 1130432 | 7 | 7 | 7 | 0 | 0 | 2 | 0 | 3 | 2 | 0 | 0.25 | 0.00099 | 0.2 |
| 4 | P53PATHWAY | p53 induces cell cycle arrest or apoptosis under conditions of DNA damage. | APAF1, ATM, BAX, BCL2, CCND1, CCNE1, CDK2, CDK4, CDKN1A, E2F1, GADD45A, MDM2, PCNA, RB1, TIMP3, TP53 | 16 | APAF1(1), ATM(5), TP53(5) | 2266716 | 11 | 10 | 11 | 0 | 3 | 5 | 0 | 2 | 1 | 0 | 0.034 | 0.0014 | 0.22 |
| 5 | TERTPATHWAY | hTERC, the RNA subunit of telomerase, and hTERT, the catalytic protein subunit, are required for telomerase activity and are overexpressed in many cancers. | HDAC1, MAX, MYC, SP1, SP3, TP53, WT1, ZNF42 | 7 | SP1(1), TP53(5) | 879118 | 6 | 6 | 6 | 0 | 3 | 1 | 0 | 1 | 1 | 0 | 0.16 | 0.0022 | 0.23 |
| 6 | PLK3PATHWAY | Active Plk3 phosphorylates CDC25c, blocking the G2/M transition, and phosphorylates p53 to induce apoptosis. | ATM, ATR, CDC25C, CHEK1, CHEK2, CNK, TP53, YWHAH | 7 | ATM(5), CHEK2(2), TP53(5) | 1994178 | 12 | 11 | 11 | 2 | 3 | 6 | 0 | 2 | 1 | 0 | 0.26 | 0.0022 | 0.23 |
| 7 | RBPATHWAY | The ATM protein kinase recognizes DNA damage and blocks cell cycle progression by phosphorylating chk1 and p53, which normally inhibits Rb to allow G1/S transitions. | ATM, CDC2, CDC25A, CDC25B, CDC25C, CDK2, CDK4, CHEK1, MYT1, RB1, TP53, WEE1, YWHAH | 12 | ATM(5), TP53(5) | 2195302 | 10 | 9 | 10 | 1 | 3 | 4 | 0 | 2 | 1 | 0 | 0.18 | 0.0032 | 0.28 |
| 8 | G1PATHWAY | CDK4/6-cyclin D and CDK2-cyclin E phosphorylate Rb, which allows the transcription of genes needed for the G1/S cell cycle transition. | ABL1, ATM, ATR, CCNA1, CCND1, CCNE1, CDC2, CDC25A, CDK2, CDK4, CDK6, CDKN1A, CDKN1B, CDKN2A, CDKN2B, DHFR, E2F1, GSK3B, HDAC1, MADH3, MADH4, RB1, SKP2, TFDP1, TGFB1, TGFB2, TGFB3, TP53 | 25 | ATM(5), CCNA1(1), CDKN1B(2), DHFR(1), TP53(5) | 3787641 | 14 | 12 | 14 | 0 | 3 | 5 | 0 | 2 | 4 | 0 | 0.032 | 0.0056 | 0.4 |
| 9 | CHEMICALPATHWAY | DNA damage promotes Bid cleavage, which stimulates mitochondrial cytochrome c release and consequent caspase activation, resulting in apoptosis. | ADPRT, AKT1, APAF1, ATM, BAD, BAX, BCL2, BCL2L1, BID, CASP3, CASP6, CASP7, CASP9, CYCS, EIF2S1, PRKCA, PRKCB1, PTK2, PXN, STAT1, TLN1, TP53 | 20 | AKT1(1), APAF1(1), ATM(5), TLN1(1), TP53(5) | 3433242 | 13 | 12 | 13 | 0 | 3 | 6 | 0 | 3 | 1 | 0 | 0.019 | 0.0058 | 0.4 |
| 10 | SMALL_LIGAND_GPCRS | C9orf47, CNR1, CNR2, DNMT1, EDG1, EDG2, EDG5, EDG6, MTNR1A, MTNR1B, PTAFR, PTGDR, PTGER1, PTGER2, PTGER4, PTGFR, PTGIR, TBXA2R | 13 | DNMT1(3), MTNR1A(1), PTGER2(1), TBXA2R(2) | 1410721 | 7 | 7 | 7 | 1 | 3 | 2 | 0 | 1 | 1 | 0 | 0.19 | 0.011 | 0.65 |
Table 7. Get Full Table A Ranked List of Significantly Mutated Genesets (Excluding Significantly Mutated Genes). Number of significant genesets found: 0. Number of genesets displayed: 10
| rank | geneset | description | genes | N_genes | mut_tally | N | n | npat | nsite | nsil | n1 | n2 | n3 | n4 | n5 | n6 | p_ns_s | p | q |
|---|---|---|---|---|---|---|---|---|---|---|---|---|---|---|---|---|---|---|---|
| 1 | SMALL_LIGAND_GPCRS | C9orf47, CNR1, CNR2, DNMT1, EDG1, EDG2, EDG5, EDG6, MTNR1A, MTNR1B, PTAFR, PTGDR, PTGER1, PTGER2, PTGER4, PTGFR, PTGIR, TBXA2R | 13 | DNMT1(3), MTNR1A(1), PTGER2(1), TBXA2R(2) | 1410721 | 7 | 7 | 7 | 1 | 3 | 2 | 0 | 1 | 1 | 0 | 0.19 | 0.011 | 1 | |
| 2 | HSA00830_RETINOL_METABOLISM | Genes involved in retinol metabolism | ALDH1A1, ALDH1A2, BCMO1, RDH5 | 4 | ALDH1A2(1), BCMO1(2) | 483292 | 3 | 3 | 2 | 0 | 0 | 2 | 0 | 1 | 0 | 0 | 0.37 | 0.012 | 1 |
| 3 | PTENPATHWAY | PTEN suppresses AKT-induced cell proliferation and antagonizes the action of PI3K. | AKT1, BCAR1, CDKN1B, FOXO3A, GRB2, ILK, ITGB1, MAPK1, MAPK3, PDK2, PDPK1, PIK3CA, PIK3R1, PTEN, PTK2, SHC1, SOS1, TNFSF6 | 16 | AKT1(1), CDKN1B(2), PIK3CA(2), PTEN(3) | 2419782 | 8 | 8 | 8 | 1 | 0 | 3 | 1 | 1 | 3 | 0 | 0.36 | 0.013 | 1 |
| 4 | P53HYPOXIAPATHWAY | Hypoxia induces p53 accumulation and consequent apoptosis with p53-mediated cell cycle arrest, which is present under conditions of DNA damage. | ABCB1, AKT1, ATM, BAX, CDKN1A, CPB2, CSNK1A1, CSNK1D, FHL2, GADD45A, HIC1, HIF1A, HSPA1A, HSPCA, IGFBP3, MAPK8, MDM2, NFKBIB, NQO1, TP53 | 18 | ABCB1(2), AKT1(1), ATM(5) | 2497058 | 8 | 8 | 8 | 0 | 1 | 6 | 0 | 1 | 0 | 0 | 0.053 | 0.02 | 1 |
| 5 | HSA00670_ONE_CARBON_POOL_BY_FOLATE | Genes involved in one carbon pool by folate | ALDH1L1, AMT, ATIC, DHFR, FTCD, GART, MTFMT, MTHFD1, MTHFD1L, MTHFD2, MTHFR, MTHFS, MTR, SHMT1, SHMT2, TYMS | 16 | DHFR(1), FTCD(2), GART(1), MTHFD1(1), MTHFD1L(1), MTHFR(1) | 2365631 | 7 | 7 | 7 | 0 | 0 | 2 | 0 | 2 | 3 | 0 | 0.21 | 0.022 | 1 |
| 6 | LONGEVITYPATHWAY | Caloric restriction in animals often increases lifespan, which may occur via decreased IGF receptor expression and consequent expression of stress-resistance proteins. | AKT1, CAT, FOXO3A, GH1, GHR, HRAS, IGF1, IGF1R, PIK3CA, PIK3R1, SHC1, SOD1, SOD2, SOD3 | 13 | AKT1(1), GHR(1), IGF1R(1), PIK3CA(2), SOD3(1) | 1657357 | 6 | 6 | 6 | 0 | 0 | 4 | 1 | 1 | 0 | 0 | 0.12 | 0.023 | 1 |
| 7 | TRKAPATHWAY | Nerve growth factor (NGF) promotes neuronal survival and proliferation by binding its receptor TrkA, which activates PI3K/AKT, Ras, and the MAP kinase pathway. | AKT1, DPM2, GRB2, HRAS, KLK2, NGFB, NTRK1, PIK3CA, PIK3R1, PLCG1, PRKCA, PRKCB1, SHC1, SOS1 | 12 | AKT1(1), KLK2(1), NTRK1(2), PIK3CA(2) | 1940556 | 6 | 6 | 6 | 0 | 0 | 4 | 1 | 0 | 1 | 0 | 0.13 | 0.031 | 1 |
| 8 | HSA00564_GLYCEROPHOSPHOLIPID_METABOLISM | Genes involved in glycerophospholipid metabolism | ACHE, AGPAT1, AGPAT2, AGPAT3, AGPAT4, AGPAT6, ARD1A, CDIPT, CDS1, CDS2, CHAT, CHKA, CHKB, CHPT1, CRLS1, DGKA, DGKB, DGKD, DGKE, DGKG, DGKH, DGKI, DGKQ, DGKZ, ESCO1, ESCO2, ETNK1, ETNK2, GNPAT, GPAM, GPD1, GPD1L, GPD2, LCAT, LYCAT, LYPLA1, LYPLA2, LYPLA3, MYST3, MYST4, NAT5, NAT6, PCYT1A, PCYT1B, PEMT, PHOSPHO1, PISD, PLA2G10, PLA2G12A, PLA2G12B, PLA2G1B, PLA2G2A, PLA2G2D, PLA2G2E, PLA2G2F, PLA2G3, PLA2G4A, PLA2G5, PLA2G6, PLD1, PLD2, PNPLA3, PPAP2A, PPAP2B, PPAP2C, PTDSS1, PTDSS2, SH3GLB1 | 64 | AGPAT2(1), AGPAT3(1), CHAT(2), DGKD(1), DGKH(1), DGKI(1), DGKQ(2), ESCO1(3), GNPAT(1), MYST3(1), PEMT(1), PLA2G2A(1), PLA2G4A(1), PLA2G5(1), PLD1(1), PTDSS1(1) | 8241571 | 20 | 19 | 20 | 2 | 2 | 4 | 1 | 9 | 4 | 0 | 0.11 | 0.032 | 1 |
| 9 | ST_PHOSPHOINOSITIDE_3_KINASE_PATHWAY | The phosphoinositide-3 kinase pathway produces the lipid second messenger PIP3 and regulates cell growth, survival, and movement. | A1BG, AKT1, AKT2, AKT3, BAD, BTK, CDKN2A, CSL4, DAF, DAPP1, FOXO1A, GRB2, GSK3A, GSK3B, IARS, IGFBP1, INPP5D, P14, PDK1, PIK3CA, PPP1R13B, PSCD3, PTEN, RPS6KA1, RPS6KA2, RPS6KA3, RPS6KB1, SFN, SHC1, SOS1, SOS2, TEC, YWHAB, YWHAE, YWHAG, YWHAH, YWHAQ, YWHAZ | 33 | A1BG(1), AKT1(1), BTK(1), GSK3A(1), PDK1(1), PIK3CA(2), PPP1R13B(1), PTEN(3) | 4518736 | 11 | 11 | 11 | 1 | 1 | 3 | 1 | 4 | 2 | 0 | 0.16 | 0.04 | 1 |
| 10 | HSA00592_ALPHA_LINOLENIC_ACID_METABOLISM | Genes involved in alpha-Linolenic acid metabolism | ACOX1, ACOX3, FADS2, PLA2G10, PLA2G12A, PLA2G12B, PLA2G1B, PLA2G2A, PLA2G2D, PLA2G2E, PLA2G2F, PLA2G3, PLA2G4A, PLA2G5, PLA2G6 | 15 | ACOX3(1), FADS2(1), PLA2G2A(1), PLA2G4A(1), PLA2G5(1) | 1273374 | 5 | 5 | 5 | 1 | 2 | 1 | 0 | 2 | 0 | 0 | 0.46 | 0.044 | 1 |
In brief, we tabulate the number of mutations and the number of covered bases for each gene. The counts are broken down by mutation context category: four context categories that are discovered by MutSig, and one for indel and 'null' mutations, which include indels, nonsense mutations, splice-site mutations, and non-stop (read-through) mutations. For each gene, we calculate the probability of seeing the observed constellation of mutations, i.e. the product P1 x P2 x ... x Pm, or a more extreme one, given the background mutation rates calculated across the dataset. [1]
In addition to the links below, the full results of the analysis summarized in this report can also be downloaded programmatically using firehose_get, or interactively from either the Broad GDAC website or TCGA Data Coordination Center Portal.