This pipeline computes the correlation between cancer subtypes identified by different molecular patterns and selected clinical features.
Testing the association between subtypes identified by 8 different clustering approaches and 11 clinical features across 363 patients, 31 significant findings detected with P value < 0.05 and Q value < 0.25.
-
3 subtypes identified in current cancer cohort by 'Copy Number Ratio CNMF subtypes'. These subtypes correlate to 'GENDER' and 'RACE'.
-
3 subtypes identified in current cancer cohort by 'METHLYATION CNMF'. These subtypes correlate to 'YEARS_TO_BIRTH', 'GENDER', and 'RACE'.
-
CNMF clustering analysis on sequencing-based mRNA expression data identified 5 subtypes that correlate to 'Time to Death', 'YEARS_TO_BIRTH', 'NEOPLASM_DISEASESTAGE', 'PATHOLOGY_T_STAGE', 'GENDER', 'HISTOLOGICAL_TYPE', 'COMPLETENESS_OF_RESECTION', and 'RACE'.
-
Consensus hierarchical clustering analysis on sequencing-based mRNA expression data identified 5 subtypes that correlate to 'Time to Death', 'YEARS_TO_BIRTH', 'NEOPLASM_DISEASESTAGE', 'PATHOLOGY_T_STAGE', 'GENDER', 'HISTOLOGICAL_TYPE', 'COMPLETENESS_OF_RESECTION', and 'RACE'.
-
4 subtypes identified in current cancer cohort by 'MIRSEQ CNMF'. These subtypes correlate to 'YEARS_TO_BIRTH'.
-
5 subtypes identified in current cancer cohort by 'MIRSEQ CHIERARCHICAL'. These subtypes correlate to 'YEARS_TO_BIRTH' and 'GENDER'.
-
4 subtypes identified in current cancer cohort by 'MIRseq Mature CNMF subtypes'. These subtypes correlate to 'YEARS_TO_BIRTH', 'NEOPLASM_DISEASESTAGE', 'PATHOLOGY_T_STAGE', and 'GENDER'.
-
5 subtypes identified in current cancer cohort by 'MIRseq Mature cHierClus subtypes'. These subtypes correlate to 'YEARS_TO_BIRTH', 'GENDER', and 'RACE'.
Table 1. Get Full Table Overview of the association between subtypes identified by 8 different clustering approaches and 11 clinical features. Shown in the table are P values (Q values). Thresholded by P value < 0.05 and Q value < 0.25, 31 significant findings detected.
|
Clinical Features |
Statistical Tests |
Copy Number Ratio CNMF subtypes |
METHLYATION CNMF |
RNAseq CNMF subtypes |
RNAseq cHierClus subtypes |
MIRSEQ CNMF |
MIRSEQ CHIERARCHICAL |
MIRseq Mature CNMF subtypes |
MIRseq Mature cHierClus subtypes |
| Time to Death | logrank test |
0.23 (0.43) |
0.503 (0.671) |
0.00702 (0.0346) |
0.0348 (0.108) |
0.449 (0.619) |
0.0783 (0.215) |
0.339 (0.499) |
0.0842 (0.225) |
| YEARS TO BIRTH | Kruskal-Wallis (anova) |
0.18 (0.354) |
2.48e-07 (2.18e-05) |
2.15e-06 (9.44e-05) |
0.000138 (0.00154) |
0.00388 (0.0263) |
2.37e-05 (0.000522) |
0.00707 (0.0346) |
3.13e-05 (0.000551) |
| NEOPLASM DISEASESTAGE | Fisher's exact test |
0.247 (0.443) |
0.89 (0.959) |
0.0421 (0.119) |
0.00195 (0.0143) |
0.181 (0.354) |
0.946 (0.991) |
0.00034 (0.00332) |
0.0888 (0.227) |
| PATHOLOGY T STAGE | Fisher's exact test |
0.17 (0.354) |
0.868 (0.955) |
0.00512 (0.0322) |
0.00014 (0.00154) |
0.894 (0.959) |
0.856 (0.954) |
0.011 (0.0461) |
0.108 (0.265) |
| PATHOLOGY N STAGE | Fisher's exact test |
1 (1.00) |
1 (1.00) |
0.628 (0.789) |
0.279 (0.481) |
0.677 (0.806) |
1 (1.00) |
0.159 (0.342) |
0.944 (0.991) |
| PATHOLOGY M STAGE | Fisher's exact test |
1 (1.00) |
0.271 (0.478) |
0.608 (0.787) |
0.472 (0.639) |
0.239 (0.437) |
0.31 (0.496) |
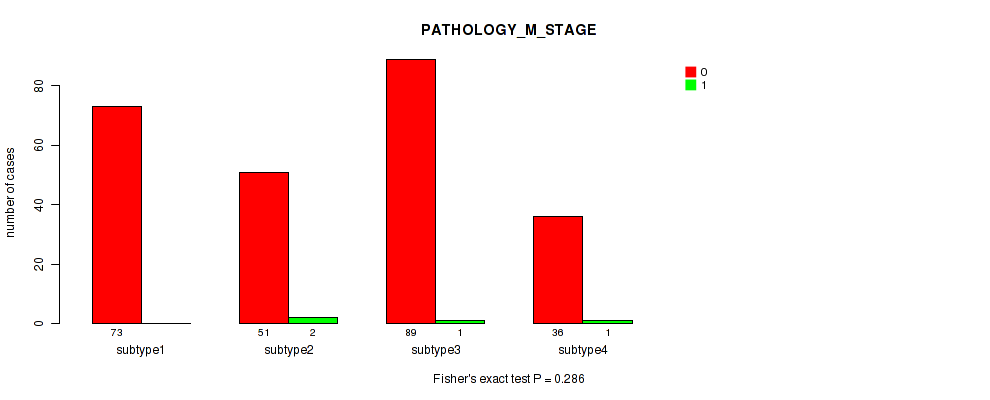
0.286 (0.484) |
0.151 (0.332) |
| GENDER | Fisher's exact test |
0.0283 (0.0957) |
0.0368 (0.108) |
1e-05 (0.000293) |
0.00011 (0.00154) |
0.292 (0.486) |
0.0207 (0.0792) |
0.0225 (0.0824) |
0.0367 (0.108) |
| HISTOLOGICAL TYPE | Fisher's exact test |
0.668 (0.806) |
0.148 (0.332) |
0.00662 (0.0346) |
0.00181 (0.0143) |
0.0904 (0.227) |
0.836 (0.943) |
0.116 (0.276) |
0.605 (0.787) |
| COMPLETENESS OF RESECTION | Fisher's exact test |
0.331 (0.499) |
0.617 (0.787) |
0.00847 (0.0392) |
0.0266 (0.0936) |
0.658 (0.806) |
0.326 (0.499) |
0.184 (0.354) |
0.185 (0.354) |
| RACE | Fisher's exact test |
0.0321 (0.105) |
0.00124 (0.0109) |
0.00652 (0.0346) |
0.0202 (0.0792) |
0.376 (0.534) |
0.119 (0.276) |
0.798 (0.912) |
0.00935 (0.0411) |
| ETHNICITY | Fisher's exact test |
0.346 (0.499) |
0.45 (0.619) |
0.34 (0.499) |
0.324 (0.499) |
0.303 (0.493) |
0.674 (0.806) |
0.703 (0.824) |
0.722 (0.837) |
Table S1. Description of clustering approach #1: 'Copy Number Ratio CNMF subtypes'
| Cluster Labels | 1 | 2 | 3 |
|---|---|---|---|
| Number of samples | 106 | 119 | 132 |
P value = 0.23 (logrank test), Q value = 0.43
Table S2. Clustering Approach #1: 'Copy Number Ratio CNMF subtypes' versus Clinical Feature #1: 'Time to Death'
| nPatients | nDeath | Duration Range (Median), Month | |
|---|---|---|---|
| ALL | 334 | 109 | 0.0 - 120.8 (19.3) |
| subtype1 | 104 | 35 | 0.1 - 114.3 (18.4) |
| subtype2 | 106 | 38 | 0.0 - 120.8 (18.1) |
| subtype3 | 124 | 36 | 0.1 - 108.8 (21.0) |
Figure S1. Get High-res Image Clustering Approach #1: 'Copy Number Ratio CNMF subtypes' versus Clinical Feature #1: 'Time to Death'

P value = 0.18 (Kruskal-Wallis (anova)), Q value = 0.35
Table S3. Clustering Approach #1: 'Copy Number Ratio CNMF subtypes' versus Clinical Feature #2: 'YEARS_TO_BIRTH'
| nPatients | Mean (Std.Dev) | |
|---|---|---|
| ALL | 354 | 59.8 (12.7) |
| subtype1 | 105 | 61.4 (11.2) |
| subtype2 | 117 | 58.2 (13.0) |
| subtype3 | 132 | 59.8 (13.5) |
Figure S2. Get High-res Image Clustering Approach #1: 'Copy Number Ratio CNMF subtypes' versus Clinical Feature #2: 'YEARS_TO_BIRTH'

P value = 0.247 (Fisher's exact test), Q value = 0.44
Table S4. Clustering Approach #1: 'Copy Number Ratio CNMF subtypes' versus Clinical Feature #3: 'NEOPLASM_DISEASESTAGE'
| nPatients | STAGE I | STAGE II | STAGE III | STAGE IIIA | STAGE IIIB | STAGE IIIC | STAGE IV | STAGE IVA | STAGE IVB |
|---|---|---|---|---|---|---|---|---|---|
| ALL | 168 | 84 | 3 | 59 | 8 | 7 | 3 | 1 | 2 |
| subtype1 | 58 | 25 | 0 | 14 | 1 | 0 | 1 | 1 | 0 |
| subtype2 | 47 | 33 | 1 | 22 | 3 | 2 | 2 | 0 | 1 |
| subtype3 | 63 | 26 | 2 | 23 | 4 | 5 | 0 | 0 | 1 |
Figure S3. Get High-res Image Clustering Approach #1: 'Copy Number Ratio CNMF subtypes' versus Clinical Feature #3: 'NEOPLASM_DISEASESTAGE'

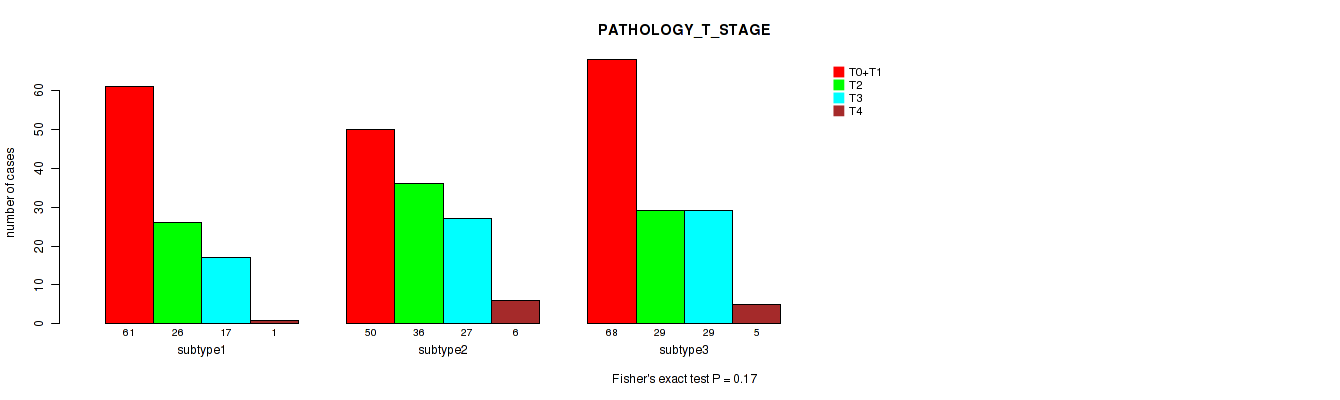
P value = 0.17 (Fisher's exact test), Q value = 0.35
Table S5. Clustering Approach #1: 'Copy Number Ratio CNMF subtypes' versus Clinical Feature #4: 'PATHOLOGY_T_STAGE'
| nPatients | T0+T1 | T2 | T3 | T4 |
|---|---|---|---|---|
| ALL | 179 | 91 | 73 | 12 |
| subtype1 | 61 | 26 | 17 | 1 |
| subtype2 | 50 | 36 | 27 | 6 |
| subtype3 | 68 | 29 | 29 | 5 |
Figure S4. Get High-res Image Clustering Approach #1: 'Copy Number Ratio CNMF subtypes' versus Clinical Feature #4: 'PATHOLOGY_T_STAGE'
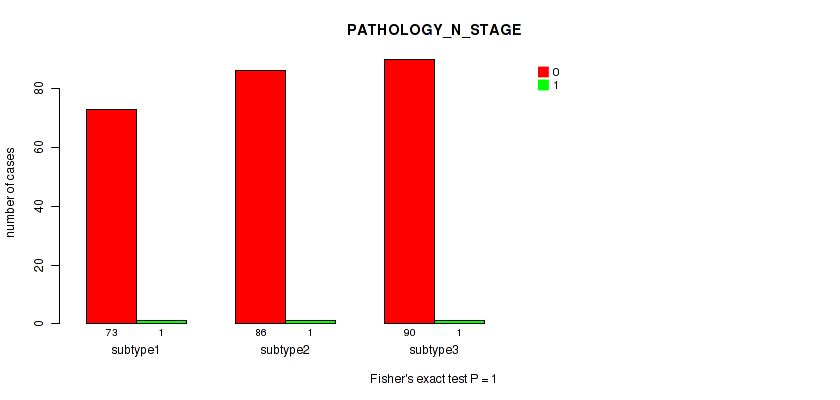
P value = 1 (Fisher's exact test), Q value = 1
Table S6. Clustering Approach #1: 'Copy Number Ratio CNMF subtypes' versus Clinical Feature #5: 'PATHOLOGY_N_STAGE'
| nPatients | 0 | 1 |
|---|---|---|
| ALL | 249 | 3 |
| subtype1 | 73 | 1 |
| subtype2 | 86 | 1 |
| subtype3 | 90 | 1 |
Figure S5. Get High-res Image Clustering Approach #1: 'Copy Number Ratio CNMF subtypes' versus Clinical Feature #5: 'PATHOLOGY_N_STAGE'
P value = 1 (Fisher's exact test), Q value = 1
Table S7. Clustering Approach #1: 'Copy Number Ratio CNMF subtypes' versus Clinical Feature #6: 'PATHOLOGY_M_STAGE'
| nPatients | 0 | 1 |
|---|---|---|
| ALL | 260 | 4 |
| subtype1 | 77 | 1 |
| subtype2 | 91 | 2 |
| subtype3 | 92 | 1 |
Figure S6. Get High-res Image Clustering Approach #1: 'Copy Number Ratio CNMF subtypes' versus Clinical Feature #6: 'PATHOLOGY_M_STAGE'

P value = 0.0283 (Fisher's exact test), Q value = 0.096
Table S8. Clustering Approach #1: 'Copy Number Ratio CNMF subtypes' versus Clinical Feature #7: 'GENDER'
| nPatients | FEMALE | MALE |
|---|---|---|
| ALL | 113 | 244 |
| subtype1 | 23 | 83 |
| subtype2 | 43 | 76 |
| subtype3 | 47 | 85 |
Figure S7. Get High-res Image Clustering Approach #1: 'Copy Number Ratio CNMF subtypes' versus Clinical Feature #7: 'GENDER'

P value = 0.668 (Fisher's exact test), Q value = 0.81
Table S9. Clustering Approach #1: 'Copy Number Ratio CNMF subtypes' versus Clinical Feature #8: 'HISTOLOGICAL_TYPE'
| nPatients | FIBROLAMELLAR CARCINOMA | HEPATOCELLULAR CARCINOMA | HEPATOCHOLANGIOCARCINOMA (MIXED) |
|---|---|---|---|
| ALL | 2 | 348 | 7 |
| subtype1 | 0 | 104 | 2 |
| subtype2 | 0 | 116 | 3 |
| subtype3 | 2 | 128 | 2 |
Figure S8. Get High-res Image Clustering Approach #1: 'Copy Number Ratio CNMF subtypes' versus Clinical Feature #8: 'HISTOLOGICAL_TYPE'

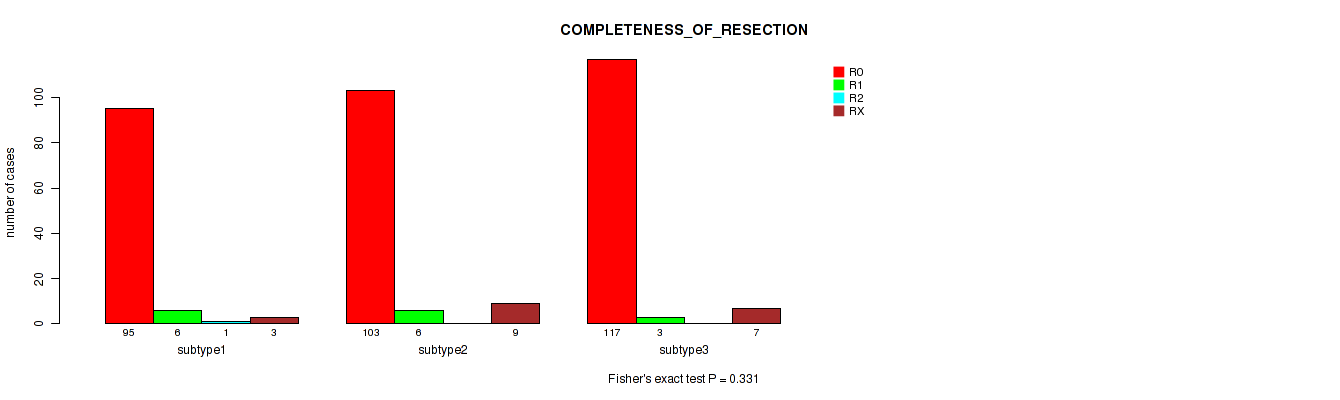
P value = 0.331 (Fisher's exact test), Q value = 0.5
Table S10. Clustering Approach #1: 'Copy Number Ratio CNMF subtypes' versus Clinical Feature #9: 'COMPLETENESS_OF_RESECTION'
| nPatients | R0 | R1 | R2 | RX |
|---|---|---|---|---|
| ALL | 315 | 15 | 1 | 19 |
| subtype1 | 95 | 6 | 1 | 3 |
| subtype2 | 103 | 6 | 0 | 9 |
| subtype3 | 117 | 3 | 0 | 7 |
Figure S9. Get High-res Image Clustering Approach #1: 'Copy Number Ratio CNMF subtypes' versus Clinical Feature #9: 'COMPLETENESS_OF_RESECTION'
P value = 0.0321 (Fisher's exact test), Q value = 0.1
Table S11. Clustering Approach #1: 'Copy Number Ratio CNMF subtypes' versus Clinical Feature #10: 'RACE'
| nPatients | AMERICAN INDIAN OR ALASKA NATIVE | ASIAN | BLACK OR AFRICAN AMERICAN | WHITE |
|---|---|---|---|---|
| ALL | 1 | 156 | 17 | 173 |
| subtype1 | 1 | 49 | 5 | 46 |
| subtype2 | 0 | 63 | 4 | 51 |
| subtype3 | 0 | 44 | 8 | 76 |
Figure S10. Get High-res Image Clustering Approach #1: 'Copy Number Ratio CNMF subtypes' versus Clinical Feature #10: 'RACE'

P value = 0.346 (Fisher's exact test), Q value = 0.5
Table S12. Clustering Approach #1: 'Copy Number Ratio CNMF subtypes' versus Clinical Feature #11: 'ETHNICITY'
| nPatients | HISPANIC OR LATINO | NOT HISPANIC OR LATINO |
|---|---|---|
| ALL | 11 | 329 |
| subtype1 | 5 | 96 |
| subtype2 | 4 | 112 |
| subtype3 | 2 | 121 |
Figure S11. Get High-res Image Clustering Approach #1: 'Copy Number Ratio CNMF subtypes' versus Clinical Feature #11: 'ETHNICITY'

Table S13. Description of clustering approach #2: 'METHLYATION CNMF'
| Cluster Labels | 1 | 2 | 3 |
|---|---|---|---|
| Number of samples | 82 | 166 | 115 |
P value = 0.503 (logrank test), Q value = 0.67
Table S14. Clustering Approach #2: 'METHLYATION CNMF' versus Clinical Feature #1: 'Time to Death'
| nPatients | nDeath | Duration Range (Median), Month | |
|---|---|---|---|
| ALL | 338 | 111 | 0.0 - 120.8 (19.3) |
| subtype1 | 75 | 24 | 0.1 - 108.8 (20.8) |
| subtype2 | 157 | 53 | 0.0 - 120.8 (19.0) |
| subtype3 | 106 | 34 | 0.1 - 114.3 (19.4) |
Figure S12. Get High-res Image Clustering Approach #2: 'METHLYATION CNMF' versus Clinical Feature #1: 'Time to Death'

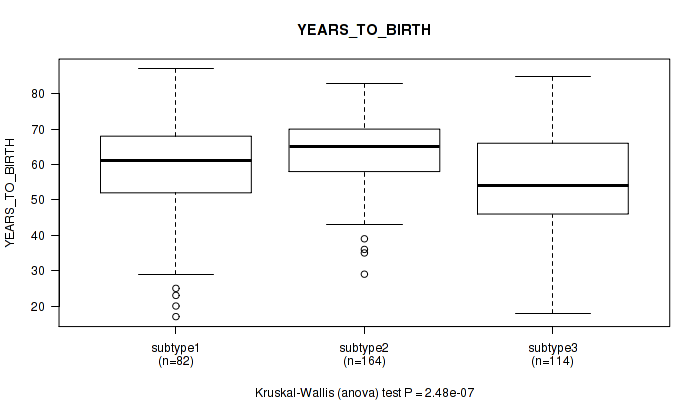
P value = 2.48e-07 (Kruskal-Wallis (anova)), Q value = 2.2e-05
Table S15. Clustering Approach #2: 'METHLYATION CNMF' versus Clinical Feature #2: 'YEARS_TO_BIRTH'
| nPatients | Mean (Std.Dev) | |
|---|---|---|
| ALL | 360 | 59.6 (13.0) |
| subtype1 | 82 | 58.3 (14.0) |
| subtype2 | 164 | 63.6 (10.0) |
| subtype3 | 114 | 54.8 (14.3) |
Figure S13. Get High-res Image Clustering Approach #2: 'METHLYATION CNMF' versus Clinical Feature #2: 'YEARS_TO_BIRTH'
P value = 0.89 (Fisher's exact test), Q value = 0.96
Table S16. Clustering Approach #2: 'METHLYATION CNMF' versus Clinical Feature #3: 'NEOPLASM_DISEASESTAGE'
| nPatients | STAGE I | STAGE II | STAGE III | STAGE IIIA | STAGE IIIB | STAGE IIIC | STAGE IV | STAGE IVA | STAGE IVB |
|---|---|---|---|---|---|---|---|---|---|
| ALL | 169 | 84 | 3 | 62 | 8 | 9 | 3 | 1 | 2 |
| subtype1 | 38 | 16 | 0 | 17 | 3 | 4 | 0 | 0 | 0 |
| subtype2 | 79 | 40 | 2 | 25 | 4 | 3 | 1 | 1 | 1 |
| subtype3 | 52 | 28 | 1 | 20 | 1 | 2 | 2 | 0 | 1 |
Figure S14. Get High-res Image Clustering Approach #2: 'METHLYATION CNMF' versus Clinical Feature #3: 'NEOPLASM_DISEASESTAGE'

P value = 0.868 (Fisher's exact test), Q value = 0.96
Table S17. Clustering Approach #2: 'METHLYATION CNMF' versus Clinical Feature #4: 'PATHOLOGY_T_STAGE'
| nPatients | T0+T1 | T2 | T3 | T4 |
|---|---|---|---|---|
| ALL | 180 | 91 | 77 | 13 |
| subtype1 | 40 | 18 | 20 | 3 |
| subtype2 | 85 | 43 | 30 | 7 |
| subtype3 | 55 | 30 | 27 | 3 |
Figure S15. Get High-res Image Clustering Approach #2: 'METHLYATION CNMF' versus Clinical Feature #4: 'PATHOLOGY_T_STAGE'

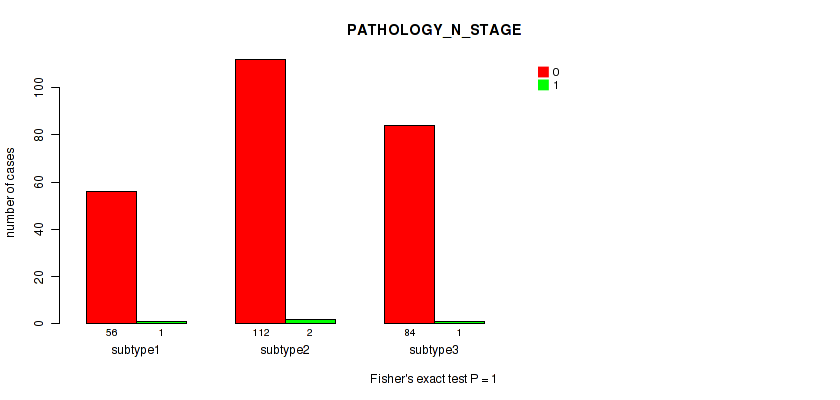
P value = 1 (Fisher's exact test), Q value = 1
Table S18. Clustering Approach #2: 'METHLYATION CNMF' versus Clinical Feature #5: 'PATHOLOGY_N_STAGE'
| nPatients | 0 | 1 |
|---|---|---|
| ALL | 252 | 4 |
| subtype1 | 56 | 1 |
| subtype2 | 112 | 2 |
| subtype3 | 84 | 1 |
Figure S16. Get High-res Image Clustering Approach #2: 'METHLYATION CNMF' versus Clinical Feature #5: 'PATHOLOGY_N_STAGE'
P value = 0.271 (Fisher's exact test), Q value = 0.48
Table S19. Clustering Approach #2: 'METHLYATION CNMF' versus Clinical Feature #6: 'PATHOLOGY_M_STAGE'
| nPatients | 0 | 1 |
|---|---|---|
| ALL | 266 | 4 |
| subtype1 | 58 | 0 |
| subtype2 | 120 | 1 |
| subtype3 | 88 | 3 |
Figure S17. Get High-res Image Clustering Approach #2: 'METHLYATION CNMF' versus Clinical Feature #6: 'PATHOLOGY_M_STAGE'

P value = 0.0368 (Fisher's exact test), Q value = 0.11
Table S20. Clustering Approach #2: 'METHLYATION CNMF' versus Clinical Feature #7: 'GENDER'
| nPatients | FEMALE | MALE |
|---|---|---|
| ALL | 116 | 247 |
| subtype1 | 29 | 53 |
| subtype2 | 42 | 124 |
| subtype3 | 45 | 70 |
Figure S18. Get High-res Image Clustering Approach #2: 'METHLYATION CNMF' versus Clinical Feature #7: 'GENDER'

P value = 0.148 (Fisher's exact test), Q value = 0.33
Table S21. Clustering Approach #2: 'METHLYATION CNMF' versus Clinical Feature #8: 'HISTOLOGICAL_TYPE'
| nPatients | FIBROLAMELLAR CARCINOMA | HEPATOCELLULAR CARCINOMA | HEPATOCHOLANGIOCARCINOMA (MIXED) |
|---|---|---|---|
| ALL | 2 | 354 | 7 |
| subtype1 | 2 | 78 | 2 |
| subtype2 | 0 | 164 | 2 |
| subtype3 | 0 | 112 | 3 |
Figure S19. Get High-res Image Clustering Approach #2: 'METHLYATION CNMF' versus Clinical Feature #8: 'HISTOLOGICAL_TYPE'

P value = 0.617 (Fisher's exact test), Q value = 0.79
Table S22. Clustering Approach #2: 'METHLYATION CNMF' versus Clinical Feature #9: 'COMPLETENESS_OF_RESECTION'
| nPatients | R0 | R1 | R2 | RX |
|---|---|---|---|---|
| ALL | 320 | 15 | 1 | 20 |
| subtype1 | 68 | 3 | 0 | 7 |
| subtype2 | 149 | 6 | 0 | 8 |
| subtype3 | 103 | 6 | 1 | 5 |
Figure S20. Get High-res Image Clustering Approach #2: 'METHLYATION CNMF' versus Clinical Feature #9: 'COMPLETENESS_OF_RESECTION'

P value = 0.00124 (Fisher's exact test), Q value = 0.011
Table S23. Clustering Approach #2: 'METHLYATION CNMF' versus Clinical Feature #10: 'RACE'
| nPatients | AMERICAN INDIAN OR ALASKA NATIVE | ASIAN | BLACK OR AFRICAN AMERICAN | WHITE |
|---|---|---|---|---|
| ALL | 1 | 159 | 17 | 176 |
| subtype1 | 0 | 26 | 8 | 45 |
| subtype2 | 1 | 68 | 8 | 85 |
| subtype3 | 0 | 65 | 1 | 46 |
Figure S21. Get High-res Image Clustering Approach #2: 'METHLYATION CNMF' versus Clinical Feature #10: 'RACE'

P value = 0.45 (Fisher's exact test), Q value = 0.62
Table S24. Clustering Approach #2: 'METHLYATION CNMF' versus Clinical Feature #11: 'ETHNICITY'
| nPatients | HISPANIC OR LATINO | NOT HISPANIC OR LATINO |
|---|---|---|
| ALL | 12 | 334 |
| subtype1 | 2 | 76 |
| subtype2 | 4 | 151 |
| subtype3 | 6 | 107 |
Figure S22. Get High-res Image Clustering Approach #2: 'METHLYATION CNMF' versus Clinical Feature #11: 'ETHNICITY'
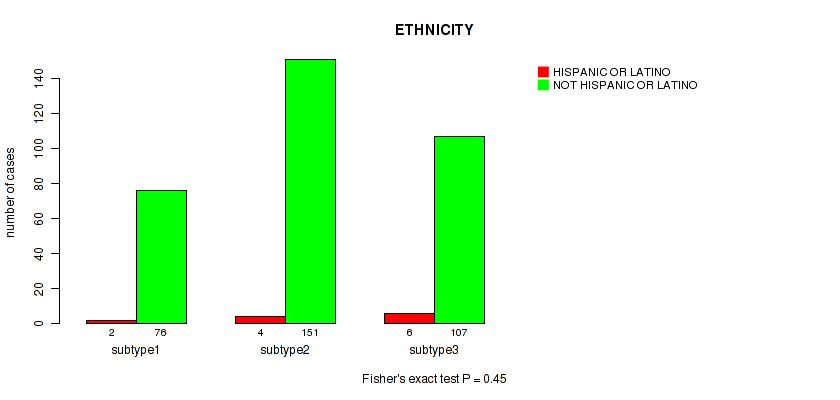
Table S25. Description of clustering approach #3: 'RNAseq CNMF subtypes'
| Cluster Labels | 1 | 2 | 3 | 4 | 5 |
|---|---|---|---|---|---|
| Number of samples | 59 | 97 | 70 | 65 | 66 |
P value = 0.00702 (logrank test), Q value = 0.035
Table S26. Clustering Approach #3: 'RNAseq CNMF subtypes' versus Clinical Feature #1: 'Time to Death'
| nPatients | nDeath | Duration Range (Median), Month | |
|---|---|---|---|
| ALL | 332 | 109 | 0.0 - 120.8 (19.1) |
| subtype1 | 53 | 25 | 0.1 - 120.8 (13.6) |
| subtype2 | 95 | 31 | 0.1 - 102.7 (21.8) |
| subtype3 | 58 | 18 | 0.1 - 114.3 (19.7) |
| subtype4 | 64 | 19 | 0.0 - 107.1 (17.0) |
| subtype5 | 62 | 16 | 0.4 - 108.8 (18.5) |
Figure S23. Get High-res Image Clustering Approach #3: 'RNAseq CNMF subtypes' versus Clinical Feature #1: 'Time to Death'

P value = 2.15e-06 (Kruskal-Wallis (anova)), Q value = 9.4e-05
Table S27. Clustering Approach #3: 'RNAseq CNMF subtypes' versus Clinical Feature #2: 'YEARS_TO_BIRTH'
| nPatients | Mean (Std.Dev) | |
|---|---|---|
| ALL | 354 | 59.6 (13.0) |
| subtype1 | 58 | 61.6 (11.5) |
| subtype2 | 96 | 62.8 (12.5) |
| subtype3 | 69 | 52.4 (13.8) |
| subtype4 | 65 | 58.5 (13.0) |
| subtype5 | 66 | 61.8 (11.2) |
Figure S24. Get High-res Image Clustering Approach #3: 'RNAseq CNMF subtypes' versus Clinical Feature #2: 'YEARS_TO_BIRTH'

P value = 0.0421 (Fisher's exact test), Q value = 0.12
Table S28. Clustering Approach #3: 'RNAseq CNMF subtypes' versus Clinical Feature #3: 'NEOPLASM_DISEASESTAGE'
| nPatients | STAGE I | STAGE II | STAGE III | STAGE IIIA | STAGE IIIB | STAGE IIIC | STAGE IV | STAGE IVA | STAGE IVB |
|---|---|---|---|---|---|---|---|---|---|
| ALL | 165 | 83 | 3 | 62 | 7 | 9 | 3 | 1 | 2 |
| subtype1 | 15 | 21 | 0 | 12 | 3 | 3 | 1 | 0 | 0 |
| subtype2 | 56 | 16 | 1 | 12 | 2 | 0 | 0 | 1 | 1 |
| subtype3 | 31 | 17 | 1 | 14 | 1 | 2 | 1 | 0 | 1 |
| subtype4 | 33 | 12 | 0 | 10 | 0 | 3 | 1 | 0 | 0 |
| subtype5 | 30 | 17 | 1 | 14 | 1 | 1 | 0 | 0 | 0 |
Figure S25. Get High-res Image Clustering Approach #3: 'RNAseq CNMF subtypes' versus Clinical Feature #3: 'NEOPLASM_DISEASESTAGE'

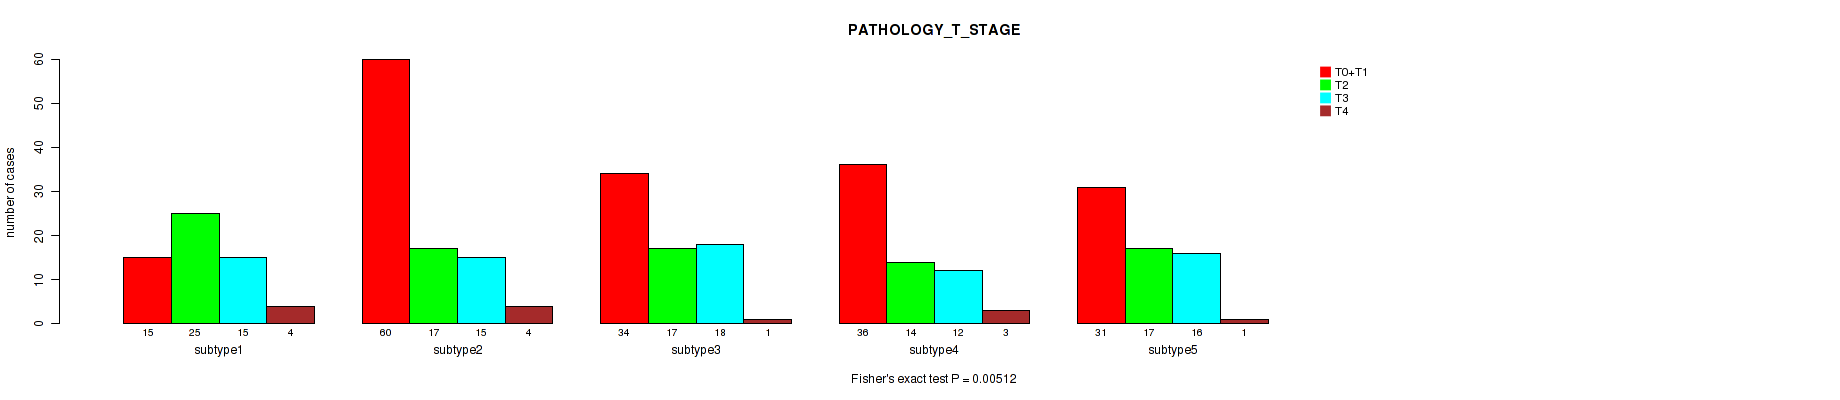
P value = 0.00512 (Fisher's exact test), Q value = 0.032
Table S29. Clustering Approach #3: 'RNAseq CNMF subtypes' versus Clinical Feature #4: 'PATHOLOGY_T_STAGE'
| nPatients | T0+T1 | T2 | T3 | T4 |
|---|---|---|---|---|
| ALL | 176 | 90 | 76 | 13 |
| subtype1 | 15 | 25 | 15 | 4 |
| subtype2 | 60 | 17 | 15 | 4 |
| subtype3 | 34 | 17 | 18 | 1 |
| subtype4 | 36 | 14 | 12 | 3 |
| subtype5 | 31 | 17 | 16 | 1 |
Figure S26. Get High-res Image Clustering Approach #3: 'RNAseq CNMF subtypes' versus Clinical Feature #4: 'PATHOLOGY_T_STAGE'
P value = 0.628 (Fisher's exact test), Q value = 0.79
Table S30. Clustering Approach #3: 'RNAseq CNMF subtypes' versus Clinical Feature #5: 'PATHOLOGY_N_STAGE'
| nPatients | 0 | 1 |
|---|---|---|
| ALL | 247 | 4 |
| subtype1 | 35 | 1 |
| subtype2 | 64 | 1 |
| subtype3 | 58 | 2 |
| subtype4 | 39 | 0 |
| subtype5 | 51 | 0 |
Figure S27. Get High-res Image Clustering Approach #3: 'RNAseq CNMF subtypes' versus Clinical Feature #5: 'PATHOLOGY_N_STAGE'

P value = 0.608 (Fisher's exact test), Q value = 0.79
Table S31. Clustering Approach #3: 'RNAseq CNMF subtypes' versus Clinical Feature #6: 'PATHOLOGY_M_STAGE'
| nPatients | 0 | 1 |
|---|---|---|
| ALL | 260 | 4 |
| subtype1 | 42 | 0 |
| subtype2 | 67 | 1 |
| subtype3 | 59 | 2 |
| subtype4 | 39 | 1 |
| subtype5 | 53 | 0 |
Figure S28. Get High-res Image Clustering Approach #3: 'RNAseq CNMF subtypes' versus Clinical Feature #6: 'PATHOLOGY_M_STAGE'

P value = 1e-05 (Fisher's exact test), Q value = 0.00029
Table S32. Clustering Approach #3: 'RNAseq CNMF subtypes' versus Clinical Feature #7: 'GENDER'
| nPatients | FEMALE | MALE |
|---|---|---|
| ALL | 115 | 242 |
| subtype1 | 17 | 42 |
| subtype2 | 26 | 71 |
| subtype3 | 37 | 33 |
| subtype4 | 27 | 38 |
| subtype5 | 8 | 58 |
Figure S29. Get High-res Image Clustering Approach #3: 'RNAseq CNMF subtypes' versus Clinical Feature #7: 'GENDER'

P value = 0.00662 (Fisher's exact test), Q value = 0.035
Table S33. Clustering Approach #3: 'RNAseq CNMF subtypes' versus Clinical Feature #8: 'HISTOLOGICAL_TYPE'
| nPatients | FIBROLAMELLAR CARCINOMA | HEPATOCELLULAR CARCINOMA | HEPATOCHOLANGIOCARCINOMA (MIXED) |
|---|---|---|---|
| ALL | 2 | 348 | 7 |
| subtype1 | 0 | 57 | 2 |
| subtype2 | 0 | 97 | 0 |
| subtype3 | 0 | 69 | 1 |
| subtype4 | 2 | 59 | 4 |
| subtype5 | 0 | 66 | 0 |
Figure S30. Get High-res Image Clustering Approach #3: 'RNAseq CNMF subtypes' versus Clinical Feature #8: 'HISTOLOGICAL_TYPE'

P value = 0.00847 (Fisher's exact test), Q value = 0.039
Table S34. Clustering Approach #3: 'RNAseq CNMF subtypes' versus Clinical Feature #9: 'COMPLETENESS_OF_RESECTION'
| nPatients | R0 | R1 | R2 | RX |
|---|---|---|---|---|
| ALL | 314 | 15 | 1 | 20 |
| subtype1 | 48 | 5 | 0 | 5 |
| subtype2 | 84 | 3 | 0 | 8 |
| subtype3 | 65 | 1 | 0 | 4 |
| subtype4 | 53 | 6 | 1 | 3 |
| subtype5 | 64 | 0 | 0 | 0 |
Figure S31. Get High-res Image Clustering Approach #3: 'RNAseq CNMF subtypes' versus Clinical Feature #9: 'COMPLETENESS_OF_RESECTION'

P value = 0.00652 (Fisher's exact test), Q value = 0.035
Table S35. Clustering Approach #3: 'RNAseq CNMF subtypes' versus Clinical Feature #10: 'RACE'
| nPatients | AMERICAN INDIAN OR ALASKA NATIVE | ASIAN | BLACK OR AFRICAN AMERICAN | WHITE |
|---|---|---|---|---|
| ALL | 1 | 156 | 17 | 173 |
| subtype1 | 0 | 24 | 6 | 27 |
| subtype2 | 0 | 35 | 5 | 52 |
| subtype3 | 0 | 45 | 1 | 23 |
| subtype4 | 0 | 22 | 2 | 39 |
| subtype5 | 1 | 30 | 3 | 32 |
Figure S32. Get High-res Image Clustering Approach #3: 'RNAseq CNMF subtypes' versus Clinical Feature #10: 'RACE'

P value = 0.34 (Fisher's exact test), Q value = 0.5
Table S36. Clustering Approach #3: 'RNAseq CNMF subtypes' versus Clinical Feature #11: 'ETHNICITY'
| nPatients | HISPANIC OR LATINO | NOT HISPANIC OR LATINO |
|---|---|---|
| ALL | 12 | 328 |
| subtype1 | 3 | 51 |
| subtype2 | 5 | 86 |
| subtype3 | 2 | 67 |
| subtype4 | 2 | 60 |
| subtype5 | 0 | 64 |
Figure S33. Get High-res Image Clustering Approach #3: 'RNAseq CNMF subtypes' versus Clinical Feature #11: 'ETHNICITY'

Table S37. Description of clustering approach #4: 'RNAseq cHierClus subtypes'
| Cluster Labels | 1 | 2 | 3 | 4 | 5 |
|---|---|---|---|---|---|
| Number of samples | 52 | 55 | 113 | 82 | 55 |
P value = 0.0348 (logrank test), Q value = 0.11
Table S38. Clustering Approach #4: 'RNAseq cHierClus subtypes' versus Clinical Feature #1: 'Time to Death'
| nPatients | nDeath | Duration Range (Median), Month | |
|---|---|---|---|
| ALL | 332 | 109 | 0.0 - 120.8 (19.1) |
| subtype1 | 45 | 22 | 0.1 - 107.1 (13.5) |
| subtype2 | 55 | 16 | 0.0 - 90.3 (17.7) |
| subtype3 | 107 | 37 | 0.3 - 120.8 (20.7) |
| subtype4 | 73 | 21 | 0.1 - 114.3 (19.6) |
| subtype5 | 52 | 13 | 0.4 - 108.8 (17.3) |
Figure S34. Get High-res Image Clustering Approach #4: 'RNAseq cHierClus subtypes' versus Clinical Feature #1: 'Time to Death'

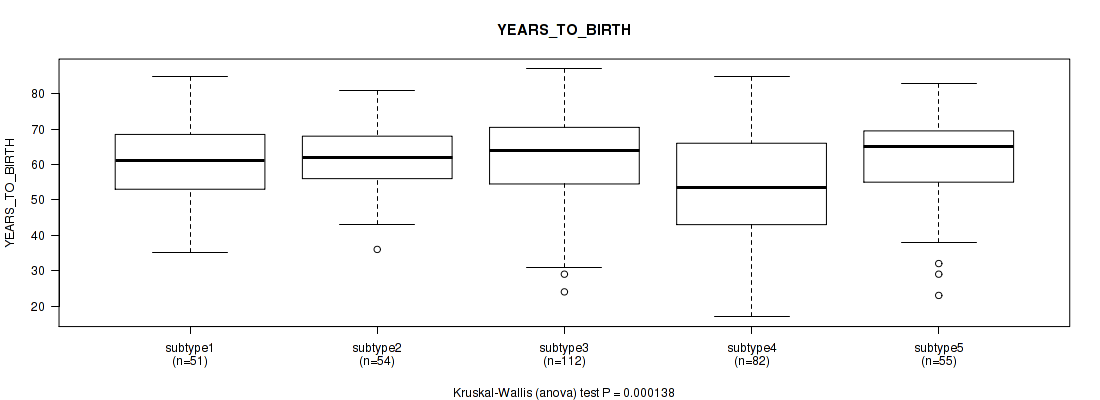
P value = 0.000138 (Kruskal-Wallis (anova)), Q value = 0.0015
Table S39. Clustering Approach #4: 'RNAseq cHierClus subtypes' versus Clinical Feature #2: 'YEARS_TO_BIRTH'
| nPatients | Mean (Std.Dev) | |
|---|---|---|
| ALL | 354 | 59.6 (13.0) |
| subtype1 | 51 | 61.0 (11.3) |
| subtype2 | 54 | 61.9 (9.7) |
| subtype3 | 112 | 62.0 (11.7) |
| subtype4 | 82 | 52.7 (15.6) |
| subtype5 | 55 | 61.5 (12.3) |
Figure S35. Get High-res Image Clustering Approach #4: 'RNAseq cHierClus subtypes' versus Clinical Feature #2: 'YEARS_TO_BIRTH'
P value = 0.00195 (Fisher's exact test), Q value = 0.014
Table S40. Clustering Approach #4: 'RNAseq cHierClus subtypes' versus Clinical Feature #3: 'NEOPLASM_DISEASESTAGE'
| nPatients | STAGE I | STAGE II | STAGE III | STAGE IIIA | STAGE IIIB | STAGE IIIC | STAGE IV | STAGE IVA | STAGE IVB |
|---|---|---|---|---|---|---|---|---|---|
| ALL | 165 | 83 | 3 | 62 | 7 | 9 | 3 | 1 | 2 |
| subtype1 | 10 | 15 | 0 | 15 | 4 | 3 | 0 | 0 | 0 |
| subtype2 | 31 | 10 | 0 | 3 | 1 | 2 | 1 | 1 | 0 |
| subtype3 | 60 | 25 | 1 | 17 | 1 | 1 | 0 | 0 | 1 |
| subtype4 | 40 | 18 | 1 | 16 | 0 | 2 | 2 | 0 | 1 |
| subtype5 | 24 | 15 | 1 | 11 | 1 | 1 | 0 | 0 | 0 |
Figure S36. Get High-res Image Clustering Approach #4: 'RNAseq cHierClus subtypes' versus Clinical Feature #3: 'NEOPLASM_DISEASESTAGE'

P value = 0.00014 (Fisher's exact test), Q value = 0.0015
Table S41. Clustering Approach #4: 'RNAseq cHierClus subtypes' versus Clinical Feature #4: 'PATHOLOGY_T_STAGE'
| nPatients | T0+T1 | T2 | T3 | T4 |
|---|---|---|---|---|
| ALL | 176 | 90 | 76 | 13 |
| subtype1 | 10 | 18 | 20 | 4 |
| subtype2 | 37 | 11 | 5 | 2 |
| subtype3 | 61 | 28 | 18 | 5 |
| subtype4 | 43 | 18 | 20 | 1 |
| subtype5 | 25 | 15 | 13 | 1 |
Figure S37. Get High-res Image Clustering Approach #4: 'RNAseq cHierClus subtypes' versus Clinical Feature #4: 'PATHOLOGY_T_STAGE'

P value = 0.279 (Fisher's exact test), Q value = 0.48
Table S42. Clustering Approach #4: 'RNAseq cHierClus subtypes' versus Clinical Feature #5: 'PATHOLOGY_N_STAGE'
| nPatients | 0 | 1 |
|---|---|---|
| ALL | 247 | 4 |
| subtype1 | 33 | 1 |
| subtype2 | 30 | 1 |
| subtype3 | 76 | 0 |
| subtype4 | 65 | 2 |
| subtype5 | 43 | 0 |
Figure S38. Get High-res Image Clustering Approach #4: 'RNAseq cHierClus subtypes' versus Clinical Feature #5: 'PATHOLOGY_N_STAGE'

P value = 0.472 (Fisher's exact test), Q value = 0.64
Table S43. Clustering Approach #4: 'RNAseq cHierClus subtypes' versus Clinical Feature #6: 'PATHOLOGY_M_STAGE'
| nPatients | 0 | 1 |
|---|---|---|
| ALL | 260 | 4 |
| subtype1 | 38 | 0 |
| subtype2 | 32 | 0 |
| subtype3 | 81 | 1 |
| subtype4 | 65 | 3 |
| subtype5 | 44 | 0 |
Figure S39. Get High-res Image Clustering Approach #4: 'RNAseq cHierClus subtypes' versus Clinical Feature #6: 'PATHOLOGY_M_STAGE'

P value = 0.00011 (Fisher's exact test), Q value = 0.0015
Table S44. Clustering Approach #4: 'RNAseq cHierClus subtypes' versus Clinical Feature #7: 'GENDER'
| nPatients | FEMALE | MALE |
|---|---|---|
| ALL | 115 | 242 |
| subtype1 | 22 | 30 |
| subtype2 | 13 | 42 |
| subtype3 | 34 | 79 |
| subtype4 | 39 | 43 |
| subtype5 | 7 | 48 |
Figure S40. Get High-res Image Clustering Approach #4: 'RNAseq cHierClus subtypes' versus Clinical Feature #7: 'GENDER'

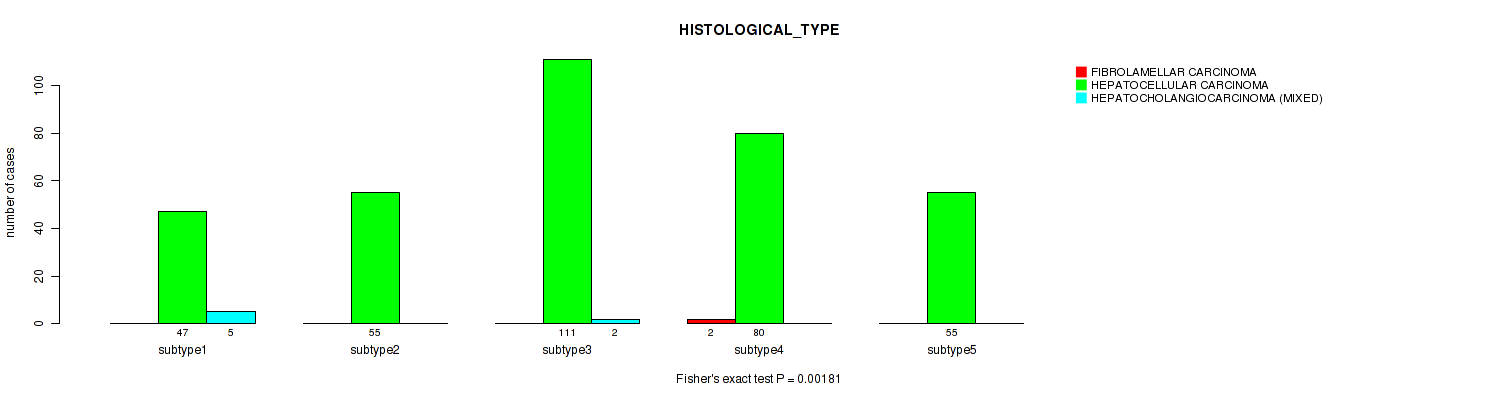
P value = 0.00181 (Fisher's exact test), Q value = 0.014
Table S45. Clustering Approach #4: 'RNAseq cHierClus subtypes' versus Clinical Feature #8: 'HISTOLOGICAL_TYPE'
| nPatients | FIBROLAMELLAR CARCINOMA | HEPATOCELLULAR CARCINOMA | HEPATOCHOLANGIOCARCINOMA (MIXED) |
|---|---|---|---|
| ALL | 2 | 348 | 7 |
| subtype1 | 0 | 47 | 5 |
| subtype2 | 0 | 55 | 0 |
| subtype3 | 0 | 111 | 2 |
| subtype4 | 2 | 80 | 0 |
| subtype5 | 0 | 55 | 0 |
Figure S41. Get High-res Image Clustering Approach #4: 'RNAseq cHierClus subtypes' versus Clinical Feature #8: 'HISTOLOGICAL_TYPE'
P value = 0.0266 (Fisher's exact test), Q value = 0.094
Table S46. Clustering Approach #4: 'RNAseq cHierClus subtypes' versus Clinical Feature #9: 'COMPLETENESS_OF_RESECTION'
| nPatients | R0 | R1 | R2 | RX |
|---|---|---|---|---|
| ALL | 314 | 15 | 1 | 20 |
| subtype1 | 42 | 6 | 0 | 3 |
| subtype2 | 46 | 4 | 0 | 3 |
| subtype3 | 99 | 4 | 0 | 8 |
| subtype4 | 74 | 1 | 1 | 6 |
| subtype5 | 53 | 0 | 0 | 0 |
Figure S42. Get High-res Image Clustering Approach #4: 'RNAseq cHierClus subtypes' versus Clinical Feature #9: 'COMPLETENESS_OF_RESECTION'

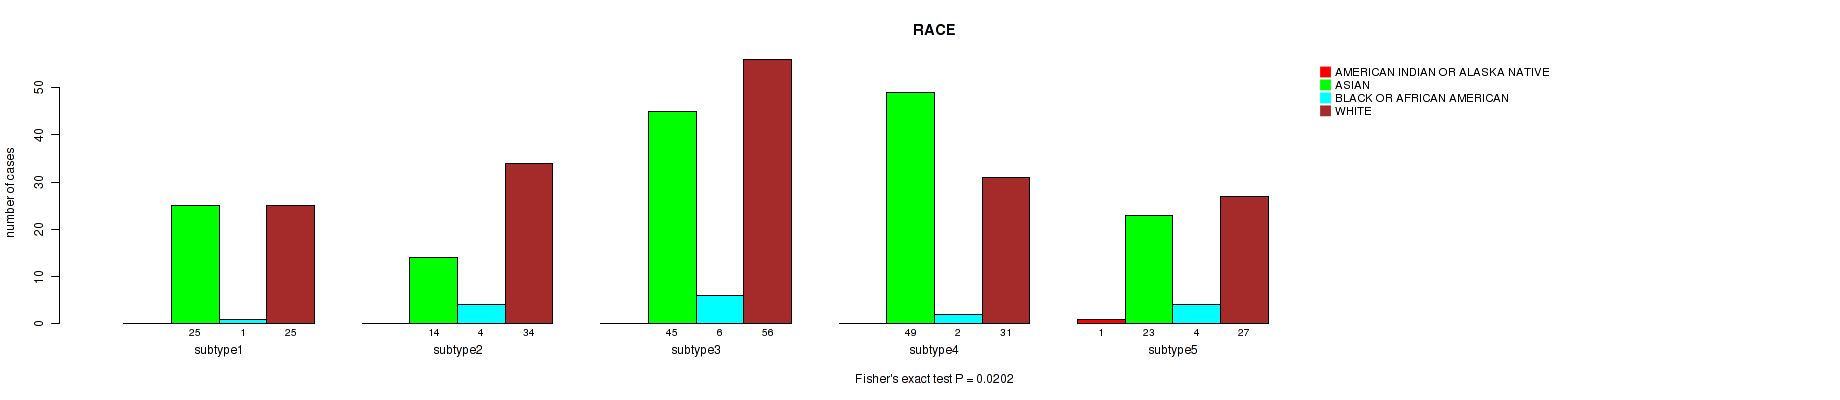
P value = 0.0202 (Fisher's exact test), Q value = 0.079
Table S47. Clustering Approach #4: 'RNAseq cHierClus subtypes' versus Clinical Feature #10: 'RACE'
| nPatients | AMERICAN INDIAN OR ALASKA NATIVE | ASIAN | BLACK OR AFRICAN AMERICAN | WHITE |
|---|---|---|---|---|
| ALL | 1 | 156 | 17 | 173 |
| subtype1 | 0 | 25 | 1 | 25 |
| subtype2 | 0 | 14 | 4 | 34 |
| subtype3 | 0 | 45 | 6 | 56 |
| subtype4 | 0 | 49 | 2 | 31 |
| subtype5 | 1 | 23 | 4 | 27 |
Figure S43. Get High-res Image Clustering Approach #4: 'RNAseq cHierClus subtypes' versus Clinical Feature #10: 'RACE'
P value = 0.324 (Fisher's exact test), Q value = 0.5
Table S48. Clustering Approach #4: 'RNAseq cHierClus subtypes' versus Clinical Feature #11: 'ETHNICITY'
| nPatients | HISPANIC OR LATINO | NOT HISPANIC OR LATINO |
|---|---|---|
| ALL | 12 | 328 |
| subtype1 | 2 | 49 |
| subtype2 | 4 | 50 |
| subtype3 | 4 | 98 |
| subtype4 | 2 | 78 |
| subtype5 | 0 | 53 |
Figure S44. Get High-res Image Clustering Approach #4: 'RNAseq cHierClus subtypes' versus Clinical Feature #11: 'ETHNICITY'
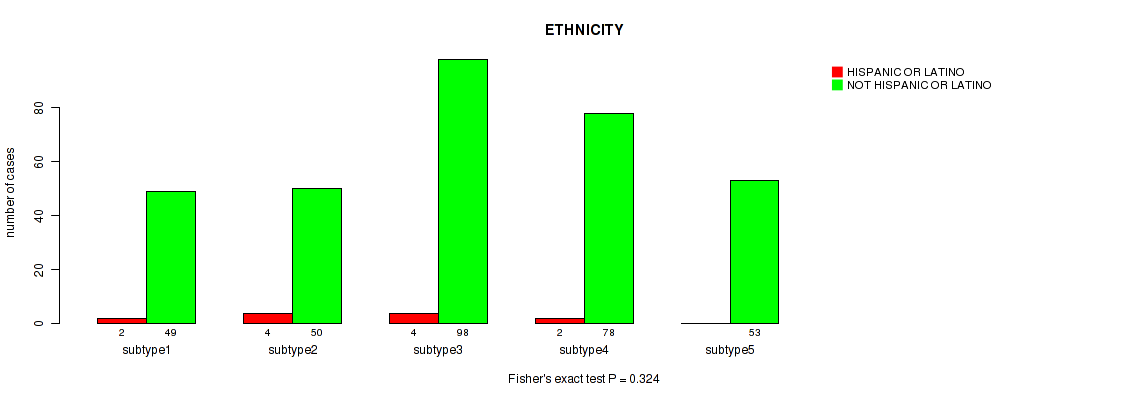
Table S49. Description of clustering approach #5: 'MIRSEQ CNMF'
| Cluster Labels | 1 | 2 | 3 | 4 |
|---|---|---|---|---|
| Number of samples | 62 | 127 | 49 | 120 |
P value = 0.449 (logrank test), Q value = 0.62
Table S50. Clustering Approach #5: 'MIRSEQ CNMF' versus Clinical Feature #1: 'Time to Death'
| nPatients | nDeath | Duration Range (Median), Month | |
|---|---|---|---|
| ALL | 333 | 107 | 0.0 - 120.8 (19.3) |
| subtype1 | 60 | 23 | 0.0 - 120.8 (19.0) |
| subtype2 | 117 | 39 | 0.3 - 108.8 (19.2) |
| subtype3 | 42 | 13 | 0.1 - 83.2 (24.7) |
| subtype4 | 114 | 32 | 0.1 - 114.3 (18.4) |
Figure S45. Get High-res Image Clustering Approach #5: 'MIRSEQ CNMF' versus Clinical Feature #1: 'Time to Death'

P value = 0.00388 (Kruskal-Wallis (anova)), Q value = 0.026
Table S51. Clustering Approach #5: 'MIRSEQ CNMF' versus Clinical Feature #2: 'YEARS_TO_BIRTH'
| nPatients | Mean (Std.Dev) | |
|---|---|---|
| ALL | 355 | 59.6 (12.9) |
| subtype1 | 60 | 62.8 (10.9) |
| subtype2 | 127 | 61.2 (13.2) |
| subtype3 | 49 | 55.9 (14.5) |
| subtype4 | 119 | 57.7 (12.4) |
Figure S46. Get High-res Image Clustering Approach #5: 'MIRSEQ CNMF' versus Clinical Feature #2: 'YEARS_TO_BIRTH'

P value = 0.181 (Fisher's exact test), Q value = 0.35
Table S52. Clustering Approach #5: 'MIRSEQ CNMF' versus Clinical Feature #3: 'NEOPLASM_DISEASESTAGE'
| nPatients | STAGE I | STAGE II | STAGE III | STAGE IIIA | STAGE IIIB | STAGE IIIC | STAGE IV | STAGE IVA | STAGE IVB |
|---|---|---|---|---|---|---|---|---|---|
| ALL | 166 | 83 | 3 | 61 | 8 | 9 | 3 | 1 | 2 |
| subtype1 | 32 | 8 | 1 | 9 | 3 | 1 | 1 | 1 | 1 |
| subtype2 | 59 | 32 | 0 | 26 | 3 | 3 | 0 | 0 | 0 |
| subtype3 | 19 | 13 | 2 | 10 | 0 | 2 | 1 | 0 | 0 |
| subtype4 | 56 | 30 | 0 | 16 | 2 | 3 | 1 | 0 | 1 |
Figure S47. Get High-res Image Clustering Approach #5: 'MIRSEQ CNMF' versus Clinical Feature #3: 'NEOPLASM_DISEASESTAGE'

P value = 0.894 (Fisher's exact test), Q value = 0.96
Table S53. Clustering Approach #5: 'MIRSEQ CNMF' versus Clinical Feature #4: 'PATHOLOGY_T_STAGE'
| nPatients | T0+T1 | T2 | T3 | T4 |
|---|---|---|---|---|
| ALL | 177 | 90 | 76 | 13 |
| subtype1 | 35 | 11 | 13 | 3 |
| subtype2 | 60 | 33 | 29 | 4 |
| subtype3 | 22 | 13 | 12 | 2 |
| subtype4 | 60 | 33 | 22 | 4 |
Figure S48. Get High-res Image Clustering Approach #5: 'MIRSEQ CNMF' versus Clinical Feature #4: 'PATHOLOGY_T_STAGE'

P value = 0.677 (Fisher's exact test), Q value = 0.81
Table S54. Clustering Approach #5: 'MIRSEQ CNMF' versus Clinical Feature #5: 'PATHOLOGY_N_STAGE'
| nPatients | 0 | 1 |
|---|---|---|
| ALL | 249 | 4 |
| subtype1 | 40 | 1 |
| subtype2 | 91 | 1 |
| subtype3 | 37 | 1 |
| subtype4 | 81 | 1 |
Figure S49. Get High-res Image Clustering Approach #5: 'MIRSEQ CNMF' versus Clinical Feature #5: 'PATHOLOGY_N_STAGE'

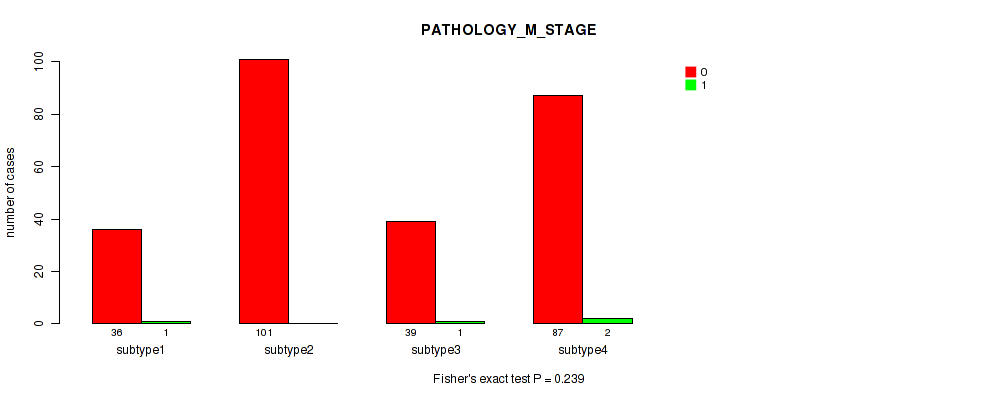
P value = 0.239 (Fisher's exact test), Q value = 0.44
Table S55. Clustering Approach #5: 'MIRSEQ CNMF' versus Clinical Feature #6: 'PATHOLOGY_M_STAGE'
| nPatients | 0 | 1 |
|---|---|---|
| ALL | 263 | 4 |
| subtype1 | 36 | 1 |
| subtype2 | 101 | 0 |
| subtype3 | 39 | 1 |
| subtype4 | 87 | 2 |
Figure S50. Get High-res Image Clustering Approach #5: 'MIRSEQ CNMF' versus Clinical Feature #6: 'PATHOLOGY_M_STAGE'
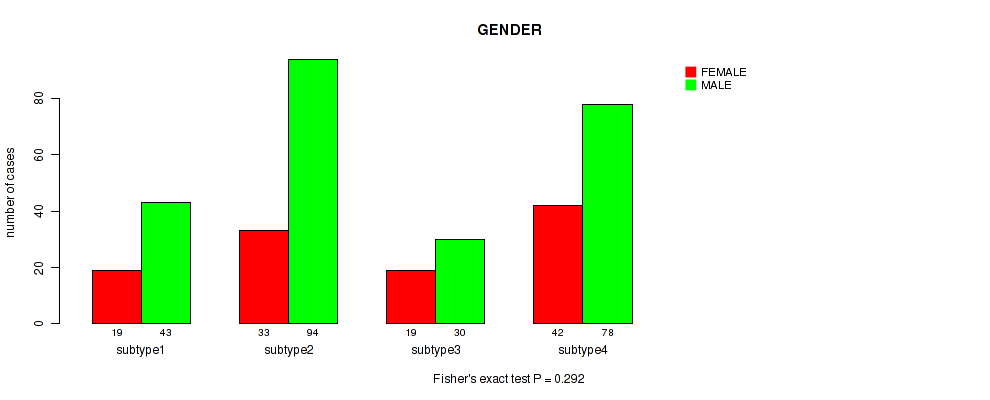
P value = 0.292 (Fisher's exact test), Q value = 0.49
Table S56. Clustering Approach #5: 'MIRSEQ CNMF' versus Clinical Feature #7: 'GENDER'
| nPatients | FEMALE | MALE |
|---|---|---|
| ALL | 113 | 245 |
| subtype1 | 19 | 43 |
| subtype2 | 33 | 94 |
| subtype3 | 19 | 30 |
| subtype4 | 42 | 78 |
Figure S51. Get High-res Image Clustering Approach #5: 'MIRSEQ CNMF' versus Clinical Feature #7: 'GENDER'
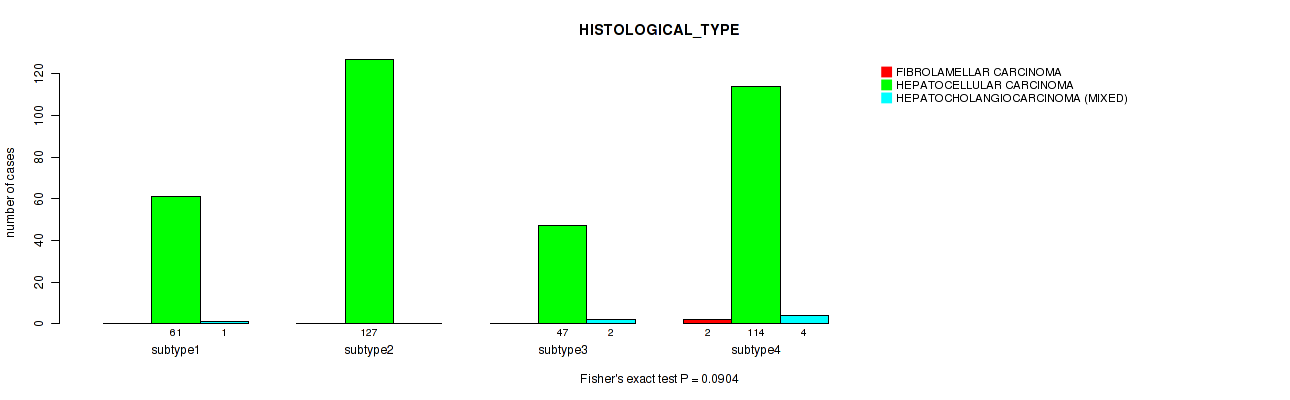
P value = 0.0904 (Fisher's exact test), Q value = 0.23
Table S57. Clustering Approach #5: 'MIRSEQ CNMF' versus Clinical Feature #8: 'HISTOLOGICAL_TYPE'
| nPatients | FIBROLAMELLAR CARCINOMA | HEPATOCELLULAR CARCINOMA | HEPATOCHOLANGIOCARCINOMA (MIXED) |
|---|---|---|---|
| ALL | 2 | 349 | 7 |
| subtype1 | 0 | 61 | 1 |
| subtype2 | 0 | 127 | 0 |
| subtype3 | 0 | 47 | 2 |
| subtype4 | 2 | 114 | 4 |
Figure S52. Get High-res Image Clustering Approach #5: 'MIRSEQ CNMF' versus Clinical Feature #8: 'HISTOLOGICAL_TYPE'
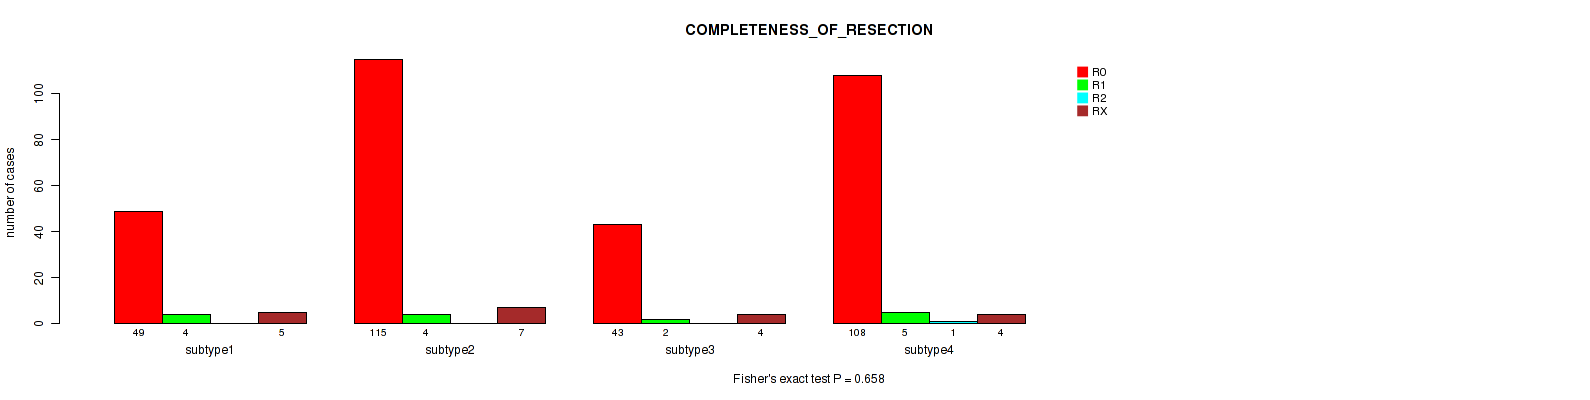
P value = 0.658 (Fisher's exact test), Q value = 0.81
Table S58. Clustering Approach #5: 'MIRSEQ CNMF' versus Clinical Feature #9: 'COMPLETENESS_OF_RESECTION'
| nPatients | R0 | R1 | R2 | RX |
|---|---|---|---|---|
| ALL | 315 | 15 | 1 | 20 |
| subtype1 | 49 | 4 | 0 | 5 |
| subtype2 | 115 | 4 | 0 | 7 |
| subtype3 | 43 | 2 | 0 | 4 |
| subtype4 | 108 | 5 | 1 | 4 |
Figure S53. Get High-res Image Clustering Approach #5: 'MIRSEQ CNMF' versus Clinical Feature #9: 'COMPLETENESS_OF_RESECTION'
P value = 0.376 (Fisher's exact test), Q value = 0.53
Table S59. Clustering Approach #5: 'MIRSEQ CNMF' versus Clinical Feature #10: 'RACE'
| nPatients | AMERICAN INDIAN OR ALASKA NATIVE | ASIAN | BLACK OR AFRICAN AMERICAN | WHITE |
|---|---|---|---|---|
| ALL | 1 | 159 | 17 | 171 |
| subtype1 | 0 | 20 | 4 | 36 |
| subtype2 | 1 | 58 | 6 | 59 |
| subtype3 | 0 | 27 | 3 | 19 |
| subtype4 | 0 | 54 | 4 | 57 |
Figure S54. Get High-res Image Clustering Approach #5: 'MIRSEQ CNMF' versus Clinical Feature #10: 'RACE'

P value = 0.303 (Fisher's exact test), Q value = 0.49
Table S60. Clustering Approach #5: 'MIRSEQ CNMF' versus Clinical Feature #11: 'ETHNICITY'
| nPatients | HISPANIC OR LATINO | NOT HISPANIC OR LATINO |
|---|---|---|
| ALL | 12 | 329 |
| subtype1 | 2 | 56 |
| subtype2 | 2 | 119 |
| subtype3 | 1 | 46 |
| subtype4 | 7 | 108 |
Figure S55. Get High-res Image Clustering Approach #5: 'MIRSEQ CNMF' versus Clinical Feature #11: 'ETHNICITY'

Table S61. Description of clustering approach #6: 'MIRSEQ CHIERARCHICAL'
| Cluster Labels | 1 | 2 | 3 | 4 | 5 |
|---|---|---|---|---|---|
| Number of samples | 41 | 96 | 56 | 118 | 47 |
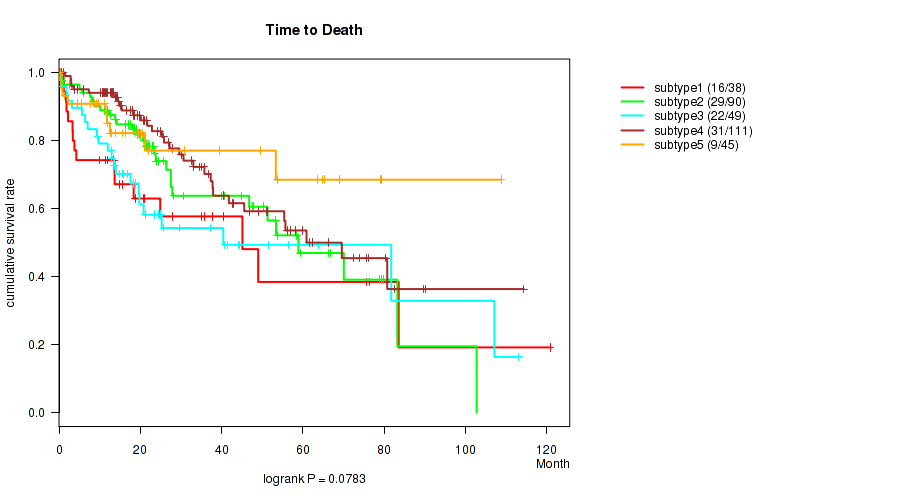
P value = 0.0783 (logrank test), Q value = 0.22
Table S62. Clustering Approach #6: 'MIRSEQ CHIERARCHICAL' versus Clinical Feature #1: 'Time to Death'
| nPatients | nDeath | Duration Range (Median), Month | |
|---|---|---|---|
| ALL | 333 | 107 | 0.0 - 120.8 (19.3) |
| subtype1 | 38 | 16 | 0.0 - 120.8 (14.3) |
| subtype2 | 90 | 29 | 0.1 - 102.7 (21.3) |
| subtype3 | 49 | 22 | 0.3 - 113.0 (17.6) |
| subtype4 | 111 | 31 | 0.1 - 114.3 (21.0) |
| subtype5 | 45 | 9 | 0.3 - 108.8 (16.4) |
Figure S56. Get High-res Image Clustering Approach #6: 'MIRSEQ CHIERARCHICAL' versus Clinical Feature #1: 'Time to Death'
P value = 2.37e-05 (Kruskal-Wallis (anova)), Q value = 0.00052
Table S63. Clustering Approach #6: 'MIRSEQ CHIERARCHICAL' versus Clinical Feature #2: 'YEARS_TO_BIRTH'
| nPatients | Mean (Std.Dev) | |
|---|---|---|
| ALL | 355 | 59.6 (12.9) |
| subtype1 | 41 | 62.0 (11.1) |
| subtype2 | 94 | 62.9 (11.8) |
| subtype3 | 56 | 58.7 (13.6) |
| subtype4 | 117 | 54.9 (13.9) |
| subtype5 | 47 | 63.4 (9.9) |
Figure S57. Get High-res Image Clustering Approach #6: 'MIRSEQ CHIERARCHICAL' versus Clinical Feature #2: 'YEARS_TO_BIRTH'

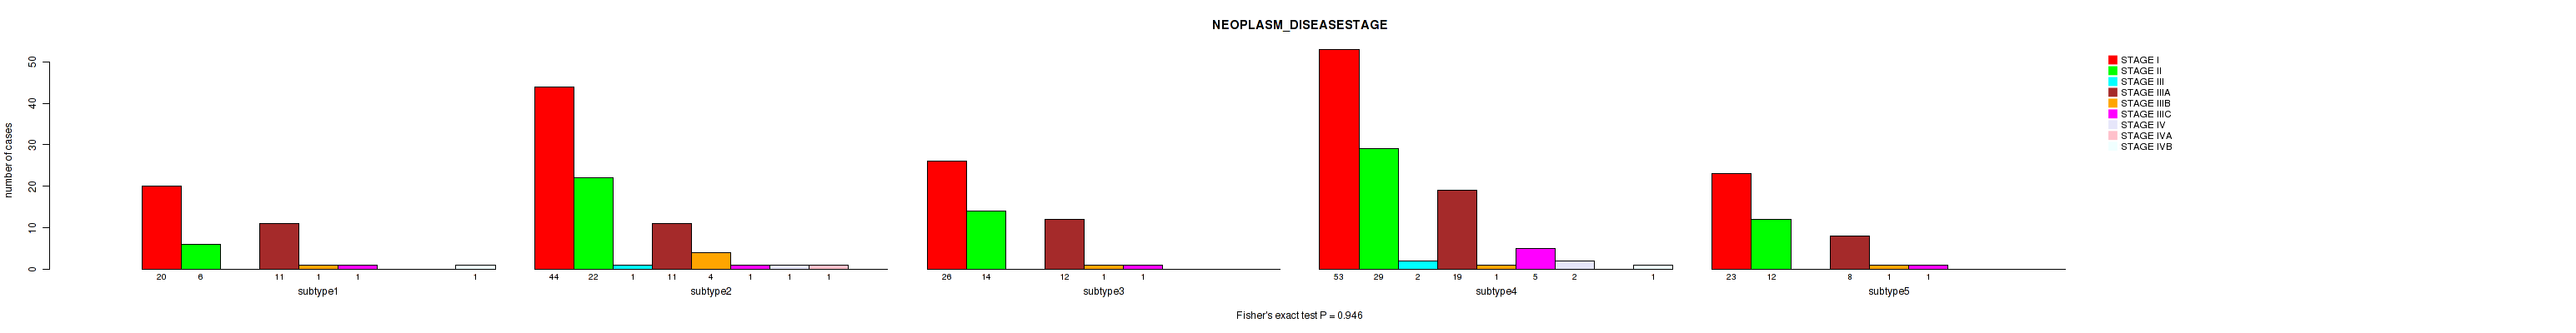
P value = 0.946 (Fisher's exact test), Q value = 0.99
Table S64. Clustering Approach #6: 'MIRSEQ CHIERARCHICAL' versus Clinical Feature #3: 'NEOPLASM_DISEASESTAGE'
| nPatients | STAGE I | STAGE II | STAGE III | STAGE IIIA | STAGE IIIB | STAGE IIIC | STAGE IV | STAGE IVA | STAGE IVB |
|---|---|---|---|---|---|---|---|---|---|
| ALL | 166 | 83 | 3 | 61 | 8 | 9 | 3 | 1 | 2 |
| subtype1 | 20 | 6 | 0 | 11 | 1 | 1 | 0 | 0 | 1 |
| subtype2 | 44 | 22 | 1 | 11 | 4 | 1 | 1 | 1 | 0 |
| subtype3 | 26 | 14 | 0 | 12 | 1 | 1 | 0 | 0 | 0 |
| subtype4 | 53 | 29 | 2 | 19 | 1 | 5 | 2 | 0 | 1 |
| subtype5 | 23 | 12 | 0 | 8 | 1 | 1 | 0 | 0 | 0 |
Figure S58. Get High-res Image Clustering Approach #6: 'MIRSEQ CHIERARCHICAL' versus Clinical Feature #3: 'NEOPLASM_DISEASESTAGE'
P value = 0.856 (Fisher's exact test), Q value = 0.95
Table S65. Clustering Approach #6: 'MIRSEQ CHIERARCHICAL' versus Clinical Feature #4: 'PATHOLOGY_T_STAGE'
| nPatients | T0+T1 | T2 | T3 | T4 |
|---|---|---|---|---|
| ALL | 177 | 90 | 76 | 13 |
| subtype1 | 20 | 7 | 12 | 2 |
| subtype2 | 49 | 25 | 17 | 5 |
| subtype3 | 28 | 14 | 14 | 0 |
| subtype4 | 56 | 32 | 24 | 5 |
| subtype5 | 24 | 12 | 9 | 1 |
Figure S59. Get High-res Image Clustering Approach #6: 'MIRSEQ CHIERARCHICAL' versus Clinical Feature #4: 'PATHOLOGY_T_STAGE'

P value = 1 (Fisher's exact test), Q value = 1
Table S66. Clustering Approach #6: 'MIRSEQ CHIERARCHICAL' versus Clinical Feature #5: 'PATHOLOGY_N_STAGE'
| nPatients | 0 | 1 |
|---|---|---|
| ALL | 249 | 4 |
| subtype1 | 30 | 0 |
| subtype2 | 57 | 1 |
| subtype3 | 39 | 1 |
| subtype4 | 86 | 2 |
| subtype5 | 37 | 0 |
Figure S60. Get High-res Image Clustering Approach #6: 'MIRSEQ CHIERARCHICAL' versus Clinical Feature #5: 'PATHOLOGY_N_STAGE'

P value = 0.31 (Fisher's exact test), Q value = 0.5
Table S67. Clustering Approach #6: 'MIRSEQ CHIERARCHICAL' versus Clinical Feature #6: 'PATHOLOGY_M_STAGE'
| nPatients | 0 | 1 |
|---|---|---|
| ALL | 263 | 4 |
| subtype1 | 26 | 1 |
| subtype2 | 64 | 0 |
| subtype3 | 42 | 0 |
| subtype4 | 92 | 3 |
| subtype5 | 39 | 0 |
Figure S61. Get High-res Image Clustering Approach #6: 'MIRSEQ CHIERARCHICAL' versus Clinical Feature #6: 'PATHOLOGY_M_STAGE'

P value = 0.0207 (Fisher's exact test), Q value = 0.079
Table S68. Clustering Approach #6: 'MIRSEQ CHIERARCHICAL' versus Clinical Feature #7: 'GENDER'
| nPatients | FEMALE | MALE |
|---|---|---|
| ALL | 113 | 245 |
| subtype1 | 13 | 28 |
| subtype2 | 29 | 67 |
| subtype3 | 19 | 37 |
| subtype4 | 46 | 72 |
| subtype5 | 6 | 41 |
Figure S62. Get High-res Image Clustering Approach #6: 'MIRSEQ CHIERARCHICAL' versus Clinical Feature #7: 'GENDER'

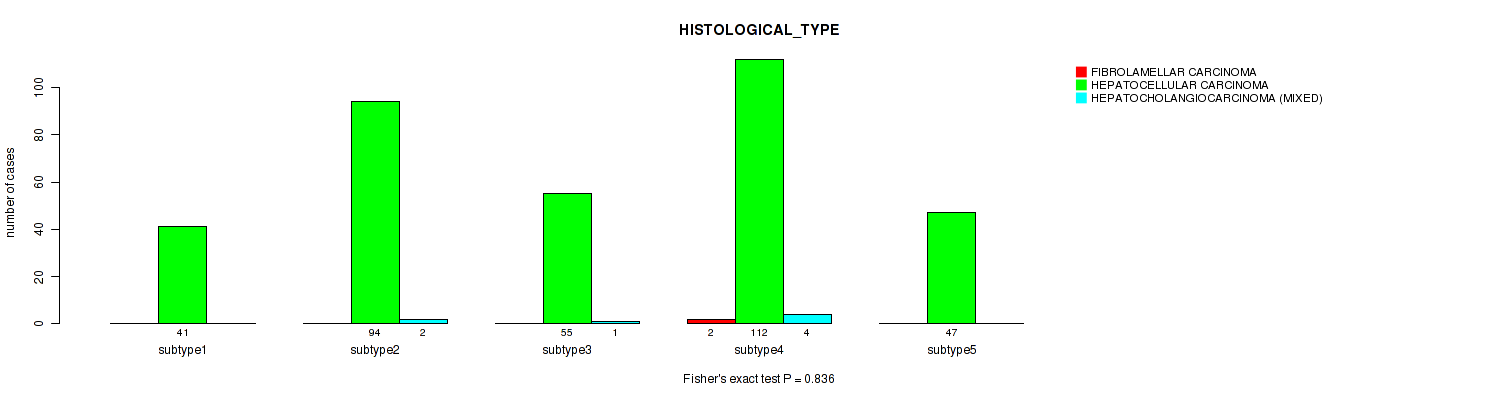
P value = 0.836 (Fisher's exact test), Q value = 0.94
Table S69. Clustering Approach #6: 'MIRSEQ CHIERARCHICAL' versus Clinical Feature #8: 'HISTOLOGICAL_TYPE'
| nPatients | FIBROLAMELLAR CARCINOMA | HEPATOCELLULAR CARCINOMA | HEPATOCHOLANGIOCARCINOMA (MIXED) |
|---|---|---|---|
| ALL | 2 | 349 | 7 |
| subtype1 | 0 | 41 | 0 |
| subtype2 | 0 | 94 | 2 |
| subtype3 | 0 | 55 | 1 |
| subtype4 | 2 | 112 | 4 |
| subtype5 | 0 | 47 | 0 |
Figure S63. Get High-res Image Clustering Approach #6: 'MIRSEQ CHIERARCHICAL' versus Clinical Feature #8: 'HISTOLOGICAL_TYPE'
P value = 0.326 (Fisher's exact test), Q value = 0.5
Table S70. Clustering Approach #6: 'MIRSEQ CHIERARCHICAL' versus Clinical Feature #9: 'COMPLETENESS_OF_RESECTION'
| nPatients | R0 | R1 | R2 | RX |
|---|---|---|---|---|
| ALL | 315 | 15 | 1 | 20 |
| subtype1 | 32 | 3 | 0 | 3 |
| subtype2 | 82 | 5 | 0 | 6 |
| subtype3 | 50 | 1 | 0 | 5 |
| subtype4 | 105 | 6 | 1 | 6 |
| subtype5 | 46 | 0 | 0 | 0 |
Figure S64. Get High-res Image Clustering Approach #6: 'MIRSEQ CHIERARCHICAL' versus Clinical Feature #9: 'COMPLETENESS_OF_RESECTION'

P value = 0.119 (Fisher's exact test), Q value = 0.28
Table S71. Clustering Approach #6: 'MIRSEQ CHIERARCHICAL' versus Clinical Feature #10: 'RACE'
| nPatients | AMERICAN INDIAN OR ALASKA NATIVE | ASIAN | BLACK OR AFRICAN AMERICAN | WHITE |
|---|---|---|---|---|
| ALL | 1 | 159 | 17 | 171 |
| subtype1 | 0 | 17 | 5 | 19 |
| subtype2 | 0 | 33 | 5 | 52 |
| subtype3 | 0 | 32 | 2 | 21 |
| subtype4 | 0 | 56 | 4 | 55 |
| subtype5 | 1 | 21 | 1 | 24 |
Figure S65. Get High-res Image Clustering Approach #6: 'MIRSEQ CHIERARCHICAL' versus Clinical Feature #10: 'RACE'

P value = 0.674 (Fisher's exact test), Q value = 0.81
Table S72. Clustering Approach #6: 'MIRSEQ CHIERARCHICAL' versus Clinical Feature #11: 'ETHNICITY'
| nPatients | HISPANIC OR LATINO | NOT HISPANIC OR LATINO |
|---|---|---|
| ALL | 12 | 329 |
| subtype1 | 1 | 39 |
| subtype2 | 4 | 85 |
| subtype3 | 3 | 51 |
| subtype4 | 4 | 110 |
| subtype5 | 0 | 44 |
Figure S66. Get High-res Image Clustering Approach #6: 'MIRSEQ CHIERARCHICAL' versus Clinical Feature #11: 'ETHNICITY'
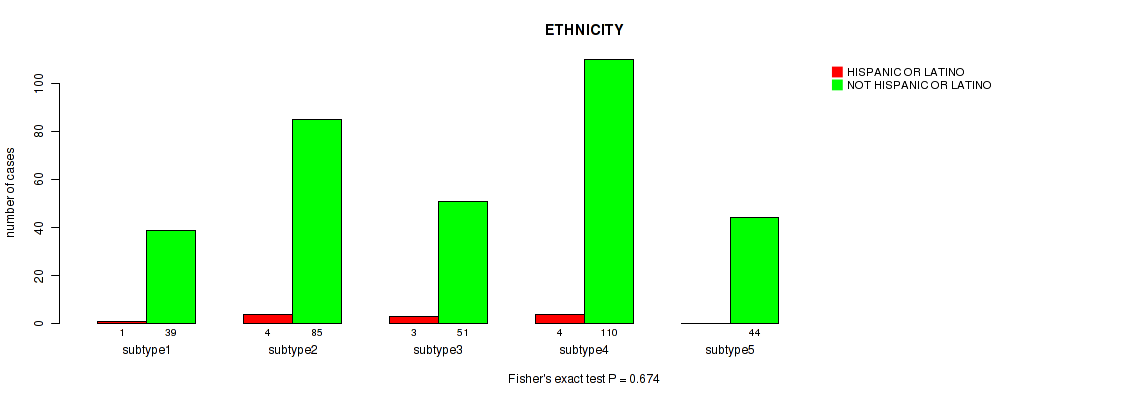
Table S73. Description of clustering approach #7: 'MIRseq Mature CNMF subtypes'
| Cluster Labels | 1 | 2 | 3 | 4 |
|---|---|---|---|---|
| Number of samples | 91 | 84 | 118 | 41 |
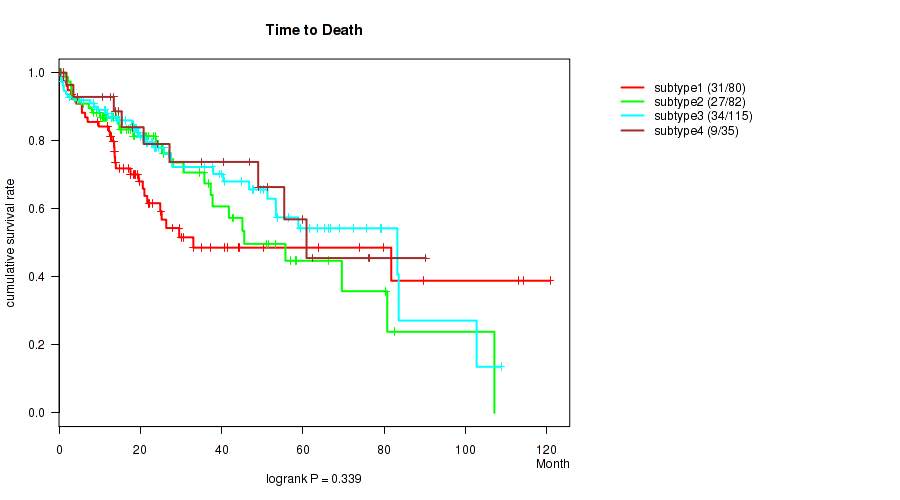
P value = 0.339 (logrank test), Q value = 0.5
Table S74. Clustering Approach #7: 'MIRseq Mature CNMF subtypes' versus Clinical Feature #1: 'Time to Death'
| nPatients | nDeath | Duration Range (Median), Month | |
|---|---|---|---|
| ALL | 312 | 101 | 0.0 - 120.8 (19.3) |
| subtype1 | 80 | 31 | 0.2 - 120.8 (17.3) |
| subtype2 | 82 | 27 | 0.1 - 107.1 (18.4) |
| subtype3 | 115 | 34 | 0.3 - 108.8 (20.7) |
| subtype4 | 35 | 9 | 0.0 - 90.3 (18.1) |
Figure S67. Get High-res Image Clustering Approach #7: 'MIRseq Mature CNMF subtypes' versus Clinical Feature #1: 'Time to Death'
P value = 0.00707 (Kruskal-Wallis (anova)), Q value = 0.035
Table S75. Clustering Approach #7: 'MIRseq Mature CNMF subtypes' versus Clinical Feature #2: 'YEARS_TO_BIRTH'
| nPatients | Mean (Std.Dev) | |
|---|---|---|
| ALL | 331 | 59.6 (12.7) |
| subtype1 | 91 | 58.0 (13.4) |
| subtype2 | 83 | 58.9 (12.4) |
| subtype3 | 117 | 62.9 (10.2) |
| subtype4 | 40 | 55.1 (15.7) |
Figure S68. Get High-res Image Clustering Approach #7: 'MIRseq Mature CNMF subtypes' versus Clinical Feature #2: 'YEARS_TO_BIRTH'

P value = 0.00034 (Fisher's exact test), Q value = 0.0033
Table S76. Clustering Approach #7: 'MIRseq Mature CNMF subtypes' versus Clinical Feature #3: 'NEOPLASM_DISEASESTAGE'
| nPatients | STAGE I | STAGE II | STAGE III | STAGE IIIA | STAGE IIIB | STAGE IIIC | STAGE IV | STAGE IVA | STAGE IVB |
|---|---|---|---|---|---|---|---|---|---|
| ALL | 153 | 80 | 3 | 56 | 6 | 8 | 3 | 1 | 2 |
| subtype1 | 33 | 22 | 0 | 25 | 5 | 5 | 0 | 0 | 0 |
| subtype2 | 36 | 20 | 0 | 12 | 0 | 3 | 2 | 1 | 1 |
| subtype3 | 66 | 27 | 1 | 12 | 0 | 0 | 0 | 0 | 1 |
| subtype4 | 18 | 11 | 2 | 7 | 1 | 0 | 1 | 0 | 0 |
Figure S69. Get High-res Image Clustering Approach #7: 'MIRseq Mature CNMF subtypes' versus Clinical Feature #3: 'NEOPLASM_DISEASESTAGE'

P value = 0.011 (Fisher's exact test), Q value = 0.046
Table S77. Clustering Approach #7: 'MIRseq Mature CNMF subtypes' versus Clinical Feature #4: 'PATHOLOGY_T_STAGE'
| nPatients | T0+T1 | T2 | T3 | T4 |
|---|---|---|---|---|
| ALL | 164 | 87 | 69 | 12 |
| subtype1 | 34 | 23 | 29 | 5 |
| subtype2 | 41 | 23 | 15 | 5 |
| subtype3 | 70 | 30 | 14 | 2 |
| subtype4 | 19 | 11 | 11 | 0 |
Figure S70. Get High-res Image Clustering Approach #7: 'MIRseq Mature CNMF subtypes' versus Clinical Feature #4: 'PATHOLOGY_T_STAGE'

P value = 0.159 (Fisher's exact test), Q value = 0.34
Table S78. Clustering Approach #7: 'MIRseq Mature CNMF subtypes' versus Clinical Feature #5: 'PATHOLOGY_N_STAGE'
| nPatients | 0 | 1 |
|---|---|---|
| ALL | 233 | 4 |
| subtype1 | 65 | 3 |
| subtype2 | 53 | 1 |
| subtype3 | 83 | 0 |
| subtype4 | 32 | 0 |
Figure S71. Get High-res Image Clustering Approach #7: 'MIRseq Mature CNMF subtypes' versus Clinical Feature #5: 'PATHOLOGY_N_STAGE'

P value = 0.286 (Fisher's exact test), Q value = 0.48
Table S79. Clustering Approach #7: 'MIRseq Mature CNMF subtypes' versus Clinical Feature #6: 'PATHOLOGY_M_STAGE'
| nPatients | 0 | 1 |
|---|---|---|
| ALL | 249 | 4 |
| subtype1 | 73 | 0 |
| subtype2 | 51 | 2 |
| subtype3 | 89 | 1 |
| subtype4 | 36 | 1 |
Figure S72. Get High-res Image Clustering Approach #7: 'MIRseq Mature CNMF subtypes' versus Clinical Feature #6: 'PATHOLOGY_M_STAGE'
P value = 0.0225 (Fisher's exact test), Q value = 0.082
Table S80. Clustering Approach #7: 'MIRseq Mature CNMF subtypes' versus Clinical Feature #7: 'GENDER'
| nPatients | FEMALE | MALE |
|---|---|---|
| ALL | 110 | 224 |
| subtype1 | 38 | 53 |
| subtype2 | 29 | 55 |
| subtype3 | 27 | 91 |
| subtype4 | 16 | 25 |
Figure S73. Get High-res Image Clustering Approach #7: 'MIRseq Mature CNMF subtypes' versus Clinical Feature #7: 'GENDER'

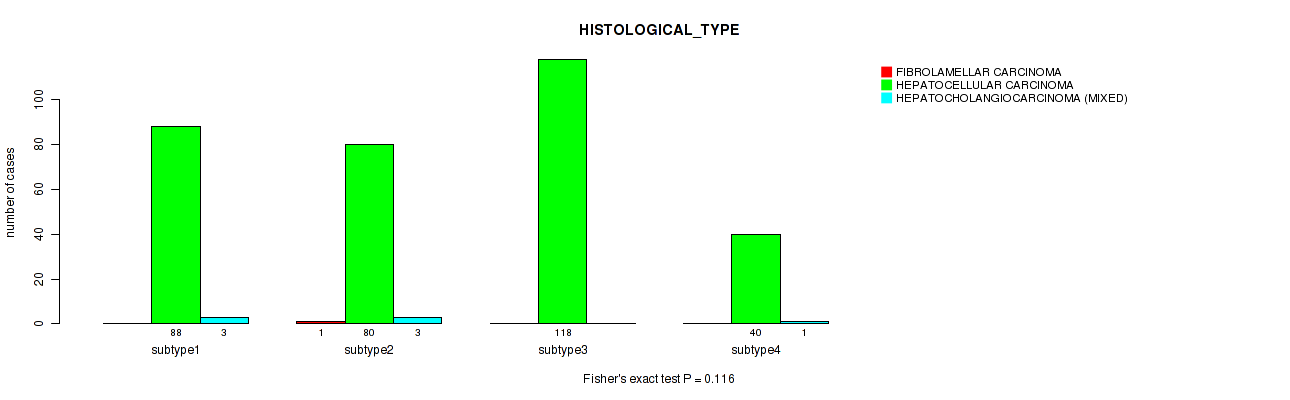
P value = 0.116 (Fisher's exact test), Q value = 0.28
Table S81. Clustering Approach #7: 'MIRseq Mature CNMF subtypes' versus Clinical Feature #8: 'HISTOLOGICAL_TYPE'
| nPatients | FIBROLAMELLAR CARCINOMA | HEPATOCELLULAR CARCINOMA | HEPATOCHOLANGIOCARCINOMA (MIXED) |
|---|---|---|---|
| ALL | 1 | 326 | 7 |
| subtype1 | 0 | 88 | 3 |
| subtype2 | 1 | 80 | 3 |
| subtype3 | 0 | 118 | 0 |
| subtype4 | 0 | 40 | 1 |
Figure S74. Get High-res Image Clustering Approach #7: 'MIRseq Mature CNMF subtypes' versus Clinical Feature #8: 'HISTOLOGICAL_TYPE'
P value = 0.184 (Fisher's exact test), Q value = 0.35
Table S82. Clustering Approach #7: 'MIRseq Mature CNMF subtypes' versus Clinical Feature #9: 'COMPLETENESS_OF_RESECTION'
| nPatients | R0 | R1 | R2 | RX |
|---|---|---|---|---|
| ALL | 295 | 15 | 1 | 17 |
| subtype1 | 78 | 5 | 0 | 5 |
| subtype2 | 70 | 7 | 1 | 4 |
| subtype3 | 111 | 2 | 0 | 4 |
| subtype4 | 36 | 1 | 0 | 4 |
Figure S75. Get High-res Image Clustering Approach #7: 'MIRseq Mature CNMF subtypes' versus Clinical Feature #9: 'COMPLETENESS_OF_RESECTION'

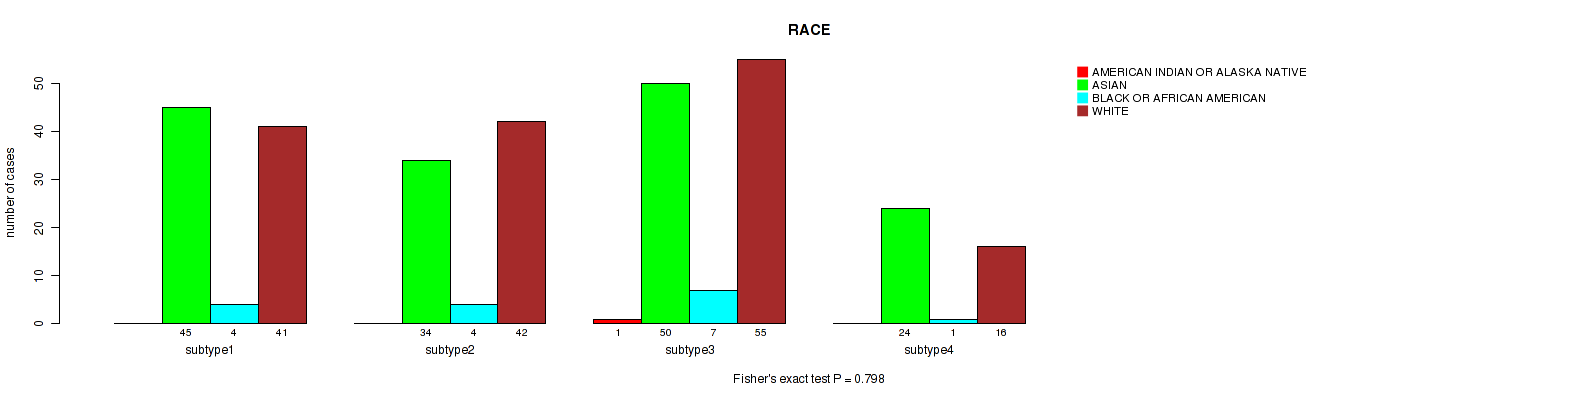
P value = 0.798 (Fisher's exact test), Q value = 0.91
Table S83. Clustering Approach #7: 'MIRseq Mature CNMF subtypes' versus Clinical Feature #10: 'RACE'
| nPatients | AMERICAN INDIAN OR ALASKA NATIVE | ASIAN | BLACK OR AFRICAN AMERICAN | WHITE |
|---|---|---|---|---|
| ALL | 1 | 153 | 16 | 154 |
| subtype1 | 0 | 45 | 4 | 41 |
| subtype2 | 0 | 34 | 4 | 42 |
| subtype3 | 1 | 50 | 7 | 55 |
| subtype4 | 0 | 24 | 1 | 16 |
Figure S76. Get High-res Image Clustering Approach #7: 'MIRseq Mature CNMF subtypes' versus Clinical Feature #10: 'RACE'
P value = 0.703 (Fisher's exact test), Q value = 0.82
Table S84. Clustering Approach #7: 'MIRseq Mature CNMF subtypes' versus Clinical Feature #11: 'ETHNICITY'
| nPatients | HISPANIC OR LATINO | NOT HISPANIC OR LATINO |
|---|---|---|
| ALL | 12 | 306 |
| subtype1 | 5 | 81 |
| subtype2 | 3 | 78 |
| subtype3 | 3 | 107 |
| subtype4 | 1 | 40 |
Figure S77. Get High-res Image Clustering Approach #7: 'MIRseq Mature CNMF subtypes' versus Clinical Feature #11: 'ETHNICITY'

Table S85. Description of clustering approach #8: 'MIRseq Mature cHierClus subtypes'
| Cluster Labels | 1 | 2 | 3 | 4 | 5 |
|---|---|---|---|---|---|
| Number of samples | 63 | 87 | 98 | 34 | 52 |
P value = 0.0842 (logrank test), Q value = 0.22
Table S86. Clustering Approach #8: 'MIRseq Mature cHierClus subtypes' versus Clinical Feature #1: 'Time to Death'
| nPatients | nDeath | Duration Range (Median), Month | |
|---|---|---|---|
| ALL | 312 | 101 | 0.0 - 120.8 (19.3) |
| subtype1 | 53 | 23 | 0.1 - 107.1 (17.6) |
| subtype2 | 82 | 27 | 0.3 - 113.0 (22.0) |
| subtype3 | 94 | 27 | 0.1 - 114.3 (20.0) |
| subtype4 | 32 | 14 | 0.0 - 120.8 (13.7) |
| subtype5 | 51 | 10 | 0.3 - 79.4 (18.6) |
Figure S78. Get High-res Image Clustering Approach #8: 'MIRseq Mature cHierClus subtypes' versus Clinical Feature #1: 'Time to Death'

P value = 3.13e-05 (Kruskal-Wallis (anova)), Q value = 0.00055
Table S87. Clustering Approach #8: 'MIRseq Mature cHierClus subtypes' versus Clinical Feature #2: 'YEARS_TO_BIRTH'
| nPatients | Mean (Std.Dev) | |
|---|---|---|
| ALL | 331 | 59.6 (12.7) |
| subtype1 | 63 | 55.1 (12.7) |
| subtype2 | 85 | 63.1 (11.5) |
| subtype3 | 97 | 56.6 (14.0) |
| subtype4 | 34 | 63.2 (10.9) |
| subtype5 | 52 | 62.7 (9.6) |
Figure S79. Get High-res Image Clustering Approach #8: 'MIRseq Mature cHierClus subtypes' versus Clinical Feature #2: 'YEARS_TO_BIRTH'

P value = 0.0888 (Fisher's exact test), Q value = 0.23
Table S88. Clustering Approach #8: 'MIRseq Mature cHierClus subtypes' versus Clinical Feature #3: 'NEOPLASM_DISEASESTAGE'
| nPatients | STAGE I | STAGE II | STAGE III | STAGE IIIA | STAGE IIIB | STAGE IIIC | STAGE IV | STAGE IVA | STAGE IVB |
|---|---|---|---|---|---|---|---|---|---|
| ALL | 153 | 80 | 3 | 56 | 6 | 8 | 3 | 1 | 2 |
| subtype1 | 24 | 14 | 0 | 19 | 1 | 1 | 0 | 0 | 0 |
| subtype2 | 38 | 20 | 1 | 11 | 4 | 1 | 1 | 1 | 0 |
| subtype3 | 45 | 25 | 2 | 12 | 0 | 5 | 2 | 0 | 1 |
| subtype4 | 19 | 4 | 0 | 8 | 1 | 1 | 0 | 0 | 1 |
| subtype5 | 27 | 17 | 0 | 6 | 0 | 0 | 0 | 0 | 0 |
Figure S80. Get High-res Image Clustering Approach #8: 'MIRseq Mature cHierClus subtypes' versus Clinical Feature #3: 'NEOPLASM_DISEASESTAGE'

P value = 0.108 (Fisher's exact test), Q value = 0.26
Table S89. Clustering Approach #8: 'MIRseq Mature cHierClus subtypes' versus Clinical Feature #4: 'PATHOLOGY_T_STAGE'
| nPatients | T0+T1 | T2 | T3 | T4 |
|---|---|---|---|---|
| ALL | 164 | 87 | 69 | 12 |
| subtype1 | 26 | 15 | 21 | 1 |
| subtype2 | 43 | 23 | 16 | 5 |
| subtype3 | 48 | 28 | 17 | 4 |
| subtype4 | 19 | 4 | 9 | 2 |
| subtype5 | 28 | 17 | 6 | 0 |
Figure S81. Get High-res Image Clustering Approach #8: 'MIRseq Mature cHierClus subtypes' versus Clinical Feature #4: 'PATHOLOGY_T_STAGE'

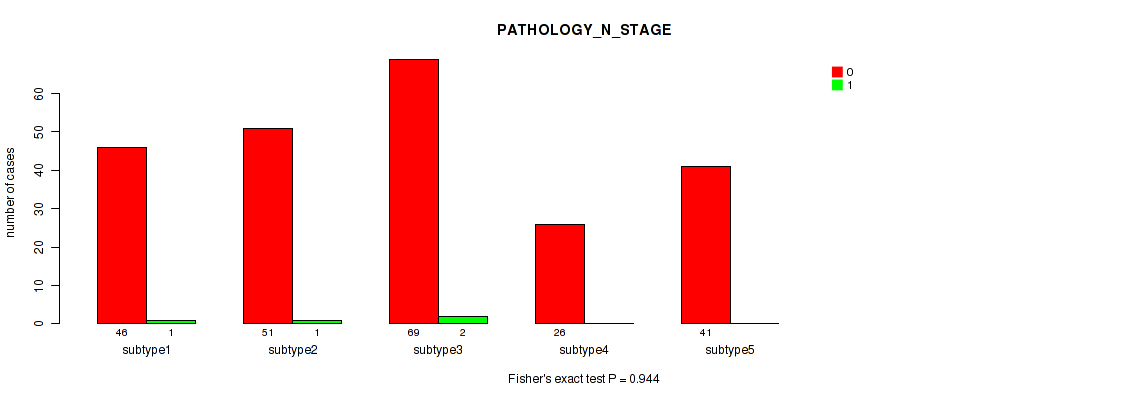
P value = 0.944 (Fisher's exact test), Q value = 0.99
Table S90. Clustering Approach #8: 'MIRseq Mature cHierClus subtypes' versus Clinical Feature #5: 'PATHOLOGY_N_STAGE'
| nPatients | 0 | 1 |
|---|---|---|
| ALL | 233 | 4 |
| subtype1 | 46 | 1 |
| subtype2 | 51 | 1 |
| subtype3 | 69 | 2 |
| subtype4 | 26 | 0 |
| subtype5 | 41 | 0 |
Figure S82. Get High-res Image Clustering Approach #8: 'MIRseq Mature cHierClus subtypes' versus Clinical Feature #5: 'PATHOLOGY_N_STAGE'
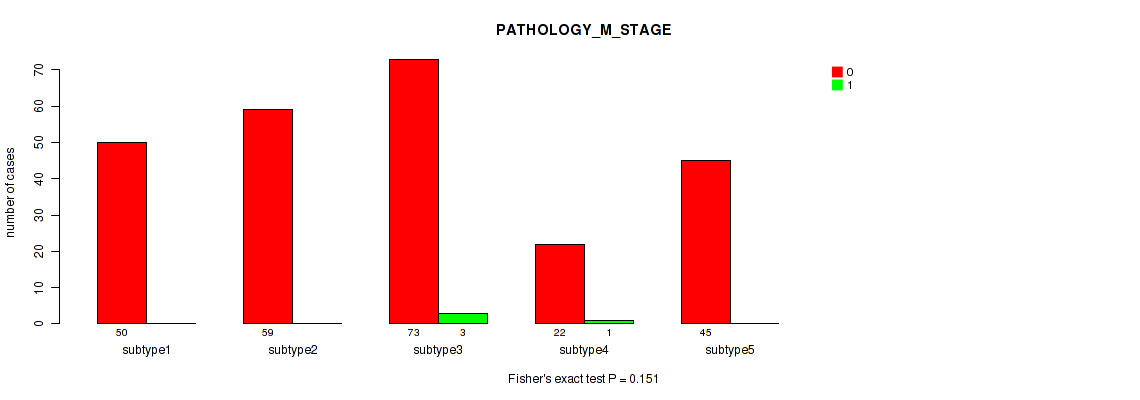
P value = 0.151 (Fisher's exact test), Q value = 0.33
Table S91. Clustering Approach #8: 'MIRseq Mature cHierClus subtypes' versus Clinical Feature #6: 'PATHOLOGY_M_STAGE'
| nPatients | 0 | 1 |
|---|---|---|
| ALL | 249 | 4 |
| subtype1 | 50 | 0 |
| subtype2 | 59 | 0 |
| subtype3 | 73 | 3 |
| subtype4 | 22 | 1 |
| subtype5 | 45 | 0 |
Figure S83. Get High-res Image Clustering Approach #8: 'MIRseq Mature cHierClus subtypes' versus Clinical Feature #6: 'PATHOLOGY_M_STAGE'
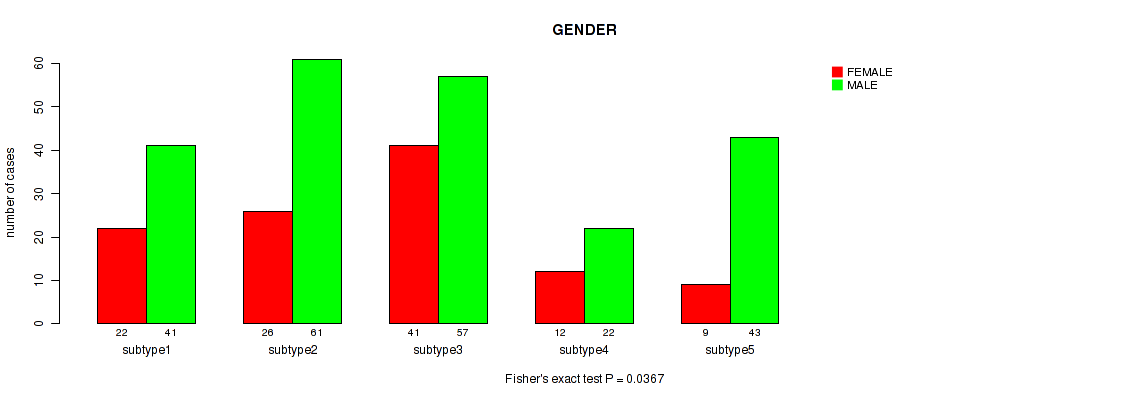
P value = 0.0367 (Fisher's exact test), Q value = 0.11
Table S92. Clustering Approach #8: 'MIRseq Mature cHierClus subtypes' versus Clinical Feature #7: 'GENDER'
| nPatients | FEMALE | MALE |
|---|---|---|
| ALL | 110 | 224 |
| subtype1 | 22 | 41 |
| subtype2 | 26 | 61 |
| subtype3 | 41 | 57 |
| subtype4 | 12 | 22 |
| subtype5 | 9 | 43 |
Figure S84. Get High-res Image Clustering Approach #8: 'MIRseq Mature cHierClus subtypes' versus Clinical Feature #7: 'GENDER'
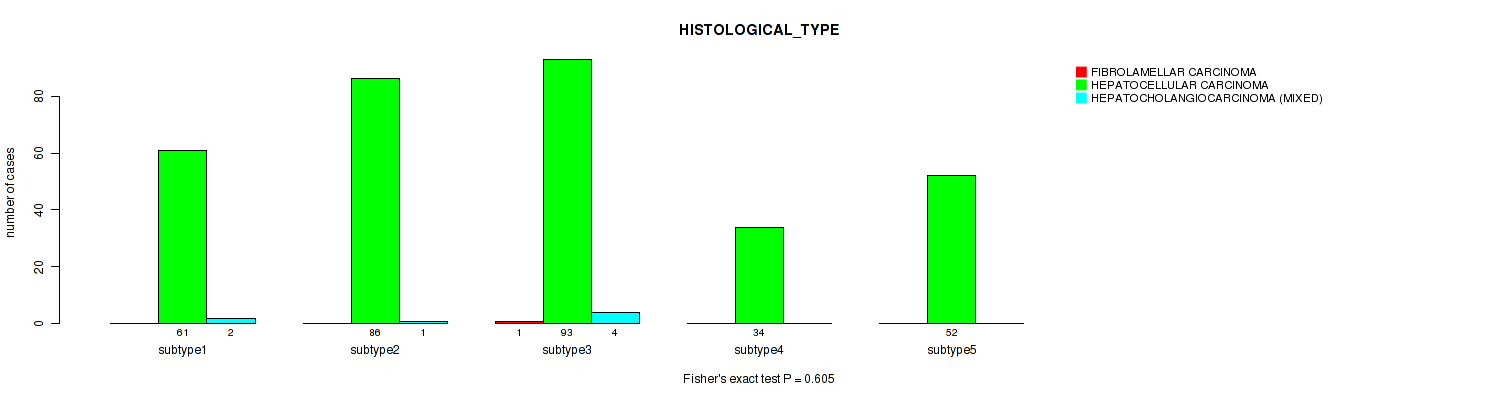
P value = 0.605 (Fisher's exact test), Q value = 0.79
Table S93. Clustering Approach #8: 'MIRseq Mature cHierClus subtypes' versus Clinical Feature #8: 'HISTOLOGICAL_TYPE'
| nPatients | FIBROLAMELLAR CARCINOMA | HEPATOCELLULAR CARCINOMA | HEPATOCHOLANGIOCARCINOMA (MIXED) |
|---|---|---|---|
| ALL | 1 | 326 | 7 |
| subtype1 | 0 | 61 | 2 |
| subtype2 | 0 | 86 | 1 |
| subtype3 | 1 | 93 | 4 |
| subtype4 | 0 | 34 | 0 |
| subtype5 | 0 | 52 | 0 |
Figure S85. Get High-res Image Clustering Approach #8: 'MIRseq Mature cHierClus subtypes' versus Clinical Feature #8: 'HISTOLOGICAL_TYPE'
P value = 0.185 (Fisher's exact test), Q value = 0.35
Table S94. Clustering Approach #8: 'MIRseq Mature cHierClus subtypes' versus Clinical Feature #9: 'COMPLETENESS_OF_RESECTION'
| nPatients | R0 | R1 | R2 | RX |
|---|---|---|---|---|
| ALL | 295 | 15 | 1 | 17 |
| subtype1 | 57 | 4 | 0 | 2 |
| subtype2 | 75 | 3 | 0 | 7 |
| subtype3 | 85 | 5 | 1 | 7 |
| subtype4 | 27 | 3 | 0 | 1 |
| subtype5 | 51 | 0 | 0 | 0 |
Figure S86. Get High-res Image Clustering Approach #8: 'MIRseq Mature cHierClus subtypes' versus Clinical Feature #9: 'COMPLETENESS_OF_RESECTION'

P value = 0.00935 (Fisher's exact test), Q value = 0.041
Table S95. Clustering Approach #8: 'MIRseq Mature cHierClus subtypes' versus Clinical Feature #10: 'RACE'
| nPatients | AMERICAN INDIAN OR ALASKA NATIVE | ASIAN | BLACK OR AFRICAN AMERICAN | WHITE |
|---|---|---|---|---|
| ALL | 1 | 153 | 16 | 154 |
| subtype1 | 0 | 41 | 1 | 21 |
| subtype2 | 0 | 27 | 7 | 47 |
| subtype3 | 0 | 45 | 4 | 46 |
| subtype4 | 0 | 13 | 3 | 18 |
| subtype5 | 1 | 27 | 1 | 22 |
Figure S87. Get High-res Image Clustering Approach #8: 'MIRseq Mature cHierClus subtypes' versus Clinical Feature #10: 'RACE'

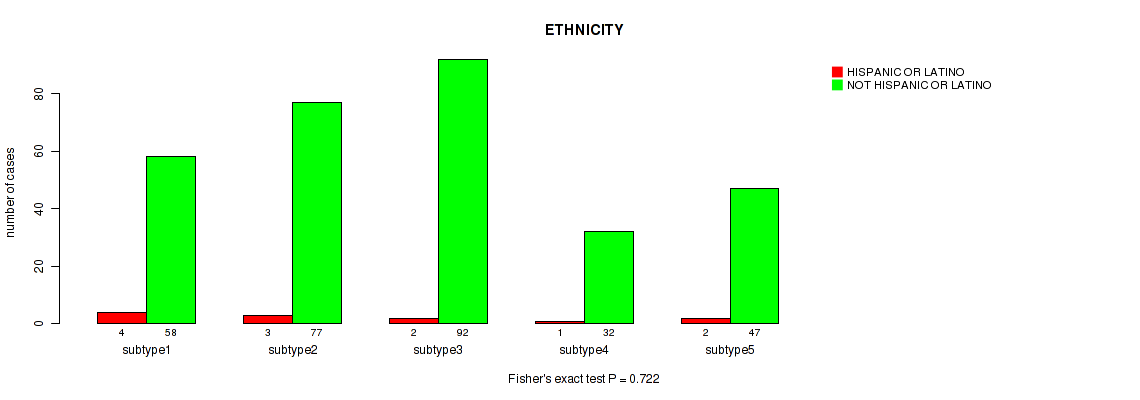
P value = 0.722 (Fisher's exact test), Q value = 0.84
Table S96. Clustering Approach #8: 'MIRseq Mature cHierClus subtypes' versus Clinical Feature #11: 'ETHNICITY'
| nPatients | HISPANIC OR LATINO | NOT HISPANIC OR LATINO |
|---|---|---|
| ALL | 12 | 306 |
| subtype1 | 4 | 58 |
| subtype2 | 3 | 77 |
| subtype3 | 2 | 92 |
| subtype4 | 1 | 32 |
| subtype5 | 2 | 47 |
Figure S88. Get High-res Image Clustering Approach #8: 'MIRseq Mature cHierClus subtypes' versus Clinical Feature #11: 'ETHNICITY'
-
Cluster data file = /xchip/cga/gdac-prod/tcga-gdac/jobResults/GDAC_mergedClustering/LIHC-TP/15111045/LIHC-TP.mergedcluster.txt
-
Clinical data file = /xchip/cga/gdac-prod/tcga-gdac/jobResults/Append_Data/LIHC-TP/15082975/LIHC-TP.merged_data.txt
-
Number of patients = 363
-
Number of clustering approaches = 8
-
Number of selected clinical features = 11
-
Exclude small clusters that include fewer than K patients, K = 3
consensus non-negative matrix factorization clustering approach (Brunet et al. 2004)
Resampling-based clustering method (Monti et al. 2003)
For survival clinical features, the Kaplan-Meier survival curves of tumors with and without gene mutations were plotted and the statistical significance P values were estimated by logrank test (Bland and Altman 2004) using the 'survdiff' function in R
For binary clinical features, two-tailed Fisher's exact tests (Fisher 1922) were used to estimate the P values using the 'fisher.test' function in R
For multiple hypothesis correction, Q value is the False Discovery Rate (FDR) analogue of the P value (Benjamini and Hochberg 1995), defined as the minimum FDR at which the test may be called significant. We used the 'Benjamini and Hochberg' method of 'p.adjust' function in R to convert P values into Q values.
In addition to the links below, the full results of the analysis summarized in this report can also be downloaded programmatically using firehose_get, or interactively from either the Broad GDAC website or TCGA Data Coordination Center Portal.