This report serves to describe the mutational landscape and properties of a given individual set, as well as rank genes and genesets according to mutational significance. MutSig v2.0 was used to generate the results found in this report.
-
Working with individual set: DLBC-TP
-
Number of patients in set: 48
The input for this pipeline is a set of individuals with the following files associated for each:
-
An annotated .maf file describing the mutations called for the respective individual, and their properties.
-
A .wig file that contains information about the coverage of the sample.
-
MAF used for this analysis:DLBC-TP.final_analysis_set.maf
-
Blacklist used for this analysis: pancan_mutation_blacklist.v14.hg19.txt
-
Significantly mutated genes (q ≤ 0.1): 55
-
Mutations seen in COSMIC: 60
-
Significantly mutated genes in COSMIC territory: 14
-
Significantly mutated genesets: 4
-
Significantly mutated genesets: (excluding sig. mutated genes):0
-
Read 48 MAFs of type "maf1"
-
Total number of mutations in input MAFs: 16918
-
After removing 60 mutations outside chr1-24: 16858
-
After removing 219 blacklisted mutations: 16639
-
After removing 416 noncoding mutations: 16223
-
After collapsing adjacent/redundant mutations: 16219
-
Number of mutations before filtering: 16219
-
After removing 950 mutations outside gene set: 15269
-
After removing 30 mutations outside category set: 15239
Table 1. Get Full Table Table representing breakdown of mutations by type.
| type | count |
|---|---|
| De_novo_Start_InFrame | 1 |
| De_novo_Start_OutOfFrame | 3 |
| Frame_Shift_Del | 175 |
| Frame_Shift_Ins | 78 |
| In_Frame_Del | 107 |
| In_Frame_Ins | 37 |
| Missense_Mutation | 8539 |
| Nonsense_Mutation | 309 |
| Nonstop_Mutation | 14 |
| Silent | 5559 |
| Splice_Site | 393 |
| Start_Codon_Del | 1 |
| Start_Codon_SNP | 17 |
| Stop_Codon_Del | 4 |
| Stop_Codon_Ins | 2 |
| Total | 15239 |
Table 2. Get Full Table A breakdown of mutation rates per category discovered for this individual set.
| category | n | N | rate | rate_per_mb | relative_rate | exp_ns_s_ratio |
|---|---|---|---|---|---|---|
| *CpG->T | 2279 | 89487814 | 0.000025 | 25 | 4.1 | 2.1 |
| *Cp(A/C/T)->T | 1913 | 705245959 | 2.7e-06 | 2.7 | 0.43 | 1.7 |
| A->G | 1465 | 750879567 | 2e-06 | 2 | 0.31 | 2.4 |
| transver | 2899 | 1545613340 | 1.9e-06 | 1.9 | 0.3 | 5 |
| indel+null | 1096 | 1545613340 | 7.1e-07 | 0.71 | 0.11 | NaN |
| double_null | 28 | 1545613340 | 1.8e-08 | 0.018 | 0.0029 | NaN |
| Total | 9680 | 1545613340 | 6.3e-06 | 6.3 | 1 | 3.5 |
The x axis represents the samples. The y axis represents the exons, one row per exon, and they are sorted by average coverage across samples. For exons with exactly the same average coverage, they are sorted next by the %GC of the exon. (The secondary sort is especially useful for the zero-coverage exons at the bottom). If the figure is unpopulated, then full coverage is assumed (e.g. MutSig CV doesn't use WIGs and assumes full coverage).
Figure 1.
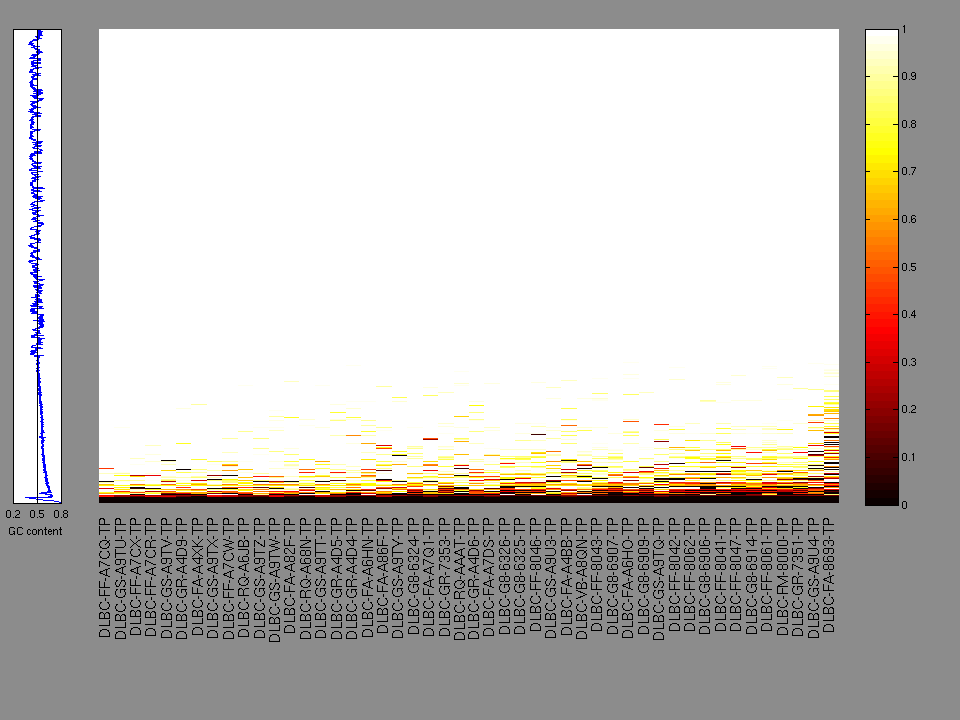
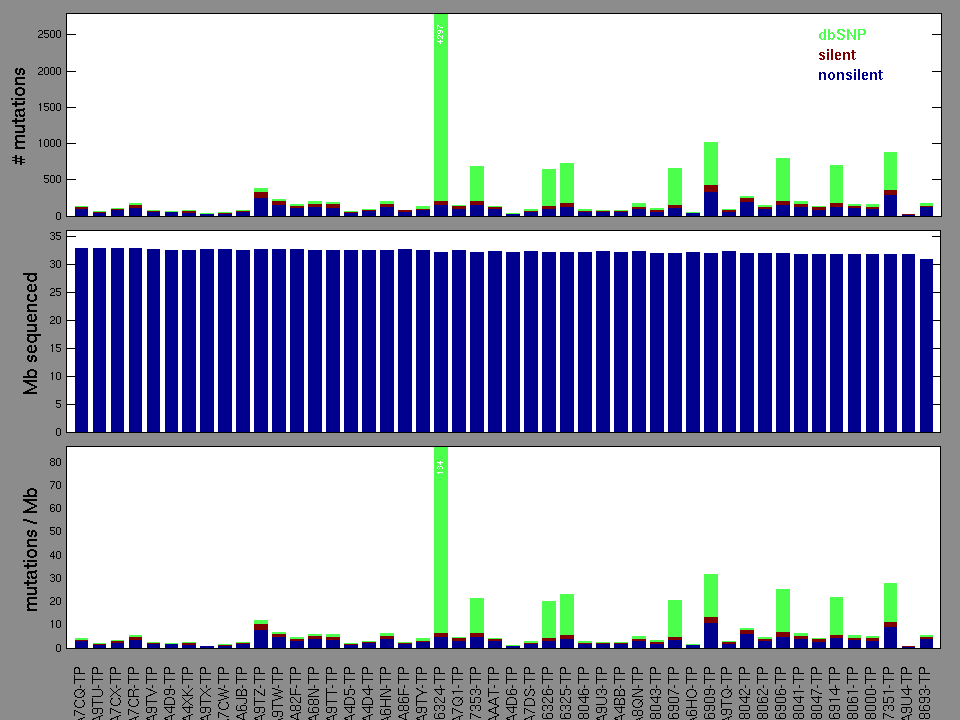
Figure 2. Patients counts and rates file used to generate this plot: DLBC-TP.patients.counts_and_rates.txt
The mutation spectrum is depicted in the lego plots below in which the 96 possible mutation types are subdivided into six large blocks, color-coded to reflect the base substitution type. Each large block is further subdivided into the 16 possible pairs of 5' and 3' neighbors, as listed in the 4x4 trinucleotide context legend. The height of each block corresponds to the mutation frequency for that kind of mutation (counts of mutations normalized by the base coverage in a given bin). The shape of the spectrum is a signature for dominant mutational mechanisms in different tumor types.
Figure 3. Get High-res Image SNV Mutation rate lego plot for entire set. Each bin is normalized by base coverage for that bin. Colors represent the six SNV types on the upper right. The three-base context for each mutation is labeled in the 4x4 legend on the lower right. The fractional breakdown of SNV counts is shown in the pie chart on the upper left. If this figure is blank, not enough information was provided in the MAF to generate it.
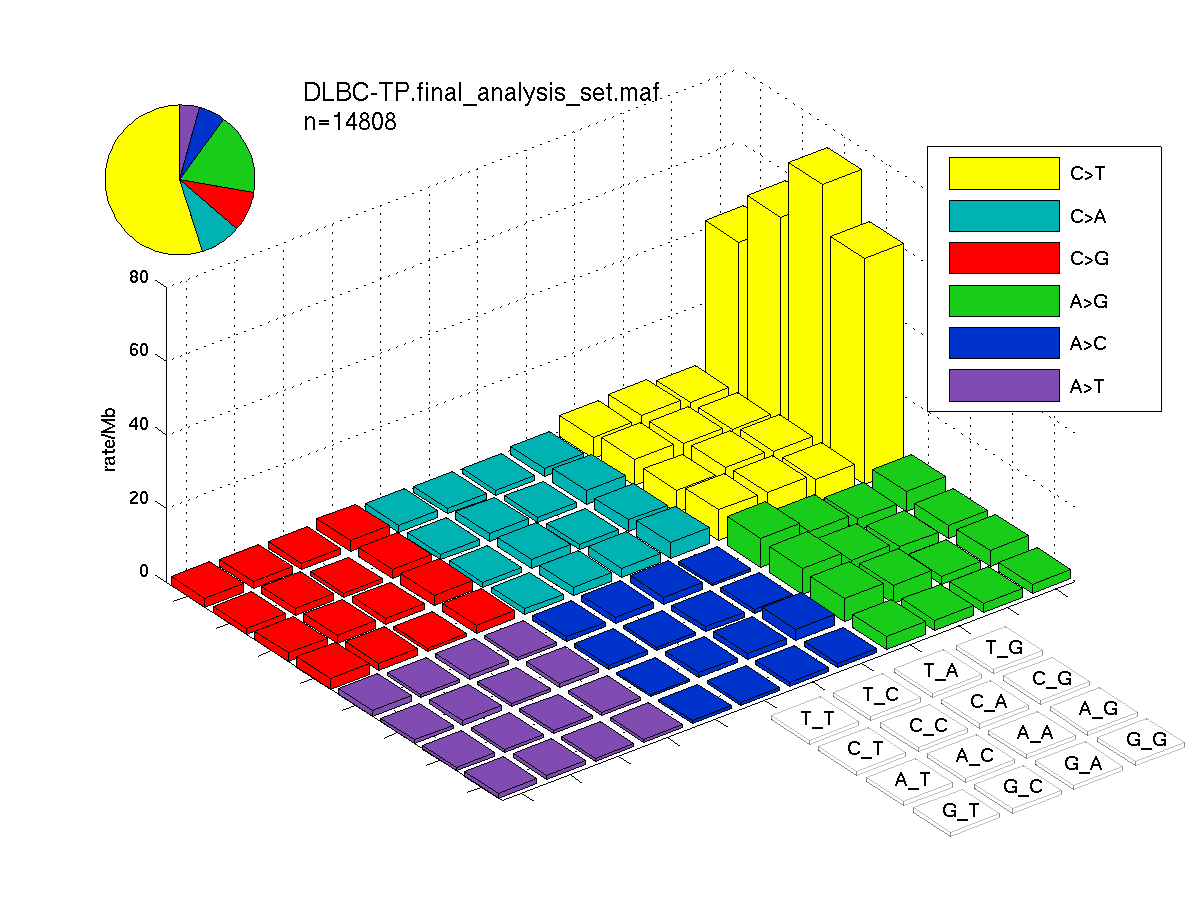
Figure 4. Get High-res Image SNV Mutation rate lego plots for 4 slices of mutation allele fraction (0<=AF<0.1, 0.1<=AF<0.25, 0.25<=AF<0.5, & 0.5<=AF) . The color code and three-base context legends are the same as the previous figure. If this figure is blank, not enough information was provided in the MAF to generate it.

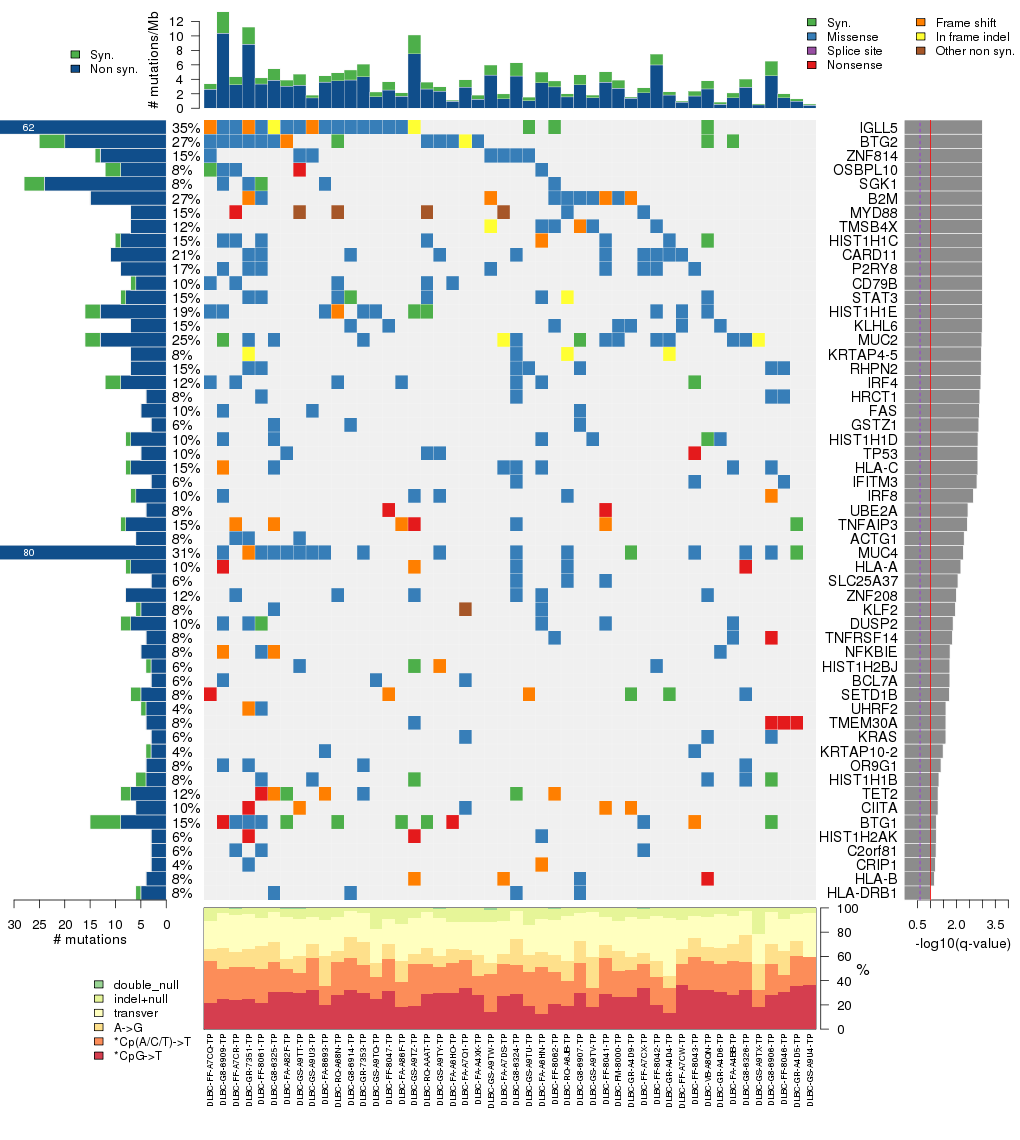
Figure 5. Get High-res Image The matrix in the center of the figure represents individual mutations in patient samples, color-coded by type of mutation, for the significantly mutated genes. The rate of synonymous and non-synonymous mutations is displayed at the top of the matrix. The barplot on the left of the matrix shows the number of mutations in each gene. The percentages represent the fraction of tumors with at least one mutation in the specified gene. The barplot to the right of the matrix displays the q-values for the most significantly mutated genes. The purple boxplots below the matrix (only displayed if required columns are present in the provided MAF) represent the distributions of allelic fractions observed in each sample. The plot at the bottom represents the base substitution distribution of individual samples, using the same categories that were used to calculate significance.
Column Descriptions:
-
N = number of sequenced bases in this gene across the individual set
-
n = number of (nonsilent) mutations in this gene across the individual set
-
npat = number of patients (individuals) with at least one nonsilent mutation
-
nsite = number of unique sites having a non-silent mutation
-
nsil = number of silent mutations in this gene across the individual set
-
n1 = number of nonsilent mutations of type: *CpG->T
-
n2 = number of nonsilent mutations of type: *Cp(A/C/T)->T
-
n3 = number of nonsilent mutations of type: A->G
-
n4 = number of nonsilent mutations of type: transver
-
n5 = number of nonsilent mutations of type: indel+null
-
n6 = number of nonsilent mutations of type: double_null
-
p_classic = p-value for the observed amount of nonsilent mutations being elevated in this gene
-
p_ns_s = p-value for the observed nonsilent/silent ratio being elevated in this gene
-
p_cons = p-value for enrichment of mutations at evolutionarily most-conserved sites in gene
-
p_joint = p-value for clustering + conservation
-
p = p-value (overall)
-
q = q-value, False Discovery Rate (Benjamini-Hochberg procedure)
Table 3. Get Full Table A Ranked List of Significantly Mutated Genes. Number of significant genes found: 55. Number of genes displayed: 35. Click on a gene name to display its stick figure depicting the distribution of mutations and mutation types across the chosen gene (this feature may not be available for all significant genes).
| rank | gene | description | N | n | npat | nsite | nsil | n1 | n2 | n3 | n4 | n5 | n6 | p_classic | p_ns_s | p_clust | p_cons | p_joint | p | q |
|---|---|---|---|---|---|---|---|---|---|---|---|---|---|---|---|---|---|---|---|---|
| 1 | IGLL5 | immunoglobulin lambda-like polypeptide 5 | 29626 | 37 | 17 | 31 | 25 | 0 | 13 | 2 | 13 | 8 | 1 | 1 | 0.98 | 0 | 0.96 | 0 | <1.00e-15 | <3.74e-12 |
| 2 | BTG2 | BTG family, member 2 | 23234 | 20 | 13 | 17 | 5 | 0 | 4 | 1 | 11 | 4 | 0 | 3.4e-12 | 0.34 | 0 | 0.98 | 0 | <1.00e-15 | <3.74e-12 |
| 3 | ZNF814 | zinc finger protein 814 | 123757 | 13 | 7 | 4 | 1 | 0 | 5 | 0 | 8 | 0 | 0 | 1.3e-07 | 0.2 | 0 | 0.66 | 0 | <1.00e-15 | <3.74e-12 |
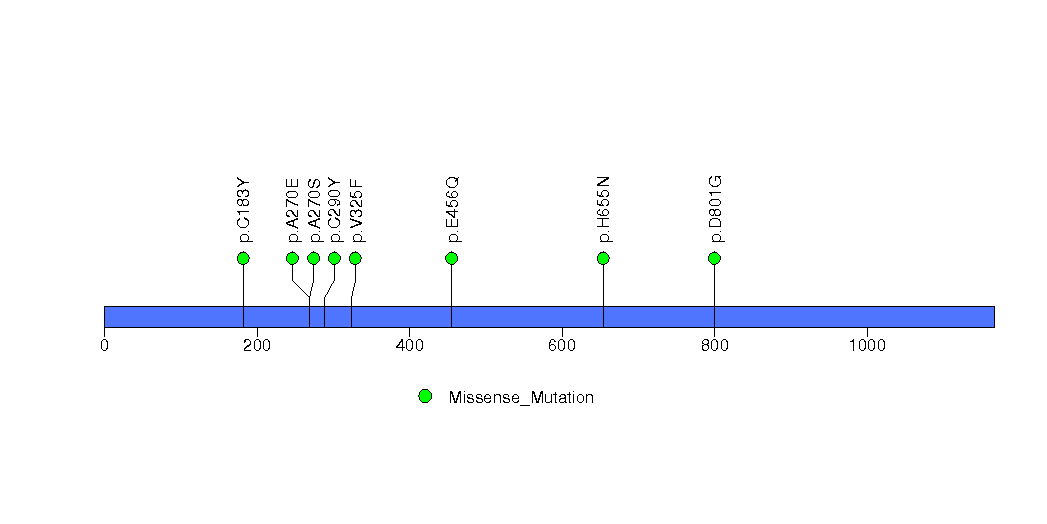
| 4 | OSBPL10 | oxysterol binding protein-like 10 | 106752 | 9 | 4 | 9 | 3 | 0 | 7 | 0 | 1 | 0 | 1 | 0.024 | 0.34 | 0 | 0.96 | 0 | <1.00e-15 | <3.74e-12 |
| 5 | SGK1 | serum/glucocorticoid regulated kinase 1 | 94332 | 24 | 4 | 19 | 4 | 0 | 9 | 0 | 12 | 1 | 2 | 0.000061 | 0.12 | 0 | 0.054 | 0 | <1.00e-15 | <3.74e-12 |
| 6 | B2M | beta-2-microglobulin | 17374 | 15 | 13 | 13 | 0 | 0 | 0 | 4 | 7 | 4 | 0 | 9.6e-15 | 0.065 | 0.037 | 0.074 | 0.03 | 1.07e-14 | 3.32e-11 |
| 7 | MYD88 | myeloid differentiation primary response gene (88) | 44453 | 7 | 7 | 4 | 0 | 0 | 1 | 1 | 0 | 5 | 0 | 2.2e-11 | 0.12 | 0.01 | 0.0053 | 0.0082 | 5.49e-12 | 1.47e-08 |
| 8 | TMSB4X | thymosin beta 4, X-linked | 6858 | 7 | 6 | 7 | 0 | 0 | 0 | 0 | 4 | 3 | 0 | 3.9e-13 | 0.4 | 0.81 | 0.43 | 0.9 | 1.05e-11 | 2.44e-08 |
| 9 | HIST1H1C | histone cluster 1, H1c | 31008 | 9 | 7 | 9 | 1 | 1 | 5 | 0 | 2 | 1 | 0 | 9.2e-11 | 0.16 | 0.019 | 0.43 | 0.047 | 1.18e-10 | 2.46e-07 |
| 10 | CARD11 | caspase recruitment domain family, member 11 | 168971 | 11 | 10 | 10 | 0 | 1 | 2 | 1 | 7 | 0 | 0 | 1.9e-08 | 0.041 | 0.00043 | 0.14 | 0.00041 | 2.04e-10 | 3.81e-07 |
| 11 | P2RY8 | purinergic receptor P2Y, G-protein coupled, 8 | 50186 | 9 | 8 | 9 | 0 | 1 | 2 | 2 | 4 | 0 | 0 | 2.8e-10 | 0.044 | 0.68 | 0.022 | 0.084 | 6.06e-10 | 1.03e-06 |
| 12 | CD79B | CD79b molecule, immunoglobulin-associated beta | 33304 | 6 | 5 | 3 | 1 | 0 | 0 | 2 | 3 | 1 | 0 | 3.1e-08 | 0.74 | 0.0018 | 0.047 | 0.002 | 1.54e-09 | 2.40e-06 |
| 13 | STAT3 | signal transducer and activator of transcription 3 (acute-phase response factor) | 115316 | 8 | 7 | 8 | 1 | 0 | 1 | 2 | 4 | 1 | 0 | 1.6e-07 | 0.43 | 0.0014 | 0.039 | 0.00088 | 3.25e-09 | 4.68e-06 |
| 14 | HIST1H1E | histone cluster 1, H1e | 31582 | 13 | 9 | 11 | 3 | 0 | 7 | 0 | 5 | 1 | 0 | 2.7e-09 | 0.23 | 0.028 | 0.76 | 0.072 | 4.57e-09 | 6.11e-06 |
| 15 | KLHL6 | kelch-like 6 (Drosophila) | 90912 | 7 | 7 | 6 | 0 | 1 | 2 | 3 | 1 | 0 | 0 | 5.1e-09 | 0.074 | 0.13 | 0.13 | 0.11 | 1.24e-08 | 1.55e-05 |
| 16 | MUC2 | mucin 2, oligomeric mucus/gel-forming | 385696 | 13 | 12 | 12 | 3 | 2 | 3 | 1 | 5 | 2 | 0 | 0.00019 | 0.38 | 2e-07 | 1 | 0.000014 | 5.59e-08 | 6.53e-05 |
| 17 | KRTAP4-5 | keratin associated protein 4-5 | 26164 | 7 | 4 | 5 | 0 | 0 | 1 | 2 | 1 | 3 | 0 | 2e-06 | 0.33 | 0.00058 | 0.95 | 0.002 | 8.08e-08 | 8.89e-05 |
| 18 | RHPN2 | rhophilin, Rho GTPase binding protein 2 | 95835 | 7 | 7 | 3 | 0 | 1 | 5 | 0 | 1 | 0 | 0 | 7.4e-07 | 0.029 | 0.011 | 0.048 | 0.0073 | 1.08e-07 | 0.000112 |
| 19 | IRF4 | interferon regulatory factor 4 | 65761 | 9 | 6 | 9 | 3 | 0 | 2 | 2 | 5 | 0 | 0 | 0.00023 | 0.57 | 0.000026 | 0.25 | 0.000036 | 1.58e-07 | 0.000156 |
| 20 | HRCT1 | histidine rich carboxyl terminus 1 | 13776 | 4 | 4 | 3 | 0 | 0 | 0 | 0 | 4 | 0 | 0 | 2.1e-06 | 0.35 | 0.0018 | 0.96 | 0.0075 | 3.02e-07 | 0.000282 |
| 21 | FAS | Fas (TNF receptor superfamily, member 6) | 49044 | 5 | 5 | 5 | 0 | 1 | 1 | 1 | 0 | 2 | 0 | 2.9e-07 | 0.24 | 0.081 | 0.11 | 0.061 | 3.30e-07 | 0.000294 |
| 22 | GSTZ1 | glutathione transferase zeta 1 (maleylacetoacetate isomerase) | 32957 | 3 | 3 | 1 | 0 | 0 | 3 | 0 | 0 | 0 | 0 | 0.00067 | 0.18 | 0.00024 | 0.00092 | 0.000039 | 4.76e-07 | 0.000404 |
| 23 | HIST1H1D | histone cluster 1, H1d | 32160 | 7 | 5 | 7 | 1 | 0 | 4 | 0 | 3 | 0 | 0 | 1.6e-07 | 0.26 | 0.11 | 0.57 | 0.2 | 5.90e-07 | 0.000480 |
| 24 | TP53 | tumor protein p53 | 62884 | 5 | 5 | 5 | 0 | 2 | 0 | 1 | 0 | 2 | 0 | 9.6e-07 | 0.22 | 0.11 | 0.033 | 0.04 | 6.97e-07 | 0.000523 |
| 25 | HLA-C | major histocompatibility complex, class I, C | 53860 | 7 | 7 | 5 | 1 | 0 | 4 | 0 | 2 | 1 | 0 | 3.9e-08 | 0.22 | 0.56 | 0.99 | 1 | 7.00e-07 | 0.000523 |
| 26 | IFITM3 | interferon induced transmembrane protein 3 (1-8U) | 18937 | 3 | 3 | 1 | 0 | 0 | 3 | 0 | 0 | 0 | 0 | 4e-05 | 0.14 | 0.00037 | 0.94 | 0.0012 | 8.65e-07 | 0.000622 |
| 27 | IRF8 | interferon regulatory factor 8 | 57788 | 6 | 5 | 5 | 1 | 0 | 1 | 2 | 1 | 2 | 0 | 4.1e-06 | 0.61 | 0.098 | 0.018 | 0.024 | 1.74e-06 | 0.00120 |
| 28 | UBE2A | ubiquitin-conjugating enzyme E2A (RAD6 homolog) | 22951 | 4 | 4 | 4 | 0 | 0 | 0 | 0 | 0 | 4 | 0 | 2.4e-07 | 0.41 | 0.72 | 0.39 | 1 | 3.91e-06 | 0.00261 |
| 29 | TNFAIP3 | tumor necrosis factor, alpha-induced protein 3 | 111927 | 8 | 7 | 8 | 1 | 0 | 1 | 0 | 1 | 6 | 0 | 2.7e-07 | 0.75 | 0.96 | 0.57 | 1 | 4.31e-06 | 0.00278 |
| 30 | ACTG1 | actin, gamma 1 | 55101 | 6 | 4 | 6 | 0 | 1 | 0 | 0 | 4 | 1 | 0 | 0.00019 | 0.14 | 0.001 | 0.98 | 0.0021 | 6.42e-06 | 0.00400 |
| 31 | MUC4 | mucin 4, cell surface associated | 171524 | 60 | 15 | 55 | 20 | 10 | 12 | 8 | 29 | 0 | 1 | 7.3e-06 | 0.34 | NaN | NaN | NaN | 7.27e-06 | 0.00439 |
| 32 | HLA-A | major histocompatibility complex, class I, A | 53868 | 7 | 5 | 7 | 1 | 0 | 0 | 1 | 2 | 4 | 0 | 9.4e-06 | 0.5 | 0.032 | 0.97 | 0.07 | 1.00e-05 | 0.00584 |
| 33 | SLC25A37 | solute carrier family 25, member 37 | 48205 | 3 | 3 | 3 | 0 | 1 | 0 | 0 | 2 | 0 | 0 | 0.0022 | 0.42 | 0.00056 | 0.18 | 0.00042 | 1.37e-05 | 0.00775 |
| 34 | ZNF208 | zinc finger protein 208 | 130747 | 8 | 6 | 8 | 0 | 0 | 2 | 1 | 5 | 0 | 0 | 0.000017 | 0.17 | 0.042 | 0.42 | 0.066 | 1.62e-05 | 0.00894 |
| 35 | KLF2 | Kruppel-like factor 2 (lung) | 21693 | 5 | 4 | 5 | 1 | 0 | 1 | 0 | 1 | 3 | 0 | 1.3e-06 | 0.39 | 0.79 | 1 | 1 | 1.85e-05 | 0.00991 |
Figure S1. This figure depicts the distribution of mutations and mutation types across the BTG2 significant gene.
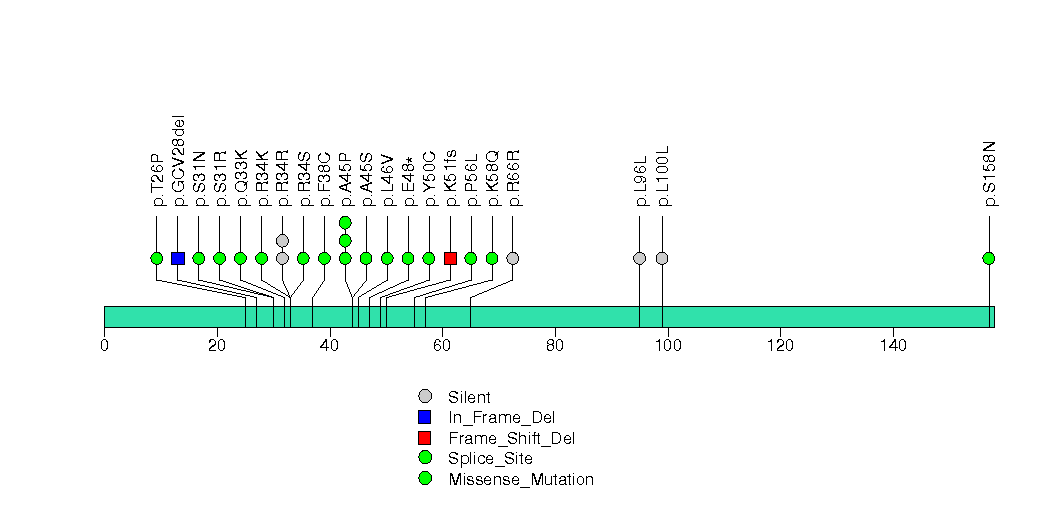
Figure S2. This figure depicts the distribution of mutations and mutation types across the ZNF814 significant gene.
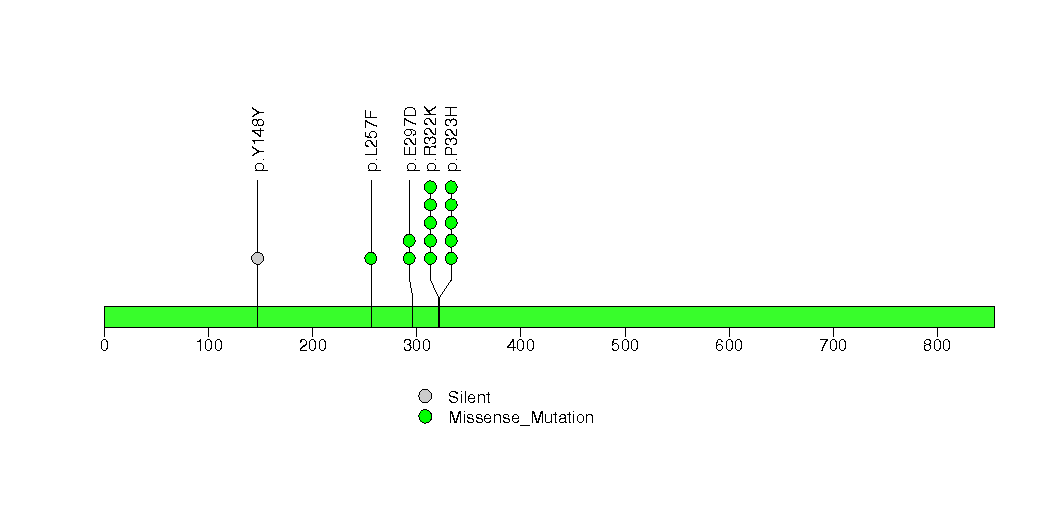
Figure S3. This figure depicts the distribution of mutations and mutation types across the OSBPL10 significant gene.
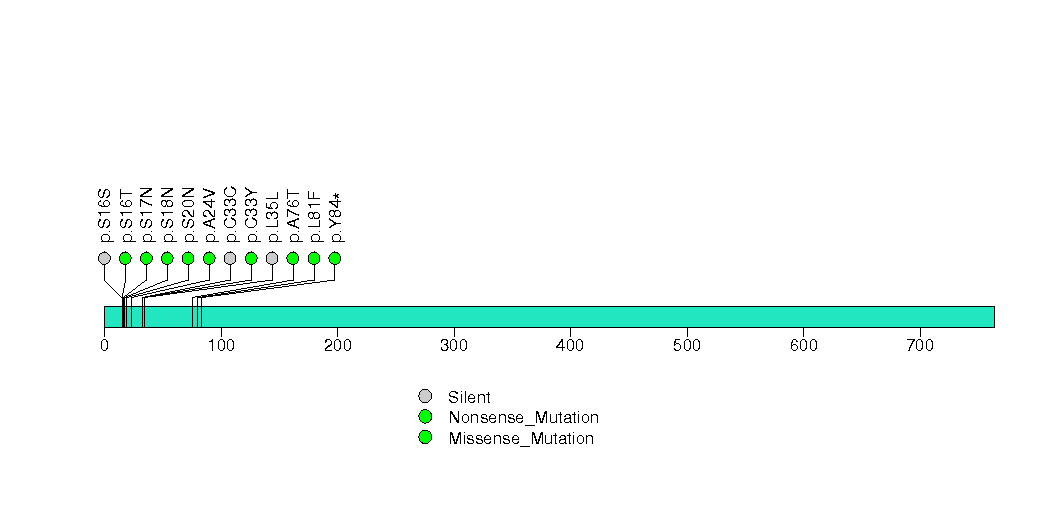
Figure S4. This figure depicts the distribution of mutations and mutation types across the SGK1 significant gene.
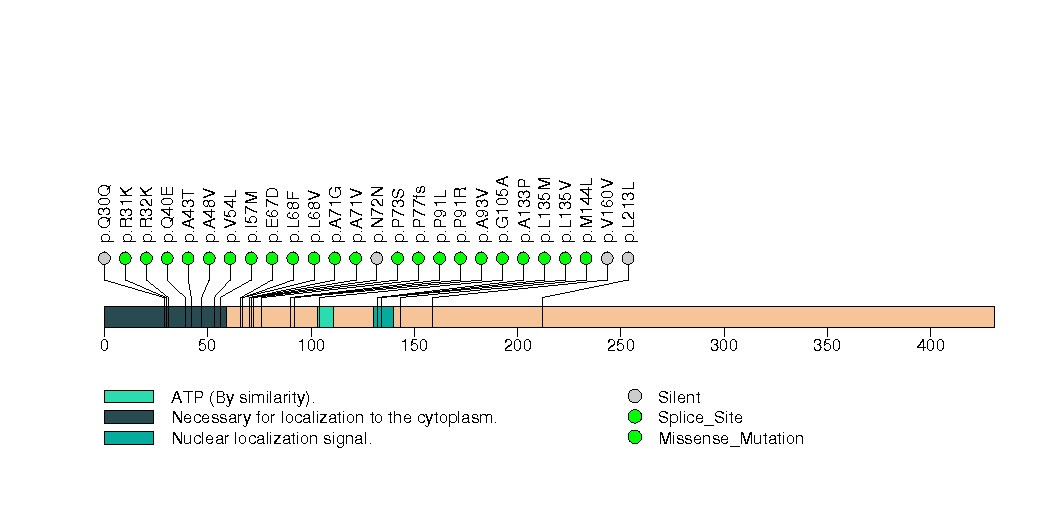
Figure S5. This figure depicts the distribution of mutations and mutation types across the B2M significant gene.
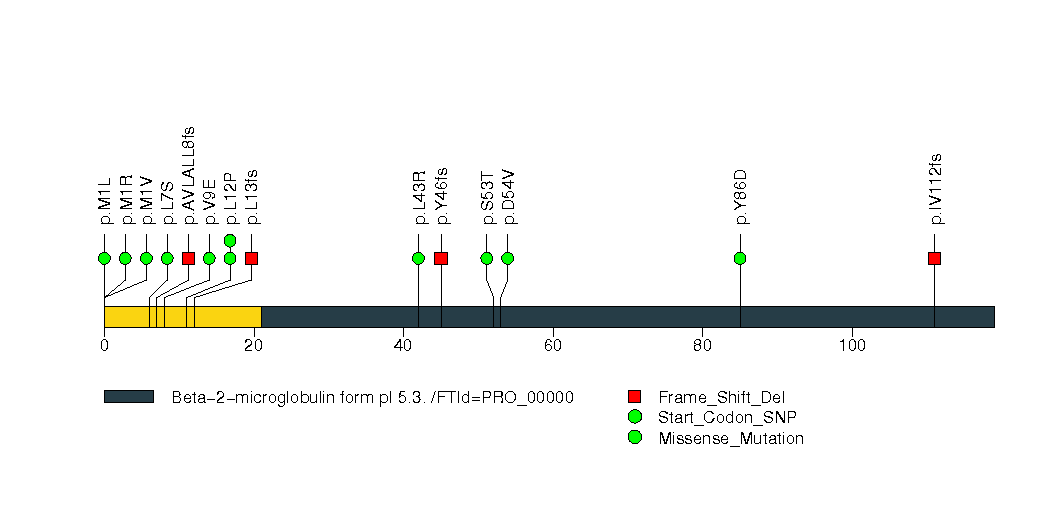
Figure S6. This figure depicts the distribution of mutations and mutation types across the MYD88 significant gene.
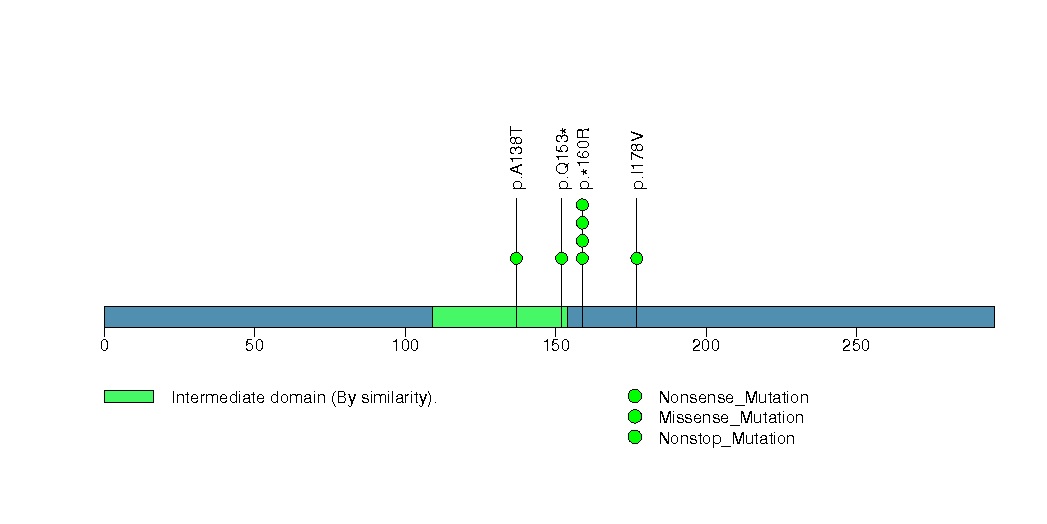
Figure S7. This figure depicts the distribution of mutations and mutation types across the HIST1H1C significant gene.
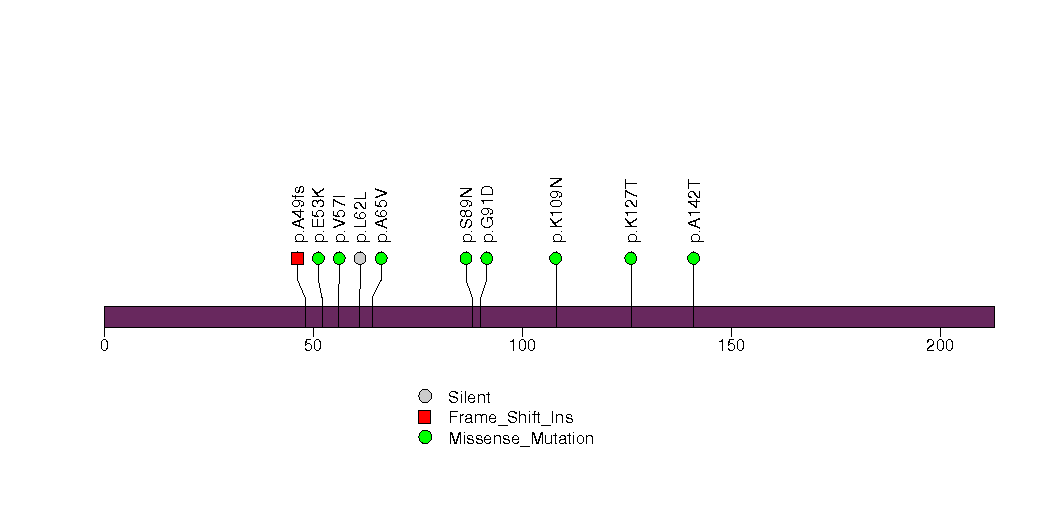
Figure S8. This figure depicts the distribution of mutations and mutation types across the CARD11 significant gene.
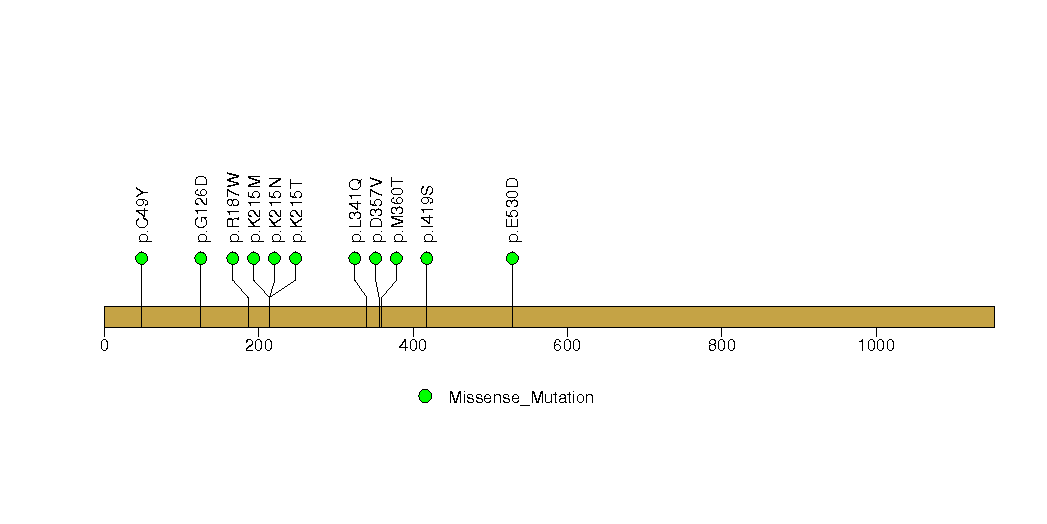
Figure S9. This figure depicts the distribution of mutations and mutation types across the P2RY8 significant gene.
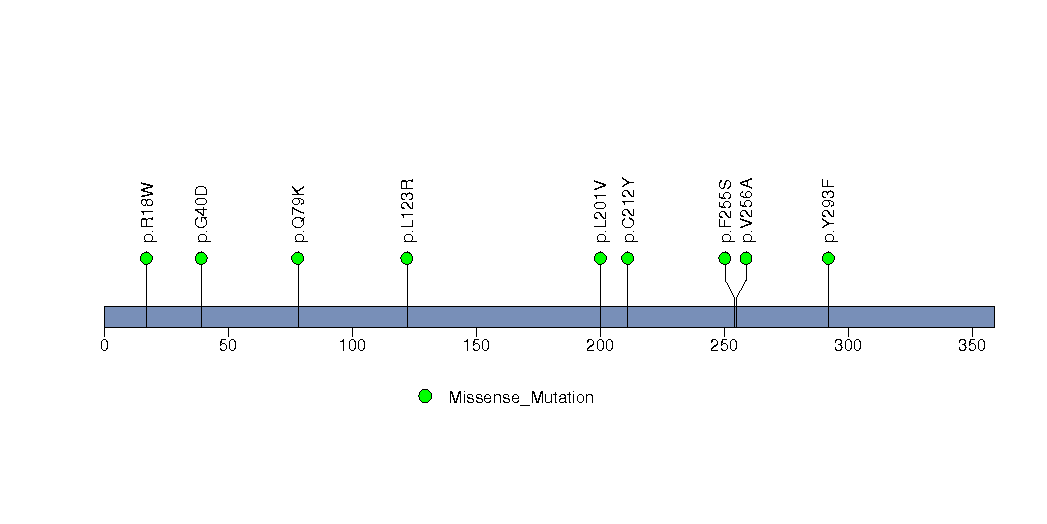
Figure S10. This figure depicts the distribution of mutations and mutation types across the CD79B significant gene.
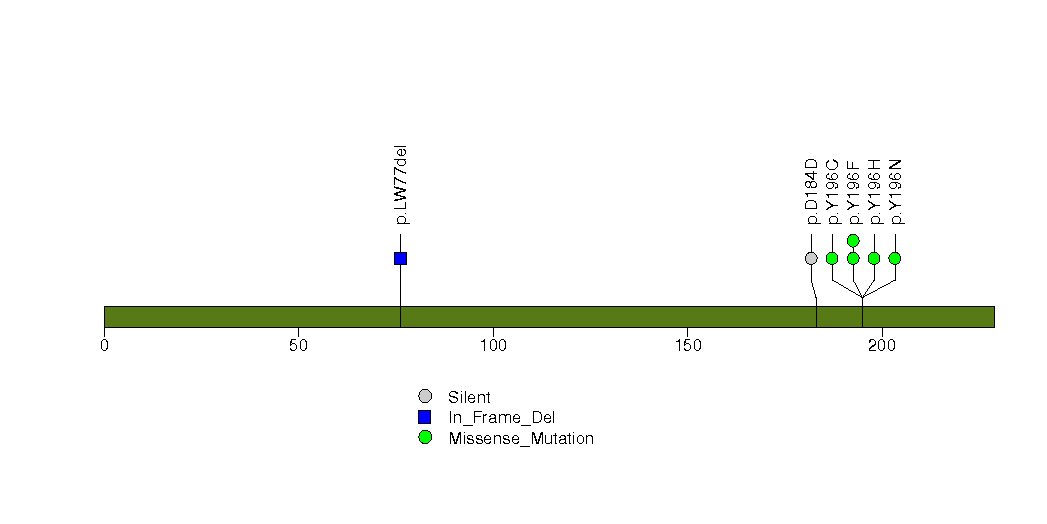
Figure S11. This figure depicts the distribution of mutations and mutation types across the STAT3 significant gene.
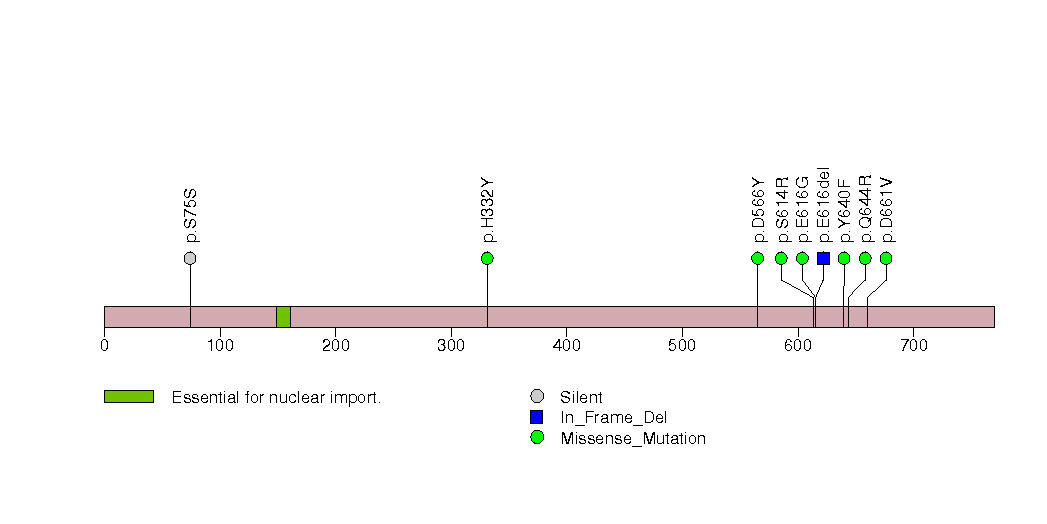
Figure S12. This figure depicts the distribution of mutations and mutation types across the HIST1H1E significant gene.
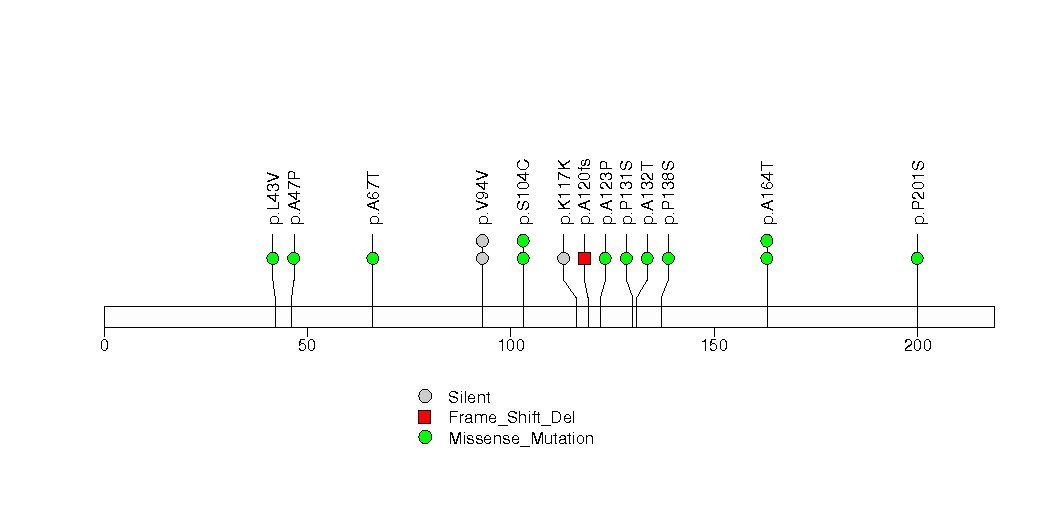
Figure S13. This figure depicts the distribution of mutations and mutation types across the KLHL6 significant gene.
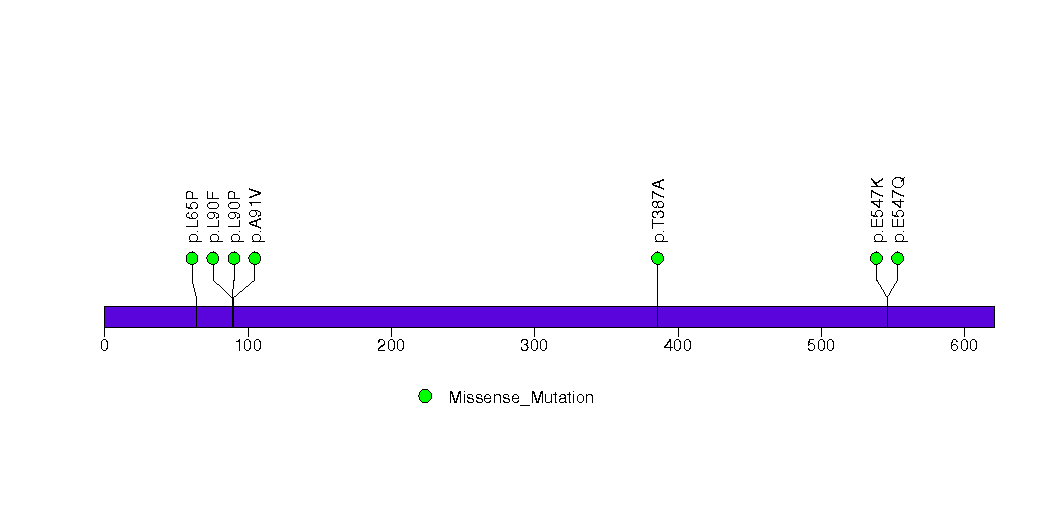
Figure S14. This figure depicts the distribution of mutations and mutation types across the MUC2 significant gene.
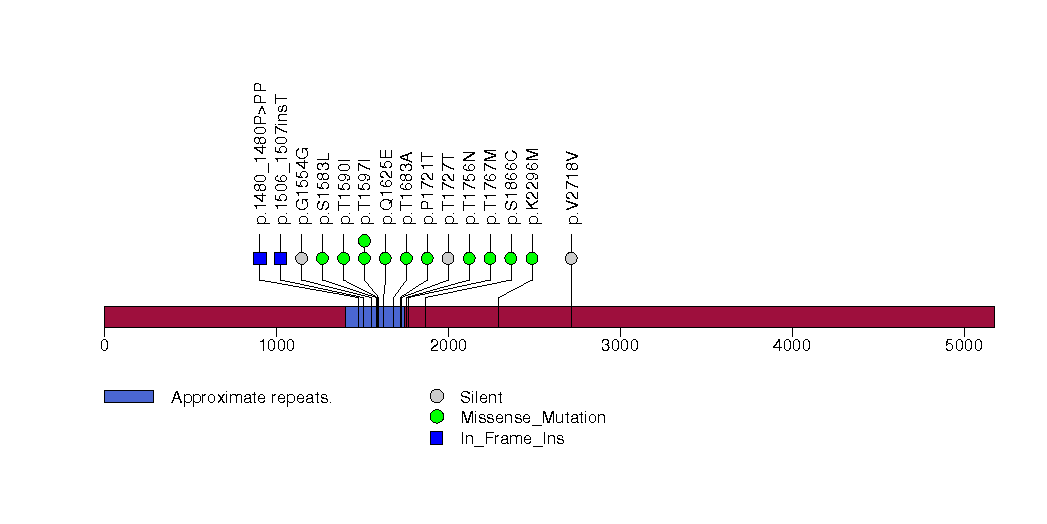
Figure S15. This figure depicts the distribution of mutations and mutation types across the KRTAP4-5 significant gene.
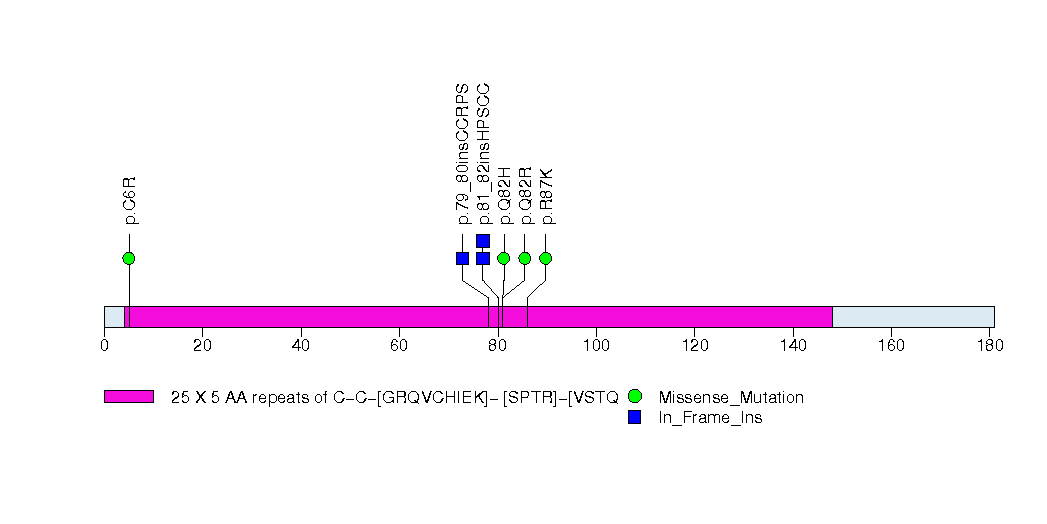
Figure S16. This figure depicts the distribution of mutations and mutation types across the RHPN2 significant gene.
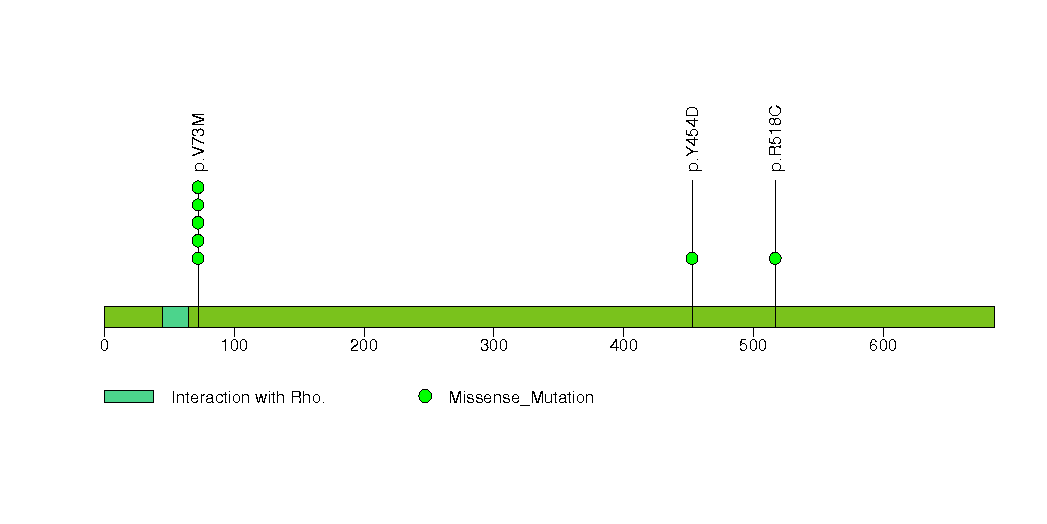
Figure S17. This figure depicts the distribution of mutations and mutation types across the IRF4 significant gene.
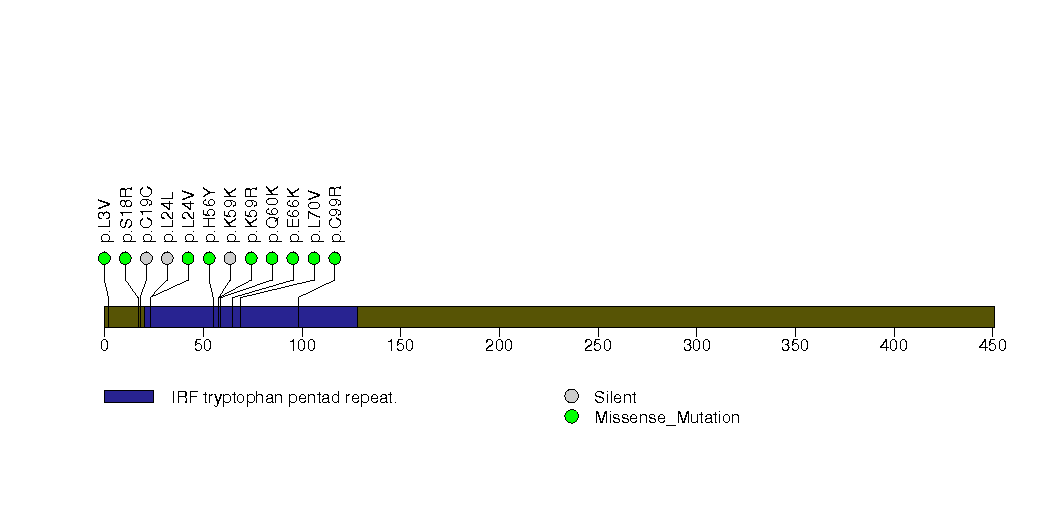
Figure S18. This figure depicts the distribution of mutations and mutation types across the HRCT1 significant gene.
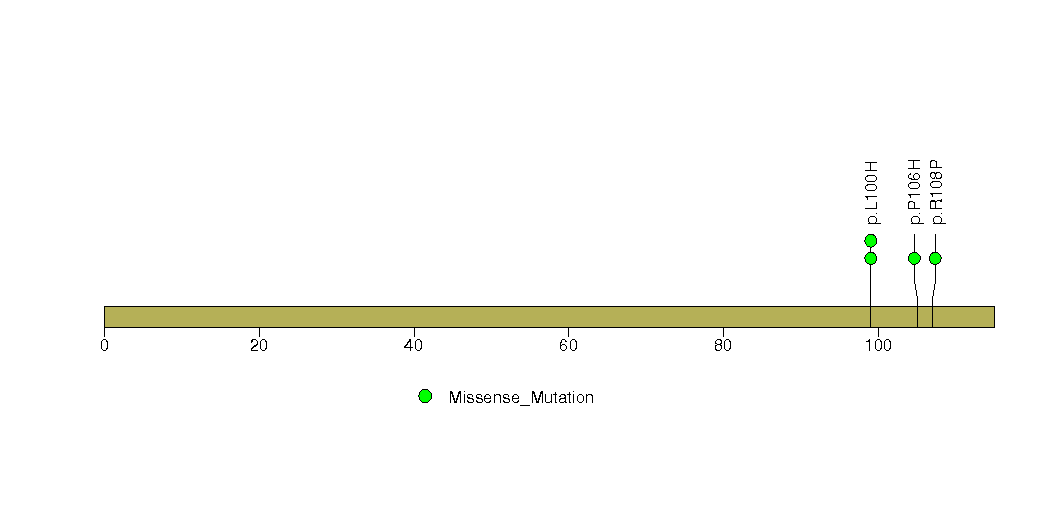
Figure S19. This figure depicts the distribution of mutations and mutation types across the FAS significant gene.
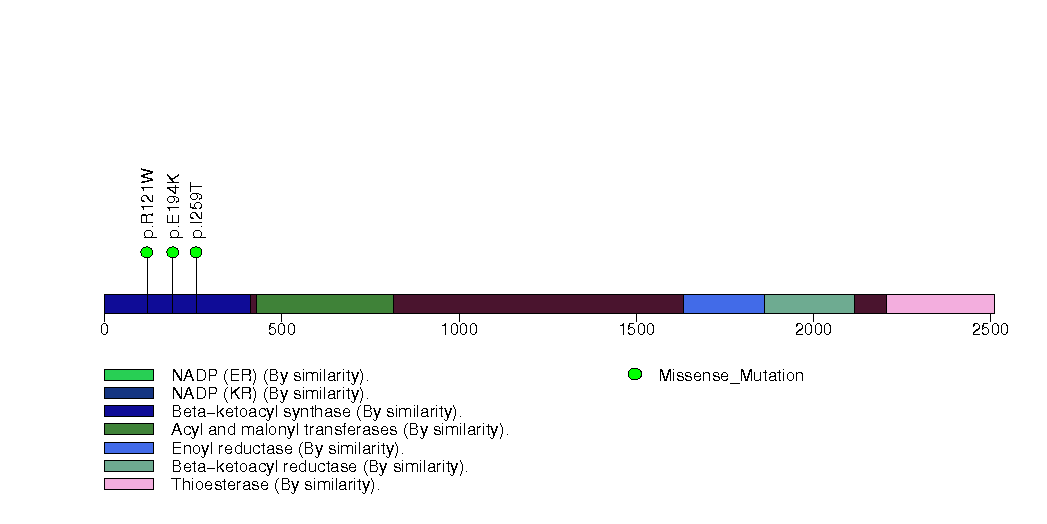
Figure S20. This figure depicts the distribution of mutations and mutation types across the GSTZ1 significant gene.
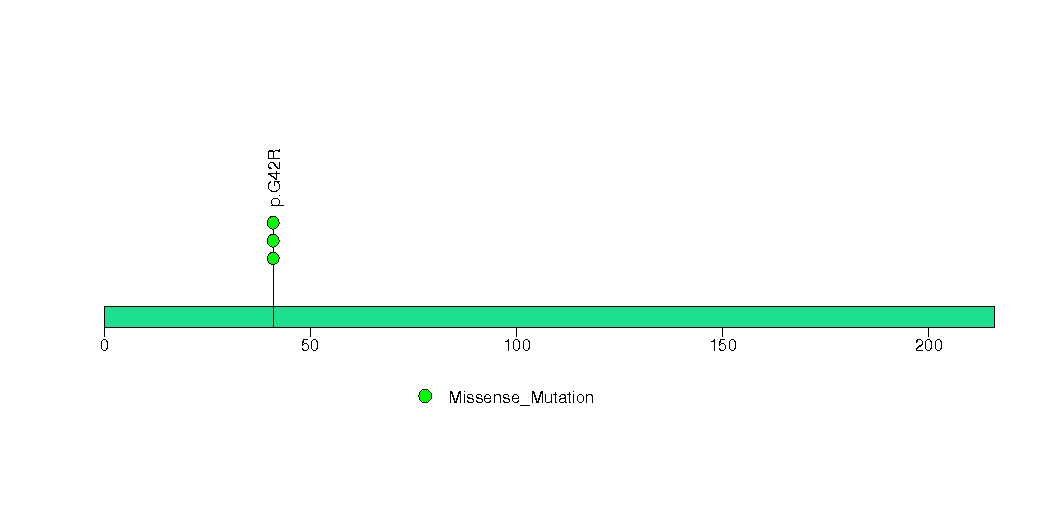
Figure S21. This figure depicts the distribution of mutations and mutation types across the HIST1H1D significant gene.
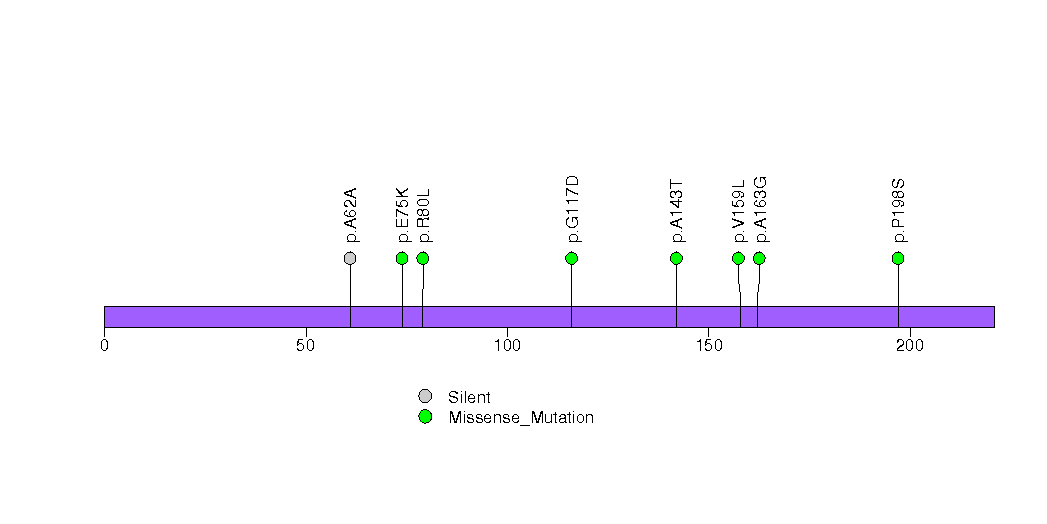
Figure S22. This figure depicts the distribution of mutations and mutation types across the TP53 significant gene.
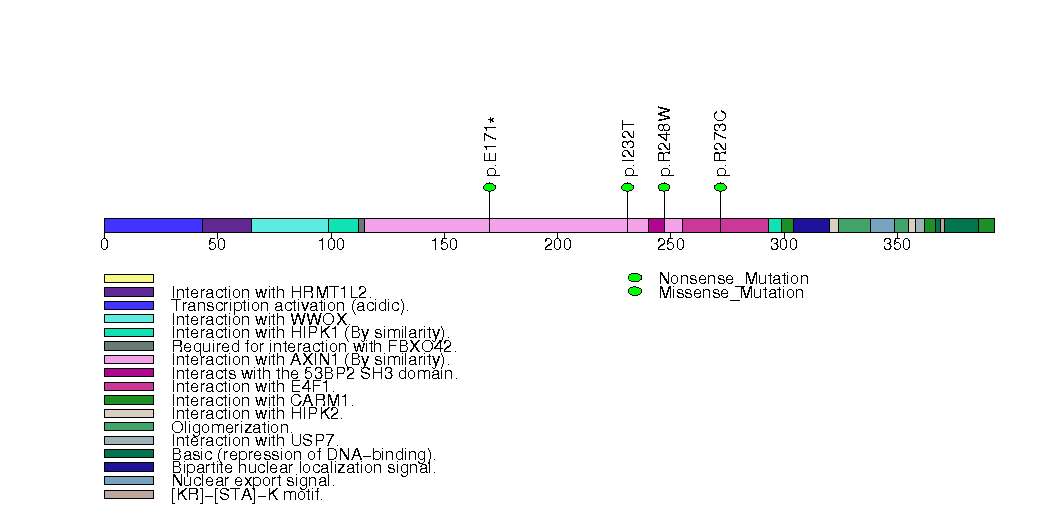
Figure S23. This figure depicts the distribution of mutations and mutation types across the HLA-C significant gene.
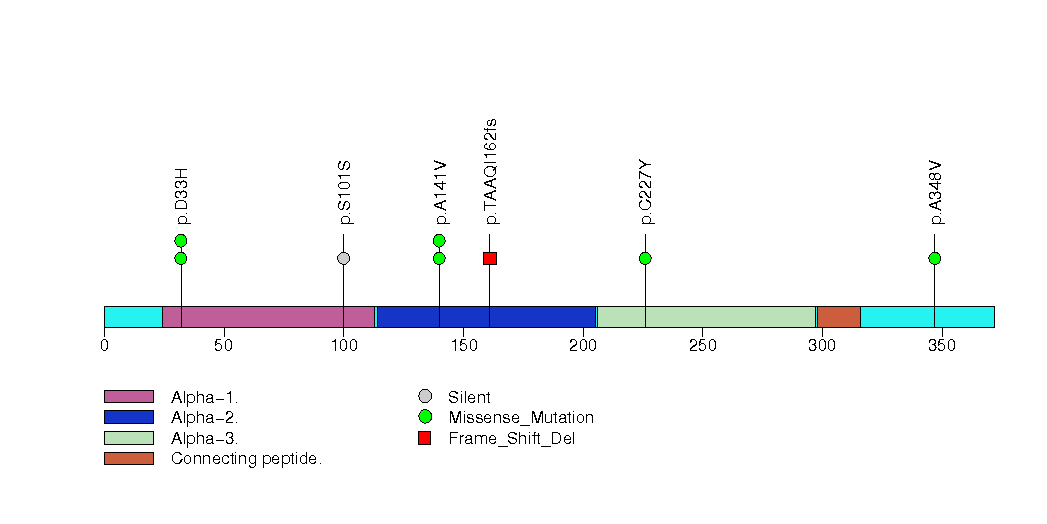
Figure S24. This figure depicts the distribution of mutations and mutation types across the IFITM3 significant gene.
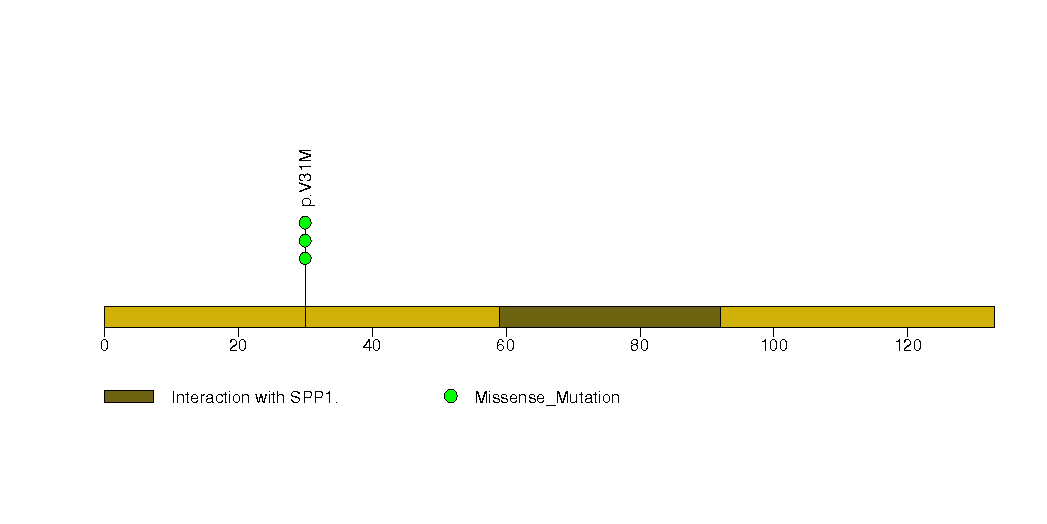
Figure S25. This figure depicts the distribution of mutations and mutation types across the IRF8 significant gene.
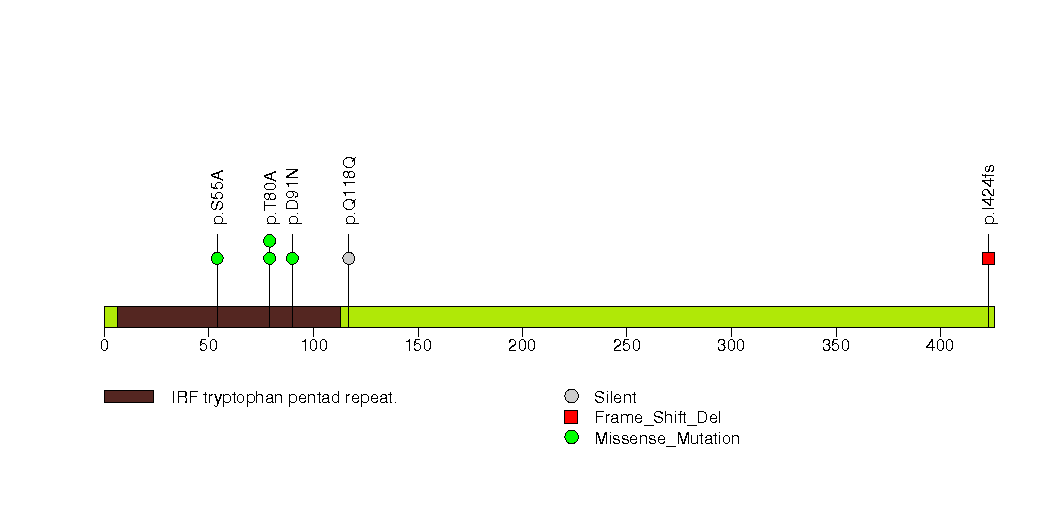
Figure S26. This figure depicts the distribution of mutations and mutation types across the UBE2A significant gene.
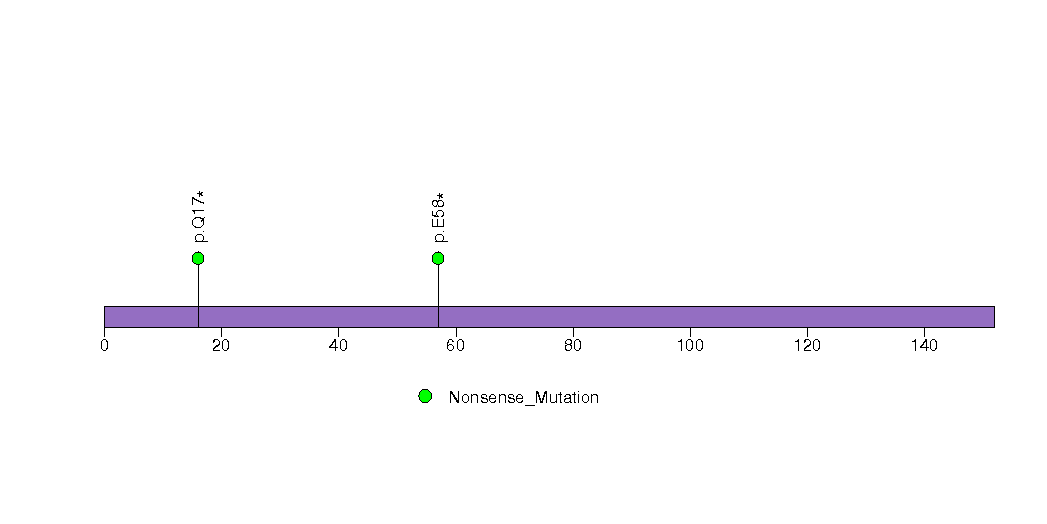
Figure S27. This figure depicts the distribution of mutations and mutation types across the TNFAIP3 significant gene.
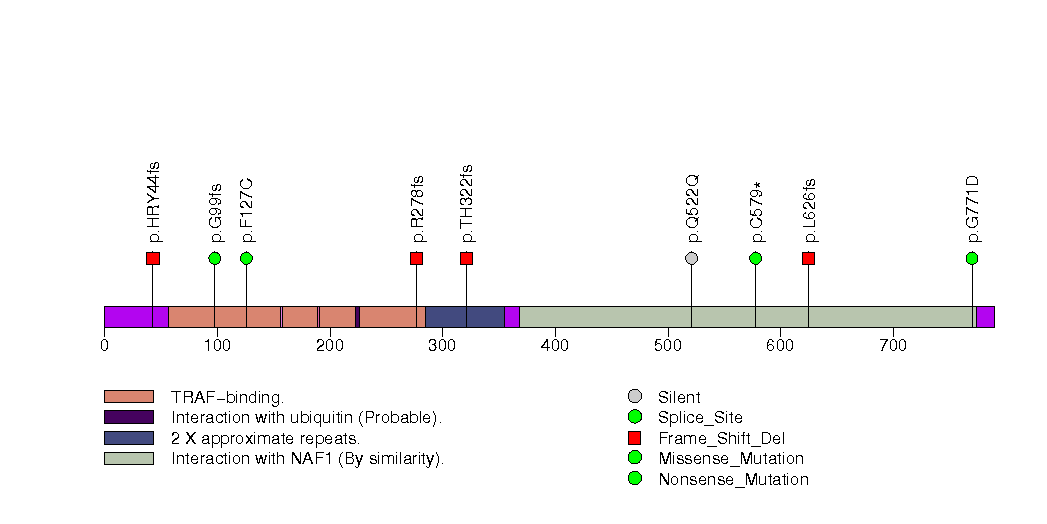
Figure S28. This figure depicts the distribution of mutations and mutation types across the ACTG1 significant gene.
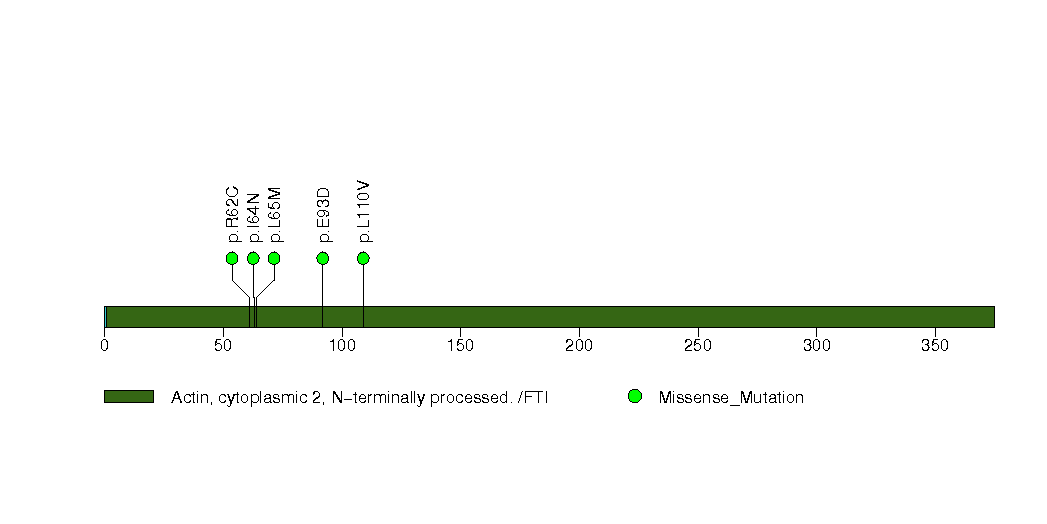
Figure S29. This figure depicts the distribution of mutations and mutation types across the MUC4 significant gene.
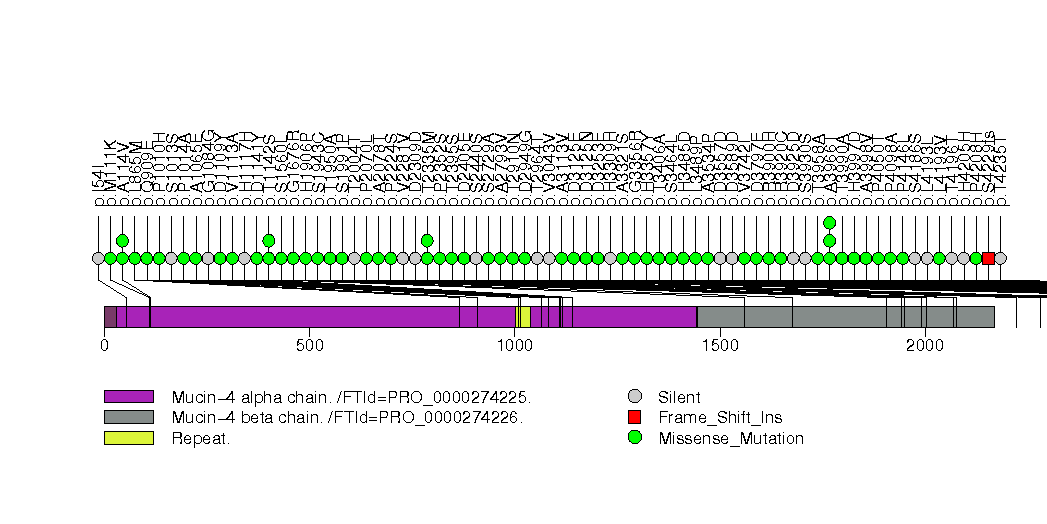
Figure S30. This figure depicts the distribution of mutations and mutation types across the HLA-A significant gene.
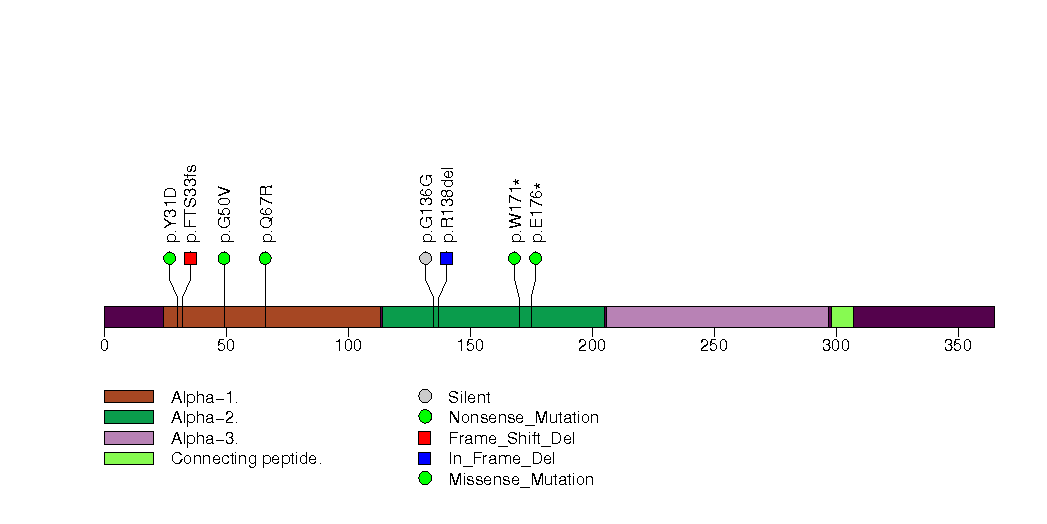
Figure S31. This figure depicts the distribution of mutations and mutation types across the SLC25A37 significant gene.
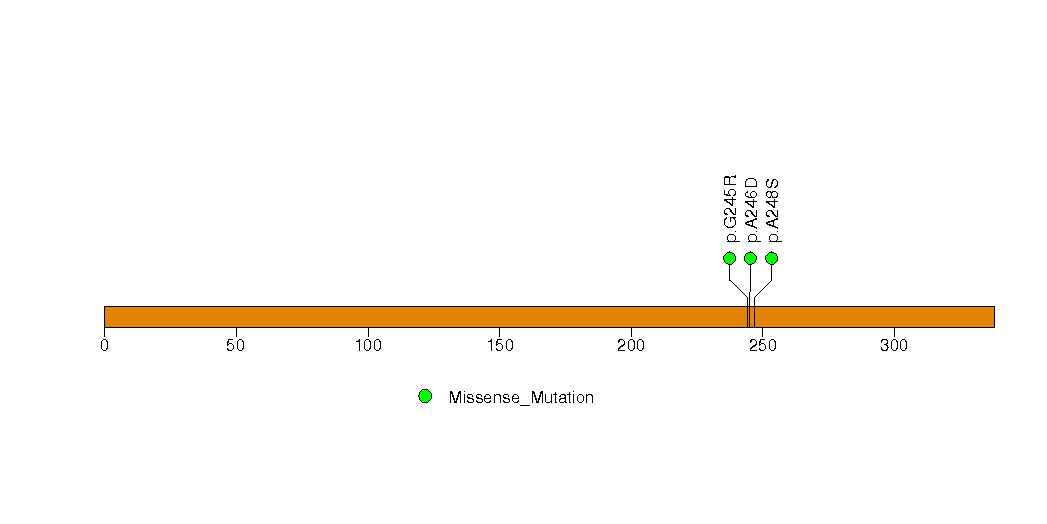
Figure S32. This figure depicts the distribution of mutations and mutation types across the ZNF208 significant gene.
In this analysis, COSMIC is used as a filter to increase power by restricting the territory of each gene. Cosmic version: v48.
Table 4. Get Full Table Significantly mutated genes (COSMIC territory only). To access the database please go to: COSMIC. Number of significant genes found: 14. Number of genes displayed: 10
| rank | gene | description | n | cos | n_cos | N_cos | cos_ev | p | q |
|---|---|---|---|---|---|---|---|---|---|
| 1 | ATM | ataxia telangiectasia mutated | 8 | 245 | 6 | 11760 | 32 | 2.1e-10 | 9.4e-07 |
| 2 | TNFAIP3 | tumor necrosis factor, alpha-induced protein 3 | 8 | 138 | 5 | 6624 | 9 | 9.9e-10 | 2.2e-06 |
| 3 | SOCS1 | suppressor of cytokine signaling 1 | 9 | 67 | 4 | 3216 | 14 | 6.7e-09 | 1e-05 |
| 4 | TP53 | tumor protein p53 | 5 | 356 | 5 | 17088 | 1887 | 1.1e-07 | 0.00012 |
| 5 | RADIL | Ras association and DIL domains | 6 | 2 | 2 | 96 | 2 | 1.8e-07 | 0.00016 |
| 6 | KRAS | v-Ki-ras2 Kirsten rat sarcoma viral oncogene homolog | 3 | 52 | 3 | 2496 | 14621 | 6.3e-07 | 0.00048 |
| 7 | EZH2 | enhancer of zeste homolog 2 (Drosophila) | 6 | 6 | 2 | 288 | 116 | 1.6e-06 | 0.0011 |
| 8 | JAK3 | Janus kinase 3 (a protein tyrosine kinase, leukocyte) | 2 | 18 | 2 | 864 | 5 | 0.000015 | 0.0083 |
| 9 | MLH1 | mutL homolog 1, colon cancer, nonpolyposis type 2 (E. coli) | 5 | 49 | 2 | 2352 | 8 | 0.00011 | 0.054 |
| 10 | ATP2A3 | ATPase, Ca++ transporting, ubiquitous | 2 | 1 | 1 | 48 | 1 | 0.0003 | 0.098 |
Note:
n - number of (nonsilent) mutations in this gene across the individual set.
cos = number of unique mutated sites in this gene in COSMIC
n_cos = overlap between n and cos.
N_cos = number of individuals times cos.
cos_ev = total evidence: number of reports in COSMIC for mutations seen in this gene.
p = p-value for seeing the observed amount of overlap in this gene)
q = q-value, False Discovery Rate (Benjamini-Hochberg procedure)
Table 5. Get Full Table A Ranked List of Significantly Mutated Genesets. (Source: MSigDB GSEA Cannonical Pathway Set).Number of significant genesets found: 4. Number of genesets displayed: 10
| rank | geneset | description | genes | N_genes | mut_tally | N | n | npat | nsite | nsil | n1 | n2 | n3 | n4 | n5 | n6 | p_ns_s | p | q |
|---|---|---|---|---|---|---|---|---|---|---|---|---|---|---|---|---|---|---|---|
| 1 | NKCELLSPATHWAY | Natural killer (NK) lymphocytes are inhibited by MHC and activated by surface glycoproteins on tumor or virus-infected cells, which undergo perforin-mediated lysis. | B2M, HLA-A, IL18, ITGB1, KLRC1, KLRC2, KLRC3, KLRC4, KLRD1, LAT, MAP2K1, MAPK3, PAK1, PIK3CA, PIK3R1, PTK2B, PTPN6, RAC1, SYK, VAV1 | 20 | B2M(15), HLA-A(7), KLRC4(1), MAP2K1(2), PIK3CA(2), PTPN6(4) | 1386527 | 31 | 21 | 29 | 2 | 2 | 1 | 7 | 11 | 10 | 0 | 0.03 | 5.9e-07 | 0.00036 |
| 2 | CTLPATHWAY | Cytotoxic T lymphocytes induce apoptosis in infected cells presenting antigen-MHC-I complexes via the perforin and Fas/Fas ligand pathways. | B2M, CD3D, CD3E, CD3G, CD3Z, GZMB, HLA-A, ICAM1, ITGAL, ITGB2, PRF1, TNFRSF6, TNFSF6, TRA@, TRB@ | 10 | B2M(15), CD3D(1), CD3G(1), HLA-A(7), PRF1(2) | 627337 | 26 | 17 | 24 | 5 | 2 | 1 | 5 | 9 | 9 | 0 | 0.29 | 0.000026 | 0.0079 |
| 3 | SA_G1_AND_S_PHASES | Cdk2, 4, and 6 bind cyclin D in G1, while cdk2/cyclin E promotes the G1/S transition. | ARF1, ARF3, CCND1, CDK2, CDK4, CDKN1A, CDKN1B, CDKN2A, CFL1, E2F1, E2F2, MDM2, NXT1, PRB1, TP53 | 15 | CDKN1A(2), CDKN2A(1), E2F1(2), E2F2(1), PRB1(1), TP53(5) | 608381 | 12 | 11 | 12 | 2 | 4 | 2 | 2 | 0 | 4 | 0 | 0.2 | 0.00031 | 0.063 |
| 4 | NTHIPATHWAY | Hemophilus influenzae infections activate NF-kB via several pathways, inducing the inflammatory response. | CHUK, CREBBP, DUSP1, EP300, IKBKB, IL1B, IL8, MADH3, MADH4, MAP2K3, MAP2K6, MAP3K14, MAP3K7, MAPK11, MAPK14, MYD88, NFKB1, NFKBIA, NR3C1, RELA, TGFBR1, TGFBR2, TLR2, TNF | 22 | CREBBP(6), EP300(3), IKBKB(2), MAP2K3(2), MAPK11(1), MYD88(7), NFKB1(1), NFKBIA(3), TLR2(2), TNF(3) | 2183744 | 30 | 26 | 27 | 6 | 4 | 2 | 5 | 8 | 11 | 0 | 0.1 | 0.00049 | 0.076 |
| 5 | RNAPATHWAY | dsRNA-activated protein kinase phosphorylates elF2a, which generally inhibits translation, and activates NF-kB to provoke inflammation. | CHUK, DNAJC3, EIF2S1, EIF2S2, MAP3K14, NFKB1, NFKBIA, PRKR, RELA, TP53 | 9 | EIF2S2(1), NFKB1(1), NFKBIA(3), TP53(5) | 751321 | 10 | 9 | 10 | 2 | 4 | 0 | 2 | 1 | 3 | 0 | 0.29 | 0.0032 | 0.4 |
| 6 | PLK3PATHWAY | Active Plk3 phosphorylates CDC25c, blocking the G2/M transition, and phosphorylates p53 to induce apoptosis. | ATM, ATR, CDC25C, CHEK1, CHEK2, CNK, TP53, YWHAH | 7 | ATM(8), ATR(2), CDC25C(2), CHEK2(2), TP53(5) | 1143073 | 19 | 14 | 17 | 3 | 3 | 3 | 6 | 4 | 2 | 1 | 0.13 | 0.0045 | 0.42 |
| 7 | TUBBYPATHWAY | Tubby is activated by phospholipase C activity and hydrolysis of PIP2, after which it enters the nucleus and regulates transcription. | CHRM1, GNAQ, GNB1, GNGT1, HTR2C, PLCB1, TUB | 7 | GNGT1(1), PLCB1(5), TUB(2) | 517190 | 8 | 7 | 8 | 0 | 2 | 0 | 1 | 2 | 3 | 0 | 0.17 | 0.0053 | 0.42 |
| 8 | PKCPATHWAY | Gq-coupled receptors promote hydrolysis of PIP2 to DAG and IP3, which causes calcium influx and activates protein kinase C. | GNAQ, NFKB1, NFKBIA, PLCB1, PRKCA, PRKCB1, RELA | 6 | NFKB1(1), NFKBIA(3), PLCB1(5) | 608492 | 9 | 8 | 9 | 2 | 1 | 0 | 1 | 3 | 4 | 0 | 0.53 | 0.0055 | 0.42 |
| 9 | PPARGPATHWAY | PPAR-gamma is a nuclear hormone receptor that is activated by fatty acids and regulates transcription through co-activations like Src-1 and Tif2. | CREBBP, EP300, LPL, NCOA1, NCOA2, PPARBP, PPARG, PPARGC1, RXRA | 7 | CREBBP(6), EP300(3), NCOA1(1), NCOA2(1), PPARG(1) | 1337157 | 12 | 11 | 12 | 1 | 1 | 1 | 3 | 5 | 2 | 0 | 0.14 | 0.0072 | 0.49 |
| 10 | SA_DIACYLGLYCEROL_SIGNALING | DAG (diacylglycerol) signaling activity | ESR1, ESR2, ITPKA, PDE1A, PDE1B, PLCB1, PLCB2, PRL, TRH, VIP | 10 | ESR2(1), ITPKA(1), PDE1B(1), PLCB1(5) | 818032 | 8 | 8 | 8 | 1 | 0 | 2 | 1 | 2 | 3 | 0 | 0.33 | 0.0088 | 0.54 |
Table 6. Get Full Table A Ranked List of Significantly Mutated Genesets (Excluding Significantly Mutated Genes). Number of significant genesets found: 0. Number of genesets displayed: 10
| rank | geneset | description | genes | N_genes | mut_tally | N | n | npat | nsite | nsil | n1 | n2 | n3 | n4 | n5 | n6 | p_ns_s | p | q |
|---|---|---|---|---|---|---|---|---|---|---|---|---|---|---|---|---|---|---|---|
| 1 | TUBBYPATHWAY | Tubby is activated by phospholipase C activity and hydrolysis of PIP2, after which it enters the nucleus and regulates transcription. | CHRM1, GNAQ, GNB1, GNGT1, HTR2C, PLCB1, TUB | 7 | GNGT1(1), PLCB1(5), TUB(2) | 517190 | 8 | 7 | 8 | 0 | 2 | 0 | 1 | 2 | 3 | 0 | 0.17 | 0.0053 | 1 |
| 2 | PKCPATHWAY | Gq-coupled receptors promote hydrolysis of PIP2 to DAG and IP3, which causes calcium influx and activates protein kinase C. | GNAQ, NFKB1, NFKBIA, PLCB1, PRKCA, PRKCB1, RELA | 6 | NFKB1(1), NFKBIA(3), PLCB1(5) | 608492 | 9 | 8 | 9 | 2 | 1 | 0 | 1 | 3 | 4 | 0 | 0.53 | 0.0055 | 1 |
| 3 | PPARGPATHWAY | PPAR-gamma is a nuclear hormone receptor that is activated by fatty acids and regulates transcription through co-activations like Src-1 and Tif2. | CREBBP, EP300, LPL, NCOA1, NCOA2, PPARBP, PPARG, PPARGC1, RXRA | 7 | CREBBP(6), EP300(3), NCOA1(1), NCOA2(1), PPARG(1) | 1337157 | 12 | 11 | 12 | 1 | 1 | 1 | 3 | 5 | 2 | 0 | 0.14 | 0.0072 | 1 |
| 4 | SA_DIACYLGLYCEROL_SIGNALING | DAG (diacylglycerol) signaling activity | ESR1, ESR2, ITPKA, PDE1A, PDE1B, PLCB1, PLCB2, PRL, TRH, VIP | 10 | ESR2(1), ITPKA(1), PDE1B(1), PLCB1(5) | 818032 | 8 | 8 | 8 | 1 | 0 | 2 | 1 | 2 | 3 | 0 | 0.33 | 0.0088 | 1 |
| 5 | SETPATHWAY | Cytotoxic T cells release perforin, which to allow entry into target cells of granzyme B, which activates caspases, and granzyme A, which induces caspase-independent apoptosis. | ANP32A, APEX1, CREBBP, DFFA, DFFB, GZMA, GZMB, HMGB2, NME1, PRF1, SET | 11 | CREBBP(6), DFFA(1), HMGB2(1), PRF1(2) | 788678 | 10 | 10 | 10 | 2 | 3 | 0 | 2 | 3 | 2 | 0 | 0.36 | 0.013 | 1 |
| 6 | HSA00472_D_ARGININE_AND_D_ORNITHINE_METABOLISM | Genes involved in D-arginine and D-ornithine metabolism | DAO | 1 | DAO(2) | 51556 | 2 | 2 | 2 | 0 | 1 | 0 | 0 | 1 | 0 | 0 | 0.59 | 0.016 | 1 |
| 7 | TCRMOLECULE | T Cell Receptor and CD3 Complex | CD3D, CD3E, CD3G, CD3Z, TRA@, TRB@ | 3 | CD3D(1), CD3G(1) | 84242 | 2 | 2 | 2 | 0 | 0 | 1 | 0 | 0 | 1 | 0 | 0.41 | 0.022 | 1 |
| 8 | IL17PATHWAY | Activated T cells secrete IL-17, which stimulates fibroblasts and other cells to secrete inflammatory and hematopoietic cytokines. | CD2, CD34, CD3D, CD3E, CD3G, CD3Z, CD4, CD58, CD8A, CSF3, IL17, IL3, IL6, IL8, KITLG, TRA@, TRB@ | 13 | CD3D(1), CD3G(1), CD58(1), IL6(2), KITLG(1) | 460709 | 6 | 5 | 6 | 1 | 1 | 1 | 1 | 1 | 2 | 0 | 0.37 | 0.025 | 1 |
| 9 | IL18PATHWAY | Pro-inflammatory IL-18 is activated in macrophages by caspase-1 cleavage and, in conjunction with IL-12, stimulates Th1 cell differentiation. | CASP1, IFNG, IL12A, IL12B, IL18, IL2 | 6 | CASP1(1), IL12B(2) | 222942 | 3 | 3 | 2 | 0 | 2 | 0 | 0 | 0 | 1 | 0 | 0.3 | 0.049 | 1 |
| 10 | HSA00300_LYSINE_BIOSYNTHESIS | Genes involved in lysine biosynthesis | AADAT, AASDHPPT, AASS, KARS | 4 | AASDHPPT(2), AASS(2) | 342070 | 4 | 4 | 4 | 0 | 0 | 1 | 1 | 1 | 1 | 0 | 0.38 | 0.05 | 1 |
In brief, we tabulate the number of mutations and the number of covered bases for each gene. The counts are broken down by mutation context category: four context categories that are discovered by MutSig, and one for indel and 'null' mutations, which include indels, nonsense mutations, splice-site mutations, and non-stop (read-through) mutations. For each gene, we calculate the probability of seeing the observed constellation of mutations, i.e. the product P1 x P2 x ... x Pm, or a more extreme one, given the background mutation rates calculated across the dataset. [1]
In addition to the links below, the full results of the analysis summarized in this report can also be downloaded programmatically using firehose_get, or interactively from either the Broad GDAC website or TCGA Data Coordination Center Portal.