This report serves to describe the mutational landscape and properties of a given individual set, as well as rank genes and genesets according to mutational significance. MutSig v2.0 was used to generate the results found in this report.
-
Working with individual set: HNSC-TP
-
Number of patients in set: 511
The input for this pipeline is a set of individuals with the following files associated for each:
-
An annotated .maf file describing the mutations called for the respective individual, and their properties.
-
A .wig file that contains information about the coverage of the sample.
-
MAF used for this analysis:HNSC-TP.final_analysis_set.maf
-
Blacklist used for this analysis: pancan_mutation_blacklist.v14.hg19.txt
-
Significantly mutated genes (q ≤ 0.1): 76
-
Mutations seen in COSMIC: 856
-
Significantly mutated genes in COSMIC territory: 15
-
Significantly mutated genesets: 60
-
Significantly mutated genesets: (excluding sig. mutated genes):0
-
Read 511 MAFs of type "maf1"
-
Total number of mutations in input MAFs: 120167
-
After removing 21 mutations outside chr1-24: 120146
-
After removing 3704 blacklisted mutations: 116442
-
After removing 6176 noncoding mutations: 110266
-
After collapsing adjacent/redundant mutations: 100303
-
Number of mutations before filtering: 100303
-
After removing 5391 mutations outside gene set: 94912
-
After removing 150 mutations outside category set: 94762
Table 1. Get Full Table Table representing breakdown of mutations by type.
| type | count |
|---|---|
| De_novo_Start_InFrame | 49 |
| De_novo_Start_OutOfFrame | 79 |
| Frame_Shift_Del | 2021 |
| Frame_Shift_Ins | 952 |
| In_Frame_Del | 465 |
| In_Frame_Ins | 55 |
| Missense_Mutation | 59473 |
| Nonsense_Mutation | 4576 |
| Nonstop_Mutation | 79 |
| Silent | 23954 |
| Splice_Site | 2964 |
| Start_Codon_Del | 5 |
| Start_Codon_Ins | 2 |
| Start_Codon_SNP | 88 |
| Total | 94762 |
Table 2. Get Full Table A breakdown of mutation rates per category discovered for this individual set.
| category | n | N | rate | rate_per_mb | relative_rate | exp_ns_s_ratio |
|---|---|---|---|---|---|---|
| *CpG->T | 10574 | 839327783 | 0.000013 | 13 | 2.7 | 2.1 |
| *Cp(A/C/T)->T | 15382 | 6847176767 | 2.2e-06 | 2.2 | 0.48 | 1.7 |
| C->(G/A) | 21902 | 7686504550 | 2.8e-06 | 2.8 | 0.61 | 4.8 |
| A->mut | 11703 | 7377330205 | 1.6e-06 | 1.6 | 0.34 | 3.9 |
| indel+null | 11105 | 15063834755 | 7.4e-07 | 0.74 | 0.16 | NaN |
| double_null | 142 | 15063834755 | 9.4e-09 | 0.0094 | 0.002 | NaN |
| Total | 70808 | 15063834755 | 4.7e-06 | 4.7 | 1 | 3.5 |
The x axis represents the samples. The y axis represents the exons, one row per exon, and they are sorted by average coverage across samples. For exons with exactly the same average coverage, they are sorted next by the %GC of the exon. (The secondary sort is especially useful for the zero-coverage exons at the bottom). If the figure is unpopulated, then full coverage is assumed (e.g. MutSig CV doesn't use WIGs and assumes full coverage).
Figure 1.
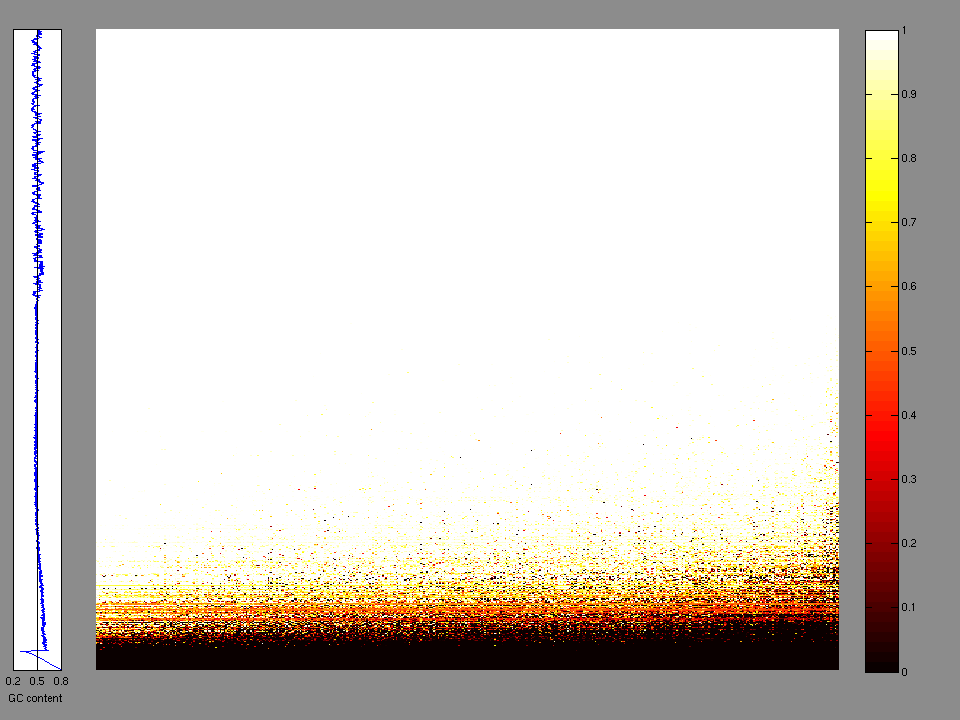
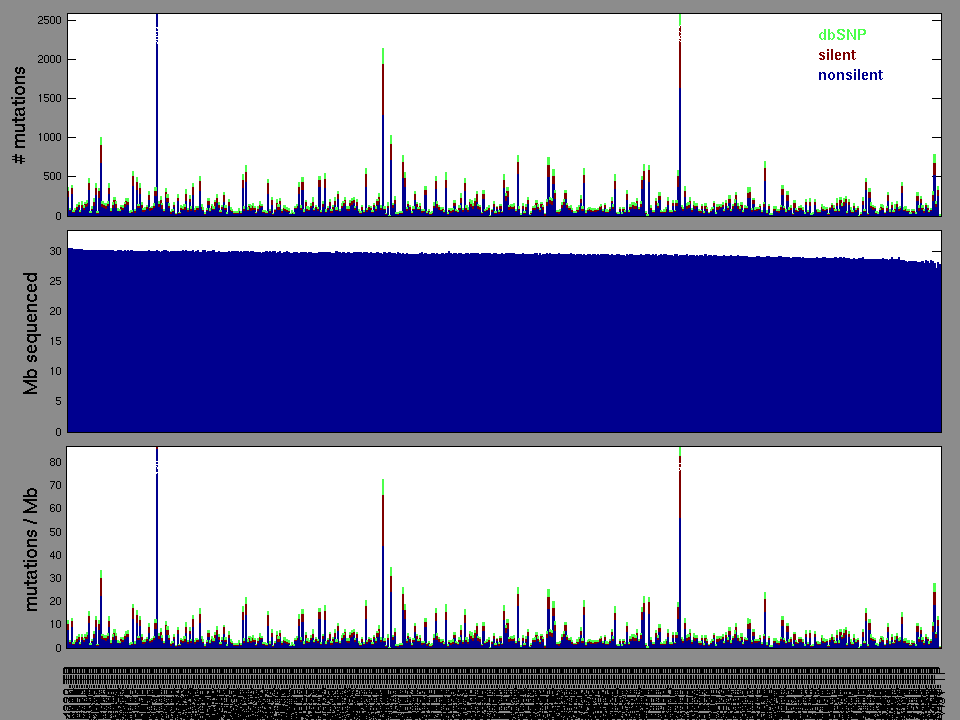
Figure 2. Patients counts and rates file used to generate this plot: HNSC-TP.patients.counts_and_rates.txt
The mutation spectrum is depicted in the lego plots below in which the 96 possible mutation types are subdivided into six large blocks, color-coded to reflect the base substitution type. Each large block is further subdivided into the 16 possible pairs of 5' and 3' neighbors, as listed in the 4x4 trinucleotide context legend. The height of each block corresponds to the mutation frequency for that kind of mutation (counts of mutations normalized by the base coverage in a given bin). The shape of the spectrum is a signature for dominant mutational mechanisms in different tumor types.
Figure 3. Get High-res Image SNV Mutation rate lego plot for entire set. Each bin is normalized by base coverage for that bin. Colors represent the six SNV types on the upper right. The three-base context for each mutation is labeled in the 4x4 legend on the lower right. The fractional breakdown of SNV counts is shown in the pie chart on the upper left. If this figure is blank, not enough information was provided in the MAF to generate it.
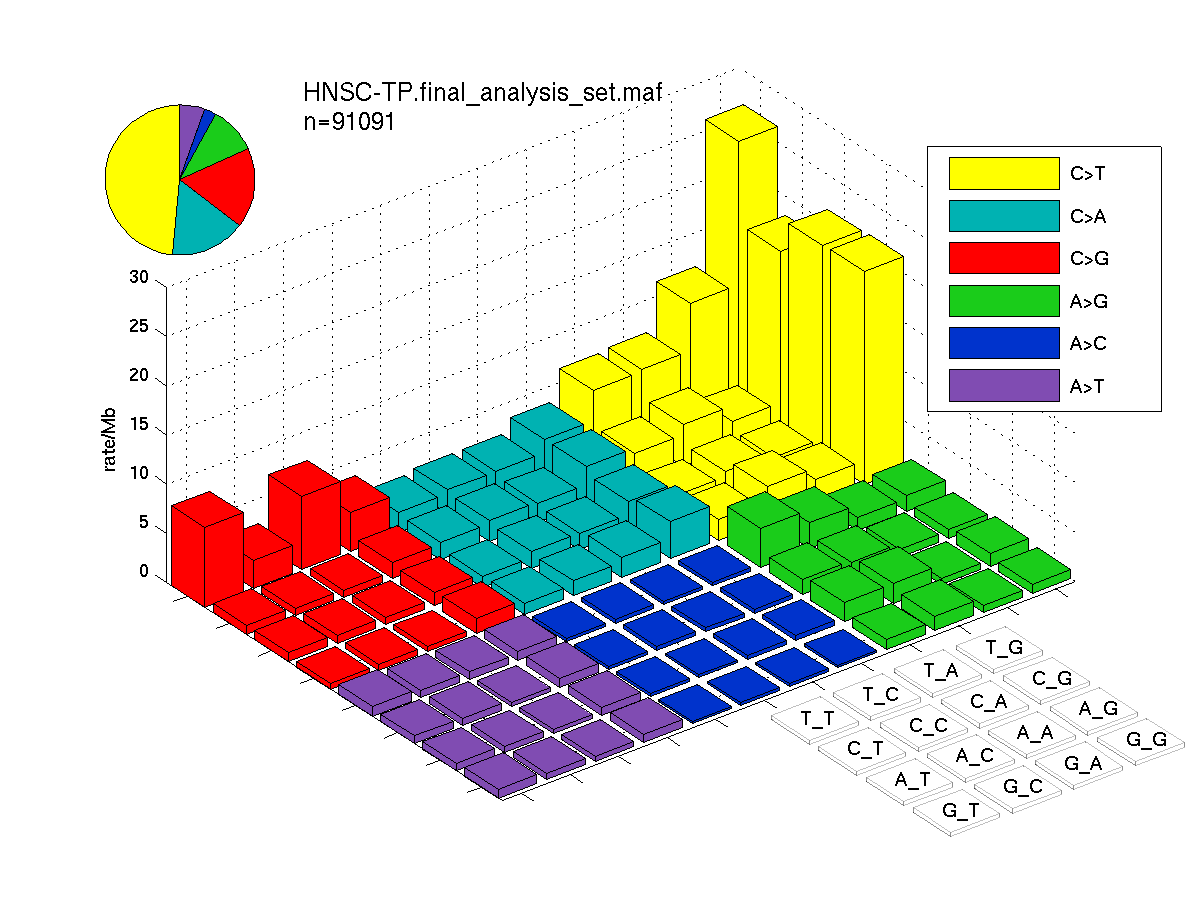
Figure 4. Get High-res Image SNV Mutation rate lego plots for 4 slices of mutation allele fraction (0<=AF<0.1, 0.1<=AF<0.25, 0.25<=AF<0.5, & 0.5<=AF) . The color code and three-base context legends are the same as the previous figure. If this figure is blank, not enough information was provided in the MAF to generate it.
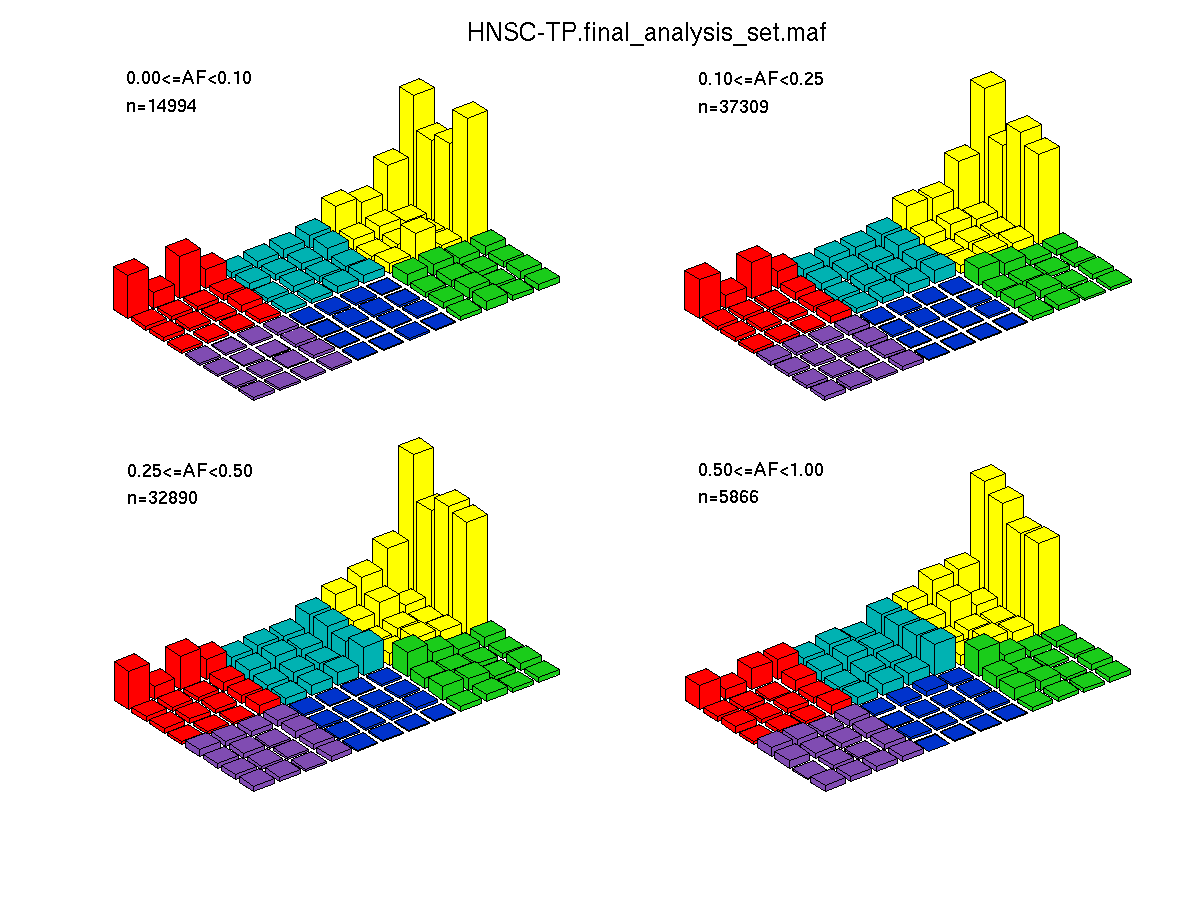
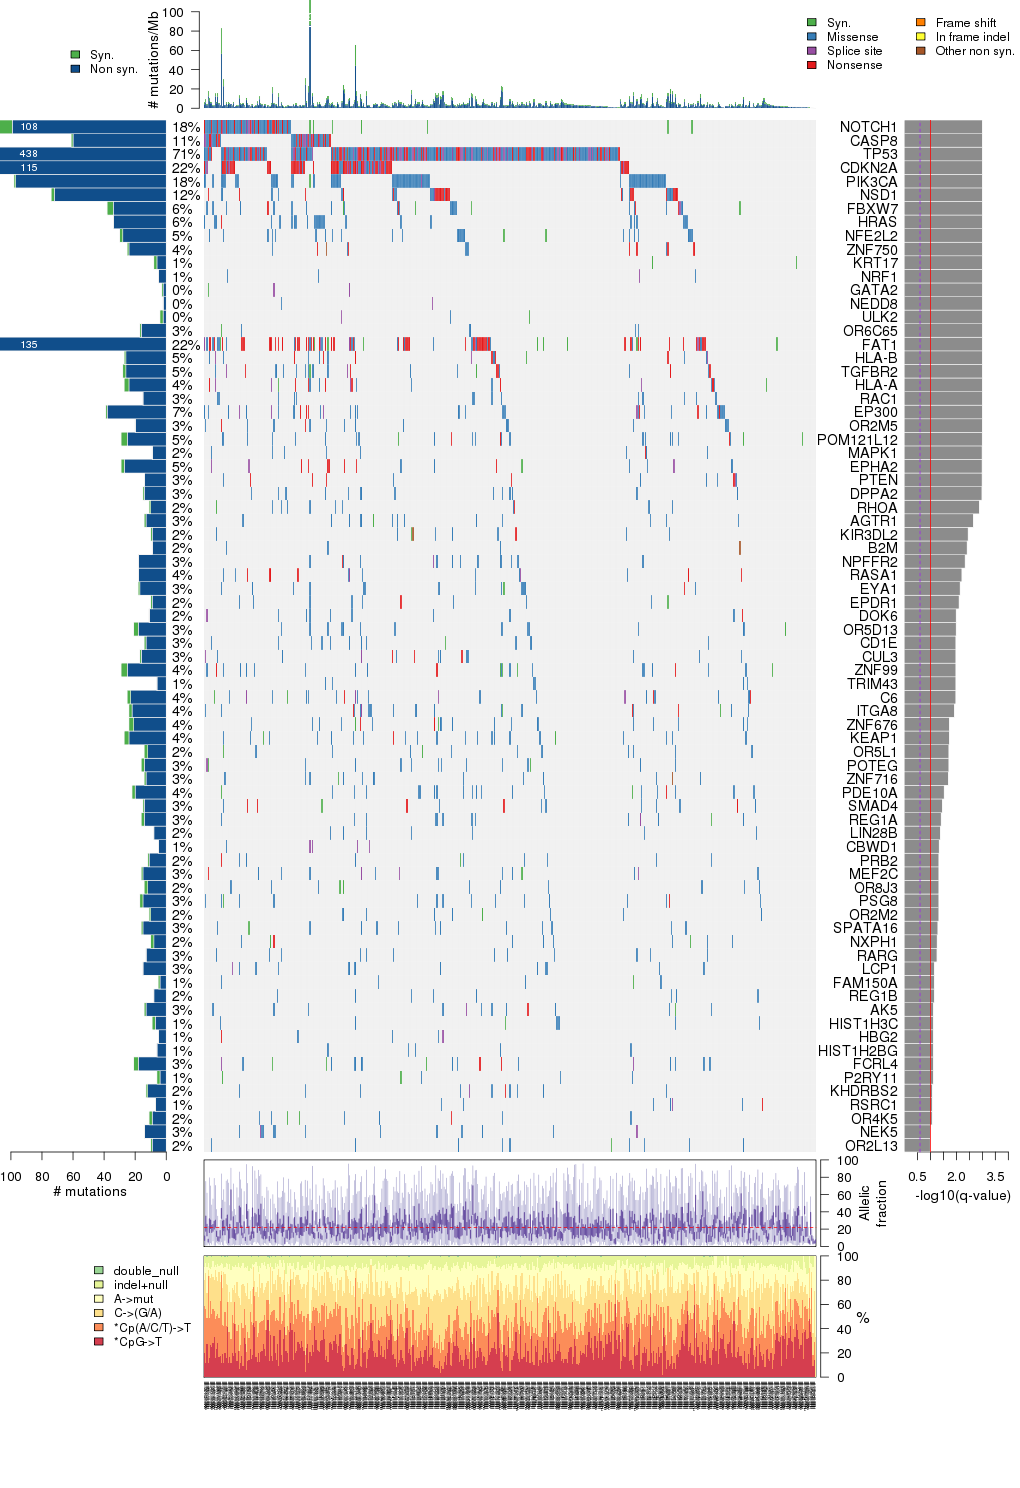
Figure 5. Get High-res Image The matrix in the center of the figure represents individual mutations in patient samples, color-coded by type of mutation, for the significantly mutated genes. The rate of synonymous and non-synonymous mutations is displayed at the top of the matrix. The barplot on the left of the matrix shows the number of mutations in each gene. The percentages represent the fraction of tumors with at least one mutation in the specified gene. The barplot to the right of the matrix displays the q-values for the most significantly mutated genes. The purple boxplots below the matrix (only displayed if required columns are present in the provided MAF) represent the distributions of allelic fractions observed in each sample. The plot at the bottom represents the base substitution distribution of individual samples, using the same categories that were used to calculate significance.
Column Descriptions:
-
N = number of sequenced bases in this gene across the individual set
-
n = number of (nonsilent) mutations in this gene across the individual set
-
npat = number of patients (individuals) with at least one nonsilent mutation
-
nsite = number of unique sites having a non-silent mutation
-
nsil = number of silent mutations in this gene across the individual set
-
n1 = number of nonsilent mutations of type: *CpG->T
-
n2 = number of nonsilent mutations of type: *Cp(A/C/T)->T
-
n3 = number of nonsilent mutations of type: C->(G/A)
-
n4 = number of nonsilent mutations of type: A->mut
-
n5 = number of nonsilent mutations of type: indel+null
-
n6 = number of nonsilent mutations of type: double_null
-
p_classic = p-value for the observed amount of nonsilent mutations being elevated in this gene
-
p_ns_s = p-value for the observed nonsilent/silent ratio being elevated in this gene
-
p_cons = p-value for enrichment of mutations at evolutionarily most-conserved sites in gene
-
p_joint = p-value for clustering + conservation
-
p = p-value (overall)
-
q = q-value, False Discovery Rate (Benjamini-Hochberg procedure)
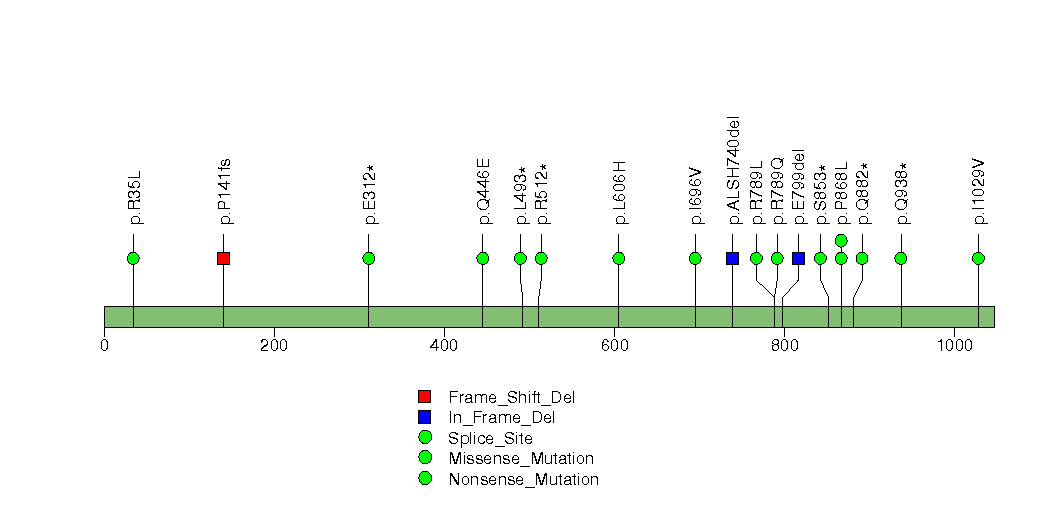
Table 3. Get Full Table A Ranked List of Significantly Mutated Genes. Number of significant genes found: 76. Number of genes displayed: 35. Click on a gene name to display its stick figure depicting the distribution of mutations and mutation types across the chosen gene (this feature may not be available for all significant genes).
| rank | gene | description | N | n | npat | nsite | nsil | n1 | n2 | n3 | n4 | n5 | n6 | p_classic | p_ns_s | p_clust | p_cons | p_joint | p | q |
|---|---|---|---|---|---|---|---|---|---|---|---|---|---|---|---|---|---|---|---|---|
| 1 | NOTCH1 | Notch homolog 1, translocation-associated (Drosophila) | 3188473 | 99 | 90 | 94 | 9 | 16 | 17 | 15 | 10 | 40 | 1 | 2.89e-15 | 2.65e-07 | 0.00024 | 0.14 | 0.00036 | 0.000 | 0.000 |
| 2 | CASP8 | caspase 8, apoptosis-related cysteine peptidase | 891984 | 60 | 54 | 48 | 1 | 3 | 8 | 8 | 8 | 31 | 2 | 3.44e-15 | 2.19e-06 | 0.58 | 0.000017 | 0.00018 | 0.000 | 0.000 |
| 3 | TP53 | tumor protein p53 | 629002 | 432 | 364 | 213 | 6 | 72 | 45 | 60 | 69 | 176 | 10 | <1.00e-15 | <1.00e-15 | 0 | 0 | 0 | <1.00e-15 | <1.21e-12 |
| 4 | CDKN2A | cyclin-dependent kinase inhibitor 2A (melanoma, p16, inhibits CDK4) | 431282 | 114 | 112 | 54 | 1 | 4 | 3 | 6 | 6 | 92 | 3 | <1.00e-15 | 5.47e-11 | 0 | 0 | 0 | <1.00e-15 | <1.21e-12 |
| 5 | PIK3CA | phosphoinositide-3-kinase, catalytic, alpha polypeptide | 1678341 | 97 | 94 | 36 | 1 | 3 | 54 | 6 | 31 | 3 | 0 | 2.00e-15 | 1.69e-11 | 0 | 0.00047 | 0 | <1.00e-15 | <1.21e-12 |
| 6 | NSD1 | nuclear receptor binding SET domain protein 1 | 4170623 | 72 | 62 | 69 | 2 | 2 | 9 | 13 | 5 | 37 | 6 | 4.55e-15 | 0.000330 | 0.0001 | 0.000013 | 0 | <1.00e-15 | <1.21e-12 |
| 7 | FBXW7 | F-box and WD repeat domain containing 7 | 1273127 | 34 | 33 | 25 | 4 | 4 | 2 | 11 | 5 | 11 | 1 | 5.90e-10 | 0.272 | 4e-07 | 0.19 | 0 | <1.00e-15 | <1.21e-12 |
| 8 | HRAS | v-Ha-ras Harvey rat sarcoma viral oncogene homolog | 331971 | 34 | 31 | 10 | 0 | 7 | 4 | 19 | 3 | 1 | 0 | 2.44e-15 | 1.57e-05 | 0 | 6.4e-06 | 0 | <1.00e-15 | <1.21e-12 |
| 9 | NFE2L2 | nuclear factor (erythroid-derived 2)-like 2 | 913695 | 28 | 27 | 19 | 2 | 0 | 6 | 13 | 8 | 1 | 0 | 5.62e-14 | 0.0574 | 0 | 0 | 0 | <1.00e-15 | <1.21e-12 |
| 10 | ZNF750 | zinc finger protein 750 | 1113745 | 24 | 22 | 23 | 1 | 0 | 1 | 4 | 4 | 15 | 0 | 9.40e-09 | 0.0593 | 0.00084 | 0.00016 | 0 | <1.00e-15 | <1.21e-12 |
| 11 | KRT17 | keratin 17 | 679085 | 6 | 6 | 3 | 2 | 0 | 0 | 0 | 0 | 6 | 0 | 0.0560 | 1.000 | 0 | 0.88 | 0 | <1.00e-15 | <1.21e-12 |
| 12 | NRF1 | nuclear respiratory factor 1 | 784336 | 5 | 5 | 5 | 0 | 0 | 1 | 2 | 0 | 2 | 0 | 0.163 | 0.310 | 0.75 | 0 | 0 | <1.00e-15 | <1.21e-12 |
| 13 | GATA2 | GATA binding protein 2 | 635524 | 2 | 2 | 2 | 1 | 0 | 0 | 0 | 0 | 2 | 0 | 0.758 | 0.659 | 0.049 | 0 | 0 | <1.00e-15 | <1.21e-12 |
| 14 | NEDD8 | neural precursor cell expressed, developmentally down-regulated 8 | 127929 | 2 | 2 | 2 | 0 | 0 | 0 | 1 | 0 | 1 | 0 | 0.0493 | 0.659 | 0.88 | 0 | 0 | <1.00e-15 | <1.21e-12 |
| 15 | ULK2 | unc-51-like kinase 2 (C. elegans) | 1556817 | 2 | 2 | 2 | 2 | 0 | 0 | 1 | 0 | 1 | 0 | 0.995 | 0.943 | 0.82 | 0 | 0 | <1.00e-15 | <1.21e-12 |
| 16 | OR6C65 | olfactory receptor, family 6, subfamily C, member 65 | 474443 | 16 | 16 | 7 | 1 | 0 | 3 | 1 | 1 | 11 | 0 | 1.55e-12 | 0.430 | 8.4e-06 | 0.64 | 0.000068 | 4.00e-15 | 4.50e-12 |
| 17 | FAT1 | FAT tumor suppressor homolog 1 (Drosophila) | 6977289 | 123 | 112 | 118 | 12 | 2 | 7 | 10 | 11 | 77 | 16 | 3.55e-15 | 0.000253 | 0.16 | 0.03 | 0.032 | 4.22e-15 | 4.50e-12 |
| 18 | HLA-B | major histocompatibility complex, class I, B | 504575 | 26 | 24 | 21 | 1 | 0 | 1 | 8 | 2 | 15 | 0 | 4.33e-15 | 0.00658 | 0.033 | 0.065 | 0.037 | 6.00e-15 | 6.03e-12 |
| 19 | TGFBR2 | transforming growth factor, beta receptor II (70/80kDa) | 880651 | 26 | 24 | 17 | 2 | 5 | 7 | 0 | 5 | 9 | 0 | 2.04e-12 | 0.00297 | 0.0036 | 0.097 | 0.0046 | 3.12e-13 | 2.98e-10 |
| 20 | HLA-A | major histocompatibility complex, class I, A | 565415 | 24 | 22 | 21 | 3 | 1 | 0 | 1 | 6 | 16 | 0 | 4.46e-12 | 0.137 | 0.099 | 0.38 | 0.12 | 1.63e-11 | 1.48e-08 |
| 21 | RAC1 | ras-related C3 botulinum toxin substrate 1 (rho family, small GTP binding protein Rac1) | 317803 | 15 | 14 | 8 | 0 | 6 | 4 | 2 | 3 | 0 | 0 | 1.46e-10 | 0.00386 | 0.18 | 0.062 | 0.075 | 2.86e-10 | 2.47e-07 |
| 22 | EP300 | E1A binding protein p300 | 3759447 | 38 | 38 | 31 | 1 | 5 | 9 | 6 | 7 | 11 | 0 | 4.99e-08 | 0.000406 | 0.00022 | 0.02 | 0.00029 | 3.79e-10 | 3.12e-07 |
| 23 | OR2M5 | olfactory receptor, family 2, subfamily M, member 5 | 481362 | 20 | 17 | 19 | 0 | 4 | 2 | 10 | 2 | 2 | 0 | 7.73e-11 | 0.00511 | 0.58 | 0.87 | 0.78 | 1.48e-09 | 1.16e-06 |
| 24 | POM121L12 | POM121 transmembrane nucleoporin-like 12 | 444628 | 25 | 23 | 25 | 4 | 6 | 2 | 10 | 3 | 4 | 0 | 2.89e-09 | 0.0524 | 0.19 | 0.2 | 0.22 | 1.42e-08 | 1.08e-05 |
| 25 | MAPK1 | mitogen-activated protein kinase 1 | 506892 | 9 | 9 | 2 | 0 | 7 | 1 | 0 | 0 | 1 | 0 | 2.91e-05 | 0.0486 | 4e-05 | 0.05 | 0.000053 | 3.28e-08 | 2.38e-05 |
| 26 | EPHA2 | EPH receptor A2 | 1452412 | 27 | 24 | 24 | 2 | 6 | 1 | 2 | 0 | 16 | 2 | 2.68e-07 | 0.0231 | 0.0068 | 0.22 | 0.0063 | 3.59e-08 | 2.41e-05 |
| 27 | PTEN | phosphatase and tensin homolog (mutated in multiple advanced cancers 1) | 621569 | 14 | 14 | 14 | 0 | 1 | 1 | 2 | 2 | 8 | 0 | 2.95e-08 | 0.0580 | 0.21 | 0.015 | 0.058 | 3.59e-08 | 2.41e-05 |
| 28 | DPPA2 | developmental pluripotency associated 2 | 472642 | 14 | 14 | 13 | 1 | 4 | 2 | 4 | 4 | 0 | 0 | 6.58e-09 | 0.0964 | 0.62 | 0.31 | 0.57 | 7.70e-08 | 4.98e-05 |
| 29 | RHOA | ras homolog gene family, member A | 305578 | 10 | 10 | 7 | 1 | 0 | 1 | 6 | 2 | 1 | 0 | 5.98e-07 | 0.296 | 0.055 | 0.082 | 0.044 | 4.87e-07 | 0.000304 |
| 30 | AGTR1 | angiotensin II receptor, type 1 | 553924 | 13 | 13 | 13 | 1 | 2 | 5 | 2 | 4 | 0 | 0 | 2.17e-07 | 0.0690 | 0.51 | 0.29 | 0.54 | 1.99e-06 | 0.00120 |
| 31 | KIR3DL2 | killer cell immunoglobulin-like receptor, three domains, long cytoplasmic tail, 2 | 457495 | 9 | 9 | 7 | 1 | 3 | 1 | 3 | 0 | 2 | 0 | 5.97e-05 | 0.204 | 0.0021 | 0.83 | 0.0045 | 4.32e-06 | 0.00253 |
| 32 | B2M | beta-2-microglobulin | 190082 | 9 | 8 | 8 | 0 | 0 | 2 | 2 | 0 | 5 | 0 | 3.51e-07 | 0.282 | 0.72 | 0.65 | 0.9 | 5.03e-06 | 0.00285 |
| 33 | NPFFR2 | neuropeptide FF receptor 2 | 808643 | 18 | 17 | 18 | 0 | 1 | 3 | 5 | 6 | 3 | 0 | 7.00e-07 | 0.0126 | 0.45 | 0.45 | 0.6 | 6.54e-06 | 0.00359 |
| 34 | RASA1 | RAS p21 protein activator (GTPase activating protein) 1 | 1552003 | 18 | 18 | 16 | 0 | 1 | 0 | 3 | 3 | 10 | 1 | 5.29e-06 | 0.0268 | 0.42 | 0.051 | 0.12 | 9.73e-06 | 0.00518 |
| 35 | EYA1 | eyes absent homolog 1 (Drosophila) | 935398 | 17 | 16 | 17 | 1 | 3 | 2 | 6 | 5 | 1 | 0 | 3.44e-06 | 0.0638 | 0.33 | 0.086 | 0.23 | 1.19e-05 | 0.00618 |
Figure S1. This figure depicts the distribution of mutations and mutation types across the NOTCH1 significant gene.
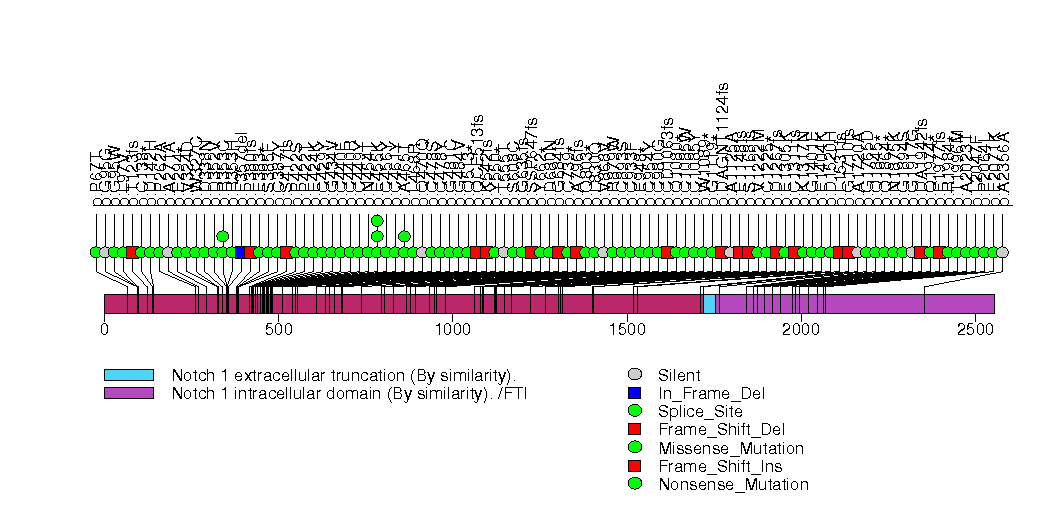
Figure S2. This figure depicts the distribution of mutations and mutation types across the TP53 significant gene.
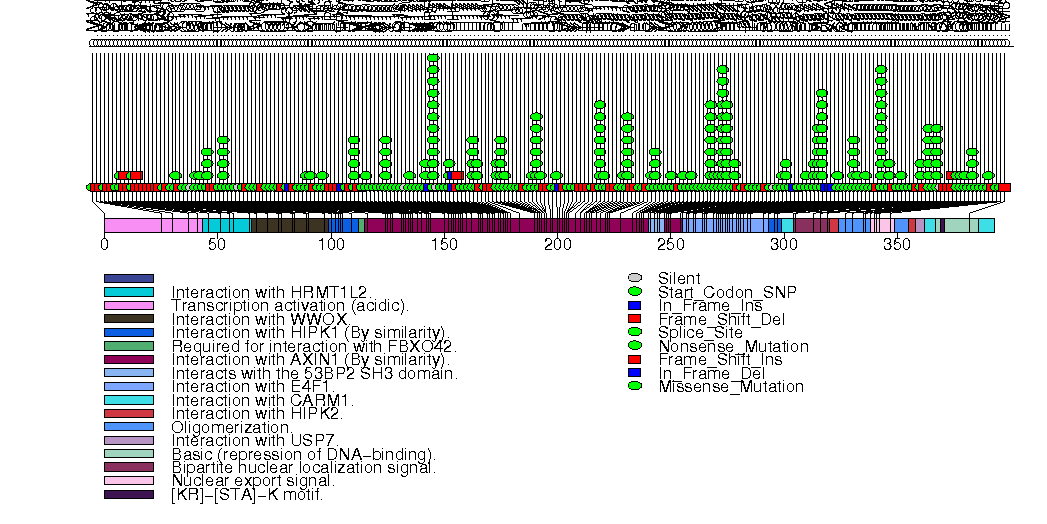
Figure S3. This figure depicts the distribution of mutations and mutation types across the CDKN2A significant gene.
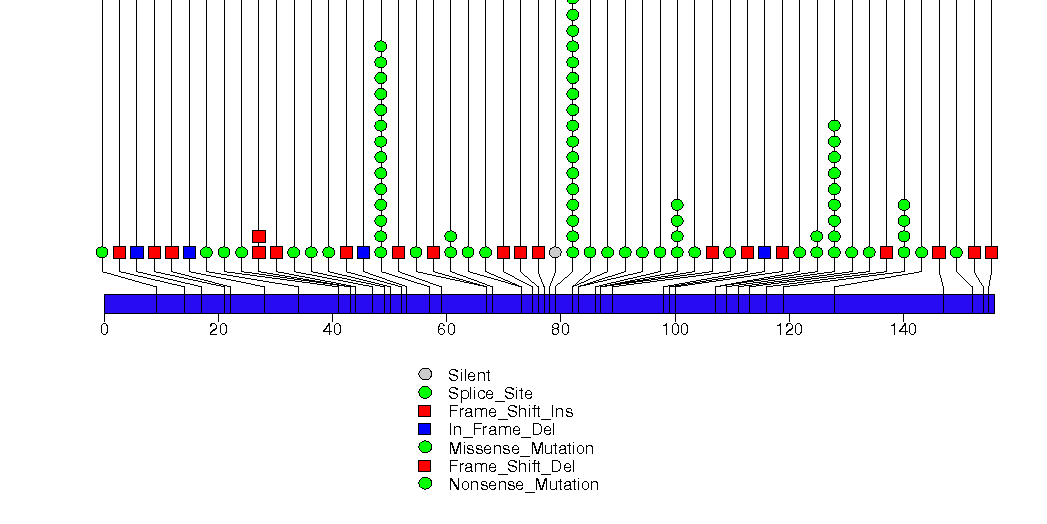
Figure S4. This figure depicts the distribution of mutations and mutation types across the PIK3CA significant gene.
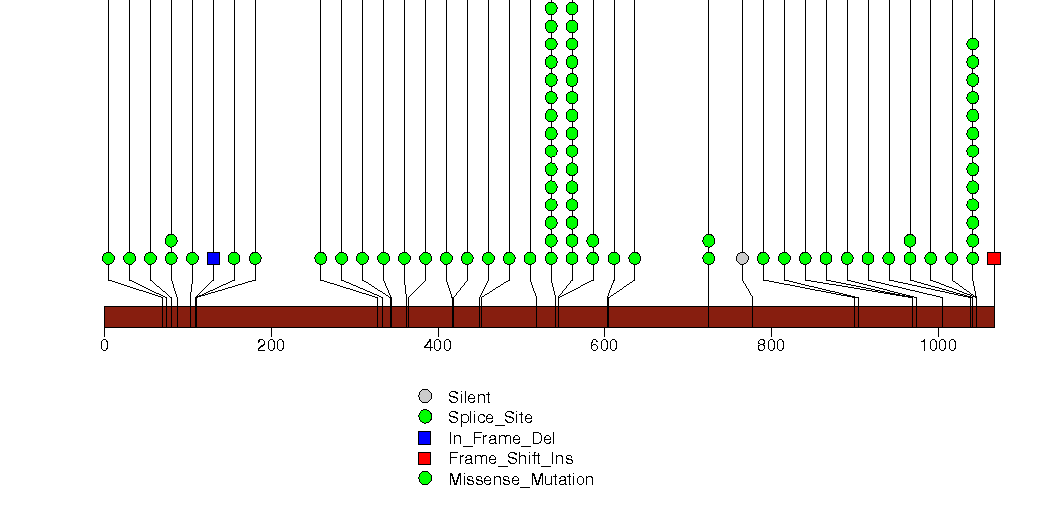
Figure S5. This figure depicts the distribution of mutations and mutation types across the NSD1 significant gene.
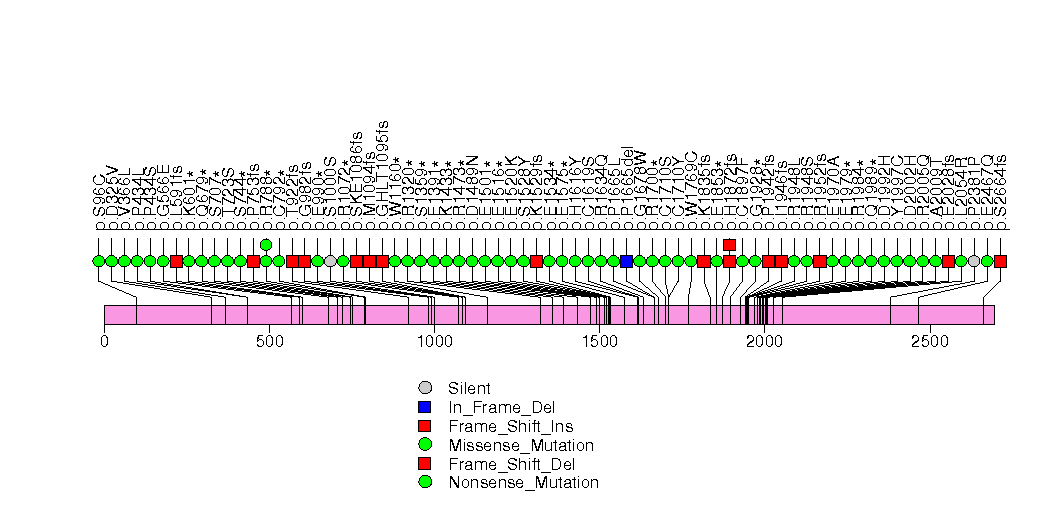
Figure S6. This figure depicts the distribution of mutations and mutation types across the FBXW7 significant gene.
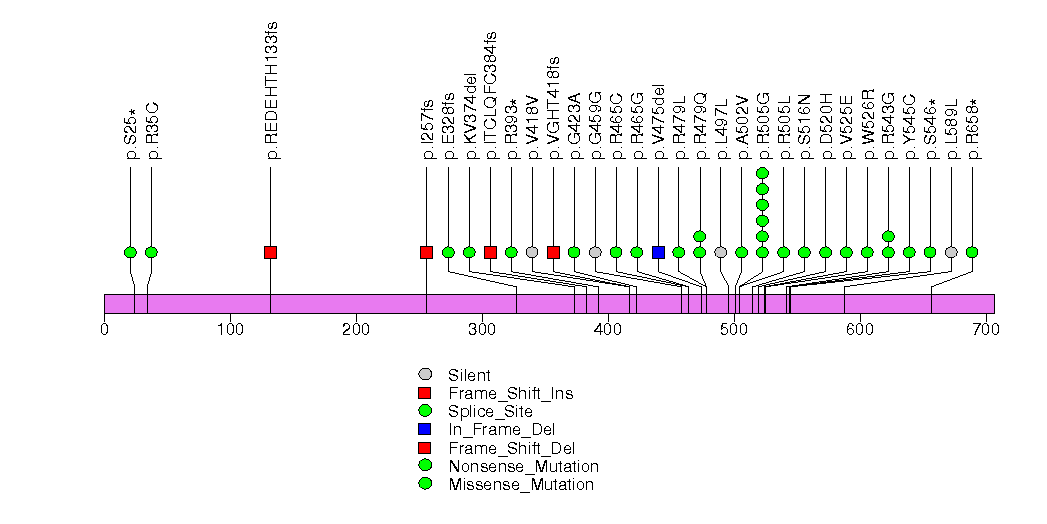
Figure S7. This figure depicts the distribution of mutations and mutation types across the HRAS significant gene.
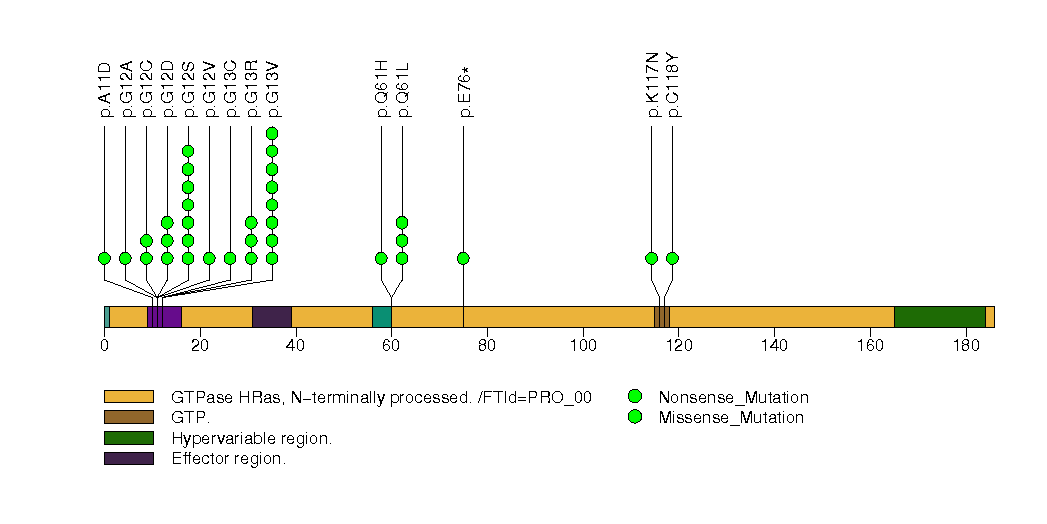
Figure S8. This figure depicts the distribution of mutations and mutation types across the NFE2L2 significant gene.
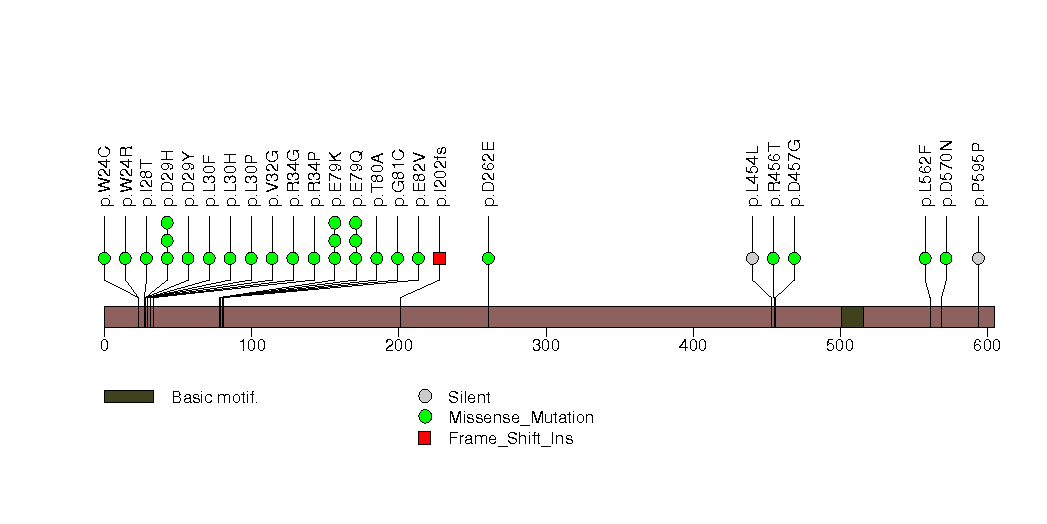
Figure S9. This figure depicts the distribution of mutations and mutation types across the ZNF750 significant gene.
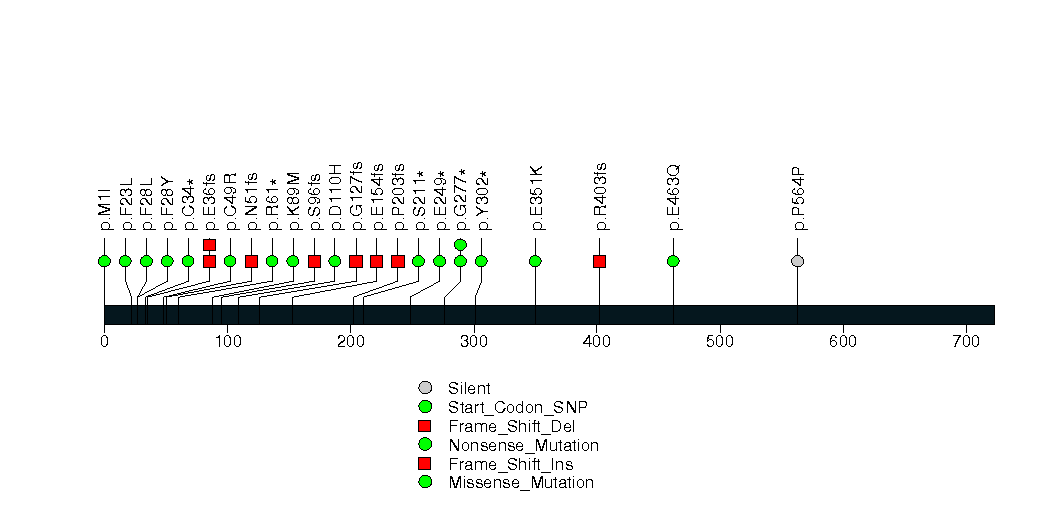
Figure S10. This figure depicts the distribution of mutations and mutation types across the KRT17 significant gene.
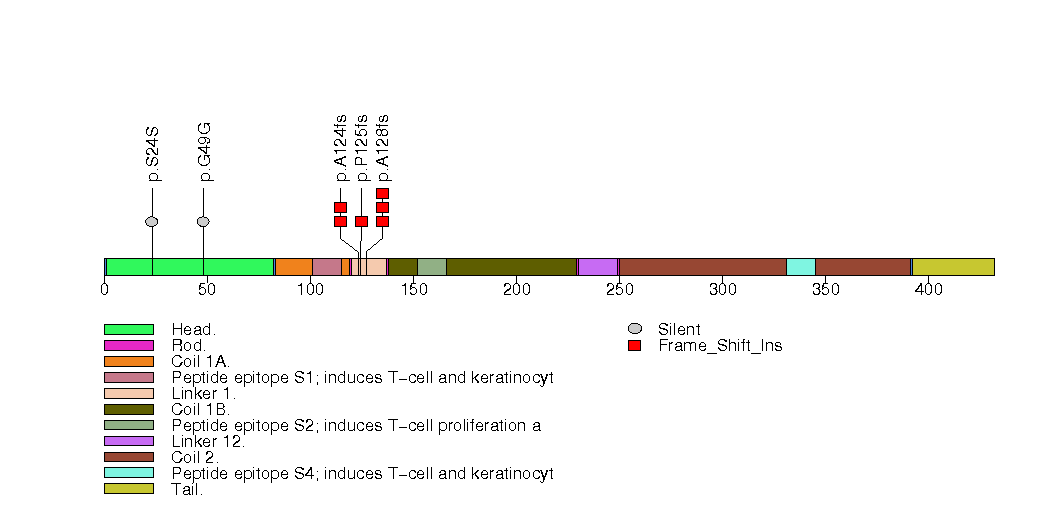
Figure S11. This figure depicts the distribution of mutations and mutation types across the NRF1 significant gene.
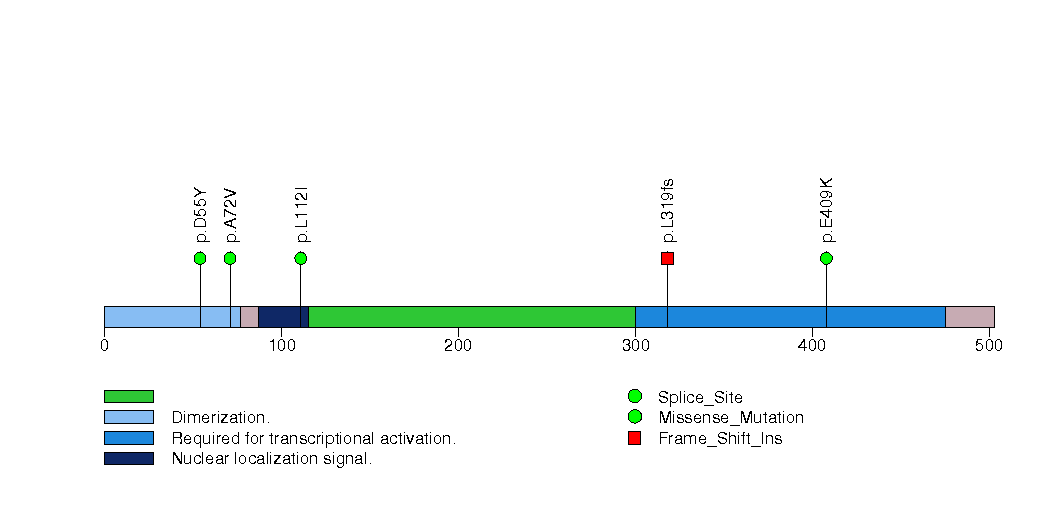
Figure S12. This figure depicts the distribution of mutations and mutation types across the GATA2 significant gene.
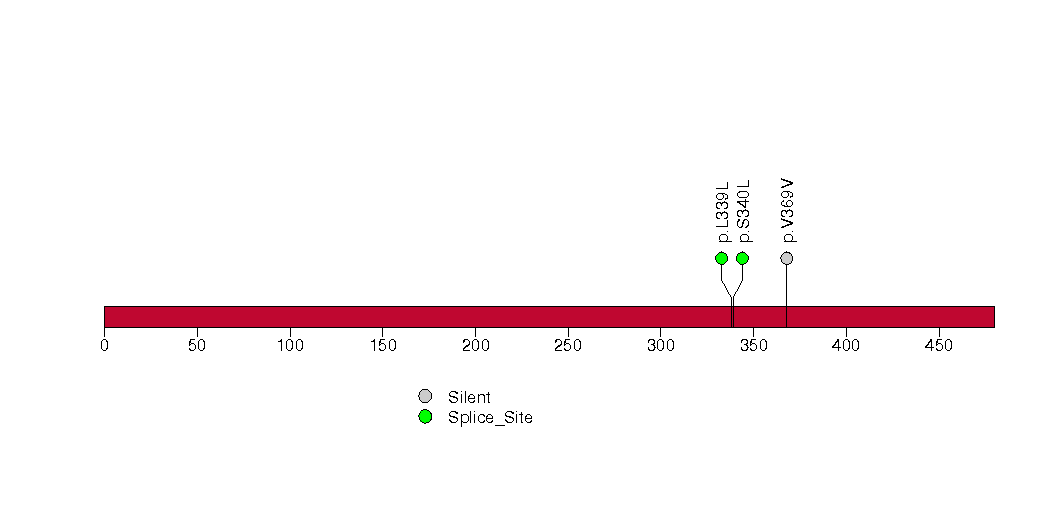
Figure S13. This figure depicts the distribution of mutations and mutation types across the NEDD8 significant gene.
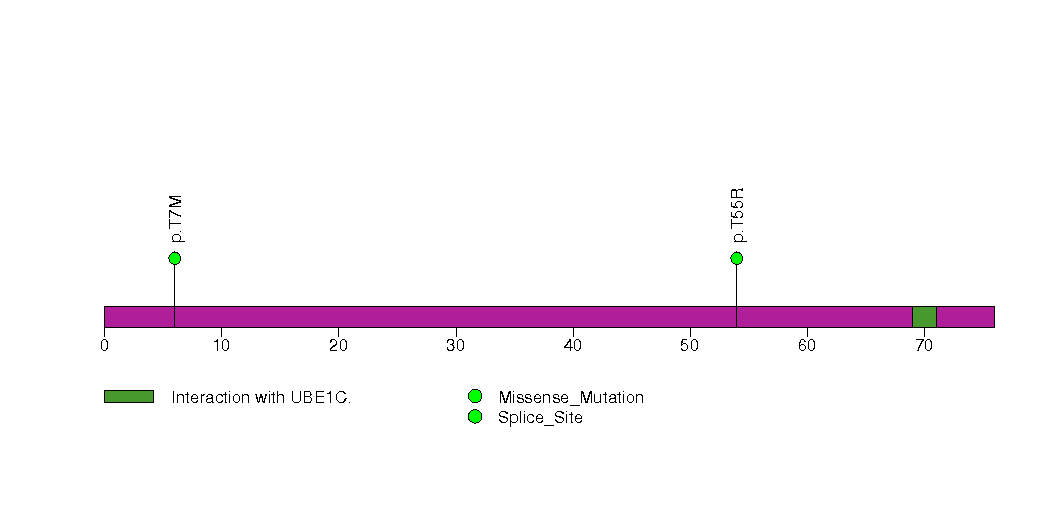
Figure S14. This figure depicts the distribution of mutations and mutation types across the ULK2 significant gene.
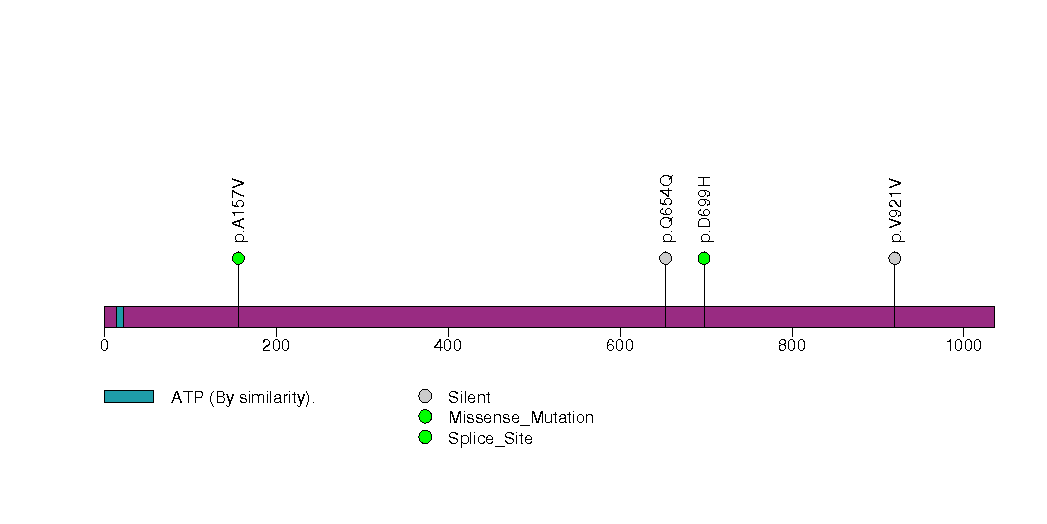
Figure S15. This figure depicts the distribution of mutations and mutation types across the OR6C65 significant gene.
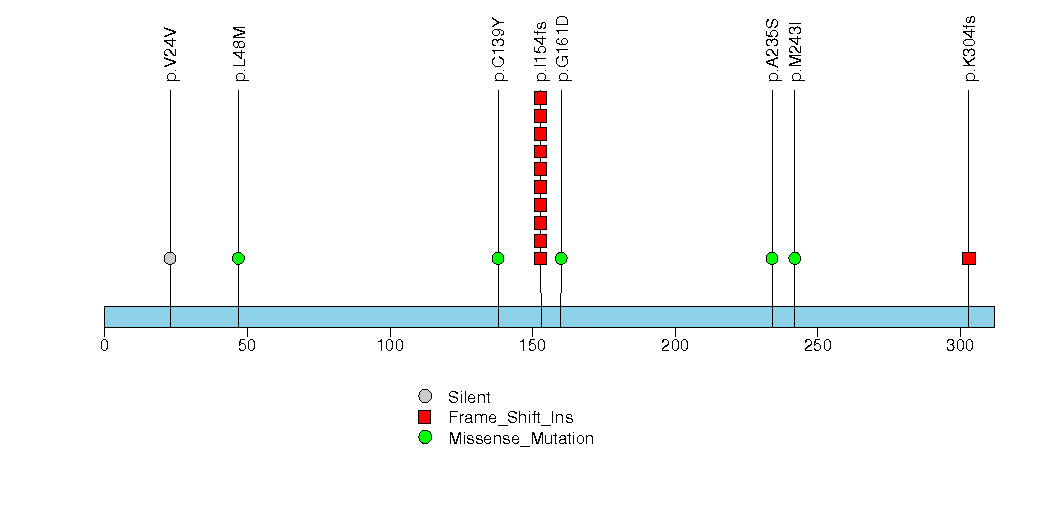
Figure S16. This figure depicts the distribution of mutations and mutation types across the FAT1 significant gene.
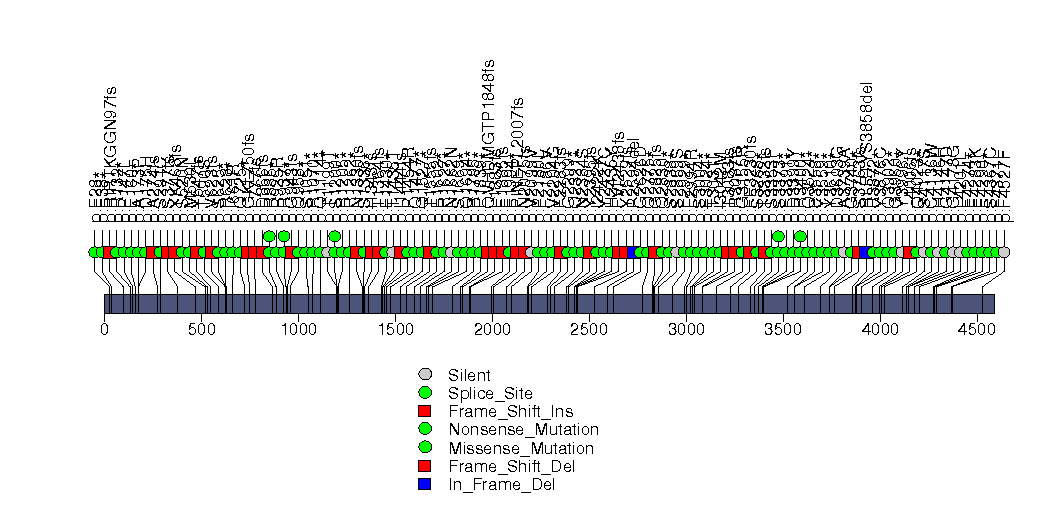
Figure S17. This figure depicts the distribution of mutations and mutation types across the HLA-B significant gene.
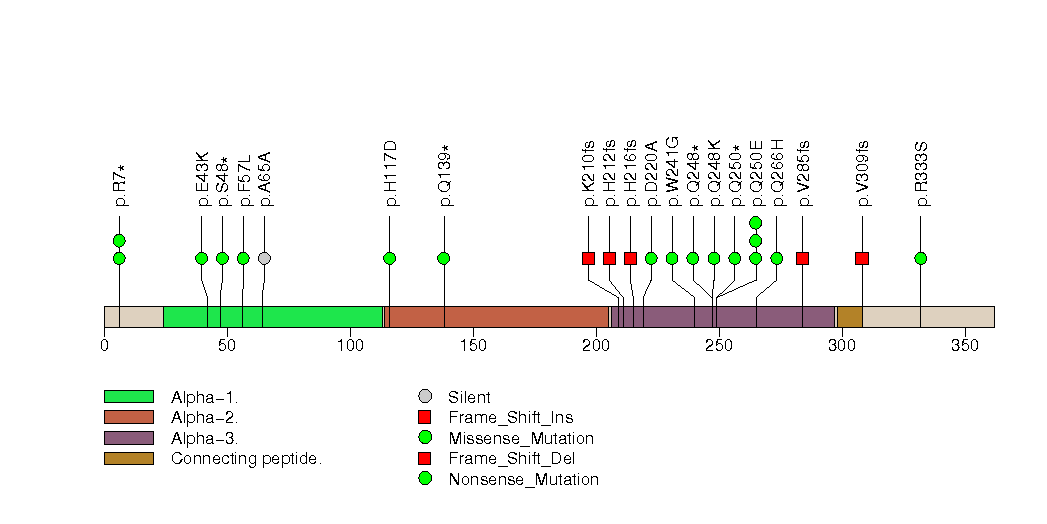
Figure S18. This figure depicts the distribution of mutations and mutation types across the TGFBR2 significant gene.
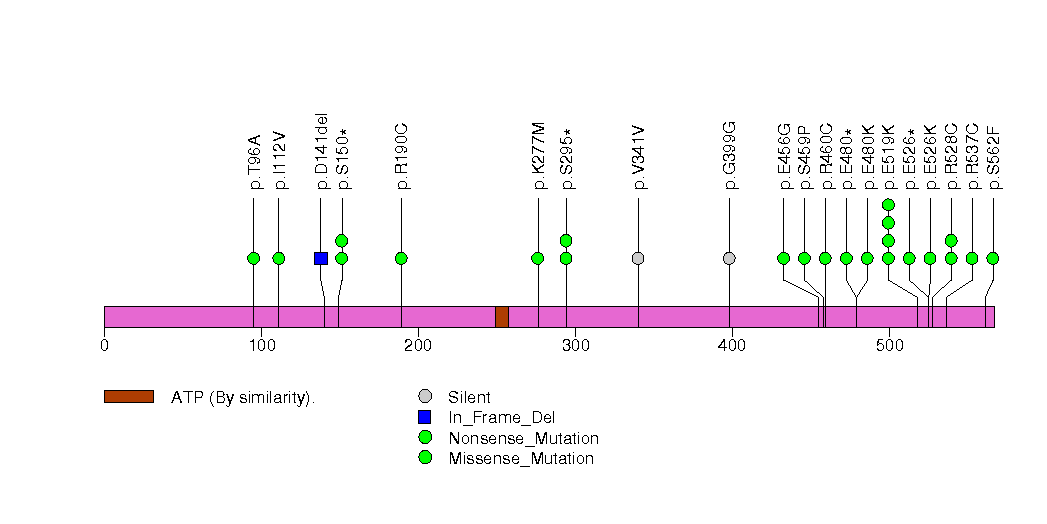
Figure S19. This figure depicts the distribution of mutations and mutation types across the HLA-A significant gene.
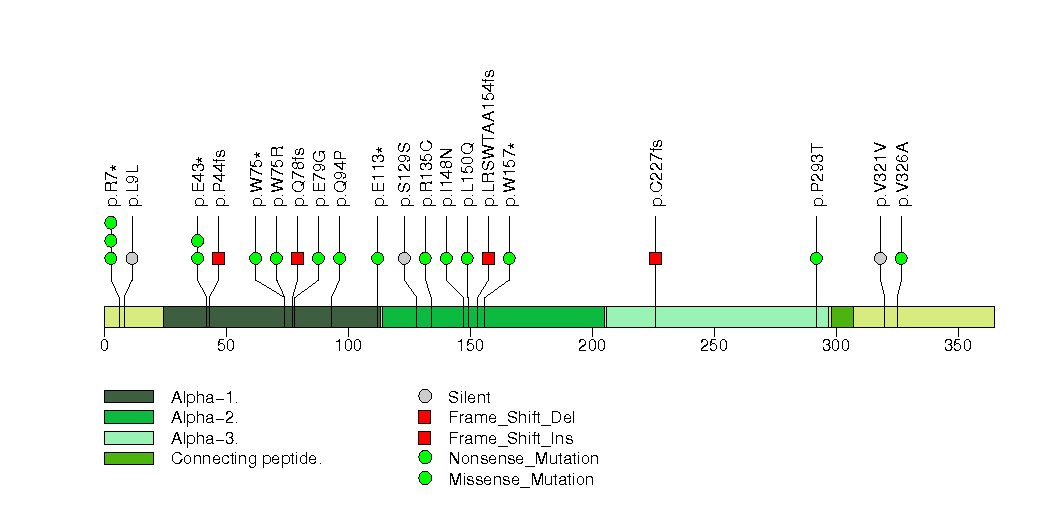
Figure S20. This figure depicts the distribution of mutations and mutation types across the RAC1 significant gene.
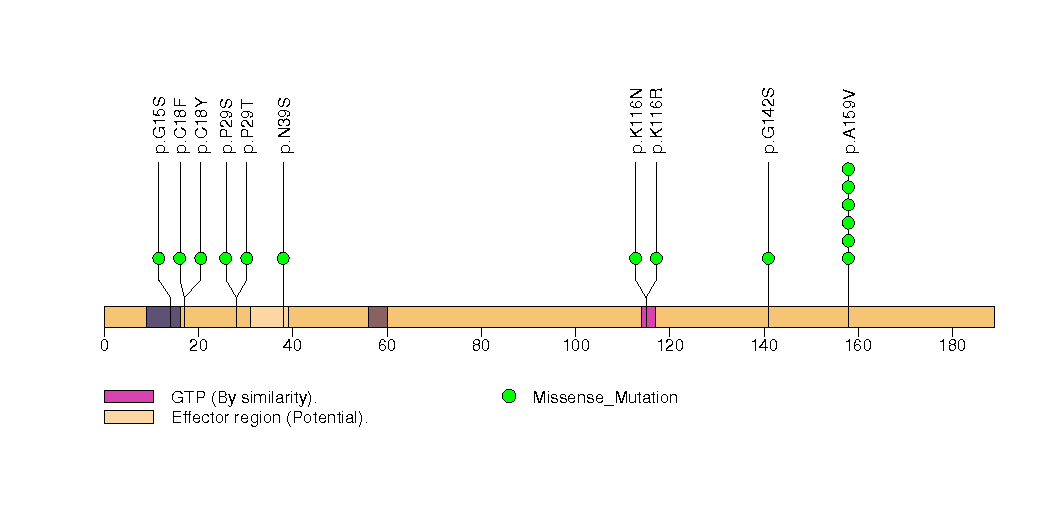
Figure S21. This figure depicts the distribution of mutations and mutation types across the EP300 significant gene.
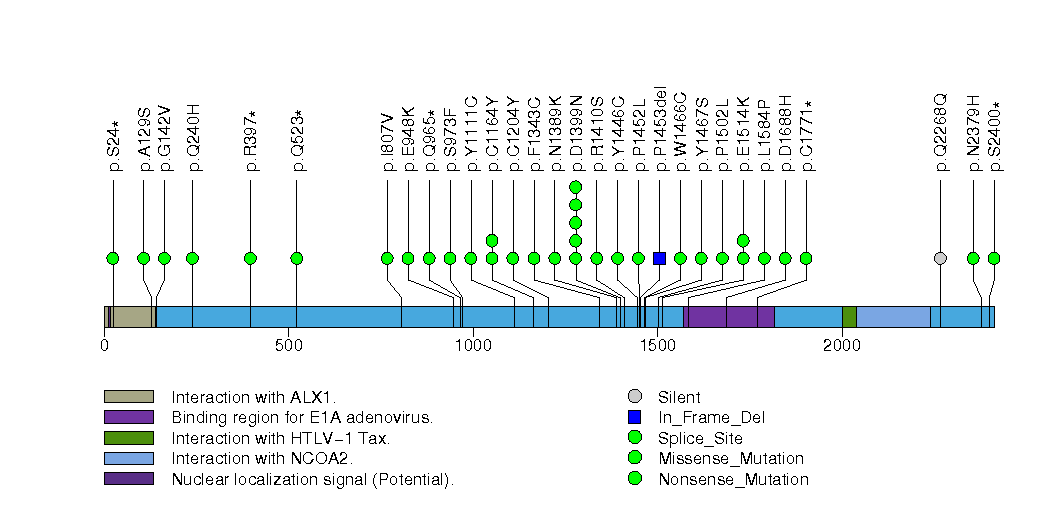
Figure S22. This figure depicts the distribution of mutations and mutation types across the OR2M5 significant gene.
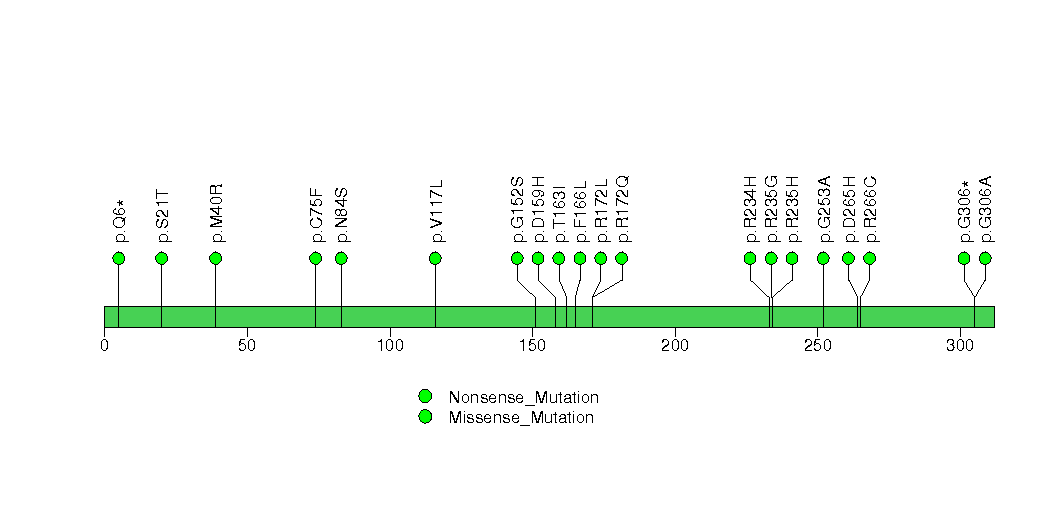
Figure S23. This figure depicts the distribution of mutations and mutation types across the POM121L12 significant gene.
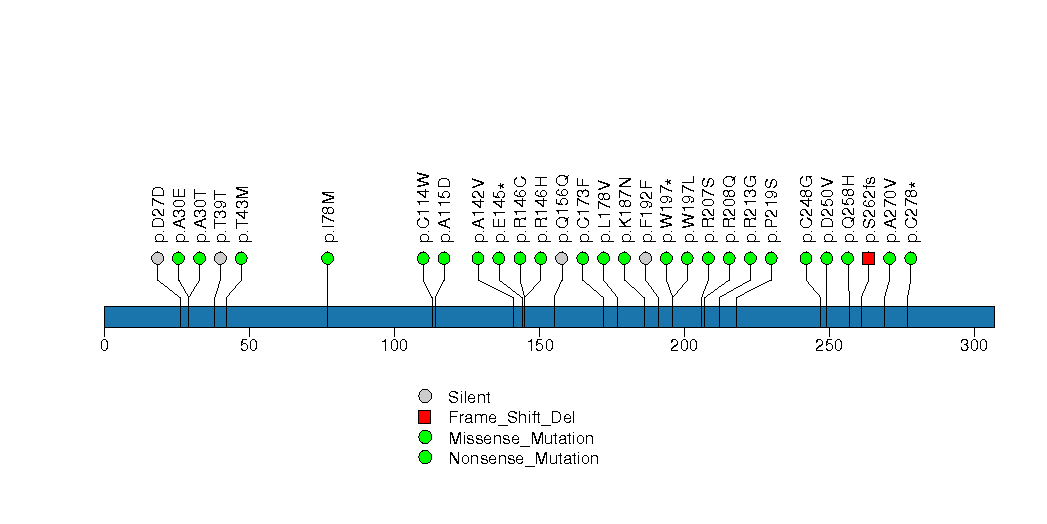
Figure S24. This figure depicts the distribution of mutations and mutation types across the MAPK1 significant gene.
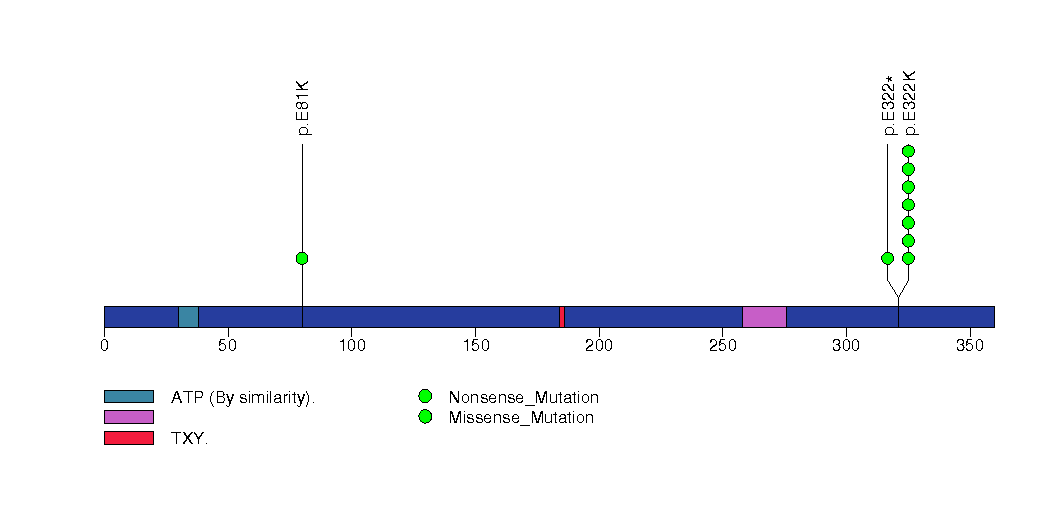
Figure S25. This figure depicts the distribution of mutations and mutation types across the EPHA2 significant gene.
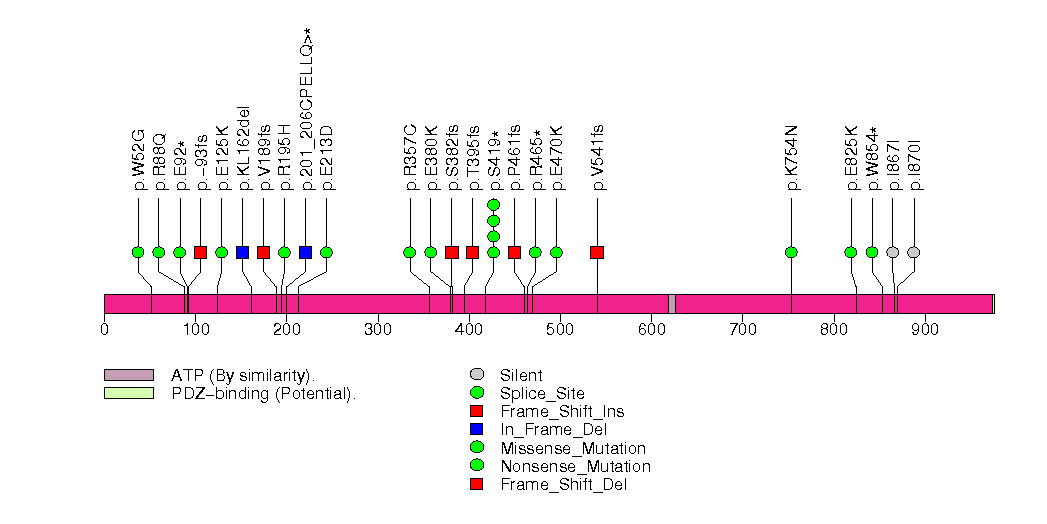
Figure S26. This figure depicts the distribution of mutations and mutation types across the PTEN significant gene.
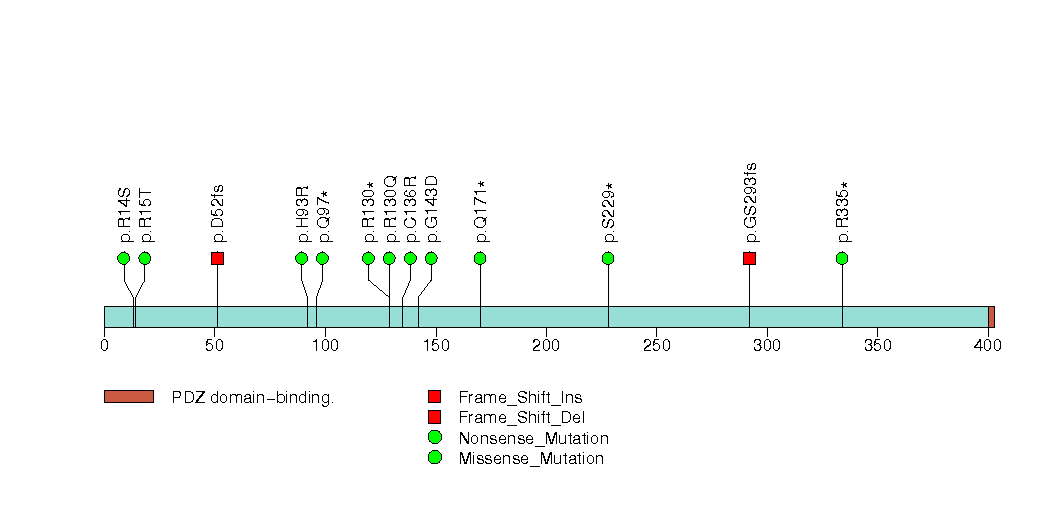
Figure S27. This figure depicts the distribution of mutations and mutation types across the DPPA2 significant gene.
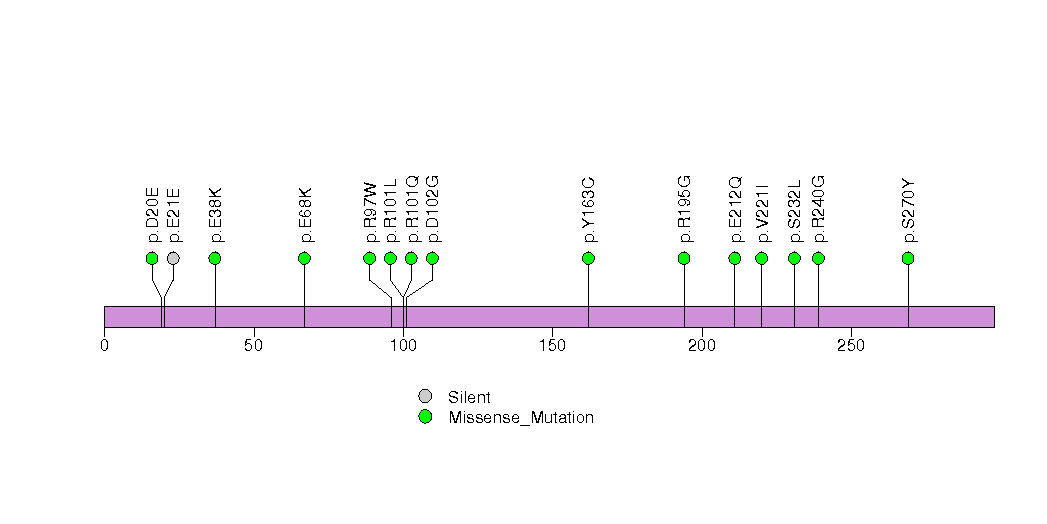
Figure S28. This figure depicts the distribution of mutations and mutation types across the RHOA significant gene.
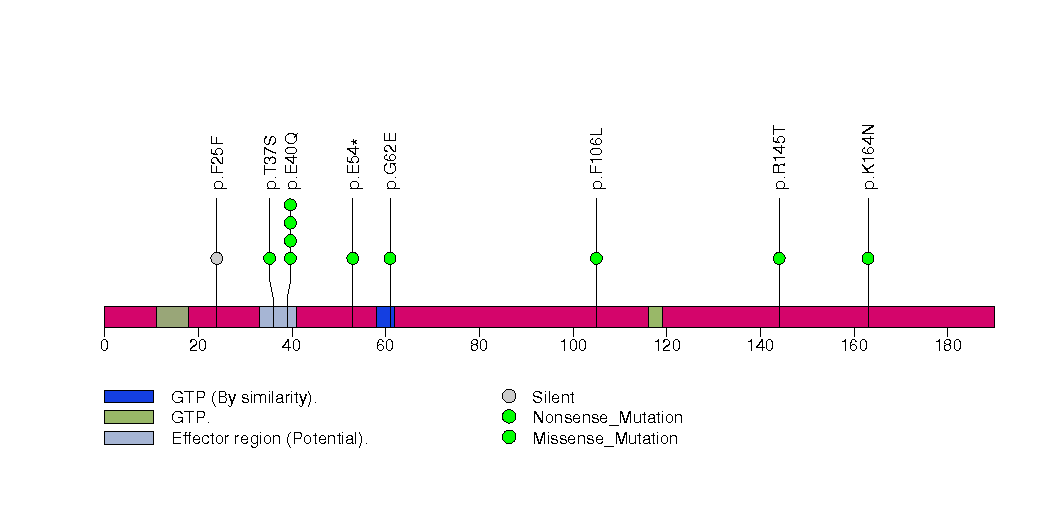
Figure S29. This figure depicts the distribution of mutations and mutation types across the AGTR1 significant gene.
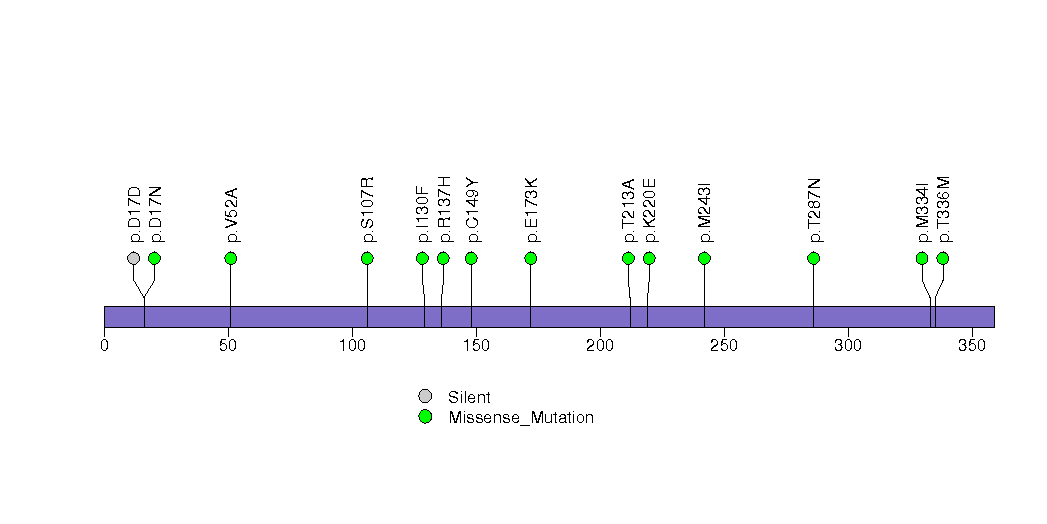
Figure S30. This figure depicts the distribution of mutations and mutation types across the KIR3DL2 significant gene.
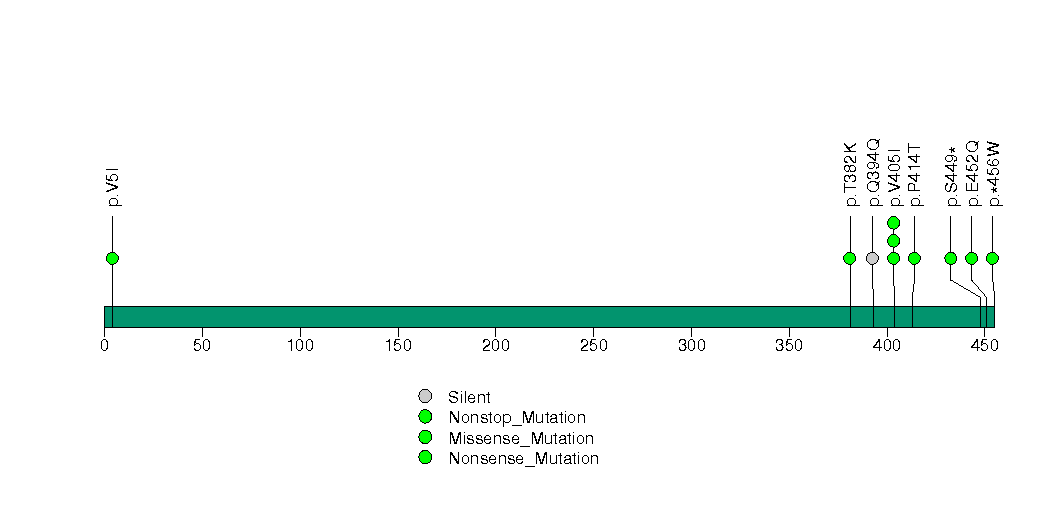
Figure S31. This figure depicts the distribution of mutations and mutation types across the B2M significant gene.
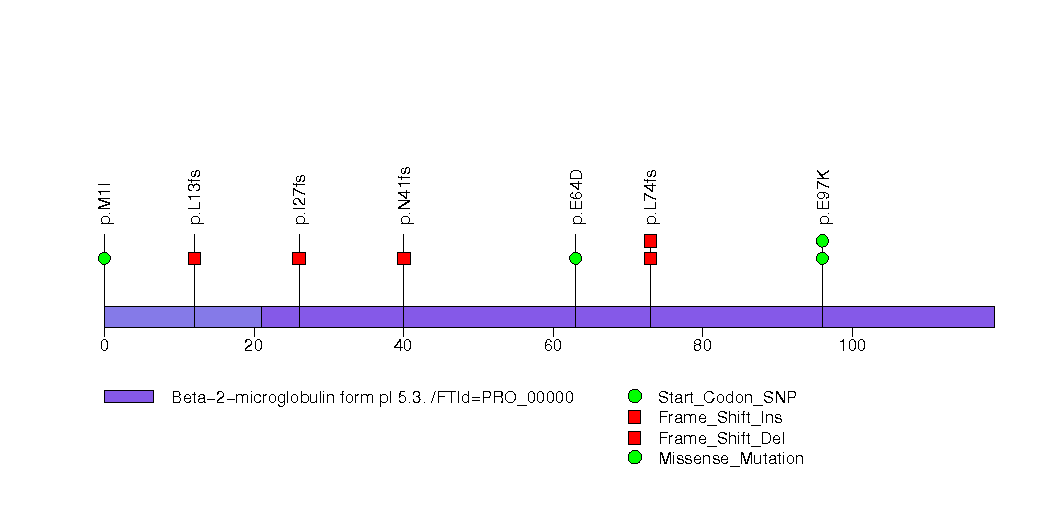
Figure S32. This figure depicts the distribution of mutations and mutation types across the NPFFR2 significant gene.
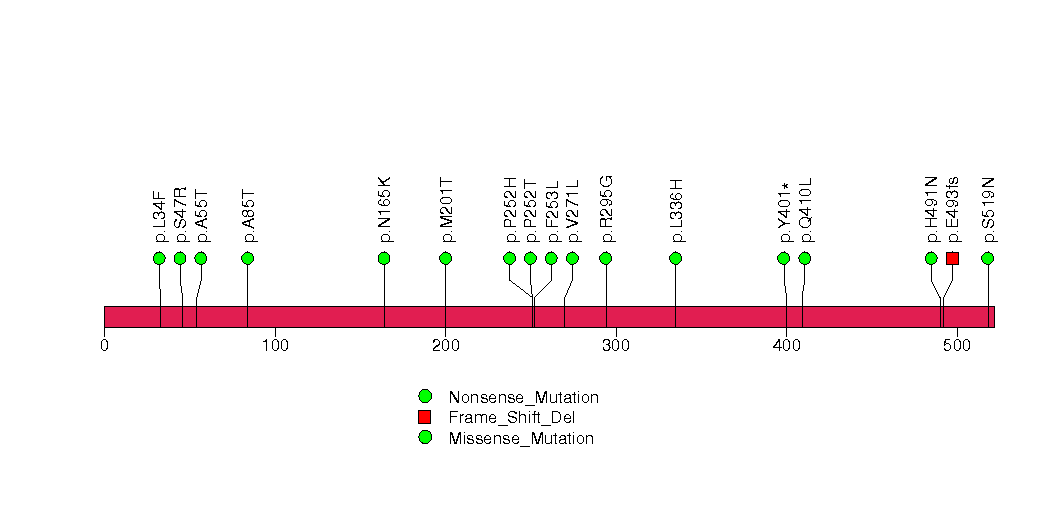
Figure S33. This figure depicts the distribution of mutations and mutation types across the RASA1 significant gene.
In this analysis, COSMIC is used as a filter to increase power by restricting the territory of each gene. Cosmic version: v48.
Table 4. Get Full Table Significantly mutated genes (COSMIC territory only). To access the database please go to: COSMIC. Number of significant genes found: 15. Number of genes displayed: 10
| rank | gene | description | n | cos | n_cos | N_cos | cos_ev | p | q |
|---|---|---|---|---|---|---|---|---|---|
| 1 | HRAS | v-Ha-ras Harvey rat sarcoma viral oncogene homolog | 34 | 19 | 32 | 9709 | 7854 | 0 | 0 |
| 2 | TP53 | tumor protein p53 | 432 | 356 | 398 | 181916 | 75536 | 0 | 0 |
| 3 | PIK3CA | phosphoinositide-3-kinase, catalytic, alpha polypeptide | 97 | 220 | 82 | 112420 | 39060 | 0 | 0 |
| 4 | CDKN2A | cyclin-dependent kinase inhibitor 2A (melanoma, p16, inhibits CDK4) | 114 | 332 | 112 | 169652 | 4733 | 0 | 0 |
| 5 | FBXW7 | F-box and WD repeat domain containing 7 | 34 | 91 | 23 | 46501 | 520 | 0 | 0 |
| 6 | FGFR3 | fibroblast growth factor receptor 3 (achondroplasia, thanatophoric dwarfism) | 13 | 62 | 7 | 31682 | 5409 | 2.8e-10 | 2.1e-07 |
| 7 | PTEN | phosphatase and tensin homolog (mutated in multiple advanced cancers 1) | 14 | 767 | 14 | 391937 | 527 | 1.1e-08 | 6.9e-06 |
| 8 | PIK3R1 | phosphoinositide-3-kinase, regulatory subunit 1 (alpha) | 9 | 33 | 5 | 16863 | 13 | 2.4e-08 | 0.000014 |
| 9 | SMAD4 | SMAD family member 4 | 14 | 159 | 7 | 81249 | 17 | 1.7e-07 | 0.000085 |
| 10 | RB1 | retinoblastoma 1 (including osteosarcoma) | 17 | 267 | 8 | 136437 | 23 | 4e-07 | 0.00018 |
Note:
n - number of (nonsilent) mutations in this gene across the individual set.
cos = number of unique mutated sites in this gene in COSMIC
n_cos = overlap between n and cos.
N_cos = number of individuals times cos.
cos_ev = total evidence: number of reports in COSMIC for mutations seen in this gene.
p = p-value for seeing the observed amount of overlap in this gene)
q = q-value, False Discovery Rate (Benjamini-Hochberg procedure)
Table 5. Get Full Table A Ranked List of Significantly Mutated Genesets. (Source: MSigDB GSEA Cannonical Pathway Set).Number of significant genesets found: 60. Number of genesets displayed: 10
| rank | geneset | description | genes | N_genes | mut_tally | N | n | npat | nsite | nsil | n1 | n2 | n3 | n4 | n5 | n6 | p_ns_s | p | q |
|---|---|---|---|---|---|---|---|---|---|---|---|---|---|---|---|---|---|---|---|
| 1 | HSA04210_APOPTOSIS | Genes involved in apoptosis | AIFM1, AKT1, AKT2, AKT3, APAF1, ATM, BAD, BAX, BCL2, BCL2L1, BID, BIRC2, BIRC3, BIRC4, CAPN1, CAPN2, CASP10, CASP3, CASP6, CASP7, CASP8, CASP9, CFLAR, CHP, CHUK, CSF2RB, CYCS, DFFA, DFFB, ENDOG, FADD, FAS, FASLG, IKBKB, IKBKG, IL1A, IL1B, IL1R1, IL1RAP, IL3, IL3RA, IRAK1, IRAK2, IRAK3, IRAK4, MAP3K14, MYD88, NFKB1, NFKB2, NFKBIA, NGFB, NTRK1, PIK3CA, PIK3CB, PIK3CD, PIK3CG, PIK3R1, PIK3R2, PIK3R3, PIK3R5, PPP3CA, PPP3CB, PPP3CC, PPP3R1, PPP3R2, PRKACA, PRKACB, PRKACG, PRKAR1A, PRKAR1B, PRKAR2A, PRKAR2B, RELA, RIPK1, TNF, TNFRSF10A, TNFRSF10B, TNFRSF10C, TNFRSF10D, TNFRSF1A, TNFSF10, TP53, TRADD, TRAF2 | 80 | AIFM1(1), AKT1(2), AKT2(4), AKT3(6), APAF1(12), ATM(16), BAD(1), BCL2(1), BCL2L1(2), BID(3), BIRC2(3), BIRC3(2), CAPN1(3), CAPN2(5), CASP10(2), CASP3(2), CASP6(5), CASP7(3), CASP8(60), CASP9(1), CFLAR(2), CHUK(6), CSF2RB(7), FADD(3), FAS(5), FASLG(1), IKBKB(11), IL1A(1), IL1B(1), IL1R1(4), IL1RAP(6), IL3(1), IL3RA(5), IRAK1(3), IRAK2(2), IRAK3(9), IRAK4(3), NFKB1(5), NFKB2(5), NFKBIA(1), NTRK1(3), PIK3CA(97), PIK3CB(6), PIK3CD(8), PIK3CG(20), PIK3R1(9), PIK3R2(5), PIK3R3(4), PIK3R5(10), PPP3CA(2), PPP3CB(1), PRKACA(4), PRKACB(3), PRKACG(2), PRKAR1A(4), PRKAR1B(4), PRKAR2B(3), RELA(2), RIPK1(2), TNFRSF10A(3), TNFRSF10B(1), TNFRSF10D(1), TNFRSF1A(2), TNFSF10(1), TP53(432), TRADD(1), TRAF2(2) | 63750063 | 847 | 442 | 552 | 87 | 120 | 166 | 133 | 154 | 262 | 12 | <1.00e-15 | <1.00e-15 | <3.42e-14 |
| 2 | ARFPATHWAY | Cyclin-dependent kinase inhibitor 2A is a tumor suppressor that induces G1 arrest and can activate the p53 pathway, leading to G2/M arrest. | ABL1, CDKN2A, E2F1, MDM2, MYC, PIK3CA, PIK3R1, POLR1A, POLR1B, POLR1C, POLR1D, RAC1, RB1, TBX2, TP53, TWIST1 | 16 | ABL1(8), CDKN2A(114), MDM2(3), MYC(6), PIK3CA(97), PIK3R1(9), POLR1A(9), POLR1B(3), POLR1C(2), RAC1(15), RB1(17), TBX2(4), TP53(432), TWIST1(1) | 15458536 | 720 | 423 | 370 | 24 | 91 | 114 | 88 | 120 | 294 | 13 | <1.00e-15 | <1.00e-15 | <3.42e-14 |
| 3 | HSA04115_P53_SIGNALING_PATHWAY | Genes involved in p53 signaling pathway | APAF1, ATM, ATR, BAI1, BAX, BBC3, BID, CASP3, CASP8, CASP9, CCNB1, CCNB2, CCNB3, CCND1, CCND2, CCND3, CCNE1, CCNE2, CCNG1, CCNG2, CD82, CDC2, CDK2, CDK4, CDK6, CDKN1A, CDKN2A, CHEK1, CHEK2, CYCS, DDB2, EI24, FAS, GADD45A, GADD45B, GADD45G, GTSE1, IGF1, IGFBP3, LRDD, MDM2, MDM4, P53AIP1, PERP, PMAIP1, PPM1D, PTEN, RCHY1, RFWD2, RPRM, RRM2, RRM2B, SCOTIN, SERPINB5, SERPINE1, SESN1, SESN2, SESN3, SFN, SIAH1, STEAP3, THBS1, TNFRSF10B, TP53, TP53I3, TP73, TSC2, ZMAT3 | 65 | APAF1(12), ATM(16), ATR(24), BAI1(8), BID(3), CASP3(2), CASP8(60), CASP9(1), CCNB1(2), CCNB3(11), CCND1(3), CCND2(2), CCNE1(4), CCNE2(4), CCNG1(1), CCNG2(4), CDK4(5), CDK6(1), CDKN2A(114), CHEK1(1), CHEK2(4), DDB2(4), EI24(2), FAS(5), GADD45A(1), GADD45G(1), GTSE1(9), IGF1(1), IGFBP3(1), MDM2(3), MDM4(1), PERP(1), PMAIP1(2), PPM1D(7), PTEN(14), RCHY1(1), RFWD2(2), RRM2(1), RRM2B(1), SERPINB5(1), SERPINE1(7), SESN1(2), SESN2(4), SESN3(4), SFN(7), SIAH1(4), STEAP3(4), THBS1(8), TNFRSF10B(1), TP53(432), TSC2(7), ZMAT3(2) | 49912643 | 822 | 419 | 531 | 66 | 100 | 106 | 120 | 133 | 348 | 15 | <1.00e-15 | <1.00e-15 | <3.42e-14 |
| 4 | ST_FAS_SIGNALING_PATHWAY | The Fas receptor induces apoptosis and NF-kB activation when bound to Fas ligand. | ADPRT, ALG2, BAK1, BAX, BFAR, BIRC4, BTK, CAD, CASP10, CASP3, CASP8, CASP8AP2, CD7, CDK2AP1, CSNK1A1, DAXX, DEDD, DEDD2, DFFA, DIABLO, EGFR, EPHB2, FADD, FAF1, FAIM2, FREQ, HRB, HSPB1, IL1A, IL8, MAP2K4, MAP2K7, MAP3K1, MAP3K5, MAPK1, MAPK10, MAPK8, MAPK8IP1, MAPK8IP2, MAPK8IP3, MAPK9, MCP, MET, NFAT5, NFKB1, NFKB2, NFKBIA, NFKBIB, NFKBIE, NFKBIL1, NFKBIL2, NR0B2, PFN1, PFN2, PTPN13, RALBP1, RIPK1, ROCK1, SMPD1, TNFRSF6, TNFRSF6B, TP53, TPX2, TRAF2, TUFM, VIL2 | 59 | ALG2(2), BAK1(1), BTK(8), CAD(5), CASP10(2), CASP3(2), CASP8(60), CSNK1A1(1), DAXX(6), DEDD(1), DEDD2(5), DIABLO(1), EGFR(19), EPHB2(3), FADD(3), FAF1(2), IL1A(1), MAP2K4(2), MAP2K7(2), MAP3K1(6), MAP3K5(6), MAPK1(9), MAPK10(4), MAPK8(4), MAPK8IP1(4), MAPK8IP2(2), MAPK8IP3(9), MAPK9(4), MET(4), NFAT5(12), NFKB1(5), NFKB2(5), NFKBIA(1), NFKBIB(1), NFKBIE(1), NFKBIL1(1), NR0B2(1), PFN1(1), PFN2(1), PTPN13(12), RALBP1(3), RIPK1(2), ROCK1(19), TNFRSF6B(4), TP53(432), TPX2(5), TRAF2(2) | 55608973 | 686 | 419 | 448 | 68 | 109 | 98 | 121 | 102 | 243 | 13 | <1.00e-15 | <1.00e-15 | <3.42e-14 |
| 5 | G1_TO_S_CELL_CYCLE_REACTOME | ATM, CCNA1, CCNB1, CCND1, CCND2, CCND3, CCNE1, CCNE2, CCNG2, CCNH, CDC25A, CDC45L, CDK2, CDK4, CDK7, CDKN1A, CDKN1B, CDKN1C, CDKN2A, CDKN2B, CDKN2C, CDKN2D, CREB3, CREB3L1, CREB3L3, CREB3L4, CREBL1, CREBL1, TNXB, E2F1, E2F2, E2F3, E2F4, E2F5, E2F6, FLJ14001, GADD45A, GBA2, MCM2, MCM3, MCM4, MCM5, MCM6, MCM7, MDM2, MNAT1, MYC, MYT1, NACA, NACA, FKSG17, ORC1L, ORC2L, ORC3L, ORC4L, ORC5L, ORC6L, PCNA, POLA2, POLE, POLE2, PRIM1, PRIM2A, RB1, RBL1, RPA1, RPA2, RPA3, TFDP1, TFDP2, TP53, WEE1 | 64 | ATM(16), CCNA1(7), CCNB1(2), CCND1(3), CCND2(2), CCNE1(4), CCNE2(4), CCNG2(4), CDC25A(3), CDK4(5), CDKN1B(2), CDKN2A(114), CDKN2C(1), CDKN2D(1), CREB3L1(4), CREB3L3(9), CREB3L4(2), E2F2(3), E2F3(3), E2F4(3), E2F5(6), E2F6(1), GADD45A(1), GBA2(6), MCM2(5), MCM3(4), MCM4(7), MCM5(2), MCM6(4), MCM7(8), MDM2(3), MNAT1(1), MYC(6), MYT1(11), NACA(24), PCNA(1), POLA2(2), POLE(11), PRIM1(3), RB1(17), RBL1(12), RPA1(5), RPA2(1), TFDP1(2), TFDP2(1), TNXB(25), TP53(432), WEE1(2) | 58898340 | 795 | 418 | 513 | 78 | 106 | 110 | 136 | 114 | 315 | 14 | <1.00e-15 | <1.00e-15 | <3.42e-14 | |
| 6 | G1PATHWAY | CDK4/6-cyclin D and CDK2-cyclin E phosphorylate Rb, which allows the transcription of genes needed for the G1/S cell cycle transition. | ABL1, ATM, ATR, CCNA1, CCND1, CCNE1, CDC2, CDC25A, CDK2, CDK4, CDK6, CDKN1A, CDKN1B, CDKN2A, CDKN2B, DHFR, E2F1, GSK3B, HDAC1, MADH3, MADH4, RB1, SKP2, TFDP1, TGFB1, TGFB2, TGFB3, TP53 | 25 | ABL1(8), ATM(16), ATR(24), CCNA1(7), CCND1(3), CCNE1(4), CDC25A(3), CDK4(5), CDK6(1), CDKN1B(2), CDKN2A(114), DHFR(2), GSK3B(3), HDAC1(1), RB1(17), SKP2(4), TFDP1(2), TGFB1(1), TGFB2(4), TGFB3(1), TP53(432) | 22993891 | 654 | 398 | 374 | 32 | 85 | 68 | 93 | 99 | 296 | 13 | <1.00e-15 | <1.00e-15 | <3.42e-14 |
| 7 | G2PATHWAY | Activated Cdc2-cyclin B kinase regulates the G2/M transition; DNA damage stimulates the DNA-PK/ATM/ATR kinases, which inactivate Cdc2. | ATM, ATR, BRCA1, CCNB1, CDC2, CDC25A, CDC25B, CDC25C, CDC34, CDKN1A, CDKN2D, CHEK1, CHEK2, EP300, GADD45A, MDM2, MYT1, PLK, PRKDC, RPS6KA1, TP53, WEE1, YWHAH, YWHAQ | 22 | ATM(16), ATR(24), BRCA1(12), CCNB1(2), CDC25A(3), CDC25B(4), CDC25C(4), CDC34(4), CDKN2D(1), CHEK1(1), CHEK2(4), EP300(38), GADD45A(1), MDM2(3), MYT1(11), PRKDC(28), RPS6KA1(10), TP53(432), WEE1(2), YWHAH(2), YWHAQ(3) | 31973159 | 605 | 398 | 379 | 37 | 94 | 84 | 105 | 104 | 208 | 10 | <1.00e-15 | <1.00e-15 | <3.42e-14 |
| 8 | ATRBRCAPATHWAY | BRCA1 and 2 block cell cycle progression in response to DNA damage and promote double-stranded break repair; mutations induce breast cancer susceptibility. | ATM, ATR, BRCA1, BRCA2, CHEK1, CHEK2, FANCA, FANCC, FANCD2, FANCE, FANCF, FANCG, HUS1, MRE11A, NBS1, RAD1, RAD17, RAD50, RAD51, RAD9A, TP53, TREX1 | 21 | ATM(16), ATR(24), BRCA1(12), BRCA2(17), CHEK1(1), CHEK2(4), FANCA(7), FANCC(3), FANCD2(9), FANCF(2), FANCG(2), HUS1(2), MRE11A(3), RAD17(7), RAD50(10), RAD51(1), RAD9A(2), TP53(432), TREX1(4) | 33566948 | 558 | 393 | 339 | 36 | 80 | 83 | 92 | 96 | 197 | 10 | <1.00e-15 | <1.00e-15 | <3.42e-14 |
| 9 | ST_JNK_MAPK_PATHWAY | JNKs are MAP kinases regulated by several levels of kinases (MAPKK, MAPKKK) and phosphorylate transcription factors and regulatory proteins. | AKT1, ATF2, CDC42, DLD, DUSP10, DUSP4, DUSP8, GAB1, GADD45A, GCK, IL1R1, JUN, MAP2K4, MAP2K5, MAP2K7, MAP3K1, MAP3K10, MAP3K11, MAP3K12, MAP3K13, MAP3K2, MAP3K3, MAP3K4, MAP3K5, MAP3K7, MAP3K7IP1, MAP3K7IP2, MAP3K9, MAPK10, MAPK7, MAPK8, MAPK9, MYEF2, NFATC3, NR2C2, PAPPA, SHC1, TP53, TRAF6, ZAK | 38 | AKT1(2), ATF2(1), CDC42(3), DLD(1), DUSP10(3), DUSP4(1), DUSP8(1), GAB1(5), GADD45A(1), GCK(4), IL1R1(4), JUN(1), MAP2K4(2), MAP2K5(3), MAP2K7(2), MAP3K1(6), MAP3K10(5), MAP3K11(2), MAP3K12(8), MAP3K13(15), MAP3K2(2), MAP3K3(2), MAP3K4(14), MAP3K5(6), MAP3K7(8), MAP3K9(9), MAPK10(4), MAPK7(6), MAPK8(4), MAPK9(4), MYEF2(8), NFATC3(5), NR2C2(1), PAPPA(13), SHC1(2), TP53(432), TRAF6(3), ZAK(5) | 38482261 | 598 | 393 | 376 | 50 | 95 | 82 | 117 | 94 | 200 | 10 | <1.00e-15 | <1.00e-15 | <3.42e-14 |
| 10 | TIDPATHWAY | On ligand binding, interferon gamma receptors stimulate JAK2 kinase to phosphorylate STAT transcription factors, which promote expression of interferon responsive genes. | DNAJA3, HSPA1A, IFNG, IFNGR1, IFNGR2, IKBKB, JAK2, LIN7A, NFKB1, NFKBIA, RB1, RELA, TIP-1, TNF, TNFRSF1A, TNFRSF1B, TP53, USH1C, WT1 | 18 | DNAJA3(3), IFNG(2), IFNGR1(4), IFNGR2(4), IKBKB(11), JAK2(5), LIN7A(4), NFKB1(5), NFKBIA(1), RB1(17), RELA(2), TNFRSF1A(2), TNFRSF1B(2), TP53(432), USH1C(3), WT1(3) | 13883618 | 500 | 388 | 280 | 29 | 77 | 56 | 82 | 77 | 198 | 10 | <1.00e-15 | <1.00e-15 | <3.42e-14 |
Table 6. Get Full Table A Ranked List of Significantly Mutated Genesets (Excluding Significantly Mutated Genes). Number of significant genesets found: 0. Number of genesets displayed: 10
| rank | geneset | description | genes | N_genes | mut_tally | N | n | npat | nsite | nsil | n1 | n2 | n3 | n4 | n5 | n6 | p_ns_s | p | q |
|---|---|---|---|---|---|---|---|---|---|---|---|---|---|---|---|---|---|---|---|
| 1 | HSA00627_1,4_DICHLOROBENZENE_DEGRADATION | Genes involved in 1,4-dichlorobenzene degradation | CMBL | 1 | CMBL(2) | 387333 | 2 | 2 | 2 | 0 | 0 | 0 | 0 | 0 | 2 | 0 | 0.66 | 0.29 | 1 |
| 2 | SULFUR_METABOLISM | BPNT1, PAPSS1, PAPSS2, SULT1A2, SULT1A3, SULT1A3, SULT1A4, SULT1E1, SULT2A1, SUOX | 7 | BPNT1(2), PAPSS1(6), PAPSS2(6), SULT1A2(2), SULT1E1(5), SULT2A1(2), SUOX(2) | 4654771 | 25 | 23 | 25 | 2 | 5 | 7 | 5 | 5 | 3 | 0 | 0.027 | 0.36 | 1 | |
| 3 | HSA00550_PEPTIDOGLYCAN_BIOSYNTHESIS | Genes involved in peptidoglycan biosynthesis | GLUL, PGLYRP2 | 2 | GLUL(3), PGLYRP2(6) | 1385935 | 9 | 9 | 9 | 2 | 1 | 3 | 2 | 2 | 1 | 0 | 0.35 | 0.6 | 1 |
| 4 | HSA00031_INOSITOL_METABOLISM | Genes involved in inositol metabolism | ALDH6A1, TPI1 | 2 | ALDH6A1(2), TPI1(4) | 1259018 | 6 | 6 | 6 | 2 | 1 | 3 | 2 | 0 | 0 | 0 | 0.65 | 0.69 | 1 |
| 5 | FBW7PATHWAY | Cyclin E interacts with cell cycle checkpoint kinase cdk2 to allow transcription of genes required for S phase, including transcription of additional cyclin E. | CCNE1, CDC34, CDK2, CUL1, E2F1, FBXW7, RB1, SKP1A, TFDP1 | 7 | CCNE1(4), CDC34(4), CUL1(11), RB1(17), TFDP1(2) | 5002135 | 38 | 33 | 38 | 8 | 3 | 11 | 5 | 3 | 16 | 0 | 0.11 | 0.7 | 1 |
| 6 | SA_G2_AND_M_PHASES | Cdc25 activates the cdc2/cyclin B complex to induce the G2/M transition. | CDC2, CDC25A, CDC25B, CDK7, CDKN1A, CHEK1, NEK1, WEE1 | 7 | CDC25A(3), CDC25B(4), CHEK1(1), NEK1(9), WEE1(2) | 5234638 | 19 | 19 | 19 | 1 | 4 | 4 | 6 | 1 | 4 | 0 | 0.092 | 0.73 | 1 |
| 7 | RABPATHWAY | Rab family GTPases regulate vesicle transport, endocytosis and exocytosis, and vesicle docking via interactions with the rabphilins. | ACTA1, MEL, RAB11A, RAB1A, RAB2, RAB27A, RAB3A, RAB4A, RAB5A, RAB6A, RAB7, RAB9A | 9 | ACTA1(4), RAB11A(1), RAB1A(2), RAB3A(2), RAB4A(1), RAB5A(3) | 3216067 | 13 | 13 | 13 | 1 | 5 | 4 | 2 | 1 | 1 | 0 | 0.041 | 0.74 | 1 |
| 8 | HSA00902_MONOTERPENOID_BIOSYNTHESIS | Genes involved in monoterpenoid biosynthesis | CYP2C19, CYP2C9 | 2 | CYP2C19(6), CYP2C9(6) | 1540877 | 12 | 12 | 12 | 3 | 0 | 4 | 5 | 2 | 1 | 0 | 0.41 | 0.76 | 1 |
| 9 | NUCLEOTIDE_SUGARS_METABOLISM | GALE, GALT, TGDS, UGDH, UXS1 | 5 | GALT(2), TGDS(3), UGDH(3), UXS1(2) | 2930825 | 10 | 10 | 10 | 0 | 0 | 1 | 5 | 3 | 1 | 0 | 0.13 | 0.78 | 1 | |
| 10 | BBCELLPATHWAY | Fas ligand expression by T cells induces apoptosis in Fas-expressing, inactive B cells. | CD28, CD4, HLA-DRA, HLA-DRB1, TNFRSF5, TNFRSF6, TNFSF5, TNFSF6 | 4 | CD28(3), CD4(1), HLA-DRA(1), HLA-DRB1(2) | 1803977 | 7 | 7 | 6 | 2 | 0 | 1 | 0 | 3 | 3 | 0 | 0.75 | 0.79 | 1 |
In brief, we tabulate the number of mutations and the number of covered bases for each gene. The counts are broken down by mutation context category: four context categories that are discovered by MutSig, and one for indel and 'null' mutations, which include indels, nonsense mutations, splice-site mutations, and non-stop (read-through) mutations. For each gene, we calculate the probability of seeing the observed constellation of mutations, i.e. the product P1 x P2 x ... x Pm, or a more extreme one, given the background mutation rates calculated across the dataset. [1]
In addition to the links below, the full results of the analysis summarized in this report can also be downloaded programmatically using firehose_get, or interactively from either the Broad GDAC website or TCGA Data Coordination Center Portal.