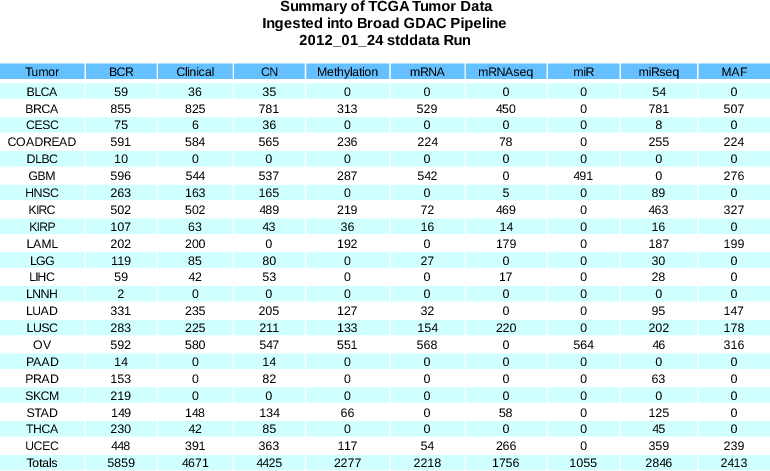
Tables of Ingested Data: HTML PNG TSV
| Tumor Type | # Datasets | % Processed | Summary |
|---|---|---|---|
| LUSC | 23 | 100% | Report |
| OV | 22 | 100% | Report |
| GBM | 20 | 100% | Report |
| UCEC | 14 | 100% | Report |
| KIRC | 14 | 100% | Report |
| BRCA | 14 | 100% | Report |
| STAD | 12 | 100% | Report |
| KIRP | 12 | 100% | Report |
| COADREAD | 12 | 100% | Report |
| LUAD | 11 | 100% | Report |
| HNSC | 11 | 100% | Report |
| LIHC | 9 | 100% | Report |
| LGG | 8 | 100% | Report |
| LAML | 7 | 100% | Report |
| THCA | 6 | 100% | Report |
| CESC | 6 | 100% | Report |
| BLCA | 6 | 100% | Report |
| PRAD | 5 | 100% | Report |
| PAAD | 3 | 100% | Report |
| SKCM | 1 | 100% | Report |
| LNNH | 1 | 100% | Report |
| DLBC | 1 | 100% | Report |