This pipeline computes the correlation between significant copy number variation (cnv focal) genes and molecular subtypes.
Testing the association between copy number variation 110 focal events and 3 molecular subtypes across 100 patients, 97 significant findings detected with P value < 0.05 and Q value < 0.25.
-
amp_1p36.33 cnv correlated to 'METHYLATION_CNMF' and 'METHYLATION_CHIERARCHICAL'.
-
amp_1q22 cnv correlated to 'METHYLATION_CNMF' and 'METHYLATION_CHIERARCHICAL'.
-
amp_1q32.2 cnv correlated to 'METHYLATION_CNMF'.
-
amp_2p23.3 cnv correlated to 'METHYLATION_CNMF' and 'METHYLATION_CHIERARCHICAL'.
-
amp_2q11.1 cnv correlated to 'METHYLATION_CNMF'.
-
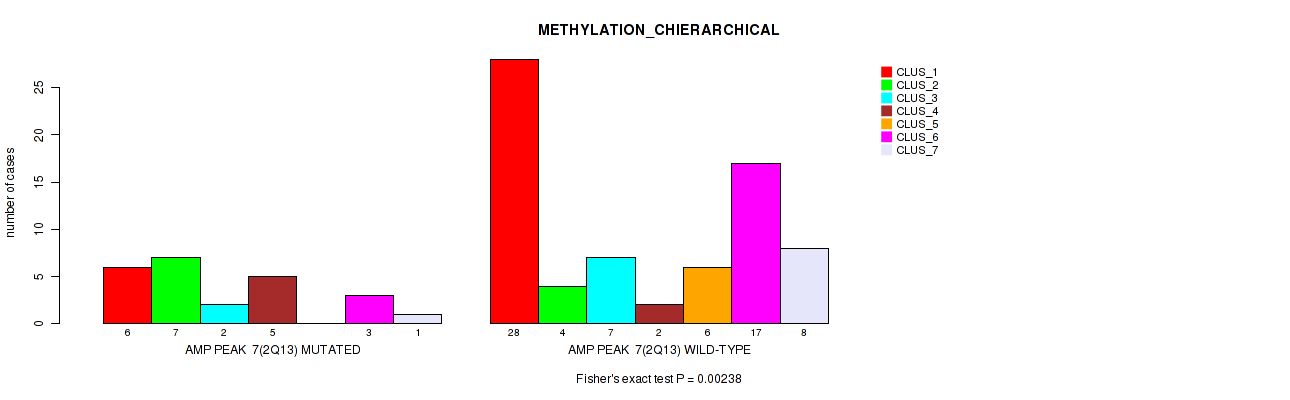
amp_2q13 cnv correlated to 'METHYLATION_CNMF' and 'METHYLATION_CHIERARCHICAL'.
-
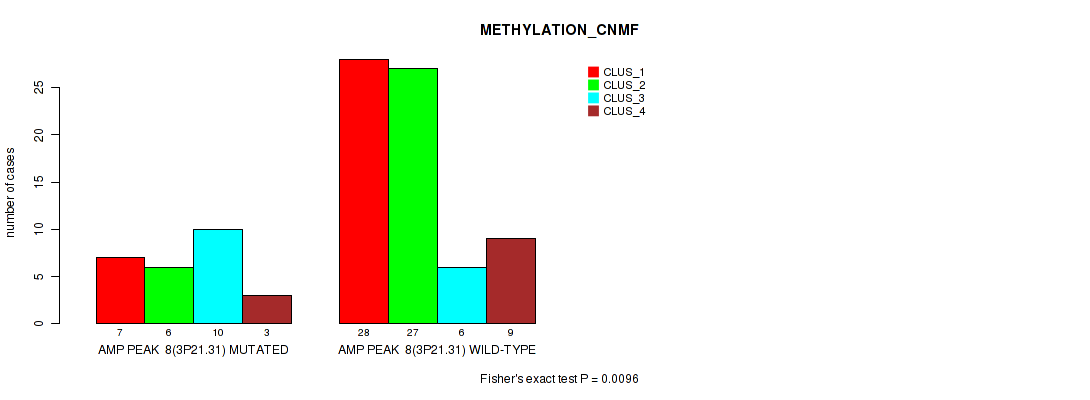
amp_3p21.31 cnv correlated to 'METHYLATION_CNMF'.
-
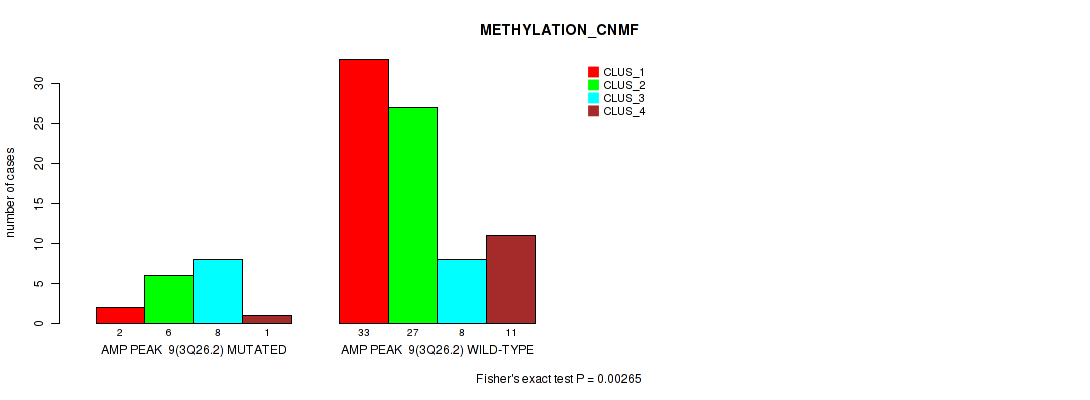
amp_3q26.2 cnv correlated to 'METHYLATION_CNMF' and 'METHYLATION_CHIERARCHICAL'.
-
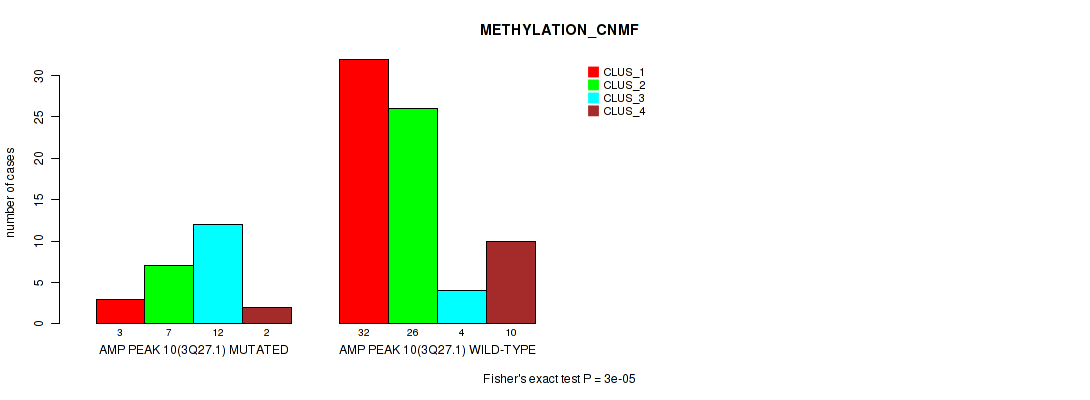
amp_3q27.1 cnv correlated to 'METHYLATION_CNMF' and 'METHYLATION_CHIERARCHICAL'.
-
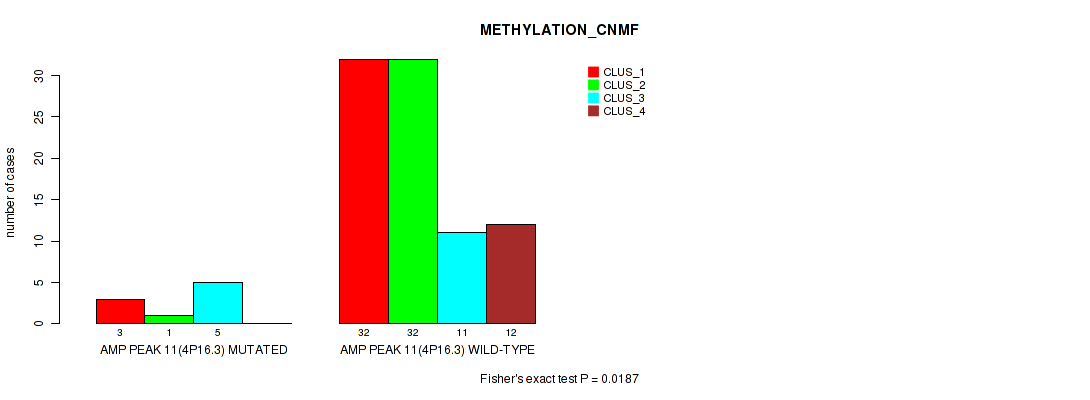
amp_4p16.3 cnv correlated to 'METHYLATION_CNMF'.
-
amp_5q35.2 cnv correlated to 'METHYLATION_CNMF'.
-
amp_7p13 cnv correlated to 'METHYLATION_CNMF'.
-
amp_8q22.3 cnv correlated to 'MRNA_CHIERARCHICAL'.
-
amp_9q34.3 cnv correlated to 'METHYLATION_CNMF'.
-
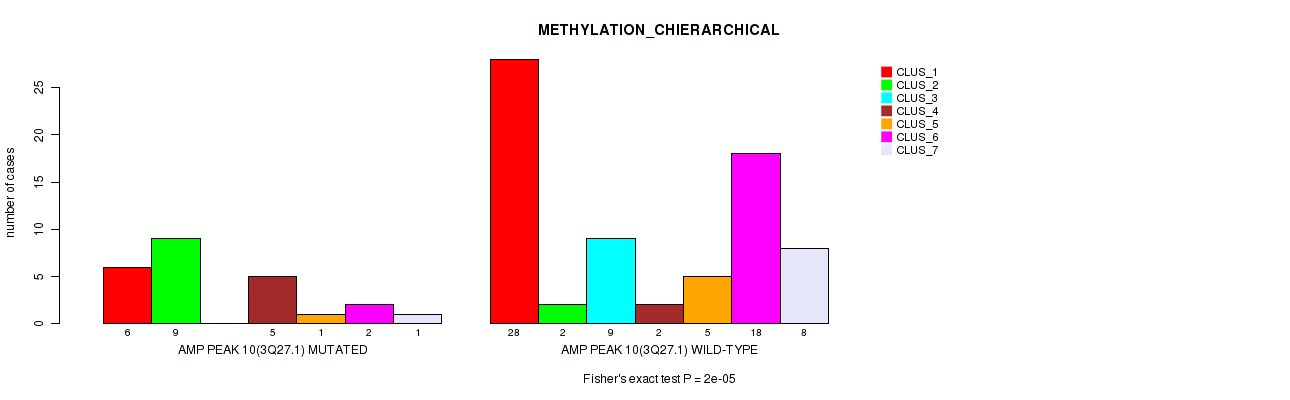
amp_10q26.13 cnv correlated to 'METHYLATION_CNMF' and 'METHYLATION_CHIERARCHICAL'.
-
amp_11p11.2 cnv correlated to 'METHYLATION_CNMF' and 'METHYLATION_CHIERARCHICAL'.
-
amp_11q13.2 cnv correlated to 'METHYLATION_CNMF'.
-
amp_11q13.3 cnv correlated to 'METHYLATION_CNMF' and 'METHYLATION_CHIERARCHICAL'.
-
amp_12p13.33 cnv correlated to 'METHYLATION_CHIERARCHICAL'.
-
amp_12q13.2 cnv correlated to 'METHYLATION_CNMF' and 'METHYLATION_CHIERARCHICAL'.
-
amp_13q12.11 cnv correlated to 'METHYLATION_CHIERARCHICAL'.
-
amp_14q24.2 cnv correlated to 'METHYLATION_CNMF' and 'METHYLATION_CHIERARCHICAL'.
-
amp_17q12 cnv correlated to 'METHYLATION_CNMF' and 'METHYLATION_CHIERARCHICAL'.
-
amp_17q24.1 cnv correlated to 'METHYLATION_CNMF'.
-
amp_19p13.2 cnv correlated to 'METHYLATION_CNMF' and 'METHYLATION_CHIERARCHICAL'.
-
amp_19p13.11 cnv correlated to 'METHYLATION_CNMF' and 'METHYLATION_CHIERARCHICAL'.
-
amp_19q12 cnv correlated to 'METHYLATION_CNMF' and 'METHYLATION_CHIERARCHICAL'.
-
amp_19q13.2 cnv correlated to 'METHYLATION_CNMF' and 'METHYLATION_CHIERARCHICAL'.
-
amp_20q13.33 cnv correlated to 'METHYLATION_CNMF' and 'METHYLATION_CHIERARCHICAL'.
-
del_1p36.12 cnv correlated to 'METHYLATION_CNMF'.
-
del_1p13.2 cnv correlated to 'METHYLATION_CNMF' and 'METHYLATION_CHIERARCHICAL'.
-
del_3p26.3 cnv correlated to 'METHYLATION_CNMF'.
-
del_3p21.1 cnv correlated to 'METHYLATION_CNMF' and 'METHYLATION_CHIERARCHICAL'.
-
del_4p15.31 cnv correlated to 'METHYLATION_CNMF'.
-
del_4q21.21 cnv correlated to 'METHYLATION_CHIERARCHICAL'.
-
del_5q23.1 cnv correlated to 'METHYLATION_CNMF' and 'METHYLATION_CHIERARCHICAL'.
-
del_6q22.31 cnv correlated to 'METHYLATION_CNMF' and 'METHYLATION_CHIERARCHICAL'.
-
del_8p23.2 cnv correlated to 'METHYLATION_CNMF' and 'METHYLATION_CHIERARCHICAL'.
-
del_9p24.3 cnv correlated to 'METHYLATION_CHIERARCHICAL'.
-
del_9p24.1 cnv correlated to 'METHYLATION_CNMF' and 'METHYLATION_CHIERARCHICAL'.
-
del_10q11.22 cnv correlated to 'METHYLATION_CNMF'.
-
del_11p15.5 cnv correlated to 'METHYLATION_CNMF' and 'METHYLATION_CHIERARCHICAL'.
-
del_11p15.3 cnv correlated to 'METHYLATION_CNMF' and 'METHYLATION_CHIERARCHICAL'.
-
del_11q24.2 cnv correlated to 'METHYLATION_CNMF' and 'METHYLATION_CHIERARCHICAL'.
-
del_12p13.33 cnv correlated to 'METHYLATION_CNMF'.
-
del_13q12.11 cnv correlated to 'MRNA_CHIERARCHICAL' and 'METHYLATION_CNMF'.
-
del_13q31.3 cnv correlated to 'METHYLATION_CNMF'.
-
del_15q11.2 cnv correlated to 'METHYLATION_CNMF'.
-
del_15q15.1 cnv correlated to 'MRNA_CHIERARCHICAL'.
-
del_15q24.2 cnv correlated to 'METHYLATION_CNMF' and 'METHYLATION_CHIERARCHICAL'.
-
del_16p13.3 cnv correlated to 'METHYLATION_CHIERARCHICAL'.
-
del_16p11.2 cnv correlated to 'METHYLATION_CNMF' and 'METHYLATION_CHIERARCHICAL'.
-
del_16q22.1 cnv correlated to 'METHYLATION_CNMF' and 'METHYLATION_CHIERARCHICAL'.
-
del_16q22.2 cnv correlated to 'METHYLATION_CNMF'.
-
del_17p11.2 cnv correlated to 'METHYLATION_CNMF' and 'METHYLATION_CHIERARCHICAL'.
-
del_17q21.32 cnv correlated to 'METHYLATION_CNMF'.
-
del_18q22.1 cnv correlated to 'METHYLATION_CHIERARCHICAL'.
-
del_19p13.3 cnv correlated to 'METHYLATION_CNMF' and 'METHYLATION_CHIERARCHICAL'.
-
del_19q13.33 cnv correlated to 'METHYLATION_CNMF'.
-
del_xp11.23 cnv correlated to 'METHYLATION_CHIERARCHICAL'.
-
del_xp11.23 cnv correlated to 'METHYLATION_CNMF' and 'METHYLATION_CHIERARCHICAL'.
-
del_xp11.22 cnv correlated to 'METHYLATION_CNMF'.
-
del_xq24 cnv correlated to 'METHYLATION_CNMF'.
-
del_xq27.3 cnv correlated to 'METHYLATION_CNMF'.
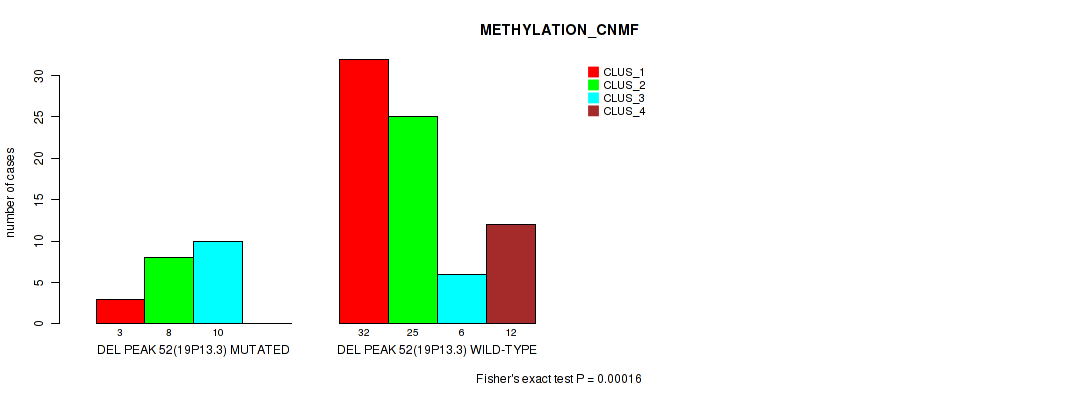
Table 1. Get Full Table Overview of the association between significant copy number variation of 110 focal events and 3 molecular subtypes. Shown in the table are P values (Q values). Thresholded by P value < 0.05 and Q value < 0.25, 97 significant findings detected.
|
Clinical Features |
MRNA CHIERARCHICAL |
METHYLATION CNMF |
METHYLATION CHIERARCHICAL |
||
| nCNV (%) | nWild-Type | Fisher's exact test | Fisher's exact test | Fisher's exact test | |
| amp 1p36 33 | 24 (24%) | 76 |
0.29 (0.469) |
0.0203 (0.0985) |
0.0113 (0.0621) |
| amp 1q22 | 42 (42%) | 58 |
0.156 (0.329) |
1e-05 (0.00165) |
5e-05 (0.00236) |
| amp 2p23 3 | 27 (27%) | 73 |
0.769 (0.852) |
0.00447 (0.0321) |
0.00367 (0.0288) |
| amp 2q13 | 27 (27%) | 73 |
0.807 (0.873) |
0.00288 (0.0264) |
0.00238 (0.0264) |
| amp 3q26 2 | 20 (20%) | 80 |
0.132 (0.307) |
0.00265 (0.0264) |
0.00013 (0.00536) |
| amp 3q27 1 | 27 (27%) | 73 |
0.371 (0.556) |
3e-05 (0.0022) |
2e-05 (0.0022) |
| amp 10q26 13 | 34 (34%) | 66 |
0.486 (0.638) |
0.0329 (0.128) |
0.0453 (0.16) |
| amp 11p11 2 | 15 (15%) | 85 |
0.874 (0.92) |
0.00526 (0.0362) |
0.00335 (0.0278) |
| amp 11q13 3 | 19 (19%) | 81 |
0.646 (0.764) |
0.00019 (0.00627) |
0.00447 (0.0321) |
| amp 12q13 2 | 24 (24%) | 76 |
0.0708 (0.215) |
0.0275 (0.118) |
0.00587 (0.0395) |
| amp 14q24 2 | 15 (15%) | 85 |
0.429 (0.593) |
0.00034 (0.00935) |
0.00738 (0.046) |
| amp 17q12 | 21 (21%) | 79 |
0.1 (0.267) |
4e-05 (0.0022) |
0.00267 (0.0264) |
| amp 19p13 2 | 20 (20%) | 80 |
0.6 (0.731) |
0.00281 (0.0264) |
0.00615 (0.0406) |
| amp 19p13 11 | 22 (22%) | 78 |
0.236 (0.416) |
0.03 (0.122) |
0.0443 (0.159) |
| amp 19q12 | 18 (18%) | 82 |
0.604 (0.733) |
0.0257 (0.113) |
0.00384 (0.0293) |
| amp 19q13 2 | 18 (18%) | 82 |
0.962 (0.977) |
0.013 (0.0692) |
0.00346 (0.0278) |
| amp 20q13 33 | 28 (28%) | 72 |
0.473 (0.632) |
0.00061 (0.0144) |
0.00166 (0.0211) |
| del 1p13 2 | 12 (12%) | 88 |
0.329 (0.512) |
0.00066 (0.0145) |
0.00205 (0.0251) |
| del 3p21 1 | 13 (13%) | 87 |
0.867 (0.92) |
0.0244 (0.11) |
0.0289 (0.122) |
| del 5q23 1 | 13 (13%) | 87 |
0.0847 (0.237) |
0.00146 (0.0201) |
0.0469 (0.161) |
| del 6q22 31 | 9 (9%) | 91 |
0.128 (0.305) |
4e-05 (0.0022) |
0.00707 (0.0454) |
| del 8p23 2 | 11 (11%) | 89 |
0.136 (0.313) |
0.00045 (0.0114) |
0.00021 (0.0063) |
| del 9p24 1 | 11 (11%) | 89 |
0.138 (0.313) |
0.00099 (0.0156) |
0.00091 (0.015) |
| del 11p15 5 | 11 (11%) | 89 |
0.633 (0.752) |
1e-05 (0.00165) |
0.00075 (0.0145) |
| del 11p15 3 | 15 (15%) | 85 |
0.536 (0.691) |
0.0138 (0.0725) |
0.00251 (0.0264) |
| del 11q24 2 | 14 (14%) | 86 |
1 (1.00) |
0.00716 (0.0454) |
0.00084 (0.0146) |
| del 13q12 11 | 14 (14%) | 86 |
0.0268 (0.116) |
0.0324 (0.128) |
0.38 (0.562) |
| del 15q24 2 | 28 (28%) | 72 |
0.18 (0.357) |
0.0296 (0.122) |
0.0298 (0.122) |
| del 16p11 2 | 21 (21%) | 79 |
0.249 (0.428) |
0.00391 (0.0293) |
0.0219 (0.105) |
| del 16q22 1 | 11 (11%) | 89 |
0.466 (0.627) |
0.00335 (0.0278) |
0.0463 (0.161) |
| del 17p11 2 | 17 (17%) | 83 |
0.283 (0.465) |
0.00079 (0.0145) |
0.00077 (0.0145) |
| del 19p13 3 | 23 (23%) | 77 |
0.759 (0.851) |
0.00016 (0.00587) |
0.00152 (0.0201) |
| del xp11 23 | 36 (36%) | 64 |
0.761 (0.851) |
0.039 (0.146) |
0.00966 (0.0559) |
| amp 1q32 2 | 39 (39%) | 61 |
0.104 (0.271) |
0.00143 (0.0201) |
0.357 (0.545) |
| amp 2q11 1 | 48 (48%) | 52 |
0.583 (0.715) |
0.0342 (0.131) |
0.11 (0.282) |
| amp 3p21 31 | 27 (27%) | 73 |
0.437 (0.596) |
0.0096 (0.0559) |
0.0885 (0.245) |
| amp 4p16 3 | 10 (10%) | 90 |
0.424 (0.59) |
0.0187 (0.092) |
0.186 (0.365) |
| amp 5q35 2 | 10 (10%) | 90 |
0.538 (0.691) |
0.0156 (0.0794) |
0.14 (0.313) |
| amp 7p13 | 29 (29%) | 71 |
0.401 (0.576) |
0.00315 (0.0278) |
0.0971 (0.263) |
| amp 8q22 3 | 27 (27%) | 73 |
0.00773 (0.0472) |
0.314 (0.495) |
0.654 (0.768) |
| amp 9q34 3 | 13 (13%) | 87 |
0.404 (0.576) |
0.0255 (0.113) |
0.495 (0.648) |
| amp 11q13 2 | 22 (22%) | 78 |
0.92 (0.954) |
0.00982 (0.0559) |
0.0548 (0.185) |
| amp 12p13 33 | 37 (37%) | 63 |
0.664 (0.773) |
0.236 (0.416) |
0.0436 (0.159) |
| amp 13q12 11 | 14 (14%) | 86 |
0.168 (0.341) |
0.335 (0.517) |
0.00113 (0.0169) |
| amp 17q24 1 | 18 (18%) | 82 |
0.176 (0.353) |
0.0376 (0.143) |
0.172 (0.345) |
| del 1p36 12 | 16 (16%) | 84 |
0.732 (0.827) |
0.00921 (0.0553) |
0.0771 (0.224) |
| del 3p26 3 | 15 (15%) | 85 |
0.404 (0.576) |
0.0222 (0.105) |
0.071 (0.215) |
| del 4p15 31 | 13 (13%) | 87 |
0.13 (0.306) |
0.0325 (0.128) |
0.0633 (0.201) |
| del 4q21 21 | 24 (24%) | 76 |
0.203 (0.384) |
0.165 (0.336) |
0.0437 (0.159) |
| del 9p24 3 | 15 (15%) | 85 |
0.571 (0.705) |
0.141 (0.313) |
0.0046 (0.0323) |
| del 10q11 22 | 6 (6%) | 94 |
0.944 (0.973) |
0.0227 (0.105) |
0.369 (0.556) |
| del 12p13 33 | 4 (4%) | 96 |
1 (1.00) |
0.016 (0.08) |
0.189 (0.368) |
| del 13q31 3 | 11 (11%) | 89 |
0.82 (0.881) |
0.0233 (0.107) |
0.105 (0.273) |
| del 15q11 2 | 20 (20%) | 80 |
0.221 (0.402) |
0.00288 (0.0264) |
0.157 (0.329) |
| del 15q15 1 | 26 (26%) | 74 |
0.0106 (0.0593) |
0.211 (0.391) |
0.412 (0.578) |
| del 16p13 3 | 9 (9%) | 91 |
0.797 (0.868) |
0.157 (0.329) |
0.044 (0.159) |
| del 16q22 2 | 16 (16%) | 84 |
0.968 (0.98) |
0.0146 (0.0753) |
0.227 (0.407) |
| del 17q21 32 | 10 (10%) | 90 |
0.546 (0.695) |
0.00266 (0.0264) |
0.162 (0.335) |
| del 18q22 1 | 16 (16%) | 84 |
0.476 (0.632) |
0.0772 (0.224) |
0.0455 (0.16) |
| del 19q13 33 | 13 (13%) | 87 |
1 (1.00) |
0.00268 (0.0264) |
0.309 (0.491) |
| del xp11 23 | 47 (47%) | 53 |
0.303 (0.485) |
0.125 (0.304) |
0.0302 (0.122) |
| del xp11 22 | 29 (29%) | 71 |
0.666 (0.773) |
0.0127 (0.0689) |
0.0796 (0.228) |
| del xq24 | 32 (32%) | 68 |
0.132 (0.307) |
0.0493 (0.168) |
0.0819 (0.231) |
| del xq27 3 | 34 (34%) | 66 |
0.415 (0.58) |
0.00337 (0.0278) |
0.0566 (0.187) |
| amp 1p36 13 | 14 (14%) | 86 |
0.954 (0.973) |
0.444 (0.603) |
0.304 (0.485) |
| amp 6p21 32 | 44 (44%) | 56 |
0.922 (0.954) |
0.119 (0.292) |
0.184 (0.364) |
| amp 6q25 1 | 17 (17%) | 83 |
0.223 (0.404) |
0.374 (0.556) |
0.691 (0.797) |
| amp 7q11 23 | 35 (35%) | 65 |
0.405 (0.576) |
0.155 (0.329) |
0.613 (0.741) |
| amp 7q22 1 | 32 (32%) | 68 |
0.162 (0.335) |
0.064 (0.201) |
0.251 (0.429) |
| amp 9p24 3 | 38 (38%) | 62 |
0.072 (0.216) |
0.102 (0.269) |
0.463 (0.627) |
| amp 10q23 2 | 30 (30%) | 70 |
0.765 (0.852) |
0.8 (0.868) |
0.513 (0.669) |
| amp 11p15 2 | 5 (5%) | 95 |
0.237 (0.416) |
0.114 (0.288) |
0.261 (0.44) |
| amp 12q24 31 | 21 (21%) | 79 |
0.288 (0.468) |
0.0611 (0.198) |
0.119 (0.292) |
| amp 15q24 2 | 16 (16%) | 84 |
0.429 (0.593) |
0.116 (0.29) |
0.391 (0.57) |
| amp 15q26 3 | 35 (35%) | 65 |
0.622 (0.745) |
0.572 (0.705) |
0.623 (0.745) |
| amp 16p11 2 | 31 (31%) | 69 |
0.0986 (0.264) |
0.14 (0.313) |
0.0619 (0.198) |
| amp 16q22 2 | 19 (19%) | 81 |
0.954 (0.973) |
0.196 (0.374) |
0.359 (0.545) |
| amp 18p11 31 | 20 (20%) | 80 |
0.0938 (0.256) |
0.253 (0.431) |
0.406 (0.576) |
| amp 22q13 2 | 19 (19%) | 81 |
0.954 (0.973) |
0.219 (0.401) |
0.432 (0.594) |
| amp xp11 23 | 22 (22%) | 78 |
0.769 (0.852) |
0.272 (0.451) |
0.531 (0.69) |
| amp xp11 23 | 31 (31%) | 69 |
0.324 (0.507) |
0.56 (0.703) |
0.241 (0.416) |
| amp xq24 | 32 (32%) | 68 |
0.874 (0.92) |
0.783 (0.862) |
0.206 (0.385) |
| amp xq28 | 40 (40%) | 60 |
0.108 (0.279) |
0.469 (0.628) |
0.811 (0.875) |
| del 1p36 32 | 11 (11%) | 89 |
0.759 (0.851) |
0.149 (0.322) |
0.477 (0.632) |
| del 1q32 2 | 13 (13%) | 87 |
0.723 (0.822) |
0.559 (0.703) |
0.21 (0.391) |
| del 2q31 2 | 9 (9%) | 91 |
0.862 (0.92) |
0.871 (0.92) |
0.292 (0.47) |
| del 3p12 2 | 22 (22%) | 78 |
0.259 (0.438) |
0.485 (0.638) |
0.627 (0.747) |
| del 3q25 1 | 6 (6%) | 94 |
0.697 (0.8) |
0.569 (0.705) |
0.145 (0.316) |
| del 3q25 33 | 5 (5%) | 95 |
0.402 (0.576) |
0.0576 (0.188) |
0.164 (0.336) |
| del 4q13 2 | 25 (25%) | 75 |
0.0566 (0.187) |
0.0702 (0.215) |
0.0811 (0.231) |
| del 7p22 1 | 9 (9%) | 91 |
0.571 (0.705) |
0.317 (0.498) |
0.239 (0.416) |
| del 7q11 21 | 16 (16%) | 84 |
0.65 (0.767) |
0.267 (0.447) |
0.789 (0.865) |
| del 7q11 23 | 6 (6%) | 94 |
0.347 (0.533) |
0.875 (0.92) |
0.838 (0.898) |
| del 7q22 1 | 11 (11%) | 89 |
0.798 (0.868) |
0.138 (0.313) |
0.237 (0.416) |
| del 7q22 1 | 7 (7%) | 93 |
0.698 (0.8) |
0.396 (0.575) |
0.215 (0.397) |
| del 9q21 32 | 30 (30%) | 70 |
0.332 (0.515) |
0.0648 (0.202) |
0.14 (0.313) |
| del 10q25 3 | 13 (13%) | 87 |
0.0742 (0.219) |
0.0902 (0.248) |
0.126 (0.304) |
| del 11p11 12 | 17 (17%) | 83 |
0.618 (0.744) |
0.144 (0.316) |
0.546 (0.695) |
| del 12p11 23 | 10 (10%) | 90 |
0.538 (0.691) |
0.204 (0.384) |
0.196 (0.374) |
| del 12q21 32 | 18 (18%) | 82 |
0.919 (0.954) |
0.196 (0.374) |
0.373 (0.556) |
| del 13q12 11 | 16 (16%) | 84 |
0.41 (0.578) |
0.597 (0.73) |
0.274 (0.452) |
| del 14q32 31 | 20 (20%) | 80 |
0.556 (0.703) |
0.227 (0.407) |
0.126 (0.304) |
| del 15q26 3 | 15 (15%) | 85 |
0.286 (0.467) |
0.24 (0.416) |
0.39 (0.57) |
| del 16p13 3 | 24 (24%) | 76 |
0.189 (0.368) |
0.658 (0.77) |
0.155 (0.329) |
| del 17q24 1 | 11 (11%) | 89 |
0.901 (0.941) |
0.385 (0.567) |
0.37 (0.556) |
| del 19p13 2 | 17 (17%) | 83 |
0.956 (0.973) |
0.129 (0.306) |
0.725 (0.822) |
| del 19p12 | 29 (29%) | 71 |
0.985 (0.994) |
0.783 (0.862) |
0.548 (0.695) |
| del 20p13 | 9 (9%) | 91 |
0.703 (0.802) |
0.115 (0.29) |
0.0738 (0.219) |
| del 20q13 13 | 6 (6%) | 94 |
0.569 (0.705) |
0.686 (0.794) |
0.272 (0.451) |
| del 22q13 2 | 22 (22%) | 78 |
0.887 (0.93) |
0.437 (0.596) |
0.147 (0.32) |
P value = 0.0203 (Fisher's exact test), Q value = 0.099
Table S1. Gene #1: 'amp_1p36.33' versus Molecular Subtype #2: 'METHYLATION_CNMF'
| nPatients | CLUS_1 | CLUS_2 | CLUS_3 | CLUS_4 |
|---|---|---|---|---|
| ALL | 35 | 33 | 16 | 12 |
| AMP PEAK 1(1P36.33) MUTATED | 6 | 5 | 8 | 5 |
| AMP PEAK 1(1P36.33) WILD-TYPE | 29 | 28 | 8 | 7 |
Figure S1. Get High-res Image Gene #1: 'amp_1p36.33' versus Molecular Subtype #2: 'METHYLATION_CNMF'
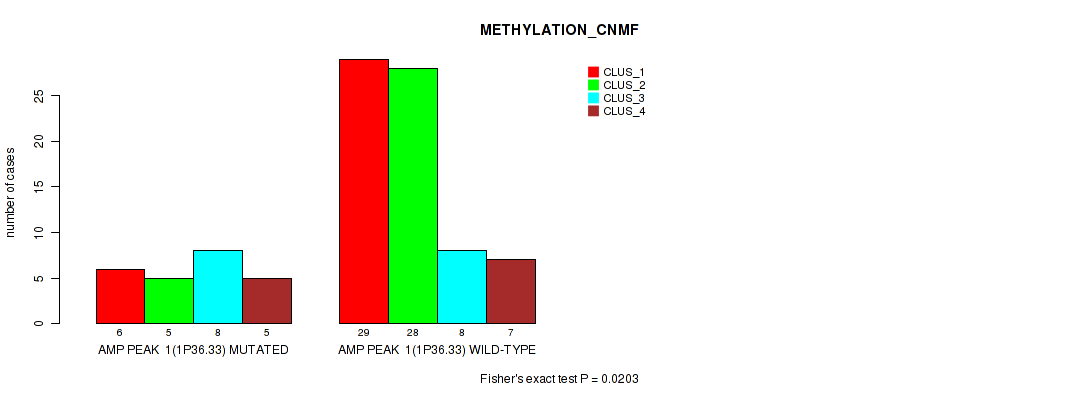
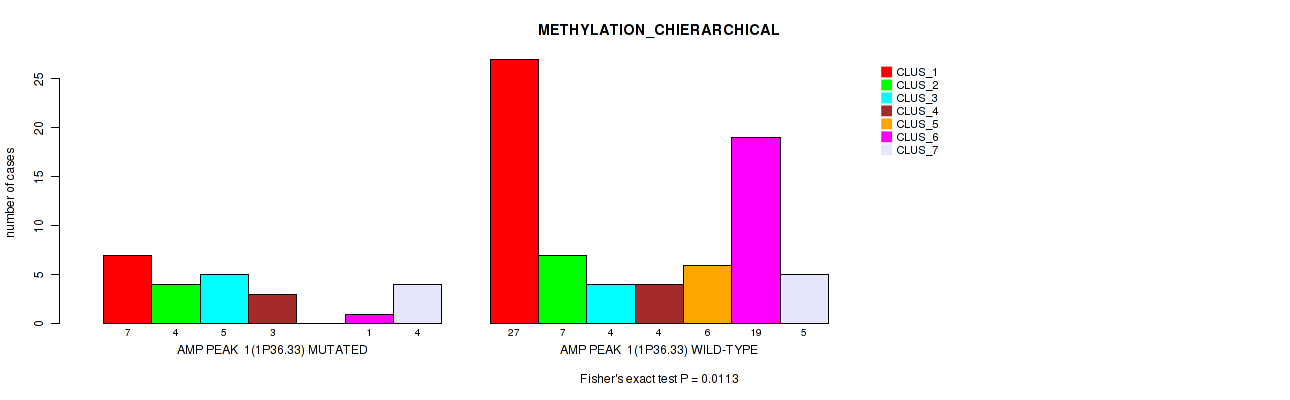
P value = 0.0113 (Fisher's exact test), Q value = 0.062
Table S2. Gene #1: 'amp_1p36.33' versus Molecular Subtype #3: 'METHYLATION_CHIERARCHICAL'
| nPatients | CLUS_1 | CLUS_2 | CLUS_3 | CLUS_4 | CLUS_5 | CLUS_6 | CLUS_7 |
|---|---|---|---|---|---|---|---|
| ALL | 34 | 11 | 9 | 7 | 6 | 20 | 9 |
| AMP PEAK 1(1P36.33) MUTATED | 7 | 4 | 5 | 3 | 0 | 1 | 4 |
| AMP PEAK 1(1P36.33) WILD-TYPE | 27 | 7 | 4 | 4 | 6 | 19 | 5 |
Figure S2. Get High-res Image Gene #1: 'amp_1p36.33' versus Molecular Subtype #3: 'METHYLATION_CHIERARCHICAL'
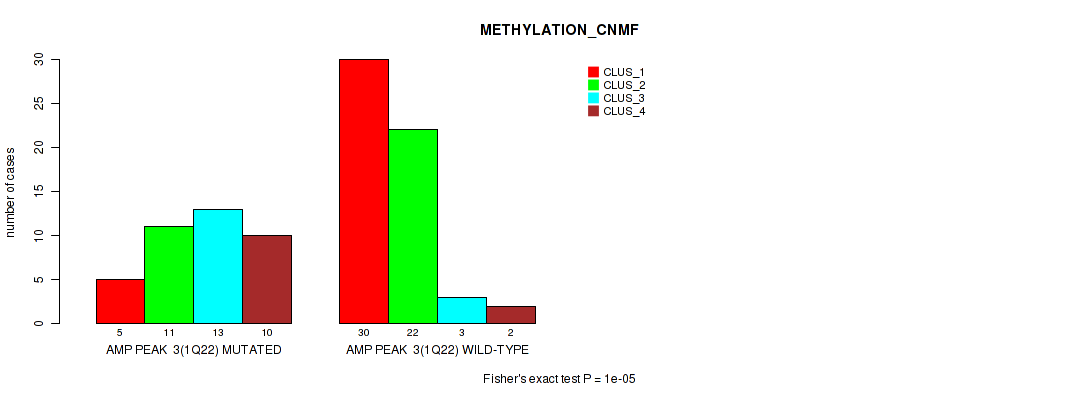
P value = 1e-05 (Fisher's exact test), Q value = 0.0016
Table S3. Gene #3: 'amp_1q22' versus Molecular Subtype #2: 'METHYLATION_CNMF'
| nPatients | CLUS_1 | CLUS_2 | CLUS_3 | CLUS_4 |
|---|---|---|---|---|
| ALL | 35 | 33 | 16 | 12 |
| AMP PEAK 3(1Q22) MUTATED | 5 | 11 | 13 | 10 |
| AMP PEAK 3(1Q22) WILD-TYPE | 30 | 22 | 3 | 2 |
Figure S3. Get High-res Image Gene #3: 'amp_1q22' versus Molecular Subtype #2: 'METHYLATION_CNMF'
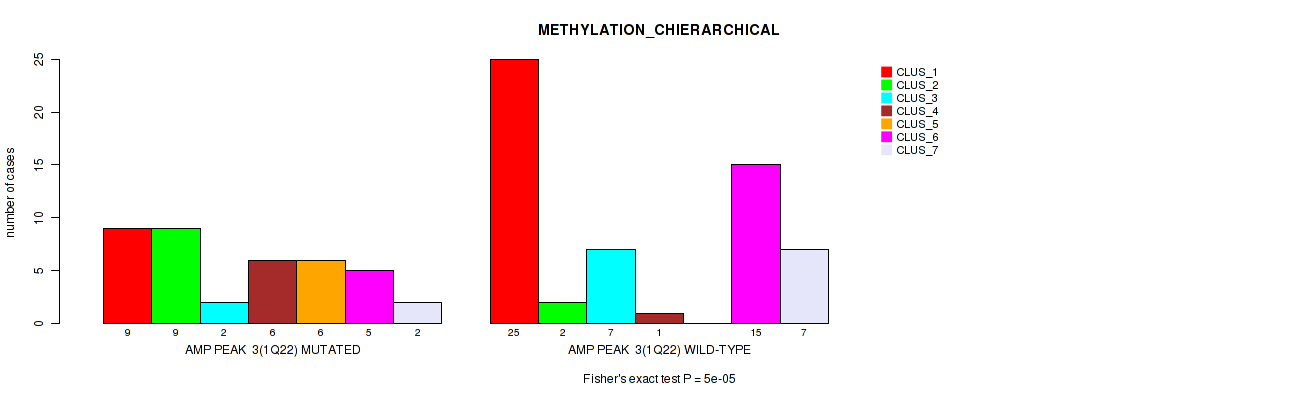
P value = 5e-05 (Fisher's exact test), Q value = 0.0024
Table S4. Gene #3: 'amp_1q22' versus Molecular Subtype #3: 'METHYLATION_CHIERARCHICAL'
| nPatients | CLUS_1 | CLUS_2 | CLUS_3 | CLUS_4 | CLUS_5 | CLUS_6 | CLUS_7 |
|---|---|---|---|---|---|---|---|
| ALL | 34 | 11 | 9 | 7 | 6 | 20 | 9 |
| AMP PEAK 3(1Q22) MUTATED | 9 | 9 | 2 | 6 | 6 | 5 | 2 |
| AMP PEAK 3(1Q22) WILD-TYPE | 25 | 2 | 7 | 1 | 0 | 15 | 7 |
Figure S4. Get High-res Image Gene #3: 'amp_1q22' versus Molecular Subtype #3: 'METHYLATION_CHIERARCHICAL'
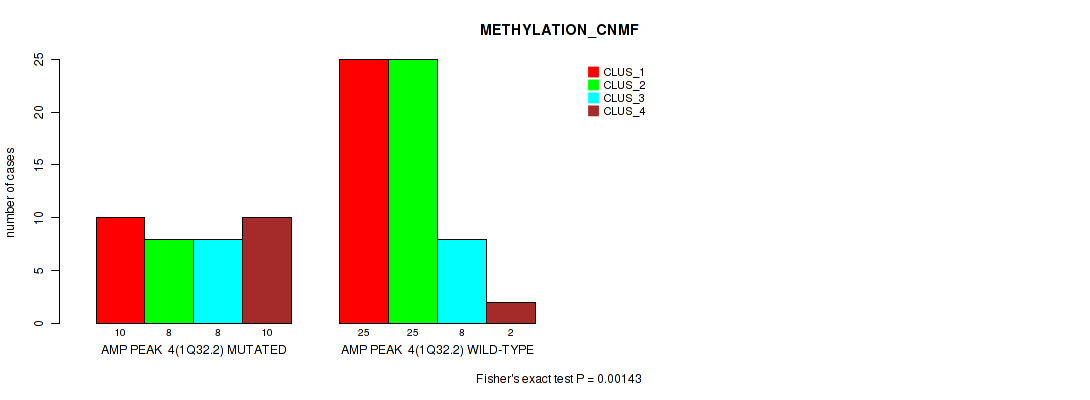
P value = 0.00143 (Fisher's exact test), Q value = 0.02
Table S5. Gene #4: 'amp_1q32.2' versus Molecular Subtype #2: 'METHYLATION_CNMF'
| nPatients | CLUS_1 | CLUS_2 | CLUS_3 | CLUS_4 |
|---|---|---|---|---|
| ALL | 35 | 33 | 16 | 12 |
| AMP PEAK 4(1Q32.2) MUTATED | 10 | 8 | 8 | 10 |
| AMP PEAK 4(1Q32.2) WILD-TYPE | 25 | 25 | 8 | 2 |
Figure S5. Get High-res Image Gene #4: 'amp_1q32.2' versus Molecular Subtype #2: 'METHYLATION_CNMF'
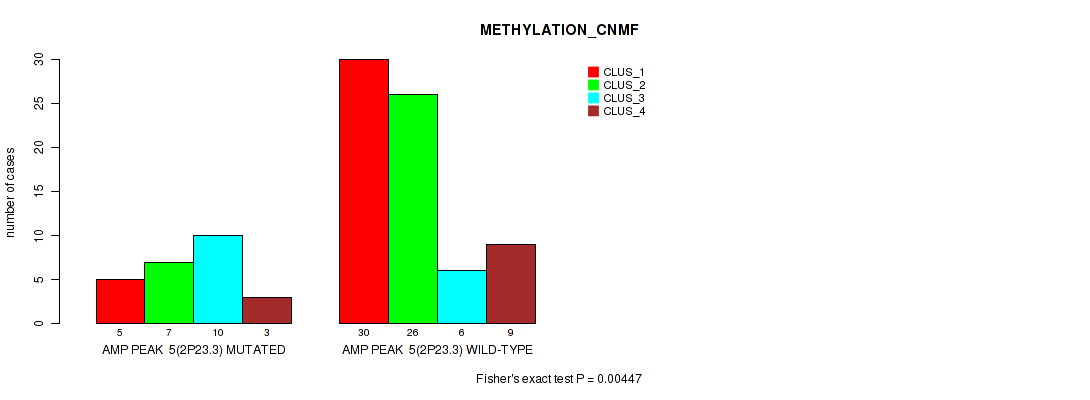
P value = 0.00447 (Fisher's exact test), Q value = 0.032
Table S6. Gene #5: 'amp_2p23.3' versus Molecular Subtype #2: 'METHYLATION_CNMF'
| nPatients | CLUS_1 | CLUS_2 | CLUS_3 | CLUS_4 |
|---|---|---|---|---|
| ALL | 35 | 33 | 16 | 12 |
| AMP PEAK 5(2P23.3) MUTATED | 5 | 7 | 10 | 3 |
| AMP PEAK 5(2P23.3) WILD-TYPE | 30 | 26 | 6 | 9 |
Figure S6. Get High-res Image Gene #5: 'amp_2p23.3' versus Molecular Subtype #2: 'METHYLATION_CNMF'
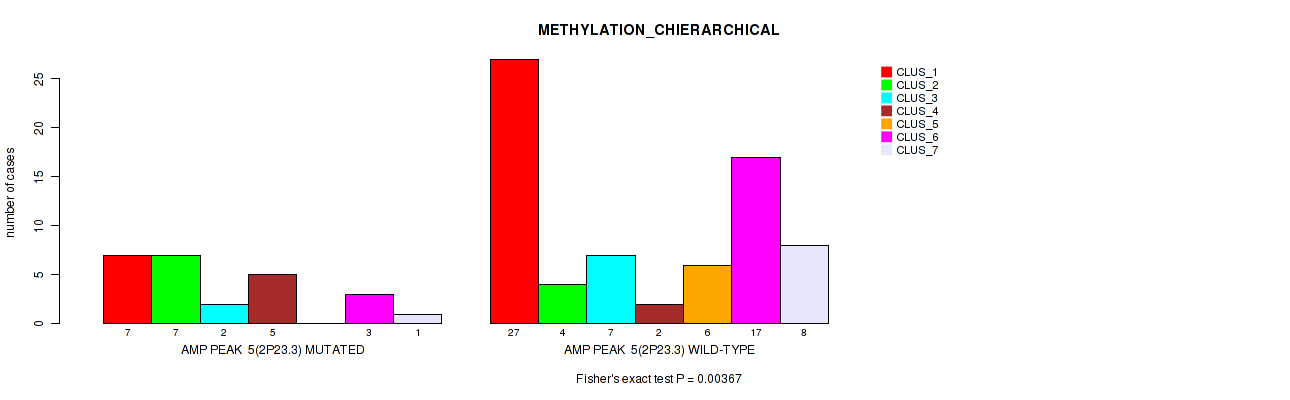
P value = 0.00367 (Fisher's exact test), Q value = 0.029
Table S7. Gene #5: 'amp_2p23.3' versus Molecular Subtype #3: 'METHYLATION_CHIERARCHICAL'
| nPatients | CLUS_1 | CLUS_2 | CLUS_3 | CLUS_4 | CLUS_5 | CLUS_6 | CLUS_7 |
|---|---|---|---|---|---|---|---|
| ALL | 34 | 11 | 9 | 7 | 6 | 20 | 9 |
| AMP PEAK 5(2P23.3) MUTATED | 7 | 7 | 2 | 5 | 0 | 3 | 1 |
| AMP PEAK 5(2P23.3) WILD-TYPE | 27 | 4 | 7 | 2 | 6 | 17 | 8 |
Figure S7. Get High-res Image Gene #5: 'amp_2p23.3' versus Molecular Subtype #3: 'METHYLATION_CHIERARCHICAL'
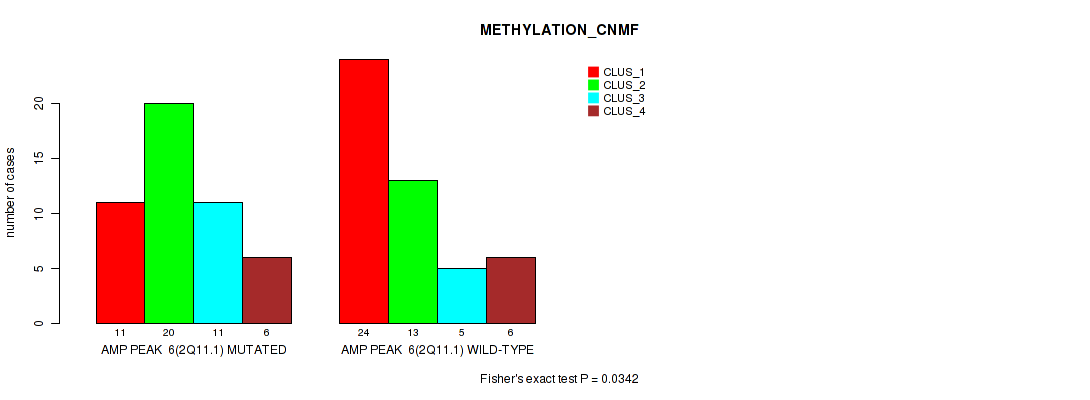
P value = 0.0342 (Fisher's exact test), Q value = 0.13
Table S8. Gene #6: 'amp_2q11.1' versus Molecular Subtype #2: 'METHYLATION_CNMF'
| nPatients | CLUS_1 | CLUS_2 | CLUS_3 | CLUS_4 |
|---|---|---|---|---|
| ALL | 35 | 33 | 16 | 12 |
| AMP PEAK 6(2Q11.1) MUTATED | 11 | 20 | 11 | 6 |
| AMP PEAK 6(2Q11.1) WILD-TYPE | 24 | 13 | 5 | 6 |
Figure S8. Get High-res Image Gene #6: 'amp_2q11.1' versus Molecular Subtype #2: 'METHYLATION_CNMF'
P value = 0.00288 (Fisher's exact test), Q value = 0.026
Table S9. Gene #7: 'amp_2q13' versus Molecular Subtype #2: 'METHYLATION_CNMF'
| nPatients | CLUS_1 | CLUS_2 | CLUS_3 | CLUS_4 |
|---|---|---|---|---|
| ALL | 35 | 33 | 16 | 12 |
| AMP PEAK 7(2Q13) MUTATED | 5 | 6 | 10 | 3 |
| AMP PEAK 7(2Q13) WILD-TYPE | 30 | 27 | 6 | 9 |
Figure S9. Get High-res Image Gene #7: 'amp_2q13' versus Molecular Subtype #2: 'METHYLATION_CNMF'
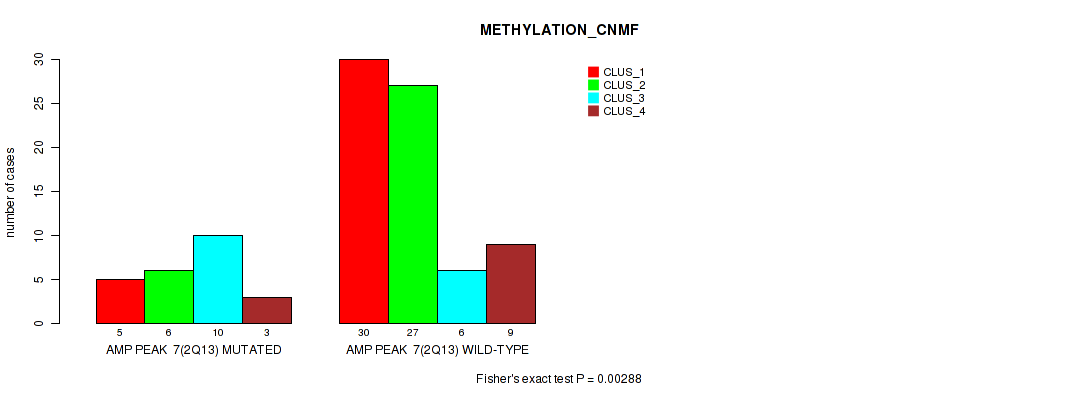
P value = 0.00238 (Fisher's exact test), Q value = 0.026
Table S10. Gene #7: 'amp_2q13' versus Molecular Subtype #3: 'METHYLATION_CHIERARCHICAL'
| nPatients | CLUS_1 | CLUS_2 | CLUS_3 | CLUS_4 | CLUS_5 | CLUS_6 | CLUS_7 |
|---|---|---|---|---|---|---|---|
| ALL | 34 | 11 | 9 | 7 | 6 | 20 | 9 |
| AMP PEAK 7(2Q13) MUTATED | 6 | 7 | 2 | 5 | 0 | 3 | 1 |
| AMP PEAK 7(2Q13) WILD-TYPE | 28 | 4 | 7 | 2 | 6 | 17 | 8 |
Figure S10. Get High-res Image Gene #7: 'amp_2q13' versus Molecular Subtype #3: 'METHYLATION_CHIERARCHICAL'
P value = 0.0096 (Fisher's exact test), Q value = 0.056
Table S11. Gene #8: 'amp_3p21.31' versus Molecular Subtype #2: 'METHYLATION_CNMF'
| nPatients | CLUS_1 | CLUS_2 | CLUS_3 | CLUS_4 |
|---|---|---|---|---|
| ALL | 35 | 33 | 16 | 12 |
| AMP PEAK 8(3P21.31) MUTATED | 7 | 6 | 10 | 3 |
| AMP PEAK 8(3P21.31) WILD-TYPE | 28 | 27 | 6 | 9 |
Figure S11. Get High-res Image Gene #8: 'amp_3p21.31' versus Molecular Subtype #2: 'METHYLATION_CNMF'
P value = 0.00265 (Fisher's exact test), Q value = 0.026
Table S12. Gene #9: 'amp_3q26.2' versus Molecular Subtype #2: 'METHYLATION_CNMF'
| nPatients | CLUS_1 | CLUS_2 | CLUS_3 | CLUS_4 |
|---|---|---|---|---|
| ALL | 35 | 33 | 16 | 12 |
| AMP PEAK 9(3Q26.2) MUTATED | 2 | 6 | 8 | 1 |
| AMP PEAK 9(3Q26.2) WILD-TYPE | 33 | 27 | 8 | 11 |
Figure S12. Get High-res Image Gene #9: 'amp_3q26.2' versus Molecular Subtype #2: 'METHYLATION_CNMF'
P value = 0.00013 (Fisher's exact test), Q value = 0.0054
Table S13. Gene #9: 'amp_3q26.2' versus Molecular Subtype #3: 'METHYLATION_CHIERARCHICAL'
| nPatients | CLUS_1 | CLUS_2 | CLUS_3 | CLUS_4 | CLUS_5 | CLUS_6 | CLUS_7 |
|---|---|---|---|---|---|---|---|
| ALL | 34 | 11 | 9 | 7 | 6 | 20 | 9 |
| AMP PEAK 9(3Q26.2) MUTATED | 4 | 8 | 0 | 3 | 0 | 2 | 0 |
| AMP PEAK 9(3Q26.2) WILD-TYPE | 30 | 3 | 9 | 4 | 6 | 18 | 9 |
Figure S13. Get High-res Image Gene #9: 'amp_3q26.2' versus Molecular Subtype #3: 'METHYLATION_CHIERARCHICAL'
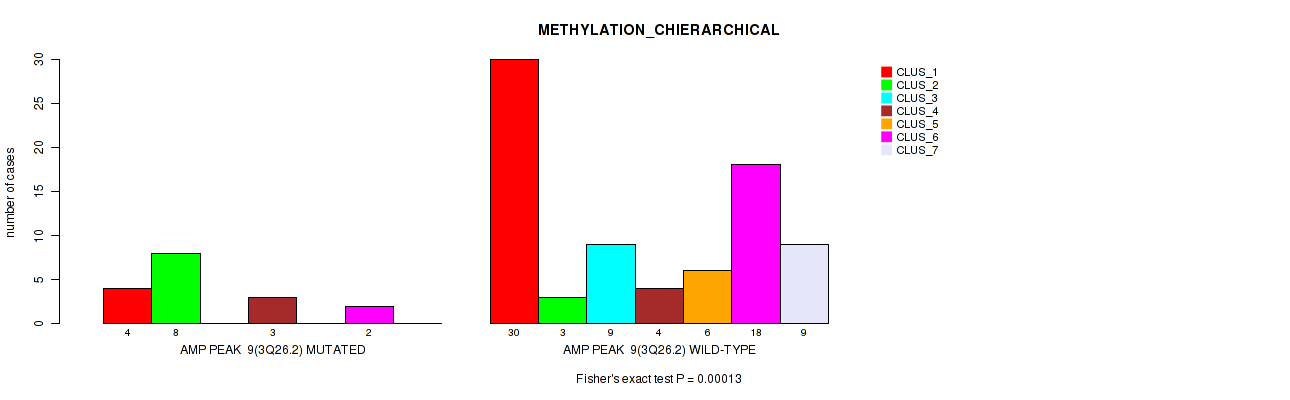
P value = 3e-05 (Fisher's exact test), Q value = 0.0022
Table S14. Gene #10: 'amp_3q27.1' versus Molecular Subtype #2: 'METHYLATION_CNMF'
| nPatients | CLUS_1 | CLUS_2 | CLUS_3 | CLUS_4 |
|---|---|---|---|---|
| ALL | 35 | 33 | 16 | 12 |
| AMP PEAK 10(3Q27.1) MUTATED | 3 | 7 | 12 | 2 |
| AMP PEAK 10(3Q27.1) WILD-TYPE | 32 | 26 | 4 | 10 |
Figure S14. Get High-res Image Gene #10: 'amp_3q27.1' versus Molecular Subtype #2: 'METHYLATION_CNMF'
P value = 2e-05 (Fisher's exact test), Q value = 0.0022
Table S15. Gene #10: 'amp_3q27.1' versus Molecular Subtype #3: 'METHYLATION_CHIERARCHICAL'
| nPatients | CLUS_1 | CLUS_2 | CLUS_3 | CLUS_4 | CLUS_5 | CLUS_6 | CLUS_7 |
|---|---|---|---|---|---|---|---|
| ALL | 34 | 11 | 9 | 7 | 6 | 20 | 9 |
| AMP PEAK 10(3Q27.1) MUTATED | 6 | 9 | 0 | 5 | 1 | 2 | 1 |
| AMP PEAK 10(3Q27.1) WILD-TYPE | 28 | 2 | 9 | 2 | 5 | 18 | 8 |
Figure S15. Get High-res Image Gene #10: 'amp_3q27.1' versus Molecular Subtype #3: 'METHYLATION_CHIERARCHICAL'
P value = 0.0187 (Fisher's exact test), Q value = 0.092
Table S16. Gene #11: 'amp_4p16.3' versus Molecular Subtype #2: 'METHYLATION_CNMF'
| nPatients | CLUS_1 | CLUS_2 | CLUS_3 | CLUS_4 |
|---|---|---|---|---|
| ALL | 35 | 33 | 16 | 12 |
| AMP PEAK 11(4P16.3) MUTATED | 3 | 1 | 5 | 0 |
| AMP PEAK 11(4P16.3) WILD-TYPE | 32 | 32 | 11 | 12 |
Figure S16. Get High-res Image Gene #11: 'amp_4p16.3' versus Molecular Subtype #2: 'METHYLATION_CNMF'
P value = 0.0156 (Fisher's exact test), Q value = 0.079
Table S17. Gene #12: 'amp_5q35.2' versus Molecular Subtype #2: 'METHYLATION_CNMF'
| nPatients | CLUS_1 | CLUS_2 | CLUS_3 | CLUS_4 |
|---|---|---|---|---|
| ALL | 35 | 33 | 16 | 12 |
| AMP PEAK 12(5Q35.2) MUTATED | 1 | 3 | 5 | 0 |
| AMP PEAK 12(5Q35.2) WILD-TYPE | 34 | 30 | 11 | 12 |
Figure S17. Get High-res Image Gene #12: 'amp_5q35.2' versus Molecular Subtype #2: 'METHYLATION_CNMF'
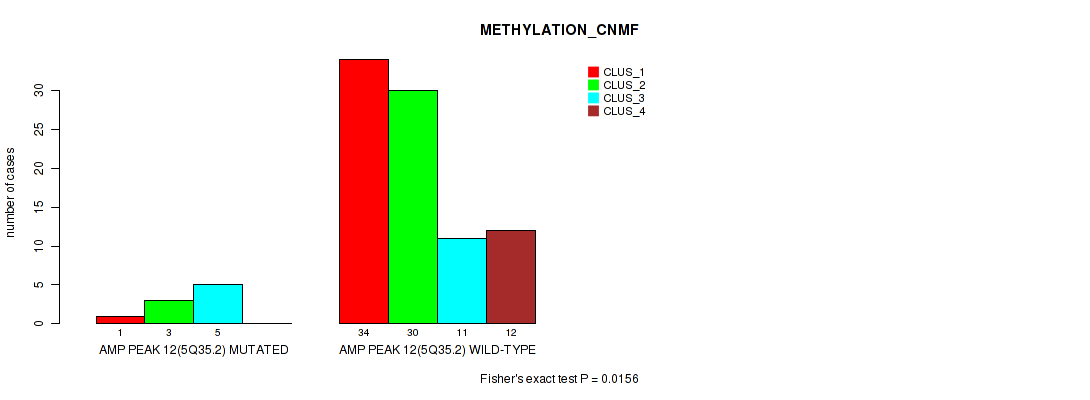
P value = 0.00315 (Fisher's exact test), Q value = 0.028
Table S18. Gene #15: 'amp_7p13' versus Molecular Subtype #2: 'METHYLATION_CNMF'
| nPatients | CLUS_1 | CLUS_2 | CLUS_3 | CLUS_4 |
|---|---|---|---|---|
| ALL | 35 | 33 | 16 | 12 |
| AMP PEAK 15(7P13) MUTATED | 8 | 6 | 11 | 3 |
| AMP PEAK 15(7P13) WILD-TYPE | 27 | 27 | 5 | 9 |
Figure S18. Get High-res Image Gene #15: 'amp_7p13' versus Molecular Subtype #2: 'METHYLATION_CNMF'
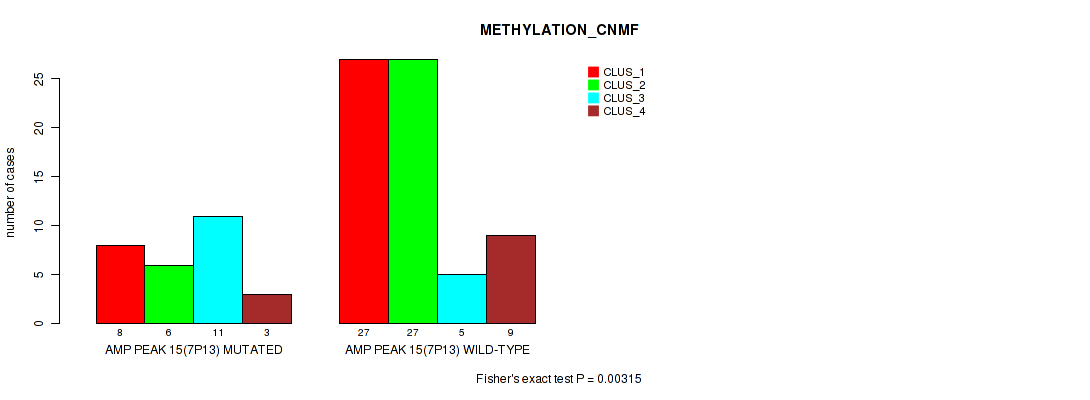
P value = 0.00773 (Fisher's exact test), Q value = 0.047
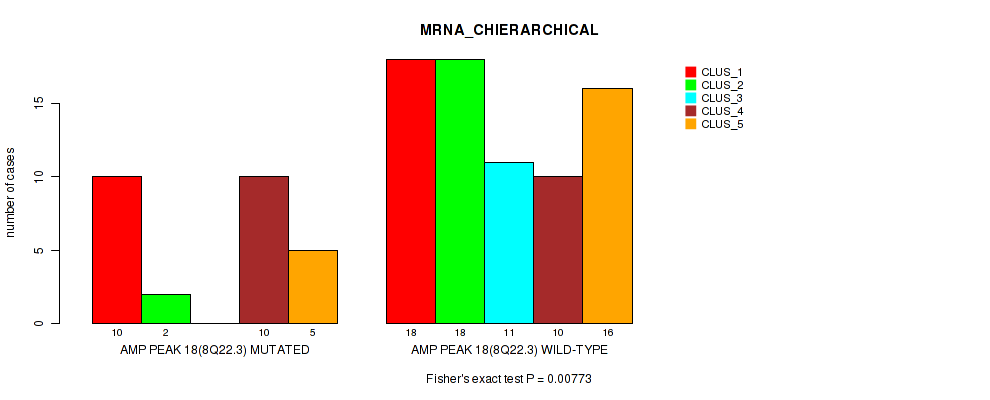
Table S19. Gene #18: 'amp_8q22.3' versus Molecular Subtype #1: 'MRNA_CHIERARCHICAL'
| nPatients | CLUS_1 | CLUS_2 | CLUS_3 | CLUS_4 | CLUS_5 |
|---|---|---|---|---|---|
| ALL | 28 | 20 | 11 | 20 | 21 |
| AMP PEAK 18(8Q22.3) MUTATED | 10 | 2 | 0 | 10 | 5 |
| AMP PEAK 18(8Q22.3) WILD-TYPE | 18 | 18 | 11 | 10 | 16 |
Figure S19. Get High-res Image Gene #18: 'amp_8q22.3' versus Molecular Subtype #1: 'MRNA_CHIERARCHICAL'
P value = 0.0255 (Fisher's exact test), Q value = 0.11
Table S20. Gene #20: 'amp_9q34.3' versus Molecular Subtype #2: 'METHYLATION_CNMF'
| nPatients | CLUS_1 | CLUS_2 | CLUS_3 | CLUS_4 |
|---|---|---|---|---|
| ALL | 35 | 33 | 16 | 12 |
| AMP PEAK 20(9Q34.3) MUTATED | 4 | 3 | 6 | 0 |
| AMP PEAK 20(9Q34.3) WILD-TYPE | 31 | 30 | 10 | 12 |
Figure S20. Get High-res Image Gene #20: 'amp_9q34.3' versus Molecular Subtype #2: 'METHYLATION_CNMF'

P value = 0.0329 (Fisher's exact test), Q value = 0.13
Table S21. Gene #22: 'amp_10q26.13' versus Molecular Subtype #2: 'METHYLATION_CNMF'
| nPatients | CLUS_1 | CLUS_2 | CLUS_3 | CLUS_4 |
|---|---|---|---|---|
| ALL | 35 | 33 | 16 | 12 |
| AMP PEAK 22(10Q26.13) MUTATED | 7 | 11 | 10 | 4 |
| AMP PEAK 22(10Q26.13) WILD-TYPE | 28 | 22 | 6 | 8 |
Figure S21. Get High-res Image Gene #22: 'amp_10q26.13' versus Molecular Subtype #2: 'METHYLATION_CNMF'
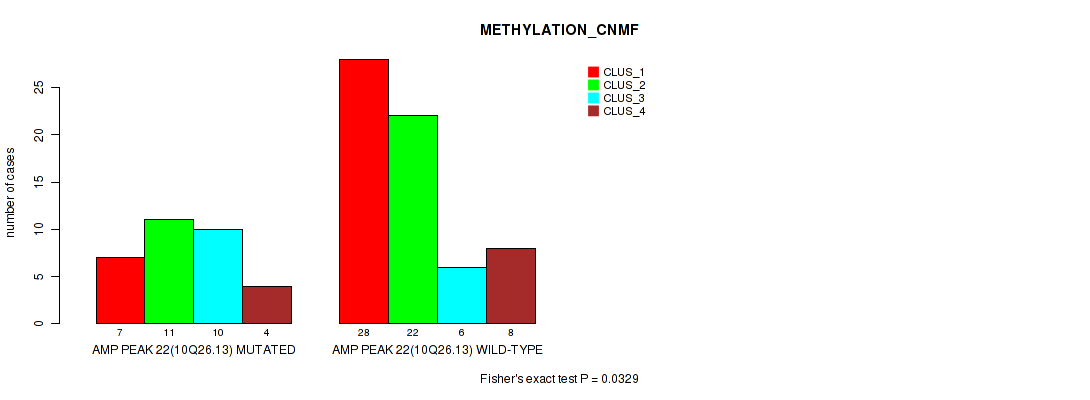
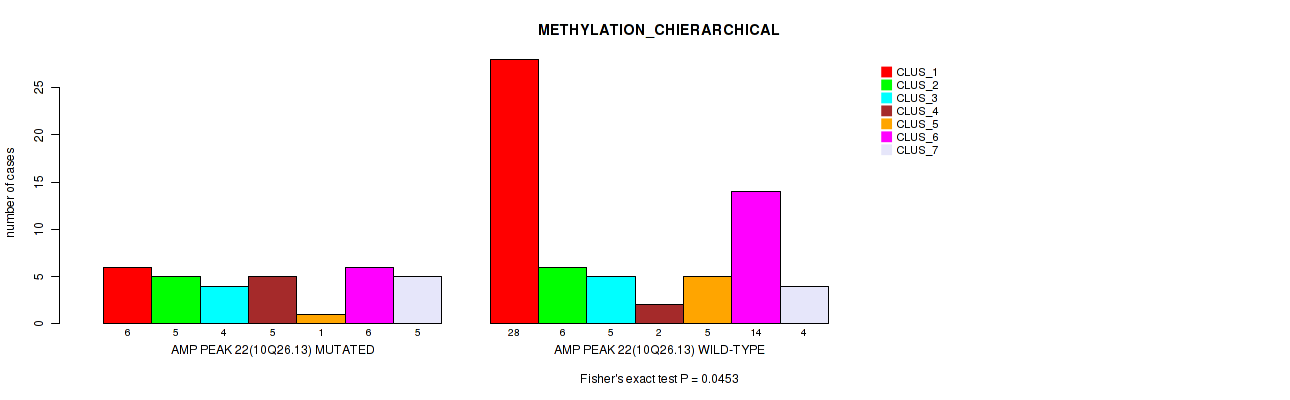
P value = 0.0453 (Fisher's exact test), Q value = 0.16
Table S22. Gene #22: 'amp_10q26.13' versus Molecular Subtype #3: 'METHYLATION_CHIERARCHICAL'
| nPatients | CLUS_1 | CLUS_2 | CLUS_3 | CLUS_4 | CLUS_5 | CLUS_6 | CLUS_7 |
|---|---|---|---|---|---|---|---|
| ALL | 34 | 11 | 9 | 7 | 6 | 20 | 9 |
| AMP PEAK 22(10Q26.13) MUTATED | 6 | 5 | 4 | 5 | 1 | 6 | 5 |
| AMP PEAK 22(10Q26.13) WILD-TYPE | 28 | 6 | 5 | 2 | 5 | 14 | 4 |
Figure S22. Get High-res Image Gene #22: 'amp_10q26.13' versus Molecular Subtype #3: 'METHYLATION_CHIERARCHICAL'
P value = 0.00526 (Fisher's exact test), Q value = 0.036
Table S23. Gene #24: 'amp_11p11.2' versus Molecular Subtype #2: 'METHYLATION_CNMF'
| nPatients | CLUS_1 | CLUS_2 | CLUS_3 | CLUS_4 |
|---|---|---|---|---|
| ALL | 35 | 33 | 16 | 12 |
| AMP PEAK 24(11P11.2) MUTATED | 3 | 3 | 7 | 0 |
| AMP PEAK 24(11P11.2) WILD-TYPE | 32 | 30 | 9 | 12 |
Figure S23. Get High-res Image Gene #24: 'amp_11p11.2' versus Molecular Subtype #2: 'METHYLATION_CNMF'

P value = 0.00335 (Fisher's exact test), Q value = 0.028
Table S24. Gene #24: 'amp_11p11.2' versus Molecular Subtype #3: 'METHYLATION_CHIERARCHICAL'
| nPatients | CLUS_1 | CLUS_2 | CLUS_3 | CLUS_4 | CLUS_5 | CLUS_6 | CLUS_7 |
|---|---|---|---|---|---|---|---|
| ALL | 34 | 11 | 9 | 7 | 6 | 20 | 9 |
| AMP PEAK 24(11P11.2) MUTATED | 4 | 5 | 0 | 3 | 0 | 0 | 1 |
| AMP PEAK 24(11P11.2) WILD-TYPE | 30 | 6 | 9 | 4 | 6 | 20 | 8 |
Figure S24. Get High-res Image Gene #24: 'amp_11p11.2' versus Molecular Subtype #3: 'METHYLATION_CHIERARCHICAL'

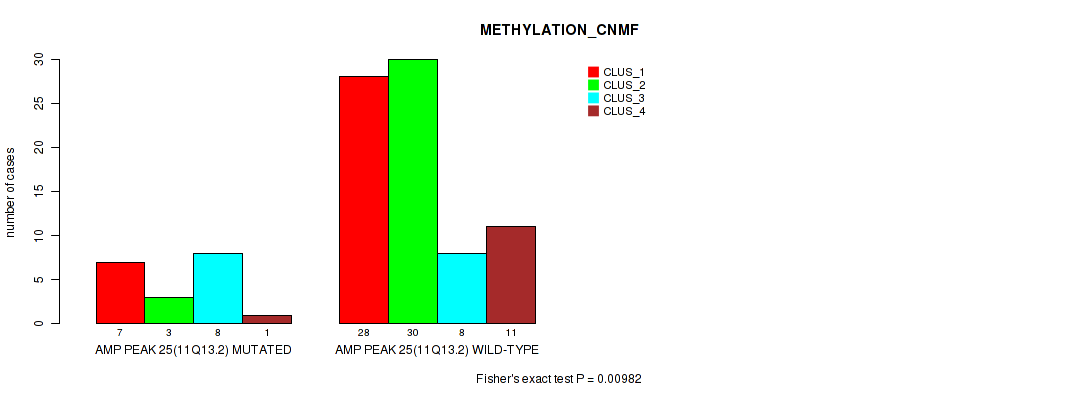
P value = 0.00982 (Fisher's exact test), Q value = 0.056
Table S25. Gene #25: 'amp_11q13.2' versus Molecular Subtype #2: 'METHYLATION_CNMF'
| nPatients | CLUS_1 | CLUS_2 | CLUS_3 | CLUS_4 |
|---|---|---|---|---|
| ALL | 35 | 33 | 16 | 12 |
| AMP PEAK 25(11Q13.2) MUTATED | 7 | 3 | 8 | 1 |
| AMP PEAK 25(11Q13.2) WILD-TYPE | 28 | 30 | 8 | 11 |
Figure S25. Get High-res Image Gene #25: 'amp_11q13.2' versus Molecular Subtype #2: 'METHYLATION_CNMF'
P value = 0.00019 (Fisher's exact test), Q value = 0.0063
Table S26. Gene #26: 'amp_11q13.3' versus Molecular Subtype #2: 'METHYLATION_CNMF'
| nPatients | CLUS_1 | CLUS_2 | CLUS_3 | CLUS_4 |
|---|---|---|---|---|
| ALL | 35 | 33 | 16 | 12 |
| AMP PEAK 26(11Q13.3) MUTATED | 6 | 2 | 9 | 0 |
| AMP PEAK 26(11Q13.3) WILD-TYPE | 29 | 31 | 7 | 12 |
Figure S26. Get High-res Image Gene #26: 'amp_11q13.3' versus Molecular Subtype #2: 'METHYLATION_CNMF'
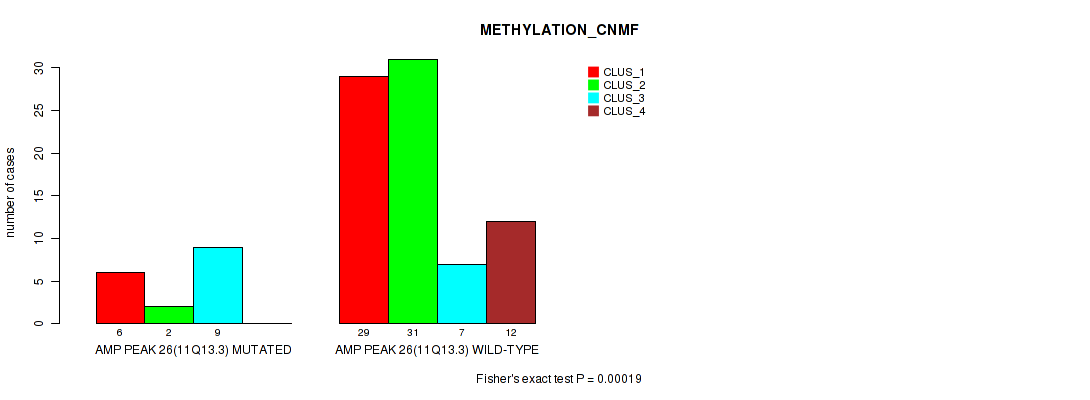
P value = 0.00447 (Fisher's exact test), Q value = 0.032
Table S27. Gene #26: 'amp_11q13.3' versus Molecular Subtype #3: 'METHYLATION_CHIERARCHICAL'
| nPatients | CLUS_1 | CLUS_2 | CLUS_3 | CLUS_4 | CLUS_5 | CLUS_6 | CLUS_7 |
|---|---|---|---|---|---|---|---|
| ALL | 34 | 11 | 9 | 7 | 6 | 20 | 9 |
| AMP PEAK 26(11Q13.3) MUTATED | 8 | 5 | 0 | 3 | 0 | 0 | 1 |
| AMP PEAK 26(11Q13.3) WILD-TYPE | 26 | 6 | 9 | 4 | 6 | 20 | 8 |
Figure S27. Get High-res Image Gene #26: 'amp_11q13.3' versus Molecular Subtype #3: 'METHYLATION_CHIERARCHICAL'
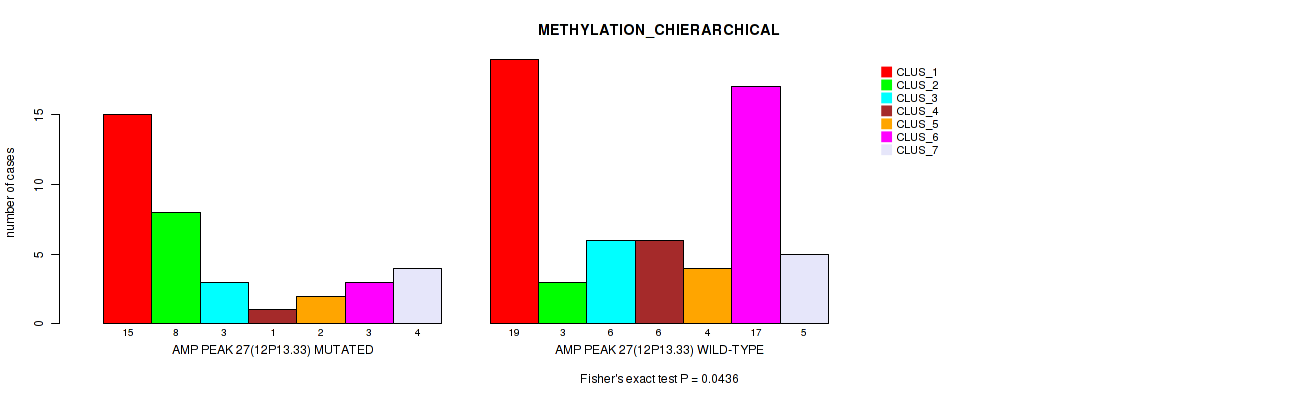
P value = 0.0436 (Fisher's exact test), Q value = 0.16
Table S28. Gene #27: 'amp_12p13.33' versus Molecular Subtype #3: 'METHYLATION_CHIERARCHICAL'
| nPatients | CLUS_1 | CLUS_2 | CLUS_3 | CLUS_4 | CLUS_5 | CLUS_6 | CLUS_7 |
|---|---|---|---|---|---|---|---|
| ALL | 34 | 11 | 9 | 7 | 6 | 20 | 9 |
| AMP PEAK 27(12P13.33) MUTATED | 15 | 8 | 3 | 1 | 2 | 3 | 4 |
| AMP PEAK 27(12P13.33) WILD-TYPE | 19 | 3 | 6 | 6 | 4 | 17 | 5 |
Figure S28. Get High-res Image Gene #27: 'amp_12p13.33' versus Molecular Subtype #3: 'METHYLATION_CHIERARCHICAL'
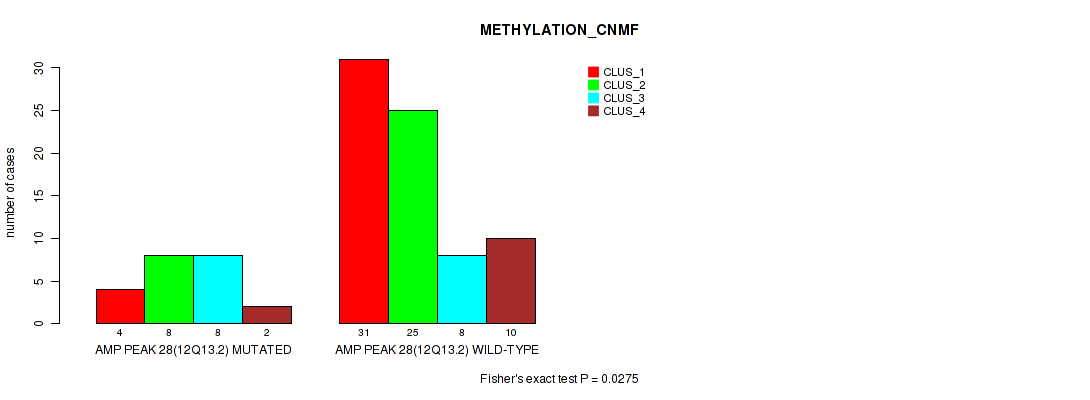
P value = 0.0275 (Fisher's exact test), Q value = 0.12
Table S29. Gene #28: 'amp_12q13.2' versus Molecular Subtype #2: 'METHYLATION_CNMF'
| nPatients | CLUS_1 | CLUS_2 | CLUS_3 | CLUS_4 |
|---|---|---|---|---|
| ALL | 35 | 33 | 16 | 12 |
| AMP PEAK 28(12Q13.2) MUTATED | 4 | 8 | 8 | 2 |
| AMP PEAK 28(12Q13.2) WILD-TYPE | 31 | 25 | 8 | 10 |
Figure S29. Get High-res Image Gene #28: 'amp_12q13.2' versus Molecular Subtype #2: 'METHYLATION_CNMF'
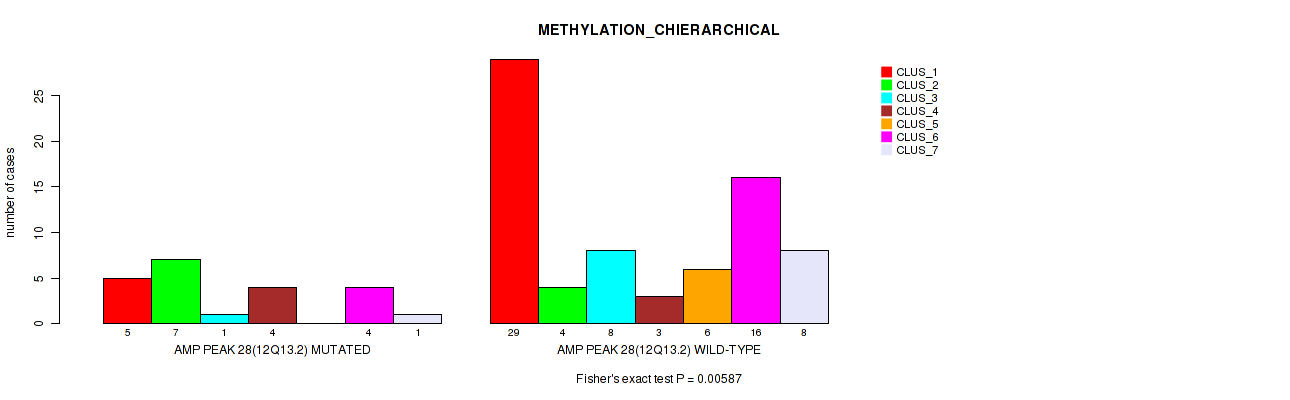
P value = 0.00587 (Fisher's exact test), Q value = 0.04
Table S30. Gene #28: 'amp_12q13.2' versus Molecular Subtype #3: 'METHYLATION_CHIERARCHICAL'
| nPatients | CLUS_1 | CLUS_2 | CLUS_3 | CLUS_4 | CLUS_5 | CLUS_6 | CLUS_7 |
|---|---|---|---|---|---|---|---|
| ALL | 34 | 11 | 9 | 7 | 6 | 20 | 9 |
| AMP PEAK 28(12Q13.2) MUTATED | 5 | 7 | 1 | 4 | 0 | 4 | 1 |
| AMP PEAK 28(12Q13.2) WILD-TYPE | 29 | 4 | 8 | 3 | 6 | 16 | 8 |
Figure S30. Get High-res Image Gene #28: 'amp_12q13.2' versus Molecular Subtype #3: 'METHYLATION_CHIERARCHICAL'
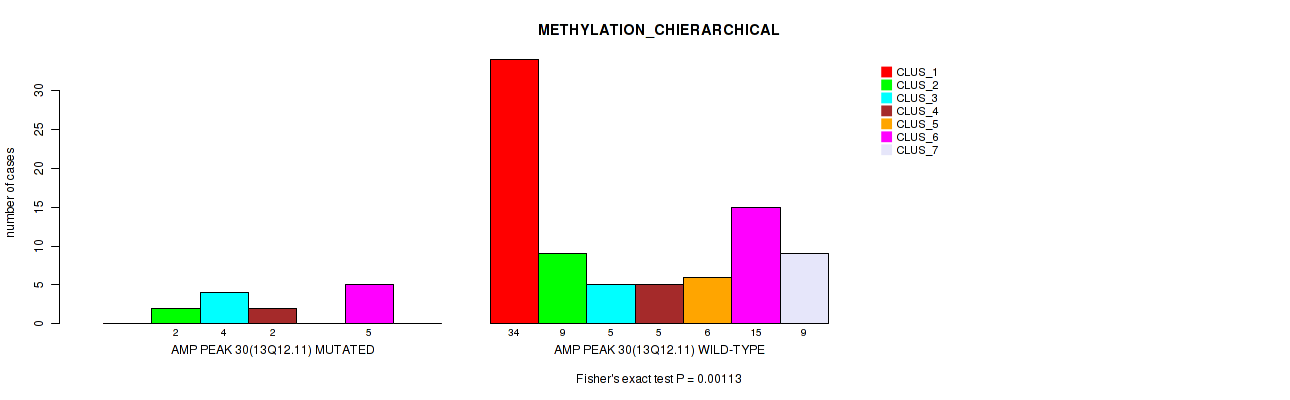
P value = 0.00113 (Fisher's exact test), Q value = 0.017
Table S31. Gene #30: 'amp_13q12.11' versus Molecular Subtype #3: 'METHYLATION_CHIERARCHICAL'
| nPatients | CLUS_1 | CLUS_2 | CLUS_3 | CLUS_4 | CLUS_5 | CLUS_6 | CLUS_7 |
|---|---|---|---|---|---|---|---|
| ALL | 34 | 11 | 9 | 7 | 6 | 20 | 9 |
| AMP PEAK 30(13Q12.11) MUTATED | 0 | 2 | 4 | 2 | 0 | 5 | 0 |
| AMP PEAK 30(13Q12.11) WILD-TYPE | 34 | 9 | 5 | 5 | 6 | 15 | 9 |
Figure S31. Get High-res Image Gene #30: 'amp_13q12.11' versus Molecular Subtype #3: 'METHYLATION_CHIERARCHICAL'
P value = 0.00034 (Fisher's exact test), Q value = 0.0093
Table S32. Gene #31: 'amp_14q24.2' versus Molecular Subtype #2: 'METHYLATION_CNMF'
| nPatients | CLUS_1 | CLUS_2 | CLUS_3 | CLUS_4 |
|---|---|---|---|---|
| ALL | 35 | 33 | 16 | 12 |
| AMP PEAK 31(14Q24.2) MUTATED | 2 | 2 | 8 | 1 |
| AMP PEAK 31(14Q24.2) WILD-TYPE | 33 | 31 | 8 | 11 |
Figure S32. Get High-res Image Gene #31: 'amp_14q24.2' versus Molecular Subtype #2: 'METHYLATION_CNMF'

P value = 0.00738 (Fisher's exact test), Q value = 0.046
Table S33. Gene #31: 'amp_14q24.2' versus Molecular Subtype #3: 'METHYLATION_CHIERARCHICAL'
| nPatients | CLUS_1 | CLUS_2 | CLUS_3 | CLUS_4 | CLUS_5 | CLUS_6 | CLUS_7 |
|---|---|---|---|---|---|---|---|
| ALL | 34 | 11 | 9 | 7 | 6 | 20 | 9 |
| AMP PEAK 31(14Q24.2) MUTATED | 4 | 3 | 0 | 4 | 1 | 0 | 1 |
| AMP PEAK 31(14Q24.2) WILD-TYPE | 30 | 8 | 9 | 3 | 5 | 20 | 8 |
Figure S33. Get High-res Image Gene #31: 'amp_14q24.2' versus Molecular Subtype #3: 'METHYLATION_CHIERARCHICAL'

P value = 4e-05 (Fisher's exact test), Q value = 0.0022
Table S34. Gene #36: 'amp_17q12' versus Molecular Subtype #2: 'METHYLATION_CNMF'
| nPatients | CLUS_1 | CLUS_2 | CLUS_3 | CLUS_4 |
|---|---|---|---|---|
| ALL | 35 | 33 | 16 | 12 |
| AMP PEAK 36(17Q12) MUTATED | 1 | 5 | 10 | 2 |
| AMP PEAK 36(17Q12) WILD-TYPE | 34 | 28 | 6 | 10 |
Figure S34. Get High-res Image Gene #36: 'amp_17q12' versus Molecular Subtype #2: 'METHYLATION_CNMF'
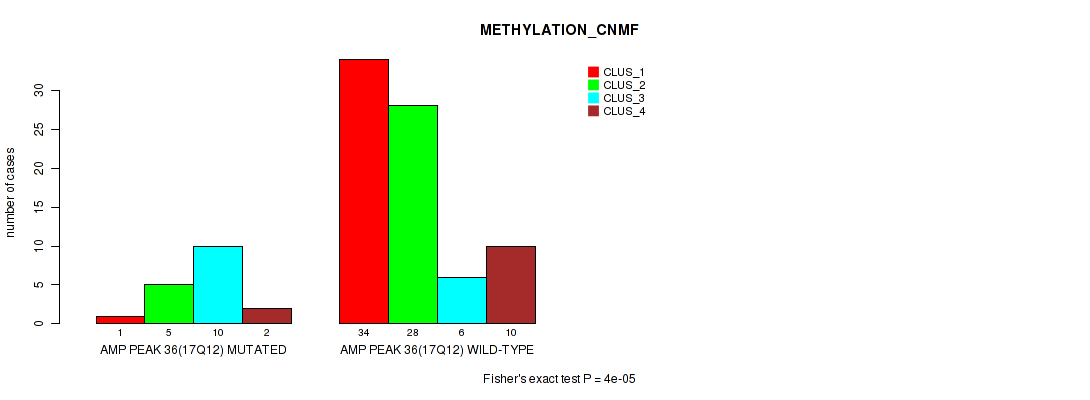
P value = 0.00267 (Fisher's exact test), Q value = 0.026
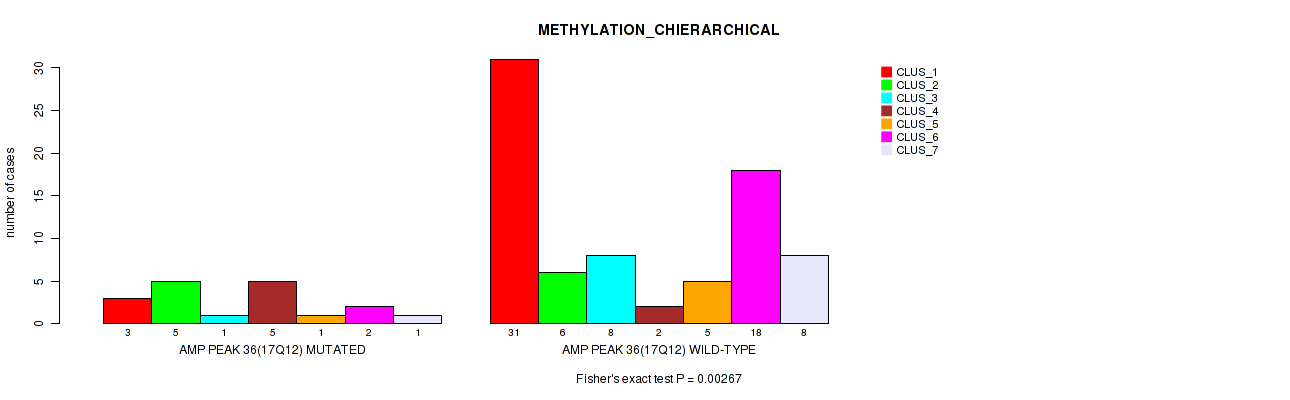
Table S35. Gene #36: 'amp_17q12' versus Molecular Subtype #3: 'METHYLATION_CHIERARCHICAL'
| nPatients | CLUS_1 | CLUS_2 | CLUS_3 | CLUS_4 | CLUS_5 | CLUS_6 | CLUS_7 |
|---|---|---|---|---|---|---|---|
| ALL | 34 | 11 | 9 | 7 | 6 | 20 | 9 |
| AMP PEAK 36(17Q12) MUTATED | 3 | 5 | 1 | 5 | 1 | 2 | 1 |
| AMP PEAK 36(17Q12) WILD-TYPE | 31 | 6 | 8 | 2 | 5 | 18 | 8 |
Figure S35. Get High-res Image Gene #36: 'amp_17q12' versus Molecular Subtype #3: 'METHYLATION_CHIERARCHICAL'
P value = 0.0376 (Fisher's exact test), Q value = 0.14
Table S36. Gene #37: 'amp_17q24.1' versus Molecular Subtype #2: 'METHYLATION_CNMF'
| nPatients | CLUS_1 | CLUS_2 | CLUS_3 | CLUS_4 |
|---|---|---|---|---|
| ALL | 35 | 33 | 16 | 12 |
| AMP PEAK 37(17Q24.1) MUTATED | 2 | 6 | 5 | 4 |
| AMP PEAK 37(17Q24.1) WILD-TYPE | 33 | 27 | 11 | 8 |
Figure S36. Get High-res Image Gene #37: 'amp_17q24.1' versus Molecular Subtype #2: 'METHYLATION_CNMF'
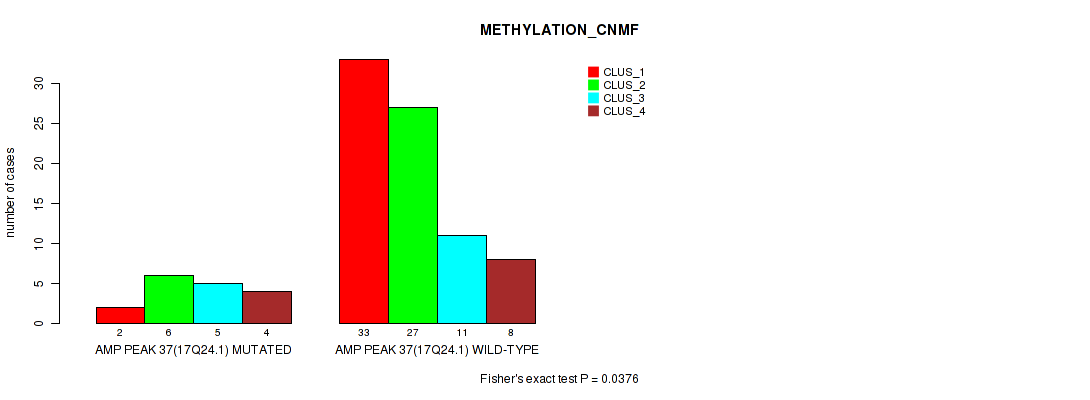
P value = 0.00281 (Fisher's exact test), Q value = 0.026
Table S37. Gene #39: 'amp_19p13.2' versus Molecular Subtype #2: 'METHYLATION_CNMF'
| nPatients | CLUS_1 | CLUS_2 | CLUS_3 | CLUS_4 |
|---|---|---|---|---|
| ALL | 35 | 33 | 16 | 12 |
| AMP PEAK 39(19P13.2) MUTATED | 4 | 5 | 9 | 1 |
| AMP PEAK 39(19P13.2) WILD-TYPE | 31 | 28 | 7 | 11 |
Figure S37. Get High-res Image Gene #39: 'amp_19p13.2' versus Molecular Subtype #2: 'METHYLATION_CNMF'
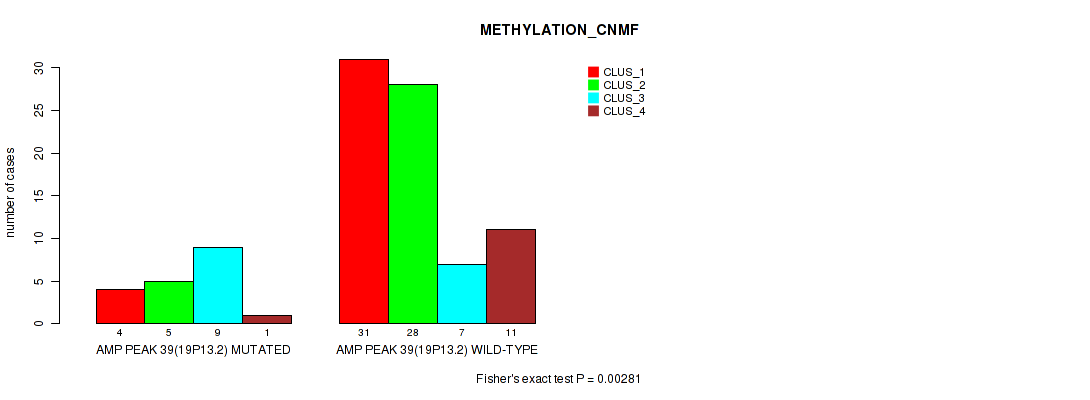
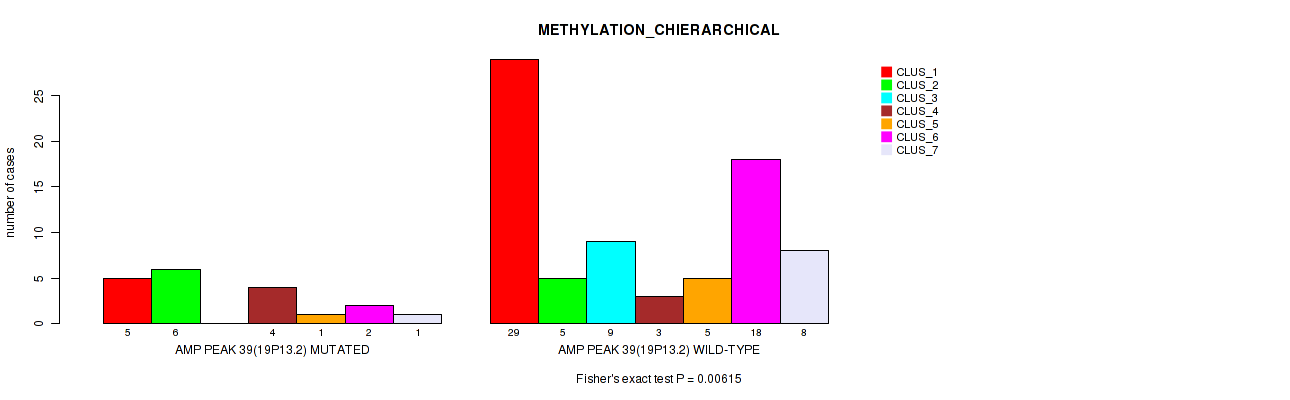
P value = 0.00615 (Fisher's exact test), Q value = 0.041
Table S38. Gene #39: 'amp_19p13.2' versus Molecular Subtype #3: 'METHYLATION_CHIERARCHICAL'
| nPatients | CLUS_1 | CLUS_2 | CLUS_3 | CLUS_4 | CLUS_5 | CLUS_6 | CLUS_7 |
|---|---|---|---|---|---|---|---|
| ALL | 34 | 11 | 9 | 7 | 6 | 20 | 9 |
| AMP PEAK 39(19P13.2) MUTATED | 5 | 6 | 0 | 4 | 1 | 2 | 1 |
| AMP PEAK 39(19P13.2) WILD-TYPE | 29 | 5 | 9 | 3 | 5 | 18 | 8 |
Figure S38. Get High-res Image Gene #39: 'amp_19p13.2' versus Molecular Subtype #3: 'METHYLATION_CHIERARCHICAL'
P value = 0.03 (Fisher's exact test), Q value = 0.12
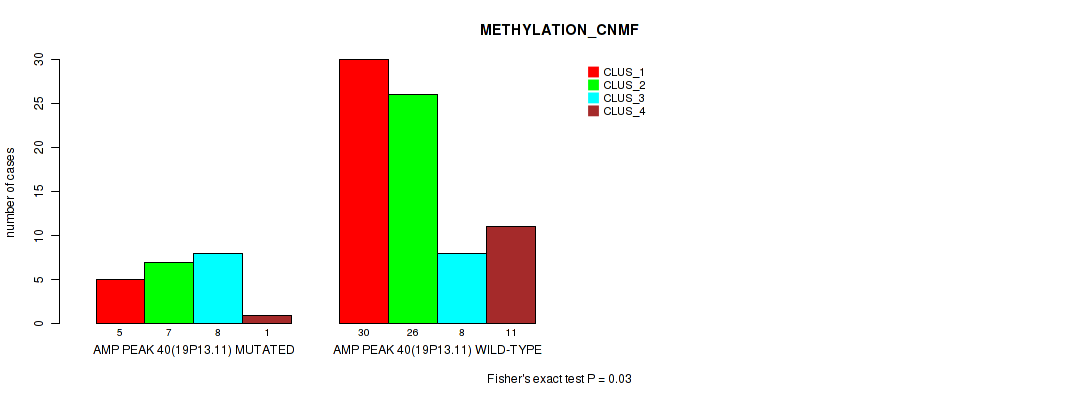
Table S39. Gene #40: 'amp_19p13.11' versus Molecular Subtype #2: 'METHYLATION_CNMF'
| nPatients | CLUS_1 | CLUS_2 | CLUS_3 | CLUS_4 |
|---|---|---|---|---|
| ALL | 35 | 33 | 16 | 12 |
| AMP PEAK 40(19P13.11) MUTATED | 5 | 7 | 8 | 1 |
| AMP PEAK 40(19P13.11) WILD-TYPE | 30 | 26 | 8 | 11 |
Figure S39. Get High-res Image Gene #40: 'amp_19p13.11' versus Molecular Subtype #2: 'METHYLATION_CNMF'
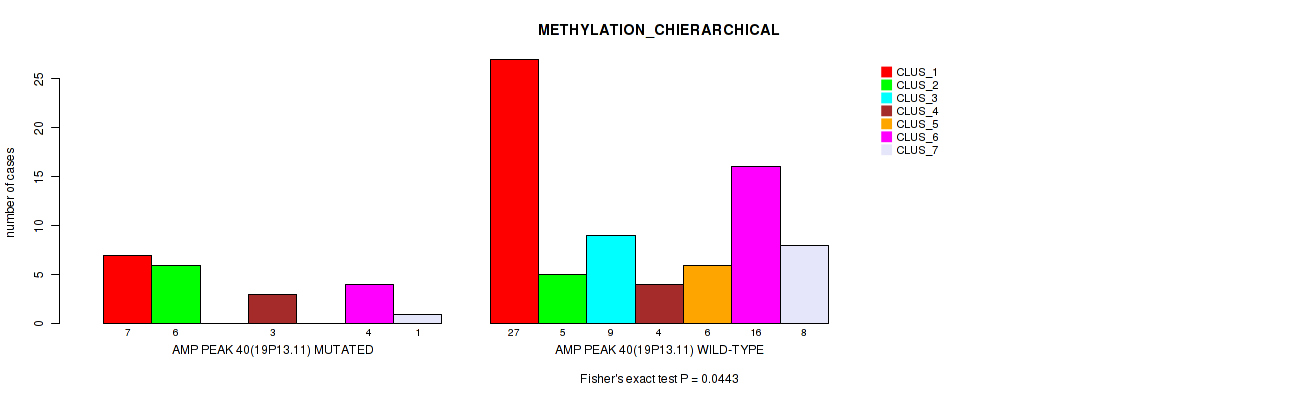
P value = 0.0443 (Fisher's exact test), Q value = 0.16
Table S40. Gene #40: 'amp_19p13.11' versus Molecular Subtype #3: 'METHYLATION_CHIERARCHICAL'
| nPatients | CLUS_1 | CLUS_2 | CLUS_3 | CLUS_4 | CLUS_5 | CLUS_6 | CLUS_7 |
|---|---|---|---|---|---|---|---|
| ALL | 34 | 11 | 9 | 7 | 6 | 20 | 9 |
| AMP PEAK 40(19P13.11) MUTATED | 7 | 6 | 0 | 3 | 0 | 4 | 1 |
| AMP PEAK 40(19P13.11) WILD-TYPE | 27 | 5 | 9 | 4 | 6 | 16 | 8 |
Figure S40. Get High-res Image Gene #40: 'amp_19p13.11' versus Molecular Subtype #3: 'METHYLATION_CHIERARCHICAL'
P value = 0.0257 (Fisher's exact test), Q value = 0.11
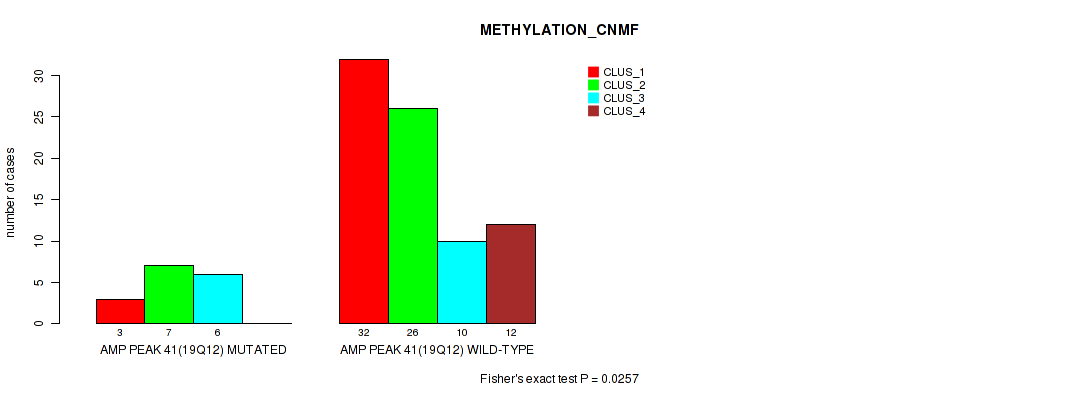
Table S41. Gene #41: 'amp_19q12' versus Molecular Subtype #2: 'METHYLATION_CNMF'
| nPatients | CLUS_1 | CLUS_2 | CLUS_3 | CLUS_4 |
|---|---|---|---|---|
| ALL | 35 | 33 | 16 | 12 |
| AMP PEAK 41(19Q12) MUTATED | 3 | 7 | 6 | 0 |
| AMP PEAK 41(19Q12) WILD-TYPE | 32 | 26 | 10 | 12 |
Figure S41. Get High-res Image Gene #41: 'amp_19q12' versus Molecular Subtype #2: 'METHYLATION_CNMF'
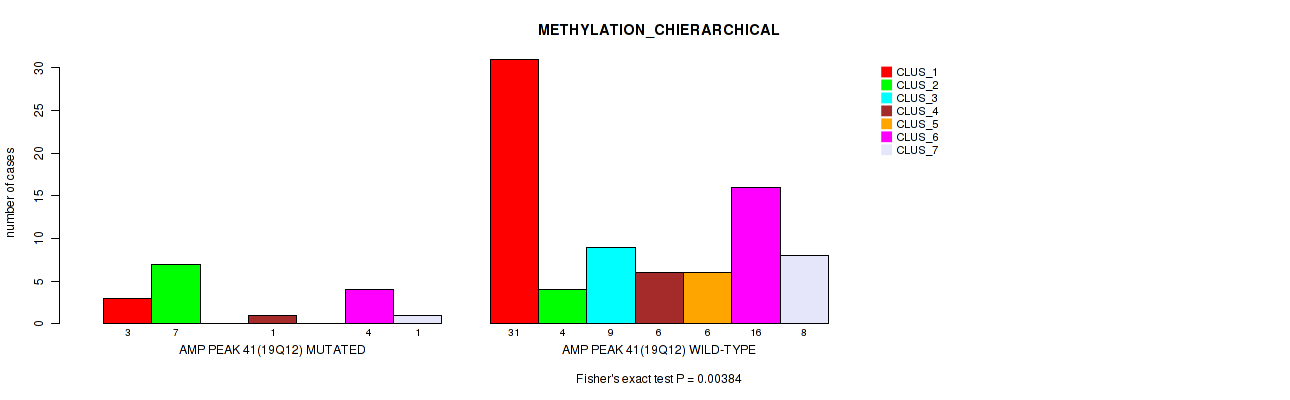
P value = 0.00384 (Fisher's exact test), Q value = 0.029
Table S42. Gene #41: 'amp_19q12' versus Molecular Subtype #3: 'METHYLATION_CHIERARCHICAL'
| nPatients | CLUS_1 | CLUS_2 | CLUS_3 | CLUS_4 | CLUS_5 | CLUS_6 | CLUS_7 |
|---|---|---|---|---|---|---|---|
| ALL | 34 | 11 | 9 | 7 | 6 | 20 | 9 |
| AMP PEAK 41(19Q12) MUTATED | 3 | 7 | 0 | 1 | 0 | 4 | 1 |
| AMP PEAK 41(19Q12) WILD-TYPE | 31 | 4 | 9 | 6 | 6 | 16 | 8 |
Figure S42. Get High-res Image Gene #41: 'amp_19q12' versus Molecular Subtype #3: 'METHYLATION_CHIERARCHICAL'
P value = 0.013 (Fisher's exact test), Q value = 0.069
Table S43. Gene #42: 'amp_19q13.2' versus Molecular Subtype #2: 'METHYLATION_CNMF'
| nPatients | CLUS_1 | CLUS_2 | CLUS_3 | CLUS_4 |
|---|---|---|---|---|
| ALL | 35 | 33 | 16 | 12 |
| AMP PEAK 42(19Q13.2) MUTATED | 4 | 5 | 8 | 1 |
| AMP PEAK 42(19Q13.2) WILD-TYPE | 31 | 28 | 8 | 11 |
Figure S43. Get High-res Image Gene #42: 'amp_19q13.2' versus Molecular Subtype #2: 'METHYLATION_CNMF'
P value = 0.00346 (Fisher's exact test), Q value = 0.028
Table S44. Gene #42: 'amp_19q13.2' versus Molecular Subtype #3: 'METHYLATION_CHIERARCHICAL'
| nPatients | CLUS_1 | CLUS_2 | CLUS_3 | CLUS_4 | CLUS_5 | CLUS_6 | CLUS_7 |
|---|---|---|---|---|---|---|---|
| ALL | 34 | 11 | 9 | 7 | 6 | 20 | 9 |
| AMP PEAK 42(19Q13.2) MUTATED | 4 | 6 | 0 | 3 | 1 | 1 | 3 |
| AMP PEAK 42(19Q13.2) WILD-TYPE | 30 | 5 | 9 | 4 | 5 | 19 | 6 |
Figure S44. Get High-res Image Gene #42: 'amp_19q13.2' versus Molecular Subtype #3: 'METHYLATION_CHIERARCHICAL'

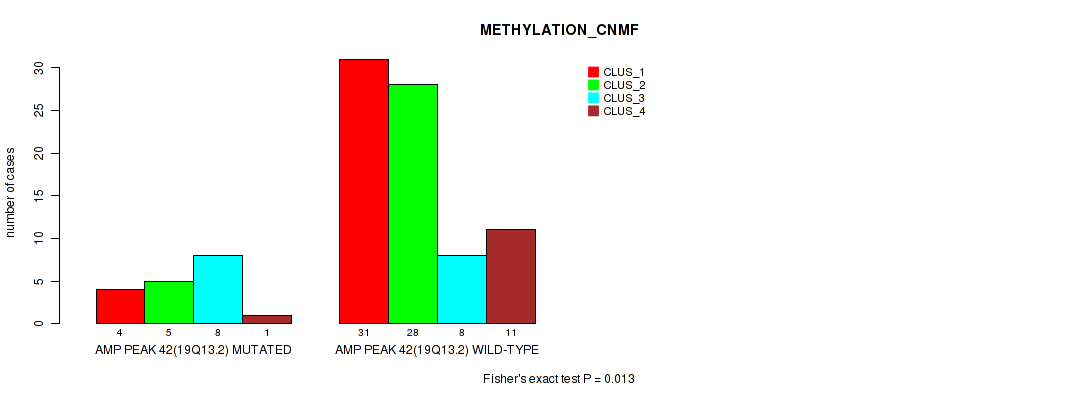
P value = 0.00061 (Fisher's exact test), Q value = 0.014
Table S45. Gene #43: 'amp_20q13.33' versus Molecular Subtype #2: 'METHYLATION_CNMF'
| nPatients | CLUS_1 | CLUS_2 | CLUS_3 | CLUS_4 |
|---|---|---|---|---|
| ALL | 35 | 33 | 16 | 12 |
| AMP PEAK 43(20Q13.33) MUTATED | 6 | 7 | 11 | 1 |
| AMP PEAK 43(20Q13.33) WILD-TYPE | 29 | 26 | 5 | 11 |
Figure S45. Get High-res Image Gene #43: 'amp_20q13.33' versus Molecular Subtype #2: 'METHYLATION_CNMF'
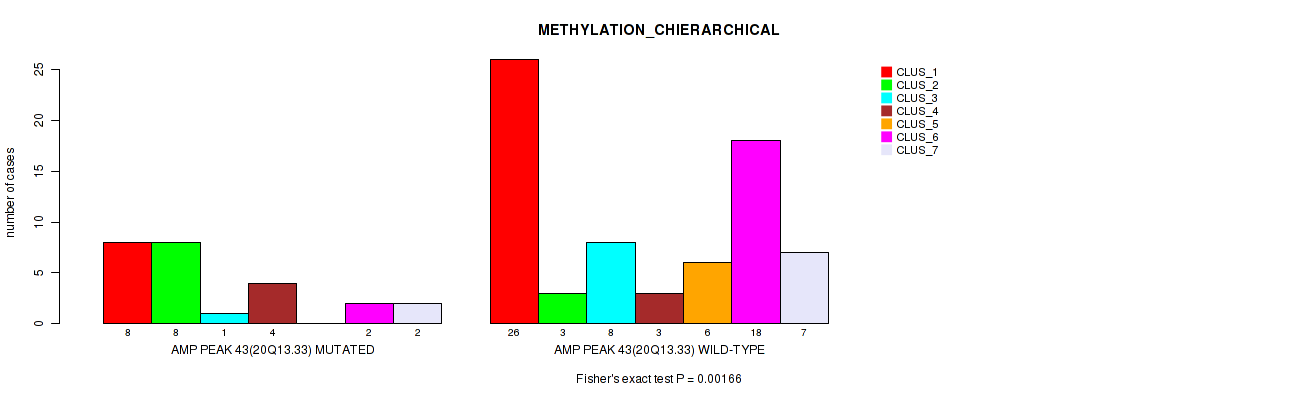
P value = 0.00166 (Fisher's exact test), Q value = 0.021
Table S46. Gene #43: 'amp_20q13.33' versus Molecular Subtype #3: 'METHYLATION_CHIERARCHICAL'
| nPatients | CLUS_1 | CLUS_2 | CLUS_3 | CLUS_4 | CLUS_5 | CLUS_6 | CLUS_7 |
|---|---|---|---|---|---|---|---|
| ALL | 34 | 11 | 9 | 7 | 6 | 20 | 9 |
| AMP PEAK 43(20Q13.33) MUTATED | 8 | 8 | 1 | 4 | 0 | 2 | 2 |
| AMP PEAK 43(20Q13.33) WILD-TYPE | 26 | 3 | 8 | 3 | 6 | 18 | 7 |
Figure S46. Get High-res Image Gene #43: 'amp_20q13.33' versus Molecular Subtype #3: 'METHYLATION_CHIERARCHICAL'
P value = 0.00921 (Fisher's exact test), Q value = 0.055
Table S47. Gene #50: 'del_1p36.12' versus Molecular Subtype #2: 'METHYLATION_CNMF'
| nPatients | CLUS_1 | CLUS_2 | CLUS_3 | CLUS_4 |
|---|---|---|---|---|
| ALL | 35 | 33 | 16 | 12 |
| DEL PEAK 2(1P36.12) MUTATED | 4 | 2 | 7 | 1 |
| DEL PEAK 2(1P36.12) WILD-TYPE | 31 | 31 | 9 | 11 |
Figure S47. Get High-res Image Gene #50: 'del_1p36.12' versus Molecular Subtype #2: 'METHYLATION_CNMF'

P value = 0.00066 (Fisher's exact test), Q value = 0.014
Table S48. Gene #51: 'del_1p13.2' versus Molecular Subtype #2: 'METHYLATION_CNMF'
| nPatients | CLUS_1 | CLUS_2 | CLUS_3 | CLUS_4 |
|---|---|---|---|---|
| ALL | 35 | 33 | 16 | 12 |
| DEL PEAK 3(1P13.2) MUTATED | 2 | 1 | 7 | 2 |
| DEL PEAK 3(1P13.2) WILD-TYPE | 33 | 32 | 9 | 10 |
Figure S48. Get High-res Image Gene #51: 'del_1p13.2' versus Molecular Subtype #2: 'METHYLATION_CNMF'
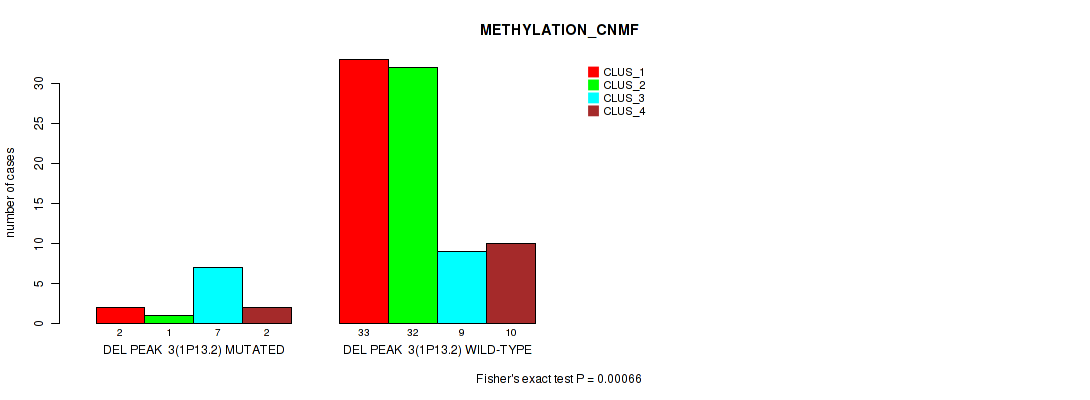
P value = 0.00205 (Fisher's exact test), Q value = 0.025
Table S49. Gene #51: 'del_1p13.2' versus Molecular Subtype #3: 'METHYLATION_CHIERARCHICAL'
| nPatients | CLUS_1 | CLUS_2 | CLUS_3 | CLUS_4 | CLUS_5 | CLUS_6 | CLUS_7 |
|---|---|---|---|---|---|---|---|
| ALL | 34 | 11 | 9 | 7 | 6 | 20 | 9 |
| DEL PEAK 3(1P13.2) MUTATED | 3 | 5 | 1 | 3 | 0 | 0 | 0 |
| DEL PEAK 3(1P13.2) WILD-TYPE | 31 | 6 | 8 | 4 | 6 | 20 | 9 |
Figure S49. Get High-res Image Gene #51: 'del_1p13.2' versus Molecular Subtype #3: 'METHYLATION_CHIERARCHICAL'

P value = 0.0222 (Fisher's exact test), Q value = 0.1
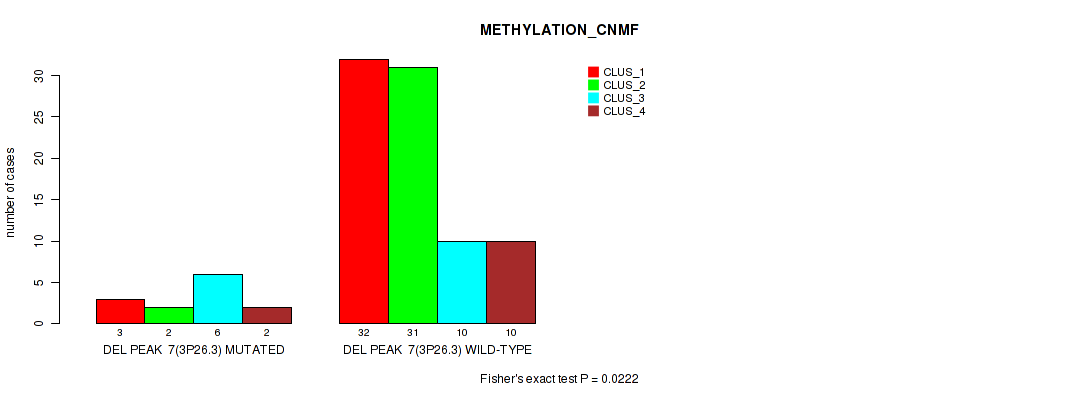
Table S50. Gene #54: 'del_3p26.3' versus Molecular Subtype #2: 'METHYLATION_CNMF'
| nPatients | CLUS_1 | CLUS_2 | CLUS_3 | CLUS_4 |
|---|---|---|---|---|
| ALL | 35 | 33 | 16 | 12 |
| DEL PEAK 7(3P26.3) MUTATED | 3 | 2 | 6 | 2 |
| DEL PEAK 7(3P26.3) WILD-TYPE | 32 | 31 | 10 | 10 |
Figure S50. Get High-res Image Gene #54: 'del_3p26.3' versus Molecular Subtype #2: 'METHYLATION_CNMF'
P value = 0.0244 (Fisher's exact test), Q value = 0.11
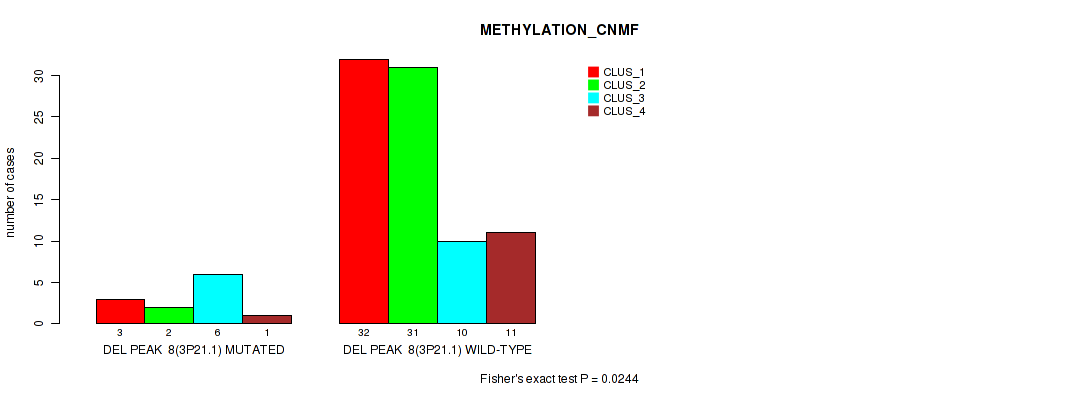
Table S51. Gene #55: 'del_3p21.1' versus Molecular Subtype #2: 'METHYLATION_CNMF'
| nPatients | CLUS_1 | CLUS_2 | CLUS_3 | CLUS_4 |
|---|---|---|---|---|
| ALL | 35 | 33 | 16 | 12 |
| DEL PEAK 8(3P21.1) MUTATED | 3 | 2 | 6 | 1 |
| DEL PEAK 8(3P21.1) WILD-TYPE | 32 | 31 | 10 | 11 |
Figure S51. Get High-res Image Gene #55: 'del_3p21.1' versus Molecular Subtype #2: 'METHYLATION_CNMF'
P value = 0.0289 (Fisher's exact test), Q value = 0.12
Table S52. Gene #55: 'del_3p21.1' versus Molecular Subtype #3: 'METHYLATION_CHIERARCHICAL'
| nPatients | CLUS_1 | CLUS_2 | CLUS_3 | CLUS_4 | CLUS_5 | CLUS_6 | CLUS_7 |
|---|---|---|---|---|---|---|---|
| ALL | 34 | 11 | 9 | 7 | 6 | 20 | 9 |
| DEL PEAK 8(3P21.1) MUTATED | 4 | 5 | 1 | 1 | 0 | 0 | 1 |
| DEL PEAK 8(3P21.1) WILD-TYPE | 30 | 6 | 8 | 6 | 6 | 20 | 8 |
Figure S52. Get High-res Image Gene #55: 'del_3p21.1' versus Molecular Subtype #3: 'METHYLATION_CHIERARCHICAL'

P value = 0.0325 (Fisher's exact test), Q value = 0.13
Table S53. Gene #59: 'del_4p15.31' versus Molecular Subtype #2: 'METHYLATION_CNMF'
| nPatients | CLUS_1 | CLUS_2 | CLUS_3 | CLUS_4 |
|---|---|---|---|---|
| ALL | 35 | 33 | 16 | 12 |
| DEL PEAK 12(4P15.31) MUTATED | 3 | 1 | 5 | 1 |
| DEL PEAK 12(4P15.31) WILD-TYPE | 32 | 32 | 11 | 11 |
Figure S53. Get High-res Image Gene #59: 'del_4p15.31' versus Molecular Subtype #2: 'METHYLATION_CNMF'

P value = 0.0437 (Fisher's exact test), Q value = 0.16
Table S54. Gene #61: 'del_4q21.21' versus Molecular Subtype #3: 'METHYLATION_CHIERARCHICAL'
| nPatients | CLUS_1 | CLUS_2 | CLUS_3 | CLUS_4 | CLUS_5 | CLUS_6 | CLUS_7 |
|---|---|---|---|---|---|---|---|
| ALL | 34 | 11 | 9 | 7 | 6 | 20 | 9 |
| DEL PEAK 14(4Q21.21) MUTATED | 8 | 7 | 0 | 1 | 1 | 4 | 1 |
| DEL PEAK 14(4Q21.21) WILD-TYPE | 26 | 4 | 9 | 6 | 5 | 16 | 8 |
Figure S54. Get High-res Image Gene #61: 'del_4q21.21' versus Molecular Subtype #3: 'METHYLATION_CHIERARCHICAL'

P value = 0.00146 (Fisher's exact test), Q value = 0.02
Table S55. Gene #62: 'del_5q23.1' versus Molecular Subtype #2: 'METHYLATION_CNMF'
| nPatients | CLUS_1 | CLUS_2 | CLUS_3 | CLUS_4 |
|---|---|---|---|---|
| ALL | 35 | 33 | 16 | 12 |
| DEL PEAK 15(5Q23.1) MUTATED | 4 | 0 | 6 | 1 |
| DEL PEAK 15(5Q23.1) WILD-TYPE | 31 | 33 | 10 | 11 |
Figure S55. Get High-res Image Gene #62: 'del_5q23.1' versus Molecular Subtype #2: 'METHYLATION_CNMF'
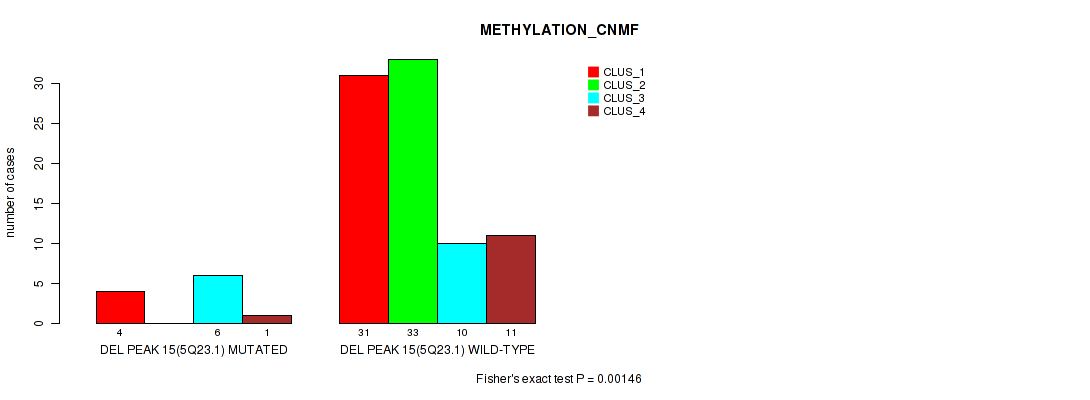
P value = 0.0469 (Fisher's exact test), Q value = 0.16
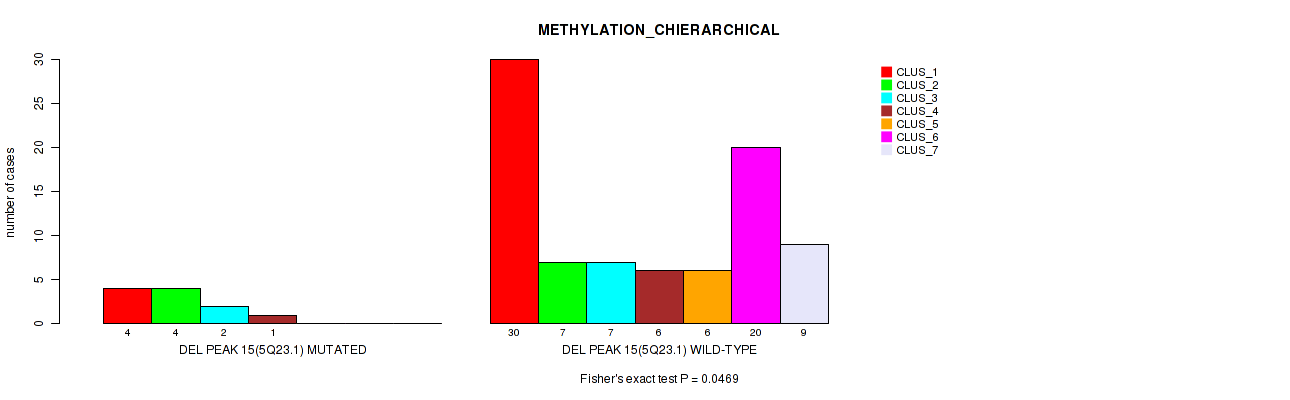
Table S56. Gene #62: 'del_5q23.1' versus Molecular Subtype #3: 'METHYLATION_CHIERARCHICAL'
| nPatients | CLUS_1 | CLUS_2 | CLUS_3 | CLUS_4 | CLUS_5 | CLUS_6 | CLUS_7 |
|---|---|---|---|---|---|---|---|
| ALL | 34 | 11 | 9 | 7 | 6 | 20 | 9 |
| DEL PEAK 15(5Q23.1) MUTATED | 4 | 4 | 2 | 1 | 0 | 0 | 0 |
| DEL PEAK 15(5Q23.1) WILD-TYPE | 30 | 7 | 7 | 6 | 6 | 20 | 9 |
Figure S56. Get High-res Image Gene #62: 'del_5q23.1' versus Molecular Subtype #3: 'METHYLATION_CHIERARCHICAL'
P value = 4e-05 (Fisher's exact test), Q value = 0.0022
Table S57. Gene #63: 'del_6q22.31' versus Molecular Subtype #2: 'METHYLATION_CNMF'
| nPatients | CLUS_1 | CLUS_2 | CLUS_3 | CLUS_4 |
|---|---|---|---|---|
| ALL | 35 | 33 | 16 | 12 |
| DEL PEAK 16(6Q22.31) MUTATED | 0 | 0 | 6 | 2 |
| DEL PEAK 16(6Q22.31) WILD-TYPE | 35 | 33 | 10 | 10 |
Figure S57. Get High-res Image Gene #63: 'del_6q22.31' versus Molecular Subtype #2: 'METHYLATION_CNMF'
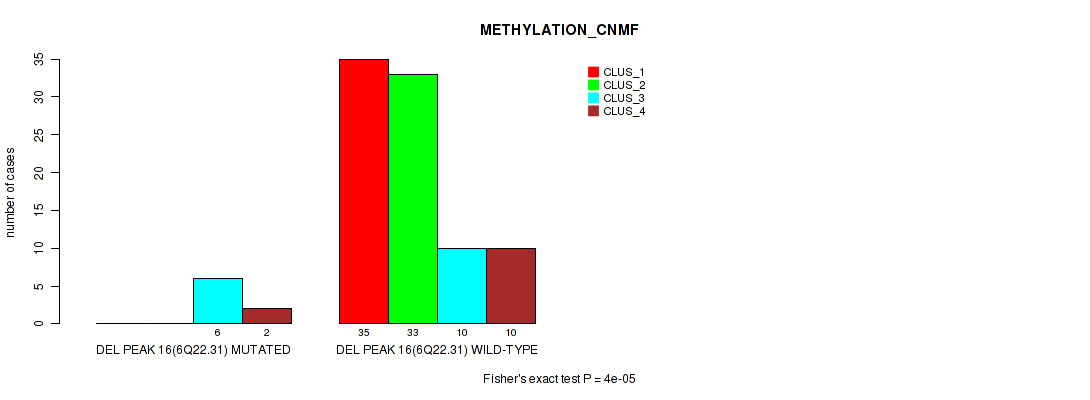
P value = 0.00707 (Fisher's exact test), Q value = 0.045
Table S58. Gene #63: 'del_6q22.31' versus Molecular Subtype #3: 'METHYLATION_CHIERARCHICAL'
| nPatients | CLUS_1 | CLUS_2 | CLUS_3 | CLUS_4 | CLUS_5 | CLUS_6 | CLUS_7 |
|---|---|---|---|---|---|---|---|
| ALL | 34 | 11 | 9 | 7 | 6 | 20 | 9 |
| DEL PEAK 16(6Q22.31) MUTATED | 1 | 4 | 2 | 1 | 0 | 0 | 0 |
| DEL PEAK 16(6Q22.31) WILD-TYPE | 33 | 7 | 7 | 6 | 6 | 20 | 9 |
Figure S58. Get High-res Image Gene #63: 'del_6q22.31' versus Molecular Subtype #3: 'METHYLATION_CHIERARCHICAL'
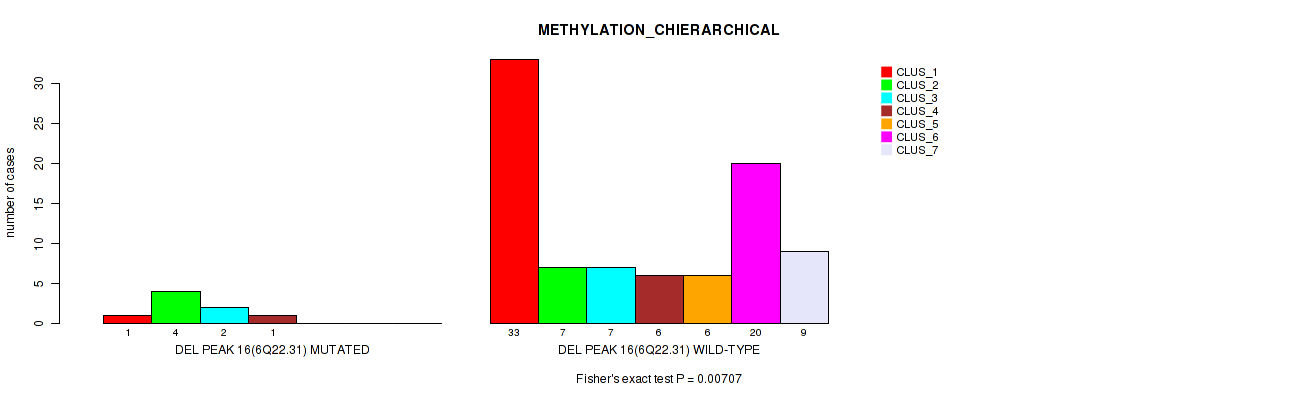
P value = 0.00045 (Fisher's exact test), Q value = 0.011
Table S59. Gene #69: 'del_8p23.2' versus Molecular Subtype #2: 'METHYLATION_CNMF'
| nPatients | CLUS_1 | CLUS_2 | CLUS_3 | CLUS_4 |
|---|---|---|---|---|
| ALL | 35 | 33 | 16 | 12 |
| DEL PEAK 22(8P23.2) MUTATED | 1 | 3 | 7 | 0 |
| DEL PEAK 22(8P23.2) WILD-TYPE | 34 | 30 | 9 | 12 |
Figure S59. Get High-res Image Gene #69: 'del_8p23.2' versus Molecular Subtype #2: 'METHYLATION_CNMF'

P value = 0.00021 (Fisher's exact test), Q value = 0.0063
Table S60. Gene #69: 'del_8p23.2' versus Molecular Subtype #3: 'METHYLATION_CHIERARCHICAL'
| nPatients | CLUS_1 | CLUS_2 | CLUS_3 | CLUS_4 | CLUS_5 | CLUS_6 | CLUS_7 |
|---|---|---|---|---|---|---|---|
| ALL | 34 | 11 | 9 | 7 | 6 | 20 | 9 |
| DEL PEAK 22(8P23.2) MUTATED | 2 | 7 | 0 | 1 | 0 | 1 | 0 |
| DEL PEAK 22(8P23.2) WILD-TYPE | 32 | 4 | 9 | 6 | 6 | 19 | 9 |
Figure S60. Get High-res Image Gene #69: 'del_8p23.2' versus Molecular Subtype #3: 'METHYLATION_CHIERARCHICAL'
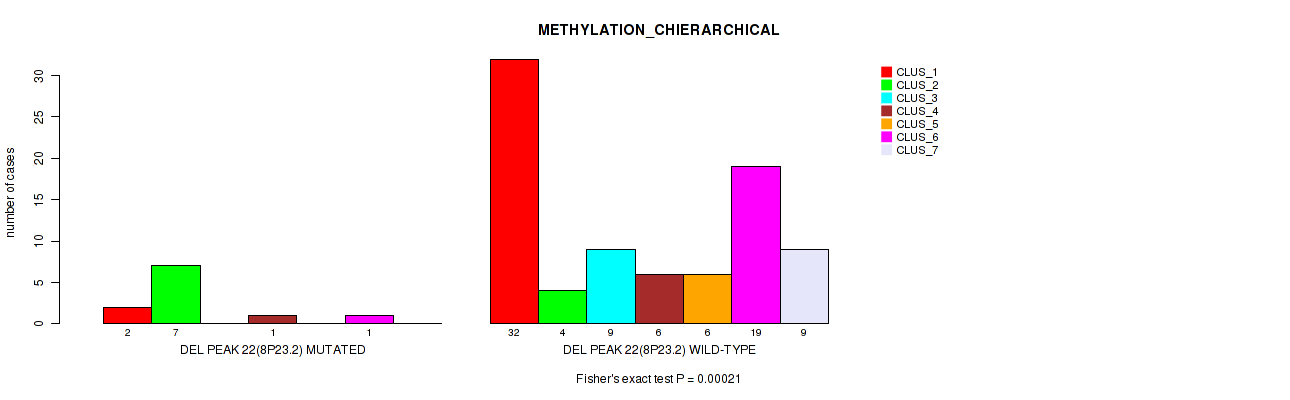
P value = 0.0046 (Fisher's exact test), Q value = 0.032
Table S61. Gene #70: 'del_9p24.3' versus Molecular Subtype #3: 'METHYLATION_CHIERARCHICAL'
| nPatients | CLUS_1 | CLUS_2 | CLUS_3 | CLUS_4 | CLUS_5 | CLUS_6 | CLUS_7 |
|---|---|---|---|---|---|---|---|
| ALL | 34 | 11 | 9 | 7 | 6 | 20 | 9 |
| DEL PEAK 23(9P24.3) MUTATED | 2 | 5 | 2 | 1 | 2 | 0 | 1 |
| DEL PEAK 23(9P24.3) WILD-TYPE | 32 | 6 | 7 | 6 | 4 | 20 | 8 |
Figure S61. Get High-res Image Gene #70: 'del_9p24.3' versus Molecular Subtype #3: 'METHYLATION_CHIERARCHICAL'
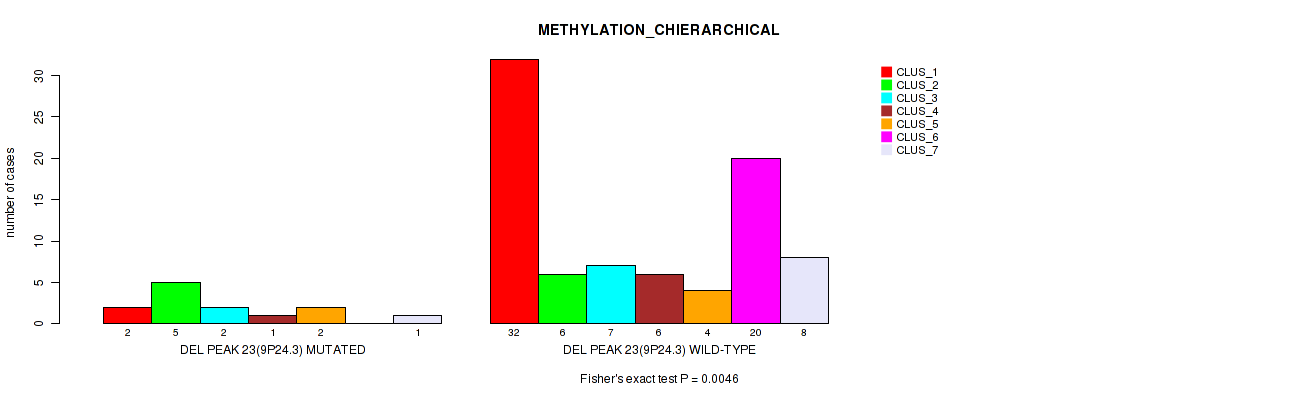
P value = 0.00099 (Fisher's exact test), Q value = 0.016
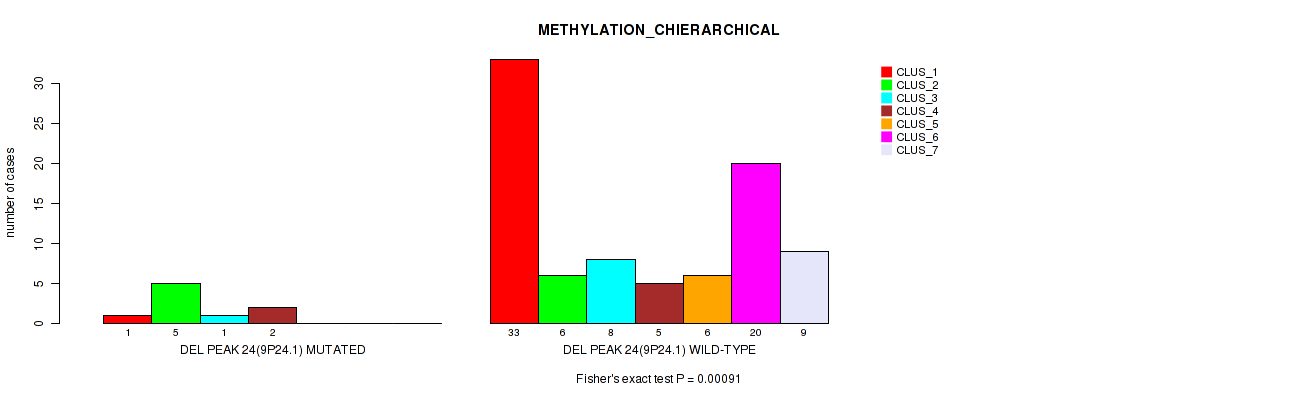
Table S62. Gene #71: 'del_9p24.1' versus Molecular Subtype #2: 'METHYLATION_CNMF'
| nPatients | CLUS_1 | CLUS_2 | CLUS_3 | CLUS_4 |
|---|---|---|---|---|
| ALL | 35 | 33 | 16 | 12 |
| DEL PEAK 24(9P24.1) MUTATED | 1 | 1 | 6 | 1 |
| DEL PEAK 24(9P24.1) WILD-TYPE | 34 | 32 | 10 | 11 |
Figure S62. Get High-res Image Gene #71: 'del_9p24.1' versus Molecular Subtype #2: 'METHYLATION_CNMF'

P value = 0.00091 (Fisher's exact test), Q value = 0.015
Table S63. Gene #71: 'del_9p24.1' versus Molecular Subtype #3: 'METHYLATION_CHIERARCHICAL'
| nPatients | CLUS_1 | CLUS_2 | CLUS_3 | CLUS_4 | CLUS_5 | CLUS_6 | CLUS_7 |
|---|---|---|---|---|---|---|---|
| ALL | 34 | 11 | 9 | 7 | 6 | 20 | 9 |
| DEL PEAK 24(9P24.1) MUTATED | 1 | 5 | 1 | 2 | 0 | 0 | 0 |
| DEL PEAK 24(9P24.1) WILD-TYPE | 33 | 6 | 8 | 5 | 6 | 20 | 9 |
Figure S63. Get High-res Image Gene #71: 'del_9p24.1' versus Molecular Subtype #3: 'METHYLATION_CHIERARCHICAL'
P value = 0.0227 (Fisher's exact test), Q value = 0.11
Table S64. Gene #73: 'del_10q11.22' versus Molecular Subtype #2: 'METHYLATION_CNMF'
| nPatients | CLUS_1 | CLUS_2 | CLUS_3 | CLUS_4 |
|---|---|---|---|---|
| ALL | 35 | 33 | 16 | 12 |
| DEL PEAK 26(10Q11.22) MUTATED | 1 | 0 | 3 | 0 |
| DEL PEAK 26(10Q11.22) WILD-TYPE | 34 | 33 | 13 | 12 |
Figure S64. Get High-res Image Gene #73: 'del_10q11.22' versus Molecular Subtype #2: 'METHYLATION_CNMF'
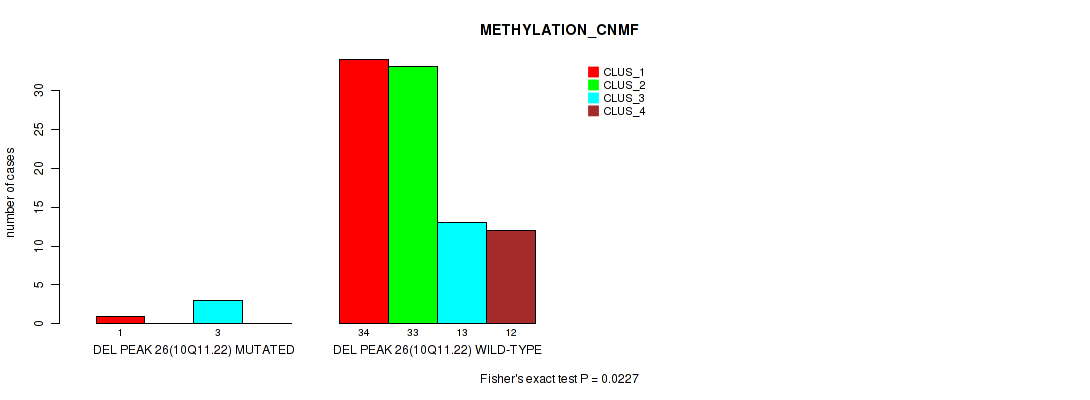
P value = 1e-05 (Fisher's exact test), Q value = 0.0016
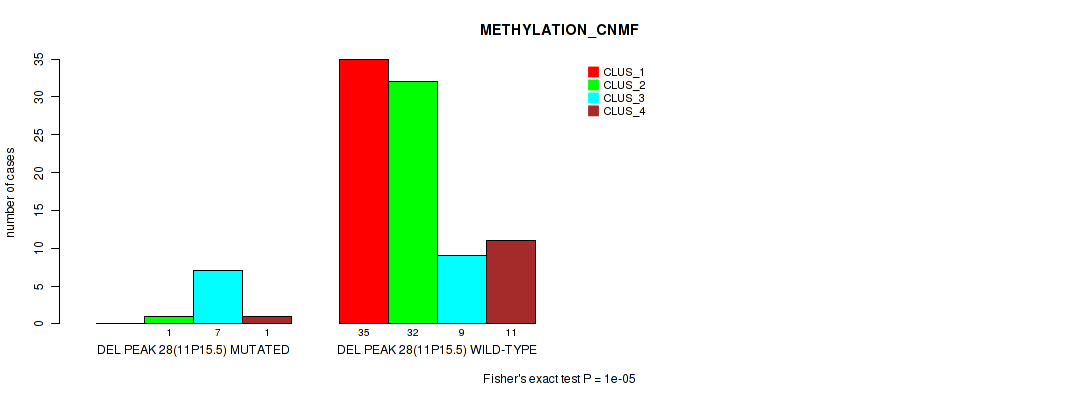
Table S65. Gene #75: 'del_11p15.5' versus Molecular Subtype #2: 'METHYLATION_CNMF'
| nPatients | CLUS_1 | CLUS_2 | CLUS_3 | CLUS_4 |
|---|---|---|---|---|
| ALL | 35 | 33 | 16 | 12 |
| DEL PEAK 28(11P15.5) MUTATED | 0 | 1 | 7 | 1 |
| DEL PEAK 28(11P15.5) WILD-TYPE | 35 | 32 | 9 | 11 |
Figure S65. Get High-res Image Gene #75: 'del_11p15.5' versus Molecular Subtype #2: 'METHYLATION_CNMF'
P value = 0.00075 (Fisher's exact test), Q value = 0.014
Table S66. Gene #75: 'del_11p15.5' versus Molecular Subtype #3: 'METHYLATION_CHIERARCHICAL'
| nPatients | CLUS_1 | CLUS_2 | CLUS_3 | CLUS_4 | CLUS_5 | CLUS_6 | CLUS_7 |
|---|---|---|---|---|---|---|---|
| ALL | 34 | 11 | 9 | 7 | 6 | 20 | 9 |
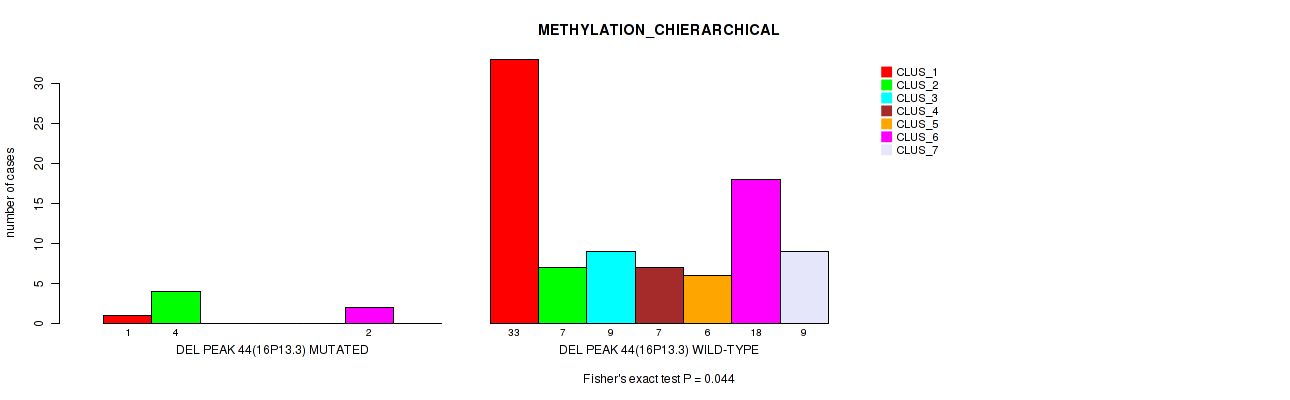
| DEL PEAK 28(11P15.5) MUTATED | 1 | 5 | 1 | 2 | 0 | 0 | 0 |
| DEL PEAK 28(11P15.5) WILD-TYPE | 33 | 6 | 8 | 5 | 6 | 20 | 9 |
Figure S66. Get High-res Image Gene #75: 'del_11p15.5' versus Molecular Subtype #3: 'METHYLATION_CHIERARCHICAL'
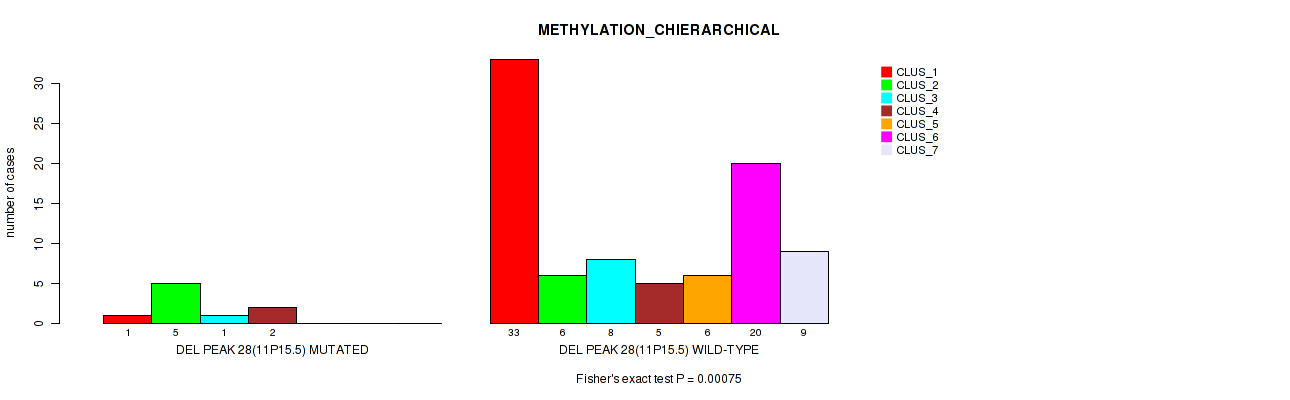
P value = 0.0138 (Fisher's exact test), Q value = 0.072
Table S67. Gene #76: 'del_11p15.3' versus Molecular Subtype #2: 'METHYLATION_CNMF'
| nPatients | CLUS_1 | CLUS_2 | CLUS_3 | CLUS_4 |
|---|---|---|---|---|
| ALL | 35 | 33 | 16 | 12 |
| DEL PEAK 29(11P15.3) MUTATED | 2 | 4 | 6 | 0 |
| DEL PEAK 29(11P15.3) WILD-TYPE | 33 | 29 | 10 | 12 |
Figure S67. Get High-res Image Gene #76: 'del_11p15.3' versus Molecular Subtype #2: 'METHYLATION_CNMF'
P value = 0.00251 (Fisher's exact test), Q value = 0.026
Table S68. Gene #76: 'del_11p15.3' versus Molecular Subtype #3: 'METHYLATION_CHIERARCHICAL'
| nPatients | CLUS_1 | CLUS_2 | CLUS_3 | CLUS_4 | CLUS_5 | CLUS_6 | CLUS_7 |
|---|---|---|---|---|---|---|---|
| ALL | 34 | 11 | 9 | 7 | 6 | 20 | 9 |
| DEL PEAK 29(11P15.3) MUTATED | 2 | 6 | 0 | 2 | 0 | 1 | 1 |
| DEL PEAK 29(11P15.3) WILD-TYPE | 32 | 5 | 9 | 5 | 6 | 19 | 8 |
Figure S68. Get High-res Image Gene #76: 'del_11p15.3' versus Molecular Subtype #3: 'METHYLATION_CHIERARCHICAL'
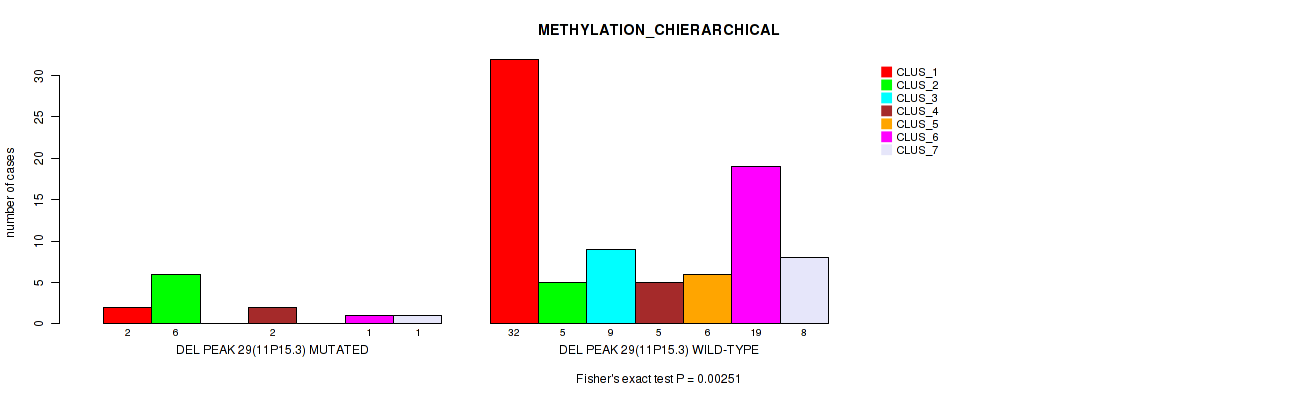
P value = 0.00716 (Fisher's exact test), Q value = 0.045
Table S69. Gene #78: 'del_11q24.2' versus Molecular Subtype #2: 'METHYLATION_CNMF'
| nPatients | CLUS_1 | CLUS_2 | CLUS_3 | CLUS_4 |
|---|---|---|---|---|
| ALL | 35 | 33 | 16 | 12 |
| DEL PEAK 31(11Q24.2) MUTATED | 4 | 3 | 7 | 0 |
| DEL PEAK 31(11Q24.2) WILD-TYPE | 31 | 30 | 9 | 12 |
Figure S69. Get High-res Image Gene #78: 'del_11q24.2' versus Molecular Subtype #2: 'METHYLATION_CNMF'
P value = 0.00084 (Fisher's exact test), Q value = 0.015
Table S70. Gene #78: 'del_11q24.2' versus Molecular Subtype #3: 'METHYLATION_CHIERARCHICAL'
| nPatients | CLUS_1 | CLUS_2 | CLUS_3 | CLUS_4 | CLUS_5 | CLUS_6 | CLUS_7 |
|---|---|---|---|---|---|---|---|
| ALL | 34 | 11 | 9 | 7 | 6 | 20 | 9 |
| DEL PEAK 31(11Q24.2) MUTATED | 4 | 6 | 0 | 3 | 0 | 0 | 1 |
| DEL PEAK 31(11Q24.2) WILD-TYPE | 30 | 5 | 9 | 4 | 6 | 20 | 8 |
Figure S70. Get High-res Image Gene #78: 'del_11q24.2' versus Molecular Subtype #3: 'METHYLATION_CHIERARCHICAL'

P value = 0.016 (Fisher's exact test), Q value = 0.08
Table S71. Gene #79: 'del_12p13.33' versus Molecular Subtype #2: 'METHYLATION_CNMF'
| nPatients | CLUS_1 | CLUS_2 | CLUS_3 | CLUS_4 |
|---|---|---|---|---|
| ALL | 35 | 33 | 16 | 12 |
| DEL PEAK 32(12P13.33) MUTATED | 0 | 1 | 3 | 0 |
| DEL PEAK 32(12P13.33) WILD-TYPE | 35 | 32 | 13 | 12 |
Figure S71. Get High-res Image Gene #79: 'del_12p13.33' versus Molecular Subtype #2: 'METHYLATION_CNMF'
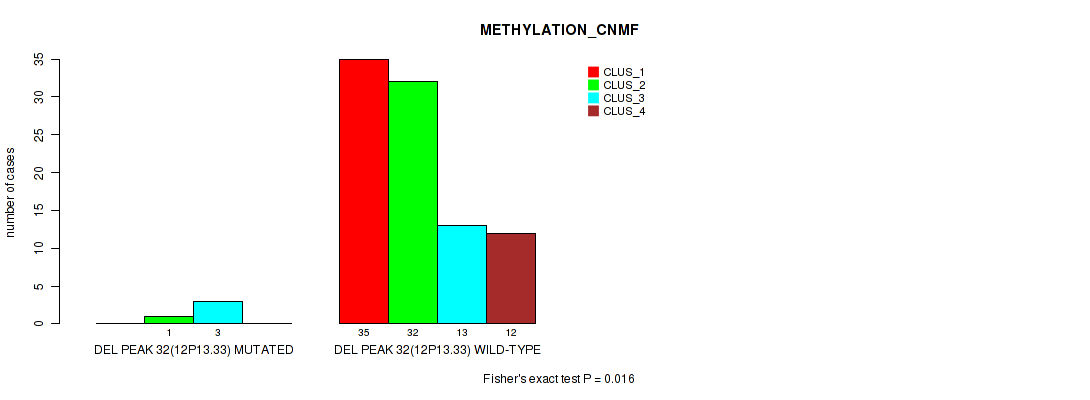
P value = 0.0268 (Fisher's exact test), Q value = 0.12
Table S72. Gene #83: 'del_13q12.11' versus Molecular Subtype #1: 'MRNA_CHIERARCHICAL'
| nPatients | CLUS_1 | CLUS_2 | CLUS_3 | CLUS_4 | CLUS_5 |
|---|---|---|---|---|---|
| ALL | 28 | 20 | 11 | 20 | 21 |
| DEL PEAK 36(13Q12.11) MUTATED | 4 | 0 | 1 | 7 | 2 |
| DEL PEAK 36(13Q12.11) WILD-TYPE | 24 | 20 | 10 | 13 | 19 |
Figure S72. Get High-res Image Gene #83: 'del_13q12.11' versus Molecular Subtype #1: 'MRNA_CHIERARCHICAL'
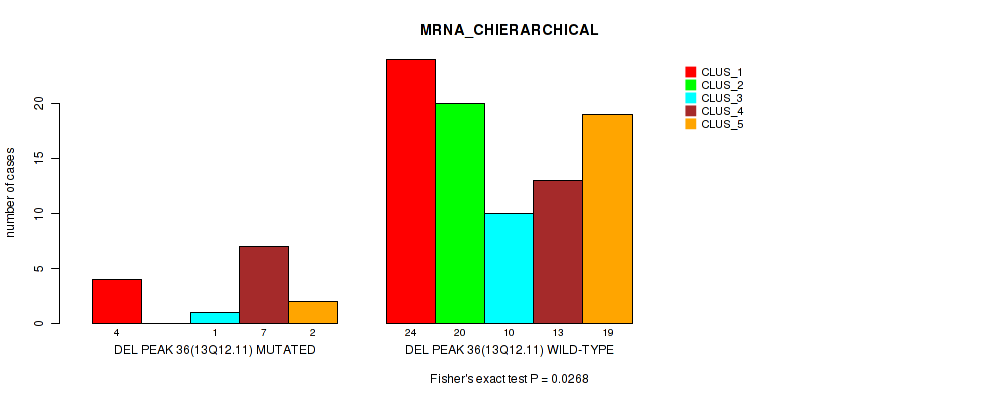
P value = 0.0324 (Fisher's exact test), Q value = 0.13
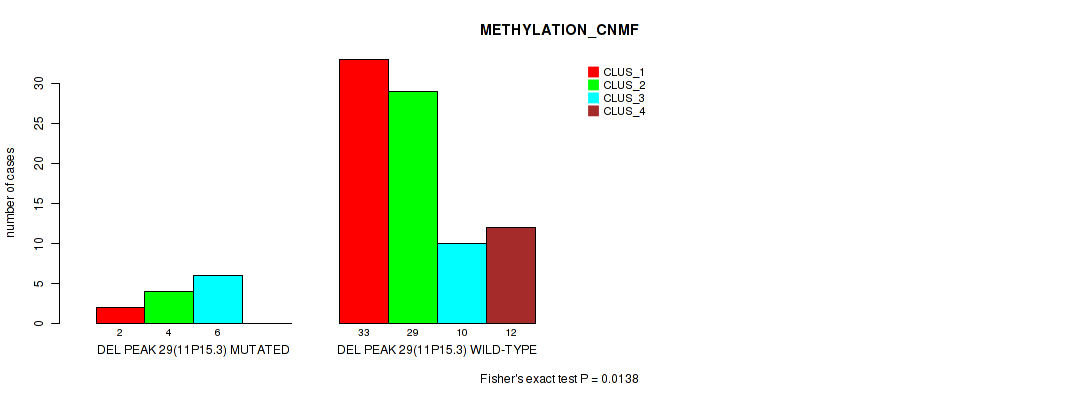
Table S73. Gene #83: 'del_13q12.11' versus Molecular Subtype #2: 'METHYLATION_CNMF'
| nPatients | CLUS_1 | CLUS_2 | CLUS_3 | CLUS_4 |
|---|---|---|---|---|
| ALL | 35 | 33 | 16 | 12 |
| DEL PEAK 36(13Q12.11) MUTATED | 6 | 1 | 5 | 1 |
| DEL PEAK 36(13Q12.11) WILD-TYPE | 29 | 32 | 11 | 11 |
Figure S73. Get High-res Image Gene #83: 'del_13q12.11' versus Molecular Subtype #2: 'METHYLATION_CNMF'
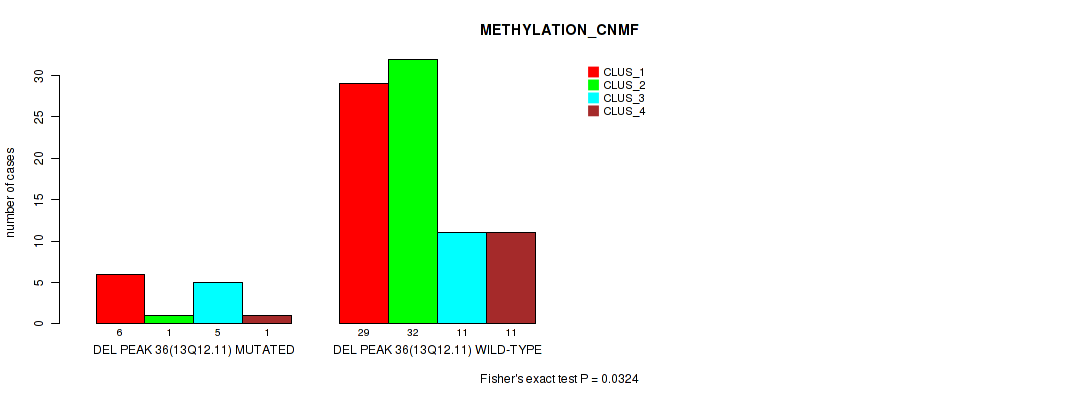
P value = 0.0233 (Fisher's exact test), Q value = 0.11
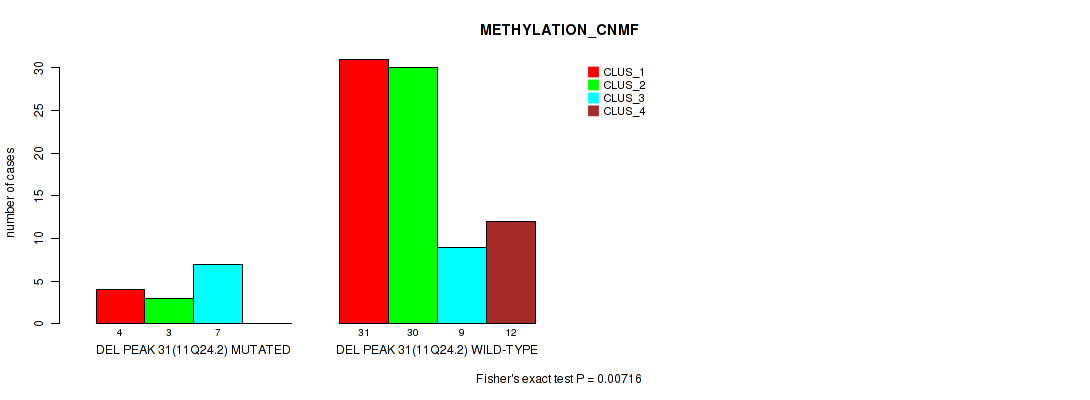
Table S74. Gene #84: 'del_13q31.3' versus Molecular Subtype #2: 'METHYLATION_CNMF'
| nPatients | CLUS_1 | CLUS_2 | CLUS_3 | CLUS_4 |
|---|---|---|---|---|
| ALL | 35 | 33 | 16 | 12 |
| DEL PEAK 37(13Q31.3) MUTATED | 4 | 0 | 4 | 1 |
| DEL PEAK 37(13Q31.3) WILD-TYPE | 31 | 33 | 12 | 11 |
Figure S74. Get High-res Image Gene #84: 'del_13q31.3' versus Molecular Subtype #2: 'METHYLATION_CNMF'
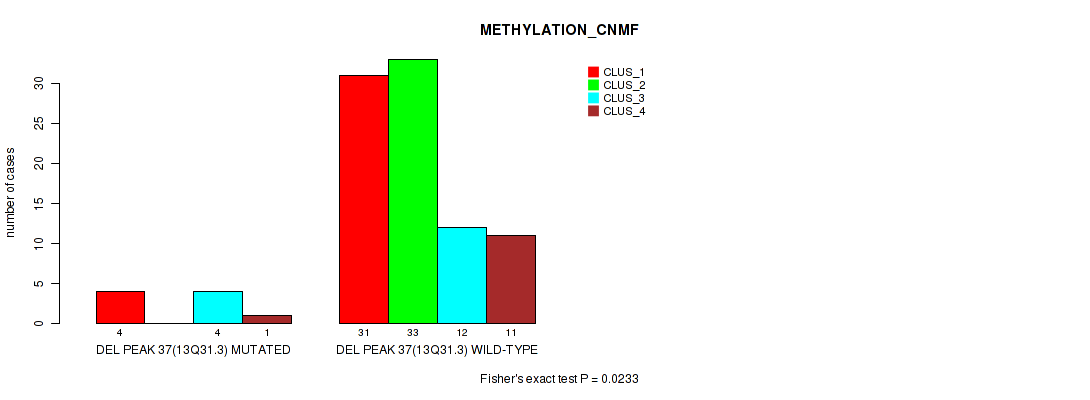
P value = 0.00288 (Fisher's exact test), Q value = 0.026
Table S75. Gene #86: 'del_15q11.2' versus Molecular Subtype #2: 'METHYLATION_CNMF'
| nPatients | CLUS_1 | CLUS_2 | CLUS_3 | CLUS_4 |
|---|---|---|---|---|
| ALL | 35 | 33 | 16 | 12 |
| DEL PEAK 39(15Q11.2) MUTATED | 6 | 2 | 8 | 1 |
| DEL PEAK 39(15Q11.2) WILD-TYPE | 29 | 31 | 8 | 11 |
Figure S75. Get High-res Image Gene #86: 'del_15q11.2' versus Molecular Subtype #2: 'METHYLATION_CNMF'
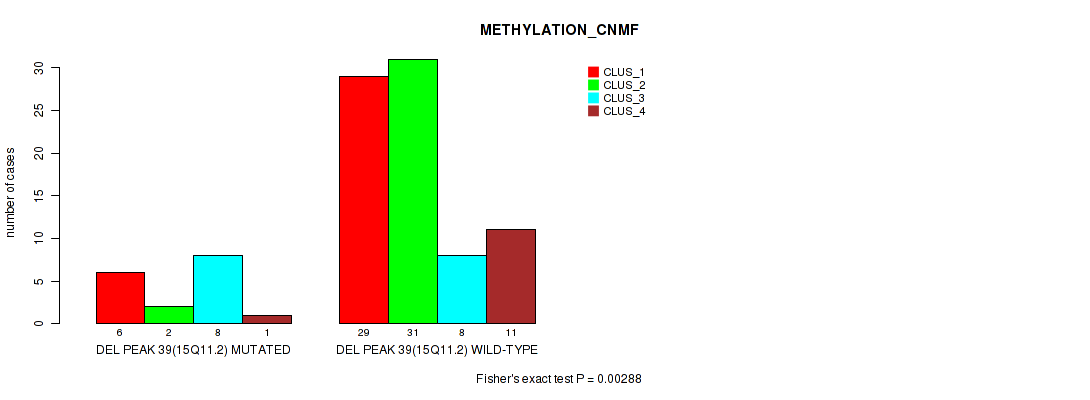
P value = 0.0106 (Fisher's exact test), Q value = 0.059
Table S76. Gene #87: 'del_15q15.1' versus Molecular Subtype #1: 'MRNA_CHIERARCHICAL'
| nPatients | CLUS_1 | CLUS_2 | CLUS_3 | CLUS_4 | CLUS_5 |
|---|---|---|---|---|---|
| ALL | 28 | 20 | 11 | 20 | 21 |
| DEL PEAK 40(15Q15.1) MUTATED | 11 | 6 | 2 | 0 | 7 |
| DEL PEAK 40(15Q15.1) WILD-TYPE | 17 | 14 | 9 | 20 | 14 |
Figure S76. Get High-res Image Gene #87: 'del_15q15.1' versus Molecular Subtype #1: 'MRNA_CHIERARCHICAL'
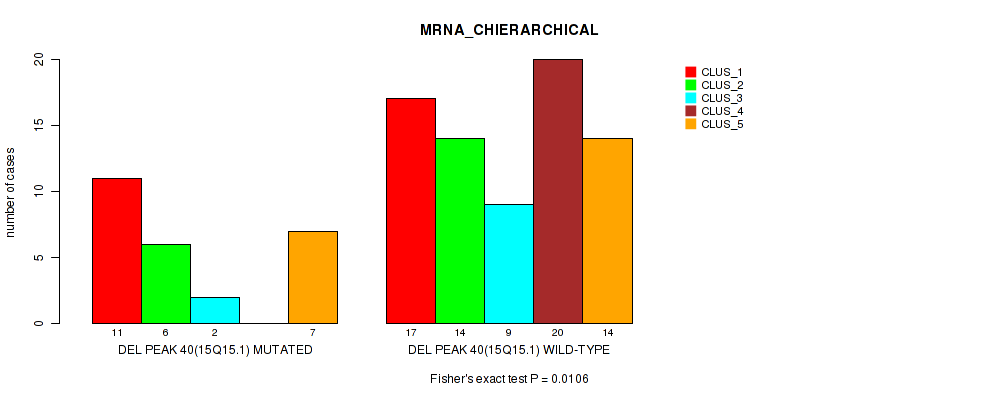
P value = 0.0296 (Fisher's exact test), Q value = 0.12
Table S77. Gene #88: 'del_15q24.2' versus Molecular Subtype #2: 'METHYLATION_CNMF'
| nPatients | CLUS_1 | CLUS_2 | CLUS_3 | CLUS_4 |
|---|---|---|---|---|
| ALL | 35 | 33 | 16 | 12 |
| DEL PEAK 41(15Q24.2) MUTATED | 11 | 4 | 8 | 2 |
| DEL PEAK 41(15Q24.2) WILD-TYPE | 24 | 29 | 8 | 10 |
Figure S77. Get High-res Image Gene #88: 'del_15q24.2' versus Molecular Subtype #2: 'METHYLATION_CNMF'
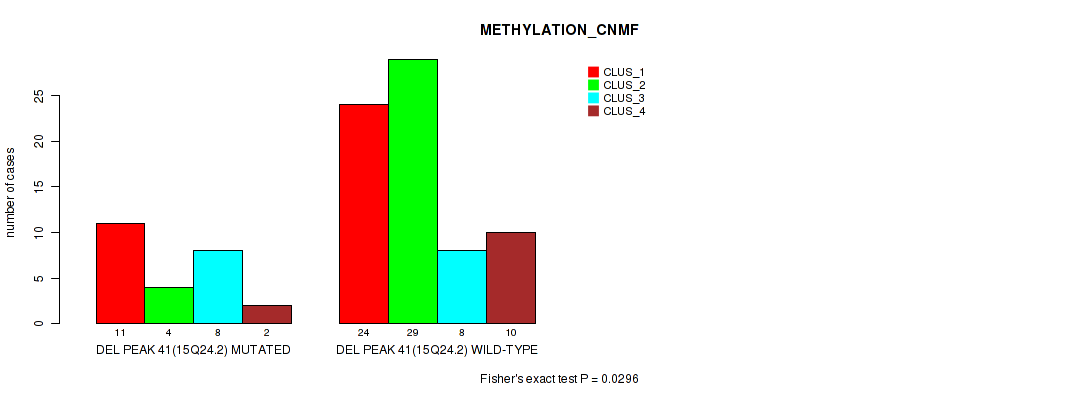
P value = 0.0298 (Fisher's exact test), Q value = 0.12
Table S78. Gene #88: 'del_15q24.2' versus Molecular Subtype #3: 'METHYLATION_CHIERARCHICAL'
| nPatients | CLUS_1 | CLUS_2 | CLUS_3 | CLUS_4 | CLUS_5 | CLUS_6 | CLUS_7 |
|---|---|---|---|---|---|---|---|
| ALL | 34 | 11 | 9 | 7 | 6 | 20 | 9 |
| DEL PEAK 41(15Q24.2) MUTATED | 10 | 4 | 4 | 4 | 0 | 1 | 2 |
| DEL PEAK 41(15Q24.2) WILD-TYPE | 24 | 7 | 5 | 3 | 6 | 19 | 7 |
Figure S78. Get High-res Image Gene #88: 'del_15q24.2' versus Molecular Subtype #3: 'METHYLATION_CHIERARCHICAL'
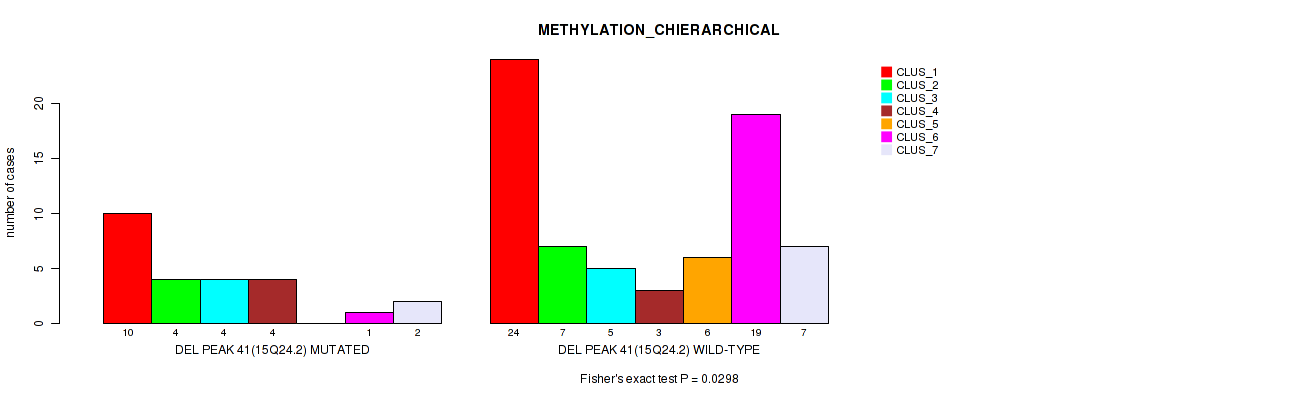
P value = 0.044 (Fisher's exact test), Q value = 0.16
Table S79. Gene #91: 'del_16p13.3' versus Molecular Subtype #3: 'METHYLATION_CHIERARCHICAL'
| nPatients | CLUS_1 | CLUS_2 | CLUS_3 | CLUS_4 | CLUS_5 | CLUS_6 | CLUS_7 |
|---|---|---|---|---|---|---|---|
| ALL | 34 | 11 | 9 | 7 | 6 | 20 | 9 |
| DEL PEAK 44(16P13.3) MUTATED | 1 | 4 | 0 | 0 | 0 | 2 | 0 |
| DEL PEAK 44(16P13.3) WILD-TYPE | 33 | 7 | 9 | 7 | 6 | 18 | 9 |
Figure S79. Get High-res Image Gene #91: 'del_16p13.3' versus Molecular Subtype #3: 'METHYLATION_CHIERARCHICAL'
P value = 0.00391 (Fisher's exact test), Q value = 0.029
Table S80. Gene #92: 'del_16p11.2' versus Molecular Subtype #2: 'METHYLATION_CNMF'
| nPatients | CLUS_1 | CLUS_2 | CLUS_3 | CLUS_4 |
|---|---|---|---|---|
| ALL | 35 | 33 | 16 | 12 |
| DEL PEAK 45(16P11.2) MUTATED | 14 | 2 | 3 | 1 |
| DEL PEAK 45(16P11.2) WILD-TYPE | 21 | 31 | 13 | 11 |
Figure S80. Get High-res Image Gene #92: 'del_16p11.2' versus Molecular Subtype #2: 'METHYLATION_CNMF'
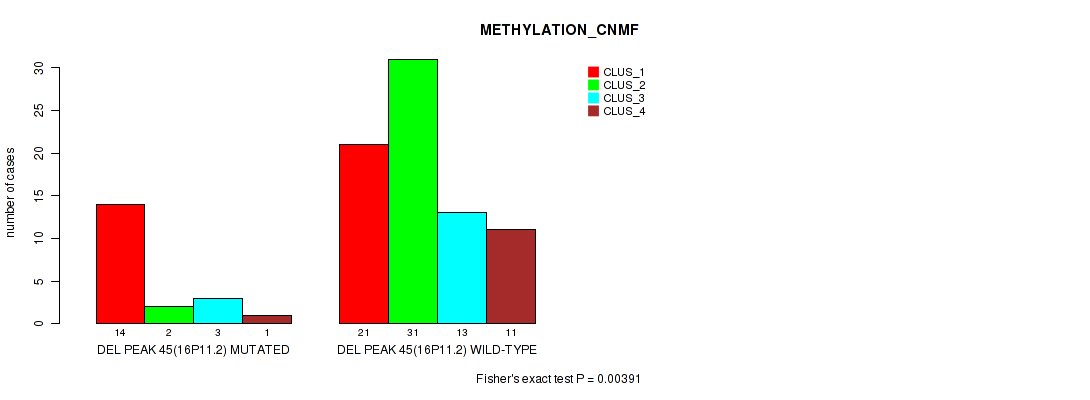
P value = 0.0219 (Fisher's exact test), Q value = 0.1
Table S81. Gene #92: 'del_16p11.2' versus Molecular Subtype #3: 'METHYLATION_CHIERARCHICAL'
| nPatients | CLUS_1 | CLUS_2 | CLUS_3 | CLUS_4 | CLUS_5 | CLUS_6 | CLUS_7 |
|---|---|---|---|---|---|---|---|
| ALL | 34 | 11 | 9 | 7 | 6 | 20 | 9 |
| DEL PEAK 45(16P11.2) MUTATED | 14 | 2 | 1 | 1 | 1 | 1 | 0 |
| DEL PEAK 45(16P11.2) WILD-TYPE | 20 | 9 | 8 | 6 | 5 | 19 | 9 |
Figure S81. Get High-res Image Gene #92: 'del_16p11.2' versus Molecular Subtype #3: 'METHYLATION_CHIERARCHICAL'
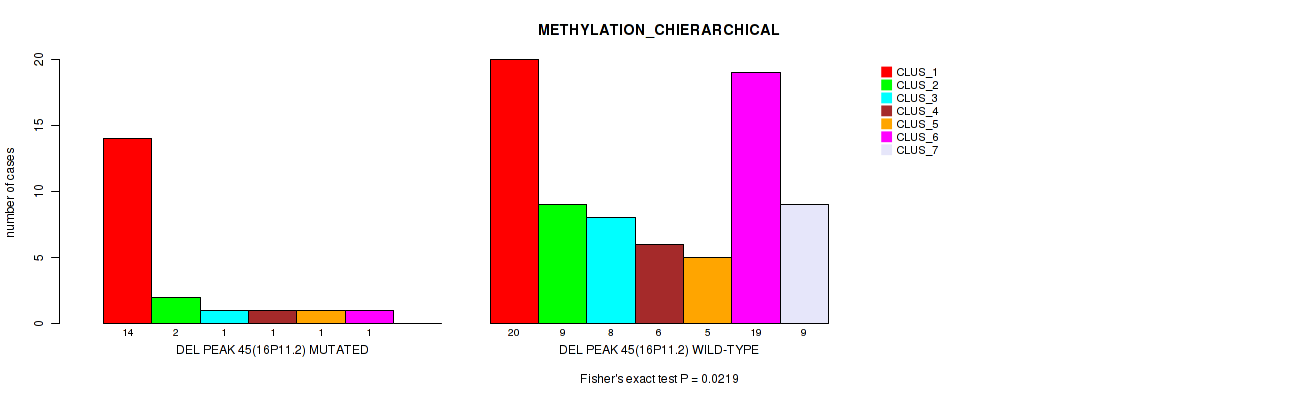
P value = 0.00335 (Fisher's exact test), Q value = 0.028
Table S82. Gene #93: 'del_16q22.1' versus Molecular Subtype #2: 'METHYLATION_CNMF'
| nPatients | CLUS_1 | CLUS_2 | CLUS_3 | CLUS_4 |
|---|---|---|---|---|
| ALL | 35 | 33 | 16 | 12 |
| DEL PEAK 46(16Q22.1) MUTATED | 3 | 1 | 6 | 0 |
| DEL PEAK 46(16Q22.1) WILD-TYPE | 32 | 32 | 10 | 12 |
Figure S82. Get High-res Image Gene #93: 'del_16q22.1' versus Molecular Subtype #2: 'METHYLATION_CNMF'

P value = 0.0463 (Fisher's exact test), Q value = 0.16
Table S83. Gene #93: 'del_16q22.1' versus Molecular Subtype #3: 'METHYLATION_CHIERARCHICAL'
| nPatients | CLUS_1 | CLUS_2 | CLUS_3 | CLUS_4 | CLUS_5 | CLUS_6 | CLUS_7 |
|---|---|---|---|---|---|---|---|
| ALL | 34 | 11 | 9 | 7 | 6 | 20 | 9 |
| DEL PEAK 46(16Q22.1) MUTATED | 3 | 3 | 0 | 3 | 0 | 1 | 0 |
| DEL PEAK 46(16Q22.1) WILD-TYPE | 31 | 8 | 9 | 4 | 6 | 19 | 9 |
Figure S83. Get High-res Image Gene #93: 'del_16q22.1' versus Molecular Subtype #3: 'METHYLATION_CHIERARCHICAL'
P value = 0.0146 (Fisher's exact test), Q value = 0.075
Table S84. Gene #94: 'del_16q22.2' versus Molecular Subtype #2: 'METHYLATION_CNMF'
| nPatients | CLUS_1 | CLUS_2 | CLUS_3 | CLUS_4 |
|---|---|---|---|---|
| ALL | 35 | 33 | 16 | 12 |
| DEL PEAK 47(16Q22.2) MUTATED | 6 | 2 | 6 | 0 |
| DEL PEAK 47(16Q22.2) WILD-TYPE | 29 | 31 | 10 | 12 |
Figure S84. Get High-res Image Gene #94: 'del_16q22.2' versus Molecular Subtype #2: 'METHYLATION_CNMF'
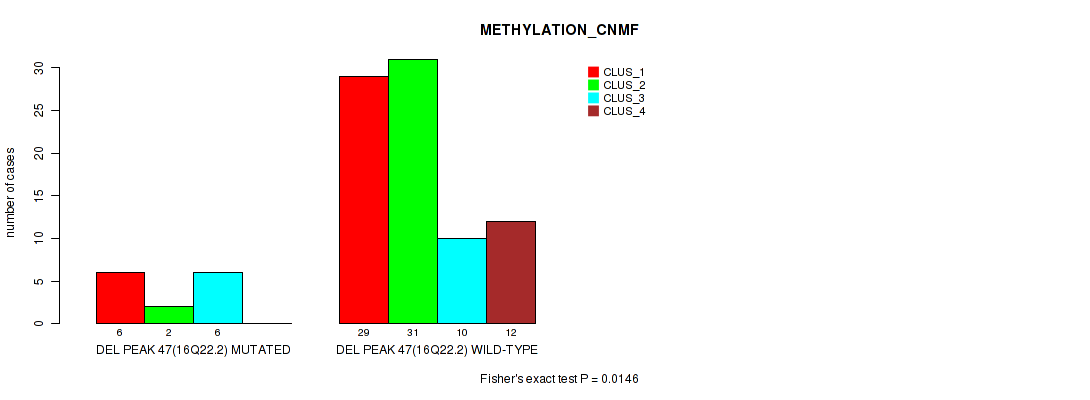
P value = 0.00079 (Fisher's exact test), Q value = 0.014
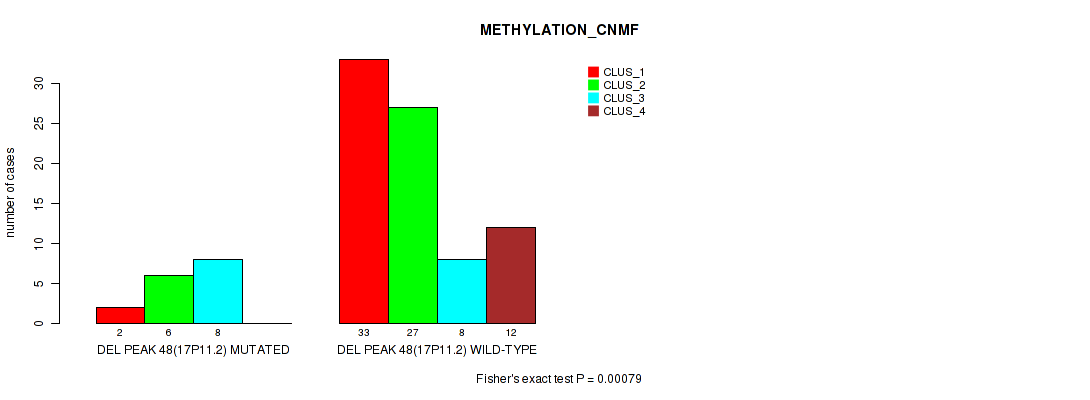
Table S85. Gene #95: 'del_17p11.2' versus Molecular Subtype #2: 'METHYLATION_CNMF'
| nPatients | CLUS_1 | CLUS_2 | CLUS_3 | CLUS_4 |
|---|---|---|---|---|
| ALL | 35 | 33 | 16 | 12 |
| DEL PEAK 48(17P11.2) MUTATED | 2 | 6 | 8 | 0 |
| DEL PEAK 48(17P11.2) WILD-TYPE | 33 | 27 | 8 | 12 |
Figure S85. Get High-res Image Gene #95: 'del_17p11.2' versus Molecular Subtype #2: 'METHYLATION_CNMF'
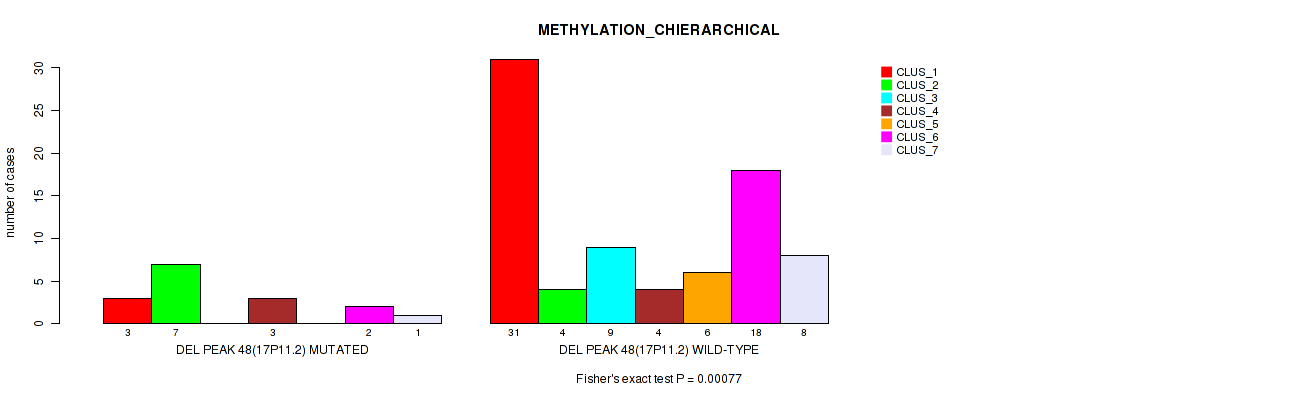
P value = 0.00077 (Fisher's exact test), Q value = 0.014
Table S86. Gene #95: 'del_17p11.2' versus Molecular Subtype #3: 'METHYLATION_CHIERARCHICAL'
| nPatients | CLUS_1 | CLUS_2 | CLUS_3 | CLUS_4 | CLUS_5 | CLUS_6 | CLUS_7 |
|---|---|---|---|---|---|---|---|
| ALL | 34 | 11 | 9 | 7 | 6 | 20 | 9 |
| DEL PEAK 48(17P11.2) MUTATED | 3 | 7 | 0 | 3 | 0 | 2 | 1 |
| DEL PEAK 48(17P11.2) WILD-TYPE | 31 | 4 | 9 | 4 | 6 | 18 | 8 |
Figure S86. Get High-res Image Gene #95: 'del_17p11.2' versus Molecular Subtype #3: 'METHYLATION_CHIERARCHICAL'
P value = 0.00266 (Fisher's exact test), Q value = 0.026
Table S87. Gene #96: 'del_17q21.32' versus Molecular Subtype #2: 'METHYLATION_CNMF'
| nPatients | CLUS_1 | CLUS_2 | CLUS_3 | CLUS_4 |
|---|---|---|---|---|
| ALL | 35 | 33 | 16 | 12 |
| DEL PEAK 49(17Q21.32) MUTATED | 3 | 0 | 5 | 0 |
| DEL PEAK 49(17Q21.32) WILD-TYPE | 32 | 33 | 11 | 12 |
Figure S87. Get High-res Image Gene #96: 'del_17q21.32' versus Molecular Subtype #2: 'METHYLATION_CNMF'
P value = 0.0455 (Fisher's exact test), Q value = 0.16
Table S88. Gene #98: 'del_18q22.1' versus Molecular Subtype #3: 'METHYLATION_CHIERARCHICAL'
| nPatients | CLUS_1 | CLUS_2 | CLUS_3 | CLUS_4 | CLUS_5 | CLUS_6 | CLUS_7 |
|---|---|---|---|---|---|---|---|
| ALL | 34 | 11 | 9 | 7 | 6 | 20 | 9 |
| DEL PEAK 51(18Q22.1) MUTATED | 5 | 5 | 2 | 2 | 0 | 1 | 0 |
| DEL PEAK 51(18Q22.1) WILD-TYPE | 29 | 6 | 7 | 5 | 6 | 19 | 9 |
Figure S88. Get High-res Image Gene #98: 'del_18q22.1' versus Molecular Subtype #3: 'METHYLATION_CHIERARCHICAL'
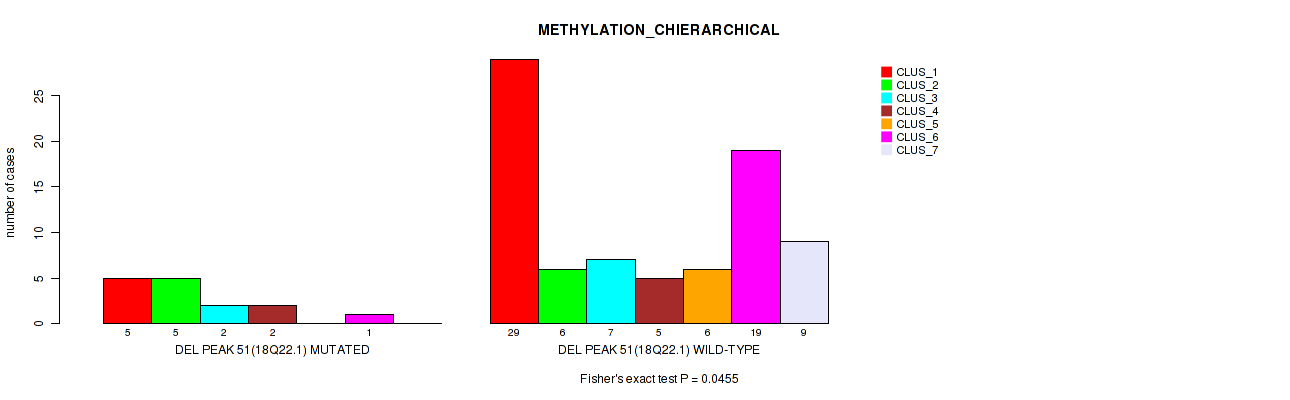
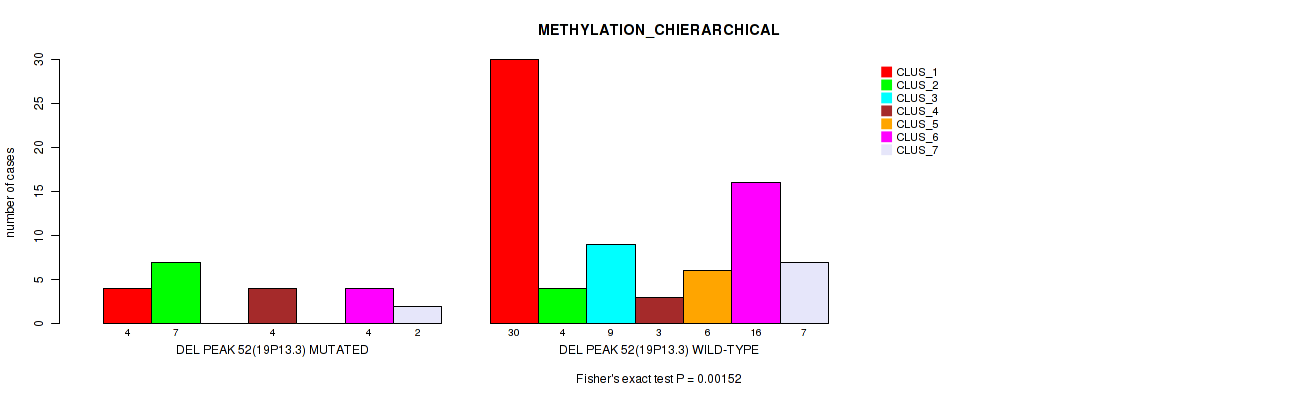
P value = 0.00016 (Fisher's exact test), Q value = 0.0059
Table S89. Gene #99: 'del_19p13.3' versus Molecular Subtype #2: 'METHYLATION_CNMF'
| nPatients | CLUS_1 | CLUS_2 | CLUS_3 | CLUS_4 |
|---|---|---|---|---|
| ALL | 35 | 33 | 16 | 12 |
| DEL PEAK 52(19P13.3) MUTATED | 3 | 8 | 10 | 0 |
| DEL PEAK 52(19P13.3) WILD-TYPE | 32 | 25 | 6 | 12 |
Figure S89. Get High-res Image Gene #99: 'del_19p13.3' versus Molecular Subtype #2: 'METHYLATION_CNMF'
P value = 0.00152 (Fisher's exact test), Q value = 0.02
Table S90. Gene #99: 'del_19p13.3' versus Molecular Subtype #3: 'METHYLATION_CHIERARCHICAL'
| nPatients | CLUS_1 | CLUS_2 | CLUS_3 | CLUS_4 | CLUS_5 | CLUS_6 | CLUS_7 |
|---|---|---|---|---|---|---|---|
| ALL | 34 | 11 | 9 | 7 | 6 | 20 | 9 |
| DEL PEAK 52(19P13.3) MUTATED | 4 | 7 | 0 | 4 | 0 | 4 | 2 |
| DEL PEAK 52(19P13.3) WILD-TYPE | 30 | 4 | 9 | 3 | 6 | 16 | 7 |
Figure S90. Get High-res Image Gene #99: 'del_19p13.3' versus Molecular Subtype #3: 'METHYLATION_CHIERARCHICAL'
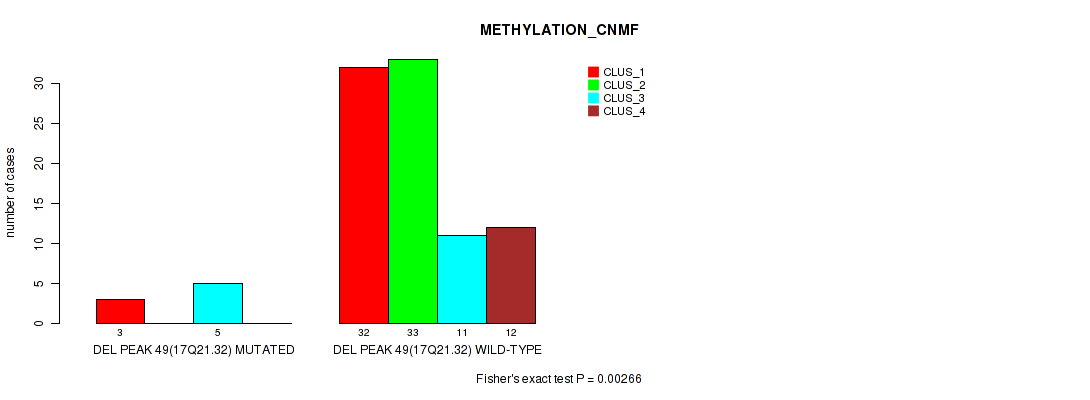
P value = 0.00268 (Fisher's exact test), Q value = 0.026
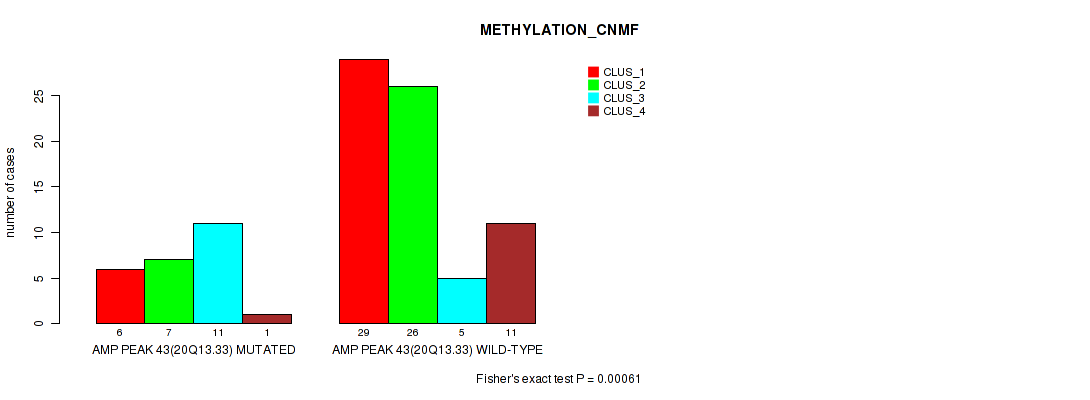
Table S91. Gene #102: 'del_19q13.33' versus Molecular Subtype #2: 'METHYLATION_CNMF'
| nPatients | CLUS_1 | CLUS_2 | CLUS_3 | CLUS_4 |
|---|---|---|---|---|
| ALL | 35 | 33 | 16 | 12 |
| DEL PEAK 55(19Q13.33) MUTATED | 3 | 2 | 7 | 0 |
| DEL PEAK 55(19Q13.33) WILD-TYPE | 32 | 31 | 9 | 12 |
Figure S91. Get High-res Image Gene #102: 'del_19q13.33' versus Molecular Subtype #2: 'METHYLATION_CNMF'

P value = 0.0302 (Fisher's exact test), Q value = 0.12
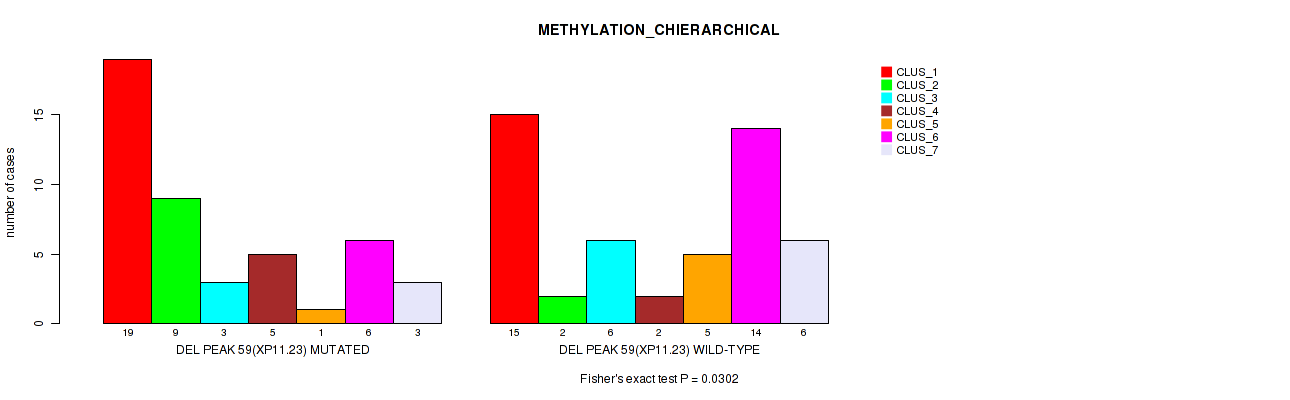
Table S92. Gene #106: 'del_xp11.23' versus Molecular Subtype #3: 'METHYLATION_CHIERARCHICAL'
| nPatients | CLUS_1 | CLUS_2 | CLUS_3 | CLUS_4 | CLUS_5 | CLUS_6 | CLUS_7 |
|---|---|---|---|---|---|---|---|
| ALL | 34 | 11 | 9 | 7 | 6 | 20 | 9 |
| DEL PEAK 59(XP11.23) MUTATED | 19 | 9 | 3 | 5 | 1 | 6 | 3 |
| DEL PEAK 59(XP11.23) WILD-TYPE | 15 | 2 | 6 | 2 | 5 | 14 | 6 |
Figure S92. Get High-res Image Gene #106: 'del_xp11.23' versus Molecular Subtype #3: 'METHYLATION_CHIERARCHICAL'
P value = 0.039 (Fisher's exact test), Q value = 0.15
Table S93. Gene #107: 'del_xp11.23' versus Molecular Subtype #2: 'METHYLATION_CNMF'
| nPatients | CLUS_1 | CLUS_2 | CLUS_3 | CLUS_4 |
|---|---|---|---|---|
| ALL | 35 | 33 | 16 | 12 |
| DEL PEAK 60(XP11.23) MUTATED | 9 | 15 | 8 | 1 |
| DEL PEAK 60(XP11.23) WILD-TYPE | 26 | 18 | 8 | 11 |
Figure S93. Get High-res Image Gene #107: 'del_xp11.23' versus Molecular Subtype #2: 'METHYLATION_CNMF'
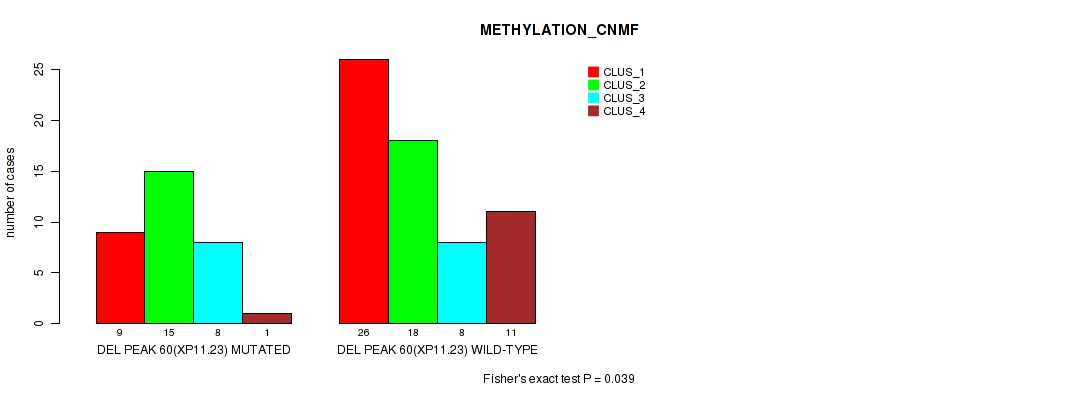
P value = 0.00966 (Fisher's exact test), Q value = 0.056
Table S94. Gene #107: 'del_xp11.23' versus Molecular Subtype #3: 'METHYLATION_CHIERARCHICAL'
| nPatients | CLUS_1 | CLUS_2 | CLUS_3 | CLUS_4 | CLUS_5 | CLUS_6 | CLUS_7 |
|---|---|---|---|---|---|---|---|
| ALL | 34 | 11 | 9 | 7 | 6 | 20 | 9 |
| DEL PEAK 60(XP11.23) MUTATED | 10 | 9 | 1 | 3 | 0 | 7 | 3 |
| DEL PEAK 60(XP11.23) WILD-TYPE | 24 | 2 | 8 | 4 | 6 | 13 | 6 |
Figure S94. Get High-res Image Gene #107: 'del_xp11.23' versus Molecular Subtype #3: 'METHYLATION_CHIERARCHICAL'
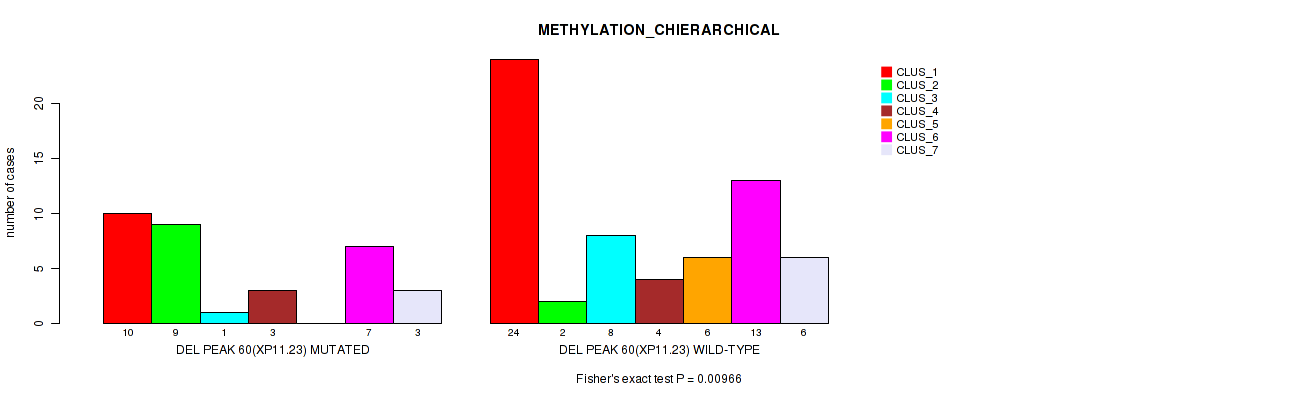
P value = 0.0127 (Fisher's exact test), Q value = 0.069
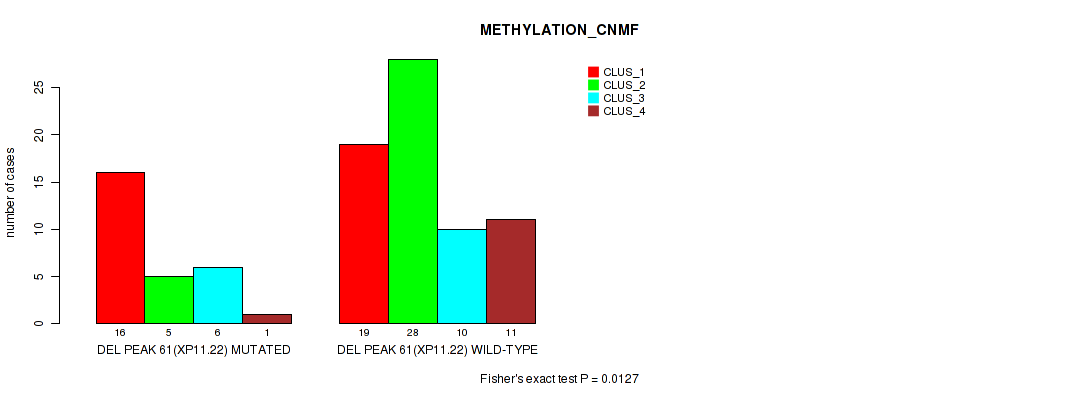
Table S95. Gene #108: 'del_xp11.22' versus Molecular Subtype #2: 'METHYLATION_CNMF'
| nPatients | CLUS_1 | CLUS_2 | CLUS_3 | CLUS_4 |
|---|---|---|---|---|
| ALL | 35 | 33 | 16 | 12 |
| DEL PEAK 61(XP11.22) MUTATED | 16 | 5 | 6 | 1 |
| DEL PEAK 61(XP11.22) WILD-TYPE | 19 | 28 | 10 | 11 |
Figure S95. Get High-res Image Gene #108: 'del_xp11.22' versus Molecular Subtype #2: 'METHYLATION_CNMF'
P value = 0.0493 (Fisher's exact test), Q value = 0.17
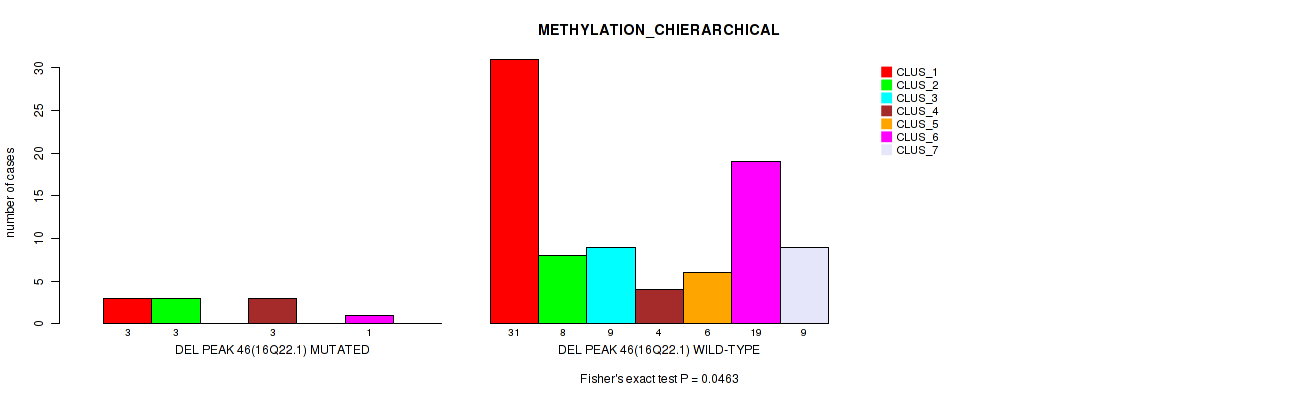
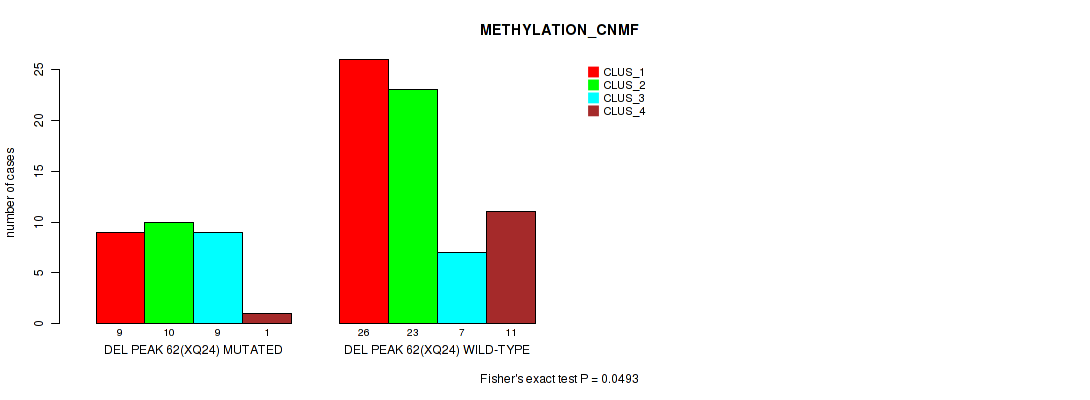
Table S96. Gene #109: 'del_xq24' versus Molecular Subtype #2: 'METHYLATION_CNMF'
| nPatients | CLUS_1 | CLUS_2 | CLUS_3 | CLUS_4 |
|---|---|---|---|---|
| ALL | 35 | 33 | 16 | 12 |
| DEL PEAK 62(XQ24) MUTATED | 9 | 10 | 9 | 1 |
| DEL PEAK 62(XQ24) WILD-TYPE | 26 | 23 | 7 | 11 |
Figure S96. Get High-res Image Gene #109: 'del_xq24' versus Molecular Subtype #2: 'METHYLATION_CNMF'
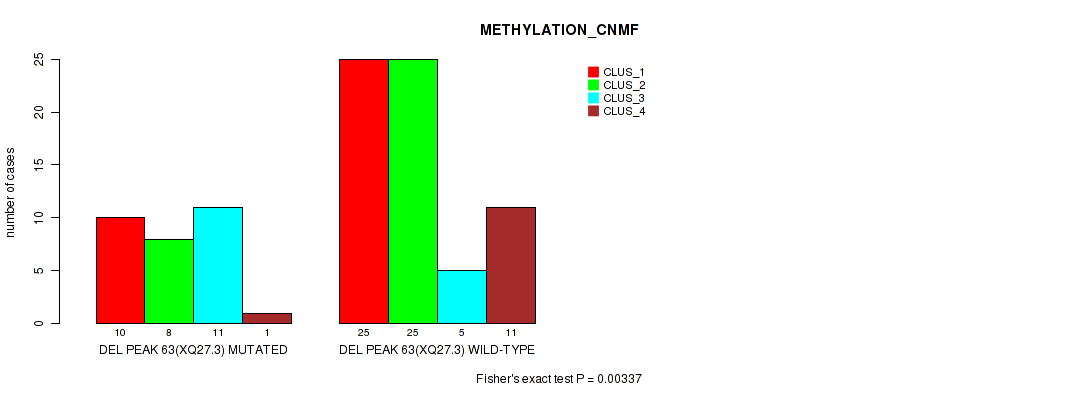
P value = 0.00337 (Fisher's exact test), Q value = 0.028
Table S97. Gene #110: 'del_xq27.3' versus Molecular Subtype #2: 'METHYLATION_CNMF'
| nPatients | CLUS_1 | CLUS_2 | CLUS_3 | CLUS_4 |
|---|---|---|---|---|
| ALL | 35 | 33 | 16 | 12 |
| DEL PEAK 63(XQ27.3) MUTATED | 10 | 8 | 11 | 1 |
| DEL PEAK 63(XQ27.3) WILD-TYPE | 25 | 25 | 5 | 11 |
Figure S97. Get High-res Image Gene #110: 'del_xq27.3' versus Molecular Subtype #2: 'METHYLATION_CNMF'
-
Copy number data file = all_lesions.txt from GISTIC pipeline
-
Processed Copy number data file = /cromwell_root/fc-8b2df640-93e1-40a2-b735-5b7a14ef6398/b8d03c5a-e1ed-4426-8834-af3b0ae152b6/correlate_genomic_events_all/b3a721d9-347a-4708-9fd3-f2507378733d/call-preprocess_genomic_event/transformed.cor.cli.txt
-
Molecular subtype file = /cromwell_root/fc-8b2df640-93e1-40a2-b735-5b7a14ef6398/10d02b45-07ea-40cc-ac82-013e5f89ebb2/aggregate_clusters_workflow/b0f8dcb2-0993-4424-ad42-552c0bd1a2d5/call-aggregate_clusters/CPTAC3-UCEC-TP.transposedmergedcluster.txt
-
Number of patients = 100
-
Number of significantly focal cnvs = 110
-
Number of molecular subtypes = 3
-
Exclude genes that fewer than K tumors have alterations, K = 3
For binary or multi-class clinical features (nominal or ordinal), two-tailed Fisher's exact tests (Fisher 1922) were used to estimate the P values using the 'fisher.test' function in R
For multiple hypothesis correction, Q value is the False Discovery Rate (FDR) analogue of the P value (Benjamini and Hochberg 1995), defined as the minimum FDR at which the test may be called significant. We used the 'Benjamini and Hochberg' method of 'p.adjust' function in R to convert P values into Q values.