This pipeline computes the correlation between significantly recurrent gene mutations and selected clinical features.
Testing the association between mutation status of 87 genes and 9 clinical features across 132 patients, one significant finding detected with Q value < 0.25.
-
ANAPC1 mutation correlated to 'AGE'.
Table 1. Get Full Table Overview of the association between mutation status of 87 genes and 9 clinical features. Shown in the table are P values (Q values). Thresholded by Q value < 0.25, one significant finding detected.
|
Clinical Features |
Time to Death |
AGE | GENDER |
HISTOLOGICAL TYPE |
PATHOLOGY T |
PATHOLOGY N |
PATHOLOGICSPREAD(M) |
TUMOR STAGE |
NEOADJUVANT THERAPY |
||
| nMutated (%) | nWild-Type | logrank test | t-test | Fisher's exact test | Chi-square test | Fisher's exact test | Fisher's exact test | Fisher's exact test | Fisher's exact test | Fisher's exact test | |
| ANAPC1 | 12 (9%) | 120 |
0.711 (1.00) |
0.000135 (0.102) |
0.762 (1.00) |
0.767 (1.00) |
0.144 (1.00) |
0.718 (1.00) |
0.392 (1.00) |
0.909 (1.00) |
1 (1.00) |
| ACVR2A | 17 (13%) | 115 |
0.00155 (1.00) |
0.0992 (1.00) |
0.114 (1.00) |
0.18 (1.00) |
0.15 (1.00) |
1 (1.00) |
0.529 (1.00) |
0.787 (1.00) |
0.596 (1.00) |
| CBWD1 | 17 (13%) | 115 |
0.303 (1.00) |
0.0208 (1.00) |
0.294 (1.00) |
0.298 (1.00) |
0.0009 (0.677) |
0.54 (1.00) |
0.529 (1.00) |
0.408 (1.00) |
0.596 (1.00) |
| DNAJC15 | 3 (2%) | 129 |
0.0291 (1.00) |
0.564 (1.00) |
0.81 (1.00) |
1 (1.00) |
0.114 (1.00) |
1 (1.00) |
|||
| KRAS | 17 (13%) | 115 |
0.353 (1.00) |
0.241 (1.00) |
0.114 (1.00) |
0.668 (1.00) |
0.811 (1.00) |
0.502 (1.00) |
0.645 (1.00) |
0.339 (1.00) |
0.596 (1.00) |
| RPL22 | 10 (8%) | 122 |
0.478 (1.00) |
0.0186 (1.00) |
0.522 (1.00) |
0.613 (1.00) |
0.0588 (1.00) |
0.235 (1.00) |
0.000928 (0.697) |
0.0811 (1.00) |
1 (1.00) |
| SFRS12IP1 | 5 (4%) | 127 |
0.00167 (1.00) |
0.648 (1.00) |
0.782 (1.00) |
0.236 (1.00) |
0.606 (1.00) |
1 (1.00) |
0.368 (1.00) |
1 (1.00) |
|
| SMAP1 | 5 (4%) | 127 |
0.0768 (1.00) |
0.39 (1.00) |
0.782 (1.00) |
0.0317 (1.00) |
0.606 (1.00) |
1 (1.00) |
0.132 (1.00) |
1 (1.00) |
|
| TP53 | 61 (46%) | 71 |
0.0826 (1.00) |
0.714 (1.00) |
0.285 (1.00) |
0.0533 (1.00) |
0.759 (1.00) |
0.908 (1.00) |
0.128 (1.00) |
0.751 (1.00) |
0.47 (1.00) |
| TRIM48 | 14 (11%) | 118 |
0.322 (1.00) |
0.12 (1.00) |
0.566 (1.00) |
0.299 (1.00) |
0.0982 (1.00) |
0.304 (1.00) |
0.0874 (1.00) |
0.166 (1.00) |
0.599 (1.00) |
| ZNF48 | 3 (2%) | 129 |
0.0763 (1.00) |
0.564 (1.00) |
0.953 (1.00) |
0.151 (1.00) |
1 (1.00) |
1 (1.00) |
|||
| PGM5 | 18 (14%) | 114 |
0.962 (1.00) |
0.000669 (0.504) |
0.0192 (1.00) |
0.505 (1.00) |
0.00714 (1.00) |
0.584 (1.00) |
0.551 (1.00) |
0.413 (1.00) |
1 (1.00) |
| ARID1A | 26 (20%) | 106 |
0.225 (1.00) |
0.89 (1.00) |
0.272 (1.00) |
0.268 (1.00) |
0.162 (1.00) |
0.303 (1.00) |
0.0177 (1.00) |
0.118 (1.00) |
0.656 (1.00) |
| RHOA | 7 (5%) | 125 |
0.0968 (1.00) |
0.0721 (1.00) |
0.701 (1.00) |
0.358 (1.00) |
0.541 (1.00) |
0.718 (1.00) |
0.628 (1.00) |
0.203 (1.00) |
0.361 (1.00) |
| PIK3CA | 25 (19%) | 107 |
0.407 (1.00) |
0.591 (1.00) |
0.377 (1.00) |
0.774 (1.00) |
0.722 (1.00) |
0.63 (1.00) |
0.879 (1.00) |
0.405 (1.00) |
1 (1.00) |
| INO80E | 9 (7%) | 123 |
0.677 (1.00) |
0.338 (1.00) |
0.156 (1.00) |
0.694 (1.00) |
0.000819 (0.617) |
0.199 (1.00) |
0.192 (1.00) |
0.122 (1.00) |
1 (1.00) |
| FGF22 | 4 (3%) | 128 |
0.0132 (1.00) |
1 (1.00) |
0.691 (1.00) |
0.288 (1.00) |
0.843 (1.00) |
0.428 (1.00) |
1 (1.00) |
1 (1.00) |
|
| OR8H3 | 10 (8%) | 122 |
0.626 (1.00) |
0.386 (1.00) |
0.739 (1.00) |
0.0282 (1.00) |
0.731 (1.00) |
0.0678 (1.00) |
0.707 (1.00) |
0.705 (1.00) |
0.477 (1.00) |
| ZNF804B | 21 (16%) | 111 |
0.909 (1.00) |
0.238 (1.00) |
0.629 (1.00) |
0.427 (1.00) |
1 (1.00) |
0.0734 (1.00) |
0.395 (1.00) |
0.0128 (1.00) |
1 (1.00) |
| CDH1 | 13 (10%) | 119 |
0.516 (1.00) |
0.148 (1.00) |
1 (1.00) |
0.142 (1.00) |
0.681 (1.00) |
0.819 (1.00) |
1 (1.00) |
0.378 (1.00) |
1 (1.00) |
| TUSC3 | 11 (8%) | 121 |
0.76 (1.00) |
0.575 (1.00) |
1 (1.00) |
0.786 (1.00) |
0.606 (1.00) |
0.457 (1.00) |
0.356 (1.00) |
0.552 (1.00) |
0.511 (1.00) |
| PRRT2 | 5 (4%) | 127 |
0.277 (1.00) |
1 (1.00) |
0.571 (1.00) |
0.00291 (1.00) |
0.418 (1.00) |
0.213 (1.00) |
1 (1.00) |
||
| PTH2 | 3 (2%) | 129 |
0.833 (1.00) |
0.564 (1.00) |
0.756 (1.00) |
1 (1.00) |
0.418 (1.00) |
1 (1.00) |
0.774 (1.00) |
0.172 (1.00) |
|
| C17ORF63 | 4 (3%) | 128 |
0.806 (1.00) |
1 (1.00) |
0.907 (1.00) |
0.273 (1.00) |
0.705 (1.00) |
1 (1.00) |
0.526 (1.00) |
1 (1.00) |
|
| IAPP | 4 (3%) | 128 |
0.461 (1.00) |
0.649 (1.00) |
0.907 (1.00) |
1 (1.00) |
0.887 (1.00) |
0.162 (1.00) |
0.132 (1.00) |
1 (1.00) |
|
| IRF2 | 8 (6%) | 124 |
0.74 (1.00) |
0.209 (1.00) |
0.0597 (1.00) |
0.873 (1.00) |
0.0186 (1.00) |
0.87 (1.00) |
0.25 (1.00) |
1 (1.00) |
1 (1.00) |
| RNF43 | 15 (11%) | 117 |
0.0257 (1.00) |
0.0137 (1.00) |
0.279 (1.00) |
0.154 (1.00) |
0.0955 (1.00) |
0.97 (1.00) |
0.49 (1.00) |
0.199 (1.00) |
0.596 (1.00) |
| HLA-B | 10 (8%) | 122 |
0.963 (1.00) |
0.473 (1.00) |
0.0886 (1.00) |
0.533 (1.00) |
0.158 (1.00) |
0.114 (1.00) |
0.32 (1.00) |
0.3 (1.00) |
1 (1.00) |
| HLA-A | 9 (7%) | 123 |
0.354 (1.00) |
0.985 (1.00) |
0.483 (1.00) |
0.117 (1.00) |
0.603 (1.00) |
0.783 (1.00) |
0.697 (1.00) |
0.952 (1.00) |
0.441 (1.00) |
| SMAD4 | 8 (6%) | 124 |
0.103 (1.00) |
0.043 (1.00) |
1 (1.00) |
0.666 (1.00) |
0.898 (1.00) |
1 (1.00) |
0.155 (1.00) |
0.952 (1.00) |
1 (1.00) |
| UPF3A | 7 (5%) | 125 |
0.647 (1.00) |
0.13 (1.00) |
0.438 (1.00) |
0.864 (1.00) |
0.0014 (1.00) |
0.589 (1.00) |
0.216 (1.00) |
0.254 (1.00) |
1 (1.00) |
| CCDC43 | 4 (3%) | 128 |
0.252 (1.00) |
1 (1.00) |
0.691 (1.00) |
0.428 (1.00) |
0.79 (1.00) |
1 (1.00) |
0.162 (1.00) |
1 (1.00) |
|
| PHF2 | 13 (10%) | 119 |
0.905 (1.00) |
0.00617 (1.00) |
0.374 (1.00) |
0.435 (1.00) |
0.012 (1.00) |
0.59 (1.00) |
0.00341 (1.00) |
0.101 (1.00) |
1 (1.00) |
| PCDH15 | 23 (17%) | 109 |
0.855 (1.00) |
0.802 (1.00) |
0.485 (1.00) |
0.797 (1.00) |
0.285 (1.00) |
0.714 (1.00) |
0.533 (1.00) |
0.204 (1.00) |
0.628 (1.00) |
| SPRYD5 | 8 (6%) | 124 |
0.143 (1.00) |
0.126 (1.00) |
1 (1.00) |
0.925 (1.00) |
0.0509 (1.00) |
0.718 (1.00) |
0.0757 (1.00) |
0.0293 (1.00) |
1 (1.00) |
| SOX1 | 6 (5%) | 126 |
0.361 (1.00) |
0.444 (1.00) |
1 (1.00) |
0.935 (1.00) |
0.187 (1.00) |
0.0865 (1.00) |
1 (1.00) |
0.526 (1.00) |
0.318 (1.00) |
| POTEG | 6 (5%) | 126 |
0.221 (1.00) |
0.00963 (1.00) |
0.684 (1.00) |
0.558 (1.00) |
0.629 (1.00) |
0.589 (1.00) |
1 (1.00) |
0.803 (1.00) |
1 (1.00) |
| TPTE | 16 (12%) | 116 |
0.382 (1.00) |
0.587 (1.00) |
0.424 (1.00) |
0.00416 (1.00) |
0.288 (1.00) |
0.685 (1.00) |
0.508 (1.00) |
1 (1.00) |
1 (1.00) |
| FSHR | 14 (11%) | 118 |
0.55 (1.00) |
0.0322 (1.00) |
0.566 (1.00) |
0.123 (1.00) |
0.048 (1.00) |
0.637 (1.00) |
0.768 (1.00) |
0.566 (1.00) |
1 (1.00) |
| UNC93B1 | 3 (2%) | 129 |
0.00167 (1.00) |
0.564 (1.00) |
0.599 (1.00) |
0.2 (1.00) |
1 (1.00) |
1 (1.00) |
|||
| EDNRB | 12 (9%) | 120 |
0.877 (1.00) |
0.762 (1.00) |
0.543 (1.00) |
0.295 (1.00) |
0.253 (1.00) |
0.426 (1.00) |
0.392 (1.00) |
0.859 (1.00) |
1 (1.00) |
| RASA1 | 10 (8%) | 122 |
0.307 (1.00) |
0.231 (1.00) |
1 (1.00) |
0.199 (1.00) |
0.0195 (1.00) |
0.723 (1.00) |
0.0878 (1.00) |
0.371 (1.00) |
0.477 (1.00) |
| KDM4B | 11 (8%) | 121 |
0.81 (1.00) |
0.0336 (1.00) |
0.0273 (1.00) |
0.432 (1.00) |
0.158 (1.00) |
0.825 (1.00) |
0.356 (1.00) |
0.533 (1.00) |
1 (1.00) |
| LHCGR | 7 (5%) | 125 |
0.863 (1.00) |
0.403 (1.00) |
1 (1.00) |
0.701 (1.00) |
0.0866 (1.00) |
0.39 (1.00) |
0.216 (1.00) |
1 (1.00) |
0.361 (1.00) |
| TM7SF4 | 8 (6%) | 124 |
0.915 (1.00) |
0.321 (1.00) |
1 (1.00) |
0.86 (1.00) |
0.771 (1.00) |
0.825 (1.00) |
1 (1.00) |
0.679 (1.00) |
1 (1.00) |
| IL2RG | 3 (2%) | 129 |
0.448 (1.00) |
0.0625 (1.00) |
0.953 (1.00) |
1 (1.00) |
0.114 (1.00) |
1 (1.00) |
|||
| TLR4 | 13 (10%) | 119 |
0.295 (1.00) |
0.946 (1.00) |
0.561 (1.00) |
0.384 (1.00) |
0.393 (1.00) |
0.702 (1.00) |
0.427 (1.00) |
1 (1.00) |
0.179 (1.00) |
| TSHZ2 | 7 (5%) | 125 |
0.205 (1.00) |
0.619 (1.00) |
0.438 (1.00) |
0.538 (1.00) |
0.603 (1.00) |
0.021 (1.00) |
0.318 (1.00) |
0.0482 (1.00) |
1 (1.00) |
| PDZRN4 | 12 (9%) | 120 |
0.699 (1.00) |
0.994 (1.00) |
0.36 (1.00) |
0.935 (1.00) |
0.136 (1.00) |
0.827 (1.00) |
0.0591 (1.00) |
0.909 (1.00) |
0.544 (1.00) |
| POM121L12 | 8 (6%) | 124 |
0.943 (1.00) |
0.502 (1.00) |
0.713 (1.00) |
0.577 (1.00) |
0.118 (1.00) |
0.817 (1.00) |
0.155 (1.00) |
0.295 (1.00) |
1 (1.00) |
| WBSCR17 | 12 (9%) | 120 |
0.116 (1.00) |
0.165 (1.00) |
0.543 (1.00) |
0.239 (1.00) |
0.521 (1.00) |
1 (1.00) |
0.199 (1.00) |
0.744 (1.00) |
1 (1.00) |
| ZC4H2 | 6 (5%) | 126 |
0.303 (1.00) |
0.874 (1.00) |
1 (1.00) |
0.81 (1.00) |
0.273 (1.00) |
0.151 (1.00) |
0.172 (1.00) |
0.0554 (1.00) |
1 (1.00) |
| CNBD1 | 6 (5%) | 126 |
0.0498 (1.00) |
0.684 (1.00) |
0.776 (1.00) |
1 (1.00) |
1 (1.00) |
1 (1.00) |
0.338 (1.00) |
0.318 (1.00) |
|
| CPS1 | 14 (11%) | 118 |
0.862 (1.00) |
0.773 (1.00) |
0.158 (1.00) |
0.535 (1.00) |
0.626 (1.00) |
0.539 (1.00) |
0.19 (1.00) |
0.973 (1.00) |
0.599 (1.00) |
| KIAA0748 | 8 (6%) | 124 |
0.337 (1.00) |
0.237 (1.00) |
1 (1.00) |
0.755 (1.00) |
0.69 (1.00) |
0.516 (1.00) |
1 (1.00) |
0.14 (1.00) |
1 (1.00) |
| OR2T6 | 7 (5%) | 125 |
0.996 (1.00) |
0.962 (1.00) |
1 (1.00) |
0.558 (1.00) |
0.0689 (1.00) |
0.39 (1.00) |
0.628 (1.00) |
0.0837 (1.00) |
0.361 (1.00) |
| CHRM2 | 7 (5%) | 125 |
0.607 (1.00) |
0.241 (1.00) |
0.104 (1.00) |
0.466 (1.00) |
0.912 (1.00) |
1 (1.00) |
0.118 (1.00) |
0.361 (1.00) |
|
| NDN | 8 (6%) | 124 |
0.148 (1.00) |
0.827 (1.00) |
0.266 (1.00) |
0.726 (1.00) |
0.603 (1.00) |
0.719 (1.00) |
1 (1.00) |
0.952 (1.00) |
1 (1.00) |
| TCEB3C | 5 (4%) | 127 |
0.945 (1.00) |
0.68 (1.00) |
1 (1.00) |
0.846 (1.00) |
0.875 (1.00) |
0.172 (1.00) |
0.504 (1.00) |
0.339 (1.00) |
0.272 (1.00) |
| IL13RA2 | 7 (5%) | 125 |
0.161 (1.00) |
0.32 (1.00) |
0.438 (1.00) |
0.561 (1.00) |
0.187 (1.00) |
0.39 (1.00) |
0.628 (1.00) |
0.658 (1.00) |
0.0581 (1.00) |
| ASTN2 | 16 (12%) | 116 |
0.525 (1.00) |
0.0817 (1.00) |
0.182 (1.00) |
0.172 (1.00) |
0.11 (1.00) |
1 (1.00) |
0.228 (1.00) |
0.85 (1.00) |
1 (1.00) |
| FCRL3 | 9 (7%) | 123 |
0.515 (1.00) |
0.963 (1.00) |
0.483 (1.00) |
0.913 (1.00) |
0.332 (1.00) |
0.421 (1.00) |
1 (1.00) |
0.882 (1.00) |
1 (1.00) |
| PARK2 | 9 (7%) | 123 |
0.73 (1.00) |
0.00798 (1.00) |
0.74 (1.00) |
0.12 (1.00) |
0.238 (1.00) |
0.472 (1.00) |
0.192 (1.00) |
0.14 (1.00) |
0.441 (1.00) |
| POU3F2 | 4 (3%) | 128 |
0.461 (1.00) |
0.149 (1.00) |
0.81 (1.00) |
0.571 (1.00) |
0.418 (1.00) |
0.162 (1.00) |
1 (1.00) |
1 (1.00) |
|
| FAM9A | 6 (5%) | 126 |
0.677 (1.00) |
0.249 (1.00) |
0.684 (1.00) |
0.81 (1.00) |
0.00697 (1.00) |
0.175 (1.00) |
0.00559 (1.00) |
0.122 (1.00) |
1 (1.00) |
| CSNK2A1 | 4 (3%) | 128 |
0.465 (1.00) |
0.684 (1.00) |
0.649 (1.00) |
0.348 (1.00) |
0.821 (1.00) |
1 (1.00) |
1 (1.00) |
0.207 (1.00) |
0.224 (1.00) |
| CAPN6 | 7 (5%) | 125 |
0.399 (1.00) |
1 (1.00) |
0.919 (1.00) |
0.097 (1.00) |
0.558 (1.00) |
0.121 (1.00) |
1 (1.00) |
1 (1.00) |
|
| ELF3 | 6 (5%) | 126 |
0.541 (1.00) |
0.391 (1.00) |
0.218 (1.00) |
0.444 (1.00) |
0.441 (1.00) |
0.366 (1.00) |
1 (1.00) |
0.935 (1.00) |
1 (1.00) |
| FBXW7 | 10 (8%) | 122 |
0.876 (1.00) |
0.0737 (1.00) |
0.522 (1.00) |
0.619 (1.00) |
1 (1.00) |
0.313 (1.00) |
0.222 (1.00) |
0.768 (1.00) |
1 (1.00) |
| TP53TG5 | 4 (3%) | 128 |
0.739 (1.00) |
0.735 (1.00) |
0.649 (1.00) |
0.0217 (1.00) |
0.0607 (1.00) |
0.395 (1.00) |
1 (1.00) |
0.526 (1.00) |
1 (1.00) |
| ZNF559 | 7 (5%) | 125 |
0.184 (1.00) |
0.542 (1.00) |
0.116 (1.00) |
0.459 (1.00) |
0.0368 (1.00) |
0.65 (1.00) |
0.628 (1.00) |
0.0999 (1.00) |
1 (1.00) |
| CHRM3 | 6 (5%) | 126 |
0.497 (1.00) |
0.0592 (1.00) |
0.684 (1.00) |
0.459 (1.00) |
0.271 (1.00) |
0.466 (1.00) |
0.266 (1.00) |
0.695 (1.00) |
1 (1.00) |
| ELL2 | 8 (6%) | 124 |
0.567 (1.00) |
0.396 (1.00) |
1 (1.00) |
0.755 (1.00) |
0.157 (1.00) |
0.439 (1.00) |
0.25 (1.00) |
0.859 (1.00) |
1 (1.00) |
| EPHA6 | 14 (11%) | 118 |
0.322 (1.00) |
0.397 (1.00) |
0.781 (1.00) |
0.302 (1.00) |
0.175 (1.00) |
0.478 (1.00) |
0.462 (1.00) |
0.383 (1.00) |
1 (1.00) |
| OSGIN2 | 6 (5%) | 126 |
0.329 (1.00) |
0.639 (1.00) |
0.218 (1.00) |
0.748 (1.00) |
0.349 (1.00) |
0.766 (1.00) |
0.0894 (1.00) |
0.709 (1.00) |
1 (1.00) |
| KRTAP4-1 | 3 (2%) | 129 |
0.291 (1.00) |
0.617 (1.00) |
0.564 (1.00) |
0.752 (1.00) |
1 (1.00) |
0.296 (1.00) |
1 (1.00) |
0.878 (1.00) |
1 (1.00) |
| SMAD2 | 7 (5%) | 125 |
0.386 (1.00) |
0.238 (1.00) |
0.438 (1.00) |
0.571 (1.00) |
0.69 (1.00) |
0.51 (1.00) |
0.628 (1.00) |
0.709 (1.00) |
1 (1.00) |
| EDIL3 | 6 (5%) | 126 |
0.931 (1.00) |
0.877 (1.00) |
0.218 (1.00) |
0.782 (1.00) |
0.349 (1.00) |
0.558 (1.00) |
0.57 (1.00) |
0.333 (1.00) |
1 (1.00) |
| OR4C13 | 5 (4%) | 127 |
0.748 (1.00) |
0.713 (1.00) |
0.39 (1.00) |
0.741 (1.00) |
0.821 (1.00) |
1 (1.00) |
1 (1.00) |
0.482 (1.00) |
1 (1.00) |
| OR4C16 | 9 (7%) | 123 |
0.614 (1.00) |
0.204 (1.00) |
0.74 (1.00) |
0.257 (1.00) |
0.414 (1.00) |
0.441 (1.00) |
0.697 (1.00) |
0.848 (1.00) |
1 (1.00) |
| PRR11 | 4 (3%) | 128 |
0.483 (1.00) |
1 (1.00) |
0.787 (1.00) |
0.0317 (1.00) |
0.79 (1.00) |
0.162 (1.00) |
0.338 (1.00) |
1 (1.00) |
|
| AUH | 5 (4%) | 127 |
0.00659 (1.00) |
0.39 (1.00) |
0.89 (1.00) |
0.236 (1.00) |
0.887 (1.00) |
0.213 (1.00) |
0.878 (1.00) |
1 (1.00) |
|
| AFAP1 | 5 (4%) | 127 |
0.33 (1.00) |
0.76 (1.00) |
1 (1.00) |
0.946 (1.00) |
0.0573 (1.00) |
0.707 (1.00) |
0.0616 (1.00) |
0.295 (1.00) |
1 (1.00) |
| LIN7A | 6 (5%) | 126 |
0.471 (1.00) |
0.914 (1.00) |
0.684 (1.00) |
0.869 (1.00) |
0.327 (1.00) |
0.912 (1.00) |
1 (1.00) |
0.339 (1.00) |
0.318 (1.00) |
| OR8B4 | 3 (2%) | 129 |
0.541 (1.00) |
0.758 (1.00) |
0.564 (1.00) |
0.269 (1.00) |
0.288 (1.00) |
0.098 (1.00) |
1 (1.00) |
0.338 (1.00) |
0.172 (1.00) |
| PID1 | 5 (4%) | 127 |
0.361 (1.00) |
0.624 (1.00) |
0.648 (1.00) |
0.161 (1.00) |
0.583 (1.00) |
0.128 (1.00) |
0.213 (1.00) |
0.132 (1.00) |
1 (1.00) |
| AVP | 3 (2%) | 129 |
0.362 (1.00) |
1 (1.00) |
0.953 (1.00) |
1 (1.00) |
1 (1.00) |
0.0196 (1.00) |
1 (1.00) |
1 (1.00) |
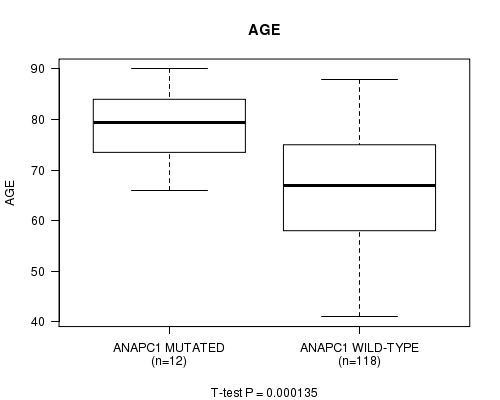
P value = 0.000135 (t-test), Q value = 0.1
Table S1. Gene #77: 'ANAPC1 MUTATION STATUS' versus Clinical Feature #2: 'AGE'
| nPatients | Mean (Std.Dev) | |
|---|---|---|
| ALL | 130 | 67.8 (10.8) |
| ANAPC1 MUTATED | 12 | 79.2 (7.9) |
| ANAPC1 WILD-TYPE | 118 | 66.7 (10.4) |
Figure S1. Get High-res Image Gene #77: 'ANAPC1 MUTATION STATUS' versus Clinical Feature #2: 'AGE'
-
Mutation data file = STAD.mutsig.cluster.txt
-
Clinical data file = STAD.clin.merged.picked.txt
-
Number of patients = 132
-
Number of significantly mutated genes = 87
-
Number of selected clinical features = 9
-
Exclude genes that fewer than K tumors have mutations, K = 3
For survival clinical features, the Kaplan-Meier survival curves of tumors with and without gene mutations were plotted and the statistical significance P values were estimated by logrank test (Bland and Altman 2004) using the 'survdiff' function in R
For continuous numerical clinical features, two-tailed Student's t test with unequal variance (Lehmann and Romano 2005) was applied to compare the clinical values between tumors with and without gene mutations using 't.test' function in R
For binary or multi-class clinical features (nominal or ordinal), two-tailed Fisher's exact tests (Fisher 1922) were used to estimate the P values using the 'fisher.test' function in R
For multi-class clinical features (nominal or ordinal), Chi-square tests (Greenwood and Nikulin 1996) were used to estimate the P values using the 'chisq.test' function in R
For multiple hypothesis correction, Q value is the False Discovery Rate (FDR) analogue of the P value (Benjamini and Hochberg 1995), defined as the minimum FDR at which the test may be called significant. We used the 'Benjamini and Hochberg' method of 'p.adjust' function in R to convert P values into Q values.
This is an experimental feature. The full results of the analysis summarized in this report can be downloaded from the TCGA Data Coordination Center.