This pipeline computes the correlation between significantly recurrent gene mutations and molecular subtypes.
Testing the association between mutation status of 16 genes and 7 molecular subtypes across 154 patients, 7 significant findings detected with P value < 0.05 and Q value < 0.25.
-
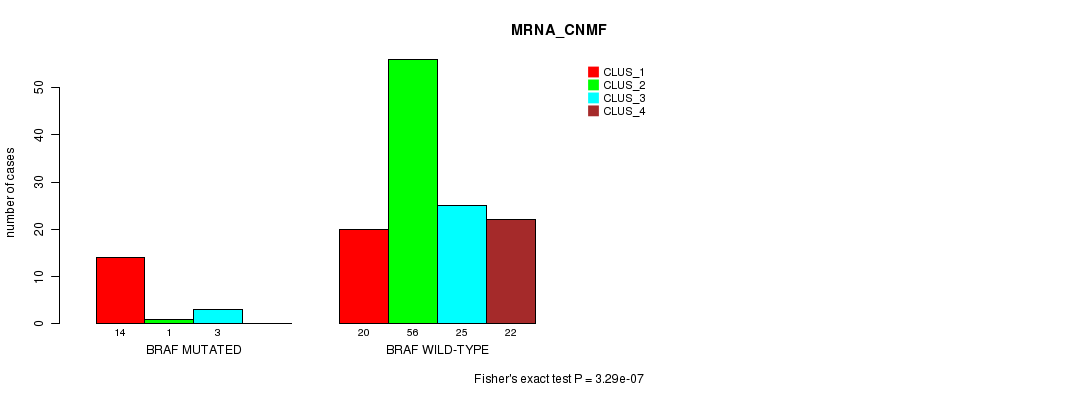
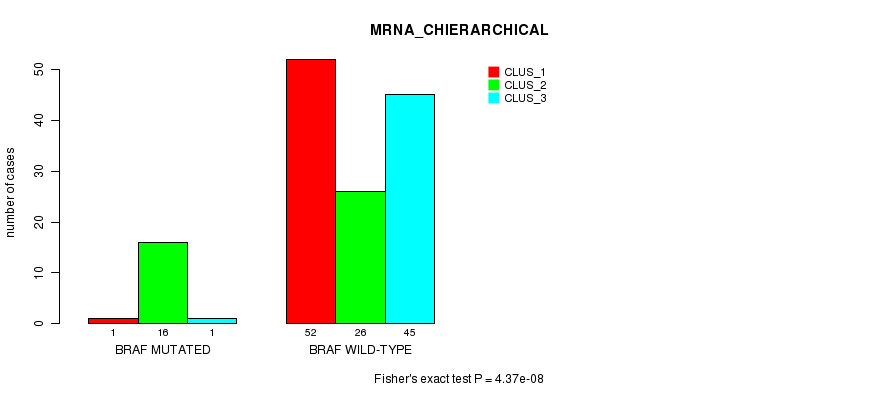
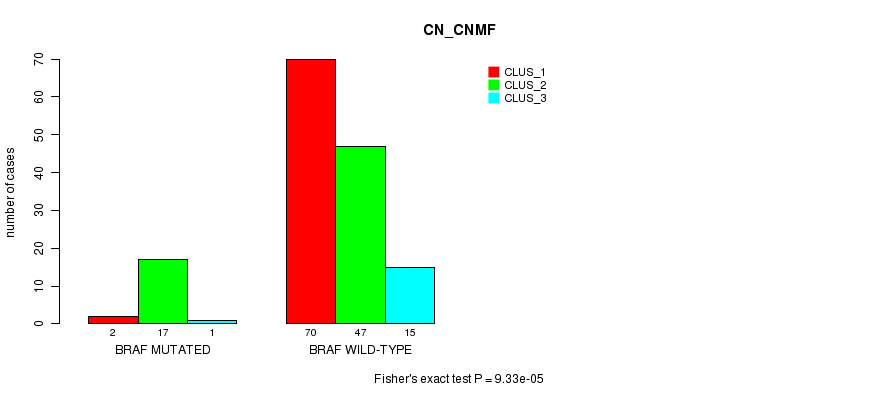
BRAF mutation correlated to 'MRNA_CNMF', 'MRNA_CHIERARCHICAL', and 'CN_CNMF'.
-
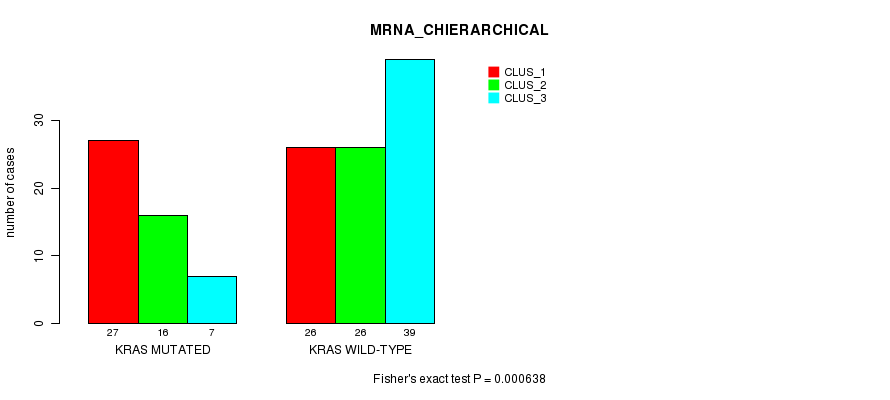
KRAS mutation correlated to 'MRNA_CHIERARCHICAL'.
-
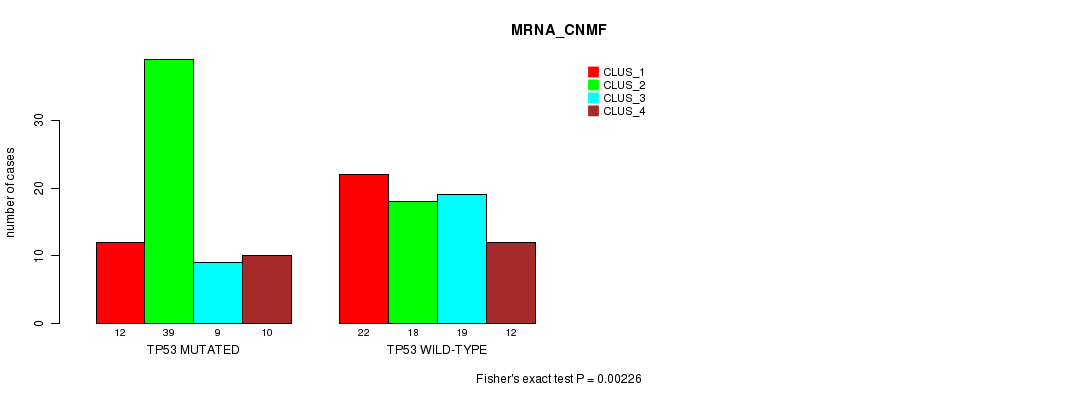
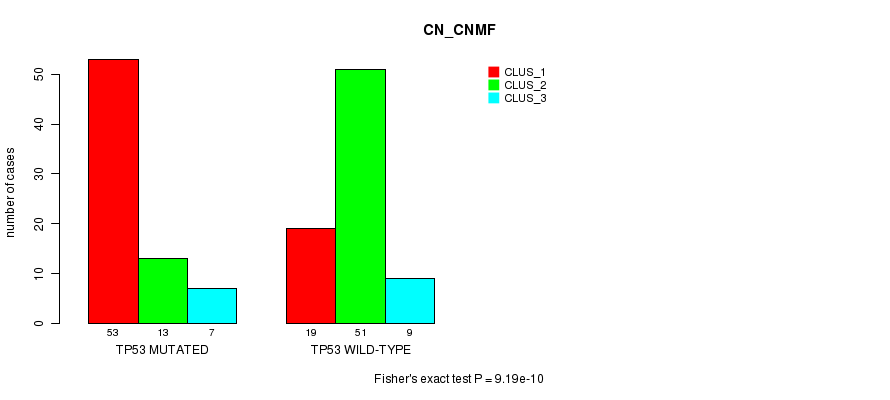
TP53 mutation correlated to 'MRNA_CNMF' and 'CN_CNMF'.
-
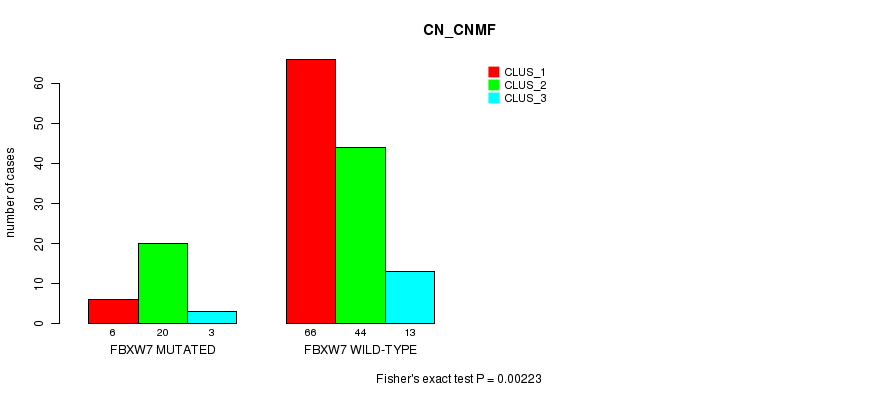
FBXW7 mutation correlated to 'CN_CNMF'.
Table 1. Get Full Table Overview of the association between mutation status of 16 genes and 7 molecular subtypes. Shown in the table are P values (Q values). Thresholded by P value < 0.05 and Q value < 0.25, 7 significant findings detected.
|
Clinical Features |
MRNA CNMF |
MRNA CHIERARCHICAL |
CN CNMF |
RPPA CNMF |
RPPA CHIERARCHICAL |
MIRSEQ CNMF |
MIRSEQ CHIERARCHICAL |
||
| nMutated (%) | nWild-Type | Fisher's exact test | Fisher's exact test | Fisher's exact test | Fisher's exact test | Fisher's exact test | Fisher's exact test | Fisher's exact test | |
| BRAF | 20 (13%) | 134 |
3.29e-07 (3.36e-05) |
4.37e-08 (4.5e-06) |
9.33e-05 (0.00943) |
0.722 (1.00) |
0.926 (1.00) |
0.462 (1.00) |
1 (1.00) |
| TP53 | 74 (48%) | 80 |
0.00226 (0.222) |
0.013 (1.00) |
9.19e-10 (9.56e-08) |
0.271 (1.00) |
0.38 (1.00) |
0.62 (1.00) |
1 (1.00) |
| KRAS | 58 (38%) | 96 |
0.0241 (1.00) |
0.000638 (0.0638) |
0.0552 (1.00) |
0.72 (1.00) |
0.752 (1.00) |
0.626 (1.00) |
0.283 (1.00) |
| FBXW7 | 29 (19%) | 125 |
0.227 (1.00) |
0.0892 (1.00) |
0.00223 (0.221) |
0.00343 (0.333) |
0.233 (1.00) |
1 (1.00) |
0.474 (1.00) |
| APC | 103 (67%) | 51 |
0.171 (1.00) |
0.0187 (1.00) |
0.025 (1.00) |
0.216 (1.00) |
0.388 (1.00) |
0.601 (1.00) |
0.258 (1.00) |
| PIK3CA | 26 (17%) | 128 |
0.331 (1.00) |
0.336 (1.00) |
0.00617 (0.592) |
0.119 (1.00) |
0.332 (1.00) |
0.514 (1.00) |
0.416 (1.00) |
| NRAS | 15 (10%) | 139 |
0.0773 (1.00) |
0.409 (1.00) |
0.927 (1.00) |
0.465 (1.00) |
0.332 (1.00) |
1 (1.00) |
1 (1.00) |
| SMAD4 | 18 (12%) | 136 |
0.304 (1.00) |
0.58 (1.00) |
0.0558 (1.00) |
0.852 (1.00) |
0.495 (1.00) |
1 (1.00) |
1 (1.00) |
| FAM123B | 19 (12%) | 135 |
0.208 (1.00) |
0.00622 (0.592) |
0.0228 (1.00) |
0.286 (1.00) |
0.422 (1.00) |
0.425 (1.00) |
0.338 (1.00) |
| SOX9 | 9 (6%) | 145 |
0.235 (1.00) |
0.214 (1.00) |
0.223 (1.00) |
0.231 (1.00) |
0.461 (1.00) |
1 (1.00) |
1 (1.00) |
| ACVR2A | 8 (5%) | 146 |
0.045 (1.00) |
0.296 (1.00) |
0.0382 (1.00) |
0.199 (1.00) |
0.668 (1.00) |
1 (1.00) |
0.162 (1.00) |
| TNFRSF10C | 6 (4%) | 148 |
0.381 (1.00) |
0.676 (1.00) |
0.299 (1.00) |
0.68 (1.00) |
0.169 (1.00) |
1 (1.00) |
1 (1.00) |
| ACOT4 | 3 (2%) | 151 |
0.665 (1.00) |
0.391 (1.00) |
0.462 (1.00) |
1 (1.00) |
1 (1.00) |
||
| SMAD2 | 10 (6%) | 144 |
0.0995 (1.00) |
0.19 (1.00) |
0.0277 (1.00) |
1 (1.00) |
0.377 (1.00) |
1 (1.00) |
1 (1.00) |
| PCBP1 | 4 (3%) | 150 |
0.33 (1.00) |
0.552 (1.00) |
0.44 (1.00) |
1 (1.00) |
1 (1.00) |
||
| GGT1 | 3 (2%) | 151 |
0.23 (1.00) |
1 (1.00) |
1 (1.00) |
P value = 3.29e-07 (Fisher's exact test), Q value = 3.4e-05
Table S1. Gene #3: 'BRAF MUTATION STATUS' versus Clinical Feature #1: 'MRNA_CNMF'
| nPatients | CLUS_1 | CLUS_2 | CLUS_3 | CLUS_4 |
|---|---|---|---|---|
| ALL | 34 | 57 | 28 | 22 |
| BRAF MUTATED | 14 | 1 | 3 | 0 |
| BRAF WILD-TYPE | 20 | 56 | 25 | 22 |
Figure S1. Get High-res Image Gene #3: 'BRAF MUTATION STATUS' versus Clinical Feature #1: 'MRNA_CNMF'
P value = 4.37e-08 (Fisher's exact test), Q value = 4.5e-06
Table S2. Gene #3: 'BRAF MUTATION STATUS' versus Clinical Feature #2: 'MRNA_CHIERARCHICAL'
| nPatients | CLUS_1 | CLUS_2 | CLUS_3 |
|---|---|---|---|
| ALL | 53 | 42 | 46 |
| BRAF MUTATED | 1 | 16 | 1 |
| BRAF WILD-TYPE | 52 | 26 | 45 |
Figure S2. Get High-res Image Gene #3: 'BRAF MUTATION STATUS' versus Clinical Feature #2: 'MRNA_CHIERARCHICAL'
P value = 9.33e-05 (Fisher's exact test), Q value = 0.0094
Table S3. Gene #3: 'BRAF MUTATION STATUS' versus Clinical Feature #3: 'CN_CNMF'
| nPatients | CLUS_1 | CLUS_2 | CLUS_3 |
|---|---|---|---|
| ALL | 72 | 64 | 16 |
| BRAF MUTATED | 2 | 17 | 1 |
| BRAF WILD-TYPE | 70 | 47 | 15 |
Figure S3. Get High-res Image Gene #3: 'BRAF MUTATION STATUS' versus Clinical Feature #3: 'CN_CNMF'
P value = 0.000638 (Fisher's exact test), Q value = 0.064
Table S4. Gene #4: 'KRAS MUTATION STATUS' versus Clinical Feature #2: 'MRNA_CHIERARCHICAL'
| nPatients | CLUS_1 | CLUS_2 | CLUS_3 |
|---|---|---|---|
| ALL | 53 | 42 | 46 |
| KRAS MUTATED | 27 | 16 | 7 |
| KRAS WILD-TYPE | 26 | 26 | 39 |
Figure S4. Get High-res Image Gene #4: 'KRAS MUTATION STATUS' versus Clinical Feature #2: 'MRNA_CHIERARCHICAL'
P value = 0.00226 (Fisher's exact test), Q value = 0.22
Table S5. Gene #5: 'TP53 MUTATION STATUS' versus Clinical Feature #1: 'MRNA_CNMF'
| nPatients | CLUS_1 | CLUS_2 | CLUS_3 | CLUS_4 |
|---|---|---|---|---|
| ALL | 34 | 57 | 28 | 22 |
| TP53 MUTATED | 12 | 39 | 9 | 10 |
| TP53 WILD-TYPE | 22 | 18 | 19 | 12 |
Figure S5. Get High-res Image Gene #5: 'TP53 MUTATION STATUS' versus Clinical Feature #1: 'MRNA_CNMF'
P value = 9.19e-10 (Fisher's exact test), Q value = 9.6e-08
Table S6. Gene #5: 'TP53 MUTATION STATUS' versus Clinical Feature #3: 'CN_CNMF'
| nPatients | CLUS_1 | CLUS_2 | CLUS_3 |
|---|---|---|---|
| ALL | 72 | 64 | 16 |
| TP53 MUTATED | 53 | 13 | 7 |
| TP53 WILD-TYPE | 19 | 51 | 9 |
Figure S6. Get High-res Image Gene #5: 'TP53 MUTATION STATUS' versus Clinical Feature #3: 'CN_CNMF'
P value = 0.00223 (Fisher's exact test), Q value = 0.22
Table S7. Gene #6: 'FBXW7 MUTATION STATUS' versus Clinical Feature #3: 'CN_CNMF'
| nPatients | CLUS_1 | CLUS_2 | CLUS_3 |
|---|---|---|---|
| ALL | 72 | 64 | 16 |
| FBXW7 MUTATED | 6 | 20 | 3 |
| FBXW7 WILD-TYPE | 66 | 44 | 13 |
Figure S7. Get High-res Image Gene #6: 'FBXW7 MUTATION STATUS' versus Clinical Feature #3: 'CN_CNMF'
-
Mutation data file = COAD-TP.mutsig.cluster.txt
-
Molecular subtypes file = COAD-TP.transferedmergedcluster.txt
-
Number of patients = 154
-
Number of significantly mutated genes = 16
-
Number of Molecular subtypes = 7
-
Exclude genes that fewer than K tumors have mutations, K = 3
For binary or multi-class clinical features (nominal or ordinal), two-tailed Fisher's exact tests (Fisher 1922) were used to estimate the P values using the 'fisher.test' function in R
For multiple hypothesis correction, Q value is the False Discovery Rate (FDR) analogue of the P value (Benjamini and Hochberg 1995), defined as the minimum FDR at which the test may be called significant. We used the 'Benjamini and Hochberg' method of 'p.adjust' function in R to convert P values into Q values.
In addition to the links below, the full results of the analysis summarized in this report can also be downloaded programmatically using firehose_get, or interactively from either the Broad GDAC website or TCGA Data Coordination Center Portal.