This pipeline computes the correlation between significant copy number variation (cnv focal) genes and selected clinical features.
Testing the association between copy number variation 52 focal events and 8 clinical features across 472 patients, 93 significant findings detected with Q value < 0.25.
-
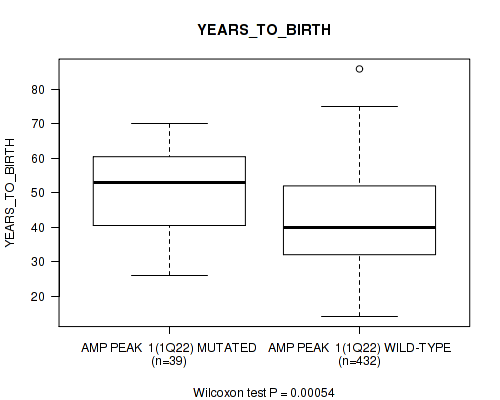
amp_1q22 cnv correlated to 'YEARS_TO_BIRTH'.
-
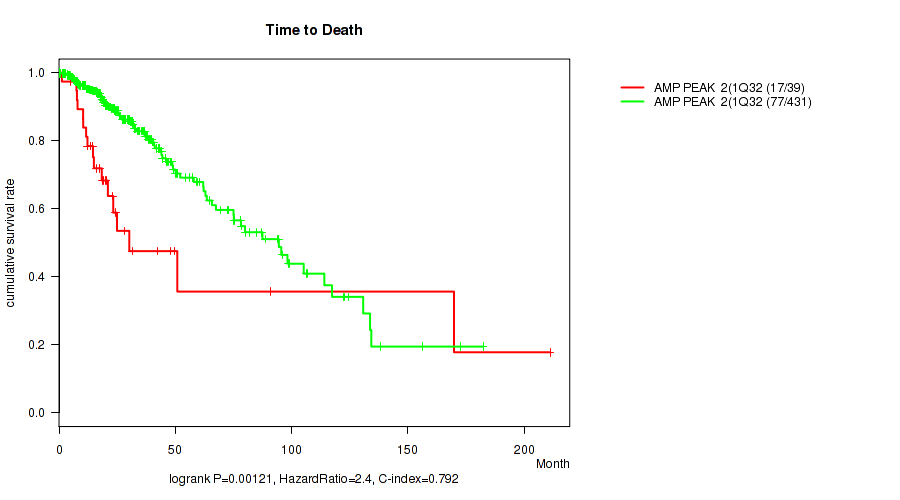
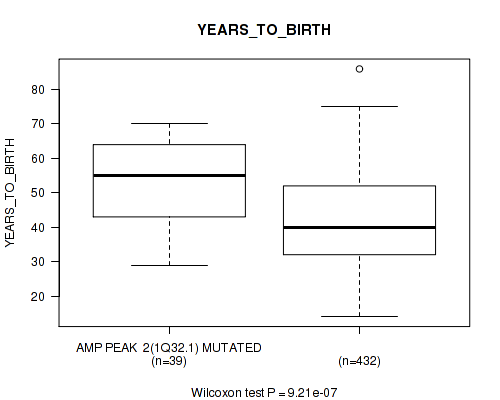
amp_1q32.1 cnv correlated to 'Time to Death' and 'YEARS_TO_BIRTH'.
-
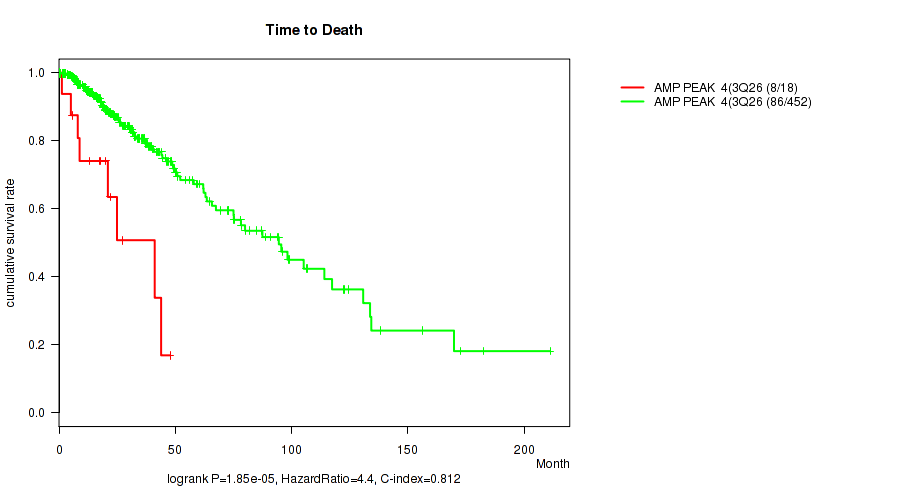
amp_3q26.33 cnv correlated to 'Time to Death' and 'HISTOLOGICAL_TYPE'.
-
amp_4q12 cnv correlated to 'Time to Death' and 'HISTOLOGICAL_TYPE'.
-
amp_7p11.2 cnv correlated to 'Time to Death' and 'YEARS_TO_BIRTH'.
-
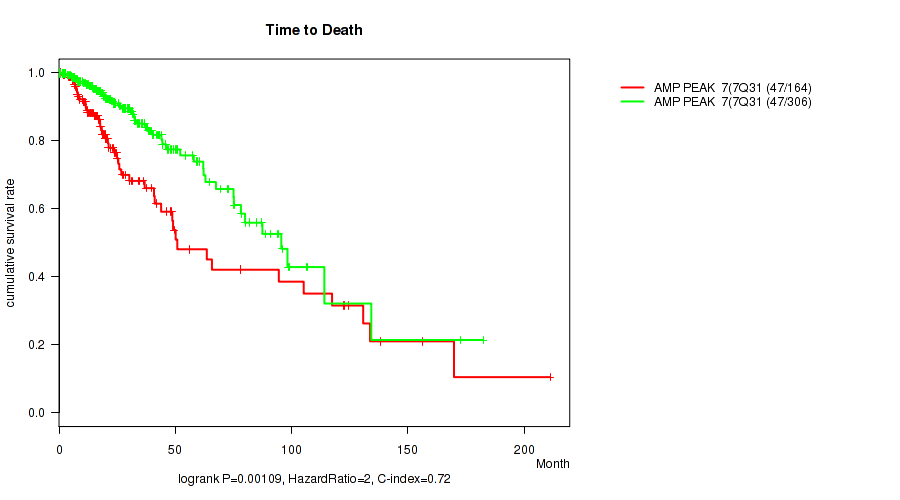
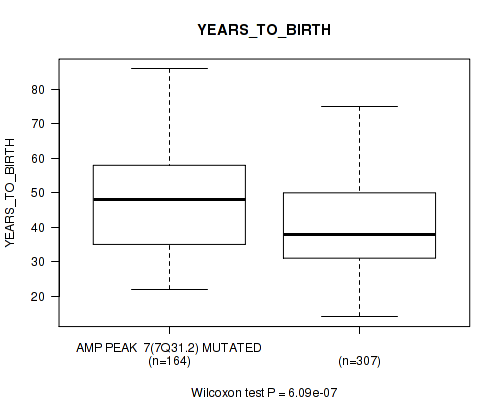
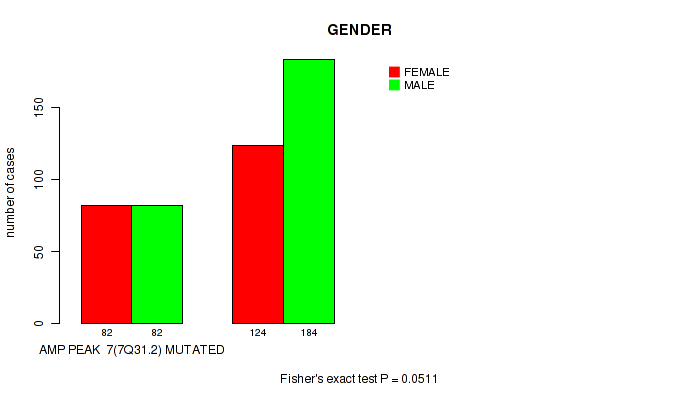
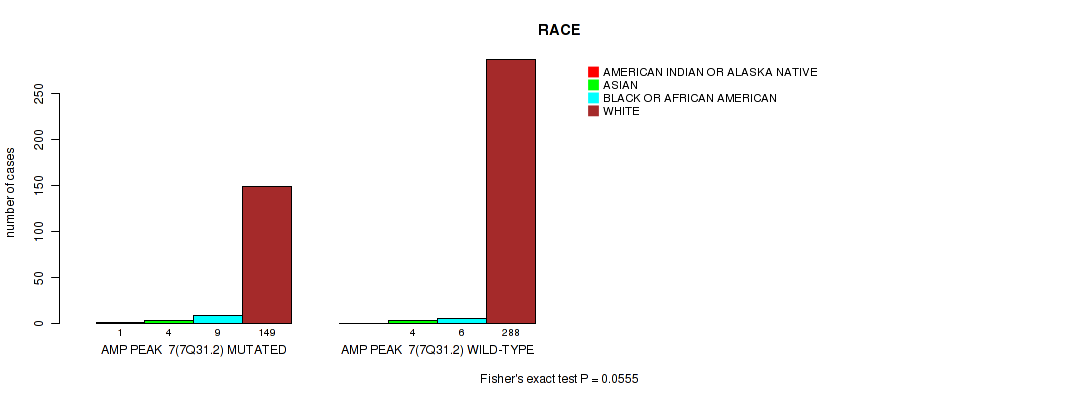
amp_7q31.2 cnv correlated to 'Time to Death', 'YEARS_TO_BIRTH', 'GENDER', and 'RACE'.
-
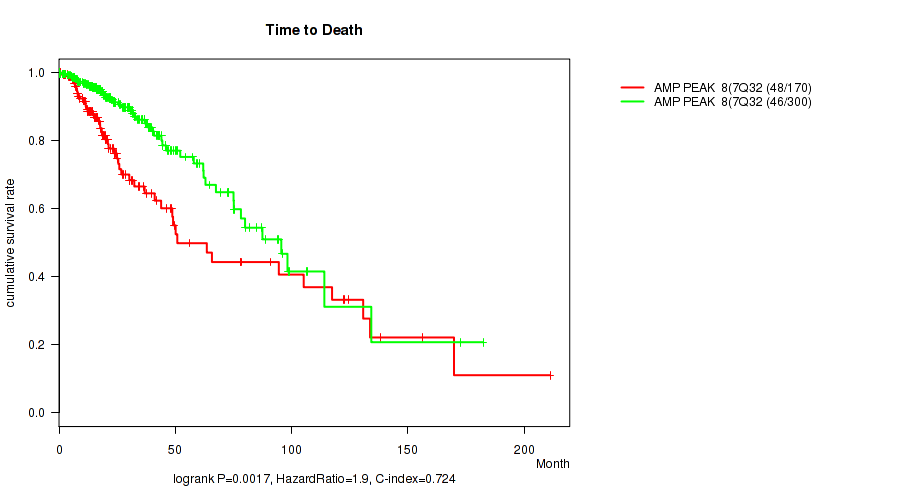
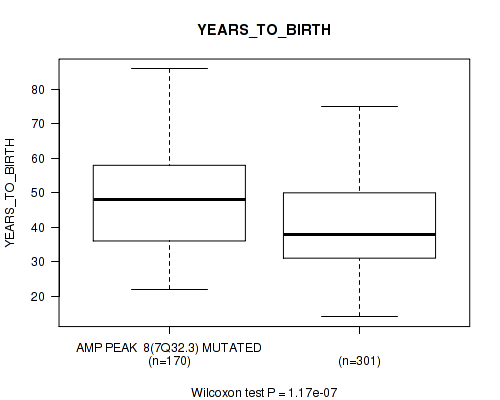
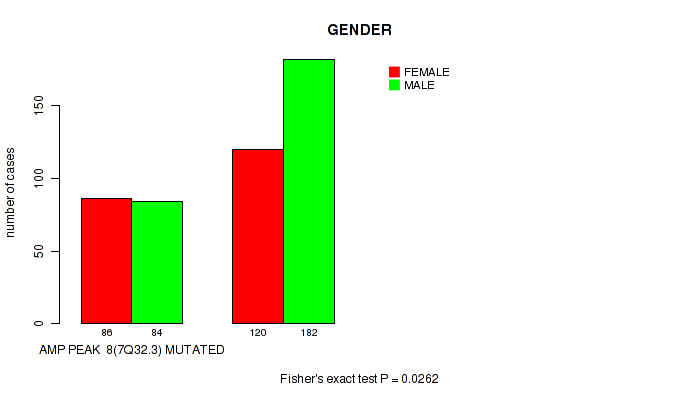
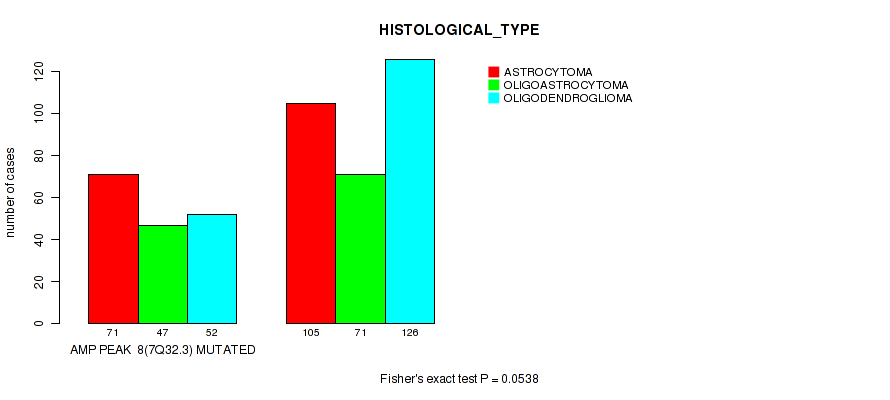
amp_7q32.3 cnv correlated to 'Time to Death', 'YEARS_TO_BIRTH', 'GENDER', and 'HISTOLOGICAL_TYPE'.
-
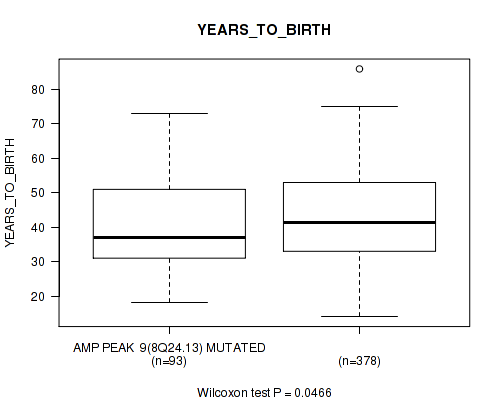
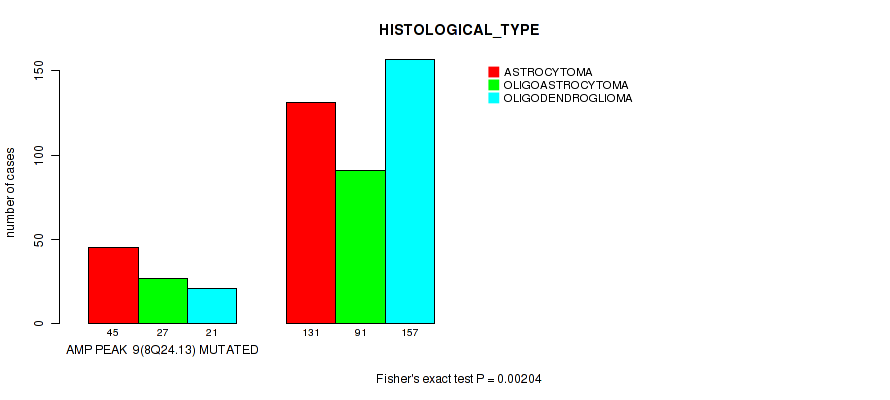
amp_8q24.13 cnv correlated to 'YEARS_TO_BIRTH' and 'HISTOLOGICAL_TYPE'.
-
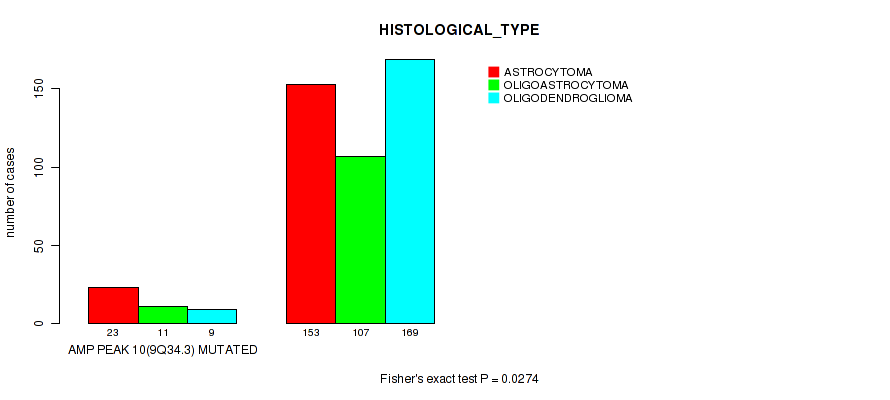
amp_9q34.3 cnv correlated to 'HISTOLOGICAL_TYPE'.
-
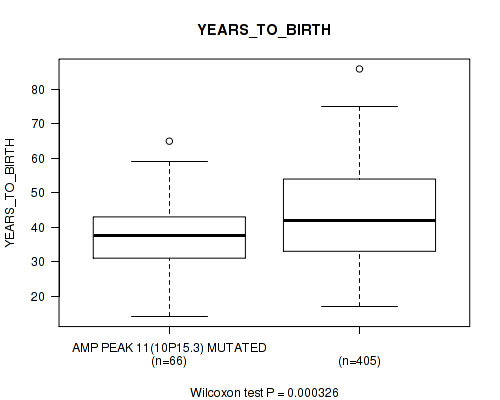
amp_10p15.3 cnv correlated to 'YEARS_TO_BIRTH' and 'HISTOLOGICAL_TYPE'.
-
amp_12p13.32 cnv correlated to 'YEARS_TO_BIRTH'.
-
amp_12q14.1 cnv correlated to 'Time to Death', 'YEARS_TO_BIRTH', and 'HISTOLOGICAL_TYPE'.
-
amp_15q26.3 cnv correlated to 'Time to Death'.
-
amp_17q25.1 cnv correlated to 'Time to Death' and 'YEARS_TO_BIRTH'.
-
amp_19p13.3 cnv correlated to 'YEARS_TO_BIRTH' and 'HISTOLOGICAL_TYPE'.
-
amp_19p13.2 cnv correlated to 'YEARS_TO_BIRTH' and 'HISTOLOGICAL_TYPE'.
-
amp_xp11.22 cnv correlated to 'HISTOLOGICAL_TYPE'.
-
amp_xp11.22 cnv correlated to 'HISTOLOGICAL_TYPE'.
-
del_1p36.32 cnv correlated to 'YEARS_TO_BIRTH', 'HISTOLOGICAL_TYPE', and 'RADIATIONS_RADIATION_REGIMENINDICATION'.
-
del_1p32.3 cnv correlated to 'Time to Death', 'YEARS_TO_BIRTH', 'HISTOLOGICAL_TYPE', and 'RADIATIONS_RADIATION_REGIMENINDICATION'.
-
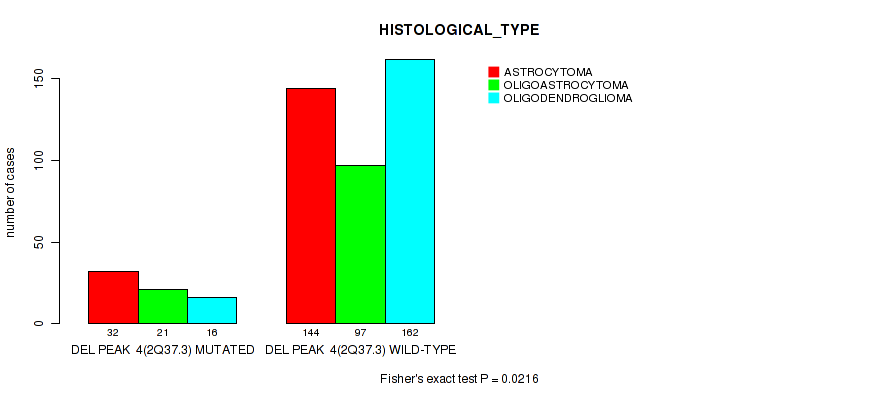
del_2q37.3 cnv correlated to 'HISTOLOGICAL_TYPE'.
-
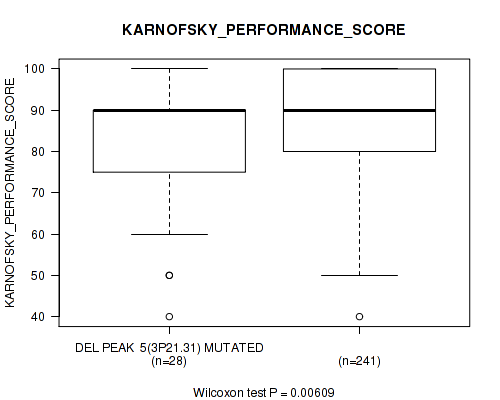
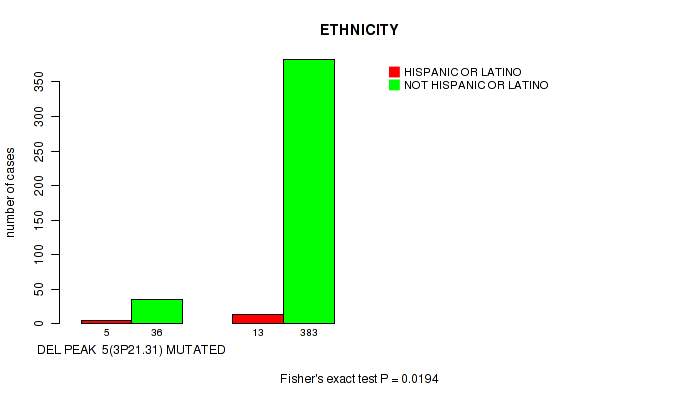
del_3p21.31 cnv correlated to 'KARNOFSKY_PERFORMANCE_SCORE' and 'ETHNICITY'.
-
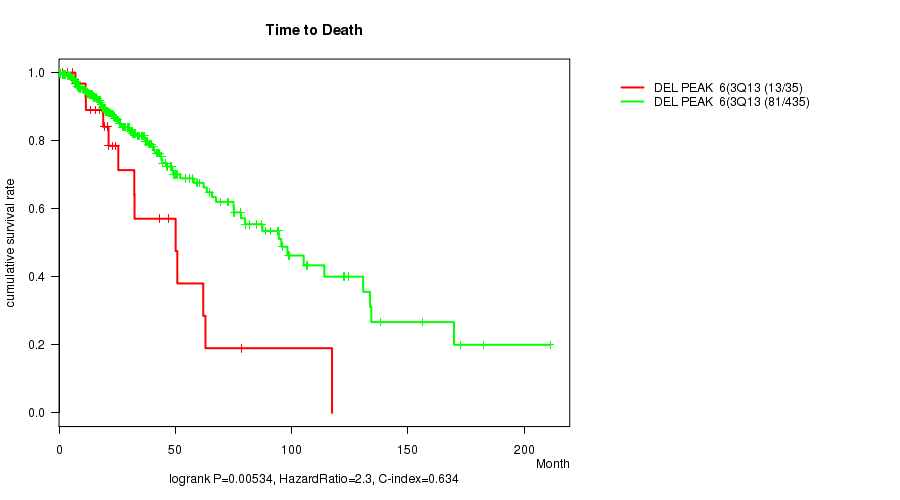
del_3q13.31 cnv correlated to 'Time to Death'.
-
del_3q29 cnv correlated to 'Time to Death'.
-
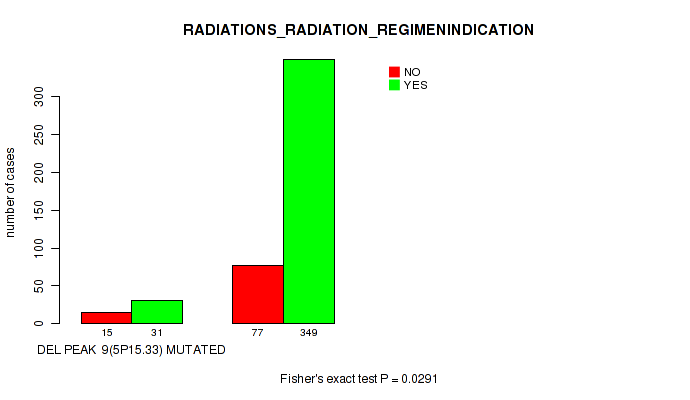
del_5p15.33 cnv correlated to 'KARNOFSKY_PERFORMANCE_SCORE', 'HISTOLOGICAL_TYPE', and 'RADIATIONS_RADIATION_REGIMENINDICATION'.
-
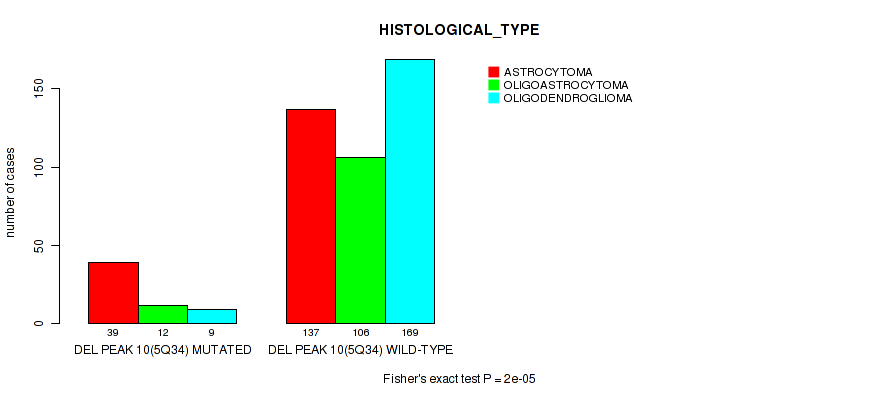
del_5q34 cnv correlated to 'HISTOLOGICAL_TYPE'.
-
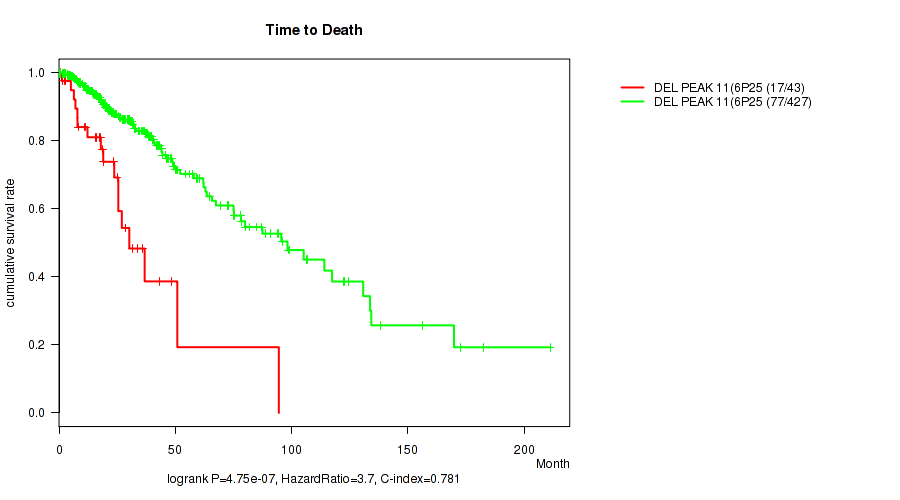
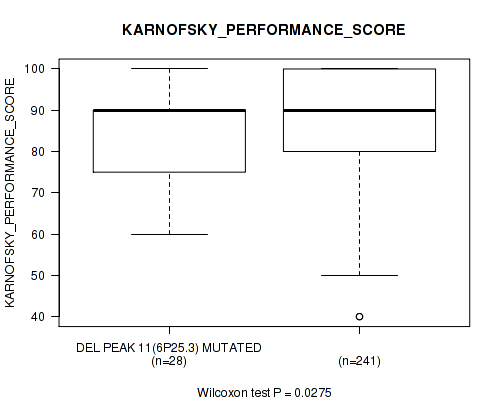
del_6p25.3 cnv correlated to 'Time to Death' and 'KARNOFSKY_PERFORMANCE_SCORE'.
-
del_6q22.31 cnv correlated to 'Time to Death', 'KARNOFSKY_PERFORMANCE_SCORE', and 'HISTOLOGICAL_TYPE'.
-
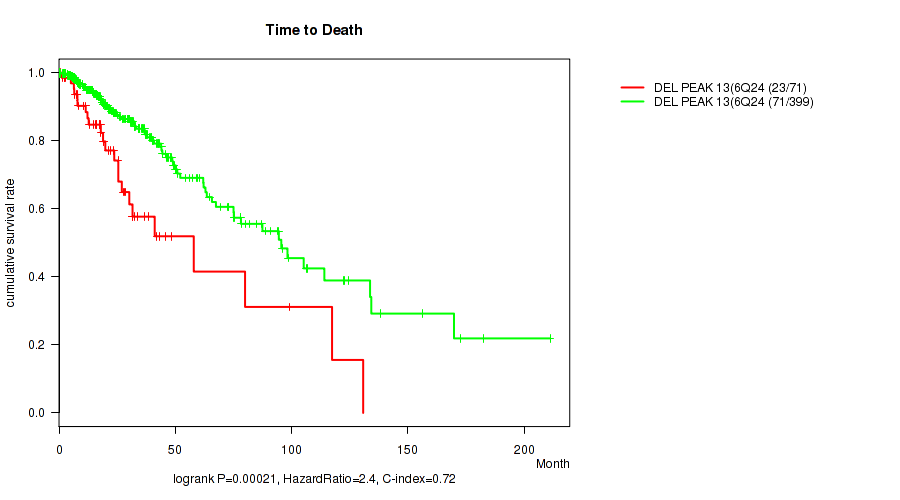
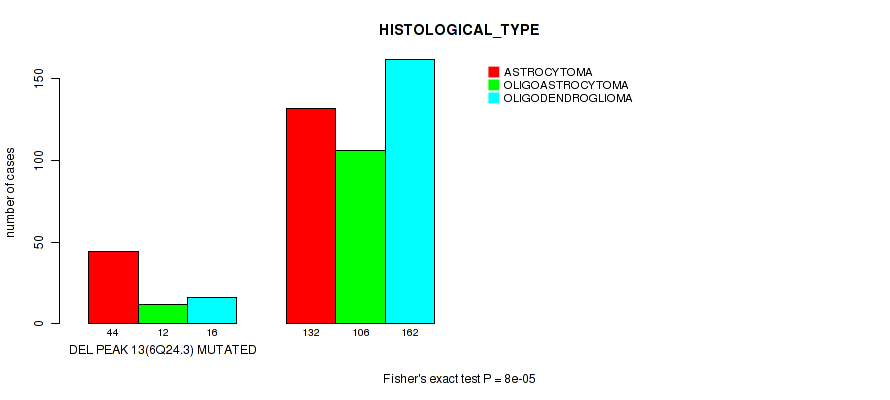
del_6q24.3 cnv correlated to 'Time to Death', 'KARNOFSKY_PERFORMANCE_SCORE', and 'HISTOLOGICAL_TYPE'.
-
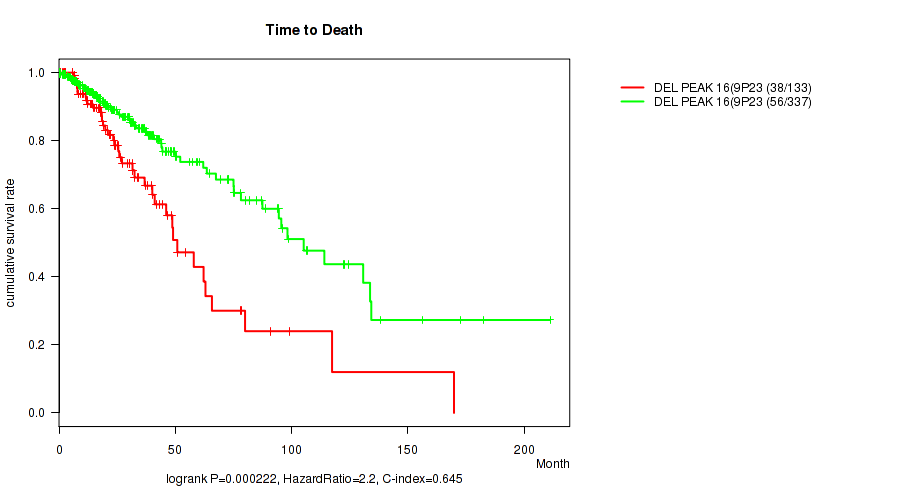
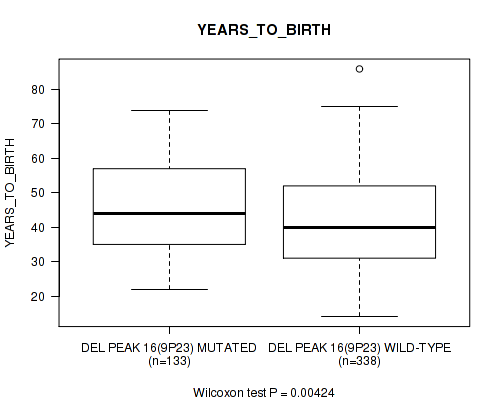
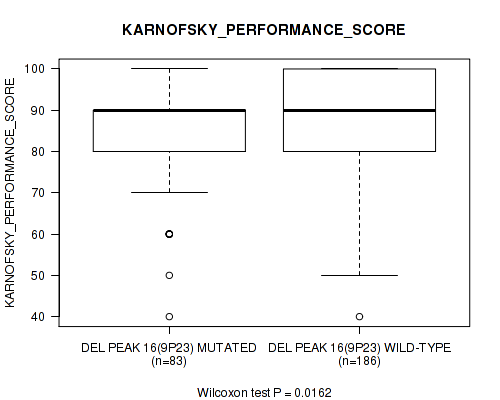
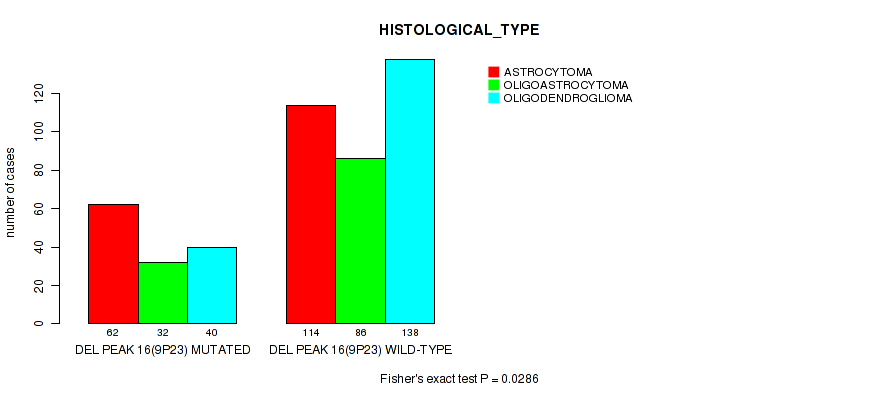
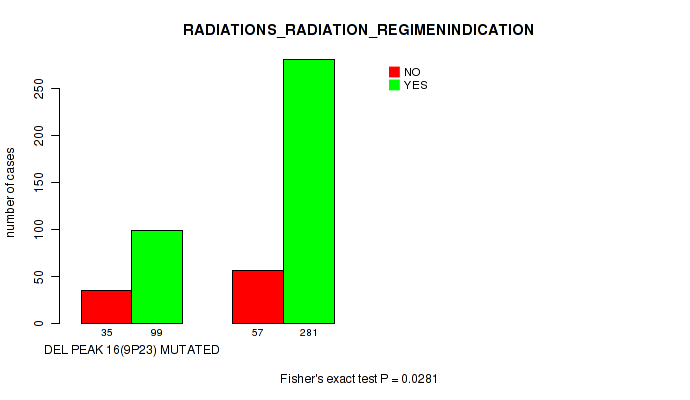
del_9p23 cnv correlated to 'Time to Death', 'YEARS_TO_BIRTH', 'KARNOFSKY_PERFORMANCE_SCORE', 'HISTOLOGICAL_TYPE', and 'RADIATIONS_RADIATION_REGIMENINDICATION'.
-
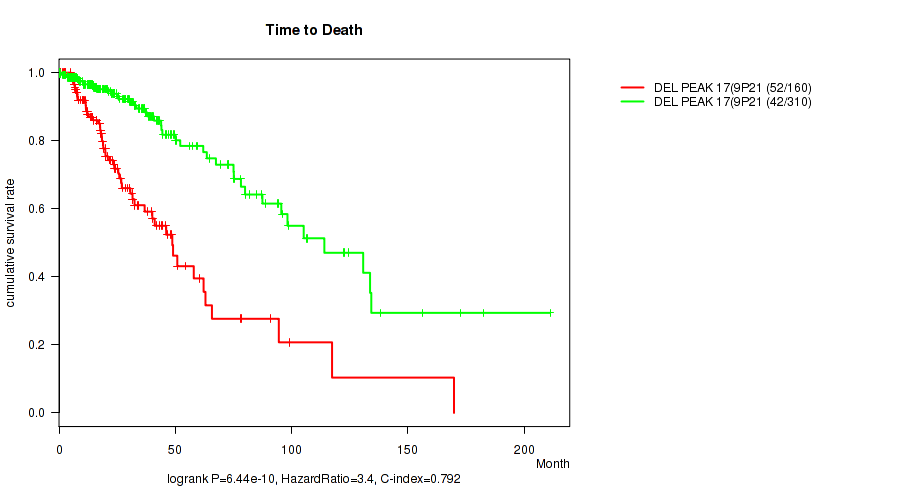
del_9p21.3 cnv correlated to 'Time to Death', 'YEARS_TO_BIRTH', 'KARNOFSKY_PERFORMANCE_SCORE', 'HISTOLOGICAL_TYPE', and 'RADIATIONS_RADIATION_REGIMENINDICATION'.
-
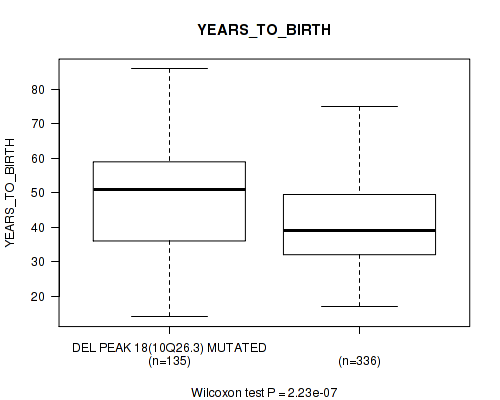
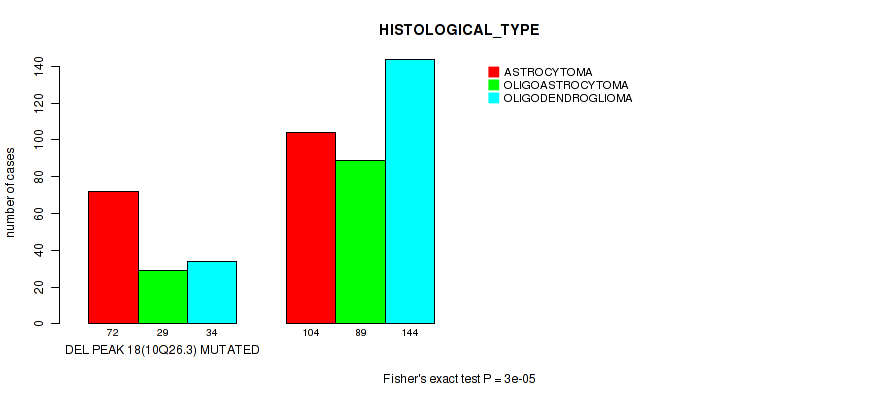
del_10q26.3 cnv correlated to 'Time to Death', 'YEARS_TO_BIRTH', and 'HISTOLOGICAL_TYPE'.
-
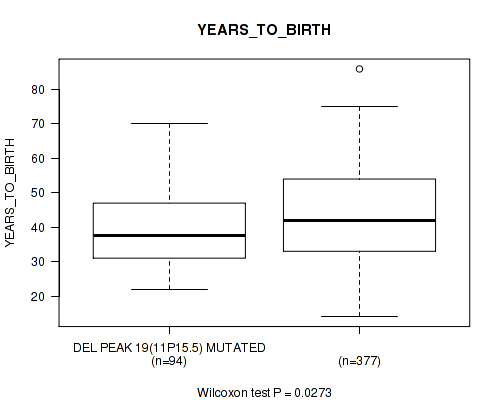
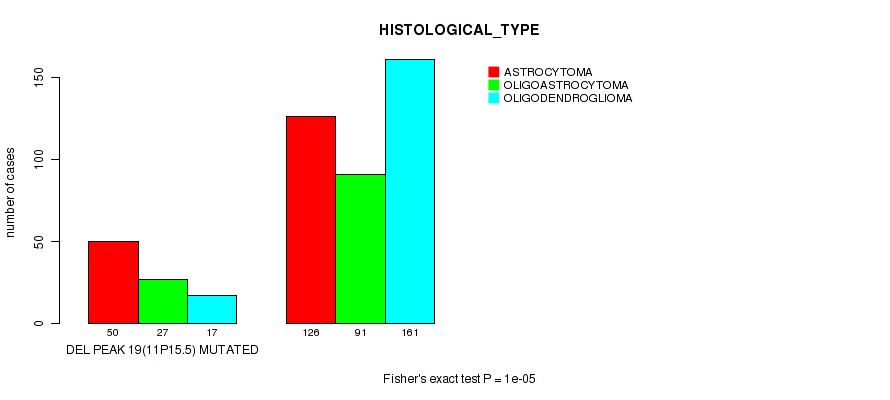
del_11p15.5 cnv correlated to 'YEARS_TO_BIRTH' and 'HISTOLOGICAL_TYPE'.
-
del_11p15.1 cnv correlated to 'KARNOFSKY_PERFORMANCE_SCORE' and 'HISTOLOGICAL_TYPE'.
-
del_12p13.1 cnv correlated to 'Time to Death' and 'HISTOLOGICAL_TYPE'.
-
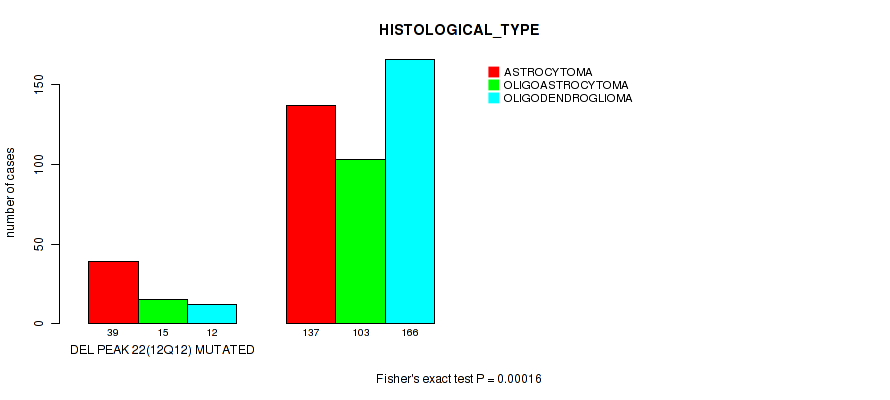
del_12q12 cnv correlated to 'HISTOLOGICAL_TYPE'.
-
del_13q14.2 cnv correlated to 'KARNOFSKY_PERFORMANCE_SCORE'.
-
del_13q14.2 cnv correlated to 'KARNOFSKY_PERFORMANCE_SCORE'.
-
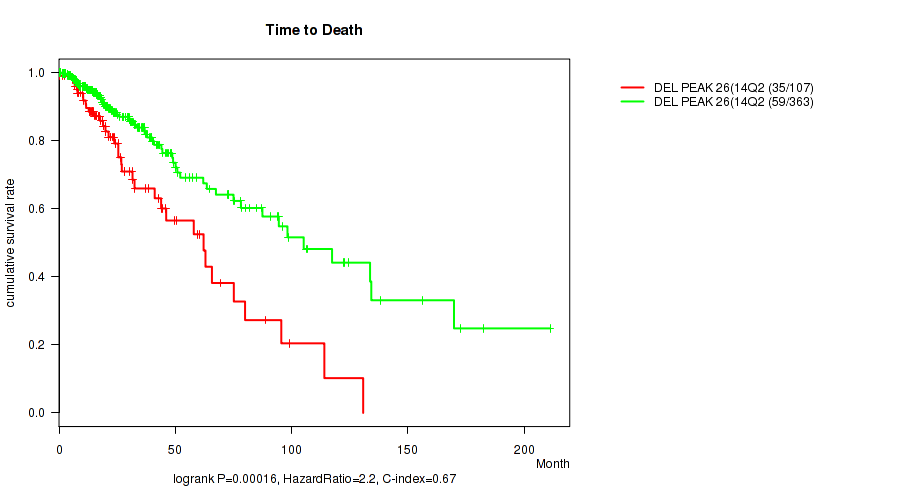
del_14q24.3 cnv correlated to 'Time to Death' and 'YEARS_TO_BIRTH'.
-
del_18q23 cnv correlated to 'YEARS_TO_BIRTH'.
-
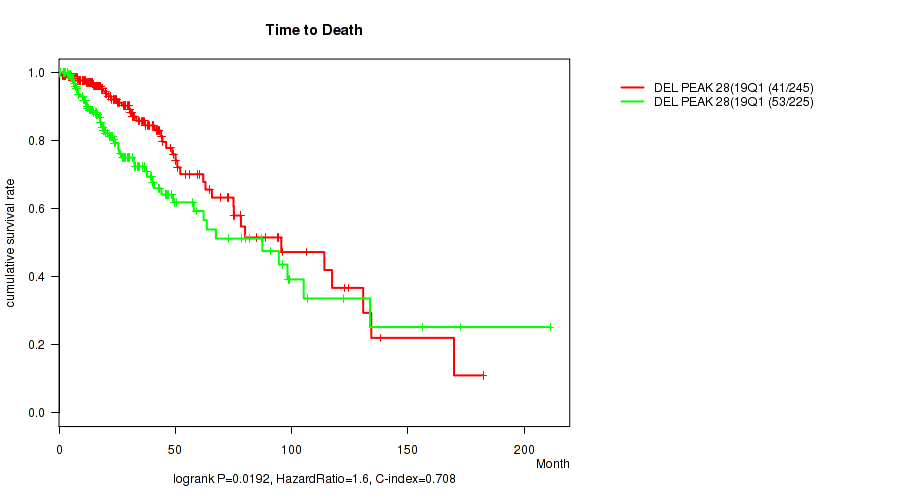
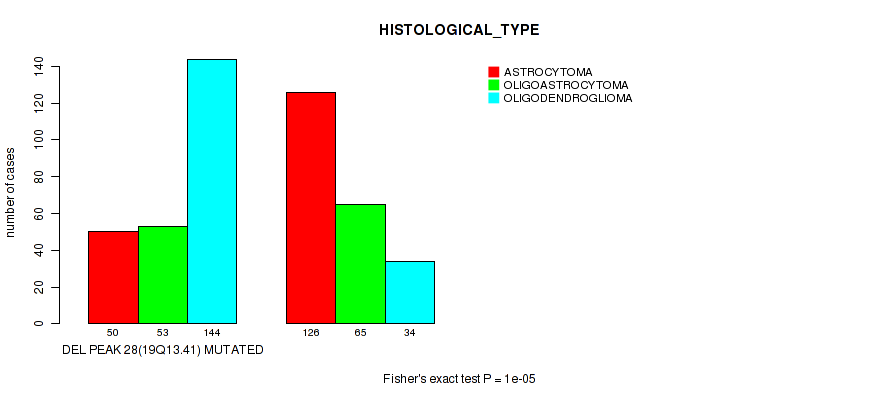
del_19q13.41 cnv correlated to 'Time to Death', 'YEARS_TO_BIRTH', and 'HISTOLOGICAL_TYPE'.
-
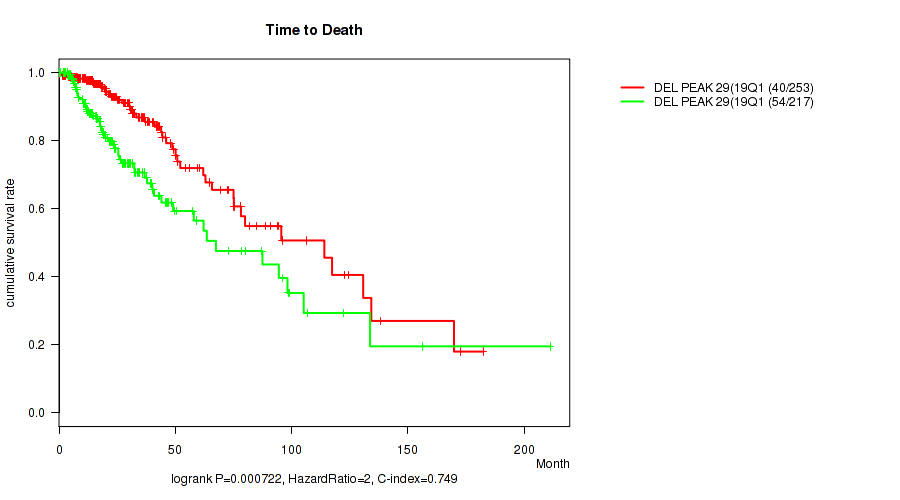
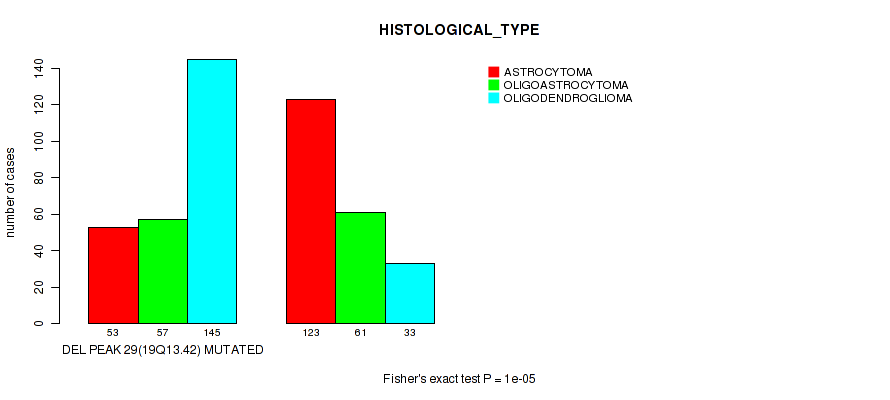
del_19q13.42 cnv correlated to 'Time to Death' and 'HISTOLOGICAL_TYPE'.
-
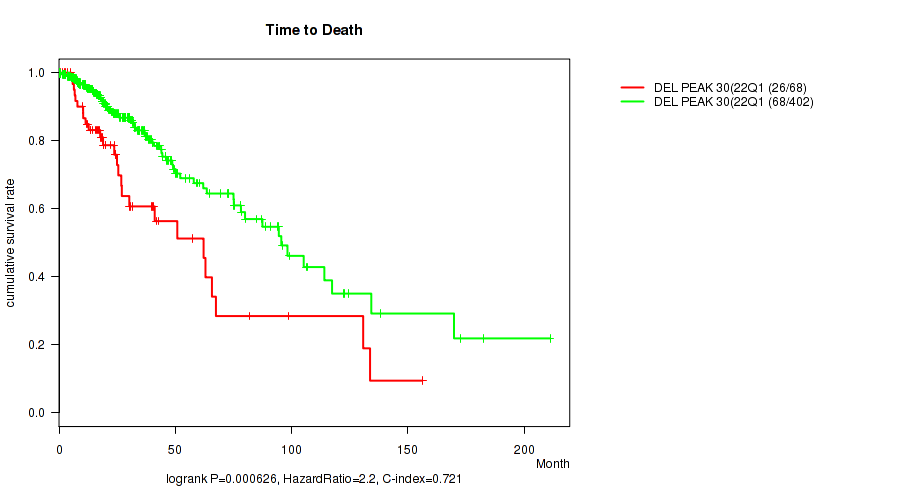
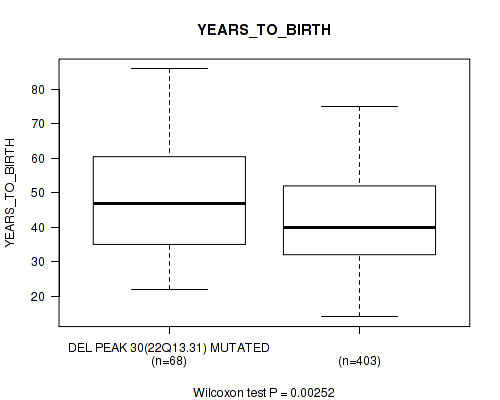
del_22q13.31 cnv correlated to 'Time to Death', 'YEARS_TO_BIRTH', and 'HISTOLOGICAL_TYPE'.
-
del_xq21.1 cnv correlated to 'Time to Death'.
Table 1. Get Full Table Overview of the association between significant copy number variation of 52 focal events and 8 clinical features. Shown in the table are P values (Q values). Thresholded by Q value < 0.25, 93 significant findings detected.
|
Clinical Features |
Time to Death |
YEARS TO BIRTH |
GENDER |
KARNOFSKY PERFORMANCE SCORE |
HISTOLOGICAL TYPE |
RADIATIONS RADIATION REGIMENINDICATION |
RACE | ETHNICITY | ||
| nCNV (%) | nWild-Type | logrank test | Wilcoxon-test | Fisher's exact test | Wilcoxon-test | Fisher's exact test | Fisher's exact test | Fisher's exact test | Fisher's exact test | |
| del 9p23 | 134 (28%) | 338 |
0.000222 (0.0028) |
0.00424 (0.036) |
0.609 (0.86) |
0.0162 (0.109) |
0.0286 (0.155) |
0.0281 (0.155) |
0.95 (1.00) |
0.6 (0.857) |
| del 9p21 3 | 161 (34%) | 311 |
6.44e-10 (1.24e-07) |
3.11e-06 (9.96e-05) |
0.282 (0.647) |
0.00441 (0.0365) |
0.00592 (0.0443) |
0.0203 (0.13) |
1 (1.00) |
0.621 (0.86) |
| amp 7q31 2 | 164 (35%) | 308 |
0.00109 (0.0116) |
6.09e-07 (2.53e-05) |
0.0511 (0.236) |
0.331 (0.672) |
0.059 (0.259) |
0.331 (0.672) |
0.0555 (0.249) |
1 (1.00) |
| amp 7q32 3 | 170 (36%) | 302 |
0.0017 (0.0168) |
1.17e-07 (8.09e-06) |
0.0262 (0.153) |
0.445 (0.749) |
0.0538 (0.246) |
0.276 (0.641) |
0.0771 (0.297) |
0.807 (0.945) |
| del 1p32 3 | 181 (38%) | 291 |
0.0214 (0.132) |
1.47e-06 (5.09e-05) |
0.569 (0.842) |
0.55 (0.832) |
1e-05 (0.000208) |
0.00396 (0.0343) |
0.374 (0.704) |
0.806 (0.945) |
| amp 12q14 1 | 34 (7%) | 438 |
3.62e-08 (3.31e-06) |
0.00504 (0.0403) |
0.721 (0.91) |
0.274 (0.641) |
0.0337 (0.169) |
0.367 (0.704) |
0.323 (0.668) |
1 (1.00) |
| del 1p36 32 | 191 (40%) | 281 |
0.154 (0.442) |
3.25e-07 (1.69e-05) |
0.396 (0.713) |
0.673 (0.874) |
1e-05 (0.000208) |
0.033 (0.167) |
0.302 (0.665) |
0.628 (0.86) |
| del 5p15 33 | 46 (10%) | 426 |
0.951 (1.00) |
0.399 (0.715) |
0.536 (0.826) |
0.0326 (0.167) |
0.00291 (0.0269) |
0.0291 (0.155) |
0.545 (0.828) |
0.7 (0.892) |
| del 6q22 31 | 69 (15%) | 403 |
1.28e-05 (0.000254) |
0.203 (0.524) |
0.694 (0.891) |
0.0442 (0.211) |
3e-05 (0.000499) |
0.412 (0.726) |
0.185 (0.491) |
0.733 (0.916) |
| del 6q24 3 | 72 (15%) | 400 |
0.00021 (0.00273) |
0.646 (0.868) |
0.369 (0.704) |
0.0442 (0.211) |
8e-05 (0.00119) |
0.335 (0.674) |
0.21 (0.539) |
0.331 (0.672) |
| del 10q26 3 | 135 (29%) | 337 |
3.75e-12 (1.56e-09) |
2.23e-07 (1.33e-05) |
0.0653 (0.269) |
0.165 (0.454) |
3e-05 (0.000499) |
0.7 (0.892) |
0.175 (0.472) |
1 (1.00) |
| del 19q13 41 | 247 (52%) | 225 |
0.0192 (0.126) |
0.0247 (0.147) |
0.578 (0.843) |
0.641 (0.865) |
1e-05 (0.000208) |
0.487 (0.779) |
0.395 (0.713) |
1 (1.00) |
| del 22q13 31 | 68 (14%) | 404 |
0.000626 (0.00723) |
0.00252 (0.0239) |
0.511 (0.793) |
0.126 (0.402) |
0.00121 (0.0123) |
0.619 (0.86) |
0.134 (0.416) |
1 (1.00) |
| amp 1q32 1 | 39 (8%) | 433 |
0.00121 (0.0123) |
9.21e-07 (3.48e-05) |
0.866 (0.982) |
0.0587 (0.259) |
0.302 (0.665) |
0.297 (0.661) |
0.162 (0.449) |
0.385 (0.712) |
| amp 3q26 33 | 19 (4%) | 453 |
1.85e-05 (0.000349) |
0.0801 (0.298) |
0.482 (0.779) |
0.161 (0.449) |
0.00447 (0.0365) |
0.231 (0.564) |
0.0609 (0.26) |
1 (1.00) |
| amp 4q12 | 27 (6%) | 445 |
0.014 (0.0955) |
0.232 (0.564) |
0.843 (0.961) |
0.317 (0.668) |
0.00385 (0.0341) |
0.626 (0.86) |
0.772 (0.941) |
1 (1.00) |
| amp 7p11 2 | 117 (25%) | 355 |
3.98e-08 (3.31e-06) |
8.98e-10 (1.24e-07) |
0.333 (0.673) |
0.0646 (0.269) |
0.0661 (0.269) |
0.42 (0.731) |
0.0667 (0.269) |
0.786 (0.942) |
| amp 8q24 13 | 93 (20%) | 379 |
0.462 (0.771) |
0.0466 (0.218) |
0.296 (0.661) |
0.419 (0.731) |
0.00204 (0.0197) |
1 (1.00) |
0.615 (0.86) |
0.373 (0.704) |
| amp 10p15 3 | 66 (14%) | 406 |
0.44 (0.749) |
0.000326 (0.00399) |
0.229 (0.564) |
0.0691 (0.271) |
7e-05 (0.00108) |
0.0945 (0.336) |
0.815 (0.947) |
0.0804 (0.298) |
| amp 17q25 1 | 39 (8%) | 433 |
0.00926 (0.0653) |
0.0302 (0.157) |
0.614 (0.86) |
0.361 (0.704) |
0.211 (0.539) |
0.673 (0.874) |
0.202 (0.524) |
0.647 (0.868) |
| amp 19p13 3 | 120 (25%) | 352 |
0.627 (0.86) |
0.0446 (0.211) |
0.831 (0.957) |
0.631 (0.86) |
1e-05 (0.000208) |
0.594 (0.853) |
0.803 (0.945) |
0.789 (0.943) |
| amp 19p13 2 | 113 (24%) | 359 |
0.806 (0.945) |
0.0115 (0.0796) |
0.277 (0.641) |
0.315 (0.668) |
1e-05 (0.000208) |
0.892 (0.991) |
0.707 (0.897) |
0.78 (0.942) |
| del 3p21 31 | 44 (9%) | 428 |
0.323 (0.668) |
0.493 (0.779) |
0.874 (0.982) |
0.00609 (0.0445) |
0.48 (0.779) |
0.322 (0.668) |
0.443 (0.749) |
0.0194 (0.126) |
| del 6p25 3 | 44 (9%) | 428 |
4.75e-07 (2.2e-05) |
0.345 (0.681) |
0.874 (0.982) |
0.0275 (0.155) |
0.369 (0.704) |
0.843 (0.961) |
0.0785 (0.298) |
0.233 (0.564) |
| del 11p15 5 | 94 (20%) | 378 |
0.331 (0.672) |
0.0273 (0.155) |
0.081 (0.298) |
0.0996 (0.343) |
1e-05 (0.000208) |
0.467 (0.774) |
0.559 (0.833) |
0.77 (0.941) |
| del 11p15 1 | 66 (14%) | 406 |
0.0684 (0.271) |
0.23 (0.564) |
0.0613 (0.26) |
0.0356 (0.177) |
0.00083 (0.00909) |
0.315 (0.668) |
0.67 (0.874) |
0.739 (0.918) |
| del 12p13 1 | 35 (7%) | 437 |
0.00339 (0.0307) |
0.366 (0.704) |
1 (1.00) |
0.492 (0.779) |
0.0421 (0.206) |
0.374 (0.704) |
0.808 (0.945) |
0.384 (0.712) |
| del 14q24 3 | 108 (23%) | 364 |
0.00016 (0.00215) |
0.0556 (0.249) |
0.151 (0.44) |
0.441 (0.749) |
0.191 (0.499) |
0.783 (0.942) |
0.189 (0.497) |
1 (1.00) |
| del 19q13 42 | 255 (54%) | 217 |
0.000722 (0.00812) |
0.133 (0.416) |
0.78 (0.942) |
0.666 (0.874) |
1e-05 (0.000208) |
0.727 (0.914) |
0.389 (0.713) |
0.811 (0.945) |
| amp 1q22 | 39 (8%) | 433 |
0.111 (0.37) |
0.00054 (0.00641) |
1 (1.00) |
0.505 (0.789) |
0.345 (0.681) |
0.297 (0.661) |
0.257 (0.612) |
0.385 (0.712) |
| amp 9q34 3 | 43 (9%) | 429 |
0.999 (1.00) |
0.833 (0.957) |
0.107 (0.364) |
0.108 (0.364) |
0.0274 (0.155) |
0.545 (0.828) |
0.128 (0.408) |
0.222 (0.556) |
| amp 12p13 32 | 64 (14%) | 408 |
0.633 (0.86) |
0.0239 (0.144) |
0.222 (0.556) |
0.81 (0.945) |
0.122 (0.395) |
0.0879 (0.318) |
1 (1.00) |
0.489 (0.779) |
| amp 15q26 3 | 15 (3%) | 457 |
4.89e-05 (0.000783) |
0.558 (0.833) |
0.799 (0.945) |
0.14 (0.423) |
0.0866 (0.316) |
0.506 (0.789) |
1 (1.00) |
0.45 (0.755) |
| amp xp11 22 | 41 (9%) | 431 |
0.473 (0.779) |
0.445 (0.749) |
1 (1.00) |
0.668 (0.874) |
0.0084 (0.0602) |
0.218 (0.554) |
0.291 (0.659) |
1 (1.00) |
| amp xp11 22 | 57 (12%) | 415 |
0.913 (0.995) |
0.914 (0.995) |
0.156 (0.445) |
0.991 (1.00) |
0.00011 (0.00158) |
0.48 (0.779) |
0.897 (0.991) |
1 (1.00) |
| del 2q37 3 | 69 (15%) | 403 |
0.542 (0.828) |
0.098 (0.342) |
0.434 (0.745) |
0.701 (0.892) |
0.0216 (0.132) |
0.412 (0.726) |
0.686 (0.884) |
0.176 (0.472) |
| del 3q13 31 | 35 (7%) | 437 |
0.00534 (0.0419) |
0.62 (0.86) |
0.29 (0.659) |
0.487 (0.779) |
0.566 (0.841) |
0.374 (0.704) |
0.671 (0.874) |
0.633 (0.86) |
| del 3q29 | 40 (8%) | 432 |
0.021 (0.132) |
0.73 (0.915) |
0.739 (0.918) |
0.404 (0.72) |
0.132 (0.416) |
0.676 (0.874) |
0.396 (0.713) |
0.652 (0.873) |
| del 5q34 | 60 (13%) | 412 |
0.0989 (0.343) |
0.608 (0.86) |
0.889 (0.991) |
0.31 (0.668) |
2e-05 (0.000362) |
0.161 (0.449) |
0.343 (0.681) |
0.49 (0.779) |
| del 12q12 | 66 (14%) | 406 |
0.638 (0.865) |
0.395 (0.713) |
0.423 (0.734) |
0.602 (0.857) |
0.00016 (0.00215) |
0.868 (0.982) |
0.31 (0.668) |
0.154 (0.442) |
| del 13q14 2 | 129 (27%) | 343 |
0.075 (0.292) |
0.904 (0.991) |
0.145 (0.434) |
0.00576 (0.0443) |
0.14 (0.423) |
0.0897 (0.322) |
0.343 (0.681) |
1 (1.00) |
| del 13q14 2 | 131 (28%) | 341 |
0.0973 (0.342) |
0.895 (0.991) |
0.148 (0.438) |
0.00597 (0.0443) |
0.109 (0.364) |
0.119 (0.389) |
0.347 (0.681) |
1 (1.00) |
| del 18q23 | 74 (16%) | 398 |
0.558 (0.833) |
0.0291 (0.155) |
0.308 (0.668) |
0.902 (0.991) |
0.496 (0.782) |
0.873 (0.982) |
0.136 (0.419) |
0.168 (0.457) |
| del xq21 1 | 66 (14%) | 406 |
0.0302 (0.157) |
0.0599 (0.259) |
0.594 (0.853) |
0.902 (0.991) |
0.503 (0.789) |
1 (1.00) |
0.378 (0.707) |
1 (1.00) |
| amp 2p24 3 | 22 (5%) | 450 |
0.068 (0.271) |
0.784 (0.942) |
0.661 (0.874) |
0.479 (0.779) |
0.123 (0.395) |
0.592 (0.853) |
1 (1.00) |
0.181 (0.483) |
| amp 11q24 1 | 82 (17%) | 390 |
0.906 (0.991) |
0.248 (0.597) |
0.463 (0.771) |
0.887 (0.991) |
0.52 (0.804) |
0.878 (0.985) |
0.577 (0.843) |
0.75 (0.926) |
| amp 13q34 | 21 (4%) | 451 |
0.272 (0.641) |
0.742 (0.919) |
0.658 (0.874) |
0.117 (0.386) |
0.586 (0.853) |
0.578 (0.843) |
0.664 (0.874) |
0.577 (0.843) |
| del 1q43 | 27 (6%) | 445 |
0.676 (0.874) |
0.276 (0.641) |
0.427 (0.736) |
0.801 (0.945) |
0.283 (0.647) |
1 (1.00) |
0.223 (0.556) |
0.307 (0.668) |
| del 4q34 3 | 125 (26%) | 347 |
0.826 (0.957) |
0.151 (0.44) |
0.754 (0.928) |
0.476 (0.779) |
0.831 (0.957) |
0.148 (0.438) |
0.589 (0.853) |
1 (1.00) |
| del 7p22 3 | 19 (4%) | 453 |
0.167 (0.457) |
0.923 (0.999) |
1 (1.00) |
0.76 (0.932) |
0.916 (0.995) |
0.773 (0.941) |
0.405 (0.72) |
1 (1.00) |
| del 8q24 3 | 26 (6%) | 446 |
0.842 (0.961) |
0.62 (0.86) |
0.545 (0.828) |
0.955 (1.00) |
0.158 (0.446) |
0.314 (0.668) |
0.413 (0.726) |
0.0619 (0.26) |
| del 13q34 | 99 (21%) | 373 |
0.0792 (0.298) |
0.72 (0.91) |
0.255 (0.611) |
0.138 (0.423) |
0.989 (1.00) |
0.318 (0.668) |
0.394 (0.713) |
0.557 (0.833) |
P value = 0.00054 (Wilcoxon-test), Q value = 0.0064
Table S1. Gene #1: 'amp_1q22' versus Clinical Feature #2: 'YEARS_TO_BIRTH'
| nPatients | Mean (Std.Dev) | |
|---|---|---|
| ALL | 471 | 43.1 (13.4) |
| AMP PEAK 1(1Q22) MUTATED | 39 | 50.2 (13.2) |
| AMP PEAK 1(1Q22) WILD-TYPE | 432 | 42.4 (13.3) |
Figure S1. Get High-res Image Gene #1: 'amp_1q22' versus Clinical Feature #2: 'YEARS_TO_BIRTH'
P value = 0.00121 (logrank test), Q value = 0.012
Table S2. Gene #2: 'amp_1q32.1' versus Clinical Feature #1: 'Time to Death'
| nPatients | nDeath | Duration Range (Median), Month | |
|---|---|---|---|
| ALL | 470 | 94 | 0.0 - 211.2 (18.7) |
| AMP PEAK 2(1Q32.1) MUTATED | 39 | 17 | 0.2 - 211.2 (18.4) |
| AMP PEAK 2(1Q32.1) WILD-TYPE | 431 | 77 | 0.0 - 182.3 (18.7) |
Figure S2. Get High-res Image Gene #2: 'amp_1q32.1' versus Clinical Feature #1: 'Time to Death'
P value = 9.21e-07 (Wilcoxon-test), Q value = 3.5e-05
Table S3. Gene #2: 'amp_1q32.1' versus Clinical Feature #2: 'YEARS_TO_BIRTH'
| nPatients | Mean (Std.Dev) | |
|---|---|---|
| ALL | 471 | 43.1 (13.4) |
| AMP PEAK 2(1Q32.1) MUTATED | 39 | 53.5 (12.3) |
| AMP PEAK 2(1Q32.1) WILD-TYPE | 432 | 42.1 (13.1) |
Figure S3. Get High-res Image Gene #2: 'amp_1q32.1' versus Clinical Feature #2: 'YEARS_TO_BIRTH'
P value = 1.85e-05 (logrank test), Q value = 0.00035
Table S4. Gene #4: 'amp_3q26.33' versus Clinical Feature #1: 'Time to Death'
| nPatients | nDeath | Duration Range (Median), Month | |
|---|---|---|---|
| ALL | 470 | 94 | 0.0 - 211.2 (18.7) |
| AMP PEAK 4(3Q26.33) MUTATED | 18 | 8 | 0.2 - 47.8 (17.6) |
| AMP PEAK 4(3Q26.33) WILD-TYPE | 452 | 86 | 0.0 - 211.2 (18.7) |
Figure S4. Get High-res Image Gene #4: 'amp_3q26.33' versus Clinical Feature #1: 'Time to Death'
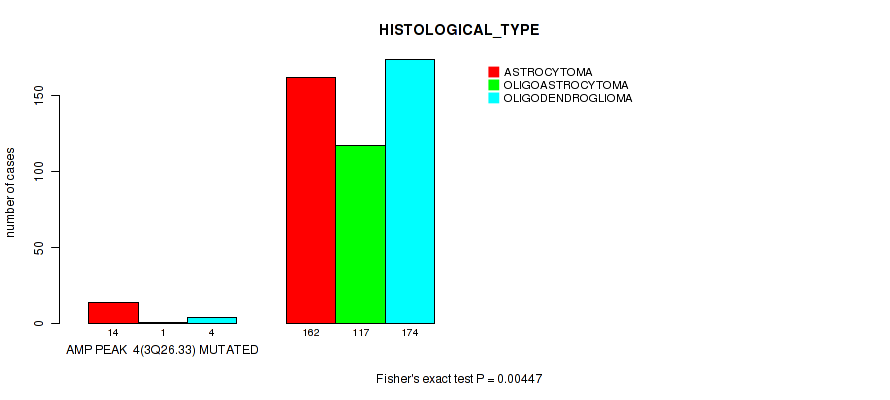
P value = 0.00447 (Fisher's exact test), Q value = 0.036
Table S5. Gene #4: 'amp_3q26.33' versus Clinical Feature #5: 'HISTOLOGICAL_TYPE'
| nPatients | ASTROCYTOMA | OLIGOASTROCYTOMA | OLIGODENDROGLIOMA |
|---|---|---|---|
| ALL | 176 | 118 | 178 |
| AMP PEAK 4(3Q26.33) MUTATED | 14 | 1 | 4 |
| AMP PEAK 4(3Q26.33) WILD-TYPE | 162 | 117 | 174 |
Figure S5. Get High-res Image Gene #4: 'amp_3q26.33' versus Clinical Feature #5: 'HISTOLOGICAL_TYPE'
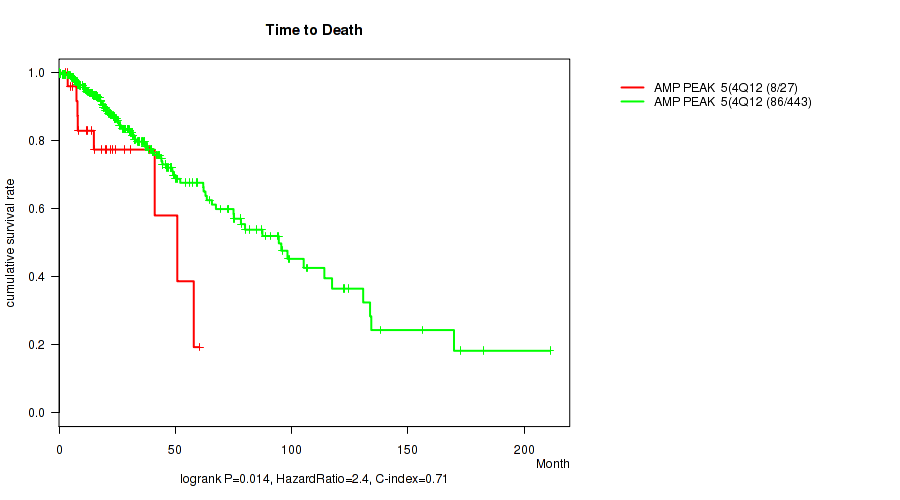
P value = 0.014 (logrank test), Q value = 0.095
Table S6. Gene #5: 'amp_4q12' versus Clinical Feature #1: 'Time to Death'
| nPatients | nDeath | Duration Range (Median), Month | |
|---|---|---|---|
| ALL | 470 | 94 | 0.0 - 211.2 (18.7) |
| AMP PEAK 5(4Q12) MUTATED | 27 | 8 | 2.8 - 60.3 (15.1) |
| AMP PEAK 5(4Q12) WILD-TYPE | 443 | 86 | 0.0 - 211.2 (18.7) |
Figure S6. Get High-res Image Gene #5: 'amp_4q12' versus Clinical Feature #1: 'Time to Death'
P value = 0.00385 (Fisher's exact test), Q value = 0.034
Table S7. Gene #5: 'amp_4q12' versus Clinical Feature #5: 'HISTOLOGICAL_TYPE'
| nPatients | ASTROCYTOMA | OLIGOASTROCYTOMA | OLIGODENDROGLIOMA |
|---|---|---|---|
| ALL | 176 | 118 | 178 |
| AMP PEAK 5(4Q12) MUTATED | 18 | 2 | 7 |
| AMP PEAK 5(4Q12) WILD-TYPE | 158 | 116 | 171 |
Figure S7. Get High-res Image Gene #5: 'amp_4q12' versus Clinical Feature #5: 'HISTOLOGICAL_TYPE'

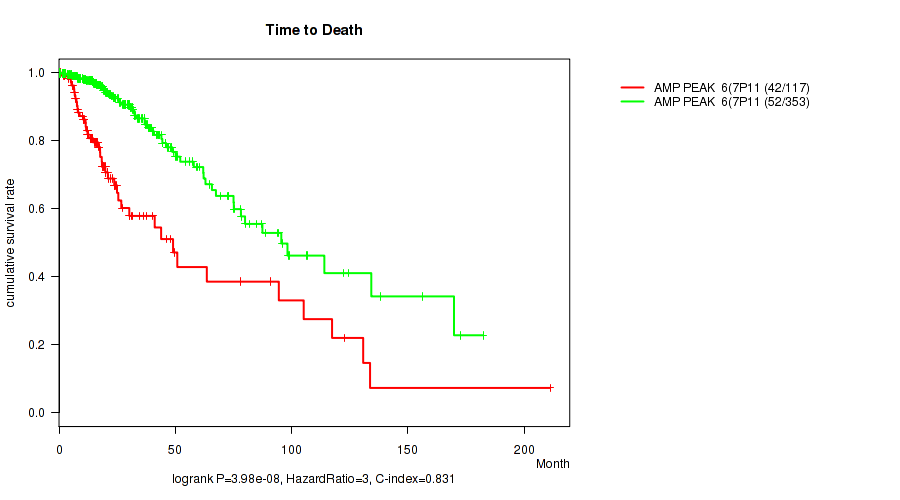
P value = 3.98e-08 (logrank test), Q value = 3.3e-06
Table S8. Gene #6: 'amp_7p11.2' versus Clinical Feature #1: 'Time to Death'
| nPatients | nDeath | Duration Range (Median), Month | |
|---|---|---|---|
| ALL | 470 | 94 | 0.0 - 211.2 (18.7) |
| AMP PEAK 6(7P11.2) MUTATED | 117 | 42 | 0.1 - 211.2 (16.5) |
| AMP PEAK 6(7P11.2) WILD-TYPE | 353 | 52 | 0.0 - 182.3 (19.6) |
Figure S8. Get High-res Image Gene #6: 'amp_7p11.2' versus Clinical Feature #1: 'Time to Death'
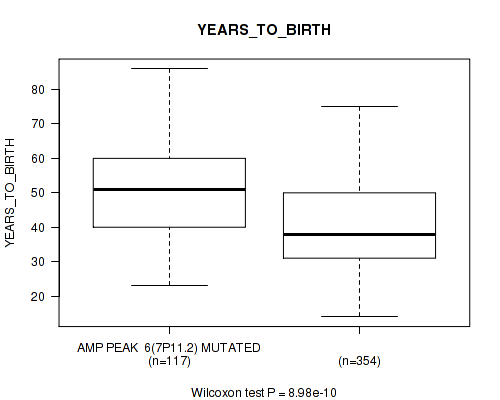
P value = 8.98e-10 (Wilcoxon-test), Q value = 1.2e-07
Table S9. Gene #6: 'amp_7p11.2' versus Clinical Feature #2: 'YEARS_TO_BIRTH'
| nPatients | Mean (Std.Dev) | |
|---|---|---|
| ALL | 471 | 43.1 (13.4) |
| AMP PEAK 6(7P11.2) MUTATED | 117 | 49.8 (13.4) |
| AMP PEAK 6(7P11.2) WILD-TYPE | 354 | 40.8 (12.7) |
Figure S9. Get High-res Image Gene #6: 'amp_7p11.2' versus Clinical Feature #2: 'YEARS_TO_BIRTH'
P value = 0.00109 (logrank test), Q value = 0.012
Table S10. Gene #7: 'amp_7q31.2' versus Clinical Feature #1: 'Time to Death'
| nPatients | nDeath | Duration Range (Median), Month | |
|---|---|---|---|
| ALL | 470 | 94 | 0.0 - 211.2 (18.7) |
| AMP PEAK 7(7Q31.2) MUTATED | 164 | 47 | 0.1 - 211.2 (17.3) |
| AMP PEAK 7(7Q31.2) WILD-TYPE | 306 | 47 | 0.0 - 182.3 (19.9) |
Figure S10. Get High-res Image Gene #7: 'amp_7q31.2' versus Clinical Feature #1: 'Time to Death'
P value = 6.09e-07 (Wilcoxon-test), Q value = 2.5e-05
Table S11. Gene #7: 'amp_7q31.2' versus Clinical Feature #2: 'YEARS_TO_BIRTH'
| nPatients | Mean (Std.Dev) | |
|---|---|---|
| ALL | 471 | 43.1 (13.4) |
| AMP PEAK 7(7Q31.2) MUTATED | 164 | 47.3 (13.3) |
| AMP PEAK 7(7Q31.2) WILD-TYPE | 307 | 40.8 (12.9) |
Figure S11. Get High-res Image Gene #7: 'amp_7q31.2' versus Clinical Feature #2: 'YEARS_TO_BIRTH'
P value = 0.0511 (Fisher's exact test), Q value = 0.24
Table S12. Gene #7: 'amp_7q31.2' versus Clinical Feature #3: 'GENDER'
| nPatients | FEMALE | MALE |
|---|---|---|
| ALL | 206 | 266 |
| AMP PEAK 7(7Q31.2) MUTATED | 82 | 82 |
| AMP PEAK 7(7Q31.2) WILD-TYPE | 124 | 184 |
Figure S12. Get High-res Image Gene #7: 'amp_7q31.2' versus Clinical Feature #3: 'GENDER'
P value = 0.0555 (Fisher's exact test), Q value = 0.25
Table S13. Gene #7: 'amp_7q31.2' versus Clinical Feature #7: 'RACE'
| nPatients | AMERICAN INDIAN OR ALASKA NATIVE | ASIAN | BLACK OR AFRICAN AMERICAN | WHITE |
|---|---|---|---|---|
| ALL | 1 | 8 | 15 | 437 |
| AMP PEAK 7(7Q31.2) MUTATED | 1 | 4 | 9 | 149 |
| AMP PEAK 7(7Q31.2) WILD-TYPE | 0 | 4 | 6 | 288 |
Figure S13. Get High-res Image Gene #7: 'amp_7q31.2' versus Clinical Feature #7: 'RACE'
P value = 0.0017 (logrank test), Q value = 0.017
Table S14. Gene #8: 'amp_7q32.3' versus Clinical Feature #1: 'Time to Death'
| nPatients | nDeath | Duration Range (Median), Month | |
|---|---|---|---|
| ALL | 470 | 94 | 0.0 - 211.2 (18.7) |
| AMP PEAK 8(7Q32.3) MUTATED | 170 | 48 | 0.1 - 211.2 (17.1) |
| AMP PEAK 8(7Q32.3) WILD-TYPE | 300 | 46 | 0.0 - 182.3 (20.0) |
Figure S14. Get High-res Image Gene #8: 'amp_7q32.3' versus Clinical Feature #1: 'Time to Death'
P value = 1.17e-07 (Wilcoxon-test), Q value = 8.1e-06
Table S15. Gene #8: 'amp_7q32.3' versus Clinical Feature #2: 'YEARS_TO_BIRTH'
| nPatients | Mean (Std.Dev) | |
|---|---|---|
| ALL | 471 | 43.1 (13.4) |
| AMP PEAK 8(7Q32.3) MUTATED | 170 | 47.4 (13.2) |
| AMP PEAK 8(7Q32.3) WILD-TYPE | 301 | 40.6 (13.0) |
Figure S15. Get High-res Image Gene #8: 'amp_7q32.3' versus Clinical Feature #2: 'YEARS_TO_BIRTH'
P value = 0.0262 (Fisher's exact test), Q value = 0.15
Table S16. Gene #8: 'amp_7q32.3' versus Clinical Feature #3: 'GENDER'
| nPatients | FEMALE | MALE |
|---|---|---|
| ALL | 206 | 266 |
| AMP PEAK 8(7Q32.3) MUTATED | 86 | 84 |
| AMP PEAK 8(7Q32.3) WILD-TYPE | 120 | 182 |
Figure S16. Get High-res Image Gene #8: 'amp_7q32.3' versus Clinical Feature #3: 'GENDER'
P value = 0.0538 (Fisher's exact test), Q value = 0.25
Table S17. Gene #8: 'amp_7q32.3' versus Clinical Feature #5: 'HISTOLOGICAL_TYPE'
| nPatients | ASTROCYTOMA | OLIGOASTROCYTOMA | OLIGODENDROGLIOMA |
|---|---|---|---|
| ALL | 176 | 118 | 178 |
| AMP PEAK 8(7Q32.3) MUTATED | 71 | 47 | 52 |
| AMP PEAK 8(7Q32.3) WILD-TYPE | 105 | 71 | 126 |
Figure S17. Get High-res Image Gene #8: 'amp_7q32.3' versus Clinical Feature #5: 'HISTOLOGICAL_TYPE'
P value = 0.0466 (Wilcoxon-test), Q value = 0.22
Table S18. Gene #9: 'amp_8q24.13' versus Clinical Feature #2: 'YEARS_TO_BIRTH'
| nPatients | Mean (Std.Dev) | |
|---|---|---|
| ALL | 471 | 43.1 (13.4) |
| AMP PEAK 9(8Q24.13) MUTATED | 93 | 40.8 (13.3) |
| AMP PEAK 9(8Q24.13) WILD-TYPE | 378 | 43.6 (13.4) |
Figure S18. Get High-res Image Gene #9: 'amp_8q24.13' versus Clinical Feature #2: 'YEARS_TO_BIRTH'
P value = 0.00204 (Fisher's exact test), Q value = 0.02
Table S19. Gene #9: 'amp_8q24.13' versus Clinical Feature #5: 'HISTOLOGICAL_TYPE'
| nPatients | ASTROCYTOMA | OLIGOASTROCYTOMA | OLIGODENDROGLIOMA |
|---|---|---|---|
| ALL | 176 | 118 | 178 |
| AMP PEAK 9(8Q24.13) MUTATED | 45 | 27 | 21 |
| AMP PEAK 9(8Q24.13) WILD-TYPE | 131 | 91 | 157 |
Figure S19. Get High-res Image Gene #9: 'amp_8q24.13' versus Clinical Feature #5: 'HISTOLOGICAL_TYPE'
P value = 0.0274 (Fisher's exact test), Q value = 0.15
Table S20. Gene #10: 'amp_9q34.3' versus Clinical Feature #5: 'HISTOLOGICAL_TYPE'
| nPatients | ASTROCYTOMA | OLIGOASTROCYTOMA | OLIGODENDROGLIOMA |
|---|---|---|---|
| ALL | 176 | 118 | 178 |
| AMP PEAK 10(9Q34.3) MUTATED | 23 | 11 | 9 |
| AMP PEAK 10(9Q34.3) WILD-TYPE | 153 | 107 | 169 |
Figure S20. Get High-res Image Gene #10: 'amp_9q34.3' versus Clinical Feature #5: 'HISTOLOGICAL_TYPE'
P value = 0.000326 (Wilcoxon-test), Q value = 0.004
Table S21. Gene #11: 'amp_10p15.3' versus Clinical Feature #2: 'YEARS_TO_BIRTH'
| nPatients | Mean (Std.Dev) | |
|---|---|---|
| ALL | 471 | 43.1 (13.4) |
| AMP PEAK 11(10P15.3) MUTATED | 66 | 37.0 (10.4) |
| AMP PEAK 11(10P15.3) WILD-TYPE | 405 | 44.0 (13.6) |
Figure S21. Get High-res Image Gene #11: 'amp_10p15.3' versus Clinical Feature #2: 'YEARS_TO_BIRTH'
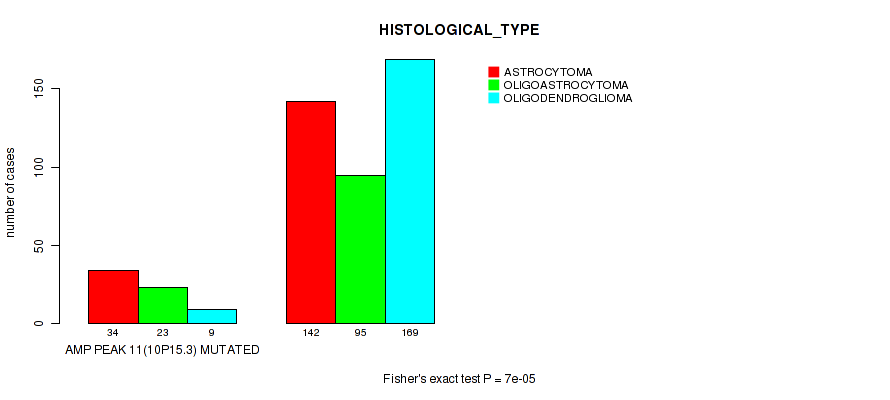
P value = 7e-05 (Fisher's exact test), Q value = 0.0011
Table S22. Gene #11: 'amp_10p15.3' versus Clinical Feature #5: 'HISTOLOGICAL_TYPE'
| nPatients | ASTROCYTOMA | OLIGOASTROCYTOMA | OLIGODENDROGLIOMA |
|---|---|---|---|
| ALL | 176 | 118 | 178 |
| AMP PEAK 11(10P15.3) MUTATED | 34 | 23 | 9 |
| AMP PEAK 11(10P15.3) WILD-TYPE | 142 | 95 | 169 |
Figure S22. Get High-res Image Gene #11: 'amp_10p15.3' versus Clinical Feature #5: 'HISTOLOGICAL_TYPE'
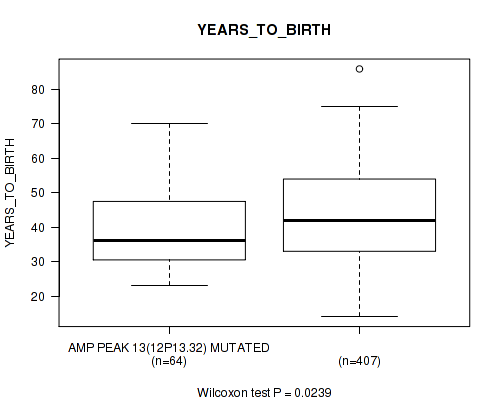
P value = 0.0239 (Wilcoxon-test), Q value = 0.14
Table S23. Gene #13: 'amp_12p13.32' versus Clinical Feature #2: 'YEARS_TO_BIRTH'
| nPatients | Mean (Std.Dev) | |
|---|---|---|
| ALL | 471 | 43.1 (13.4) |
| AMP PEAK 13(12P13.32) MUTATED | 64 | 40.0 (12.7) |
| AMP PEAK 13(12P13.32) WILD-TYPE | 407 | 43.5 (13.5) |
Figure S23. Get High-res Image Gene #13: 'amp_12p13.32' versus Clinical Feature #2: 'YEARS_TO_BIRTH'
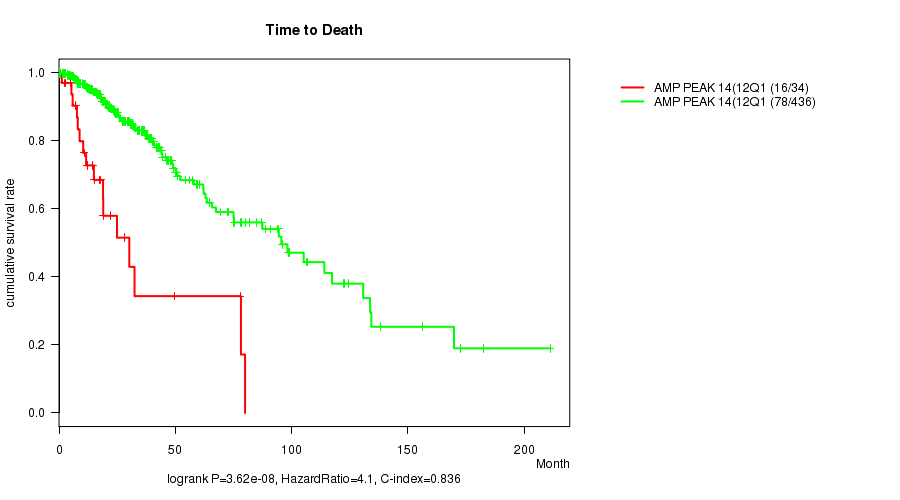
P value = 3.62e-08 (logrank test), Q value = 3.3e-06
Table S24. Gene #14: 'amp_12q14.1' versus Clinical Feature #1: 'Time to Death'
| nPatients | nDeath | Duration Range (Median), Month | |
|---|---|---|---|
| ALL | 470 | 94 | 0.0 - 211.2 (18.7) |
| AMP PEAK 14(12Q14.1) MUTATED | 34 | 16 | 0.2 - 80.0 (14.8) |
| AMP PEAK 14(12Q14.1) WILD-TYPE | 436 | 78 | 0.0 - 211.2 (18.8) |
Figure S24. Get High-res Image Gene #14: 'amp_12q14.1' versus Clinical Feature #1: 'Time to Death'
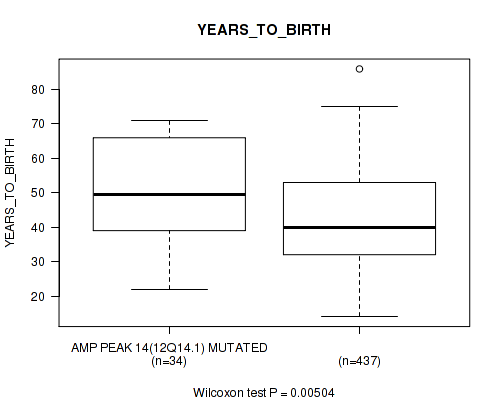
P value = 0.00504 (Wilcoxon-test), Q value = 0.04
Table S25. Gene #14: 'amp_12q14.1' versus Clinical Feature #2: 'YEARS_TO_BIRTH'
| nPatients | Mean (Std.Dev) | |
|---|---|---|
| ALL | 471 | 43.1 (13.4) |
| AMP PEAK 14(12Q14.1) MUTATED | 34 | 49.9 (14.8) |
| AMP PEAK 14(12Q14.1) WILD-TYPE | 437 | 42.5 (13.2) |
Figure S25. Get High-res Image Gene #14: 'amp_12q14.1' versus Clinical Feature #2: 'YEARS_TO_BIRTH'
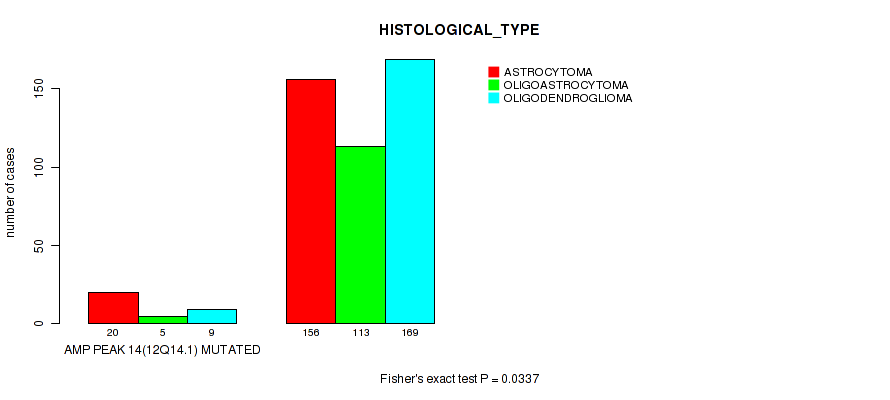
P value = 0.0337 (Fisher's exact test), Q value = 0.17
Table S26. Gene #14: 'amp_12q14.1' versus Clinical Feature #5: 'HISTOLOGICAL_TYPE'
| nPatients | ASTROCYTOMA | OLIGOASTROCYTOMA | OLIGODENDROGLIOMA |
|---|---|---|---|
| ALL | 176 | 118 | 178 |
| AMP PEAK 14(12Q14.1) MUTATED | 20 | 5 | 9 |
| AMP PEAK 14(12Q14.1) WILD-TYPE | 156 | 113 | 169 |
Figure S26. Get High-res Image Gene #14: 'amp_12q14.1' versus Clinical Feature #5: 'HISTOLOGICAL_TYPE'
P value = 4.89e-05 (logrank test), Q value = 0.00078
Table S27. Gene #16: 'amp_15q26.3' versus Clinical Feature #1: 'Time to Death'
| nPatients | nDeath | Duration Range (Median), Month | |
|---|---|---|---|
| ALL | 470 | 94 | 0.0 - 211.2 (18.7) |
| AMP PEAK 16(15Q26.3) MUTATED | 15 | 8 | 2.5 - 50.9 (21.7) |
| AMP PEAK 16(15Q26.3) WILD-TYPE | 455 | 86 | 0.0 - 211.2 (18.6) |
Figure S27. Get High-res Image Gene #16: 'amp_15q26.3' versus Clinical Feature #1: 'Time to Death'

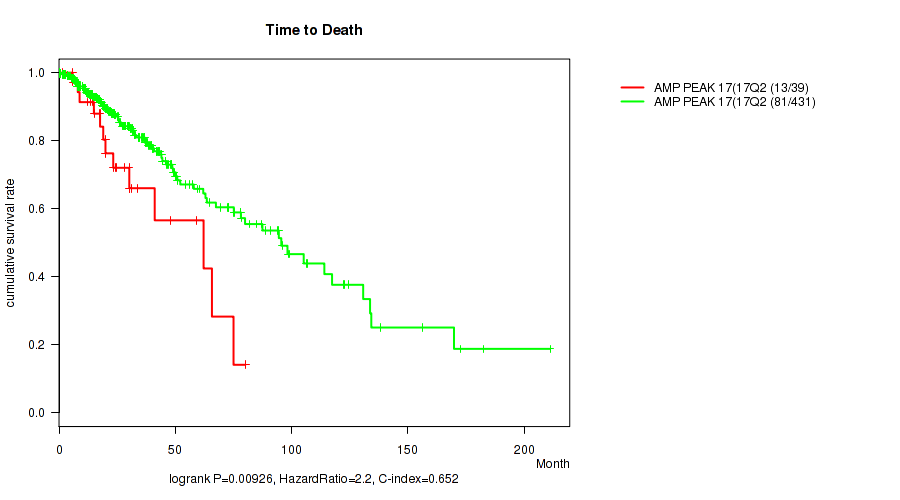
P value = 0.00926 (logrank test), Q value = 0.065
Table S28. Gene #17: 'amp_17q25.1' versus Clinical Feature #1: 'Time to Death'
| nPatients | nDeath | Duration Range (Median), Month | |
|---|---|---|---|
| ALL | 470 | 94 | 0.0 - 211.2 (18.7) |
| AMP PEAK 17(17Q25.1) MUTATED | 39 | 13 | 0.2 - 80.1 (20.0) |
| AMP PEAK 17(17Q25.1) WILD-TYPE | 431 | 81 | 0.0 - 211.2 (18.6) |
Figure S28. Get High-res Image Gene #17: 'amp_17q25.1' versus Clinical Feature #1: 'Time to Death'
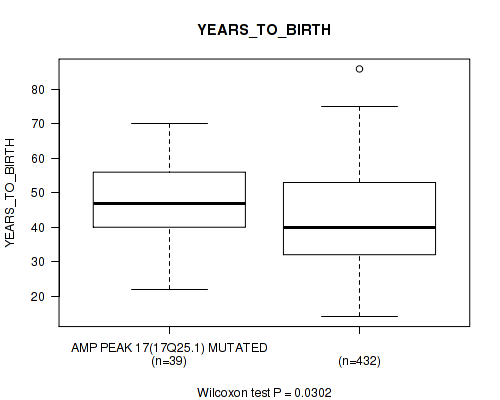
P value = 0.0302 (Wilcoxon-test), Q value = 0.16
Table S29. Gene #17: 'amp_17q25.1' versus Clinical Feature #2: 'YEARS_TO_BIRTH'
| nPatients | Mean (Std.Dev) | |
|---|---|---|
| ALL | 471 | 43.1 (13.4) |
| AMP PEAK 17(17Q25.1) MUTATED | 39 | 47.1 (12.6) |
| AMP PEAK 17(17Q25.1) WILD-TYPE | 432 | 42.7 (13.5) |
Figure S29. Get High-res Image Gene #17: 'amp_17q25.1' versus Clinical Feature #2: 'YEARS_TO_BIRTH'
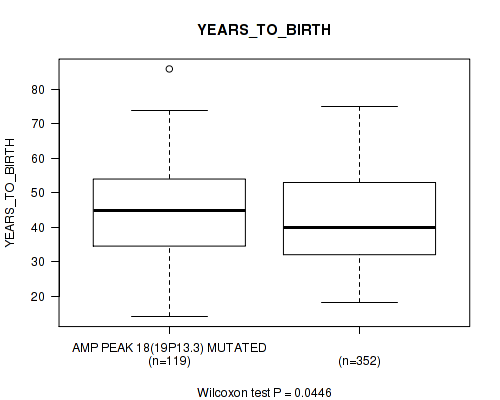
P value = 0.0446 (Wilcoxon-test), Q value = 0.21
Table S30. Gene #18: 'amp_19p13.3' versus Clinical Feature #2: 'YEARS_TO_BIRTH'
| nPatients | Mean (Std.Dev) | |
|---|---|---|
| ALL | 471 | 43.1 (13.4) |
| AMP PEAK 18(19P13.3) MUTATED | 119 | 45.1 (13.8) |
| AMP PEAK 18(19P13.3) WILD-TYPE | 352 | 42.4 (13.3) |
Figure S30. Get High-res Image Gene #18: 'amp_19p13.3' versus Clinical Feature #2: 'YEARS_TO_BIRTH'
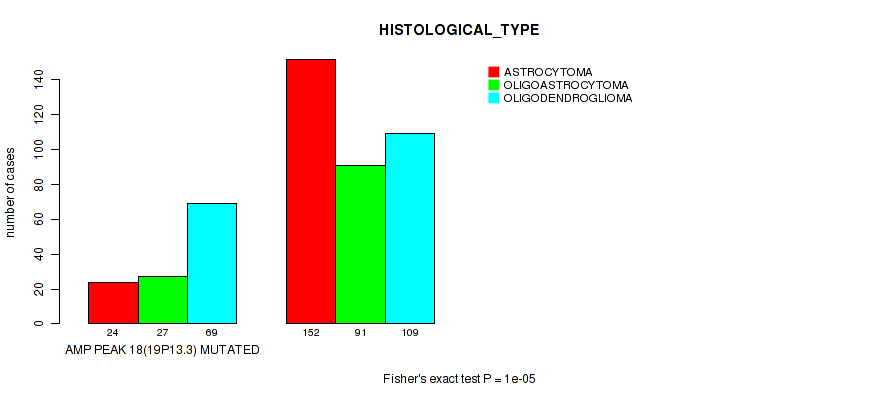
P value = 1e-05 (Fisher's exact test), Q value = 0.00021
Table S31. Gene #18: 'amp_19p13.3' versus Clinical Feature #5: 'HISTOLOGICAL_TYPE'
| nPatients | ASTROCYTOMA | OLIGOASTROCYTOMA | OLIGODENDROGLIOMA |
|---|---|---|---|
| ALL | 176 | 118 | 178 |
| AMP PEAK 18(19P13.3) MUTATED | 24 | 27 | 69 |
| AMP PEAK 18(19P13.3) WILD-TYPE | 152 | 91 | 109 |
Figure S31. Get High-res Image Gene #18: 'amp_19p13.3' versus Clinical Feature #5: 'HISTOLOGICAL_TYPE'
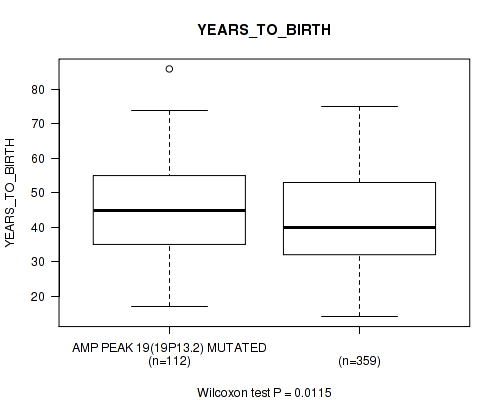
P value = 0.0115 (Wilcoxon-test), Q value = 0.08
Table S32. Gene #19: 'amp_19p13.2' versus Clinical Feature #2: 'YEARS_TO_BIRTH'
| nPatients | Mean (Std.Dev) | |
|---|---|---|
| ALL | 471 | 43.1 (13.4) |
| AMP PEAK 19(19P13.2) MUTATED | 112 | 45.9 (13.7) |
| AMP PEAK 19(19P13.2) WILD-TYPE | 359 | 42.2 (13.3) |
Figure S32. Get High-res Image Gene #19: 'amp_19p13.2' versus Clinical Feature #2: 'YEARS_TO_BIRTH'
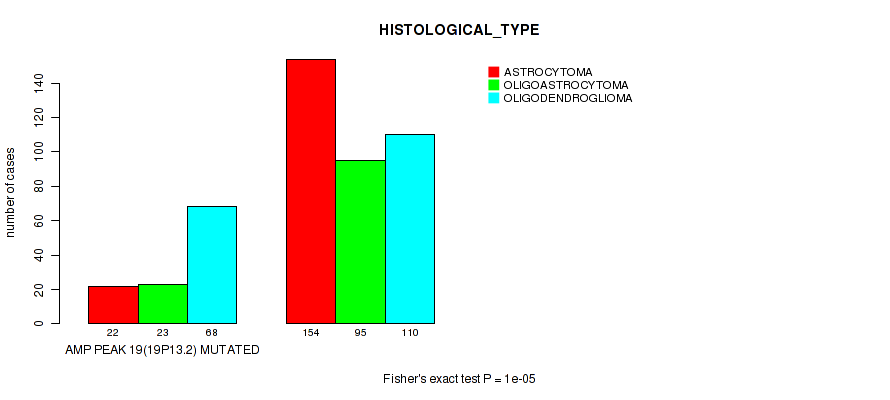
P value = 1e-05 (Fisher's exact test), Q value = 0.00021
Table S33. Gene #19: 'amp_19p13.2' versus Clinical Feature #5: 'HISTOLOGICAL_TYPE'
| nPatients | ASTROCYTOMA | OLIGOASTROCYTOMA | OLIGODENDROGLIOMA |
|---|---|---|---|
| ALL | 176 | 118 | 178 |
| AMP PEAK 19(19P13.2) MUTATED | 22 | 23 | 68 |
| AMP PEAK 19(19P13.2) WILD-TYPE | 154 | 95 | 110 |
Figure S33. Get High-res Image Gene #19: 'amp_19p13.2' versus Clinical Feature #5: 'HISTOLOGICAL_TYPE'
P value = 0.0084 (Fisher's exact test), Q value = 0.06
Table S34. Gene #20: 'amp_xp11.22' versus Clinical Feature #5: 'HISTOLOGICAL_TYPE'
| nPatients | ASTROCYTOMA | OLIGOASTROCYTOMA | OLIGODENDROGLIOMA |
|---|---|---|---|
| ALL | 176 | 118 | 178 |
| AMP PEAK 20(XP11.22) MUTATED | 24 | 9 | 8 |
| AMP PEAK 20(XP11.22) WILD-TYPE | 152 | 109 | 170 |
Figure S34. Get High-res Image Gene #20: 'amp_xp11.22' versus Clinical Feature #5: 'HISTOLOGICAL_TYPE'

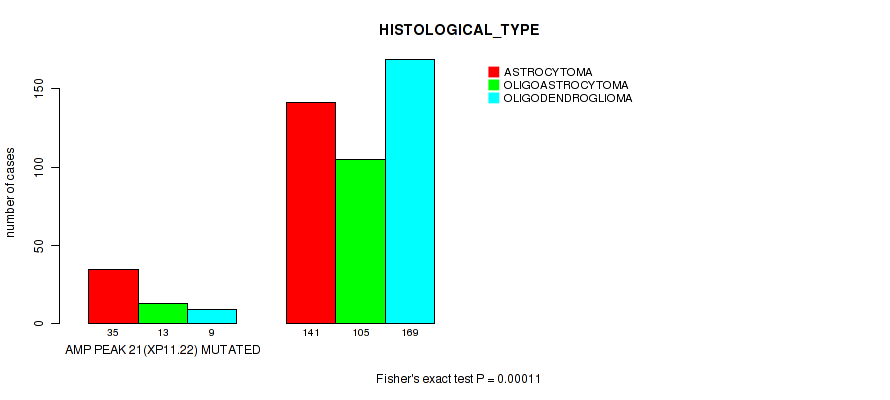
P value = 0.00011 (Fisher's exact test), Q value = 0.0016
Table S35. Gene #21: 'amp_xp11.22' versus Clinical Feature #5: 'HISTOLOGICAL_TYPE'
| nPatients | ASTROCYTOMA | OLIGOASTROCYTOMA | OLIGODENDROGLIOMA |
|---|---|---|---|
| ALL | 176 | 118 | 178 |
| AMP PEAK 21(XP11.22) MUTATED | 35 | 13 | 9 |
| AMP PEAK 21(XP11.22) WILD-TYPE | 141 | 105 | 169 |
Figure S35. Get High-res Image Gene #21: 'amp_xp11.22' versus Clinical Feature #5: 'HISTOLOGICAL_TYPE'
P value = 3.25e-07 (Wilcoxon-test), Q value = 1.7e-05
Table S36. Gene #22: 'del_1p36.32' versus Clinical Feature #2: 'YEARS_TO_BIRTH'
| nPatients | Mean (Std.Dev) | |
|---|---|---|
| ALL | 471 | 43.1 (13.4) |
| DEL PEAK 1(1P36.32) MUTATED | 190 | 46.6 (12.7) |
| DEL PEAK 1(1P36.32) WILD-TYPE | 281 | 40.6 (13.4) |
Figure S36. Get High-res Image Gene #22: 'del_1p36.32' versus Clinical Feature #2: 'YEARS_TO_BIRTH'

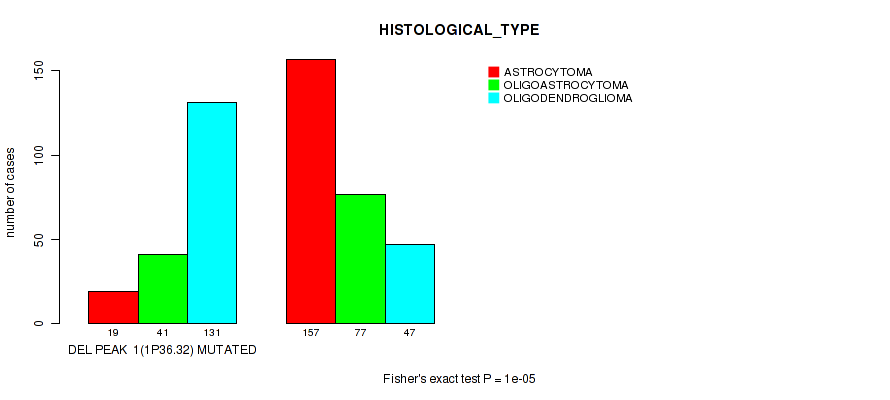
P value = 1e-05 (Fisher's exact test), Q value = 0.00021
Table S37. Gene #22: 'del_1p36.32' versus Clinical Feature #5: 'HISTOLOGICAL_TYPE'
| nPatients | ASTROCYTOMA | OLIGOASTROCYTOMA | OLIGODENDROGLIOMA |
|---|---|---|---|
| ALL | 176 | 118 | 178 |
| DEL PEAK 1(1P36.32) MUTATED | 19 | 41 | 131 |
| DEL PEAK 1(1P36.32) WILD-TYPE | 157 | 77 | 47 |
Figure S37. Get High-res Image Gene #22: 'del_1p36.32' versus Clinical Feature #5: 'HISTOLOGICAL_TYPE'
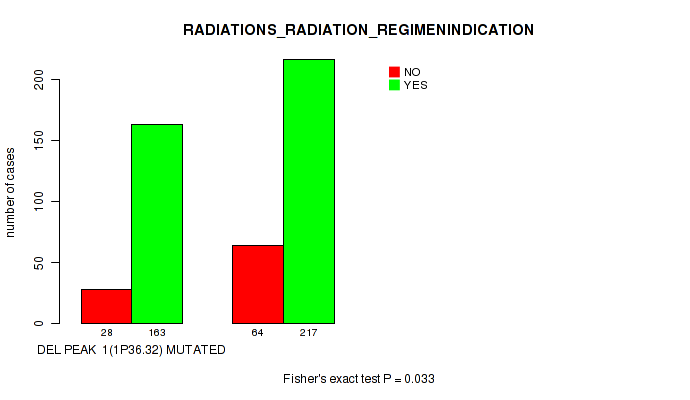
P value = 0.033 (Fisher's exact test), Q value = 0.17
Table S38. Gene #22: 'del_1p36.32' versus Clinical Feature #6: 'RADIATIONS_RADIATION_REGIMENINDICATION'
| nPatients | NO | YES |
|---|---|---|
| ALL | 92 | 380 |
| DEL PEAK 1(1P36.32) MUTATED | 28 | 163 |
| DEL PEAK 1(1P36.32) WILD-TYPE | 64 | 217 |
Figure S38. Get High-res Image Gene #22: 'del_1p36.32' versus Clinical Feature #6: 'RADIATIONS_RADIATION_REGIMENINDICATION'
P value = 0.0214 (logrank test), Q value = 0.13
Table S39. Gene #23: 'del_1p32.3' versus Clinical Feature #1: 'Time to Death'
| nPatients | nDeath | Duration Range (Median), Month | |
|---|---|---|---|
| ALL | 470 | 94 | 0.0 - 211.2 (18.7) |
| DEL PEAK 2(1P32.3) MUTATED | 180 | 27 | 0.1 - 182.3 (18.7) |
| DEL PEAK 2(1P32.3) WILD-TYPE | 290 | 67 | 0.0 - 211.2 (18.7) |
Figure S39. Get High-res Image Gene #23: 'del_1p32.3' versus Clinical Feature #1: 'Time to Death'

P value = 1.47e-06 (Wilcoxon-test), Q value = 5.1e-05
Table S40. Gene #23: 'del_1p32.3' versus Clinical Feature #2: 'YEARS_TO_BIRTH'
| nPatients | Mean (Std.Dev) | |
|---|---|---|
| ALL | 471 | 43.1 (13.4) |
| DEL PEAK 2(1P32.3) MUTATED | 180 | 46.7 (13.1) |
| DEL PEAK 2(1P32.3) WILD-TYPE | 291 | 40.8 (13.2) |
Figure S40. Get High-res Image Gene #23: 'del_1p32.3' versus Clinical Feature #2: 'YEARS_TO_BIRTH'

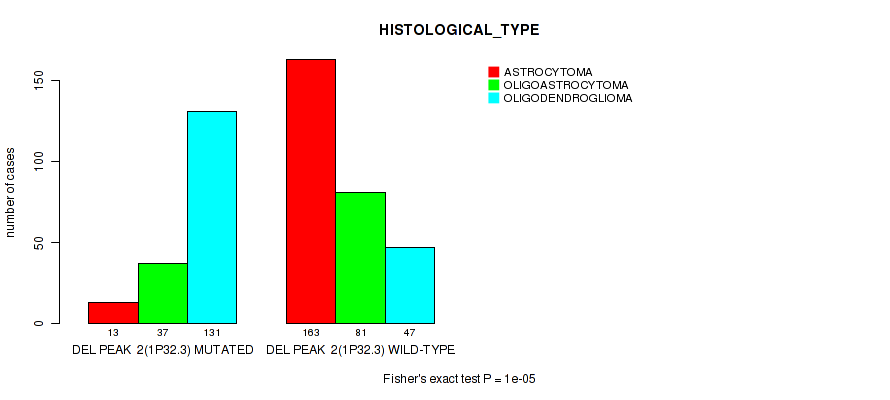
P value = 1e-05 (Fisher's exact test), Q value = 0.00021
Table S41. Gene #23: 'del_1p32.3' versus Clinical Feature #5: 'HISTOLOGICAL_TYPE'
| nPatients | ASTROCYTOMA | OLIGOASTROCYTOMA | OLIGODENDROGLIOMA |
|---|---|---|---|
| ALL | 176 | 118 | 178 |
| DEL PEAK 2(1P32.3) MUTATED | 13 | 37 | 131 |
| DEL PEAK 2(1P32.3) WILD-TYPE | 163 | 81 | 47 |
Figure S41. Get High-res Image Gene #23: 'del_1p32.3' versus Clinical Feature #5: 'HISTOLOGICAL_TYPE'
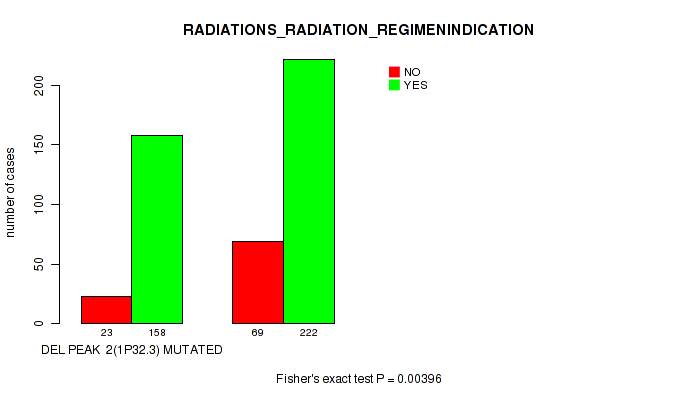
P value = 0.00396 (Fisher's exact test), Q value = 0.034
Table S42. Gene #23: 'del_1p32.3' versus Clinical Feature #6: 'RADIATIONS_RADIATION_REGIMENINDICATION'
| nPatients | NO | YES |
|---|---|---|
| ALL | 92 | 380 |
| DEL PEAK 2(1P32.3) MUTATED | 23 | 158 |
| DEL PEAK 2(1P32.3) WILD-TYPE | 69 | 222 |
Figure S42. Get High-res Image Gene #23: 'del_1p32.3' versus Clinical Feature #6: 'RADIATIONS_RADIATION_REGIMENINDICATION'
P value = 0.0216 (Fisher's exact test), Q value = 0.13
Table S43. Gene #25: 'del_2q37.3' versus Clinical Feature #5: 'HISTOLOGICAL_TYPE'
| nPatients | ASTROCYTOMA | OLIGOASTROCYTOMA | OLIGODENDROGLIOMA |
|---|---|---|---|
| ALL | 176 | 118 | 178 |
| DEL PEAK 4(2Q37.3) MUTATED | 32 | 21 | 16 |
| DEL PEAK 4(2Q37.3) WILD-TYPE | 144 | 97 | 162 |
Figure S43. Get High-res Image Gene #25: 'del_2q37.3' versus Clinical Feature #5: 'HISTOLOGICAL_TYPE'
P value = 0.00609 (Wilcoxon-test), Q value = 0.044
Table S44. Gene #26: 'del_3p21.31' versus Clinical Feature #4: 'KARNOFSKY_PERFORMANCE_SCORE'
| nPatients | Mean (Std.Dev) | |
|---|---|---|
| ALL | 269 | 87.7 (12.0) |
| DEL PEAK 5(3P21.31) MUTATED | 28 | 81.1 (15.5) |
| DEL PEAK 5(3P21.31) WILD-TYPE | 241 | 88.5 (11.3) |
Figure S44. Get High-res Image Gene #26: 'del_3p21.31' versus Clinical Feature #4: 'KARNOFSKY_PERFORMANCE_SCORE'
P value = 0.0194 (Fisher's exact test), Q value = 0.13
Table S45. Gene #26: 'del_3p21.31' versus Clinical Feature #8: 'ETHNICITY'
| nPatients | HISPANIC OR LATINO | NOT HISPANIC OR LATINO |
|---|---|---|
| ALL | 18 | 419 |
| DEL PEAK 5(3P21.31) MUTATED | 5 | 36 |
| DEL PEAK 5(3P21.31) WILD-TYPE | 13 | 383 |
Figure S45. Get High-res Image Gene #26: 'del_3p21.31' versus Clinical Feature #8: 'ETHNICITY'
P value = 0.00534 (logrank test), Q value = 0.042
Table S46. Gene #27: 'del_3q13.31' versus Clinical Feature #1: 'Time to Death'
| nPatients | nDeath | Duration Range (Median), Month | |
|---|---|---|---|
| ALL | 470 | 94 | 0.0 - 211.2 (18.7) |
| DEL PEAK 6(3Q13.31) MUTATED | 35 | 13 | 0.2 - 117.4 (19.0) |
| DEL PEAK 6(3Q13.31) WILD-TYPE | 435 | 81 | 0.0 - 211.2 (18.6) |
Figure S46. Get High-res Image Gene #27: 'del_3q13.31' versus Clinical Feature #1: 'Time to Death'
P value = 0.021 (logrank test), Q value = 0.13
Table S47. Gene #28: 'del_3q29' versus Clinical Feature #1: 'Time to Death'
| nPatients | nDeath | Duration Range (Median), Month | |
|---|---|---|---|
| ALL | 470 | 94 | 0.0 - 211.2 (18.7) |
| DEL PEAK 7(3Q29) MUTATED | 40 | 15 | 0.0 - 122.5 (23.0) |
| DEL PEAK 7(3Q29) WILD-TYPE | 430 | 79 | 0.1 - 211.2 (18.3) |
Figure S47. Get High-res Image Gene #28: 'del_3q29' versus Clinical Feature #1: 'Time to Death'

P value = 0.0326 (Wilcoxon-test), Q value = 0.17
Table S48. Gene #30: 'del_5p15.33' versus Clinical Feature #4: 'KARNOFSKY_PERFORMANCE_SCORE'
| nPatients | Mean (Std.Dev) | |
|---|---|---|
| ALL | 269 | 87.7 (12.0) |
| DEL PEAK 9(5P15.33) MUTATED | 27 | 83.3 (13.0) |
| DEL PEAK 9(5P15.33) WILD-TYPE | 242 | 88.2 (11.8) |
Figure S48. Get High-res Image Gene #30: 'del_5p15.33' versus Clinical Feature #4: 'KARNOFSKY_PERFORMANCE_SCORE'

P value = 0.00291 (Fisher's exact test), Q value = 0.027
Table S49. Gene #30: 'del_5p15.33' versus Clinical Feature #5: 'HISTOLOGICAL_TYPE'
| nPatients | ASTROCYTOMA | OLIGOASTROCYTOMA | OLIGODENDROGLIOMA |
|---|---|---|---|
| ALL | 176 | 118 | 178 |
| DEL PEAK 9(5P15.33) MUTATED | 19 | 19 | 8 |
| DEL PEAK 9(5P15.33) WILD-TYPE | 157 | 99 | 170 |
Figure S49. Get High-res Image Gene #30: 'del_5p15.33' versus Clinical Feature #5: 'HISTOLOGICAL_TYPE'

P value = 0.0291 (Fisher's exact test), Q value = 0.16
Table S50. Gene #30: 'del_5p15.33' versus Clinical Feature #6: 'RADIATIONS_RADIATION_REGIMENINDICATION'
| nPatients | NO | YES |
|---|---|---|
| ALL | 92 | 380 |
| DEL PEAK 9(5P15.33) MUTATED | 15 | 31 |
| DEL PEAK 9(5P15.33) WILD-TYPE | 77 | 349 |
Figure S50. Get High-res Image Gene #30: 'del_5p15.33' versus Clinical Feature #6: 'RADIATIONS_RADIATION_REGIMENINDICATION'
P value = 2e-05 (Fisher's exact test), Q value = 0.00036
Table S51. Gene #31: 'del_5q34' versus Clinical Feature #5: 'HISTOLOGICAL_TYPE'
| nPatients | ASTROCYTOMA | OLIGOASTROCYTOMA | OLIGODENDROGLIOMA |
|---|---|---|---|
| ALL | 176 | 118 | 178 |
| DEL PEAK 10(5Q34) MUTATED | 39 | 12 | 9 |
| DEL PEAK 10(5Q34) WILD-TYPE | 137 | 106 | 169 |
Figure S51. Get High-res Image Gene #31: 'del_5q34' versus Clinical Feature #5: 'HISTOLOGICAL_TYPE'
P value = 4.75e-07 (logrank test), Q value = 2.2e-05
Table S52. Gene #32: 'del_6p25.3' versus Clinical Feature #1: 'Time to Death'
| nPatients | nDeath | Duration Range (Median), Month | |
|---|---|---|---|
| ALL | 470 | 94 | 0.0 - 211.2 (18.7) |
| DEL PEAK 11(6P25.3) MUTATED | 43 | 17 | 0.2 - 94.5 (18.8) |
| DEL PEAK 11(6P25.3) WILD-TYPE | 427 | 77 | 0.0 - 211.2 (18.6) |
Figure S52. Get High-res Image Gene #32: 'del_6p25.3' versus Clinical Feature #1: 'Time to Death'
P value = 0.0275 (Wilcoxon-test), Q value = 0.15
Table S53. Gene #32: 'del_6p25.3' versus Clinical Feature #4: 'KARNOFSKY_PERFORMANCE_SCORE'
| nPatients | Mean (Std.Dev) | |
|---|---|---|
| ALL | 269 | 87.7 (12.0) |
| DEL PEAK 11(6P25.3) MUTATED | 28 | 83.2 (12.8) |
| DEL PEAK 11(6P25.3) WILD-TYPE | 241 | 88.3 (11.8) |
Figure S53. Get High-res Image Gene #32: 'del_6p25.3' versus Clinical Feature #4: 'KARNOFSKY_PERFORMANCE_SCORE'
P value = 1.28e-05 (logrank test), Q value = 0.00025
Table S54. Gene #33: 'del_6q22.31' versus Clinical Feature #1: 'Time to Death'
| nPatients | nDeath | Duration Range (Median), Month | |
|---|---|---|---|
| ALL | 470 | 94 | 0.0 - 211.2 (18.7) |
| DEL PEAK 12(6Q22.31) MUTATED | 68 | 23 | 0.1 - 117.4 (17.9) |
| DEL PEAK 12(6Q22.31) WILD-TYPE | 402 | 71 | 0.0 - 211.2 (18.8) |
Figure S54. Get High-res Image Gene #33: 'del_6q22.31' versus Clinical Feature #1: 'Time to Death'

P value = 0.0442 (Wilcoxon-test), Q value = 0.21
Table S55. Gene #33: 'del_6q22.31' versus Clinical Feature #4: 'KARNOFSKY_PERFORMANCE_SCORE'
| nPatients | Mean (Std.Dev) | |
|---|---|---|
| ALL | 269 | 87.7 (12.0) |
| DEL PEAK 12(6Q22.31) MUTATED | 44 | 84.3 (13.2) |
| DEL PEAK 12(6Q22.31) WILD-TYPE | 225 | 88.4 (11.7) |
Figure S55. Get High-res Image Gene #33: 'del_6q22.31' versus Clinical Feature #4: 'KARNOFSKY_PERFORMANCE_SCORE'

P value = 3e-05 (Fisher's exact test), Q value = 5e-04
Table S56. Gene #33: 'del_6q22.31' versus Clinical Feature #5: 'HISTOLOGICAL_TYPE'
| nPatients | ASTROCYTOMA | OLIGOASTROCYTOMA | OLIGODENDROGLIOMA |
|---|---|---|---|
| ALL | 176 | 118 | 178 |
| DEL PEAK 12(6Q22.31) MUTATED | 44 | 11 | 14 |
| DEL PEAK 12(6Q22.31) WILD-TYPE | 132 | 107 | 164 |
Figure S56. Get High-res Image Gene #33: 'del_6q22.31' versus Clinical Feature #5: 'HISTOLOGICAL_TYPE'

P value = 0.00021 (logrank test), Q value = 0.0027
Table S57. Gene #34: 'del_6q24.3' versus Clinical Feature #1: 'Time to Death'
| nPatients | nDeath | Duration Range (Median), Month | |
|---|---|---|---|
| ALL | 470 | 94 | 0.0 - 211.2 (18.7) |
| DEL PEAK 13(6Q24.3) MUTATED | 71 | 23 | 0.0 - 130.8 (17.9) |
| DEL PEAK 13(6Q24.3) WILD-TYPE | 399 | 71 | 0.1 - 211.2 (18.8) |
Figure S57. Get High-res Image Gene #34: 'del_6q24.3' versus Clinical Feature #1: 'Time to Death'
P value = 0.0442 (Wilcoxon-test), Q value = 0.21
Table S58. Gene #34: 'del_6q24.3' versus Clinical Feature #4: 'KARNOFSKY_PERFORMANCE_SCORE'
| nPatients | Mean (Std.Dev) | |
|---|---|---|
| ALL | 269 | 87.7 (12.0) |
| DEL PEAK 13(6Q24.3) MUTATED | 44 | 84.3 (13.2) |
| DEL PEAK 13(6Q24.3) WILD-TYPE | 225 | 88.4 (11.7) |
Figure S58. Get High-res Image Gene #34: 'del_6q24.3' versus Clinical Feature #4: 'KARNOFSKY_PERFORMANCE_SCORE'

P value = 8e-05 (Fisher's exact test), Q value = 0.0012
Table S59. Gene #34: 'del_6q24.3' versus Clinical Feature #5: 'HISTOLOGICAL_TYPE'
| nPatients | ASTROCYTOMA | OLIGOASTROCYTOMA | OLIGODENDROGLIOMA |
|---|---|---|---|
| ALL | 176 | 118 | 178 |
| DEL PEAK 13(6Q24.3) MUTATED | 44 | 12 | 16 |
| DEL PEAK 13(6Q24.3) WILD-TYPE | 132 | 106 | 162 |
Figure S59. Get High-res Image Gene #34: 'del_6q24.3' versus Clinical Feature #5: 'HISTOLOGICAL_TYPE'
P value = 0.000222 (logrank test), Q value = 0.0028
Table S60. Gene #37: 'del_9p23' versus Clinical Feature #1: 'Time to Death'
| nPatients | nDeath | Duration Range (Median), Month | |
|---|---|---|---|
| ALL | 470 | 94 | 0.0 - 211.2 (18.7) |
| DEL PEAK 16(9P23) MUTATED | 133 | 38 | 0.1 - 169.8 (18.4) |
| DEL PEAK 16(9P23) WILD-TYPE | 337 | 56 | 0.0 - 211.2 (18.7) |
Figure S60. Get High-res Image Gene #37: 'del_9p23' versus Clinical Feature #1: 'Time to Death'
P value = 0.00424 (Wilcoxon-test), Q value = 0.036
Table S61. Gene #37: 'del_9p23' versus Clinical Feature #2: 'YEARS_TO_BIRTH'
| nPatients | Mean (Std.Dev) | |
|---|---|---|
| ALL | 471 | 43.1 (13.4) |
| DEL PEAK 16(9P23) MUTATED | 133 | 45.8 (13.4) |
| DEL PEAK 16(9P23) WILD-TYPE | 338 | 42.0 (13.3) |
Figure S61. Get High-res Image Gene #37: 'del_9p23' versus Clinical Feature #2: 'YEARS_TO_BIRTH'
P value = 0.0162 (Wilcoxon-test), Q value = 0.11
Table S62. Gene #37: 'del_9p23' versus Clinical Feature #4: 'KARNOFSKY_PERFORMANCE_SCORE'
| nPatients | Mean (Std.Dev) | |
|---|---|---|
| ALL | 269 | 87.7 (12.0) |
| DEL PEAK 16(9P23) MUTATED | 83 | 85.2 (12.9) |
| DEL PEAK 16(9P23) WILD-TYPE | 186 | 88.9 (11.4) |
Figure S62. Get High-res Image Gene #37: 'del_9p23' versus Clinical Feature #4: 'KARNOFSKY_PERFORMANCE_SCORE'
P value = 0.0286 (Fisher's exact test), Q value = 0.16
Table S63. Gene #37: 'del_9p23' versus Clinical Feature #5: 'HISTOLOGICAL_TYPE'
| nPatients | ASTROCYTOMA | OLIGOASTROCYTOMA | OLIGODENDROGLIOMA |
|---|---|---|---|
| ALL | 176 | 118 | 178 |
| DEL PEAK 16(9P23) MUTATED | 62 | 32 | 40 |
| DEL PEAK 16(9P23) WILD-TYPE | 114 | 86 | 138 |
Figure S63. Get High-res Image Gene #37: 'del_9p23' versus Clinical Feature #5: 'HISTOLOGICAL_TYPE'
P value = 0.0281 (Fisher's exact test), Q value = 0.16
Table S64. Gene #37: 'del_9p23' versus Clinical Feature #6: 'RADIATIONS_RADIATION_REGIMENINDICATION'
| nPatients | NO | YES |
|---|---|---|
| ALL | 92 | 380 |
| DEL PEAK 16(9P23) MUTATED | 35 | 99 |
| DEL PEAK 16(9P23) WILD-TYPE | 57 | 281 |
Figure S64. Get High-res Image Gene #37: 'del_9p23' versus Clinical Feature #6: 'RADIATIONS_RADIATION_REGIMENINDICATION'
P value = 6.44e-10 (logrank test), Q value = 1.2e-07
Table S65. Gene #38: 'del_9p21.3' versus Clinical Feature #1: 'Time to Death'
| nPatients | nDeath | Duration Range (Median), Month | |
|---|---|---|---|
| ALL | 470 | 94 | 0.0 - 211.2 (18.7) |
| DEL PEAK 17(9P21.3) MUTATED | 160 | 52 | 0.1 - 169.8 (17.9) |
| DEL PEAK 17(9P21.3) WILD-TYPE | 310 | 42 | 0.0 - 211.2 (19.0) |
Figure S65. Get High-res Image Gene #38: 'del_9p21.3' versus Clinical Feature #1: 'Time to Death'
P value = 3.11e-06 (Wilcoxon-test), Q value = 1e-04
Table S66. Gene #38: 'del_9p21.3' versus Clinical Feature #2: 'YEARS_TO_BIRTH'
| nPatients | Mean (Std.Dev) | |
|---|---|---|
| ALL | 471 | 43.1 (13.4) |
| DEL PEAK 17(9P21.3) MUTATED | 160 | 47.2 (14.0) |
| DEL PEAK 17(9P21.3) WILD-TYPE | 311 | 40.9 (12.6) |
Figure S66. Get High-res Image Gene #38: 'del_9p21.3' versus Clinical Feature #2: 'YEARS_TO_BIRTH'

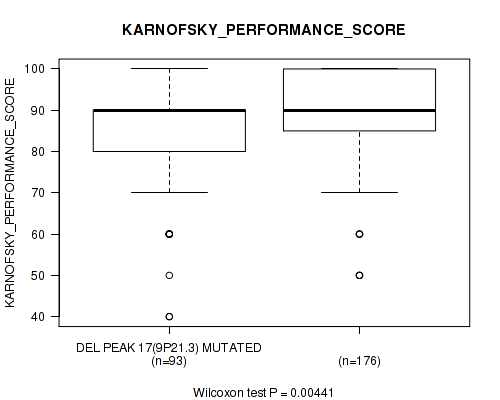
P value = 0.00441 (Wilcoxon-test), Q value = 0.036
Table S67. Gene #38: 'del_9p21.3' versus Clinical Feature #4: 'KARNOFSKY_PERFORMANCE_SCORE'
| nPatients | Mean (Std.Dev) | |
|---|---|---|
| ALL | 269 | 87.7 (12.0) |
| DEL PEAK 17(9P21.3) MUTATED | 93 | 84.6 (13.6) |
| DEL PEAK 17(9P21.3) WILD-TYPE | 176 | 89.4 (10.7) |
Figure S67. Get High-res Image Gene #38: 'del_9p21.3' versus Clinical Feature #4: 'KARNOFSKY_PERFORMANCE_SCORE'
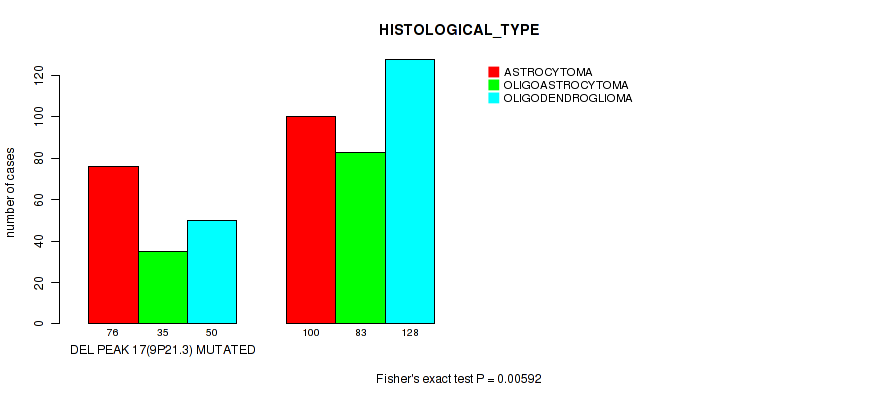
P value = 0.00592 (Fisher's exact test), Q value = 0.044
Table S68. Gene #38: 'del_9p21.3' versus Clinical Feature #5: 'HISTOLOGICAL_TYPE'
| nPatients | ASTROCYTOMA | OLIGOASTROCYTOMA | OLIGODENDROGLIOMA |
|---|---|---|---|
| ALL | 176 | 118 | 178 |
| DEL PEAK 17(9P21.3) MUTATED | 76 | 35 | 50 |
| DEL PEAK 17(9P21.3) WILD-TYPE | 100 | 83 | 128 |
Figure S68. Get High-res Image Gene #38: 'del_9p21.3' versus Clinical Feature #5: 'HISTOLOGICAL_TYPE'
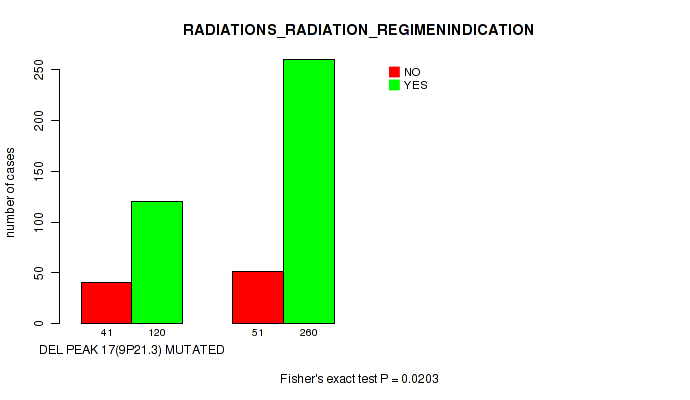
P value = 0.0203 (Fisher's exact test), Q value = 0.13
Table S69. Gene #38: 'del_9p21.3' versus Clinical Feature #6: 'RADIATIONS_RADIATION_REGIMENINDICATION'
| nPatients | NO | YES |
|---|---|---|
| ALL | 92 | 380 |
| DEL PEAK 17(9P21.3) MUTATED | 41 | 120 |
| DEL PEAK 17(9P21.3) WILD-TYPE | 51 | 260 |
Figure S69. Get High-res Image Gene #38: 'del_9p21.3' versus Clinical Feature #6: 'RADIATIONS_RADIATION_REGIMENINDICATION'
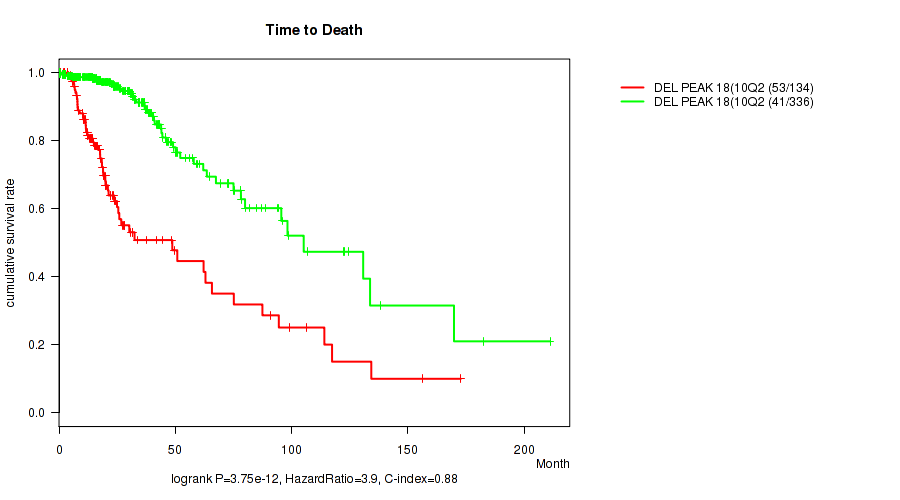
P value = 3.75e-12 (logrank test), Q value = 1.6e-09
Table S70. Gene #39: 'del_10q26.3' versus Clinical Feature #1: 'Time to Death'
| nPatients | nDeath | Duration Range (Median), Month | |
|---|---|---|---|
| ALL | 470 | 94 | 0.0 - 211.2 (18.7) |
| DEL PEAK 18(10Q26.3) MUTATED | 134 | 53 | 0.1 - 172.8 (16.4) |
| DEL PEAK 18(10Q26.3) WILD-TYPE | 336 | 41 | 0.0 - 211.2 (20.2) |
Figure S70. Get High-res Image Gene #39: 'del_10q26.3' versus Clinical Feature #1: 'Time to Death'
P value = 2.23e-07 (Wilcoxon-test), Q value = 1.3e-05
Table S71. Gene #39: 'del_10q26.3' versus Clinical Feature #2: 'YEARS_TO_BIRTH'
| nPatients | Mean (Std.Dev) | |
|---|---|---|
| ALL | 471 | 43.1 (13.4) |
| DEL PEAK 18(10Q26.3) MUTATED | 135 | 48.3 (13.9) |
| DEL PEAK 18(10Q26.3) WILD-TYPE | 336 | 40.9 (12.7) |
Figure S71. Get High-res Image Gene #39: 'del_10q26.3' versus Clinical Feature #2: 'YEARS_TO_BIRTH'
P value = 3e-05 (Fisher's exact test), Q value = 5e-04
Table S72. Gene #39: 'del_10q26.3' versus Clinical Feature #5: 'HISTOLOGICAL_TYPE'
| nPatients | ASTROCYTOMA | OLIGOASTROCYTOMA | OLIGODENDROGLIOMA |
|---|---|---|---|
| ALL | 176 | 118 | 178 |
| DEL PEAK 18(10Q26.3) MUTATED | 72 | 29 | 34 |
| DEL PEAK 18(10Q26.3) WILD-TYPE | 104 | 89 | 144 |
Figure S72. Get High-res Image Gene #39: 'del_10q26.3' versus Clinical Feature #5: 'HISTOLOGICAL_TYPE'
P value = 0.0273 (Wilcoxon-test), Q value = 0.15
Table S73. Gene #40: 'del_11p15.5' versus Clinical Feature #2: 'YEARS_TO_BIRTH'
| nPatients | Mean (Std.Dev) | |
|---|---|---|
| ALL | 471 | 43.1 (13.4) |
| DEL PEAK 19(11P15.5) MUTATED | 94 | 40.4 (11.6) |
| DEL PEAK 19(11P15.5) WILD-TYPE | 377 | 43.7 (13.8) |
Figure S73. Get High-res Image Gene #40: 'del_11p15.5' versus Clinical Feature #2: 'YEARS_TO_BIRTH'
P value = 1e-05 (Fisher's exact test), Q value = 0.00021
Table S74. Gene #40: 'del_11p15.5' versus Clinical Feature #5: 'HISTOLOGICAL_TYPE'
| nPatients | ASTROCYTOMA | OLIGOASTROCYTOMA | OLIGODENDROGLIOMA |
|---|---|---|---|
| ALL | 176 | 118 | 178 |
| DEL PEAK 19(11P15.5) MUTATED | 50 | 27 | 17 |
| DEL PEAK 19(11P15.5) WILD-TYPE | 126 | 91 | 161 |
Figure S74. Get High-res Image Gene #40: 'del_11p15.5' versus Clinical Feature #5: 'HISTOLOGICAL_TYPE'
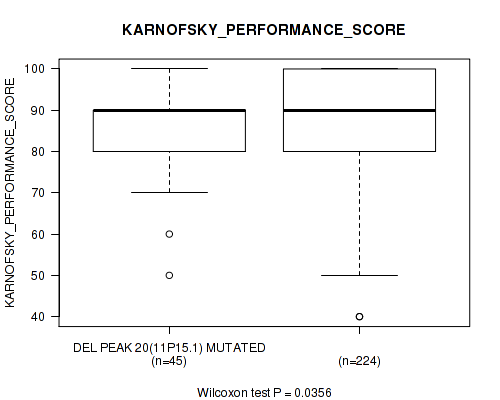
P value = 0.0356 (Wilcoxon-test), Q value = 0.18
Table S75. Gene #41: 'del_11p15.1' versus Clinical Feature #4: 'KARNOFSKY_PERFORMANCE_SCORE'
| nPatients | Mean (Std.Dev) | |
|---|---|---|
| ALL | 269 | 87.7 (12.0) |
| DEL PEAK 20(11P15.1) MUTATED | 45 | 85.6 (10.6) |
| DEL PEAK 20(11P15.1) WILD-TYPE | 224 | 88.2 (12.2) |
Figure S75. Get High-res Image Gene #41: 'del_11p15.1' versus Clinical Feature #4: 'KARNOFSKY_PERFORMANCE_SCORE'
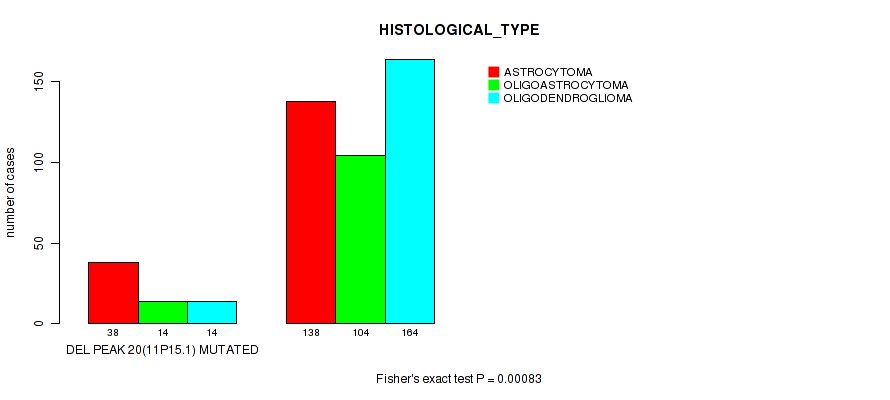
P value = 0.00083 (Fisher's exact test), Q value = 0.0091
Table S76. Gene #41: 'del_11p15.1' versus Clinical Feature #5: 'HISTOLOGICAL_TYPE'
| nPatients | ASTROCYTOMA | OLIGOASTROCYTOMA | OLIGODENDROGLIOMA |
|---|---|---|---|
| ALL | 176 | 118 | 178 |
| DEL PEAK 20(11P15.1) MUTATED | 38 | 14 | 14 |
| DEL PEAK 20(11P15.1) WILD-TYPE | 138 | 104 | 164 |
Figure S76. Get High-res Image Gene #41: 'del_11p15.1' versus Clinical Feature #5: 'HISTOLOGICAL_TYPE'
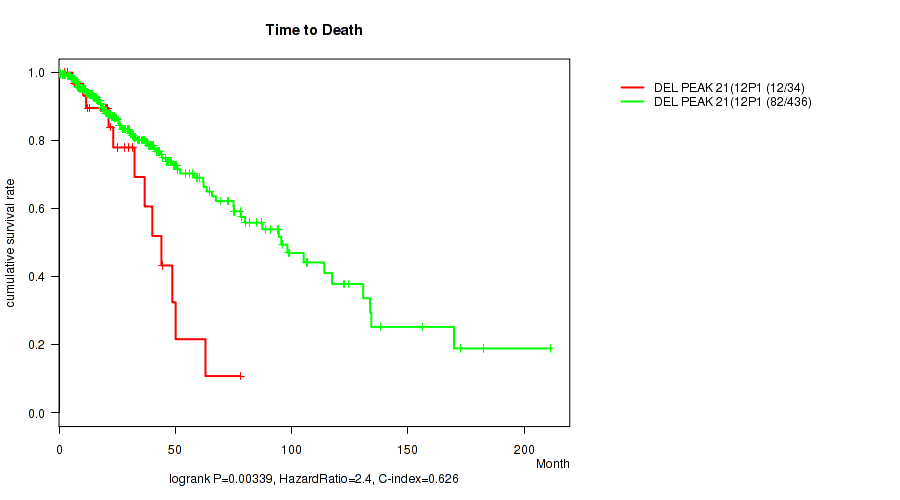
P value = 0.00339 (logrank test), Q value = 0.031
Table S77. Gene #42: 'del_12p13.1' versus Clinical Feature #1: 'Time to Death'
| nPatients | nDeath | Duration Range (Median), Month | |
|---|---|---|---|
| ALL | 470 | 94 | 0.0 - 211.2 (18.7) |
| DEL PEAK 21(12P13.1) MUTATED | 34 | 12 | 0.1 - 78.0 (20.5) |
| DEL PEAK 21(12P13.1) WILD-TYPE | 436 | 82 | 0.0 - 211.2 (18.6) |
Figure S77. Get High-res Image Gene #42: 'del_12p13.1' versus Clinical Feature #1: 'Time to Death'
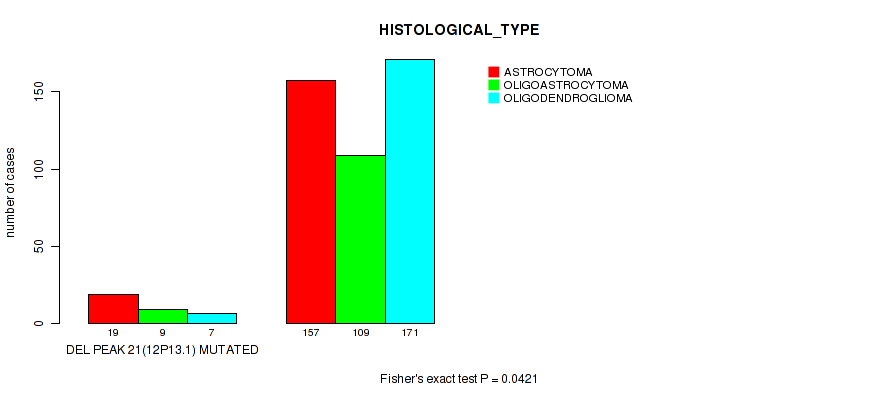
P value = 0.0421 (Fisher's exact test), Q value = 0.21
Table S78. Gene #42: 'del_12p13.1' versus Clinical Feature #5: 'HISTOLOGICAL_TYPE'
| nPatients | ASTROCYTOMA | OLIGOASTROCYTOMA | OLIGODENDROGLIOMA |
|---|---|---|---|
| ALL | 176 | 118 | 178 |
| DEL PEAK 21(12P13.1) MUTATED | 19 | 9 | 7 |
| DEL PEAK 21(12P13.1) WILD-TYPE | 157 | 109 | 171 |
Figure S78. Get High-res Image Gene #42: 'del_12p13.1' versus Clinical Feature #5: 'HISTOLOGICAL_TYPE'
P value = 0.00016 (Fisher's exact test), Q value = 0.0021
Table S79. Gene #43: 'del_12q12' versus Clinical Feature #5: 'HISTOLOGICAL_TYPE'
| nPatients | ASTROCYTOMA | OLIGOASTROCYTOMA | OLIGODENDROGLIOMA |
|---|---|---|---|
| ALL | 176 | 118 | 178 |
| DEL PEAK 22(12Q12) MUTATED | 39 | 15 | 12 |
| DEL PEAK 22(12Q12) WILD-TYPE | 137 | 103 | 166 |
Figure S79. Get High-res Image Gene #43: 'del_12q12' versus Clinical Feature #5: 'HISTOLOGICAL_TYPE'
P value = 0.00576 (Wilcoxon-test), Q value = 0.044
Table S80. Gene #44: 'del_13q14.2' versus Clinical Feature #4: 'KARNOFSKY_PERFORMANCE_SCORE'
| nPatients | Mean (Std.Dev) | |
|---|---|---|
| ALL | 269 | 87.7 (12.0) |
| DEL PEAK 23(13Q14.2) MUTATED | 80 | 84.9 (12.6) |
| DEL PEAK 23(13Q14.2) WILD-TYPE | 189 | 88.9 (11.5) |
Figure S80. Get High-res Image Gene #44: 'del_13q14.2' versus Clinical Feature #4: 'KARNOFSKY_PERFORMANCE_SCORE'

P value = 0.00597 (Wilcoxon-test), Q value = 0.044
Table S81. Gene #45: 'del_13q14.2' versus Clinical Feature #4: 'KARNOFSKY_PERFORMANCE_SCORE'
| nPatients | Mean (Std.Dev) | |
|---|---|---|
| ALL | 269 | 87.7 (12.0) |
| DEL PEAK 24(13Q14.2) MUTATED | 81 | 84.9 (12.6) |
| DEL PEAK 24(13Q14.2) WILD-TYPE | 188 | 88.9 (11.6) |
Figure S81. Get High-res Image Gene #45: 'del_13q14.2' versus Clinical Feature #4: 'KARNOFSKY_PERFORMANCE_SCORE'

P value = 0.00016 (logrank test), Q value = 0.0021
Table S82. Gene #47: 'del_14q24.3' versus Clinical Feature #1: 'Time to Death'
| nPatients | nDeath | Duration Range (Median), Month | |
|---|---|---|---|
| ALL | 470 | 94 | 0.0 - 211.2 (18.7) |
| DEL PEAK 26(14Q24.3) MUTATED | 107 | 35 | 0.1 - 130.8 (19.9) |
| DEL PEAK 26(14Q24.3) WILD-TYPE | 363 | 59 | 0.0 - 211.2 (18.4) |
Figure S82. Get High-res Image Gene #47: 'del_14q24.3' versus Clinical Feature #1: 'Time to Death'
P value = 0.0556 (Wilcoxon-test), Q value = 0.25
Table S83. Gene #47: 'del_14q24.3' versus Clinical Feature #2: 'YEARS_TO_BIRTH'
| nPatients | Mean (Std.Dev) | |
|---|---|---|
| ALL | 471 | 43.1 (13.4) |
| DEL PEAK 26(14Q24.3) MUTATED | 108 | 45.2 (13.1) |
| DEL PEAK 26(14Q24.3) WILD-TYPE | 363 | 42.4 (13.5) |
Figure S83. Get High-res Image Gene #47: 'del_14q24.3' versus Clinical Feature #2: 'YEARS_TO_BIRTH'

P value = 0.0291 (Wilcoxon-test), Q value = 0.16
Table S84. Gene #48: 'del_18q23' versus Clinical Feature #2: 'YEARS_TO_BIRTH'
| nPatients | Mean (Std.Dev) | |
|---|---|---|
| ALL | 471 | 43.1 (13.4) |
| DEL PEAK 27(18Q23) MUTATED | 74 | 46.6 (14.3) |
| DEL PEAK 27(18Q23) WILD-TYPE | 397 | 42.4 (13.2) |
Figure S84. Get High-res Image Gene #48: 'del_18q23' versus Clinical Feature #2: 'YEARS_TO_BIRTH'

P value = 0.0192 (logrank test), Q value = 0.13
Table S85. Gene #49: 'del_19q13.41' versus Clinical Feature #1: 'Time to Death'
| nPatients | nDeath | Duration Range (Median), Month | |
|---|---|---|---|
| ALL | 470 | 94 | 0.0 - 211.2 (18.7) |
| DEL PEAK 28(19Q13.41) MUTATED | 245 | 41 | 0.0 - 182.3 (19.9) |
| DEL PEAK 28(19Q13.41) WILD-TYPE | 225 | 53 | 0.1 - 211.2 (18.0) |
Figure S85. Get High-res Image Gene #49: 'del_19q13.41' versus Clinical Feature #1: 'Time to Death'
P value = 0.0247 (Wilcoxon-test), Q value = 0.15
Table S86. Gene #49: 'del_19q13.41' versus Clinical Feature #2: 'YEARS_TO_BIRTH'
| nPatients | Mean (Std.Dev) | |
|---|---|---|
| ALL | 471 | 43.1 (13.4) |
| DEL PEAK 28(19Q13.41) MUTATED | 246 | 44.2 (12.6) |
| DEL PEAK 28(19Q13.41) WILD-TYPE | 225 | 41.8 (14.2) |
Figure S86. Get High-res Image Gene #49: 'del_19q13.41' versus Clinical Feature #2: 'YEARS_TO_BIRTH'

P value = 1e-05 (Fisher's exact test), Q value = 0.00021
Table S87. Gene #49: 'del_19q13.41' versus Clinical Feature #5: 'HISTOLOGICAL_TYPE'
| nPatients | ASTROCYTOMA | OLIGOASTROCYTOMA | OLIGODENDROGLIOMA |
|---|---|---|---|
| ALL | 176 | 118 | 178 |
| DEL PEAK 28(19Q13.41) MUTATED | 50 | 53 | 144 |
| DEL PEAK 28(19Q13.41) WILD-TYPE | 126 | 65 | 34 |
Figure S87. Get High-res Image Gene #49: 'del_19q13.41' versus Clinical Feature #5: 'HISTOLOGICAL_TYPE'
P value = 0.000722 (logrank test), Q value = 0.0081
Table S88. Gene #50: 'del_19q13.42' versus Clinical Feature #1: 'Time to Death'
| nPatients | nDeath | Duration Range (Median), Month | |
|---|---|---|---|
| ALL | 470 | 94 | 0.0 - 211.2 (18.7) |
| DEL PEAK 29(19Q13.42) MUTATED | 253 | 40 | 0.0 - 182.3 (20.1) |
| DEL PEAK 29(19Q13.42) WILD-TYPE | 217 | 54 | 0.1 - 211.2 (17.6) |
Figure S88. Get High-res Image Gene #50: 'del_19q13.42' versus Clinical Feature #1: 'Time to Death'
P value = 1e-05 (Fisher's exact test), Q value = 0.00021
Table S89. Gene #50: 'del_19q13.42' versus Clinical Feature #5: 'HISTOLOGICAL_TYPE'
| nPatients | ASTROCYTOMA | OLIGOASTROCYTOMA | OLIGODENDROGLIOMA |
|---|---|---|---|
| ALL | 176 | 118 | 178 |
| DEL PEAK 29(19Q13.42) MUTATED | 53 | 57 | 145 |
| DEL PEAK 29(19Q13.42) WILD-TYPE | 123 | 61 | 33 |
Figure S89. Get High-res Image Gene #50: 'del_19q13.42' versus Clinical Feature #5: 'HISTOLOGICAL_TYPE'
P value = 0.000626 (logrank test), Q value = 0.0072
Table S90. Gene #51: 'del_22q13.31' versus Clinical Feature #1: 'Time to Death'
| nPatients | nDeath | Duration Range (Median), Month | |
|---|---|---|---|
| ALL | 470 | 94 | 0.0 - 211.2 (18.7) |
| DEL PEAK 30(22Q13.31) MUTATED | 68 | 26 | 0.1 - 156.2 (19.0) |
| DEL PEAK 30(22Q13.31) WILD-TYPE | 402 | 68 | 0.0 - 211.2 (18.6) |
Figure S90. Get High-res Image Gene #51: 'del_22q13.31' versus Clinical Feature #1: 'Time to Death'
P value = 0.00252 (Wilcoxon-test), Q value = 0.024
Table S91. Gene #51: 'del_22q13.31' versus Clinical Feature #2: 'YEARS_TO_BIRTH'
| nPatients | Mean (Std.Dev) | |
|---|---|---|
| ALL | 471 | 43.1 (13.4) |
| DEL PEAK 30(22Q13.31) MUTATED | 68 | 48.2 (14.9) |
| DEL PEAK 30(22Q13.31) WILD-TYPE | 403 | 42.2 (13.0) |
Figure S91. Get High-res Image Gene #51: 'del_22q13.31' versus Clinical Feature #2: 'YEARS_TO_BIRTH'
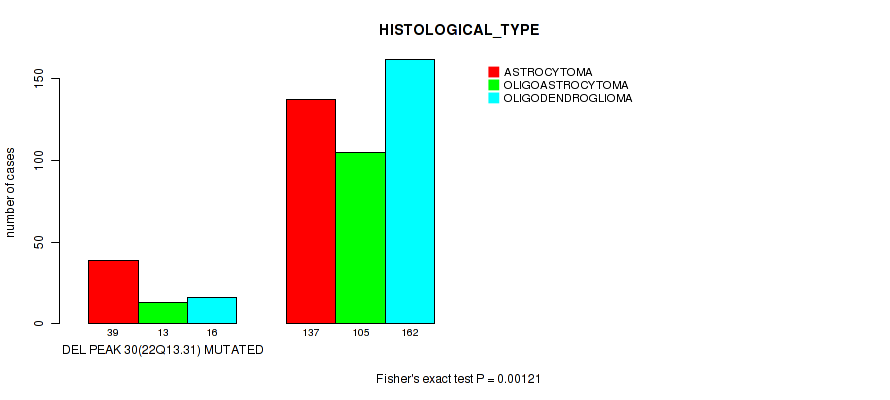
P value = 0.00121 (Fisher's exact test), Q value = 0.012
Table S92. Gene #51: 'del_22q13.31' versus Clinical Feature #5: 'HISTOLOGICAL_TYPE'
| nPatients | ASTROCYTOMA | OLIGOASTROCYTOMA | OLIGODENDROGLIOMA |
|---|---|---|---|
| ALL | 176 | 118 | 178 |
| DEL PEAK 30(22Q13.31) MUTATED | 39 | 13 | 16 |
| DEL PEAK 30(22Q13.31) WILD-TYPE | 137 | 105 | 162 |
Figure S92. Get High-res Image Gene #51: 'del_22q13.31' versus Clinical Feature #5: 'HISTOLOGICAL_TYPE'
P value = 0.0302 (logrank test), Q value = 0.16
Table S93. Gene #52: 'del_xq21.1' versus Clinical Feature #1: 'Time to Death'
| nPatients | nDeath | Duration Range (Median), Month | |
|---|---|---|---|
| ALL | 470 | 94 | 0.0 - 211.2 (18.7) |
| DEL PEAK 31(XQ21.1) MUTATED | 65 | 20 | 0.1 - 156.2 (16.7) |
| DEL PEAK 31(XQ21.1) WILD-TYPE | 405 | 74 | 0.0 - 211.2 (18.8) |
Figure S93. Get High-res Image Gene #52: 'del_xq21.1' versus Clinical Feature #1: 'Time to Death'

-
Copy number data file = all_lesions.txt from GISTIC pipeline
-
Processed Copy number data file = /xchip/cga/gdac-prod/tcga-gdac/jobResults/GDAC_Correlate_Genomic_Events_Preprocess/LGG-TP/15087635/transformed.cor.cli.txt
-
Clinical data file = /xchip/cga/gdac-prod/tcga-gdac/jobResults/Append_Data/LGG-TP/15082624/LGG-TP.merged_data.txt
-
Number of patients = 472
-
Number of significantly focal cnvs = 52
-
Number of selected clinical features = 8
-
Exclude genes that fewer than K tumors have mutations, K = 3
For survival clinical features, the Kaplan-Meier survival curves of tumors with and without gene mutations were plotted and the statistical significance P values were estimated by logrank test (Bland and Altman 2004) using the 'survdiff' function in R
For binary or multi-class clinical features (nominal or ordinal), two-tailed Fisher's exact tests (Fisher 1922) were used to estimate the P values using the 'fisher.test' function in R
For multiple hypothesis correction, Q value is the False Discovery Rate (FDR) analogue of the P value (Benjamini and Hochberg 1995), defined as the minimum FDR at which the test may be called significant. We used the 'Benjamini and Hochberg' method of 'p.adjust' function in R to convert P values into Q values.
In addition to the links below, the full results of the analysis summarized in this report can also be downloaded programmatically using firehose_get, or interactively from either the Broad GDAC website or TCGA Data Coordination Center Portal.