This pipeline computes the correlation between cancer subtypes identified by different molecular patterns and selected clinical features.
Testing the association between subtypes identified by 12 different clustering approaches and 7 clinical features across 536 patients, 38 significant findings detected with P value < 0.05 and Q value < 0.25.
-
CNMF clustering analysis on array-based mRNA expression data identified 4 subtypes that correlate to 'YEARS_TO_BIRTH', 'HISTOLOGICAL_TYPE', and 'RADIATIONS_RADIATION_REGIMENINDICATION'.
-
Consensus hierarchical clustering analysis on array-based mRNA expression data identified 5 subtypes that correlate to 'YEARS_TO_BIRTH' and 'HISTOLOGICAL_TYPE'.
-
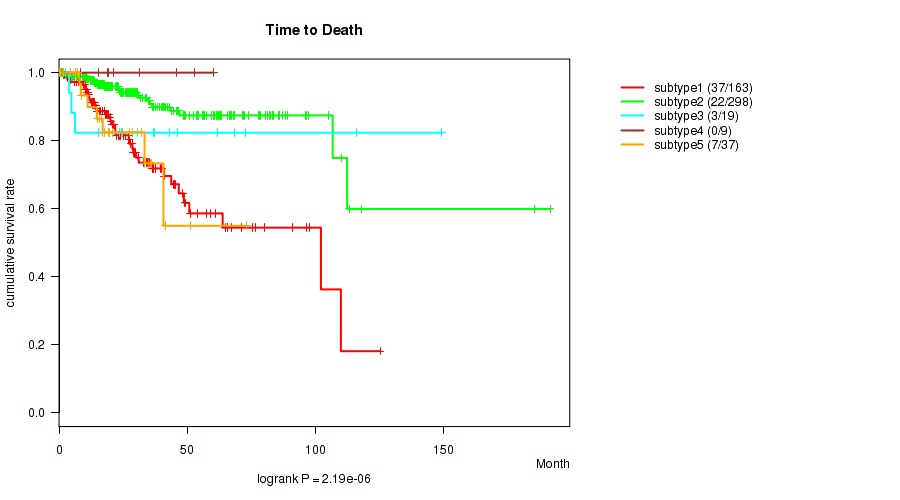
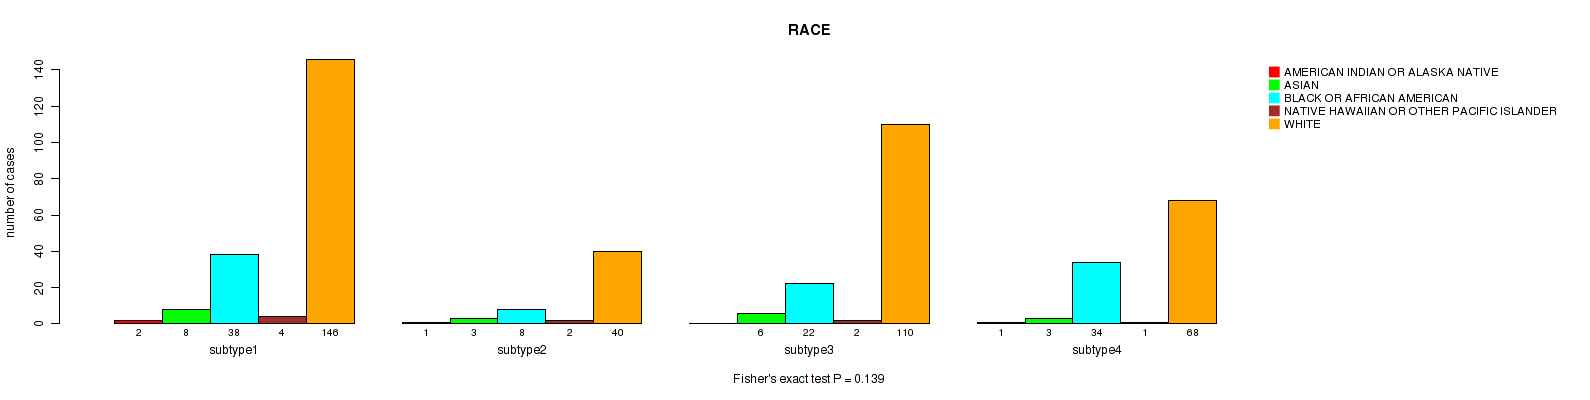
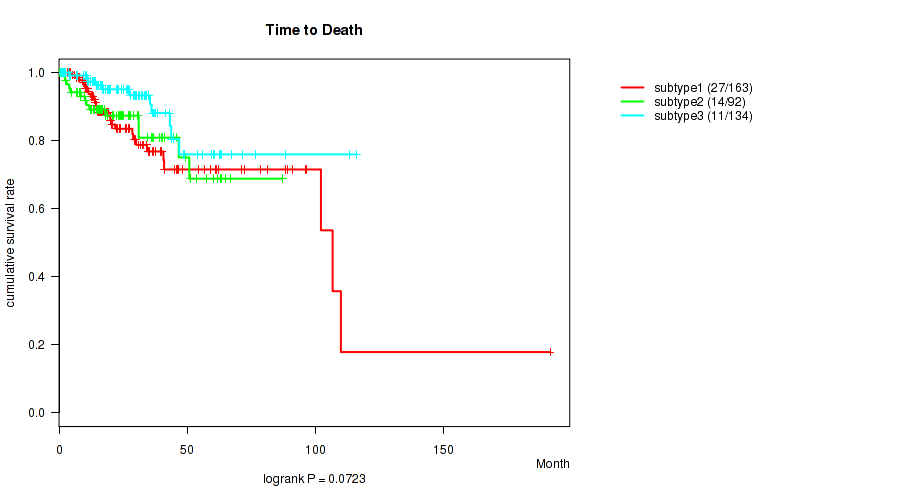
5 subtypes identified in current cancer cohort by 'Copy Number Ratio CNMF subtypes'. These subtypes correlate to 'Time to Death', 'YEARS_TO_BIRTH', 'HISTOLOGICAL_TYPE', 'RADIATIONS_RADIATION_REGIMENINDICATION', and 'RACE'.
-
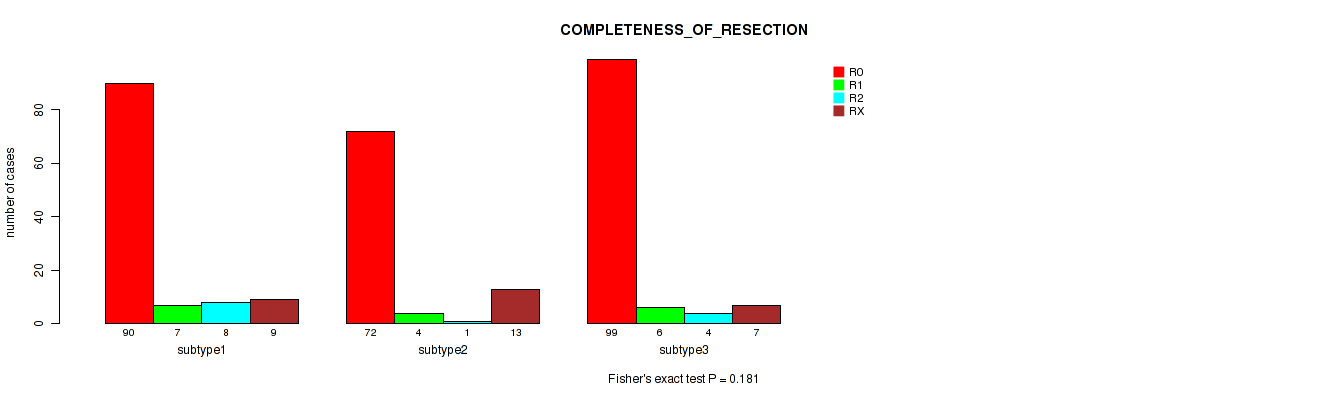
3 subtypes identified in current cancer cohort by 'METHLYATION CNMF'. These subtypes correlate to 'Time to Death', 'YEARS_TO_BIRTH', 'HISTOLOGICAL_TYPE', and 'COMPLETENESS_OF_RESECTION'.
-
CNMF clustering analysis on RPPA data identified 6 subtypes that correlate to 'HISTOLOGICAL_TYPE'.
-
Consensus hierarchical clustering analysis on RPPA data identified 4 subtypes that correlate to 'HISTOLOGICAL_TYPE'.
-
CNMF clustering analysis on sequencing-based mRNA expression data identified 3 subtypes that correlate to 'Time to Death', 'YEARS_TO_BIRTH', 'HISTOLOGICAL_TYPE', and 'RADIATIONS_RADIATION_REGIMENINDICATION'.
-
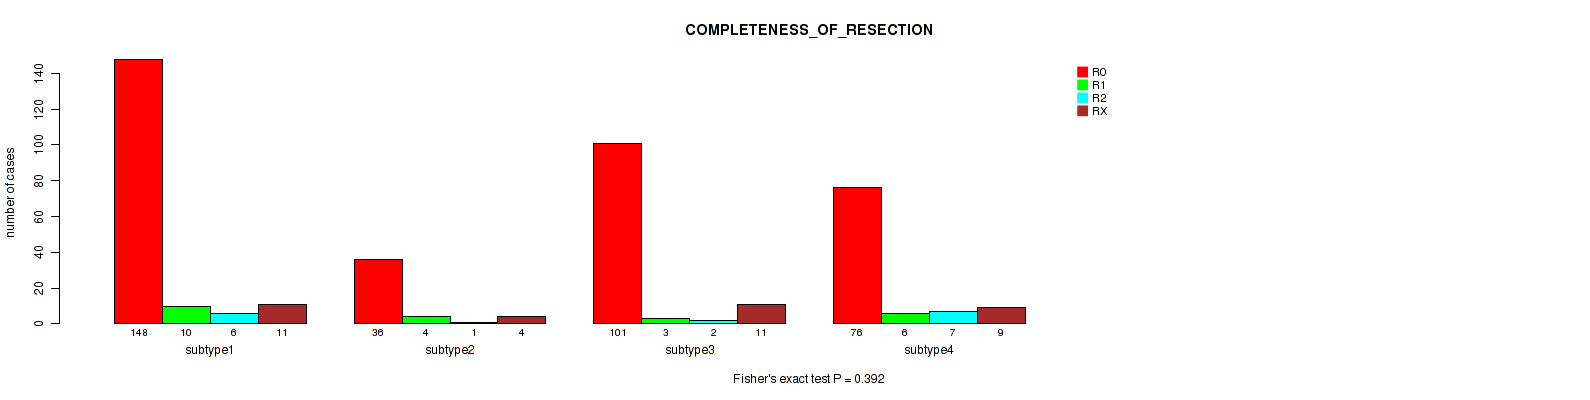
Consensus hierarchical clustering analysis on sequencing-based mRNA expression data identified 7 subtypes that correlate to 'Time to Death', 'YEARS_TO_BIRTH', 'HISTOLOGICAL_TYPE', 'RADIATIONS_RADIATION_REGIMENINDICATION', 'COMPLETENESS_OF_RESECTION', and 'RACE'.
-
3 subtypes identified in current cancer cohort by 'MIRSEQ CNMF'. These subtypes correlate to 'Time to Death', 'YEARS_TO_BIRTH', and 'HISTOLOGICAL_TYPE'.
-
4 subtypes identified in current cancer cohort by 'MIRSEQ CHIERARCHICAL'. These subtypes correlate to 'Time to Death', 'YEARS_TO_BIRTH', and 'HISTOLOGICAL_TYPE'.
-
3 subtypes identified in current cancer cohort by 'MIRseq Mature CNMF subtypes'. These subtypes correlate to 'YEARS_TO_BIRTH', 'HISTOLOGICAL_TYPE', 'RADIATIONS_RADIATION_REGIMENINDICATION', and 'RACE'.
-
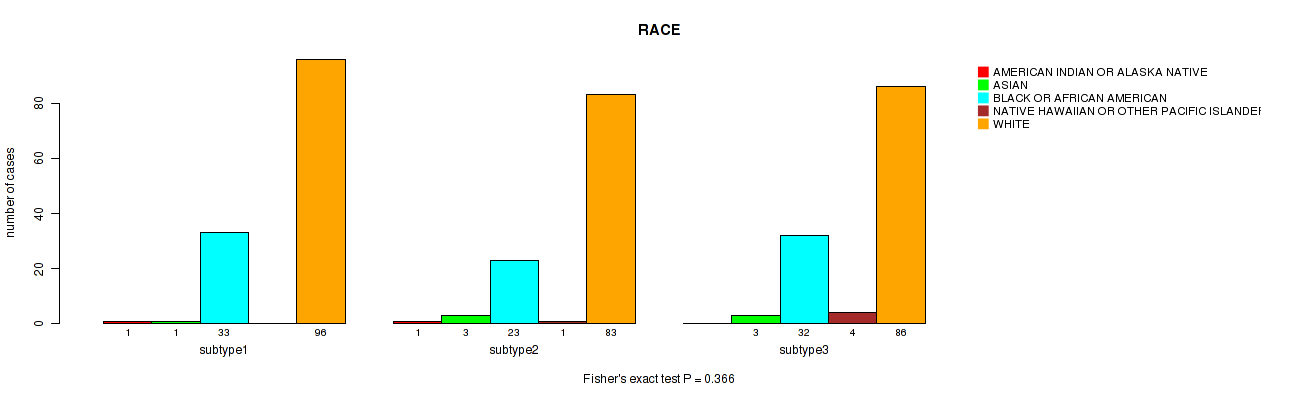
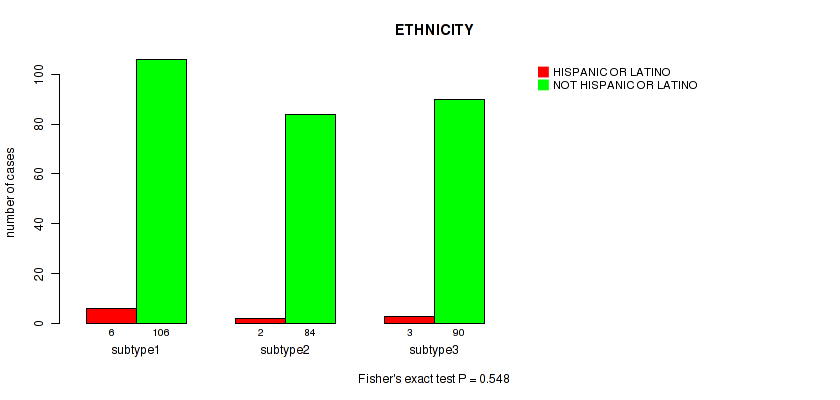
3 subtypes identified in current cancer cohort by 'MIRseq Mature cHierClus subtypes'. These subtypes correlate to 'YEARS_TO_BIRTH' and 'HISTOLOGICAL_TYPE'.
Table 1. Get Full Table Overview of the association between subtypes identified by 12 different clustering approaches and 7 clinical features. Shown in the table are P values (Q values). Thresholded by P value < 0.05 and Q value < 0.25, 38 significant findings detected.
|
Clinical Features |
Time to Death |
YEARS TO BIRTH |
HISTOLOGICAL TYPE |
RADIATIONS RADIATION REGIMENINDICATION |
COMPLETENESS OF RESECTION |
RACE | ETHNICITY |
| Statistical Tests | logrank test | Kruskal-Wallis (anova) | Fisher's exact test | Fisher's exact test | Fisher's exact test | Fisher's exact test | Fisher's exact test |
| mRNA CNMF subtypes |
0.836 (0.889) |
0.00418 (0.0125) |
0.0003 (0.00126) |
0.0369 (0.0837) |
0.891 (0.935) |
0.148 (0.239) |
0.614 (0.679) |
| mRNA cHierClus subtypes |
0.095 (0.185) |
0.0314 (0.0789) |
1e-05 (5.25e-05) |
0.103 (0.19) |
0.488 (0.577) |
0.571 (0.648) |
1 (1.00) |
| Copy Number Ratio CNMF subtypes |
2.19e-06 (3.68e-05) |
3.09e-12 (2.59e-10) |
1e-05 (5.25e-05) |
0.0218 (0.059) |
0.313 (0.404) |
0.00269 (0.00837) |
0.794 (0.855) |
| METHLYATION CNMF |
0.0348 (0.0836) |
0.00191 (0.00617) |
1e-05 (5.25e-05) |
0.248 (0.353) |
0.0319 (0.0789) |
0.0667 (0.144) |
0.483 (0.577) |
| RPPA CNMF subtypes |
0.228 (0.342) |
0.148 (0.239) |
3e-05 (0.000148) |
0.471 (0.577) |
0.113 (0.193) |
0.0727 (0.149) |
0.478 (0.577) |
| RPPA cHierClus subtypes |
0.278 (0.377) |
0.108 (0.19) |
1e-05 (5.25e-05) |
0.983 (1.00) |
0.107 (0.19) |
0.287 (0.377) |
0.498 (0.581) |
| RNAseq CNMF subtypes |
7.24e-05 (0.00032) |
1.27e-06 (2.67e-05) |
1e-05 (5.25e-05) |
0.00432 (0.0125) |
0.108 (0.19) |
0.0827 (0.165) |
1 (1.00) |
| RNAseq cHierClus subtypes |
0.000338 (0.00132) |
2.77e-08 (7.77e-07) |
1e-05 (5.25e-05) |
0.0441 (0.0975) |
0.0276 (0.0726) |
0.0359 (0.0837) |
0.227 (0.342) |
| MIRSEQ CNMF |
0.000656 (0.0023) |
3.07e-06 (4.3e-05) |
1e-05 (5.25e-05) |
0.587 (0.657) |
0.246 (0.353) |
0.274 (0.377) |
0.105 (0.19) |
| MIRSEQ CHIERARCHICAL |
5.04e-05 (0.000235) |
1.02e-09 (4.29e-08) |
1e-05 (5.25e-05) |
0.287 (0.377) |
0.392 (0.491) |
0.139 (0.234) |
0.976 (1.00) |
| MIRseq Mature CNMF subtypes |
0.0723 (0.149) |
0.000821 (0.00276) |
1e-05 (5.25e-05) |
0.00572 (0.016) |
0.694 (0.757) |
0.00044 (0.00161) |
0.168 (0.266) |
| MIRseq Mature cHierClus subtypes |
0.239 (0.352) |
0.000345 (0.00132) |
1e-05 (5.25e-05) |
0.282 (0.377) |
0.181 (0.282) |
0.366 (0.466) |
0.548 (0.631) |
Table S1. Description of clustering approach #1: 'mRNA CNMF subtypes'
| Cluster Labels | 1 | 2 | 3 | 4 |
|---|---|---|---|---|
| Number of samples | 14 | 18 | 12 | 10 |
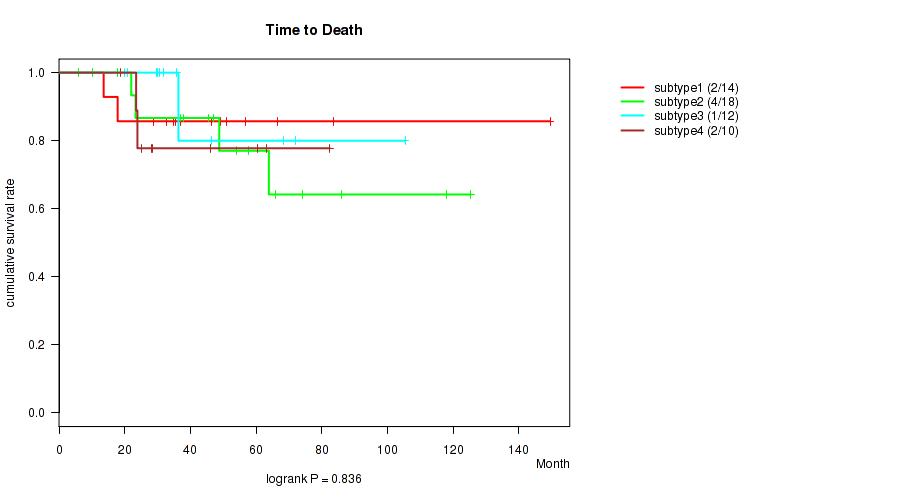
P value = 0.836 (logrank test), Q value = 0.89
Table S2. Clustering Approach #1: 'mRNA CNMF subtypes' versus Clinical Feature #1: 'Time to Death'
| nPatients | nDeath | Duration Range (Median), Month | |
|---|---|---|---|
| ALL | 54 | 9 | 6.0 - 149.6 (37.4) |
| subtype1 | 14 | 2 | 13.6 - 149.6 (41.7) |
| subtype2 | 18 | 4 | 6.0 - 125.4 (47.9) |
| subtype3 | 12 | 1 | 19.8 - 105.4 (33.8) |
| subtype4 | 10 | 2 | 18.6 - 82.5 (28.3) |
Figure S1. Get High-res Image Clustering Approach #1: 'mRNA CNMF subtypes' versus Clinical Feature #1: 'Time to Death'
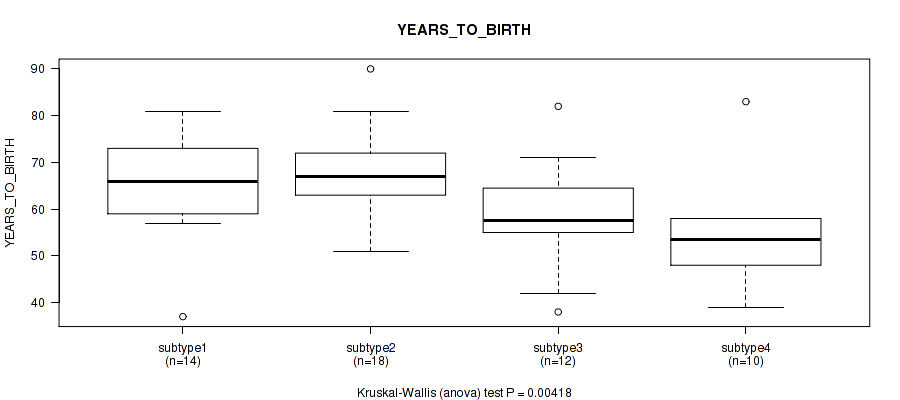
P value = 0.00418 (Kruskal-Wallis (anova)), Q value = 0.013
Table S3. Clustering Approach #1: 'mRNA CNMF subtypes' versus Clinical Feature #2: 'YEARS_TO_BIRTH'
| nPatients | Mean (Std.Dev) | |
|---|---|---|
| ALL | 54 | 62.9 (11.8) |
| subtype1 | 14 | 65.6 (11.7) |
| subtype2 | 18 | 68.2 (9.3) |
| subtype3 | 12 | 58.7 (11.9) |
| subtype4 | 10 | 54.9 (11.5) |
Figure S2. Get High-res Image Clustering Approach #1: 'mRNA CNMF subtypes' versus Clinical Feature #2: 'YEARS_TO_BIRTH'
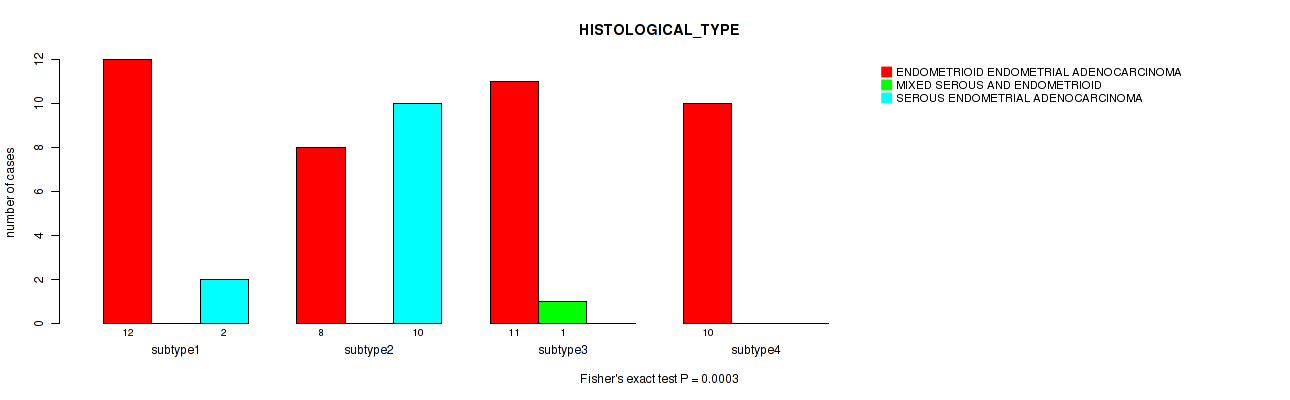
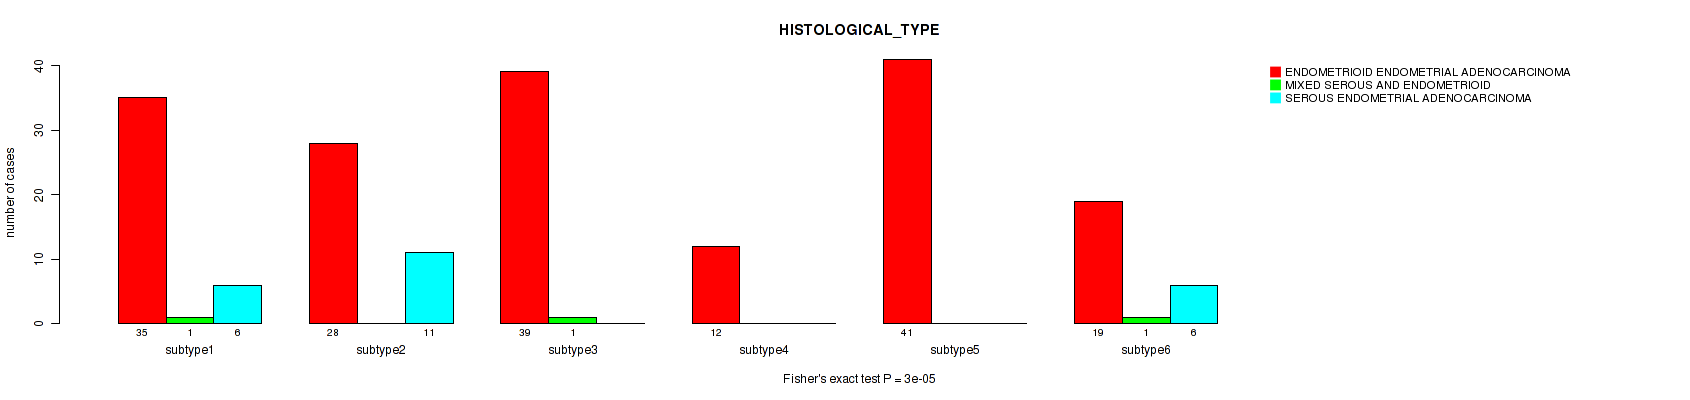
P value = 3e-04 (Fisher's exact test), Q value = 0.0013
Table S4. Clustering Approach #1: 'mRNA CNMF subtypes' versus Clinical Feature #3: 'HISTOLOGICAL_TYPE'
| nPatients | ENDOMETRIOID ENDOMETRIAL ADENOCARCINOMA | MIXED SEROUS AND ENDOMETRIOID | SEROUS ENDOMETRIAL ADENOCARCINOMA |
|---|---|---|---|
| ALL | 41 | 1 | 12 |
| subtype1 | 12 | 0 | 2 |
| subtype2 | 8 | 0 | 10 |
| subtype3 | 11 | 1 | 0 |
| subtype4 | 10 | 0 | 0 |
Figure S3. Get High-res Image Clustering Approach #1: 'mRNA CNMF subtypes' versus Clinical Feature #3: 'HISTOLOGICAL_TYPE'
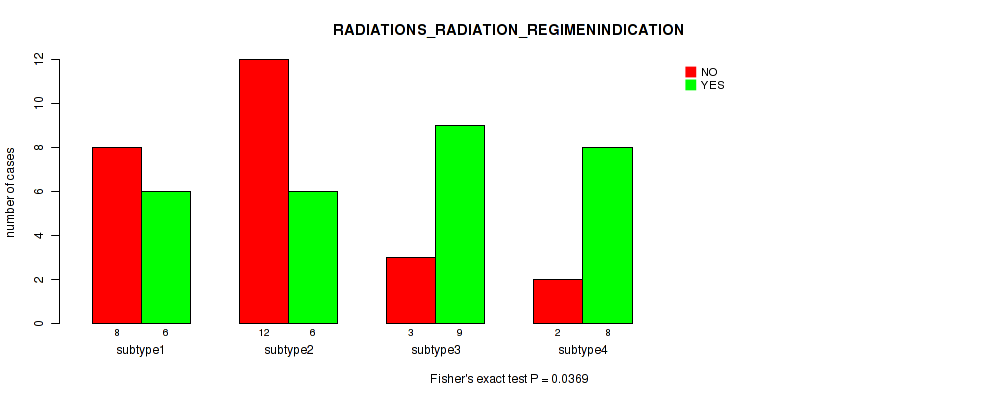
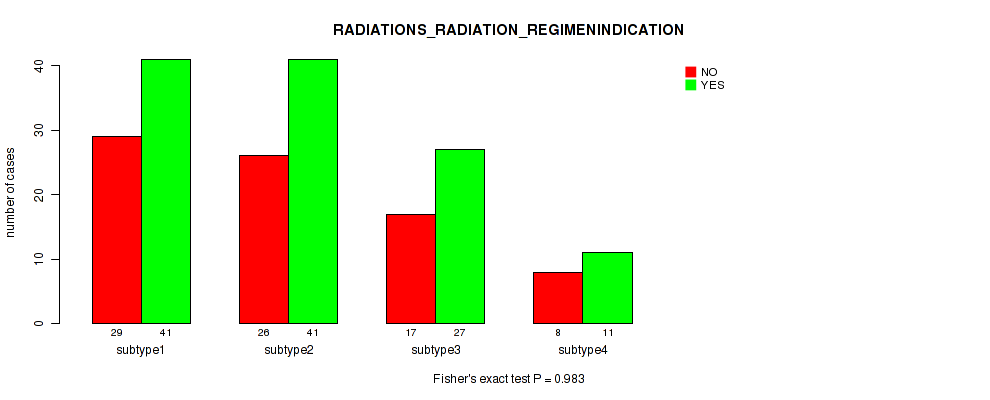
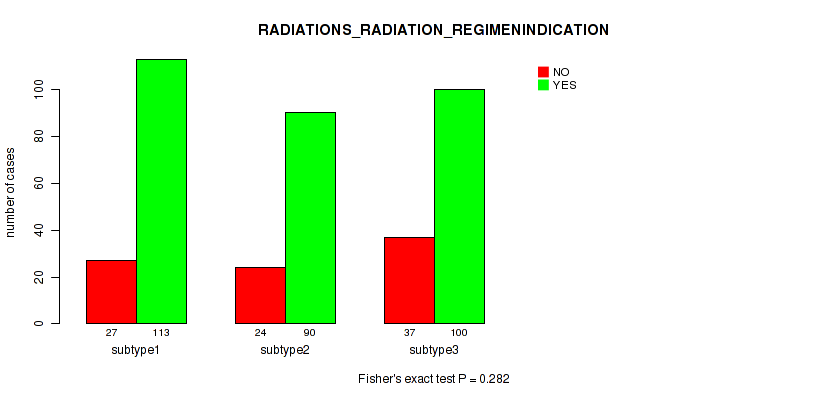
P value = 0.0369 (Fisher's exact test), Q value = 0.084
Table S5. Clustering Approach #1: 'mRNA CNMF subtypes' versus Clinical Feature #4: 'RADIATIONS_RADIATION_REGIMENINDICATION'
| nPatients | NO | YES |
|---|---|---|
| ALL | 25 | 29 |
| subtype1 | 8 | 6 |
| subtype2 | 12 | 6 |
| subtype3 | 3 | 9 |
| subtype4 | 2 | 8 |
Figure S4. Get High-res Image Clustering Approach #1: 'mRNA CNMF subtypes' versus Clinical Feature #4: 'RADIATIONS_RADIATION_REGIMENINDICATION'
P value = 0.891 (Fisher's exact test), Q value = 0.94
Table S6. Clustering Approach #1: 'mRNA CNMF subtypes' versus Clinical Feature #5: 'COMPLETENESS_OF_RESECTION'
| nPatients | R0 | R1 | R2 | RX |
|---|---|---|---|---|
| ALL | 41 | 4 | 2 | 1 |
| subtype1 | 8 | 2 | 1 | 0 |
| subtype2 | 14 | 1 | 1 | 1 |
| subtype3 | 10 | 1 | 0 | 0 |
| subtype4 | 9 | 0 | 0 | 0 |
Figure S5. Get High-res Image Clustering Approach #1: 'mRNA CNMF subtypes' versus Clinical Feature #5: 'COMPLETENESS_OF_RESECTION'
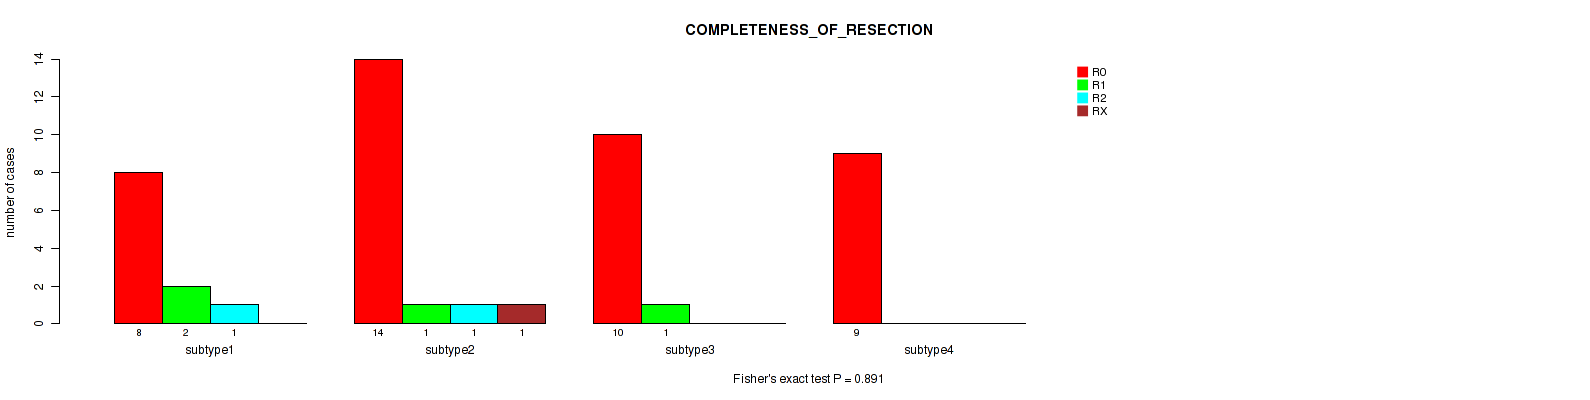
P value = 0.148 (Fisher's exact test), Q value = 0.24
Table S7. Clustering Approach #1: 'mRNA CNMF subtypes' versus Clinical Feature #6: 'RACE'
| nPatients | AMERICAN INDIAN OR ALASKA NATIVE | ASIAN | BLACK OR AFRICAN AMERICAN | WHITE |
|---|---|---|---|---|
| ALL | 2 | 4 | 6 | 40 |
| subtype1 | 1 | 1 | 1 | 10 |
| subtype2 | 0 | 0 | 4 | 13 |
| subtype3 | 1 | 3 | 0 | 8 |
| subtype4 | 0 | 0 | 1 | 9 |
Figure S6. Get High-res Image Clustering Approach #1: 'mRNA CNMF subtypes' versus Clinical Feature #6: 'RACE'
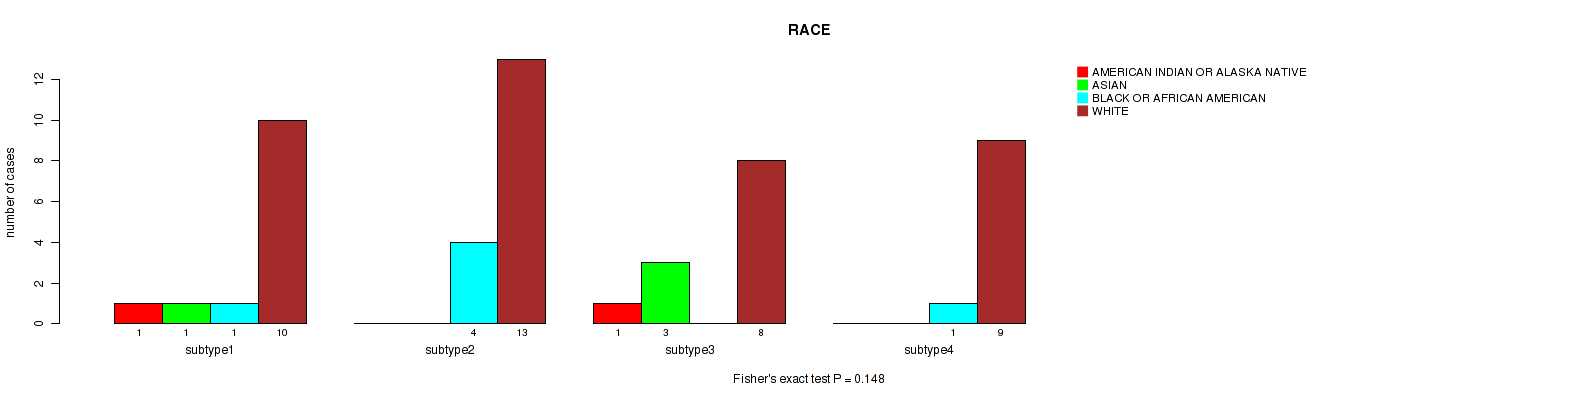
P value = 0.614 (Fisher's exact test), Q value = 0.68
Table S8. Clustering Approach #1: 'mRNA CNMF subtypes' versus Clinical Feature #7: 'ETHNICITY'
| nPatients | HISPANIC OR LATINO | NOT HISPANIC OR LATINO |
|---|---|---|
| ALL | 2 | 24 |
| subtype1 | 1 | 6 |
| subtype2 | 1 | 6 |
| subtype3 | 0 | 9 |
| subtype4 | 0 | 3 |
Figure S7. Get High-res Image Clustering Approach #1: 'mRNA CNMF subtypes' versus Clinical Feature #7: 'ETHNICITY'

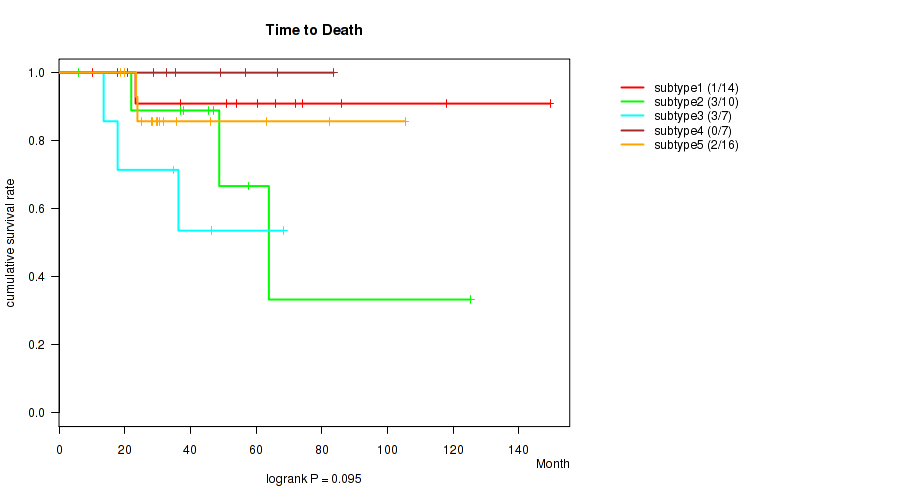
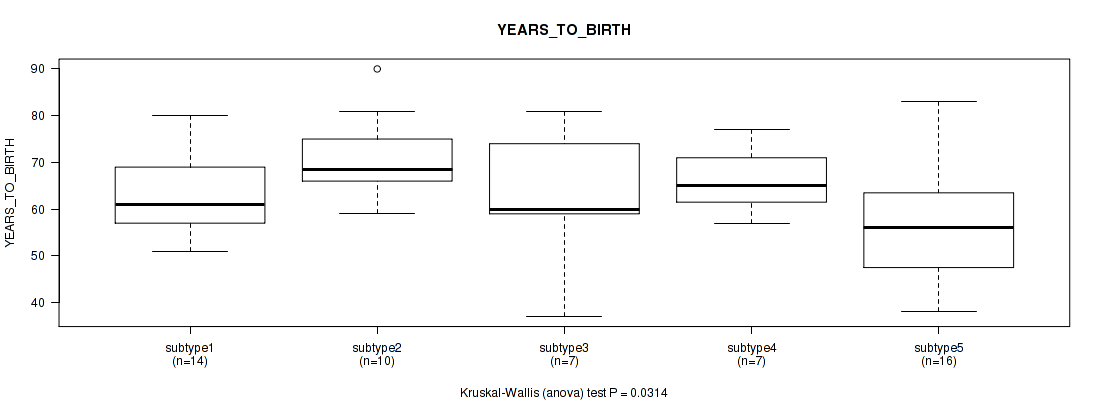
Table S9. Description of clustering approach #2: 'mRNA cHierClus subtypes'
| Cluster Labels | 1 | 2 | 3 | 4 | 5 |
|---|---|---|---|---|---|
| Number of samples | 14 | 10 | 7 | 7 | 16 |
P value = 0.095 (logrank test), Q value = 0.19
Table S10. Clustering Approach #2: 'mRNA cHierClus subtypes' versus Clinical Feature #1: 'Time to Death'
| nPatients | nDeath | Duration Range (Median), Month | |
|---|---|---|---|
| ALL | 54 | 9 | 6.0 - 149.6 (37.4) |
| subtype1 | 14 | 1 | 10.2 - 149.6 (57.2) |
| subtype2 | 10 | 3 | 6.0 - 125.4 (46.2) |
| subtype3 | 7 | 3 | 13.6 - 68.3 (36.4) |
| subtype4 | 7 | 0 | 28.6 - 83.7 (49.2) |
| subtype5 | 16 | 2 | 18.6 - 105.4 (29.9) |
Figure S8. Get High-res Image Clustering Approach #2: 'mRNA cHierClus subtypes' versus Clinical Feature #1: 'Time to Death'
P value = 0.0314 (Kruskal-Wallis (anova)), Q value = 0.079
Table S11. Clustering Approach #2: 'mRNA cHierClus subtypes' versus Clinical Feature #2: 'YEARS_TO_BIRTH'
| nPatients | Mean (Std.Dev) | |
|---|---|---|
| ALL | 54 | 62.9 (11.8) |
| subtype1 | 14 | 62.4 (8.6) |
| subtype2 | 10 | 70.7 (9.3) |
| subtype3 | 7 | 63.4 (15.2) |
| subtype4 | 7 | 66.3 (7.1) |
| subtype5 | 16 | 56.9 (13.6) |
Figure S9. Get High-res Image Clustering Approach #2: 'mRNA cHierClus subtypes' versus Clinical Feature #2: 'YEARS_TO_BIRTH'
P value = 1e-05 (Fisher's exact test), Q value = 5.2e-05
Table S12. Clustering Approach #2: 'mRNA cHierClus subtypes' versus Clinical Feature #3: 'HISTOLOGICAL_TYPE'
| nPatients | ENDOMETRIOID ENDOMETRIAL ADENOCARCINOMA | MIXED SEROUS AND ENDOMETRIOID | SEROUS ENDOMETRIAL ADENOCARCINOMA |
|---|---|---|---|
| ALL | 41 | 1 | 12 |
| subtype1 | 11 | 0 | 3 |
| subtype2 | 1 | 0 | 9 |
| subtype3 | 6 | 1 | 0 |
| subtype4 | 7 | 0 | 0 |
| subtype5 | 16 | 0 | 0 |
Figure S10. Get High-res Image Clustering Approach #2: 'mRNA cHierClus subtypes' versus Clinical Feature #3: 'HISTOLOGICAL_TYPE'
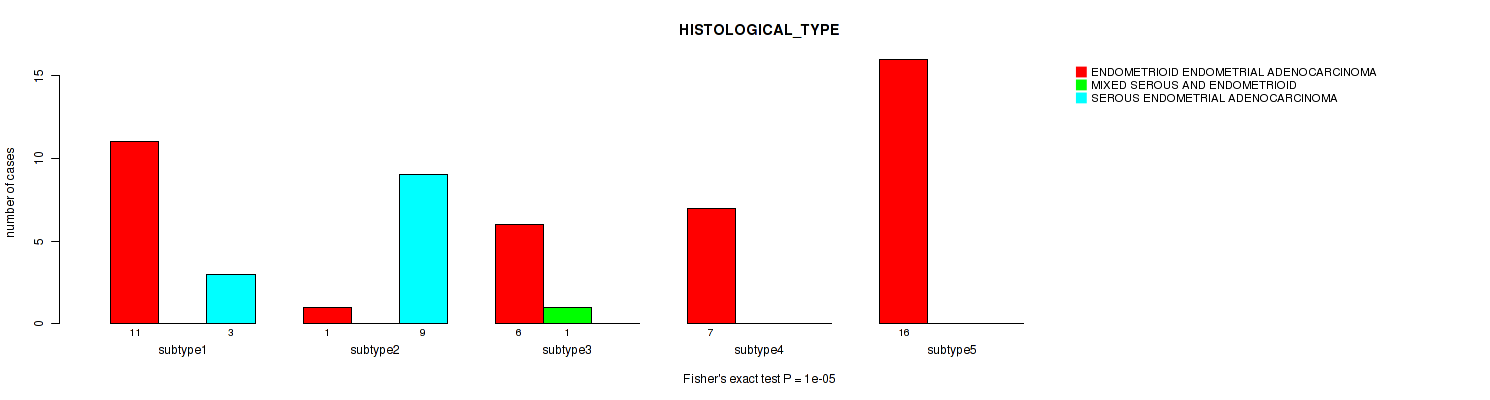
P value = 0.103 (Fisher's exact test), Q value = 0.19
Table S13. Clustering Approach #2: 'mRNA cHierClus subtypes' versus Clinical Feature #4: 'RADIATIONS_RADIATION_REGIMENINDICATION'
| nPatients | NO | YES |
|---|---|---|
| ALL | 25 | 29 |
| subtype1 | 7 | 7 |
| subtype2 | 7 | 3 |
| subtype3 | 2 | 5 |
| subtype4 | 5 | 2 |
| subtype5 | 4 | 12 |
Figure S11. Get High-res Image Clustering Approach #2: 'mRNA cHierClus subtypes' versus Clinical Feature #4: 'RADIATIONS_RADIATION_REGIMENINDICATION'
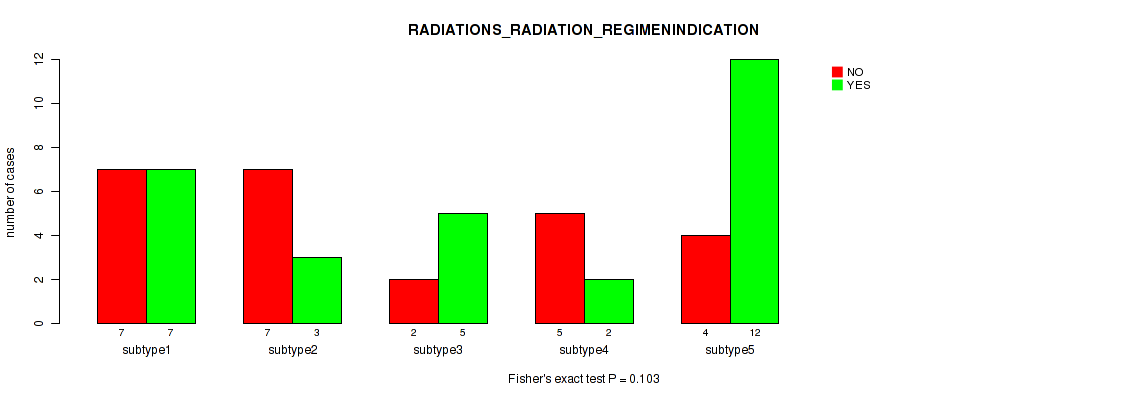
P value = 0.488 (Fisher's exact test), Q value = 0.58
Table S14. Clustering Approach #2: 'mRNA cHierClus subtypes' versus Clinical Feature #5: 'COMPLETENESS_OF_RESECTION'
| nPatients | R0 | R1 | R2 | RX |
|---|---|---|---|---|
| ALL | 41 | 4 | 2 | 1 |
| subtype1 | 11 | 1 | 0 | 1 |
| subtype2 | 9 | 0 | 1 | 0 |
| subtype3 | 4 | 1 | 1 | 0 |
| subtype4 | 4 | 1 | 0 | 0 |
| subtype5 | 13 | 1 | 0 | 0 |
Figure S12. Get High-res Image Clustering Approach #2: 'mRNA cHierClus subtypes' versus Clinical Feature #5: 'COMPLETENESS_OF_RESECTION'
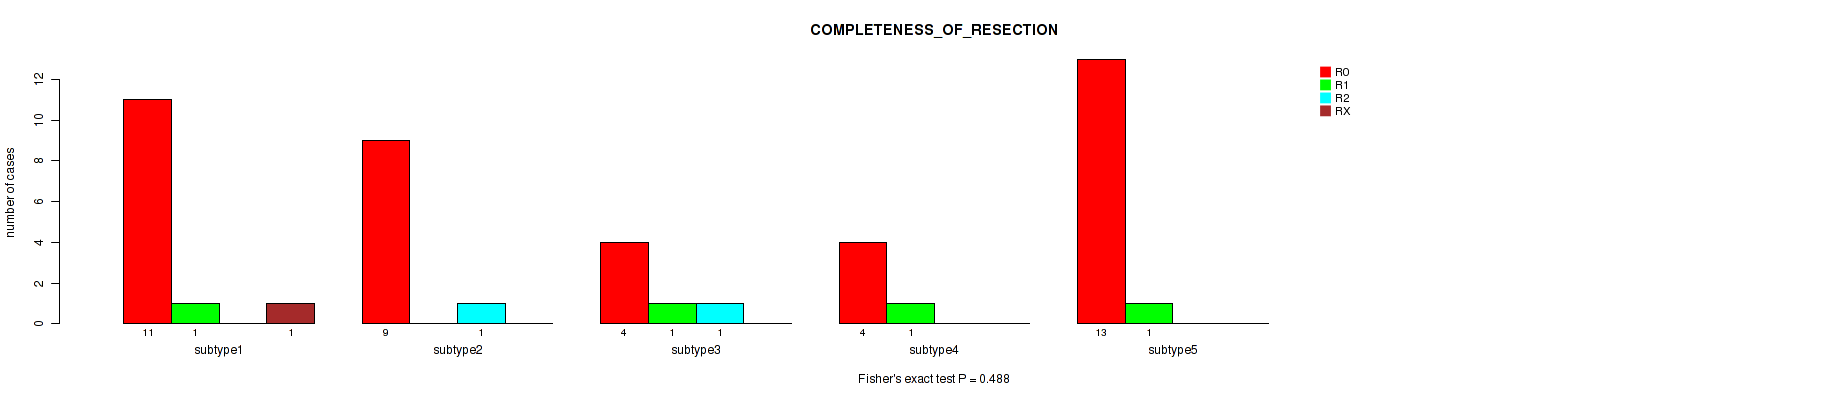
P value = 0.571 (Fisher's exact test), Q value = 0.65
Table S15. Clustering Approach #2: 'mRNA cHierClus subtypes' versus Clinical Feature #6: 'RACE'
| nPatients | AMERICAN INDIAN OR ALASKA NATIVE | ASIAN | BLACK OR AFRICAN AMERICAN | WHITE |
|---|---|---|---|---|
| ALL | 2 | 4 | 6 | 40 |
| subtype1 | 0 | 2 | 2 | 9 |
| subtype2 | 0 | 0 | 3 | 7 |
| subtype3 | 0 | 1 | 0 | 5 |
| subtype4 | 1 | 0 | 0 | 6 |
| subtype5 | 1 | 1 | 1 | 13 |
Figure S13. Get High-res Image Clustering Approach #2: 'mRNA cHierClus subtypes' versus Clinical Feature #6: 'RACE'
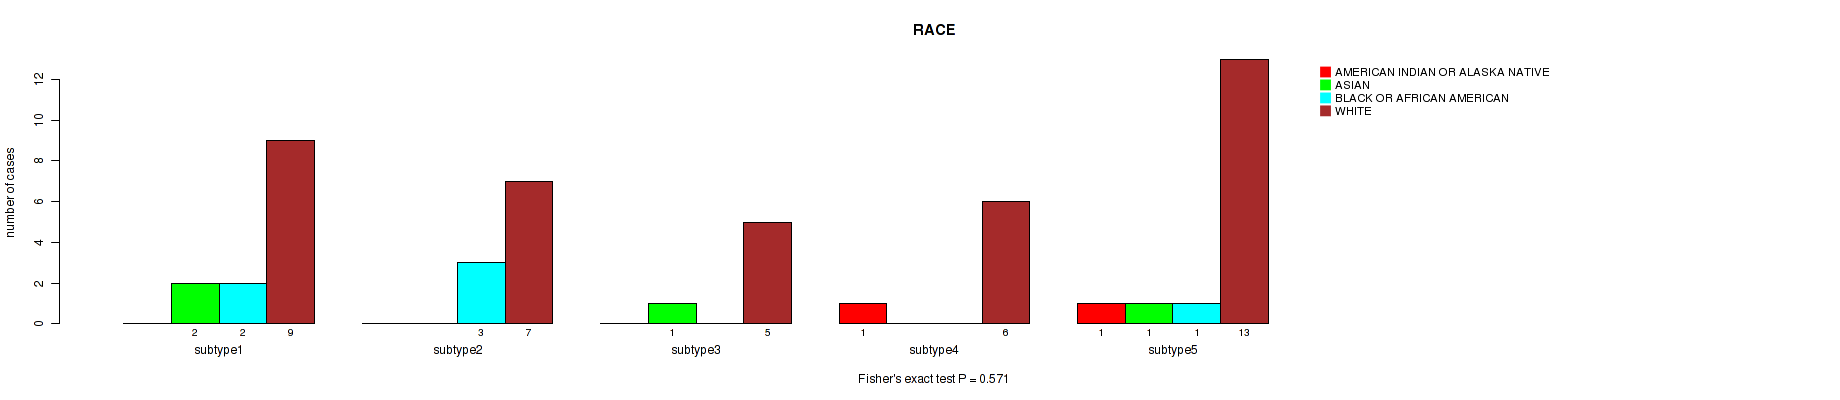
P value = 1 (Fisher's exact test), Q value = 1
Table S16. Clustering Approach #2: 'mRNA cHierClus subtypes' versus Clinical Feature #7: 'ETHNICITY'
| nPatients | HISPANIC OR LATINO | NOT HISPANIC OR LATINO |
|---|---|---|
| ALL | 2 | 24 |
| subtype1 | 1 | 9 |
| subtype2 | 0 | 2 |
| subtype3 | 1 | 5 |
| subtype4 | 0 | 2 |
| subtype5 | 0 | 6 |
Figure S14. Get High-res Image Clustering Approach #2: 'mRNA cHierClus subtypes' versus Clinical Feature #7: 'ETHNICITY'
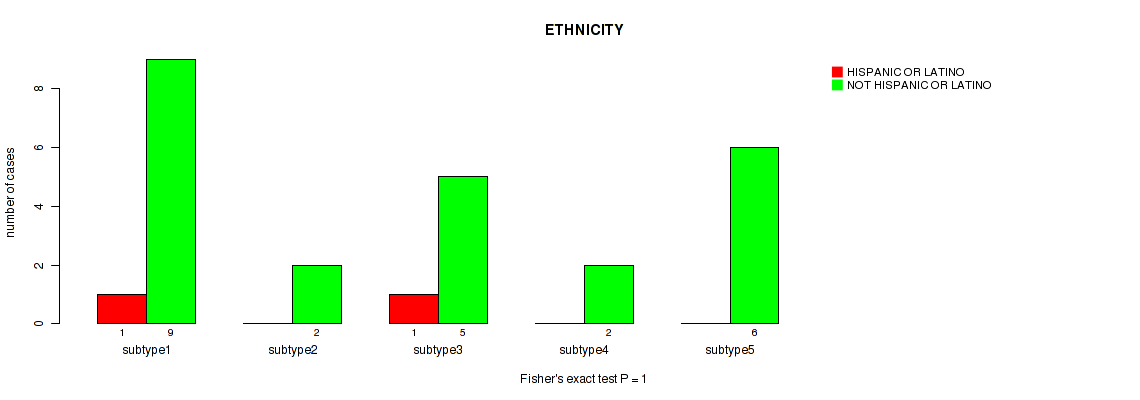
Table S17. Description of clustering approach #3: 'Copy Number Ratio CNMF subtypes'
| Cluster Labels | 1 | 2 | 3 | 4 | 5 |
|---|---|---|---|---|---|
| Number of samples | 164 | 299 | 19 | 9 | 37 |
P value = 2.19e-06 (logrank test), Q value = 3.7e-05
Table S18. Clustering Approach #3: 'Copy Number Ratio CNMF subtypes' versus Clinical Feature #1: 'Time to Death'
| nPatients | nDeath | Duration Range (Median), Month | |
|---|---|---|---|
| ALL | 526 | 69 | 0.1 - 191.8 (23.3) |
| subtype1 | 163 | 37 | 0.1 - 125.4 (21.2) |
| subtype2 | 298 | 22 | 0.2 - 191.8 (24.8) |
| subtype3 | 19 | 3 | 0.2 - 149.6 (30.8) |
| subtype4 | 9 | 0 | 8.6 - 60.5 (21.2) |
| subtype5 | 37 | 7 | 0.1 - 73.2 (17.9) |
Figure S15. Get High-res Image Clustering Approach #3: 'Copy Number Ratio CNMF subtypes' versus Clinical Feature #1: 'Time to Death'
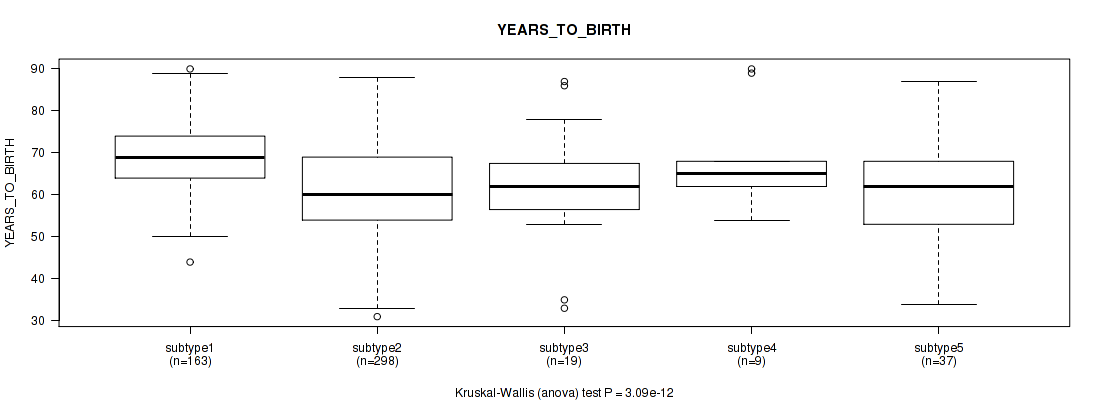
P value = 3.09e-12 (Kruskal-Wallis (anova)), Q value = 2.6e-10
Table S19. Clustering Approach #3: 'Copy Number Ratio CNMF subtypes' versus Clinical Feature #2: 'YEARS_TO_BIRTH'
| nPatients | Mean (Std.Dev) | |
|---|---|---|
| ALL | 526 | 64.0 (11.2) |
| subtype1 | 163 | 69.2 (8.4) |
| subtype2 | 298 | 61.4 (11.2) |
| subtype3 | 19 | 61.9 (13.8) |
| subtype4 | 9 | 68.1 (12.9) |
| subtype5 | 37 | 61.6 (12.8) |
Figure S16. Get High-res Image Clustering Approach #3: 'Copy Number Ratio CNMF subtypes' versus Clinical Feature #2: 'YEARS_TO_BIRTH'
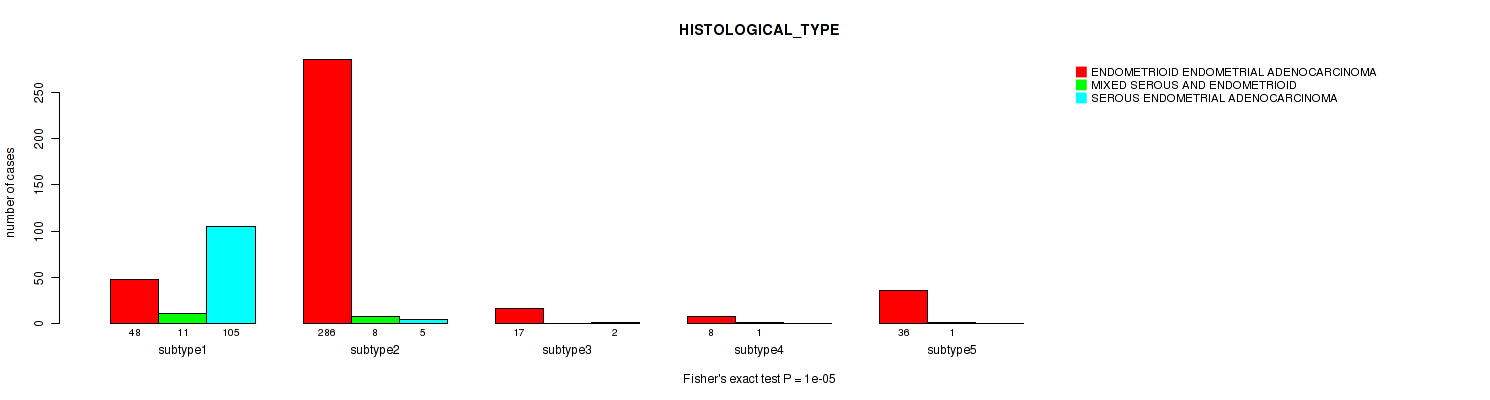
P value = 1e-05 (Fisher's exact test), Q value = 5.2e-05
Table S20. Clustering Approach #3: 'Copy Number Ratio CNMF subtypes' versus Clinical Feature #3: 'HISTOLOGICAL_TYPE'
| nPatients | ENDOMETRIOID ENDOMETRIAL ADENOCARCINOMA | MIXED SEROUS AND ENDOMETRIOID | SEROUS ENDOMETRIAL ADENOCARCINOMA |
|---|---|---|---|
| ALL | 395 | 21 | 112 |
| subtype1 | 48 | 11 | 105 |
| subtype2 | 286 | 8 | 5 |
| subtype3 | 17 | 0 | 2 |
| subtype4 | 8 | 1 | 0 |
| subtype5 | 36 | 1 | 0 |
Figure S17. Get High-res Image Clustering Approach #3: 'Copy Number Ratio CNMF subtypes' versus Clinical Feature #3: 'HISTOLOGICAL_TYPE'
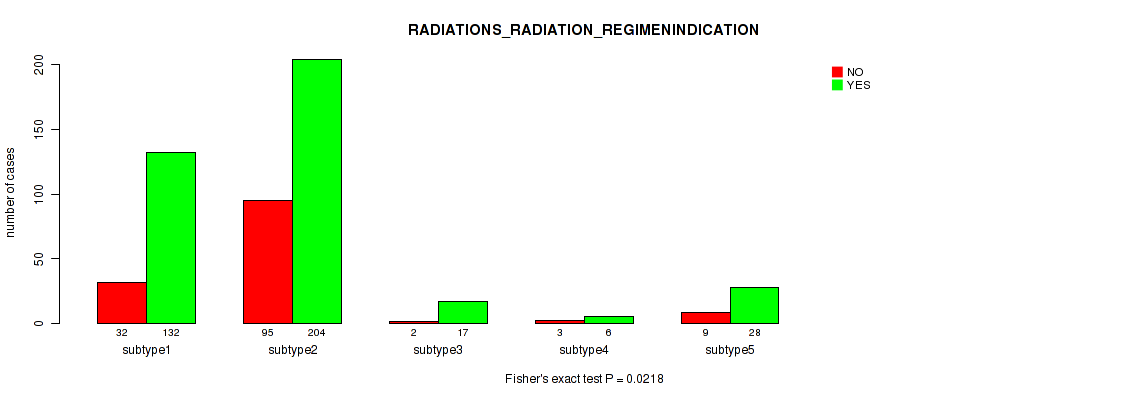
P value = 0.0218 (Fisher's exact test), Q value = 0.059
Table S21. Clustering Approach #3: 'Copy Number Ratio CNMF subtypes' versus Clinical Feature #4: 'RADIATIONS_RADIATION_REGIMENINDICATION'
| nPatients | NO | YES |
|---|---|---|
| ALL | 141 | 387 |
| subtype1 | 32 | 132 |
| subtype2 | 95 | 204 |
| subtype3 | 2 | 17 |
| subtype4 | 3 | 6 |
| subtype5 | 9 | 28 |
Figure S18. Get High-res Image Clustering Approach #3: 'Copy Number Ratio CNMF subtypes' versus Clinical Feature #4: 'RADIATIONS_RADIATION_REGIMENINDICATION'
P value = 0.313 (Fisher's exact test), Q value = 0.4
Table S22. Clustering Approach #3: 'Copy Number Ratio CNMF subtypes' versus Clinical Feature #5: 'COMPLETENESS_OF_RESECTION'
| nPatients | R0 | R1 | R2 | RX |
|---|---|---|---|---|
| ALL | 363 | 23 | 17 | 35 |
| subtype1 | 103 | 9 | 10 | 14 |
| subtype2 | 211 | 14 | 5 | 19 |
| subtype3 | 12 | 0 | 1 | 1 |
| subtype4 | 9 | 0 | 0 | 0 |
| subtype5 | 28 | 0 | 1 | 1 |
Figure S19. Get High-res Image Clustering Approach #3: 'Copy Number Ratio CNMF subtypes' versus Clinical Feature #5: 'COMPLETENESS_OF_RESECTION'

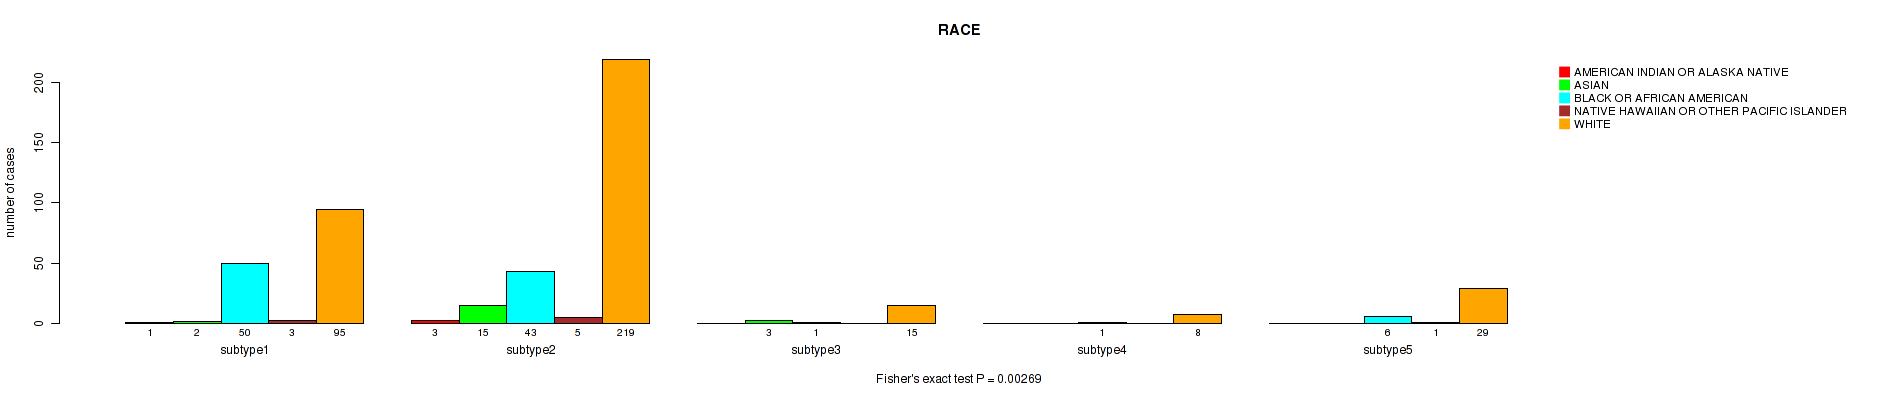
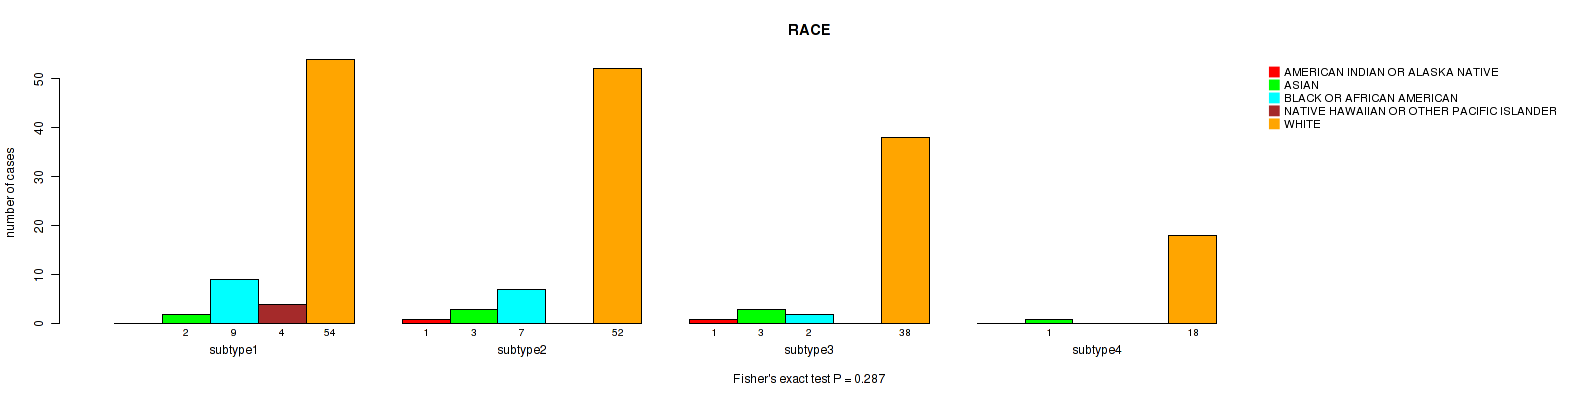
P value = 0.00269 (Fisher's exact test), Q value = 0.0084
Table S23. Clustering Approach #3: 'Copy Number Ratio CNMF subtypes' versus Clinical Feature #6: 'RACE'
| nPatients | AMERICAN INDIAN OR ALASKA NATIVE | ASIAN | BLACK OR AFRICAN AMERICAN | NATIVE HAWAIIAN OR OTHER PACIFIC ISLANDER | WHITE |
|---|---|---|---|---|---|
| ALL | 4 | 20 | 101 | 9 | 366 |
| subtype1 | 1 | 2 | 50 | 3 | 95 |
| subtype2 | 3 | 15 | 43 | 5 | 219 |
| subtype3 | 0 | 3 | 1 | 0 | 15 |
| subtype4 | 0 | 0 | 1 | 0 | 8 |
| subtype5 | 0 | 0 | 6 | 1 | 29 |
Figure S20. Get High-res Image Clustering Approach #3: 'Copy Number Ratio CNMF subtypes' versus Clinical Feature #6: 'RACE'
P value = 0.794 (Fisher's exact test), Q value = 0.85
Table S24. Clustering Approach #3: 'Copy Number Ratio CNMF subtypes' versus Clinical Feature #7: 'ETHNICITY'
| nPatients | HISPANIC OR LATINO | NOT HISPANIC OR LATINO |
|---|---|---|
| ALL | 14 | 367 |
| subtype1 | 6 | 112 |
| subtype2 | 8 | 201 |
| subtype3 | 0 | 15 |
| subtype4 | 0 | 9 |
| subtype5 | 0 | 30 |
Figure S21. Get High-res Image Clustering Approach #3: 'Copy Number Ratio CNMF subtypes' versus Clinical Feature #7: 'ETHNICITY'
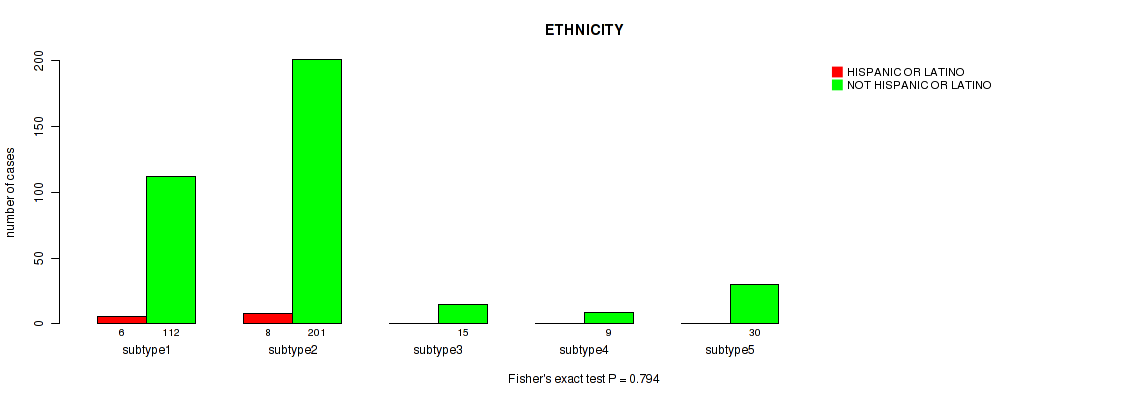
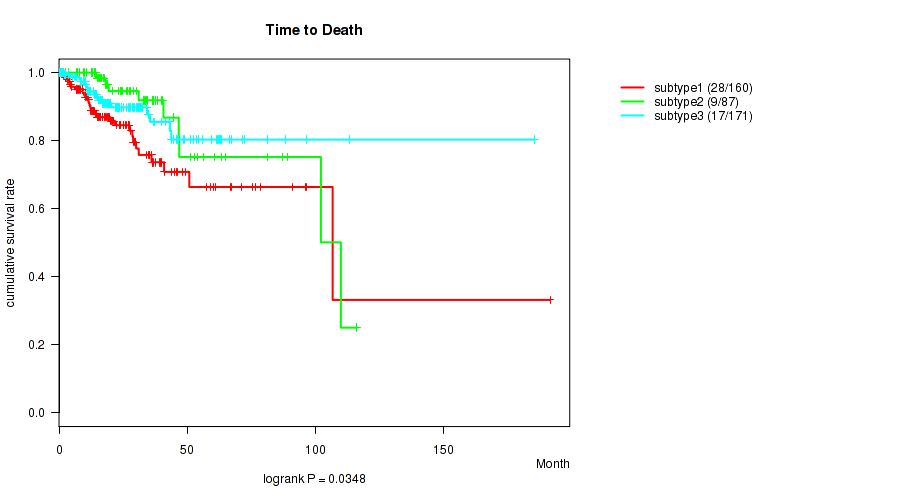
Table S25. Description of clustering approach #4: 'METHLYATION CNMF'
| Cluster Labels | 1 | 2 | 3 |
|---|---|---|---|
| Number of samples | 162 | 87 | 171 |
P value = 0.0348 (logrank test), Q value = 0.084
Table S26. Clustering Approach #4: 'METHLYATION CNMF' versus Clinical Feature #1: 'Time to Death'
| nPatients | nDeath | Duration Range (Median), Month | |
|---|---|---|---|
| ALL | 418 | 54 | 0.1 - 191.8 (19.4) |
| subtype1 | 160 | 28 | 0.1 - 191.8 (18.8) |
| subtype2 | 87 | 9 | 0.3 - 116.2 (24.3) |
| subtype3 | 171 | 17 | 0.1 - 185.8 (18.9) |
Figure S22. Get High-res Image Clustering Approach #4: 'METHLYATION CNMF' versus Clinical Feature #1: 'Time to Death'
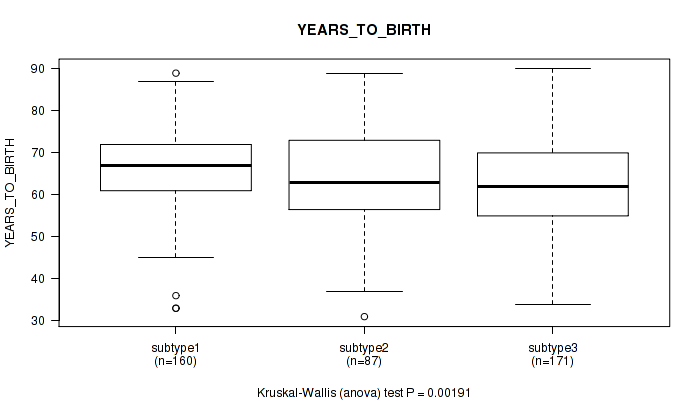
P value = 0.00191 (Kruskal-Wallis (anova)), Q value = 0.0062
Table S27. Clustering Approach #4: 'METHLYATION CNMF' versus Clinical Feature #2: 'YEARS_TO_BIRTH'
| nPatients | Mean (Std.Dev) | |
|---|---|---|
| ALL | 418 | 64.2 (11.2) |
| subtype1 | 160 | 66.3 (10.1) |
| subtype2 | 87 | 63.2 (12.3) |
| subtype3 | 171 | 62.7 (11.4) |
Figure S23. Get High-res Image Clustering Approach #4: 'METHLYATION CNMF' versus Clinical Feature #2: 'YEARS_TO_BIRTH'
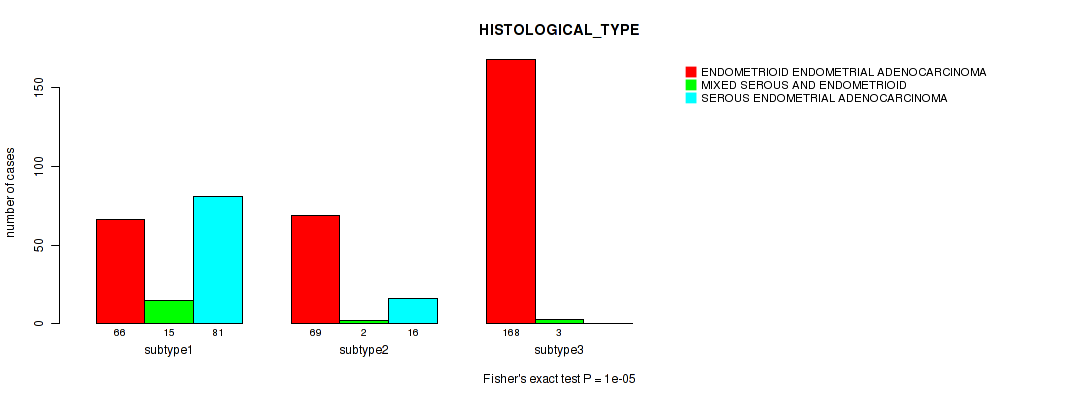
P value = 1e-05 (Fisher's exact test), Q value = 5.2e-05
Table S28. Clustering Approach #4: 'METHLYATION CNMF' versus Clinical Feature #3: 'HISTOLOGICAL_TYPE'
| nPatients | ENDOMETRIOID ENDOMETRIAL ADENOCARCINOMA | MIXED SEROUS AND ENDOMETRIOID | SEROUS ENDOMETRIAL ADENOCARCINOMA |
|---|---|---|---|
| ALL | 303 | 20 | 97 |
| subtype1 | 66 | 15 | 81 |
| subtype2 | 69 | 2 | 16 |
| subtype3 | 168 | 3 | 0 |
Figure S24. Get High-res Image Clustering Approach #4: 'METHLYATION CNMF' versus Clinical Feature #3: 'HISTOLOGICAL_TYPE'
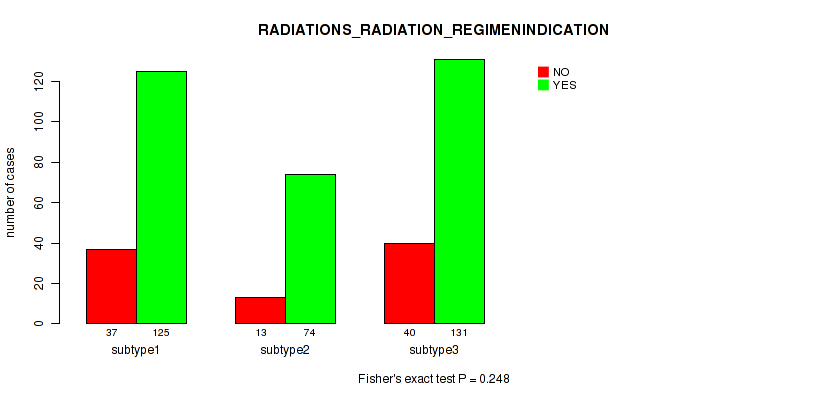
P value = 0.248 (Fisher's exact test), Q value = 0.35
Table S29. Clustering Approach #4: 'METHLYATION CNMF' versus Clinical Feature #4: 'RADIATIONS_RADIATION_REGIMENINDICATION'
| nPatients | NO | YES |
|---|---|---|
| ALL | 90 | 330 |
| subtype1 | 37 | 125 |
| subtype2 | 13 | 74 |
| subtype3 | 40 | 131 |
Figure S25. Get High-res Image Clustering Approach #4: 'METHLYATION CNMF' versus Clinical Feature #4: 'RADIATIONS_RADIATION_REGIMENINDICATION'
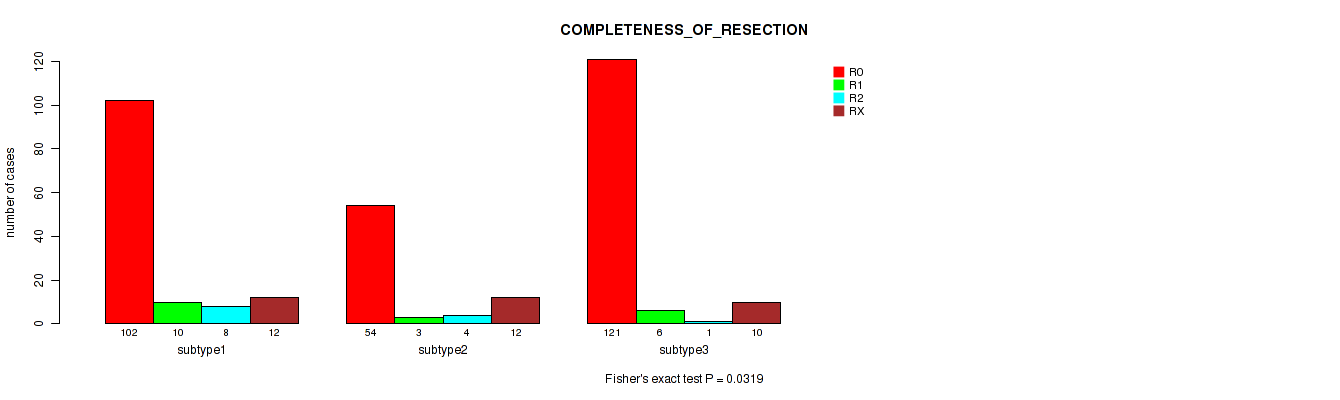
P value = 0.0319 (Fisher's exact test), Q value = 0.079
Table S30. Clustering Approach #4: 'METHLYATION CNMF' versus Clinical Feature #5: 'COMPLETENESS_OF_RESECTION'
| nPatients | R0 | R1 | R2 | RX |
|---|---|---|---|---|
| ALL | 277 | 19 | 13 | 34 |
| subtype1 | 102 | 10 | 8 | 12 |
| subtype2 | 54 | 3 | 4 | 12 |
| subtype3 | 121 | 6 | 1 | 10 |
Figure S26. Get High-res Image Clustering Approach #4: 'METHLYATION CNMF' versus Clinical Feature #5: 'COMPLETENESS_OF_RESECTION'
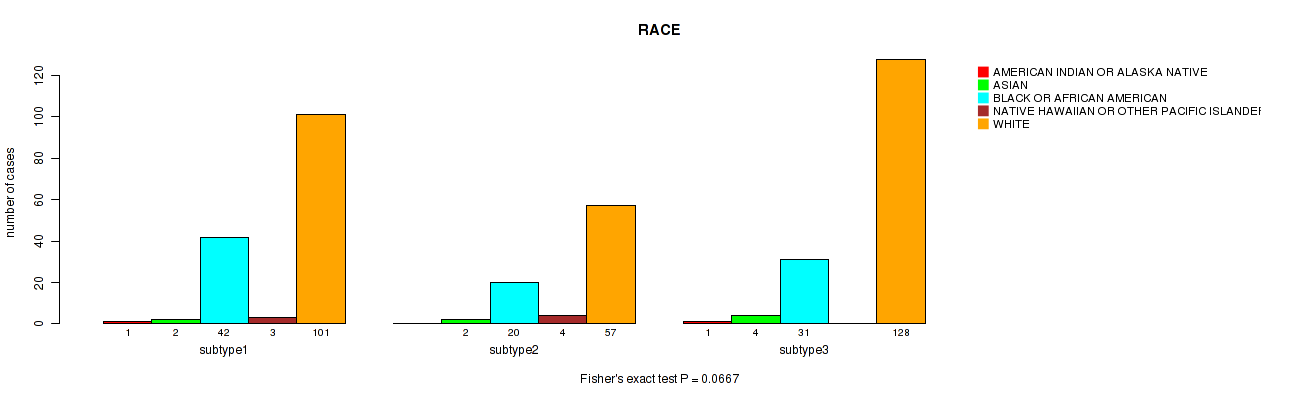
P value = 0.0667 (Fisher's exact test), Q value = 0.14
Table S31. Clustering Approach #4: 'METHLYATION CNMF' versus Clinical Feature #6: 'RACE'
| nPatients | AMERICAN INDIAN OR ALASKA NATIVE | ASIAN | BLACK OR AFRICAN AMERICAN | NATIVE HAWAIIAN OR OTHER PACIFIC ISLANDER | WHITE |
|---|---|---|---|---|---|
| ALL | 2 | 8 | 93 | 7 | 286 |
| subtype1 | 1 | 2 | 42 | 3 | 101 |
| subtype2 | 0 | 2 | 20 | 4 | 57 |
| subtype3 | 1 | 4 | 31 | 0 | 128 |
Figure S27. Get High-res Image Clustering Approach #4: 'METHLYATION CNMF' versus Clinical Feature #6: 'RACE'
P value = 0.483 (Fisher's exact test), Q value = 0.58
Table S32. Clustering Approach #4: 'METHLYATION CNMF' versus Clinical Feature #7: 'ETHNICITY'
| nPatients | HISPANIC OR LATINO | NOT HISPANIC OR LATINO |
|---|---|---|
| ALL | 11 | 304 |
| subtype1 | 6 | 114 |
| subtype2 | 1 | 64 |
| subtype3 | 4 | 126 |
Figure S28. Get High-res Image Clustering Approach #4: 'METHLYATION CNMF' versus Clinical Feature #7: 'ETHNICITY'
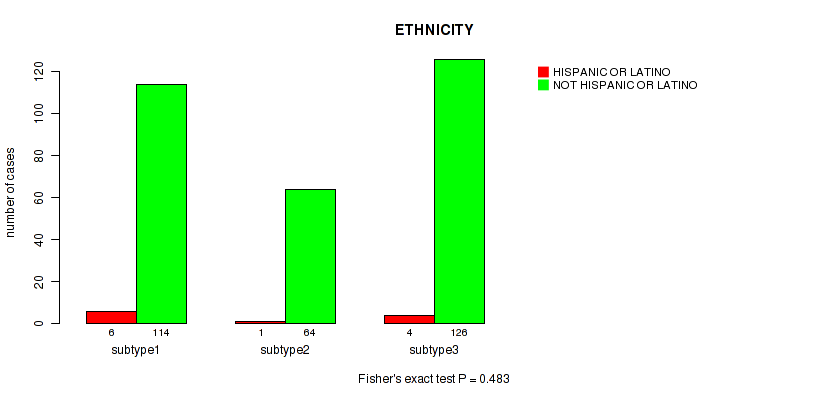
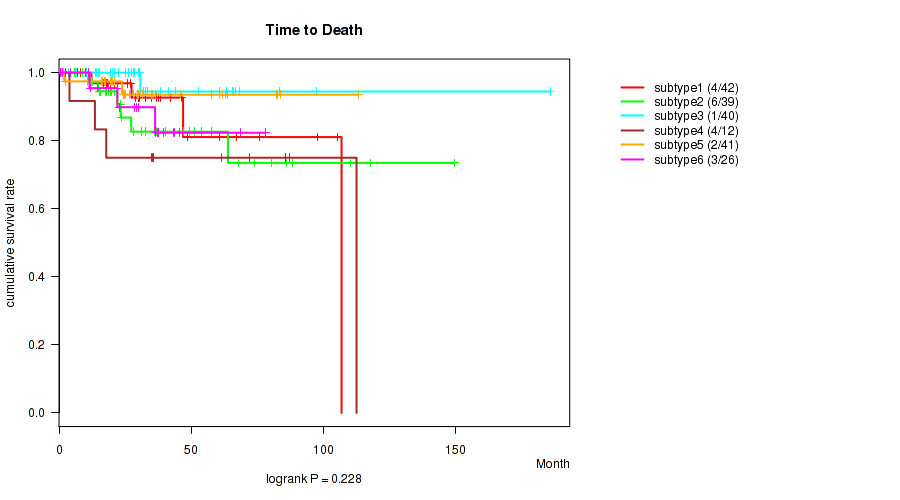
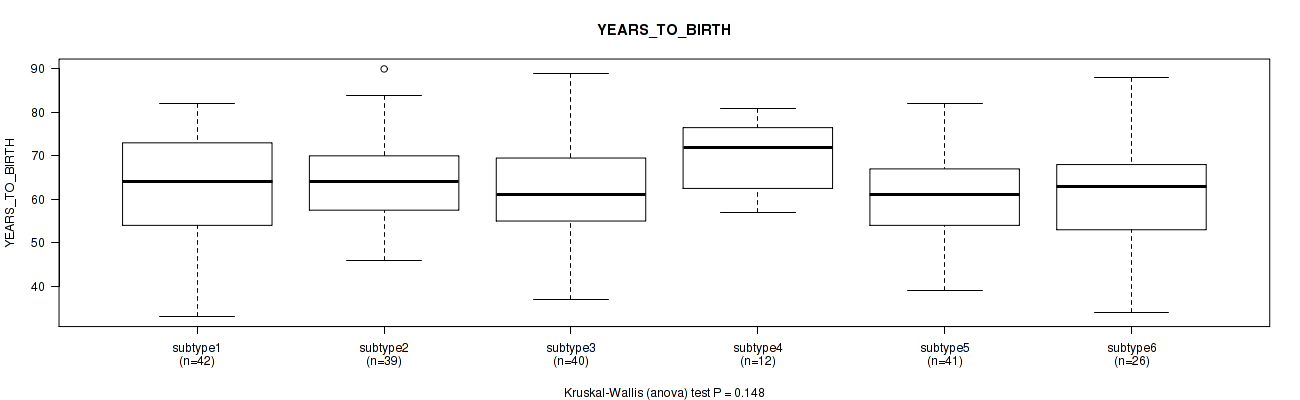
Table S33. Description of clustering approach #5: 'RPPA CNMF subtypes'
| Cluster Labels | 1 | 2 | 3 | 4 | 5 | 6 |
|---|---|---|---|---|---|---|
| Number of samples | 42 | 39 | 40 | 12 | 41 | 26 |
P value = 0.228 (logrank test), Q value = 0.34
Table S34. Clustering Approach #5: 'RPPA CNMF subtypes' versus Clinical Feature #1: 'Time to Death'
| nPatients | nDeath | Duration Range (Median), Month | |
|---|---|---|---|
| ALL | 200 | 20 | 0.6 - 185.8 (29.5) |
| subtype1 | 42 | 4 | 0.6 - 106.9 (29.5) |
| subtype2 | 39 | 6 | 6.0 - 149.6 (28.1) |
| subtype3 | 40 | 1 | 1.8 - 185.8 (30.0) |
| subtype4 | 12 | 4 | 4.0 - 112.5 (48.8) |
| subtype5 | 41 | 2 | 0.7 - 113.4 (25.1) |
| subtype6 | 26 | 3 | 0.7 - 78.2 (29.6) |
Figure S29. Get High-res Image Clustering Approach #5: 'RPPA CNMF subtypes' versus Clinical Feature #1: 'Time to Death'
P value = 0.148 (Kruskal-Wallis (anova)), Q value = 0.24
Table S35. Clustering Approach #5: 'RPPA CNMF subtypes' versus Clinical Feature #2: 'YEARS_TO_BIRTH'
| nPatients | Mean (Std.Dev) | |
|---|---|---|
| ALL | 200 | 62.7 (11.1) |
| subtype1 | 42 | 62.3 (12.7) |
| subtype2 | 39 | 64.2 (9.6) |
| subtype3 | 40 | 62.2 (11.2) |
| subtype4 | 12 | 69.8 (8.5) |
| subtype5 | 41 | 60.7 (9.4) |
| subtype6 | 26 | 62.0 (12.8) |
Figure S30. Get High-res Image Clustering Approach #5: 'RPPA CNMF subtypes' versus Clinical Feature #2: 'YEARS_TO_BIRTH'
P value = 3e-05 (Fisher's exact test), Q value = 0.00015
Table S36. Clustering Approach #5: 'RPPA CNMF subtypes' versus Clinical Feature #3: 'HISTOLOGICAL_TYPE'
| nPatients | ENDOMETRIOID ENDOMETRIAL ADENOCARCINOMA | MIXED SEROUS AND ENDOMETRIOID | SEROUS ENDOMETRIAL ADENOCARCINOMA |
|---|---|---|---|
| ALL | 174 | 3 | 23 |
| subtype1 | 35 | 1 | 6 |
| subtype2 | 28 | 0 | 11 |
| subtype3 | 39 | 1 | 0 |
| subtype4 | 12 | 0 | 0 |
| subtype5 | 41 | 0 | 0 |
| subtype6 | 19 | 1 | 6 |
Figure S31. Get High-res Image Clustering Approach #5: 'RPPA CNMF subtypes' versus Clinical Feature #3: 'HISTOLOGICAL_TYPE'
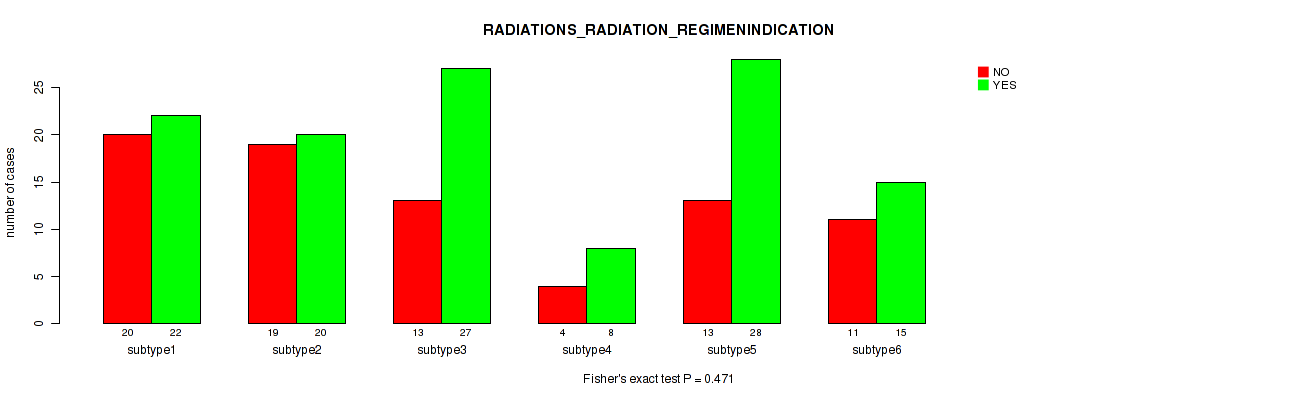
P value = 0.471 (Fisher's exact test), Q value = 0.58
Table S37. Clustering Approach #5: 'RPPA CNMF subtypes' versus Clinical Feature #4: 'RADIATIONS_RADIATION_REGIMENINDICATION'
| nPatients | NO | YES |
|---|---|---|
| ALL | 80 | 120 |
| subtype1 | 20 | 22 |
| subtype2 | 19 | 20 |
| subtype3 | 13 | 27 |
| subtype4 | 4 | 8 |
| subtype5 | 13 | 28 |
| subtype6 | 11 | 15 |
Figure S32. Get High-res Image Clustering Approach #5: 'RPPA CNMF subtypes' versus Clinical Feature #4: 'RADIATIONS_RADIATION_REGIMENINDICATION'
P value = 0.113 (Fisher's exact test), Q value = 0.19
Table S38. Clustering Approach #5: 'RPPA CNMF subtypes' versus Clinical Feature #5: 'COMPLETENESS_OF_RESECTION'
| nPatients | R0 | R1 | R2 | RX |
|---|---|---|---|---|
| ALL | 143 | 7 | 5 | 16 |
| subtype1 | 24 | 3 | 3 | 6 |
| subtype2 | 29 | 1 | 1 | 2 |
| subtype3 | 26 | 0 | 0 | 5 |
| subtype4 | 10 | 1 | 1 | 0 |
| subtype5 | 32 | 2 | 0 | 1 |
| subtype6 | 22 | 0 | 0 | 2 |
Figure S33. Get High-res Image Clustering Approach #5: 'RPPA CNMF subtypes' versus Clinical Feature #5: 'COMPLETENESS_OF_RESECTION'
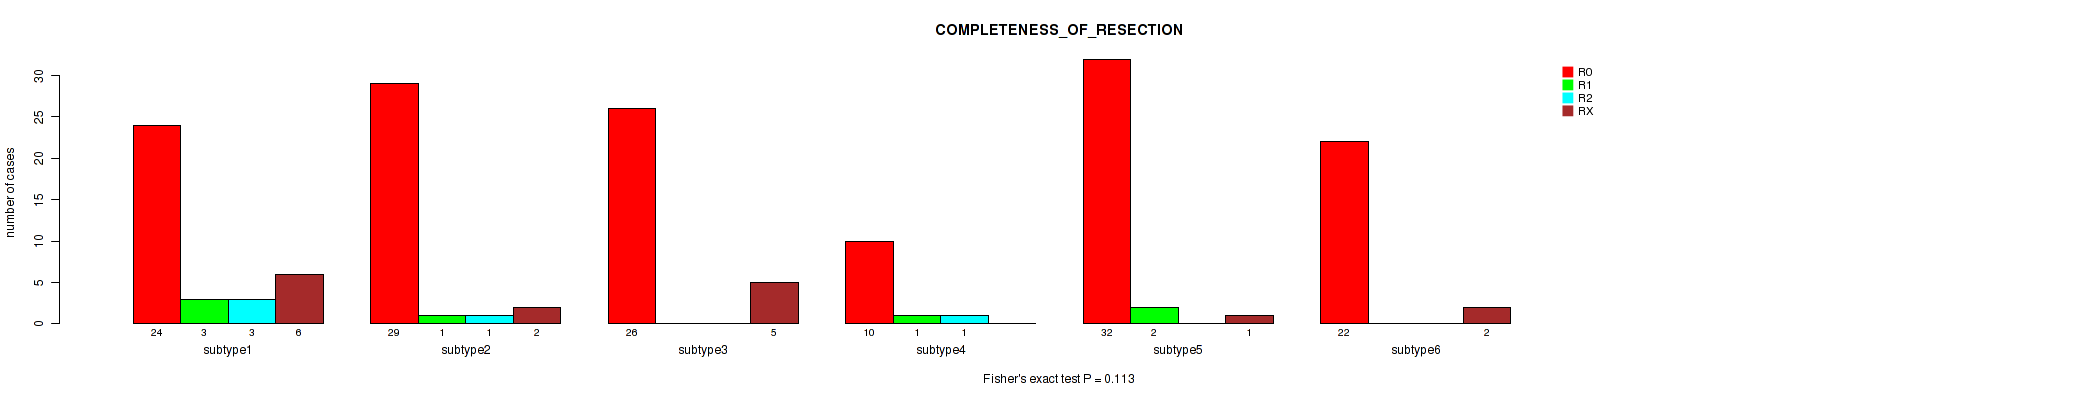
P value = 0.0727 (Fisher's exact test), Q value = 0.15
Table S39. Clustering Approach #5: 'RPPA CNMF subtypes' versus Clinical Feature #6: 'RACE'
| nPatients | AMERICAN INDIAN OR ALASKA NATIVE | ASIAN | BLACK OR AFRICAN AMERICAN | NATIVE HAWAIIAN OR OTHER PACIFIC ISLANDER | WHITE |
|---|---|---|---|---|---|
| ALL | 2 | 9 | 18 | 4 | 162 |
| subtype1 | 0 | 1 | 6 | 2 | 30 |
| subtype2 | 0 | 3 | 6 | 1 | 28 |
| subtype3 | 0 | 0 | 2 | 0 | 38 |
| subtype4 | 1 | 2 | 1 | 0 | 8 |
| subtype5 | 1 | 2 | 3 | 1 | 33 |
| subtype6 | 0 | 1 | 0 | 0 | 25 |
Figure S34. Get High-res Image Clustering Approach #5: 'RPPA CNMF subtypes' versus Clinical Feature #6: 'RACE'
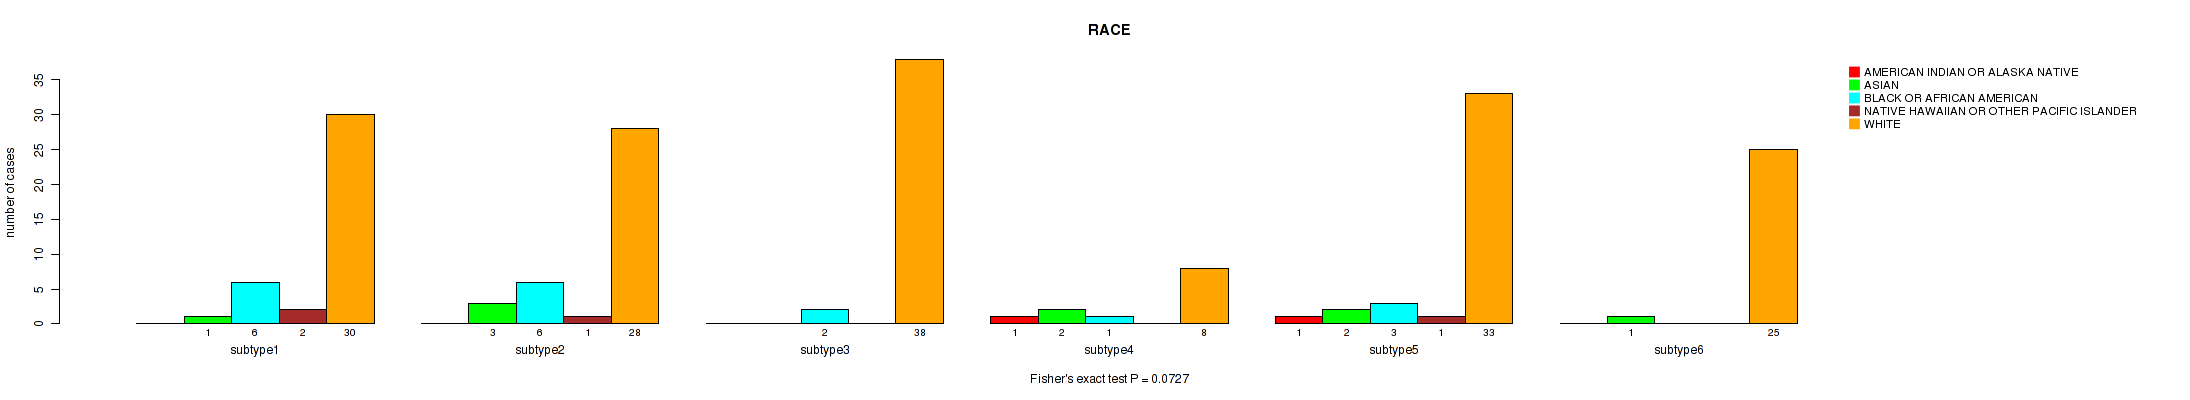
P value = 0.478 (Fisher's exact test), Q value = 0.58
Table S40. Clustering Approach #5: 'RPPA CNMF subtypes' versus Clinical Feature #7: 'ETHNICITY'
| nPatients | HISPANIC OR LATINO | NOT HISPANIC OR LATINO |
|---|---|---|
| ALL | 5 | 135 |
| subtype1 | 2 | 29 |
| subtype2 | 2 | 21 |
| subtype3 | 0 | 30 |
| subtype4 | 0 | 10 |
| subtype5 | 1 | 23 |
| subtype6 | 0 | 22 |
Figure S35. Get High-res Image Clustering Approach #5: 'RPPA CNMF subtypes' versus Clinical Feature #7: 'ETHNICITY'
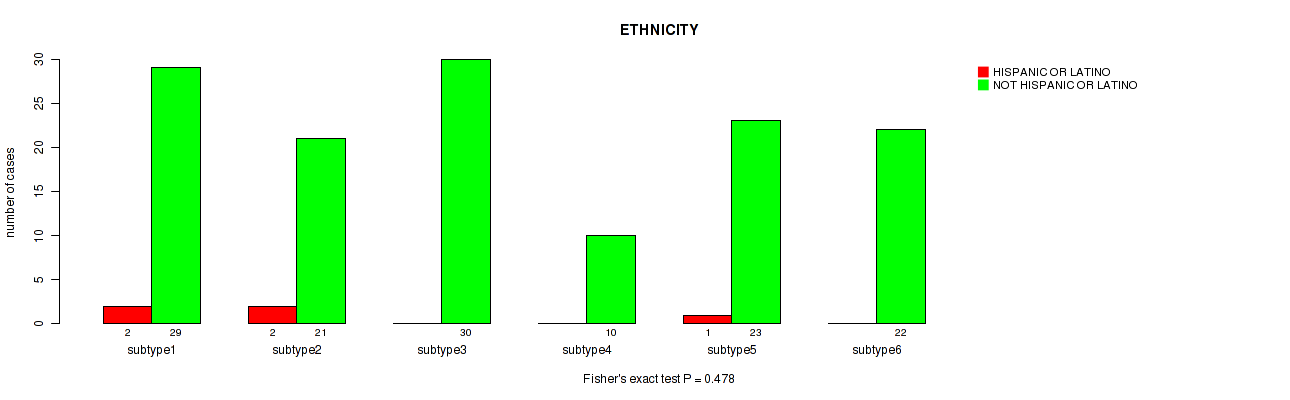
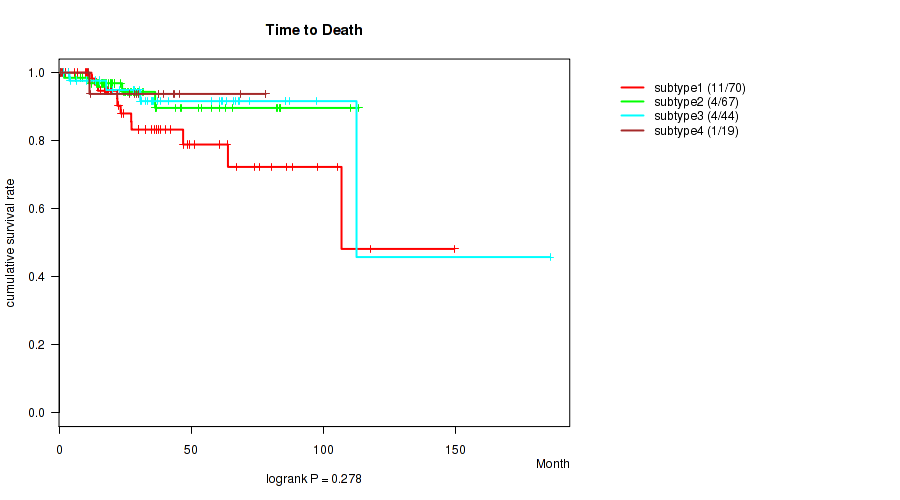
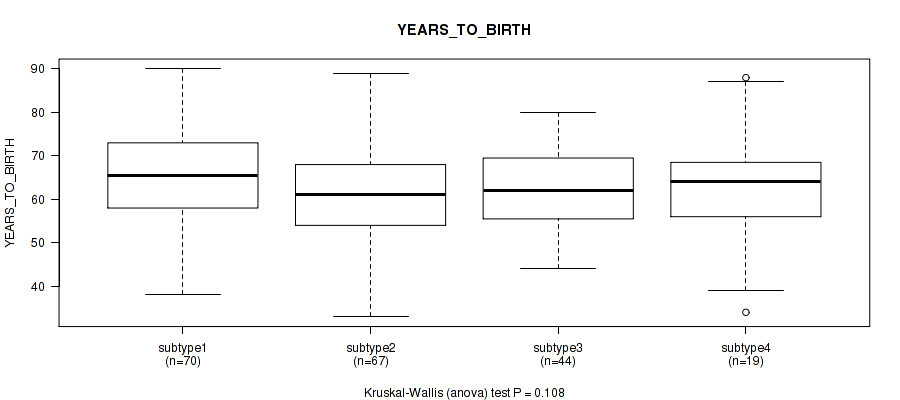
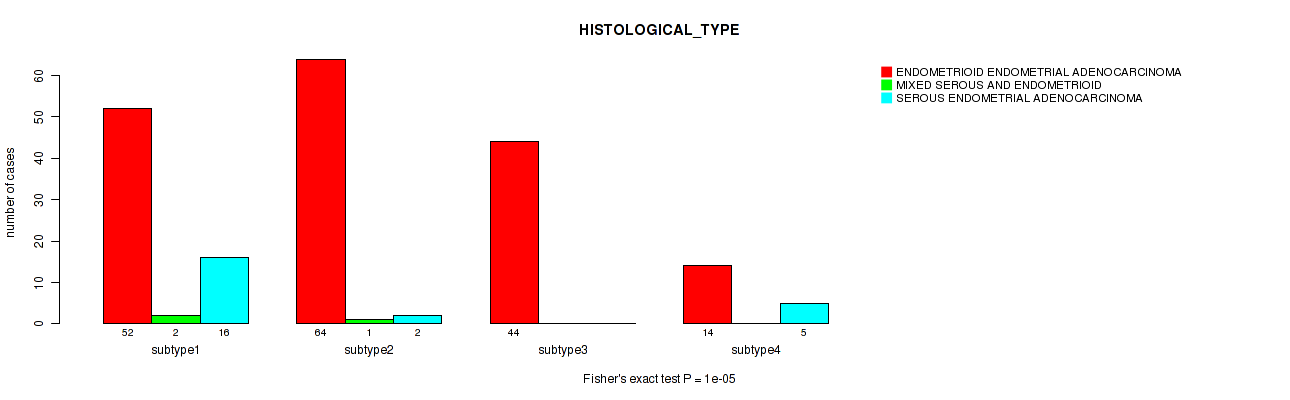
Table S41. Description of clustering approach #6: 'RPPA cHierClus subtypes'
| Cluster Labels | 1 | 2 | 3 | 4 |
|---|---|---|---|---|
| Number of samples | 70 | 67 | 44 | 19 |
P value = 0.278 (logrank test), Q value = 0.38
Table S42. Clustering Approach #6: 'RPPA cHierClus subtypes' versus Clinical Feature #1: 'Time to Death'
| nPatients | nDeath | Duration Range (Median), Month | |
|---|---|---|---|
| ALL | 200 | 20 | 0.6 - 185.8 (29.5) |
| subtype1 | 70 | 11 | 0.6 - 149.6 (28.6) |
| subtype2 | 67 | 4 | 0.7 - 113.4 (25.1) |
| subtype3 | 44 | 4 | 1.8 - 185.8 (35.1) |
| subtype4 | 19 | 1 | 0.7 - 78.2 (29.9) |
Figure S36. Get High-res Image Clustering Approach #6: 'RPPA cHierClus subtypes' versus Clinical Feature #1: 'Time to Death'
P value = 0.108 (Kruskal-Wallis (anova)), Q value = 0.19
Table S43. Clustering Approach #6: 'RPPA cHierClus subtypes' versus Clinical Feature #2: 'YEARS_TO_BIRTH'
| nPatients | Mean (Std.Dev) | |
|---|---|---|
| ALL | 200 | 62.7 (11.1) |
| subtype1 | 70 | 64.9 (11.2) |
| subtype2 | 67 | 60.1 (10.9) |
| subtype3 | 44 | 62.9 (9.2) |
| subtype4 | 19 | 63.4 (13.8) |
Figure S37. Get High-res Image Clustering Approach #6: 'RPPA cHierClus subtypes' versus Clinical Feature #2: 'YEARS_TO_BIRTH'
P value = 1e-05 (Fisher's exact test), Q value = 5.2e-05
Table S44. Clustering Approach #6: 'RPPA cHierClus subtypes' versus Clinical Feature #3: 'HISTOLOGICAL_TYPE'
| nPatients | ENDOMETRIOID ENDOMETRIAL ADENOCARCINOMA | MIXED SEROUS AND ENDOMETRIOID | SEROUS ENDOMETRIAL ADENOCARCINOMA |
|---|---|---|---|
| ALL | 174 | 3 | 23 |
| subtype1 | 52 | 2 | 16 |
| subtype2 | 64 | 1 | 2 |
| subtype3 | 44 | 0 | 0 |
| subtype4 | 14 | 0 | 5 |
Figure S38. Get High-res Image Clustering Approach #6: 'RPPA cHierClus subtypes' versus Clinical Feature #3: 'HISTOLOGICAL_TYPE'
P value = 0.983 (Fisher's exact test), Q value = 1
Table S45. Clustering Approach #6: 'RPPA cHierClus subtypes' versus Clinical Feature #4: 'RADIATIONS_RADIATION_REGIMENINDICATION'
| nPatients | NO | YES |
|---|---|---|
| ALL | 80 | 120 |
| subtype1 | 29 | 41 |
| subtype2 | 26 | 41 |
| subtype3 | 17 | 27 |
| subtype4 | 8 | 11 |
Figure S39. Get High-res Image Clustering Approach #6: 'RPPA cHierClus subtypes' versus Clinical Feature #4: 'RADIATIONS_RADIATION_REGIMENINDICATION'
P value = 0.107 (Fisher's exact test), Q value = 0.19
Table S46. Clustering Approach #6: 'RPPA cHierClus subtypes' versus Clinical Feature #5: 'COMPLETENESS_OF_RESECTION'
| nPatients | R0 | R1 | R2 | RX |
|---|---|---|---|---|
| ALL | 143 | 7 | 5 | 16 |
| subtype1 | 43 | 4 | 5 | 9 |
| subtype2 | 50 | 1 | 0 | 3 |
| subtype3 | 34 | 2 | 0 | 3 |
| subtype4 | 16 | 0 | 0 | 1 |
Figure S40. Get High-res Image Clustering Approach #6: 'RPPA cHierClus subtypes' versus Clinical Feature #5: 'COMPLETENESS_OF_RESECTION'

P value = 0.287 (Fisher's exact test), Q value = 0.38
Table S47. Clustering Approach #6: 'RPPA cHierClus subtypes' versus Clinical Feature #6: 'RACE'
| nPatients | AMERICAN INDIAN OR ALASKA NATIVE | ASIAN | BLACK OR AFRICAN AMERICAN | NATIVE HAWAIIAN OR OTHER PACIFIC ISLANDER | WHITE |
|---|---|---|---|---|---|
| ALL | 2 | 9 | 18 | 4 | 162 |
| subtype1 | 0 | 2 | 9 | 4 | 54 |
| subtype2 | 1 | 3 | 7 | 0 | 52 |
| subtype3 | 1 | 3 | 2 | 0 | 38 |
| subtype4 | 0 | 1 | 0 | 0 | 18 |
Figure S41. Get High-res Image Clustering Approach #6: 'RPPA cHierClus subtypes' versus Clinical Feature #6: 'RACE'
P value = 0.498 (Fisher's exact test), Q value = 0.58
Table S48. Clustering Approach #6: 'RPPA cHierClus subtypes' versus Clinical Feature #7: 'ETHNICITY'
| nPatients | HISPANIC OR LATINO | NOT HISPANIC OR LATINO |
|---|---|---|
| ALL | 5 | 135 |
| subtype1 | 3 | 46 |
| subtype2 | 2 | 37 |
| subtype3 | 0 | 37 |
| subtype4 | 0 | 15 |
Figure S42. Get High-res Image Clustering Approach #6: 'RPPA cHierClus subtypes' versus Clinical Feature #7: 'ETHNICITY'
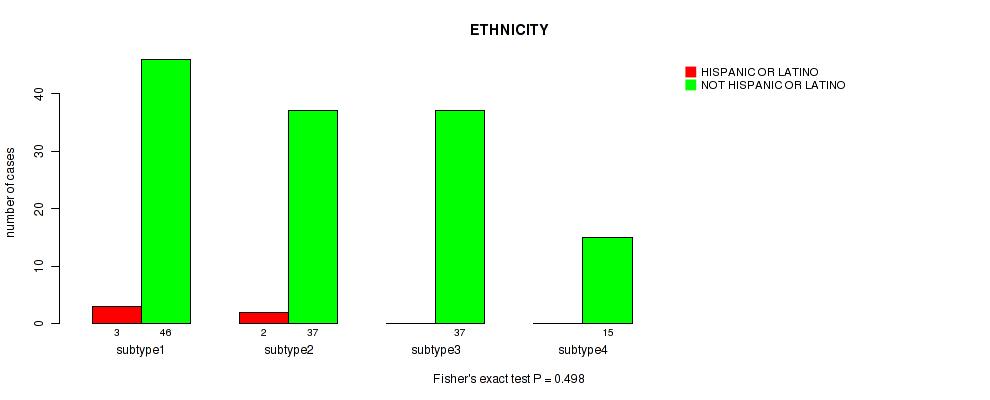
Table S49. Description of clustering approach #7: 'RNAseq CNMF subtypes'
| Cluster Labels | 1 | 2 | 3 |
|---|---|---|---|
| Number of samples | 230 | 151 | 153 |
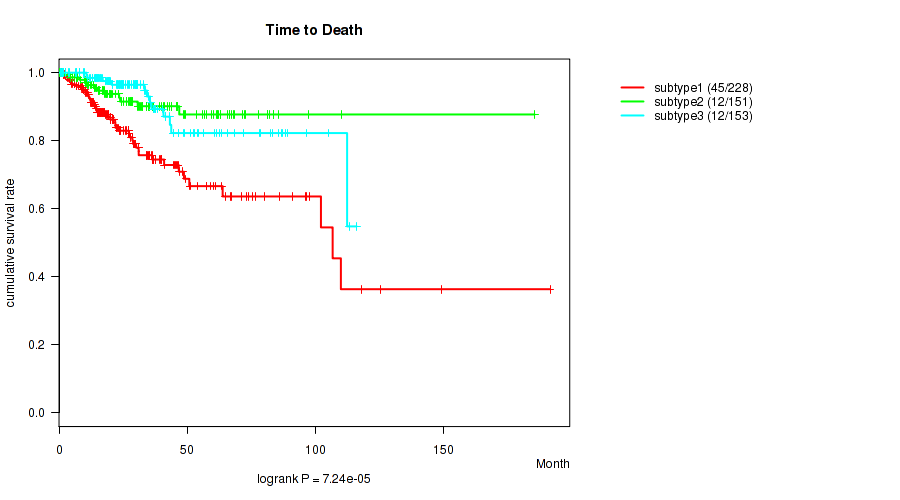
P value = 7.24e-05 (logrank test), Q value = 0.00032
Table S50. Clustering Approach #7: 'RNAseq CNMF subtypes' versus Clinical Feature #1: 'Time to Death'
| nPatients | nDeath | Duration Range (Median), Month | |
|---|---|---|---|
| ALL | 532 | 69 | 0.1 - 191.8 (23.3) |
| subtype1 | 228 | 45 | 0.1 - 191.8 (20.1) |
| subtype2 | 151 | 12 | 0.1 - 185.8 (27.2) |
| subtype3 | 153 | 12 | 0.4 - 116.2 (24.9) |
Figure S43. Get High-res Image Clustering Approach #7: 'RNAseq CNMF subtypes' versus Clinical Feature #1: 'Time to Death'
P value = 1.27e-06 (Kruskal-Wallis (anova)), Q value = 2.7e-05
Table S51. Clustering Approach #7: 'RNAseq CNMF subtypes' versus Clinical Feature #2: 'YEARS_TO_BIRTH'
| nPatients | Mean (Std.Dev) | |
|---|---|---|
| ALL | 532 | 64.0 (11.2) |
| subtype1 | 228 | 66.5 (10.5) |
| subtype2 | 151 | 60.9 (11.6) |
| subtype3 | 153 | 63.1 (11.0) |
Figure S44. Get High-res Image Clustering Approach #7: 'RNAseq CNMF subtypes' versus Clinical Feature #2: 'YEARS_TO_BIRTH'
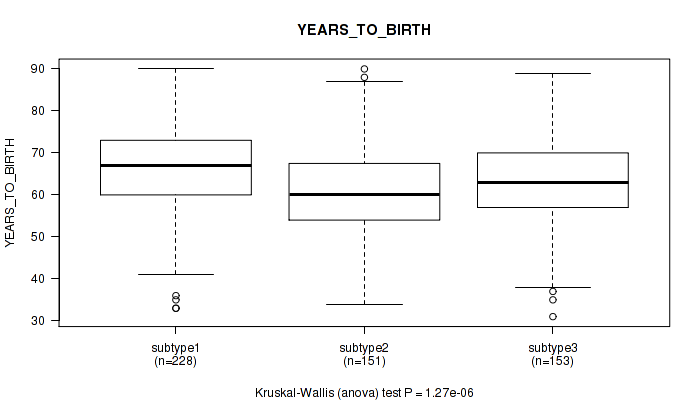
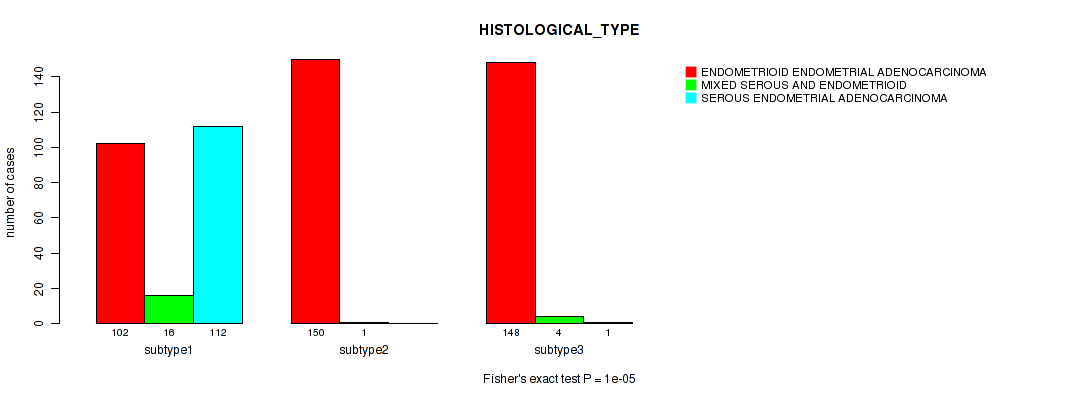
P value = 1e-05 (Fisher's exact test), Q value = 5.2e-05
Table S52. Clustering Approach #7: 'RNAseq CNMF subtypes' versus Clinical Feature #3: 'HISTOLOGICAL_TYPE'
| nPatients | ENDOMETRIOID ENDOMETRIAL ADENOCARCINOMA | MIXED SEROUS AND ENDOMETRIOID | SEROUS ENDOMETRIAL ADENOCARCINOMA |
|---|---|---|---|
| ALL | 400 | 21 | 113 |
| subtype1 | 102 | 16 | 112 |
| subtype2 | 150 | 1 | 0 |
| subtype3 | 148 | 4 | 1 |
Figure S45. Get High-res Image Clustering Approach #7: 'RNAseq CNMF subtypes' versus Clinical Feature #3: 'HISTOLOGICAL_TYPE'
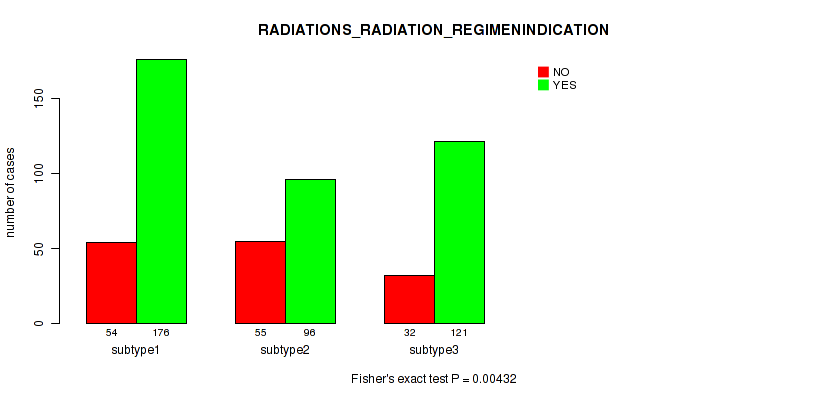
P value = 0.00432 (Fisher's exact test), Q value = 0.013
Table S53. Clustering Approach #7: 'RNAseq CNMF subtypes' versus Clinical Feature #4: 'RADIATIONS_RADIATION_REGIMENINDICATION'
| nPatients | NO | YES |
|---|---|---|
| ALL | 141 | 393 |
| subtype1 | 54 | 176 |
| subtype2 | 55 | 96 |
| subtype3 | 32 | 121 |
Figure S46. Get High-res Image Clustering Approach #7: 'RNAseq CNMF subtypes' versus Clinical Feature #4: 'RADIATIONS_RADIATION_REGIMENINDICATION'
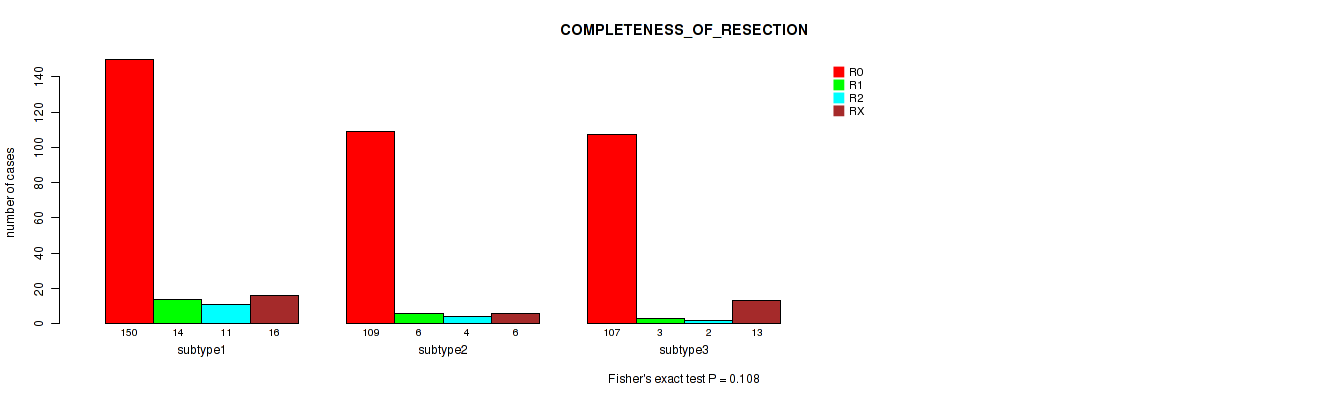
P value = 0.108 (Fisher's exact test), Q value = 0.19
Table S54. Clustering Approach #7: 'RNAseq CNMF subtypes' versus Clinical Feature #5: 'COMPLETENESS_OF_RESECTION'
| nPatients | R0 | R1 | R2 | RX |
|---|---|---|---|---|
| ALL | 366 | 23 | 17 | 35 |
| subtype1 | 150 | 14 | 11 | 16 |
| subtype2 | 109 | 6 | 4 | 6 |
| subtype3 | 107 | 3 | 2 | 13 |
Figure S47. Get High-res Image Clustering Approach #7: 'RNAseq CNMF subtypes' versus Clinical Feature #5: 'COMPLETENESS_OF_RESECTION'
P value = 0.0827 (Fisher's exact test), Q value = 0.17
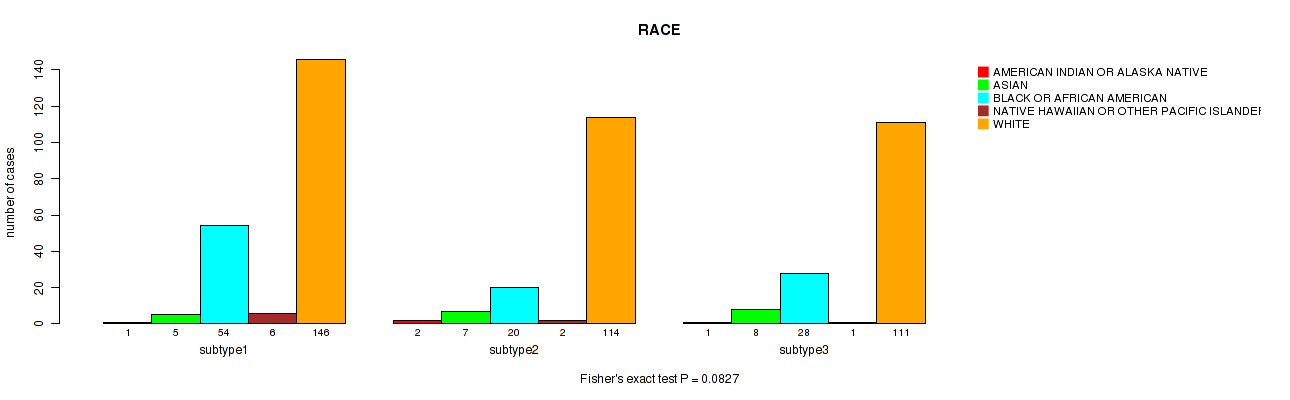
Table S55. Clustering Approach #7: 'RNAseq CNMF subtypes' versus Clinical Feature #6: 'RACE'
| nPatients | AMERICAN INDIAN OR ALASKA NATIVE | ASIAN | BLACK OR AFRICAN AMERICAN | NATIVE HAWAIIAN OR OTHER PACIFIC ISLANDER | WHITE |
|---|---|---|---|---|---|
| ALL | 4 | 20 | 102 | 9 | 371 |
| subtype1 | 1 | 5 | 54 | 6 | 146 |
| subtype2 | 2 | 7 | 20 | 2 | 114 |
| subtype3 | 1 | 8 | 28 | 1 | 111 |
Figure S48. Get High-res Image Clustering Approach #7: 'RNAseq CNMF subtypes' versus Clinical Feature #6: 'RACE'
P value = 1 (Fisher's exact test), Q value = 1
Table S56. Clustering Approach #7: 'RNAseq CNMF subtypes' versus Clinical Feature #7: 'ETHNICITY'
| nPatients | HISPANIC OR LATINO | NOT HISPANIC OR LATINO |
|---|---|---|
| ALL | 14 | 370 |
| subtype1 | 6 | 163 |
| subtype2 | 4 | 99 |
| subtype3 | 4 | 108 |
Figure S49. Get High-res Image Clustering Approach #7: 'RNAseq CNMF subtypes' versus Clinical Feature #7: 'ETHNICITY'
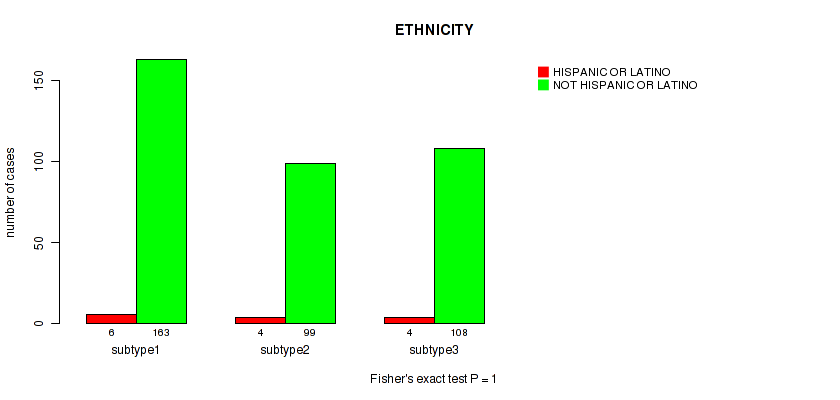
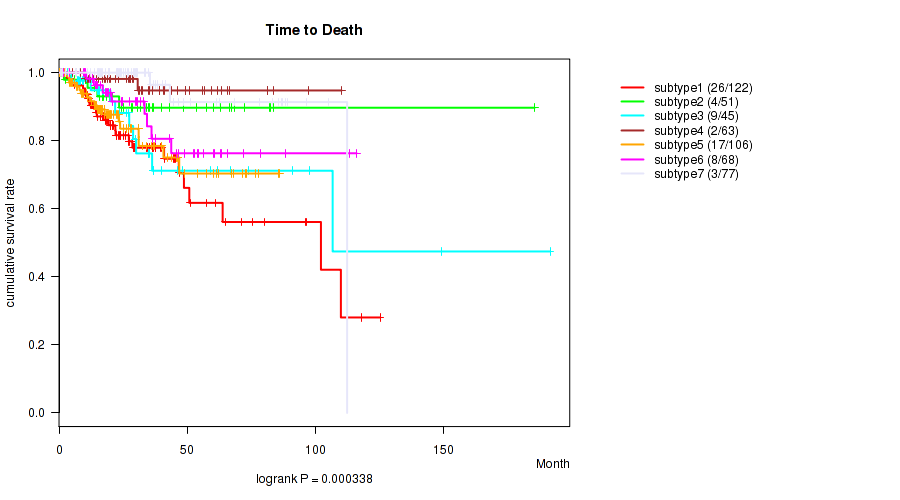
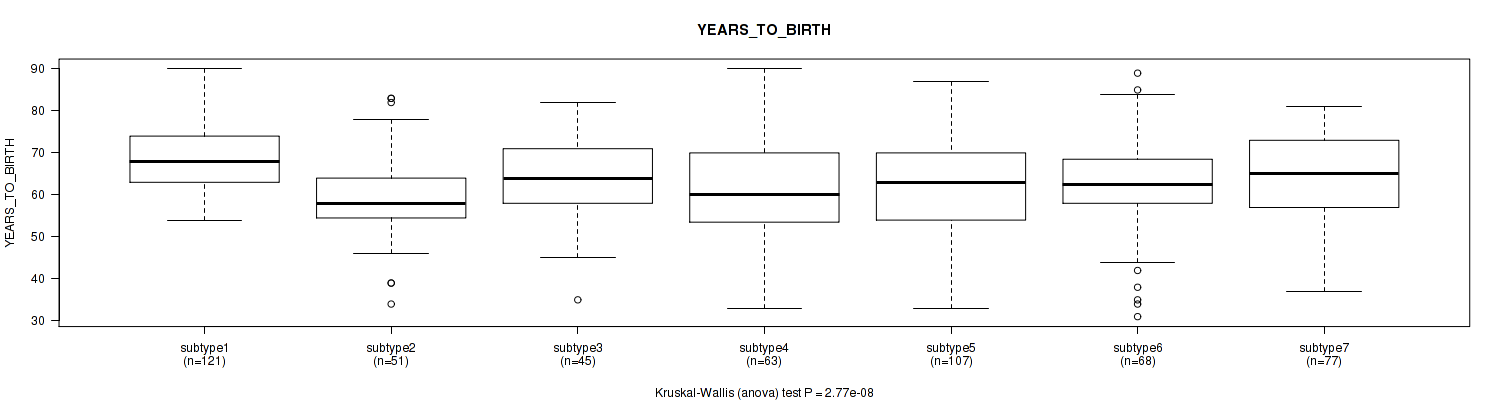
Table S57. Description of clustering approach #8: 'RNAseq cHierClus subtypes'
| Cluster Labels | 1 | 2 | 3 | 4 | 5 | 6 | 7 |
|---|---|---|---|---|---|---|---|
| Number of samples | 122 | 51 | 46 | 63 | 107 | 68 | 77 |
P value = 0.000338 (logrank test), Q value = 0.0013
Table S58. Clustering Approach #8: 'RNAseq cHierClus subtypes' versus Clinical Feature #1: 'Time to Death'
| nPatients | nDeath | Duration Range (Median), Month | |
|---|---|---|---|
| ALL | 532 | 69 | 0.1 - 191.8 (23.3) |
| subtype1 | 122 | 26 | 0.1 - 125.4 (20.5) |
| subtype2 | 51 | 4 | 0.7 - 185.8 (25.1) |
| subtype3 | 45 | 9 | 0.2 - 191.8 (27.4) |
| subtype4 | 63 | 2 | 0.1 - 110.4 (28.0) |
| subtype5 | 106 | 17 | 0.2 - 86.1 (18.6) |
| subtype6 | 68 | 8 | 0.4 - 116.2 (24.3) |
| subtype7 | 77 | 3 | 0.6 - 112.5 (27.2) |
Figure S50. Get High-res Image Clustering Approach #8: 'RNAseq cHierClus subtypes' versus Clinical Feature #1: 'Time to Death'
P value = 2.77e-08 (Kruskal-Wallis (anova)), Q value = 7.8e-07
Table S59. Clustering Approach #8: 'RNAseq cHierClus subtypes' versus Clinical Feature #2: 'YEARS_TO_BIRTH'
| nPatients | Mean (Std.Dev) | |
|---|---|---|
| ALL | 532 | 64.0 (11.2) |
| subtype1 | 121 | 69.3 (8.4) |
| subtype2 | 51 | 59.6 (10.4) |
| subtype3 | 45 | 63.9 (9.9) |
| subtype4 | 63 | 61.3 (13.0) |
| subtype5 | 107 | 62.7 (12.1) |
| subtype6 | 68 | 62.4 (11.8) |
| subtype7 | 77 | 63.8 (10.1) |
Figure S51. Get High-res Image Clustering Approach #8: 'RNAseq cHierClus subtypes' versus Clinical Feature #2: 'YEARS_TO_BIRTH'
P value = 1e-05 (Fisher's exact test), Q value = 5.2e-05
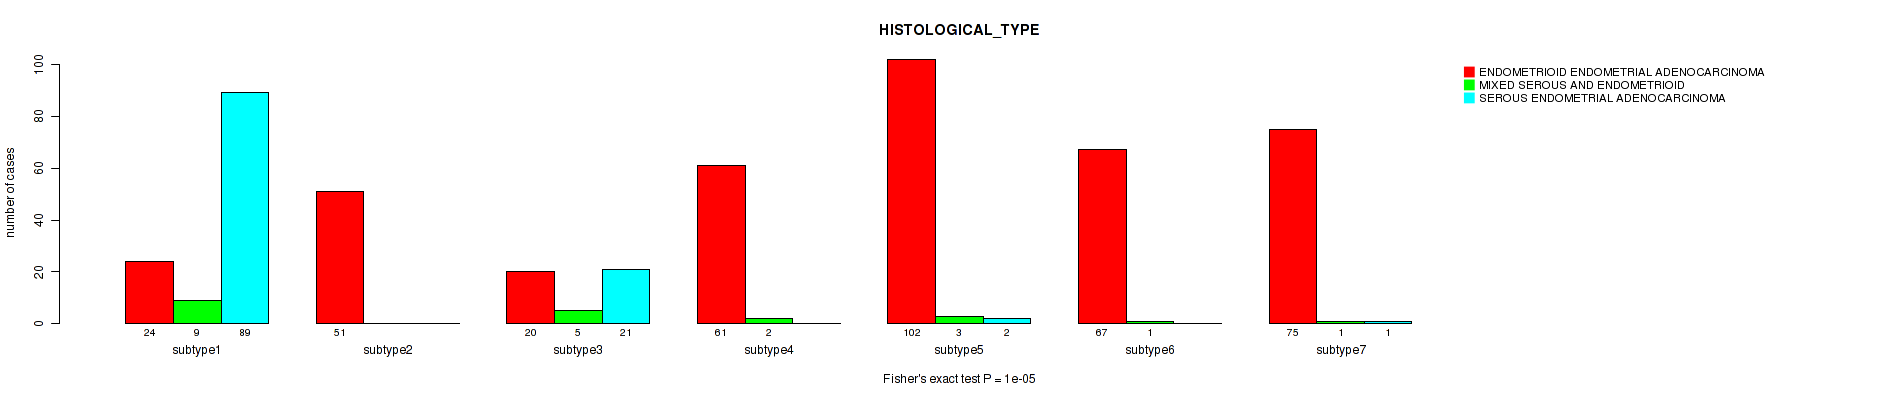
Table S60. Clustering Approach #8: 'RNAseq cHierClus subtypes' versus Clinical Feature #3: 'HISTOLOGICAL_TYPE'
| nPatients | ENDOMETRIOID ENDOMETRIAL ADENOCARCINOMA | MIXED SEROUS AND ENDOMETRIOID | SEROUS ENDOMETRIAL ADENOCARCINOMA |
|---|---|---|---|
| ALL | 400 | 21 | 113 |
| subtype1 | 24 | 9 | 89 |
| subtype2 | 51 | 0 | 0 |
| subtype3 | 20 | 5 | 21 |
| subtype4 | 61 | 2 | 0 |
| subtype5 | 102 | 3 | 2 |
| subtype6 | 67 | 1 | 0 |
| subtype7 | 75 | 1 | 1 |
Figure S52. Get High-res Image Clustering Approach #8: 'RNAseq cHierClus subtypes' versus Clinical Feature #3: 'HISTOLOGICAL_TYPE'
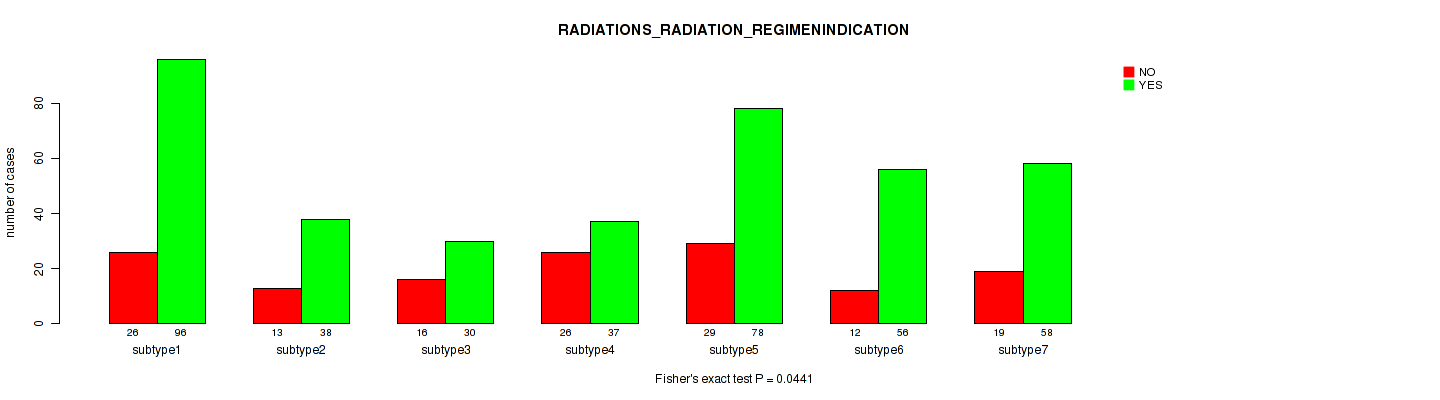
P value = 0.0441 (Fisher's exact test), Q value = 0.097
Table S61. Clustering Approach #8: 'RNAseq cHierClus subtypes' versus Clinical Feature #4: 'RADIATIONS_RADIATION_REGIMENINDICATION'
| nPatients | NO | YES |
|---|---|---|
| ALL | 141 | 393 |
| subtype1 | 26 | 96 |
| subtype2 | 13 | 38 |
| subtype3 | 16 | 30 |
| subtype4 | 26 | 37 |
| subtype5 | 29 | 78 |
| subtype6 | 12 | 56 |
| subtype7 | 19 | 58 |
Figure S53. Get High-res Image Clustering Approach #8: 'RNAseq cHierClus subtypes' versus Clinical Feature #4: 'RADIATIONS_RADIATION_REGIMENINDICATION'
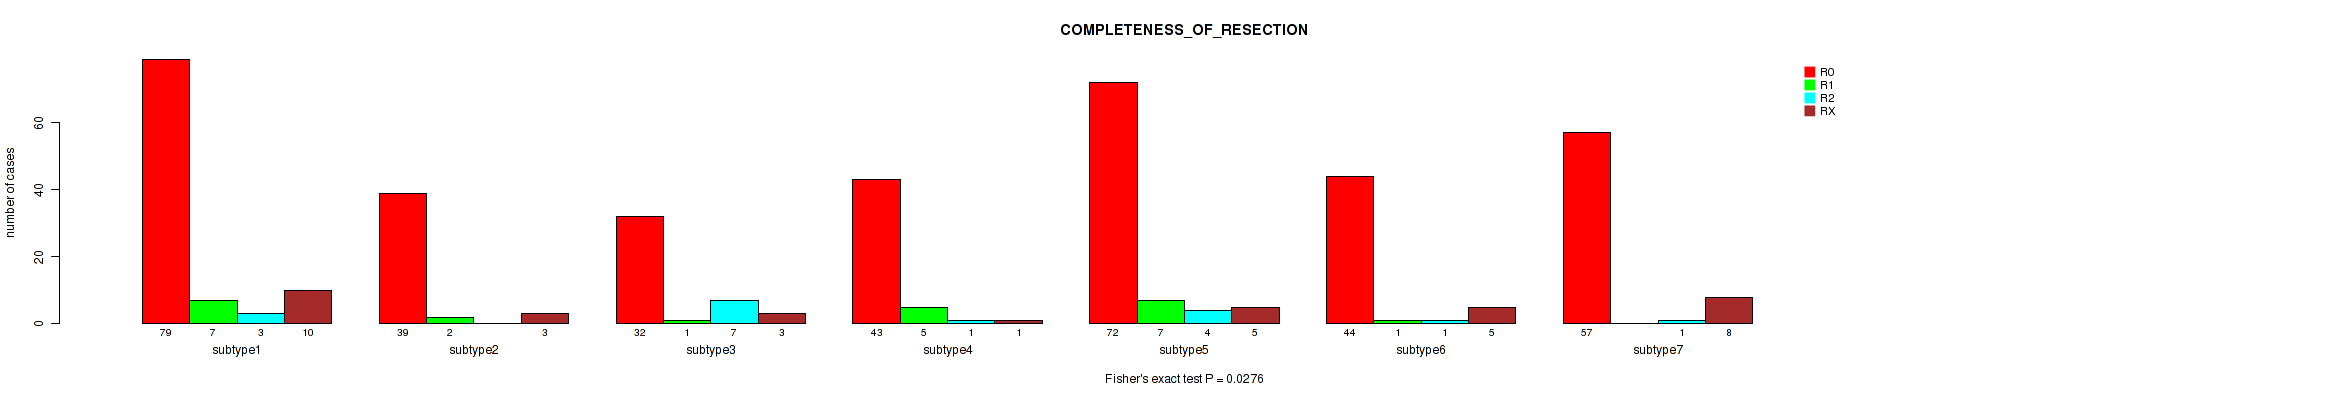
P value = 0.0276 (Fisher's exact test), Q value = 0.073
Table S62. Clustering Approach #8: 'RNAseq cHierClus subtypes' versus Clinical Feature #5: 'COMPLETENESS_OF_RESECTION'
| nPatients | R0 | R1 | R2 | RX |
|---|---|---|---|---|
| ALL | 366 | 23 | 17 | 35 |
| subtype1 | 79 | 7 | 3 | 10 |
| subtype2 | 39 | 2 | 0 | 3 |
| subtype3 | 32 | 1 | 7 | 3 |
| subtype4 | 43 | 5 | 1 | 1 |
| subtype5 | 72 | 7 | 4 | 5 |
| subtype6 | 44 | 1 | 1 | 5 |
| subtype7 | 57 | 0 | 1 | 8 |
Figure S54. Get High-res Image Clustering Approach #8: 'RNAseq cHierClus subtypes' versus Clinical Feature #5: 'COMPLETENESS_OF_RESECTION'
P value = 0.0359 (Fisher's exact test), Q value = 0.084
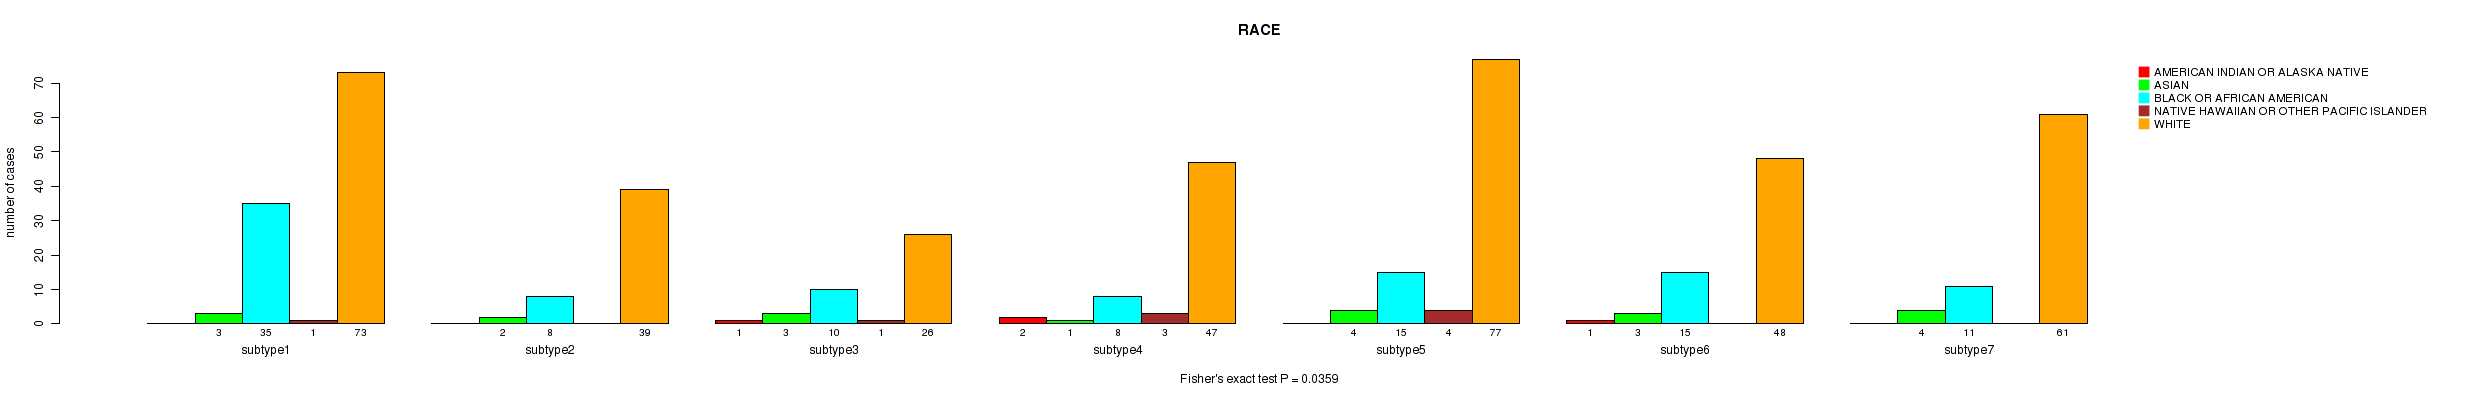
Table S63. Clustering Approach #8: 'RNAseq cHierClus subtypes' versus Clinical Feature #6: 'RACE'
| nPatients | AMERICAN INDIAN OR ALASKA NATIVE | ASIAN | BLACK OR AFRICAN AMERICAN | NATIVE HAWAIIAN OR OTHER PACIFIC ISLANDER | WHITE |
|---|---|---|---|---|---|
| ALL | 4 | 20 | 102 | 9 | 371 |
| subtype1 | 0 | 3 | 35 | 1 | 73 |
| subtype2 | 0 | 2 | 8 | 0 | 39 |
| subtype3 | 1 | 3 | 10 | 1 | 26 |
| subtype4 | 2 | 1 | 8 | 3 | 47 |
| subtype5 | 0 | 4 | 15 | 4 | 77 |
| subtype6 | 1 | 3 | 15 | 0 | 48 |
| subtype7 | 0 | 4 | 11 | 0 | 61 |
Figure S55. Get High-res Image Clustering Approach #8: 'RNAseq cHierClus subtypes' versus Clinical Feature #6: 'RACE'
P value = 0.227 (Fisher's exact test), Q value = 0.34
Table S64. Clustering Approach #8: 'RNAseq cHierClus subtypes' versus Clinical Feature #7: 'ETHNICITY'
| nPatients | HISPANIC OR LATINO | NOT HISPANIC OR LATINO |
|---|---|---|
| ALL | 14 | 370 |
| subtype1 | 3 | 80 |
| subtype2 | 1 | 36 |
| subtype3 | 4 | 33 |
| subtype4 | 2 | 40 |
| subtype5 | 3 | 76 |
| subtype6 | 1 | 45 |
| subtype7 | 0 | 60 |
Figure S56. Get High-res Image Clustering Approach #8: 'RNAseq cHierClus subtypes' versus Clinical Feature #7: 'ETHNICITY'
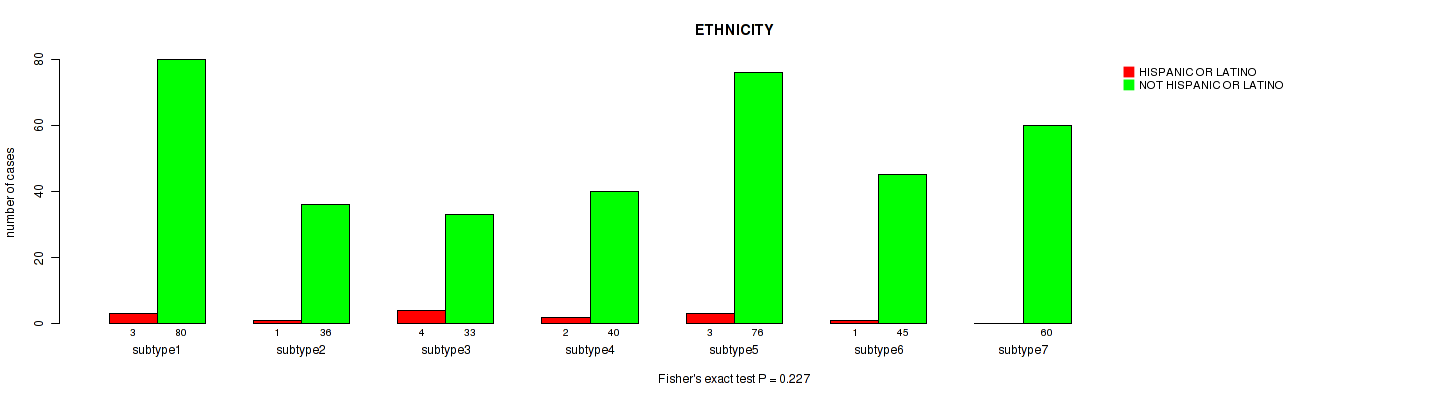
Table S65. Description of clustering approach #9: 'MIRSEQ CNMF'
| Cluster Labels | 1 | 2 | 3 |
|---|---|---|---|
| Number of samples | 218 | 148 | 161 |
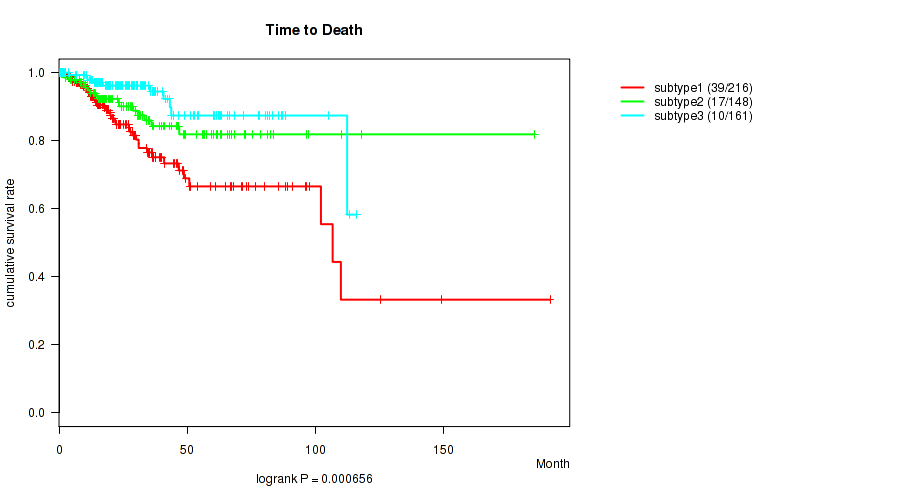
P value = 0.000656 (logrank test), Q value = 0.0023
Table S66. Clustering Approach #9: 'MIRSEQ CNMF' versus Clinical Feature #1: 'Time to Death'
| nPatients | nDeath | Duration Range (Median), Month | |
|---|---|---|---|
| ALL | 525 | 66 | 0.1 - 191.8 (23.3) |
| subtype1 | 216 | 39 | 0.1 - 191.8 (20.0) |
| subtype2 | 148 | 17 | 0.1 - 185.8 (27.1) |
| subtype3 | 161 | 10 | 0.4 - 116.2 (24.9) |
Figure S57. Get High-res Image Clustering Approach #9: 'MIRSEQ CNMF' versus Clinical Feature #1: 'Time to Death'
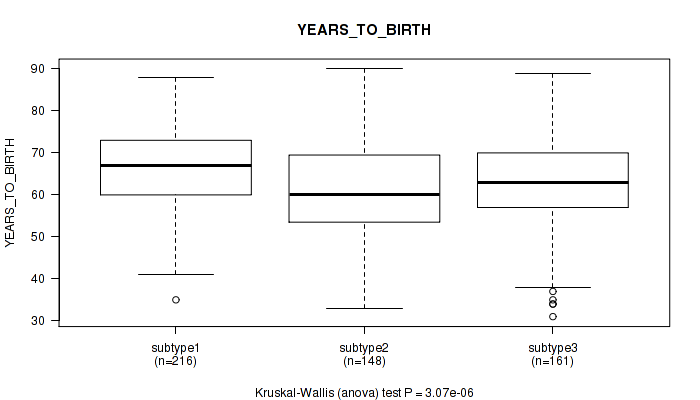
P value = 3.07e-06 (Kruskal-Wallis (anova)), Q value = 4.3e-05
Table S67. Clustering Approach #9: 'MIRSEQ CNMF' versus Clinical Feature #2: 'YEARS_TO_BIRTH'
| nPatients | Mean (Std.Dev) | |
|---|---|---|
| ALL | 525 | 63.9 (11.2) |
| subtype1 | 216 | 66.7 (10.0) |
| subtype2 | 148 | 61.0 (12.3) |
| subtype3 | 161 | 63.0 (11.0) |
Figure S58. Get High-res Image Clustering Approach #9: 'MIRSEQ CNMF' versus Clinical Feature #2: 'YEARS_TO_BIRTH'
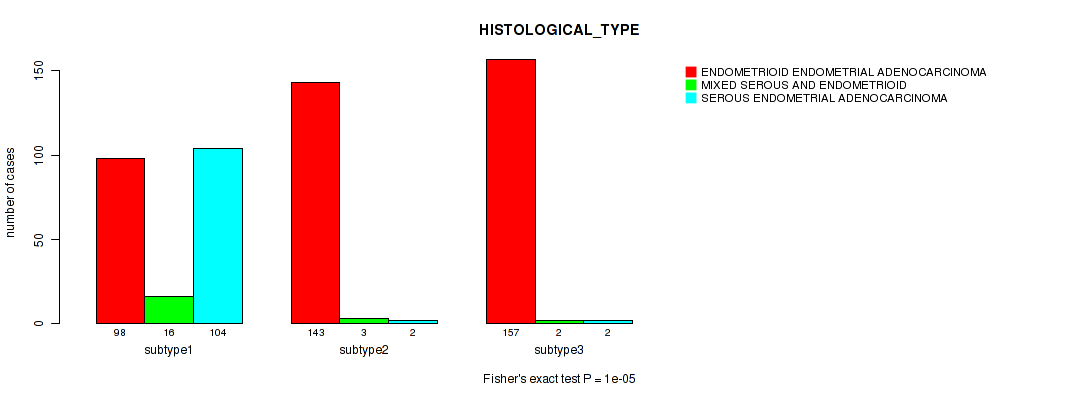
P value = 1e-05 (Fisher's exact test), Q value = 5.2e-05
Table S68. Clustering Approach #9: 'MIRSEQ CNMF' versus Clinical Feature #3: 'HISTOLOGICAL_TYPE'
| nPatients | ENDOMETRIOID ENDOMETRIAL ADENOCARCINOMA | MIXED SEROUS AND ENDOMETRIOID | SEROUS ENDOMETRIAL ADENOCARCINOMA |
|---|---|---|---|
| ALL | 398 | 21 | 108 |
| subtype1 | 98 | 16 | 104 |
| subtype2 | 143 | 3 | 2 |
| subtype3 | 157 | 2 | 2 |
Figure S59. Get High-res Image Clustering Approach #9: 'MIRSEQ CNMF' versus Clinical Feature #3: 'HISTOLOGICAL_TYPE'
P value = 0.587 (Fisher's exact test), Q value = 0.66
Table S69. Clustering Approach #9: 'MIRSEQ CNMF' versus Clinical Feature #4: 'RADIATIONS_RADIATION_REGIMENINDICATION'
| nPatients | NO | YES |
|---|---|---|
| ALL | 137 | 390 |
| subtype1 | 53 | 165 |
| subtype2 | 43 | 105 |
| subtype3 | 41 | 120 |
Figure S60. Get High-res Image Clustering Approach #9: 'MIRSEQ CNMF' versus Clinical Feature #4: 'RADIATIONS_RADIATION_REGIMENINDICATION'
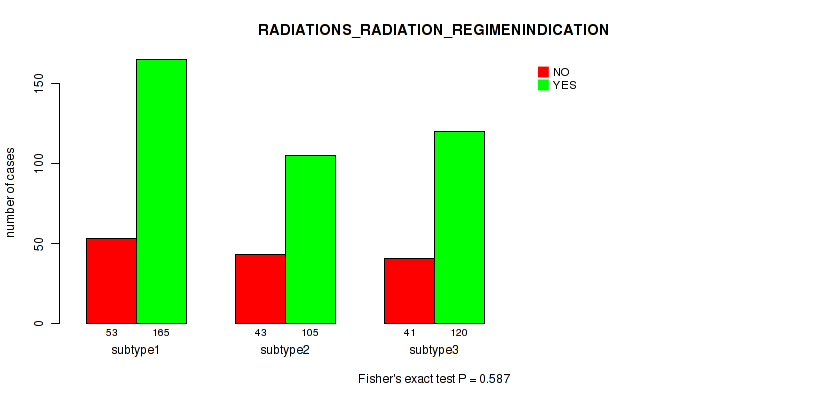
P value = 0.246 (Fisher's exact test), Q value = 0.35
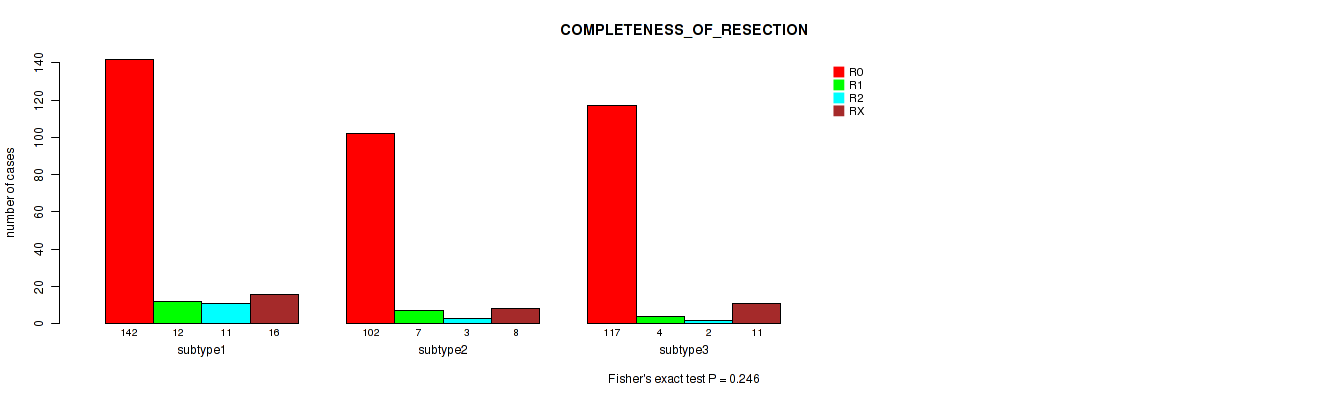
Table S70. Clustering Approach #9: 'MIRSEQ CNMF' versus Clinical Feature #5: 'COMPLETENESS_OF_RESECTION'
| nPatients | R0 | R1 | R2 | RX |
|---|---|---|---|---|
| ALL | 361 | 23 | 16 | 35 |
| subtype1 | 142 | 12 | 11 | 16 |
| subtype2 | 102 | 7 | 3 | 8 |
| subtype3 | 117 | 4 | 2 | 11 |
Figure S61. Get High-res Image Clustering Approach #9: 'MIRSEQ CNMF' versus Clinical Feature #5: 'COMPLETENESS_OF_RESECTION'
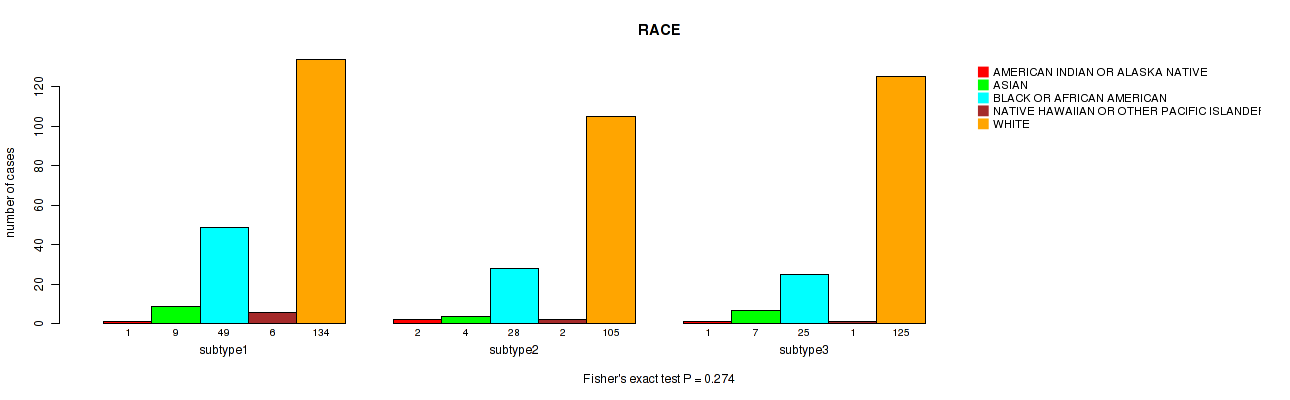
P value = 0.274 (Fisher's exact test), Q value = 0.38
Table S71. Clustering Approach #9: 'MIRSEQ CNMF' versus Clinical Feature #6: 'RACE'
| nPatients | AMERICAN INDIAN OR ALASKA NATIVE | ASIAN | BLACK OR AFRICAN AMERICAN | NATIVE HAWAIIAN OR OTHER PACIFIC ISLANDER | WHITE |
|---|---|---|---|---|---|
| ALL | 4 | 20 | 102 | 9 | 364 |
| subtype1 | 1 | 9 | 49 | 6 | 134 |
| subtype2 | 2 | 4 | 28 | 2 | 105 |
| subtype3 | 1 | 7 | 25 | 1 | 125 |
Figure S62. Get High-res Image Clustering Approach #9: 'MIRSEQ CNMF' versus Clinical Feature #6: 'RACE'
P value = 0.105 (Fisher's exact test), Q value = 0.19
Table S72. Clustering Approach #9: 'MIRSEQ CNMF' versus Clinical Feature #7: 'ETHNICITY'
| nPatients | HISPANIC OR LATINO | NOT HISPANIC OR LATINO |
|---|---|---|
| ALL | 14 | 369 |
| subtype1 | 10 | 151 |
| subtype2 | 2 | 98 |
| subtype3 | 2 | 120 |
Figure S63. Get High-res Image Clustering Approach #9: 'MIRSEQ CNMF' versus Clinical Feature #7: 'ETHNICITY'
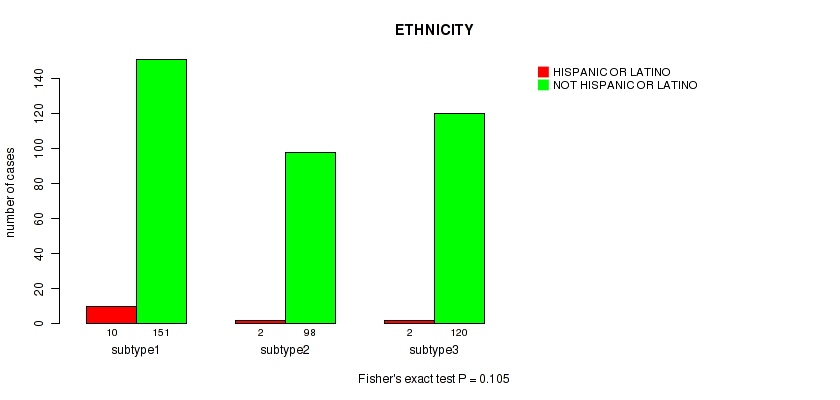
Table S73. Description of clustering approach #10: 'MIRSEQ CHIERARCHICAL'
| Cluster Labels | 1 | 2 | 3 | 4 |
|---|---|---|---|---|
| Number of samples | 214 | 56 | 142 | 115 |
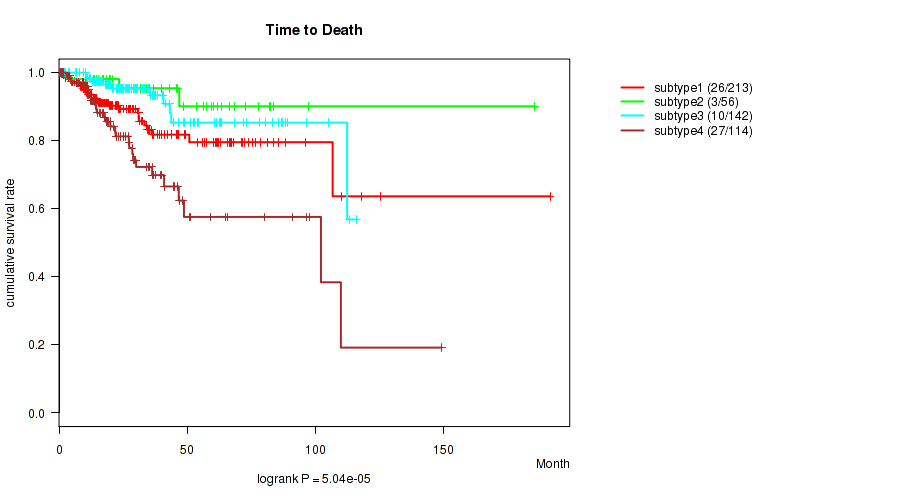
P value = 5.04e-05 (logrank test), Q value = 0.00024
Table S74. Clustering Approach #10: 'MIRSEQ CHIERARCHICAL' versus Clinical Feature #1: 'Time to Death'
| nPatients | nDeath | Duration Range (Median), Month | |
|---|---|---|---|
| ALL | 525 | 66 | 0.1 - 191.8 (23.3) |
| subtype1 | 213 | 26 | 0.1 - 191.8 (20.6) |
| subtype2 | 56 | 3 | 0.7 - 185.8 (31.3) |
| subtype3 | 142 | 10 | 0.4 - 116.2 (24.5) |
| subtype4 | 114 | 27 | 0.3 - 149.6 (22.0) |
Figure S64. Get High-res Image Clustering Approach #10: 'MIRSEQ CHIERARCHICAL' versus Clinical Feature #1: 'Time to Death'
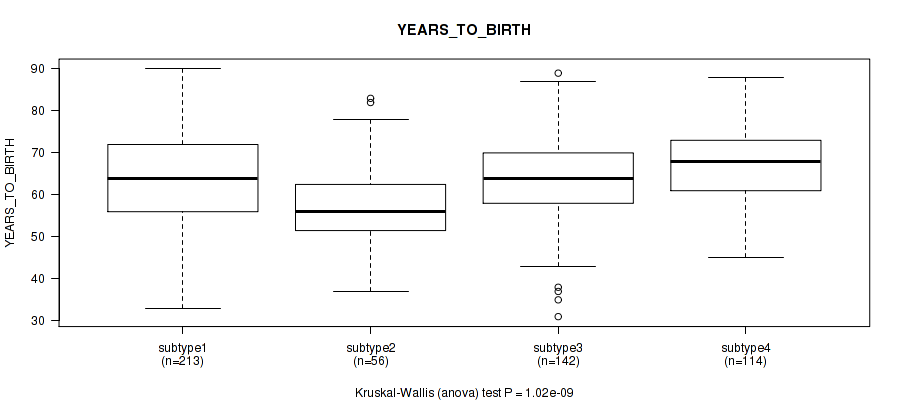
P value = 1.02e-09 (Kruskal-Wallis (anova)), Q value = 4.3e-08
Table S75. Clustering Approach #10: 'MIRSEQ CHIERARCHICAL' versus Clinical Feature #2: 'YEARS_TO_BIRTH'
| nPatients | Mean (Std.Dev) | |
|---|---|---|
| ALL | 525 | 63.9 (11.2) |
| subtype1 | 213 | 63.6 (12.3) |
| subtype2 | 56 | 56.7 (10.2) |
| subtype3 | 142 | 63.8 (10.2) |
| subtype4 | 114 | 68.2 (8.8) |
Figure S65. Get High-res Image Clustering Approach #10: 'MIRSEQ CHIERARCHICAL' versus Clinical Feature #2: 'YEARS_TO_BIRTH'
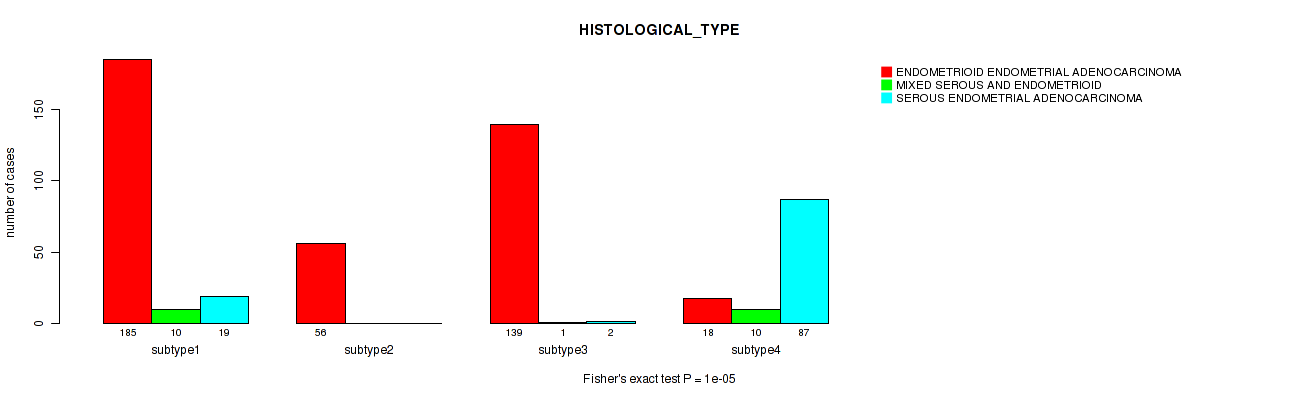
P value = 1e-05 (Fisher's exact test), Q value = 5.2e-05
Table S76. Clustering Approach #10: 'MIRSEQ CHIERARCHICAL' versus Clinical Feature #3: 'HISTOLOGICAL_TYPE'
| nPatients | ENDOMETRIOID ENDOMETRIAL ADENOCARCINOMA | MIXED SEROUS AND ENDOMETRIOID | SEROUS ENDOMETRIAL ADENOCARCINOMA |
|---|---|---|---|
| ALL | 398 | 21 | 108 |
| subtype1 | 185 | 10 | 19 |
| subtype2 | 56 | 0 | 0 |
| subtype3 | 139 | 1 | 2 |
| subtype4 | 18 | 10 | 87 |
Figure S66. Get High-res Image Clustering Approach #10: 'MIRSEQ CHIERARCHICAL' versus Clinical Feature #3: 'HISTOLOGICAL_TYPE'
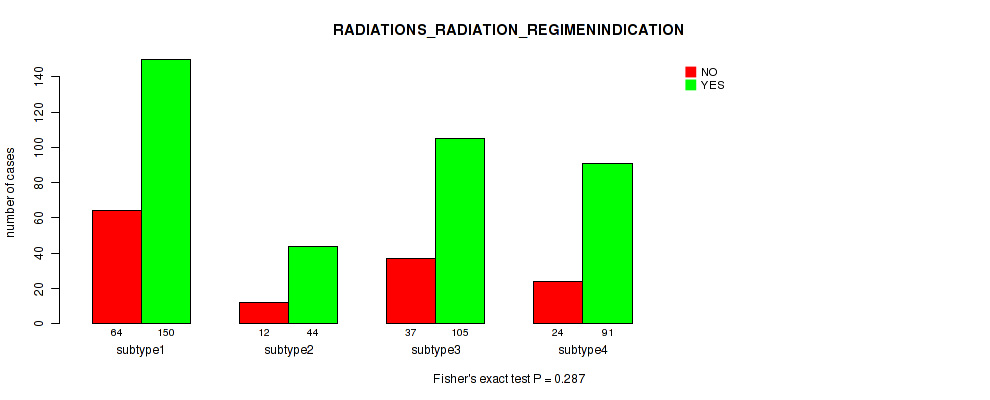
P value = 0.287 (Fisher's exact test), Q value = 0.38
Table S77. Clustering Approach #10: 'MIRSEQ CHIERARCHICAL' versus Clinical Feature #4: 'RADIATIONS_RADIATION_REGIMENINDICATION'
| nPatients | NO | YES |
|---|---|---|
| ALL | 137 | 390 |
| subtype1 | 64 | 150 |
| subtype2 | 12 | 44 |
| subtype3 | 37 | 105 |
| subtype4 | 24 | 91 |
Figure S67. Get High-res Image Clustering Approach #10: 'MIRSEQ CHIERARCHICAL' versus Clinical Feature #4: 'RADIATIONS_RADIATION_REGIMENINDICATION'
P value = 0.392 (Fisher's exact test), Q value = 0.49
Table S78. Clustering Approach #10: 'MIRSEQ CHIERARCHICAL' versus Clinical Feature #5: 'COMPLETENESS_OF_RESECTION'
| nPatients | R0 | R1 | R2 | RX |
|---|---|---|---|---|
| ALL | 361 | 23 | 16 | 35 |
| subtype1 | 148 | 10 | 6 | 11 |
| subtype2 | 36 | 4 | 1 | 4 |
| subtype3 | 101 | 3 | 2 | 11 |
| subtype4 | 76 | 6 | 7 | 9 |
Figure S68. Get High-res Image Clustering Approach #10: 'MIRSEQ CHIERARCHICAL' versus Clinical Feature #5: 'COMPLETENESS_OF_RESECTION'
P value = 0.139 (Fisher's exact test), Q value = 0.23
Table S79. Clustering Approach #10: 'MIRSEQ CHIERARCHICAL' versus Clinical Feature #6: 'RACE'
| nPatients | AMERICAN INDIAN OR ALASKA NATIVE | ASIAN | BLACK OR AFRICAN AMERICAN | NATIVE HAWAIIAN OR OTHER PACIFIC ISLANDER | WHITE |
|---|---|---|---|---|---|
| ALL | 4 | 20 | 102 | 9 | 364 |
| subtype1 | 2 | 8 | 38 | 4 | 146 |
| subtype2 | 1 | 3 | 8 | 2 | 40 |
| subtype3 | 0 | 6 | 22 | 2 | 110 |
| subtype4 | 1 | 3 | 34 | 1 | 68 |
Figure S69. Get High-res Image Clustering Approach #10: 'MIRSEQ CHIERARCHICAL' versus Clinical Feature #6: 'RACE'
P value = 0.976 (Fisher's exact test), Q value = 1
Table S80. Clustering Approach #10: 'MIRSEQ CHIERARCHICAL' versus Clinical Feature #7: 'ETHNICITY'
| nPatients | HISPANIC OR LATINO | NOT HISPANIC OR LATINO |
|---|---|---|
| ALL | 14 | 369 |
| subtype1 | 7 | 148 |
| subtype2 | 1 | 36 |
| subtype3 | 3 | 103 |
| subtype4 | 3 | 82 |
Figure S70. Get High-res Image Clustering Approach #10: 'MIRSEQ CHIERARCHICAL' versus Clinical Feature #7: 'ETHNICITY'
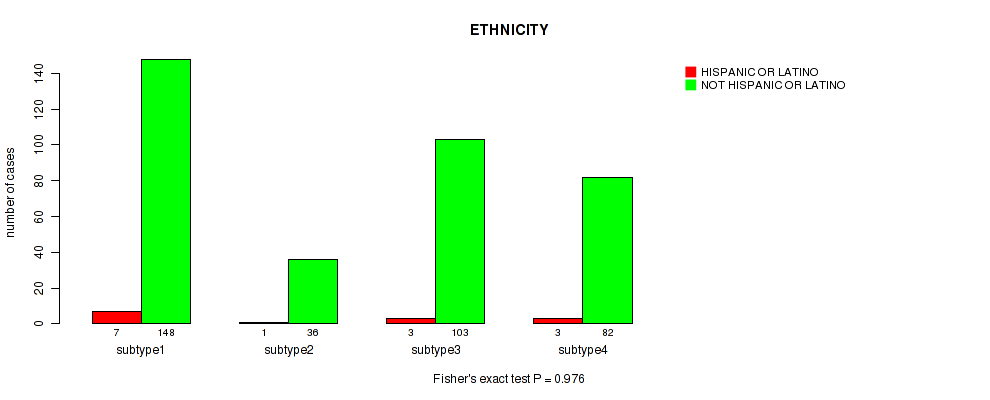
Table S81. Description of clustering approach #11: 'MIRseq Mature CNMF subtypes'
| Cluster Labels | 1 | 2 | 3 |
|---|---|---|---|
| Number of samples | 165 | 92 | 134 |
P value = 0.0723 (logrank test), Q value = 0.15
Table S82. Clustering Approach #11: 'MIRseq Mature CNMF subtypes' versus Clinical Feature #1: 'Time to Death'
| nPatients | nDeath | Duration Range (Median), Month | |
|---|---|---|---|
| ALL | 389 | 52 | 0.1 - 191.8 (19.3) |
| subtype1 | 163 | 27 | 0.1 - 191.8 (17.8) |
| subtype2 | 92 | 14 | 0.3 - 87.3 (21.0) |
| subtype3 | 134 | 11 | 0.7 - 116.2 (20.2) |
Figure S71. Get High-res Image Clustering Approach #11: 'MIRseq Mature CNMF subtypes' versus Clinical Feature #1: 'Time to Death'
P value = 0.000821 (Kruskal-Wallis (anova)), Q value = 0.0028
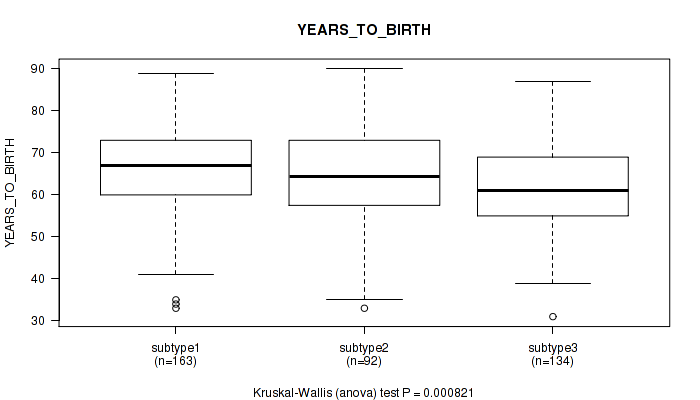
Table S83. Clustering Approach #11: 'MIRseq Mature CNMF subtypes' versus Clinical Feature #2: 'YEARS_TO_BIRTH'
| nPatients | Mean (Std.Dev) | |
|---|---|---|
| ALL | 389 | 64.3 (11.1) |
| subtype1 | 163 | 66.2 (10.7) |
| subtype2 | 92 | 64.7 (12.3) |
| subtype3 | 134 | 61.7 (10.1) |
Figure S72. Get High-res Image Clustering Approach #11: 'MIRseq Mature CNMF subtypes' versus Clinical Feature #2: 'YEARS_TO_BIRTH'
P value = 1e-05 (Fisher's exact test), Q value = 5.2e-05
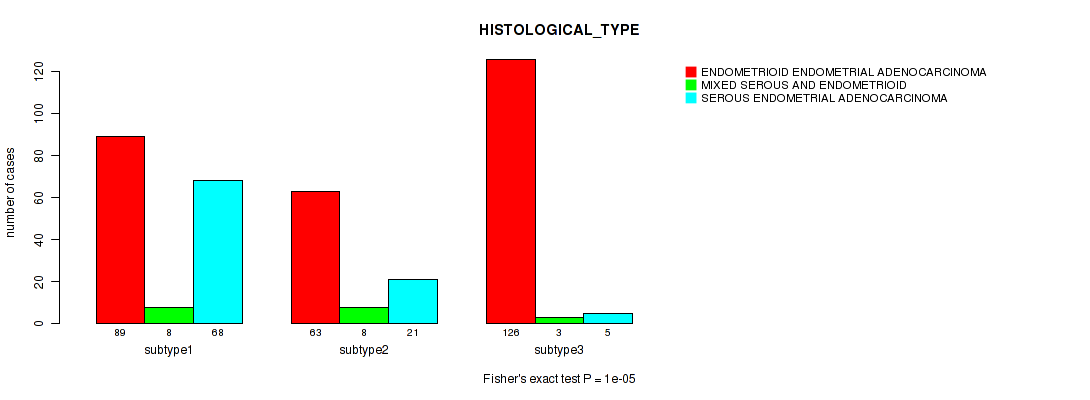
Table S84. Clustering Approach #11: 'MIRseq Mature CNMF subtypes' versus Clinical Feature #3: 'HISTOLOGICAL_TYPE'
| nPatients | ENDOMETRIOID ENDOMETRIAL ADENOCARCINOMA | MIXED SEROUS AND ENDOMETRIOID | SEROUS ENDOMETRIAL ADENOCARCINOMA |
|---|---|---|---|
| ALL | 278 | 19 | 94 |
| subtype1 | 89 | 8 | 68 |
| subtype2 | 63 | 8 | 21 |
| subtype3 | 126 | 3 | 5 |
Figure S73. Get High-res Image Clustering Approach #11: 'MIRseq Mature CNMF subtypes' versus Clinical Feature #3: 'HISTOLOGICAL_TYPE'
P value = 0.00572 (Fisher's exact test), Q value = 0.016
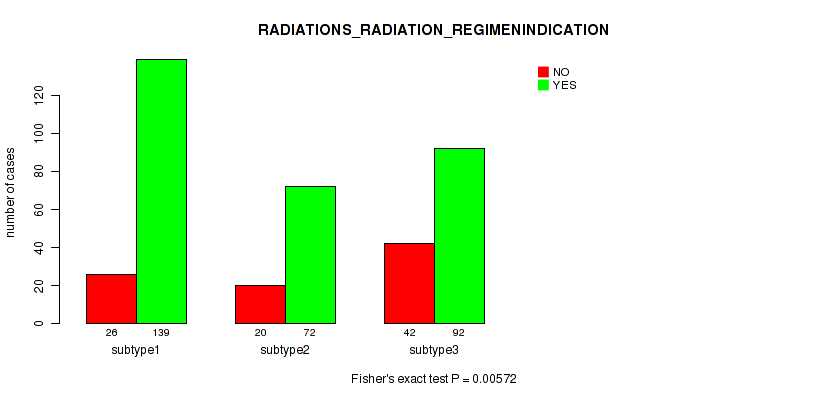
Table S85. Clustering Approach #11: 'MIRseq Mature CNMF subtypes' versus Clinical Feature #4: 'RADIATIONS_RADIATION_REGIMENINDICATION'
| nPatients | NO | YES |
|---|---|---|
| ALL | 88 | 303 |
| subtype1 | 26 | 139 |
| subtype2 | 20 | 72 |
| subtype3 | 42 | 92 |
Figure S74. Get High-res Image Clustering Approach #11: 'MIRseq Mature CNMF subtypes' versus Clinical Feature #4: 'RADIATIONS_RADIATION_REGIMENINDICATION'
P value = 0.694 (Fisher's exact test), Q value = 0.76
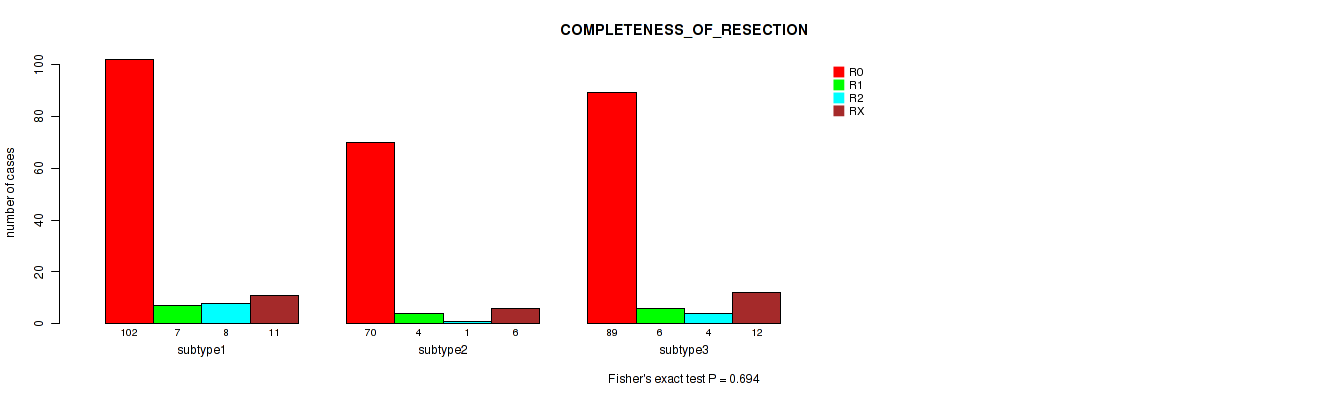
Table S86. Clustering Approach #11: 'MIRseq Mature CNMF subtypes' versus Clinical Feature #5: 'COMPLETENESS_OF_RESECTION'
| nPatients | R0 | R1 | R2 | RX |
|---|---|---|---|---|
| ALL | 261 | 17 | 13 | 29 |
| subtype1 | 102 | 7 | 8 | 11 |
| subtype2 | 70 | 4 | 1 | 6 |
| subtype3 | 89 | 6 | 4 | 12 |
Figure S75. Get High-res Image Clustering Approach #11: 'MIRseq Mature CNMF subtypes' versus Clinical Feature #5: 'COMPLETENESS_OF_RESECTION'
P value = 0.00044 (Fisher's exact test), Q value = 0.0016
Table S87. Clustering Approach #11: 'MIRseq Mature CNMF subtypes' versus Clinical Feature #6: 'RACE'
| nPatients | AMERICAN INDIAN OR ALASKA NATIVE | ASIAN | BLACK OR AFRICAN AMERICAN | NATIVE HAWAIIAN OR OTHER PACIFIC ISLANDER | WHITE |
|---|---|---|---|---|---|
| ALL | 2 | 7 | 88 | 5 | 265 |
| subtype1 | 1 | 1 | 44 | 0 | 102 |
| subtype2 | 1 | 4 | 24 | 4 | 54 |
| subtype3 | 0 | 2 | 20 | 1 | 109 |
Figure S76. Get High-res Image Clustering Approach #11: 'MIRseq Mature CNMF subtypes' versus Clinical Feature #6: 'RACE'

P value = 0.168 (Fisher's exact test), Q value = 0.27
Table S88. Clustering Approach #11: 'MIRseq Mature CNMF subtypes' versus Clinical Feature #7: 'ETHNICITY'
| nPatients | HISPANIC OR LATINO | NOT HISPANIC OR LATINO |
|---|---|---|
| ALL | 11 | 280 |
| subtype1 | 8 | 115 |
| subtype2 | 1 | 64 |
| subtype3 | 2 | 101 |
Figure S77. Get High-res Image Clustering Approach #11: 'MIRseq Mature CNMF subtypes' versus Clinical Feature #7: 'ETHNICITY'
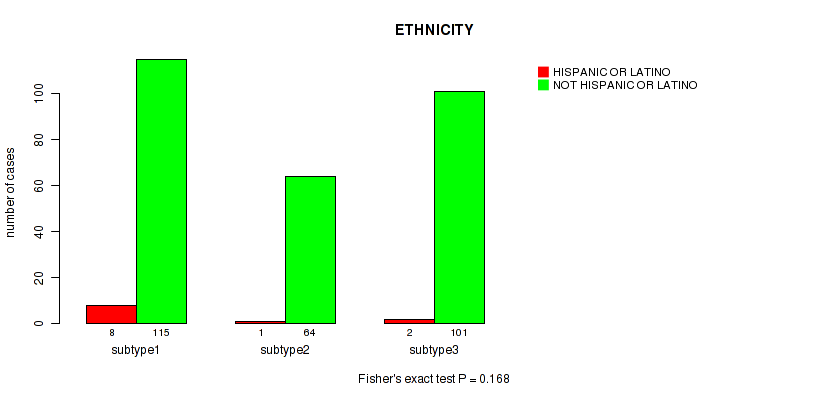
Table S89. Description of clustering approach #12: 'MIRseq Mature cHierClus subtypes'
| Cluster Labels | 1 | 2 | 3 |
|---|---|---|---|
| Number of samples | 140 | 114 | 137 |
P value = 0.239 (logrank test), Q value = 0.35
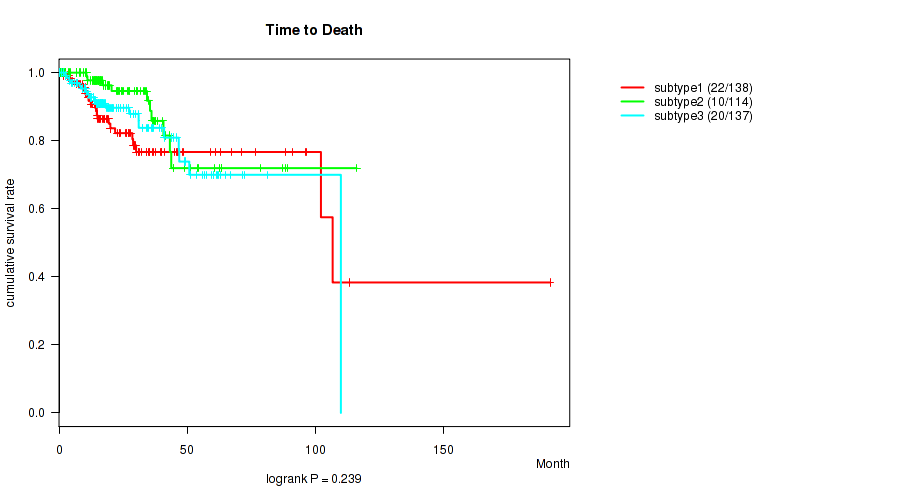
Table S90. Clustering Approach #12: 'MIRseq Mature cHierClus subtypes' versus Clinical Feature #1: 'Time to Death'
| nPatients | nDeath | Duration Range (Median), Month | |
|---|---|---|---|
| ALL | 389 | 52 | 0.1 - 191.8 (19.3) |
| subtype1 | 138 | 22 | 0.1 - 191.8 (17.8) |
| subtype2 | 114 | 10 | 0.4 - 116.2 (20.2) |
| subtype3 | 137 | 20 | 0.2 - 110.1 (20.0) |
Figure S78. Get High-res Image Clustering Approach #12: 'MIRseq Mature cHierClus subtypes' versus Clinical Feature #1: 'Time to Death'
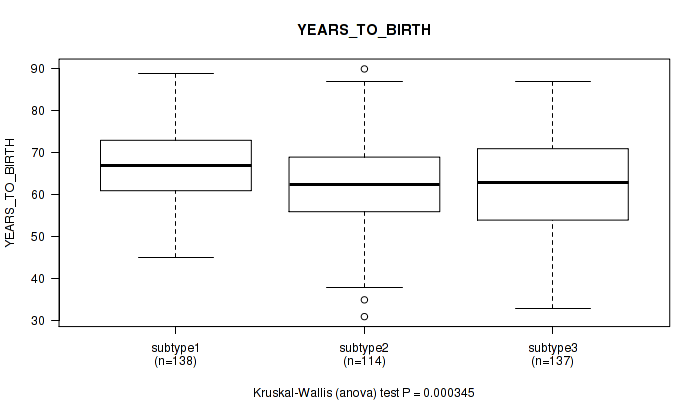
P value = 0.000345 (Kruskal-Wallis (anova)), Q value = 0.0013
Table S91. Clustering Approach #12: 'MIRseq Mature cHierClus subtypes' versus Clinical Feature #2: 'YEARS_TO_BIRTH'
| nPatients | Mean (Std.Dev) | |
|---|---|---|
| ALL | 389 | 64.3 (11.1) |
| subtype1 | 138 | 67.3 (9.0) |
| subtype2 | 114 | 62.5 (10.7) |
| subtype3 | 137 | 62.8 (12.5) |
Figure S79. Get High-res Image Clustering Approach #12: 'MIRseq Mature cHierClus subtypes' versus Clinical Feature #2: 'YEARS_TO_BIRTH'
P value = 1e-05 (Fisher's exact test), Q value = 5.2e-05
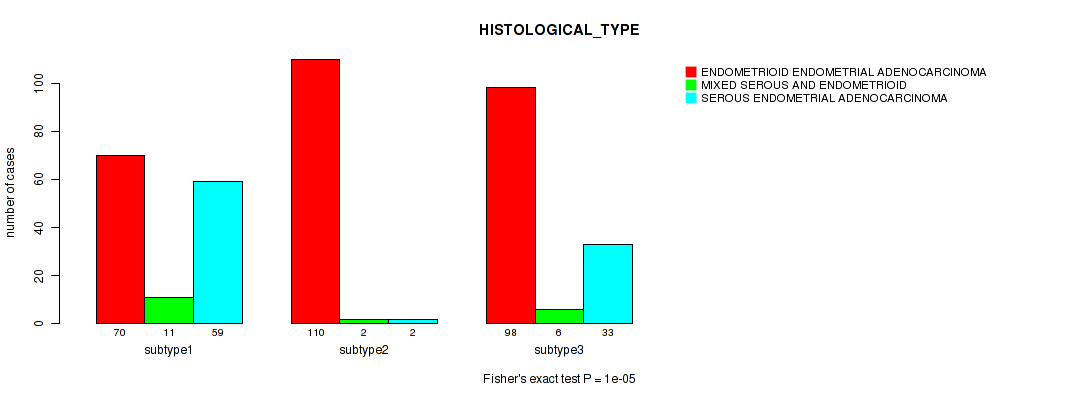
Table S92. Clustering Approach #12: 'MIRseq Mature cHierClus subtypes' versus Clinical Feature #3: 'HISTOLOGICAL_TYPE'
| nPatients | ENDOMETRIOID ENDOMETRIAL ADENOCARCINOMA | MIXED SEROUS AND ENDOMETRIOID | SEROUS ENDOMETRIAL ADENOCARCINOMA |
|---|---|---|---|
| ALL | 278 | 19 | 94 |
| subtype1 | 70 | 11 | 59 |
| subtype2 | 110 | 2 | 2 |
| subtype3 | 98 | 6 | 33 |
Figure S80. Get High-res Image Clustering Approach #12: 'MIRseq Mature cHierClus subtypes' versus Clinical Feature #3: 'HISTOLOGICAL_TYPE'
P value = 0.282 (Fisher's exact test), Q value = 0.38
Table S93. Clustering Approach #12: 'MIRseq Mature cHierClus subtypes' versus Clinical Feature #4: 'RADIATIONS_RADIATION_REGIMENINDICATION'
| nPatients | NO | YES |
|---|---|---|
| ALL | 88 | 303 |
| subtype1 | 27 | 113 |
| subtype2 | 24 | 90 |
| subtype3 | 37 | 100 |
Figure S81. Get High-res Image Clustering Approach #12: 'MIRseq Mature cHierClus subtypes' versus Clinical Feature #4: 'RADIATIONS_RADIATION_REGIMENINDICATION'
P value = 0.181 (Fisher's exact test), Q value = 0.28
Table S94. Clustering Approach #12: 'MIRseq Mature cHierClus subtypes' versus Clinical Feature #5: 'COMPLETENESS_OF_RESECTION'
| nPatients | R0 | R1 | R2 | RX |
|---|---|---|---|---|
| ALL | 261 | 17 | 13 | 29 |
| subtype1 | 90 | 7 | 8 | 9 |
| subtype2 | 72 | 4 | 1 | 13 |
| subtype3 | 99 | 6 | 4 | 7 |
Figure S82. Get High-res Image Clustering Approach #12: 'MIRseq Mature cHierClus subtypes' versus Clinical Feature #5: 'COMPLETENESS_OF_RESECTION'
P value = 0.366 (Fisher's exact test), Q value = 0.47
Table S95. Clustering Approach #12: 'MIRseq Mature cHierClus subtypes' versus Clinical Feature #6: 'RACE'
| nPatients | AMERICAN INDIAN OR ALASKA NATIVE | ASIAN | BLACK OR AFRICAN AMERICAN | NATIVE HAWAIIAN OR OTHER PACIFIC ISLANDER | WHITE |
|---|---|---|---|---|---|
| ALL | 2 | 7 | 88 | 5 | 265 |
| subtype1 | 1 | 1 | 33 | 0 | 96 |
| subtype2 | 1 | 3 | 23 | 1 | 83 |
| subtype3 | 0 | 3 | 32 | 4 | 86 |
Figure S83. Get High-res Image Clustering Approach #12: 'MIRseq Mature cHierClus subtypes' versus Clinical Feature #6: 'RACE'
P value = 0.548 (Fisher's exact test), Q value = 0.63
Table S96. Clustering Approach #12: 'MIRseq Mature cHierClus subtypes' versus Clinical Feature #7: 'ETHNICITY'
| nPatients | HISPANIC OR LATINO | NOT HISPANIC OR LATINO |
|---|---|---|
| ALL | 11 | 280 |
| subtype1 | 6 | 106 |
| subtype2 | 2 | 84 |
| subtype3 | 3 | 90 |
Figure S84. Get High-res Image Clustering Approach #12: 'MIRseq Mature cHierClus subtypes' versus Clinical Feature #7: 'ETHNICITY'
-
Cluster data file = /xchip/cga/gdac-prod/tcga-gdac/jobResults/GDAC_mergedClustering/UCEC-TP/15120652/UCEC-TP.mergedcluster.txt
-
Clinical data file = /xchip/cga/gdac-prod/tcga-gdac/jobResults/Append_Data/UCEC-TP/15094079/UCEC-TP.merged_data.txt
-
Number of patients = 536
-
Number of clustering approaches = 12
-
Number of selected clinical features = 7
-
Exclude small clusters that include fewer than K patients, K = 3
consensus non-negative matrix factorization clustering approach (Brunet et al. 2004)
Resampling-based clustering method (Monti et al. 2003)
For survival clinical features, the Kaplan-Meier survival curves of tumors with and without gene mutations were plotted and the statistical significance P values were estimated by logrank test (Bland and Altman 2004) using the 'survdiff' function in R
For binary clinical features, two-tailed Fisher's exact tests (Fisher 1922) were used to estimate the P values using the 'fisher.test' function in R
For multiple hypothesis correction, Q value is the False Discovery Rate (FDR) analogue of the P value (Benjamini and Hochberg 1995), defined as the minimum FDR at which the test may be called significant. We used the 'Benjamini and Hochberg' method of 'p.adjust' function in R to convert P values into Q values.
In addition to the links below, the full results of the analysis summarized in this report can also be downloaded programmatically using firehose_get, or interactively from either the Broad GDAC website or TCGA Data Coordination Center Portal.