This pipeline computes the correlation between cancer subtypes identified by different molecular patterns and selected clinical features.
Testing the association between subtypes identified by 12 different clustering approaches and 8 clinical features across 515 patients, 49 significant findings detected with P value < 0.05 and Q value < 0.25.
-
CNMF clustering analysis on array-based mRNA expression data identified 3 subtypes that correlate to 'HISTOLOGICAL_TYPE'.
-
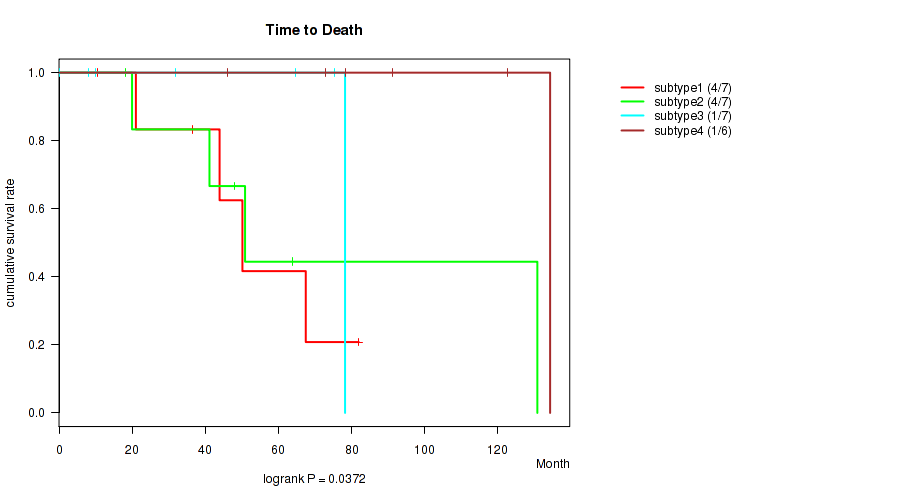
Consensus hierarchical clustering analysis on array-based mRNA expression data identified 4 subtypes that correlate to 'Time to Death' and 'HISTOLOGICAL_TYPE'.
-
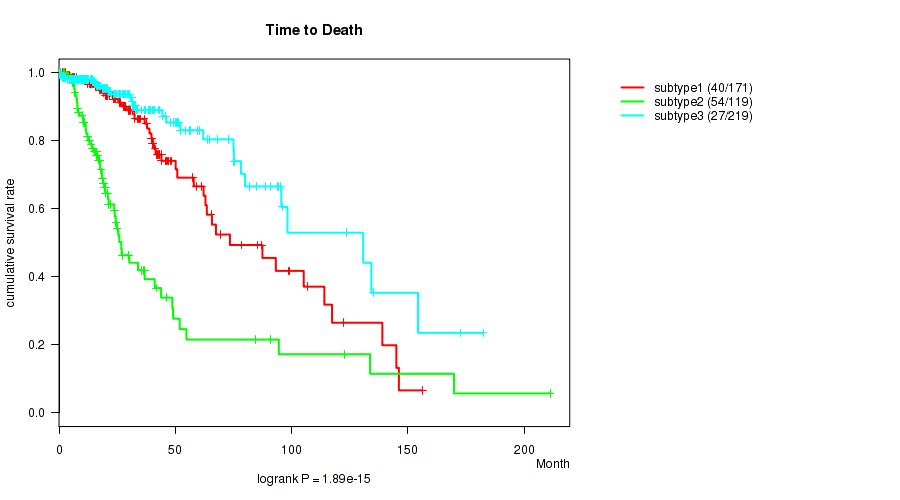
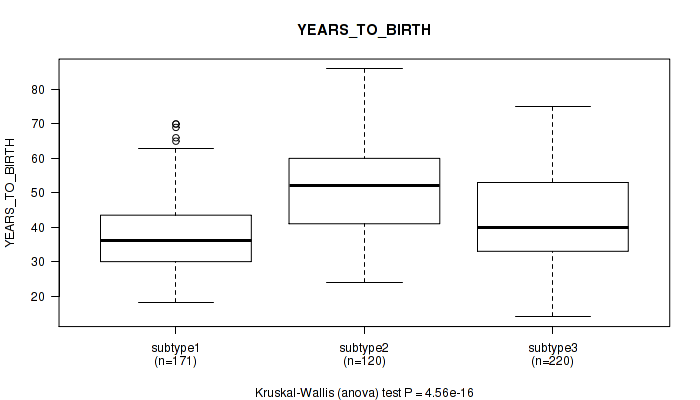
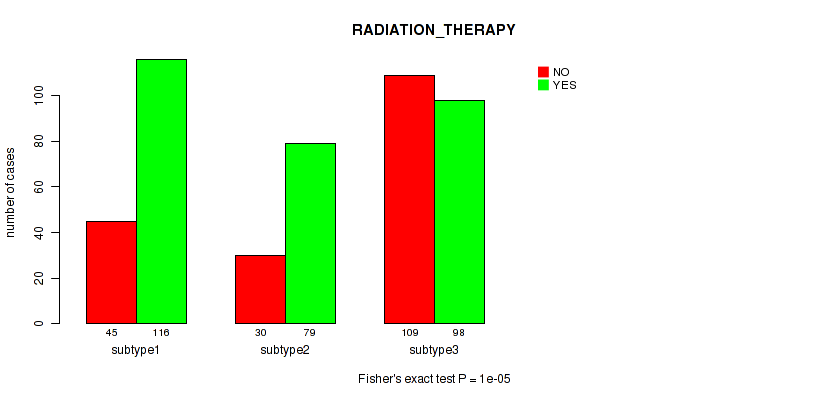
3 subtypes identified in current cancer cohort by 'Copy Number Ratio CNMF subtypes'. These subtypes correlate to 'Time to Death', 'YEARS_TO_BIRTH', 'RADIATION_THERAPY', 'KARNOFSKY_PERFORMANCE_SCORE', 'HISTOLOGICAL_TYPE', and 'RACE'.
-
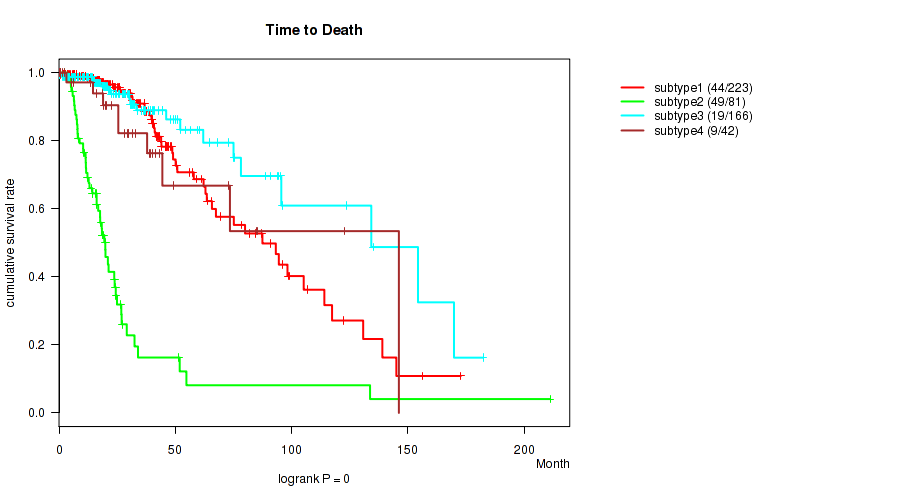
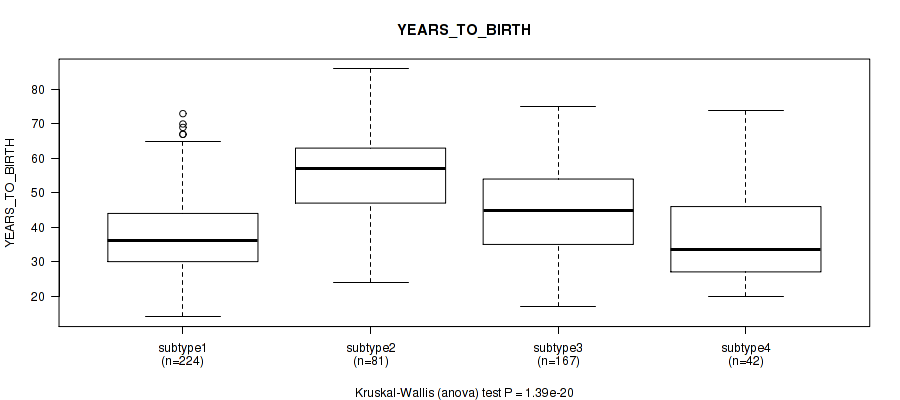
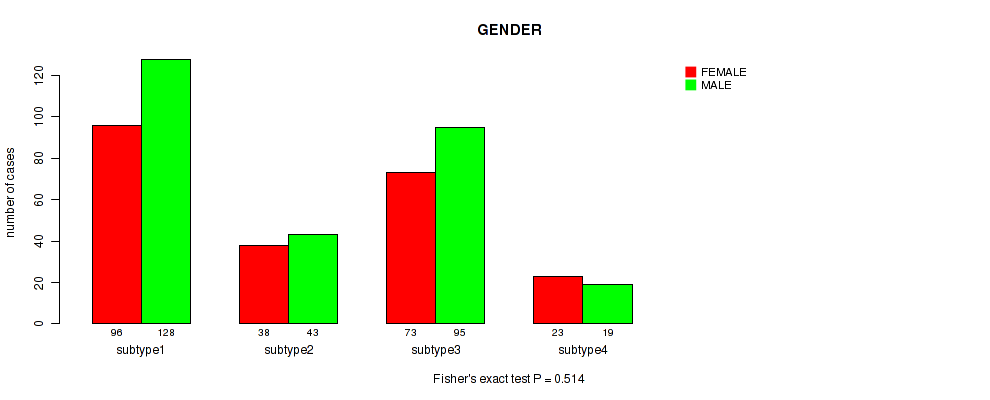
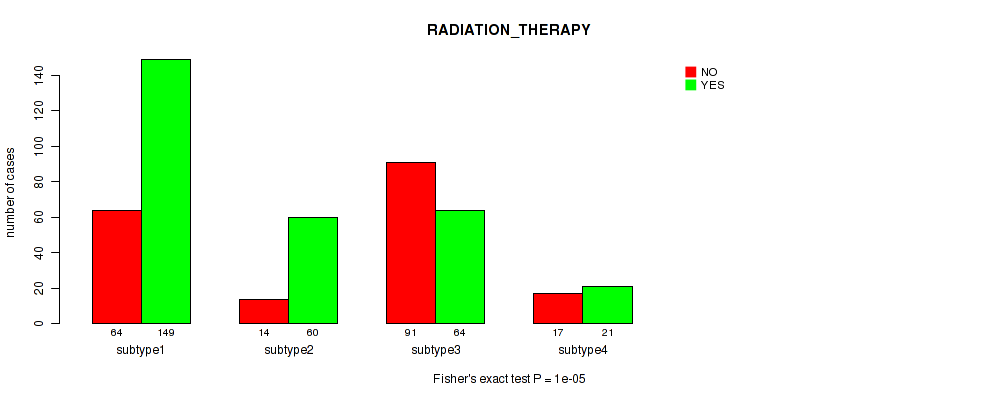
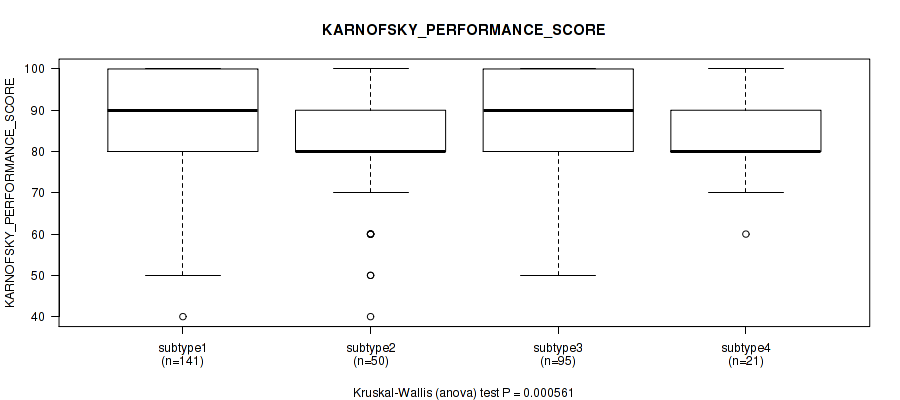
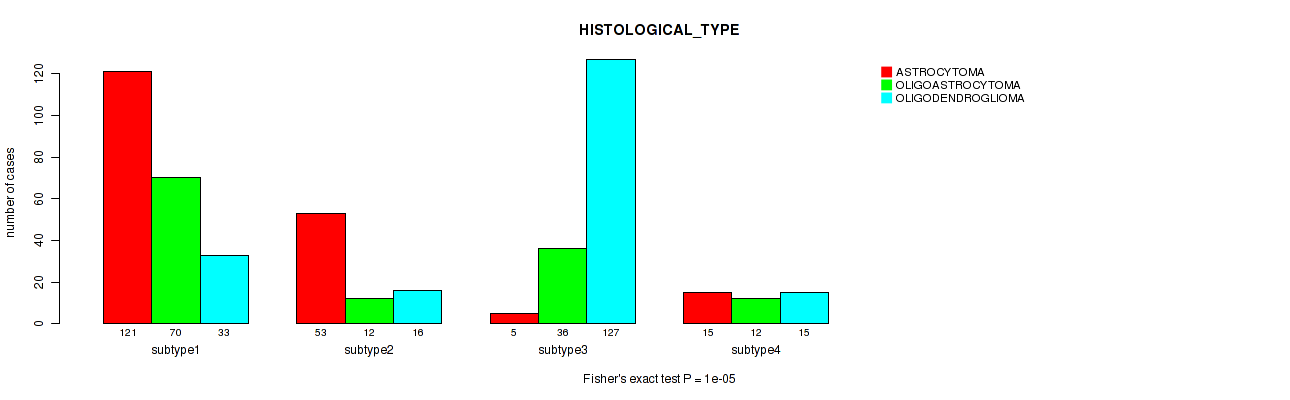
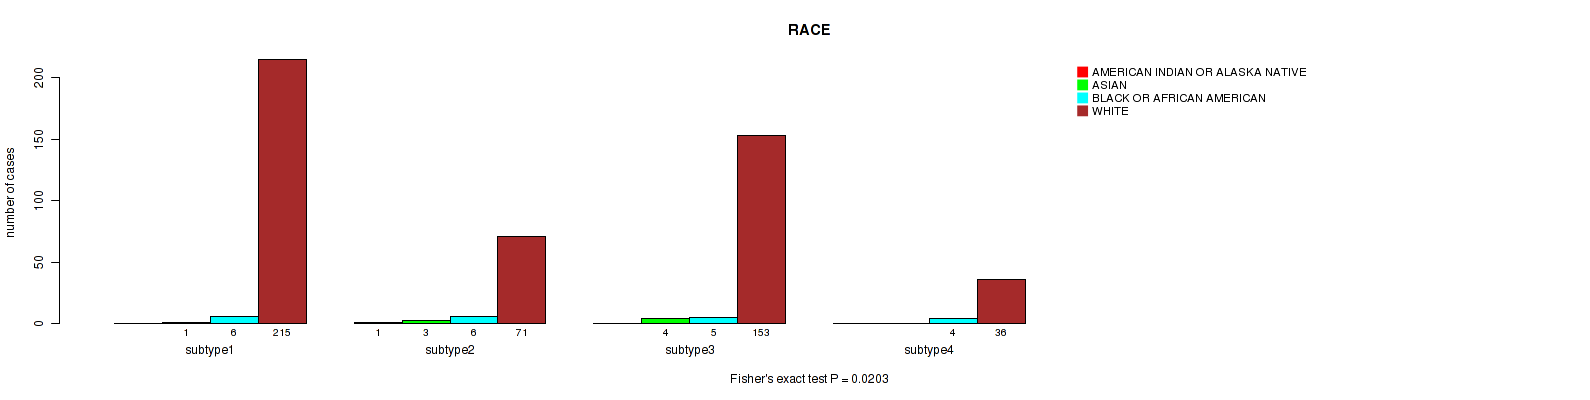
4 subtypes identified in current cancer cohort by 'METHLYATION CNMF'. These subtypes correlate to 'Time to Death', 'YEARS_TO_BIRTH', 'RADIATION_THERAPY', 'KARNOFSKY_PERFORMANCE_SCORE', 'HISTOLOGICAL_TYPE', and 'RACE'.
-
CNMF clustering analysis on RPPA data identified 4 subtypes that correlate to 'Time to Death', 'GENDER', and 'HISTOLOGICAL_TYPE'.
-
Consensus hierarchical clustering analysis on RPPA data identified 3 subtypes that correlate to 'Time to Death' and 'HISTOLOGICAL_TYPE'.
-
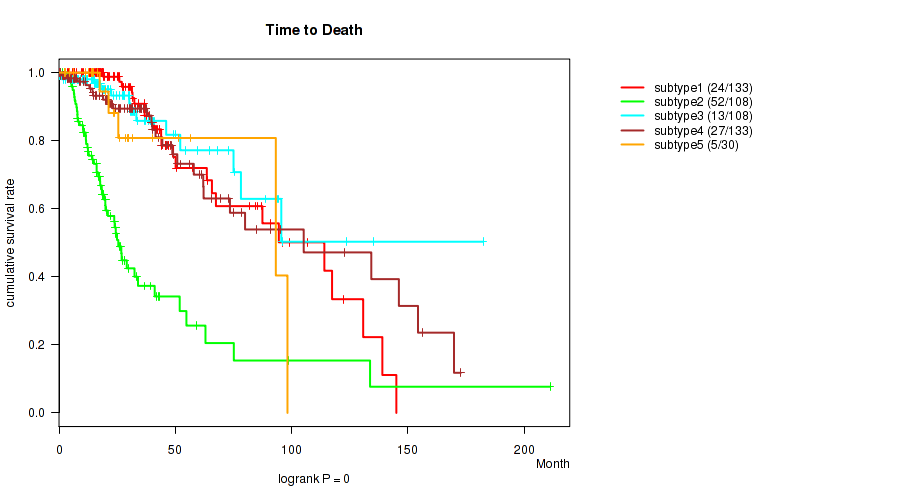
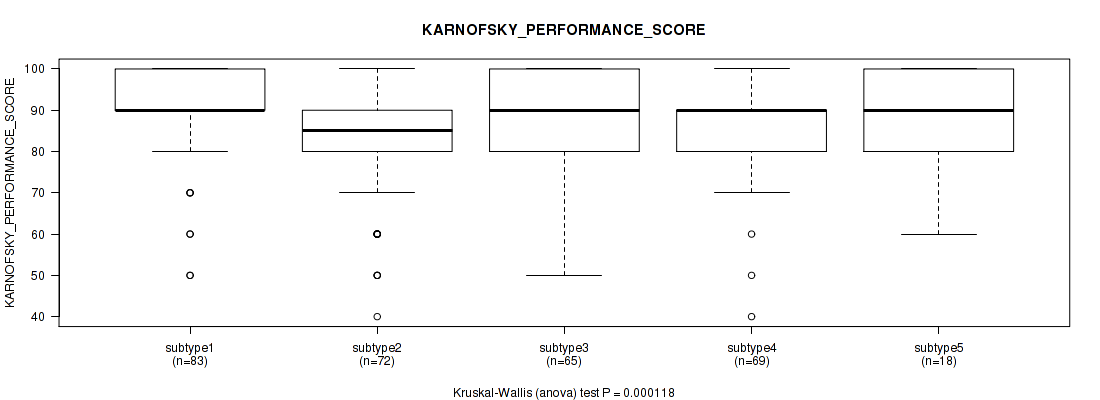
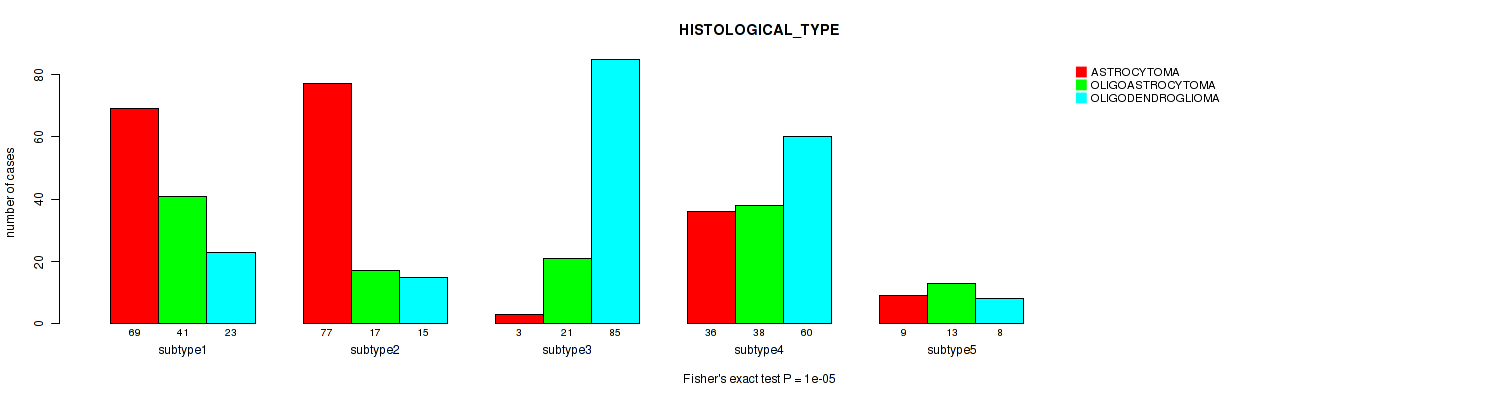
CNMF clustering analysis on sequencing-based mRNA expression data identified 5 subtypes that correlate to 'Time to Death', 'YEARS_TO_BIRTH', 'RADIATION_THERAPY', 'KARNOFSKY_PERFORMANCE_SCORE', and 'HISTOLOGICAL_TYPE'.
-
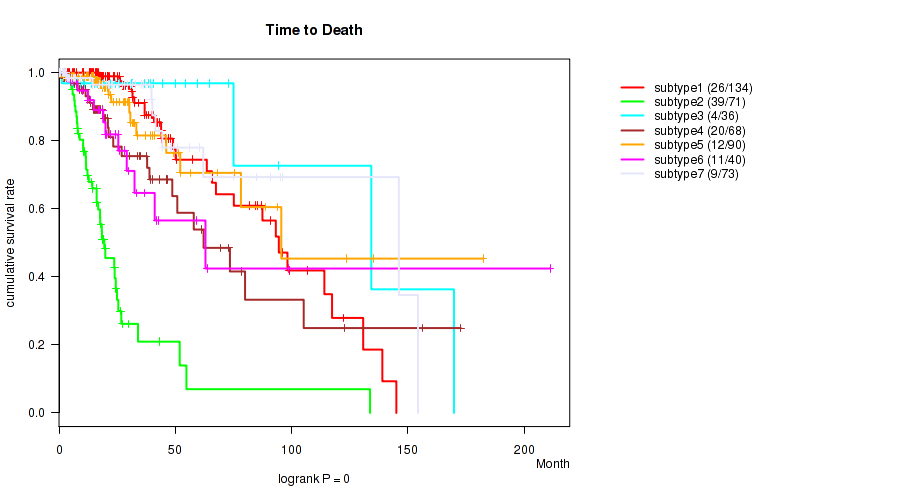
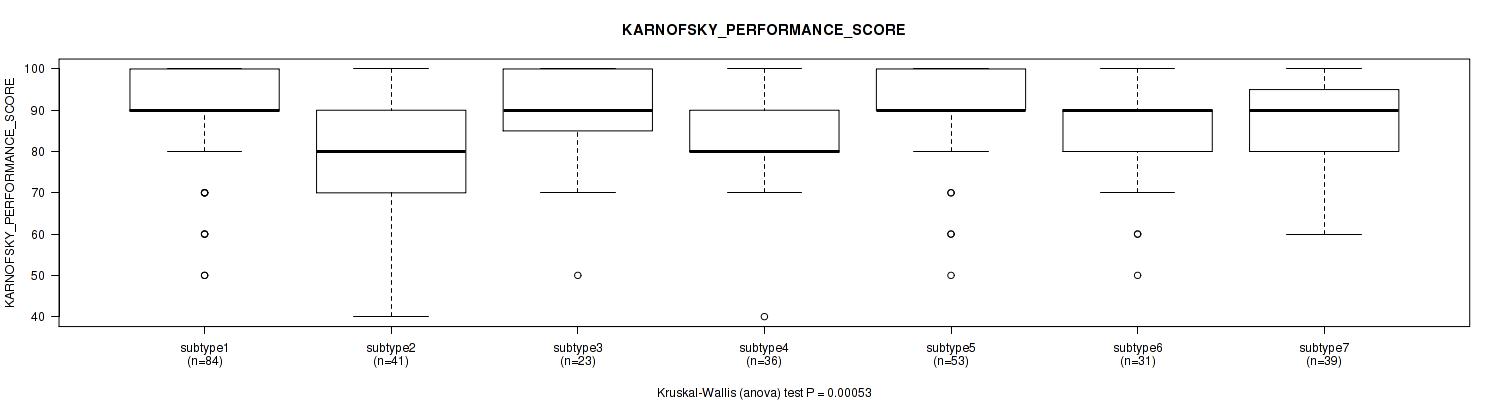
Consensus hierarchical clustering analysis on sequencing-based mRNA expression data identified 7 subtypes that correlate to 'Time to Death', 'YEARS_TO_BIRTH', 'RADIATION_THERAPY', 'KARNOFSKY_PERFORMANCE_SCORE', and 'HISTOLOGICAL_TYPE'.
-
4 subtypes identified in current cancer cohort by 'MIRSEQ CNMF'. These subtypes correlate to 'Time to Death', 'RADIATION_THERAPY', and 'HISTOLOGICAL_TYPE'.
-
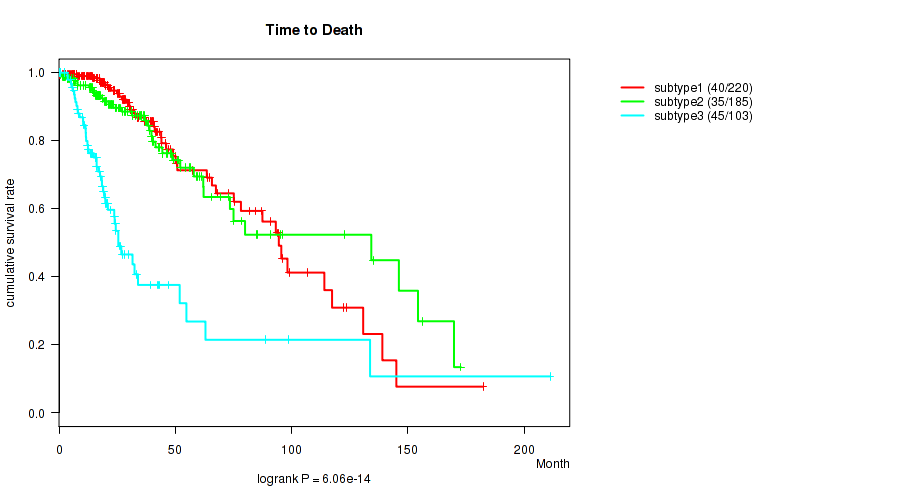
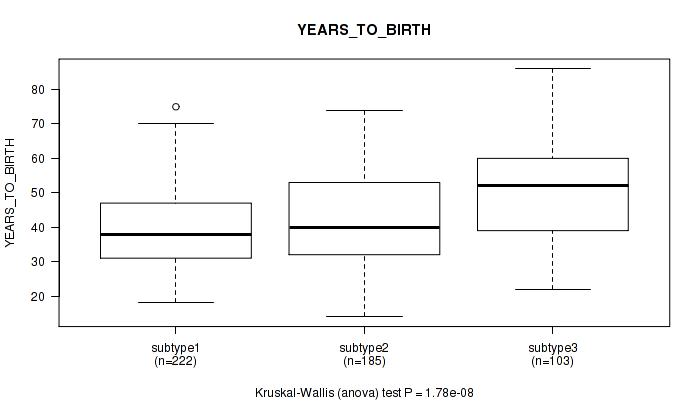
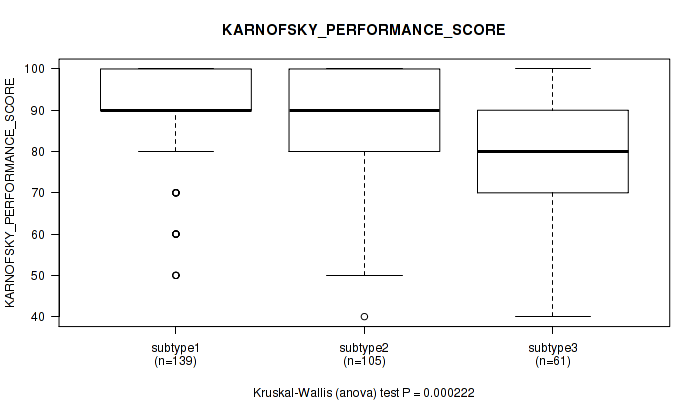
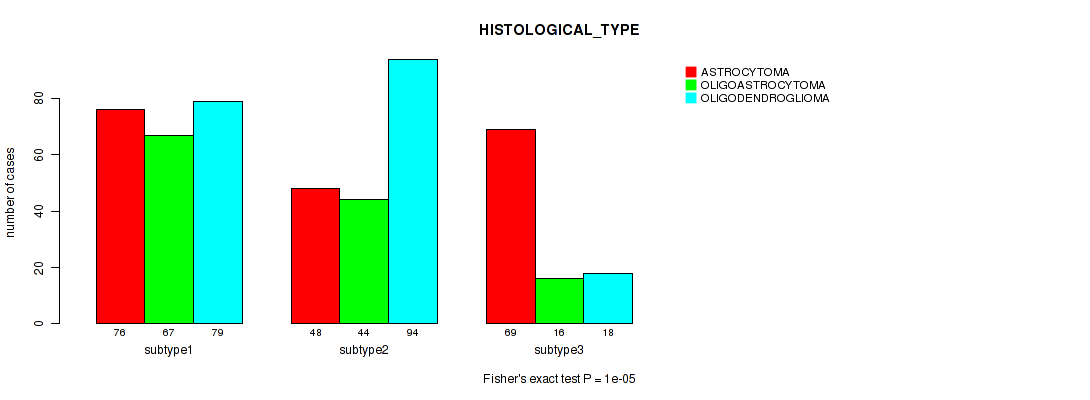
3 subtypes identified in current cancer cohort by 'MIRSEQ CHIERARCHICAL'. These subtypes correlate to 'Time to Death', 'YEARS_TO_BIRTH', 'RADIATION_THERAPY', 'KARNOFSKY_PERFORMANCE_SCORE', and 'HISTOLOGICAL_TYPE'.
-
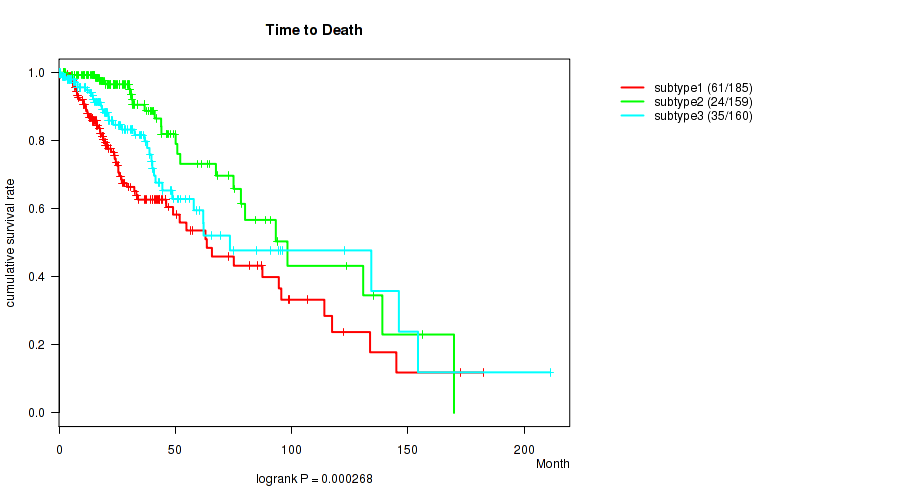
3 subtypes identified in current cancer cohort by 'MIRseq Mature CNMF subtypes'. These subtypes correlate to 'Time to Death', 'GENDER', 'RADIATION_THERAPY', 'KARNOFSKY_PERFORMANCE_SCORE', 'HISTOLOGICAL_TYPE', and 'ETHNICITY'.
-
4 subtypes identified in current cancer cohort by 'MIRseq Mature cHierClus subtypes'. These subtypes correlate to 'Time to Death', 'YEARS_TO_BIRTH', 'RADIATION_THERAPY', 'KARNOFSKY_PERFORMANCE_SCORE', and 'HISTOLOGICAL_TYPE'.
Table 1. Get Full Table Overview of the association between subtypes identified by 12 different clustering approaches and 8 clinical features. Shown in the table are P values (Q values). Thresholded by P value < 0.05 and Q value < 0.25, 49 significant findings detected.
|
Clinical Features |
Time to Death |
YEARS TO BIRTH |
GENDER |
RADIATION THERAPY |
KARNOFSKY PERFORMANCE SCORE |
HISTOLOGICAL TYPE |
RACE | ETHNICITY |
| Statistical Tests | logrank test | Kruskal-Wallis (anova) | Fisher's exact test | Fisher's exact test | Kruskal-Wallis (anova) | Fisher's exact test | Fisher's exact test | Fisher's exact test |
| mRNA CNMF subtypes |
0.377 (0.489) |
0.247 (0.359) |
0.102 (0.172) |
0.693 (0.747) |
0.305 (0.401) |
0.0227 (0.0475) |
0.515 (0.595) |
1 (1.00) |
| mRNA cHierClus subtypes |
0.0372 (0.0743) |
0.0787 (0.14) |
0.15 (0.248) |
0.763 (0.805) |
0.243 (0.359) |
0.00811 (0.0185) |
0.225 (0.342) |
0.43 (0.524) |
| Copy Number Ratio CNMF subtypes |
1.89e-15 (2.26e-14) |
4.56e-16 (7.29e-15) |
0.264 (0.378) |
1e-05 (3.69e-05) |
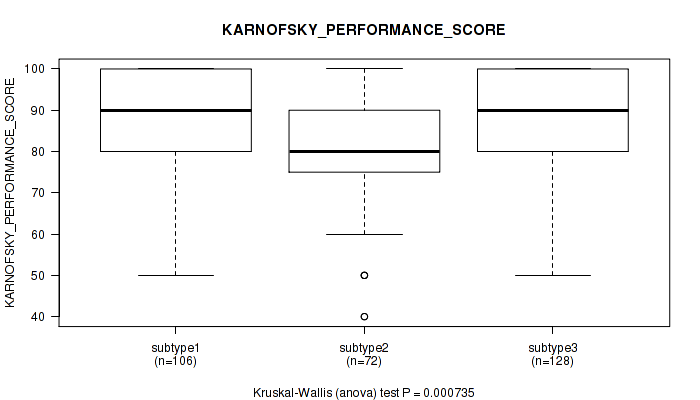
0.000735 (0.00191) |
1e-05 (3.69e-05) |
0.00073 (0.00191) |
1 (1.00) |
| METHLYATION CNMF |
0 (0) |
1.39e-20 (2.68e-19) |
0.514 (0.595) |
1e-05 (3.69e-05) |
0.000561 (0.00158) |
1e-05 (3.69e-05) |
0.0203 (0.0432) |
0.393 (0.496) |
| RPPA CNMF subtypes |
0.000726 (0.00191) |
0.0502 (0.0957) |
0.00375 (0.00878) |
0.383 (0.49) |
0.185 (0.291) |
0.00118 (0.0029) |
0.48 (0.569) |
0.55 (0.622) |
| RPPA cHierClus subtypes |
0.00855 (0.0191) |
0.0687 (0.124) |
0.409 (0.51) |
0.0509 (0.0957) |
0.524 (0.599) |
1e-05 (3.69e-05) |
0.754 (0.804) |
0.283 (0.383) |
| RNAseq CNMF subtypes |
0 (0) |
6.44e-12 (5.62e-11) |
0.623 (0.687) |
1e-05 (3.69e-05) |
0.000118 (0.000397) |
1e-05 (3.69e-05) |
0.296 (0.394) |
0.164 (0.266) |
| RNAseq cHierClus subtypes |
0 (0) |
1.45e-15 (1.98e-14) |
0.279 (0.383) |
1e-05 (3.69e-05) |
0.00053 (0.00154) |
1e-05 (3.69e-05) |
0.177 (0.283) |
0.837 (0.873) |
| MIRSEQ CNMF |
0.0123 (0.0269) |
0.917 (0.936) |
0.69 (0.747) |
0.00199 (0.00478) |
0.0929 (0.162) |
1e-05 (3.69e-05) |
0.269 (0.38) |
0.437 (0.525) |
| MIRSEQ CHIERARCHICAL |
6.06e-14 (6.47e-13) |
1.78e-08 (1.43e-07) |
0.283 (0.383) |
1e-05 (3.69e-05) |
0.000222 (0.000688) |
1e-05 (3.69e-05) |
0.568 (0.634) |
0.233 (0.35) |
| MIRseq Mature CNMF subtypes |
0.000268 (0.000805) |
0.0547 (0.101) |
0.0323 (0.0659) |
0.00014 (0.000448) |
0.0393 (0.0769) |
1e-05 (3.69e-05) |
0.864 (0.892) |
0.0008 (0.00202) |
| MIRseq Mature cHierClus subtypes |
0 (0) |
1.6e-12 (1.54e-11) |
0.0973 (0.167) |
0.00012 (0.000397) |
5.43e-05 (0.000193) |
1e-05 (3.69e-05) |
0.203 (0.314) |
0.431 (0.524) |
Table S1. Description of clustering approach #1: 'mRNA CNMF subtypes'
| Cluster Labels | 1 | 2 | 3 |
|---|---|---|---|
| Number of samples | 9 | 10 | 8 |
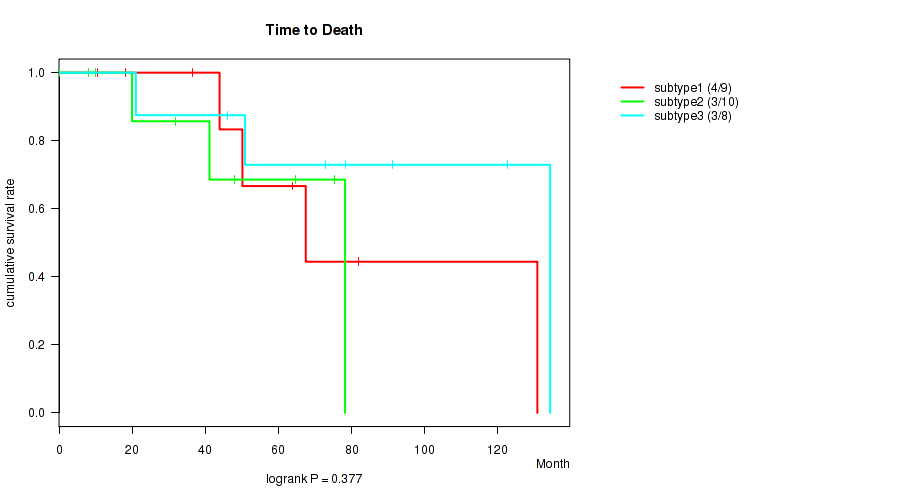
P value = 0.377 (logrank test), Q value = 0.49
Table S2. Clustering Approach #1: 'mRNA CNMF subtypes' versus Clinical Feature #1: 'Time to Death'
| nPatients | nDeath | Duration Range (Median), Month | |
|---|---|---|---|
| ALL | 27 | 10 | 0.1 - 134.3 (50.1) |
| subtype1 | 9 | 4 | 10.6 - 130.8 (50.1) |
| subtype2 | 10 | 3 | 0.1 - 78.2 (36.5) |
| subtype3 | 8 | 3 | 21.0 - 134.3 (75.6) |
Figure S1. Get High-res Image Clustering Approach #1: 'mRNA CNMF subtypes' versus Clinical Feature #1: 'Time to Death'
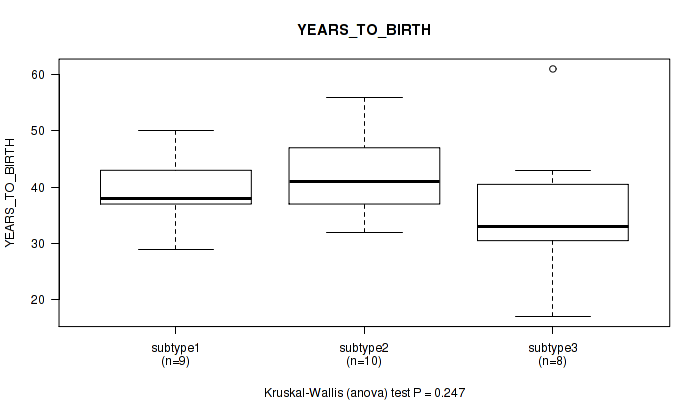
P value = 0.247 (Kruskal-Wallis (anova)), Q value = 0.36
Table S3. Clustering Approach #1: 'mRNA CNMF subtypes' versus Clinical Feature #2: 'YEARS_TO_BIRTH'
| nPatients | Mean (Std.Dev) | |
|---|---|---|
| ALL | 27 | 39.3 (9.1) |
| subtype1 | 9 | 39.2 (6.2) |
| subtype2 | 10 | 42.3 (7.6) |
| subtype3 | 8 | 35.8 (12.6) |
Figure S2. Get High-res Image Clustering Approach #1: 'mRNA CNMF subtypes' versus Clinical Feature #2: 'YEARS_TO_BIRTH'
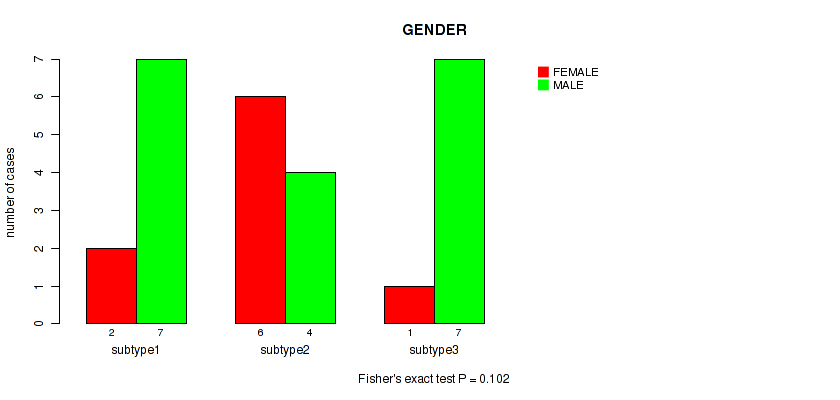
P value = 0.102 (Fisher's exact test), Q value = 0.17
Table S4. Clustering Approach #1: 'mRNA CNMF subtypes' versus Clinical Feature #3: 'GENDER'
| nPatients | FEMALE | MALE |
|---|---|---|
| ALL | 9 | 18 |
| subtype1 | 2 | 7 |
| subtype2 | 6 | 4 |
| subtype3 | 1 | 7 |
Figure S3. Get High-res Image Clustering Approach #1: 'mRNA CNMF subtypes' versus Clinical Feature #3: 'GENDER'
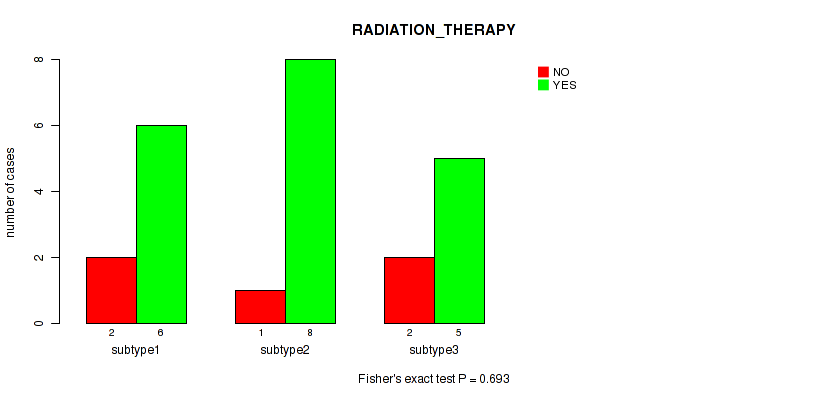
P value = 0.693 (Fisher's exact test), Q value = 0.75
Table S5. Clustering Approach #1: 'mRNA CNMF subtypes' versus Clinical Feature #4: 'RADIATION_THERAPY'
| nPatients | NO | YES |
|---|---|---|
| ALL | 5 | 19 |
| subtype1 | 2 | 6 |
| subtype2 | 1 | 8 |
| subtype3 | 2 | 5 |
Figure S4. Get High-res Image Clustering Approach #1: 'mRNA CNMF subtypes' versus Clinical Feature #4: 'RADIATION_THERAPY'
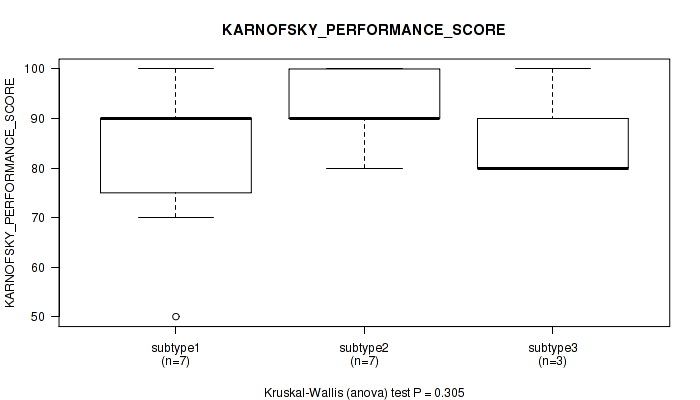
P value = 0.305 (Kruskal-Wallis (anova)), Q value = 0.4
Table S6. Clustering Approach #1: 'mRNA CNMF subtypes' versus Clinical Feature #5: 'KARNOFSKY_PERFORMANCE_SCORE'
| nPatients | Mean (Std.Dev) | |
|---|---|---|
| ALL | 17 | 87.1 (13.1) |
| subtype1 | 7 | 81.4 (16.8) |
| subtype2 | 7 | 92.9 (7.6) |
| subtype3 | 3 | 86.7 (11.5) |
Figure S5. Get High-res Image Clustering Approach #1: 'mRNA CNMF subtypes' versus Clinical Feature #5: 'KARNOFSKY_PERFORMANCE_SCORE'
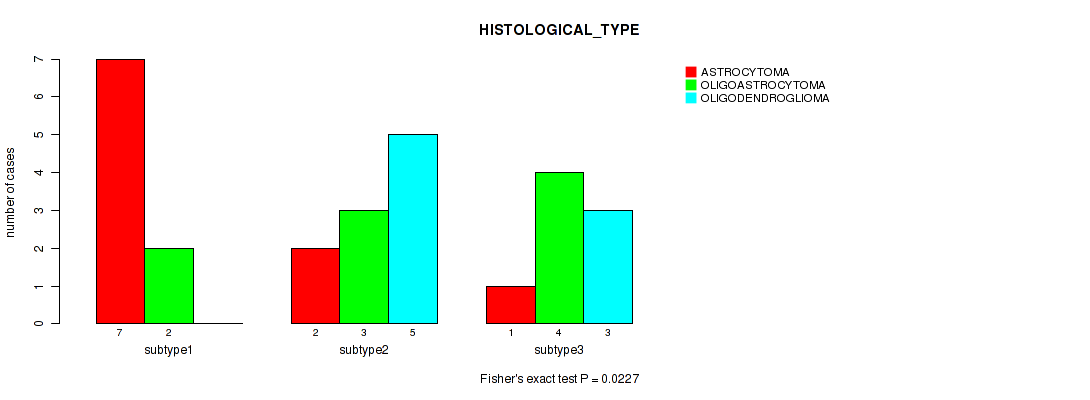
P value = 0.0227 (Fisher's exact test), Q value = 0.047
Table S7. Clustering Approach #1: 'mRNA CNMF subtypes' versus Clinical Feature #6: 'HISTOLOGICAL_TYPE'
| nPatients | ASTROCYTOMA | OLIGOASTROCYTOMA | OLIGODENDROGLIOMA |
|---|---|---|---|
| ALL | 10 | 9 | 8 |
| subtype1 | 7 | 2 | 0 |
| subtype2 | 2 | 3 | 5 |
| subtype3 | 1 | 4 | 3 |
Figure S6. Get High-res Image Clustering Approach #1: 'mRNA CNMF subtypes' versus Clinical Feature #6: 'HISTOLOGICAL_TYPE'
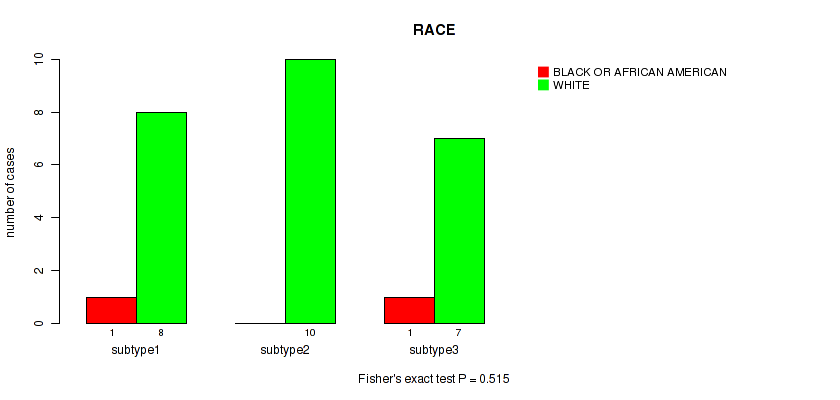
P value = 0.515 (Fisher's exact test), Q value = 0.6
Table S8. Clustering Approach #1: 'mRNA CNMF subtypes' versus Clinical Feature #7: 'RACE'
| nPatients | BLACK OR AFRICAN AMERICAN | WHITE |
|---|---|---|
| ALL | 2 | 25 |
| subtype1 | 1 | 8 |
| subtype2 | 0 | 10 |
| subtype3 | 1 | 7 |
Figure S7. Get High-res Image Clustering Approach #1: 'mRNA CNMF subtypes' versus Clinical Feature #7: 'RACE'
P value = 1 (Fisher's exact test), Q value = 1
Table S9. Clustering Approach #1: 'mRNA CNMF subtypes' versus Clinical Feature #8: 'ETHNICITY'
| nPatients | HISPANIC OR LATINO | NOT HISPANIC OR LATINO |
|---|---|---|
| ALL | 1 | 20 |
| subtype1 | 0 | 6 |
| subtype2 | 1 | 7 |
| subtype3 | 0 | 7 |
Figure S8. Get High-res Image Clustering Approach #1: 'mRNA CNMF subtypes' versus Clinical Feature #8: 'ETHNICITY'
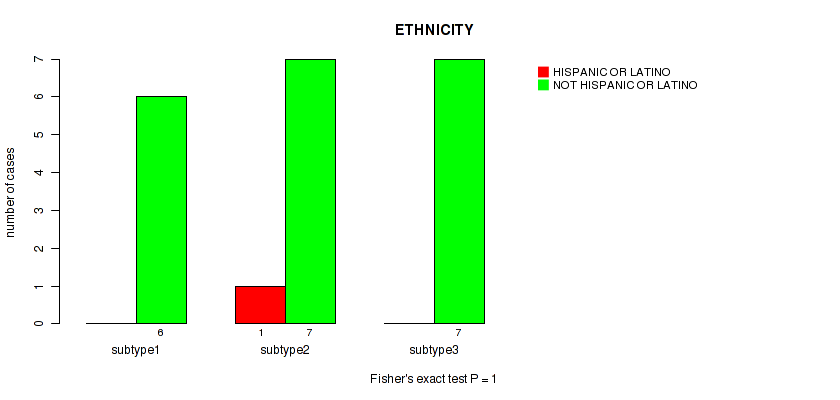
Table S10. Description of clustering approach #2: 'mRNA cHierClus subtypes'
| Cluster Labels | 1 | 2 | 3 | 4 |
|---|---|---|---|---|
| Number of samples | 7 | 7 | 7 | 6 |
P value = 0.0372 (logrank test), Q value = 0.074
Table S11. Clustering Approach #2: 'mRNA cHierClus subtypes' versus Clinical Feature #1: 'Time to Death'
| nPatients | nDeath | Duration Range (Median), Month | |
|---|---|---|---|
| ALL | 27 | 10 | 0.1 - 134.3 (50.1) |
| subtype1 | 7 | 4 | 10.6 - 82.0 (43.9) |
| subtype2 | 7 | 4 | 18.1 - 130.8 (47.9) |
| subtype3 | 7 | 1 | 0.1 - 78.2 (31.8) |
| subtype4 | 6 | 1 | 46.1 - 134.3 (84.7) |
Figure S9. Get High-res Image Clustering Approach #2: 'mRNA cHierClus subtypes' versus Clinical Feature #1: 'Time to Death'
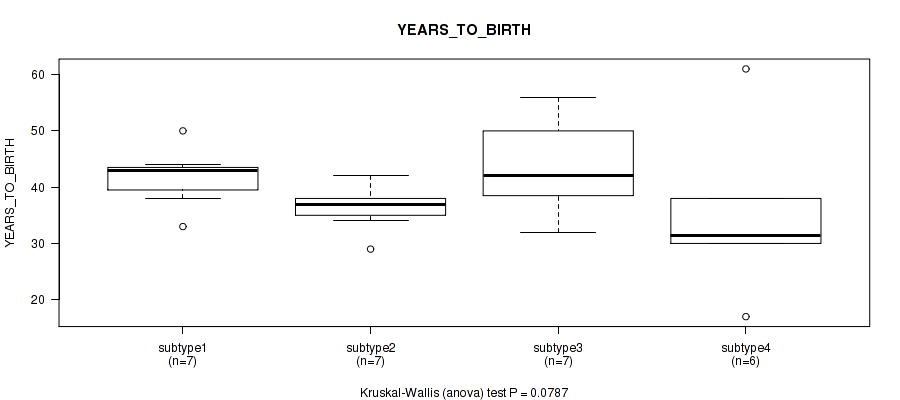
P value = 0.0787 (Kruskal-Wallis (anova)), Q value = 0.14
Table S12. Clustering Approach #2: 'mRNA cHierClus subtypes' versus Clinical Feature #2: 'YEARS_TO_BIRTH'
| nPatients | Mean (Std.Dev) | |
|---|---|---|
| ALL | 27 | 39.3 (9.1) |
| subtype1 | 7 | 41.7 (5.3) |
| subtype2 | 7 | 36.3 (4.0) |
| subtype3 | 7 | 43.9 (8.6) |
| subtype4 | 6 | 34.8 (14.6) |
Figure S10. Get High-res Image Clustering Approach #2: 'mRNA cHierClus subtypes' versus Clinical Feature #2: 'YEARS_TO_BIRTH'
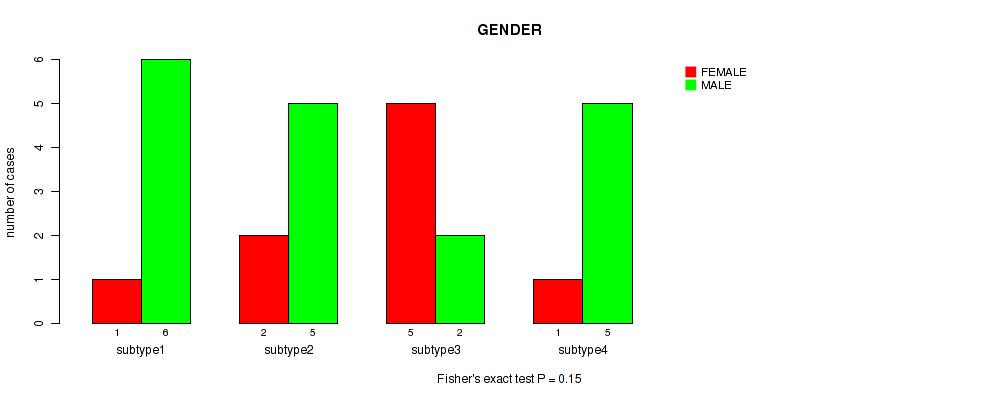
P value = 0.15 (Fisher's exact test), Q value = 0.25
Table S13. Clustering Approach #2: 'mRNA cHierClus subtypes' versus Clinical Feature #3: 'GENDER'
| nPatients | FEMALE | MALE |
|---|---|---|
| ALL | 9 | 18 |
| subtype1 | 1 | 6 |
| subtype2 | 2 | 5 |
| subtype3 | 5 | 2 |
| subtype4 | 1 | 5 |
Figure S11. Get High-res Image Clustering Approach #2: 'mRNA cHierClus subtypes' versus Clinical Feature #3: 'GENDER'
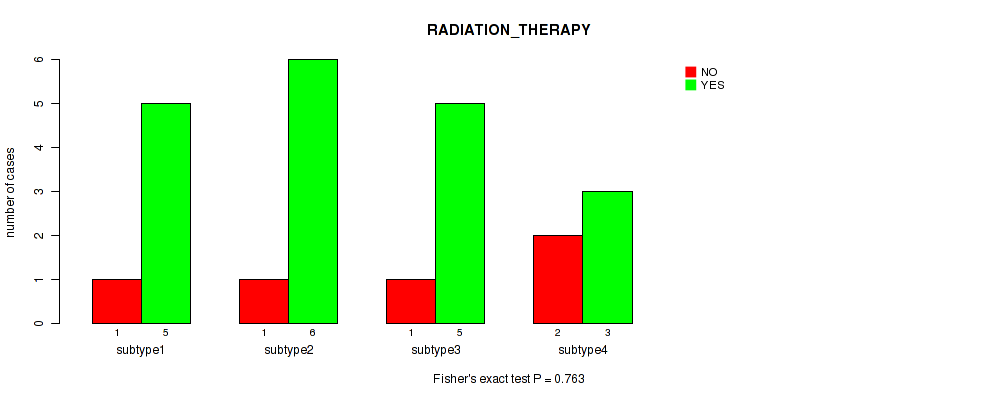
P value = 0.763 (Fisher's exact test), Q value = 0.81
Table S14. Clustering Approach #2: 'mRNA cHierClus subtypes' versus Clinical Feature #4: 'RADIATION_THERAPY'
| nPatients | NO | YES |
|---|---|---|
| ALL | 5 | 19 |
| subtype1 | 1 | 5 |
| subtype2 | 1 | 6 |
| subtype3 | 1 | 5 |
| subtype4 | 2 | 3 |
Figure S12. Get High-res Image Clustering Approach #2: 'mRNA cHierClus subtypes' versus Clinical Feature #4: 'RADIATION_THERAPY'
P value = 0.243 (Kruskal-Wallis (anova)), Q value = 0.36
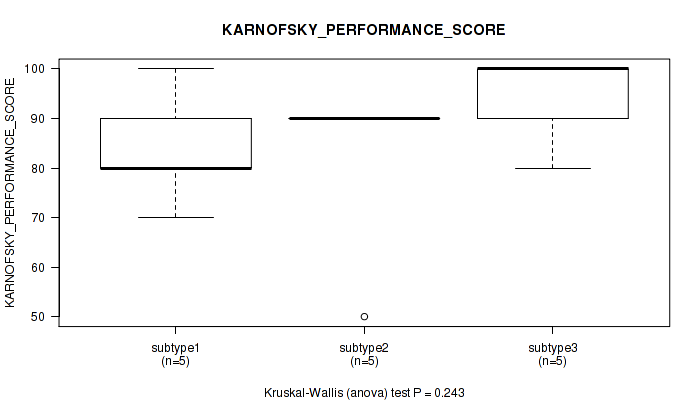
Table S15. Clustering Approach #2: 'mRNA cHierClus subtypes' versus Clinical Feature #5: 'KARNOFSKY_PERFORMANCE_SCORE'
| nPatients | Mean (Std.Dev) | |
|---|---|---|
| ALL | 17 | 87.1 (13.1) |
| subtype1 | 5 | 84.0 (11.4) |
| subtype2 | 5 | 82.0 (17.9) |
| subtype3 | 5 | 94.0 (8.9) |
| subtype4 | 2 | 90.0 (14.1) |
Figure S13. Get High-res Image Clustering Approach #2: 'mRNA cHierClus subtypes' versus Clinical Feature #5: 'KARNOFSKY_PERFORMANCE_SCORE'
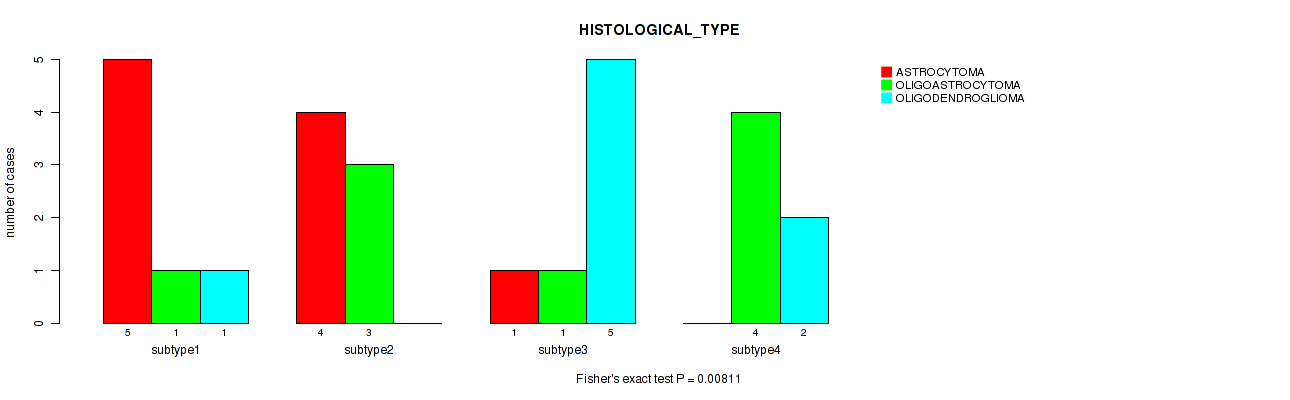
P value = 0.00811 (Fisher's exact test), Q value = 0.019
Table S16. Clustering Approach #2: 'mRNA cHierClus subtypes' versus Clinical Feature #6: 'HISTOLOGICAL_TYPE'
| nPatients | ASTROCYTOMA | OLIGOASTROCYTOMA | OLIGODENDROGLIOMA |
|---|---|---|---|
| ALL | 10 | 9 | 8 |
| subtype1 | 5 | 1 | 1 |
| subtype2 | 4 | 3 | 0 |
| subtype3 | 1 | 1 | 5 |
| subtype4 | 0 | 4 | 2 |
Figure S14. Get High-res Image Clustering Approach #2: 'mRNA cHierClus subtypes' versus Clinical Feature #6: 'HISTOLOGICAL_TYPE'
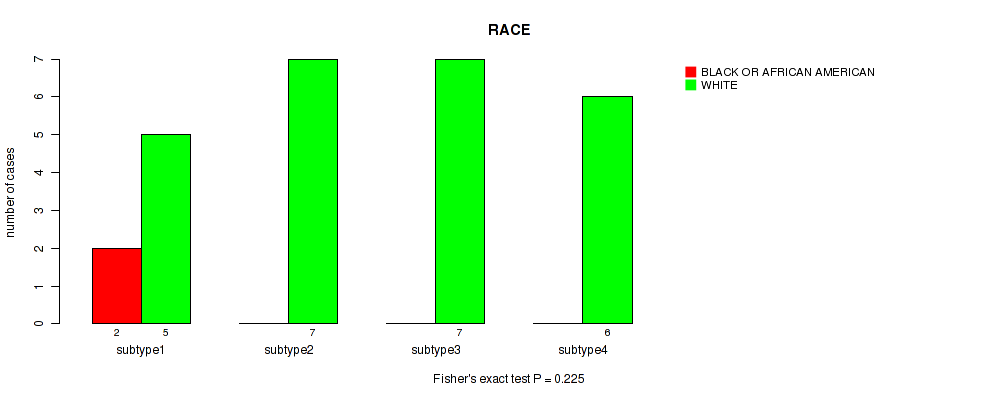
P value = 0.225 (Fisher's exact test), Q value = 0.34
Table S17. Clustering Approach #2: 'mRNA cHierClus subtypes' versus Clinical Feature #7: 'RACE'
| nPatients | BLACK OR AFRICAN AMERICAN | WHITE |
|---|---|---|
| ALL | 2 | 25 |
| subtype1 | 2 | 5 |
| subtype2 | 0 | 7 |
| subtype3 | 0 | 7 |
| subtype4 | 0 | 6 |
Figure S15. Get High-res Image Clustering Approach #2: 'mRNA cHierClus subtypes' versus Clinical Feature #7: 'RACE'
P value = 0.43 (Fisher's exact test), Q value = 0.52
Table S18. Clustering Approach #2: 'mRNA cHierClus subtypes' versus Clinical Feature #8: 'ETHNICITY'
| nPatients | HISPANIC OR LATINO | NOT HISPANIC OR LATINO |
|---|---|---|
| ALL | 1 | 20 |
| subtype1 | 0 | 4 |
| subtype2 | 0 | 6 |
| subtype3 | 1 | 4 |
| subtype4 | 0 | 6 |
Figure S16. Get High-res Image Clustering Approach #2: 'mRNA cHierClus subtypes' versus Clinical Feature #8: 'ETHNICITY'
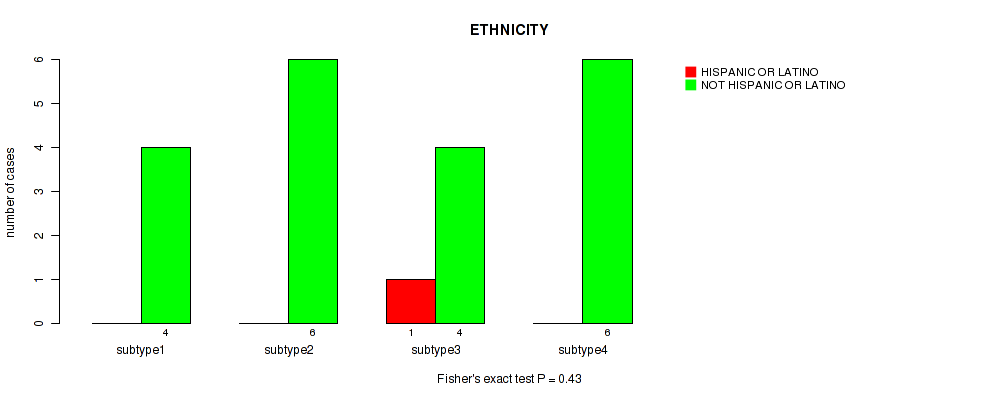
Table S19. Description of clustering approach #3: 'Copy Number Ratio CNMF subtypes'
| Cluster Labels | 1 | 2 | 3 |
|---|---|---|---|
| Number of samples | 171 | 120 | 221 |
P value = 1.89e-15 (logrank test), Q value = 2.3e-14
Table S20. Clustering Approach #3: 'Copy Number Ratio CNMF subtypes' versus Clinical Feature #1: 'Time to Death'
| nPatients | nDeath | Duration Range (Median), Month | |
|---|---|---|---|
| ALL | 509 | 121 | 0.0 - 211.2 (20.8) |
| subtype1 | 171 | 40 | 0.1 - 156.2 (25.9) |
| subtype2 | 119 | 54 | 0.1 - 211.2 (17.0) |
| subtype3 | 219 | 27 | 0.0 - 182.3 (22.6) |
Figure S17. Get High-res Image Clustering Approach #3: 'Copy Number Ratio CNMF subtypes' versus Clinical Feature #1: 'Time to Death'
P value = 4.56e-16 (Kruskal-Wallis (anova)), Q value = 7.3e-15
Table S21. Clustering Approach #3: 'Copy Number Ratio CNMF subtypes' versus Clinical Feature #2: 'YEARS_TO_BIRTH'
| nPatients | Mean (Std.Dev) | |
|---|---|---|
| ALL | 511 | 43.0 (13.3) |
| subtype1 | 171 | 37.7 (11.4) |
| subtype2 | 120 | 51.0 (12.6) |
| subtype3 | 220 | 42.8 (13.1) |
Figure S18. Get High-res Image Clustering Approach #3: 'Copy Number Ratio CNMF subtypes' versus Clinical Feature #2: 'YEARS_TO_BIRTH'
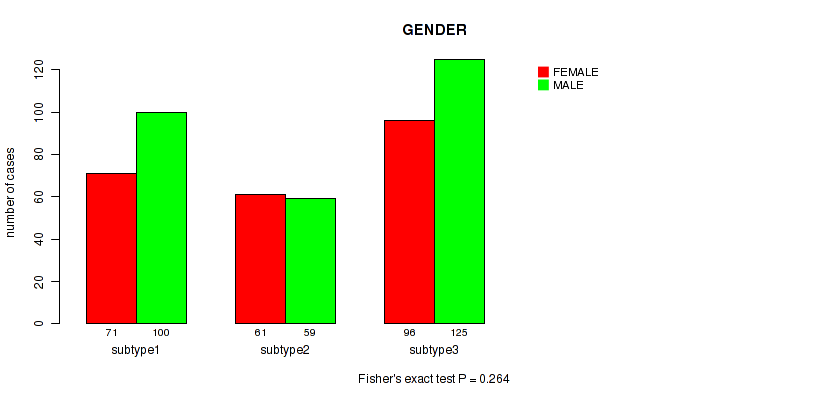
P value = 0.264 (Fisher's exact test), Q value = 0.38
Table S22. Clustering Approach #3: 'Copy Number Ratio CNMF subtypes' versus Clinical Feature #3: 'GENDER'
| nPatients | FEMALE | MALE |
|---|---|---|
| ALL | 228 | 284 |
| subtype1 | 71 | 100 |
| subtype2 | 61 | 59 |
| subtype3 | 96 | 125 |
Figure S19. Get High-res Image Clustering Approach #3: 'Copy Number Ratio CNMF subtypes' versus Clinical Feature #3: 'GENDER'
P value = 1e-05 (Fisher's exact test), Q value = 3.7e-05
Table S23. Clustering Approach #3: 'Copy Number Ratio CNMF subtypes' versus Clinical Feature #4: 'RADIATION_THERAPY'
| nPatients | NO | YES |
|---|---|---|
| ALL | 184 | 293 |
| subtype1 | 45 | 116 |
| subtype2 | 30 | 79 |
| subtype3 | 109 | 98 |
Figure S20. Get High-res Image Clustering Approach #3: 'Copy Number Ratio CNMF subtypes' versus Clinical Feature #4: 'RADIATION_THERAPY'
P value = 0.000735 (Kruskal-Wallis (anova)), Q value = 0.0019
Table S24. Clustering Approach #3: 'Copy Number Ratio CNMF subtypes' versus Clinical Feature #5: 'KARNOFSKY_PERFORMANCE_SCORE'
| nPatients | Mean (Std.Dev) | |
|---|---|---|
| ALL | 306 | 86.6 (12.6) |
| subtype1 | 106 | 87.9 (11.5) |
| subtype2 | 72 | 81.2 (15.1) |
| subtype3 | 128 | 88.6 (11.0) |
Figure S21. Get High-res Image Clustering Approach #3: 'Copy Number Ratio CNMF subtypes' versus Clinical Feature #5: 'KARNOFSKY_PERFORMANCE_SCORE'
P value = 1e-05 (Fisher's exact test), Q value = 3.7e-05
Table S25. Clustering Approach #3: 'Copy Number Ratio CNMF subtypes' versus Clinical Feature #6: 'HISTOLOGICAL_TYPE'
| nPatients | ASTROCYTOMA | OLIGOASTROCYTOMA | OLIGODENDROGLIOMA |
|---|---|---|---|
| ALL | 194 | 129 | 189 |
| subtype1 | 101 | 44 | 26 |
| subtype2 | 57 | 33 | 30 |
| subtype3 | 36 | 52 | 133 |
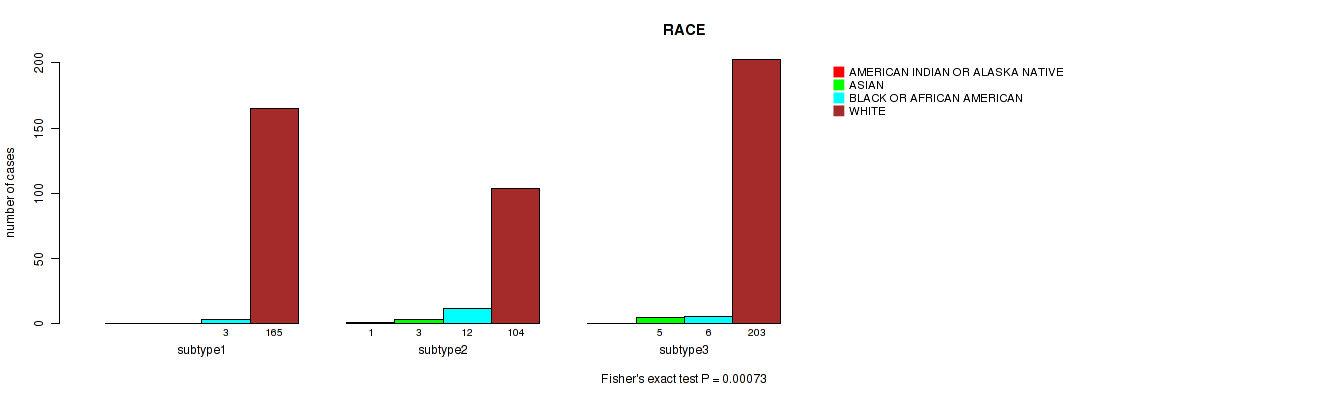
Figure S22. Get High-res Image Clustering Approach #3: 'Copy Number Ratio CNMF subtypes' versus Clinical Feature #6: 'HISTOLOGICAL_TYPE'
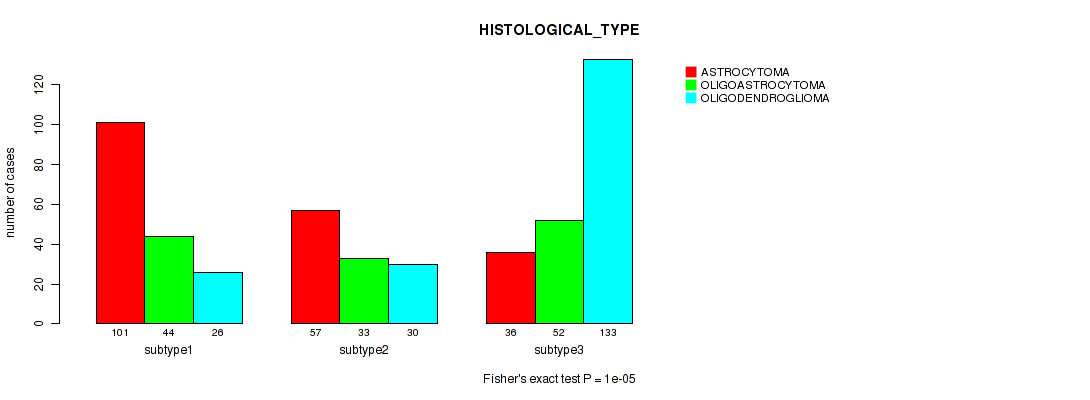
P value = 0.00073 (Fisher's exact test), Q value = 0.0019
Table S26. Clustering Approach #3: 'Copy Number Ratio CNMF subtypes' versus Clinical Feature #7: 'RACE'
| nPatients | AMERICAN INDIAN OR ALASKA NATIVE | ASIAN | BLACK OR AFRICAN AMERICAN | WHITE |
|---|---|---|---|---|
| ALL | 1 | 8 | 21 | 472 |
| subtype1 | 0 | 0 | 3 | 165 |
| subtype2 | 1 | 3 | 12 | 104 |
| subtype3 | 0 | 5 | 6 | 203 |
Figure S23. Get High-res Image Clustering Approach #3: 'Copy Number Ratio CNMF subtypes' versus Clinical Feature #7: 'RACE'
P value = 1 (Fisher's exact test), Q value = 1
Table S27. Clustering Approach #3: 'Copy Number Ratio CNMF subtypes' versus Clinical Feature #8: 'ETHNICITY'
| nPatients | HISPANIC OR LATINO | NOT HISPANIC OR LATINO |
|---|---|---|
| ALL | 32 | 446 |
| subtype1 | 10 | 146 |
| subtype2 | 8 | 106 |
| subtype3 | 14 | 194 |
Figure S24. Get High-res Image Clustering Approach #3: 'Copy Number Ratio CNMF subtypes' versus Clinical Feature #8: 'ETHNICITY'
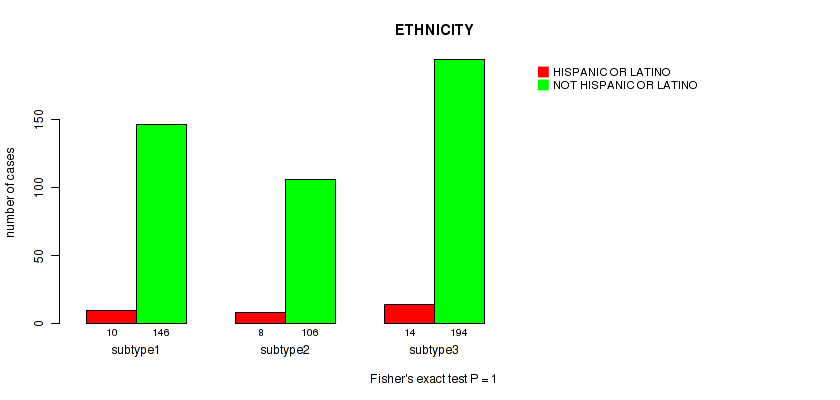
Table S28. Description of clustering approach #4: 'METHLYATION CNMF'
| Cluster Labels | 1 | 2 | 3 | 4 |
|---|---|---|---|---|
| Number of samples | 224 | 81 | 168 | 42 |
P value = 0 (logrank test), Q value = 0
Table S29. Clustering Approach #4: 'METHLYATION CNMF' versus Clinical Feature #1: 'Time to Death'
| nPatients | nDeath | Duration Range (Median), Month | |
|---|---|---|---|
| ALL | 512 | 121 | 0.0 - 211.2 (20.8) |
| subtype1 | 223 | 44 | 0.0 - 172.8 (25.4) |
| subtype2 | 81 | 49 | 0.1 - 211.2 (14.5) |
| subtype3 | 166 | 19 | 0.1 - 182.3 (21.8) |
| subtype4 | 42 | 9 | 0.1 - 146.1 (25.5) |
Figure S25. Get High-res Image Clustering Approach #4: 'METHLYATION CNMF' versus Clinical Feature #1: 'Time to Death'
P value = 1.39e-20 (Kruskal-Wallis (anova)), Q value = 2.7e-19
Table S30. Clustering Approach #4: 'METHLYATION CNMF' versus Clinical Feature #2: 'YEARS_TO_BIRTH'
| nPatients | Mean (Std.Dev) | |
|---|---|---|
| ALL | 514 | 42.9 (13.4) |
| subtype1 | 224 | 38.0 (11.0) |
| subtype2 | 81 | 54.2 (12.3) |
| subtype3 | 167 | 45.3 (12.6) |
| subtype4 | 42 | 38.0 (14.3) |
Figure S26. Get High-res Image Clustering Approach #4: 'METHLYATION CNMF' versus Clinical Feature #2: 'YEARS_TO_BIRTH'
P value = 0.514 (Fisher's exact test), Q value = 0.6
Table S31. Clustering Approach #4: 'METHLYATION CNMF' versus Clinical Feature #3: 'GENDER'
| nPatients | FEMALE | MALE |
|---|---|---|
| ALL | 230 | 285 |
| subtype1 | 96 | 128 |
| subtype2 | 38 | 43 |
| subtype3 | 73 | 95 |
| subtype4 | 23 | 19 |
Figure S27. Get High-res Image Clustering Approach #4: 'METHLYATION CNMF' versus Clinical Feature #3: 'GENDER'
P value = 1e-05 (Fisher's exact test), Q value = 3.7e-05
Table S32. Clustering Approach #4: 'METHLYATION CNMF' versus Clinical Feature #4: 'RADIATION_THERAPY'
| nPatients | NO | YES |
|---|---|---|
| ALL | 186 | 294 |
| subtype1 | 64 | 149 |
| subtype2 | 14 | 60 |
| subtype3 | 91 | 64 |
| subtype4 | 17 | 21 |
Figure S28. Get High-res Image Clustering Approach #4: 'METHLYATION CNMF' versus Clinical Feature #4: 'RADIATION_THERAPY'
P value = 0.000561 (Kruskal-Wallis (anova)), Q value = 0.0016
Table S33. Clustering Approach #4: 'METHLYATION CNMF' versus Clinical Feature #5: 'KARNOFSKY_PERFORMANCE_SCORE'
| nPatients | Mean (Std.Dev) | |
|---|---|---|
| ALL | 307 | 86.6 (12.6) |
| subtype1 | 141 | 87.6 (11.9) |
| subtype2 | 50 | 80.8 (14.3) |
| subtype3 | 95 | 88.8 (11.8) |
| subtype4 | 21 | 83.8 (11.6) |
Figure S29. Get High-res Image Clustering Approach #4: 'METHLYATION CNMF' versus Clinical Feature #5: 'KARNOFSKY_PERFORMANCE_SCORE'
P value = 1e-05 (Fisher's exact test), Q value = 3.7e-05
Table S34. Clustering Approach #4: 'METHLYATION CNMF' versus Clinical Feature #6: 'HISTOLOGICAL_TYPE'
| nPatients | ASTROCYTOMA | OLIGOASTROCYTOMA | OLIGODENDROGLIOMA |
|---|---|---|---|
| ALL | 194 | 130 | 191 |
| subtype1 | 121 | 70 | 33 |
| subtype2 | 53 | 12 | 16 |
| subtype3 | 5 | 36 | 127 |
| subtype4 | 15 | 12 | 15 |
Figure S30. Get High-res Image Clustering Approach #4: 'METHLYATION CNMF' versus Clinical Feature #6: 'HISTOLOGICAL_TYPE'
P value = 0.0203 (Fisher's exact test), Q value = 0.043
Table S35. Clustering Approach #4: 'METHLYATION CNMF' versus Clinical Feature #7: 'RACE'
| nPatients | AMERICAN INDIAN OR ALASKA NATIVE | ASIAN | BLACK OR AFRICAN AMERICAN | WHITE |
|---|---|---|---|---|
| ALL | 1 | 8 | 21 | 475 |
| subtype1 | 0 | 1 | 6 | 215 |
| subtype2 | 1 | 3 | 6 | 71 |
| subtype3 | 0 | 4 | 5 | 153 |
| subtype4 | 0 | 0 | 4 | 36 |
Figure S31. Get High-res Image Clustering Approach #4: 'METHLYATION CNMF' versus Clinical Feature #7: 'RACE'
P value = 0.393 (Fisher's exact test), Q value = 0.5
Table S36. Clustering Approach #4: 'METHLYATION CNMF' versus Clinical Feature #8: 'ETHNICITY'
| nPatients | HISPANIC OR LATINO | NOT HISPANIC OR LATINO |
|---|---|---|
| ALL | 32 | 449 |
| subtype1 | 14 | 194 |
| subtype2 | 2 | 75 |
| subtype3 | 13 | 144 |
| subtype4 | 3 | 36 |
Figure S32. Get High-res Image Clustering Approach #4: 'METHLYATION CNMF' versus Clinical Feature #8: 'ETHNICITY'
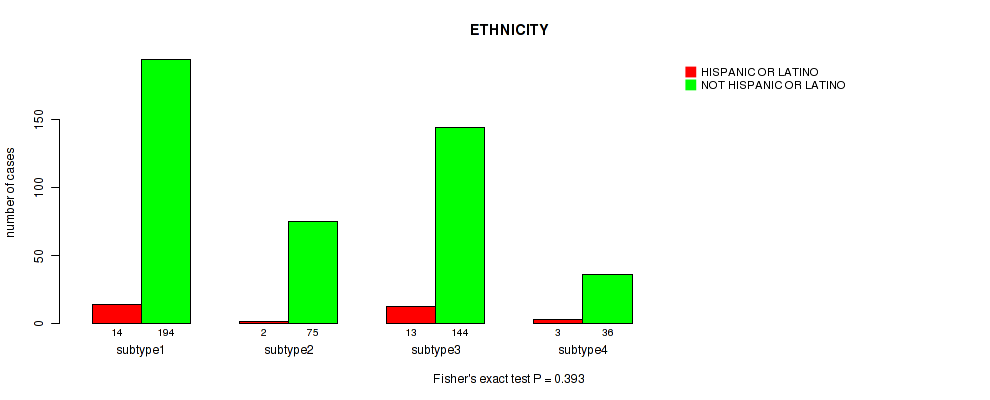
Table S37. Description of clustering approach #5: 'RPPA CNMF subtypes'
| Cluster Labels | 1 | 2 | 3 | 4 |
|---|---|---|---|---|
| Number of samples | 90 | 95 | 126 | 117 |
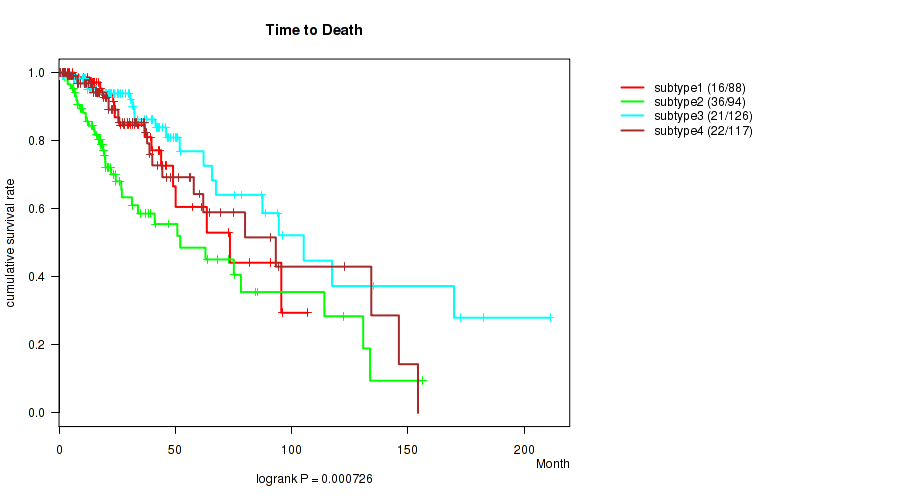
P value = 0.000726 (logrank test), Q value = 0.0019
Table S38. Clustering Approach #5: 'RPPA CNMF subtypes' versus Clinical Feature #1: 'Time to Death'
| nPatients | nDeath | Duration Range (Median), Month | |
|---|---|---|---|
| ALL | 425 | 95 | 0.0 - 211.2 (20.0) |
| subtype1 | 88 | 16 | 0.0 - 107.0 (23.4) |
| subtype2 | 94 | 36 | 0.1 - 156.2 (19.1) |
| subtype3 | 126 | 21 | 0.1 - 211.2 (21.5) |
| subtype4 | 117 | 22 | 0.1 - 154.4 (18.6) |
Figure S33. Get High-res Image Clustering Approach #5: 'RPPA CNMF subtypes' versus Clinical Feature #1: 'Time to Death'
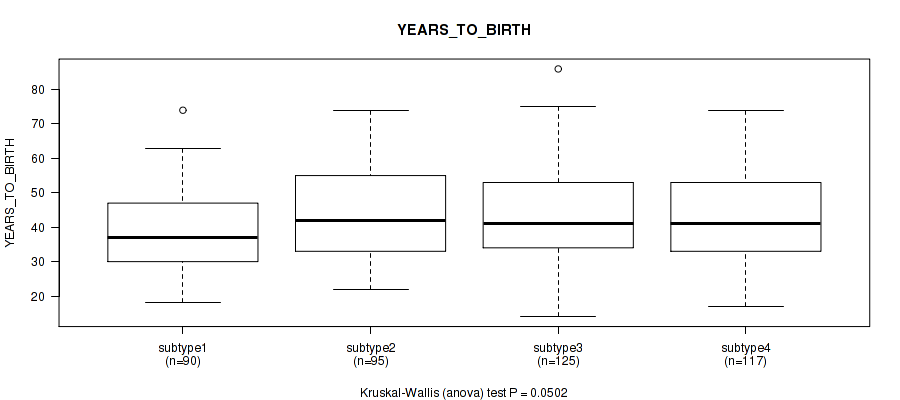
P value = 0.0502 (Kruskal-Wallis (anova)), Q value = 0.096
Table S39. Clustering Approach #5: 'RPPA CNMF subtypes' versus Clinical Feature #2: 'YEARS_TO_BIRTH'
| nPatients | Mean (Std.Dev) | |
|---|---|---|
| ALL | 427 | 42.7 (13.3) |
| subtype1 | 90 | 39.2 (12.0) |
| subtype2 | 95 | 44.0 (13.9) |
| subtype3 | 125 | 43.3 (13.1) |
| subtype4 | 117 | 43.7 (13.8) |
Figure S34. Get High-res Image Clustering Approach #5: 'RPPA CNMF subtypes' versus Clinical Feature #2: 'YEARS_TO_BIRTH'
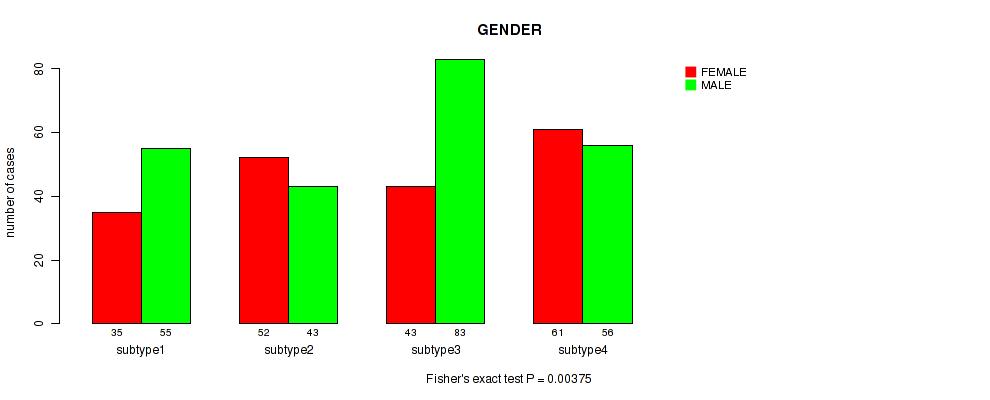
P value = 0.00375 (Fisher's exact test), Q value = 0.0088
Table S40. Clustering Approach #5: 'RPPA CNMF subtypes' versus Clinical Feature #3: 'GENDER'
| nPatients | FEMALE | MALE |
|---|---|---|
| ALL | 191 | 237 |
| subtype1 | 35 | 55 |
| subtype2 | 52 | 43 |
| subtype3 | 43 | 83 |
| subtype4 | 61 | 56 |
Figure S35. Get High-res Image Clustering Approach #5: 'RPPA CNMF subtypes' versus Clinical Feature #3: 'GENDER'
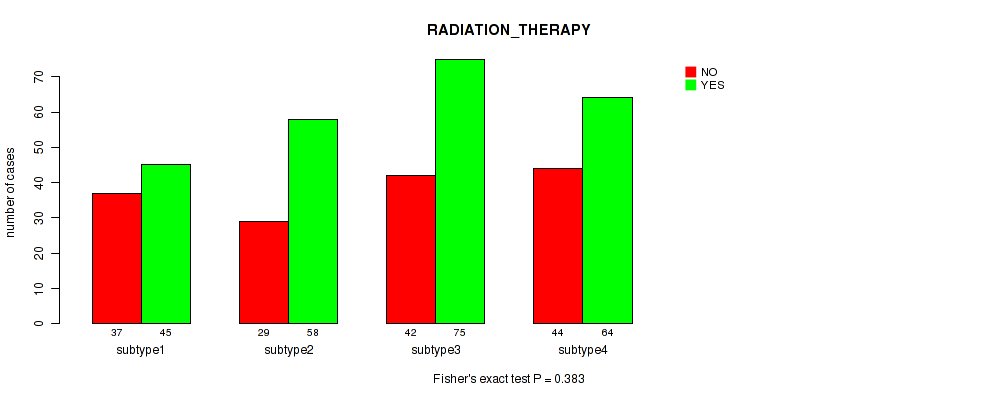
P value = 0.383 (Fisher's exact test), Q value = 0.49
Table S41. Clustering Approach #5: 'RPPA CNMF subtypes' versus Clinical Feature #4: 'RADIATION_THERAPY'
| nPatients | NO | YES |
|---|---|---|
| ALL | 152 | 242 |
| subtype1 | 37 | 45 |
| subtype2 | 29 | 58 |
| subtype3 | 42 | 75 |
| subtype4 | 44 | 64 |
Figure S36. Get High-res Image Clustering Approach #5: 'RPPA CNMF subtypes' versus Clinical Feature #4: 'RADIATION_THERAPY'
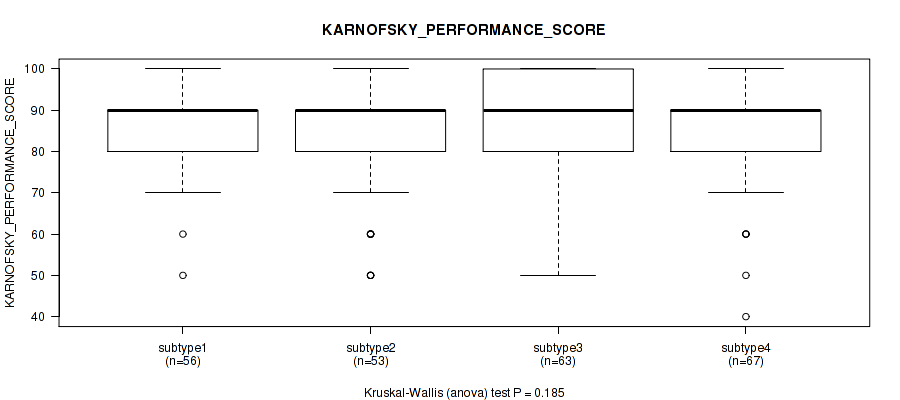
P value = 0.185 (Kruskal-Wallis (anova)), Q value = 0.29
Table S42. Clustering Approach #5: 'RPPA CNMF subtypes' versus Clinical Feature #5: 'KARNOFSKY_PERFORMANCE_SCORE'
| nPatients | Mean (Std.Dev) | |
|---|---|---|
| ALL | 239 | 85.7 (12.7) |
| subtype1 | 56 | 86.8 (10.8) |
| subtype2 | 53 | 82.5 (14.7) |
| subtype3 | 63 | 88.1 (11.6) |
| subtype4 | 67 | 85.1 (13.3) |
Figure S37. Get High-res Image Clustering Approach #5: 'RPPA CNMF subtypes' versus Clinical Feature #5: 'KARNOFSKY_PERFORMANCE_SCORE'
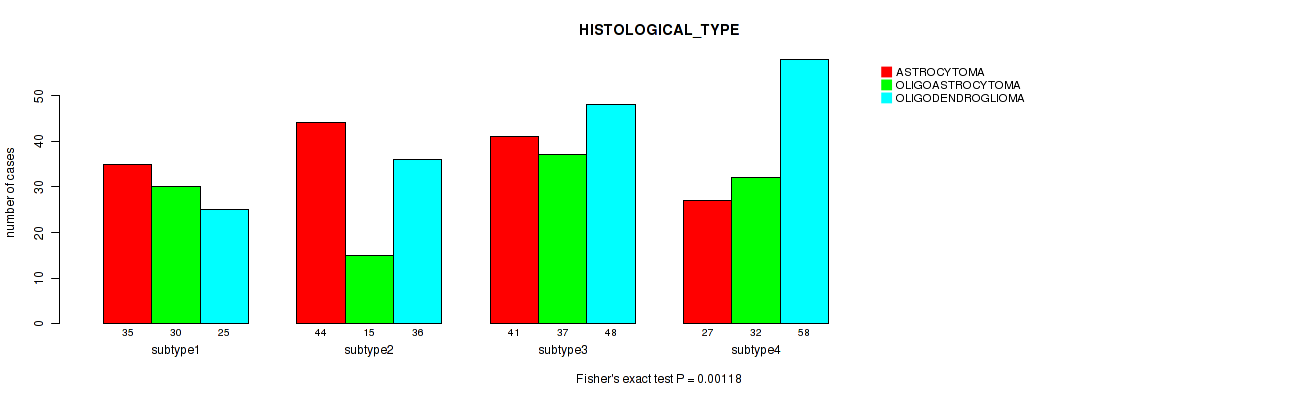
P value = 0.00118 (Fisher's exact test), Q value = 0.0029
Table S43. Clustering Approach #5: 'RPPA CNMF subtypes' versus Clinical Feature #6: 'HISTOLOGICAL_TYPE'
| nPatients | ASTROCYTOMA | OLIGOASTROCYTOMA | OLIGODENDROGLIOMA |
|---|---|---|---|
| ALL | 147 | 114 | 167 |
| subtype1 | 35 | 30 | 25 |
| subtype2 | 44 | 15 | 36 |
| subtype3 | 41 | 37 | 48 |
| subtype4 | 27 | 32 | 58 |
Figure S38. Get High-res Image Clustering Approach #5: 'RPPA CNMF subtypes' versus Clinical Feature #6: 'HISTOLOGICAL_TYPE'
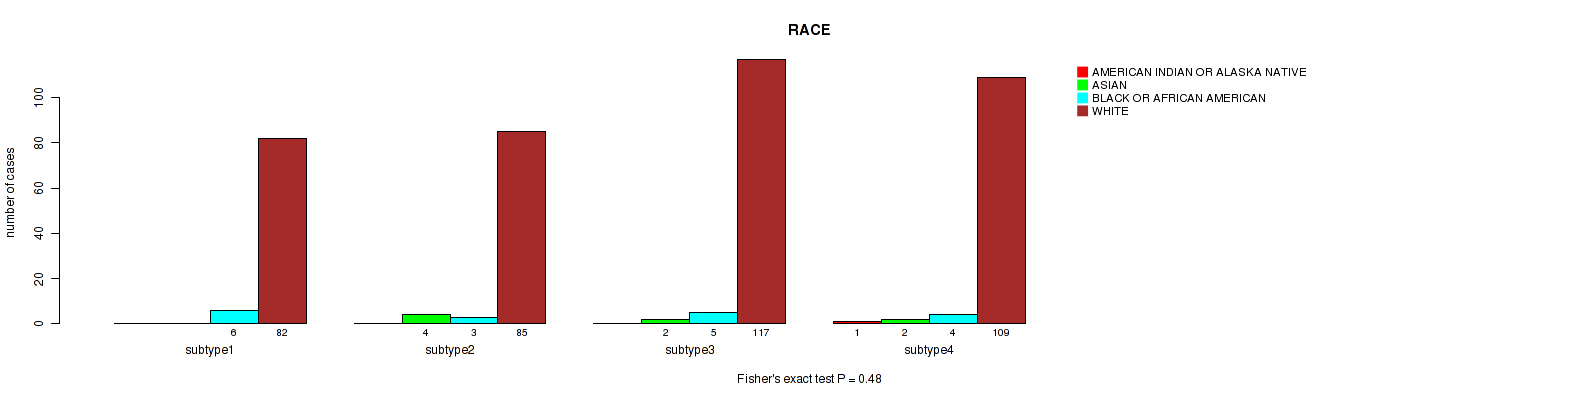
P value = 0.48 (Fisher's exact test), Q value = 0.57
Table S44. Clustering Approach #5: 'RPPA CNMF subtypes' versus Clinical Feature #7: 'RACE'
| nPatients | AMERICAN INDIAN OR ALASKA NATIVE | ASIAN | BLACK OR AFRICAN AMERICAN | WHITE |
|---|---|---|---|---|
| ALL | 1 | 8 | 18 | 393 |
| subtype1 | 0 | 0 | 6 | 82 |
| subtype2 | 0 | 4 | 3 | 85 |
| subtype3 | 0 | 2 | 5 | 117 |
| subtype4 | 1 | 2 | 4 | 109 |
Figure S39. Get High-res Image Clustering Approach #5: 'RPPA CNMF subtypes' versus Clinical Feature #7: 'RACE'
P value = 0.55 (Fisher's exact test), Q value = 0.62
Table S45. Clustering Approach #5: 'RPPA CNMF subtypes' versus Clinical Feature #8: 'ETHNICITY'
| nPatients | HISPANIC OR LATINO | NOT HISPANIC OR LATINO |
|---|---|---|
| ALL | 26 | 377 |
| subtype1 | 8 | 76 |
| subtype2 | 6 | 83 |
| subtype3 | 7 | 111 |
| subtype4 | 5 | 107 |
Figure S40. Get High-res Image Clustering Approach #5: 'RPPA CNMF subtypes' versus Clinical Feature #8: 'ETHNICITY'
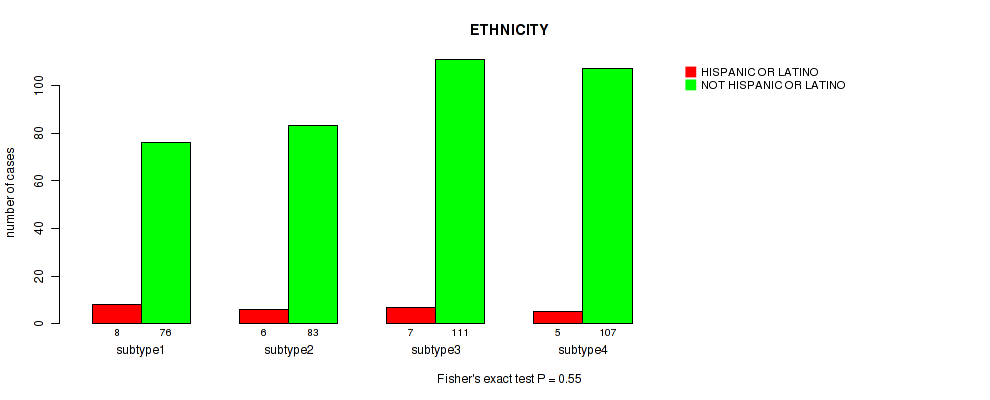
Table S46. Description of clustering approach #6: 'RPPA cHierClus subtypes'
| Cluster Labels | 1 | 2 | 3 |
|---|---|---|---|
| Number of samples | 83 | 160 | 185 |
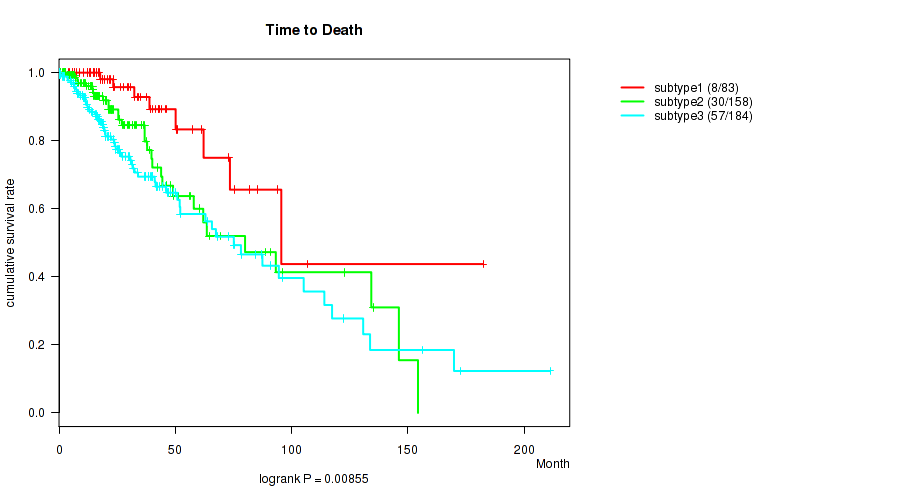
P value = 0.00855 (logrank test), Q value = 0.019
Table S47. Clustering Approach #6: 'RPPA cHierClus subtypes' versus Clinical Feature #1: 'Time to Death'
| nPatients | nDeath | Duration Range (Median), Month | |
|---|---|---|---|
| ALL | 425 | 95 | 0.0 - 211.2 (20.0) |
| subtype1 | 83 | 8 | 0.0 - 182.3 (23.3) |
| subtype2 | 158 | 30 | 0.1 - 154.4 (17.4) |
| subtype3 | 184 | 57 | 0.1 - 211.2 (20.0) |
Figure S41. Get High-res Image Clustering Approach #6: 'RPPA cHierClus subtypes' versus Clinical Feature #1: 'Time to Death'
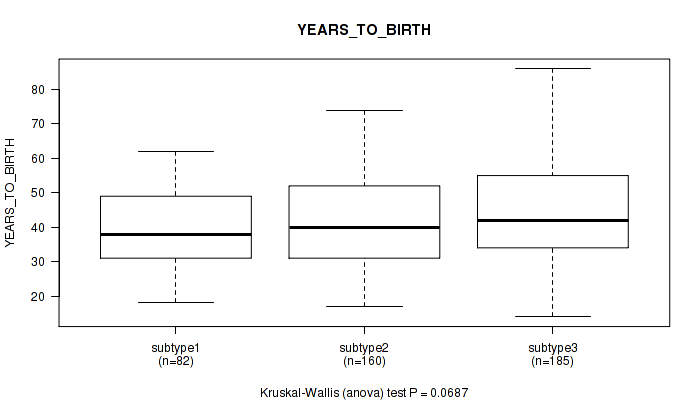
P value = 0.0687 (Kruskal-Wallis (anova)), Q value = 0.12
Table S48. Clustering Approach #6: 'RPPA cHierClus subtypes' versus Clinical Feature #2: 'YEARS_TO_BIRTH'
| nPatients | Mean (Std.Dev) | |
|---|---|---|
| ALL | 427 | 42.7 (13.3) |
| subtype1 | 82 | 40.0 (11.5) |
| subtype2 | 160 | 42.2 (13.3) |
| subtype3 | 185 | 44.3 (14.0) |
Figure S42. Get High-res Image Clustering Approach #6: 'RPPA cHierClus subtypes' versus Clinical Feature #2: 'YEARS_TO_BIRTH'
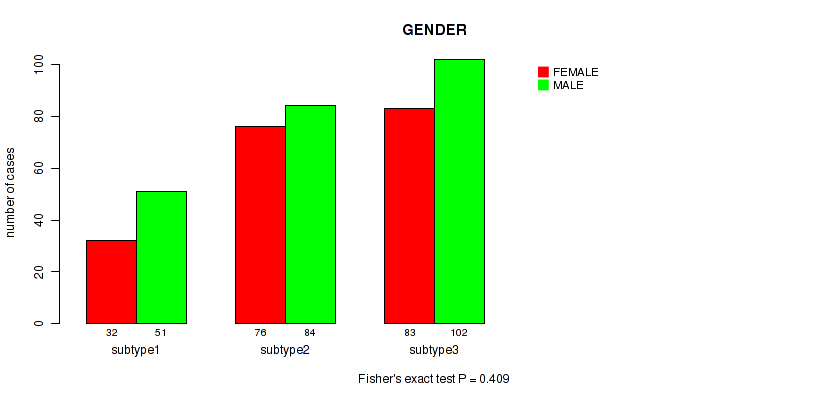
P value = 0.409 (Fisher's exact test), Q value = 0.51
Table S49. Clustering Approach #6: 'RPPA cHierClus subtypes' versus Clinical Feature #3: 'GENDER'
| nPatients | FEMALE | MALE |
|---|---|---|
| ALL | 191 | 237 |
| subtype1 | 32 | 51 |
| subtype2 | 76 | 84 |
| subtype3 | 83 | 102 |
Figure S43. Get High-res Image Clustering Approach #6: 'RPPA cHierClus subtypes' versus Clinical Feature #3: 'GENDER'
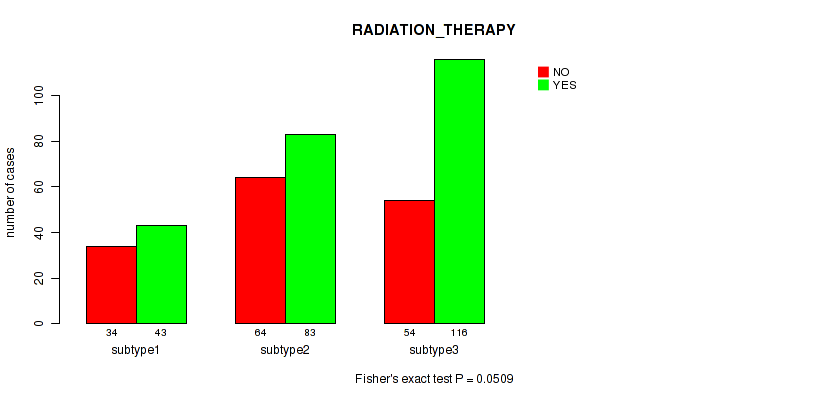
P value = 0.0509 (Fisher's exact test), Q value = 0.096
Table S50. Clustering Approach #6: 'RPPA cHierClus subtypes' versus Clinical Feature #4: 'RADIATION_THERAPY'
| nPatients | NO | YES |
|---|---|---|
| ALL | 152 | 242 |
| subtype1 | 34 | 43 |
| subtype2 | 64 | 83 |
| subtype3 | 54 | 116 |
Figure S44. Get High-res Image Clustering Approach #6: 'RPPA cHierClus subtypes' versus Clinical Feature #4: 'RADIATION_THERAPY'
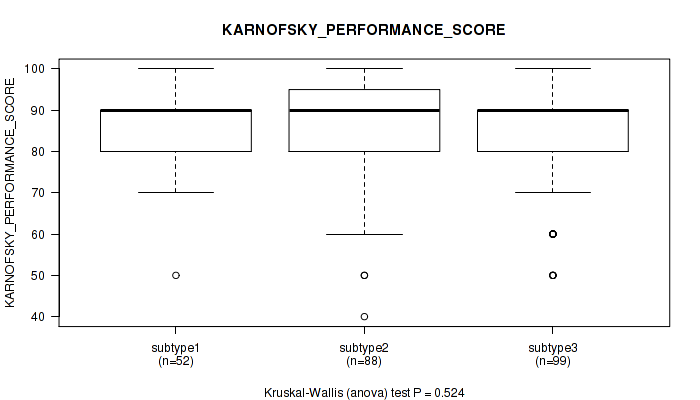
P value = 0.524 (Kruskal-Wallis (anova)), Q value = 0.6
Table S51. Clustering Approach #6: 'RPPA cHierClus subtypes' versus Clinical Feature #5: 'KARNOFSKY_PERFORMANCE_SCORE'
| nPatients | Mean (Std.Dev) | |
|---|---|---|
| ALL | 239 | 85.7 (12.7) |
| subtype1 | 52 | 87.9 (10.0) |
| subtype2 | 88 | 85.7 (13.2) |
| subtype3 | 99 | 84.5 (13.6) |
Figure S45. Get High-res Image Clustering Approach #6: 'RPPA cHierClus subtypes' versus Clinical Feature #5: 'KARNOFSKY_PERFORMANCE_SCORE'
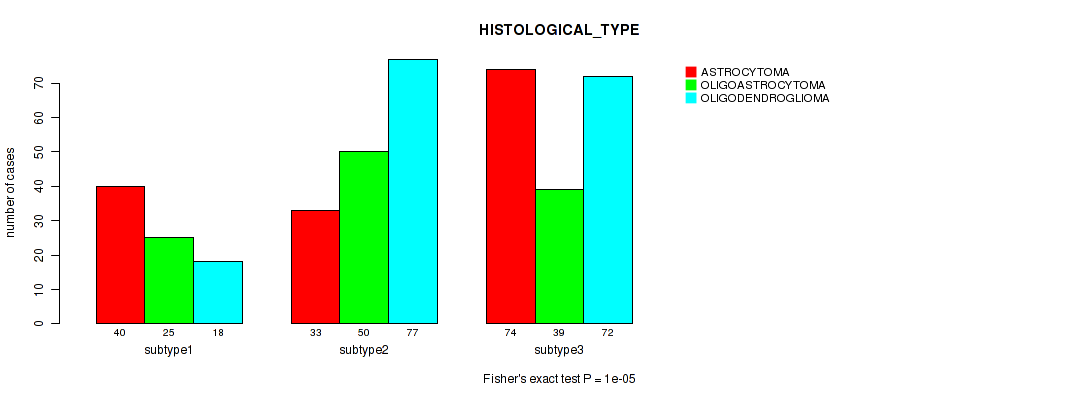
P value = 1e-05 (Fisher's exact test), Q value = 3.7e-05
Table S52. Clustering Approach #6: 'RPPA cHierClus subtypes' versus Clinical Feature #6: 'HISTOLOGICAL_TYPE'
| nPatients | ASTROCYTOMA | OLIGOASTROCYTOMA | OLIGODENDROGLIOMA |
|---|---|---|---|
| ALL | 147 | 114 | 167 |
| subtype1 | 40 | 25 | 18 |
| subtype2 | 33 | 50 | 77 |
| subtype3 | 74 | 39 | 72 |
Figure S46. Get High-res Image Clustering Approach #6: 'RPPA cHierClus subtypes' versus Clinical Feature #6: 'HISTOLOGICAL_TYPE'
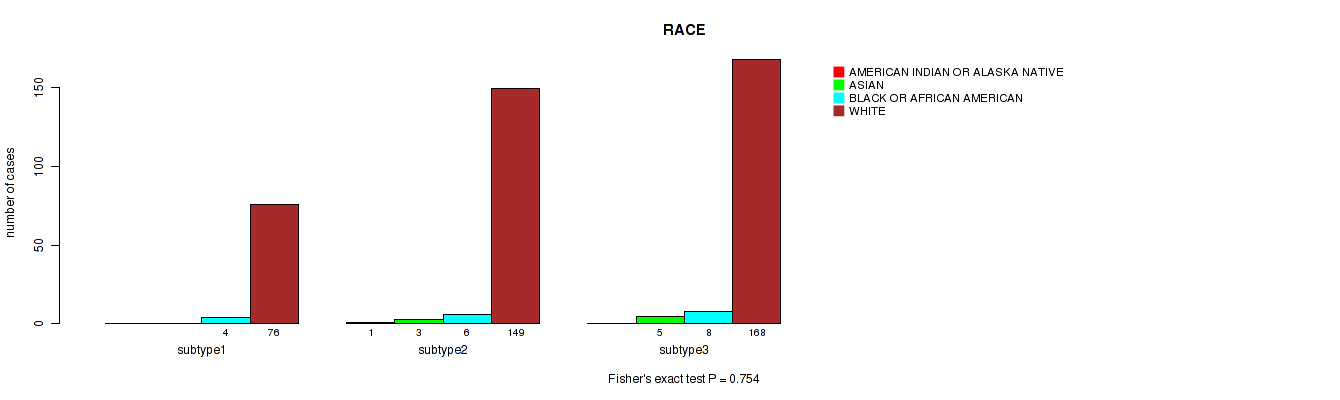
P value = 0.754 (Fisher's exact test), Q value = 0.8
Table S53. Clustering Approach #6: 'RPPA cHierClus subtypes' versus Clinical Feature #7: 'RACE'
| nPatients | AMERICAN INDIAN OR ALASKA NATIVE | ASIAN | BLACK OR AFRICAN AMERICAN | WHITE |
|---|---|---|---|---|
| ALL | 1 | 8 | 18 | 393 |
| subtype1 | 0 | 0 | 4 | 76 |
| subtype2 | 1 | 3 | 6 | 149 |
| subtype3 | 0 | 5 | 8 | 168 |
Figure S47. Get High-res Image Clustering Approach #6: 'RPPA cHierClus subtypes' versus Clinical Feature #7: 'RACE'
P value = 0.283 (Fisher's exact test), Q value = 0.38
Table S54. Clustering Approach #6: 'RPPA cHierClus subtypes' versus Clinical Feature #8: 'ETHNICITY'
| nPatients | HISPANIC OR LATINO | NOT HISPANIC OR LATINO |
|---|---|---|
| ALL | 26 | 377 |
| subtype1 | 8 | 67 |
| subtype2 | 8 | 146 |
| subtype3 | 10 | 164 |
Figure S48. Get High-res Image Clustering Approach #6: 'RPPA cHierClus subtypes' versus Clinical Feature #8: 'ETHNICITY'
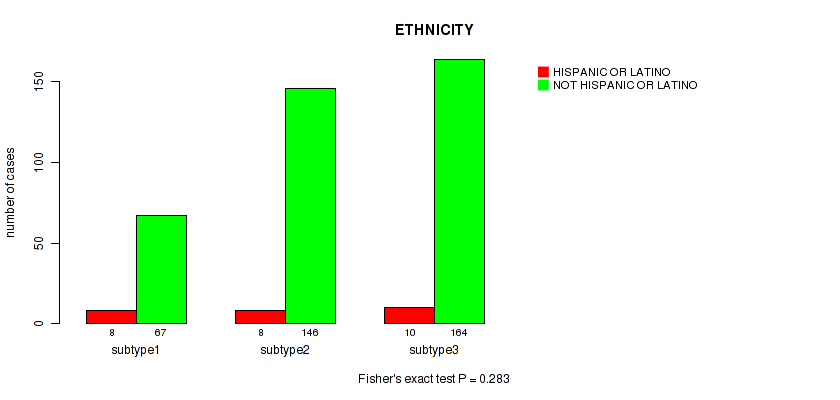
Table S55. Description of clustering approach #7: 'RNAseq CNMF subtypes'
| Cluster Labels | 1 | 2 | 3 | 4 | 5 |
|---|---|---|---|---|---|
| Number of samples | 133 | 109 | 109 | 134 | 30 |
P value = 0 (logrank test), Q value = 0
Table S56. Clustering Approach #7: 'RNAseq CNMF subtypes' versus Clinical Feature #1: 'Time to Death'
| nPatients | nDeath | Duration Range (Median), Month | |
|---|---|---|---|
| ALL | 512 | 121 | 0.0 - 211.2 (20.8) |
| subtype1 | 133 | 24 | 0.0 - 145.1 (25.9) |
| subtype2 | 108 | 52 | 0.1 - 211.2 (17.2) |
| subtype3 | 108 | 13 | 0.1 - 182.3 (21.0) |
| subtype4 | 133 | 27 | 0.1 - 172.8 (23.3) |
| subtype5 | 30 | 5 | 2.4 - 98.2 (20.7) |
Figure S49. Get High-res Image Clustering Approach #7: 'RNAseq CNMF subtypes' versus Clinical Feature #1: 'Time to Death'
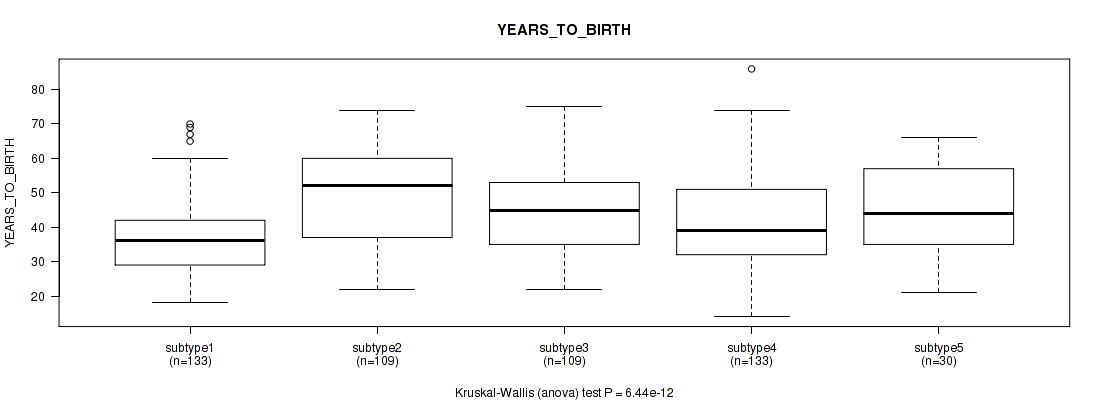
P value = 6.44e-12 (Kruskal-Wallis (anova)), Q value = 5.6e-11
Table S57. Clustering Approach #7: 'RNAseq CNMF subtypes' versus Clinical Feature #2: 'YEARS_TO_BIRTH'
| nPatients | Mean (Std.Dev) | |
|---|---|---|
| ALL | 514 | 42.9 (13.4) |
| subtype1 | 133 | 36.6 (10.4) |
| subtype2 | 109 | 49.1 (13.6) |
| subtype3 | 109 | 45.4 (12.8) |
| subtype4 | 133 | 41.8 (13.7) |
| subtype5 | 30 | 44.9 (12.3) |
Figure S50. Get High-res Image Clustering Approach #7: 'RNAseq CNMF subtypes' versus Clinical Feature #2: 'YEARS_TO_BIRTH'
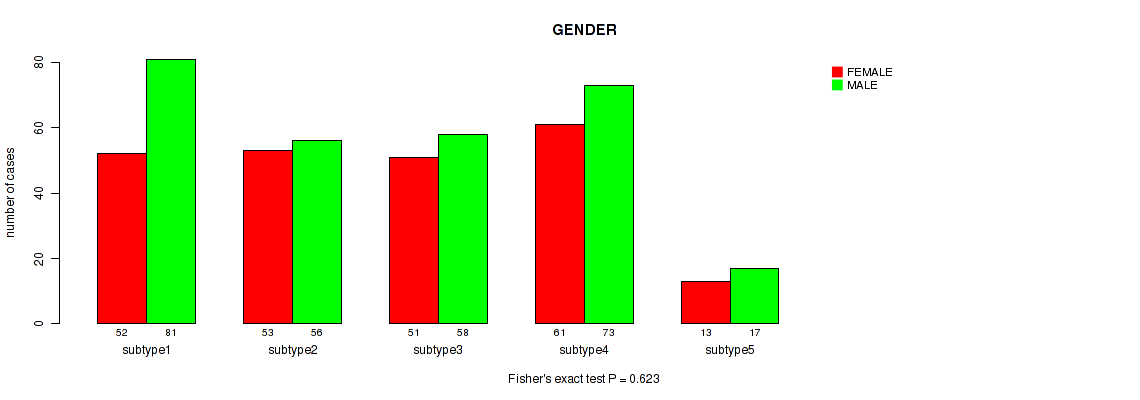
P value = 0.623 (Fisher's exact test), Q value = 0.69
Table S58. Clustering Approach #7: 'RNAseq CNMF subtypes' versus Clinical Feature #3: 'GENDER'
| nPatients | FEMALE | MALE |
|---|---|---|
| ALL | 230 | 285 |
| subtype1 | 52 | 81 |
| subtype2 | 53 | 56 |
| subtype3 | 51 | 58 |
| subtype4 | 61 | 73 |
| subtype5 | 13 | 17 |
Figure S51. Get High-res Image Clustering Approach #7: 'RNAseq CNMF subtypes' versus Clinical Feature #3: 'GENDER'
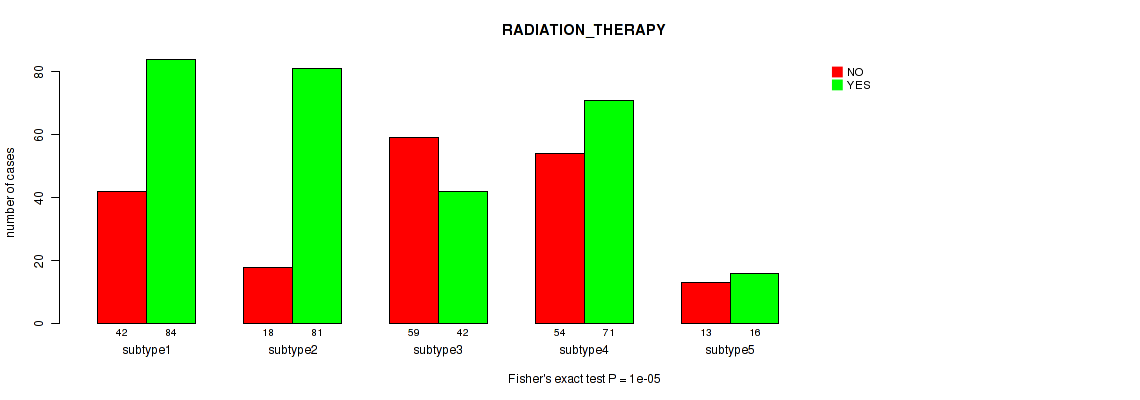
P value = 1e-05 (Fisher's exact test), Q value = 3.7e-05
Table S59. Clustering Approach #7: 'RNAseq CNMF subtypes' versus Clinical Feature #4: 'RADIATION_THERAPY'
| nPatients | NO | YES |
|---|---|---|
| ALL | 186 | 294 |
| subtype1 | 42 | 84 |
| subtype2 | 18 | 81 |
| subtype3 | 59 | 42 |
| subtype4 | 54 | 71 |
| subtype5 | 13 | 16 |
Figure S52. Get High-res Image Clustering Approach #7: 'RNAseq CNMF subtypes' versus Clinical Feature #4: 'RADIATION_THERAPY'
P value = 0.000118 (Kruskal-Wallis (anova)), Q value = 4e-04
Table S60. Clustering Approach #7: 'RNAseq CNMF subtypes' versus Clinical Feature #5: 'KARNOFSKY_PERFORMANCE_SCORE'
| nPatients | Mean (Std.Dev) | |
|---|---|---|
| ALL | 307 | 86.6 (12.6) |
| subtype1 | 83 | 89.4 (10.9) |
| subtype2 | 72 | 81.5 (13.8) |
| subtype3 | 65 | 89.7 (11.9) |
| subtype4 | 69 | 85.4 (12.6) |
| subtype5 | 18 | 87.8 (11.1) |
Figure S53. Get High-res Image Clustering Approach #7: 'RNAseq CNMF subtypes' versus Clinical Feature #5: 'KARNOFSKY_PERFORMANCE_SCORE'
P value = 1e-05 (Fisher's exact test), Q value = 3.7e-05
Table S61. Clustering Approach #7: 'RNAseq CNMF subtypes' versus Clinical Feature #6: 'HISTOLOGICAL_TYPE'
| nPatients | ASTROCYTOMA | OLIGOASTROCYTOMA | OLIGODENDROGLIOMA |
|---|---|---|---|
| ALL | 194 | 130 | 191 |
| subtype1 | 69 | 41 | 23 |
| subtype2 | 77 | 17 | 15 |
| subtype3 | 3 | 21 | 85 |
| subtype4 | 36 | 38 | 60 |
| subtype5 | 9 | 13 | 8 |
Figure S54. Get High-res Image Clustering Approach #7: 'RNAseq CNMF subtypes' versus Clinical Feature #6: 'HISTOLOGICAL_TYPE'
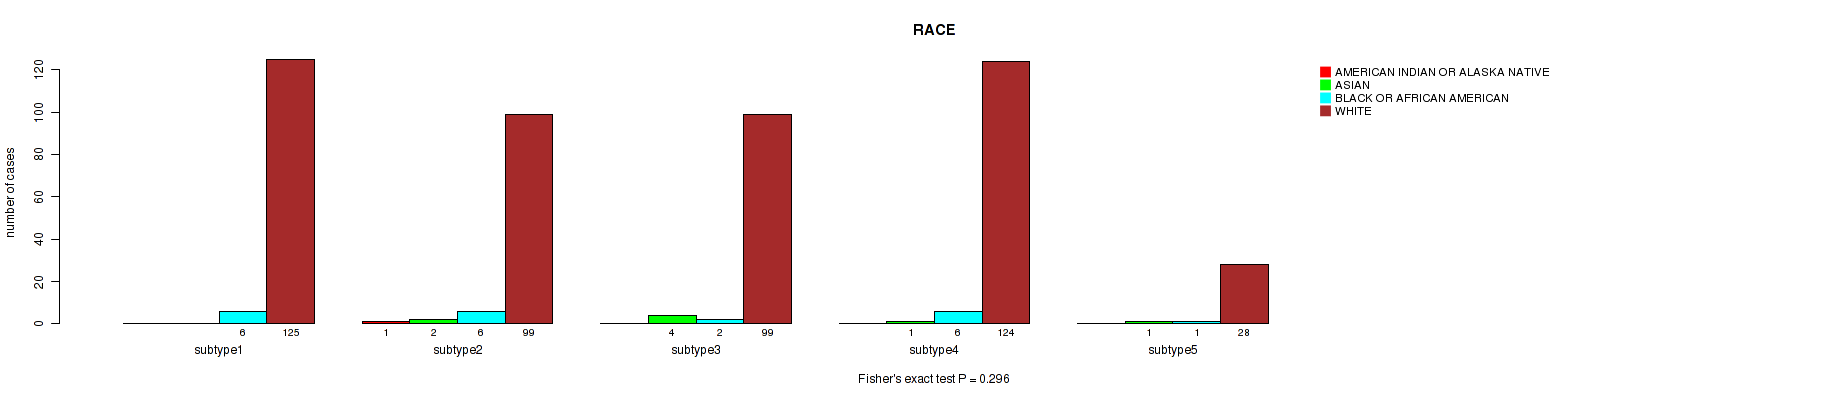
P value = 0.296 (Fisher's exact test), Q value = 0.39
Table S62. Clustering Approach #7: 'RNAseq CNMF subtypes' versus Clinical Feature #7: 'RACE'
| nPatients | AMERICAN INDIAN OR ALASKA NATIVE | ASIAN | BLACK OR AFRICAN AMERICAN | WHITE |
|---|---|---|---|---|
| ALL | 1 | 8 | 21 | 475 |
| subtype1 | 0 | 0 | 6 | 125 |
| subtype2 | 1 | 2 | 6 | 99 |
| subtype3 | 0 | 4 | 2 | 99 |
| subtype4 | 0 | 1 | 6 | 124 |
| subtype5 | 0 | 1 | 1 | 28 |
Figure S55. Get High-res Image Clustering Approach #7: 'RNAseq CNMF subtypes' versus Clinical Feature #7: 'RACE'
P value = 0.164 (Fisher's exact test), Q value = 0.27
Table S63. Clustering Approach #7: 'RNAseq CNMF subtypes' versus Clinical Feature #8: 'ETHNICITY'
| nPatients | HISPANIC OR LATINO | NOT HISPANIC OR LATINO |
|---|---|---|
| ALL | 32 | 449 |
| subtype1 | 8 | 113 |
| subtype2 | 3 | 100 |
| subtype3 | 11 | 90 |
| subtype4 | 7 | 120 |
| subtype5 | 3 | 26 |
Figure S56. Get High-res Image Clustering Approach #7: 'RNAseq CNMF subtypes' versus Clinical Feature #8: 'ETHNICITY'
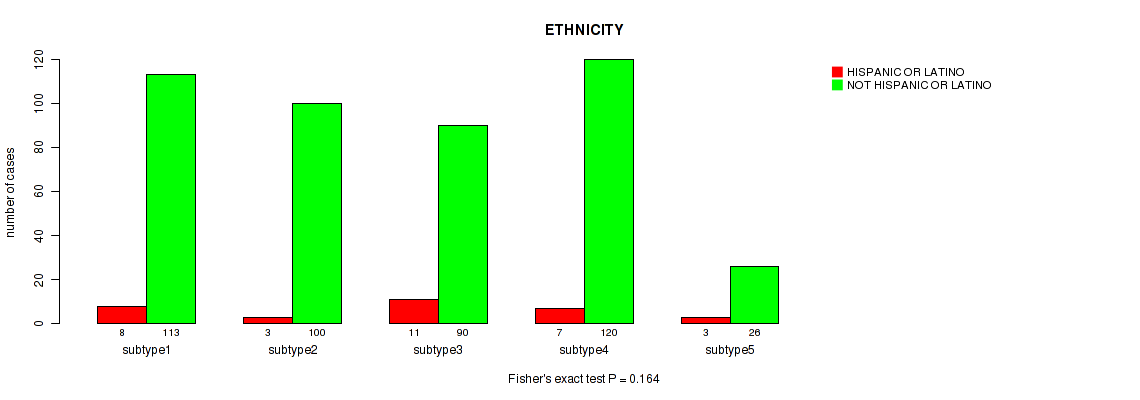
Table S64. Description of clustering approach #8: 'RNAseq cHierClus subtypes'
| Cluster Labels | 1 | 2 | 3 | 4 | 5 | 6 | 7 |
|---|---|---|---|---|---|---|---|
| Number of samples | 134 | 71 | 36 | 68 | 91 | 41 | 74 |
P value = 0 (logrank test), Q value = 0
Table S65. Clustering Approach #8: 'RNAseq cHierClus subtypes' versus Clinical Feature #1: 'Time to Death'
| nPatients | nDeath | Duration Range (Median), Month | |
|---|---|---|---|
| ALL | 512 | 121 | 0.0 - 211.2 (20.8) |
| subtype1 | 134 | 26 | 0.0 - 145.1 (26.6) |
| subtype2 | 71 | 39 | 0.1 - 133.7 (14.3) |
| subtype3 | 36 | 4 | 0.1 - 169.8 (25.2) |
| subtype4 | 68 | 20 | 0.1 - 172.8 (19.8) |
| subtype5 | 90 | 12 | 0.1 - 182.3 (21.7) |
| subtype6 | 40 | 11 | 0.1 - 211.2 (23.2) |
| subtype7 | 73 | 9 | 0.1 - 154.4 (23.2) |
Figure S57. Get High-res Image Clustering Approach #8: 'RNAseq cHierClus subtypes' versus Clinical Feature #1: 'Time to Death'
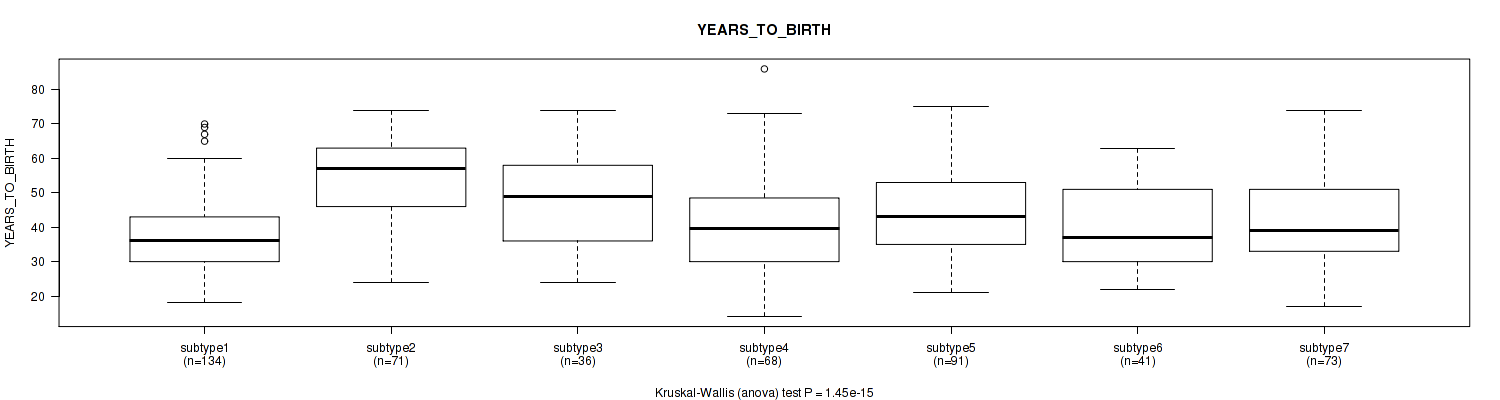
P value = 1.45e-15 (Kruskal-Wallis (anova)), Q value = 2e-14
Table S66. Clustering Approach #8: 'RNAseq cHierClus subtypes' versus Clinical Feature #2: 'YEARS_TO_BIRTH'
| nPatients | Mean (Std.Dev) | |
|---|---|---|
| ALL | 514 | 42.9 (13.4) |
| subtype1 | 134 | 37.2 (10.6) |
| subtype2 | 71 | 53.9 (12.3) |
| subtype3 | 36 | 49.0 (13.9) |
| subtype4 | 68 | 41.0 (14.2) |
| subtype5 | 91 | 44.4 (12.3) |
| subtype6 | 41 | 39.9 (11.4) |
| subtype7 | 73 | 41.5 (12.9) |
Figure S58. Get High-res Image Clustering Approach #8: 'RNAseq cHierClus subtypes' versus Clinical Feature #2: 'YEARS_TO_BIRTH'
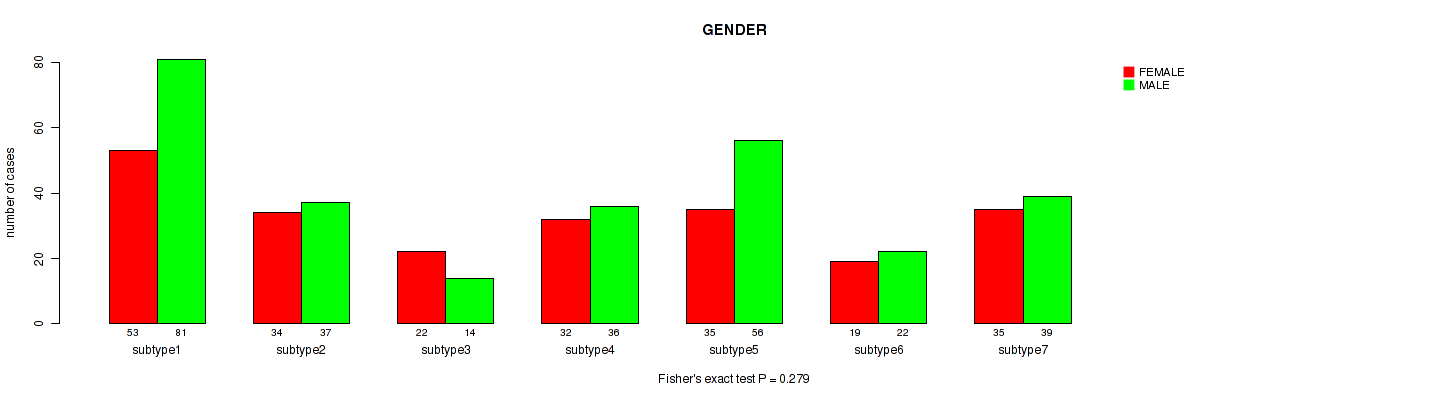
P value = 0.279 (Fisher's exact test), Q value = 0.38
Table S67. Clustering Approach #8: 'RNAseq cHierClus subtypes' versus Clinical Feature #3: 'GENDER'
| nPatients | FEMALE | MALE |
|---|---|---|
| ALL | 230 | 285 |
| subtype1 | 53 | 81 |
| subtype2 | 34 | 37 |
| subtype3 | 22 | 14 |
| subtype4 | 32 | 36 |
| subtype5 | 35 | 56 |
| subtype6 | 19 | 22 |
| subtype7 | 35 | 39 |
Figure S59. Get High-res Image Clustering Approach #8: 'RNAseq cHierClus subtypes' versus Clinical Feature #3: 'GENDER'
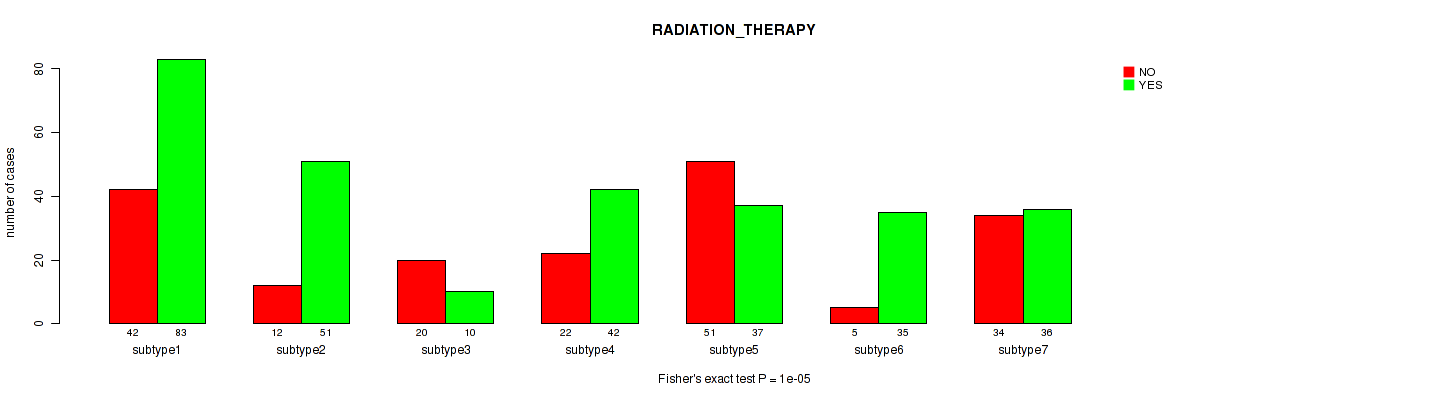
P value = 1e-05 (Fisher's exact test), Q value = 3.7e-05
Table S68. Clustering Approach #8: 'RNAseq cHierClus subtypes' versus Clinical Feature #4: 'RADIATION_THERAPY'
| nPatients | NO | YES |
|---|---|---|
| ALL | 186 | 294 |
| subtype1 | 42 | 83 |
| subtype2 | 12 | 51 |
| subtype3 | 20 | 10 |
| subtype4 | 22 | 42 |
| subtype5 | 51 | 37 |
| subtype6 | 5 | 35 |
| subtype7 | 34 | 36 |
Figure S60. Get High-res Image Clustering Approach #8: 'RNAseq cHierClus subtypes' versus Clinical Feature #4: 'RADIATION_THERAPY'
P value = 0.00053 (Kruskal-Wallis (anova)), Q value = 0.0015
Table S69. Clustering Approach #8: 'RNAseq cHierClus subtypes' versus Clinical Feature #5: 'KARNOFSKY_PERFORMANCE_SCORE'
| nPatients | Mean (Std.Dev) | |
|---|---|---|
| ALL | 307 | 86.6 (12.6) |
| subtype1 | 84 | 89.2 (11.5) |
| subtype2 | 41 | 79.8 (15.1) |
| subtype3 | 23 | 89.1 (14.1) |
| subtype4 | 36 | 85.3 (11.8) |
| subtype5 | 53 | 89.2 (11.4) |
| subtype6 | 31 | 83.9 (11.5) |
| subtype7 | 39 | 86.7 (11.3) |
Figure S61. Get High-res Image Clustering Approach #8: 'RNAseq cHierClus subtypes' versus Clinical Feature #5: 'KARNOFSKY_PERFORMANCE_SCORE'
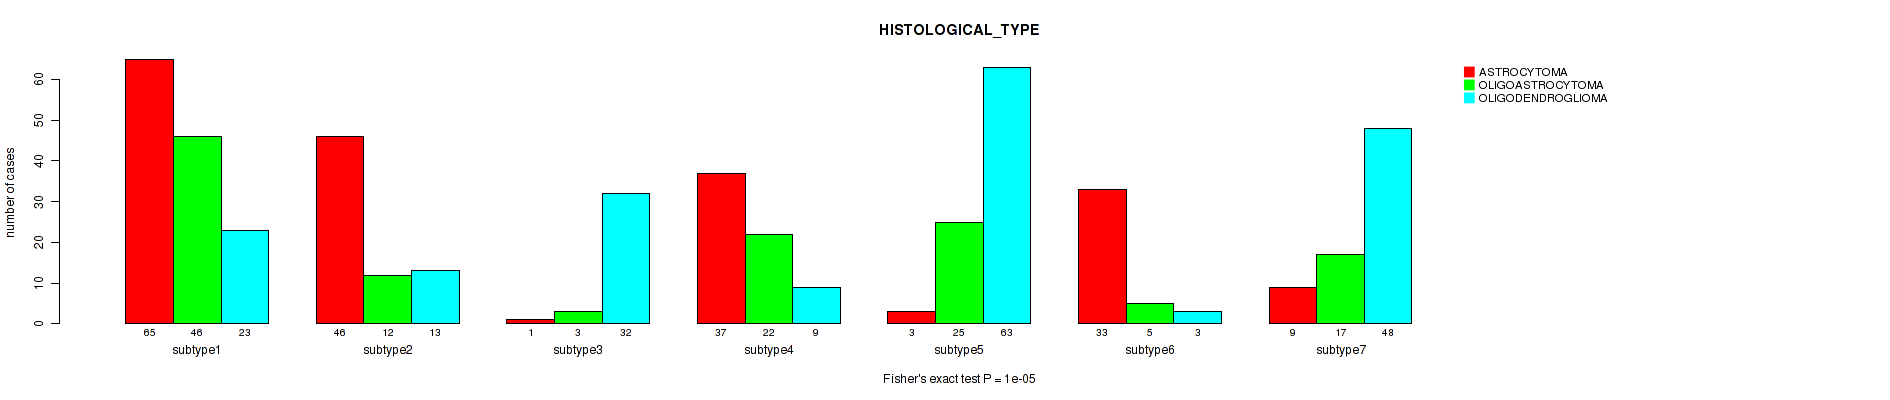
P value = 1e-05 (Fisher's exact test), Q value = 3.7e-05
Table S70. Clustering Approach #8: 'RNAseq cHierClus subtypes' versus Clinical Feature #6: 'HISTOLOGICAL_TYPE'
| nPatients | ASTROCYTOMA | OLIGOASTROCYTOMA | OLIGODENDROGLIOMA |
|---|---|---|---|
| ALL | 194 | 130 | 191 |
| subtype1 | 65 | 46 | 23 |
| subtype2 | 46 | 12 | 13 |
| subtype3 | 1 | 3 | 32 |
| subtype4 | 37 | 22 | 9 |
| subtype5 | 3 | 25 | 63 |
| subtype6 | 33 | 5 | 3 |
| subtype7 | 9 | 17 | 48 |
Figure S62. Get High-res Image Clustering Approach #8: 'RNAseq cHierClus subtypes' versus Clinical Feature #6: 'HISTOLOGICAL_TYPE'
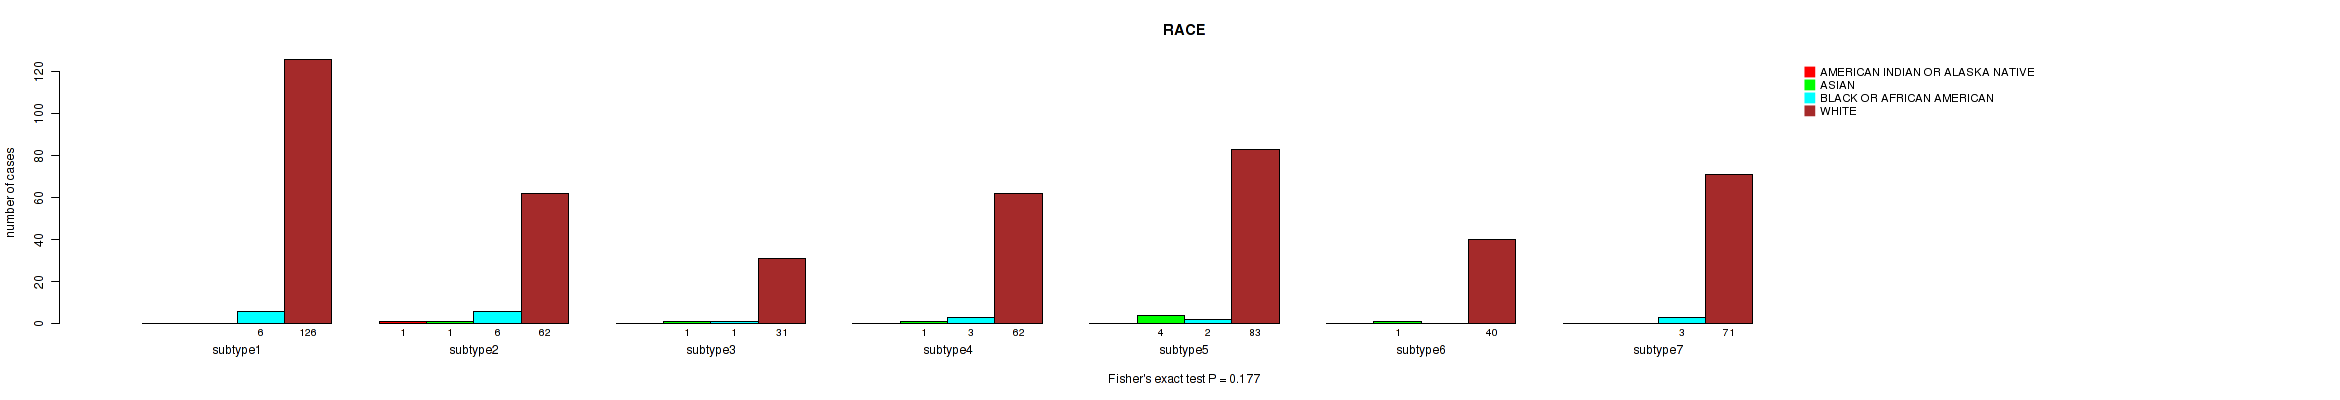
P value = 0.177 (Fisher's exact test), Q value = 0.28
Table S71. Clustering Approach #8: 'RNAseq cHierClus subtypes' versus Clinical Feature #7: 'RACE'
| nPatients | AMERICAN INDIAN OR ALASKA NATIVE | ASIAN | BLACK OR AFRICAN AMERICAN | WHITE |
|---|---|---|---|---|
| ALL | 1 | 8 | 21 | 475 |
| subtype1 | 0 | 0 | 6 | 126 |
| subtype2 | 1 | 1 | 6 | 62 |
| subtype3 | 0 | 1 | 1 | 31 |
| subtype4 | 0 | 1 | 3 | 62 |
| subtype5 | 0 | 4 | 2 | 83 |
| subtype6 | 0 | 1 | 0 | 40 |
| subtype7 | 0 | 0 | 3 | 71 |
Figure S63. Get High-res Image Clustering Approach #8: 'RNAseq cHierClus subtypes' versus Clinical Feature #7: 'RACE'
P value = 0.837 (Fisher's exact test), Q value = 0.87
Table S72. Clustering Approach #8: 'RNAseq cHierClus subtypes' versus Clinical Feature #8: 'ETHNICITY'
| nPatients | HISPANIC OR LATINO | NOT HISPANIC OR LATINO |
|---|---|---|
| ALL | 32 | 449 |
| subtype1 | 9 | 112 |
| subtype2 | 3 | 64 |
| subtype3 | 3 | 29 |
| subtype4 | 4 | 58 |
| subtype5 | 8 | 78 |
| subtype6 | 2 | 39 |
| subtype7 | 3 | 69 |
Figure S64. Get High-res Image Clustering Approach #8: 'RNAseq cHierClus subtypes' versus Clinical Feature #8: 'ETHNICITY'
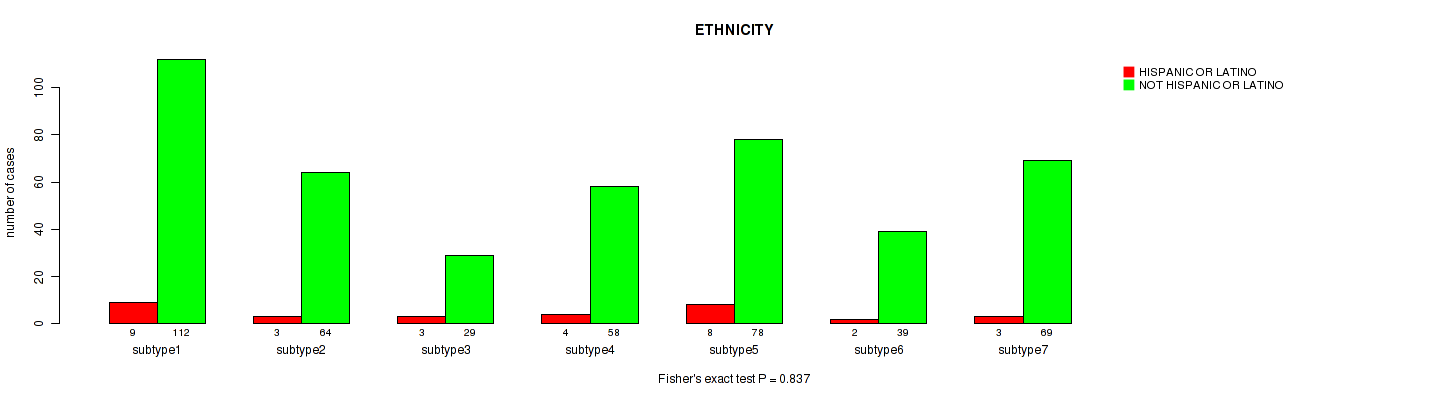
Table S73. Description of clustering approach #9: 'MIRSEQ CNMF'
| Cluster Labels | 1 | 2 | 3 | 4 |
|---|---|---|---|---|
| Number of samples | 137 | 106 | 185 | 83 |
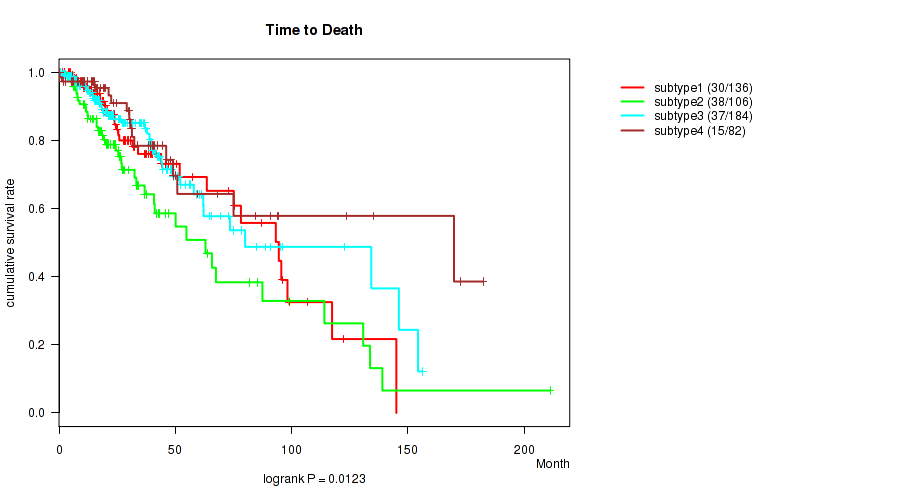
P value = 0.0123 (logrank test), Q value = 0.027
Table S74. Clustering Approach #9: 'MIRSEQ CNMF' versus Clinical Feature #1: 'Time to Death'
| nPatients | nDeath | Duration Range (Median), Month | |
|---|---|---|---|
| ALL | 508 | 120 | 0.0 - 211.2 (20.9) |
| subtype1 | 136 | 30 | 0.0 - 145.1 (20.0) |
| subtype2 | 106 | 38 | 0.1 - 211.2 (20.8) |
| subtype3 | 184 | 37 | 0.1 - 156.2 (21.0) |
| subtype4 | 82 | 15 | 0.1 - 182.3 (22.8) |
Figure S65. Get High-res Image Clustering Approach #9: 'MIRSEQ CNMF' versus Clinical Feature #1: 'Time to Death'
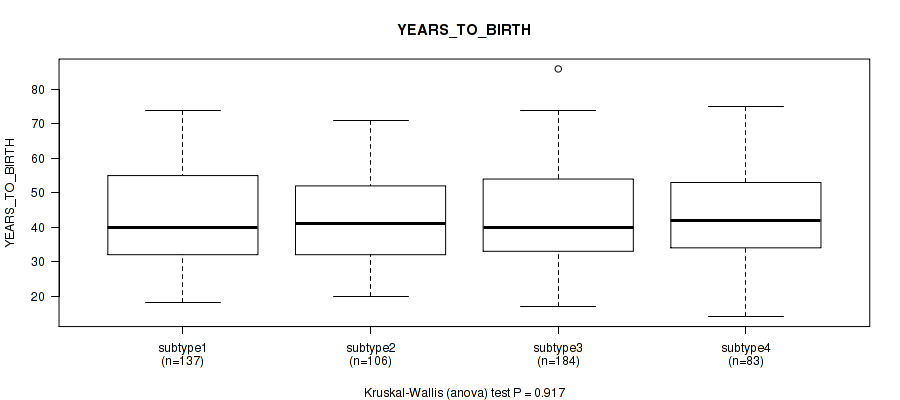
P value = 0.917 (Kruskal-Wallis (anova)), Q value = 0.94
Table S75. Clustering Approach #9: 'MIRSEQ CNMF' versus Clinical Feature #2: 'YEARS_TO_BIRTH'
| nPatients | Mean (Std.Dev) | |
|---|---|---|
| ALL | 510 | 43.0 (13.4) |
| subtype1 | 137 | 42.4 (13.4) |
| subtype2 | 106 | 42.8 (13.1) |
| subtype3 | 184 | 43.2 (13.8) |
| subtype4 | 83 | 43.7 (13.1) |
Figure S66. Get High-res Image Clustering Approach #9: 'MIRSEQ CNMF' versus Clinical Feature #2: 'YEARS_TO_BIRTH'
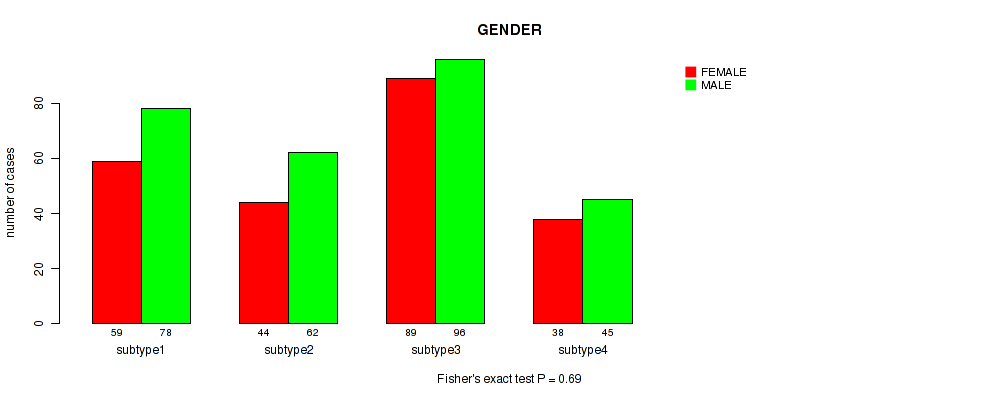
P value = 0.69 (Fisher's exact test), Q value = 0.75
Table S76. Clustering Approach #9: 'MIRSEQ CNMF' versus Clinical Feature #3: 'GENDER'
| nPatients | FEMALE | MALE |
|---|---|---|
| ALL | 230 | 281 |
| subtype1 | 59 | 78 |
| subtype2 | 44 | 62 |
| subtype3 | 89 | 96 |
| subtype4 | 38 | 45 |
Figure S67. Get High-res Image Clustering Approach #9: 'MIRSEQ CNMF' versus Clinical Feature #3: 'GENDER'
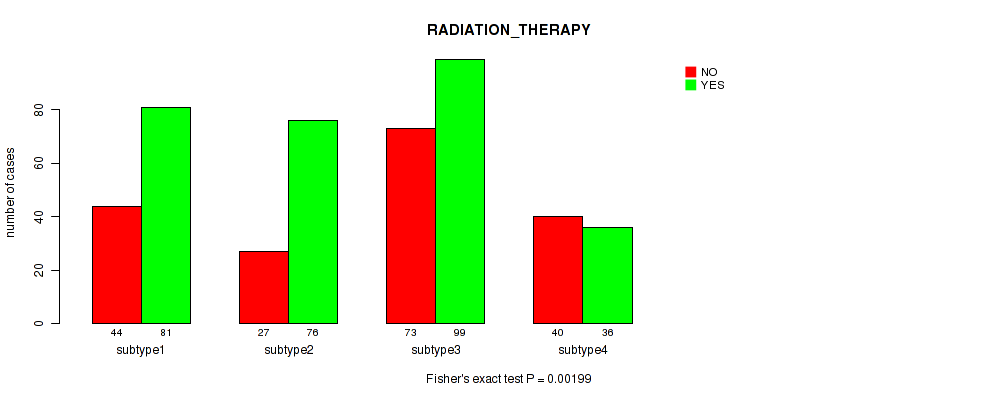
P value = 0.00199 (Fisher's exact test), Q value = 0.0048
Table S77. Clustering Approach #9: 'MIRSEQ CNMF' versus Clinical Feature #4: 'RADIATION_THERAPY'
| nPatients | NO | YES |
|---|---|---|
| ALL | 184 | 292 |
| subtype1 | 44 | 81 |
| subtype2 | 27 | 76 |
| subtype3 | 73 | 99 |
| subtype4 | 40 | 36 |
Figure S68. Get High-res Image Clustering Approach #9: 'MIRSEQ CNMF' versus Clinical Feature #4: 'RADIATION_THERAPY'
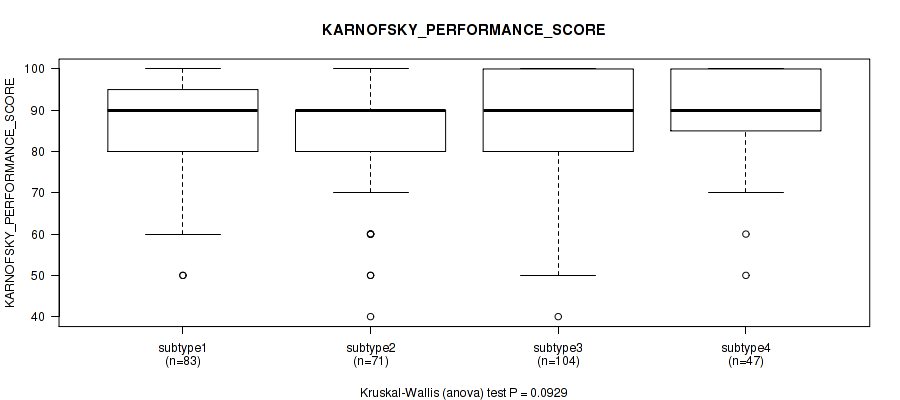
P value = 0.0929 (Kruskal-Wallis (anova)), Q value = 0.16
Table S78. Clustering Approach #9: 'MIRSEQ CNMF' versus Clinical Feature #5: 'KARNOFSKY_PERFORMANCE_SCORE'
| nPatients | Mean (Std.Dev) | |
|---|---|---|
| ALL | 305 | 86.6 (12.6) |
| subtype1 | 83 | 86.4 (12.6) |
| subtype2 | 71 | 84.4 (12.7) |
| subtype3 | 104 | 87.1 (12.7) |
| subtype4 | 47 | 89.4 (11.9) |
Figure S69. Get High-res Image Clustering Approach #9: 'MIRSEQ CNMF' versus Clinical Feature #5: 'KARNOFSKY_PERFORMANCE_SCORE'
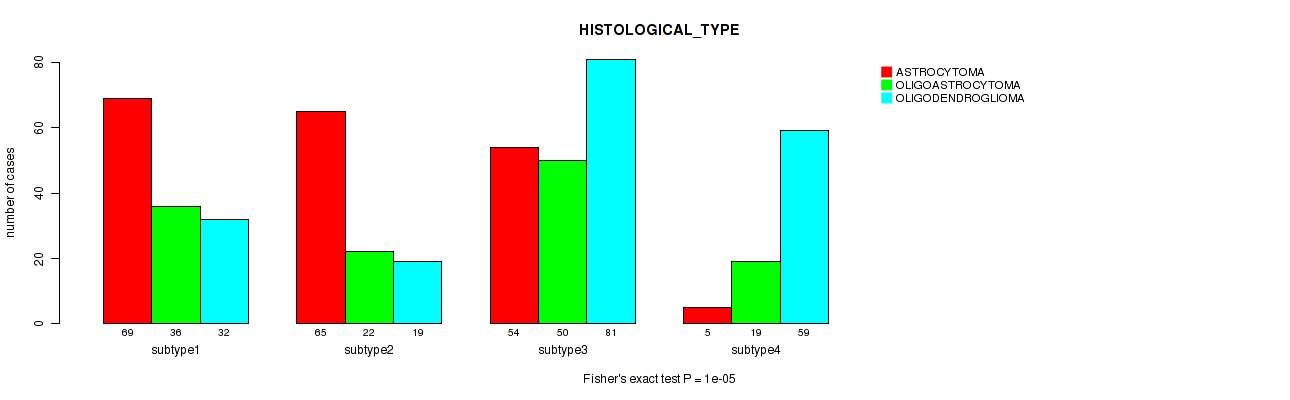
P value = 1e-05 (Fisher's exact test), Q value = 3.7e-05
Table S79. Clustering Approach #9: 'MIRSEQ CNMF' versus Clinical Feature #6: 'HISTOLOGICAL_TYPE'
| nPatients | ASTROCYTOMA | OLIGOASTROCYTOMA | OLIGODENDROGLIOMA |
|---|---|---|---|
| ALL | 193 | 127 | 191 |
| subtype1 | 69 | 36 | 32 |
| subtype2 | 65 | 22 | 19 |
| subtype3 | 54 | 50 | 81 |
| subtype4 | 5 | 19 | 59 |
Figure S70. Get High-res Image Clustering Approach #9: 'MIRSEQ CNMF' versus Clinical Feature #6: 'HISTOLOGICAL_TYPE'
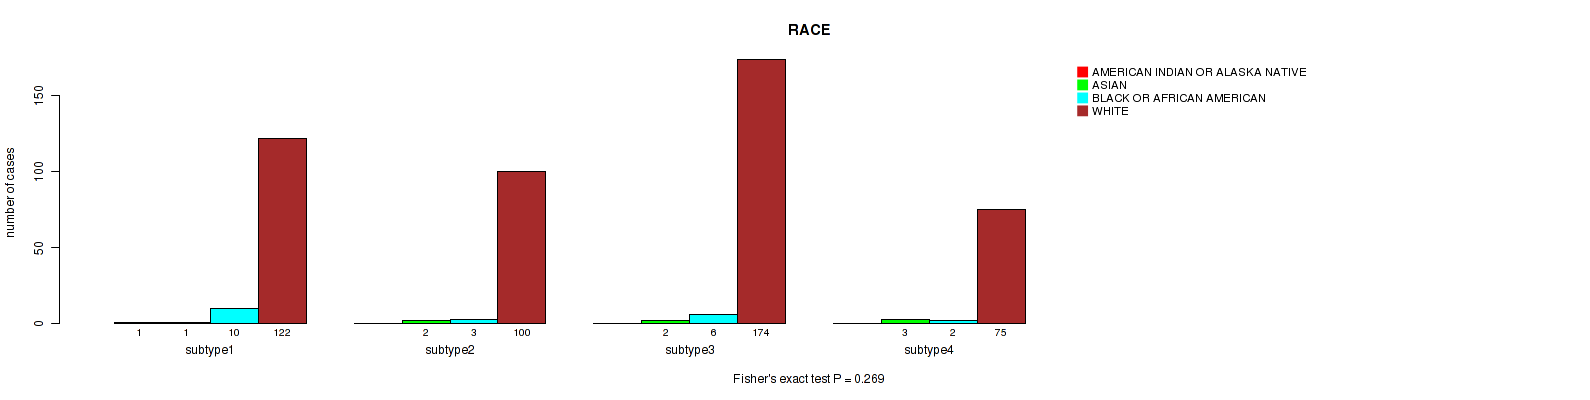
P value = 0.269 (Fisher's exact test), Q value = 0.38
Table S80. Clustering Approach #9: 'MIRSEQ CNMF' versus Clinical Feature #7: 'RACE'
| nPatients | AMERICAN INDIAN OR ALASKA NATIVE | ASIAN | BLACK OR AFRICAN AMERICAN | WHITE |
|---|---|---|---|---|
| ALL | 1 | 8 | 21 | 471 |
| subtype1 | 1 | 1 | 10 | 122 |
| subtype2 | 0 | 2 | 3 | 100 |
| subtype3 | 0 | 2 | 6 | 174 |
| subtype4 | 0 | 3 | 2 | 75 |
Figure S71. Get High-res Image Clustering Approach #9: 'MIRSEQ CNMF' versus Clinical Feature #7: 'RACE'
P value = 0.437 (Fisher's exact test), Q value = 0.52
Table S81. Clustering Approach #9: 'MIRSEQ CNMF' versus Clinical Feature #8: 'ETHNICITY'
| nPatients | HISPANIC OR LATINO | NOT HISPANIC OR LATINO |
|---|---|---|
| ALL | 32 | 445 |
| subtype1 | 8 | 119 |
| subtype2 | 4 | 93 |
| subtype3 | 12 | 165 |
| subtype4 | 8 | 68 |
Figure S72. Get High-res Image Clustering Approach #9: 'MIRSEQ CNMF' versus Clinical Feature #8: 'ETHNICITY'
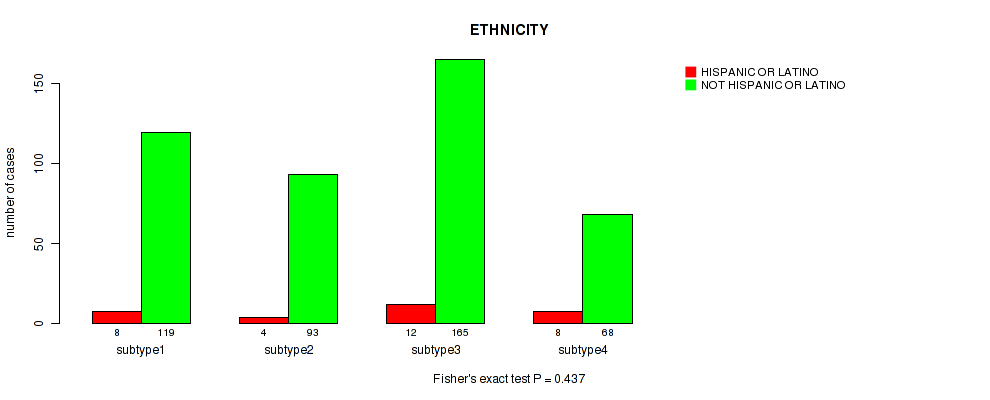
Table S82. Description of clustering approach #10: 'MIRSEQ CHIERARCHICAL'
| Cluster Labels | 1 | 2 | 3 |
|---|---|---|---|
| Number of samples | 222 | 186 | 103 |
P value = 6.06e-14 (logrank test), Q value = 6.5e-13
Table S83. Clustering Approach #10: 'MIRSEQ CHIERARCHICAL' versus Clinical Feature #1: 'Time to Death'
| nPatients | nDeath | Duration Range (Median), Month | |
|---|---|---|---|
| ALL | 508 | 120 | 0.0 - 211.2 (20.9) |
| subtype1 | 220 | 40 | 0.0 - 182.3 (25.0) |
| subtype2 | 185 | 35 | 0.1 - 172.8 (22.6) |
| subtype3 | 103 | 45 | 0.1 - 211.2 (16.8) |
Figure S73. Get High-res Image Clustering Approach #10: 'MIRSEQ CHIERARCHICAL' versus Clinical Feature #1: 'Time to Death'
P value = 1.78e-08 (Kruskal-Wallis (anova)), Q value = 1.4e-07
Table S84. Clustering Approach #10: 'MIRSEQ CHIERARCHICAL' versus Clinical Feature #2: 'YEARS_TO_BIRTH'
| nPatients | Mean (Std.Dev) | |
|---|---|---|
| ALL | 510 | 43.0 (13.4) |
| subtype1 | 222 | 40.0 (11.5) |
| subtype2 | 185 | 42.6 (13.8) |
| subtype3 | 103 | 50.0 (13.8) |
Figure S74. Get High-res Image Clustering Approach #10: 'MIRSEQ CHIERARCHICAL' versus Clinical Feature #2: 'YEARS_TO_BIRTH'
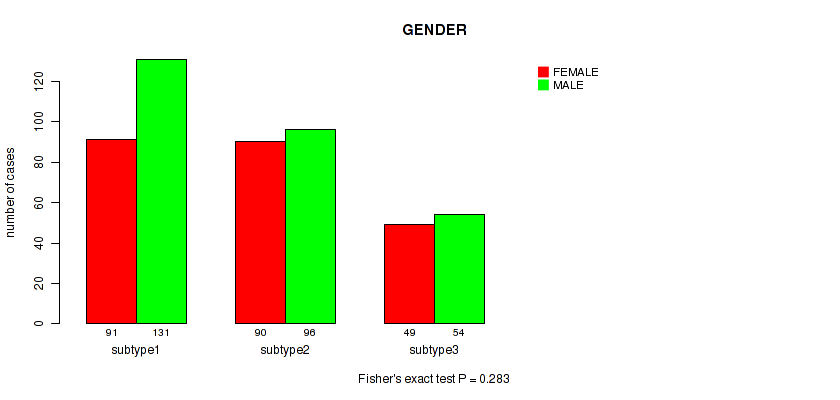
P value = 0.283 (Fisher's exact test), Q value = 0.38
Table S85. Clustering Approach #10: 'MIRSEQ CHIERARCHICAL' versus Clinical Feature #3: 'GENDER'
| nPatients | FEMALE | MALE |
|---|---|---|
| ALL | 230 | 281 |
| subtype1 | 91 | 131 |
| subtype2 | 90 | 96 |
| subtype3 | 49 | 54 |
Figure S75. Get High-res Image Clustering Approach #10: 'MIRSEQ CHIERARCHICAL' versus Clinical Feature #3: 'GENDER'
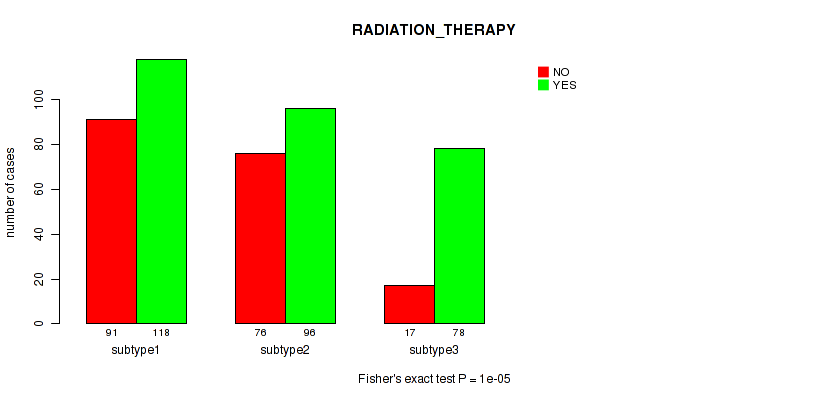
P value = 1e-05 (Fisher's exact test), Q value = 3.7e-05
Table S86. Clustering Approach #10: 'MIRSEQ CHIERARCHICAL' versus Clinical Feature #4: 'RADIATION_THERAPY'
| nPatients | NO | YES |
|---|---|---|
| ALL | 184 | 292 |
| subtype1 | 91 | 118 |
| subtype2 | 76 | 96 |
| subtype3 | 17 | 78 |
Figure S76. Get High-res Image Clustering Approach #10: 'MIRSEQ CHIERARCHICAL' versus Clinical Feature #4: 'RADIATION_THERAPY'
P value = 0.000222 (Kruskal-Wallis (anova)), Q value = 0.00069
Table S87. Clustering Approach #10: 'MIRSEQ CHIERARCHICAL' versus Clinical Feature #5: 'KARNOFSKY_PERFORMANCE_SCORE'
| nPatients | Mean (Std.Dev) | |
|---|---|---|
| ALL | 305 | 86.6 (12.6) |
| subtype1 | 139 | 88.8 (11.1) |
| subtype2 | 105 | 87.0 (12.5) |
| subtype3 | 61 | 80.8 (14.3) |
Figure S77. Get High-res Image Clustering Approach #10: 'MIRSEQ CHIERARCHICAL' versus Clinical Feature #5: 'KARNOFSKY_PERFORMANCE_SCORE'
P value = 1e-05 (Fisher's exact test), Q value = 3.7e-05
Table S88. Clustering Approach #10: 'MIRSEQ CHIERARCHICAL' versus Clinical Feature #6: 'HISTOLOGICAL_TYPE'
| nPatients | ASTROCYTOMA | OLIGOASTROCYTOMA | OLIGODENDROGLIOMA |
|---|---|---|---|
| ALL | 193 | 127 | 191 |
| subtype1 | 76 | 67 | 79 |
| subtype2 | 48 | 44 | 94 |
| subtype3 | 69 | 16 | 18 |
Figure S78. Get High-res Image Clustering Approach #10: 'MIRSEQ CHIERARCHICAL' versus Clinical Feature #6: 'HISTOLOGICAL_TYPE'
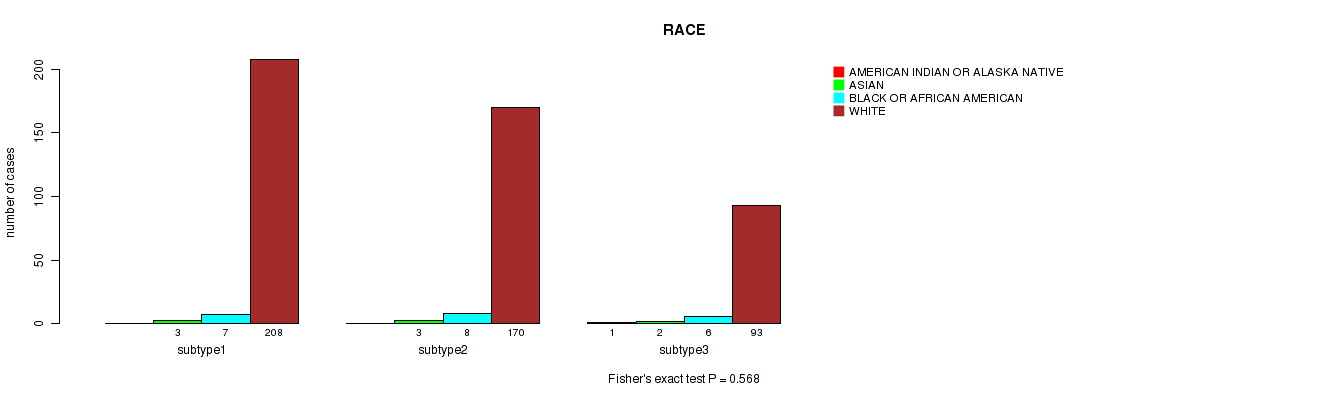
P value = 0.568 (Fisher's exact test), Q value = 0.63
Table S89. Clustering Approach #10: 'MIRSEQ CHIERARCHICAL' versus Clinical Feature #7: 'RACE'
| nPatients | AMERICAN INDIAN OR ALASKA NATIVE | ASIAN | BLACK OR AFRICAN AMERICAN | WHITE |
|---|---|---|---|---|
| ALL | 1 | 8 | 21 | 471 |
| subtype1 | 0 | 3 | 7 | 208 |
| subtype2 | 0 | 3 | 8 | 170 |
| subtype3 | 1 | 2 | 6 | 93 |
Figure S79. Get High-res Image Clustering Approach #10: 'MIRSEQ CHIERARCHICAL' versus Clinical Feature #7: 'RACE'
P value = 0.233 (Fisher's exact test), Q value = 0.35
Table S90. Clustering Approach #10: 'MIRSEQ CHIERARCHICAL' versus Clinical Feature #8: 'ETHNICITY'
| nPatients | HISPANIC OR LATINO | NOT HISPANIC OR LATINO |
|---|---|---|
| ALL | 32 | 445 |
| subtype1 | 17 | 188 |
| subtype2 | 12 | 164 |
| subtype3 | 3 | 93 |
Figure S80. Get High-res Image Clustering Approach #10: 'MIRSEQ CHIERARCHICAL' versus Clinical Feature #8: 'ETHNICITY'
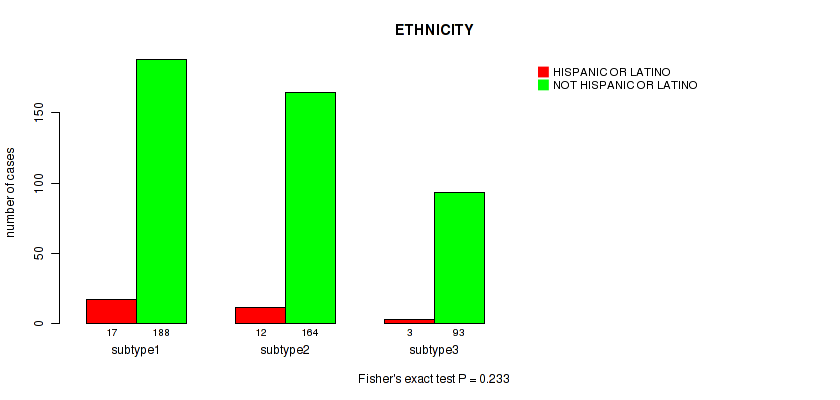
Table S91. Description of clustering approach #11: 'MIRseq Mature CNMF subtypes'
| Cluster Labels | 1 | 2 | 3 |
|---|---|---|---|
| Number of samples | 185 | 161 | 161 |
P value = 0.000268 (logrank test), Q value = 8e-04
Table S92. Clustering Approach #11: 'MIRseq Mature CNMF subtypes' versus Clinical Feature #1: 'Time to Death'
| nPatients | nDeath | Duration Range (Median), Month | |
|---|---|---|---|
| ALL | 504 | 120 | 0.0 - 211.2 (20.9) |
| subtype1 | 185 | 61 | 0.0 - 182.3 (19.1) |
| subtype2 | 159 | 24 | 0.1 - 169.8 (25.0) |
| subtype3 | 160 | 35 | 0.1 - 211.2 (20.2) |
Figure S81. Get High-res Image Clustering Approach #11: 'MIRseq Mature CNMF subtypes' versus Clinical Feature #1: 'Time to Death'
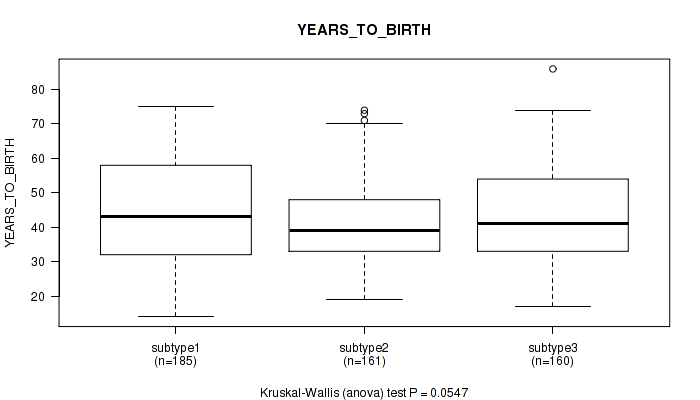
P value = 0.0547 (Kruskal-Wallis (anova)), Q value = 0.1
Table S93. Clustering Approach #11: 'MIRseq Mature CNMF subtypes' versus Clinical Feature #2: 'YEARS_TO_BIRTH'
| nPatients | Mean (Std.Dev) | |
|---|---|---|
| ALL | 506 | 43.0 (13.4) |
| subtype1 | 185 | 44.4 (14.3) |
| subtype2 | 161 | 40.7 (11.7) |
| subtype3 | 160 | 43.8 (13.7) |
Figure S82. Get High-res Image Clustering Approach #11: 'MIRseq Mature CNMF subtypes' versus Clinical Feature #2: 'YEARS_TO_BIRTH'
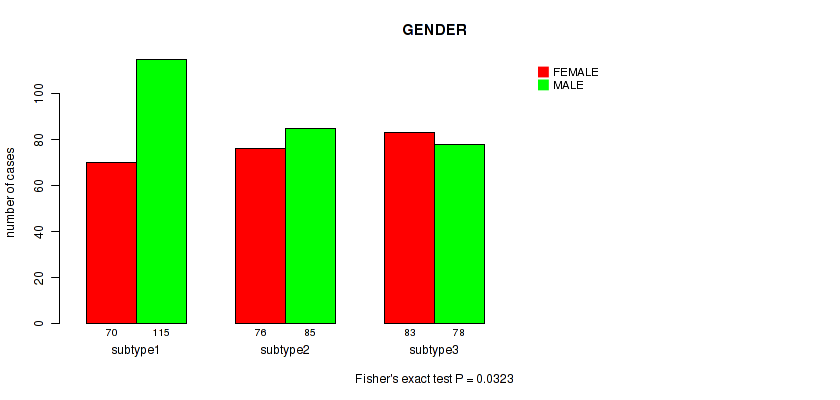
P value = 0.0323 (Fisher's exact test), Q value = 0.066
Table S94. Clustering Approach #11: 'MIRseq Mature CNMF subtypes' versus Clinical Feature #3: 'GENDER'
| nPatients | FEMALE | MALE |
|---|---|---|
| ALL | 229 | 278 |
| subtype1 | 70 | 115 |
| subtype2 | 76 | 85 |
| subtype3 | 83 | 78 |
Figure S83. Get High-res Image Clustering Approach #11: 'MIRseq Mature CNMF subtypes' versus Clinical Feature #3: 'GENDER'
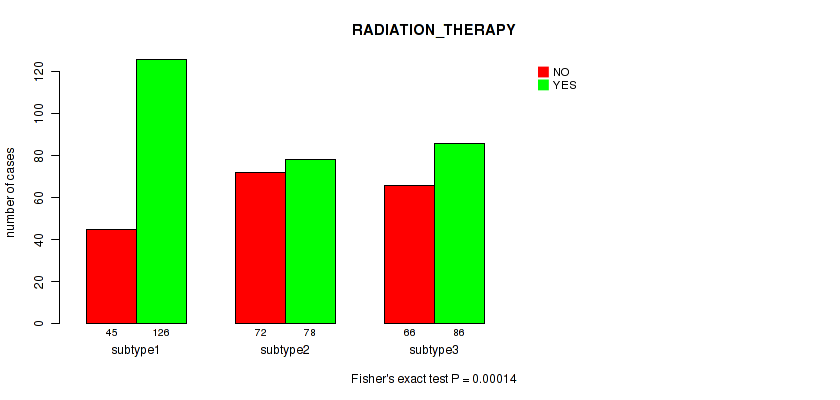
P value = 0.00014 (Fisher's exact test), Q value = 0.00045
Table S95. Clustering Approach #11: 'MIRseq Mature CNMF subtypes' versus Clinical Feature #4: 'RADIATION_THERAPY'
| nPatients | NO | YES |
|---|---|---|
| ALL | 183 | 290 |
| subtype1 | 45 | 126 |
| subtype2 | 72 | 78 |
| subtype3 | 66 | 86 |
Figure S84. Get High-res Image Clustering Approach #11: 'MIRseq Mature CNMF subtypes' versus Clinical Feature #4: 'RADIATION_THERAPY'
P value = 0.0393 (Kruskal-Wallis (anova)), Q value = 0.077
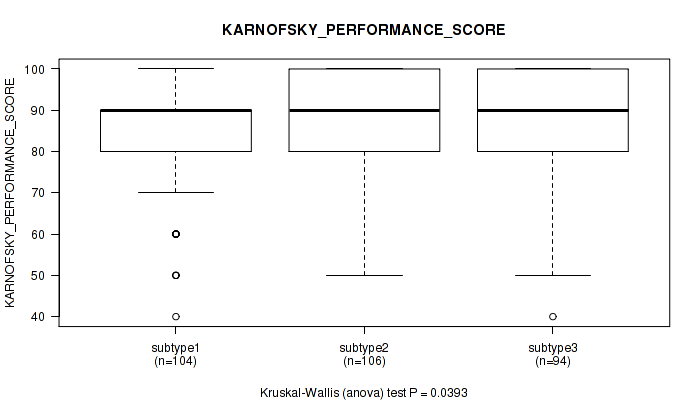
Table S96. Clustering Approach #11: 'MIRseq Mature CNMF subtypes' versus Clinical Feature #5: 'KARNOFSKY_PERFORMANCE_SCORE'
| nPatients | Mean (Std.Dev) | |
|---|---|---|
| ALL | 304 | 86.7 (12.6) |
| subtype1 | 104 | 85.0 (13.2) |
| subtype2 | 106 | 89.2 (10.8) |
| subtype3 | 94 | 85.6 (13.3) |
Figure S85. Get High-res Image Clustering Approach #11: 'MIRseq Mature CNMF subtypes' versus Clinical Feature #5: 'KARNOFSKY_PERFORMANCE_SCORE'
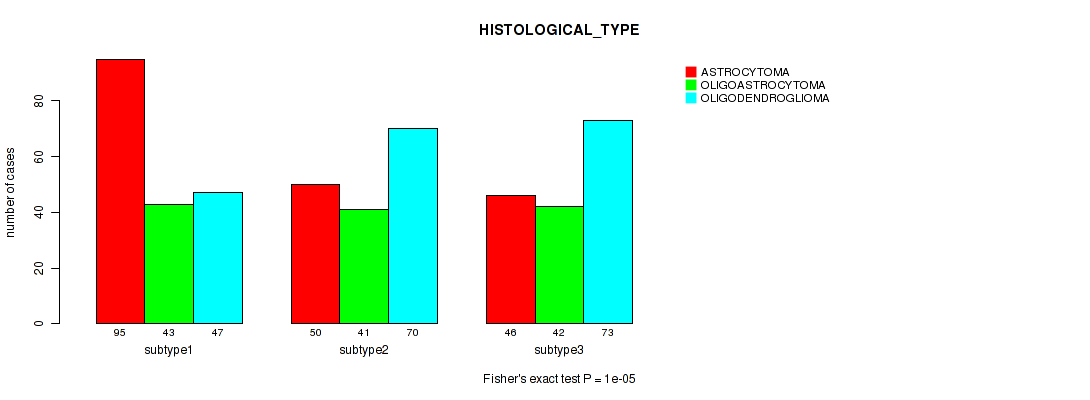
P value = 1e-05 (Fisher's exact test), Q value = 3.7e-05
Table S97. Clustering Approach #11: 'MIRseq Mature CNMF subtypes' versus Clinical Feature #6: 'HISTOLOGICAL_TYPE'
| nPatients | ASTROCYTOMA | OLIGOASTROCYTOMA | OLIGODENDROGLIOMA |
|---|---|---|---|
| ALL | 191 | 126 | 190 |
| subtype1 | 95 | 43 | 47 |
| subtype2 | 50 | 41 | 70 |
| subtype3 | 46 | 42 | 73 |
Figure S86. Get High-res Image Clustering Approach #11: 'MIRseq Mature CNMF subtypes' versus Clinical Feature #6: 'HISTOLOGICAL_TYPE'
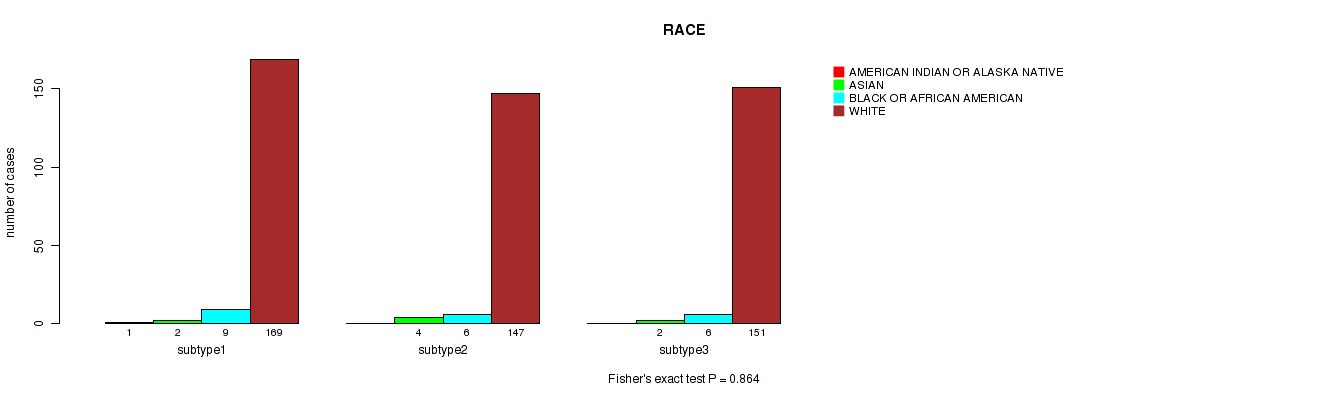
P value = 0.864 (Fisher's exact test), Q value = 0.89
Table S98. Clustering Approach #11: 'MIRseq Mature CNMF subtypes' versus Clinical Feature #7: 'RACE'
| nPatients | AMERICAN INDIAN OR ALASKA NATIVE | ASIAN | BLACK OR AFRICAN AMERICAN | WHITE |
|---|---|---|---|---|
| ALL | 1 | 8 | 21 | 467 |
| subtype1 | 1 | 2 | 9 | 169 |
| subtype2 | 0 | 4 | 6 | 147 |
| subtype3 | 0 | 2 | 6 | 151 |
Figure S87. Get High-res Image Clustering Approach #11: 'MIRseq Mature CNMF subtypes' versus Clinical Feature #7: 'RACE'
P value = 8e-04 (Fisher's exact test), Q value = 0.002
Table S99. Clustering Approach #11: 'MIRseq Mature CNMF subtypes' versus Clinical Feature #8: 'ETHNICITY'
| nPatients | HISPANIC OR LATINO | NOT HISPANIC OR LATINO |
|---|---|---|
| ALL | 32 | 441 |
| subtype1 | 6 | 165 |
| subtype2 | 20 | 128 |
| subtype3 | 6 | 148 |
Figure S88. Get High-res Image Clustering Approach #11: 'MIRseq Mature CNMF subtypes' versus Clinical Feature #8: 'ETHNICITY'
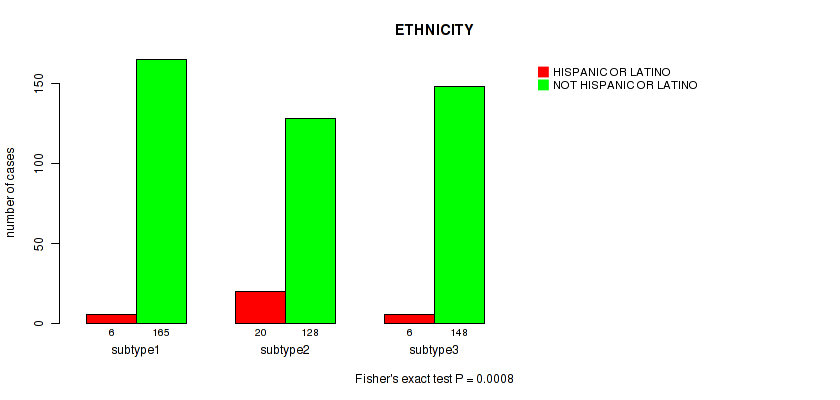
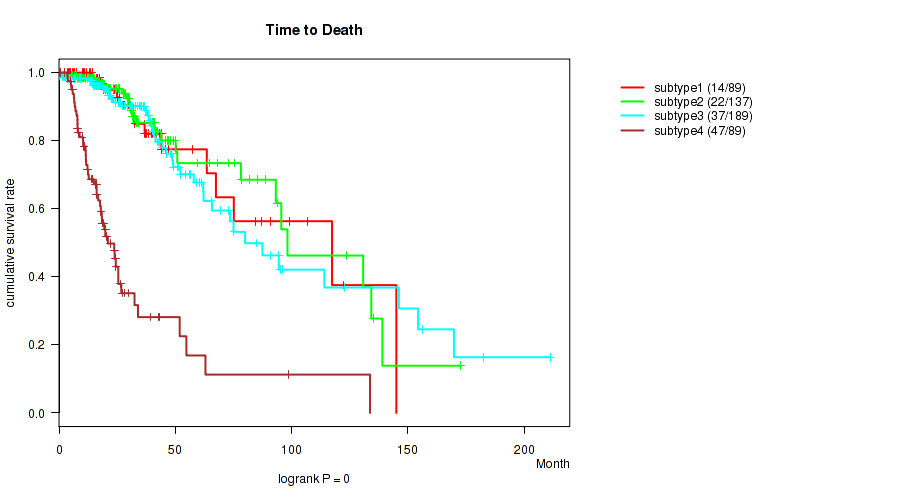
Table S100. Description of clustering approach #12: 'MIRseq Mature cHierClus subtypes'
| Cluster Labels | 1 | 2 | 3 | 4 |
|---|---|---|---|---|
| Number of samples | 90 | 138 | 190 | 89 |
P value = 0 (logrank test), Q value = 0
Table S101. Clustering Approach #12: 'MIRseq Mature cHierClus subtypes' versus Clinical Feature #1: 'Time to Death'
| nPatients | nDeath | Duration Range (Median), Month | |
|---|---|---|---|
| ALL | 504 | 120 | 0.0 - 211.2 (20.9) |
| subtype1 | 89 | 14 | 0.0 - 145.1 (23.7) |
| subtype2 | 137 | 22 | 0.1 - 172.8 (26.0) |
| subtype3 | 189 | 37 | 0.1 - 211.2 (22.3) |
| subtype4 | 89 | 47 | 0.1 - 133.7 (15.7) |
Figure S89. Get High-res Image Clustering Approach #12: 'MIRseq Mature cHierClus subtypes' versus Clinical Feature #1: 'Time to Death'
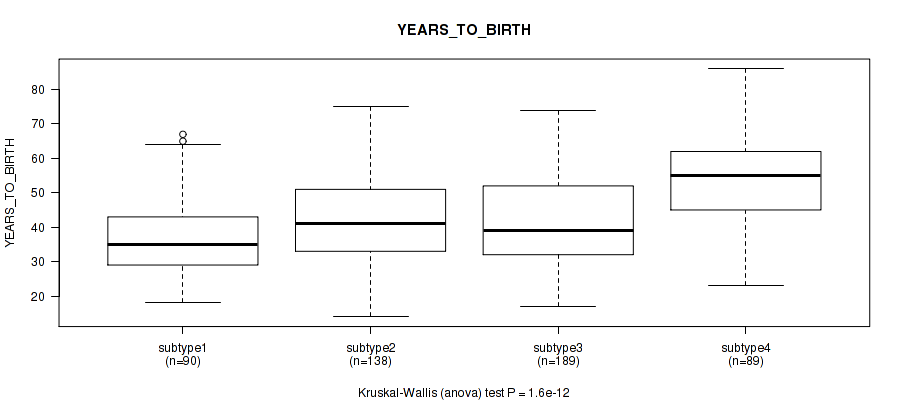
P value = 1.6e-12 (Kruskal-Wallis (anova)), Q value = 1.5e-11
Table S102. Clustering Approach #12: 'MIRseq Mature cHierClus subtypes' versus Clinical Feature #2: 'YEARS_TO_BIRTH'
| nPatients | Mean (Std.Dev) | |
|---|---|---|
| ALL | 506 | 43.0 (13.4) |
| subtype1 | 90 | 36.9 (11.3) |
| subtype2 | 138 | 42.4 (12.0) |
| subtype3 | 189 | 42.0 (13.0) |
| subtype4 | 89 | 52.3 (13.8) |
Figure S90. Get High-res Image Clustering Approach #12: 'MIRseq Mature cHierClus subtypes' versus Clinical Feature #2: 'YEARS_TO_BIRTH'
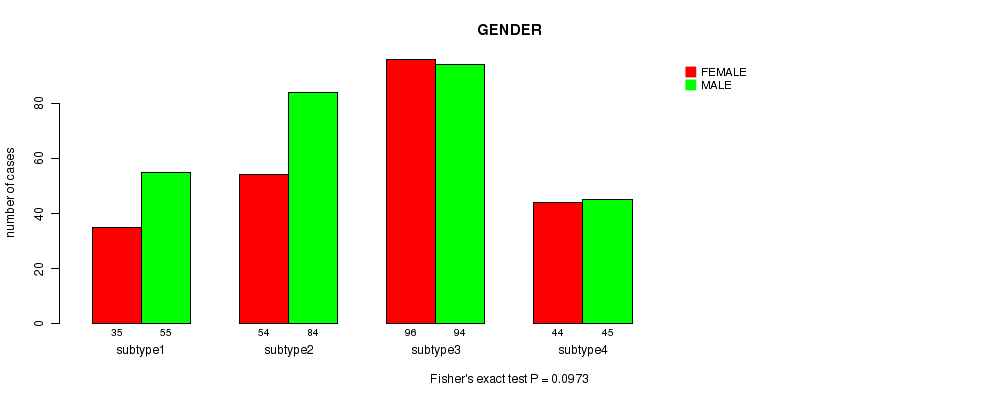
P value = 0.0973 (Fisher's exact test), Q value = 0.17
Table S103. Clustering Approach #12: 'MIRseq Mature cHierClus subtypes' versus Clinical Feature #3: 'GENDER'
| nPatients | FEMALE | MALE |
|---|---|---|
| ALL | 229 | 278 |
| subtype1 | 35 | 55 |
| subtype2 | 54 | 84 |
| subtype3 | 96 | 94 |
| subtype4 | 44 | 45 |
Figure S91. Get High-res Image Clustering Approach #12: 'MIRseq Mature cHierClus subtypes' versus Clinical Feature #3: 'GENDER'
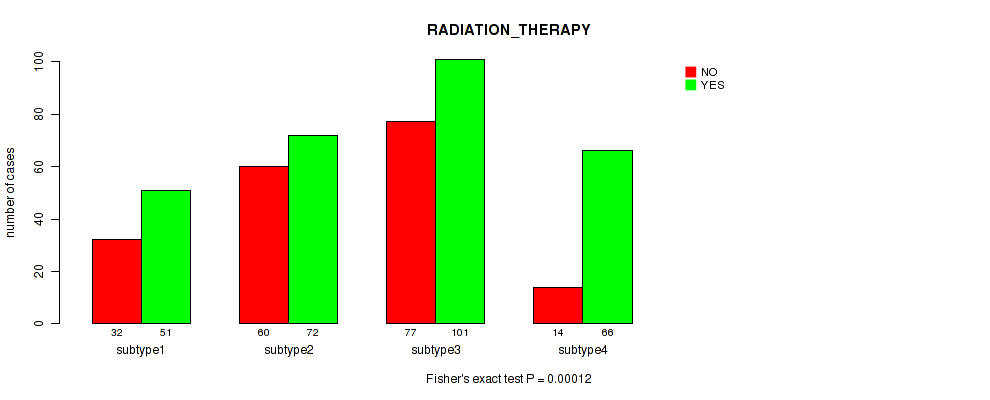
P value = 0.00012 (Fisher's exact test), Q value = 4e-04
Table S104. Clustering Approach #12: 'MIRseq Mature cHierClus subtypes' versus Clinical Feature #4: 'RADIATION_THERAPY'
| nPatients | NO | YES |
|---|---|---|
| ALL | 183 | 290 |
| subtype1 | 32 | 51 |
| subtype2 | 60 | 72 |
| subtype3 | 77 | 101 |
| subtype4 | 14 | 66 |
Figure S92. Get High-res Image Clustering Approach #12: 'MIRseq Mature cHierClus subtypes' versus Clinical Feature #4: 'RADIATION_THERAPY'
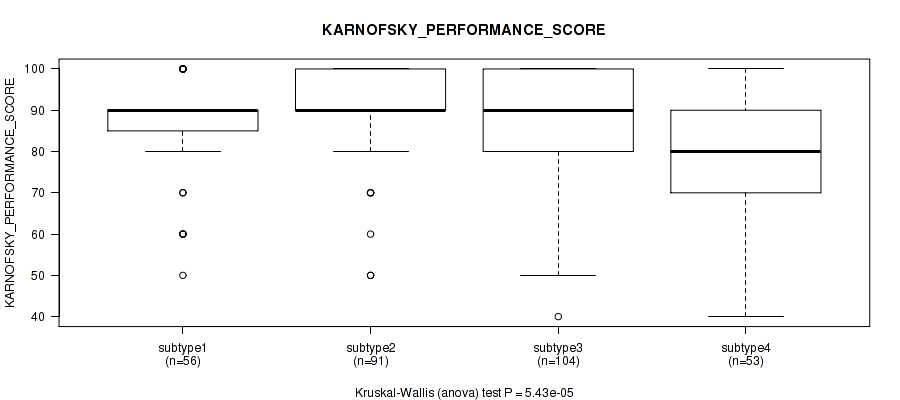
P value = 5.43e-05 (Kruskal-Wallis (anova)), Q value = 0.00019
Table S105. Clustering Approach #12: 'MIRseq Mature cHierClus subtypes' versus Clinical Feature #5: 'KARNOFSKY_PERFORMANCE_SCORE'
| nPatients | Mean (Std.Dev) | |
|---|---|---|
| ALL | 304 | 86.7 (12.6) |
| subtype1 | 56 | 87.3 (11.7) |
| subtype2 | 91 | 90.1 (10.5) |
| subtype3 | 104 | 86.8 (12.6) |
| subtype4 | 53 | 79.8 (14.3) |
Figure S93. Get High-res Image Clustering Approach #12: 'MIRseq Mature cHierClus subtypes' versus Clinical Feature #5: 'KARNOFSKY_PERFORMANCE_SCORE'
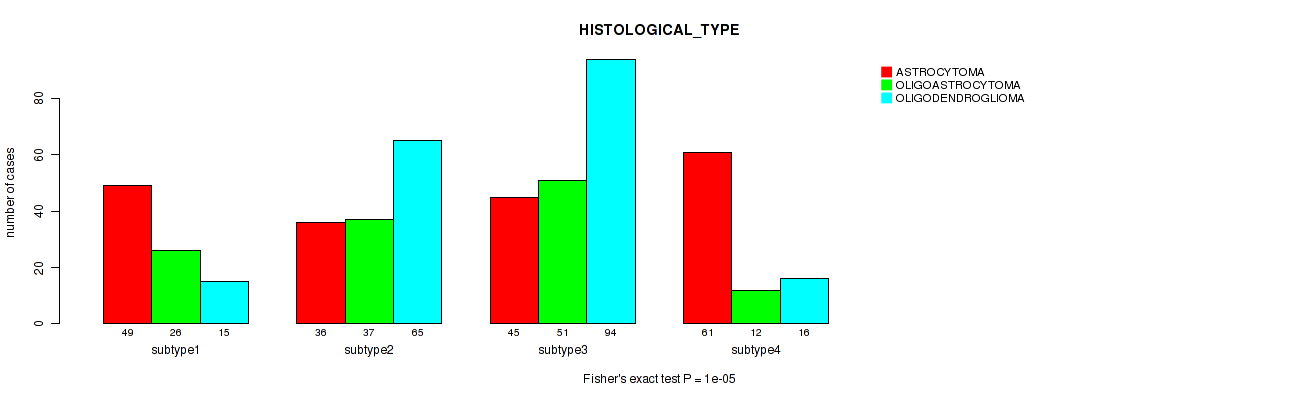
P value = 1e-05 (Fisher's exact test), Q value = 3.7e-05
Table S106. Clustering Approach #12: 'MIRseq Mature cHierClus subtypes' versus Clinical Feature #6: 'HISTOLOGICAL_TYPE'
| nPatients | ASTROCYTOMA | OLIGOASTROCYTOMA | OLIGODENDROGLIOMA |
|---|---|---|---|
| ALL | 191 | 126 | 190 |
| subtype1 | 49 | 26 | 15 |
| subtype2 | 36 | 37 | 65 |
| subtype3 | 45 | 51 | 94 |
| subtype4 | 61 | 12 | 16 |
Figure S94. Get High-res Image Clustering Approach #12: 'MIRseq Mature cHierClus subtypes' versus Clinical Feature #6: 'HISTOLOGICAL_TYPE'
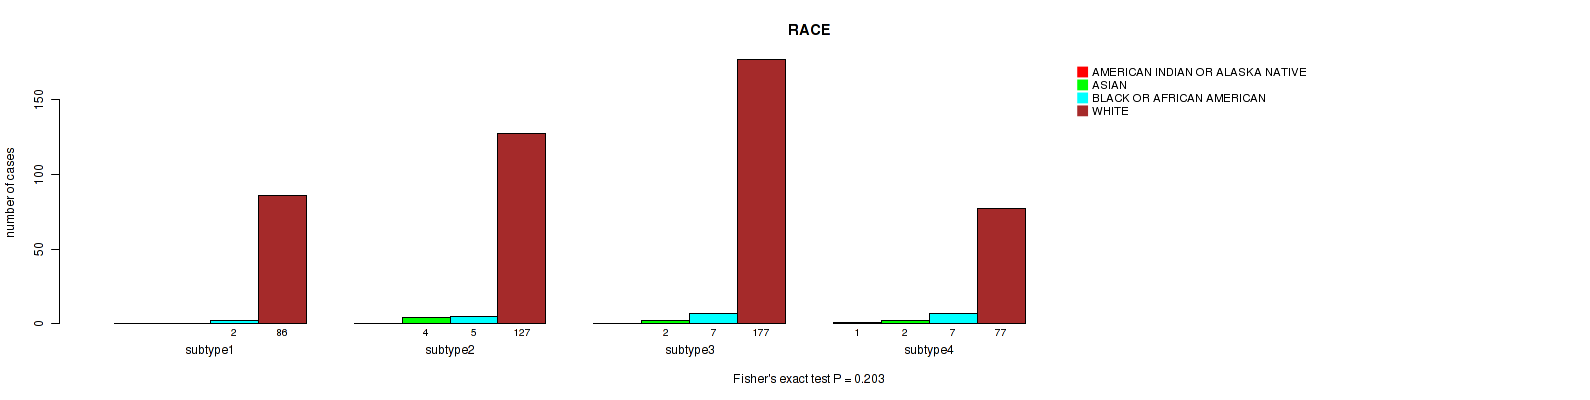
P value = 0.203 (Fisher's exact test), Q value = 0.31
Table S107. Clustering Approach #12: 'MIRseq Mature cHierClus subtypes' versus Clinical Feature #7: 'RACE'
| nPatients | AMERICAN INDIAN OR ALASKA NATIVE | ASIAN | BLACK OR AFRICAN AMERICAN | WHITE |
|---|---|---|---|---|
| ALL | 1 | 8 | 21 | 467 |
| subtype1 | 0 | 0 | 2 | 86 |
| subtype2 | 0 | 4 | 5 | 127 |
| subtype3 | 0 | 2 | 7 | 177 |
| subtype4 | 1 | 2 | 7 | 77 |
Figure S95. Get High-res Image Clustering Approach #12: 'MIRseq Mature cHierClus subtypes' versus Clinical Feature #7: 'RACE'
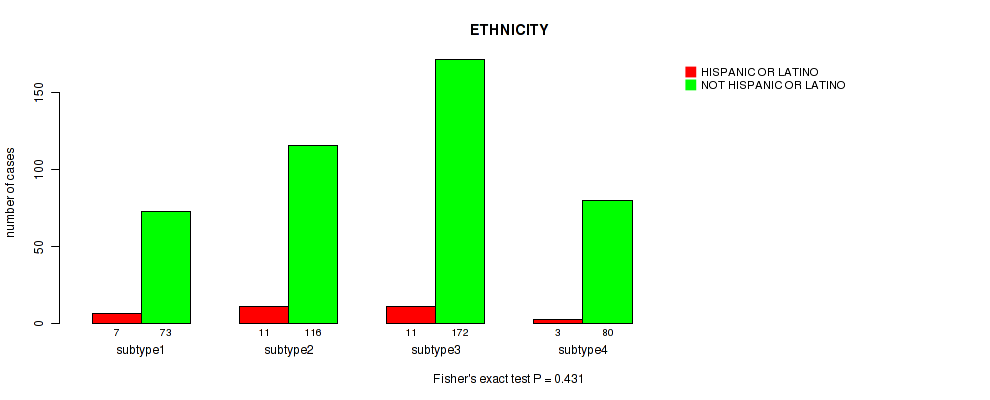
P value = 0.431 (Fisher's exact test), Q value = 0.52
Table S108. Clustering Approach #12: 'MIRseq Mature cHierClus subtypes' versus Clinical Feature #8: 'ETHNICITY'
| nPatients | HISPANIC OR LATINO | NOT HISPANIC OR LATINO |
|---|---|---|
| ALL | 32 | 441 |
| subtype1 | 7 | 73 |
| subtype2 | 11 | 116 |
| subtype3 | 11 | 172 |
| subtype4 | 3 | 80 |
Figure S96. Get High-res Image Clustering Approach #12: 'MIRseq Mature cHierClus subtypes' versus Clinical Feature #8: 'ETHNICITY'
-
Cluster data file = /xchip/cga/gdac-prod/tcga-gdac/jobResults/GDAC_mergedClustering/LGG-TP/20146758/LGG-TP.mergedcluster.txt
-
Clinical data file = /xchip/cga/gdac-prod/tcga-gdac/jobResults/Append_Data/LGG-TP/19775312/LGG-TP.merged_data.txt
-
Number of patients = 515
-
Number of clustering approaches = 12
-
Number of selected clinical features = 8
-
Exclude small clusters that include fewer than K patients, K = 3
consensus non-negative matrix factorization clustering approach (Brunet et al. 2004)
Resampling-based clustering method (Monti et al. 2003)
For survival clinical features, the Kaplan-Meier survival curves of tumors with and without gene mutations were plotted and the statistical significance P values were estimated by logrank test (Bland and Altman 2004) using the 'survdiff' function in R
For binary clinical features, two-tailed Fisher's exact tests (Fisher 1922) were used to estimate the P values using the 'fisher.test' function in R
For multiple hypothesis correction, Q value is the False Discovery Rate (FDR) analogue of the P value (Benjamini and Hochberg 1995), defined as the minimum FDR at which the test may be called significant. We used the 'Benjamini and Hochberg' method of 'p.adjust' function in R to convert P values into Q values.
In addition to the links below, the full results of the analysis summarized in this report can also be downloaded programmatically using firehose_get, or interactively from either the Broad GDAC website or TCGA Data Coordination Center Portal.