This pipeline computes the correlation between significant copy number variation (cnv focal) genes and selected clinical features.
Testing the association between copy number variation 65 focal events and 11 clinical features across 491 patients, 351 significant findings detected with Q value < 0.25.
-
amp_1q22 cnv correlated to 'YEARS_TO_BIRTH', 'PATHOLOGY_T_STAGE', 'PATHOLOGY_N_STAGE', 'RADIATION_THERAPY', 'HISTOLOGICAL_TYPE', 'RESIDUAL_TUMOR', 'NUMBER_OF_LYMPH_NODES', and 'GLEASON_SCORE'.
-
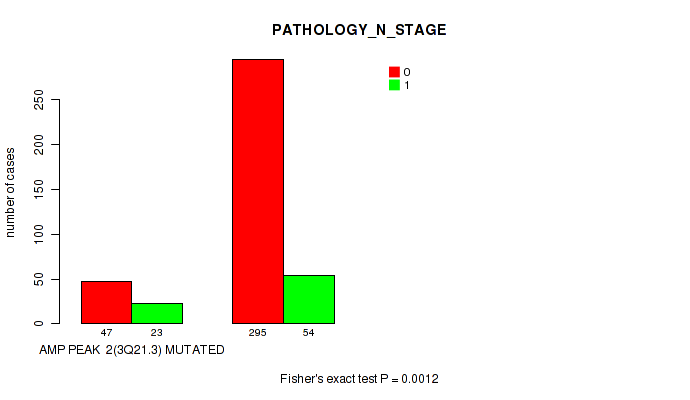
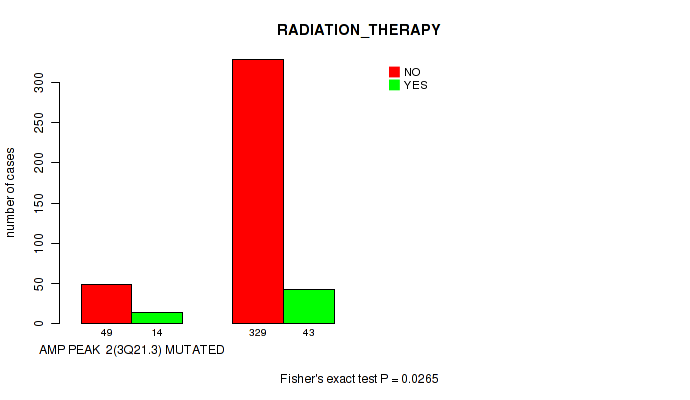
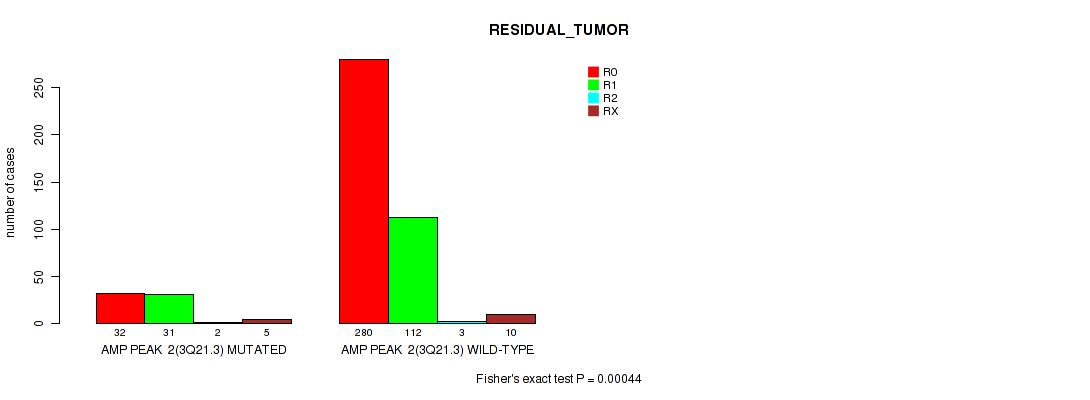
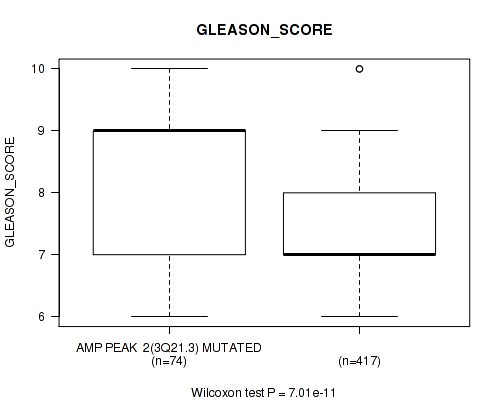
amp_3q21.3 cnv correlated to 'YEARS_TO_BIRTH', 'PATHOLOGY_T_STAGE', 'PATHOLOGY_N_STAGE', 'RADIATION_THERAPY', 'RESIDUAL_TUMOR', 'NUMBER_OF_LYMPH_NODES', and 'GLEASON_SCORE'.
-
amp_3q26.2 cnv correlated to 'YEARS_TO_BIRTH', 'PATHOLOGY_T_STAGE', 'PATHOLOGY_N_STAGE', 'RADIATION_THERAPY', 'RESIDUAL_TUMOR', 'NUMBER_OF_LYMPH_NODES', 'GLEASON_SCORE', and 'PSA_VALUE'.
-
amp_4p16.3 cnv correlated to 'YEARS_TO_BIRTH', 'PATHOLOGY_T_STAGE', and 'GLEASON_SCORE'.
-
amp_4q13.3 cnv correlated to 'YEARS_TO_BIRTH', 'PATHOLOGY_T_STAGE', 'PATHOLOGY_N_STAGE', 'RESIDUAL_TUMOR', 'NUMBER_OF_LYMPH_NODES', and 'GLEASON_SCORE'.
-
amp_5q35.3 cnv correlated to 'YEARS_TO_BIRTH', 'PATHOLOGY_T_STAGE', 'PATHOLOGY_N_STAGE', 'RESIDUAL_TUMOR', 'NUMBER_OF_LYMPH_NODES', and 'GLEASON_SCORE'.
-
amp_7p14.3 cnv correlated to 'YEARS_TO_BIRTH', 'PATHOLOGY_T_STAGE', 'RESIDUAL_TUMOR', and 'GLEASON_SCORE'.
-
amp_7q22.1 cnv correlated to 'YEARS_TO_BIRTH', 'PATHOLOGY_T_STAGE', 'RESIDUAL_TUMOR', and 'GLEASON_SCORE'.
-
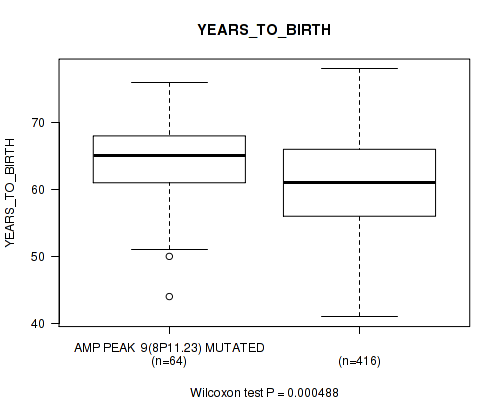
amp_8p11.23 cnv correlated to 'YEARS_TO_BIRTH', 'PATHOLOGY_T_STAGE', 'RESIDUAL_TUMOR', and 'GLEASON_SCORE'.
-
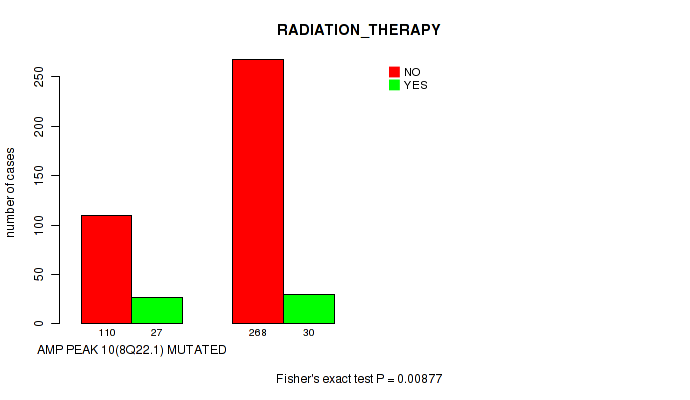
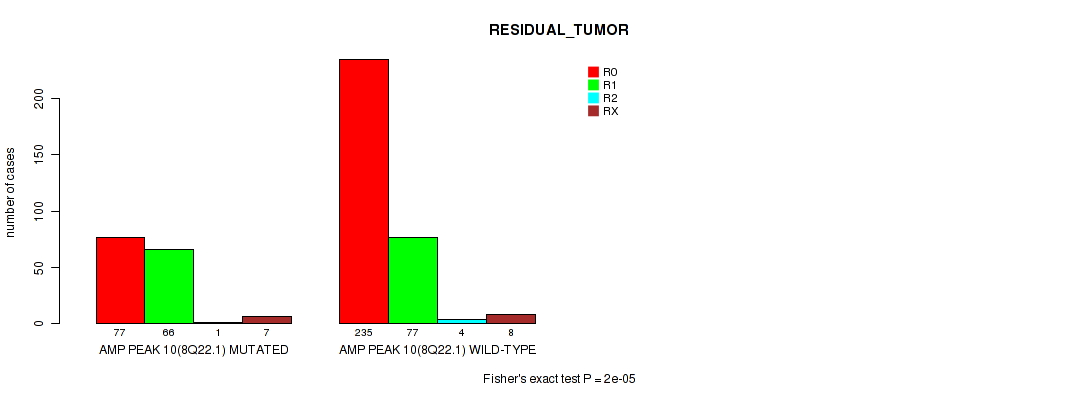
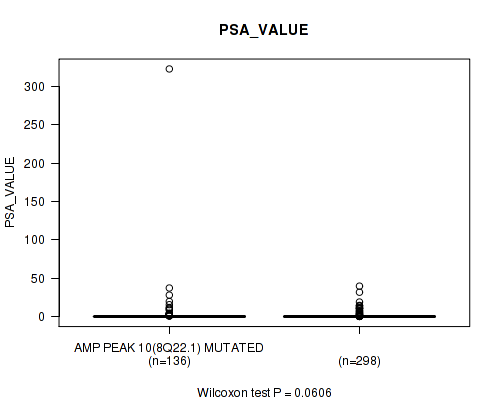
amp_8q22.1 cnv correlated to 'YEARS_TO_BIRTH', 'PATHOLOGY_T_STAGE', 'PATHOLOGY_N_STAGE', 'RADIATION_THERAPY', 'RESIDUAL_TUMOR', 'NUMBER_OF_LYMPH_NODES', 'GLEASON_SCORE', and 'PSA_VALUE'.
-
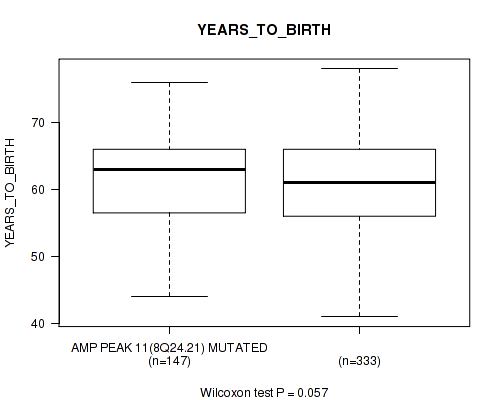
amp_8q24.21 cnv correlated to 'YEARS_TO_BIRTH', 'PATHOLOGY_T_STAGE', 'PATHOLOGY_N_STAGE', 'RADIATION_THERAPY', 'RESIDUAL_TUMOR', 'NUMBER_OF_LYMPH_NODES', 'GLEASON_SCORE', and 'PSA_VALUE'.
-
amp_9q33.3 cnv correlated to 'YEARS_TO_BIRTH', 'PATHOLOGY_T_STAGE', 'PATHOLOGY_N_STAGE', 'HISTOLOGICAL_TYPE', 'RESIDUAL_TUMOR', 'NUMBER_OF_LYMPH_NODES', and 'GLEASON_SCORE'.
-
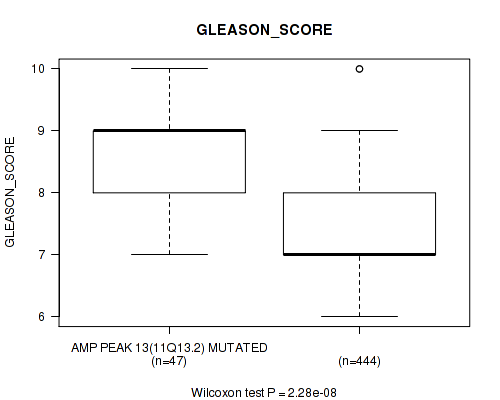
amp_11q13.2 cnv correlated to 'YEARS_TO_BIRTH', 'PATHOLOGY_T_STAGE', 'PATHOLOGY_N_STAGE', 'RADIATION_THERAPY', 'RESIDUAL_TUMOR', 'NUMBER_OF_LYMPH_NODES', and 'GLEASON_SCORE'.
-
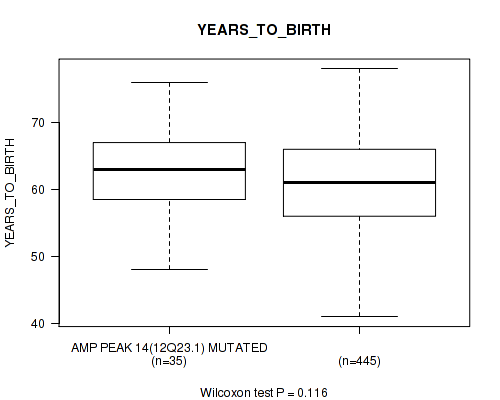
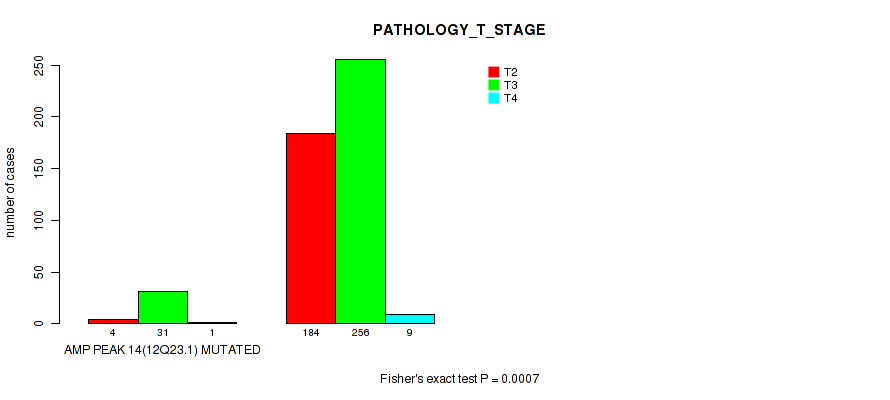
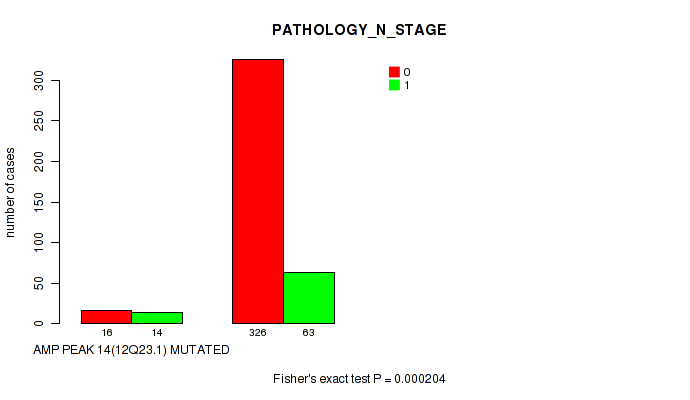
amp_12q23.1 cnv correlated to 'YEARS_TO_BIRTH', 'PATHOLOGY_T_STAGE', 'PATHOLOGY_N_STAGE', 'RADIATION_THERAPY', 'RESIDUAL_TUMOR', 'NUMBER_OF_LYMPH_NODES', and 'GLEASON_SCORE'.
-
amp_13q12.11 cnv correlated to 'YEARS_TO_BIRTH', 'PATHOLOGY_T_STAGE', 'HISTOLOGICAL_TYPE', 'NUMBER_OF_LYMPH_NODES', and 'GLEASON_SCORE'.
-
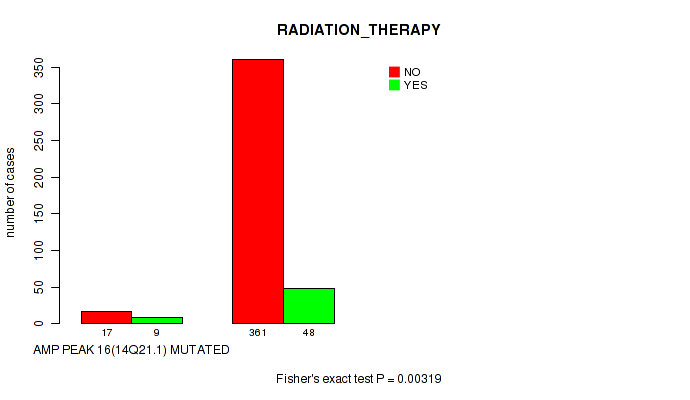
amp_14q21.1 cnv correlated to 'YEARS_TO_BIRTH', 'PATHOLOGY_T_STAGE', 'PATHOLOGY_N_STAGE', 'RADIATION_THERAPY', 'NUMBER_OF_LYMPH_NODES', and 'GLEASON_SCORE'.
-
amp_15q11.2 cnv correlated to 'Time to Death', 'YEARS_TO_BIRTH', 'PATHOLOGY_T_STAGE', 'PATHOLOGY_N_STAGE', 'RADIATION_THERAPY', 'RESIDUAL_TUMOR', 'NUMBER_OF_LYMPH_NODES', and 'GLEASON_SCORE'.
-
amp_16q11.2 cnv correlated to 'YEARS_TO_BIRTH', 'PATHOLOGY_T_STAGE', 'PATHOLOGY_N_STAGE', 'RADIATION_THERAPY', 'RESIDUAL_TUMOR', 'NUMBER_OF_LYMPH_NODES', 'GLEASON_SCORE', and 'PSA_VALUE'.
-
amp_17q23.2 cnv correlated to 'Time to Death', 'PATHOLOGY_T_STAGE', 'PATHOLOGY_N_STAGE', 'RADIATION_THERAPY', 'HISTOLOGICAL_TYPE', 'NUMBER_OF_LYMPH_NODES', 'GLEASON_SCORE', and 'PSA_VALUE'.
-
amp_19q13.43 cnv correlated to 'YEARS_TO_BIRTH', 'PATHOLOGY_T_STAGE', 'PATHOLOGY_N_STAGE', 'HISTOLOGICAL_TYPE', 'NUMBER_OF_LYMPH_NODES', and 'GLEASON_SCORE'.
-
amp_20q13.2 cnv correlated to 'YEARS_TO_BIRTH', 'PATHOLOGY_T_STAGE', 'PATHOLOGY_N_STAGE', 'RADIATION_THERAPY', 'RESIDUAL_TUMOR', 'NUMBER_OF_LYMPH_NODES', 'GLEASON_SCORE', and 'PSA_VALUE'.
-
amp_xp22.11 cnv correlated to 'YEARS_TO_BIRTH', 'PATHOLOGY_T_STAGE', 'PATHOLOGY_N_STAGE', 'RADIATION_THERAPY', 'HISTOLOGICAL_TYPE', 'RESIDUAL_TUMOR', 'NUMBER_OF_LYMPH_NODES', and 'GLEASON_SCORE'.
-
amp_xp22.11 cnv correlated to 'YEARS_TO_BIRTH', 'PATHOLOGY_T_STAGE', 'PATHOLOGY_N_STAGE', 'HISTOLOGICAL_TYPE', 'RESIDUAL_TUMOR', 'NUMBER_OF_LYMPH_NODES', 'GLEASON_SCORE', and 'PSA_VALUE'.
-
amp_xp21.1 cnv correlated to 'YEARS_TO_BIRTH', 'PATHOLOGY_T_STAGE', 'PATHOLOGY_N_STAGE', 'HISTOLOGICAL_TYPE', 'RESIDUAL_TUMOR', 'NUMBER_OF_LYMPH_NODES', 'GLEASON_SCORE', 'PSA_VALUE', and 'RACE'.
-
amp_xq21.1 cnv correlated to 'YEARS_TO_BIRTH', 'PATHOLOGY_T_STAGE', and 'GLEASON_SCORE'.
-
amp_xq21.1 cnv correlated to 'YEARS_TO_BIRTH', 'PATHOLOGY_T_STAGE', 'PATHOLOGY_N_STAGE', 'RESIDUAL_TUMOR', 'NUMBER_OF_LYMPH_NODES', 'GLEASON_SCORE', and 'RACE'.
-
amp_xq25 cnv correlated to 'PATHOLOGY_T_STAGE', 'GLEASON_SCORE', and 'RACE'.
-
amp_xq27.1 cnv correlated to 'YEARS_TO_BIRTH', 'PATHOLOGY_T_STAGE', 'GLEASON_SCORE', and 'PSA_VALUE'.
-
del_1p31.3 cnv correlated to 'PATHOLOGY_T_STAGE', 'RADIATION_THERAPY', 'RESIDUAL_TUMOR', 'NUMBER_OF_LYMPH_NODES', and 'GLEASON_SCORE'.
-
del_1p22.1 cnv correlated to 'PATHOLOGY_T_STAGE', 'RESIDUAL_TUMOR', 'NUMBER_OF_LYMPH_NODES', and 'GLEASON_SCORE'.
-
del_1q42.3 cnv correlated to 'Time to Death', 'YEARS_TO_BIRTH', 'RESIDUAL_TUMOR', 'GLEASON_SCORE', and 'PSA_VALUE'.
-
del_2p21 cnv correlated to 'PATHOLOGY_T_STAGE', 'PATHOLOGY_N_STAGE', 'RESIDUAL_TUMOR', 'NUMBER_OF_LYMPH_NODES', and 'GLEASON_SCORE'.
-
del_2q22.1 cnv correlated to 'YEARS_TO_BIRTH' and 'GLEASON_SCORE'.
-
del_2q22.3 cnv correlated to 'YEARS_TO_BIRTH' and 'GLEASON_SCORE'.
-
del_3p13 cnv correlated to 'YEARS_TO_BIRTH' and 'RADIATION_THERAPY'.
-
del_3q29 cnv correlated to 'GLEASON_SCORE'.
-
del_4q28.2 cnv correlated to 'YEARS_TO_BIRTH', 'PATHOLOGY_T_STAGE', 'RADIATION_THERAPY', and 'GLEASON_SCORE'.
-
del_5q11.2 cnv correlated to 'YEARS_TO_BIRTH', 'PATHOLOGY_T_STAGE', 'PATHOLOGY_N_STAGE', 'RADIATION_THERAPY', 'RESIDUAL_TUMOR', 'NUMBER_OF_LYMPH_NODES', and 'GLEASON_SCORE'.
-
del_5q13.2 cnv correlated to 'PATHOLOGY_T_STAGE', 'PATHOLOGY_N_STAGE', 'RADIATION_THERAPY', 'NUMBER_OF_LYMPH_NODES', and 'GLEASON_SCORE'.
-
del_5q21.1 cnv correlated to 'YEARS_TO_BIRTH', 'PATHOLOGY_T_STAGE', 'GLEASON_SCORE', and 'PSA_VALUE'.
-
del_6p25.1 cnv correlated to 'PATHOLOGY_T_STAGE', 'PATHOLOGY_N_STAGE', 'NUMBER_OF_LYMPH_NODES', 'GLEASON_SCORE', and 'RACE'.
-
del_6q14.3 cnv correlated to 'YEARS_TO_BIRTH', 'PATHOLOGY_T_STAGE', 'PATHOLOGY_N_STAGE', 'RESIDUAL_TUMOR', 'NUMBER_OF_LYMPH_NODES', and 'GLEASON_SCORE'.
-
del_7q31.33 cnv correlated to 'PATHOLOGY_N_STAGE', 'NUMBER_OF_LYMPH_NODES', and 'GLEASON_SCORE'.
-
del_8p23.2 cnv correlated to 'PATHOLOGY_T_STAGE', 'PATHOLOGY_N_STAGE', 'NUMBER_OF_LYMPH_NODES', 'GLEASON_SCORE', and 'PSA_VALUE'.
-
del_8p21.3 cnv correlated to 'PATHOLOGY_T_STAGE', 'PATHOLOGY_N_STAGE', 'RADIATION_THERAPY', 'NUMBER_OF_LYMPH_NODES', 'GLEASON_SCORE', and 'PSA_VALUE'.
-
del_9p23 cnv correlated to 'PATHOLOGY_T_STAGE', 'PATHOLOGY_N_STAGE', 'RADIATION_THERAPY', 'NUMBER_OF_LYMPH_NODES', and 'GLEASON_SCORE'.
-
del_10q23.31 cnv correlated to 'PATHOLOGY_T_STAGE', 'PATHOLOGY_N_STAGE', 'RADIATION_THERAPY', 'NUMBER_OF_LYMPH_NODES', 'GLEASON_SCORE', and 'PSA_VALUE'.
-
del_11p11.2 cnv correlated to 'PATHOLOGY_T_STAGE', 'RESIDUAL_TUMOR', 'GLEASON_SCORE', and 'RACE'.
-
del_11q22.3 cnv correlated to 'YEARS_TO_BIRTH', 'PATHOLOGY_T_STAGE', 'RADIATION_THERAPY', 'RESIDUAL_TUMOR', 'NUMBER_OF_LYMPH_NODES', and 'GLEASON_SCORE'.
-
del_11q23.2 cnv correlated to 'YEARS_TO_BIRTH', 'PATHOLOGY_T_STAGE', 'RADIATION_THERAPY', 'RESIDUAL_TUMOR', and 'GLEASON_SCORE'.
-
del_12p13.1 cnv correlated to 'PATHOLOGY_T_STAGE', 'PATHOLOGY_N_STAGE', 'RADIATION_THERAPY', 'NUMBER_OF_LYMPH_NODES', 'GLEASON_SCORE', and 'PSA_VALUE'.
-
del_12q24.32 cnv correlated to 'PATHOLOGY_T_STAGE', 'PATHOLOGY_N_STAGE', 'NUMBER_OF_LYMPH_NODES', and 'GLEASON_SCORE'.
-
del_13q14.13 cnv correlated to 'YEARS_TO_BIRTH', 'PATHOLOGY_T_STAGE', 'RADIATION_THERAPY', 'RESIDUAL_TUMOR', 'GLEASON_SCORE', and 'RACE'.
-
del_13q22.1 cnv correlated to 'YEARS_TO_BIRTH', 'PATHOLOGY_T_STAGE', 'PATHOLOGY_N_STAGE', 'RADIATION_THERAPY', 'RESIDUAL_TUMOR', 'NUMBER_OF_LYMPH_NODES', 'GLEASON_SCORE', and 'RACE'.
-
del_15q21.3 cnv correlated to 'PATHOLOGY_T_STAGE', 'PATHOLOGY_N_STAGE', 'RADIATION_THERAPY', 'NUMBER_OF_LYMPH_NODES', 'GLEASON_SCORE', and 'PSA_VALUE'.
-
del_16q22.3 cnv correlated to 'YEARS_TO_BIRTH', 'PATHOLOGY_T_STAGE', 'PATHOLOGY_N_STAGE', 'RESIDUAL_TUMOR', 'NUMBER_OF_LYMPH_NODES', 'GLEASON_SCORE', and 'PSA_VALUE'.
-
del_16q24.1 cnv correlated to 'PATHOLOGY_T_STAGE', 'PATHOLOGY_N_STAGE', 'RESIDUAL_TUMOR', 'NUMBER_OF_LYMPH_NODES', 'GLEASON_SCORE', and 'PSA_VALUE'.
-
del_17p13.1 cnv correlated to 'PATHOLOGY_T_STAGE', 'PATHOLOGY_N_STAGE', 'RADIATION_THERAPY', 'RESIDUAL_TUMOR', 'NUMBER_OF_LYMPH_NODES', and 'GLEASON_SCORE'.
-
del_17q21.31 cnv correlated to 'PATHOLOGY_T_STAGE'.
-
del_18q21.31 cnv correlated to 'PATHOLOGY_T_STAGE', 'PATHOLOGY_N_STAGE', 'RADIATION_THERAPY', 'RESIDUAL_TUMOR', 'NUMBER_OF_LYMPH_NODES', and 'GLEASON_SCORE'.
-
del_18q23 cnv correlated to 'PATHOLOGY_T_STAGE', 'PATHOLOGY_N_STAGE', 'RADIATION_THERAPY', 'RESIDUAL_TUMOR', 'NUMBER_OF_LYMPH_NODES', 'GLEASON_SCORE', and 'PSA_VALUE'.
-
del_19q13.2 cnv correlated to 'Time to Death', 'YEARS_TO_BIRTH', 'PATHOLOGY_T_STAGE', 'RESIDUAL_TUMOR', and 'GLEASON_SCORE'.
-
del_21q22.2 cnv correlated to 'PATHOLOGY_T_STAGE', 'PATHOLOGY_N_STAGE', 'RADIATION_THERAPY', 'NUMBER_OF_LYMPH_NODES', 'GLEASON_SCORE', and 'RACE'.
-
del_21q22.3 cnv correlated to 'PATHOLOGY_T_STAGE' and 'NUMBER_OF_LYMPH_NODES'.
Table 1. Get Full Table Overview of the association between significant copy number variation of 65 focal events and 11 clinical features. Shown in the table are P values (Q values). Thresholded by Q value < 0.25, 351 significant findings detected.
|
Clinical Features |
Time to Death |
YEARS TO BIRTH |
PATHOLOGY T STAGE |
PATHOLOGY N STAGE |
RADIATION THERAPY |
HISTOLOGICAL TYPE |
RESIDUAL TUMOR |
NUMBER OF LYMPH NODES |
GLEASON SCORE |
PSA VALUE |
RACE | ||
| nCNV (%) | nWild-Type | logrank test | Wilcoxon-test | Fisher's exact test | Fisher's exact test | Fisher's exact test | Fisher's exact test | Fisher's exact test | Wilcoxon-test | Wilcoxon-test | Wilcoxon-test | Fisher's exact test | |
| amp xp21 1 | 23 (5%) | 468 |
0.543 (0.697) |
0.00157 (0.00943) |
0.00542 (0.0238) |
0.0499 (0.132) |
0.736 (0.865) |
0.0233 (0.0752) |
0.0175 (0.0618) |
0.0463 (0.124) |
0.000232 (0.00224) |
0.113 (0.235) |
0.00745 (0.0317) |
| amp 1q22 | 39 (8%) | 452 |
0.417 (0.588) |
0.0122 (0.0463) |
1e-05 (0.000162) |
0.000557 (0.00419) |
0.033 (0.0952) |
0.0191 (0.0653) |
0.0534 (0.137) |
0.000171 (0.00183) |
3.24e-07 (1.16e-05) |
0.163 (0.315) |
1 (1.00) |
| amp 3q26 2 | 85 (17%) | 406 |
0.29 (0.476) |
0.0247 (0.0784) |
1e-05 (0.000162) |
0.000636 (0.00459) |
0.0871 (0.194) |
0.278 (0.465) |
0.0003 (0.00268) |
5.74e-05 (0.000747) |
2.17e-09 (1.72e-07) |
0.0511 (0.133) |
1 (1.00) |
| amp 8q22 1 | 156 (32%) | 335 |
0.56 (0.707) |
0.0909 (0.201) |
1e-05 (0.000162) |
0.00142 (0.00873) |
0.00877 (0.036) |
0.564 (0.708) |
2e-05 (0.000292) |
0.000483 (0.00383) |
2.43e-13 (1.74e-10) |
0.0606 (0.148) |
1 (1.00) |
| amp 8q24 21 | 151 (31%) | 340 |
0.973 (1.00) |
0.057 (0.143) |
1e-05 (0.000162) |
0.000738 (0.00517) |
0.0304 (0.0889) |
0.566 (0.708) |
0.00024 (0.00229) |
0.000147 (0.0016) |
1.53e-12 (3.64e-10) |
0.0321 (0.0937) |
0.812 (0.92) |
| amp 15q11 2 | 15 (3%) | 476 |
0.0932 (0.203) |
0.085 (0.19) |
0.118 (0.242) |
0.000143 (0.00157) |
0.0586 (0.146) |
1 (1.00) |
0.0344 (0.0975) |
4.27e-06 (0.000122) |
0.00307 (0.0156) |
0.628 (0.765) |
|
| amp 16q11 2 | 30 (6%) | 461 |
0.507 (0.666) |
0.0262 (0.0816) |
0.00029 (0.00266) |
0.0728 (0.169) |
0.0539 (0.137) |
0.208 (0.38) |
0.038 (0.105) |
0.0589 (0.146) |
1.57e-06 (4.88e-05) |
0.0205 (0.0691) |
1 (1.00) |
| amp 17q23 2 | 25 (5%) | 466 |
0.12 (0.243) |
0.171 (0.328) |
0.00084 (0.00567) |
0.0217 (0.071) |
0.0539 (0.137) |
0.0293 (0.0868) |
0.203 (0.373) |
0.0111 (0.0433) |
7.09e-05 (0.000874) |
0.0497 (0.132) |
1 (1.00) |
| amp 20q13 2 | 44 (9%) | 447 |
0.969 (1.00) |
0.00493 (0.0224) |
2e-05 (0.000292) |
0.00857 (0.0354) |
0.0767 (0.177) |
0.362 (0.55) |
0.0206 (0.0691) |
0.00343 (0.0168) |
1.51e-07 (6.36e-06) |
0.0647 (0.155) |
1 (1.00) |
| amp xp22 11 | 25 (5%) | 466 |
0.592 (0.733) |
0.0135 (0.0501) |
0.00236 (0.013) |
0.104 (0.221) |
0.0436 (0.118) |
0.0293 (0.0868) |
0.0179 (0.0626) |
0.0862 (0.192) |
0.000988 (0.00654) |
0.314 (0.5) |
0.259 (0.444) |
| amp xp22 11 | 24 (5%) | 467 |
0.552 (0.702) |
0.0782 (0.178) |
0.00217 (0.0122) |
0.06 (0.147) |
0.502 (0.661) |
0.0262 (0.0816) |
0.0177 (0.0625) |
0.0642 (0.154) |
0.00115 (0.0074) |
0.0996 (0.213) |
0.215 (0.389) |
| del 13q22 1 | 176 (36%) | 315 |
0.298 (0.483) |
0.000883 (0.0059) |
0.00011 (0.00125) |
0.0927 (0.202) |
0.0773 (0.177) |
0.397 (0.575) |
0.0129 (0.0484) |
0.037 (0.103) |
2.15e-10 (3.08e-08) |
0.291 (0.476) |
0.00047 (0.00378) |
| amp 3q21 3 | 74 (15%) | 417 |
0.209 (0.38) |
0.00282 (0.0148) |
1e-05 (0.000162) |
0.0012 (0.0075) |
0.0265 (0.0816) |
0.244 (0.423) |
0.00044 (0.00366) |
0.000105 (0.00121) |
7.01e-11 (1.25e-08) |
0.136 (0.272) |
0.659 (0.793) |
| amp 9q33 3 | 61 (12%) | 430 |
0.912 (1.00) |
0.0274 (0.0838) |
1e-05 (0.000162) |
1.2e-08 (6.57e-07) |
0.187 (0.351) |
0.0828 (0.187) |
0.00078 (0.00531) |
2.74e-10 (3.26e-08) |
1.3e-12 (3.64e-10) |
0.229 (0.408) |
0.555 (0.703) |
| amp 11q13 2 | 47 (10%) | 444 |
0.407 (0.585) |
0.000569 (0.00423) |
1e-05 (0.000162) |
6.26e-06 (0.000162) |
0.0963 (0.207) |
0.634 (0.77) |
0.00303 (0.0155) |
2.87e-07 (1.08e-05) |
2.28e-08 (1.09e-06) |
0.579 (0.721) |
0.345 (0.533) |
| amp 12q23 1 | 36 (7%) | 455 |
0.387 (0.567) |
0.116 (0.238) |
0.0007 (0.005) |
0.000204 (0.00204) |
0.012 (0.0457) |
1 (1.00) |
0.0003 (0.00268) |
2.77e-05 (0.000389) |
9.96e-07 (3.24e-05) |
0.374 (0.562) |
1 (1.00) |
| amp xq21 1 | 14 (3%) | 477 |
0.597 (0.736) |
0.0164 (0.0584) |
0.0198 (0.0675) |
0.0277 (0.0842) |
0.683 (0.815) |
1 (1.00) |
0.0798 (0.181) |
0.0253 (0.0801) |
0.00207 (0.0118) |
0.375 (0.562) |
0.0273 (0.0837) |
| del 5q11 2 | 99 (20%) | 392 |
0.656 (0.791) |
0.0257 (0.081) |
1e-05 (0.000162) |
0.000371 (0.00323) |
0.00766 (0.0322) |
0.746 (0.869) |
0.0283 (0.0857) |
1.49e-05 (0.000232) |
5.05e-10 (5.16e-08) |
0.406 (0.584) |
0.438 (0.609) |
| del 16q22 3 | 190 (39%) | 301 |
0.435 (0.607) |
0.0415 (0.115) |
0.00022 (0.00215) |
0.0289 (0.0868) |
0.563 (0.708) |
1 (1.00) |
0.0324 (0.0941) |
0.0106 (0.0423) |
7.22e-09 (4.69e-07) |
0.0905 (0.2) |
0.718 (0.848) |
| del 18q23 | 136 (28%) | 355 |
0.467 (0.633) |
0.148 (0.293) |
0.0005 (0.00384) |
0.00519 (0.023) |
0.11 (0.231) |
1 (1.00) |
0.0037 (0.0178) |
0.00234 (0.013) |
9.81e-07 (3.24e-05) |
0.033 (0.0952) |
0.446 (0.618) |
| amp 4q13 3 | 22 (4%) | 469 |
0.53 (0.688) |
0.019 (0.0653) |
0.00184 (0.0107) |
0.000521 (0.00397) |
0.294 (0.479) |
0.478 (0.643) |
0.00507 (0.0227) |
5.14e-05 (0.000681) |
0.000256 (0.00238) |
0.378 (0.562) |
1 (1.00) |
| amp 5q35 3 | 28 (6%) | 463 |
0.449 (0.62) |
2.6e-07 (1.03e-05) |
0.00019 (0.00197) |
0.000717 (0.00508) |
0.556 (0.703) |
0.565 (0.708) |
0.0621 (0.151) |
6.35e-05 (0.000811) |
3.64e-05 (0.000501) |
0.931 (1.00) |
0.264 (0.45) |
| amp 14q21 1 | 30 (6%) | 461 |
0.682 (0.815) |
0.0368 (0.103) |
0.0691 (0.163) |
0.0148 (0.0538) |
0.00319 (0.016) |
0.208 (0.38) |
0.415 (0.588) |
0.0055 (0.0239) |
7.74e-05 (0.000938) |
0.915 (1.00) |
1 (1.00) |
| amp 19q13 43 | 18 (4%) | 473 |
0.24 (0.419) |
0.0301 (0.0885) |
0.0005 (0.00384) |
0.022 (0.0716) |
1 (1.00) |
0.089 (0.198) |
0.275 (0.463) |
0.0115 (0.0445) |
8.97e-06 (0.000162) |
0.447 (0.618) |
1 (1.00) |
| del 6q14 3 | 179 (36%) | 312 |
0.342 (0.531) |
0.00104 (0.00683) |
0.0666 (0.159) |
0.0265 (0.0816) |
0.141 (0.279) |
1 (1.00) |
0.00044 (0.00366) |
0.018 (0.0626) |
0.000445 (0.00366) |
0.529 (0.688) |
0.58 (0.722) |
| del 8p21 3 | 293 (60%) | 198 |
0.389 (0.569) |
0.386 (0.567) |
1e-05 (0.000162) |
0.00272 (0.0144) |
0.0589 (0.146) |
0.582 (0.722) |
0.156 (0.304) |
0.0013 (0.00809) |
0.00109 (0.00707) |
0.0838 (0.188) |
0.729 (0.861) |
| del 10q23 31 | 156 (32%) | 335 |
0.909 (1.00) |
0.548 (0.701) |
1e-05 (0.000162) |
0.00236 (0.013) |
0.0214 (0.0706) |
0.774 (0.893) |
0.164 (0.318) |
0.00118 (0.0075) |
5.3e-08 (2.37e-06) |
0.00956 (0.0386) |
0.235 (0.413) |
| del 11q22 3 | 43 (9%) | 448 |
0.384 (0.566) |
0.0338 (0.0966) |
0.00062 (0.00452) |
0.173 (0.33) |
0.0529 (0.137) |
0.351 (0.539) |
0.00393 (0.0187) |
0.068 (0.161) |
6.89e-05 (0.000864) |
0.806 (0.919) |
0.633 (0.77) |
| del 12p13 1 | 124 (25%) | 367 |
0.803 (0.918) |
0.786 (0.902) |
1e-05 (0.000162) |
0.011 (0.0431) |
0.0225 (0.0729) |
0.129 (0.26) |
0.341 (0.53) |
0.00297 (0.0154) |
4.49e-05 (0.000606) |
0.021 (0.0699) |
1 (1.00) |
| del 13q14 13 | 227 (46%) | 264 |
0.907 (1.00) |
0.0129 (0.0485) |
0.00433 (0.0201) |
0.209 (0.38) |
0.00411 (0.0193) |
0.277 (0.464) |
0.00198 (0.0113) |
0.178 (0.338) |
1.48e-05 (0.000232) |
0.319 (0.504) |
0.00414 (0.0193) |
| del 15q21 3 | 66 (13%) | 425 |
0.565 (0.708) |
0.299 (0.483) |
1e-05 (0.000162) |
0.00155 (0.00943) |
0.00261 (0.0142) |
0.416 (0.588) |
0.19 (0.353) |
0.000614 (0.00452) |
1.73e-08 (8.82e-07) |
0.112 (0.235) |
1 (1.00) |
| del 16q24 1 | 212 (43%) | 279 |
0.432 (0.605) |
0.251 (0.433) |
2e-05 (0.000292) |
0.0425 (0.117) |
0.477 (0.643) |
1 (1.00) |
0.119 (0.243) |
0.0209 (0.0699) |
3.01e-09 (2.15e-07) |
0.0634 (0.153) |
1 (1.00) |
| del 17p13 1 | 162 (33%) | 329 |
0.546 (0.699) |
0.414 (0.588) |
1e-05 (0.000162) |
0.00344 (0.0168) |
0.0161 (0.058) |
0.781 (0.899) |
0.0152 (0.0549) |
0.000435 (0.00366) |
1.99e-09 (1.72e-07) |
0.238 (0.418) |
0.823 (0.929) |
| del 18q21 31 | 130 (26%) | 361 |
0.421 (0.592) |
0.765 (0.886) |
0.00045 (0.00366) |
0.0239 (0.0762) |
0.0505 (0.133) |
1 (1.00) |
0.00116 (0.00741) |
0.0142 (0.0523) |
4.75e-06 (0.000131) |
0.253 (0.436) |
0.395 (0.573) |
| del 21q22 2 | 52 (11%) | 439 |
0.295 (0.479) |
0.221 (0.397) |
0.00166 (0.00981) |
0.066 (0.158) |
0.101 (0.216) |
0.177 (0.336) |
0.754 (0.875) |
0.0341 (0.0972) |
0.0347 (0.0981) |
0.572 (0.714) |
0.0774 (0.177) |
| amp 13q12 11 | 25 (5%) | 466 |
0.79 (0.905) |
0.000412 (0.00355) |
0.0045 (0.0208) |
0.151 (0.295) |
0.338 (0.528) |
0.0293 (0.0868) |
0.202 (0.373) |
0.0836 (0.188) |
0.0107 (0.0423) |
0.462 (0.632) |
0.307 (0.491) |
| del 1p31 3 | 59 (12%) | 432 |
0.476 (0.643) |
0.233 (0.412) |
0.00955 (0.0386) |
0.128 (0.259) |
0.0294 (0.0868) |
0.393 (0.571) |
0.0701 (0.164) |
0.0989 (0.212) |
0.000205 (0.00204) |
0.275 (0.463) |
0.199 (0.367) |
| del 1q42 3 | 47 (10%) | 444 |
0.000102 (0.0012) |
0.115 (0.236) |
0.353 (0.54) |
0.307 (0.491) |
1 (1.00) |
1 (1.00) |
0.0104 (0.0419) |
0.138 (0.276) |
0.0679 (0.161) |
0.0926 (0.202) |
0.555 (0.703) |
| del 2p21 | 45 (9%) | 446 |
0.988 (1.00) |
0.15 (0.295) |
0.00035 (0.00309) |
0.0585 (0.146) |
0.458 (0.63) |
0.628 (0.765) |
0.0506 (0.133) |
0.0554 (0.141) |
0.003 (0.0154) |
0.231 (0.409) |
1 (1.00) |
| del 5q13 2 | 98 (20%) | 393 |
0.483 (0.643) |
0.392 (0.571) |
1e-05 (0.000162) |
0.0214 (0.0706) |
0.0338 (0.0966) |
0.746 (0.869) |
0.238 (0.418) |
0.00266 (0.0142) |
1.03e-08 (6.17e-07) |
0.288 (0.476) |
0.293 (0.479) |
| del 6p25 1 | 46 (9%) | 445 |
0.171 (0.328) |
0.32 (0.504) |
0.0095 (0.0386) |
0.00605 (0.0261) |
0.222 (0.398) |
1 (1.00) |
0.617 (0.757) |
0.00157 (0.00943) |
8.2e-06 (0.000162) |
0.487 (0.645) |
0.00664 (0.0284) |
| del 8p23 2 | 223 (45%) | 268 |
0.4 (0.578) |
0.376 (0.562) |
1e-05 (0.000162) |
0.0112 (0.0434) |
0.156 (0.304) |
1 (1.00) |
0.532 (0.689) |
0.00532 (0.0235) |
0.00459 (0.0211) |
0.0689 (0.162) |
0.375 (0.562) |
| del 9p23 | 45 (9%) | 446 |
0.283 (0.47) |
0.498 (0.656) |
0.0238 (0.0762) |
0.0201 (0.0682) |
0.0963 (0.207) |
1 (1.00) |
0.416 (0.588) |
0.00755 (0.0319) |
0.00401 (0.019) |
0.271 (0.46) |
1 (1.00) |
| del 11q23 2 | 48 (10%) | 443 |
0.371 (0.56) |
0.0711 (0.166) |
0.00264 (0.0142) |
0.672 (0.806) |
0.0725 (0.169) |
1 (1.00) |
0.0143 (0.0526) |
0.808 (0.92) |
8.42e-05 (0.001) |
0.463 (0.632) |
0.662 (0.795) |
| del 19q13 2 | 52 (11%) | 439 |
0.109 (0.231) |
0.0496 (0.132) |
0.00499 (0.0224) |
0.242 (0.421) |
0.651 (0.786) |
1 (1.00) |
0.0428 (0.117) |
0.239 (0.418) |
0.00025 (0.00235) |
0.481 (0.643) |
1 (1.00) |
| amp 7p14 3 | 103 (21%) | 388 |
0.464 (0.632) |
0.0107 (0.0423) |
0.0183 (0.0637) |
0.358 (0.545) |
0.385 (0.566) |
0.744 (0.869) |
0.00172 (0.0101) |
0.274 (0.462) |
0.000205 (0.00204) |
0.997 (1.00) |
1 (1.00) |
| amp 7q22 1 | 100 (20%) | 391 |
0.465 (0.633) |
0.00818 (0.0342) |
0.0632 (0.153) |
0.536 (0.69) |
0.38 (0.563) |
1 (1.00) |
0.00326 (0.0163) |
0.463 (0.632) |
0.000185 (0.00195) |
0.598 (0.736) |
1 (1.00) |
| amp 8p11 23 | 67 (14%) | 424 |
0.196 (0.365) |
0.000488 (0.00383) |
0.00364 (0.0176) |
0.375 (0.562) |
0.409 (0.586) |
0.704 (0.837) |
0.0119 (0.0457) |
0.268 (0.456) |
1.67e-06 (4.99e-05) |
0.786 (0.902) |
1 (1.00) |
| amp xq27 1 | 19 (4%) | 472 |
0.188 (0.352) |
0.0216 (0.0708) |
0.0774 (0.177) |
0.53 (0.688) |
1 (1.00) |
1 (1.00) |
0.171 (0.328) |
0.684 (0.816) |
0.0371 (0.103) |
0.114 (0.236) |
0.423 (0.594) |
| del 1p22 1 | 58 (12%) | 433 |
0.949 (1.00) |
0.515 (0.676) |
0.00267 (0.0142) |
0.128 (0.259) |
0.187 (0.351) |
0.39 (0.569) |
0.0911 (0.201) |
0.0435 (0.118) |
0.000132 (0.00148) |
0.976 (1.00) |
1 (1.00) |
| del 4q28 2 | 50 (10%) | 441 |
0.357 (0.544) |
0.00158 (0.00943) |
0.0595 (0.146) |
0.54 (0.695) |
0.11 (0.231) |
0.644 (0.781) |
0.536 (0.69) |
0.378 (0.562) |
0.000761 (0.00523) |
0.591 (0.733) |
0.299 (0.483) |
| del 5q21 1 | 108 (22%) | 383 |
0.517 (0.676) |
0.0567 (0.143) |
0.0258 (0.081) |
0.883 (0.992) |
0.312 (0.497) |
0.744 (0.869) |
0.474 (0.642) |
0.676 (0.81) |
0.00185 (0.0107) |
0.0755 (0.175) |
0.734 (0.864) |
| del 11p11 2 | 34 (7%) | 457 |
0.528 (0.688) |
0.516 (0.676) |
0.0164 (0.0584) |
0.479 (0.643) |
1 (1.00) |
0.613 (0.753) |
0.043 (0.117) |
0.329 (0.516) |
0.0121 (0.046) |
0.597 (0.736) |
0.00346 (0.0168) |
| del 12q24 32 | 43 (9%) | 448 |
0.904 (1.00) |
0.817 (0.924) |
0.00294 (0.0153) |
0.0291 (0.0868) |
0.325 (0.512) |
1 (1.00) |
0.328 (0.516) |
0.0147 (0.0536) |
0.054 (0.137) |
0.981 (1.00) |
1 (1.00) |
| amp 4p16 3 | 19 (4%) | 472 |
0.535 (0.69) |
0.0452 (0.122) |
0.00076 (0.00523) |
0.346 (0.533) |
0.711 (0.843) |
0.429 (0.601) |
0.232 (0.411) |
0.344 (0.533) |
0.00843 (0.035) |
0.377 (0.562) |
1 (1.00) |
| amp xq21 1 | 16 (3%) | 475 |
0.551 (0.702) |
0.0594 (0.146) |
0.0432 (0.118) |
0.188 (0.352) |
1 (1.00) |
1 (1.00) |
0.138 (0.276) |
0.221 (0.397) |
0.00551 (0.0239) |
0.438 (0.609) |
0.348 (0.534) |
| amp xq25 | 19 (4%) | 472 |
0.281 (0.469) |
0.288 (0.476) |
0.0505 (0.133) |
0.346 (0.533) |
1 (1.00) |
1 (1.00) |
0.189 (0.352) |
0.403 (0.581) |
0.00495 (0.0224) |
0.15 (0.295) |
0.0188 (0.0649) |
| del 7q31 33 | 28 (6%) | 463 |
0.811 (0.92) |
0.312 (0.497) |
0.383 (0.566) |
0.104 (0.221) |
0.353 (0.54) |
1 (1.00) |
0.95 (1.00) |
0.037 (0.103) |
0.0924 (0.202) |
0.885 (0.994) |
1 (1.00) |
| del 2q22 1 | 91 (19%) | 400 |
0.483 (0.643) |
2.24e-05 (0.00032) |
0.15 (0.295) |
1 (1.00) |
0.715 (0.846) |
0.484 (0.643) |
0.29 (0.476) |
0.939 (1.00) |
0.0135 (0.0501) |
0.415 (0.588) |
0.416 (0.588) |
| del 2q22 3 | 84 (17%) | 407 |
0.416 (0.588) |
0.00332 (0.0165) |
0.481 (0.643) |
0.619 (0.757) |
0.705 (0.837) |
0.482 (0.643) |
0.55 (0.702) |
0.495 (0.654) |
0.0947 (0.205) |
0.246 (0.427) |
1 (1.00) |
| del 3p13 | 78 (16%) | 413 |
0.619 (0.757) |
0.0513 (0.133) |
0.933 (1.00) |
0.304 (0.489) |
0.114 (0.236) |
0.254 (0.436) |
0.29 (0.476) |
0.26 (0.444) |
0.224 (0.401) |
0.745 (0.869) |
1 (1.00) |
| del 21q22 3 | 146 (30%) | 345 |
0.278 (0.465) |
0.168 (0.323) |
0.0509 (0.133) |
0.132 (0.266) |
0.219 (0.395) |
0.569 (0.711) |
0.747 (0.869) |
0.0572 (0.144) |
0.207 (0.379) |
0.45 (0.62) |
0.135 (0.27) |
| del 3q29 | 32 (7%) | 459 |
0.439 (0.609) |
0.648 (0.784) |
0.198 (0.367) |
0.332 (0.52) |
0.288 (0.476) |
0.23 (0.409) |
0.183 (0.346) |
0.273 (0.462) |
0.109 (0.231) |
0.923 (1.00) |
1 (1.00) |
| del 17q21 31 | 96 (20%) | 395 |
0.461 (0.632) |
0.306 (0.491) |
0.114 (0.236) |
0.874 (0.984) |
1 (1.00) |
0.742 (0.869) |
0.959 (1.00) |
0.86 (0.97) |
0.319 (0.504) |
0.946 (1.00) |
0.763 (0.884) |
| del 1q23 1 | 28 (6%) | 463 |
0.366 (0.554) |
0.14 (0.278) |
0.383 (0.566) |
0.8 (0.915) |
0.768 (0.887) |
1 (1.00) |
0.486 (0.645) |
0.811 (0.92) |
0.991 (1.00) |
0.893 (1.00) |
1 (1.00) |
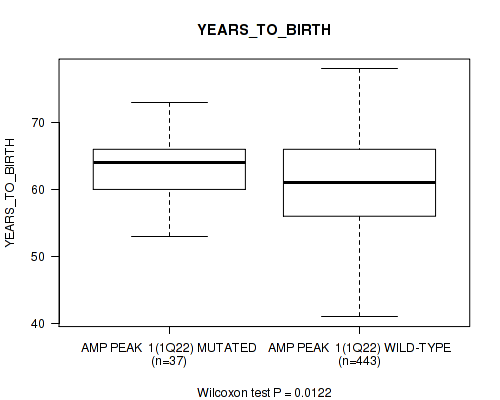
P value = 0.0122 (Wilcoxon-test), Q value = 0.046
Table S1. Gene #1: 'amp_1q22' versus Clinical Feature #2: 'YEARS_TO_BIRTH'
| nPatients | Mean (Std.Dev) | |
|---|---|---|
| ALL | 480 | 61.0 (6.8) |
| AMP PEAK 1(1Q22) MUTATED | 37 | 63.5 (4.5) |
| AMP PEAK 1(1Q22) WILD-TYPE | 443 | 60.8 (6.9) |
Figure S1. Get High-res Image Gene #1: 'amp_1q22' versus Clinical Feature #2: 'YEARS_TO_BIRTH'
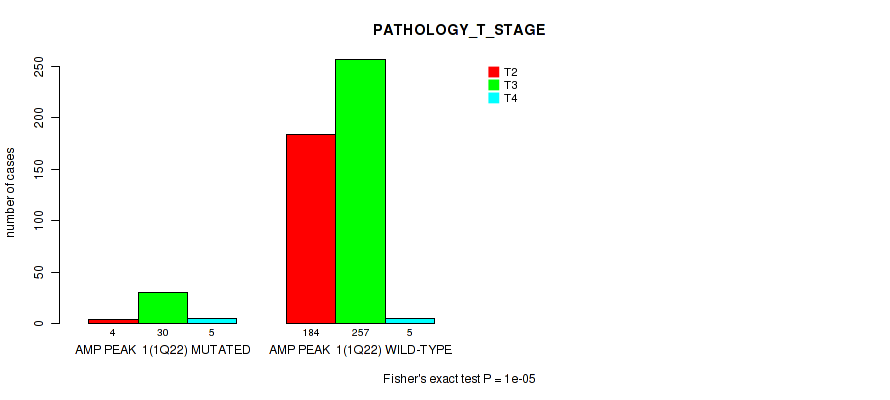
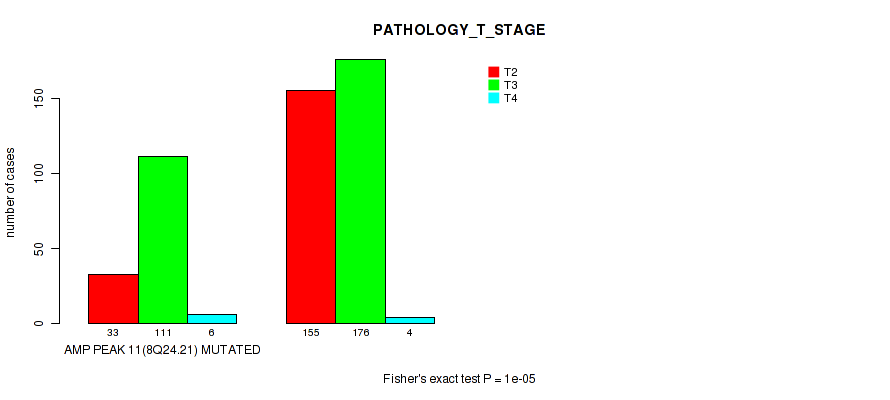
P value = 1e-05 (Fisher's exact test), Q value = 0.00016
Table S2. Gene #1: 'amp_1q22' versus Clinical Feature #3: 'PATHOLOGY_T_STAGE'
| nPatients | T2 | T3 | T4 |
|---|---|---|---|
| ALL | 188 | 287 | 10 |
| AMP PEAK 1(1Q22) MUTATED | 4 | 30 | 5 |
| AMP PEAK 1(1Q22) WILD-TYPE | 184 | 257 | 5 |
Figure S2. Get High-res Image Gene #1: 'amp_1q22' versus Clinical Feature #3: 'PATHOLOGY_T_STAGE'
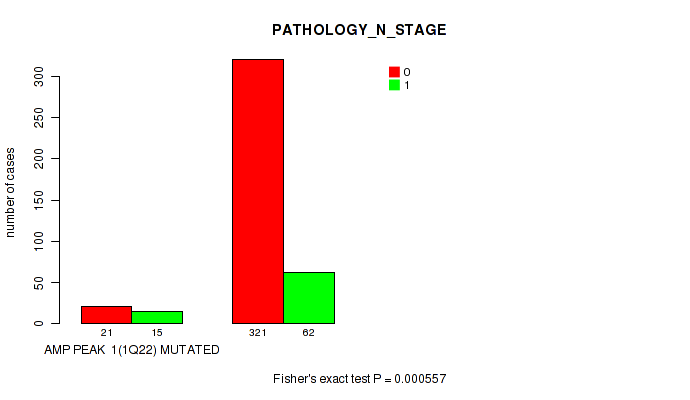
P value = 0.000557 (Fisher's exact test), Q value = 0.0042
Table S3. Gene #1: 'amp_1q22' versus Clinical Feature #4: 'PATHOLOGY_N_STAGE'
| nPatients | 0 | 1 |
|---|---|---|
| ALL | 342 | 77 |
| AMP PEAK 1(1Q22) MUTATED | 21 | 15 |
| AMP PEAK 1(1Q22) WILD-TYPE | 321 | 62 |
Figure S3. Get High-res Image Gene #1: 'amp_1q22' versus Clinical Feature #4: 'PATHOLOGY_N_STAGE'
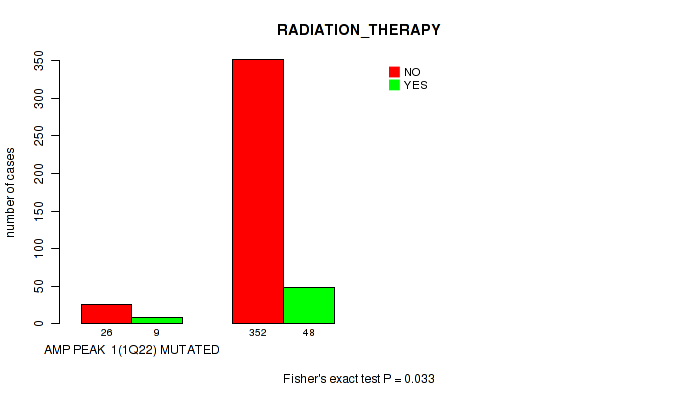
P value = 0.033 (Fisher's exact test), Q value = 0.095
Table S4. Gene #1: 'amp_1q22' versus Clinical Feature #5: 'RADIATION_THERAPY'
| nPatients | NO | YES |
|---|---|---|
| ALL | 378 | 57 |
| AMP PEAK 1(1Q22) MUTATED | 26 | 9 |
| AMP PEAK 1(1Q22) WILD-TYPE | 352 | 48 |
Figure S4. Get High-res Image Gene #1: 'amp_1q22' versus Clinical Feature #5: 'RADIATION_THERAPY'
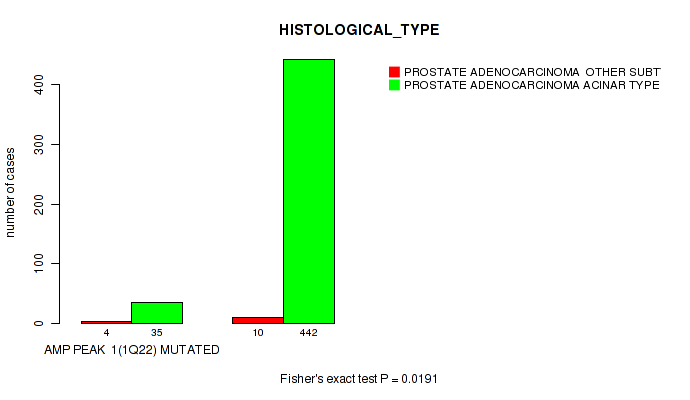
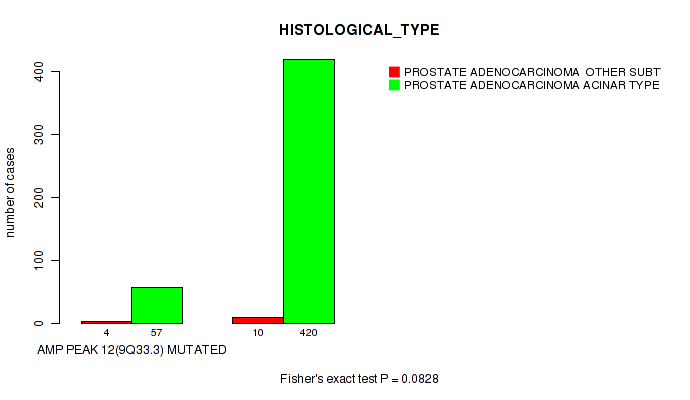
P value = 0.0191 (Fisher's exact test), Q value = 0.065
Table S5. Gene #1: 'amp_1q22' versus Clinical Feature #6: 'HISTOLOGICAL_TYPE'
| nPatients | PROSTATE ADENOCARCINOMA OTHER SUBTYPE | PROSTATE ADENOCARCINOMA ACINAR TYPE |
|---|---|---|
| ALL | 14 | 477 |
| AMP PEAK 1(1Q22) MUTATED | 4 | 35 |
| AMP PEAK 1(1Q22) WILD-TYPE | 10 | 442 |
Figure S5. Get High-res Image Gene #1: 'amp_1q22' versus Clinical Feature #6: 'HISTOLOGICAL_TYPE'
P value = 0.0534 (Fisher's exact test), Q value = 0.14
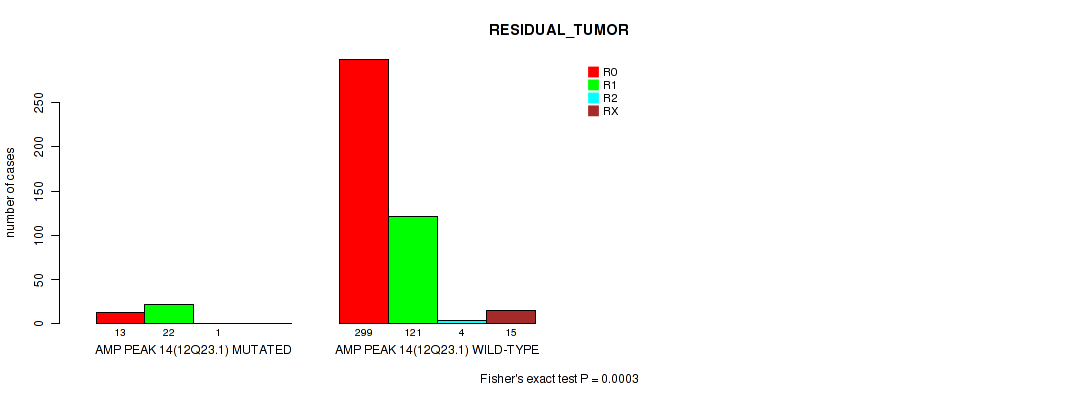
Table S6. Gene #1: 'amp_1q22' versus Clinical Feature #7: 'RESIDUAL_TUMOR'
| nPatients | R0 | R1 | R2 | RX |
|---|---|---|---|---|
| ALL | 312 | 143 | 5 | 15 |
| AMP PEAK 1(1Q22) MUTATED | 19 | 19 | 0 | 0 |
| AMP PEAK 1(1Q22) WILD-TYPE | 293 | 124 | 5 | 15 |
Figure S6. Get High-res Image Gene #1: 'amp_1q22' versus Clinical Feature #7: 'RESIDUAL_TUMOR'

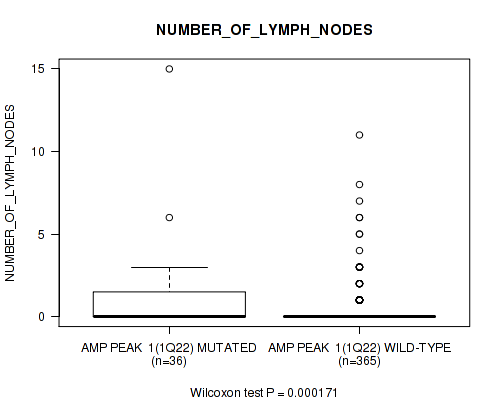
P value = 0.000171 (Wilcoxon-test), Q value = 0.0018
Table S7. Gene #1: 'amp_1q22' versus Clinical Feature #8: 'NUMBER_OF_LYMPH_NODES'
| nPatients | Mean (Std.Dev) | |
|---|---|---|
| ALL | 401 | 0.4 (1.4) |
| AMP PEAK 1(1Q22) MUTATED | 36 | 1.2 (2.7) |
| AMP PEAK 1(1Q22) WILD-TYPE | 365 | 0.4 (1.1) |
Figure S7. Get High-res Image Gene #1: 'amp_1q22' versus Clinical Feature #8: 'NUMBER_OF_LYMPH_NODES'
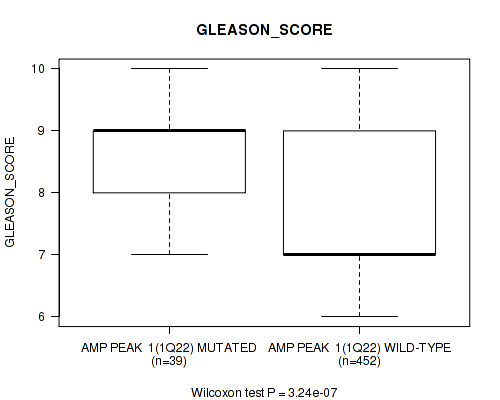
P value = 3.24e-07 (Wilcoxon-test), Q value = 1.2e-05
Table S8. Gene #1: 'amp_1q22' versus Clinical Feature #9: 'GLEASON_SCORE'
| nPatients | Mean (Std.Dev) | |
|---|---|---|
| ALL | 491 | 7.6 (1.0) |
| AMP PEAK 1(1Q22) MUTATED | 39 | 8.4 (0.9) |
| AMP PEAK 1(1Q22) WILD-TYPE | 452 | 7.5 (1.0) |
Figure S8. Get High-res Image Gene #1: 'amp_1q22' versus Clinical Feature #9: 'GLEASON_SCORE'
P value = 0.00282 (Wilcoxon-test), Q value = 0.015
Table S9. Gene #2: 'amp_3q21.3' versus Clinical Feature #2: 'YEARS_TO_BIRTH'
| nPatients | Mean (Std.Dev) | |
|---|---|---|
| ALL | 480 | 61.0 (6.8) |
| AMP PEAK 2(3Q21.3) MUTATED | 71 | 63.2 (6.9) |
| AMP PEAK 2(3Q21.3) WILD-TYPE | 409 | 60.6 (6.7) |
Figure S9. Get High-res Image Gene #2: 'amp_3q21.3' versus Clinical Feature #2: 'YEARS_TO_BIRTH'

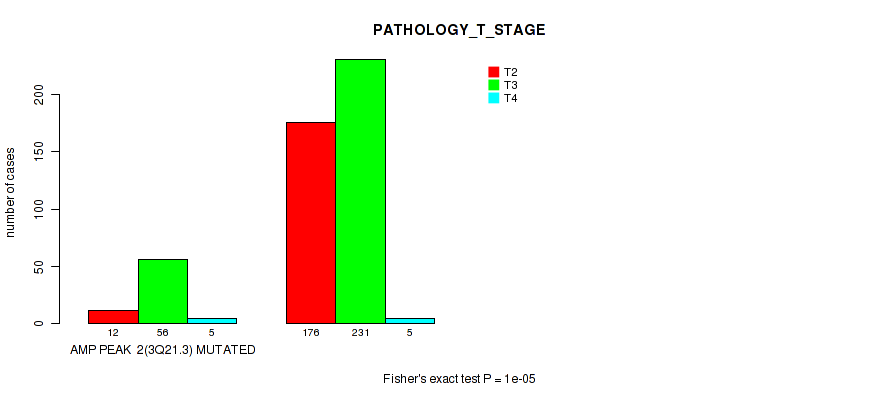
P value = 1e-05 (Fisher's exact test), Q value = 0.00016
Table S10. Gene #2: 'amp_3q21.3' versus Clinical Feature #3: 'PATHOLOGY_T_STAGE'
| nPatients | T2 | T3 | T4 |
|---|---|---|---|
| ALL | 188 | 287 | 10 |
| AMP PEAK 2(3Q21.3) MUTATED | 12 | 56 | 5 |
| AMP PEAK 2(3Q21.3) WILD-TYPE | 176 | 231 | 5 |
Figure S10. Get High-res Image Gene #2: 'amp_3q21.3' versus Clinical Feature #3: 'PATHOLOGY_T_STAGE'
P value = 0.0012 (Fisher's exact test), Q value = 0.0075
Table S11. Gene #2: 'amp_3q21.3' versus Clinical Feature #4: 'PATHOLOGY_N_STAGE'
| nPatients | 0 | 1 |
|---|---|---|
| ALL | 342 | 77 |
| AMP PEAK 2(3Q21.3) MUTATED | 47 | 23 |
| AMP PEAK 2(3Q21.3) WILD-TYPE | 295 | 54 |
Figure S11. Get High-res Image Gene #2: 'amp_3q21.3' versus Clinical Feature #4: 'PATHOLOGY_N_STAGE'
P value = 0.0265 (Fisher's exact test), Q value = 0.082
Table S12. Gene #2: 'amp_3q21.3' versus Clinical Feature #5: 'RADIATION_THERAPY'
| nPatients | NO | YES |
|---|---|---|
| ALL | 378 | 57 |
| AMP PEAK 2(3Q21.3) MUTATED | 49 | 14 |
| AMP PEAK 2(3Q21.3) WILD-TYPE | 329 | 43 |
Figure S12. Get High-res Image Gene #2: 'amp_3q21.3' versus Clinical Feature #5: 'RADIATION_THERAPY'
P value = 0.00044 (Fisher's exact test), Q value = 0.0037
Table S13. Gene #2: 'amp_3q21.3' versus Clinical Feature #7: 'RESIDUAL_TUMOR'
| nPatients | R0 | R1 | R2 | RX |
|---|---|---|---|---|
| ALL | 312 | 143 | 5 | 15 |
| AMP PEAK 2(3Q21.3) MUTATED | 32 | 31 | 2 | 5 |
| AMP PEAK 2(3Q21.3) WILD-TYPE | 280 | 112 | 3 | 10 |
Figure S13. Get High-res Image Gene #2: 'amp_3q21.3' versus Clinical Feature #7: 'RESIDUAL_TUMOR'
P value = 0.000105 (Wilcoxon-test), Q value = 0.0012
Table S14. Gene #2: 'amp_3q21.3' versus Clinical Feature #8: 'NUMBER_OF_LYMPH_NODES'
| nPatients | Mean (Std.Dev) | |
|---|---|---|
| ALL | 401 | 0.4 (1.4) |
| AMP PEAK 2(3Q21.3) MUTATED | 65 | 1.0 (1.9) |
| AMP PEAK 2(3Q21.3) WILD-TYPE | 336 | 0.3 (1.2) |
Figure S14. Get High-res Image Gene #2: 'amp_3q21.3' versus Clinical Feature #8: 'NUMBER_OF_LYMPH_NODES'

P value = 7.01e-11 (Wilcoxon-test), Q value = 1.3e-08
Table S15. Gene #2: 'amp_3q21.3' versus Clinical Feature #9: 'GLEASON_SCORE'
| nPatients | Mean (Std.Dev) | |
|---|---|---|
| ALL | 491 | 7.6 (1.0) |
| AMP PEAK 2(3Q21.3) MUTATED | 74 | 8.3 (0.9) |
| AMP PEAK 2(3Q21.3) WILD-TYPE | 417 | 7.5 (1.0) |
Figure S15. Get High-res Image Gene #2: 'amp_3q21.3' versus Clinical Feature #9: 'GLEASON_SCORE'
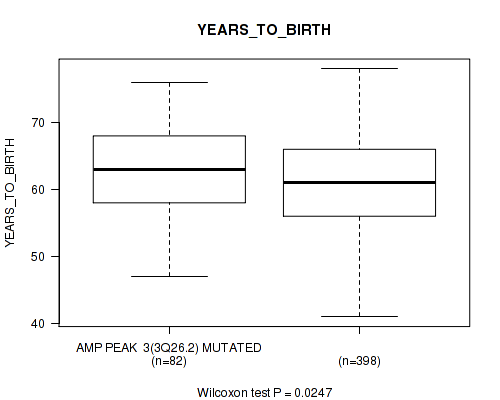
P value = 0.0247 (Wilcoxon-test), Q value = 0.078
Table S16. Gene #3: 'amp_3q26.2' versus Clinical Feature #2: 'YEARS_TO_BIRTH'
| nPatients | Mean (Std.Dev) | |
|---|---|---|
| ALL | 480 | 61.0 (6.8) |
| AMP PEAK 3(3Q26.2) MUTATED | 82 | 62.5 (6.8) |
| AMP PEAK 3(3Q26.2) WILD-TYPE | 398 | 60.6 (6.8) |
Figure S16. Get High-res Image Gene #3: 'amp_3q26.2' versus Clinical Feature #2: 'YEARS_TO_BIRTH'
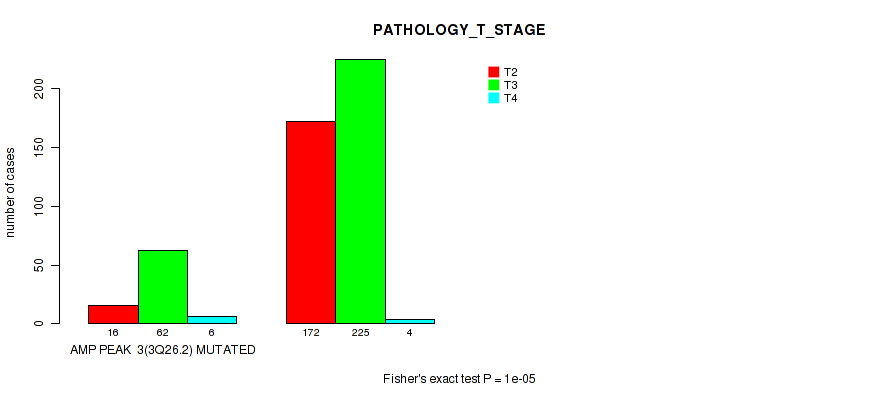
P value = 1e-05 (Fisher's exact test), Q value = 0.00016
Table S17. Gene #3: 'amp_3q26.2' versus Clinical Feature #3: 'PATHOLOGY_T_STAGE'
| nPatients | T2 | T3 | T4 |
|---|---|---|---|
| ALL | 188 | 287 | 10 |
| AMP PEAK 3(3Q26.2) MUTATED | 16 | 62 | 6 |
| AMP PEAK 3(3Q26.2) WILD-TYPE | 172 | 225 | 4 |
Figure S17. Get High-res Image Gene #3: 'amp_3q26.2' versus Clinical Feature #3: 'PATHOLOGY_T_STAGE'
P value = 0.000636 (Fisher's exact test), Q value = 0.0046
Table S18. Gene #3: 'amp_3q26.2' versus Clinical Feature #4: 'PATHOLOGY_N_STAGE'
| nPatients | 0 | 1 |
|---|---|---|
| ALL | 342 | 77 |
| AMP PEAK 3(3Q26.2) MUTATED | 54 | 26 |
| AMP PEAK 3(3Q26.2) WILD-TYPE | 288 | 51 |
Figure S18. Get High-res Image Gene #3: 'amp_3q26.2' versus Clinical Feature #4: 'PATHOLOGY_N_STAGE'

P value = 0.0871 (Fisher's exact test), Q value = 0.19
Table S19. Gene #3: 'amp_3q26.2' versus Clinical Feature #5: 'RADIATION_THERAPY'
| nPatients | NO | YES |
|---|---|---|
| ALL | 378 | 57 |
| AMP PEAK 3(3Q26.2) MUTATED | 58 | 14 |
| AMP PEAK 3(3Q26.2) WILD-TYPE | 320 | 43 |
Figure S19. Get High-res Image Gene #3: 'amp_3q26.2' versus Clinical Feature #5: 'RADIATION_THERAPY'

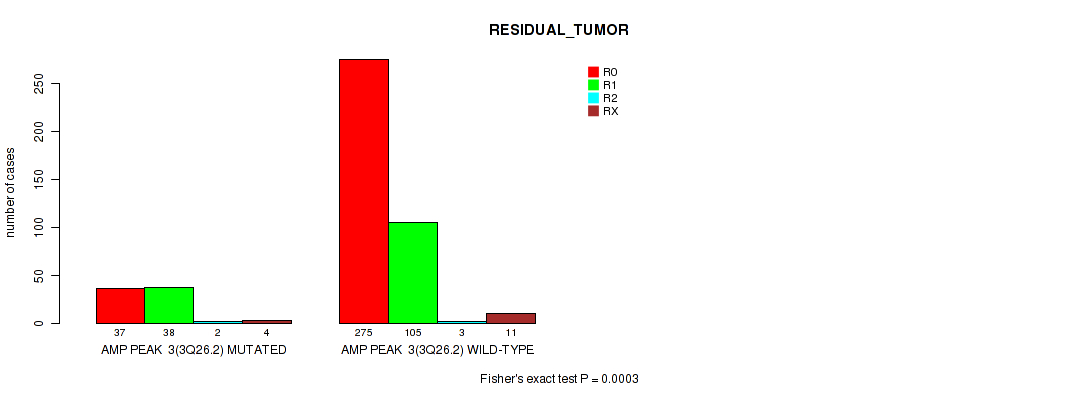
P value = 3e-04 (Fisher's exact test), Q value = 0.0027
Table S20. Gene #3: 'amp_3q26.2' versus Clinical Feature #7: 'RESIDUAL_TUMOR'
| nPatients | R0 | R1 | R2 | RX |
|---|---|---|---|---|
| ALL | 312 | 143 | 5 | 15 |
| AMP PEAK 3(3Q26.2) MUTATED | 37 | 38 | 2 | 4 |
| AMP PEAK 3(3Q26.2) WILD-TYPE | 275 | 105 | 3 | 11 |
Figure S20. Get High-res Image Gene #3: 'amp_3q26.2' versus Clinical Feature #7: 'RESIDUAL_TUMOR'
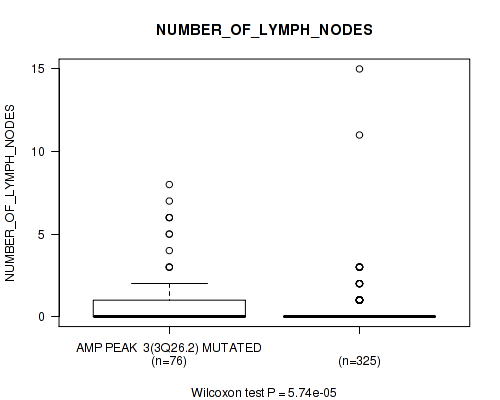
P value = 5.74e-05 (Wilcoxon-test), Q value = 0.00075
Table S21. Gene #3: 'amp_3q26.2' versus Clinical Feature #8: 'NUMBER_OF_LYMPH_NODES'
| nPatients | Mean (Std.Dev) | |
|---|---|---|
| ALL | 401 | 0.4 (1.4) |
| AMP PEAK 3(3Q26.2) MUTATED | 76 | 1.0 (1.9) |
| AMP PEAK 3(3Q26.2) WILD-TYPE | 325 | 0.3 (1.2) |
Figure S21. Get High-res Image Gene #3: 'amp_3q26.2' versus Clinical Feature #8: 'NUMBER_OF_LYMPH_NODES'
P value = 2.17e-09 (Wilcoxon-test), Q value = 1.7e-07
Table S22. Gene #3: 'amp_3q26.2' versus Clinical Feature #9: 'GLEASON_SCORE'
| nPatients | Mean (Std.Dev) | |
|---|---|---|
| ALL | 491 | 7.6 (1.0) |
| AMP PEAK 3(3Q26.2) MUTATED | 85 | 8.2 (1.0) |
| AMP PEAK 3(3Q26.2) WILD-TYPE | 406 | 7.5 (1.0) |
Figure S22. Get High-res Image Gene #3: 'amp_3q26.2' versus Clinical Feature #9: 'GLEASON_SCORE'

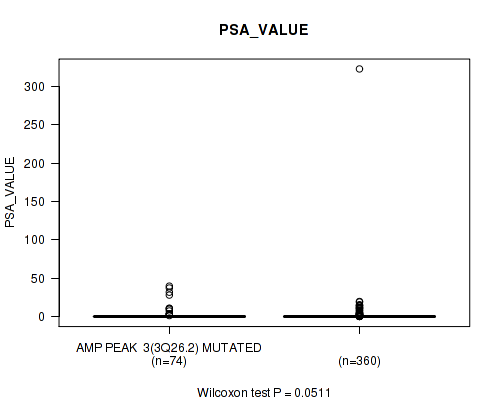
P value = 0.0511 (Wilcoxon-test), Q value = 0.13
Table S23. Gene #3: 'amp_3q26.2' versus Clinical Feature #10: 'PSA_VALUE'
| nPatients | Mean (Std.Dev) | |
|---|---|---|
| ALL | 434 | 1.8 (16.0) |
| AMP PEAK 3(3Q26.2) MUTATED | 74 | 2.7 (8.0) |
| AMP PEAK 3(3Q26.2) WILD-TYPE | 360 | 1.6 (17.2) |
Figure S23. Get High-res Image Gene #3: 'amp_3q26.2' versus Clinical Feature #10: 'PSA_VALUE'
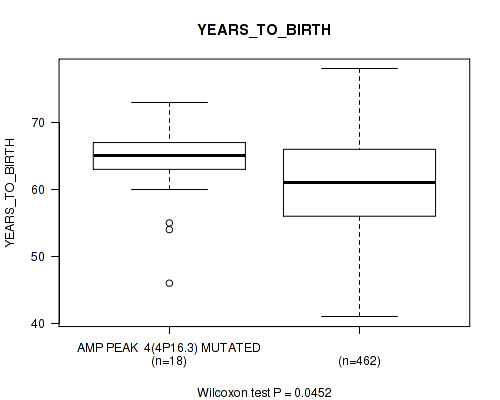
P value = 0.0452 (Wilcoxon-test), Q value = 0.12
Table S24. Gene #4: 'amp_4p16.3' versus Clinical Feature #2: 'YEARS_TO_BIRTH'
| nPatients | Mean (Std.Dev) | |
|---|---|---|
| ALL | 480 | 61.0 (6.8) |
| AMP PEAK 4(4P16.3) MUTATED | 18 | 63.7 (6.6) |
| AMP PEAK 4(4P16.3) WILD-TYPE | 462 | 60.9 (6.8) |
Figure S24. Get High-res Image Gene #4: 'amp_4p16.3' versus Clinical Feature #2: 'YEARS_TO_BIRTH'
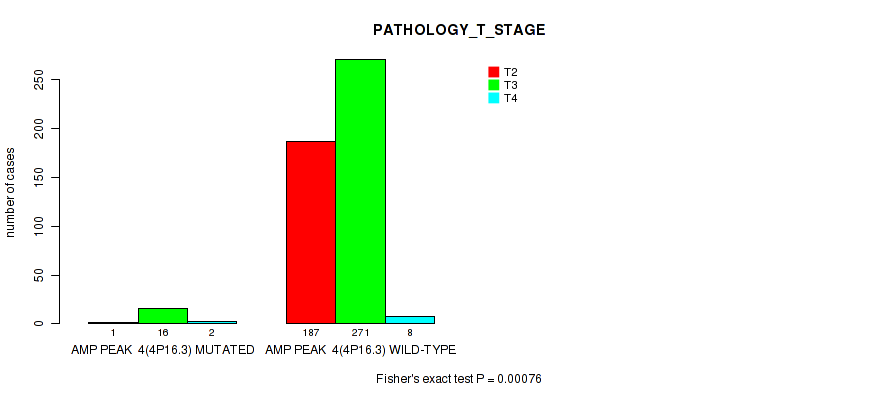
P value = 0.00076 (Fisher's exact test), Q value = 0.0052
Table S25. Gene #4: 'amp_4p16.3' versus Clinical Feature #3: 'PATHOLOGY_T_STAGE'
| nPatients | T2 | T3 | T4 |
|---|---|---|---|
| ALL | 188 | 287 | 10 |
| AMP PEAK 4(4P16.3) MUTATED | 1 | 16 | 2 |
| AMP PEAK 4(4P16.3) WILD-TYPE | 187 | 271 | 8 |
Figure S25. Get High-res Image Gene #4: 'amp_4p16.3' versus Clinical Feature #3: 'PATHOLOGY_T_STAGE'
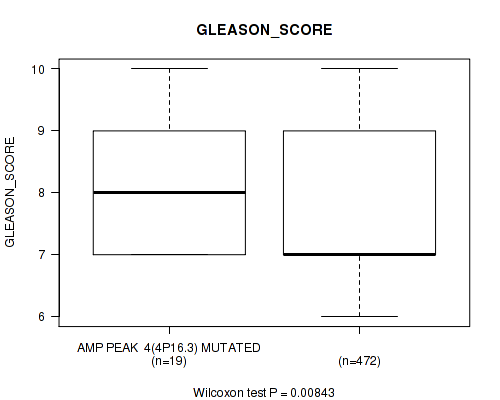
P value = 0.00843 (Wilcoxon-test), Q value = 0.035
Table S26. Gene #4: 'amp_4p16.3' versus Clinical Feature #9: 'GLEASON_SCORE'
| nPatients | Mean (Std.Dev) | |
|---|---|---|
| ALL | 491 | 7.6 (1.0) |
| AMP PEAK 4(4P16.3) MUTATED | 19 | 8.2 (1.0) |
| AMP PEAK 4(4P16.3) WILD-TYPE | 472 | 7.6 (1.0) |
Figure S26. Get High-res Image Gene #4: 'amp_4p16.3' versus Clinical Feature #9: 'GLEASON_SCORE'
P value = 0.019 (Wilcoxon-test), Q value = 0.065
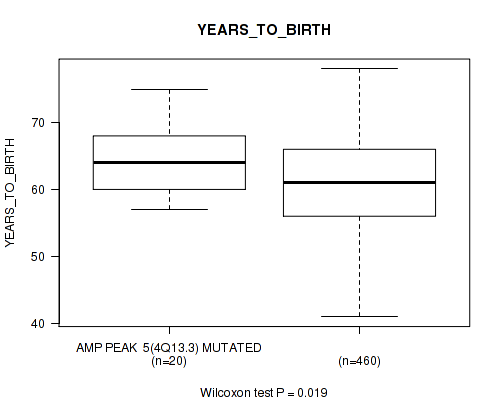
Table S27. Gene #5: 'amp_4q13.3' versus Clinical Feature #2: 'YEARS_TO_BIRTH'
| nPatients | Mean (Std.Dev) | |
|---|---|---|
| ALL | 480 | 61.0 (6.8) |
| AMP PEAK 5(4Q13.3) MUTATED | 20 | 64.6 (5.5) |
| AMP PEAK 5(4Q13.3) WILD-TYPE | 460 | 60.8 (6.8) |
Figure S27. Get High-res Image Gene #5: 'amp_4q13.3' versus Clinical Feature #2: 'YEARS_TO_BIRTH'
P value = 0.00184 (Fisher's exact test), Q value = 0.011
Table S28. Gene #5: 'amp_4q13.3' versus Clinical Feature #3: 'PATHOLOGY_T_STAGE'
| nPatients | T2 | T3 | T4 |
|---|---|---|---|
| ALL | 188 | 287 | 10 |
| AMP PEAK 5(4Q13.3) MUTATED | 2 | 18 | 2 |
| AMP PEAK 5(4Q13.3) WILD-TYPE | 186 | 269 | 8 |
Figure S28. Get High-res Image Gene #5: 'amp_4q13.3' versus Clinical Feature #3: 'PATHOLOGY_T_STAGE'

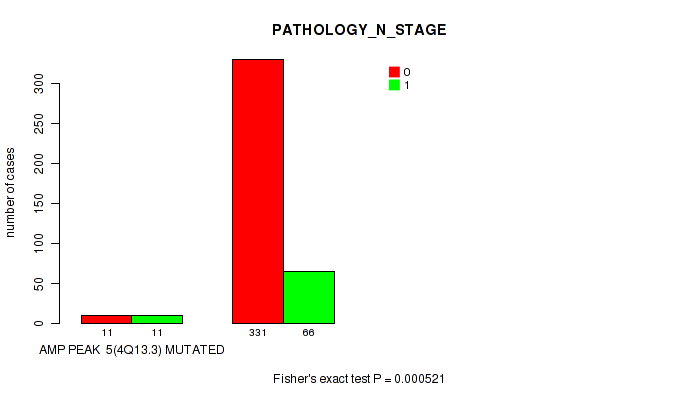
P value = 0.000521 (Fisher's exact test), Q value = 0.004
Table S29. Gene #5: 'amp_4q13.3' versus Clinical Feature #4: 'PATHOLOGY_N_STAGE'
| nPatients | 0 | 1 |
|---|---|---|
| ALL | 342 | 77 |
| AMP PEAK 5(4Q13.3) MUTATED | 11 | 11 |
| AMP PEAK 5(4Q13.3) WILD-TYPE | 331 | 66 |
Figure S29. Get High-res Image Gene #5: 'amp_4q13.3' versus Clinical Feature #4: 'PATHOLOGY_N_STAGE'
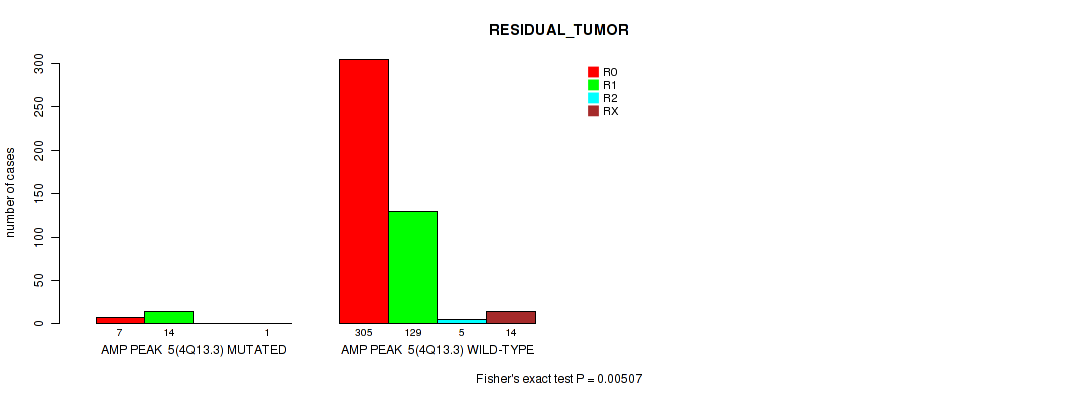
P value = 0.00507 (Fisher's exact test), Q value = 0.023
Table S30. Gene #5: 'amp_4q13.3' versus Clinical Feature #7: 'RESIDUAL_TUMOR'
| nPatients | R0 | R1 | R2 | RX |
|---|---|---|---|---|
| ALL | 312 | 143 | 5 | 15 |
| AMP PEAK 5(4Q13.3) MUTATED | 7 | 14 | 0 | 1 |
| AMP PEAK 5(4Q13.3) WILD-TYPE | 305 | 129 | 5 | 14 |
Figure S30. Get High-res Image Gene #5: 'amp_4q13.3' versus Clinical Feature #7: 'RESIDUAL_TUMOR'
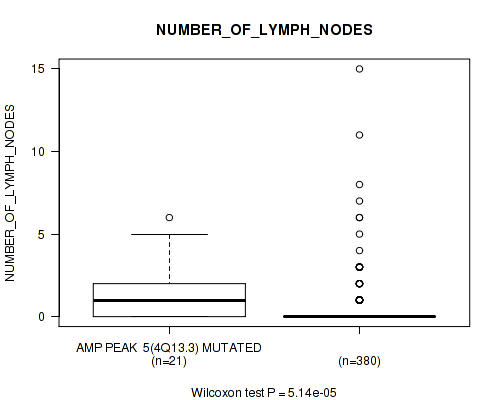
P value = 5.14e-05 (Wilcoxon-test), Q value = 0.00068
Table S31. Gene #5: 'amp_4q13.3' versus Clinical Feature #8: 'NUMBER_OF_LYMPH_NODES'
| nPatients | Mean (Std.Dev) | |
|---|---|---|
| ALL | 401 | 0.4 (1.4) |
| AMP PEAK 5(4Q13.3) MUTATED | 21 | 1.2 (1.7) |
| AMP PEAK 5(4Q13.3) WILD-TYPE | 380 | 0.4 (1.3) |
Figure S31. Get High-res Image Gene #5: 'amp_4q13.3' versus Clinical Feature #8: 'NUMBER_OF_LYMPH_NODES'
P value = 0.000256 (Wilcoxon-test), Q value = 0.0024
Table S32. Gene #5: 'amp_4q13.3' versus Clinical Feature #9: 'GLEASON_SCORE'
| nPatients | Mean (Std.Dev) | |
|---|---|---|
| ALL | 491 | 7.6 (1.0) |
| AMP PEAK 5(4Q13.3) MUTATED | 22 | 8.4 (1.0) |
| AMP PEAK 5(4Q13.3) WILD-TYPE | 469 | 7.6 (1.0) |
Figure S32. Get High-res Image Gene #5: 'amp_4q13.3' versus Clinical Feature #9: 'GLEASON_SCORE'

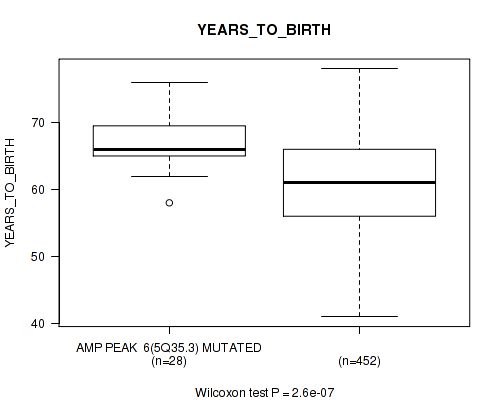
P value = 2.6e-07 (Wilcoxon-test), Q value = 1e-05
Table S33. Gene #6: 'amp_5q35.3' versus Clinical Feature #2: 'YEARS_TO_BIRTH'
| nPatients | Mean (Std.Dev) | |
|---|---|---|
| ALL | 480 | 61.0 (6.8) |
| AMP PEAK 6(5Q35.3) MUTATED | 28 | 67.1 (4.0) |
| AMP PEAK 6(5Q35.3) WILD-TYPE | 452 | 60.6 (6.8) |
Figure S33. Get High-res Image Gene #6: 'amp_5q35.3' versus Clinical Feature #2: 'YEARS_TO_BIRTH'
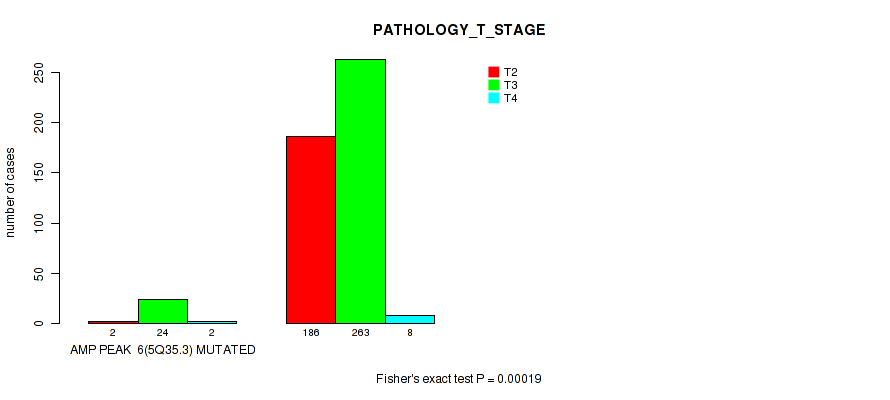
P value = 0.00019 (Fisher's exact test), Q value = 0.002
Table S34. Gene #6: 'amp_5q35.3' versus Clinical Feature #3: 'PATHOLOGY_T_STAGE'
| nPatients | T2 | T3 | T4 |
|---|---|---|---|
| ALL | 188 | 287 | 10 |
| AMP PEAK 6(5Q35.3) MUTATED | 2 | 24 | 2 |
| AMP PEAK 6(5Q35.3) WILD-TYPE | 186 | 263 | 8 |
Figure S34. Get High-res Image Gene #6: 'amp_5q35.3' versus Clinical Feature #3: 'PATHOLOGY_T_STAGE'
P value = 0.000717 (Fisher's exact test), Q value = 0.0051
Table S35. Gene #6: 'amp_5q35.3' versus Clinical Feature #4: 'PATHOLOGY_N_STAGE'
| nPatients | 0 | 1 |
|---|---|---|
| ALL | 342 | 77 |
| AMP PEAK 6(5Q35.3) MUTATED | 14 | 12 |
| AMP PEAK 6(5Q35.3) WILD-TYPE | 328 | 65 |
Figure S35. Get High-res Image Gene #6: 'amp_5q35.3' versus Clinical Feature #4: 'PATHOLOGY_N_STAGE'

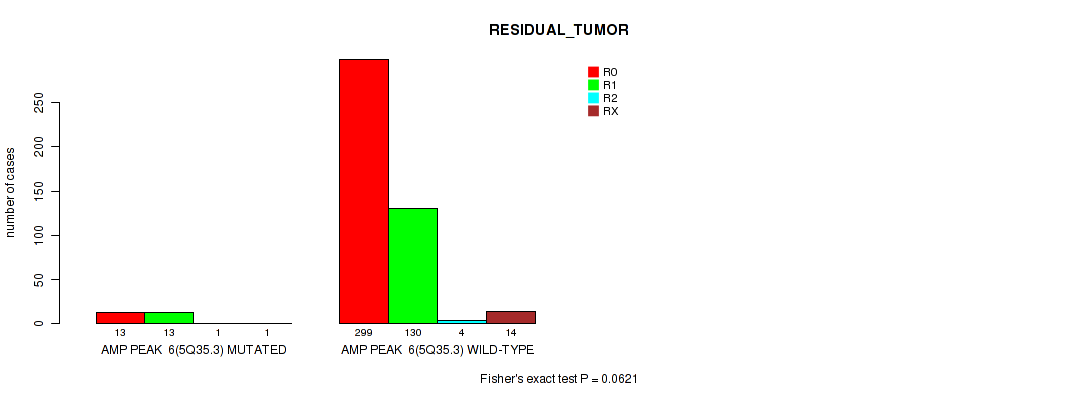
P value = 0.0621 (Fisher's exact test), Q value = 0.15
Table S36. Gene #6: 'amp_5q35.3' versus Clinical Feature #7: 'RESIDUAL_TUMOR'
| nPatients | R0 | R1 | R2 | RX |
|---|---|---|---|---|
| ALL | 312 | 143 | 5 | 15 |
| AMP PEAK 6(5Q35.3) MUTATED | 13 | 13 | 1 | 1 |
| AMP PEAK 6(5Q35.3) WILD-TYPE | 299 | 130 | 4 | 14 |
Figure S36. Get High-res Image Gene #6: 'amp_5q35.3' versus Clinical Feature #7: 'RESIDUAL_TUMOR'
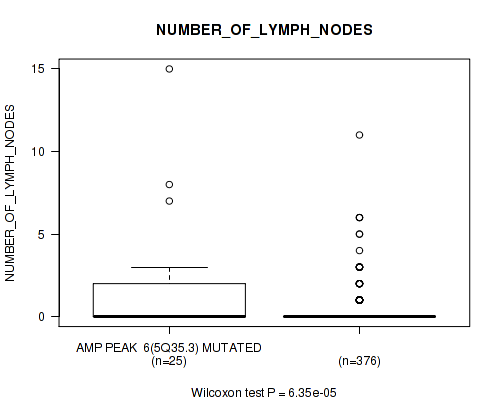
P value = 6.35e-05 (Wilcoxon-test), Q value = 0.00081
Table S37. Gene #6: 'amp_5q35.3' versus Clinical Feature #8: 'NUMBER_OF_LYMPH_NODES'
| nPatients | Mean (Std.Dev) | |
|---|---|---|
| ALL | 401 | 0.4 (1.4) |
| AMP PEAK 6(5Q35.3) MUTATED | 25 | 1.8 (3.5) |
| AMP PEAK 6(5Q35.3) WILD-TYPE | 376 | 0.3 (1.0) |
Figure S37. Get High-res Image Gene #6: 'amp_5q35.3' versus Clinical Feature #8: 'NUMBER_OF_LYMPH_NODES'
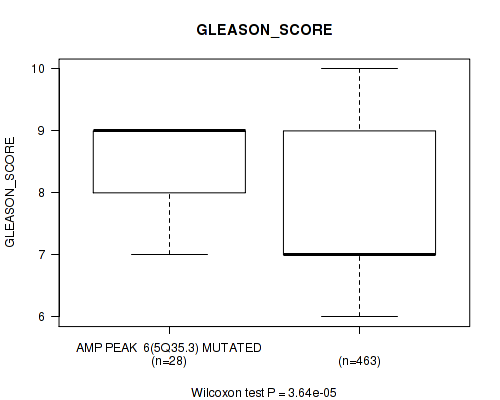
P value = 3.64e-05 (Wilcoxon-test), Q value = 5e-04
Table S38. Gene #6: 'amp_5q35.3' versus Clinical Feature #9: 'GLEASON_SCORE'
| nPatients | Mean (Std.Dev) | |
|---|---|---|
| ALL | 491 | 7.6 (1.0) |
| AMP PEAK 6(5Q35.3) MUTATED | 28 | 8.4 (0.8) |
| AMP PEAK 6(5Q35.3) WILD-TYPE | 463 | 7.6 (1.0) |
Figure S38. Get High-res Image Gene #6: 'amp_5q35.3' versus Clinical Feature #9: 'GLEASON_SCORE'
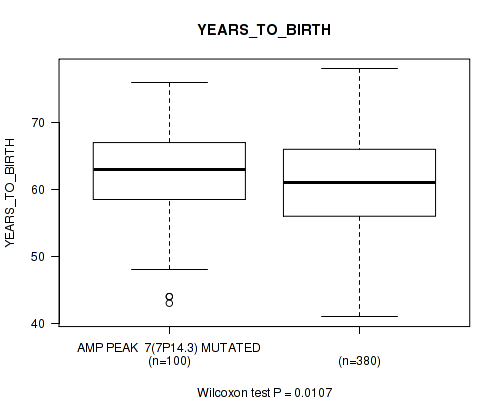
P value = 0.0107 (Wilcoxon-test), Q value = 0.042
Table S39. Gene #7: 'amp_7p14.3' versus Clinical Feature #2: 'YEARS_TO_BIRTH'
| nPatients | Mean (Std.Dev) | |
|---|---|---|
| ALL | 480 | 61.0 (6.8) |
| AMP PEAK 7(7P14.3) MUTATED | 100 | 62.4 (6.7) |
| AMP PEAK 7(7P14.3) WILD-TYPE | 380 | 60.6 (6.8) |
Figure S39. Get High-res Image Gene #7: 'amp_7p14.3' versus Clinical Feature #2: 'YEARS_TO_BIRTH'
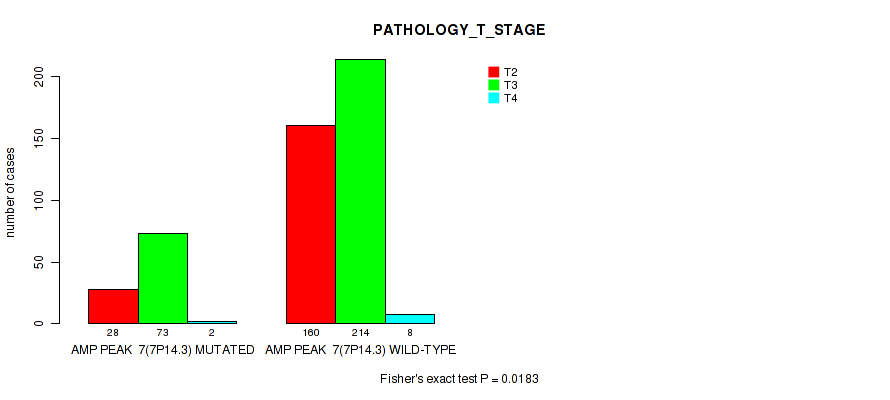
P value = 0.0183 (Fisher's exact test), Q value = 0.064
Table S40. Gene #7: 'amp_7p14.3' versus Clinical Feature #3: 'PATHOLOGY_T_STAGE'
| nPatients | T2 | T3 | T4 |
|---|---|---|---|
| ALL | 188 | 287 | 10 |
| AMP PEAK 7(7P14.3) MUTATED | 28 | 73 | 2 |
| AMP PEAK 7(7P14.3) WILD-TYPE | 160 | 214 | 8 |
Figure S40. Get High-res Image Gene #7: 'amp_7p14.3' versus Clinical Feature #3: 'PATHOLOGY_T_STAGE'
P value = 0.00172 (Fisher's exact test), Q value = 0.01
Table S41. Gene #7: 'amp_7p14.3' versus Clinical Feature #7: 'RESIDUAL_TUMOR'
| nPatients | R0 | R1 | R2 | RX |
|---|---|---|---|---|
| ALL | 312 | 143 | 5 | 15 |
| AMP PEAK 7(7P14.3) MUTATED | 50 | 45 | 1 | 4 |
| AMP PEAK 7(7P14.3) WILD-TYPE | 262 | 98 | 4 | 11 |
Figure S41. Get High-res Image Gene #7: 'amp_7p14.3' versus Clinical Feature #7: 'RESIDUAL_TUMOR'

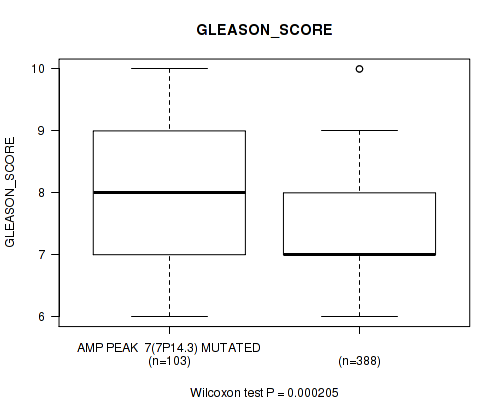
P value = 0.000205 (Wilcoxon-test), Q value = 0.002
Table S42. Gene #7: 'amp_7p14.3' versus Clinical Feature #9: 'GLEASON_SCORE'
| nPatients | Mean (Std.Dev) | |
|---|---|---|
| ALL | 491 | 7.6 (1.0) |
| AMP PEAK 7(7P14.3) MUTATED | 103 | 8.0 (1.1) |
| AMP PEAK 7(7P14.3) WILD-TYPE | 388 | 7.5 (1.0) |
Figure S42. Get High-res Image Gene #7: 'amp_7p14.3' versus Clinical Feature #9: 'GLEASON_SCORE'
P value = 0.00818 (Wilcoxon-test), Q value = 0.034
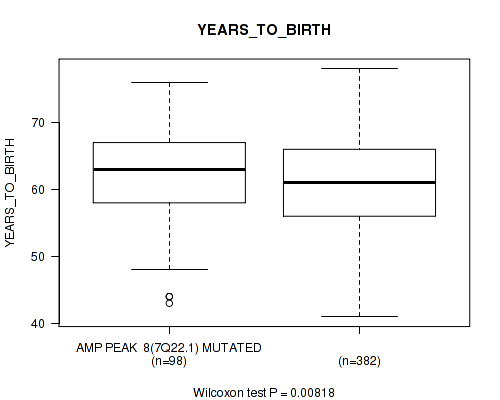
Table S43. Gene #8: 'amp_7q22.1' versus Clinical Feature #2: 'YEARS_TO_BIRTH'
| nPatients | Mean (Std.Dev) | |
|---|---|---|
| ALL | 480 | 61.0 (6.8) |
| AMP PEAK 8(7Q22.1) MUTATED | 98 | 62.4 (6.8) |
| AMP PEAK 8(7Q22.1) WILD-TYPE | 382 | 60.6 (6.8) |
Figure S43. Get High-res Image Gene #8: 'amp_7q22.1' versus Clinical Feature #2: 'YEARS_TO_BIRTH'
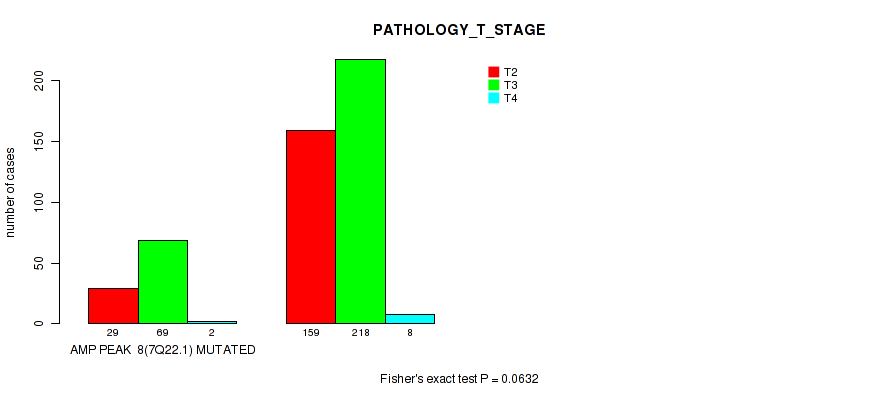
P value = 0.0632 (Fisher's exact test), Q value = 0.15
Table S44. Gene #8: 'amp_7q22.1' versus Clinical Feature #3: 'PATHOLOGY_T_STAGE'
| nPatients | T2 | T3 | T4 |
|---|---|---|---|
| ALL | 188 | 287 | 10 |
| AMP PEAK 8(7Q22.1) MUTATED | 29 | 69 | 2 |
| AMP PEAK 8(7Q22.1) WILD-TYPE | 159 | 218 | 8 |
Figure S44. Get High-res Image Gene #8: 'amp_7q22.1' versus Clinical Feature #3: 'PATHOLOGY_T_STAGE'
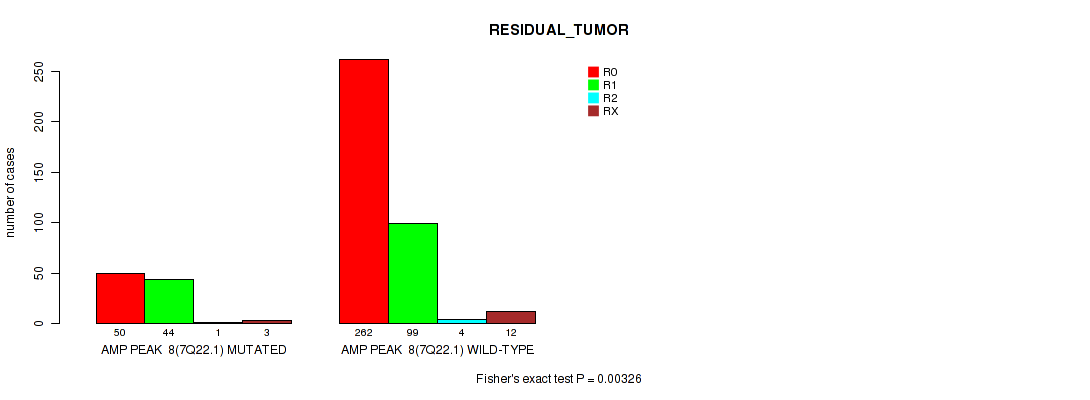
P value = 0.00326 (Fisher's exact test), Q value = 0.016
Table S45. Gene #8: 'amp_7q22.1' versus Clinical Feature #7: 'RESIDUAL_TUMOR'
| nPatients | R0 | R1 | R2 | RX |
|---|---|---|---|---|
| ALL | 312 | 143 | 5 | 15 |
| AMP PEAK 8(7Q22.1) MUTATED | 50 | 44 | 1 | 3 |
| AMP PEAK 8(7Q22.1) WILD-TYPE | 262 | 99 | 4 | 12 |
Figure S45. Get High-res Image Gene #8: 'amp_7q22.1' versus Clinical Feature #7: 'RESIDUAL_TUMOR'
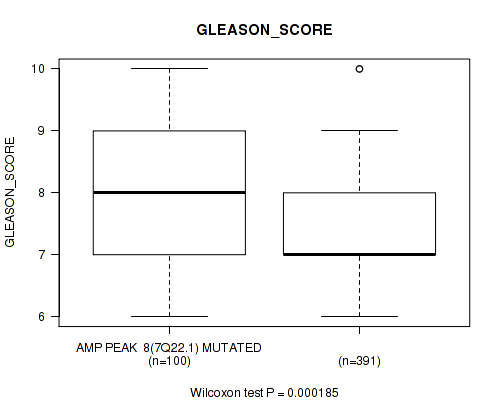
P value = 0.000185 (Wilcoxon-test), Q value = 0.002
Table S46. Gene #8: 'amp_7q22.1' versus Clinical Feature #9: 'GLEASON_SCORE'
| nPatients | Mean (Std.Dev) | |
|---|---|---|
| ALL | 491 | 7.6 (1.0) |
| AMP PEAK 8(7Q22.1) MUTATED | 100 | 8.0 (1.1) |
| AMP PEAK 8(7Q22.1) WILD-TYPE | 391 | 7.5 (1.0) |
Figure S46. Get High-res Image Gene #8: 'amp_7q22.1' versus Clinical Feature #9: 'GLEASON_SCORE'
P value = 0.000488 (Wilcoxon-test), Q value = 0.0038
Table S47. Gene #9: 'amp_8p11.23' versus Clinical Feature #2: 'YEARS_TO_BIRTH'
| nPatients | Mean (Std.Dev) | |
|---|---|---|
| ALL | 480 | 61.0 (6.8) |
| AMP PEAK 9(8P11.23) MUTATED | 64 | 63.7 (6.5) |
| AMP PEAK 9(8P11.23) WILD-TYPE | 416 | 60.6 (6.8) |
Figure S47. Get High-res Image Gene #9: 'amp_8p11.23' versus Clinical Feature #2: 'YEARS_TO_BIRTH'
P value = 0.00364 (Fisher's exact test), Q value = 0.018
Table S48. Gene #9: 'amp_8p11.23' versus Clinical Feature #3: 'PATHOLOGY_T_STAGE'
| nPatients | T2 | T3 | T4 |
|---|---|---|---|
| ALL | 188 | 287 | 10 |
| AMP PEAK 9(8P11.23) MUTATED | 15 | 49 | 3 |
| AMP PEAK 9(8P11.23) WILD-TYPE | 173 | 238 | 7 |
Figure S48. Get High-res Image Gene #9: 'amp_8p11.23' versus Clinical Feature #3: 'PATHOLOGY_T_STAGE'

P value = 0.0119 (Fisher's exact test), Q value = 0.046
Table S49. Gene #9: 'amp_8p11.23' versus Clinical Feature #7: 'RESIDUAL_TUMOR'
| nPatients | R0 | R1 | R2 | RX |
|---|---|---|---|---|
| ALL | 312 | 143 | 5 | 15 |
| AMP PEAK 9(8P11.23) MUTATED | 31 | 29 | 1 | 3 |
| AMP PEAK 9(8P11.23) WILD-TYPE | 281 | 114 | 4 | 12 |
Figure S49. Get High-res Image Gene #9: 'amp_8p11.23' versus Clinical Feature #7: 'RESIDUAL_TUMOR'

P value = 1.67e-06 (Wilcoxon-test), Q value = 5e-05
Table S50. Gene #9: 'amp_8p11.23' versus Clinical Feature #9: 'GLEASON_SCORE'
| nPatients | Mean (Std.Dev) | |
|---|---|---|
| ALL | 491 | 7.6 (1.0) |
| AMP PEAK 9(8P11.23) MUTATED | 67 | 8.2 (1.0) |
| AMP PEAK 9(8P11.23) WILD-TYPE | 424 | 7.5 (1.0) |
Figure S50. Get High-res Image Gene #9: 'amp_8p11.23' versus Clinical Feature #9: 'GLEASON_SCORE'

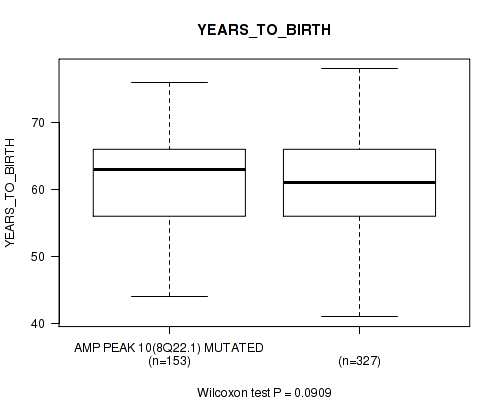
P value = 0.0909 (Wilcoxon-test), Q value = 0.2
Table S51. Gene #10: 'amp_8q22.1' versus Clinical Feature #2: 'YEARS_TO_BIRTH'
| nPatients | Mean (Std.Dev) | |
|---|---|---|
| ALL | 480 | 61.0 (6.8) |
| AMP PEAK 10(8Q22.1) MUTATED | 153 | 61.7 (6.3) |
| AMP PEAK 10(8Q22.1) WILD-TYPE | 327 | 60.6 (7.0) |
Figure S51. Get High-res Image Gene #10: 'amp_8q22.1' versus Clinical Feature #2: 'YEARS_TO_BIRTH'
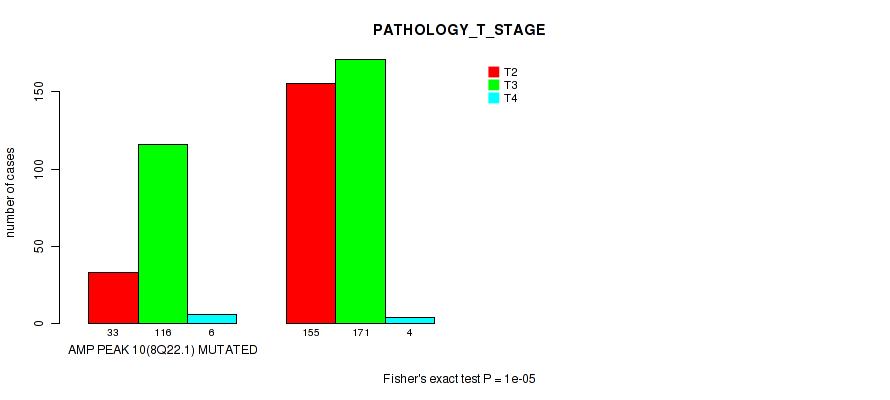
P value = 1e-05 (Fisher's exact test), Q value = 0.00016
Table S52. Gene #10: 'amp_8q22.1' versus Clinical Feature #3: 'PATHOLOGY_T_STAGE'
| nPatients | T2 | T3 | T4 |
|---|---|---|---|
| ALL | 188 | 287 | 10 |
| AMP PEAK 10(8Q22.1) MUTATED | 33 | 116 | 6 |
| AMP PEAK 10(8Q22.1) WILD-TYPE | 155 | 171 | 4 |
Figure S52. Get High-res Image Gene #10: 'amp_8q22.1' versus Clinical Feature #3: 'PATHOLOGY_T_STAGE'
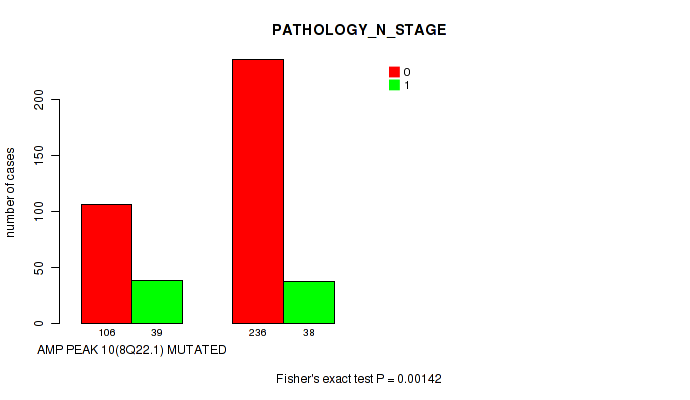
P value = 0.00142 (Fisher's exact test), Q value = 0.0087
Table S53. Gene #10: 'amp_8q22.1' versus Clinical Feature #4: 'PATHOLOGY_N_STAGE'
| nPatients | 0 | 1 |
|---|---|---|
| ALL | 342 | 77 |
| AMP PEAK 10(8Q22.1) MUTATED | 106 | 39 |
| AMP PEAK 10(8Q22.1) WILD-TYPE | 236 | 38 |
Figure S53. Get High-res Image Gene #10: 'amp_8q22.1' versus Clinical Feature #4: 'PATHOLOGY_N_STAGE'
P value = 0.00877 (Fisher's exact test), Q value = 0.036
Table S54. Gene #10: 'amp_8q22.1' versus Clinical Feature #5: 'RADIATION_THERAPY'
| nPatients | NO | YES |
|---|---|---|
| ALL | 378 | 57 |
| AMP PEAK 10(8Q22.1) MUTATED | 110 | 27 |
| AMP PEAK 10(8Q22.1) WILD-TYPE | 268 | 30 |
Figure S54. Get High-res Image Gene #10: 'amp_8q22.1' versus Clinical Feature #5: 'RADIATION_THERAPY'
P value = 2e-05 (Fisher's exact test), Q value = 0.00029
Table S55. Gene #10: 'amp_8q22.1' versus Clinical Feature #7: 'RESIDUAL_TUMOR'
| nPatients | R0 | R1 | R2 | RX |
|---|---|---|---|---|
| ALL | 312 | 143 | 5 | 15 |
| AMP PEAK 10(8Q22.1) MUTATED | 77 | 66 | 1 | 7 |
| AMP PEAK 10(8Q22.1) WILD-TYPE | 235 | 77 | 4 | 8 |
Figure S55. Get High-res Image Gene #10: 'amp_8q22.1' versus Clinical Feature #7: 'RESIDUAL_TUMOR'
P value = 0.000483 (Wilcoxon-test), Q value = 0.0038
Table S56. Gene #10: 'amp_8q22.1' versus Clinical Feature #8: 'NUMBER_OF_LYMPH_NODES'
| nPatients | Mean (Std.Dev) | |
|---|---|---|
| ALL | 401 | 0.4 (1.4) |
| AMP PEAK 10(8Q22.1) MUTATED | 138 | 0.7 (1.6) |
| AMP PEAK 10(8Q22.1) WILD-TYPE | 263 | 0.3 (1.2) |
Figure S56. Get High-res Image Gene #10: 'amp_8q22.1' versus Clinical Feature #8: 'NUMBER_OF_LYMPH_NODES'

P value = 2.43e-13 (Wilcoxon-test), Q value = 1.7e-10
Table S57. Gene #10: 'amp_8q22.1' versus Clinical Feature #9: 'GLEASON_SCORE'
| nPatients | Mean (Std.Dev) | |
|---|---|---|
| ALL | 491 | 7.6 (1.0) |
| AMP PEAK 10(8Q22.1) MUTATED | 156 | 8.1 (1.0) |
| AMP PEAK 10(8Q22.1) WILD-TYPE | 335 | 7.4 (0.9) |
Figure S57. Get High-res Image Gene #10: 'amp_8q22.1' versus Clinical Feature #9: 'GLEASON_SCORE'

P value = 0.0606 (Wilcoxon-test), Q value = 0.15
Table S58. Gene #10: 'amp_8q22.1' versus Clinical Feature #10: 'PSA_VALUE'
| nPatients | Mean (Std.Dev) | |
|---|---|---|
| ALL | 434 | 1.8 (16.0) |
| AMP PEAK 10(8Q22.1) MUTATED | 136 | 3.8 (28.0) |
| AMP PEAK 10(8Q22.1) WILD-TYPE | 298 | 0.9 (3.8) |
Figure S58. Get High-res Image Gene #10: 'amp_8q22.1' versus Clinical Feature #10: 'PSA_VALUE'
P value = 0.057 (Wilcoxon-test), Q value = 0.14
Table S59. Gene #11: 'amp_8q24.21' versus Clinical Feature #2: 'YEARS_TO_BIRTH'
| nPatients | Mean (Std.Dev) | |
|---|---|---|
| ALL | 480 | 61.0 (6.8) |
| AMP PEAK 11(8Q24.21) MUTATED | 147 | 61.9 (6.3) |
| AMP PEAK 11(8Q24.21) WILD-TYPE | 333 | 60.6 (7.0) |
Figure S59. Get High-res Image Gene #11: 'amp_8q24.21' versus Clinical Feature #2: 'YEARS_TO_BIRTH'
P value = 1e-05 (Fisher's exact test), Q value = 0.00016
Table S60. Gene #11: 'amp_8q24.21' versus Clinical Feature #3: 'PATHOLOGY_T_STAGE'
| nPatients | T2 | T3 | T4 |
|---|---|---|---|
| ALL | 188 | 287 | 10 |
| AMP PEAK 11(8Q24.21) MUTATED | 33 | 111 | 6 |
| AMP PEAK 11(8Q24.21) WILD-TYPE | 155 | 176 | 4 |
Figure S60. Get High-res Image Gene #11: 'amp_8q24.21' versus Clinical Feature #3: 'PATHOLOGY_T_STAGE'
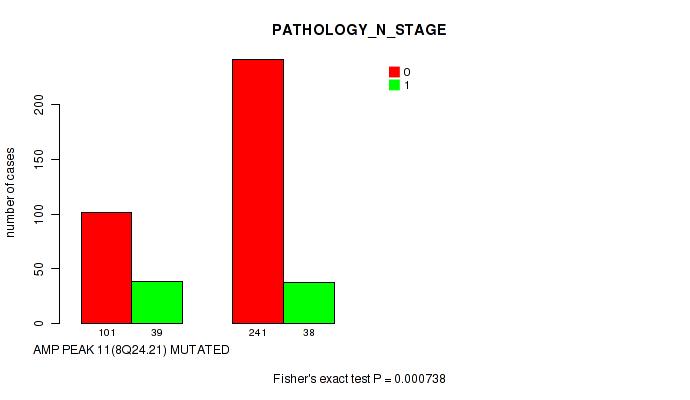
P value = 0.000738 (Fisher's exact test), Q value = 0.0052
Table S61. Gene #11: 'amp_8q24.21' versus Clinical Feature #4: 'PATHOLOGY_N_STAGE'
| nPatients | 0 | 1 |
|---|---|---|
| ALL | 342 | 77 |
| AMP PEAK 11(8Q24.21) MUTATED | 101 | 39 |
| AMP PEAK 11(8Q24.21) WILD-TYPE | 241 | 38 |
Figure S61. Get High-res Image Gene #11: 'amp_8q24.21' versus Clinical Feature #4: 'PATHOLOGY_N_STAGE'
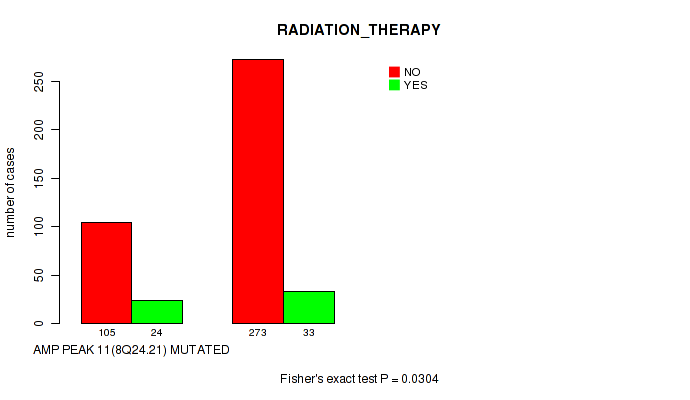
P value = 0.0304 (Fisher's exact test), Q value = 0.089
Table S62. Gene #11: 'amp_8q24.21' versus Clinical Feature #5: 'RADIATION_THERAPY'
| nPatients | NO | YES |
|---|---|---|
| ALL | 378 | 57 |
| AMP PEAK 11(8Q24.21) MUTATED | 105 | 24 |
| AMP PEAK 11(8Q24.21) WILD-TYPE | 273 | 33 |
Figure S62. Get High-res Image Gene #11: 'amp_8q24.21' versus Clinical Feature #5: 'RADIATION_THERAPY'
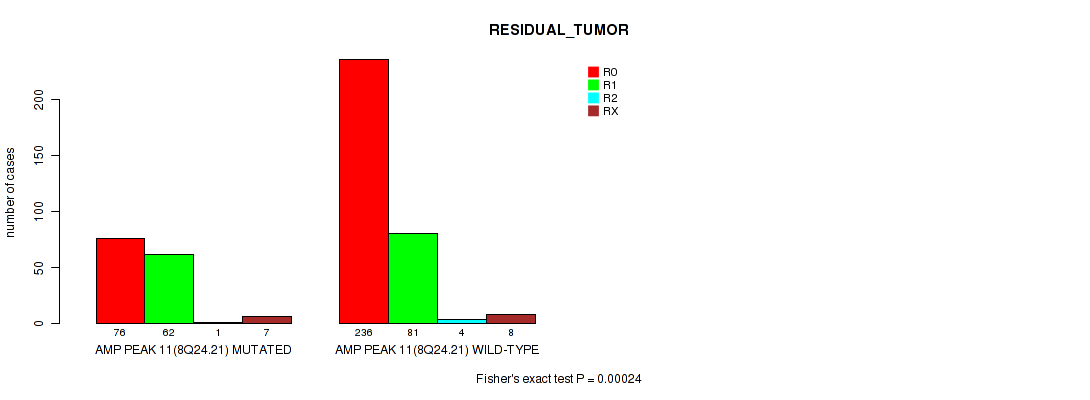
P value = 0.00024 (Fisher's exact test), Q value = 0.0023
Table S63. Gene #11: 'amp_8q24.21' versus Clinical Feature #7: 'RESIDUAL_TUMOR'
| nPatients | R0 | R1 | R2 | RX |
|---|---|---|---|---|
| ALL | 312 | 143 | 5 | 15 |
| AMP PEAK 11(8Q24.21) MUTATED | 76 | 62 | 1 | 7 |
| AMP PEAK 11(8Q24.21) WILD-TYPE | 236 | 81 | 4 | 8 |
Figure S63. Get High-res Image Gene #11: 'amp_8q24.21' versus Clinical Feature #7: 'RESIDUAL_TUMOR'
P value = 0.000147 (Wilcoxon-test), Q value = 0.0016
Table S64. Gene #11: 'amp_8q24.21' versus Clinical Feature #8: 'NUMBER_OF_LYMPH_NODES'
| nPatients | Mean (Std.Dev) | |
|---|---|---|
| ALL | 401 | 0.4 (1.4) |
| AMP PEAK 11(8Q24.21) MUTATED | 133 | 0.7 (1.4) |
| AMP PEAK 11(8Q24.21) WILD-TYPE | 268 | 0.3 (1.3) |
Figure S64. Get High-res Image Gene #11: 'amp_8q24.21' versus Clinical Feature #8: 'NUMBER_OF_LYMPH_NODES'

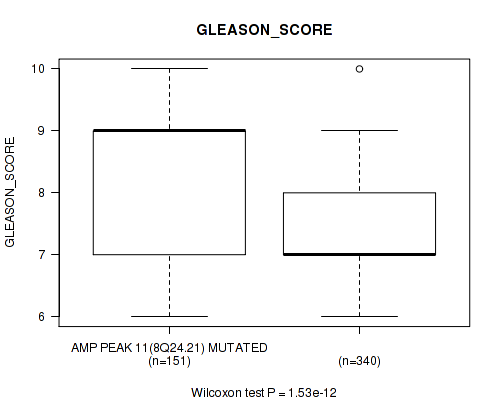
P value = 1.53e-12 (Wilcoxon-test), Q value = 3.6e-10
Table S65. Gene #11: 'amp_8q24.21' versus Clinical Feature #9: 'GLEASON_SCORE'
| nPatients | Mean (Std.Dev) | |
|---|---|---|
| ALL | 491 | 7.6 (1.0) |
| AMP PEAK 11(8Q24.21) MUTATED | 151 | 8.1 (1.0) |
| AMP PEAK 11(8Q24.21) WILD-TYPE | 340 | 7.4 (0.9) |
Figure S65. Get High-res Image Gene #11: 'amp_8q24.21' versus Clinical Feature #9: 'GLEASON_SCORE'
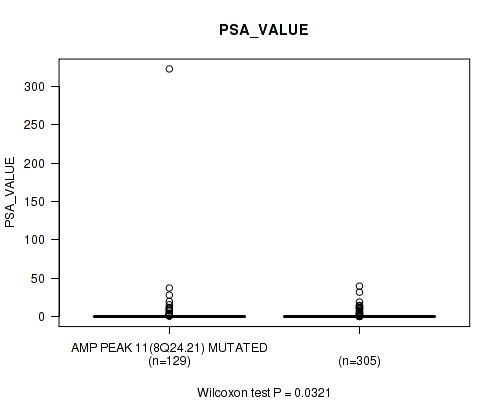
P value = 0.0321 (Wilcoxon-test), Q value = 0.094
Table S66. Gene #11: 'amp_8q24.21' versus Clinical Feature #10: 'PSA_VALUE'
| nPatients | Mean (Std.Dev) | |
|---|---|---|
| ALL | 434 | 1.8 (16.0) |
| AMP PEAK 11(8Q24.21) MUTATED | 129 | 4.0 (28.7) |
| AMP PEAK 11(8Q24.21) WILD-TYPE | 305 | 0.9 (3.7) |
Figure S66. Get High-res Image Gene #11: 'amp_8q24.21' versus Clinical Feature #10: 'PSA_VALUE'
P value = 0.0274 (Wilcoxon-test), Q value = 0.084
Table S67. Gene #12: 'amp_9q33.3' versus Clinical Feature #2: 'YEARS_TO_BIRTH'
| nPatients | Mean (Std.Dev) | |
|---|---|---|
| ALL | 480 | 61.0 (6.8) |
| AMP PEAK 12(9Q33.3) MUTATED | 59 | 62.9 (6.4) |
| AMP PEAK 12(9Q33.3) WILD-TYPE | 421 | 60.7 (6.8) |
Figure S67. Get High-res Image Gene #12: 'amp_9q33.3' versus Clinical Feature #2: 'YEARS_TO_BIRTH'

P value = 1e-05 (Fisher's exact test), Q value = 0.00016
Table S68. Gene #12: 'amp_9q33.3' versus Clinical Feature #3: 'PATHOLOGY_T_STAGE'
| nPatients | T2 | T3 | T4 |
|---|---|---|---|
| ALL | 188 | 287 | 10 |
| AMP PEAK 12(9Q33.3) MUTATED | 5 | 52 | 3 |
| AMP PEAK 12(9Q33.3) WILD-TYPE | 183 | 235 | 7 |
Figure S68. Get High-res Image Gene #12: 'amp_9q33.3' versus Clinical Feature #3: 'PATHOLOGY_T_STAGE'
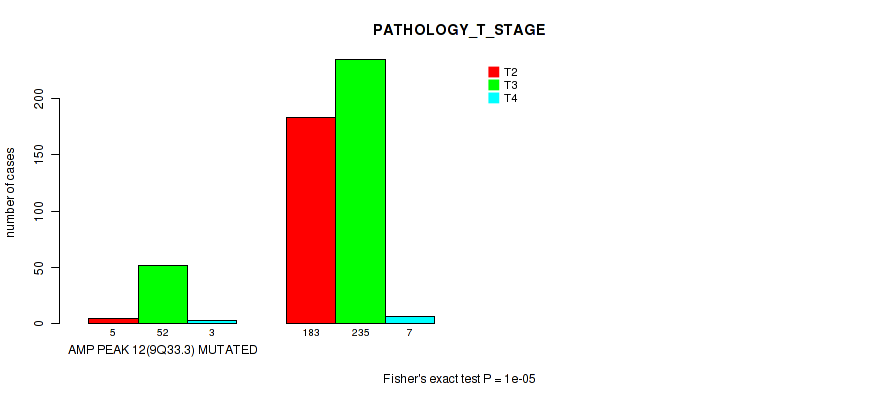
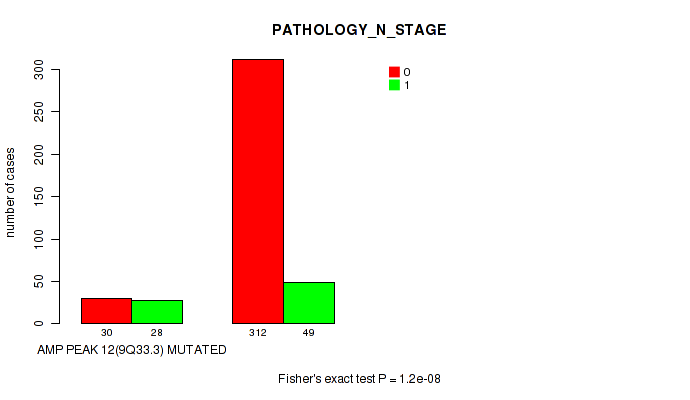
P value = 1.2e-08 (Fisher's exact test), Q value = 6.6e-07
Table S69. Gene #12: 'amp_9q33.3' versus Clinical Feature #4: 'PATHOLOGY_N_STAGE'
| nPatients | 0 | 1 |
|---|---|---|
| ALL | 342 | 77 |
| AMP PEAK 12(9Q33.3) MUTATED | 30 | 28 |
| AMP PEAK 12(9Q33.3) WILD-TYPE | 312 | 49 |
Figure S69. Get High-res Image Gene #12: 'amp_9q33.3' versus Clinical Feature #4: 'PATHOLOGY_N_STAGE'
P value = 0.0828 (Fisher's exact test), Q value = 0.19
Table S70. Gene #12: 'amp_9q33.3' versus Clinical Feature #6: 'HISTOLOGICAL_TYPE'
| nPatients | PROSTATE ADENOCARCINOMA OTHER SUBTYPE | PROSTATE ADENOCARCINOMA ACINAR TYPE |
|---|---|---|
| ALL | 14 | 477 |
| AMP PEAK 12(9Q33.3) MUTATED | 4 | 57 |
| AMP PEAK 12(9Q33.3) WILD-TYPE | 10 | 420 |
Figure S70. Get High-res Image Gene #12: 'amp_9q33.3' versus Clinical Feature #6: 'HISTOLOGICAL_TYPE'
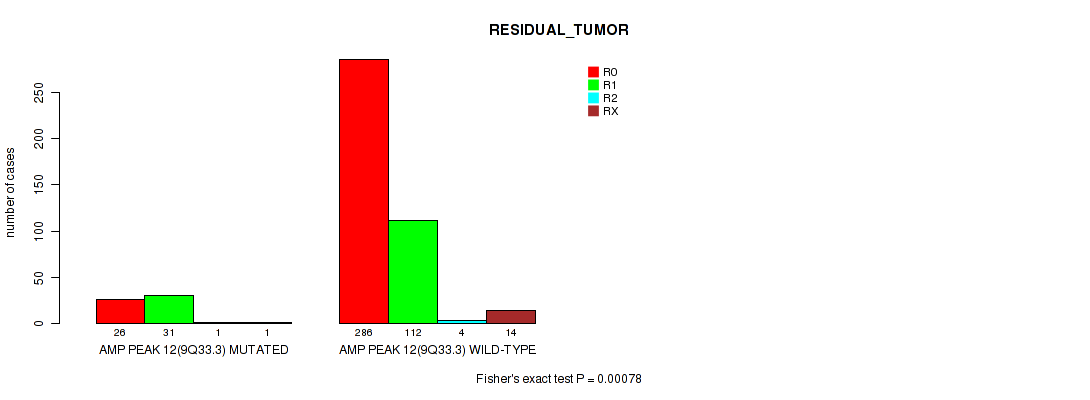
P value = 0.00078 (Fisher's exact test), Q value = 0.0053
Table S71. Gene #12: 'amp_9q33.3' versus Clinical Feature #7: 'RESIDUAL_TUMOR'
| nPatients | R0 | R1 | R2 | RX |
|---|---|---|---|---|
| ALL | 312 | 143 | 5 | 15 |
| AMP PEAK 12(9Q33.3) MUTATED | 26 | 31 | 1 | 1 |
| AMP PEAK 12(9Q33.3) WILD-TYPE | 286 | 112 | 4 | 14 |
Figure S71. Get High-res Image Gene #12: 'amp_9q33.3' versus Clinical Feature #7: 'RESIDUAL_TUMOR'
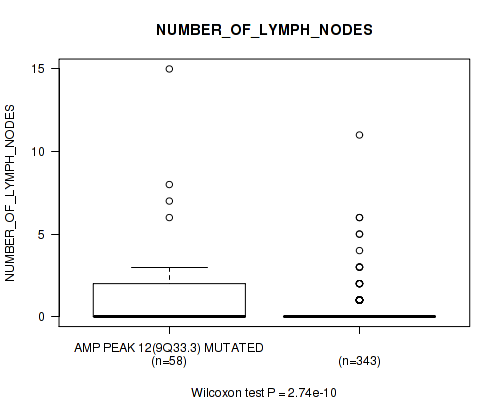
P value = 2.74e-10 (Wilcoxon-test), Q value = 3.3e-08
Table S72. Gene #12: 'amp_9q33.3' versus Clinical Feature #8: 'NUMBER_OF_LYMPH_NODES'
| nPatients | Mean (Std.Dev) | |
|---|---|---|
| ALL | 401 | 0.4 (1.4) |
| AMP PEAK 12(9Q33.3) MUTATED | 58 | 1.3 (2.5) |
| AMP PEAK 12(9Q33.3) WILD-TYPE | 343 | 0.3 (1.0) |
Figure S72. Get High-res Image Gene #12: 'amp_9q33.3' versus Clinical Feature #8: 'NUMBER_OF_LYMPH_NODES'
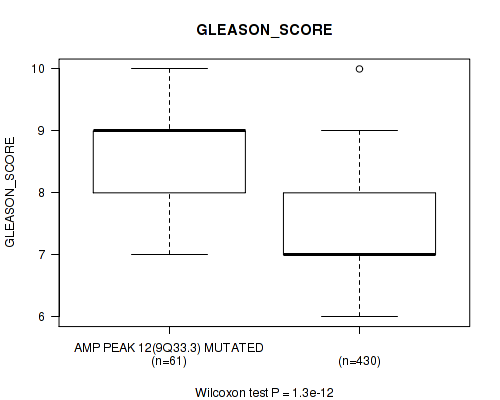
P value = 1.3e-12 (Wilcoxon-test), Q value = 3.6e-10
Table S73. Gene #12: 'amp_9q33.3' versus Clinical Feature #9: 'GLEASON_SCORE'
| nPatients | Mean (Std.Dev) | |
|---|---|---|
| ALL | 491 | 7.6 (1.0) |
| AMP PEAK 12(9Q33.3) MUTATED | 61 | 8.5 (0.8) |
| AMP PEAK 12(9Q33.3) WILD-TYPE | 430 | 7.5 (1.0) |
Figure S73. Get High-res Image Gene #12: 'amp_9q33.3' versus Clinical Feature #9: 'GLEASON_SCORE'
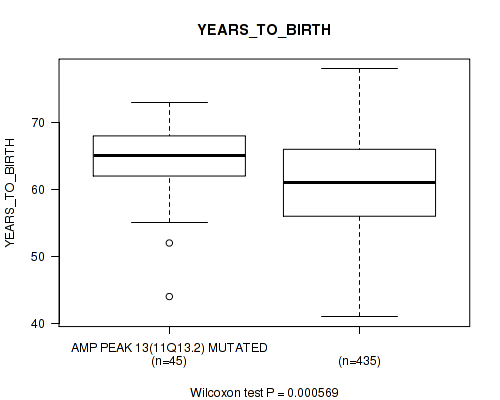
P value = 0.000569 (Wilcoxon-test), Q value = 0.0042
Table S74. Gene #13: 'amp_11q13.2' versus Clinical Feature #2: 'YEARS_TO_BIRTH'
| nPatients | Mean (Std.Dev) | |
|---|---|---|
| ALL | 480 | 61.0 (6.8) |
| AMP PEAK 13(11Q13.2) MUTATED | 45 | 64.1 (5.9) |
| AMP PEAK 13(11Q13.2) WILD-TYPE | 435 | 60.7 (6.8) |
Figure S74. Get High-res Image Gene #13: 'amp_11q13.2' versus Clinical Feature #2: 'YEARS_TO_BIRTH'
P value = 1e-05 (Fisher's exact test), Q value = 0.00016
Table S75. Gene #13: 'amp_11q13.2' versus Clinical Feature #3: 'PATHOLOGY_T_STAGE'
| nPatients | T2 | T3 | T4 |
|---|---|---|---|
| ALL | 188 | 287 | 10 |
| AMP PEAK 13(11Q13.2) MUTATED | 5 | 39 | 3 |
| AMP PEAK 13(11Q13.2) WILD-TYPE | 183 | 248 | 7 |
Figure S75. Get High-res Image Gene #13: 'amp_11q13.2' versus Clinical Feature #3: 'PATHOLOGY_T_STAGE'

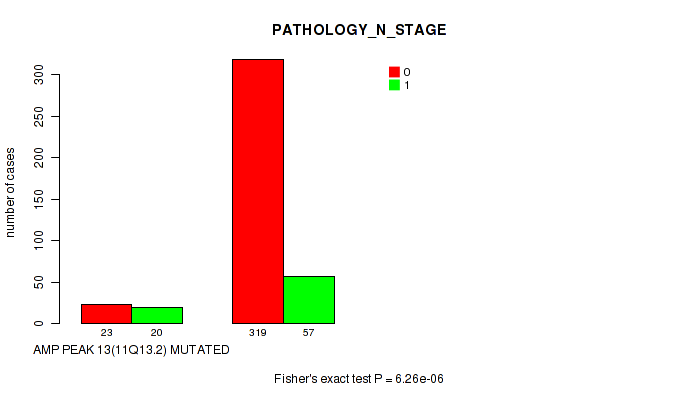
P value = 6.26e-06 (Fisher's exact test), Q value = 0.00016
Table S76. Gene #13: 'amp_11q13.2' versus Clinical Feature #4: 'PATHOLOGY_N_STAGE'
| nPatients | 0 | 1 |
|---|---|---|
| ALL | 342 | 77 |
| AMP PEAK 13(11Q13.2) MUTATED | 23 | 20 |
| AMP PEAK 13(11Q13.2) WILD-TYPE | 319 | 57 |
Figure S76. Get High-res Image Gene #13: 'amp_11q13.2' versus Clinical Feature #4: 'PATHOLOGY_N_STAGE'
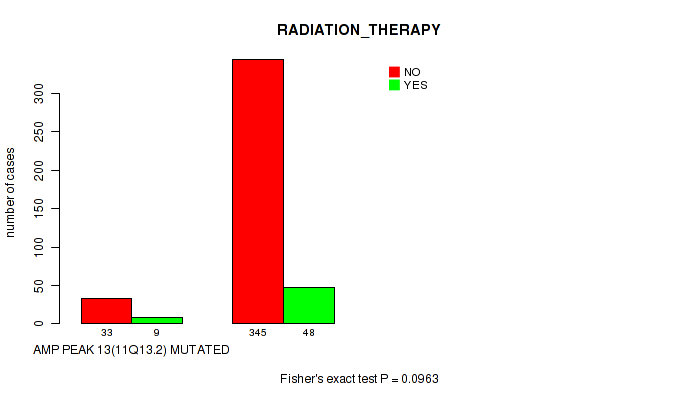
P value = 0.0963 (Fisher's exact test), Q value = 0.21
Table S77. Gene #13: 'amp_11q13.2' versus Clinical Feature #5: 'RADIATION_THERAPY'
| nPatients | NO | YES |
|---|---|---|
| ALL | 378 | 57 |
| AMP PEAK 13(11Q13.2) MUTATED | 33 | 9 |
| AMP PEAK 13(11Q13.2) WILD-TYPE | 345 | 48 |
Figure S77. Get High-res Image Gene #13: 'amp_11q13.2' versus Clinical Feature #5: 'RADIATION_THERAPY'
P value = 0.00303 (Fisher's exact test), Q value = 0.015
Table S78. Gene #13: 'amp_11q13.2' versus Clinical Feature #7: 'RESIDUAL_TUMOR'
| nPatients | R0 | R1 | R2 | RX |
|---|---|---|---|---|
| ALL | 312 | 143 | 5 | 15 |
| AMP PEAK 13(11Q13.2) MUTATED | 20 | 25 | 0 | 2 |
| AMP PEAK 13(11Q13.2) WILD-TYPE | 292 | 118 | 5 | 13 |
Figure S78. Get High-res Image Gene #13: 'amp_11q13.2' versus Clinical Feature #7: 'RESIDUAL_TUMOR'

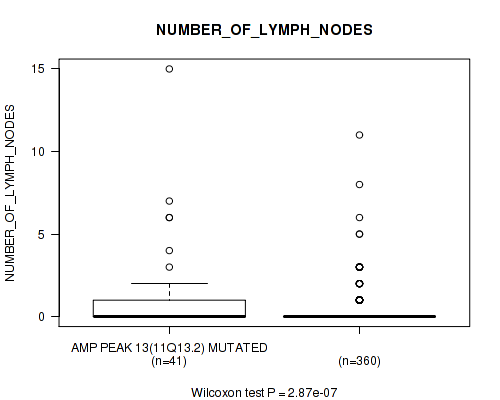
P value = 2.87e-07 (Wilcoxon-test), Q value = 1.1e-05
Table S79. Gene #13: 'amp_11q13.2' versus Clinical Feature #8: 'NUMBER_OF_LYMPH_NODES'
| nPatients | Mean (Std.Dev) | |
|---|---|---|
| ALL | 401 | 0.4 (1.4) |
| AMP PEAK 13(11Q13.2) MUTATED | 41 | 1.4 (2.8) |
| AMP PEAK 13(11Q13.2) WILD-TYPE | 360 | 0.3 (1.0) |
Figure S79. Get High-res Image Gene #13: 'amp_11q13.2' versus Clinical Feature #8: 'NUMBER_OF_LYMPH_NODES'
P value = 2.28e-08 (Wilcoxon-test), Q value = 1.1e-06
Table S80. Gene #13: 'amp_11q13.2' versus Clinical Feature #9: 'GLEASON_SCORE'
| nPatients | Mean (Std.Dev) | |
|---|---|---|
| ALL | 491 | 7.6 (1.0) |
| AMP PEAK 13(11Q13.2) MUTATED | 47 | 8.4 (0.9) |
| AMP PEAK 13(11Q13.2) WILD-TYPE | 444 | 7.5 (1.0) |
Figure S80. Get High-res Image Gene #13: 'amp_11q13.2' versus Clinical Feature #9: 'GLEASON_SCORE'
P value = 0.116 (Wilcoxon-test), Q value = 0.24
Table S81. Gene #14: 'amp_12q23.1' versus Clinical Feature #2: 'YEARS_TO_BIRTH'
| nPatients | Mean (Std.Dev) | |
|---|---|---|
| ALL | 480 | 61.0 (6.8) |
| AMP PEAK 14(12Q23.1) MUTATED | 35 | 62.8 (6.5) |
| AMP PEAK 14(12Q23.1) WILD-TYPE | 445 | 60.8 (6.8) |
Figure S81. Get High-res Image Gene #14: 'amp_12q23.1' versus Clinical Feature #2: 'YEARS_TO_BIRTH'
P value = 7e-04 (Fisher's exact test), Q value = 0.005
Table S82. Gene #14: 'amp_12q23.1' versus Clinical Feature #3: 'PATHOLOGY_T_STAGE'
| nPatients | T2 | T3 | T4 |
|---|---|---|---|
| ALL | 188 | 287 | 10 |
| AMP PEAK 14(12Q23.1) MUTATED | 4 | 31 | 1 |
| AMP PEAK 14(12Q23.1) WILD-TYPE | 184 | 256 | 9 |
Figure S82. Get High-res Image Gene #14: 'amp_12q23.1' versus Clinical Feature #3: 'PATHOLOGY_T_STAGE'
P value = 0.000204 (Fisher's exact test), Q value = 0.002
Table S83. Gene #14: 'amp_12q23.1' versus Clinical Feature #4: 'PATHOLOGY_N_STAGE'
| nPatients | 0 | 1 |
|---|---|---|
| ALL | 342 | 77 |
| AMP PEAK 14(12Q23.1) MUTATED | 16 | 14 |
| AMP PEAK 14(12Q23.1) WILD-TYPE | 326 | 63 |
Figure S83. Get High-res Image Gene #14: 'amp_12q23.1' versus Clinical Feature #4: 'PATHOLOGY_N_STAGE'
P value = 0.012 (Fisher's exact test), Q value = 0.046
Table S84. Gene #14: 'amp_12q23.1' versus Clinical Feature #5: 'RADIATION_THERAPY'
| nPatients | NO | YES |
|---|---|---|
| ALL | 378 | 57 |
| AMP PEAK 14(12Q23.1) MUTATED | 22 | 9 |
| AMP PEAK 14(12Q23.1) WILD-TYPE | 356 | 48 |
Figure S84. Get High-res Image Gene #14: 'amp_12q23.1' versus Clinical Feature #5: 'RADIATION_THERAPY'

P value = 3e-04 (Fisher's exact test), Q value = 0.0027
Table S85. Gene #14: 'amp_12q23.1' versus Clinical Feature #7: 'RESIDUAL_TUMOR'
| nPatients | R0 | R1 | R2 | RX |
|---|---|---|---|---|
| ALL | 312 | 143 | 5 | 15 |
| AMP PEAK 14(12Q23.1) MUTATED | 13 | 22 | 1 | 0 |
| AMP PEAK 14(12Q23.1) WILD-TYPE | 299 | 121 | 4 | 15 |
Figure S85. Get High-res Image Gene #14: 'amp_12q23.1' versus Clinical Feature #7: 'RESIDUAL_TUMOR'
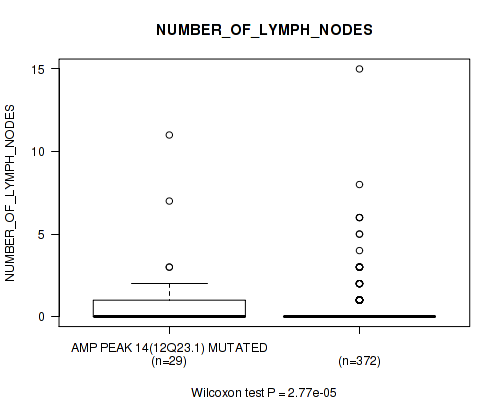
P value = 2.77e-05 (Wilcoxon-test), Q value = 0.00039
Table S86. Gene #14: 'amp_12q23.1' versus Clinical Feature #8: 'NUMBER_OF_LYMPH_NODES'
| nPatients | Mean (Std.Dev) | |
|---|---|---|
| ALL | 401 | 0.4 (1.4) |
| AMP PEAK 14(12Q23.1) MUTATED | 29 | 1.3 (2.4) |
| AMP PEAK 14(12Q23.1) WILD-TYPE | 372 | 0.4 (1.2) |
Figure S86. Get High-res Image Gene #14: 'amp_12q23.1' versus Clinical Feature #8: 'NUMBER_OF_LYMPH_NODES'
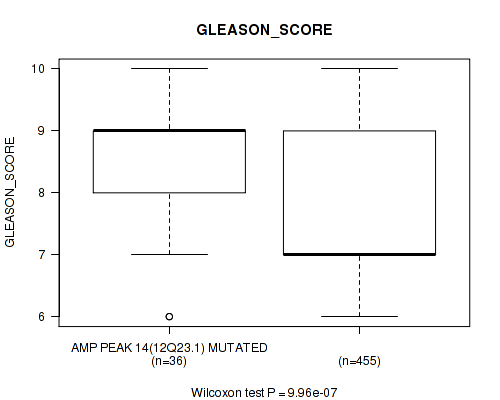
P value = 9.96e-07 (Wilcoxon-test), Q value = 3.2e-05
Table S87. Gene #14: 'amp_12q23.1' versus Clinical Feature #9: 'GLEASON_SCORE'
| nPatients | Mean (Std.Dev) | |
|---|---|---|
| ALL | 491 | 7.6 (1.0) |
| AMP PEAK 14(12Q23.1) MUTATED | 36 | 8.4 (1.0) |
| AMP PEAK 14(12Q23.1) WILD-TYPE | 455 | 7.5 (1.0) |
Figure S87. Get High-res Image Gene #14: 'amp_12q23.1' versus Clinical Feature #9: 'GLEASON_SCORE'
P value = 0.000412 (Wilcoxon-test), Q value = 0.0036
Table S88. Gene #15: 'amp_13q12.11' versus Clinical Feature #2: 'YEARS_TO_BIRTH'
| nPatients | Mean (Std.Dev) | |
|---|---|---|
| ALL | 480 | 61.0 (6.8) |
| AMP PEAK 15(13Q12.11) MUTATED | 24 | 65.5 (4.2) |
| AMP PEAK 15(13Q12.11) WILD-TYPE | 456 | 60.7 (6.8) |
Figure S88. Get High-res Image Gene #15: 'amp_13q12.11' versus Clinical Feature #2: 'YEARS_TO_BIRTH'

P value = 0.0045 (Fisher's exact test), Q value = 0.021
Table S89. Gene #15: 'amp_13q12.11' versus Clinical Feature #3: 'PATHOLOGY_T_STAGE'
| nPatients | T2 | T3 | T4 |
|---|---|---|---|
| ALL | 188 | 287 | 10 |
| AMP PEAK 15(13Q12.11) MUTATED | 5 | 17 | 3 |
| AMP PEAK 15(13Q12.11) WILD-TYPE | 183 | 270 | 7 |
Figure S89. Get High-res Image Gene #15: 'amp_13q12.11' versus Clinical Feature #3: 'PATHOLOGY_T_STAGE'

P value = 0.0293 (Fisher's exact test), Q value = 0.087
Table S90. Gene #15: 'amp_13q12.11' versus Clinical Feature #6: 'HISTOLOGICAL_TYPE'
| nPatients | PROSTATE ADENOCARCINOMA OTHER SUBTYPE | PROSTATE ADENOCARCINOMA ACINAR TYPE |
|---|---|---|
| ALL | 14 | 477 |
| AMP PEAK 15(13Q12.11) MUTATED | 3 | 22 |
| AMP PEAK 15(13Q12.11) WILD-TYPE | 11 | 455 |
Figure S90. Get High-res Image Gene #15: 'amp_13q12.11' versus Clinical Feature #6: 'HISTOLOGICAL_TYPE'

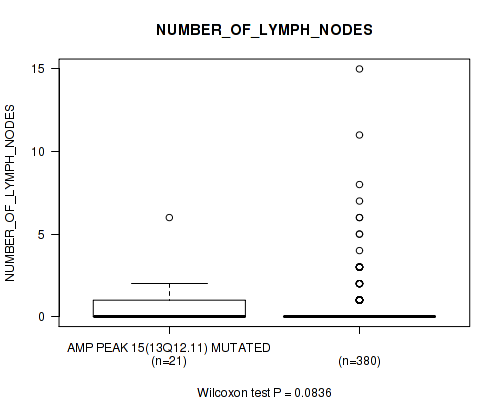
P value = 0.0836 (Wilcoxon-test), Q value = 0.19
Table S91. Gene #15: 'amp_13q12.11' versus Clinical Feature #8: 'NUMBER_OF_LYMPH_NODES'
| nPatients | Mean (Std.Dev) | |
|---|---|---|
| ALL | 401 | 0.4 (1.4) |
| AMP PEAK 15(13Q12.11) MUTATED | 21 | 0.7 (1.4) |
| AMP PEAK 15(13Q12.11) WILD-TYPE | 380 | 0.4 (1.4) |
Figure S91. Get High-res Image Gene #15: 'amp_13q12.11' versus Clinical Feature #8: 'NUMBER_OF_LYMPH_NODES'
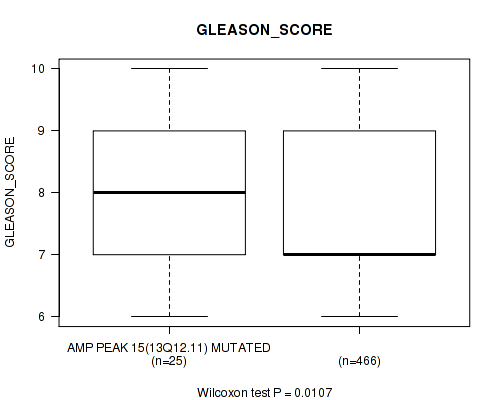
P value = 0.0107 (Wilcoxon-test), Q value = 0.042
Table S92. Gene #15: 'amp_13q12.11' versus Clinical Feature #9: 'GLEASON_SCORE'
| nPatients | Mean (Std.Dev) | |
|---|---|---|
| ALL | 491 | 7.6 (1.0) |
| AMP PEAK 15(13Q12.11) MUTATED | 25 | 8.1 (1.1) |
| AMP PEAK 15(13Q12.11) WILD-TYPE | 466 | 7.6 (1.0) |
Figure S92. Get High-res Image Gene #15: 'amp_13q12.11' versus Clinical Feature #9: 'GLEASON_SCORE'
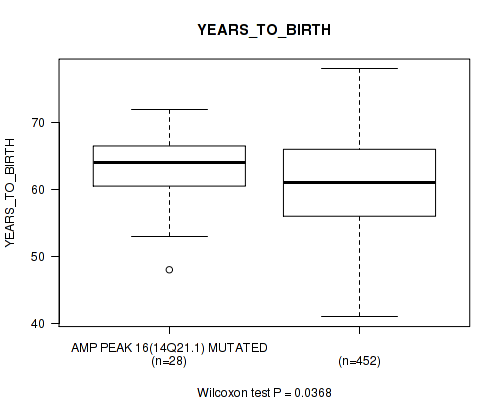
P value = 0.0368 (Wilcoxon-test), Q value = 0.1
Table S93. Gene #16: 'amp_14q21.1' versus Clinical Feature #2: 'YEARS_TO_BIRTH'
| nPatients | Mean (Std.Dev) | |
|---|---|---|
| ALL | 480 | 61.0 (6.8) |
| AMP PEAK 16(14Q21.1) MUTATED | 28 | 63.4 (5.6) |
| AMP PEAK 16(14Q21.1) WILD-TYPE | 452 | 60.8 (6.9) |
Figure S93. Get High-res Image Gene #16: 'amp_14q21.1' versus Clinical Feature #2: 'YEARS_TO_BIRTH'
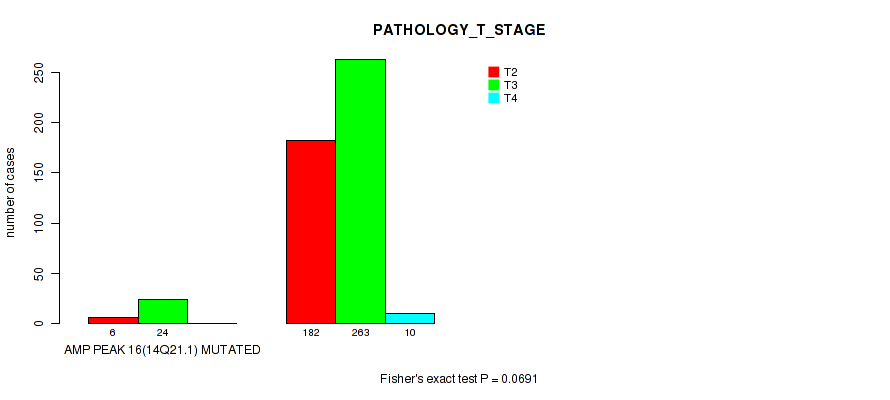
P value = 0.0691 (Fisher's exact test), Q value = 0.16
Table S94. Gene #16: 'amp_14q21.1' versus Clinical Feature #3: 'PATHOLOGY_T_STAGE'
| nPatients | T2 | T3 | T4 |
|---|---|---|---|
| ALL | 188 | 287 | 10 |
| AMP PEAK 16(14Q21.1) MUTATED | 6 | 24 | 0 |
| AMP PEAK 16(14Q21.1) WILD-TYPE | 182 | 263 | 10 |
Figure S94. Get High-res Image Gene #16: 'amp_14q21.1' versus Clinical Feature #3: 'PATHOLOGY_T_STAGE'
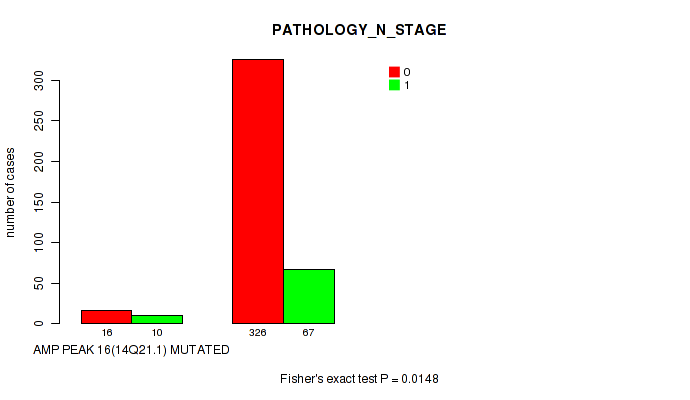
P value = 0.0148 (Fisher's exact test), Q value = 0.054
Table S95. Gene #16: 'amp_14q21.1' versus Clinical Feature #4: 'PATHOLOGY_N_STAGE'
| nPatients | 0 | 1 |
|---|---|---|
| ALL | 342 | 77 |
| AMP PEAK 16(14Q21.1) MUTATED | 16 | 10 |
| AMP PEAK 16(14Q21.1) WILD-TYPE | 326 | 67 |
Figure S95. Get High-res Image Gene #16: 'amp_14q21.1' versus Clinical Feature #4: 'PATHOLOGY_N_STAGE'
P value = 0.00319 (Fisher's exact test), Q value = 0.016
Table S96. Gene #16: 'amp_14q21.1' versus Clinical Feature #5: 'RADIATION_THERAPY'
| nPatients | NO | YES |
|---|---|---|
| ALL | 378 | 57 |
| AMP PEAK 16(14Q21.1) MUTATED | 17 | 9 |
| AMP PEAK 16(14Q21.1) WILD-TYPE | 361 | 48 |
Figure S96. Get High-res Image Gene #16: 'amp_14q21.1' versus Clinical Feature #5: 'RADIATION_THERAPY'
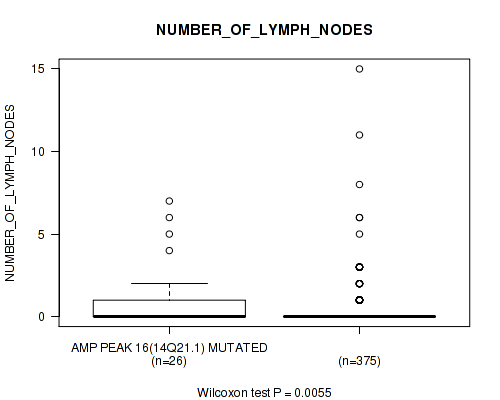
P value = 0.0055 (Wilcoxon-test), Q value = 0.024
Table S97. Gene #16: 'amp_14q21.1' versus Clinical Feature #8: 'NUMBER_OF_LYMPH_NODES'
| nPatients | Mean (Std.Dev) | |
|---|---|---|
| ALL | 401 | 0.4 (1.4) |
| AMP PEAK 16(14Q21.1) MUTATED | 26 | 1.2 (2.0) |
| AMP PEAK 16(14Q21.1) WILD-TYPE | 375 | 0.4 (1.3) |
Figure S97. Get High-res Image Gene #16: 'amp_14q21.1' versus Clinical Feature #8: 'NUMBER_OF_LYMPH_NODES'
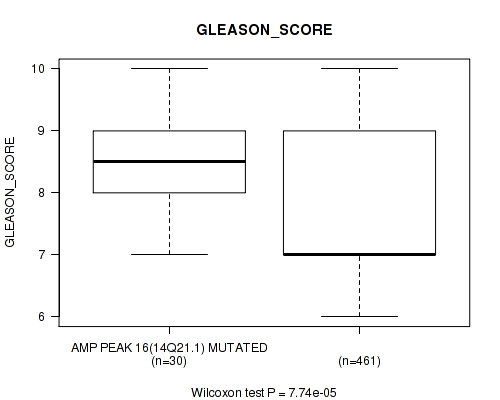
P value = 7.74e-05 (Wilcoxon-test), Q value = 0.00094
Table S98. Gene #16: 'amp_14q21.1' versus Clinical Feature #9: 'GLEASON_SCORE'
| nPatients | Mean (Std.Dev) | |
|---|---|---|
| ALL | 491 | 7.6 (1.0) |
| AMP PEAK 16(14Q21.1) MUTATED | 30 | 8.3 (0.9) |
| AMP PEAK 16(14Q21.1) WILD-TYPE | 461 | 7.6 (1.0) |
Figure S98. Get High-res Image Gene #16: 'amp_14q21.1' versus Clinical Feature #9: 'GLEASON_SCORE'
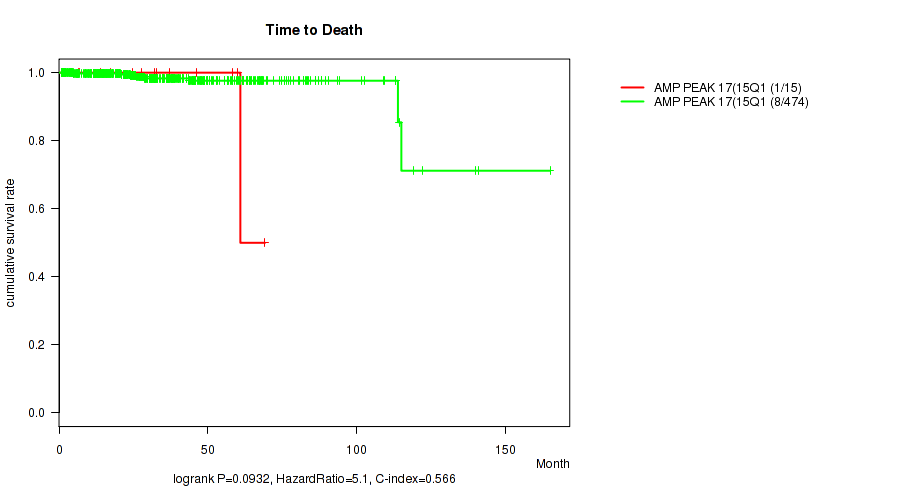
P value = 0.0932 (logrank test), Q value = 0.2
Table S99. Gene #17: 'amp_15q11.2' versus Clinical Feature #1: 'Time to Death'
| nPatients | nDeath | Duration Range (Median), Month | |
|---|---|---|---|
| ALL | 489 | 9 | 0.7 - 165.2 (28.8) |
| AMP PEAK 17(15Q11.2) MUTATED | 15 | 1 | 4.3 - 69.3 (32.0) |
| AMP PEAK 17(15Q11.2) WILD-TYPE | 474 | 8 | 0.7 - 165.2 (28.8) |
Figure S99. Get High-res Image Gene #17: 'amp_15q11.2' versus Clinical Feature #1: 'Time to Death'
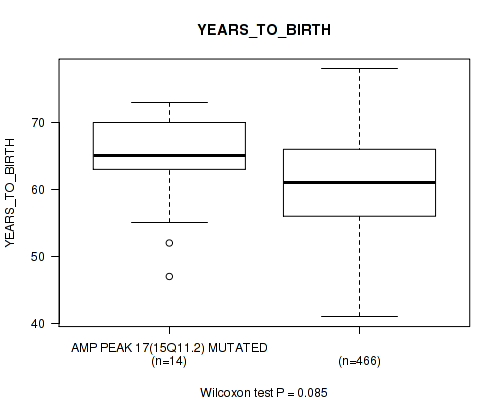
P value = 0.085 (Wilcoxon-test), Q value = 0.19
Table S100. Gene #17: 'amp_15q11.2' versus Clinical Feature #2: 'YEARS_TO_BIRTH'
| nPatients | Mean (Std.Dev) | |
|---|---|---|
| ALL | 480 | 61.0 (6.8) |
| AMP PEAK 17(15Q11.2) MUTATED | 14 | 63.8 (7.7) |
| AMP PEAK 17(15Q11.2) WILD-TYPE | 466 | 60.9 (6.8) |
Figure S100. Get High-res Image Gene #17: 'amp_15q11.2' versus Clinical Feature #2: 'YEARS_TO_BIRTH'
P value = 0.118 (Fisher's exact test), Q value = 0.24
Table S101. Gene #17: 'amp_15q11.2' versus Clinical Feature #3: 'PATHOLOGY_T_STAGE'
| nPatients | T2 | T3 | T4 |
|---|---|---|---|
| ALL | 188 | 287 | 10 |
| AMP PEAK 17(15Q11.2) MUTATED | 3 | 11 | 1 |
| AMP PEAK 17(15Q11.2) WILD-TYPE | 185 | 276 | 9 |
Figure S101. Get High-res Image Gene #17: 'amp_15q11.2' versus Clinical Feature #3: 'PATHOLOGY_T_STAGE'

P value = 0.000143 (Fisher's exact test), Q value = 0.0016
Table S102. Gene #17: 'amp_15q11.2' versus Clinical Feature #4: 'PATHOLOGY_N_STAGE'
| nPatients | 0 | 1 |
|---|---|---|
| ALL | 342 | 77 |
| AMP PEAK 17(15Q11.2) MUTATED | 5 | 9 |
| AMP PEAK 17(15Q11.2) WILD-TYPE | 337 | 68 |
Figure S102. Get High-res Image Gene #17: 'amp_15q11.2' versus Clinical Feature #4: 'PATHOLOGY_N_STAGE'

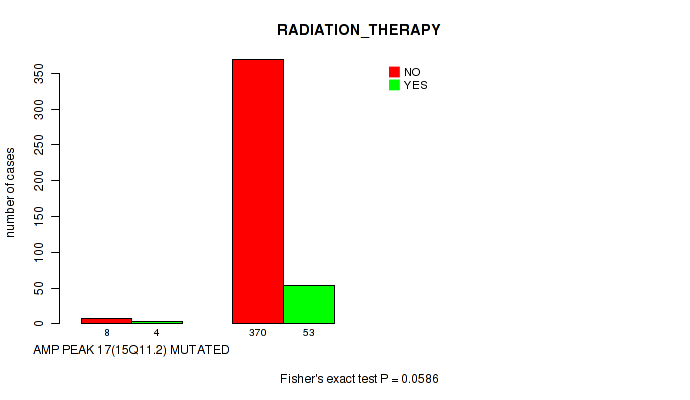
P value = 0.0586 (Fisher's exact test), Q value = 0.15
Table S103. Gene #17: 'amp_15q11.2' versus Clinical Feature #5: 'RADIATION_THERAPY'
| nPatients | NO | YES |
|---|---|---|
| ALL | 378 | 57 |
| AMP PEAK 17(15Q11.2) MUTATED | 8 | 4 |
| AMP PEAK 17(15Q11.2) WILD-TYPE | 370 | 53 |
Figure S103. Get High-res Image Gene #17: 'amp_15q11.2' versus Clinical Feature #5: 'RADIATION_THERAPY'
P value = 0.0344 (Fisher's exact test), Q value = 0.097
Table S104. Gene #17: 'amp_15q11.2' versus Clinical Feature #7: 'RESIDUAL_TUMOR'
| nPatients | R0 | R1 | R2 | RX |
|---|---|---|---|---|
| ALL | 312 | 143 | 5 | 15 |
| AMP PEAK 17(15Q11.2) MUTATED | 5 | 10 | 0 | 0 |
| AMP PEAK 17(15Q11.2) WILD-TYPE | 307 | 133 | 5 | 15 |
Figure S104. Get High-res Image Gene #17: 'amp_15q11.2' versus Clinical Feature #7: 'RESIDUAL_TUMOR'

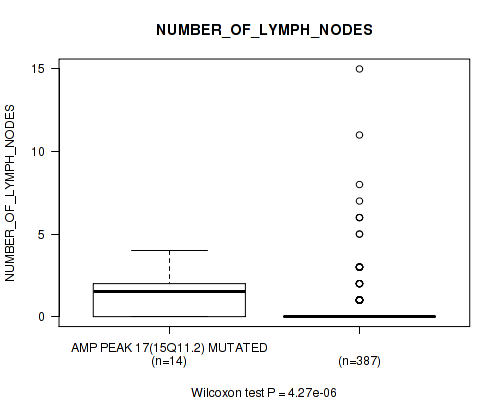
P value = 4.27e-06 (Wilcoxon-test), Q value = 0.00012
Table S105. Gene #17: 'amp_15q11.2' versus Clinical Feature #8: 'NUMBER_OF_LYMPH_NODES'
| nPatients | Mean (Std.Dev) | |
|---|---|---|
| ALL | 401 | 0.4 (1.4) |
| AMP PEAK 17(15Q11.2) MUTATED | 14 | 1.4 (1.3) |
| AMP PEAK 17(15Q11.2) WILD-TYPE | 387 | 0.4 (1.4) |
Figure S105. Get High-res Image Gene #17: 'amp_15q11.2' versus Clinical Feature #8: 'NUMBER_OF_LYMPH_NODES'
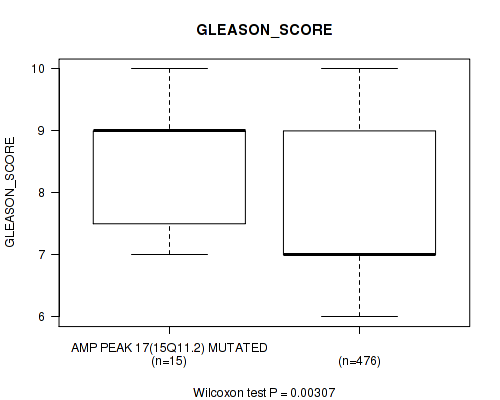
P value = 0.00307 (Wilcoxon-test), Q value = 0.016
Table S106. Gene #17: 'amp_15q11.2' versus Clinical Feature #9: 'GLEASON_SCORE'
| nPatients | Mean (Std.Dev) | |
|---|---|---|
| ALL | 491 | 7.6 (1.0) |
| AMP PEAK 17(15Q11.2) MUTATED | 15 | 8.4 (1.0) |
| AMP PEAK 17(15Q11.2) WILD-TYPE | 476 | 7.6 (1.0) |
Figure S106. Get High-res Image Gene #17: 'amp_15q11.2' versus Clinical Feature #9: 'GLEASON_SCORE'
P value = 0.0262 (Wilcoxon-test), Q value = 0.082
Table S107. Gene #18: 'amp_16q11.2' versus Clinical Feature #2: 'YEARS_TO_BIRTH'
| nPatients | Mean (Std.Dev) | |
|---|---|---|
| ALL | 480 | 61.0 (6.8) |
| AMP PEAK 18(16Q11.2) MUTATED | 28 | 63.6 (6.2) |
| AMP PEAK 18(16Q11.2) WILD-TYPE | 452 | 60.8 (6.8) |
Figure S107. Get High-res Image Gene #18: 'amp_16q11.2' versus Clinical Feature #2: 'YEARS_TO_BIRTH'

P value = 0.00029 (Fisher's exact test), Q value = 0.0027
Table S108. Gene #18: 'amp_16q11.2' versus Clinical Feature #3: 'PATHOLOGY_T_STAGE'
| nPatients | T2 | T3 | T4 |
|---|---|---|---|
| ALL | 188 | 287 | 10 |
| AMP PEAK 18(16Q11.2) MUTATED | 2 | 27 | 1 |
| AMP PEAK 18(16Q11.2) WILD-TYPE | 186 | 260 | 9 |
Figure S108. Get High-res Image Gene #18: 'amp_16q11.2' versus Clinical Feature #3: 'PATHOLOGY_T_STAGE'

P value = 0.0728 (Fisher's exact test), Q value = 0.17
Table S109. Gene #18: 'amp_16q11.2' versus Clinical Feature #4: 'PATHOLOGY_N_STAGE'
| nPatients | 0 | 1 |
|---|---|---|
| ALL | 342 | 77 |
| AMP PEAK 18(16Q11.2) MUTATED | 19 | 9 |
| AMP PEAK 18(16Q11.2) WILD-TYPE | 323 | 68 |
Figure S109. Get High-res Image Gene #18: 'amp_16q11.2' versus Clinical Feature #4: 'PATHOLOGY_N_STAGE'

P value = 0.0539 (Fisher's exact test), Q value = 0.14
Table S110. Gene #18: 'amp_16q11.2' versus Clinical Feature #5: 'RADIATION_THERAPY'
| nPatients | NO | YES |
|---|---|---|
| ALL | 378 | 57 |
| AMP PEAK 18(16Q11.2) MUTATED | 16 | 6 |
| AMP PEAK 18(16Q11.2) WILD-TYPE | 362 | 51 |
Figure S110. Get High-res Image Gene #18: 'amp_16q11.2' versus Clinical Feature #5: 'RADIATION_THERAPY'

P value = 0.038 (Fisher's exact test), Q value = 0.11
Table S111. Gene #18: 'amp_16q11.2' versus Clinical Feature #7: 'RESIDUAL_TUMOR'
| nPatients | R0 | R1 | R2 | RX |
|---|---|---|---|---|
| ALL | 312 | 143 | 5 | 15 |
| AMP PEAK 18(16Q11.2) MUTATED | 13 | 16 | 0 | 1 |
| AMP PEAK 18(16Q11.2) WILD-TYPE | 299 | 127 | 5 | 14 |
Figure S111. Get High-res Image Gene #18: 'amp_16q11.2' versus Clinical Feature #7: 'RESIDUAL_TUMOR'
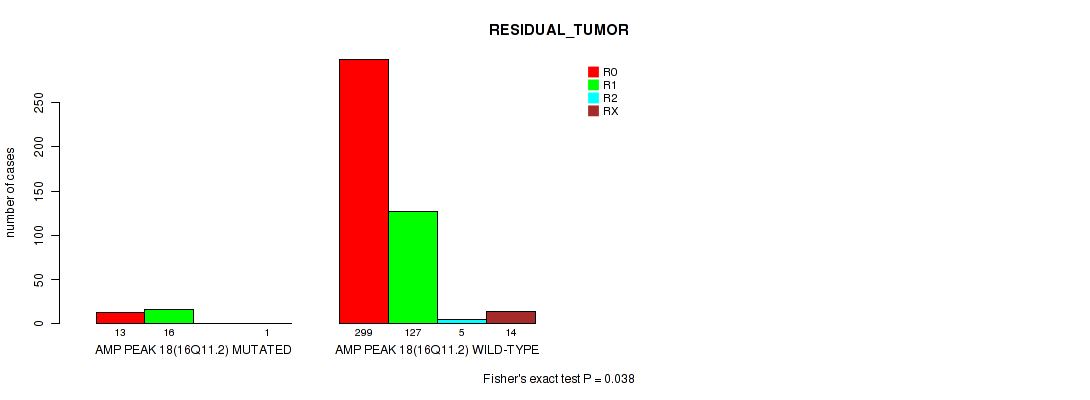
P value = 0.0589 (Wilcoxon-test), Q value = 0.15
Table S112. Gene #18: 'amp_16q11.2' versus Clinical Feature #8: 'NUMBER_OF_LYMPH_NODES'
| nPatients | Mean (Std.Dev) | |
|---|---|---|
| ALL | 401 | 0.4 (1.4) |
| AMP PEAK 18(16Q11.2) MUTATED | 27 | 0.7 (1.6) |
| AMP PEAK 18(16Q11.2) WILD-TYPE | 374 | 0.4 (1.3) |
Figure S112. Get High-res Image Gene #18: 'amp_16q11.2' versus Clinical Feature #8: 'NUMBER_OF_LYMPH_NODES'
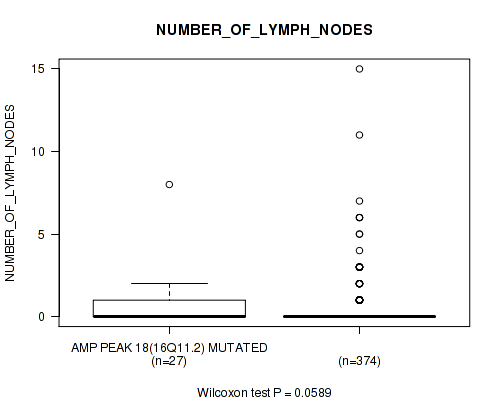
P value = 1.57e-06 (Wilcoxon-test), Q value = 4.9e-05
Table S113. Gene #18: 'amp_16q11.2' versus Clinical Feature #9: 'GLEASON_SCORE'
| nPatients | Mean (Std.Dev) | |
|---|---|---|
| ALL | 491 | 7.6 (1.0) |
| AMP PEAK 18(16Q11.2) MUTATED | 30 | 8.5 (0.9) |
| AMP PEAK 18(16Q11.2) WILD-TYPE | 461 | 7.5 (1.0) |
Figure S113. Get High-res Image Gene #18: 'amp_16q11.2' versus Clinical Feature #9: 'GLEASON_SCORE'
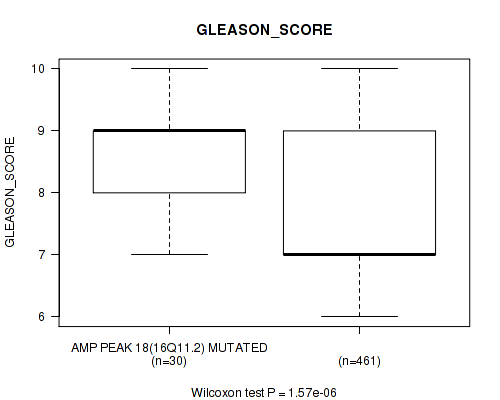
P value = 0.0205 (Wilcoxon-test), Q value = 0.069
Table S114. Gene #18: 'amp_16q11.2' versus Clinical Feature #10: 'PSA_VALUE'
| nPatients | Mean (Std.Dev) | |
|---|---|---|
| ALL | 434 | 1.8 (16.0) |
| AMP PEAK 18(16Q11.2) MUTATED | 24 | 1.3 (2.6) |
| AMP PEAK 18(16Q11.2) WILD-TYPE | 410 | 1.8 (16.4) |
Figure S114. Get High-res Image Gene #18: 'amp_16q11.2' versus Clinical Feature #10: 'PSA_VALUE'
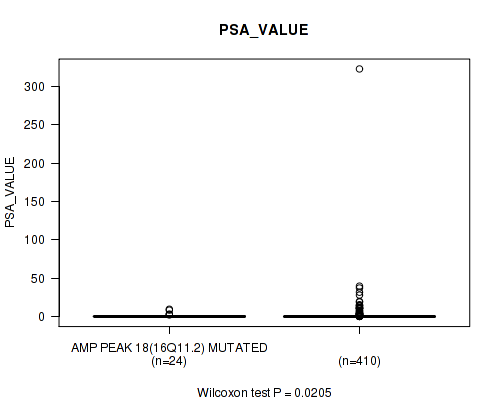
P value = 0.12 (logrank test), Q value = 0.24
Table S115. Gene #19: 'amp_17q23.2' versus Clinical Feature #1: 'Time to Death'
| nPatients | nDeath | Duration Range (Median), Month | |
|---|---|---|---|
| ALL | 489 | 9 | 0.7 - 165.2 (28.8) |
| AMP PEAK 19(17Q23.2) MUTATED | 25 | 1 | 4.3 - 109.2 (22.0) |
| AMP PEAK 19(17Q23.2) WILD-TYPE | 464 | 8 | 0.7 - 165.2 (29.9) |
Figure S115. Get High-res Image Gene #19: 'amp_17q23.2' versus Clinical Feature #1: 'Time to Death'
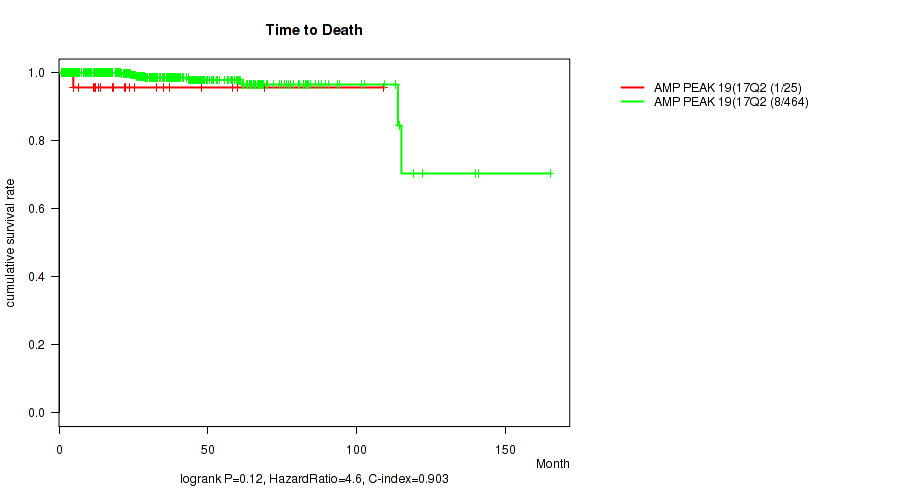
P value = 0.00084 (Fisher's exact test), Q value = 0.0057
Table S116. Gene #19: 'amp_17q23.2' versus Clinical Feature #3: 'PATHOLOGY_T_STAGE'
| nPatients | T2 | T3 | T4 |
|---|---|---|---|
| ALL | 188 | 287 | 10 |
| AMP PEAK 19(17Q23.2) MUTATED | 2 | 20 | 2 |
| AMP PEAK 19(17Q23.2) WILD-TYPE | 186 | 267 | 8 |
Figure S116. Get High-res Image Gene #19: 'amp_17q23.2' versus Clinical Feature #3: 'PATHOLOGY_T_STAGE'

P value = 0.0217 (Fisher's exact test), Q value = 0.071
Table S117. Gene #19: 'amp_17q23.2' versus Clinical Feature #4: 'PATHOLOGY_N_STAGE'
| nPatients | 0 | 1 |
|---|---|---|
| ALL | 342 | 77 |
| AMP PEAK 19(17Q23.2) MUTATED | 14 | 9 |
| AMP PEAK 19(17Q23.2) WILD-TYPE | 328 | 68 |
Figure S117. Get High-res Image Gene #19: 'amp_17q23.2' versus Clinical Feature #4: 'PATHOLOGY_N_STAGE'
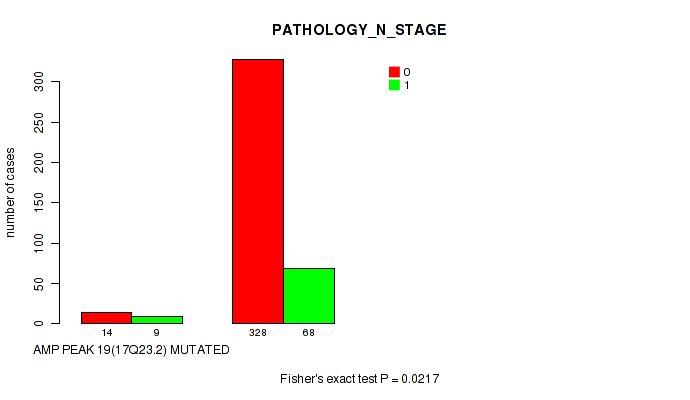
P value = 0.0539 (Fisher's exact test), Q value = 0.14
Table S118. Gene #19: 'amp_17q23.2' versus Clinical Feature #5: 'RADIATION_THERAPY'
| nPatients | NO | YES |
|---|---|---|
| ALL | 378 | 57 |
| AMP PEAK 19(17Q23.2) MUTATED | 16 | 6 |
| AMP PEAK 19(17Q23.2) WILD-TYPE | 362 | 51 |
Figure S118. Get High-res Image Gene #19: 'amp_17q23.2' versus Clinical Feature #5: 'RADIATION_THERAPY'
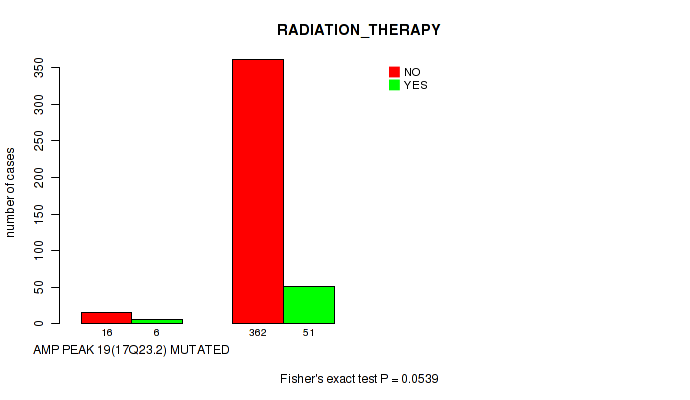
P value = 0.0293 (Fisher's exact test), Q value = 0.087
Table S119. Gene #19: 'amp_17q23.2' versus Clinical Feature #6: 'HISTOLOGICAL_TYPE'
| nPatients | PROSTATE ADENOCARCINOMA OTHER SUBTYPE | PROSTATE ADENOCARCINOMA ACINAR TYPE |
|---|---|---|
| ALL | 14 | 477 |
| AMP PEAK 19(17Q23.2) MUTATED | 3 | 22 |
| AMP PEAK 19(17Q23.2) WILD-TYPE | 11 | 455 |
Figure S119. Get High-res Image Gene #19: 'amp_17q23.2' versus Clinical Feature #6: 'HISTOLOGICAL_TYPE'

P value = 0.0111 (Wilcoxon-test), Q value = 0.043
Table S120. Gene #19: 'amp_17q23.2' versus Clinical Feature #8: 'NUMBER_OF_LYMPH_NODES'
| nPatients | Mean (Std.Dev) | |
|---|---|---|
| ALL | 401 | 0.4 (1.4) |
| AMP PEAK 19(17Q23.2) MUTATED | 23 | 0.7 (0.9) |
| AMP PEAK 19(17Q23.2) WILD-TYPE | 378 | 0.4 (1.4) |
Figure S120. Get High-res Image Gene #19: 'amp_17q23.2' versus Clinical Feature #8: 'NUMBER_OF_LYMPH_NODES'
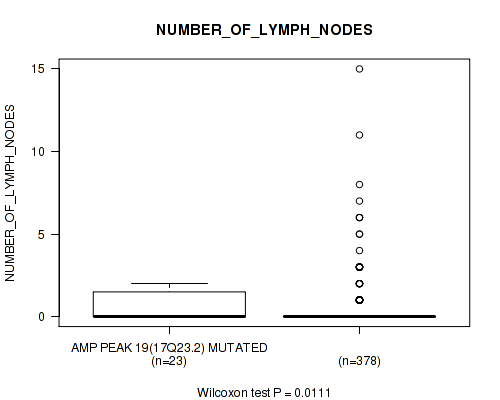
P value = 7.09e-05 (Wilcoxon-test), Q value = 0.00087
Table S121. Gene #19: 'amp_17q23.2' versus Clinical Feature #9: 'GLEASON_SCORE'
| nPatients | Mean (Std.Dev) | |
|---|---|---|
| ALL | 491 | 7.6 (1.0) |
| AMP PEAK 19(17Q23.2) MUTATED | 25 | 8.4 (1.0) |
| AMP PEAK 19(17Q23.2) WILD-TYPE | 466 | 7.6 (1.0) |
Figure S121. Get High-res Image Gene #19: 'amp_17q23.2' versus Clinical Feature #9: 'GLEASON_SCORE'
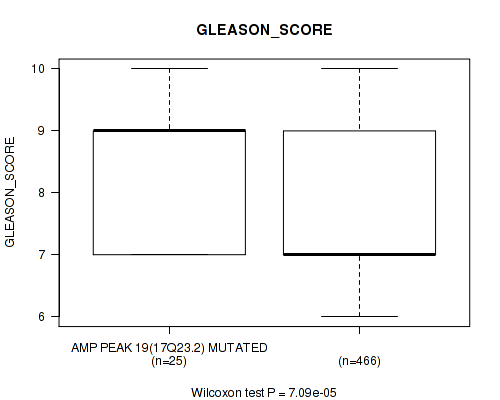
P value = 0.0497 (Wilcoxon-test), Q value = 0.13
Table S122. Gene #19: 'amp_17q23.2' versus Clinical Feature #10: 'PSA_VALUE'
| nPatients | Mean (Std.Dev) | |
|---|---|---|
| ALL | 434 | 1.8 (16.0) |
| AMP PEAK 19(17Q23.2) MUTATED | 22 | 15.6 (68.7) |
| AMP PEAK 19(17Q23.2) WILD-TYPE | 412 | 1.1 (4.2) |
Figure S122. Get High-res Image Gene #19: 'amp_17q23.2' versus Clinical Feature #10: 'PSA_VALUE'
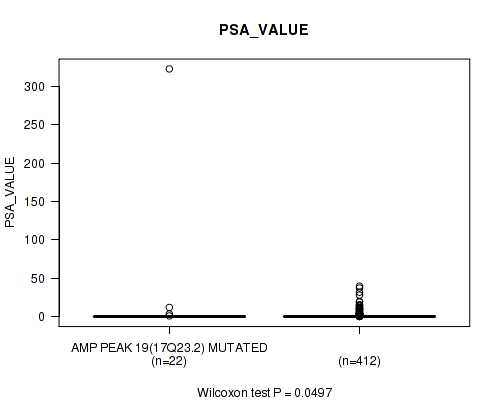
P value = 0.0301 (Wilcoxon-test), Q value = 0.089
Table S123. Gene #20: 'amp_19q13.43' versus Clinical Feature #2: 'YEARS_TO_BIRTH'
| nPatients | Mean (Std.Dev) | |
|---|---|---|
| ALL | 480 | 61.0 (6.8) |
| AMP PEAK 20(19Q13.43) MUTATED | 17 | 64.5 (6.8) |
| AMP PEAK 20(19Q13.43) WILD-TYPE | 463 | 60.8 (6.8) |
Figure S123. Get High-res Image Gene #20: 'amp_19q13.43' versus Clinical Feature #2: 'YEARS_TO_BIRTH'
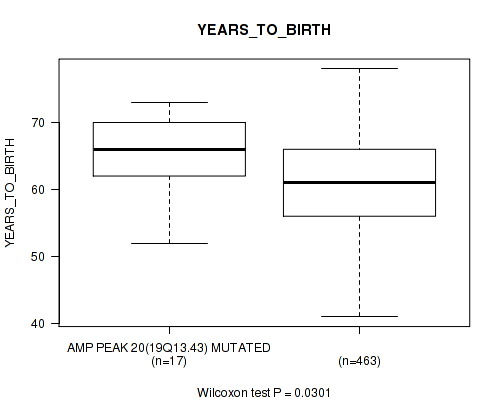
P value = 5e-04 (Fisher's exact test), Q value = 0.0038
Table S124. Gene #20: 'amp_19q13.43' versus Clinical Feature #3: 'PATHOLOGY_T_STAGE'
| nPatients | T2 | T3 | T4 |
|---|---|---|---|
| ALL | 188 | 287 | 10 |
| AMP PEAK 20(19Q13.43) MUTATED | 0 | 16 | 1 |
| AMP PEAK 20(19Q13.43) WILD-TYPE | 188 | 271 | 9 |
Figure S124. Get High-res Image Gene #20: 'amp_19q13.43' versus Clinical Feature #3: 'PATHOLOGY_T_STAGE'

P value = 0.022 (Fisher's exact test), Q value = 0.072
Table S125. Gene #20: 'amp_19q13.43' versus Clinical Feature #4: 'PATHOLOGY_N_STAGE'
| nPatients | 0 | 1 |
|---|---|---|
| ALL | 342 | 77 |
| AMP PEAK 20(19Q13.43) MUTATED | 10 | 7 |
| AMP PEAK 20(19Q13.43) WILD-TYPE | 332 | 70 |
Figure S125. Get High-res Image Gene #20: 'amp_19q13.43' versus Clinical Feature #4: 'PATHOLOGY_N_STAGE'
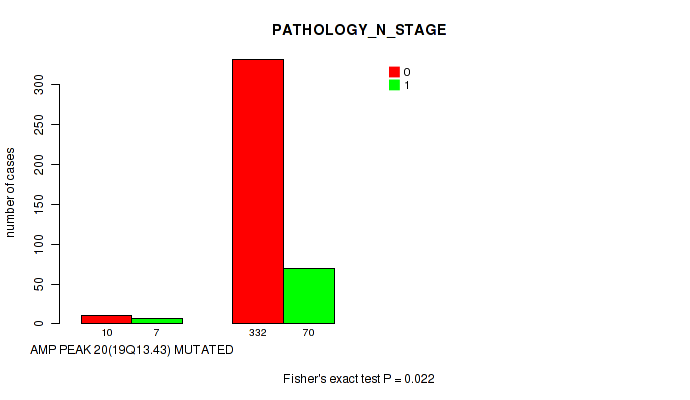
P value = 0.089 (Fisher's exact test), Q value = 0.2
Table S126. Gene #20: 'amp_19q13.43' versus Clinical Feature #6: 'HISTOLOGICAL_TYPE'
| nPatients | PROSTATE ADENOCARCINOMA OTHER SUBTYPE | PROSTATE ADENOCARCINOMA ACINAR TYPE |
|---|---|---|
| ALL | 14 | 477 |
| AMP PEAK 20(19Q13.43) MUTATED | 2 | 16 |
| AMP PEAK 20(19Q13.43) WILD-TYPE | 12 | 461 |
Figure S126. Get High-res Image Gene #20: 'amp_19q13.43' versus Clinical Feature #6: 'HISTOLOGICAL_TYPE'
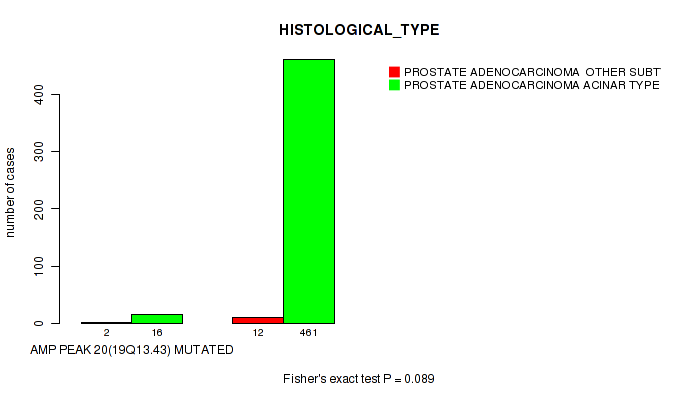
P value = 0.0115 (Wilcoxon-test), Q value = 0.045
Table S127. Gene #20: 'amp_19q13.43' versus Clinical Feature #8: 'NUMBER_OF_LYMPH_NODES'
| nPatients | Mean (Std.Dev) | |
|---|---|---|
| ALL | 401 | 0.4 (1.4) |
| AMP PEAK 20(19Q13.43) MUTATED | 17 | 1.1 (2.0) |
| AMP PEAK 20(19Q13.43) WILD-TYPE | 384 | 0.4 (1.3) |
Figure S127. Get High-res Image Gene #20: 'amp_19q13.43' versus Clinical Feature #8: 'NUMBER_OF_LYMPH_NODES'
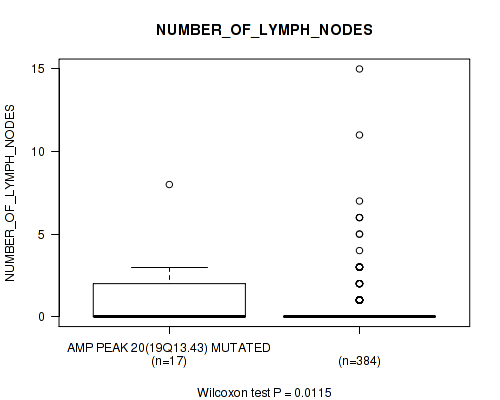
P value = 8.97e-06 (Wilcoxon-test), Q value = 0.00016
Table S128. Gene #20: 'amp_19q13.43' versus Clinical Feature #9: 'GLEASON_SCORE'
| nPatients | Mean (Std.Dev) | |
|---|---|---|
| ALL | 491 | 7.6 (1.0) |
| AMP PEAK 20(19Q13.43) MUTATED | 18 | 8.7 (0.9) |
| AMP PEAK 20(19Q13.43) WILD-TYPE | 473 | 7.6 (1.0) |
Figure S128. Get High-res Image Gene #20: 'amp_19q13.43' versus Clinical Feature #9: 'GLEASON_SCORE'
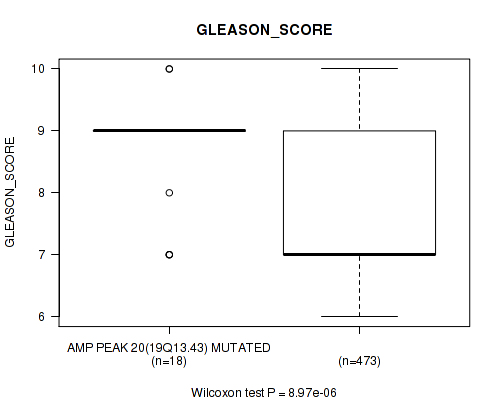
P value = 0.00493 (Wilcoxon-test), Q value = 0.022
Table S129. Gene #21: 'amp_20q13.2' versus Clinical Feature #2: 'YEARS_TO_BIRTH'
| nPatients | Mean (Std.Dev) | |
|---|---|---|
| ALL | 480 | 61.0 (6.8) |
| AMP PEAK 21(20Q13.2) MUTATED | 41 | 63.7 (4.5) |
| AMP PEAK 21(20Q13.2) WILD-TYPE | 439 | 60.7 (6.9) |
Figure S129. Get High-res Image Gene #21: 'amp_20q13.2' versus Clinical Feature #2: 'YEARS_TO_BIRTH'

P value = 2e-05 (Fisher's exact test), Q value = 0.00029
Table S130. Gene #21: 'amp_20q13.2' versus Clinical Feature #3: 'PATHOLOGY_T_STAGE'
| nPatients | T2 | T3 | T4 |
|---|---|---|---|
| ALL | 188 | 287 | 10 |
| AMP PEAK 21(20Q13.2) MUTATED | 4 | 36 | 3 |
| AMP PEAK 21(20Q13.2) WILD-TYPE | 184 | 251 | 7 |
Figure S130. Get High-res Image Gene #21: 'amp_20q13.2' versus Clinical Feature #3: 'PATHOLOGY_T_STAGE'
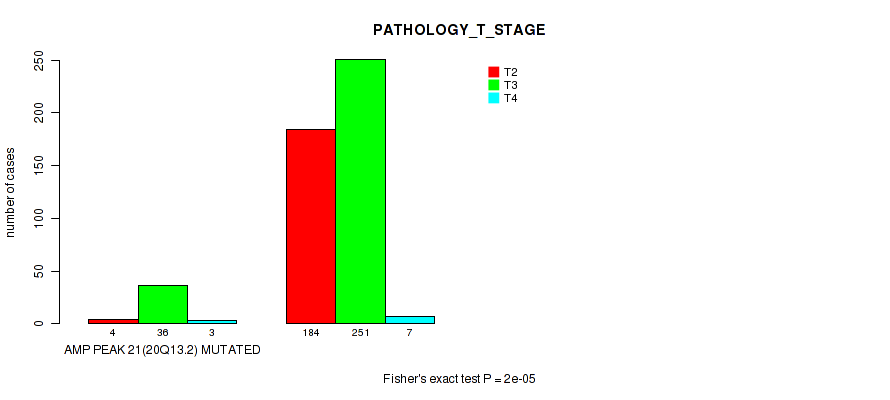
P value = 0.00857 (Fisher's exact test), Q value = 0.035
Table S131. Gene #21: 'amp_20q13.2' versus Clinical Feature #4: 'PATHOLOGY_N_STAGE'
| nPatients | 0 | 1 |
|---|---|---|
| ALL | 342 | 77 |
| AMP PEAK 21(20Q13.2) MUTATED | 26 | 14 |
| AMP PEAK 21(20Q13.2) WILD-TYPE | 316 | 63 |
Figure S131. Get High-res Image Gene #21: 'amp_20q13.2' versus Clinical Feature #4: 'PATHOLOGY_N_STAGE'

P value = 0.0767 (Fisher's exact test), Q value = 0.18
Table S132. Gene #21: 'amp_20q13.2' versus Clinical Feature #5: 'RADIATION_THERAPY'
| nPatients | NO | YES |
|---|---|---|
| ALL | 378 | 57 |
| AMP PEAK 21(20Q13.2) MUTATED | 30 | 9 |
| AMP PEAK 21(20Q13.2) WILD-TYPE | 348 | 48 |
Figure S132. Get High-res Image Gene #21: 'amp_20q13.2' versus Clinical Feature #5: 'RADIATION_THERAPY'

P value = 0.0206 (Fisher's exact test), Q value = 0.069
Table S133. Gene #21: 'amp_20q13.2' versus Clinical Feature #7: 'RESIDUAL_TUMOR'
| nPatients | R0 | R1 | R2 | RX |
|---|---|---|---|---|
| ALL | 312 | 143 | 5 | 15 |
| AMP PEAK 21(20Q13.2) MUTATED | 19 | 21 | 0 | 2 |
| AMP PEAK 21(20Q13.2) WILD-TYPE | 293 | 122 | 5 | 13 |
Figure S133. Get High-res Image Gene #21: 'amp_20q13.2' versus Clinical Feature #7: 'RESIDUAL_TUMOR'
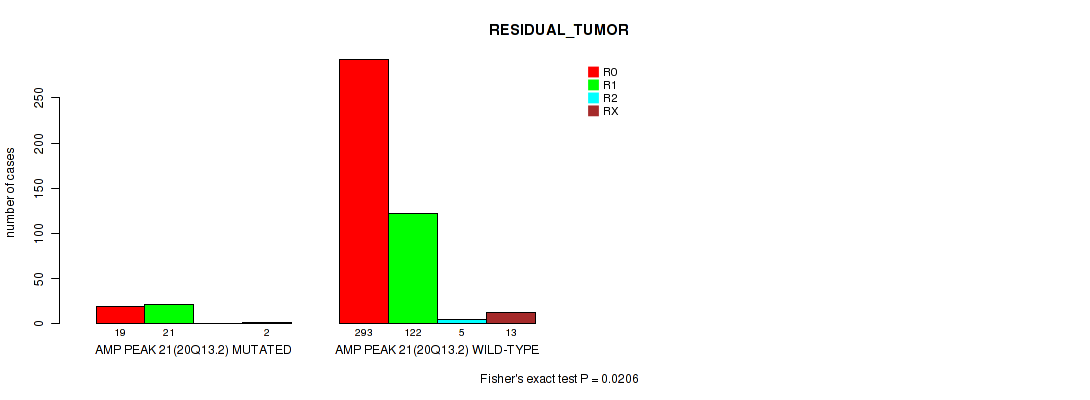
P value = 0.00343 (Wilcoxon-test), Q value = 0.017
Table S134. Gene #21: 'amp_20q13.2' versus Clinical Feature #8: 'NUMBER_OF_LYMPH_NODES'
| nPatients | Mean (Std.Dev) | |
|---|---|---|
| ALL | 401 | 0.4 (1.4) |
| AMP PEAK 21(20Q13.2) MUTATED | 38 | 0.8 (1.5) |
| AMP PEAK 21(20Q13.2) WILD-TYPE | 363 | 0.4 (1.3) |
Figure S134. Get High-res Image Gene #21: 'amp_20q13.2' versus Clinical Feature #8: 'NUMBER_OF_LYMPH_NODES'

P value = 1.51e-07 (Wilcoxon-test), Q value = 6.4e-06
Table S135. Gene #21: 'amp_20q13.2' versus Clinical Feature #9: 'GLEASON_SCORE'
| nPatients | Mean (Std.Dev) | |
|---|---|---|
| ALL | 491 | 7.6 (1.0) |
| AMP PEAK 21(20Q13.2) MUTATED | 44 | 8.4 (1.0) |
| AMP PEAK 21(20Q13.2) WILD-TYPE | 447 | 7.5 (1.0) |
Figure S135. Get High-res Image Gene #21: 'amp_20q13.2' versus Clinical Feature #9: 'GLEASON_SCORE'
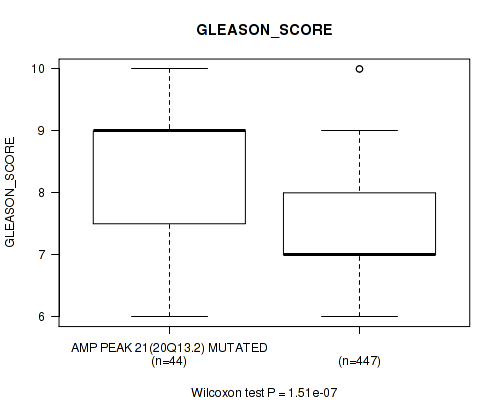
P value = 0.0647 (Wilcoxon-test), Q value = 0.16
Table S136. Gene #21: 'amp_20q13.2' versus Clinical Feature #10: 'PSA_VALUE'
| nPatients | Mean (Std.Dev) | |
|---|---|---|
| ALL | 434 | 1.8 (16.0) |
| AMP PEAK 21(20Q13.2) MUTATED | 43 | 8.6 (49.2) |
| AMP PEAK 21(20Q13.2) WILD-TYPE | 391 | 1.1 (4.2) |
Figure S136. Get High-res Image Gene #21: 'amp_20q13.2' versus Clinical Feature #10: 'PSA_VALUE'
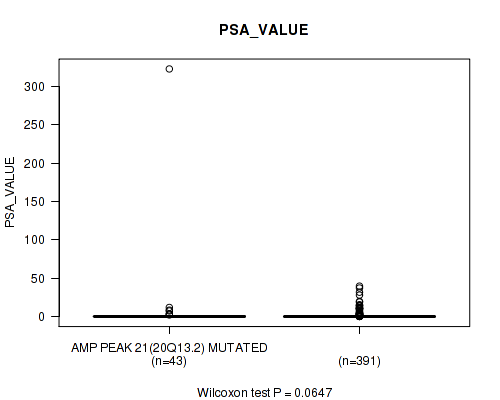
P value = 0.0135 (Wilcoxon-test), Q value = 0.05
Table S137. Gene #22: 'amp_xp22.11' versus Clinical Feature #2: 'YEARS_TO_BIRTH'
| nPatients | Mean (Std.Dev) | |
|---|---|---|
| ALL | 480 | 61.0 (6.8) |
| AMP PEAK 22(XP22.11) MUTATED | 24 | 64.3 (5.9) |
| AMP PEAK 22(XP22.11) WILD-TYPE | 456 | 60.8 (6.8) |
Figure S137. Get High-res Image Gene #22: 'amp_xp22.11' versus Clinical Feature #2: 'YEARS_TO_BIRTH'
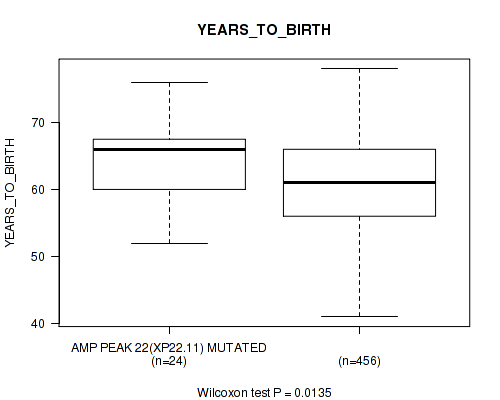
P value = 0.00236 (Fisher's exact test), Q value = 0.013
Table S138. Gene #22: 'amp_xp22.11' versus Clinical Feature #3: 'PATHOLOGY_T_STAGE'
| nPatients | T2 | T3 | T4 |
|---|---|---|---|
| ALL | 188 | 287 | 10 |
| AMP PEAK 22(XP22.11) MUTATED | 4 | 18 | 3 |
| AMP PEAK 22(XP22.11) WILD-TYPE | 184 | 269 | 7 |
Figure S138. Get High-res Image Gene #22: 'amp_xp22.11' versus Clinical Feature #3: 'PATHOLOGY_T_STAGE'

P value = 0.104 (Fisher's exact test), Q value = 0.22
Table S139. Gene #22: 'amp_xp22.11' versus Clinical Feature #4: 'PATHOLOGY_N_STAGE'
| nPatients | 0 | 1 |
|---|---|---|
| ALL | 342 | 77 |
| AMP PEAK 22(XP22.11) MUTATED | 17 | 8 |
| AMP PEAK 22(XP22.11) WILD-TYPE | 325 | 69 |
Figure S139. Get High-res Image Gene #22: 'amp_xp22.11' versus Clinical Feature #4: 'PATHOLOGY_N_STAGE'

P value = 0.0436 (Fisher's exact test), Q value = 0.12
Table S140. Gene #22: 'amp_xp22.11' versus Clinical Feature #5: 'RADIATION_THERAPY'
| nPatients | NO | YES |
|---|---|---|
| ALL | 378 | 57 |
| AMP PEAK 22(XP22.11) MUTATED | 15 | 6 |
| AMP PEAK 22(XP22.11) WILD-TYPE | 363 | 51 |
Figure S140. Get High-res Image Gene #22: 'amp_xp22.11' versus Clinical Feature #5: 'RADIATION_THERAPY'

P value = 0.0293 (Fisher's exact test), Q value = 0.087
Table S141. Gene #22: 'amp_xp22.11' versus Clinical Feature #6: 'HISTOLOGICAL_TYPE'
| nPatients | PROSTATE ADENOCARCINOMA OTHER SUBTYPE | PROSTATE ADENOCARCINOMA ACINAR TYPE |
|---|---|---|
| ALL | 14 | 477 |
| AMP PEAK 22(XP22.11) MUTATED | 3 | 22 |
| AMP PEAK 22(XP22.11) WILD-TYPE | 11 | 455 |
Figure S141. Get High-res Image Gene #22: 'amp_xp22.11' versus Clinical Feature #6: 'HISTOLOGICAL_TYPE'
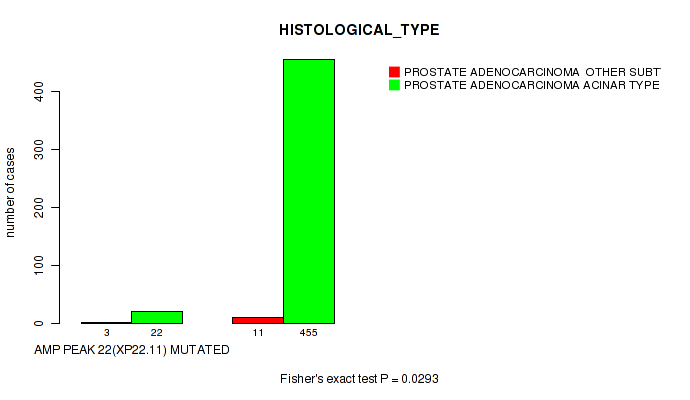
P value = 0.0179 (Fisher's exact test), Q value = 0.063
Table S142. Gene #22: 'amp_xp22.11' versus Clinical Feature #7: 'RESIDUAL_TUMOR'
| nPatients | R0 | R1 | R2 | RX |
|---|---|---|---|---|
| ALL | 312 | 143 | 5 | 15 |
| AMP PEAK 22(XP22.11) MUTATED | 9 | 12 | 1 | 1 |
| AMP PEAK 22(XP22.11) WILD-TYPE | 303 | 131 | 4 | 14 |
Figure S142. Get High-res Image Gene #22: 'amp_xp22.11' versus Clinical Feature #7: 'RESIDUAL_TUMOR'
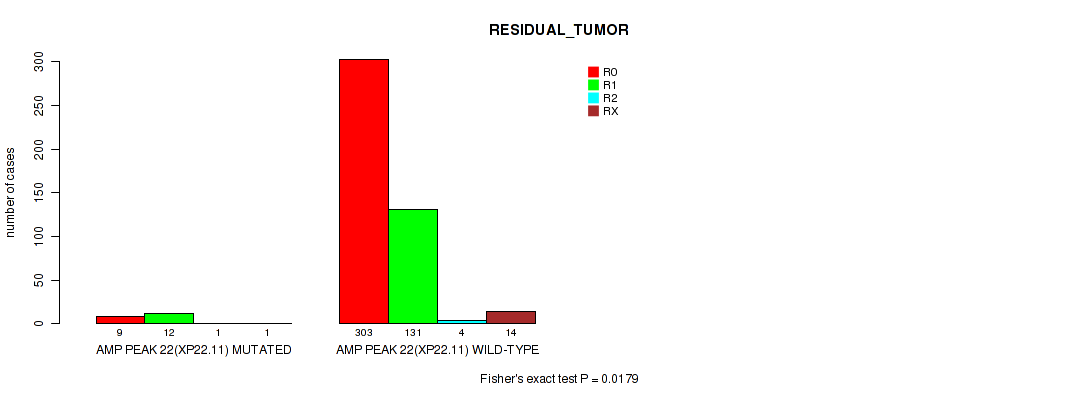
P value = 0.0862 (Wilcoxon-test), Q value = 0.19
Table S143. Gene #22: 'amp_xp22.11' versus Clinical Feature #8: 'NUMBER_OF_LYMPH_NODES'
| nPatients | Mean (Std.Dev) | |
|---|---|---|
| ALL | 401 | 0.4 (1.4) |
| AMP PEAK 22(XP22.11) MUTATED | 25 | 0.7 (1.5) |
| AMP PEAK 22(XP22.11) WILD-TYPE | 376 | 0.4 (1.4) |
Figure S143. Get High-res Image Gene #22: 'amp_xp22.11' versus Clinical Feature #8: 'NUMBER_OF_LYMPH_NODES'

P value = 0.000988 (Wilcoxon-test), Q value = 0.0065
Table S144. Gene #22: 'amp_xp22.11' versus Clinical Feature #9: 'GLEASON_SCORE'
| nPatients | Mean (Std.Dev) | |
|---|---|---|
| ALL | 491 | 7.6 (1.0) |
| AMP PEAK 22(XP22.11) MUTATED | 25 | 8.2 (0.9) |
| AMP PEAK 22(XP22.11) WILD-TYPE | 466 | 7.6 (1.0) |
Figure S144. Get High-res Image Gene #22: 'amp_xp22.11' versus Clinical Feature #9: 'GLEASON_SCORE'

P value = 0.0782 (Wilcoxon-test), Q value = 0.18
Table S145. Gene #23: 'amp_xp22.11' versus Clinical Feature #2: 'YEARS_TO_BIRTH'
| nPatients | Mean (Std.Dev) | |
|---|---|---|
| ALL | 480 | 61.0 (6.8) |
| AMP PEAK 23(XP22.11) MUTATED | 23 | 63.3 (7.1) |
| AMP PEAK 23(XP22.11) WILD-TYPE | 457 | 60.9 (6.8) |
Figure S145. Get High-res Image Gene #23: 'amp_xp22.11' versus Clinical Feature #2: 'YEARS_TO_BIRTH'
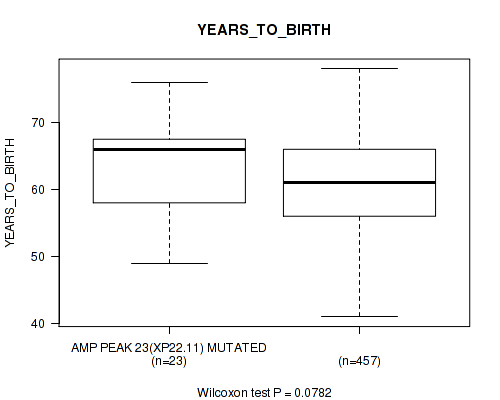
P value = 0.00217 (Fisher's exact test), Q value = 0.012
Table S146. Gene #23: 'amp_xp22.11' versus Clinical Feature #3: 'PATHOLOGY_T_STAGE'
| nPatients | T2 | T3 | T4 |
|---|---|---|---|
| ALL | 188 | 287 | 10 |
| AMP PEAK 23(XP22.11) MUTATED | 4 | 17 | 3 |
| AMP PEAK 23(XP22.11) WILD-TYPE | 184 | 270 | 7 |
Figure S146. Get High-res Image Gene #23: 'amp_xp22.11' versus Clinical Feature #3: 'PATHOLOGY_T_STAGE'
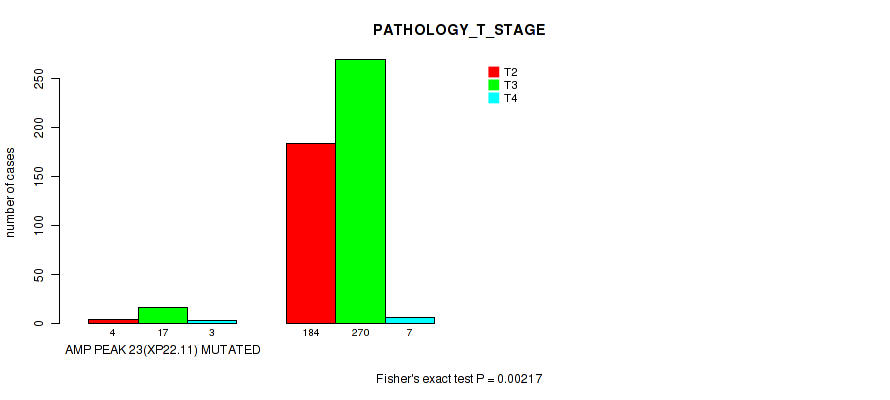
P value = 0.06 (Fisher's exact test), Q value = 0.15
Table S147. Gene #23: 'amp_xp22.11' versus Clinical Feature #4: 'PATHOLOGY_N_STAGE'
| nPatients | 0 | 1 |
|---|---|---|
| ALL | 342 | 77 |
| AMP PEAK 23(XP22.11) MUTATED | 16 | 8 |
| AMP PEAK 23(XP22.11) WILD-TYPE | 326 | 69 |
Figure S147. Get High-res Image Gene #23: 'amp_xp22.11' versus Clinical Feature #4: 'PATHOLOGY_N_STAGE'
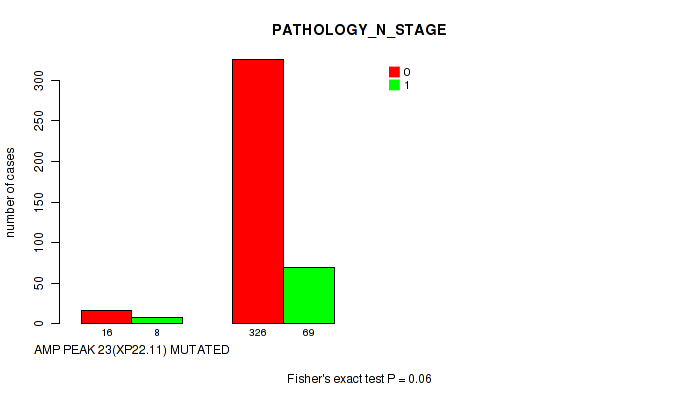
P value = 0.0262 (Fisher's exact test), Q value = 0.082
Table S148. Gene #23: 'amp_xp22.11' versus Clinical Feature #6: 'HISTOLOGICAL_TYPE'
| nPatients | PROSTATE ADENOCARCINOMA OTHER SUBTYPE | PROSTATE ADENOCARCINOMA ACINAR TYPE |
|---|---|---|
| ALL | 14 | 477 |
| AMP PEAK 23(XP22.11) MUTATED | 3 | 21 |
| AMP PEAK 23(XP22.11) WILD-TYPE | 11 | 456 |
Figure S148. Get High-res Image Gene #23: 'amp_xp22.11' versus Clinical Feature #6: 'HISTOLOGICAL_TYPE'

P value = 0.0177 (Fisher's exact test), Q value = 0.062
Table S149. Gene #23: 'amp_xp22.11' versus Clinical Feature #7: 'RESIDUAL_TUMOR'
| nPatients | R0 | R1 | R2 | RX |
|---|---|---|---|---|
| ALL | 312 | 143 | 5 | 15 |
| AMP PEAK 23(XP22.11) MUTATED | 9 | 12 | 1 | 1 |
| AMP PEAK 23(XP22.11) WILD-TYPE | 303 | 131 | 4 | 14 |
Figure S149. Get High-res Image Gene #23: 'amp_xp22.11' versus Clinical Feature #7: 'RESIDUAL_TUMOR'

P value = 0.0642 (Wilcoxon-test), Q value = 0.15
Table S150. Gene #23: 'amp_xp22.11' versus Clinical Feature #8: 'NUMBER_OF_LYMPH_NODES'
| nPatients | Mean (Std.Dev) | |
|---|---|---|
| ALL | 401 | 0.4 (1.4) |
| AMP PEAK 23(XP22.11) MUTATED | 24 | 0.8 (1.5) |
| AMP PEAK 23(XP22.11) WILD-TYPE | 377 | 0.4 (1.4) |
Figure S150. Get High-res Image Gene #23: 'amp_xp22.11' versus Clinical Feature #8: 'NUMBER_OF_LYMPH_NODES'
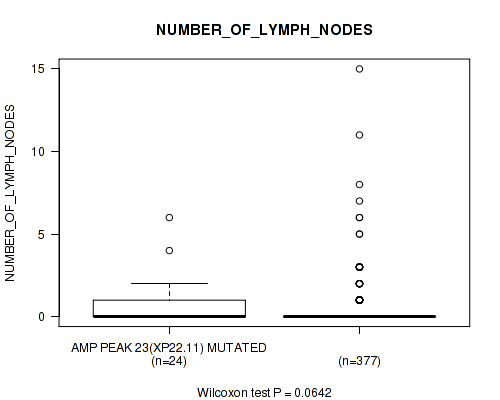
P value = 0.00115 (Wilcoxon-test), Q value = 0.0074
Table S151. Gene #23: 'amp_xp22.11' versus Clinical Feature #9: 'GLEASON_SCORE'
| nPatients | Mean (Std.Dev) | |
|---|---|---|
| ALL | 491 | 7.6 (1.0) |
| AMP PEAK 23(XP22.11) MUTATED | 24 | 8.2 (0.9) |
| AMP PEAK 23(XP22.11) WILD-TYPE | 467 | 7.6 (1.0) |
Figure S151. Get High-res Image Gene #23: 'amp_xp22.11' versus Clinical Feature #9: 'GLEASON_SCORE'
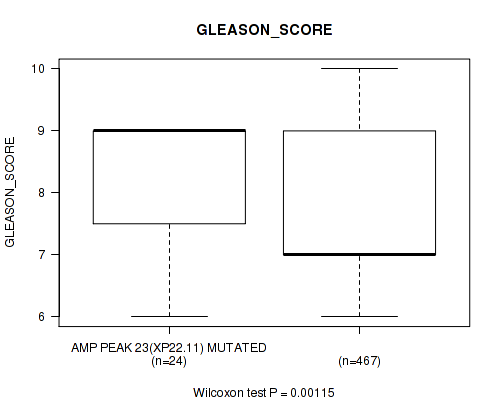
P value = 0.0996 (Wilcoxon-test), Q value = 0.21
Table S152. Gene #23: 'amp_xp22.11' versus Clinical Feature #10: 'PSA_VALUE'
| nPatients | Mean (Std.Dev) | |
|---|---|---|
| ALL | 434 | 1.8 (16.0) |
| AMP PEAK 23(XP22.11) MUTATED | 20 | 0.6 (1.0) |
| AMP PEAK 23(XP22.11) WILD-TYPE | 414 | 1.9 (16.4) |
Figure S152. Get High-res Image Gene #23: 'amp_xp22.11' versus Clinical Feature #10: 'PSA_VALUE'
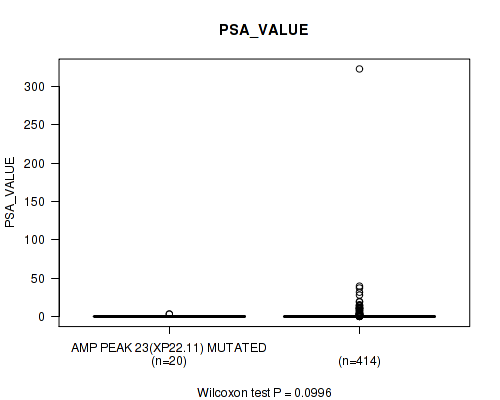
P value = 0.00157 (Wilcoxon-test), Q value = 0.0094
Table S153. Gene #24: 'amp_xp21.1' versus Clinical Feature #2: 'YEARS_TO_BIRTH'
| nPatients | Mean (Std.Dev) | |
|---|---|---|
| ALL | 480 | 61.0 (6.8) |
| AMP PEAK 24(XP21.1) MUTATED | 21 | 65.4 (4.9) |
| AMP PEAK 24(XP21.1) WILD-TYPE | 459 | 60.8 (6.8) |
Figure S153. Get High-res Image Gene #24: 'amp_xp21.1' versus Clinical Feature #2: 'YEARS_TO_BIRTH'

P value = 0.00542 (Fisher's exact test), Q value = 0.024
Table S154. Gene #24: 'amp_xp21.1' versus Clinical Feature #3: 'PATHOLOGY_T_STAGE'
| nPatients | T2 | T3 | T4 |
|---|---|---|---|
| ALL | 188 | 287 | 10 |
| AMP PEAK 24(XP21.1) MUTATED | 3 | 18 | 2 |
| AMP PEAK 24(XP21.1) WILD-TYPE | 185 | 269 | 8 |
Figure S154. Get High-res Image Gene #24: 'amp_xp21.1' versus Clinical Feature #3: 'PATHOLOGY_T_STAGE'
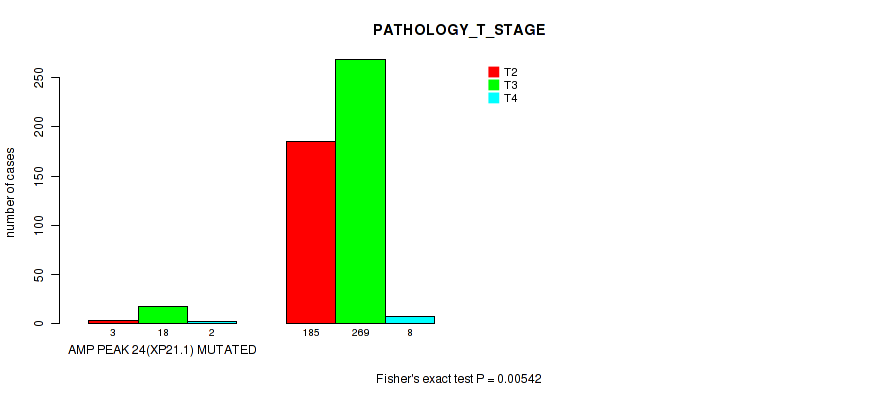
P value = 0.0499 (Fisher's exact test), Q value = 0.13
Table S155. Gene #24: 'amp_xp21.1' versus Clinical Feature #4: 'PATHOLOGY_N_STAGE'
| nPatients | 0 | 1 |
|---|---|---|
| ALL | 342 | 77 |
| AMP PEAK 24(XP21.1) MUTATED | 15 | 8 |
| AMP PEAK 24(XP21.1) WILD-TYPE | 327 | 69 |
Figure S155. Get High-res Image Gene #24: 'amp_xp21.1' versus Clinical Feature #4: 'PATHOLOGY_N_STAGE'

P value = 0.0233 (Fisher's exact test), Q value = 0.075
Table S156. Gene #24: 'amp_xp21.1' versus Clinical Feature #6: 'HISTOLOGICAL_TYPE'
| nPatients | PROSTATE ADENOCARCINOMA OTHER SUBTYPE | PROSTATE ADENOCARCINOMA ACINAR TYPE |
|---|---|---|
| ALL | 14 | 477 |
| AMP PEAK 24(XP21.1) MUTATED | 3 | 20 |
| AMP PEAK 24(XP21.1) WILD-TYPE | 11 | 457 |
Figure S156. Get High-res Image Gene #24: 'amp_xp21.1' versus Clinical Feature #6: 'HISTOLOGICAL_TYPE'
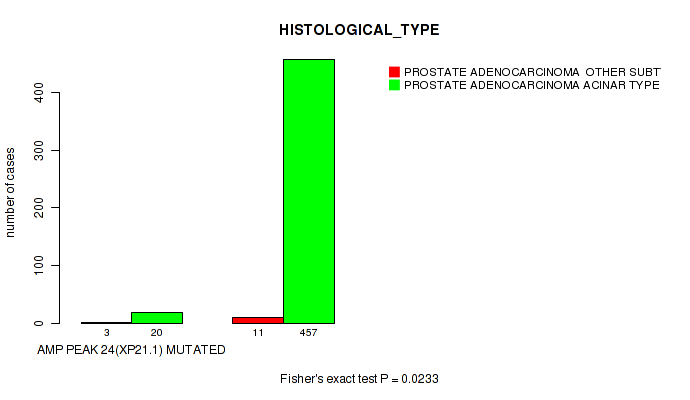
P value = 0.0175 (Fisher's exact test), Q value = 0.062
Table S157. Gene #24: 'amp_xp21.1' versus Clinical Feature #7: 'RESIDUAL_TUMOR'
| nPatients | R0 | R1 | R2 | RX |
|---|---|---|---|---|
| ALL | 312 | 143 | 5 | 15 |
| AMP PEAK 24(XP21.1) MUTATED | 9 | 12 | 1 | 1 |
| AMP PEAK 24(XP21.1) WILD-TYPE | 303 | 131 | 4 | 14 |
Figure S157. Get High-res Image Gene #24: 'amp_xp21.1' versus Clinical Feature #7: 'RESIDUAL_TUMOR'

P value = 0.0463 (Wilcoxon-test), Q value = 0.12
Table S158. Gene #24: 'amp_xp21.1' versus Clinical Feature #8: 'NUMBER_OF_LYMPH_NODES'
| nPatients | Mean (Std.Dev) | |
|---|---|---|
| ALL | 401 | 0.4 (1.4) |
| AMP PEAK 24(XP21.1) MUTATED | 23 | 0.8 (1.5) |
| AMP PEAK 24(XP21.1) WILD-TYPE | 378 | 0.4 (1.4) |
Figure S158. Get High-res Image Gene #24: 'amp_xp21.1' versus Clinical Feature #8: 'NUMBER_OF_LYMPH_NODES'

P value = 0.000232 (Wilcoxon-test), Q value = 0.0022
Table S159. Gene #24: 'amp_xp21.1' versus Clinical Feature #9: 'GLEASON_SCORE'
| nPatients | Mean (Std.Dev) | |
|---|---|---|
| ALL | 491 | 7.6 (1.0) |
| AMP PEAK 24(XP21.1) MUTATED | 23 | 8.3 (0.8) |
| AMP PEAK 24(XP21.1) WILD-TYPE | 468 | 7.6 (1.0) |
Figure S159. Get High-res Image Gene #24: 'amp_xp21.1' versus Clinical Feature #9: 'GLEASON_SCORE'
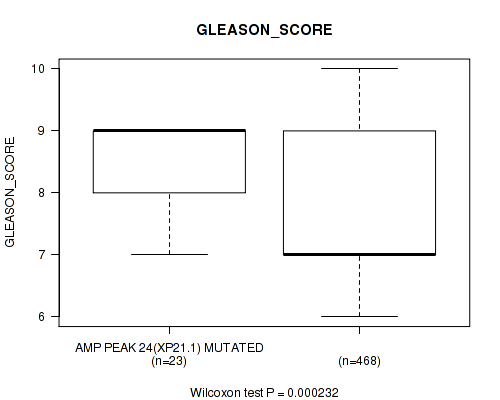
P value = 0.113 (Wilcoxon-test), Q value = 0.24
Table S160. Gene #24: 'amp_xp21.1' versus Clinical Feature #10: 'PSA_VALUE'
| nPatients | Mean (Std.Dev) | |
|---|---|---|
| ALL | 434 | 1.8 (16.0) |
| AMP PEAK 24(XP21.1) MUTATED | 20 | 0.5 (1.0) |
| AMP PEAK 24(XP21.1) WILD-TYPE | 414 | 1.9 (16.4) |
Figure S160. Get High-res Image Gene #24: 'amp_xp21.1' versus Clinical Feature #10: 'PSA_VALUE'
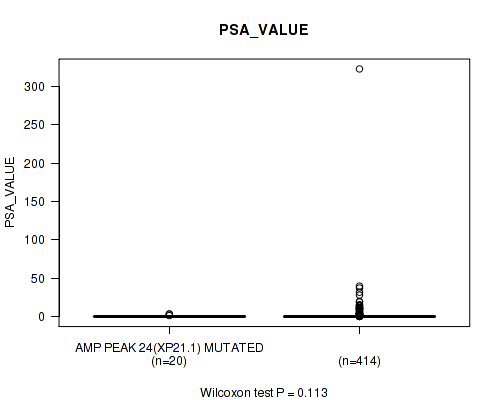
P value = 0.00745 (Fisher's exact test), Q value = 0.032
Table S161. Gene #24: 'amp_xp21.1' versus Clinical Feature #11: 'RACE'
| nPatients | ASIAN | BLACK OR AFRICAN AMERICAN | WHITE |
|---|---|---|---|
| ALL | 2 | 7 | 146 |
| AMP PEAK 24(XP21.1) MUTATED | 1 | 1 | 2 |
| AMP PEAK 24(XP21.1) WILD-TYPE | 1 | 6 | 144 |
Figure S161. Get High-res Image Gene #24: 'amp_xp21.1' versus Clinical Feature #11: 'RACE'
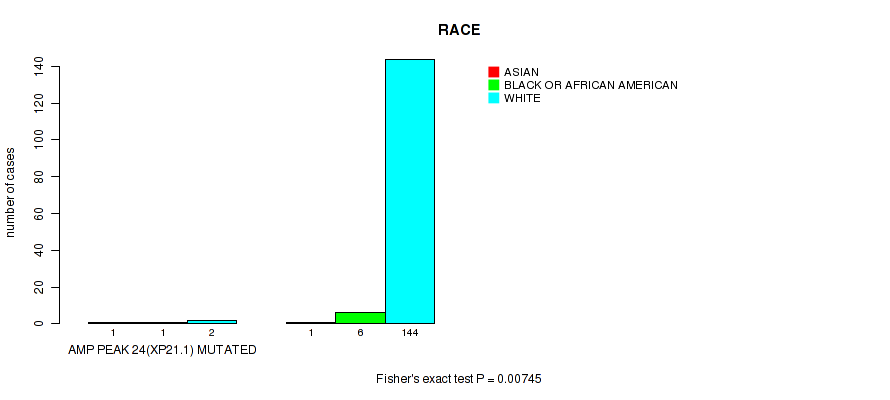
P value = 0.0594 (Wilcoxon-test), Q value = 0.15
Table S162. Gene #25: 'amp_xq21.1' versus Clinical Feature #2: 'YEARS_TO_BIRTH'
| nPatients | Mean (Std.Dev) | |
|---|---|---|
| ALL | 480 | 61.0 (6.8) |
| AMP PEAK 25(XQ21.1) MUTATED | 16 | 64.2 (5.5) |
| AMP PEAK 25(XQ21.1) WILD-TYPE | 464 | 60.9 (6.8) |
Figure S162. Get High-res Image Gene #25: 'amp_xq21.1' versus Clinical Feature #2: 'YEARS_TO_BIRTH'

P value = 0.0432 (Fisher's exact test), Q value = 0.12
Table S163. Gene #25: 'amp_xq21.1' versus Clinical Feature #3: 'PATHOLOGY_T_STAGE'
| nPatients | T2 | T3 | T4 |
|---|---|---|---|
| ALL | 188 | 287 | 10 |
| AMP PEAK 25(XQ21.1) MUTATED | 4 | 10 | 2 |
| AMP PEAK 25(XQ21.1) WILD-TYPE | 184 | 277 | 8 |
Figure S163. Get High-res Image Gene #25: 'amp_xq21.1' versus Clinical Feature #3: 'PATHOLOGY_T_STAGE'
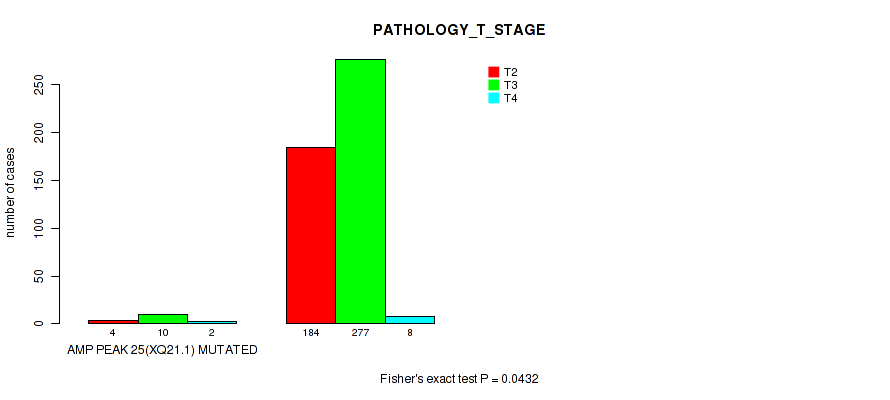
P value = 0.00551 (Wilcoxon-test), Q value = 0.024
Table S164. Gene #25: 'amp_xq21.1' versus Clinical Feature #9: 'GLEASON_SCORE'
| nPatients | Mean (Std.Dev) | |
|---|---|---|
| ALL | 491 | 7.6 (1.0) |
| AMP PEAK 25(XQ21.1) MUTATED | 16 | 8.3 (0.9) |
| AMP PEAK 25(XQ21.1) WILD-TYPE | 475 | 7.6 (1.0) |
Figure S164. Get High-res Image Gene #25: 'amp_xq21.1' versus Clinical Feature #9: 'GLEASON_SCORE'
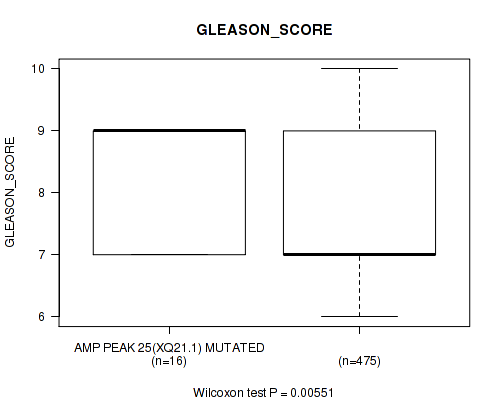
P value = 0.0164 (Wilcoxon-test), Q value = 0.058
Table S165. Gene #26: 'amp_xq21.1' versus Clinical Feature #2: 'YEARS_TO_BIRTH'
| nPatients | Mean (Std.Dev) | |
|---|---|---|
| ALL | 480 | 61.0 (6.8) |
| AMP PEAK 26(XQ21.1) MUTATED | 14 | 65.2 (5.1) |
| AMP PEAK 26(XQ21.1) WILD-TYPE | 466 | 60.8 (6.8) |
Figure S165. Get High-res Image Gene #26: 'amp_xq21.1' versus Clinical Feature #2: 'YEARS_TO_BIRTH'
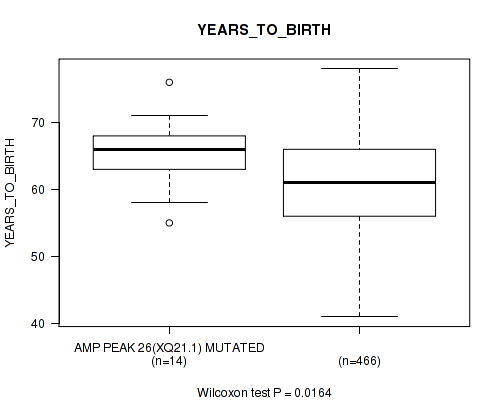
P value = 0.0198 (Fisher's exact test), Q value = 0.068
Table S166. Gene #26: 'amp_xq21.1' versus Clinical Feature #3: 'PATHOLOGY_T_STAGE'
| nPatients | T2 | T3 | T4 |
|---|---|---|---|
| ALL | 188 | 287 | 10 |
| AMP PEAK 26(XQ21.1) MUTATED | 3 | 9 | 2 |
| AMP PEAK 26(XQ21.1) WILD-TYPE | 185 | 278 | 8 |
Figure S166. Get High-res Image Gene #26: 'amp_xq21.1' versus Clinical Feature #3: 'PATHOLOGY_T_STAGE'

P value = 0.0277 (Fisher's exact test), Q value = 0.084
Table S167. Gene #26: 'amp_xq21.1' versus Clinical Feature #4: 'PATHOLOGY_N_STAGE'
| nPatients | 0 | 1 |
|---|---|---|
| ALL | 342 | 77 |
| AMP PEAK 26(XQ21.1) MUTATED | 8 | 6 |
| AMP PEAK 26(XQ21.1) WILD-TYPE | 334 | 71 |
Figure S167. Get High-res Image Gene #26: 'amp_xq21.1' versus Clinical Feature #4: 'PATHOLOGY_N_STAGE'

P value = 0.0798 (Fisher's exact test), Q value = 0.18
Table S168. Gene #26: 'amp_xq21.1' versus Clinical Feature #7: 'RESIDUAL_TUMOR'
| nPatients | R0 | R1 | R2 | RX |
|---|---|---|---|---|
| ALL | 312 | 143 | 5 | 15 |
| AMP PEAK 26(XQ21.1) MUTATED | 7 | 5 | 1 | 1 |
| AMP PEAK 26(XQ21.1) WILD-TYPE | 305 | 138 | 4 | 14 |
Figure S168. Get High-res Image Gene #26: 'amp_xq21.1' versus Clinical Feature #7: 'RESIDUAL_TUMOR'
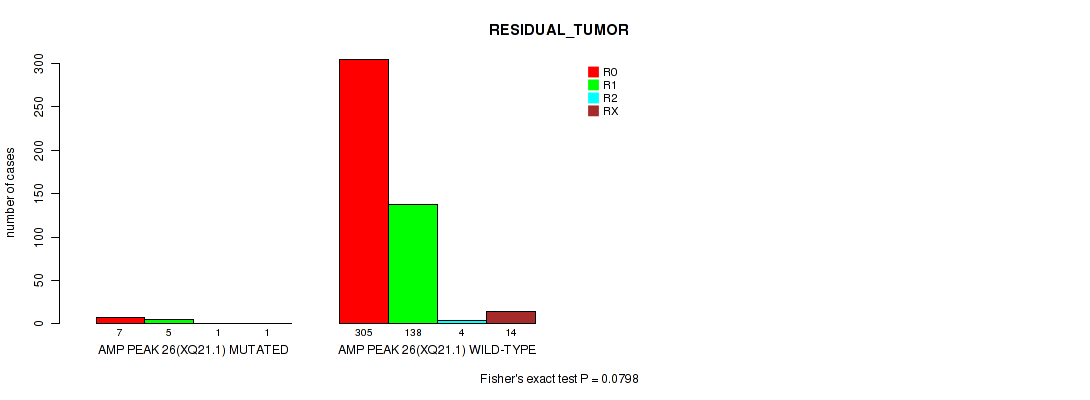
P value = 0.0253 (Wilcoxon-test), Q value = 0.08
Table S169. Gene #26: 'amp_xq21.1' versus Clinical Feature #8: 'NUMBER_OF_LYMPH_NODES'
| nPatients | Mean (Std.Dev) | |
|---|---|---|
| ALL | 401 | 0.4 (1.4) |
| AMP PEAK 26(XQ21.1) MUTATED | 14 | 0.9 (1.7) |
| AMP PEAK 26(XQ21.1) WILD-TYPE | 387 | 0.4 (1.4) |
Figure S169. Get High-res Image Gene #26: 'amp_xq21.1' versus Clinical Feature #8: 'NUMBER_OF_LYMPH_NODES'

P value = 0.00207 (Wilcoxon-test), Q value = 0.012
Table S170. Gene #26: 'amp_xq21.1' versus Clinical Feature #9: 'GLEASON_SCORE'
| nPatients | Mean (Std.Dev) | |
|---|---|---|
| ALL | 491 | 7.6 (1.0) |
| AMP PEAK 26(XQ21.1) MUTATED | 14 | 8.4 (0.9) |
| AMP PEAK 26(XQ21.1) WILD-TYPE | 477 | 7.6 (1.0) |
Figure S170. Get High-res Image Gene #26: 'amp_xq21.1' versus Clinical Feature #9: 'GLEASON_SCORE'
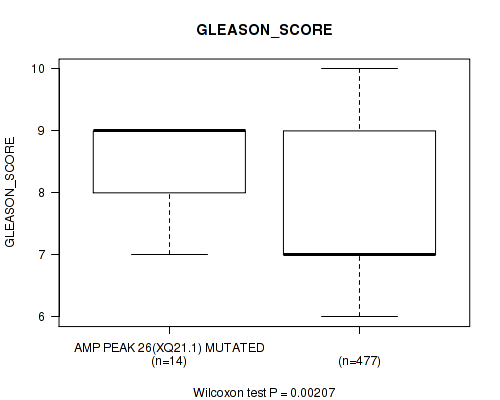
P value = 0.0273 (Fisher's exact test), Q value = 0.084
Table S171. Gene #26: 'amp_xq21.1' versus Clinical Feature #11: 'RACE'
| nPatients | ASIAN | BLACK OR AFRICAN AMERICAN | WHITE |
|---|---|---|---|
| ALL | 2 | 7 | 146 |
| AMP PEAK 26(XQ21.1) MUTATED | 0 | 2 | 3 |
| AMP PEAK 26(XQ21.1) WILD-TYPE | 2 | 5 | 143 |
Figure S171. Get High-res Image Gene #26: 'amp_xq21.1' versus Clinical Feature #11: 'RACE'
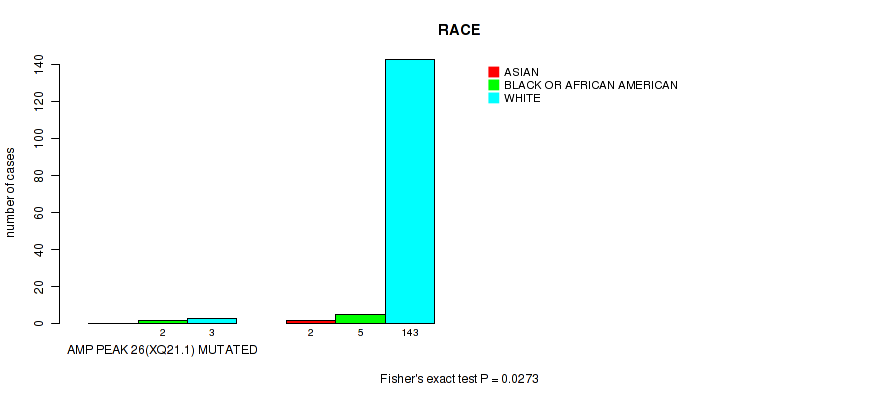
P value = 0.0505 (Fisher's exact test), Q value = 0.13
Table S172. Gene #27: 'amp_xq25' versus Clinical Feature #3: 'PATHOLOGY_T_STAGE'
| nPatients | T2 | T3 | T4 |
|---|---|---|---|
| ALL | 188 | 287 | 10 |
| AMP PEAK 27(XQ25) MUTATED | 5 | 11 | 2 |
| AMP PEAK 27(XQ25) WILD-TYPE | 183 | 276 | 8 |
Figure S172. Get High-res Image Gene #27: 'amp_xq25' versus Clinical Feature #3: 'PATHOLOGY_T_STAGE'
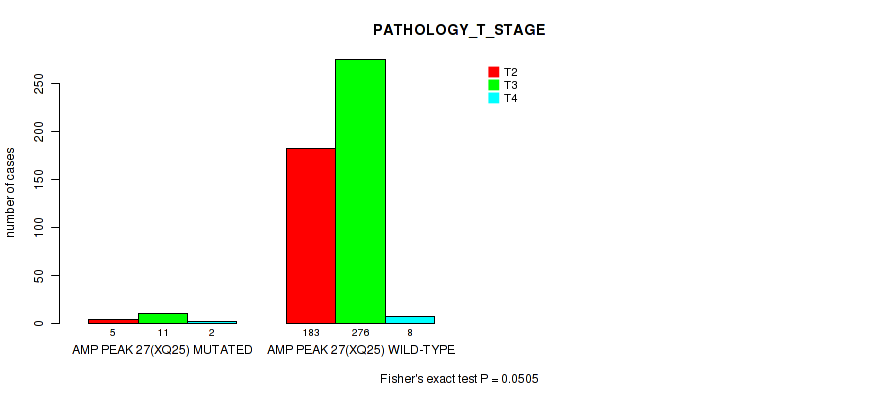
P value = 0.00495 (Wilcoxon-test), Q value = 0.022
Table S173. Gene #27: 'amp_xq25' versus Clinical Feature #9: 'GLEASON_SCORE'
| nPatients | Mean (Std.Dev) | |
|---|---|---|
| ALL | 491 | 7.6 (1.0) |
| AMP PEAK 27(XQ25) MUTATED | 19 | 8.3 (1.0) |
| AMP PEAK 27(XQ25) WILD-TYPE | 472 | 7.6 (1.0) |
Figure S173. Get High-res Image Gene #27: 'amp_xq25' versus Clinical Feature #9: 'GLEASON_SCORE'
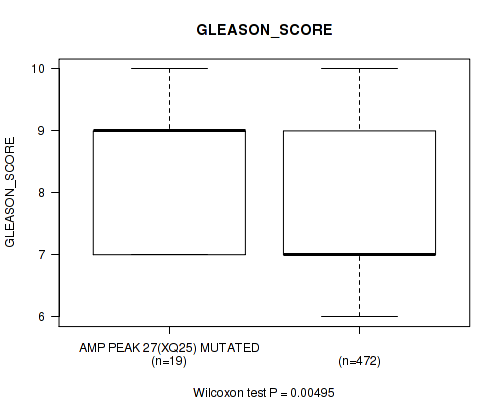
P value = 0.0188 (Fisher's exact test), Q value = 0.065
Table S174. Gene #27: 'amp_xq25' versus Clinical Feature #11: 'RACE'
| nPatients | ASIAN | BLACK OR AFRICAN AMERICAN | WHITE |
|---|---|---|---|
| ALL | 2 | 7 | 146 |
| AMP PEAK 27(XQ25) MUTATED | 1 | 1 | 4 |
| AMP PEAK 27(XQ25) WILD-TYPE | 1 | 6 | 142 |
Figure S174. Get High-res Image Gene #27: 'amp_xq25' versus Clinical Feature #11: 'RACE'
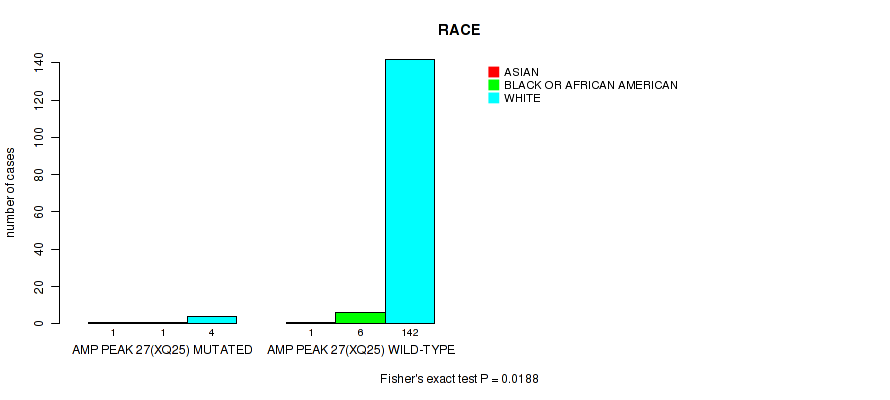
P value = 0.0216 (Wilcoxon-test), Q value = 0.071
Table S175. Gene #28: 'amp_xq27.1' versus Clinical Feature #2: 'YEARS_TO_BIRTH'
| nPatients | Mean (Std.Dev) | |
|---|---|---|
| ALL | 480 | 61.0 (6.8) |
| AMP PEAK 28(XQ27.1) MUTATED | 19 | 64.2 (7.1) |
| AMP PEAK 28(XQ27.1) WILD-TYPE | 461 | 60.8 (6.8) |
Figure S175. Get High-res Image Gene #28: 'amp_xq27.1' versus Clinical Feature #2: 'YEARS_TO_BIRTH'

P value = 0.0774 (Fisher's exact test), Q value = 0.18
Table S176. Gene #28: 'amp_xq27.1' versus Clinical Feature #3: 'PATHOLOGY_T_STAGE'
| nPatients | T2 | T3 | T4 |
|---|---|---|---|
| ALL | 188 | 287 | 10 |
| AMP PEAK 28(XQ27.1) MUTATED | 6 | 10 | 2 |
| AMP PEAK 28(XQ27.1) WILD-TYPE | 182 | 277 | 8 |
Figure S176. Get High-res Image Gene #28: 'amp_xq27.1' versus Clinical Feature #3: 'PATHOLOGY_T_STAGE'
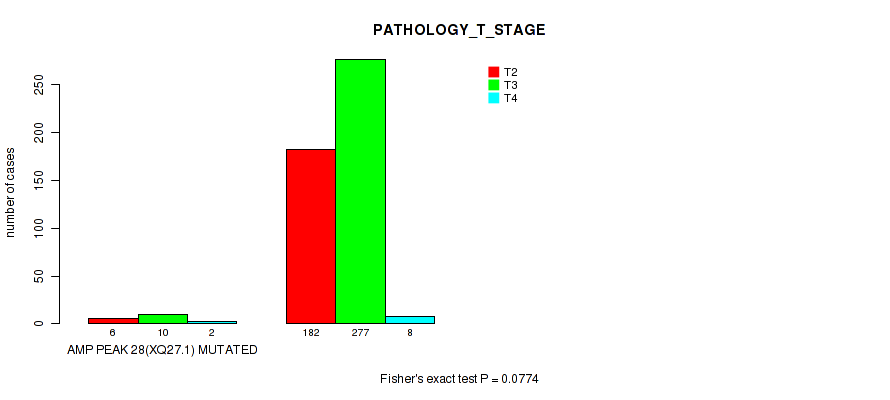
P value = 0.0371 (Wilcoxon-test), Q value = 0.1
Table S177. Gene #28: 'amp_xq27.1' versus Clinical Feature #9: 'GLEASON_SCORE'
| nPatients | Mean (Std.Dev) | |
|---|---|---|
| ALL | 491 | 7.6 (1.0) |
| AMP PEAK 28(XQ27.1) MUTATED | 19 | 8.1 (1.0) |
| AMP PEAK 28(XQ27.1) WILD-TYPE | 472 | 7.6 (1.0) |
Figure S177. Get High-res Image Gene #28: 'amp_xq27.1' versus Clinical Feature #9: 'GLEASON_SCORE'
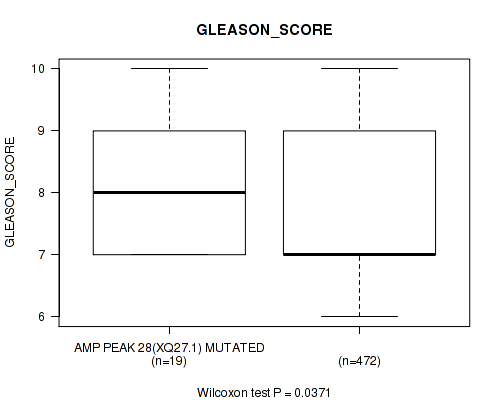
P value = 0.114 (Wilcoxon-test), Q value = 0.24
Table S178. Gene #28: 'amp_xq27.1' versus Clinical Feature #10: 'PSA_VALUE'
| nPatients | Mean (Std.Dev) | |
|---|---|---|
| ALL | 434 | 1.8 (16.0) |
| AMP PEAK 28(XQ27.1) MUTATED | 17 | 19.7 (78.2) |
| AMP PEAK 28(XQ27.1) WILD-TYPE | 417 | 1.1 (4.2) |
Figure S178. Get High-res Image Gene #28: 'amp_xq27.1' versus Clinical Feature #10: 'PSA_VALUE'

P value = 0.00955 (Fisher's exact test), Q value = 0.039
Table S179. Gene #29: 'del_1p31.3' versus Clinical Feature #3: 'PATHOLOGY_T_STAGE'
| nPatients | T2 | T3 | T4 |
|---|---|---|---|
| ALL | 188 | 287 | 10 |
| DEL PEAK 1(1P31.3) MUTATED | 13 | 44 | 2 |
| DEL PEAK 1(1P31.3) WILD-TYPE | 175 | 243 | 8 |
Figure S179. Get High-res Image Gene #29: 'del_1p31.3' versus Clinical Feature #3: 'PATHOLOGY_T_STAGE'

P value = 0.0294 (Fisher's exact test), Q value = 0.087
Table S180. Gene #29: 'del_1p31.3' versus Clinical Feature #5: 'RADIATION_THERAPY'
| nPatients | NO | YES |
|---|---|---|
| ALL | 378 | 57 |
| DEL PEAK 1(1P31.3) MUTATED | 40 | 12 |
| DEL PEAK 1(1P31.3) WILD-TYPE | 338 | 45 |
Figure S180. Get High-res Image Gene #29: 'del_1p31.3' versus Clinical Feature #5: 'RADIATION_THERAPY'
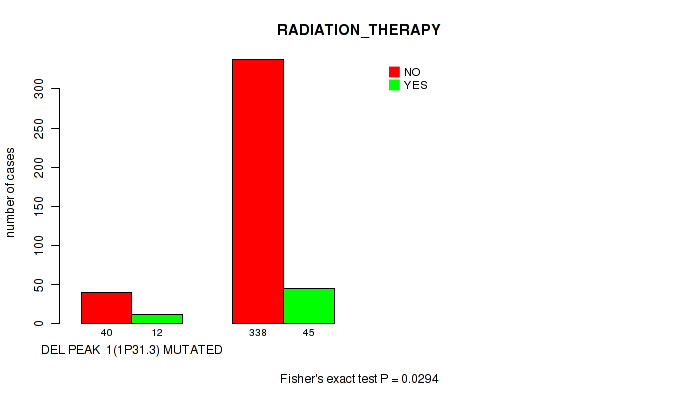
P value = 0.0701 (Fisher's exact test), Q value = 0.16
Table S181. Gene #29: 'del_1p31.3' versus Clinical Feature #7: 'RESIDUAL_TUMOR'
| nPatients | R0 | R1 | R2 | RX |
|---|---|---|---|---|
| ALL | 312 | 143 | 5 | 15 |
| DEL PEAK 1(1P31.3) MUTATED | 30 | 25 | 1 | 2 |
| DEL PEAK 1(1P31.3) WILD-TYPE | 282 | 118 | 4 | 13 |
Figure S181. Get High-res Image Gene #29: 'del_1p31.3' versus Clinical Feature #7: 'RESIDUAL_TUMOR'

P value = 0.0989 (Wilcoxon-test), Q value = 0.21
Table S182. Gene #29: 'del_1p31.3' versus Clinical Feature #8: 'NUMBER_OF_LYMPH_NODES'
| nPatients | Mean (Std.Dev) | |
|---|---|---|
| ALL | 401 | 0.4 (1.4) |
| DEL PEAK 1(1P31.3) MUTATED | 51 | 0.5 (1.1) |
| DEL PEAK 1(1P31.3) WILD-TYPE | 350 | 0.4 (1.4) |
Figure S182. Get High-res Image Gene #29: 'del_1p31.3' versus Clinical Feature #8: 'NUMBER_OF_LYMPH_NODES'

P value = 0.000205 (Wilcoxon-test), Q value = 0.002
Table S183. Gene #29: 'del_1p31.3' versus Clinical Feature #9: 'GLEASON_SCORE'
| nPatients | Mean (Std.Dev) | |
|---|---|---|
| ALL | 491 | 7.6 (1.0) |
| DEL PEAK 1(1P31.3) MUTATED | 59 | 8.1 (1.1) |
| DEL PEAK 1(1P31.3) WILD-TYPE | 432 | 7.5 (1.0) |
Figure S183. Get High-res Image Gene #29: 'del_1p31.3' versus Clinical Feature #9: 'GLEASON_SCORE'

P value = 0.00267 (Fisher's exact test), Q value = 0.014
Table S184. Gene #30: 'del_1p22.1' versus Clinical Feature #3: 'PATHOLOGY_T_STAGE'
| nPatients | T2 | T3 | T4 |
|---|---|---|---|
| ALL | 188 | 287 | 10 |
| DEL PEAK 2(1P22.1) MUTATED | 11 | 44 | 2 |
| DEL PEAK 2(1P22.1) WILD-TYPE | 177 | 243 | 8 |
Figure S184. Get High-res Image Gene #30: 'del_1p22.1' versus Clinical Feature #3: 'PATHOLOGY_T_STAGE'
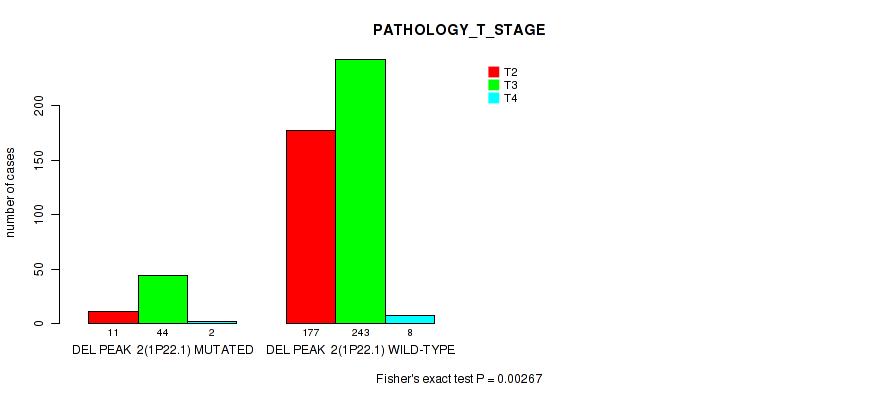
P value = 0.0911 (Fisher's exact test), Q value = 0.2
Table S185. Gene #30: 'del_1p22.1' versus Clinical Feature #7: 'RESIDUAL_TUMOR'
| nPatients | R0 | R1 | R2 | RX |
|---|---|---|---|---|
| ALL | 312 | 143 | 5 | 15 |
| DEL PEAK 2(1P22.1) MUTATED | 29 | 20 | 0 | 4 |
| DEL PEAK 2(1P22.1) WILD-TYPE | 283 | 123 | 5 | 11 |
Figure S185. Get High-res Image Gene #30: 'del_1p22.1' versus Clinical Feature #7: 'RESIDUAL_TUMOR'
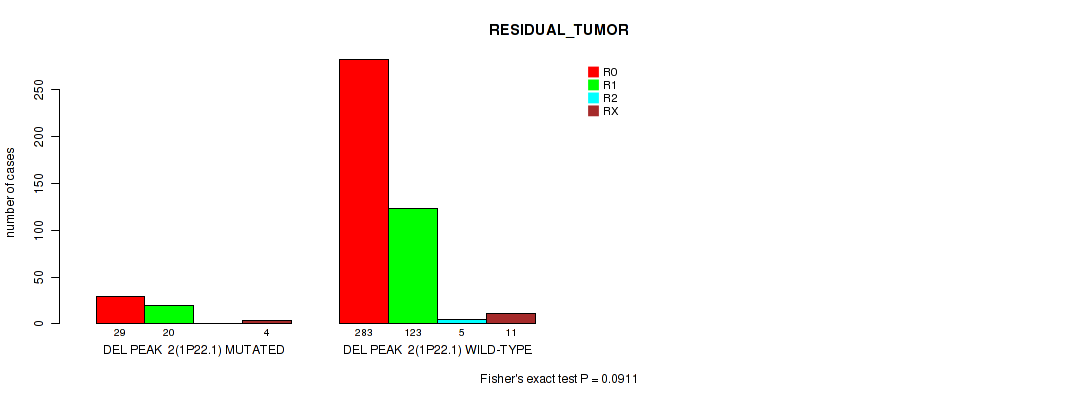
P value = 0.0435 (Wilcoxon-test), Q value = 0.12
Table S186. Gene #30: 'del_1p22.1' versus Clinical Feature #8: 'NUMBER_OF_LYMPH_NODES'
| nPatients | Mean (Std.Dev) | |
|---|---|---|
| ALL | 401 | 0.4 (1.4) |
| DEL PEAK 2(1P22.1) MUTATED | 47 | 0.6 (1.3) |
| DEL PEAK 2(1P22.1) WILD-TYPE | 354 | 0.4 (1.4) |
Figure S186. Get High-res Image Gene #30: 'del_1p22.1' versus Clinical Feature #8: 'NUMBER_OF_LYMPH_NODES'

P value = 0.000132 (Wilcoxon-test), Q value = 0.0015
Table S187. Gene #30: 'del_1p22.1' versus Clinical Feature #9: 'GLEASON_SCORE'
| nPatients | Mean (Std.Dev) | |
|---|---|---|
| ALL | 491 | 7.6 (1.0) |
| DEL PEAK 2(1P22.1) MUTATED | 58 | 8.1 (1.0) |
| DEL PEAK 2(1P22.1) WILD-TYPE | 433 | 7.5 (1.0) |
Figure S187. Get High-res Image Gene #30: 'del_1p22.1' versus Clinical Feature #9: 'GLEASON_SCORE'
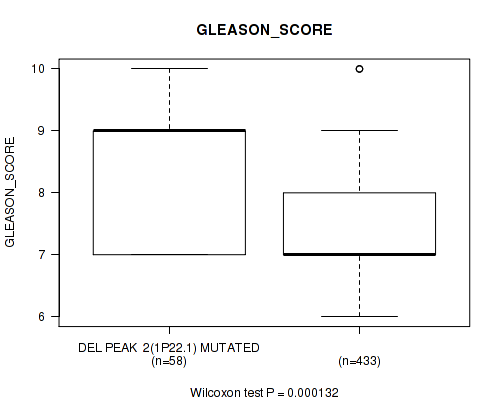
P value = 0.000102 (logrank test), Q value = 0.0012
Table S188. Gene #32: 'del_1q42.3' versus Clinical Feature #1: 'Time to Death'
| nPatients | nDeath | Duration Range (Median), Month | |
|---|---|---|---|
| ALL | 489 | 9 | 0.7 - 165.2 (28.8) |
| DEL PEAK 4(1Q42.3) MUTATED | 47 | 5 | 0.7 - 122.2 (28.5) |
| DEL PEAK 4(1Q42.3) WILD-TYPE | 442 | 4 | 0.8 - 165.2 (29.3) |
Figure S188. Get High-res Image Gene #32: 'del_1q42.3' versus Clinical Feature #1: 'Time to Death'
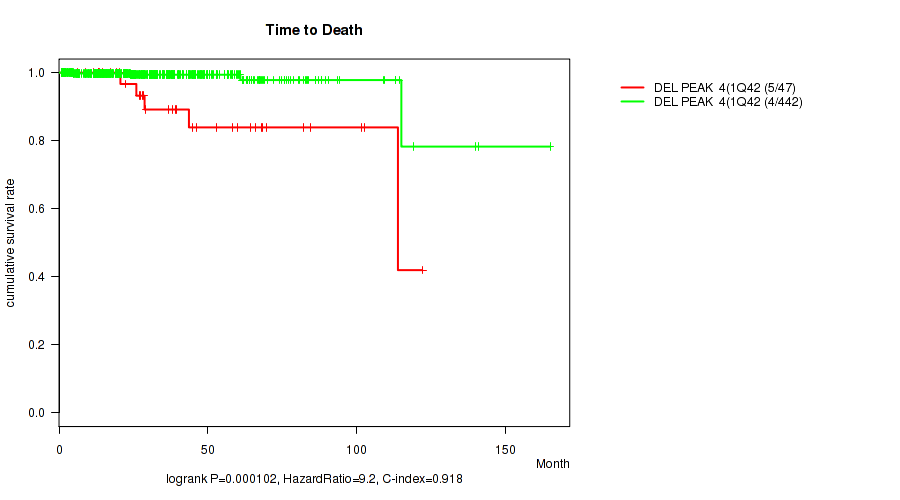
P value = 0.115 (Wilcoxon-test), Q value = 0.24
Table S189. Gene #32: 'del_1q42.3' versus Clinical Feature #2: 'YEARS_TO_BIRTH'
| nPatients | Mean (Std.Dev) | |
|---|---|---|
| ALL | 480 | 61.0 (6.8) |
| DEL PEAK 4(1Q42.3) MUTATED | 47 | 62.4 (6.3) |
| DEL PEAK 4(1Q42.3) WILD-TYPE | 433 | 60.8 (6.8) |
Figure S189. Get High-res Image Gene #32: 'del_1q42.3' versus Clinical Feature #2: 'YEARS_TO_BIRTH'
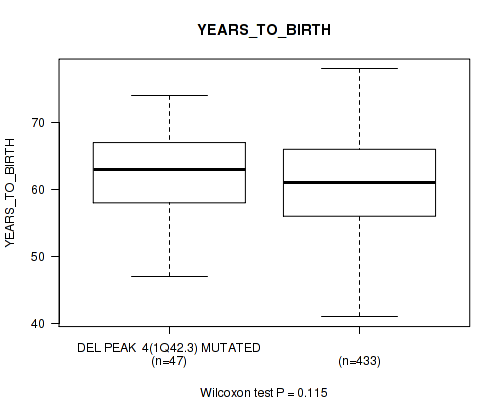
P value = 0.0104 (Fisher's exact test), Q value = 0.042
Table S190. Gene #32: 'del_1q42.3' versus Clinical Feature #7: 'RESIDUAL_TUMOR'
| nPatients | R0 | R1 | R2 | RX |
|---|---|---|---|---|
| ALL | 312 | 143 | 5 | 15 |
| DEL PEAK 4(1Q42.3) MUTATED | 20 | 23 | 0 | 2 |
| DEL PEAK 4(1Q42.3) WILD-TYPE | 292 | 120 | 5 | 13 |
Figure S190. Get High-res Image Gene #32: 'del_1q42.3' versus Clinical Feature #7: 'RESIDUAL_TUMOR'

P value = 0.0679 (Wilcoxon-test), Q value = 0.16
Table S191. Gene #32: 'del_1q42.3' versus Clinical Feature #9: 'GLEASON_SCORE'
| nPatients | Mean (Std.Dev) | |
|---|---|---|
| ALL | 491 | 7.6 (1.0) |
| DEL PEAK 4(1Q42.3) MUTATED | 47 | 7.9 (1.0) |
| DEL PEAK 4(1Q42.3) WILD-TYPE | 444 | 7.6 (1.0) |
Figure S191. Get High-res Image Gene #32: 'del_1q42.3' versus Clinical Feature #9: 'GLEASON_SCORE'

P value = 0.0926 (Wilcoxon-test), Q value = 0.2
Table S192. Gene #32: 'del_1q42.3' versus Clinical Feature #10: 'PSA_VALUE'
| nPatients | Mean (Std.Dev) | |
|---|---|---|
| ALL | 434 | 1.8 (16.0) |
| DEL PEAK 4(1Q42.3) MUTATED | 39 | 2.5 (7.3) |
| DEL PEAK 4(1Q42.3) WILD-TYPE | 395 | 1.7 (16.6) |
Figure S192. Get High-res Image Gene #32: 'del_1q42.3' versus Clinical Feature #10: 'PSA_VALUE'

P value = 0.00035 (Fisher's exact test), Q value = 0.0031
Table S193. Gene #33: 'del_2p21' versus Clinical Feature #3: 'PATHOLOGY_T_STAGE'
| nPatients | T2 | T3 | T4 |
|---|---|---|---|
| ALL | 188 | 287 | 10 |
| DEL PEAK 5(2P21) MUTATED | 7 | 35 | 3 |
| DEL PEAK 5(2P21) WILD-TYPE | 181 | 252 | 7 |
Figure S193. Get High-res Image Gene #33: 'del_2p21' versus Clinical Feature #3: 'PATHOLOGY_T_STAGE'
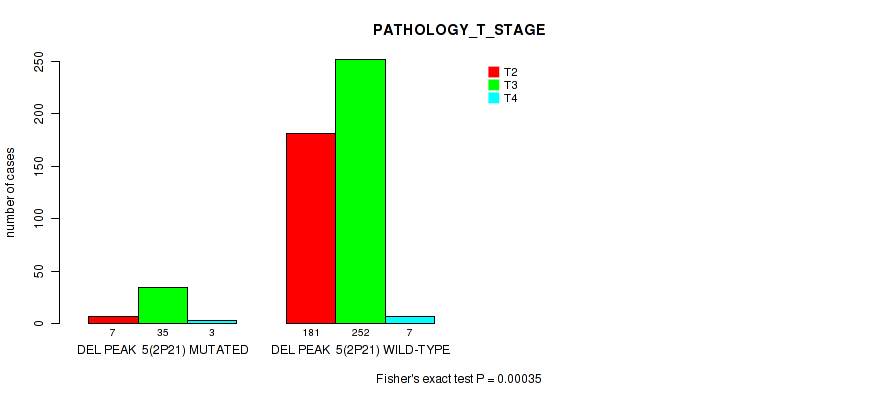
P value = 0.0585 (Fisher's exact test), Q value = 0.15
Table S194. Gene #33: 'del_2p21' versus Clinical Feature #4: 'PATHOLOGY_N_STAGE'
| nPatients | 0 | 1 |
|---|---|---|
| ALL | 342 | 77 |
| DEL PEAK 5(2P21) MUTATED | 30 | 13 |
| DEL PEAK 5(2P21) WILD-TYPE | 312 | 64 |
Figure S194. Get High-res Image Gene #33: 'del_2p21' versus Clinical Feature #4: 'PATHOLOGY_N_STAGE'
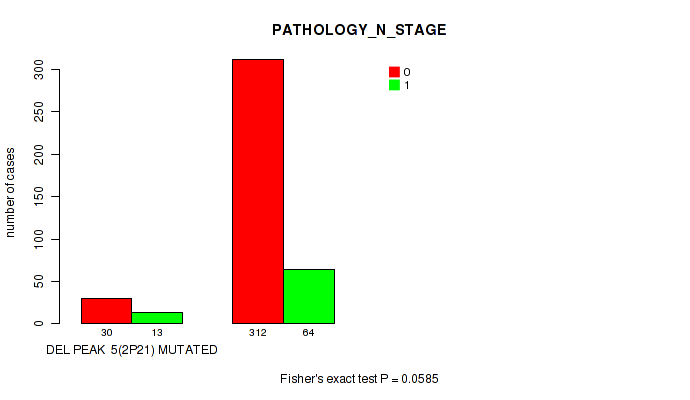
P value = 0.0506 (Fisher's exact test), Q value = 0.13
Table S195. Gene #33: 'del_2p21' versus Clinical Feature #7: 'RESIDUAL_TUMOR'
| nPatients | R0 | R1 | R2 | RX |
|---|---|---|---|---|
| ALL | 312 | 143 | 5 | 15 |
| DEL PEAK 5(2P21) MUTATED | 21 | 19 | 1 | 2 |
| DEL PEAK 5(2P21) WILD-TYPE | 291 | 124 | 4 | 13 |
Figure S195. Get High-res Image Gene #33: 'del_2p21' versus Clinical Feature #7: 'RESIDUAL_TUMOR'

P value = 0.0554 (Wilcoxon-test), Q value = 0.14
Table S196. Gene #33: 'del_2p21' versus Clinical Feature #8: 'NUMBER_OF_LYMPH_NODES'
| nPatients | Mean (Std.Dev) | |
|---|---|---|
| ALL | 401 | 0.4 (1.4) |
| DEL PEAK 5(2P21) MUTATED | 42 | 0.6 (1.3) |
| DEL PEAK 5(2P21) WILD-TYPE | 359 | 0.4 (1.4) |
Figure S196. Get High-res Image Gene #33: 'del_2p21' versus Clinical Feature #8: 'NUMBER_OF_LYMPH_NODES'
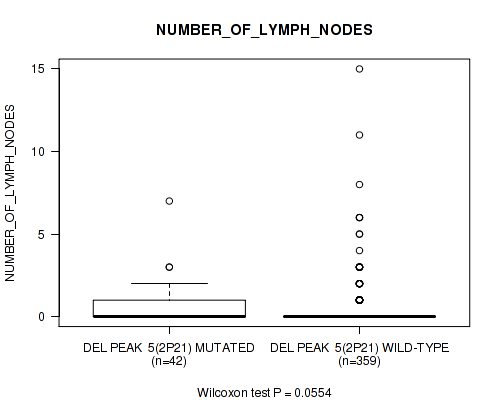
P value = 0.003 (Wilcoxon-test), Q value = 0.015
Table S197. Gene #33: 'del_2p21' versus Clinical Feature #9: 'GLEASON_SCORE'
| nPatients | Mean (Std.Dev) | |
|---|---|---|
| ALL | 491 | 7.6 (1.0) |
| DEL PEAK 5(2P21) MUTATED | 45 | 8.0 (1.0) |
| DEL PEAK 5(2P21) WILD-TYPE | 446 | 7.6 (1.0) |
Figure S197. Get High-res Image Gene #33: 'del_2p21' versus Clinical Feature #9: 'GLEASON_SCORE'
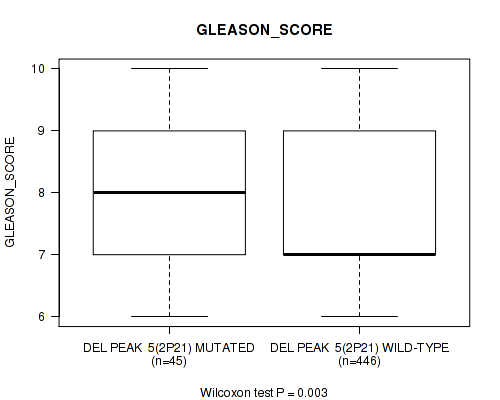
P value = 2.24e-05 (Wilcoxon-test), Q value = 0.00032
Table S198. Gene #34: 'del_2q22.1' versus Clinical Feature #2: 'YEARS_TO_BIRTH'
| nPatients | Mean (Std.Dev) | |
|---|---|---|
| ALL | 480 | 61.0 (6.8) |
| DEL PEAK 6(2Q22.1) MUTATED | 90 | 63.6 (5.8) |
| DEL PEAK 6(2Q22.1) WILD-TYPE | 390 | 60.4 (6.9) |
Figure S198. Get High-res Image Gene #34: 'del_2q22.1' versus Clinical Feature #2: 'YEARS_TO_BIRTH'
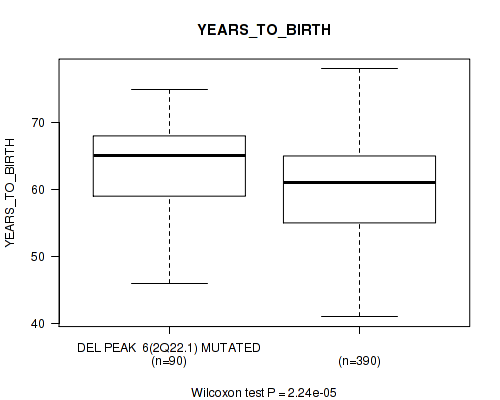
P value = 0.0135 (Wilcoxon-test), Q value = 0.05
Table S199. Gene #34: 'del_2q22.1' versus Clinical Feature #9: 'GLEASON_SCORE'
| nPatients | Mean (Std.Dev) | |
|---|---|---|
| ALL | 491 | 7.6 (1.0) |
| DEL PEAK 6(2Q22.1) MUTATED | 91 | 7.8 (1.0) |
| DEL PEAK 6(2Q22.1) WILD-TYPE | 400 | 7.6 (1.0) |
Figure S199. Get High-res Image Gene #34: 'del_2q22.1' versus Clinical Feature #9: 'GLEASON_SCORE'

P value = 0.00332 (Wilcoxon-test), Q value = 0.016
Table S200. Gene #35: 'del_2q22.3' versus Clinical Feature #2: 'YEARS_TO_BIRTH'
| nPatients | Mean (Std.Dev) | |
|---|---|---|
| ALL | 480 | 61.0 (6.8) |
| DEL PEAK 7(2Q22.3) MUTATED | 83 | 62.9 (6.5) |
| DEL PEAK 7(2Q22.3) WILD-TYPE | 397 | 60.6 (6.8) |
Figure S200. Get High-res Image Gene #35: 'del_2q22.3' versus Clinical Feature #2: 'YEARS_TO_BIRTH'

P value = 0.0947 (Wilcoxon-test), Q value = 0.21
Table S201. Gene #35: 'del_2q22.3' versus Clinical Feature #9: 'GLEASON_SCORE'
| nPatients | Mean (Std.Dev) | |
|---|---|---|
| ALL | 491 | 7.6 (1.0) |
| DEL PEAK 7(2Q22.3) MUTATED | 84 | 7.8 (1.1) |
| DEL PEAK 7(2Q22.3) WILD-TYPE | 407 | 7.6 (1.0) |
Figure S201. Get High-res Image Gene #35: 'del_2q22.3' versus Clinical Feature #9: 'GLEASON_SCORE'
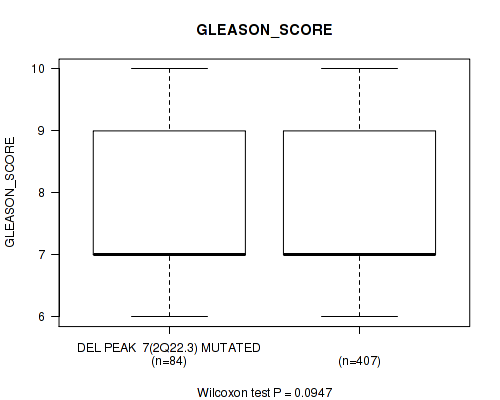
P value = 0.0513 (Wilcoxon-test), Q value = 0.13
Table S202. Gene #36: 'del_3p13' versus Clinical Feature #2: 'YEARS_TO_BIRTH'
| nPatients | Mean (Std.Dev) | |
|---|---|---|
| ALL | 480 | 61.0 (6.8) |
| DEL PEAK 8(3P13) MUTATED | 78 | 59.7 (7.4) |
| DEL PEAK 8(3P13) WILD-TYPE | 402 | 61.2 (6.7) |
Figure S202. Get High-res Image Gene #36: 'del_3p13' versus Clinical Feature #2: 'YEARS_TO_BIRTH'
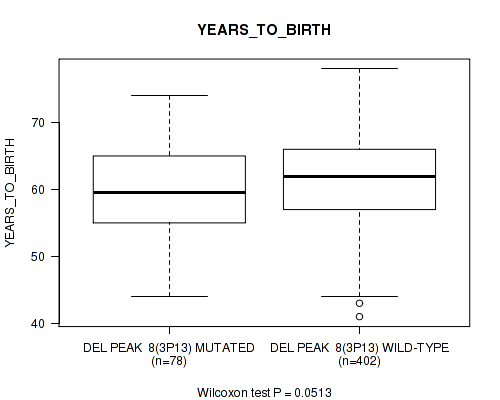
P value = 0.114 (Fisher's exact test), Q value = 0.24
Table S203. Gene #36: 'del_3p13' versus Clinical Feature #5: 'RADIATION_THERAPY'
| nPatients | NO | YES |
|---|---|---|
| ALL | 378 | 57 |
| DEL PEAK 8(3P13) MUTATED | 54 | 13 |
| DEL PEAK 8(3P13) WILD-TYPE | 324 | 44 |
Figure S203. Get High-res Image Gene #36: 'del_3p13' versus Clinical Feature #5: 'RADIATION_THERAPY'
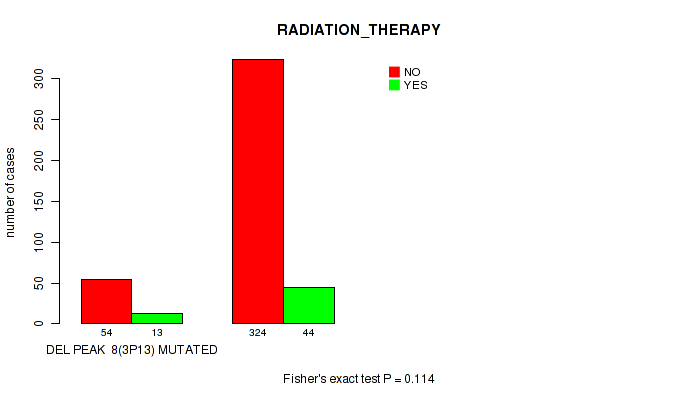
P value = 0.109 (Wilcoxon-test), Q value = 0.23
Table S204. Gene #37: 'del_3q29' versus Clinical Feature #9: 'GLEASON_SCORE'
| nPatients | Mean (Std.Dev) | |
|---|---|---|
| ALL | 491 | 7.6 (1.0) |
| DEL PEAK 9(3Q29) MUTATED | 32 | 7.9 (1.1) |
| DEL PEAK 9(3Q29) WILD-TYPE | 459 | 7.6 (1.0) |
Figure S204. Get High-res Image Gene #37: 'del_3q29' versus Clinical Feature #9: 'GLEASON_SCORE'
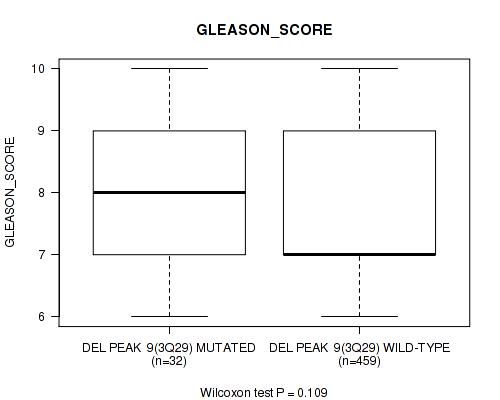
P value = 0.00158 (Wilcoxon-test), Q value = 0.0094
Table S205. Gene #38: 'del_4q28.2' versus Clinical Feature #2: 'YEARS_TO_BIRTH'
| nPatients | Mean (Std.Dev) | |
|---|---|---|
| ALL | 480 | 61.0 (6.8) |
| DEL PEAK 10(4Q28.2) MUTATED | 49 | 63.9 (6.0) |
| DEL PEAK 10(4Q28.2) WILD-TYPE | 431 | 60.6 (6.8) |
Figure S205. Get High-res Image Gene #38: 'del_4q28.2' versus Clinical Feature #2: 'YEARS_TO_BIRTH'

P value = 0.0595 (Fisher's exact test), Q value = 0.15
Table S206. Gene #38: 'del_4q28.2' versus Clinical Feature #3: 'PATHOLOGY_T_STAGE'
| nPatients | T2 | T3 | T4 |
|---|---|---|---|
| ALL | 188 | 287 | 10 |
| DEL PEAK 10(4Q28.2) MUTATED | 15 | 32 | 3 |
| DEL PEAK 10(4Q28.2) WILD-TYPE | 173 | 255 | 7 |
Figure S206. Get High-res Image Gene #38: 'del_4q28.2' versus Clinical Feature #3: 'PATHOLOGY_T_STAGE'
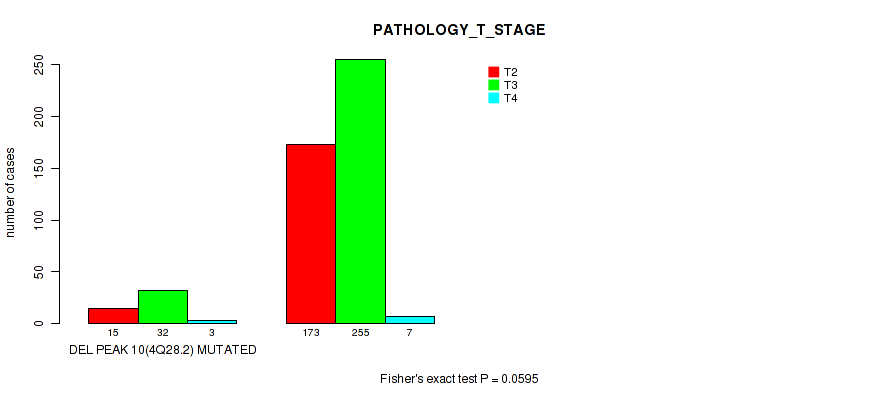
P value = 0.11 (Fisher's exact test), Q value = 0.23
Table S207. Gene #38: 'del_4q28.2' versus Clinical Feature #5: 'RADIATION_THERAPY'
| nPatients | NO | YES |
|---|---|---|
| ALL | 378 | 57 |
| DEL PEAK 10(4Q28.2) MUTATED | 38 | 10 |
| DEL PEAK 10(4Q28.2) WILD-TYPE | 340 | 47 |
Figure S207. Get High-res Image Gene #38: 'del_4q28.2' versus Clinical Feature #5: 'RADIATION_THERAPY'

P value = 0.000761 (Wilcoxon-test), Q value = 0.0052
Table S208. Gene #38: 'del_4q28.2' versus Clinical Feature #9: 'GLEASON_SCORE'
| nPatients | Mean (Std.Dev) | |
|---|---|---|
| ALL | 491 | 7.6 (1.0) |
| DEL PEAK 10(4Q28.2) MUTATED | 50 | 8.1 (1.0) |
| DEL PEAK 10(4Q28.2) WILD-TYPE | 441 | 7.6 (1.0) |
Figure S208. Get High-res Image Gene #38: 'del_4q28.2' versus Clinical Feature #9: 'GLEASON_SCORE'
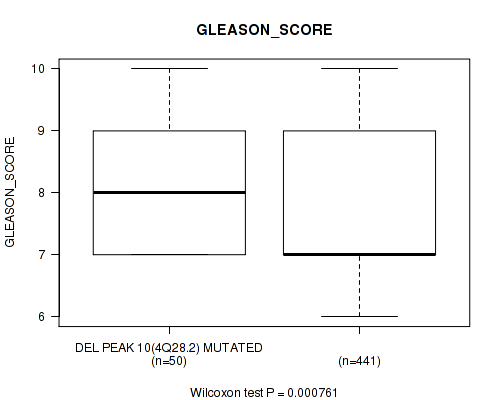
P value = 0.0257 (Wilcoxon-test), Q value = 0.081
Table S209. Gene #39: 'del_5q11.2' versus Clinical Feature #2: 'YEARS_TO_BIRTH'
| nPatients | Mean (Std.Dev) | |
|---|---|---|
| ALL | 480 | 61.0 (6.8) |
| DEL PEAK 11(5Q11.2) MUTATED | 99 | 62.4 (6.3) |
| DEL PEAK 11(5Q11.2) WILD-TYPE | 381 | 60.6 (6.9) |
Figure S209. Get High-res Image Gene #39: 'del_5q11.2' versus Clinical Feature #2: 'YEARS_TO_BIRTH'
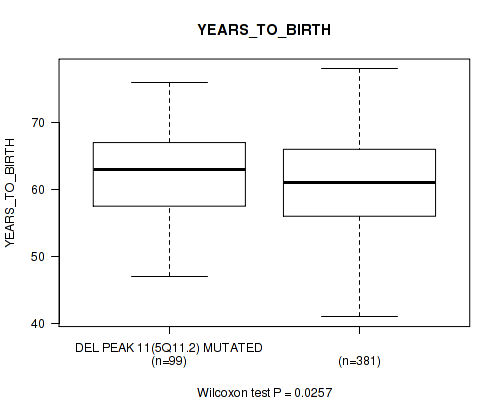
P value = 1e-05 (Fisher's exact test), Q value = 0.00016
Table S210. Gene #39: 'del_5q11.2' versus Clinical Feature #3: 'PATHOLOGY_T_STAGE'
| nPatients | T2 | T3 | T4 |
|---|---|---|---|
| ALL | 188 | 287 | 10 |
| DEL PEAK 11(5Q11.2) MUTATED | 16 | 76 | 5 |
| DEL PEAK 11(5Q11.2) WILD-TYPE | 172 | 211 | 5 |
Figure S210. Get High-res Image Gene #39: 'del_5q11.2' versus Clinical Feature #3: 'PATHOLOGY_T_STAGE'

P value = 0.000371 (Fisher's exact test), Q value = 0.0032
Table S211. Gene #39: 'del_5q11.2' versus Clinical Feature #4: 'PATHOLOGY_N_STAGE'
| nPatients | 0 | 1 |
|---|---|---|
| ALL | 342 | 77 |
| DEL PEAK 11(5Q11.2) MUTATED | 62 | 29 |
| DEL PEAK 11(5Q11.2) WILD-TYPE | 280 | 48 |
Figure S211. Get High-res Image Gene #39: 'del_5q11.2' versus Clinical Feature #4: 'PATHOLOGY_N_STAGE'
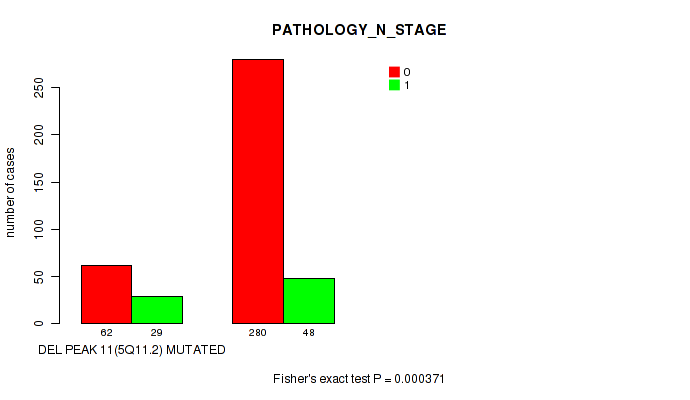
P value = 0.00766 (Fisher's exact test), Q value = 0.032
Table S212. Gene #39: 'del_5q11.2' versus Clinical Feature #5: 'RADIATION_THERAPY'
| nPatients | NO | YES |
|---|---|---|
| ALL | 378 | 57 |
| DEL PEAK 11(5Q11.2) MUTATED | 70 | 20 |
| DEL PEAK 11(5Q11.2) WILD-TYPE | 308 | 37 |
Figure S212. Get High-res Image Gene #39: 'del_5q11.2' versus Clinical Feature #5: 'RADIATION_THERAPY'
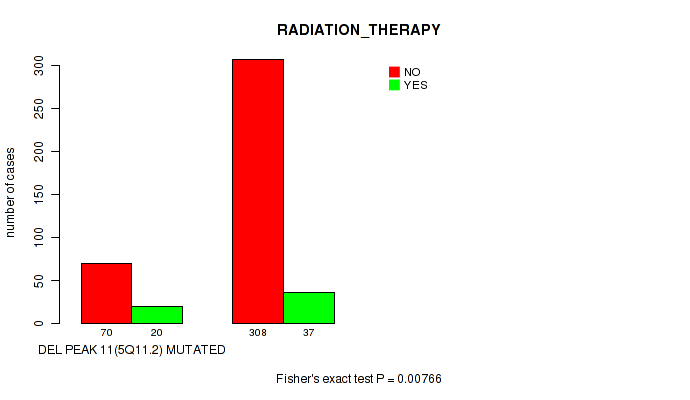
P value = 0.0283 (Fisher's exact test), Q value = 0.086
Table S213. Gene #39: 'del_5q11.2' versus Clinical Feature #7: 'RESIDUAL_TUMOR'
| nPatients | R0 | R1 | R2 | RX |
|---|---|---|---|---|
| ALL | 312 | 143 | 5 | 15 |
| DEL PEAK 11(5Q11.2) MUTATED | 50 | 39 | 1 | 4 |
| DEL PEAK 11(5Q11.2) WILD-TYPE | 262 | 104 | 4 | 11 |
Figure S213. Get High-res Image Gene #39: 'del_5q11.2' versus Clinical Feature #7: 'RESIDUAL_TUMOR'

P value = 1.49e-05 (Wilcoxon-test), Q value = 0.00023
Table S214. Gene #39: 'del_5q11.2' versus Clinical Feature #8: 'NUMBER_OF_LYMPH_NODES'
| nPatients | Mean (Std.Dev) | |
|---|---|---|
| ALL | 401 | 0.4 (1.4) |
| DEL PEAK 11(5Q11.2) MUTATED | 83 | 1.0 (2.2) |
| DEL PEAK 11(5Q11.2) WILD-TYPE | 318 | 0.3 (1.0) |
Figure S214. Get High-res Image Gene #39: 'del_5q11.2' versus Clinical Feature #8: 'NUMBER_OF_LYMPH_NODES'
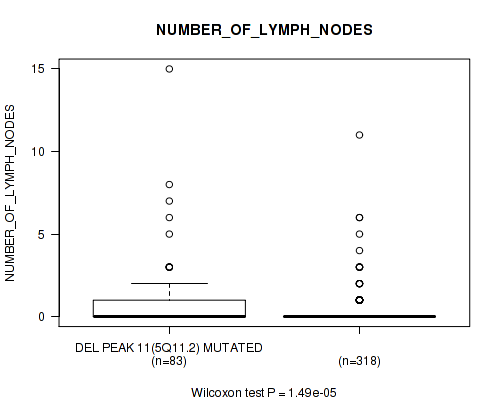
P value = 5.05e-10 (Wilcoxon-test), Q value = 5.2e-08
Table S215. Gene #39: 'del_5q11.2' versus Clinical Feature #9: 'GLEASON_SCORE'
| nPatients | Mean (Std.Dev) | |
|---|---|---|
| ALL | 491 | 7.6 (1.0) |
| DEL PEAK 11(5Q11.2) MUTATED | 99 | 8.2 (1.0) |
| DEL PEAK 11(5Q11.2) WILD-TYPE | 392 | 7.5 (1.0) |
Figure S215. Get High-res Image Gene #39: 'del_5q11.2' versus Clinical Feature #9: 'GLEASON_SCORE'
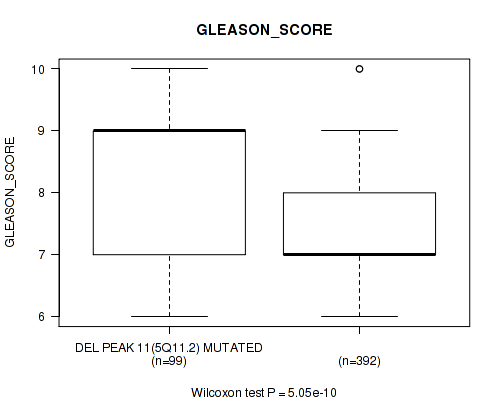
P value = 1e-05 (Fisher's exact test), Q value = 0.00016
Table S216. Gene #40: 'del_5q13.2' versus Clinical Feature #3: 'PATHOLOGY_T_STAGE'
| nPatients | T2 | T3 | T4 |
|---|---|---|---|
| ALL | 188 | 287 | 10 |
| DEL PEAK 12(5Q13.2) MUTATED | 15 | 77 | 5 |
| DEL PEAK 12(5Q13.2) WILD-TYPE | 173 | 210 | 5 |
Figure S216. Get High-res Image Gene #40: 'del_5q13.2' versus Clinical Feature #3: 'PATHOLOGY_T_STAGE'
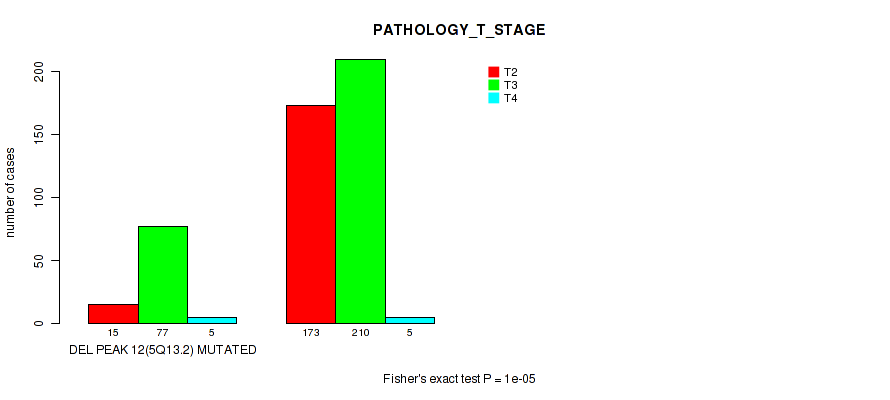
P value = 0.0214 (Fisher's exact test), Q value = 0.071
Table S217. Gene #40: 'del_5q13.2' versus Clinical Feature #4: 'PATHOLOGY_N_STAGE'
| nPatients | 0 | 1 |
|---|---|---|
| ALL | 342 | 77 |
| DEL PEAK 12(5Q13.2) MUTATED | 67 | 25 |
| DEL PEAK 12(5Q13.2) WILD-TYPE | 275 | 52 |
Figure S217. Get High-res Image Gene #40: 'del_5q13.2' versus Clinical Feature #4: 'PATHOLOGY_N_STAGE'
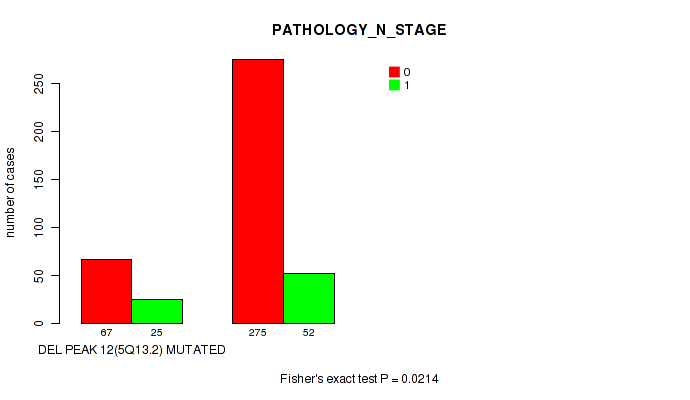
P value = 0.0338 (Fisher's exact test), Q value = 0.097
Table S218. Gene #40: 'del_5q13.2' versus Clinical Feature #5: 'RADIATION_THERAPY'
| nPatients | NO | YES |
|---|---|---|
| ALL | 378 | 57 |
| DEL PEAK 12(5Q13.2) MUTATED | 71 | 18 |
| DEL PEAK 12(5Q13.2) WILD-TYPE | 307 | 39 |
Figure S218. Get High-res Image Gene #40: 'del_5q13.2' versus Clinical Feature #5: 'RADIATION_THERAPY'

P value = 0.00266 (Wilcoxon-test), Q value = 0.014
Table S219. Gene #40: 'del_5q13.2' versus Clinical Feature #8: 'NUMBER_OF_LYMPH_NODES'
| nPatients | Mean (Std.Dev) | |
|---|---|---|
| ALL | 401 | 0.4 (1.4) |
| DEL PEAK 12(5Q13.2) MUTATED | 84 | 1.0 (2.5) |
| DEL PEAK 12(5Q13.2) WILD-TYPE | 317 | 0.3 (0.8) |
Figure S219. Get High-res Image Gene #40: 'del_5q13.2' versus Clinical Feature #8: 'NUMBER_OF_LYMPH_NODES'
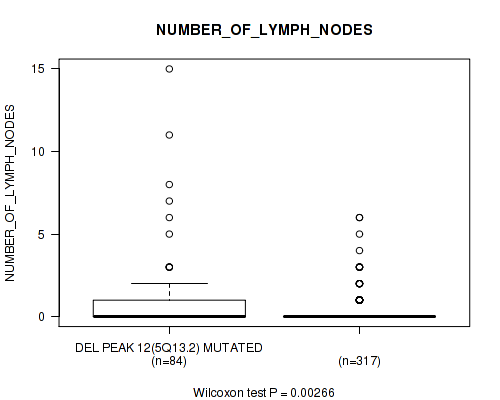
P value = 1.03e-08 (Wilcoxon-test), Q value = 6.2e-07
Table S220. Gene #40: 'del_5q13.2' versus Clinical Feature #9: 'GLEASON_SCORE'
| nPatients | Mean (Std.Dev) | |
|---|---|---|
| ALL | 491 | 7.6 (1.0) |
| DEL PEAK 12(5Q13.2) MUTATED | 98 | 8.1 (1.0) |
| DEL PEAK 12(5Q13.2) WILD-TYPE | 393 | 7.5 (1.0) |
Figure S220. Get High-res Image Gene #40: 'del_5q13.2' versus Clinical Feature #9: 'GLEASON_SCORE'
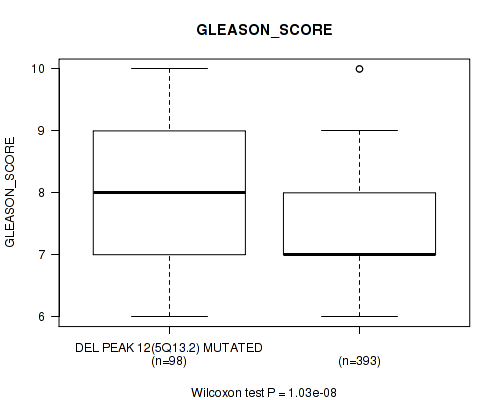
P value = 0.0567 (Wilcoxon-test), Q value = 0.14
Table S221. Gene #41: 'del_5q21.1' versus Clinical Feature #2: 'YEARS_TO_BIRTH'
| nPatients | Mean (Std.Dev) | |
|---|---|---|
| ALL | 480 | 61.0 (6.8) |
| DEL PEAK 13(5Q21.1) MUTATED | 107 | 62.1 (6.0) |
| DEL PEAK 13(5Q21.1) WILD-TYPE | 373 | 60.6 (7.0) |
Figure S221. Get High-res Image Gene #41: 'del_5q21.1' versus Clinical Feature #2: 'YEARS_TO_BIRTH'

P value = 0.0258 (Fisher's exact test), Q value = 0.081
Table S222. Gene #41: 'del_5q21.1' versus Clinical Feature #3: 'PATHOLOGY_T_STAGE'
| nPatients | T2 | T3 | T4 |
|---|---|---|---|
| ALL | 188 | 287 | 10 |
| DEL PEAK 13(5Q21.1) MUTATED | 30 | 74 | 3 |
| DEL PEAK 13(5Q21.1) WILD-TYPE | 158 | 213 | 7 |
Figure S222. Get High-res Image Gene #41: 'del_5q21.1' versus Clinical Feature #3: 'PATHOLOGY_T_STAGE'
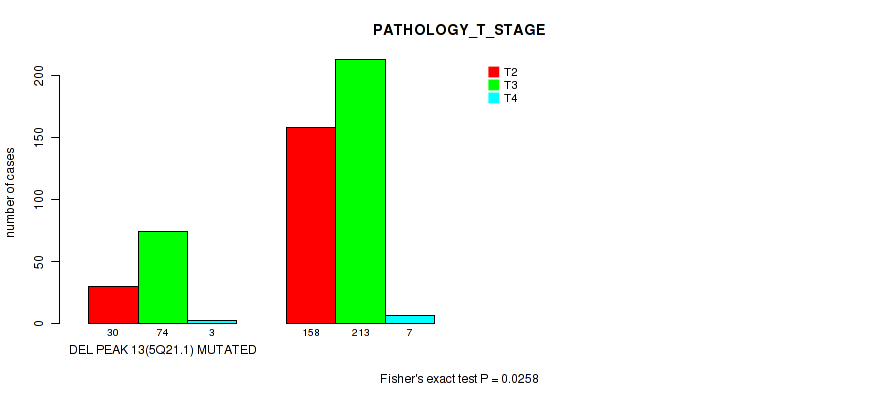
P value = 0.00185 (Wilcoxon-test), Q value = 0.011
Table S223. Gene #41: 'del_5q21.1' versus Clinical Feature #9: 'GLEASON_SCORE'
| nPatients | Mean (Std.Dev) | |
|---|---|---|
| ALL | 491 | 7.6 (1.0) |
| DEL PEAK 13(5Q21.1) MUTATED | 108 | 7.9 (1.0) |
| DEL PEAK 13(5Q21.1) WILD-TYPE | 383 | 7.5 (1.0) |
Figure S223. Get High-res Image Gene #41: 'del_5q21.1' versus Clinical Feature #9: 'GLEASON_SCORE'
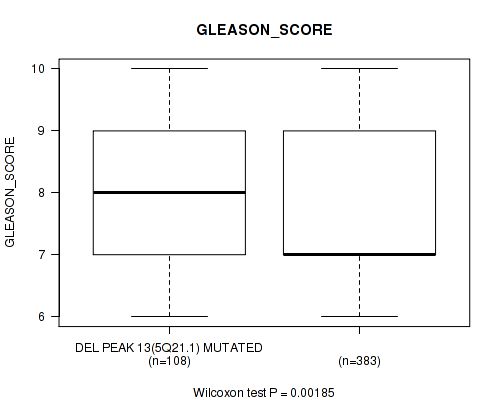
P value = 0.0755 (Wilcoxon-test), Q value = 0.17
Table S224. Gene #41: 'del_5q21.1' versus Clinical Feature #10: 'PSA_VALUE'
| nPatients | Mean (Std.Dev) | |
|---|---|---|
| ALL | 434 | 1.8 (16.0) |
| DEL PEAK 13(5Q21.1) MUTATED | 92 | 5.1 (34.0) |
| DEL PEAK 13(5Q21.1) WILD-TYPE | 342 | 0.9 (3.6) |
Figure S224. Get High-res Image Gene #41: 'del_5q21.1' versus Clinical Feature #10: 'PSA_VALUE'
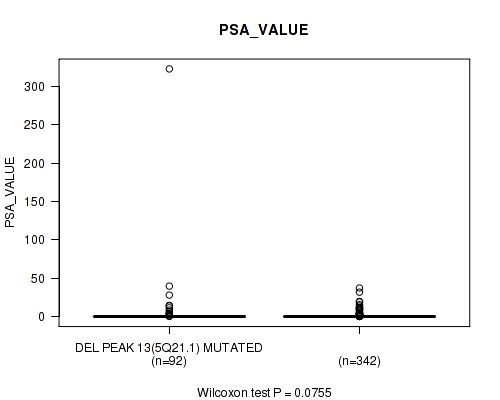
P value = 0.0095 (Fisher's exact test), Q value = 0.039
Table S225. Gene #42: 'del_6p25.1' versus Clinical Feature #3: 'PATHOLOGY_T_STAGE'
| nPatients | T2 | T3 | T4 |
|---|---|---|---|
| ALL | 188 | 287 | 10 |
| DEL PEAK 14(6P25.1) MUTATED | 10 | 31 | 3 |
| DEL PEAK 14(6P25.1) WILD-TYPE | 178 | 256 | 7 |
Figure S225. Get High-res Image Gene #42: 'del_6p25.1' versus Clinical Feature #3: 'PATHOLOGY_T_STAGE'

P value = 0.00605 (Fisher's exact test), Q value = 0.026
Table S226. Gene #42: 'del_6p25.1' versus Clinical Feature #4: 'PATHOLOGY_N_STAGE'
| nPatients | 0 | 1 |
|---|---|---|
| ALL | 342 | 77 |
| DEL PEAK 14(6P25.1) MUTATED | 28 | 15 |
| DEL PEAK 14(6P25.1) WILD-TYPE | 314 | 62 |
Figure S226. Get High-res Image Gene #42: 'del_6p25.1' versus Clinical Feature #4: 'PATHOLOGY_N_STAGE'
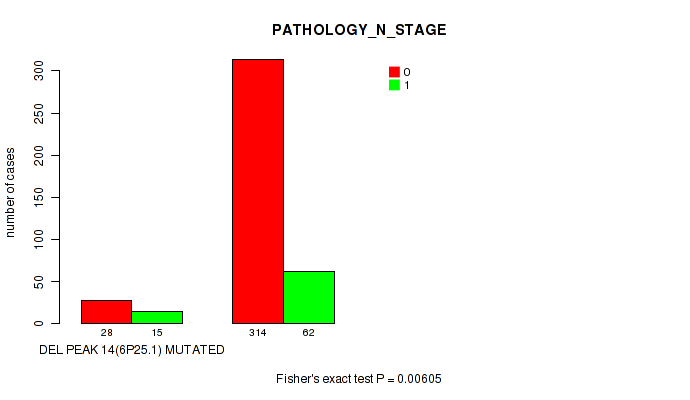
P value = 0.00157 (Wilcoxon-test), Q value = 0.0094
Table S227. Gene #42: 'del_6p25.1' versus Clinical Feature #8: 'NUMBER_OF_LYMPH_NODES'
| nPatients | Mean (Std.Dev) | |
|---|---|---|
| ALL | 401 | 0.4 (1.4) |
| DEL PEAK 14(6P25.1) MUTATED | 39 | 0.6 (1.0) |
| DEL PEAK 14(6P25.1) WILD-TYPE | 362 | 0.4 (1.4) |
Figure S227. Get High-res Image Gene #42: 'del_6p25.1' versus Clinical Feature #8: 'NUMBER_OF_LYMPH_NODES'

P value = 8.2e-06 (Wilcoxon-test), Q value = 0.00016
Table S228. Gene #42: 'del_6p25.1' versus Clinical Feature #9: 'GLEASON_SCORE'
| nPatients | Mean (Std.Dev) | |
|---|---|---|
| ALL | 491 | 7.6 (1.0) |
| DEL PEAK 14(6P25.1) MUTATED | 46 | 8.2 (0.9) |
| DEL PEAK 14(6P25.1) WILD-TYPE | 445 | 7.5 (1.0) |
Figure S228. Get High-res Image Gene #42: 'del_6p25.1' versus Clinical Feature #9: 'GLEASON_SCORE'
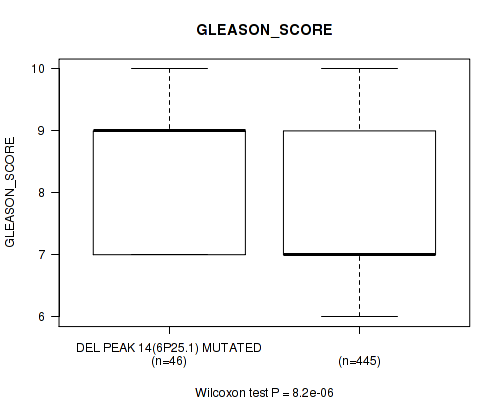
P value = 0.00664 (Fisher's exact test), Q value = 0.028
Table S229. Gene #42: 'del_6p25.1' versus Clinical Feature #11: 'RACE'
| nPatients | ASIAN | BLACK OR AFRICAN AMERICAN | WHITE |
|---|---|---|---|
| ALL | 2 | 7 | 146 |
| DEL PEAK 14(6P25.1) MUTATED | 2 | 1 | 11 |
| DEL PEAK 14(6P25.1) WILD-TYPE | 0 | 6 | 135 |
Figure S229. Get High-res Image Gene #42: 'del_6p25.1' versus Clinical Feature #11: 'RACE'
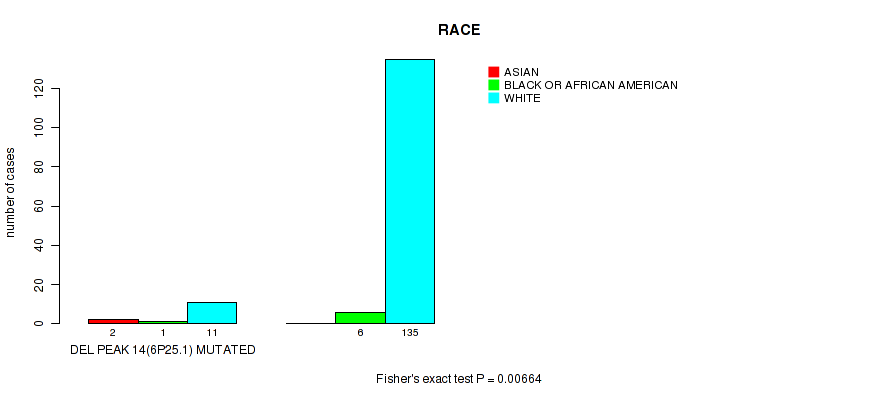
P value = 0.00104 (Wilcoxon-test), Q value = 0.0068
Table S230. Gene #43: 'del_6q14.3' versus Clinical Feature #2: 'YEARS_TO_BIRTH'
| nPatients | Mean (Std.Dev) | |
|---|---|---|
| ALL | 480 | 61.0 (6.8) |
| DEL PEAK 15(6Q14.3) MUTATED | 175 | 62.3 (6.3) |
| DEL PEAK 15(6Q14.3) WILD-TYPE | 305 | 60.2 (6.9) |
Figure S230. Get High-res Image Gene #43: 'del_6q14.3' versus Clinical Feature #2: 'YEARS_TO_BIRTH'
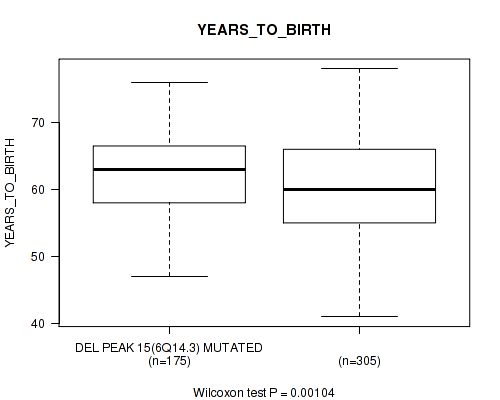
P value = 0.0666 (Fisher's exact test), Q value = 0.16
Table S231. Gene #43: 'del_6q14.3' versus Clinical Feature #3: 'PATHOLOGY_T_STAGE'
| nPatients | T2 | T3 | T4 |
|---|---|---|---|
| ALL | 188 | 287 | 10 |
| DEL PEAK 15(6Q14.3) MUTATED | 57 | 114 | 5 |
| DEL PEAK 15(6Q14.3) WILD-TYPE | 131 | 173 | 5 |
Figure S231. Get High-res Image Gene #43: 'del_6q14.3' versus Clinical Feature #3: 'PATHOLOGY_T_STAGE'
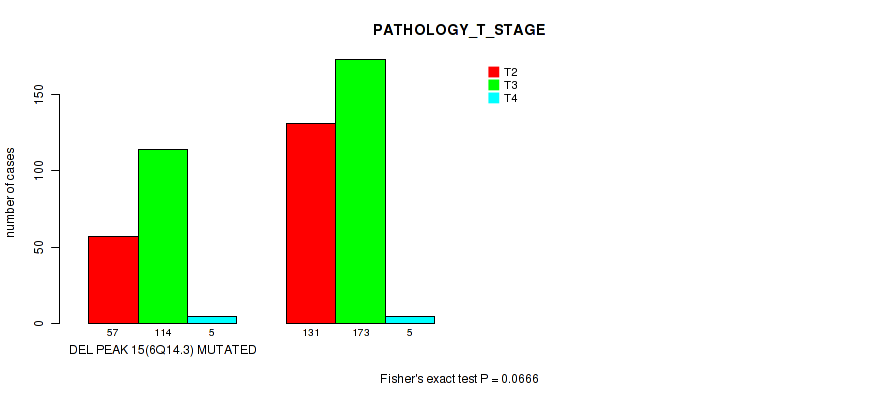
P value = 0.0265 (Fisher's exact test), Q value = 0.082
Table S232. Gene #43: 'del_6q14.3' versus Clinical Feature #4: 'PATHOLOGY_N_STAGE'
| nPatients | 0 | 1 |
|---|---|---|
| ALL | 342 | 77 |
| DEL PEAK 15(6Q14.3) MUTATED | 120 | 38 |
| DEL PEAK 15(6Q14.3) WILD-TYPE | 222 | 39 |
Figure S232. Get High-res Image Gene #43: 'del_6q14.3' versus Clinical Feature #4: 'PATHOLOGY_N_STAGE'
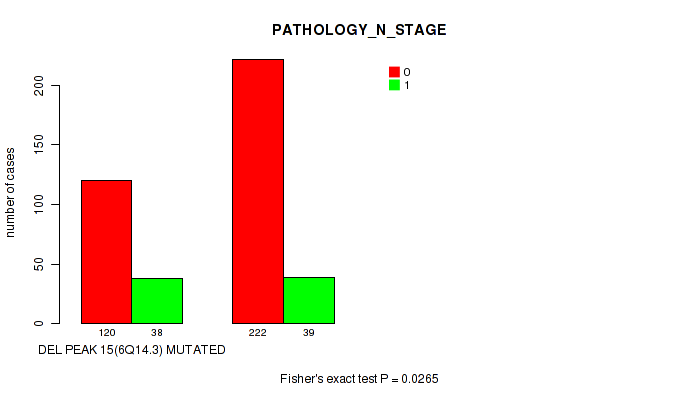
P value = 0.00044 (Fisher's exact test), Q value = 0.0037
Table S233. Gene #43: 'del_6q14.3' versus Clinical Feature #7: 'RESIDUAL_TUMOR'
| nPatients | R0 | R1 | R2 | RX |
|---|---|---|---|---|
| ALL | 312 | 143 | 5 | 15 |
| DEL PEAK 15(6Q14.3) MUTATED | 93 | 65 | 2 | 10 |
| DEL PEAK 15(6Q14.3) WILD-TYPE | 219 | 78 | 3 | 5 |
Figure S233. Get High-res Image Gene #43: 'del_6q14.3' versus Clinical Feature #7: 'RESIDUAL_TUMOR'
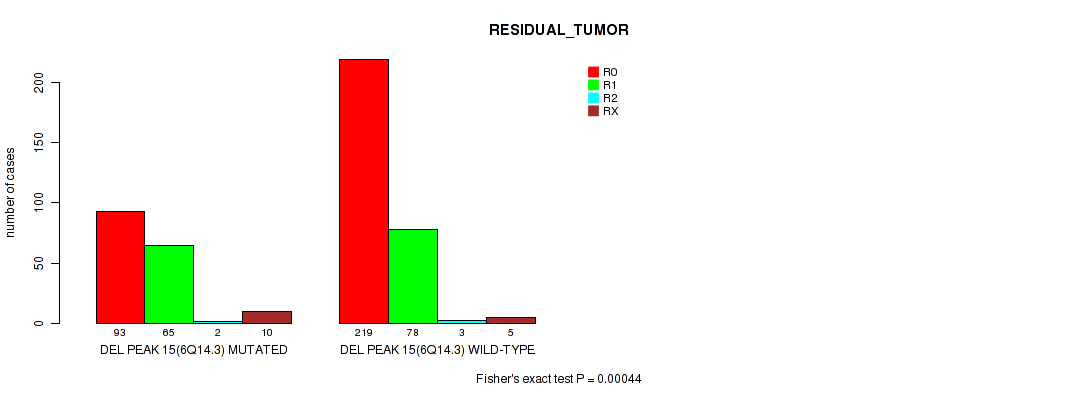
P value = 0.018 (Wilcoxon-test), Q value = 0.063
Table S234. Gene #43: 'del_6q14.3' versus Clinical Feature #8: 'NUMBER_OF_LYMPH_NODES'
| nPatients | Mean (Std.Dev) | |
|---|---|---|
| ALL | 401 | 0.4 (1.4) |
| DEL PEAK 15(6Q14.3) MUTATED | 152 | 0.5 (1.2) |
| DEL PEAK 15(6Q14.3) WILD-TYPE | 249 | 0.4 (1.4) |
Figure S234. Get High-res Image Gene #43: 'del_6q14.3' versus Clinical Feature #8: 'NUMBER_OF_LYMPH_NODES'
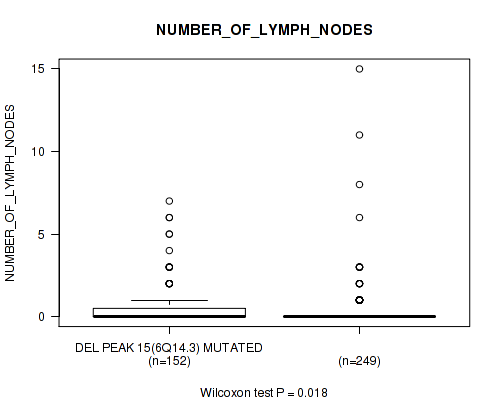
P value = 0.000445 (Wilcoxon-test), Q value = 0.0037
Table S235. Gene #43: 'del_6q14.3' versus Clinical Feature #9: 'GLEASON_SCORE'
| nPatients | Mean (Std.Dev) | |
|---|---|---|
| ALL | 491 | 7.6 (1.0) |
| DEL PEAK 15(6Q14.3) MUTATED | 179 | 7.8 (1.0) |
| DEL PEAK 15(6Q14.3) WILD-TYPE | 312 | 7.5 (1.0) |
Figure S235. Get High-res Image Gene #43: 'del_6q14.3' versus Clinical Feature #9: 'GLEASON_SCORE'

P value = 0.104 (Fisher's exact test), Q value = 0.22
Table S236. Gene #44: 'del_7q31.33' versus Clinical Feature #4: 'PATHOLOGY_N_STAGE'
| nPatients | 0 | 1 |
|---|---|---|
| ALL | 342 | 77 |
| DEL PEAK 16(7Q31.33) MUTATED | 17 | 8 |
| DEL PEAK 16(7Q31.33) WILD-TYPE | 325 | 69 |
Figure S236. Get High-res Image Gene #44: 'del_7q31.33' versus Clinical Feature #4: 'PATHOLOGY_N_STAGE'

P value = 0.037 (Wilcoxon-test), Q value = 0.1
Table S237. Gene #44: 'del_7q31.33' versus Clinical Feature #8: 'NUMBER_OF_LYMPH_NODES'
| nPatients | Mean (Std.Dev) | |
|---|---|---|
| ALL | 401 | 0.4 (1.4) |
| DEL PEAK 16(7Q31.33) MUTATED | 23 | 0.8 (1.5) |
| DEL PEAK 16(7Q31.33) WILD-TYPE | 378 | 0.4 (1.4) |
Figure S237. Get High-res Image Gene #44: 'del_7q31.33' versus Clinical Feature #8: 'NUMBER_OF_LYMPH_NODES'

P value = 0.0924 (Wilcoxon-test), Q value = 0.2
Table S238. Gene #44: 'del_7q31.33' versus Clinical Feature #9: 'GLEASON_SCORE'
| nPatients | Mean (Std.Dev) | |
|---|---|---|
| ALL | 491 | 7.6 (1.0) |
| DEL PEAK 16(7Q31.33) MUTATED | 28 | 7.9 (1.1) |
| DEL PEAK 16(7Q31.33) WILD-TYPE | 463 | 7.6 (1.0) |
Figure S238. Get High-res Image Gene #44: 'del_7q31.33' versus Clinical Feature #9: 'GLEASON_SCORE'
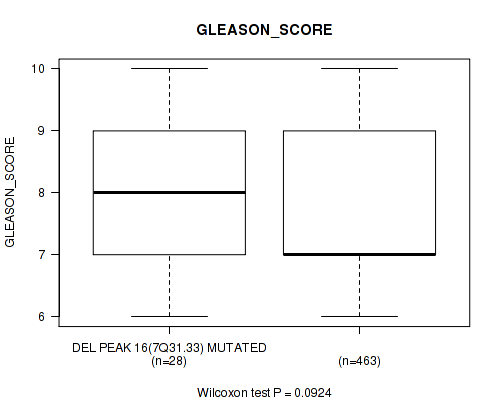
P value = 1e-05 (Fisher's exact test), Q value = 0.00016
Table S239. Gene #45: 'del_8p23.2' versus Clinical Feature #3: 'PATHOLOGY_T_STAGE'
| nPatients | T2 | T3 | T4 |
|---|---|---|---|
| ALL | 188 | 287 | 10 |
| DEL PEAK 17(8P23.2) MUTATED | 57 | 158 | 6 |
| DEL PEAK 17(8P23.2) WILD-TYPE | 131 | 129 | 4 |
Figure S239. Get High-res Image Gene #45: 'del_8p23.2' versus Clinical Feature #3: 'PATHOLOGY_T_STAGE'
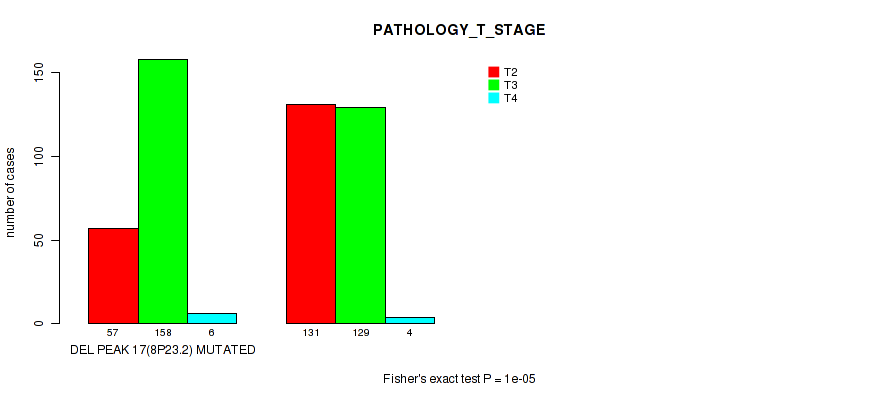
P value = 0.0112 (Fisher's exact test), Q value = 0.043
Table S240. Gene #45: 'del_8p23.2' versus Clinical Feature #4: 'PATHOLOGY_N_STAGE'
| nPatients | 0 | 1 |
|---|---|---|
| ALL | 342 | 77 |
| DEL PEAK 17(8P23.2) MUTATED | 148 | 46 |
| DEL PEAK 17(8P23.2) WILD-TYPE | 194 | 31 |
Figure S240. Get High-res Image Gene #45: 'del_8p23.2' versus Clinical Feature #4: 'PATHOLOGY_N_STAGE'

P value = 0.00532 (Wilcoxon-test), Q value = 0.023
Table S241. Gene #45: 'del_8p23.2' versus Clinical Feature #8: 'NUMBER_OF_LYMPH_NODES'
| nPatients | Mean (Std.Dev) | |
|---|---|---|
| ALL | 401 | 0.4 (1.4) |
| DEL PEAK 17(8P23.2) MUTATED | 185 | 0.6 (1.6) |
| DEL PEAK 17(8P23.2) WILD-TYPE | 216 | 0.3 (1.1) |
Figure S241. Get High-res Image Gene #45: 'del_8p23.2' versus Clinical Feature #8: 'NUMBER_OF_LYMPH_NODES'
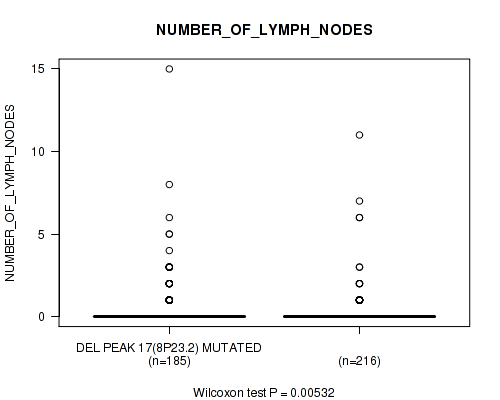
P value = 0.00459 (Wilcoxon-test), Q value = 0.021
Table S242. Gene #45: 'del_8p23.2' versus Clinical Feature #9: 'GLEASON_SCORE'
| nPatients | Mean (Std.Dev) | |
|---|---|---|
| ALL | 491 | 7.6 (1.0) |
| DEL PEAK 17(8P23.2) MUTATED | 223 | 7.7 (1.0) |
| DEL PEAK 17(8P23.2) WILD-TYPE | 268 | 7.5 (1.0) |
Figure S242. Get High-res Image Gene #45: 'del_8p23.2' versus Clinical Feature #9: 'GLEASON_SCORE'

P value = 0.0689 (Wilcoxon-test), Q value = 0.16
Table S243. Gene #45: 'del_8p23.2' versus Clinical Feature #10: 'PSA_VALUE'
| nPatients | Mean (Std.Dev) | |
|---|---|---|
| ALL | 434 | 1.8 (16.0) |
| DEL PEAK 17(8P23.2) MUTATED | 196 | 3.3 (23.6) |
| DEL PEAK 17(8P23.2) WILD-TYPE | 238 | 0.6 (2.2) |
Figure S243. Get High-res Image Gene #45: 'del_8p23.2' versus Clinical Feature #10: 'PSA_VALUE'
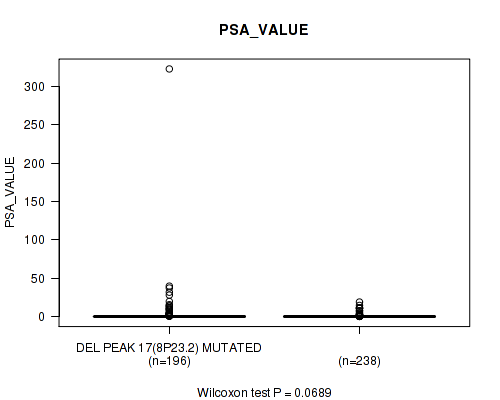
P value = 1e-05 (Fisher's exact test), Q value = 0.00016
Table S244. Gene #46: 'del_8p21.3' versus Clinical Feature #3: 'PATHOLOGY_T_STAGE'
| nPatients | T2 | T3 | T4 |
|---|---|---|---|
| ALL | 188 | 287 | 10 |
| DEL PEAK 18(8P21.3) MUTATED | 81 | 202 | 8 |
| DEL PEAK 18(8P21.3) WILD-TYPE | 107 | 85 | 2 |
Figure S244. Get High-res Image Gene #46: 'del_8p21.3' versus Clinical Feature #3: 'PATHOLOGY_T_STAGE'
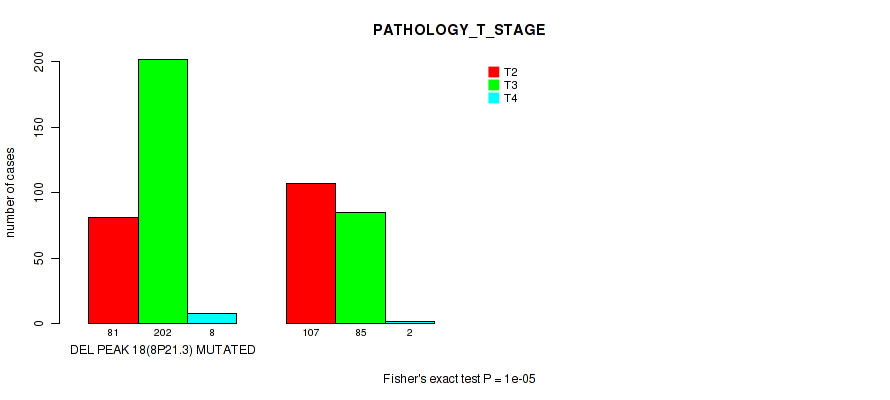
P value = 0.00272 (Fisher's exact test), Q value = 0.014
Table S245. Gene #46: 'del_8p21.3' versus Clinical Feature #4: 'PATHOLOGY_N_STAGE'
| nPatients | 0 | 1 |
|---|---|---|
| ALL | 342 | 77 |
| DEL PEAK 18(8P21.3) MUTATED | 198 | 59 |
| DEL PEAK 18(8P21.3) WILD-TYPE | 144 | 18 |
Figure S245. Get High-res Image Gene #46: 'del_8p21.3' versus Clinical Feature #4: 'PATHOLOGY_N_STAGE'
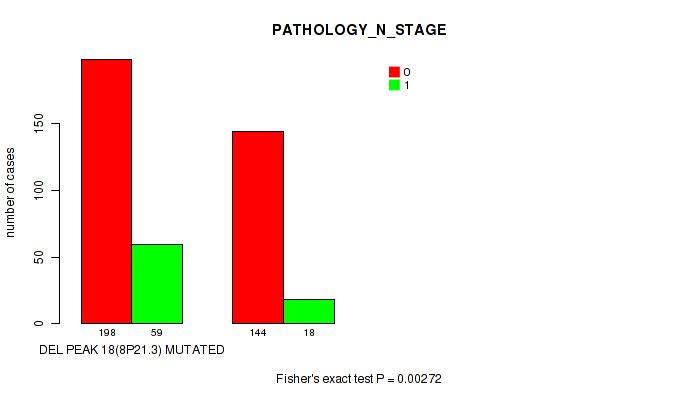
P value = 0.0589 (Fisher's exact test), Q value = 0.15
Table S246. Gene #46: 'del_8p21.3' versus Clinical Feature #5: 'RADIATION_THERAPY'
| nPatients | NO | YES |
|---|---|---|
| ALL | 378 | 57 |
| DEL PEAK 18(8P21.3) MUTATED | 219 | 41 |
| DEL PEAK 18(8P21.3) WILD-TYPE | 159 | 16 |
Figure S246. Get High-res Image Gene #46: 'del_8p21.3' versus Clinical Feature #5: 'RADIATION_THERAPY'
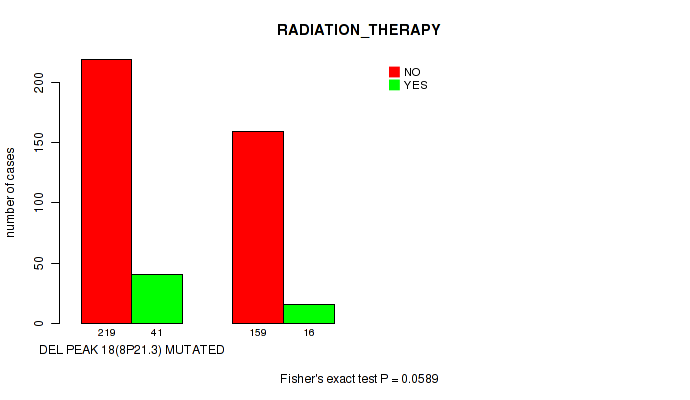
P value = 0.0013 (Wilcoxon-test), Q value = 0.0081
Table S247. Gene #46: 'del_8p21.3' versus Clinical Feature #8: 'NUMBER_OF_LYMPH_NODES'
| nPatients | Mean (Std.Dev) | |
|---|---|---|
| ALL | 401 | 0.4 (1.4) |
| DEL PEAK 18(8P21.3) MUTATED | 245 | 0.6 (1.6) |
| DEL PEAK 18(8P21.3) WILD-TYPE | 156 | 0.2 (0.8) |
Figure S247. Get High-res Image Gene #46: 'del_8p21.3' versus Clinical Feature #8: 'NUMBER_OF_LYMPH_NODES'

P value = 0.00109 (Wilcoxon-test), Q value = 0.0071
Table S248. Gene #46: 'del_8p21.3' versus Clinical Feature #9: 'GLEASON_SCORE'
| nPatients | Mean (Std.Dev) | |
|---|---|---|
| ALL | 491 | 7.6 (1.0) |
| DEL PEAK 18(8P21.3) MUTATED | 293 | 7.7 (1.0) |
| DEL PEAK 18(8P21.3) WILD-TYPE | 198 | 7.4 (1.0) |
Figure S248. Get High-res Image Gene #46: 'del_8p21.3' versus Clinical Feature #9: 'GLEASON_SCORE'
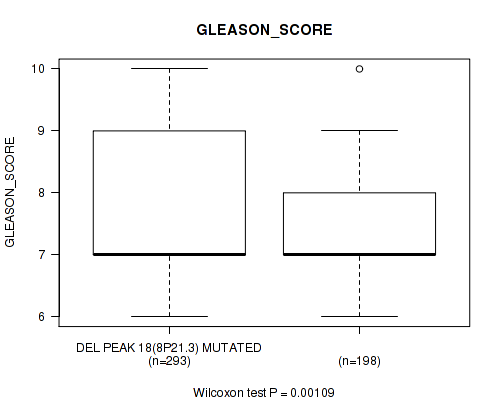
P value = 0.0838 (Wilcoxon-test), Q value = 0.19
Table S249. Gene #46: 'del_8p21.3' versus Clinical Feature #10: 'PSA_VALUE'
| nPatients | Mean (Std.Dev) | |
|---|---|---|
| ALL | 434 | 1.8 (16.0) |
| DEL PEAK 18(8P21.3) MUTATED | 257 | 2.6 (20.6) |
| DEL PEAK 18(8P21.3) WILD-TYPE | 177 | 0.7 (2.7) |
Figure S249. Get High-res Image Gene #46: 'del_8p21.3' versus Clinical Feature #10: 'PSA_VALUE'
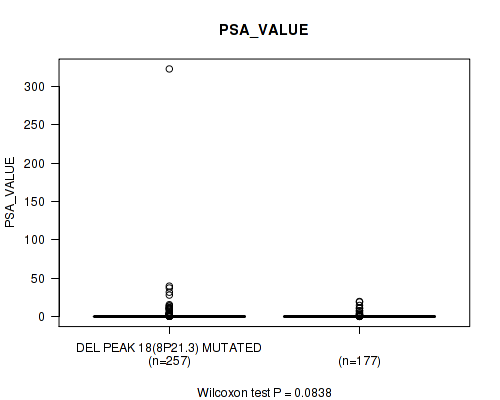
P value = 0.0238 (Fisher's exact test), Q value = 0.076
Table S250. Gene #47: 'del_9p23' versus Clinical Feature #3: 'PATHOLOGY_T_STAGE'
| nPatients | T2 | T3 | T4 |
|---|---|---|---|
| ALL | 188 | 287 | 10 |
| DEL PEAK 19(9P23) MUTATED | 10 | 33 | 2 |
| DEL PEAK 19(9P23) WILD-TYPE | 178 | 254 | 8 |
Figure S250. Get High-res Image Gene #47: 'del_9p23' versus Clinical Feature #3: 'PATHOLOGY_T_STAGE'

P value = 0.0201 (Fisher's exact test), Q value = 0.068
Table S251. Gene #47: 'del_9p23' versus Clinical Feature #4: 'PATHOLOGY_N_STAGE'
| nPatients | 0 | 1 |
|---|---|---|
| ALL | 342 | 77 |
| DEL PEAK 19(9P23) MUTATED | 29 | 14 |
| DEL PEAK 19(9P23) WILD-TYPE | 313 | 63 |
Figure S251. Get High-res Image Gene #47: 'del_9p23' versus Clinical Feature #4: 'PATHOLOGY_N_STAGE'

P value = 0.0963 (Fisher's exact test), Q value = 0.21
Table S252. Gene #47: 'del_9p23' versus Clinical Feature #5: 'RADIATION_THERAPY'
| nPatients | NO | YES |
|---|---|---|
| ALL | 378 | 57 |
| DEL PEAK 19(9P23) MUTATED | 33 | 9 |
| DEL PEAK 19(9P23) WILD-TYPE | 345 | 48 |
Figure S252. Get High-res Image Gene #47: 'del_9p23' versus Clinical Feature #5: 'RADIATION_THERAPY'

P value = 0.00755 (Wilcoxon-test), Q value = 0.032
Table S253. Gene #47: 'del_9p23' versus Clinical Feature #8: 'NUMBER_OF_LYMPH_NODES'
| nPatients | Mean (Std.Dev) | |
|---|---|---|
| ALL | 401 | 0.4 (1.4) |
| DEL PEAK 19(9P23) MUTATED | 40 | 0.9 (2.0) |
| DEL PEAK 19(9P23) WILD-TYPE | 361 | 0.4 (1.3) |
Figure S253. Get High-res Image Gene #47: 'del_9p23' versus Clinical Feature #8: 'NUMBER_OF_LYMPH_NODES'
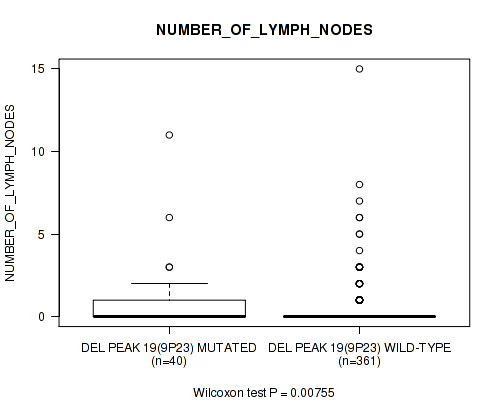
P value = 0.00401 (Wilcoxon-test), Q value = 0.019
Table S254. Gene #47: 'del_9p23' versus Clinical Feature #9: 'GLEASON_SCORE'
| nPatients | Mean (Std.Dev) | |
|---|---|---|
| ALL | 491 | 7.6 (1.0) |
| DEL PEAK 19(9P23) MUTATED | 45 | 8.0 (1.1) |
| DEL PEAK 19(9P23) WILD-TYPE | 446 | 7.6 (1.0) |
Figure S254. Get High-res Image Gene #47: 'del_9p23' versus Clinical Feature #9: 'GLEASON_SCORE'
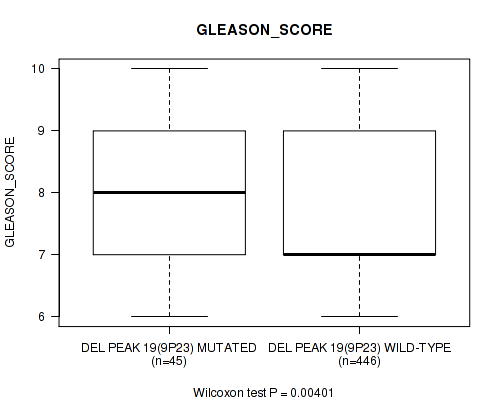
P value = 1e-05 (Fisher's exact test), Q value = 0.00016
Table S255. Gene #48: 'del_10q23.31' versus Clinical Feature #3: 'PATHOLOGY_T_STAGE'
| nPatients | T2 | T3 | T4 |
|---|---|---|---|
| ALL | 188 | 287 | 10 |
| DEL PEAK 20(10Q23.31) MUTATED | 37 | 112 | 6 |
| DEL PEAK 20(10Q23.31) WILD-TYPE | 151 | 175 | 4 |
Figure S255. Get High-res Image Gene #48: 'del_10q23.31' versus Clinical Feature #3: 'PATHOLOGY_T_STAGE'
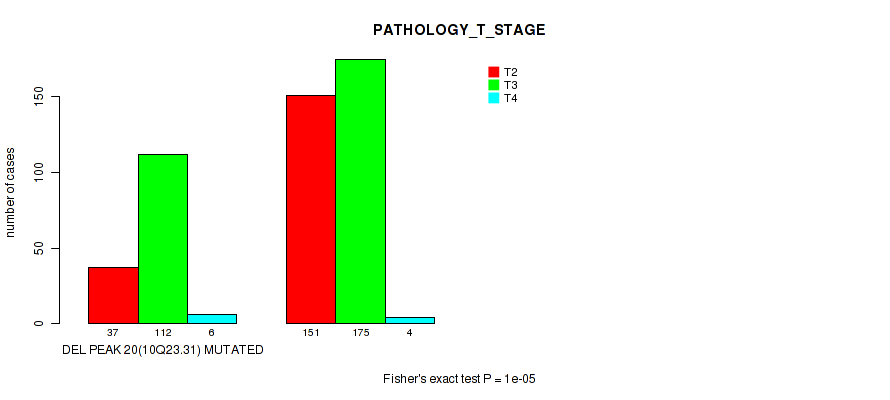
P value = 0.00236 (Fisher's exact test), Q value = 0.013
Table S256. Gene #48: 'del_10q23.31' versus Clinical Feature #4: 'PATHOLOGY_N_STAGE'
| nPatients | 0 | 1 |
|---|---|---|
| ALL | 342 | 77 |
| DEL PEAK 20(10Q23.31) MUTATED | 109 | 39 |
| DEL PEAK 20(10Q23.31) WILD-TYPE | 233 | 38 |
Figure S256. Get High-res Image Gene #48: 'del_10q23.31' versus Clinical Feature #4: 'PATHOLOGY_N_STAGE'
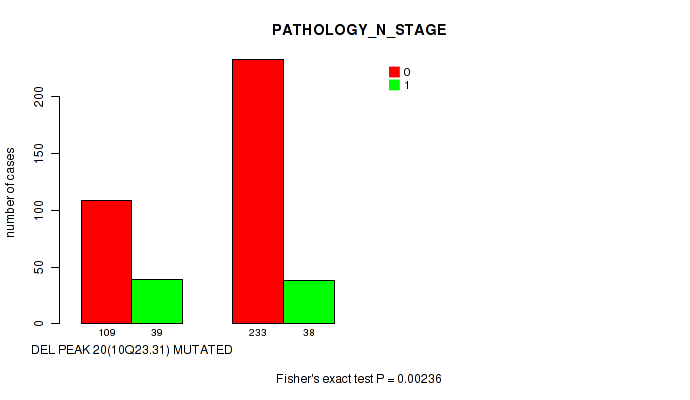
P value = 0.0214 (Fisher's exact test), Q value = 0.071
Table S257. Gene #48: 'del_10q23.31' versus Clinical Feature #5: 'RADIATION_THERAPY'
| nPatients | NO | YES |
|---|---|---|
| ALL | 378 | 57 |
| DEL PEAK 20(10Q23.31) MUTATED | 112 | 26 |
| DEL PEAK 20(10Q23.31) WILD-TYPE | 266 | 31 |
Figure S257. Get High-res Image Gene #48: 'del_10q23.31' versus Clinical Feature #5: 'RADIATION_THERAPY'

P value = 0.00118 (Wilcoxon-test), Q value = 0.0075
Table S258. Gene #48: 'del_10q23.31' versus Clinical Feature #8: 'NUMBER_OF_LYMPH_NODES'
| nPatients | Mean (Std.Dev) | |
|---|---|---|
| ALL | 401 | 0.4 (1.4) |
| DEL PEAK 20(10Q23.31) MUTATED | 142 | 0.7 (1.6) |
| DEL PEAK 20(10Q23.31) WILD-TYPE | 259 | 0.3 (1.2) |
Figure S258. Get High-res Image Gene #48: 'del_10q23.31' versus Clinical Feature #8: 'NUMBER_OF_LYMPH_NODES'

P value = 5.3e-08 (Wilcoxon-test), Q value = 2.4e-06
Table S259. Gene #48: 'del_10q23.31' versus Clinical Feature #9: 'GLEASON_SCORE'
| nPatients | Mean (Std.Dev) | |
|---|---|---|
| ALL | 491 | 7.6 (1.0) |
| DEL PEAK 20(10Q23.31) MUTATED | 156 | 8.0 (1.0) |
| DEL PEAK 20(10Q23.31) WILD-TYPE | 335 | 7.4 (1.0) |
Figure S259. Get High-res Image Gene #48: 'del_10q23.31' versus Clinical Feature #9: 'GLEASON_SCORE'

P value = 0.00956 (Wilcoxon-test), Q value = 0.039
Table S260. Gene #48: 'del_10q23.31' versus Clinical Feature #10: 'PSA_VALUE'
| nPatients | Mean (Std.Dev) | |
|---|---|---|
| ALL | 434 | 1.8 (16.0) |
| DEL PEAK 20(10Q23.31) MUTATED | 140 | 4.3 (27.9) |
| DEL PEAK 20(10Q23.31) WILD-TYPE | 294 | 0.6 (2.2) |
Figure S260. Get High-res Image Gene #48: 'del_10q23.31' versus Clinical Feature #10: 'PSA_VALUE'
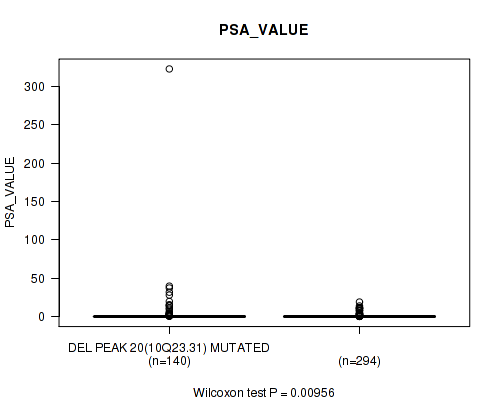
P value = 0.0164 (Fisher's exact test), Q value = 0.058
Table S261. Gene #49: 'del_11p11.2' versus Clinical Feature #3: 'PATHOLOGY_T_STAGE'
| nPatients | T2 | T3 | T4 |
|---|---|---|---|
| ALL | 188 | 287 | 10 |
| DEL PEAK 21(11P11.2) MUTATED | 6 | 27 | 1 |
| DEL PEAK 21(11P11.2) WILD-TYPE | 182 | 260 | 9 |
Figure S261. Get High-res Image Gene #49: 'del_11p11.2' versus Clinical Feature #3: 'PATHOLOGY_T_STAGE'
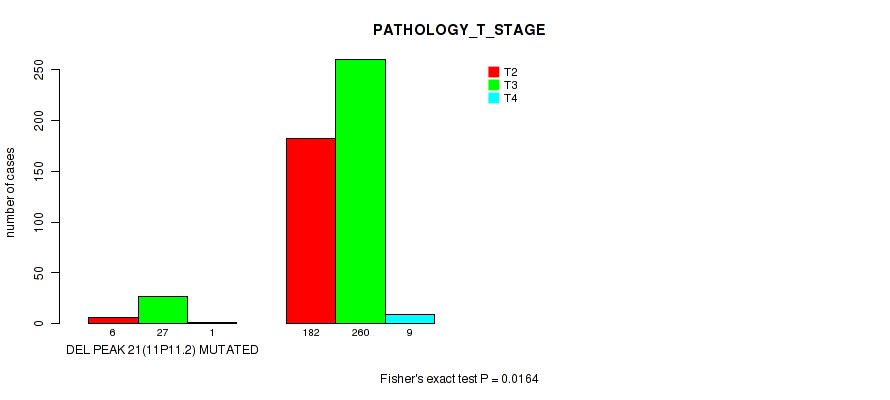
P value = 0.043 (Fisher's exact test), Q value = 0.12
Table S262. Gene #49: 'del_11p11.2' versus Clinical Feature #7: 'RESIDUAL_TUMOR'
| nPatients | R0 | R1 | R2 | RX |
|---|---|---|---|---|
| ALL | 312 | 143 | 5 | 15 |
| DEL PEAK 21(11P11.2) MUTATED | 15 | 16 | 0 | 2 |
| DEL PEAK 21(11P11.2) WILD-TYPE | 297 | 127 | 5 | 13 |
Figure S262. Get High-res Image Gene #49: 'del_11p11.2' versus Clinical Feature #7: 'RESIDUAL_TUMOR'

P value = 0.0121 (Wilcoxon-test), Q value = 0.046
Table S263. Gene #49: 'del_11p11.2' versus Clinical Feature #9: 'GLEASON_SCORE'
| nPatients | Mean (Std.Dev) | |
|---|---|---|
| ALL | 491 | 7.6 (1.0) |
| DEL PEAK 21(11P11.2) MUTATED | 34 | 8.0 (1.0) |
| DEL PEAK 21(11P11.2) WILD-TYPE | 457 | 7.6 (1.0) |
Figure S263. Get High-res Image Gene #49: 'del_11p11.2' versus Clinical Feature #9: 'GLEASON_SCORE'
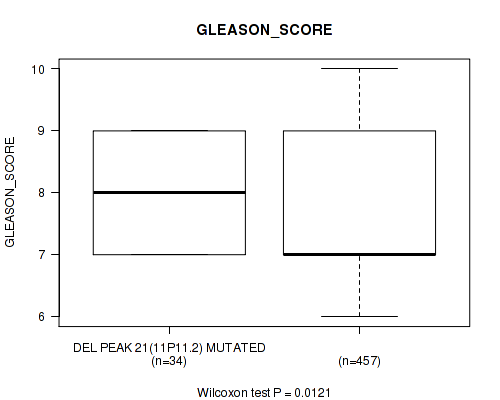
P value = 0.00346 (Fisher's exact test), Q value = 0.017
Table S264. Gene #49: 'del_11p11.2' versus Clinical Feature #11: 'RACE'
| nPatients | ASIAN | BLACK OR AFRICAN AMERICAN | WHITE |
|---|---|---|---|
| ALL | 2 | 7 | 146 |
| DEL PEAK 21(11P11.2) MUTATED | 1 | 2 | 3 |
| DEL PEAK 21(11P11.2) WILD-TYPE | 1 | 5 | 143 |
Figure S264. Get High-res Image Gene #49: 'del_11p11.2' versus Clinical Feature #11: 'RACE'
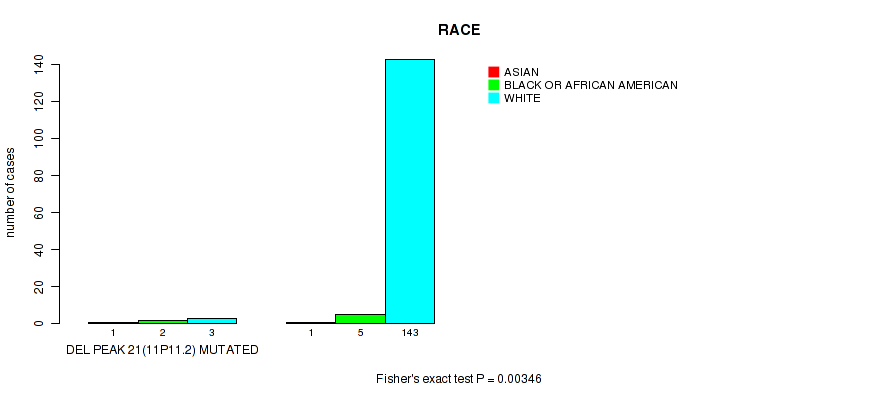
P value = 0.0338 (Wilcoxon-test), Q value = 0.097
Table S265. Gene #50: 'del_11q22.3' versus Clinical Feature #2: 'YEARS_TO_BIRTH'
| nPatients | Mean (Std.Dev) | |
|---|---|---|
| ALL | 480 | 61.0 (6.8) |
| DEL PEAK 22(11Q22.3) MUTATED | 42 | 63.2 (6.4) |
| DEL PEAK 22(11Q22.3) WILD-TYPE | 438 | 60.8 (6.8) |
Figure S265. Get High-res Image Gene #50: 'del_11q22.3' versus Clinical Feature #2: 'YEARS_TO_BIRTH'
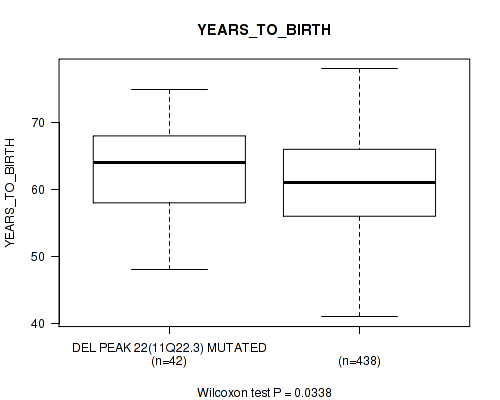
P value = 0.00062 (Fisher's exact test), Q value = 0.0045
Table S266. Gene #50: 'del_11q22.3' versus Clinical Feature #3: 'PATHOLOGY_T_STAGE'
| nPatients | T2 | T3 | T4 |
|---|---|---|---|
| ALL | 188 | 287 | 10 |
| DEL PEAK 22(11Q22.3) MUTATED | 7 | 33 | 3 |
| DEL PEAK 22(11Q22.3) WILD-TYPE | 181 | 254 | 7 |
Figure S266. Get High-res Image Gene #50: 'del_11q22.3' versus Clinical Feature #3: 'PATHOLOGY_T_STAGE'
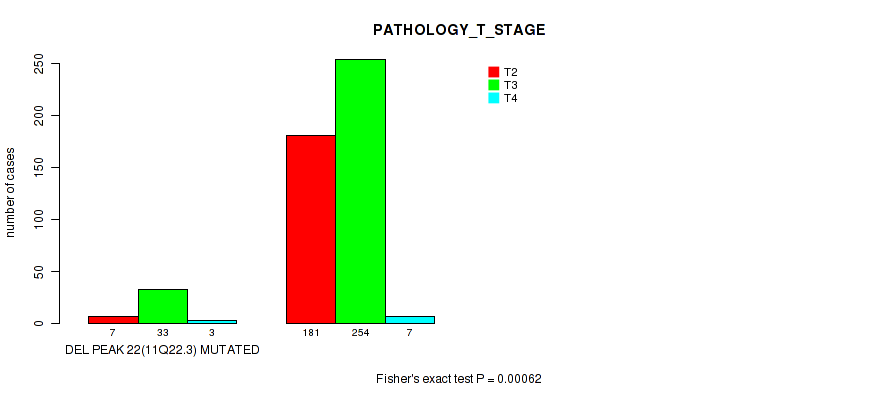
P value = 0.0529 (Fisher's exact test), Q value = 0.14
Table S267. Gene #50: 'del_11q22.3' versus Clinical Feature #5: 'RADIATION_THERAPY'
| nPatients | NO | YES |
|---|---|---|
| ALL | 378 | 57 |
| DEL PEAK 22(11Q22.3) MUTATED | 24 | 8 |
| DEL PEAK 22(11Q22.3) WILD-TYPE | 354 | 49 |
Figure S267. Get High-res Image Gene #50: 'del_11q22.3' versus Clinical Feature #5: 'RADIATION_THERAPY'

P value = 0.00393 (Fisher's exact test), Q value = 0.019
Table S268. Gene #50: 'del_11q22.3' versus Clinical Feature #7: 'RESIDUAL_TUMOR'
| nPatients | R0 | R1 | R2 | RX |
|---|---|---|---|---|
| ALL | 312 | 143 | 5 | 15 |
| DEL PEAK 22(11Q22.3) MUTATED | 18 | 23 | 0 | 0 |
| DEL PEAK 22(11Q22.3) WILD-TYPE | 294 | 120 | 5 | 15 |
Figure S268. Get High-res Image Gene #50: 'del_11q22.3' versus Clinical Feature #7: 'RESIDUAL_TUMOR'
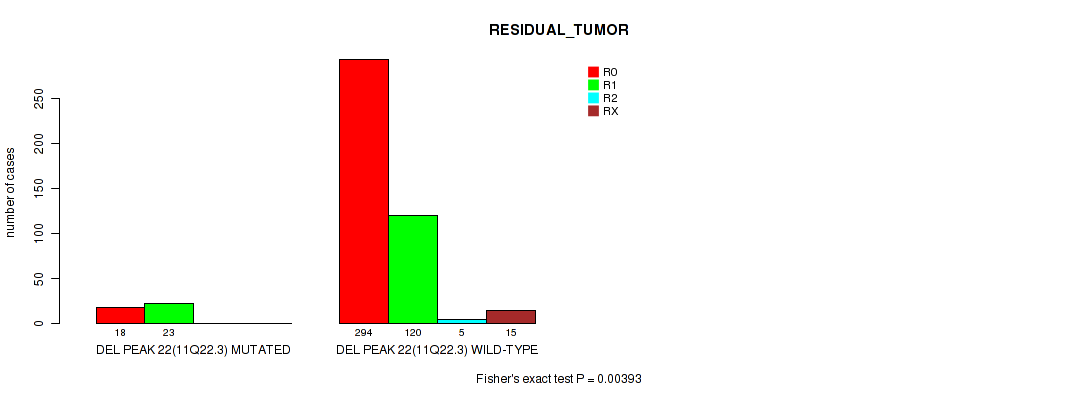
P value = 0.068 (Wilcoxon-test), Q value = 0.16
Table S269. Gene #50: 'del_11q22.3' versus Clinical Feature #8: 'NUMBER_OF_LYMPH_NODES'
| nPatients | Mean (Std.Dev) | |
|---|---|---|
| ALL | 401 | 0.4 (1.4) |
| DEL PEAK 22(11Q22.3) MUTATED | 34 | 0.7 (1.2) |
| DEL PEAK 22(11Q22.3) WILD-TYPE | 367 | 0.4 (1.4) |
Figure S269. Get High-res Image Gene #50: 'del_11q22.3' versus Clinical Feature #8: 'NUMBER_OF_LYMPH_NODES'

P value = 6.89e-05 (Wilcoxon-test), Q value = 0.00086
Table S270. Gene #50: 'del_11q22.3' versus Clinical Feature #9: 'GLEASON_SCORE'
| nPatients | Mean (Std.Dev) | |
|---|---|---|
| ALL | 491 | 7.6 (1.0) |
| DEL PEAK 22(11Q22.3) MUTATED | 43 | 8.2 (1.0) |
| DEL PEAK 22(11Q22.3) WILD-TYPE | 448 | 7.5 (1.0) |
Figure S270. Get High-res Image Gene #50: 'del_11q22.3' versus Clinical Feature #9: 'GLEASON_SCORE'
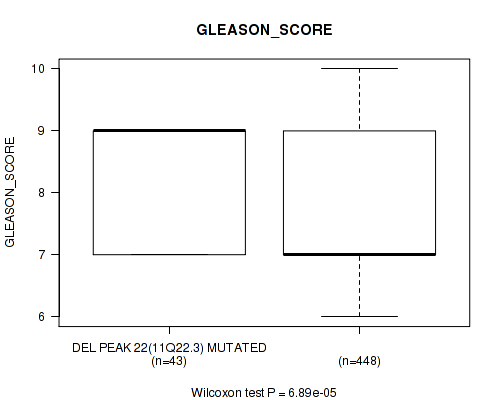
P value = 0.0711 (Wilcoxon-test), Q value = 0.17
Table S271. Gene #51: 'del_11q23.2' versus Clinical Feature #2: 'YEARS_TO_BIRTH'
| nPatients | Mean (Std.Dev) | |
|---|---|---|
| ALL | 480 | 61.0 (6.8) |
| DEL PEAK 23(11Q23.2) MUTATED | 47 | 62.7 (6.2) |
| DEL PEAK 23(11Q23.2) WILD-TYPE | 433 | 60.8 (6.9) |
Figure S271. Get High-res Image Gene #51: 'del_11q23.2' versus Clinical Feature #2: 'YEARS_TO_BIRTH'
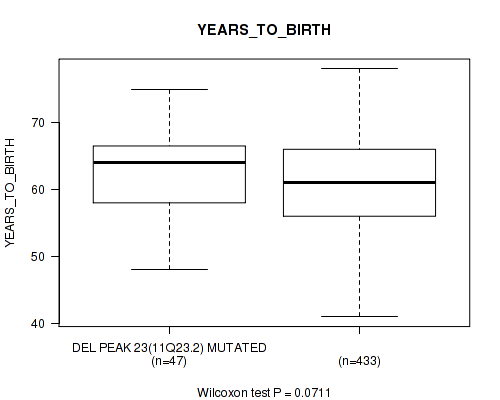
P value = 0.00264 (Fisher's exact test), Q value = 0.014
Table S272. Gene #51: 'del_11q23.2' versus Clinical Feature #3: 'PATHOLOGY_T_STAGE'
| nPatients | T2 | T3 | T4 |
|---|---|---|---|
| ALL | 188 | 287 | 10 |
| DEL PEAK 23(11Q23.2) MUTATED | 11 | 33 | 4 |
| DEL PEAK 23(11Q23.2) WILD-TYPE | 177 | 254 | 6 |
Figure S272. Get High-res Image Gene #51: 'del_11q23.2' versus Clinical Feature #3: 'PATHOLOGY_T_STAGE'

P value = 0.0725 (Fisher's exact test), Q value = 0.17
Table S273. Gene #51: 'del_11q23.2' versus Clinical Feature #5: 'RADIATION_THERAPY'
| nPatients | NO | YES |
|---|---|---|
| ALL | 378 | 57 |
| DEL PEAK 23(11Q23.2) MUTATED | 29 | 9 |
| DEL PEAK 23(11Q23.2) WILD-TYPE | 349 | 48 |
Figure S273. Get High-res Image Gene #51: 'del_11q23.2' versus Clinical Feature #5: 'RADIATION_THERAPY'

P value = 0.0143 (Fisher's exact test), Q value = 0.053
Table S274. Gene #51: 'del_11q23.2' versus Clinical Feature #7: 'RESIDUAL_TUMOR'
| nPatients | R0 | R1 | R2 | RX |
|---|---|---|---|---|
| ALL | 312 | 143 | 5 | 15 |
| DEL PEAK 23(11Q23.2) MUTATED | 21 | 23 | 0 | 2 |
| DEL PEAK 23(11Q23.2) WILD-TYPE | 291 | 120 | 5 | 13 |
Figure S274. Get High-res Image Gene #51: 'del_11q23.2' versus Clinical Feature #7: 'RESIDUAL_TUMOR'
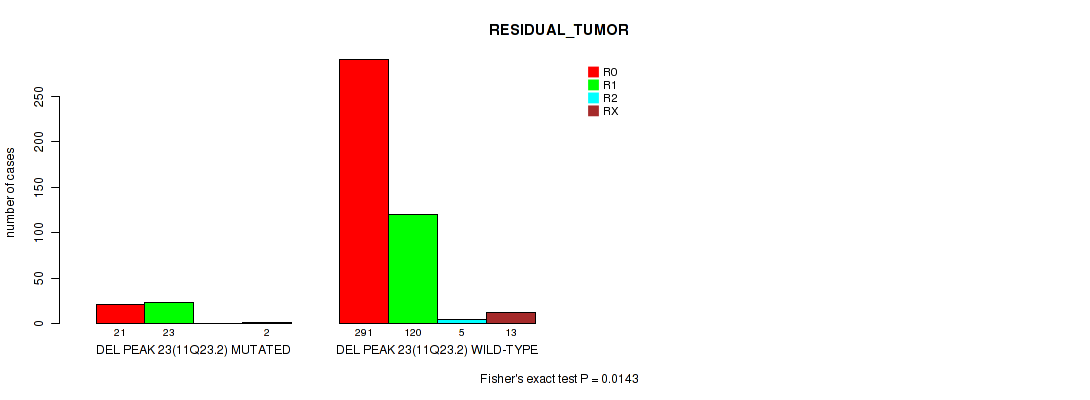
P value = 8.42e-05 (Wilcoxon-test), Q value = 0.001
Table S275. Gene #51: 'del_11q23.2' versus Clinical Feature #9: 'GLEASON_SCORE'
| nPatients | Mean (Std.Dev) | |
|---|---|---|
| ALL | 491 | 7.6 (1.0) |
| DEL PEAK 23(11Q23.2) MUTATED | 48 | 8.2 (1.0) |
| DEL PEAK 23(11Q23.2) WILD-TYPE | 443 | 7.5 (1.0) |
Figure S275. Get High-res Image Gene #51: 'del_11q23.2' versus Clinical Feature #9: 'GLEASON_SCORE'
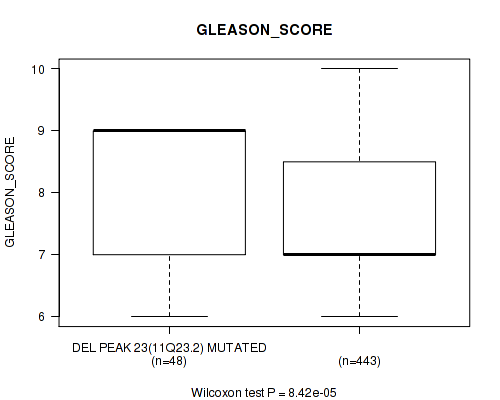
P value = 1e-05 (Fisher's exact test), Q value = 0.00016
Table S276. Gene #52: 'del_12p13.1' versus Clinical Feature #3: 'PATHOLOGY_T_STAGE'
| nPatients | T2 | T3 | T4 |
|---|---|---|---|
| ALL | 188 | 287 | 10 |
| DEL PEAK 24(12P13.1) MUTATED | 23 | 95 | 5 |
| DEL PEAK 24(12P13.1) WILD-TYPE | 165 | 192 | 5 |
Figure S276. Get High-res Image Gene #52: 'del_12p13.1' versus Clinical Feature #3: 'PATHOLOGY_T_STAGE'
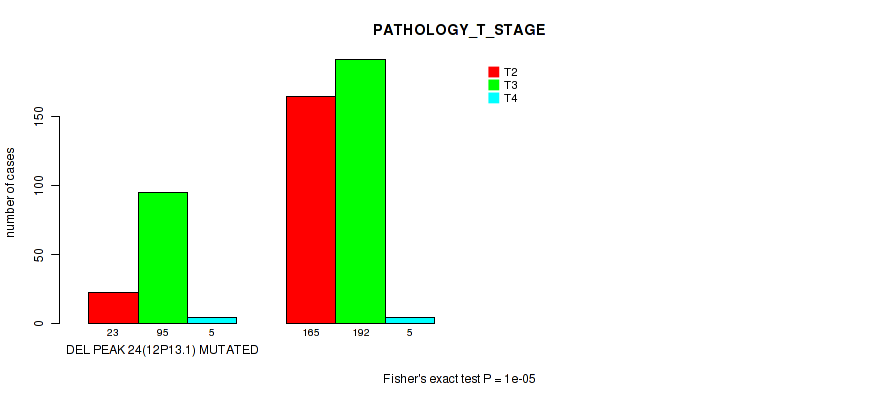
P value = 0.011 (Fisher's exact test), Q value = 0.043
Table S277. Gene #52: 'del_12p13.1' versus Clinical Feature #4: 'PATHOLOGY_N_STAGE'
| nPatients | 0 | 1 |
|---|---|---|
| ALL | 342 | 77 |
| DEL PEAK 24(12P13.1) MUTATED | 86 | 31 |
| DEL PEAK 24(12P13.1) WILD-TYPE | 256 | 46 |
Figure S277. Get High-res Image Gene #52: 'del_12p13.1' versus Clinical Feature #4: 'PATHOLOGY_N_STAGE'

P value = 0.0225 (Fisher's exact test), Q value = 0.073
Table S278. Gene #52: 'del_12p13.1' versus Clinical Feature #5: 'RADIATION_THERAPY'
| nPatients | NO | YES |
|---|---|---|
| ALL | 378 | 57 |
| DEL PEAK 24(12P13.1) MUTATED | 90 | 22 |
| DEL PEAK 24(12P13.1) WILD-TYPE | 288 | 35 |
Figure S278. Get High-res Image Gene #52: 'del_12p13.1' versus Clinical Feature #5: 'RADIATION_THERAPY'

P value = 0.00297 (Wilcoxon-test), Q value = 0.015
Table S279. Gene #52: 'del_12p13.1' versus Clinical Feature #8: 'NUMBER_OF_LYMPH_NODES'
| nPatients | Mean (Std.Dev) | |
|---|---|---|
| ALL | 401 | 0.4 (1.4) |
| DEL PEAK 24(12P13.1) MUTATED | 109 | 0.7 (1.6) |
| DEL PEAK 24(12P13.1) WILD-TYPE | 292 | 0.3 (1.3) |
Figure S279. Get High-res Image Gene #52: 'del_12p13.1' versus Clinical Feature #8: 'NUMBER_OF_LYMPH_NODES'

P value = 4.49e-05 (Wilcoxon-test), Q value = 0.00061
Table S280. Gene #52: 'del_12p13.1' versus Clinical Feature #9: 'GLEASON_SCORE'
| nPatients | Mean (Std.Dev) | |
|---|---|---|
| ALL | 491 | 7.6 (1.0) |
| DEL PEAK 24(12P13.1) MUTATED | 124 | 7.9 (1.0) |
| DEL PEAK 24(12P13.1) WILD-TYPE | 367 | 7.5 (1.0) |
Figure S280. Get High-res Image Gene #52: 'del_12p13.1' versus Clinical Feature #9: 'GLEASON_SCORE'

P value = 0.021 (Wilcoxon-test), Q value = 0.07
Table S281. Gene #52: 'del_12p13.1' versus Clinical Feature #10: 'PSA_VALUE'
| nPatients | Mean (Std.Dev) | |
|---|---|---|
| ALL | 434 | 1.8 (16.0) |
| DEL PEAK 24(12P13.1) MUTATED | 108 | 1.3 (4.6) |
| DEL PEAK 24(12P13.1) WILD-TYPE | 326 | 2.0 (18.3) |
Figure S281. Get High-res Image Gene #52: 'del_12p13.1' versus Clinical Feature #10: 'PSA_VALUE'
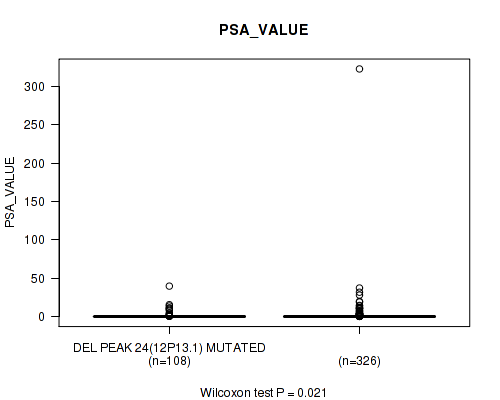
P value = 0.00294 (Fisher's exact test), Q value = 0.015
Table S282. Gene #53: 'del_12q24.32' versus Clinical Feature #3: 'PATHOLOGY_T_STAGE'
| nPatients | T2 | T3 | T4 |
|---|---|---|---|
| ALL | 188 | 287 | 10 |
| DEL PEAK 25(12Q24.32) MUTATED | 7 | 35 | 1 |
| DEL PEAK 25(12Q24.32) WILD-TYPE | 181 | 252 | 9 |
Figure S282. Get High-res Image Gene #53: 'del_12q24.32' versus Clinical Feature #3: 'PATHOLOGY_T_STAGE'
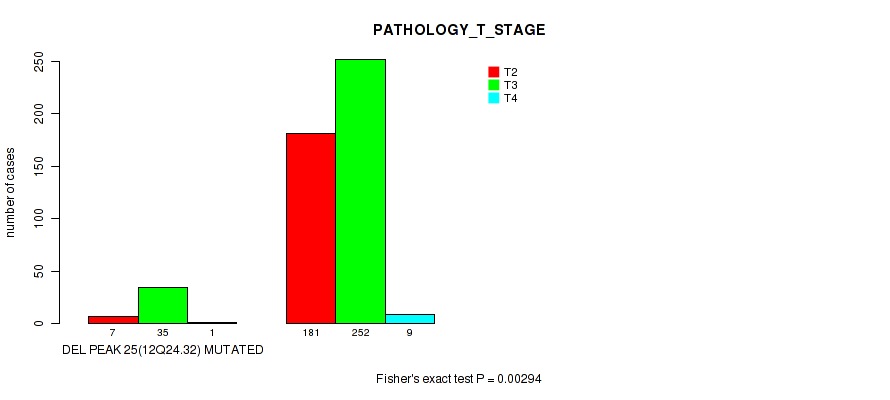
P value = 0.0291 (Fisher's exact test), Q value = 0.087
Table S283. Gene #53: 'del_12q24.32' versus Clinical Feature #4: 'PATHOLOGY_N_STAGE'
| nPatients | 0 | 1 |
|---|---|---|
| ALL | 342 | 77 |
| DEL PEAK 25(12Q24.32) MUTATED | 27 | 13 |
| DEL PEAK 25(12Q24.32) WILD-TYPE | 315 | 64 |
Figure S283. Get High-res Image Gene #53: 'del_12q24.32' versus Clinical Feature #4: 'PATHOLOGY_N_STAGE'
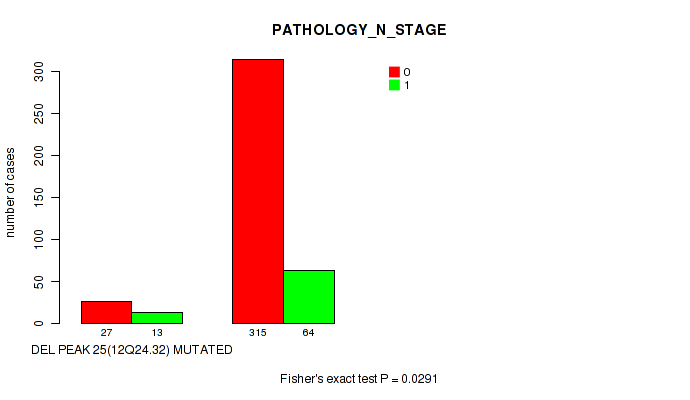
P value = 0.0147 (Wilcoxon-test), Q value = 0.054
Table S284. Gene #53: 'del_12q24.32' versus Clinical Feature #8: 'NUMBER_OF_LYMPH_NODES'
| nPatients | Mean (Std.Dev) | |
|---|---|---|
| ALL | 401 | 0.4 (1.4) |
| DEL PEAK 25(12Q24.32) MUTATED | 38 | 0.9 (2.6) |
| DEL PEAK 25(12Q24.32) WILD-TYPE | 363 | 0.4 (1.2) |
Figure S284. Get High-res Image Gene #53: 'del_12q24.32' versus Clinical Feature #8: 'NUMBER_OF_LYMPH_NODES'

P value = 0.054 (Wilcoxon-test), Q value = 0.14
Table S285. Gene #53: 'del_12q24.32' versus Clinical Feature #9: 'GLEASON_SCORE'
| nPatients | Mean (Std.Dev) | |
|---|---|---|
| ALL | 491 | 7.6 (1.0) |
| DEL PEAK 25(12Q24.32) MUTATED | 43 | 7.9 (1.0) |
| DEL PEAK 25(12Q24.32) WILD-TYPE | 448 | 7.6 (1.0) |
Figure S285. Get High-res Image Gene #53: 'del_12q24.32' versus Clinical Feature #9: 'GLEASON_SCORE'
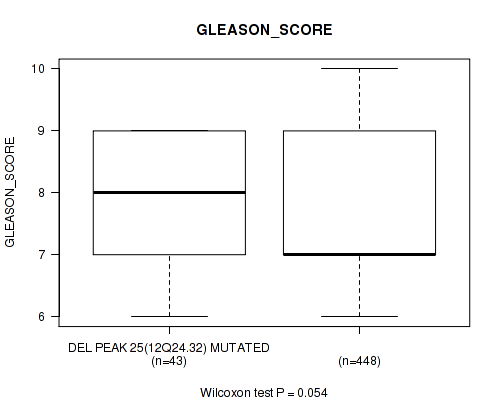
P value = 0.0129 (Wilcoxon-test), Q value = 0.048
Table S286. Gene #54: 'del_13q14.13' versus Clinical Feature #2: 'YEARS_TO_BIRTH'
| nPatients | Mean (Std.Dev) | |
|---|---|---|
| ALL | 480 | 61.0 (6.8) |
| DEL PEAK 26(13Q14.13) MUTATED | 223 | 61.7 (6.6) |
| DEL PEAK 26(13Q14.13) WILD-TYPE | 257 | 60.4 (7.0) |
Figure S286. Get High-res Image Gene #54: 'del_13q14.13' versus Clinical Feature #2: 'YEARS_TO_BIRTH'
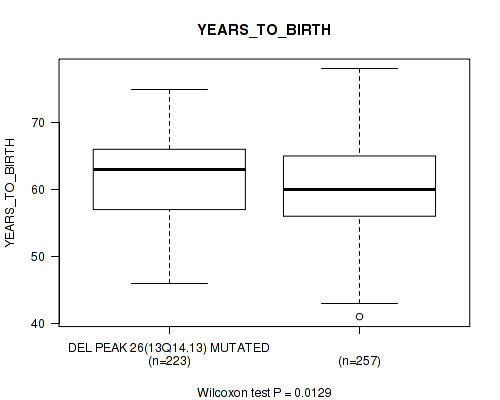
P value = 0.00433 (Fisher's exact test), Q value = 0.02
Table S287. Gene #54: 'del_13q14.13' versus Clinical Feature #3: 'PATHOLOGY_T_STAGE'
| nPatients | T2 | T3 | T4 |
|---|---|---|---|
| ALL | 188 | 287 | 10 |
| DEL PEAK 26(13Q14.13) MUTATED | 70 | 149 | 6 |
| DEL PEAK 26(13Q14.13) WILD-TYPE | 118 | 138 | 4 |
Figure S287. Get High-res Image Gene #54: 'del_13q14.13' versus Clinical Feature #3: 'PATHOLOGY_T_STAGE'
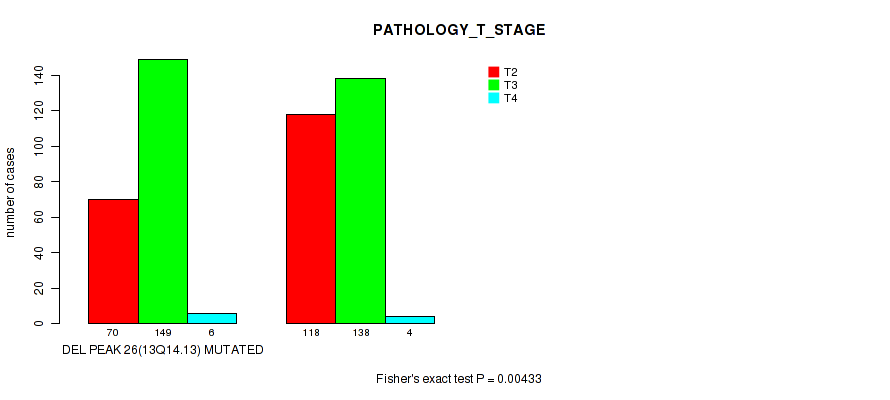
P value = 0.00411 (Fisher's exact test), Q value = 0.019
Table S288. Gene #54: 'del_13q14.13' versus Clinical Feature #5: 'RADIATION_THERAPY'
| nPatients | NO | YES |
|---|---|---|
| ALL | 378 | 57 |
| DEL PEAK 26(13Q14.13) MUTATED | 166 | 37 |
| DEL PEAK 26(13Q14.13) WILD-TYPE | 212 | 20 |
Figure S288. Get High-res Image Gene #54: 'del_13q14.13' versus Clinical Feature #5: 'RADIATION_THERAPY'

P value = 0.00198 (Fisher's exact test), Q value = 0.011
Table S289. Gene #54: 'del_13q14.13' versus Clinical Feature #7: 'RESIDUAL_TUMOR'
| nPatients | R0 | R1 | R2 | RX |
|---|---|---|---|---|
| ALL | 312 | 143 | 5 | 15 |
| DEL PEAK 26(13Q14.13) MUTATED | 126 | 82 | 1 | 9 |
| DEL PEAK 26(13Q14.13) WILD-TYPE | 186 | 61 | 4 | 6 |
Figure S289. Get High-res Image Gene #54: 'del_13q14.13' versus Clinical Feature #7: 'RESIDUAL_TUMOR'
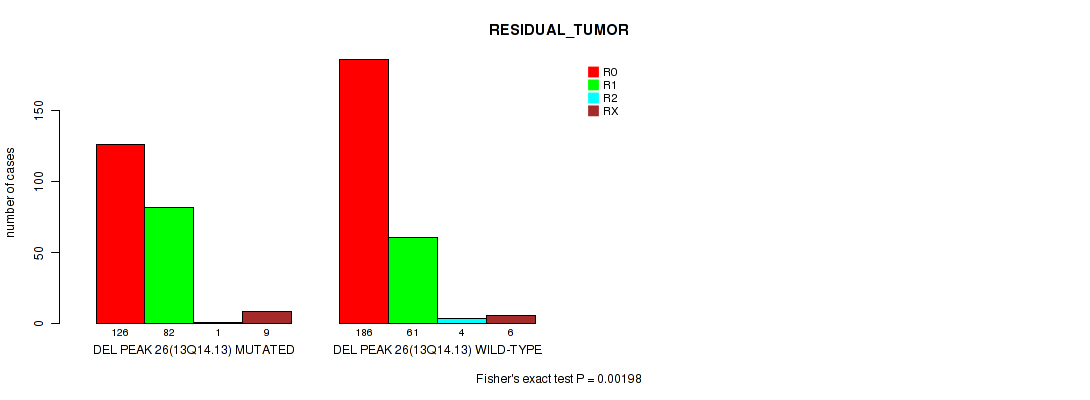
P value = 1.48e-05 (Wilcoxon-test), Q value = 0.00023
Table S290. Gene #54: 'del_13q14.13' versus Clinical Feature #9: 'GLEASON_SCORE'
| nPatients | Mean (Std.Dev) | |
|---|---|---|
| ALL | 491 | 7.6 (1.0) |
| DEL PEAK 26(13Q14.13) MUTATED | 227 | 7.8 (1.0) |
| DEL PEAK 26(13Q14.13) WILD-TYPE | 264 | 7.4 (1.0) |
Figure S290. Get High-res Image Gene #54: 'del_13q14.13' versus Clinical Feature #9: 'GLEASON_SCORE'
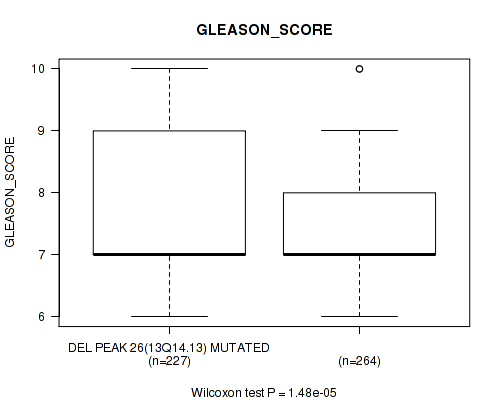
P value = 0.00414 (Fisher's exact test), Q value = 0.019
Table S291. Gene #54: 'del_13q14.13' versus Clinical Feature #11: 'RACE'
| nPatients | ASIAN | BLACK OR AFRICAN AMERICAN | WHITE |
|---|---|---|---|
| ALL | 2 | 7 | 146 |
| DEL PEAK 26(13Q14.13) MUTATED | 1 | 7 | 64 |
| DEL PEAK 26(13Q14.13) WILD-TYPE | 1 | 0 | 82 |
Figure S291. Get High-res Image Gene #54: 'del_13q14.13' versus Clinical Feature #11: 'RACE'
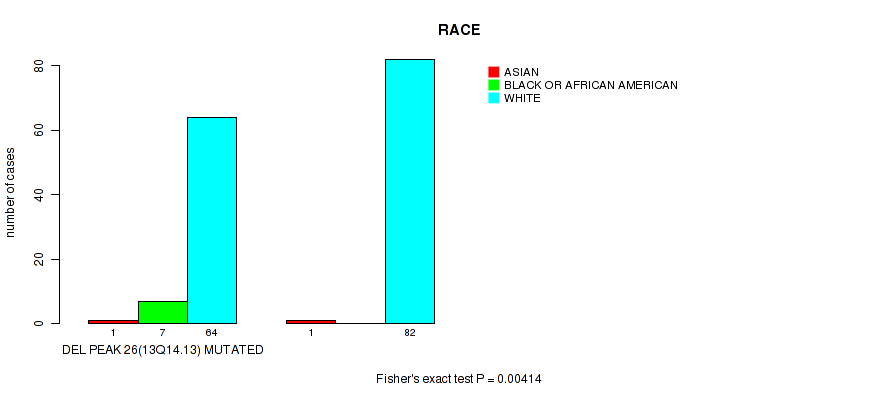
P value = 0.000883 (Wilcoxon-test), Q value = 0.0059
Table S292. Gene #55: 'del_13q22.1' versus Clinical Feature #2: 'YEARS_TO_BIRTH'
| nPatients | Mean (Std.Dev) | |
|---|---|---|
| ALL | 480 | 61.0 (6.8) |
| DEL PEAK 27(13Q22.1) MUTATED | 173 | 62.3 (6.7) |
| DEL PEAK 27(13Q22.1) WILD-TYPE | 307 | 60.2 (6.8) |
Figure S292. Get High-res Image Gene #55: 'del_13q22.1' versus Clinical Feature #2: 'YEARS_TO_BIRTH'
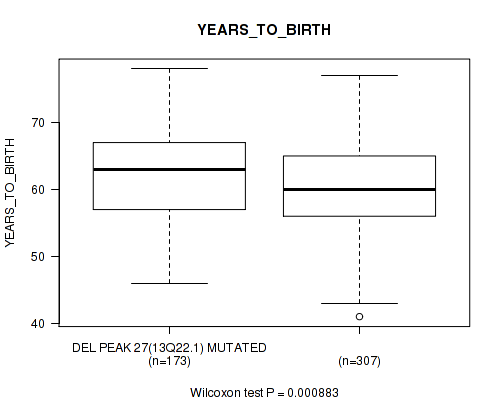
P value = 0.00011 (Fisher's exact test), Q value = 0.0012
Table S293. Gene #55: 'del_13q22.1' versus Clinical Feature #3: 'PATHOLOGY_T_STAGE'
| nPatients | T2 | T3 | T4 |
|---|---|---|---|
| ALL | 188 | 287 | 10 |
| DEL PEAK 27(13Q22.1) MUTATED | 50 | 116 | 8 |
| DEL PEAK 27(13Q22.1) WILD-TYPE | 138 | 171 | 2 |
Figure S293. Get High-res Image Gene #55: 'del_13q22.1' versus Clinical Feature #3: 'PATHOLOGY_T_STAGE'
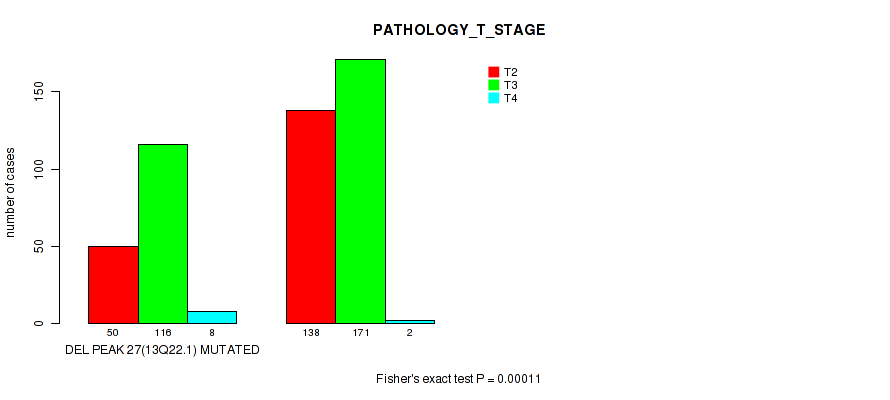
P value = 0.0927 (Fisher's exact test), Q value = 0.2
Table S294. Gene #55: 'del_13q22.1' versus Clinical Feature #4: 'PATHOLOGY_N_STAGE'
| nPatients | 0 | 1 |
|---|---|---|
| ALL | 342 | 77 |
| DEL PEAK 27(13Q22.1) MUTATED | 124 | 36 |
| DEL PEAK 27(13Q22.1) WILD-TYPE | 218 | 41 |
Figure S294. Get High-res Image Gene #55: 'del_13q22.1' versus Clinical Feature #4: 'PATHOLOGY_N_STAGE'
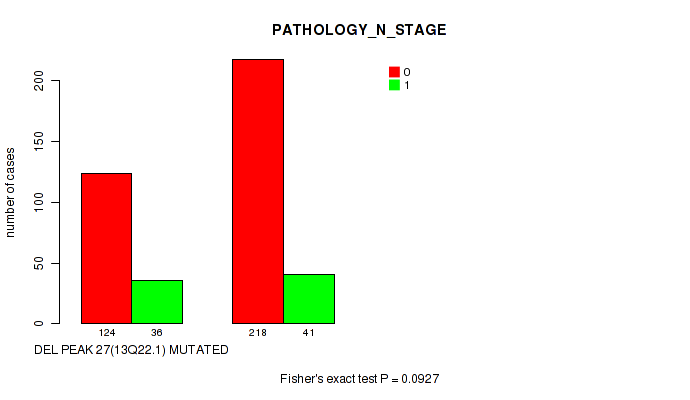
P value = 0.0773 (Fisher's exact test), Q value = 0.18
Table S295. Gene #55: 'del_13q22.1' versus Clinical Feature #5: 'RADIATION_THERAPY'
| nPatients | NO | YES |
|---|---|---|
| ALL | 378 | 57 |
| DEL PEAK 27(13Q22.1) MUTATED | 132 | 27 |
| DEL PEAK 27(13Q22.1) WILD-TYPE | 246 | 30 |
Figure S295. Get High-res Image Gene #55: 'del_13q22.1' versus Clinical Feature #5: 'RADIATION_THERAPY'
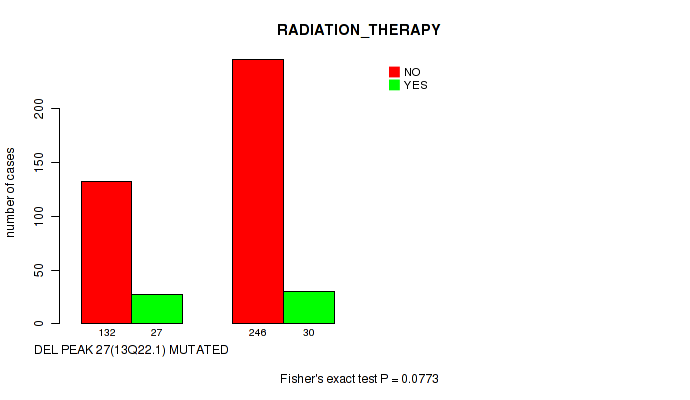
P value = 0.0129 (Fisher's exact test), Q value = 0.048
Table S296. Gene #55: 'del_13q22.1' versus Clinical Feature #7: 'RESIDUAL_TUMOR'
| nPatients | R0 | R1 | R2 | RX |
|---|---|---|---|---|
| ALL | 312 | 143 | 5 | 15 |
| DEL PEAK 27(13Q22.1) MUTATED | 96 | 65 | 1 | 7 |
| DEL PEAK 27(13Q22.1) WILD-TYPE | 216 | 78 | 4 | 8 |
Figure S296. Get High-res Image Gene #55: 'del_13q22.1' versus Clinical Feature #7: 'RESIDUAL_TUMOR'
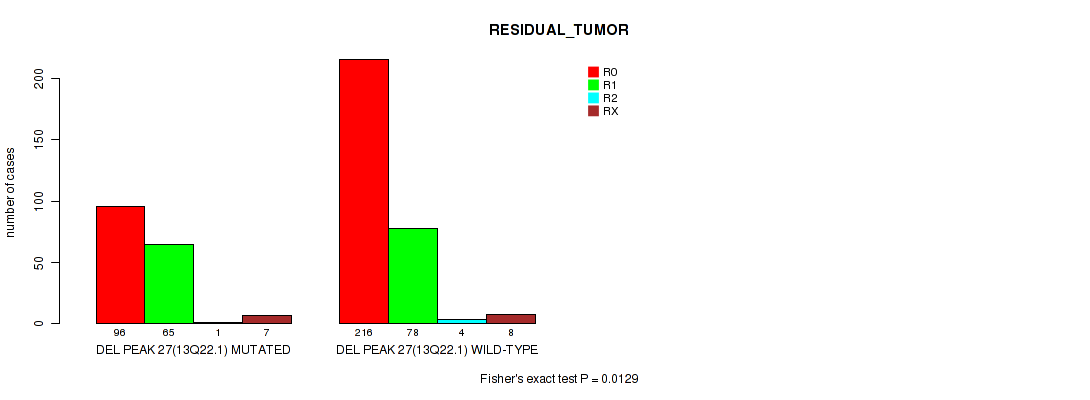
P value = 0.037 (Wilcoxon-test), Q value = 0.1
Table S297. Gene #55: 'del_13q22.1' versus Clinical Feature #8: 'NUMBER_OF_LYMPH_NODES'
| nPatients | Mean (Std.Dev) | |
|---|---|---|
| ALL | 401 | 0.4 (1.4) |
| DEL PEAK 27(13Q22.1) MUTATED | 151 | 0.6 (1.6) |
| DEL PEAK 27(13Q22.1) WILD-TYPE | 250 | 0.3 (1.2) |
Figure S297. Get High-res Image Gene #55: 'del_13q22.1' versus Clinical Feature #8: 'NUMBER_OF_LYMPH_NODES'
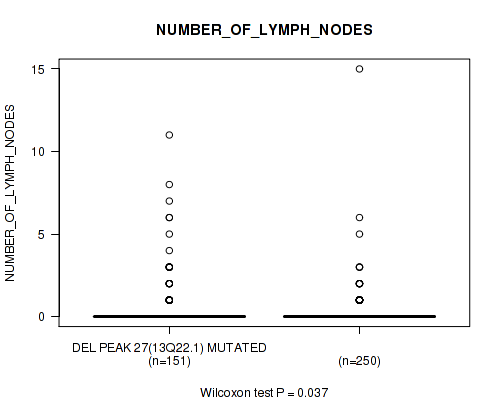
P value = 2.15e-10 (Wilcoxon-test), Q value = 3.1e-08
Table S298. Gene #55: 'del_13q22.1' versus Clinical Feature #9: 'GLEASON_SCORE'
| nPatients | Mean (Std.Dev) | |
|---|---|---|
| ALL | 491 | 7.6 (1.0) |
| DEL PEAK 27(13Q22.1) MUTATED | 176 | 8.0 (1.0) |
| DEL PEAK 27(13Q22.1) WILD-TYPE | 315 | 7.4 (1.0) |
Figure S298. Get High-res Image Gene #55: 'del_13q22.1' versus Clinical Feature #9: 'GLEASON_SCORE'

P value = 0.00047 (Fisher's exact test), Q value = 0.0038
Table S299. Gene #55: 'del_13q22.1' versus Clinical Feature #11: 'RACE'
| nPatients | ASIAN | BLACK OR AFRICAN AMERICAN | WHITE |
|---|---|---|---|
| ALL | 2 | 7 | 146 |
| DEL PEAK 27(13Q22.1) MUTATED | 0 | 7 | 51 |
| DEL PEAK 27(13Q22.1) WILD-TYPE | 2 | 0 | 95 |
Figure S299. Get High-res Image Gene #55: 'del_13q22.1' versus Clinical Feature #11: 'RACE'
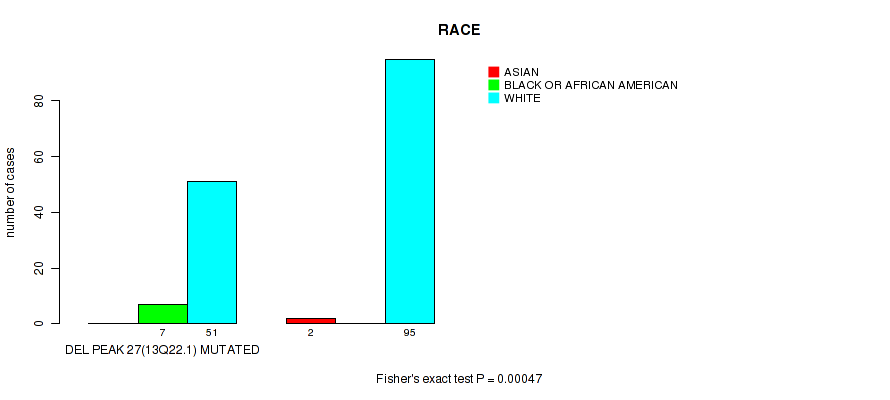
P value = 1e-05 (Fisher's exact test), Q value = 0.00016
Table S300. Gene #56: 'del_15q21.3' versus Clinical Feature #3: 'PATHOLOGY_T_STAGE'
| nPatients | T2 | T3 | T4 |
|---|---|---|---|
| ALL | 188 | 287 | 10 |
| DEL PEAK 28(15Q21.3) MUTATED | 9 | 53 | 4 |
| DEL PEAK 28(15Q21.3) WILD-TYPE | 179 | 234 | 6 |
Figure S300. Get High-res Image Gene #56: 'del_15q21.3' versus Clinical Feature #3: 'PATHOLOGY_T_STAGE'
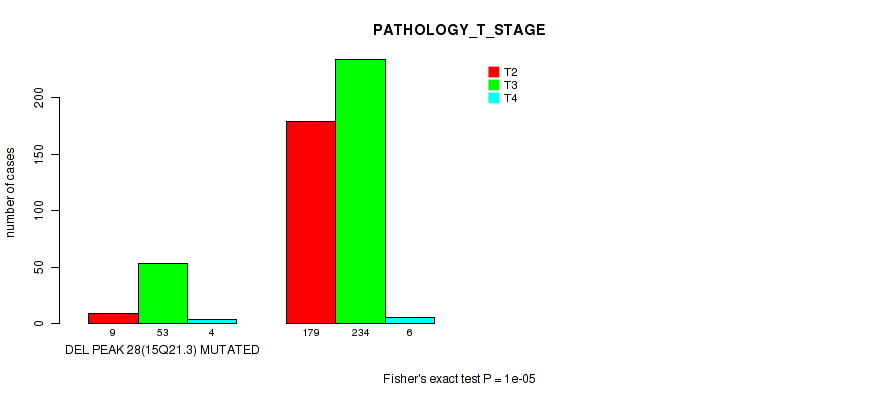
P value = 0.00155 (Fisher's exact test), Q value = 0.0094
Table S301. Gene #56: 'del_15q21.3' versus Clinical Feature #4: 'PATHOLOGY_N_STAGE'
| nPatients | 0 | 1 |
|---|---|---|
| ALL | 342 | 77 |
| DEL PEAK 28(15Q21.3) MUTATED | 38 | 20 |
| DEL PEAK 28(15Q21.3) WILD-TYPE | 304 | 57 |
Figure S301. Get High-res Image Gene #56: 'del_15q21.3' versus Clinical Feature #4: 'PATHOLOGY_N_STAGE'
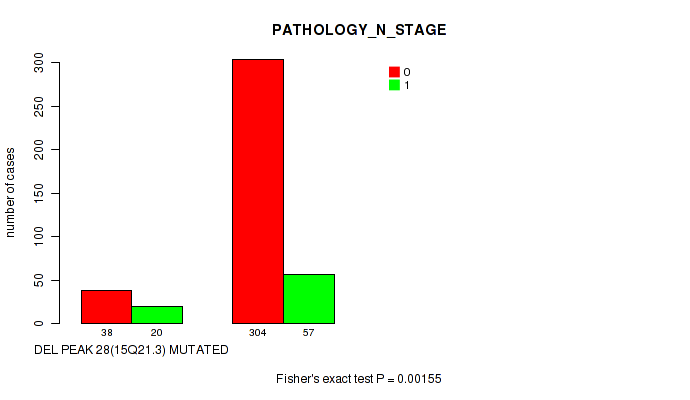
P value = 0.00261 (Fisher's exact test), Q value = 0.014
Table S302. Gene #56: 'del_15q21.3' versus Clinical Feature #5: 'RADIATION_THERAPY'
| nPatients | NO | YES |
|---|---|---|
| ALL | 378 | 57 |
| DEL PEAK 28(15Q21.3) MUTATED | 41 | 15 |
| DEL PEAK 28(15Q21.3) WILD-TYPE | 337 | 42 |
Figure S302. Get High-res Image Gene #56: 'del_15q21.3' versus Clinical Feature #5: 'RADIATION_THERAPY'

P value = 0.000614 (Wilcoxon-test), Q value = 0.0045
Table S303. Gene #56: 'del_15q21.3' versus Clinical Feature #8: 'NUMBER_OF_LYMPH_NODES'
| nPatients | Mean (Std.Dev) | |
|---|---|---|
| ALL | 401 | 0.4 (1.4) |
| DEL PEAK 28(15Q21.3) MUTATED | 57 | 0.8 (1.4) |
| DEL PEAK 28(15Q21.3) WILD-TYPE | 344 | 0.4 (1.3) |
Figure S303. Get High-res Image Gene #56: 'del_15q21.3' versus Clinical Feature #8: 'NUMBER_OF_LYMPH_NODES'

P value = 1.73e-08 (Wilcoxon-test), Q value = 8.8e-07
Table S304. Gene #56: 'del_15q21.3' versus Clinical Feature #9: 'GLEASON_SCORE'
| nPatients | Mean (Std.Dev) | |
|---|---|---|
| ALL | 491 | 7.6 (1.0) |
| DEL PEAK 28(15Q21.3) MUTATED | 66 | 8.3 (1.0) |
| DEL PEAK 28(15Q21.3) WILD-TYPE | 425 | 7.5 (1.0) |
Figure S304. Get High-res Image Gene #56: 'del_15q21.3' versus Clinical Feature #9: 'GLEASON_SCORE'

P value = 0.112 (Wilcoxon-test), Q value = 0.23
Table S305. Gene #56: 'del_15q21.3' versus Clinical Feature #10: 'PSA_VALUE'
| nPatients | Mean (Std.Dev) | |
|---|---|---|
| ALL | 434 | 1.8 (16.0) |
| DEL PEAK 28(15Q21.3) MUTATED | 52 | 2.0 (5.9) |
| DEL PEAK 28(15Q21.3) WILD-TYPE | 382 | 1.8 (16.9) |
Figure S305. Get High-res Image Gene #56: 'del_15q21.3' versus Clinical Feature #10: 'PSA_VALUE'
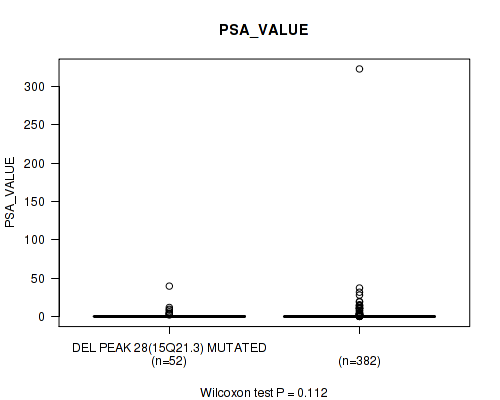
P value = 0.0415 (Wilcoxon-test), Q value = 0.11
Table S306. Gene #57: 'del_16q22.3' versus Clinical Feature #2: 'YEARS_TO_BIRTH'
| nPatients | Mean (Std.Dev) | |
|---|---|---|
| ALL | 480 | 61.0 (6.8) |
| DEL PEAK 29(16Q22.3) MUTATED | 186 | 61.7 (6.6) |
| DEL PEAK 29(16Q22.3) WILD-TYPE | 294 | 60.5 (6.9) |
Figure S306. Get High-res Image Gene #57: 'del_16q22.3' versus Clinical Feature #2: 'YEARS_TO_BIRTH'
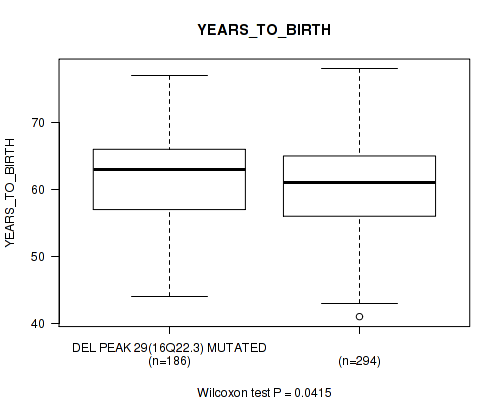
P value = 0.00022 (Fisher's exact test), Q value = 0.0022
Table S307. Gene #57: 'del_16q22.3' versus Clinical Feature #3: 'PATHOLOGY_T_STAGE'
| nPatients | T2 | T3 | T4 |
|---|---|---|---|
| ALL | 188 | 287 | 10 |
| DEL PEAK 29(16Q22.3) MUTATED | 53 | 129 | 6 |
| DEL PEAK 29(16Q22.3) WILD-TYPE | 135 | 158 | 4 |
Figure S307. Get High-res Image Gene #57: 'del_16q22.3' versus Clinical Feature #3: 'PATHOLOGY_T_STAGE'
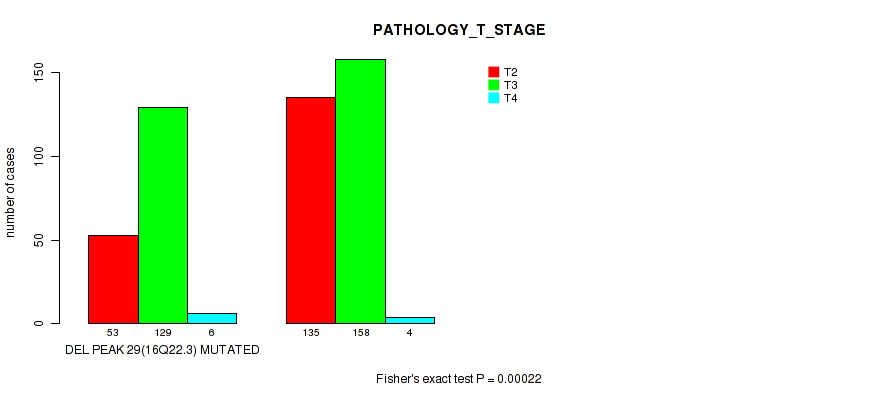
P value = 0.0289 (Fisher's exact test), Q value = 0.087
Table S308. Gene #57: 'del_16q22.3' versus Clinical Feature #4: 'PATHOLOGY_N_STAGE'
| nPatients | 0 | 1 |
|---|---|---|
| ALL | 342 | 77 |
| DEL PEAK 29(16Q22.3) MUTATED | 130 | 40 |
| DEL PEAK 29(16Q22.3) WILD-TYPE | 212 | 37 |
Figure S308. Get High-res Image Gene #57: 'del_16q22.3' versus Clinical Feature #4: 'PATHOLOGY_N_STAGE'
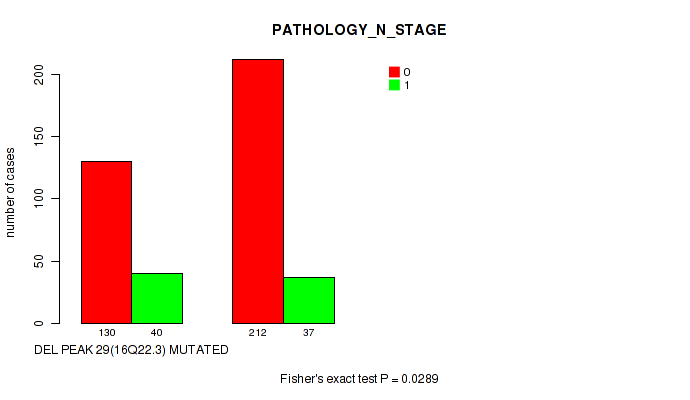
P value = 0.0324 (Fisher's exact test), Q value = 0.094
Table S309. Gene #57: 'del_16q22.3' versus Clinical Feature #7: 'RESIDUAL_TUMOR'
| nPatients | R0 | R1 | R2 | RX |
|---|---|---|---|---|
| ALL | 312 | 143 | 5 | 15 |
| DEL PEAK 29(16Q22.3) MUTATED | 108 | 69 | 1 | 5 |
| DEL PEAK 29(16Q22.3) WILD-TYPE | 204 | 74 | 4 | 10 |
Figure S309. Get High-res Image Gene #57: 'del_16q22.3' versus Clinical Feature #7: 'RESIDUAL_TUMOR'
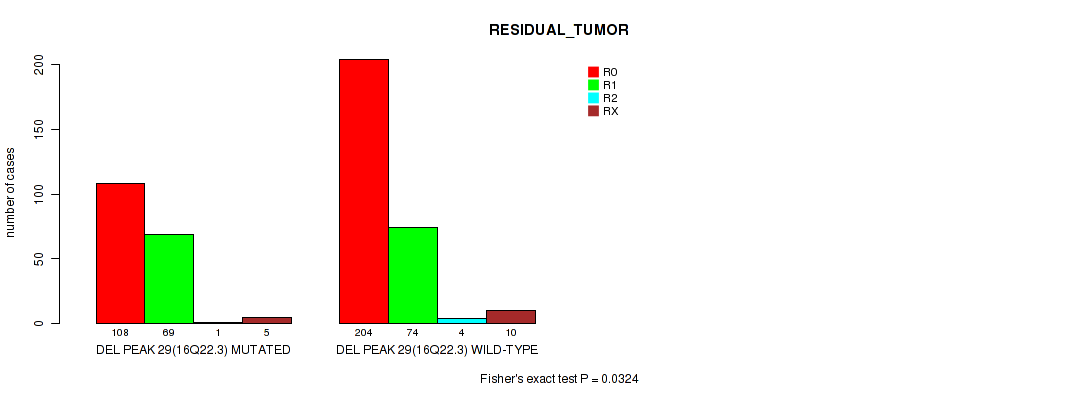
P value = 0.0106 (Wilcoxon-test), Q value = 0.042
Table S310. Gene #57: 'del_16q22.3' versus Clinical Feature #8: 'NUMBER_OF_LYMPH_NODES'
| nPatients | Mean (Std.Dev) | |
|---|---|---|
| ALL | 401 | 0.4 (1.4) |
| DEL PEAK 29(16Q22.3) MUTATED | 161 | 0.6 (1.7) |
| DEL PEAK 29(16Q22.3) WILD-TYPE | 240 | 0.3 (1.0) |
Figure S310. Get High-res Image Gene #57: 'del_16q22.3' versus Clinical Feature #8: 'NUMBER_OF_LYMPH_NODES'
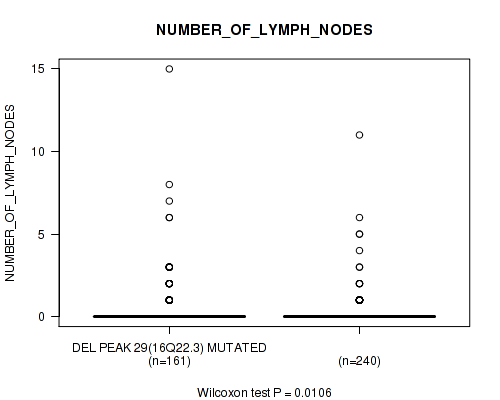
P value = 7.22e-09 (Wilcoxon-test), Q value = 4.7e-07
Table S311. Gene #57: 'del_16q22.3' versus Clinical Feature #9: 'GLEASON_SCORE'
| nPatients | Mean (Std.Dev) | |
|---|---|---|
| ALL | 491 | 7.6 (1.0) |
| DEL PEAK 29(16Q22.3) MUTATED | 190 | 7.9 (1.0) |
| DEL PEAK 29(16Q22.3) WILD-TYPE | 301 | 7.4 (1.0) |
Figure S311. Get High-res Image Gene #57: 'del_16q22.3' versus Clinical Feature #9: 'GLEASON_SCORE'

P value = 0.0905 (Wilcoxon-test), Q value = 0.2
Table S312. Gene #57: 'del_16q22.3' versus Clinical Feature #10: 'PSA_VALUE'
| nPatients | Mean (Std.Dev) | |
|---|---|---|
| ALL | 434 | 1.8 (16.0) |
| DEL PEAK 29(16Q22.3) MUTATED | 163 | 1.5 (4.9) |
| DEL PEAK 29(16Q22.3) WILD-TYPE | 271 | 2.0 (19.9) |
Figure S312. Get High-res Image Gene #57: 'del_16q22.3' versus Clinical Feature #10: 'PSA_VALUE'
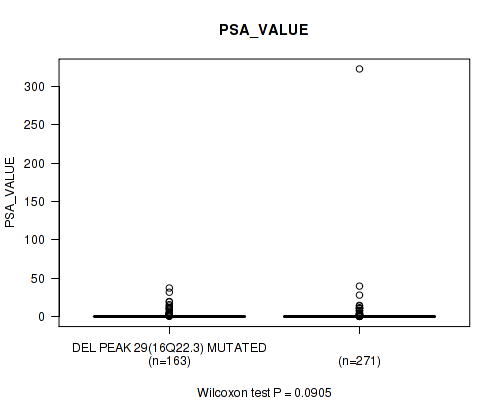
P value = 2e-05 (Fisher's exact test), Q value = 0.00029
Table S313. Gene #58: 'del_16q24.1' versus Clinical Feature #3: 'PATHOLOGY_T_STAGE'
| nPatients | T2 | T3 | T4 |
|---|---|---|---|
| ALL | 188 | 287 | 10 |
| DEL PEAK 30(16Q24.1) MUTATED | 56 | 147 | 6 |
| DEL PEAK 30(16Q24.1) WILD-TYPE | 132 | 140 | 4 |
Figure S313. Get High-res Image Gene #58: 'del_16q24.1' versus Clinical Feature #3: 'PATHOLOGY_T_STAGE'
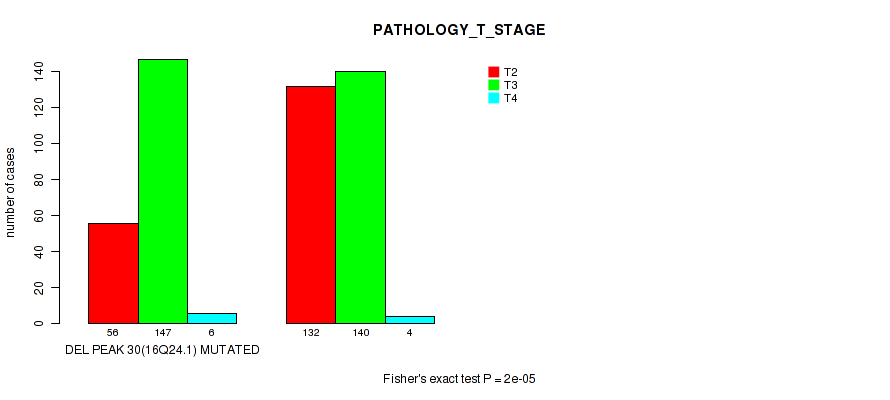
P value = 0.0425 (Fisher's exact test), Q value = 0.12
Table S314. Gene #58: 'del_16q24.1' versus Clinical Feature #4: 'PATHOLOGY_N_STAGE'
| nPatients | 0 | 1 |
|---|---|---|
| ALL | 342 | 77 |
| DEL PEAK 30(16Q24.1) MUTATED | 146 | 43 |
| DEL PEAK 30(16Q24.1) WILD-TYPE | 196 | 34 |
Figure S314. Get High-res Image Gene #58: 'del_16q24.1' versus Clinical Feature #4: 'PATHOLOGY_N_STAGE'
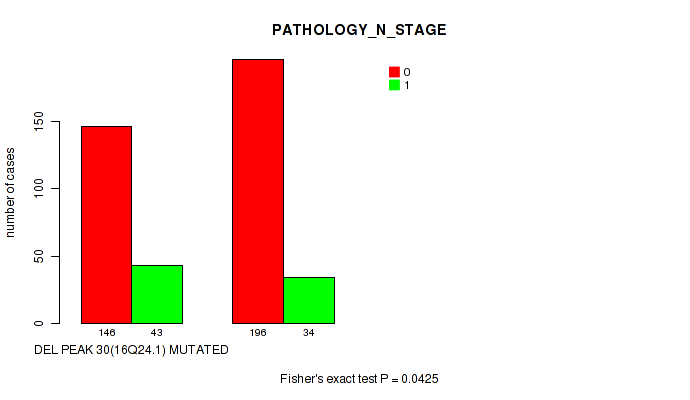
P value = 0.119 (Fisher's exact test), Q value = 0.24
Table S315. Gene #58: 'del_16q24.1' versus Clinical Feature #7: 'RESIDUAL_TUMOR'
| nPatients | R0 | R1 | R2 | RX |
|---|---|---|---|---|
| ALL | 312 | 143 | 5 | 15 |
| DEL PEAK 30(16Q24.1) MUTATED | 124 | 73 | 2 | 5 |
| DEL PEAK 30(16Q24.1) WILD-TYPE | 188 | 70 | 3 | 10 |
Figure S315. Get High-res Image Gene #58: 'del_16q24.1' versus Clinical Feature #7: 'RESIDUAL_TUMOR'
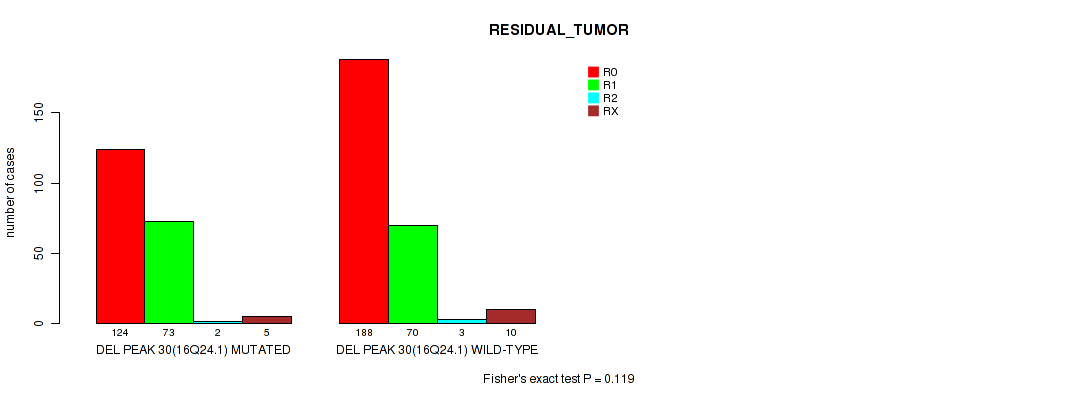
P value = 0.0209 (Wilcoxon-test), Q value = 0.07
Table S316. Gene #58: 'del_16q24.1' versus Clinical Feature #8: 'NUMBER_OF_LYMPH_NODES'
| nPatients | Mean (Std.Dev) | |
|---|---|---|
| ALL | 401 | 0.4 (1.4) |
| DEL PEAK 30(16Q24.1) MUTATED | 181 | 0.6 (1.8) |
| DEL PEAK 30(16Q24.1) WILD-TYPE | 220 | 0.3 (0.8) |
Figure S316. Get High-res Image Gene #58: 'del_16q24.1' versus Clinical Feature #8: 'NUMBER_OF_LYMPH_NODES'
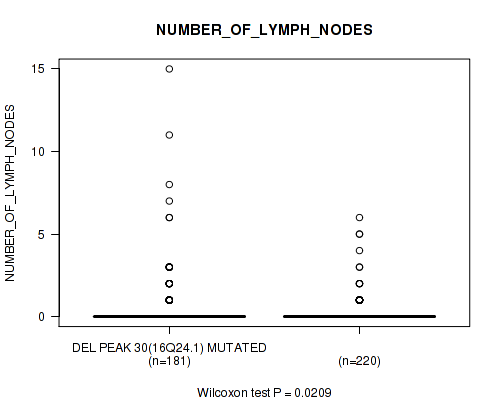
P value = 3.01e-09 (Wilcoxon-test), Q value = 2.1e-07
Table S317. Gene #58: 'del_16q24.1' versus Clinical Feature #9: 'GLEASON_SCORE'
| nPatients | Mean (Std.Dev) | |
|---|---|---|
| ALL | 491 | 7.6 (1.0) |
| DEL PEAK 30(16Q24.1) MUTATED | 212 | 7.9 (1.0) |
| DEL PEAK 30(16Q24.1) WILD-TYPE | 279 | 7.4 (0.9) |
Figure S317. Get High-res Image Gene #58: 'del_16q24.1' versus Clinical Feature #9: 'GLEASON_SCORE'
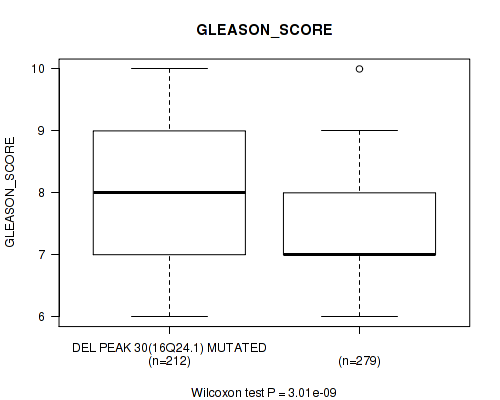
P value = 0.0634 (Wilcoxon-test), Q value = 0.15
Table S318. Gene #58: 'del_16q24.1' versus Clinical Feature #10: 'PSA_VALUE'
| nPatients | Mean (Std.Dev) | |
|---|---|---|
| ALL | 434 | 1.8 (16.0) |
| DEL PEAK 30(16Q24.1) MUTATED | 184 | 3.4 (24.2) |
| DEL PEAK 30(16Q24.1) WILD-TYPE | 250 | 0.6 (3.0) |
Figure S318. Get High-res Image Gene #58: 'del_16q24.1' versus Clinical Feature #10: 'PSA_VALUE'
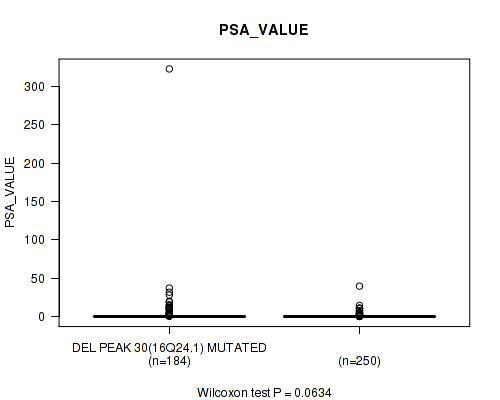
P value = 1e-05 (Fisher's exact test), Q value = 0.00016
Table S319. Gene #59: 'del_17p13.1' versus Clinical Feature #3: 'PATHOLOGY_T_STAGE'
| nPatients | T2 | T3 | T4 |
|---|---|---|---|
| ALL | 188 | 287 | 10 |
| DEL PEAK 31(17P13.1) MUTATED | 39 | 114 | 6 |
| DEL PEAK 31(17P13.1) WILD-TYPE | 149 | 173 | 4 |
Figure S319. Get High-res Image Gene #59: 'del_17p13.1' versus Clinical Feature #3: 'PATHOLOGY_T_STAGE'
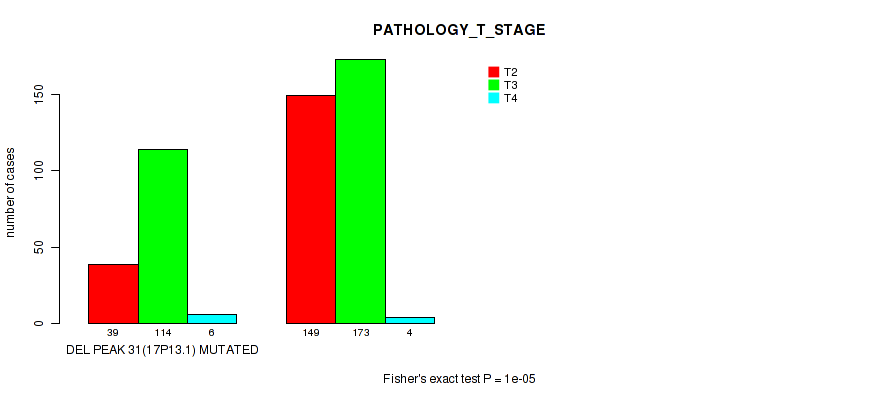
P value = 0.00344 (Fisher's exact test), Q value = 0.017
Table S320. Gene #59: 'del_17p13.1' versus Clinical Feature #4: 'PATHOLOGY_N_STAGE'
| nPatients | 0 | 1 |
|---|---|---|
| ALL | 342 | 77 |
| DEL PEAK 31(17P13.1) MUTATED | 107 | 38 |
| DEL PEAK 31(17P13.1) WILD-TYPE | 235 | 39 |
Figure S320. Get High-res Image Gene #59: 'del_17p13.1' versus Clinical Feature #4: 'PATHOLOGY_N_STAGE'
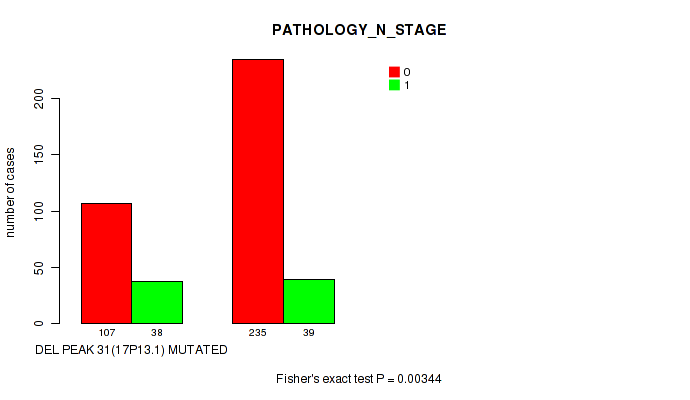
P value = 0.0161 (Fisher's exact test), Q value = 0.058
Table S321. Gene #59: 'del_17p13.1' versus Clinical Feature #5: 'RADIATION_THERAPY'
| nPatients | NO | YES |
|---|---|---|
| ALL | 378 | 57 |
| DEL PEAK 31(17P13.1) MUTATED | 117 | 27 |
| DEL PEAK 31(17P13.1) WILD-TYPE | 261 | 30 |
Figure S321. Get High-res Image Gene #59: 'del_17p13.1' versus Clinical Feature #5: 'RADIATION_THERAPY'
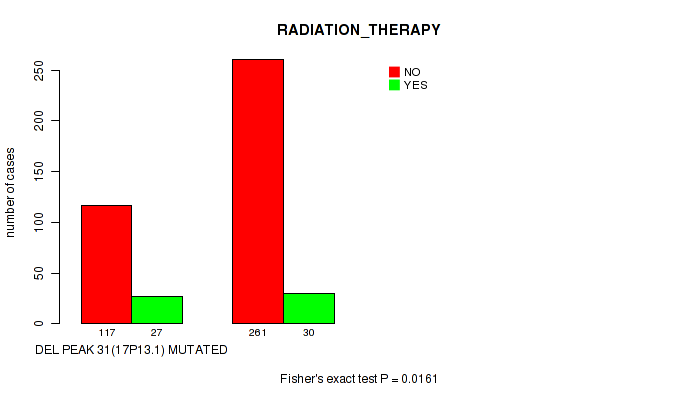
P value = 0.0152 (Fisher's exact test), Q value = 0.055
Table S322. Gene #59: 'del_17p13.1' versus Clinical Feature #7: 'RESIDUAL_TUMOR'
| nPatients | R0 | R1 | R2 | RX |
|---|---|---|---|---|
| ALL | 312 | 143 | 5 | 15 |
| DEL PEAK 31(17P13.1) MUTATED | 92 | 61 | 0 | 4 |
| DEL PEAK 31(17P13.1) WILD-TYPE | 220 | 82 | 5 | 11 |
Figure S322. Get High-res Image Gene #59: 'del_17p13.1' versus Clinical Feature #7: 'RESIDUAL_TUMOR'
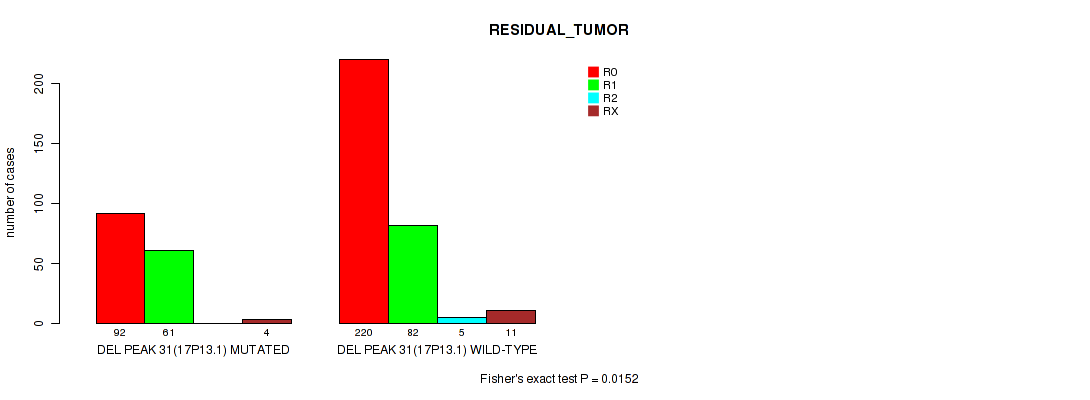
P value = 0.000435 (Wilcoxon-test), Q value = 0.0037
Table S323. Gene #59: 'del_17p13.1' versus Clinical Feature #8: 'NUMBER_OF_LYMPH_NODES'
| nPatients | Mean (Std.Dev) | |
|---|---|---|
| ALL | 401 | 0.4 (1.4) |
| DEL PEAK 31(17P13.1) MUTATED | 135 | 0.7 (1.7) |
| DEL PEAK 31(17P13.1) WILD-TYPE | 266 | 0.3 (1.2) |
Figure S323. Get High-res Image Gene #59: 'del_17p13.1' versus Clinical Feature #8: 'NUMBER_OF_LYMPH_NODES'

P value = 1.99e-09 (Wilcoxon-test), Q value = 1.7e-07
Table S324. Gene #59: 'del_17p13.1' versus Clinical Feature #9: 'GLEASON_SCORE'
| nPatients | Mean (Std.Dev) | |
|---|---|---|
| ALL | 491 | 7.6 (1.0) |
| DEL PEAK 31(17P13.1) MUTATED | 162 | 8.0 (1.0) |
| DEL PEAK 31(17P13.1) WILD-TYPE | 329 | 7.4 (0.9) |
Figure S324. Get High-res Image Gene #59: 'del_17p13.1' versus Clinical Feature #9: 'GLEASON_SCORE'

P value = 0.114 (Fisher's exact test), Q value = 0.24
Table S325. Gene #60: 'del_17q21.31' versus Clinical Feature #3: 'PATHOLOGY_T_STAGE'
| nPatients | T2 | T3 | T4 |
|---|---|---|---|
| ALL | 188 | 287 | 10 |
| DEL PEAK 32(17Q21.31) MUTATED | 29 | 63 | 3 |
| DEL PEAK 32(17Q21.31) WILD-TYPE | 159 | 224 | 7 |
Figure S325. Get High-res Image Gene #60: 'del_17q21.31' versus Clinical Feature #3: 'PATHOLOGY_T_STAGE'
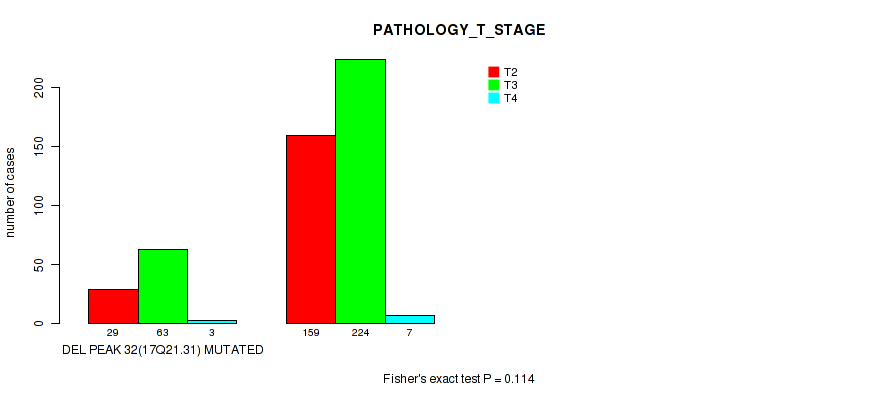
P value = 0.00045 (Fisher's exact test), Q value = 0.0037
Table S326. Gene #61: 'del_18q21.31' versus Clinical Feature #3: 'PATHOLOGY_T_STAGE'
| nPatients | T2 | T3 | T4 |
|---|---|---|---|
| ALL | 188 | 287 | 10 |
| DEL PEAK 33(18Q21.31) MUTATED | 32 | 92 | 4 |
| DEL PEAK 33(18Q21.31) WILD-TYPE | 156 | 195 | 6 |
Figure S326. Get High-res Image Gene #61: 'del_18q21.31' versus Clinical Feature #3: 'PATHOLOGY_T_STAGE'

P value = 0.0239 (Fisher's exact test), Q value = 0.076
Table S327. Gene #61: 'del_18q21.31' versus Clinical Feature #4: 'PATHOLOGY_N_STAGE'
| nPatients | 0 | 1 |
|---|---|---|
| ALL | 342 | 77 |
| DEL PEAK 33(18Q21.31) MUTATED | 87 | 30 |
| DEL PEAK 33(18Q21.31) WILD-TYPE | 255 | 47 |
Figure S327. Get High-res Image Gene #61: 'del_18q21.31' versus Clinical Feature #4: 'PATHOLOGY_N_STAGE'
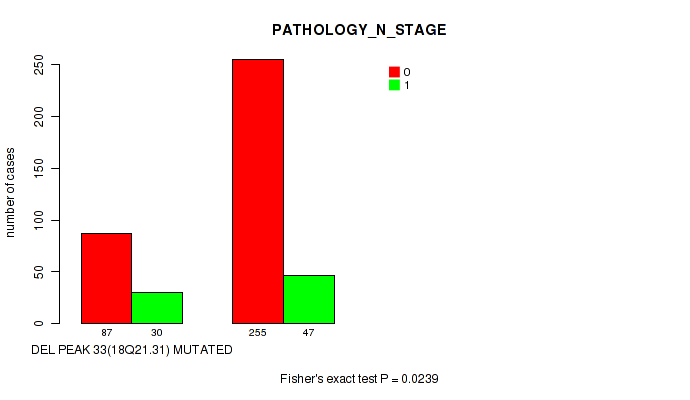
P value = 0.0505 (Fisher's exact test), Q value = 0.13
Table S328. Gene #61: 'del_18q21.31' versus Clinical Feature #5: 'RADIATION_THERAPY'
| nPatients | NO | YES |
|---|---|---|
| ALL | 378 | 57 |
| DEL PEAK 33(18Q21.31) MUTATED | 91 | 21 |
| DEL PEAK 33(18Q21.31) WILD-TYPE | 287 | 36 |
Figure S328. Get High-res Image Gene #61: 'del_18q21.31' versus Clinical Feature #5: 'RADIATION_THERAPY'
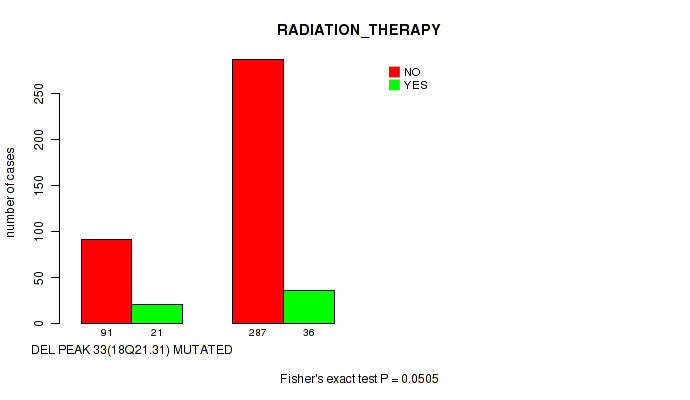
P value = 0.00116 (Fisher's exact test), Q value = 0.0074
Table S329. Gene #61: 'del_18q21.31' versus Clinical Feature #7: 'RESIDUAL_TUMOR'
| nPatients | R0 | R1 | R2 | RX |
|---|---|---|---|---|
| ALL | 312 | 143 | 5 | 15 |
| DEL PEAK 33(18Q21.31) MUTATED | 70 | 55 | 0 | 2 |
| DEL PEAK 33(18Q21.31) WILD-TYPE | 242 | 88 | 5 | 13 |
Figure S329. Get High-res Image Gene #61: 'del_18q21.31' versus Clinical Feature #7: 'RESIDUAL_TUMOR'
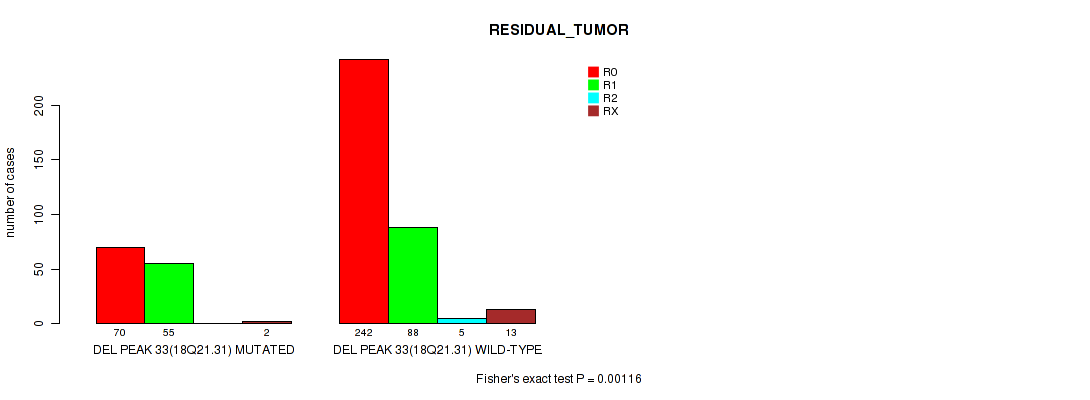
P value = 0.0142 (Wilcoxon-test), Q value = 0.052
Table S330. Gene #61: 'del_18q21.31' versus Clinical Feature #8: 'NUMBER_OF_LYMPH_NODES'
| nPatients | Mean (Std.Dev) | |
|---|---|---|
| ALL | 401 | 0.4 (1.4) |
| DEL PEAK 33(18Q21.31) MUTATED | 112 | 0.7 (2.1) |
| DEL PEAK 33(18Q21.31) WILD-TYPE | 289 | 0.3 (1.0) |
Figure S330. Get High-res Image Gene #61: 'del_18q21.31' versus Clinical Feature #8: 'NUMBER_OF_LYMPH_NODES'

P value = 4.75e-06 (Wilcoxon-test), Q value = 0.00013
Table S331. Gene #61: 'del_18q21.31' versus Clinical Feature #9: 'GLEASON_SCORE'
| nPatients | Mean (Std.Dev) | |
|---|---|---|
| ALL | 491 | 7.6 (1.0) |
| DEL PEAK 33(18Q21.31) MUTATED | 130 | 8.0 (1.0) |
| DEL PEAK 33(18Q21.31) WILD-TYPE | 361 | 7.5 (1.0) |
Figure S331. Get High-res Image Gene #61: 'del_18q21.31' versus Clinical Feature #9: 'GLEASON_SCORE'
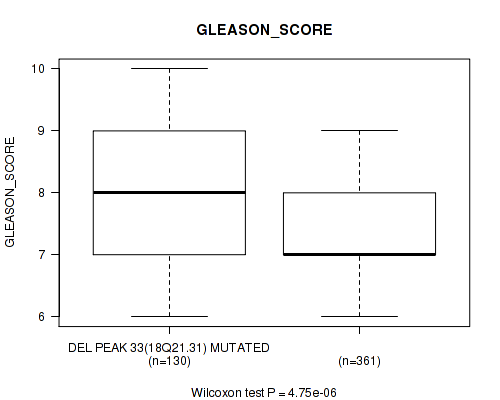
P value = 5e-04 (Fisher's exact test), Q value = 0.0038
Table S332. Gene #62: 'del_18q23' versus Clinical Feature #3: 'PATHOLOGY_T_STAGE'
| nPatients | T2 | T3 | T4 |
|---|---|---|---|
| ALL | 188 | 287 | 10 |
| DEL PEAK 34(18Q23) MUTATED | 34 | 96 | 4 |
| DEL PEAK 34(18Q23) WILD-TYPE | 154 | 191 | 6 |
Figure S332. Get High-res Image Gene #62: 'del_18q23' versus Clinical Feature #3: 'PATHOLOGY_T_STAGE'
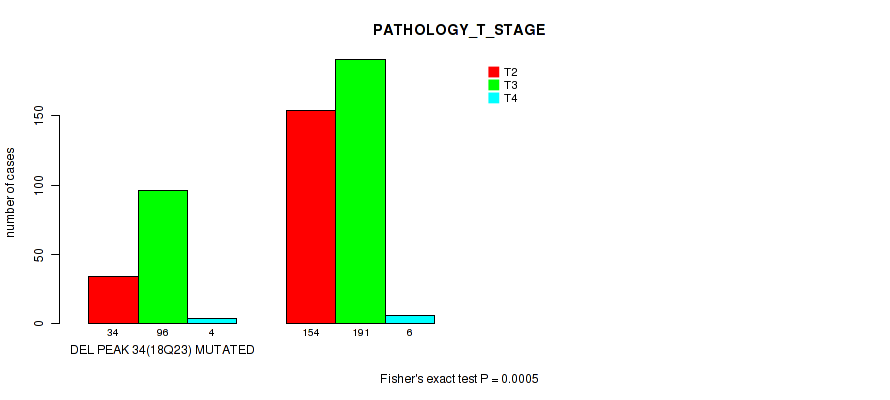
P value = 0.00519 (Fisher's exact test), Q value = 0.023
Table S333. Gene #62: 'del_18q23' versus Clinical Feature #4: 'PATHOLOGY_N_STAGE'
| nPatients | 0 | 1 |
|---|---|---|
| ALL | 342 | 77 |
| DEL PEAK 34(18Q23) MUTATED | 89 | 33 |
| DEL PEAK 34(18Q23) WILD-TYPE | 253 | 44 |
Figure S333. Get High-res Image Gene #62: 'del_18q23' versus Clinical Feature #4: 'PATHOLOGY_N_STAGE'

P value = 0.11 (Fisher's exact test), Q value = 0.23
Table S334. Gene #62: 'del_18q23' versus Clinical Feature #5: 'RADIATION_THERAPY'
| nPatients | NO | YES |
|---|---|---|
| ALL | 378 | 57 |
| DEL PEAK 34(18Q23) MUTATED | 98 | 21 |
| DEL PEAK 34(18Q23) WILD-TYPE | 280 | 36 |
Figure S334. Get High-res Image Gene #62: 'del_18q23' versus Clinical Feature #5: 'RADIATION_THERAPY'
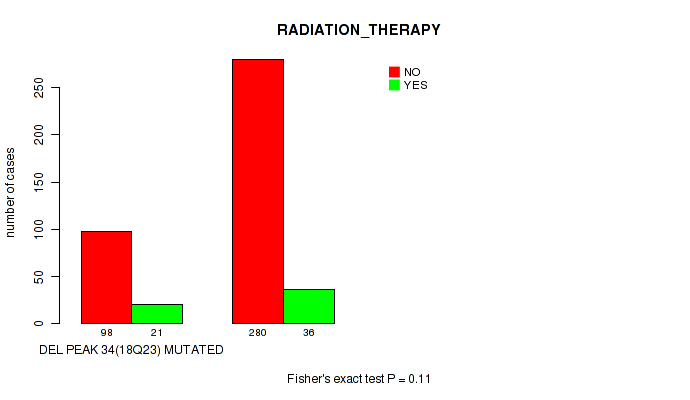
P value = 0.0037 (Fisher's exact test), Q value = 0.018
Table S335. Gene #62: 'del_18q23' versus Clinical Feature #7: 'RESIDUAL_TUMOR'
| nPatients | R0 | R1 | R2 | RX |
|---|---|---|---|---|
| ALL | 312 | 143 | 5 | 15 |
| DEL PEAK 34(18Q23) MUTATED | 75 | 55 | 0 | 2 |
| DEL PEAK 34(18Q23) WILD-TYPE | 237 | 88 | 5 | 13 |
Figure S335. Get High-res Image Gene #62: 'del_18q23' versus Clinical Feature #7: 'RESIDUAL_TUMOR'

P value = 0.00234 (Wilcoxon-test), Q value = 0.013
Table S336. Gene #62: 'del_18q23' versus Clinical Feature #8: 'NUMBER_OF_LYMPH_NODES'
| nPatients | Mean (Std.Dev) | |
|---|---|---|
| ALL | 401 | 0.4 (1.4) |
| DEL PEAK 34(18Q23) MUTATED | 117 | 0.8 (2.1) |
| DEL PEAK 34(18Q23) WILD-TYPE | 284 | 0.3 (0.9) |
Figure S336. Get High-res Image Gene #62: 'del_18q23' versus Clinical Feature #8: 'NUMBER_OF_LYMPH_NODES'

P value = 9.81e-07 (Wilcoxon-test), Q value = 3.2e-05
Table S337. Gene #62: 'del_18q23' versus Clinical Feature #9: 'GLEASON_SCORE'
| nPatients | Mean (Std.Dev) | |
|---|---|---|
| ALL | 491 | 7.6 (1.0) |
| DEL PEAK 34(18Q23) MUTATED | 136 | 8.0 (1.0) |
| DEL PEAK 34(18Q23) WILD-TYPE | 355 | 7.5 (1.0) |
Figure S337. Get High-res Image Gene #62: 'del_18q23' versus Clinical Feature #9: 'GLEASON_SCORE'
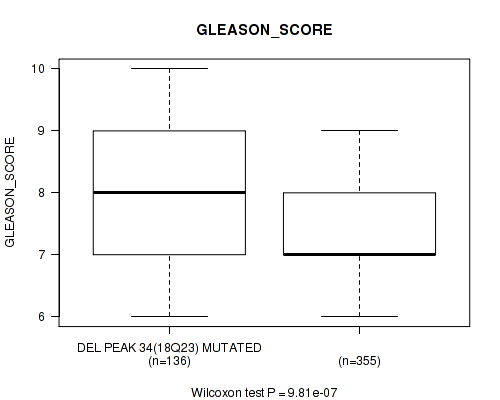
P value = 0.033 (Wilcoxon-test), Q value = 0.095
Table S338. Gene #62: 'del_18q23' versus Clinical Feature #10: 'PSA_VALUE'
| nPatients | Mean (Std.Dev) | |
|---|---|---|
| ALL | 434 | 1.8 (16.0) |
| DEL PEAK 34(18Q23) MUTATED | 119 | 4.3 (30.0) |
| DEL PEAK 34(18Q23) WILD-TYPE | 315 | 0.9 (3.4) |
Figure S338. Get High-res Image Gene #62: 'del_18q23' versus Clinical Feature #10: 'PSA_VALUE'
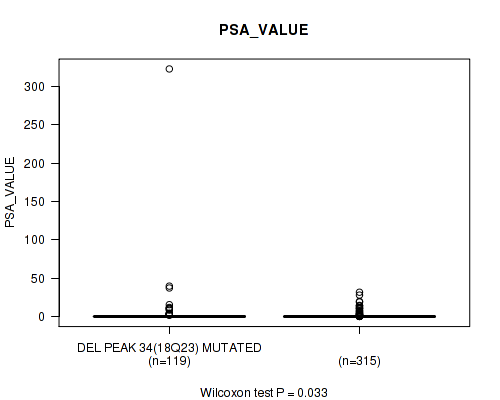
P value = 0.109 (logrank test), Q value = 0.23
Table S339. Gene #63: 'del_19q13.2' versus Clinical Feature #1: 'Time to Death'
| nPatients | nDeath | Duration Range (Median), Month | |
|---|---|---|---|
| ALL | 489 | 9 | 0.7 - 165.2 (28.8) |
| DEL PEAK 35(19Q13.2) MUTATED | 52 | 2 | 0.8 - 113.3 (28.8) |
| DEL PEAK 35(19Q13.2) WILD-TYPE | 437 | 7 | 0.7 - 165.2 (28.8) |
Figure S339. Get High-res Image Gene #63: 'del_19q13.2' versus Clinical Feature #1: 'Time to Death'
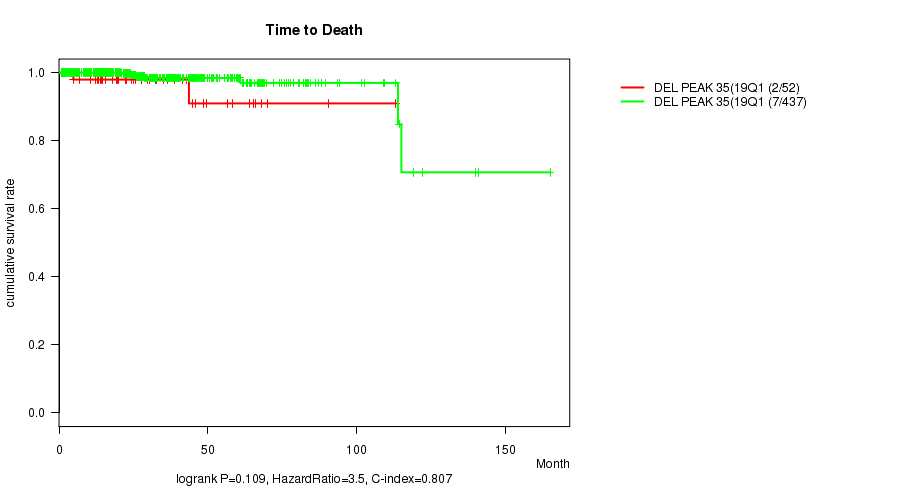
P value = 0.0496 (Wilcoxon-test), Q value = 0.13
Table S340. Gene #63: 'del_19q13.2' versus Clinical Feature #2: 'YEARS_TO_BIRTH'
| nPatients | Mean (Std.Dev) | |
|---|---|---|
| ALL | 480 | 61.0 (6.8) |
| DEL PEAK 35(19Q13.2) MUTATED | 51 | 62.6 (6.6) |
| DEL PEAK 35(19Q13.2) WILD-TYPE | 429 | 60.8 (6.8) |
Figure S340. Get High-res Image Gene #63: 'del_19q13.2' versus Clinical Feature #2: 'YEARS_TO_BIRTH'

P value = 0.00499 (Fisher's exact test), Q value = 0.022
Table S341. Gene #63: 'del_19q13.2' versus Clinical Feature #3: 'PATHOLOGY_T_STAGE'
| nPatients | T2 | T3 | T4 |
|---|---|---|---|
| ALL | 188 | 287 | 10 |
| DEL PEAK 35(19Q13.2) MUTATED | 11 | 37 | 3 |
| DEL PEAK 35(19Q13.2) WILD-TYPE | 177 | 250 | 7 |
Figure S341. Get High-res Image Gene #63: 'del_19q13.2' versus Clinical Feature #3: 'PATHOLOGY_T_STAGE'
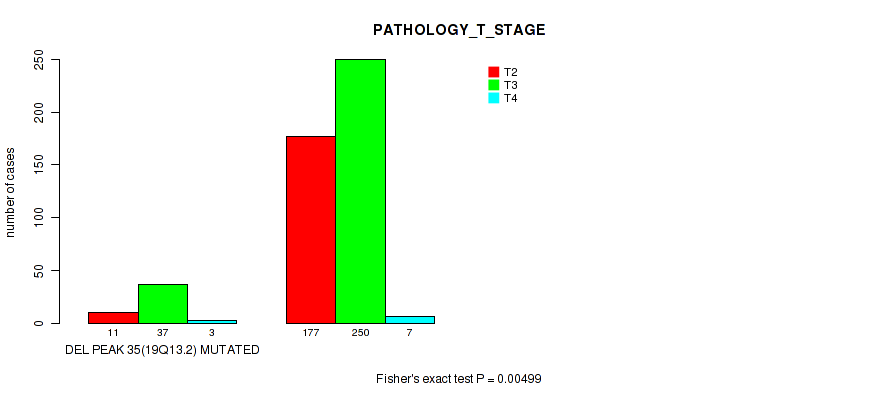
P value = 0.0428 (Fisher's exact test), Q value = 0.12
Table S342. Gene #63: 'del_19q13.2' versus Clinical Feature #7: 'RESIDUAL_TUMOR'
| nPatients | R0 | R1 | R2 | RX |
|---|---|---|---|---|
| ALL | 312 | 143 | 5 | 15 |
| DEL PEAK 35(19Q13.2) MUTATED | 27 | 24 | 0 | 0 |
| DEL PEAK 35(19Q13.2) WILD-TYPE | 285 | 119 | 5 | 15 |
Figure S342. Get High-res Image Gene #63: 'del_19q13.2' versus Clinical Feature #7: 'RESIDUAL_TUMOR'
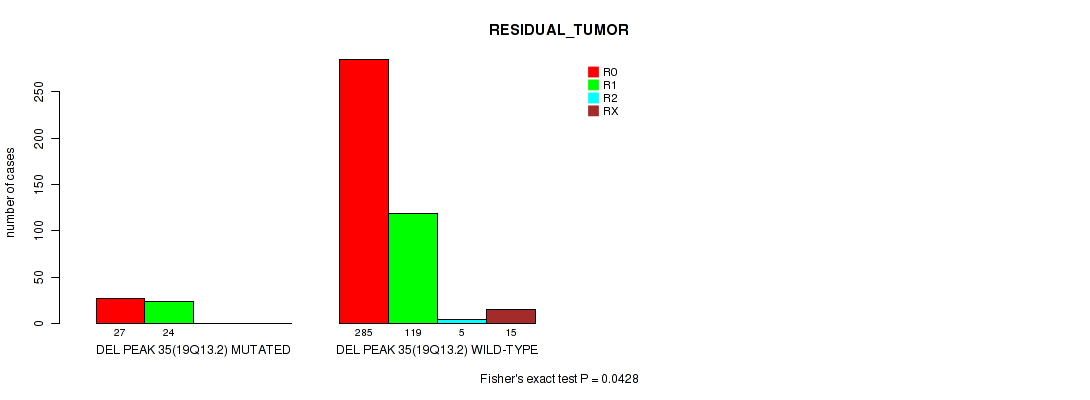
P value = 0.00025 (Wilcoxon-test), Q value = 0.0024
Table S343. Gene #63: 'del_19q13.2' versus Clinical Feature #9: 'GLEASON_SCORE'
| nPatients | Mean (Std.Dev) | |
|---|---|---|
| ALL | 491 | 7.6 (1.0) |
| DEL PEAK 35(19Q13.2) MUTATED | 52 | 8.1 (1.0) |
| DEL PEAK 35(19Q13.2) WILD-TYPE | 439 | 7.5 (1.0) |
Figure S343. Get High-res Image Gene #63: 'del_19q13.2' versus Clinical Feature #9: 'GLEASON_SCORE'
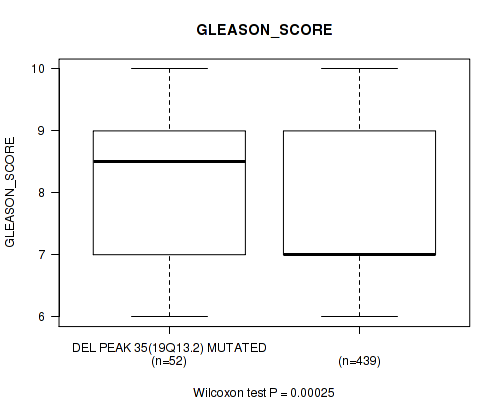
P value = 0.00166 (Fisher's exact test), Q value = 0.0098
Table S344. Gene #64: 'del_21q22.2' versus Clinical Feature #3: 'PATHOLOGY_T_STAGE'
| nPatients | T2 | T3 | T4 |
|---|---|---|---|
| ALL | 188 | 287 | 10 |
| DEL PEAK 36(21Q22.2) MUTATED | 10 | 39 | 3 |
| DEL PEAK 36(21Q22.2) WILD-TYPE | 178 | 248 | 7 |
Figure S344. Get High-res Image Gene #64: 'del_21q22.2' versus Clinical Feature #3: 'PATHOLOGY_T_STAGE'

P value = 0.066 (Fisher's exact test), Q value = 0.16
Table S345. Gene #64: 'del_21q22.2' versus Clinical Feature #4: 'PATHOLOGY_N_STAGE'
| nPatients | 0 | 1 |
|---|---|---|
| ALL | 342 | 77 |
| DEL PEAK 36(21Q22.2) MUTATED | 32 | 13 |
| DEL PEAK 36(21Q22.2) WILD-TYPE | 310 | 64 |
Figure S345. Get High-res Image Gene #64: 'del_21q22.2' versus Clinical Feature #4: 'PATHOLOGY_N_STAGE'
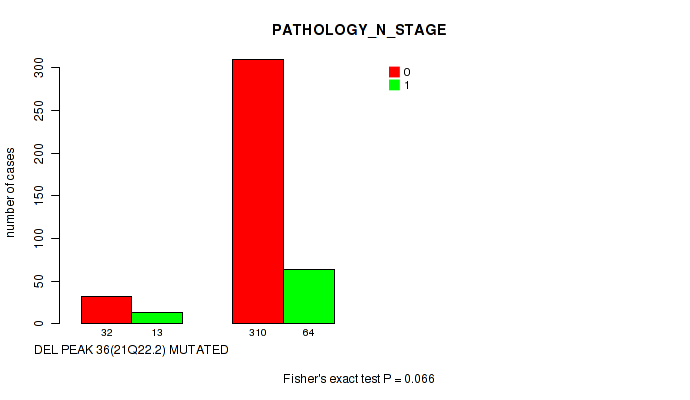
P value = 0.101 (Fisher's exact test), Q value = 0.22
Table S346. Gene #64: 'del_21q22.2' versus Clinical Feature #5: 'RADIATION_THERAPY'
| nPatients | NO | YES |
|---|---|---|
| ALL | 378 | 57 |
| DEL PEAK 36(21Q22.2) MUTATED | 36 | 10 |
| DEL PEAK 36(21Q22.2) WILD-TYPE | 342 | 47 |
Figure S346. Get High-res Image Gene #64: 'del_21q22.2' versus Clinical Feature #5: 'RADIATION_THERAPY'

P value = 0.0341 (Wilcoxon-test), Q value = 0.097
Table S347. Gene #64: 'del_21q22.2' versus Clinical Feature #8: 'NUMBER_OF_LYMPH_NODES'
| nPatients | Mean (Std.Dev) | |
|---|---|---|
| ALL | 401 | 0.4 (1.4) |
| DEL PEAK 36(21Q22.2) MUTATED | 42 | 0.8 (1.9) |
| DEL PEAK 36(21Q22.2) WILD-TYPE | 359 | 0.4 (1.3) |
Figure S347. Get High-res Image Gene #64: 'del_21q22.2' versus Clinical Feature #8: 'NUMBER_OF_LYMPH_NODES'
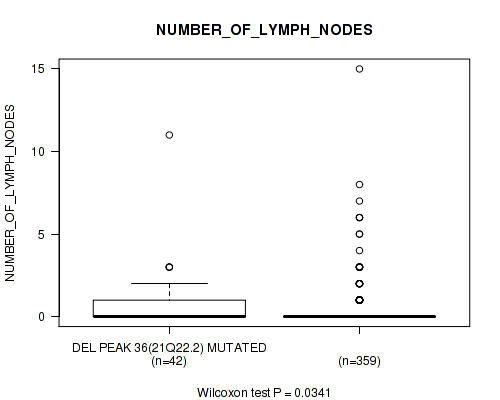
P value = 0.0347 (Wilcoxon-test), Q value = 0.098
Table S348. Gene #64: 'del_21q22.2' versus Clinical Feature #9: 'GLEASON_SCORE'
| nPatients | Mean (Std.Dev) | |
|---|---|---|
| ALL | 491 | 7.6 (1.0) |
| DEL PEAK 36(21Q22.2) MUTATED | 52 | 7.9 (1.1) |
| DEL PEAK 36(21Q22.2) WILD-TYPE | 439 | 7.6 (1.0) |
Figure S348. Get High-res Image Gene #64: 'del_21q22.2' versus Clinical Feature #9: 'GLEASON_SCORE'

P value = 0.0774 (Fisher's exact test), Q value = 0.18
Table S349. Gene #64: 'del_21q22.2' versus Clinical Feature #11: 'RACE'
| nPatients | ASIAN | BLACK OR AFRICAN AMERICAN | WHITE |
|---|---|---|---|
| ALL | 2 | 7 | 146 |
| DEL PEAK 36(21Q22.2) MUTATED | 1 | 2 | 15 |
| DEL PEAK 36(21Q22.2) WILD-TYPE | 1 | 5 | 131 |
Figure S349. Get High-res Image Gene #64: 'del_21q22.2' versus Clinical Feature #11: 'RACE'
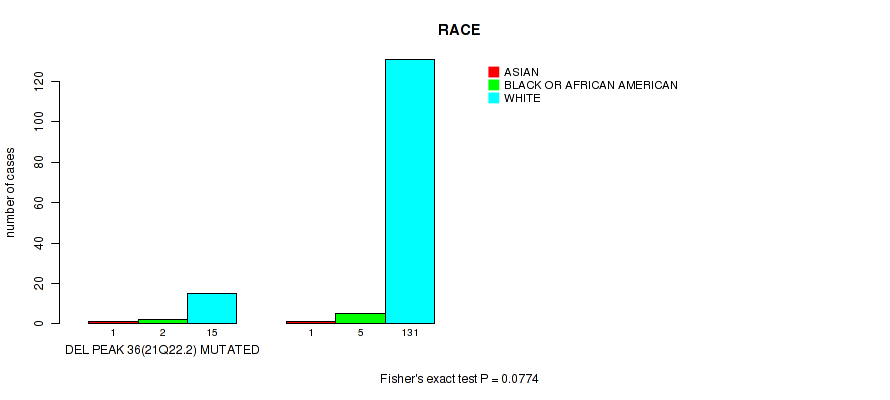
P value = 0.0509 (Fisher's exact test), Q value = 0.13
Table S350. Gene #65: 'del_21q22.3' versus Clinical Feature #3: 'PATHOLOGY_T_STAGE'
| nPatients | T2 | T3 | T4 |
|---|---|---|---|
| ALL | 188 | 287 | 10 |
| DEL PEAK 37(21Q22.3) MUTATED | 46 | 94 | 5 |
| DEL PEAK 37(21Q22.3) WILD-TYPE | 142 | 193 | 5 |
Figure S350. Get High-res Image Gene #65: 'del_21q22.3' versus Clinical Feature #3: 'PATHOLOGY_T_STAGE'
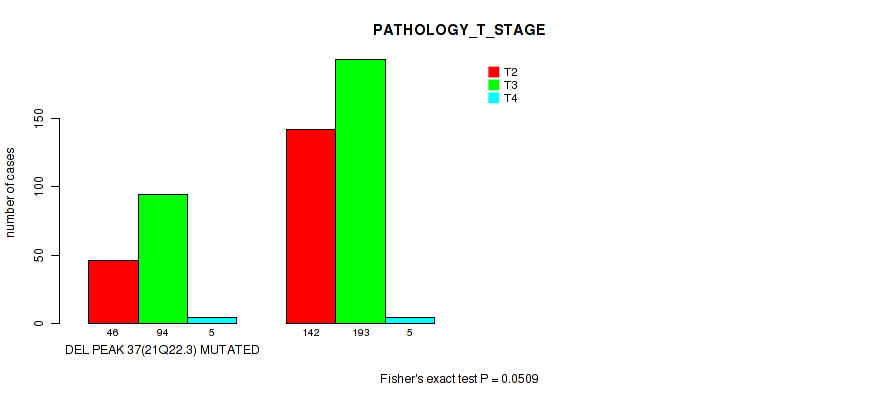
P value = 0.0572 (Wilcoxon-test), Q value = 0.14
Table S351. Gene #65: 'del_21q22.3' versus Clinical Feature #8: 'NUMBER_OF_LYMPH_NODES'
| nPatients | Mean (Std.Dev) | |
|---|---|---|
| ALL | 401 | 0.4 (1.4) |
| DEL PEAK 37(21Q22.3) MUTATED | 119 | 0.7 (2.0) |
| DEL PEAK 37(21Q22.3) WILD-TYPE | 282 | 0.3 (1.0) |
Figure S351. Get High-res Image Gene #65: 'del_21q22.3' versus Clinical Feature #8: 'NUMBER_OF_LYMPH_NODES'
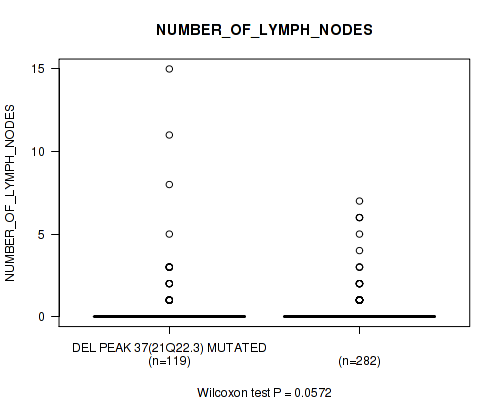
-
Copy number data file = all_lesions.txt from GISTIC pipeline
-
Processed Copy number data file = /xchip/cga/gdac-prod/tcga-gdac/jobResults/GDAC_Correlate_Genomic_Events_Preprocess/PRAD-TP/19782426/transformed.cor.cli.txt
-
Clinical data file = /xchip/cga/gdac-prod/tcga-gdac/jobResults/Append_Data/PRAD-TP/19775467/PRAD-TP.merged_data.txt
-
Number of patients = 491
-
Number of significantly focal cnvs = 65
-
Number of selected clinical features = 11
-
Exclude genes that fewer than K tumors have mutations, K = 3
For survival clinical features, the Kaplan-Meier survival curves of tumors with and without gene mutations were plotted and the statistical significance P values were estimated by logrank test (Bland and Altman 2004) using the 'survdiff' function in R
For binary or multi-class clinical features (nominal or ordinal), two-tailed Fisher's exact tests (Fisher 1922) were used to estimate the P values using the 'fisher.test' function in R
For multiple hypothesis correction, Q value is the False Discovery Rate (FDR) analogue of the P value (Benjamini and Hochberg 1995), defined as the minimum FDR at which the test may be called significant. We used the 'Benjamini and Hochberg' method of 'p.adjust' function in R to convert P values into Q values.
In addition to the links below, the full results of the analysis summarized in this report can also be downloaded programmatically using firehose_get, or interactively from either the Broad GDAC website or TCGA Data Coordination Center Portal.