This report serves to describe the mutational landscape and properties of a given individual set, as well as rank genes and genesets according to mutational significance. MutSig v2.0 was used to generate the results found in this report.
-
Working with individual set: ESCA-TP
-
Number of patients in set: 185
The input for this pipeline is a set of individuals with the following files associated for each:
-
An annotated .maf file describing the mutations called for the respective individual, and their properties.
-
A .wig file that contains information about the coverage of the sample.
-
MAF used for this analysis:ESCA-TP.final_analysis_set.maf
-
Blacklist used for this analysis: pancan_mutation_blacklist.v14.hg19.txt
-
Significantly mutated genes (q ≤ 0.1): 56
-
Mutations seen in COSMIC: 358
-
Significantly mutated genes in COSMIC territory: 17
-
Significantly mutated genesets: 30
-
Significantly mutated genesets: (excluding sig. mutated genes):0
-
Read 185 MAFs of type "maf1"
-
Total number of mutations in input MAFs: 58419
-
After removing 185 mutations outside chr1-24: 58234
-
After removing 1049 blacklisted mutations: 57185
-
After removing 8556 noncoding mutations: 48629
-
After collapsing adjacent/redundant mutations: 47397
-
Number of mutations before filtering: 47397
-
After removing 3268 mutations outside gene set: 44129
-
After removing 58 mutations outside category set: 44071
-
After removing 2 "impossible" mutations in
-
gene-patient-category bins of zero coverage: 40743
Table 1. Get Full Table Table representing breakdown of mutations by type.
| type | count |
|---|---|
| De_novo_Start_InFrame | 7 |
| De_novo_Start_OutOfFrame | 19 |
| Frame_Shift_Del | 1450 |
| Frame_Shift_Ins | 530 |
| In_Frame_Del | 329 |
| In_Frame_Ins | 48 |
| Missense_Mutation | 28340 |
| Nonsense_Mutation | 2220 |
| Nonstop_Mutation | 31 |
| Silent | 9493 |
| Splice_Site | 1560 |
| Start_Codon_Ins | 6 |
| Start_Codon_SNP | 35 |
| Stop_Codon_Del | 3 |
| Total | 44071 |
Table 2. Get Full Table A breakdown of mutation rates per category discovered for this individual set.
| category | n | N | rate | rate_per_mb | relative_rate | exp_ns_s_ratio |
|---|---|---|---|---|---|---|
| *CpG->(A/T) | 7092 | 315474250 | 0.000022 | 22 | 3.7 | 2.1 |
| *Cp(A/C/T)->(A/T) | 12091 | 2573710473 | 4.7e-06 | 4.7 | 0.77 | 2.7 |
| A->(C/G) | 4922 | 2762123896 | 1.8e-06 | 1.8 | 0.29 | 3.4 |
| flip | 4270 | 5651308619 | 7.6e-07 | 0.76 | 0.12 | 5.3 |
| indel+null | 6148 | 5651308619 | 1.1e-06 | 1.1 | 0.18 | NaN |
| double_null | 55 | 5651308619 | 9.7e-09 | 0.0097 | 0.0016 | NaN |
| Total | 34578 | 5651308619 | 6.1e-06 | 6.1 | 1 | 3.5 |
The x axis represents the samples. The y axis represents the exons, one row per exon, and they are sorted by average coverage across samples. For exons with exactly the same average coverage, they are sorted next by the %GC of the exon. (The secondary sort is especially useful for the zero-coverage exons at the bottom). If the figure is unpopulated, then full coverage is assumed (e.g. MutSig CV doesn't use WIGs and assumes full coverage).
Figure 1.
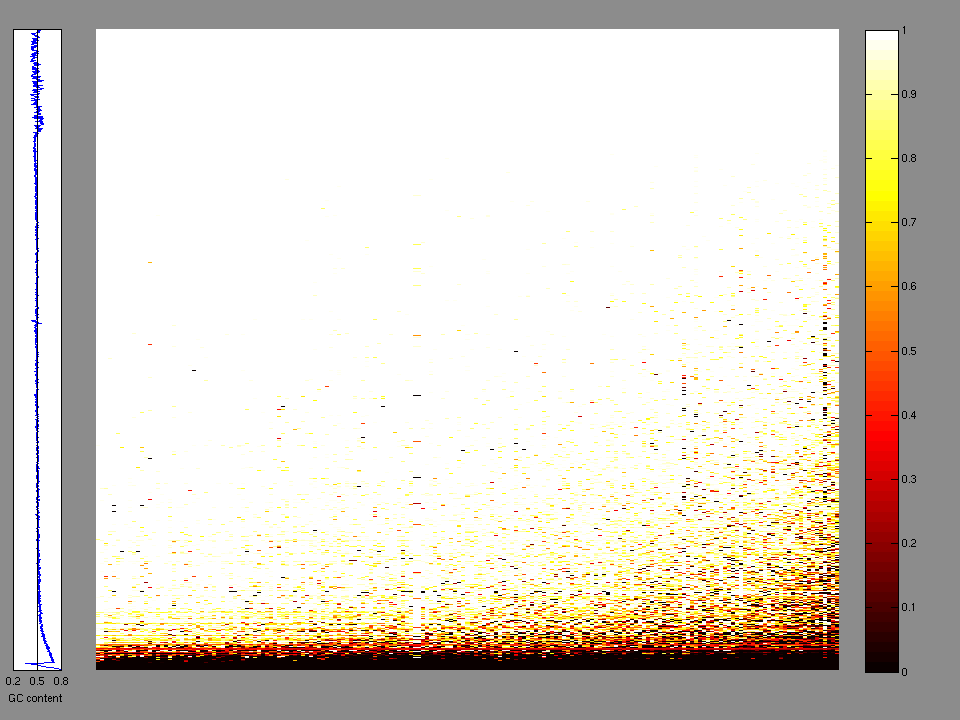
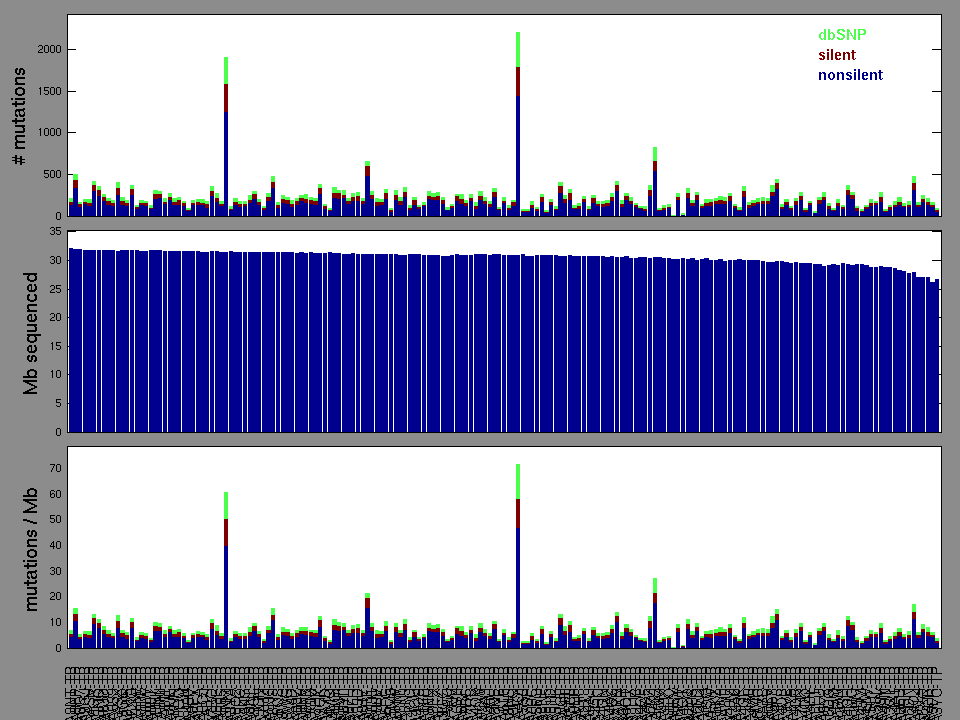
Figure 2. Patients counts and rates file used to generate this plot: ESCA-TP.patients.counts_and_rates.txt
The mutation spectrum is depicted in the lego plots below in which the 96 possible mutation types are subdivided into six large blocks, color-coded to reflect the base substitution type. Each large block is further subdivided into the 16 possible pairs of 5' and 3' neighbors, as listed in the 4x4 trinucleotide context legend. The height of each block corresponds to the mutation frequency for that kind of mutation (counts of mutations normalized by the base coverage in a given bin). The shape of the spectrum is a signature for dominant mutational mechanisms in different tumor types.
Figure 3. Get High-res Image SNV Mutation rate lego plot for entire set. Each bin is normalized by base coverage for that bin. Colors represent the six SNV types on the upper right. The three-base context for each mutation is labeled in the 4x4 legend on the lower right. The fractional breakdown of SNV counts is shown in the pie chart on the upper left. If this figure is blank, not enough information was provided in the MAF to generate it.
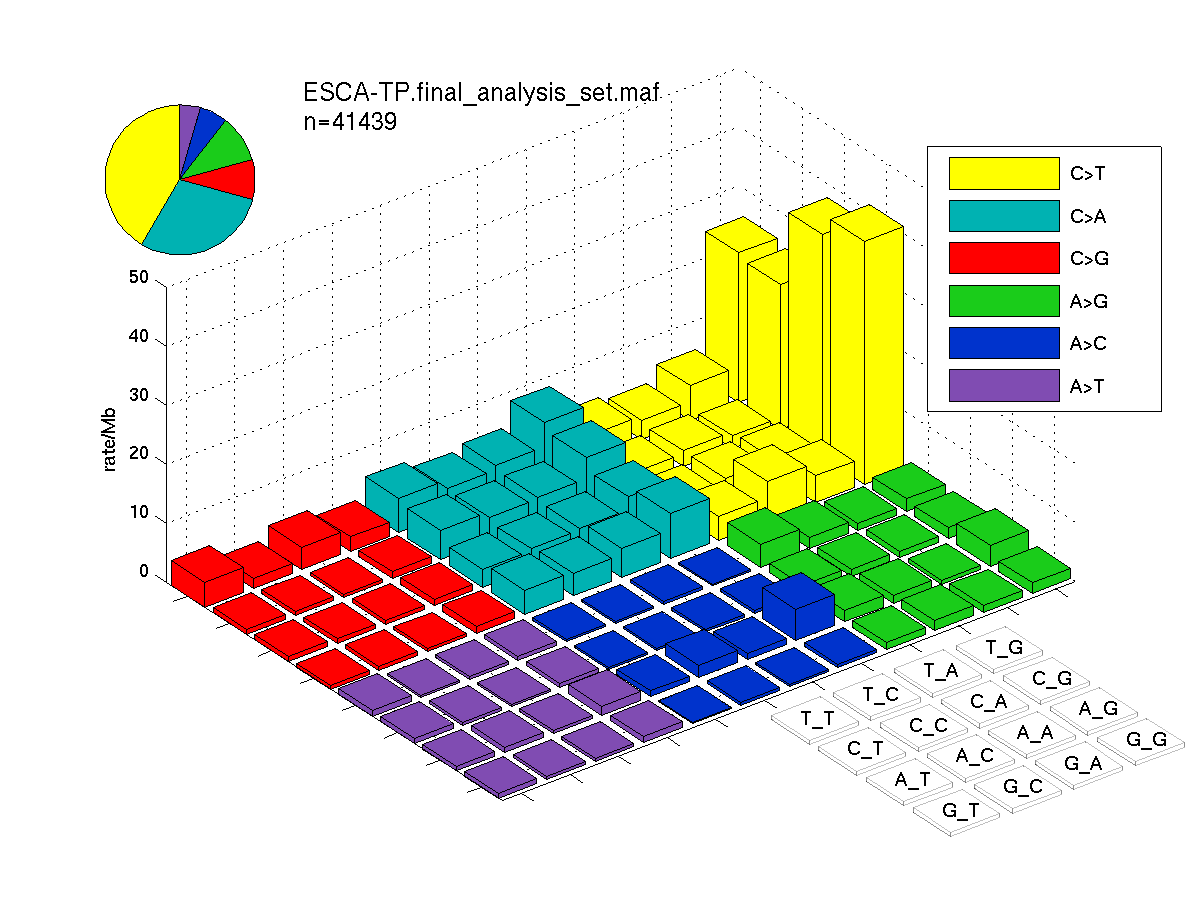
Figure 4. Get High-res Image SNV Mutation rate lego plots for 4 slices of mutation allele fraction (0<=AF<0.1, 0.1<=AF<0.25, 0.25<=AF<0.5, & 0.5<=AF) . The color code and three-base context legends are the same as the previous figure. If this figure is blank, not enough information was provided in the MAF to generate it.

Column Descriptions:
-
N = number of sequenced bases in this gene across the individual set
-
n = number of (nonsilent) mutations in this gene across the individual set
-
npat = number of patients (individuals) with at least one nonsilent mutation
-
nsite = number of unique sites having a non-silent mutation
-
nsil = number of silent mutations in this gene across the individual set
-
n1 = number of nonsilent mutations of type: *CpG->(A/T)
-
n2 = number of nonsilent mutations of type: *Cp(A/C/T)->(A/T)
-
n3 = number of nonsilent mutations of type: A->(C/G)
-
n4 = number of nonsilent mutations of type: flip
-
n5 = number of nonsilent mutations of type: indel+null
-
n6 = number of nonsilent mutations of type: double_null
-
p_classic = p-value for the observed amount of nonsilent mutations being elevated in this gene
-
p_ns_s = p-value for the observed nonsilent/silent ratio being elevated in this gene
-
p_cons = p-value for enrichment of mutations at evolutionarily most-conserved sites in gene
-
p_joint = p-value for clustering + conservation
-
p = p-value (overall)
-
q = q-value, False Discovery Rate (Benjamini-Hochberg procedure)
Table 3. Get Full Table A Ranked List of Significantly Mutated Genes. Number of significant genes found: 56. Number of genes displayed: 35. Click on a gene name to display its stick figure depicting the distribution of mutations and mutation types across the chosen gene (this feature may not be available for all significant genes).
| rank | gene | description | N | n | npat | nsite | nsil | n1 | n2 | n3 | n4 | n5 | n6 | p_classic | p_ns_s | p_clust | p_cons | p_joint | p | q |
|---|---|---|---|---|---|---|---|---|---|---|---|---|---|---|---|---|---|---|---|---|
| 1 | CDKN2A | cyclin-dependent kinase inhibitor 2A (melanoma, p16, inhibits CDK4) | 99243 | 19 | 19 | 18 | 1 | 3 | 4 | 1 | 0 | 11 | 0 | 4.8e-15 | 0.0618 | 0.21 | 0.0007 | 0.0034 | 6.66e-16 | 4.62e-12 |
| 2 | TP53 | tumor protein p53 | 230983 | 174 | 153 | 104 | 1 | 46 | 28 | 17 | 16 | 64 | 3 | 1.4e-15 | <1.00e-15 | 0 | 0 | 0 | <1.00e-15 | <4.62e-12 |
| 3 | NFE2L2 | nuclear factor (erythroid-derived 2)-like 2 | 324938 | 18 | 16 | 14 | 0 | 0 | 6 | 4 | 6 | 2 | 0 | 5e-13 | 0.0300 | 0 | 1.8e-06 | 0 | <1.00e-15 | <4.62e-12 |
| 4 | SERPING1 | serpin peptidase inhibitor, clade G (C1 inhibitor), member 1, (angioedema, hereditary) | 274401 | 2 | 2 | 2 | 1 | 0 | 1 | 0 | 0 | 1 | 0 | 0.3 | 0.744 | 0.66 | 0 | 0 | <1.00e-15 | <4.62e-12 |
| 5 | DCDC1 | doublecortin domain containing 1 | 197249 | 18 | 16 | 18 | 2 | 1 | 5 | 5 | 3 | 4 | 0 | 6.7e-14 | 0.156 | 0.22 | 0.5 | 0.32 | 7.08e-13 | 2.62e-09 |
| 6 | IVL | involucrin | 324427 | 16 | 15 | 16 | 0 | 1 | 3 | 8 | 3 | 1 | 0 | 8.6e-11 | 0.0347 | 0.00077 | 0.46 | 0.0018 | 4.77e-12 | 1.47e-08 |
| 7 | TGFBR2 | transforming growth factor, beta receptor II (70/80kDa) | 273237 | 15 | 15 | 12 | 1 | 3 | 3 | 2 | 1 | 6 | 0 | 5e-11 | 0.181 | 0.04 | 0.0052 | 0.0099 | 1.45e-11 | 3.84e-08 |
| 8 | PIK3CA | phosphoinositide-3-kinase, catalytic, alpha polypeptide | 600336 | 21 | 19 | 13 | 0 | 0 | 13 | 3 | 4 | 1 | 0 | 1.6e-10 | 0.0111 | 0.051 | 0.09 | 0.031 | 1.32e-10 | 3.05e-07 |
| 9 | ZNF804B | zinc finger protein 804B | 666910 | 24 | 21 | 24 | 1 | 2 | 6 | 10 | 5 | 1 | 0 | 8e-12 | 0.0138 | 0.63 | 0.89 | 0.82 | 1.76e-10 | 3.62e-07 |
| 10 | FBXW7 | F-box and WD repeat domain containing 7 | 462539 | 14 | 13 | 12 | 0 | 2 | 1 | 2 | 3 | 6 | 0 | 2.1e-07 | 0.0778 | 0.0055 | 0.11 | 0.0088 | 3.87e-08 | 7.16e-05 |
| 11 | SMAD4 | SMAD family member 4 | 308138 | 14 | 13 | 13 | 1 | 2 | 5 | 0 | 1 | 6 | 0 | 7.7e-09 | 0.143 | 0.2 | 0.52 | 0.3 | 4.83e-08 | 8.11e-05 |
| 12 | EIF4EBP2 | eukaryotic translation initiation factor 4E binding protein 2 | 42039 | 3 | 3 | 1 | 0 | 0 | 3 | 0 | 0 | 0 | 0 | 0.002 | 0.377 | 0.00054 | 0.002 | 0.000011 | 3.96e-07 | 0.000609 |
| 13 | CDH11 | cadherin 11, type 2, OB-cadherin (osteoblast) | 435666 | 16 | 14 | 16 | 1 | 3 | 2 | 7 | 4 | 0 | 0 | 1.6e-07 | 0.0582 | 0.75 | 0.08 | 0.33 | 9.09e-07 | 0.00129 |
| 14 | ZNF268 | zinc finger protein 268 | 88052 | 7 | 7 | 7 | 1 | 0 | 5 | 0 | 1 | 1 | 0 | 1e-06 | 0.514 | NaN | NaN | NaN | 9.95e-07 | 0.00131 |
| 15 | ZNF750 | zinc finger protein 750 | 401233 | 10 | 10 | 10 | 0 | 1 | 1 | 1 | 0 | 7 | 0 | 0.000056 | 0.105 | 0.039 | 0.0051 | 0.0014 | 1.41e-06 | 0.00174 |
| 16 | SOX11 | SRY (sex determining region Y)-box 11 | 144176 | 8 | 8 | 7 | 1 | 0 | 1 | 4 | 0 | 3 | 0 | 9.3e-07 | 0.778 | 0.49 | 0.11 | 0.35 | 5.17e-06 | 0.00596 |
| 17 | LRFN5 | leucine rich repeat and fibronectin type III domain containing 5 | 395063 | 12 | 12 | 12 | 0 | 3 | 5 | 1 | 2 | 1 | 0 | 3.8e-07 | 0.0420 | 0.79 | 0.57 | 1 | 5.92e-06 | 0.00644 |
| 18 | NLGN1 | neuroligin 1 | 445078 | 10 | 10 | 10 | 0 | 1 | 2 | 5 | 0 | 2 | 0 | 0.000029 | 0.0544 | 0.012 | 0.2 | 0.016 | 7.06e-06 | 0.00725 |
| 19 | ANKRD30A | ankyrin repeat domain 30A | 695013 | 15 | 15 | 15 | 1 | 2 | 3 | 7 | 1 | 2 | 0 | 2.5e-06 | 0.0757 | 0.22 | 0.28 | 0.26 | 9.99e-06 | 0.00962 |
| 20 | OR4C16 | olfactory receptor, family 4, subfamily C, member 16 | 167332 | 8 | 8 | 8 | 1 | 0 | 1 | 6 | 1 | 0 | 0 | 3.3e-06 | 0.357 | 0.12 | 0.96 | 0.21 | 1.04e-05 | 0.00962 |
| 21 | OR5D13 | olfactory receptor, family 5, subfamily D, member 13 | 173801 | 8 | 8 | 7 | 0 | 0 | 4 | 3 | 0 | 1 | 0 | 2.4e-06 | 0.0826 | 0.18 | 1 | 0.41 | 1.43e-05 | 0.0125 |
| 22 | CSMD1 | CUB and Sushi multiple domains 1 | 1927495 | 31 | 27 | 31 | 0 | 7 | 5 | 8 | 1 | 10 | 0 | 5.3e-06 | 0.000125 | 0.14 | 0.39 | 0.2 | 1.57e-05 | 0.0131 |
| 23 | CCDC7 | coiled-coil domain containing 7 | 265749 | 12 | 10 | 12 | 0 | 0 | 7 | 1 | 1 | 3 | 0 | 2.3e-06 | 0.1000 | 0.24 | 0.84 | 0.51 | 1.69e-05 | 0.0136 |
| 24 | MMP16 | matrix metallopeptidase 16 (membrane-inserted) | 368206 | 11 | 11 | 11 | 1 | 3 | 5 | 0 | 3 | 0 | 0 | 1.8e-06 | 0.258 | 0.56 | 0.8 | 0.77 | 2.00e-05 | 0.0154 |
| 25 | DPP10 | dipeptidyl-peptidase 10 | 463302 | 14 | 12 | 14 | 1 | 1 | 4 | 3 | 2 | 4 | 0 | 3.4e-06 | 0.108 | 0.35 | 0.8 | 0.47 | 2.28e-05 | 0.0168 |
| 26 | FOXG1 | forkhead box G1 | 195289 | 10 | 10 | 9 | 1 | 4 | 1 | 5 | 0 | 0 | 0 | 3.3e-06 | 0.194 | 0.25 | 0.58 | 0.54 | 2.53e-05 | 0.0179 |
| 27 | GRXCR1 | glutaredoxin, cysteine rich 1 | 162015 | 7 | 7 | 7 | 0 | 2 | 0 | 1 | 0 | 4 | 0 | 7.5e-06 | 0.106 | 0.79 | 0.078 | 0.26 | 2.71e-05 | 0.0181 |
| 28 | TPTE | transmembrane phosphatase with tensin homology | 321398 | 10 | 10 | 10 | 0 | 1 | 2 | 2 | 1 | 4 | 0 | 5.4e-06 | 0.110 | 0.21 | 0.24 | 0.36 | 2.74e-05 | 0.0181 |
| 29 | UNC13C | unc-13 homolog C (C. elegans) | 1176742 | 23 | 21 | 23 | 2 | 2 | 5 | 10 | 3 | 3 | 0 | 9.6e-06 | 0.0696 | 0.13 | 0.38 | 0.23 | 3.13e-05 | 0.0200 |
| 30 | ARHGEF38 | Rho guanine nucleotide exchange factor (GEF) 38 | 119380 | 6 | 6 | 6 | 0 | 1 | 2 | 1 | 1 | 1 | 0 | 0.000036 | 0.165 | NaN | NaN | NaN | 3.61e-05 | 0.0222 |
| 31 | ERBB4 | v-erb-a erythroblastic leukemia viral oncogene homolog 4 (avian) | 737882 | 17 | 17 | 17 | 1 | 2 | 7 | 3 | 0 | 5 | 0 | 3e-06 | 0.0686 | 0.86 | 0.8 | 1 | 4.05e-05 | 0.0235 |
| 32 | OR5L2 | olfactory receptor, family 5, subfamily L, member 2 | 170098 | 8 | 8 | 8 | 1 | 0 | 2 | 4 | 1 | 1 | 0 | 3.1e-06 | 0.265 | 0.94 | 0.75 | 1 | 4.25e-05 | 0.0235 |
| 33 | CHRM2 | cholinergic receptor, muscarinic 2 | 244493 | 8 | 8 | 7 | 1 | 0 | 1 | 4 | 2 | 1 | 0 | 8.5e-06 | 0.387 | 0.3 | 0.44 | 0.37 | 4.28e-05 | 0.0235 |
| 34 | SETBP1 | SET binding protein 1 | 675684 | 13 | 13 | 13 | 1 | 5 | 1 | 3 | 2 | 2 | 0 | 0.00015 | 0.115 | 0.62 | 0.0044 | 0.022 | 4.32e-05 | 0.0235 |
| 35 | CNTNAP5 | contactin associated protein-like 5 | 731250 | 19 | 19 | 19 | 3 | 4 | 7 | 5 | 2 | 1 | 0 | 0.000014 | 0.122 | 0.12 | 0.88 | 0.24 | 4.69e-05 | 0.0248 |
Figure S1. This figure depicts the distribution of mutations and mutation types across the CDKN2A significant gene.
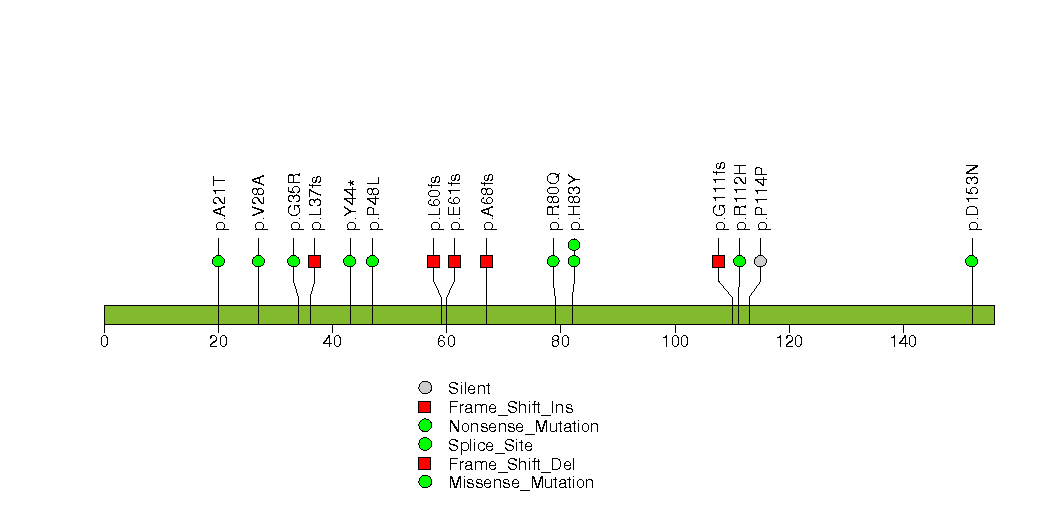
Figure S2. This figure depicts the distribution of mutations and mutation types across the TP53 significant gene.
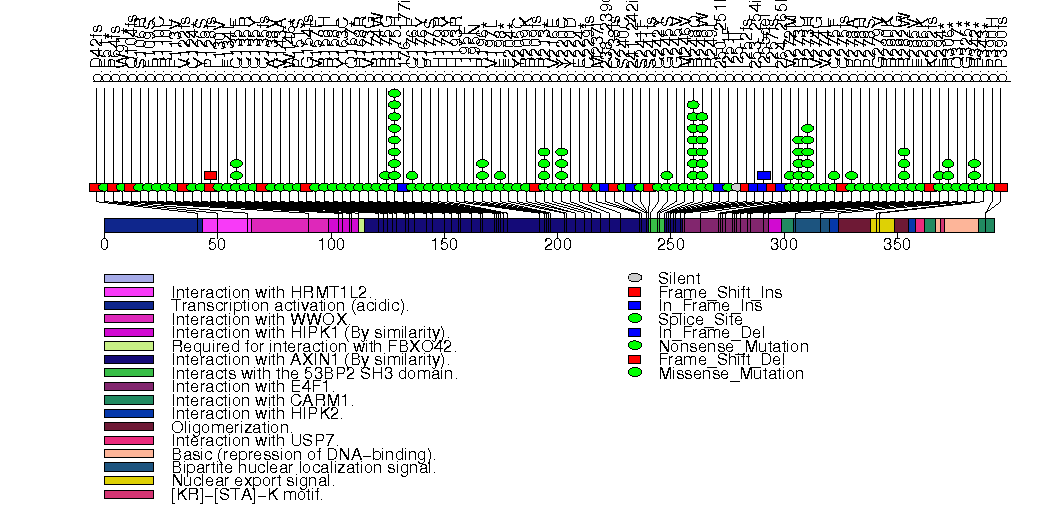
Figure S3. This figure depicts the distribution of mutations and mutation types across the NFE2L2 significant gene.
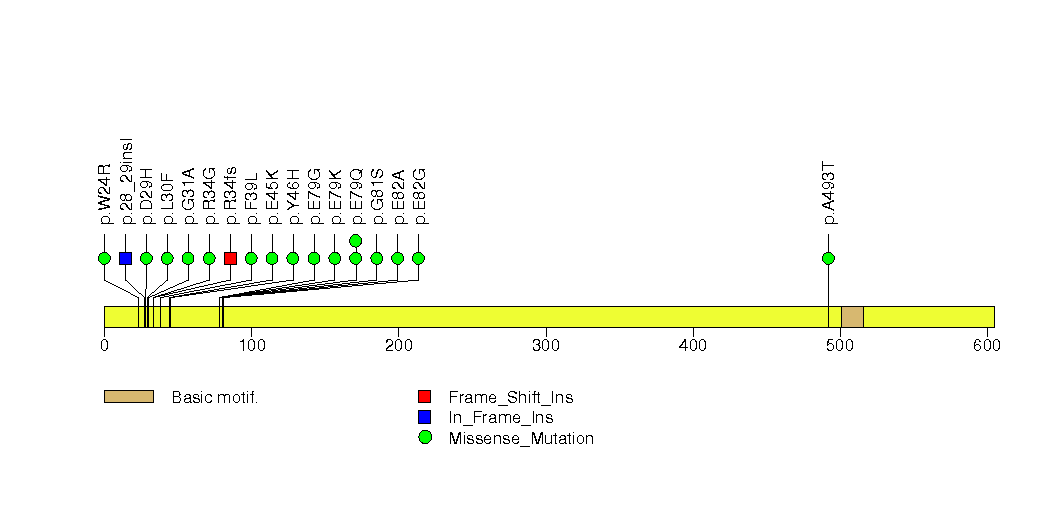
Figure S4. This figure depicts the distribution of mutations and mutation types across the SERPING1 significant gene.
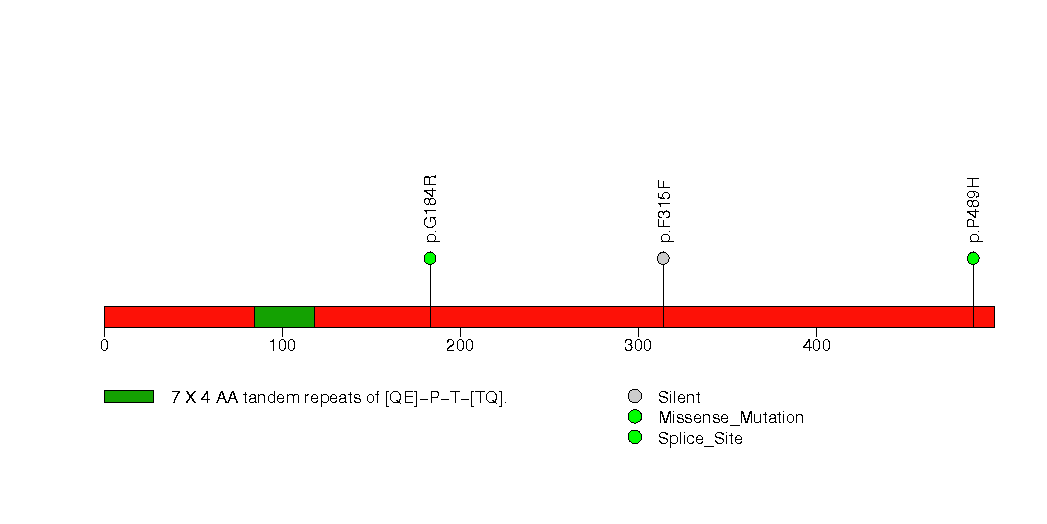
Figure S5. This figure depicts the distribution of mutations and mutation types across the DCDC1 significant gene.
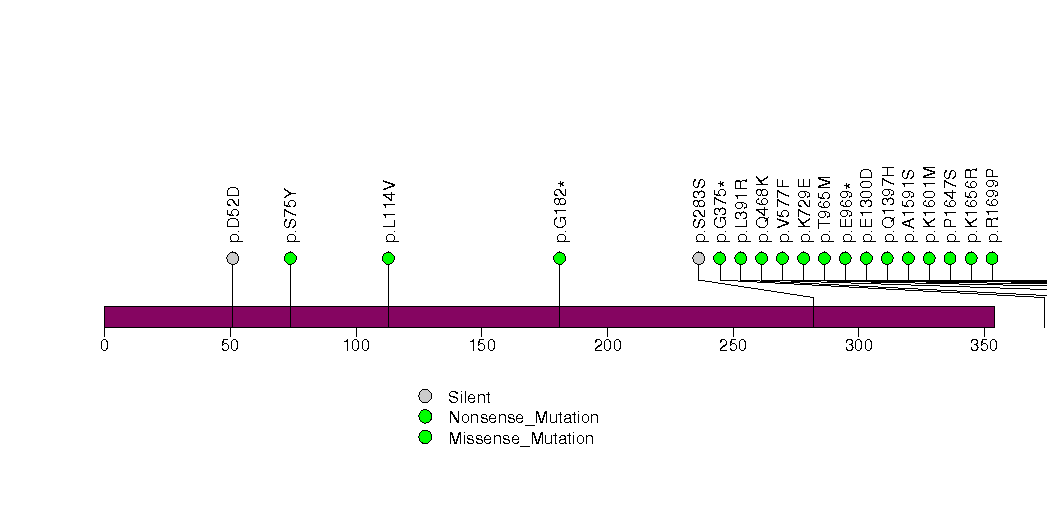
Figure S6. This figure depicts the distribution of mutations and mutation types across the IVL significant gene.
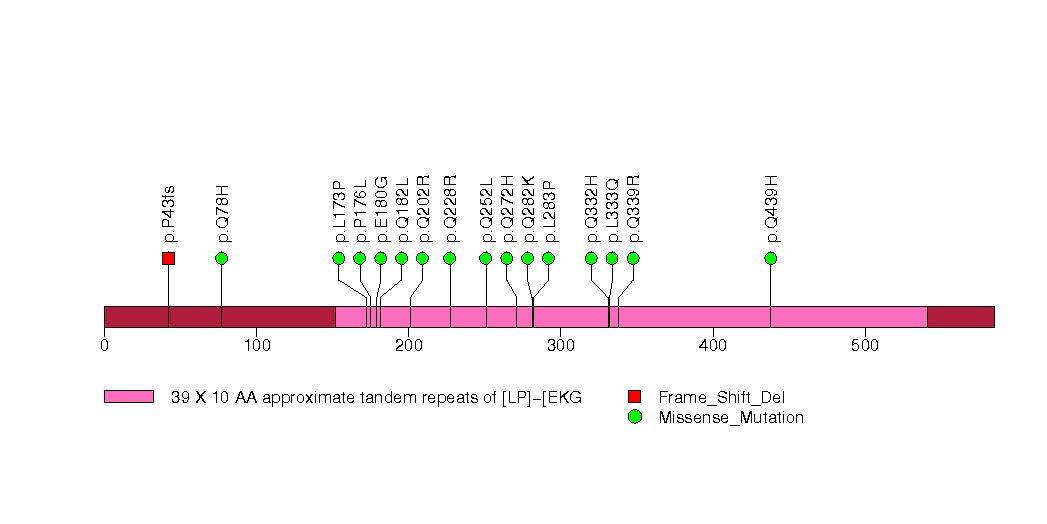
Figure S7. This figure depicts the distribution of mutations and mutation types across the TGFBR2 significant gene.
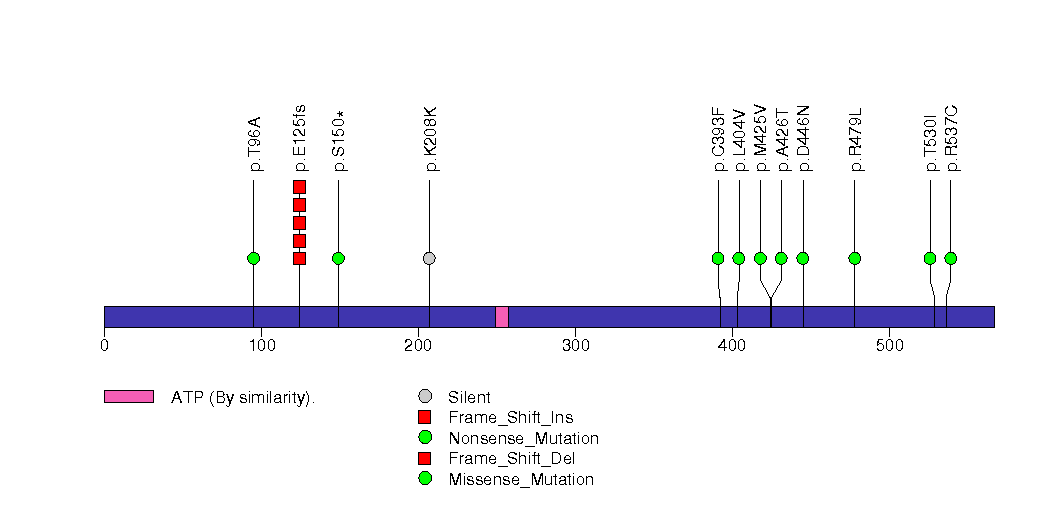
Figure S8. This figure depicts the distribution of mutations and mutation types across the PIK3CA significant gene.
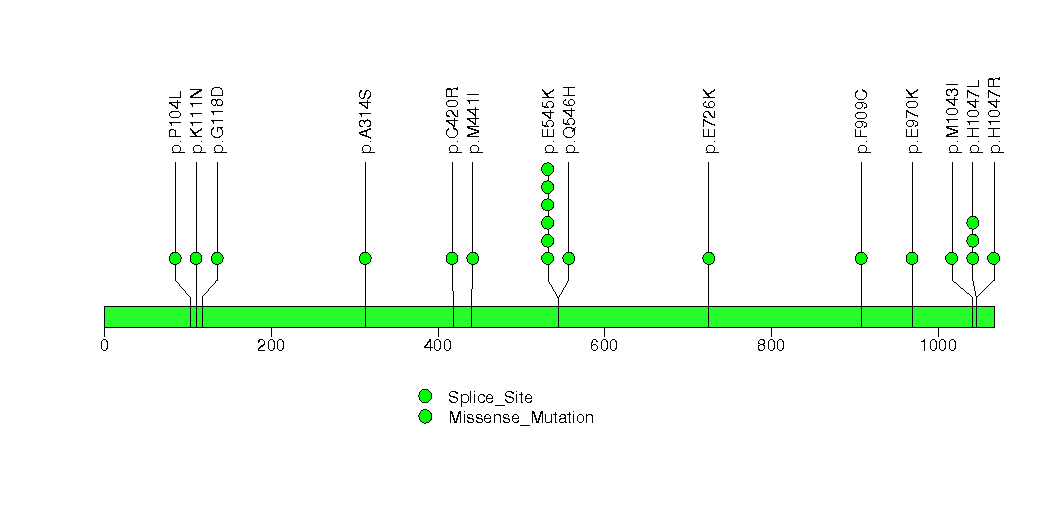
Figure S9. This figure depicts the distribution of mutations and mutation types across the ZNF804B significant gene.
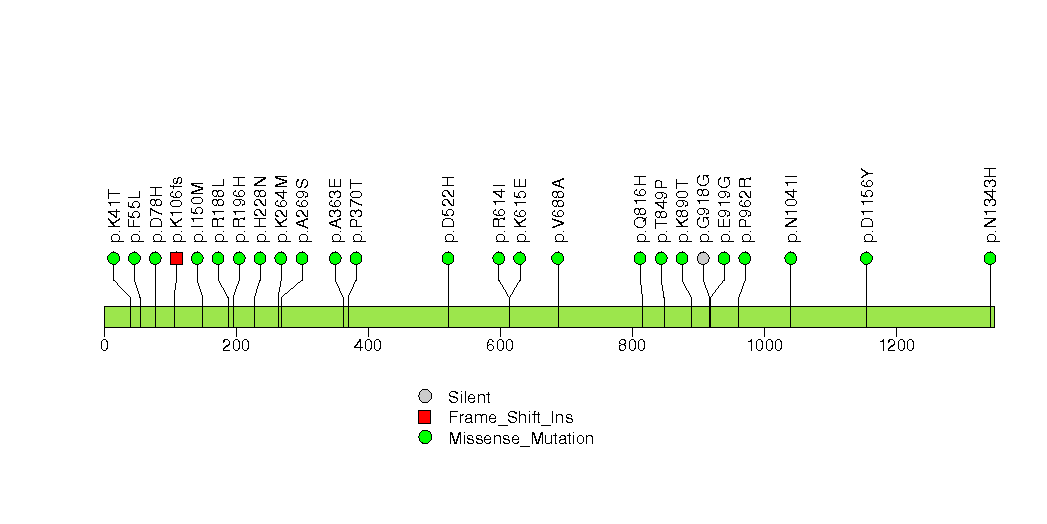
Figure S10. This figure depicts the distribution of mutations and mutation types across the FBXW7 significant gene.
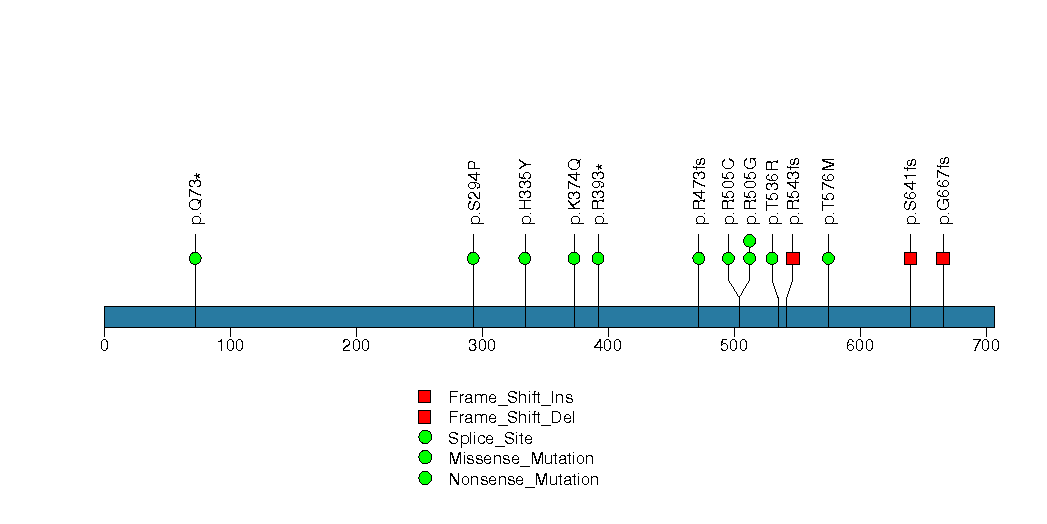
Figure S11. This figure depicts the distribution of mutations and mutation types across the SMAD4 significant gene.
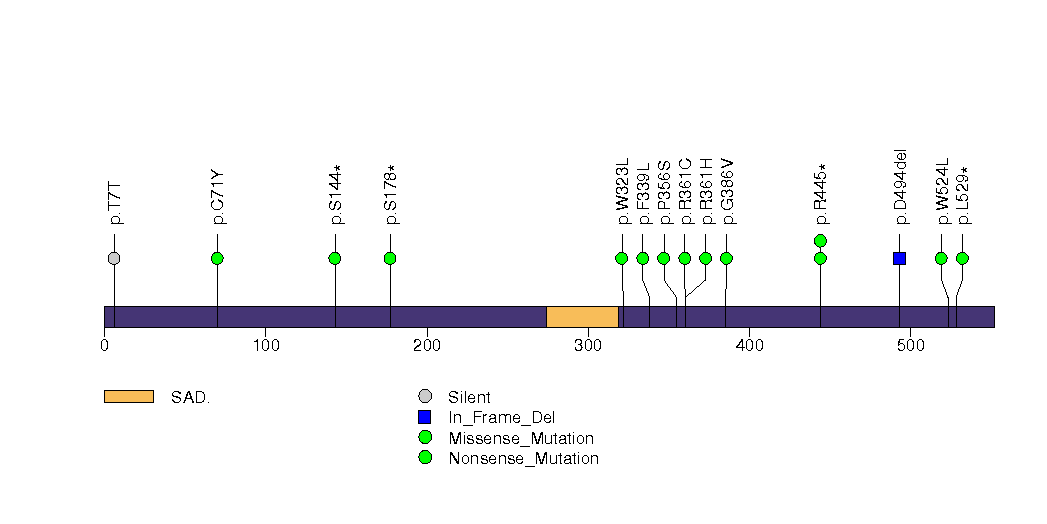
Figure S12. This figure depicts the distribution of mutations and mutation types across the EIF4EBP2 significant gene.
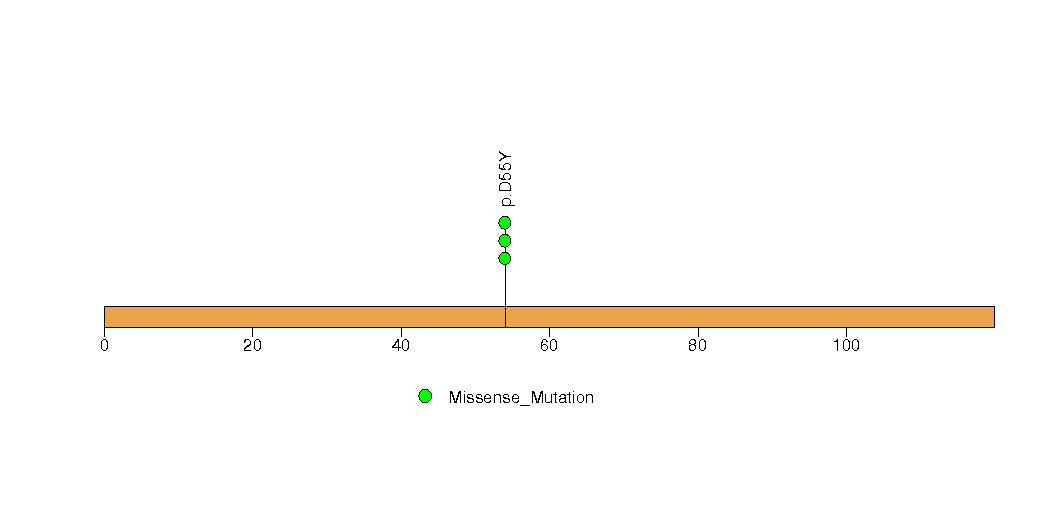
Figure S13. This figure depicts the distribution of mutations and mutation types across the CDH11 significant gene.
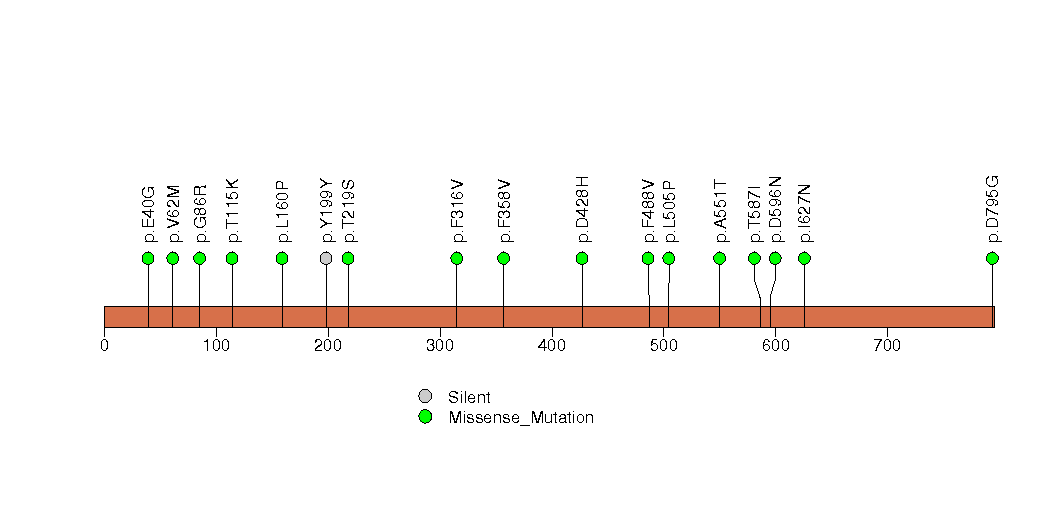
Figure S14. This figure depicts the distribution of mutations and mutation types across the ZNF268 significant gene.
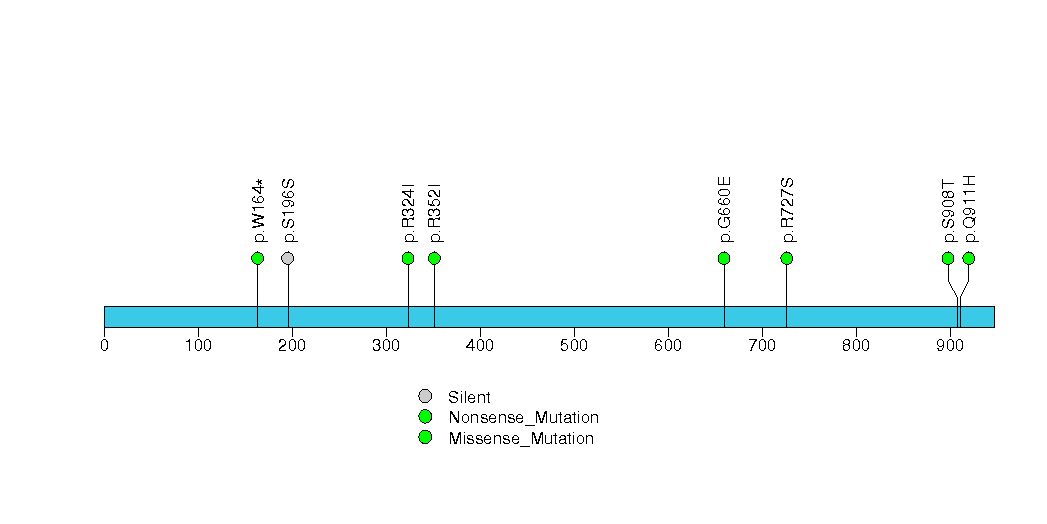
Figure S15. This figure depicts the distribution of mutations and mutation types across the ZNF750 significant gene.
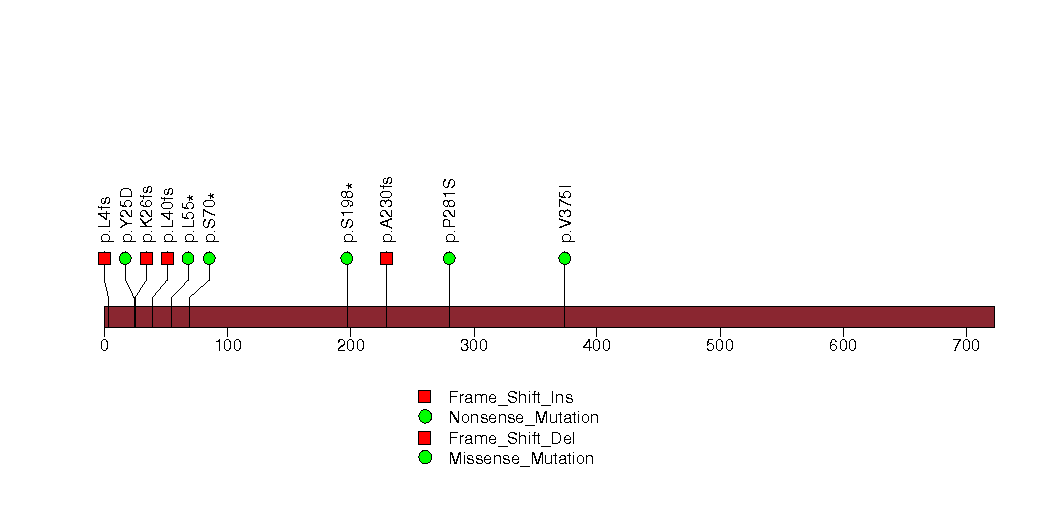
Figure S16. This figure depicts the distribution of mutations and mutation types across the SOX11 significant gene.
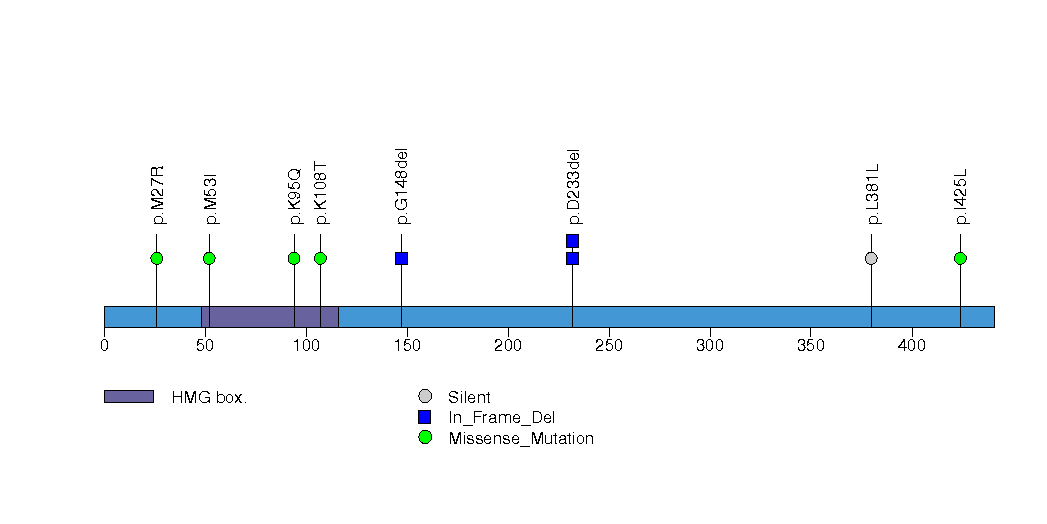
Figure S17. This figure depicts the distribution of mutations and mutation types across the LRFN5 significant gene.
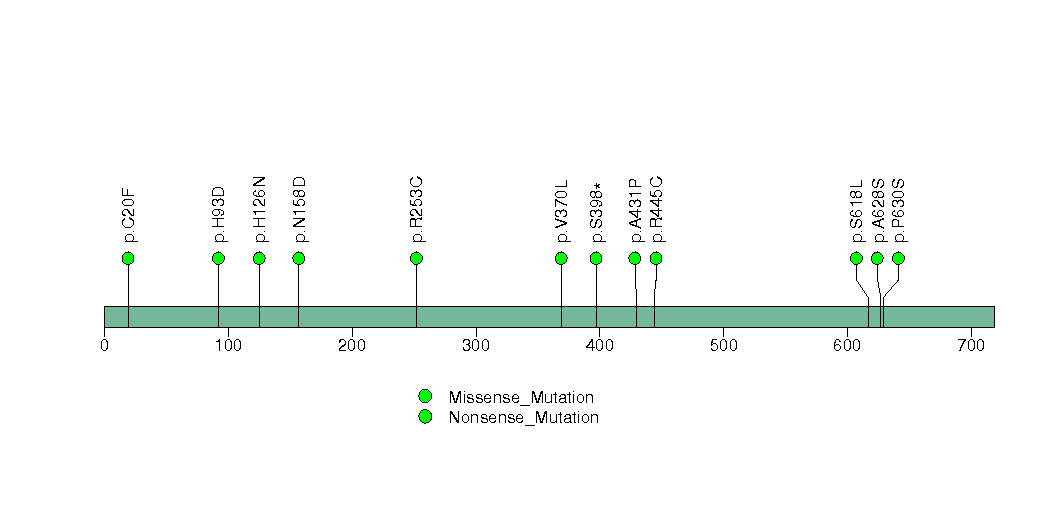
Figure S18. This figure depicts the distribution of mutations and mutation types across the NLGN1 significant gene.
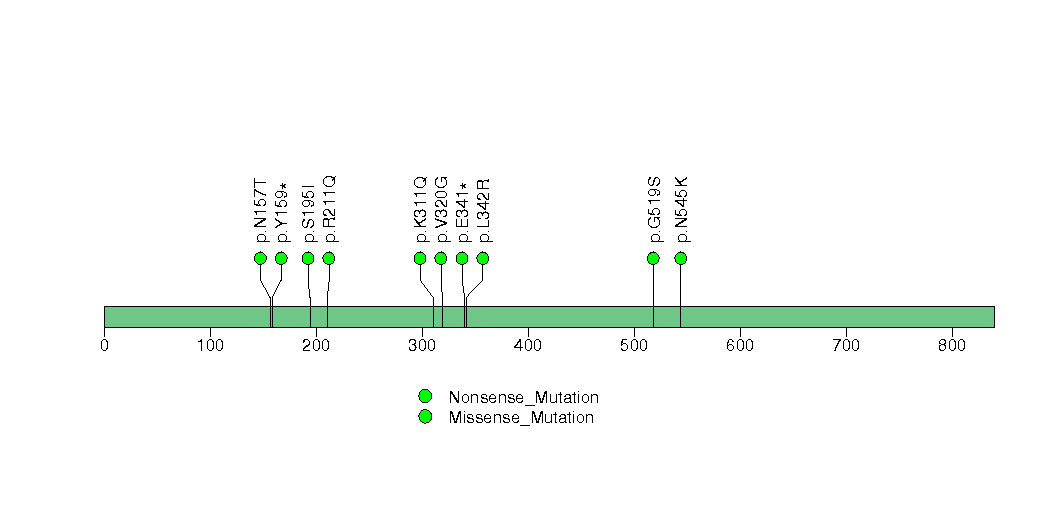
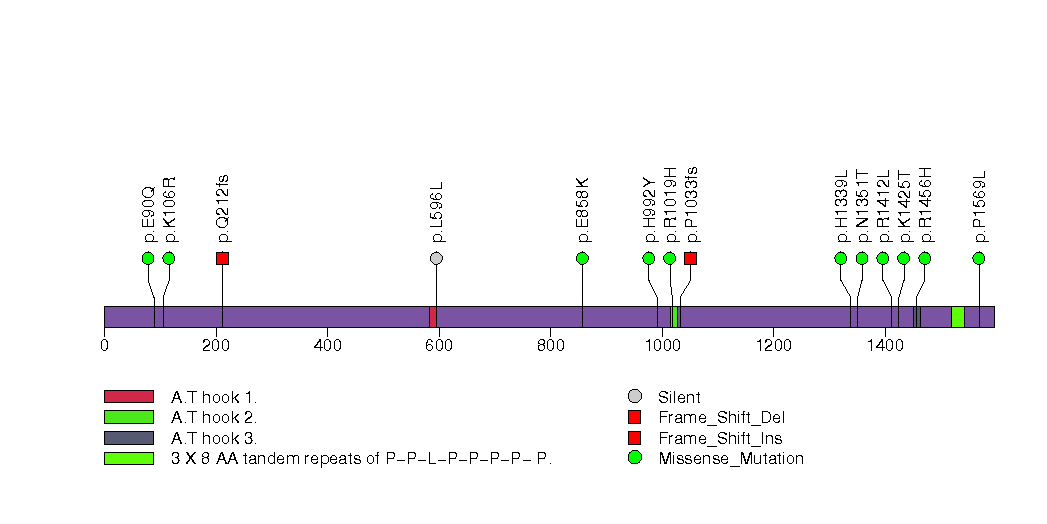
Figure S19. This figure depicts the distribution of mutations and mutation types across the ANKRD30A significant gene.
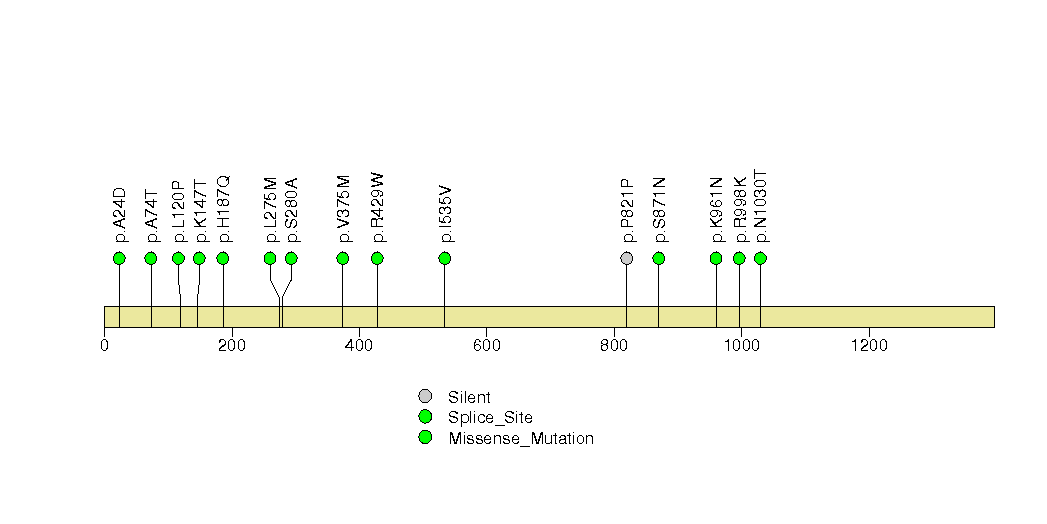
Figure S20. This figure depicts the distribution of mutations and mutation types across the OR4C16 significant gene.
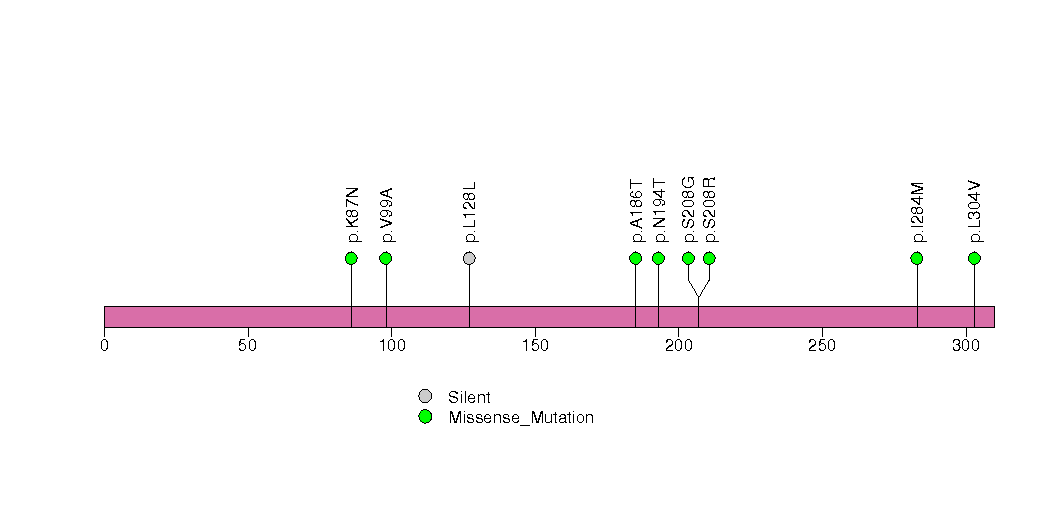
Figure S21. This figure depicts the distribution of mutations and mutation types across the OR5D13 significant gene.
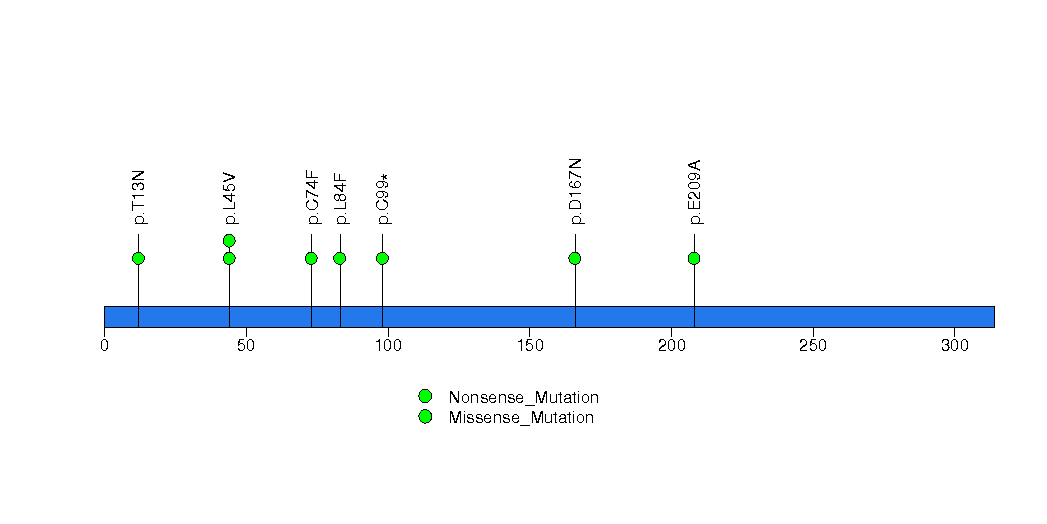
Figure S22. This figure depicts the distribution of mutations and mutation types across the CSMD1 significant gene.
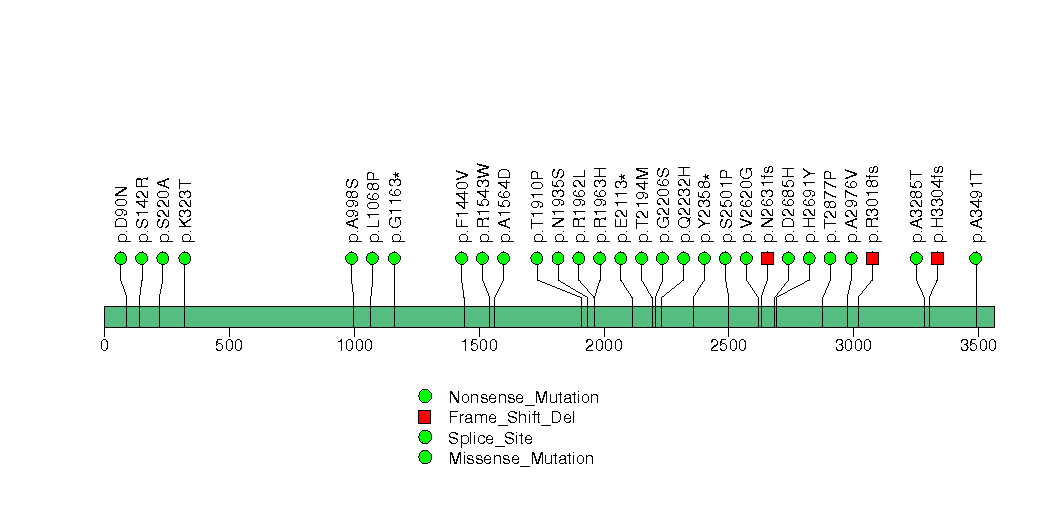
Figure S23. This figure depicts the distribution of mutations and mutation types across the CCDC7 significant gene.
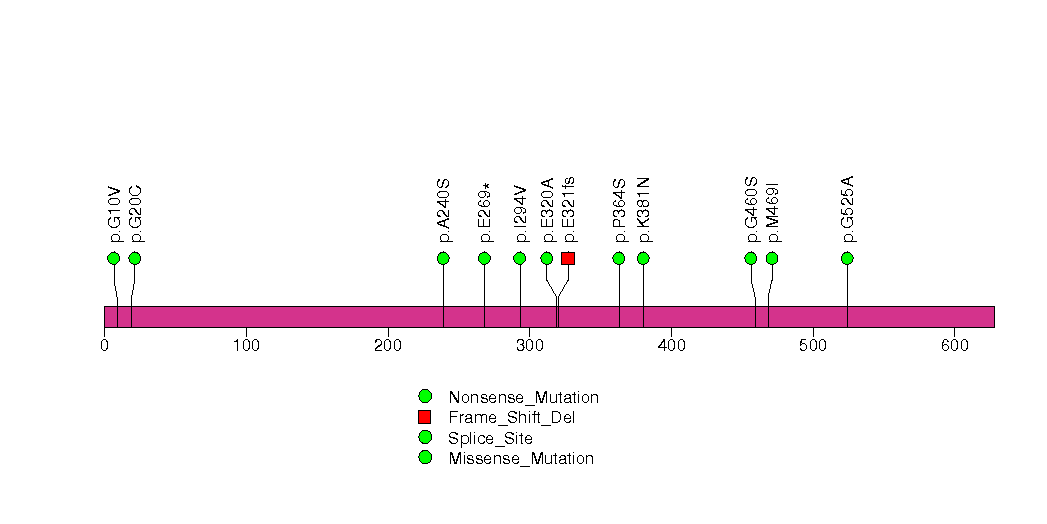
Figure S24. This figure depicts the distribution of mutations and mutation types across the MMP16 significant gene.
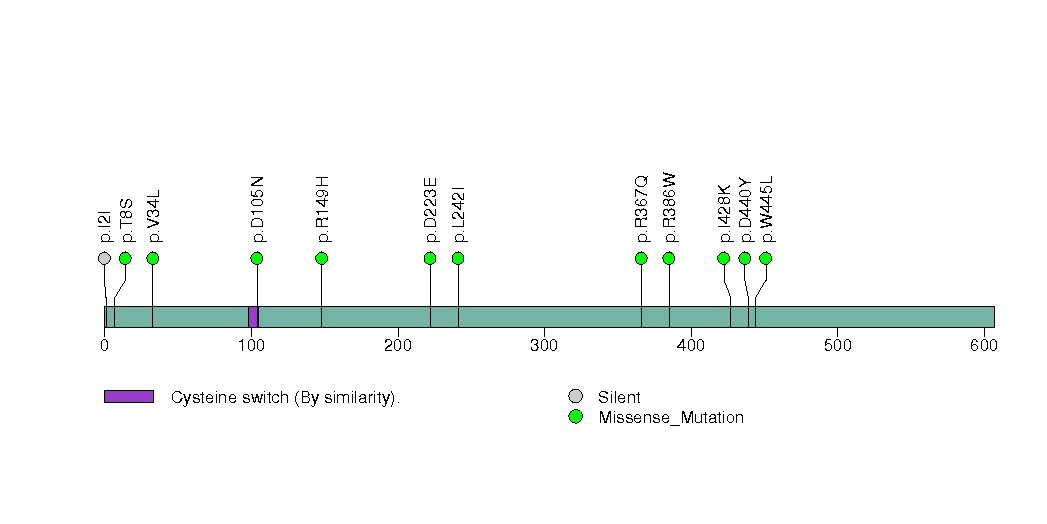
Figure S25. This figure depicts the distribution of mutations and mutation types across the DPP10 significant gene.
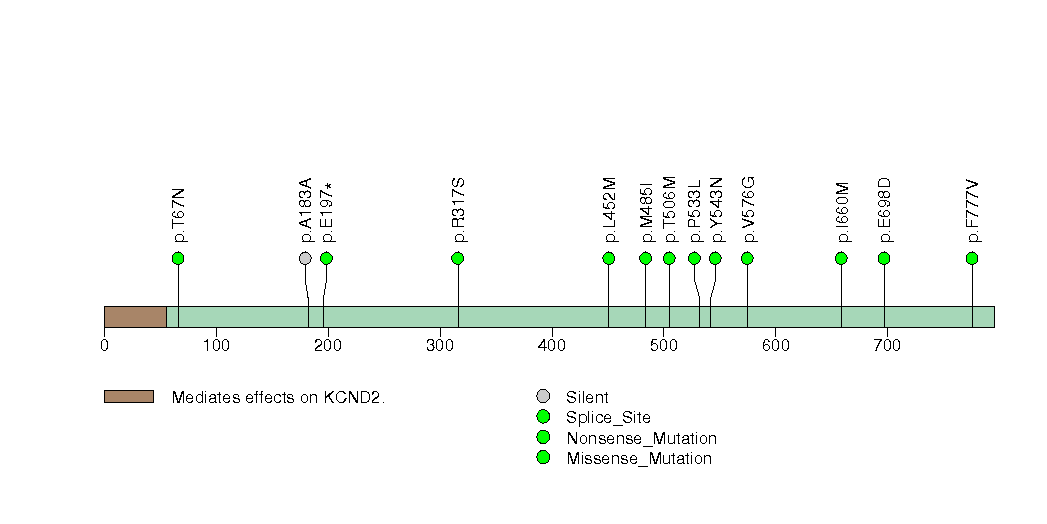
Figure S26. This figure depicts the distribution of mutations and mutation types across the FOXG1 significant gene.
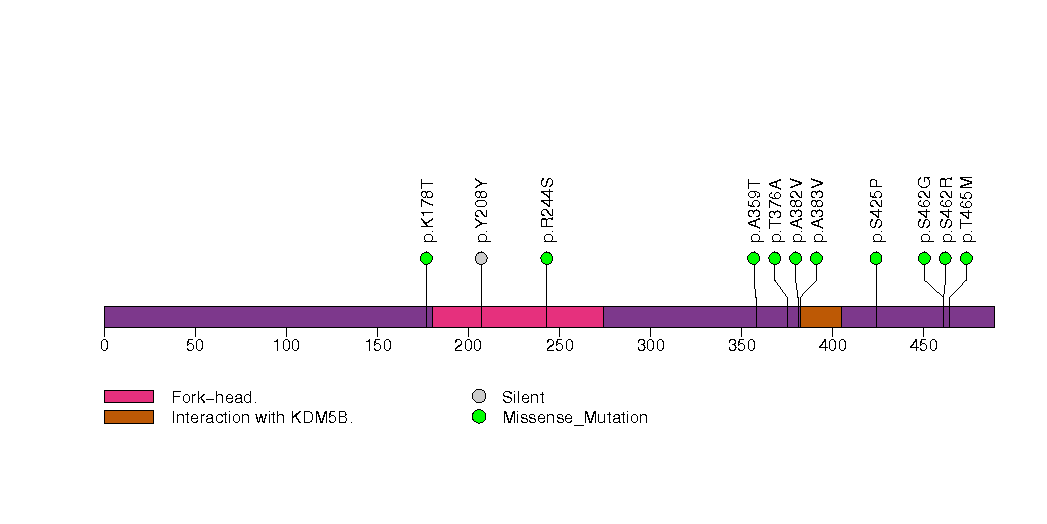
Figure S27. This figure depicts the distribution of mutations and mutation types across the GRXCR1 significant gene.
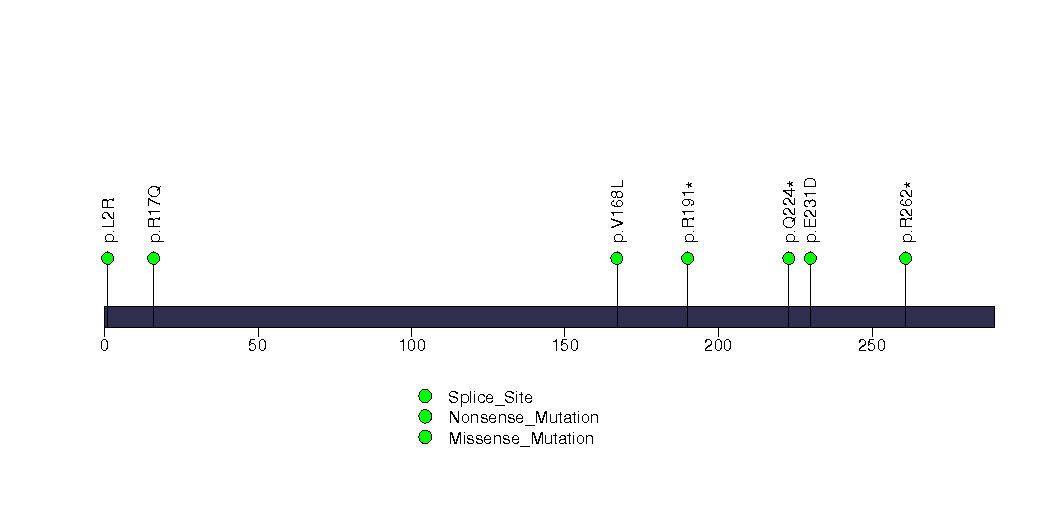
Figure S28. This figure depicts the distribution of mutations and mutation types across the TPTE significant gene.
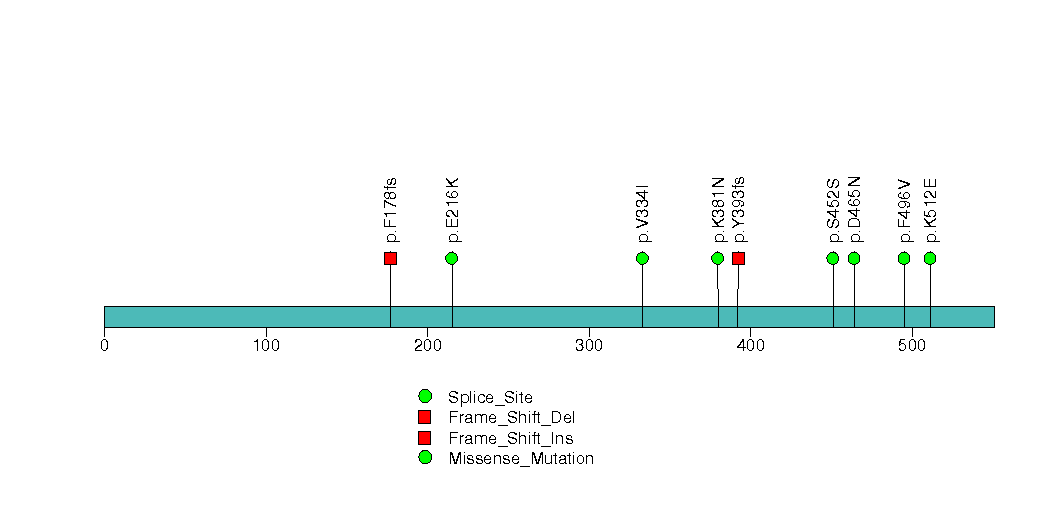
Figure S29. This figure depicts the distribution of mutations and mutation types across the UNC13C significant gene.
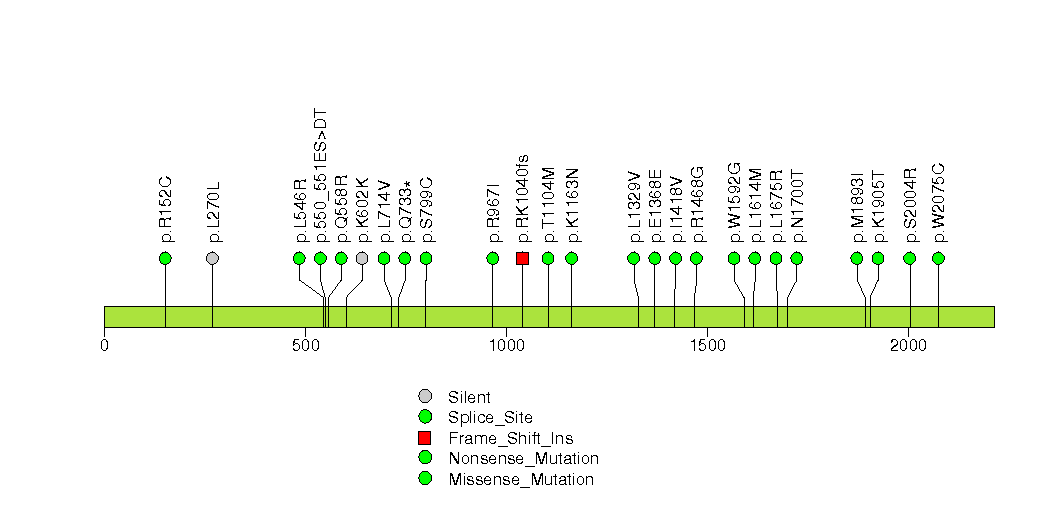
Figure S30. This figure depicts the distribution of mutations and mutation types across the ARHGEF38 significant gene.
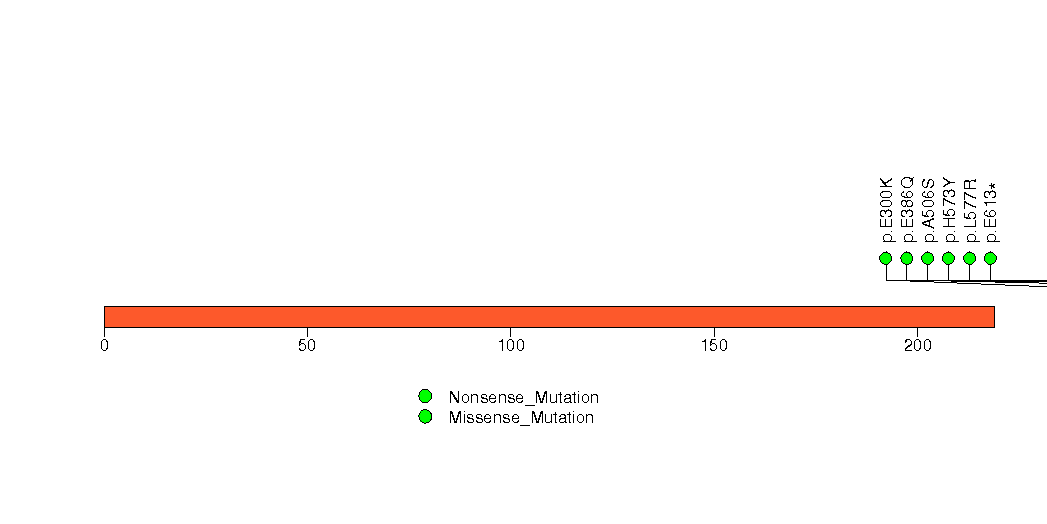
Figure S31. This figure depicts the distribution of mutations and mutation types across the OR5L2 significant gene.
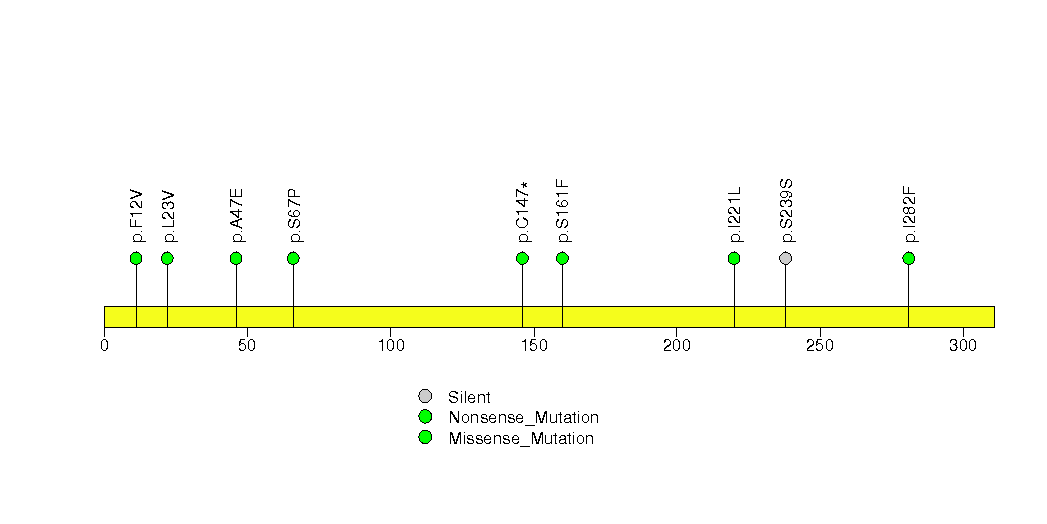
Figure S32. This figure depicts the distribution of mutations and mutation types across the CHRM2 significant gene.
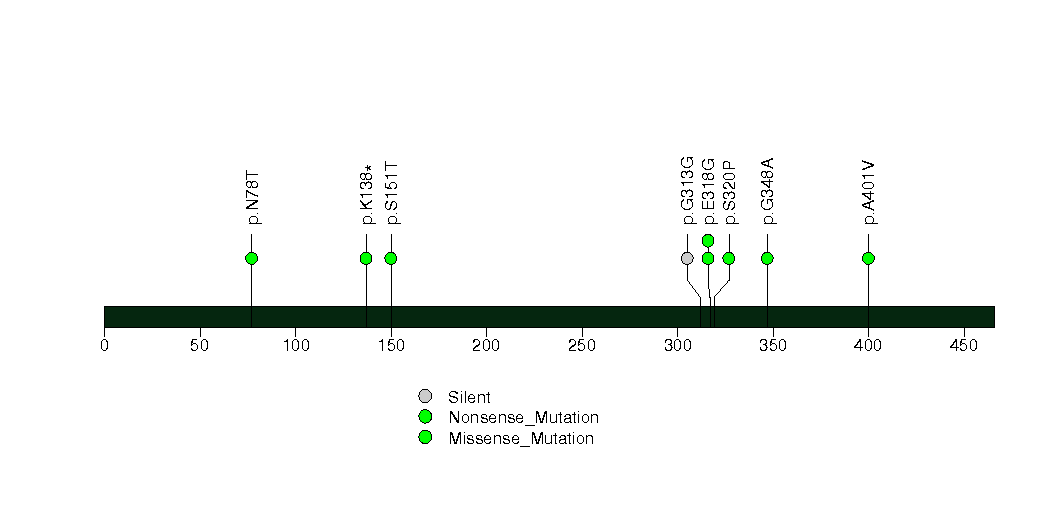
Figure S33. This figure depicts the distribution of mutations and mutation types across the SETBP1 significant gene.
In this analysis, COSMIC is used as a filter to increase power by restricting the territory of each gene. Cosmic version: v48.
Table 4. Get Full Table Significantly mutated genes (COSMIC territory only). To access the database please go to: COSMIC. Number of significant genes found: 17. Number of genes displayed: 10
| rank | gene | description | n | cos | n_cos | N_cos | cos_ev | p | q |
|---|---|---|---|---|---|---|---|---|---|
| 1 | ERBB2 | v-erb-b2 erythroblastic leukemia viral oncogene homolog 2, neuro/glioblastoma derived oncogene homolog (avian) | 12 | 42 | 8 | 7770 | 52 | 3.8e-13 | 1.7e-09 |
| 2 | FBXW7 | F-box and WD repeat domain containing 7 | 14 | 91 | 8 | 16835 | 123 | 1.1e-12 | 1.7e-09 |
| 3 | SMAD4 | SMAD family member 4 | 14 | 159 | 12 | 29415 | 43 | 1.3e-12 | 1.7e-09 |
| 4 | PIK3CA | phosphoinositide-3-kinase, catalytic, alpha polypeptide | 21 | 220 | 17 | 40700 | 7996 | 1.6e-12 | 1.7e-09 |
| 5 | CDKN2A | cyclin-dependent kinase inhibitor 2A (melanoma, p16, inhibits CDK4) | 19 | 332 | 18 | 61420 | 372 | 2.2e-12 | 1.7e-09 |
| 6 | TP53 | tumor protein p53 | 174 | 356 | 161 | 65860 | 46286 | 2.3e-12 | 1.7e-09 |
| 7 | APC | adenomatous polyposis coli | 15 | 839 | 8 | 155215 | 293 | 7.1e-06 | 0.0046 |
| 8 | RIPK1 | receptor (TNFRSF)-interacting serine-threonine kinase 1 | 2 | 4 | 2 | 740 | 2 | 1e-05 | 0.0058 |
| 9 | PTCH1 | patched homolog 1 (Drosophila) | 13 | 256 | 5 | 47360 | 5 | 0.000013 | 0.0067 |
| 10 | CTNNB1 | catenin (cadherin-associated protein), beta 1, 88kDa | 9 | 138 | 4 | 25530 | 733 | 0.000022 | 0.0099 |
Note:
n - number of (nonsilent) mutations in this gene across the individual set.
cos = number of unique mutated sites in this gene in COSMIC
n_cos = overlap between n and cos.
N_cos = number of individuals times cos.
cos_ev = total evidence: number of reports in COSMIC for mutations seen in this gene.
p = p-value for seeing the observed amount of overlap in this gene)
q = q-value, False Discovery Rate (Benjamini-Hochberg procedure)
Table 5. Get Full Table A Ranked List of Significantly Mutated Genesets. (Source: MSigDB GSEA Cannonical Pathway Set).Number of significant genesets found: 30. Number of genesets displayed: 10
| rank | geneset | description | genes | N_genes | mut_tally | N | n | npat | nsite | nsil | n1 | n2 | n3 | n4 | n5 | n6 | p_ns_s | p | q |
|---|---|---|---|---|---|---|---|---|---|---|---|---|---|---|---|---|---|---|---|
| 1 | ARFPATHWAY | Cyclin-dependent kinase inhibitor 2A is a tumor suppressor that induces G1 arrest and can activate the p53 pathway, leading to G2/M arrest. | ABL1, CDKN2A, E2F1, MDM2, MYC, PIK3CA, PIK3R1, POLR1A, POLR1B, POLR1C, POLR1D, RAC1, RB1, TBX2, TP53, TWIST1 | 16 | ABL1(2), CDKN2A(19), E2F1(2), MDM2(2), PIK3CA(21), PIK3R1(5), POLR1A(4), POLR1B(3), POLR1C(5), RAC1(1), RB1(8), TBX2(2), TP53(174), TWIST1(2) | 5500423 | 250 | 165 | 171 | 15 | 53 | 53 | 23 | 23 | 95 | 3 | 1.34e-14 | <1.00e-15 | <6.31e-14 |
| 2 | ST_JNK_MAPK_PATHWAY | JNKs are MAP kinases regulated by several levels of kinases (MAPKK, MAPKKK) and phosphorylate transcription factors and regulatory proteins. | AKT1, ATF2, CDC42, DLD, DUSP10, DUSP4, DUSP8, GAB1, GADD45A, GCK, IL1R1, JUN, MAP2K4, MAP2K5, MAP2K7, MAP3K1, MAP3K10, MAP3K11, MAP3K12, MAP3K13, MAP3K2, MAP3K3, MAP3K4, MAP3K5, MAP3K7, MAP3K7IP1, MAP3K7IP2, MAP3K9, MAPK10, MAPK7, MAPK8, MAPK9, MYEF2, NFATC3, NR2C2, PAPPA, SHC1, TP53, TRAF6, ZAK | 38 | AKT1(4), DLD(4), DUSP10(3), DUSP4(1), GAB1(1), GCK(1), IL1R1(1), JUN(1), MAP2K4(3), MAP2K5(2), MAP3K1(8), MAP3K10(4), MAP3K11(3), MAP3K12(2), MAP3K13(2), MAP3K2(3), MAP3K3(1), MAP3K4(6), MAP3K5(8), MAP3K7(3), MAP3K9(2), MAPK10(3), MAPK7(1), MAPK8(1), MAPK9(2), MYEF2(2), NFATC3(2), NR2C2(4), PAPPA(6), TP53(174), TRAF6(1), ZAK(4) | 13707275 | 263 | 163 | 192 | 23 | 66 | 56 | 25 | 27 | 86 | 3 | 9.94e-12 | <1.00e-15 | <6.31e-14 |
| 3 | ATMPATHWAY | The tumor-suppressing protein kinase ATM responds to radiation-induced DNA damage by blocking cell-cycle progression and activating DNA repair. | ABL1, ATM, BRCA1, CDKN1A, CHEK1, CHEK2, GADD45A, JUN, MAPK8, MDM2, MRE11A, NBS1, NFKB1, NFKBIA, RAD50, RAD51, RBBP8, RELA, TP53, TP73 | 19 | ABL1(2), ATM(22), BRCA1(6), CDKN1A(2), CHEK1(1), CHEK2(3), JUN(1), MAPK8(1), MDM2(2), MRE11A(2), NFKB1(2), RAD50(3), RAD51(3), RBBP8(3), TP53(174), TP73(3) | 8026064 | 230 | 161 | 157 | 10 | 53 | 51 | 22 | 24 | 77 | 3 | 1.18e-14 | <1.00e-15 | <6.31e-14 |
| 4 | TIDPATHWAY | On ligand binding, interferon gamma receptors stimulate JAK2 kinase to phosphorylate STAT transcription factors, which promote expression of interferon responsive genes. | DNAJA3, HSPA1A, IFNG, IFNGR1, IFNGR2, IKBKB, JAK2, LIN7A, NFKB1, NFKBIA, RB1, RELA, TIP-1, TNF, TNFRSF1A, TNFRSF1B, TP53, USH1C, WT1 | 18 | DNAJA3(3), IFNG(1), IFNGR1(1), IKBKB(2), JAK2(2), LIN7A(2), NFKB1(2), RB1(8), TNFRSF1B(1), TP53(174), WT1(4) | 5099114 | 200 | 161 | 130 | 12 | 52 | 33 | 19 | 18 | 75 | 3 | 8.62e-13 | <1.00e-15 | <6.31e-14 |
| 5 | ATRBRCAPATHWAY | BRCA1 and 2 block cell cycle progression in response to DNA damage and promote double-stranded break repair; mutations induce breast cancer susceptibility. | ATM, ATR, BRCA1, BRCA2, CHEK1, CHEK2, FANCA, FANCC, FANCD2, FANCE, FANCF, FANCG, HUS1, MRE11A, NBS1, RAD1, RAD17, RAD50, RAD51, RAD9A, TP53, TREX1 | 21 | ATM(22), ATR(5), BRCA1(6), BRCA2(9), CHEK1(1), CHEK2(3), FANCA(5), FANCC(2), FANCD2(4), FANCF(1), FANCG(1), MRE11A(2), RAD17(4), RAD50(3), RAD51(3), TP53(174), TREX1(1) | 11882135 | 246 | 160 | 174 | 14 | 53 | 52 | 29 | 26 | 83 | 3 | 1.64e-12 | <1.00e-15 | <6.31e-14 |
| 6 | RBPATHWAY | The ATM protein kinase recognizes DNA damage and blocks cell cycle progression by phosphorylating chk1 and p53, which normally inhibits Rb to allow G1/S transitions. | ATM, CDC2, CDC25A, CDC25B, CDC25C, CDK2, CDK4, CHEK1, MYT1, RB1, TP53, WEE1, YWHAH | 12 | ATM(22), CDC25A(3), CDC25B(2), CDK2(1), CHEK1(1), MYT1(4), RB1(8), TP53(174), WEE1(1) | 4826897 | 216 | 160 | 146 | 6 | 51 | 44 | 21 | 19 | 78 | 3 | <1.00e-15 | <1.00e-15 | <6.31e-14 |
| 7 | SA_G1_AND_S_PHASES | Cdk2, 4, and 6 bind cyclin D in G1, while cdk2/cyclin E promotes the G1/S transition. | ARF1, ARF3, CCND1, CDK2, CDK4, CDKN1A, CDKN1B, CDKN2A, CFL1, E2F1, E2F2, MDM2, NXT1, PRB1, TP53 | 15 | ARF1(1), CCND1(1), CDK2(1), CDKN1A(2), CDKN2A(19), CFL1(1), E2F1(2), E2F2(2), MDM2(2), NXT1(1), PRB1(2), TP53(174) | 2257529 | 208 | 159 | 137 | 5 | 51 | 37 | 18 | 19 | 80 | 3 | <1.00e-15 | <1.00e-15 | <6.31e-14 |
| 8 | PMLPATHWAY | Ring-shaped PML nuclear bodies regulate transcription and are required co-activators in p53- and DAXX-mediated apoptosis. | CREBBP, DAXX, HRAS, PAX3, PML, PRAM-1, RARA, RB1, SIRT1, SP100, TNF, TNFRSF1A, TNFRSF1B, TNFRSF6, TNFSF6, TP53, UBL1 | 13 | CREBBP(13), DAXX(3), HRAS(1), PML(4), RB1(8), SIRT1(5), SP100(7), TNFRSF1B(1), TP53(174) | 5160329 | 216 | 157 | 146 | 6 | 52 | 37 | 22 | 20 | 82 | 3 | <1.00e-15 | <1.00e-15 | <6.31e-14 |
| 9 | PLK3PATHWAY | Active Plk3 phosphorylates CDC25c, blocking the G2/M transition, and phosphorylates p53 to induce apoptosis. | ATM, ATR, CDC25C, CHEK1, CHEK2, CNK, TP53, YWHAH | 7 | ATM(22), ATR(5), CHEK1(1), CHEK2(3), TP53(174) | 4342671 | 205 | 156 | 135 | 4 | 50 | 37 | 22 | 22 | 71 | 3 | <1.00e-15 | <1.00e-15 | <6.31e-14 |
| 10 | RNAPATHWAY | dsRNA-activated protein kinase phosphorylates elF2a, which generally inhibits translation, and activates NF-kB to provoke inflammation. | CHUK, DNAJC3, EIF2S1, EIF2S2, MAP3K14, NFKB1, NFKBIA, PRKR, RELA, TP53 | 9 | CHUK(5), DNAJC3(1), EIF2S1(1), NFKB1(2), TP53(174) | 2784224 | 183 | 155 | 113 | 4 | 47 | 32 | 18 | 16 | 67 | 3 | 1.11e-15 | 1.22e-15 | 6.31e-14 |
Table 6. Get Full Table A Ranked List of Significantly Mutated Genesets (Excluding Significantly Mutated Genes). Number of significant genesets found: 0. Number of genesets displayed: 10
| rank | geneset | description | genes | N_genes | mut_tally | N | n | npat | nsite | nsil | n1 | n2 | n3 | n4 | n5 | n6 | p_ns_s | p | q |
|---|---|---|---|---|---|---|---|---|---|---|---|---|---|---|---|---|---|---|---|
| 1 | SLRPPATHWAY | Small leucine-rich proteoglycans (SLRPs) interact with and reorganize collagen fibers in the extracellular matrix. | BGN, DCN, DSPG3, FMOD, KERA, LUM | 5 | BGN(1), DCN(6), FMOD(2), KERA(2), LUM(3) | 981573 | 14 | 14 | 14 | 0 | 2 | 6 | 2 | 3 | 1 | 0 | 0.02 | 0.0016 | 1 |
| 2 | PS1PATHWAY | Presenilin is required for gamma-secretase activity to activate Notch signaling; presenilin also inhibits beta-catenin in the Wnt/Frizzled pathway. | ADAM17, APC, AXIN1, BTRC, CTNNB1, DLL1, DVL1, FZD1, GSK3B, NOTCH1, PSEN1, RBPSUH, TCF1, WNT1 | 12 | ADAM17(3), APC(15), AXIN1(2), BTRC(3), CTNNB1(9), DLL1(1), FZD1(4), GSK3B(3), NOTCH1(20), PSEN1(2), WNT1(1) | 5943593 | 63 | 50 | 62 | 6 | 10 | 10 | 12 | 7 | 21 | 3 | 0.01 | 0.0043 | 1 |
| 3 | NOTCHPATHWAY | Proteolysis and Signaling Pathway of Notch | ADAM17, DLL1, FURIN, NOTCH1, PSEN1, RBPSUH | 5 | ADAM17(3), DLL1(1), FURIN(2), NOTCH1(20), PSEN1(2) | 2782582 | 28 | 25 | 28 | 2 | 5 | 2 | 3 | 5 | 11 | 2 | 0.066 | 0.0069 | 1 |
| 4 | ERBB4PATHWAY | ErbB4 (aka HER4) is a receptor tyrosine kinase that binds neuregulins as well as members of the EGF family, which also target EGF receptors. | ADAM17, ERBB4, NRG2, NRG3, PRKCA, PRKCB1, PSEN1 | 5 | ADAM17(3), NRG2(2), NRG3(8), PRKCA(1), PSEN1(2) | 1787004 | 16 | 16 | 16 | 1 | 4 | 3 | 4 | 2 | 3 | 0 | 0.048 | 0.022 | 1 |
| 5 | FLUMAZENILPATHWAY | Flumazenil is a benzodiazepine receptor antagonist that may induce protective preconditioning in ischemic cardiomyocytes. | GABRA1, GABRA2, GABRA3, GABRA4, GABRA5, GABRA6, GPX1, PRKCE, SOD1 | 8 | GABRA1(7), GABRA3(1), GABRA4(3), GABRA5(4), GABRA6(7), PRKCE(2) | 1945815 | 24 | 21 | 24 | 3 | 7 | 5 | 9 | 0 | 3 | 0 | 0.046 | 0.067 | 1 |
| 6 | UREACYCLEPATHWAY | Ammonia released from amino acid deamination is used to produce carbamoyl phosphate, which is used to convert ornithine to citrulline, from which urea is eventually formed. | ARG1, ASL, ASS, CPS1, GLS, GLUD1, GOT1 | 6 | ARG1(1), ASL(3), CPS1(11), GLS(2), GLUD1(1) | 2139811 | 18 | 16 | 18 | 1 | 2 | 8 | 5 | 2 | 1 | 0 | 0.032 | 0.089 | 1 |
| 7 | FBW7PATHWAY | Cyclin E interacts with cell cycle checkpoint kinase cdk2 to allow transcription of genes required for S phase, including transcription of additional cyclin E. | CCNE1, CDC34, CDK2, CUL1, E2F1, FBXW7, RB1, SKP1A, TFDP1 | 7 | CCNE1(2), CDK2(1), CUL1(4), E2F1(2), RB1(8), TFDP1(1) | 1884442 | 18 | 17 | 18 | 3 | 0 | 5 | 1 | 1 | 11 | 0 | 0.41 | 0.11 | 1 |
| 8 | BETAOXIDATIONPATHWAY | Beta-Oxidation of Fatty Acids | ACADL, ACADM, ACADS, ACAT1, ECHS1, HADHA | 6 | ACADL(5), ACADS(2), ACAT1(3), ECHS1(1), HADHA(2) | 1517471 | 13 | 12 | 13 | 0 | 2 | 6 | 1 | 0 | 4 | 0 | 0.068 | 0.12 | 1 |
| 9 | BOTULINPATHWAY | Blockade of Neurotransmitter Relase by Botulinum Toxin | CHRM1, CHRNA1, SNAP25, STX1A, VAMP2 | 5 | CHRM1(2), CHRNA1(4), SNAP25(1), STX1A(2) | 881127 | 9 | 8 | 8 | 0 | 6 | 1 | 1 | 1 | 0 | 0 | 0.056 | 0.12 | 1 |
| 10 | IL18PATHWAY | Pro-inflammatory IL-18 is activated in macrophages by caspase-1 cleavage and, in conjunction with IL-12, stimulates Th1 cell differentiation. | CASP1, IFNG, IL12A, IL12B, IL18, IL2 | 6 | CASP1(5), IFNG(1), IL12B(1) | 817967 | 7 | 7 | 7 | 1 | 0 | 4 | 2 | 0 | 1 | 0 | 0.36 | 0.12 | 1 |
In brief, we tabulate the number of mutations and the number of covered bases for each gene. The counts are broken down by mutation context category: four context categories that are discovered by MutSig, and one for indel and 'null' mutations, which include indels, nonsense mutations, splice-site mutations, and non-stop (read-through) mutations. For each gene, we calculate the probability of seeing the observed constellation of mutations, i.e. the product P1 x P2 x ... x Pm, or a more extreme one, given the background mutation rates calculated across the dataset. [1]
In addition to the links below, the full results of the analysis summarized in this report can also be downloaded programmatically using firehose_get, or interactively from either the Broad GDAC website or TCGA Data Coordination Center Portal.