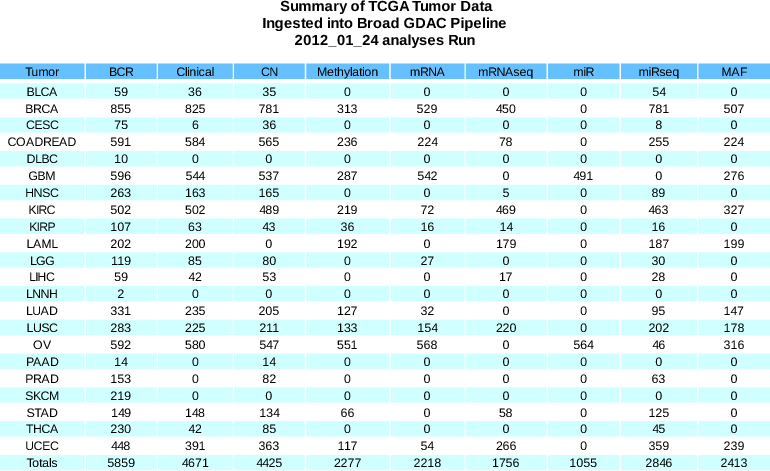
Tables of Ingested Data: HTML PNG TSV
| Tumor Type | # Pipelines | % Successful | Summary |
|---|---|---|---|
| OV | 24 | 100% | Report |
| COADREAD | 23 | 100% | Report |
| BRCA | 23 | 100% | Report |
| GBM | 21 | 100% | Report |
| LGG | 14 | 100% | Report |
| LUSC | 20 | 95% | Report |
| LUAD | 19 | 95% | Report |
| KIRC | 19 | 86% | Report |
| UCEC | 18 | 86% | Report |
| KIRP | 17 | 85% | Report |
| STAD | 12 | 80% | Report |
| LIHC | 9 | 69% | Report |
| HNSC | 8 | 62% | Report |
| THCA | 6 | 60% | Report |
| PRAD | 6 | 60% | Report |
| BLCA | 6 | 60% | Report |
| LAML | 8 | 57% | Report |
| PAAD | 3 | 43% | Report |
| CESC | 3 | 33% | Report |
| SKCM | 0 | 0% | Report |
| LNNH | 0 | 0% | Report |
| DLBC | 0 | 0% | Report |