This pipeline performs Gene Set Enrichment Analysis (GSEA) using The Broad Institute GSEA tool with MSigDB - Class2: Canonical Pathways gene sets. For a given phenotype subtype, it shows what pathways are significantly enriched in each subtype by comparing gene expression profiles between subtypes. Here, the phenotype is mRNAseq_cNMF subtypes having more than three samples and the input expression file "LAML-TB.uncv2.mRNAseq_RSEM_normalized_log2.txt" is generated in the pipeline mRNAseq_Preprocess in the stddata run. This pipeline has the following features:
-
For each subtype, calculates enrichment scores (ES) using signal to noise (S2N) that checks similarity between subtypes in expression level then calculates p values through permutation test.
-
Lists pathways significantly enriched in each phenotype subtype and their enrichment scores (ES).
-
Lists top 20 core genes enriched in each significant gene set and their enrichment scores (ES).
-
Checks if the top core genes are up-regulated or down-regulated.
-
Checks if the top core genes are high expressed or low expressed.
-
Checks if the top core genes are significantly differently expressed genes.
Table 1. Get Full Table basic data info
| basic data info |
|---|
| Number of Gene Sets: 692 |
| Number of samples: 173 |
| Original number of Gene Sets: 1320 |
| Maximum gene set size: 933 |
Table 2. Get Full Table pheno data info
| phenotype info |
|---|
| pheno.type: 1 - 3 :[ clus1 ] 75 |
| pheno.type: 2 - 3 :[ clus2 ] 52 |
| pheno.type: 3 - 3 :[ clus3 ] 46 |
For the expression subtypes of 17276 genes in 174 samples, GSEA found enriched gene sets in each cluster using 173 gene sets in MSigDB canonical pathways. Top enriched gene sets are listed as below.
-
clus1
-
Top enriched gene sets are KEGG N GLYCAN BIOSYNTHESIS, KEGG MTOR SIGNALING PATHWAY, KEGG ADHERENS JUNCTION, KEGG RENAL CELL CARCINOMA, KEGG PANCREATIC CANCER, KEGG ENDOMETRIAL CANCER, KEGG PROSTATE CANCER, KEGG THYROID CANCER, KEGG MELANOMA, KEGG NON SMALL CELL LUNG CANCER
-
And common core enriched genes are EGF, EGFR, CCND1, CDH1, MGAT3, ESR1, IFNG, NR2F2, TERT, AKT3
-
clus2
-
Top enriched gene sets are KEGG LYSOSOME, KEGG FC GAMMA R MEDIATED PHAGOCYTOSIS, BIOCARTA HIVNEF PATHWAY, BIOCARTA PYK2 PATHWAY, BIOCARTA TOLL PATHWAY, ST TUMOR NECROSIS FACTOR PATHWAY, PID IL1PATHWAY, PID IFNGPATHWAY, PID IL8CXCR2 PATHWAY, PID MAPKTRKPATHWAY
-
And common core enriched genes are FOS, MAP2K1, MAP2K6, MAPK7, MEF2C, DUSP6, IRAK3, LY96, MYD88, NFKB2
-
clus3
-
Top enriched gene sets are KEGG GLYCOSYLPHOSPHATIDYLINOSITOL GPI ANCHOR BIOSYNTHESIS, KEGG AMINOACYL TRNA BIOSYNTHESIS, KEGG RIBOSOME, KEGG RNA POLYMERASE, PID MYC PATHWAY, REACTOME TRANSLATION, REACTOME FORMATION OF THE TERNARY COMPLEX AND SUBSEQUENTLY THE 43S COMPLEX, REACTOME SRP DEPENDENT COTRANSLATIONAL PROTEIN TARGETING TO MEMBRANE, REACTOME ACTIVATION OF THE MRNA UPON BINDING OF THE CAP BINDING COMPLEX AND EIFS AND SUBSEQUENT BINDING TO 43S, REACTOME PEPTIDE CHAIN ELONGATION
-
And common core enriched genes are POLR1C, POLR1D, POLR2F, POLR2H, POLR2L, POLR3B, POLR3D, POLR3H, POLR3K, CDKN2A
Table 3. Get Full Table This table shows top 10 pathways which are significantly enriched in cluster clus1. It displays only significant gene sets satisfying nom.p.val.threshold (-1), fwer.p.val.threshold (-1) , fdr.q.val.threshold (0.25) and the default table is sorted by Normalized Enrichment Score (NES). Further details on NES statistics, please visit The Broad GSEA website.
| GeneSet(GS) | Size(#genes) | genes.ES.table | ES | NES | NOM.p.val | FDR.q.val | FWER.p.val | Tag.. | Gene.. | Signal | FDR..median. | glob.p.val |
|---|---|---|---|---|---|---|---|---|---|---|---|---|
| KEGG N GLYCAN BIOSYNTHESIS | 46 | genes.ES.table | 0.48 | 1.9 | 0.002 | 0.53 | 0.26 | 0.28 | 0.28 | 0.2 | 0 | 0.1 |
| KEGG MTOR SIGNALING PATHWAY | 49 | genes.ES.table | 0.48 | 1.7 | 0.012 | 0.47 | 0.65 | 0.2 | 0.17 | 0.17 | 0.16 | 0.12 |
| KEGG ADHERENS JUNCTION | 72 | genes.ES.table | 0.57 | 1.7 | 0.0061 | 0.68 | 0.61 | 0.24 | 0.092 | 0.22 | 0.22 | 0.16 |
| KEGG RENAL CELL CARCINOMA | 69 | genes.ES.table | 0.46 | 1.7 | 0.004 | 0.48 | 0.73 | 0.23 | 0.18 | 0.19 | 0.19 | 0.12 |
| KEGG PANCREATIC CANCER | 70 | genes.ES.table | 0.43 | 1.7 | 0.0019 | 0.55 | 0.62 | 0.17 | 0.15 | 0.15 | 0.18 | 0.13 |
| KEGG ENDOMETRIAL CANCER | 51 | genes.ES.table | 0.54 | 1.9 | 0.002 | 0.79 | 0.26 | 0.2 | 0.15 | 0.17 | 0 | 0.15 |
| KEGG PROSTATE CANCER | 87 | genes.ES.table | 0.5 | 1.8 | 0.004 | 0.5 | 0.42 | 0.23 | 0.17 | 0.19 | 0 | 0.11 |
| KEGG THYROID CANCER | 28 | genes.ES.table | 0.57 | 1.7 | 0.002 | 0.45 | 0.65 | 0.18 | 0.14 | 0.15 | 0.16 | 0.12 |
| KEGG MELANOMA | 60 | genes.ES.table | 0.58 | 1.7 | 0.0019 | 0.47 | 0.69 | 0.35 | 0.17 | 0.29 | 0.17 | 0.13 |
| KEGG NON SMALL CELL LUNG CANCER | 53 | genes.ES.table | 0.45 | 1.7 | 0.0039 | 0.6 | 0.61 | 0.15 | 0.15 | 0.13 | 0.19 | 0.14 |
Table S1. Get Full Table This table shows a Running Enrichment Score (RES) of each gene in this pathway, that is, the enrichment score at this point in the ranked list of genes. All genes are ranked by Signal-to-Noise (S2N), a measure of similarity as default and are used to obtain ES matrix of all genes. In this way, GSEA tool uses expression pattern of not only overlapped genes but also not-overlapped genes to produce ES matrix.
| Rank | GENE | SYMBOL | DESC | LIST.LOC | S2N | RES | CORE_ENRICHMENT |
|---|---|---|---|---|---|---|---|
| 1 | CCND1 | CCND1 | CCND1 | 63 | 0.61 | 0.1 | YES |
| 2 | TERT | TERT | TERT | 143 | 0.56 | 0.19 | YES |
| 3 | EGFR | EGFR | EGFR | 177 | 0.54 | 0.28 | YES |
| 4 | EGF | EGF | EGF | 253 | 0.51 | 0.36 | YES |
| 5 | ESR1 | ESR1 | ESR1 | 652 | 0.42 | 0.41 | YES |
| 6 | NR2F2 | NR2F2 | NR2F2 | 881 | 0.38 | 0.46 | YES |
| 7 | IFNG | IFNG | IFNG | 1523 | 0.31 | 0.47 | YES |
| 8 | PIF1 | PIF1 | PIF1 | 2377 | 0.23 | 0.46 | NO |
| 9 | WRN | WRN | WRN | 4085 | 0.14 | 0.39 | NO |
| 10 | MYC | MYC | MYC | 5427 | 0.09 | 0.32 | NO |
| 11 | PARP2 | PARP2 | PARP2 | 5487 | 0.089 | 0.34 | NO |
| 12 | DKC1 | DKC1 | DKC1 | 6217 | 0.071 | 0.31 | NO |
| 13 | MRE11A | MRE11A | MRE11A | 6287 | 0.07 | 0.31 | NO |
| 14 | TNKS | TNKS | TNKS | 6339 | 0.069 | 0.32 | NO |
| 15 | POT1 | POT1 | POT1 | 7074 | 0.054 | 0.29 | NO |
| 16 | RBBP4 | RBBP4 | RBBP4 | 7161 | 0.053 | 0.29 | NO |
| 17 | NBN | NBN | NBN | 7211 | 0.052 | 0.3 | NO |
| 18 | WT1 | WT1 | WT1 | 7320 | 0.05 | 0.3 | NO |
| 19 | HDAC2 | HDAC2 | HDAC2 | 7479 | 0.048 | 0.3 | NO |
| 20 | SIN3A | SIN3A | SIN3A | 7537 | 0.047 | 0.3 | NO |
| 21 | SMAD3 | SMAD3 | SMAD3 | 7609 | 0.046 | 0.31 | NO |
| 22 | SP3 | SP3 | SP3 | 7672 | 0.045 | 0.31 | NO |
| 23 | RAD9A | RAD9A | RAD9A | 7969 | 0.04 | 0.3 | NO |
| 24 | TERF1 | TERF1 | TERF1 | 7990 | 0.04 | 0.31 | NO |
| 25 | SMG6 | SMG6 | SMG6 | 8042 | 0.04 | 0.31 | NO |
| 26 | IRF1 | IRF1 | IRF1 | 8060 | 0.039 | 0.32 | NO |
| 27 | E2F1 | E2F1 | E2F1 | 8092 | 0.039 | 0.32 | NO |
| 28 | MAX | MAX | MAX | 8131 | 0.038 | 0.32 | NO |
| 29 | ABL1 | ABL1 | ABL1 | 8189 | 0.038 | 0.33 | NO |
| 30 | ATM | ATM | ATM | 8222 | 0.037 | 0.33 | NO |
| 31 | RAD1 | RAD1 | RAD1 | 8267 | 0.037 | 0.34 | NO |
| 32 | TERF2IP | TERF2IP | TERF2IP | 8441 | 0.034 | 0.33 | NO |
| 33 | UBE3A | UBE3A | UBE3A | 8508 | 0.033 | 0.33 | NO |
| 34 | BLM | BLM | BLM | 8557 | 0.033 | 0.34 | NO |
| 35 | SIN3B | SIN3B | SIN3B | 8587 | 0.032 | 0.34 | NO |
| 36 | HDAC1 | HDAC1 | HDAC1 | 8625 | 0.032 | 0.34 | NO |
| 37 | NCL | NCL | NCL | 8824 | 0.029 | 0.34 | NO |
| 38 | SMG5 | SMG5 | SMG5 | 8854 | 0.029 | 0.34 | NO |
| 39 | RPS6KB1 | RPS6KB1 | RPS6KB1 | 8933 | 0.028 | 0.34 | NO |
| 40 | RBBP7 | RBBP7 | RBBP7 | 9094 | 0.026 | 0.34 | NO |
| 41 | XRCC5 | XRCC5 | XRCC5 | 9106 | 0.026 | 0.34 | NO |
| 42 | MTOR | MTOR | MTOR | 9420 | 0.022 | 0.32 | NO |
| 43 | MAPK1 | MAPK1 | MAPK1 | 10305 | 0.011 | 0.28 | NO |
| 44 | XRCC6 | XRCC6 | XRCC6 | 10472 | 0.0086 | 0.27 | NO |
| 45 | CDKN1B | CDKN1B | CDKN1B | 10668 | 0.0064 | 0.26 | NO |
| 46 | HSP90AA1 | HSP90AA1 | HSP90AA1 | 10748 | 0.0052 | 0.25 | NO |
| 47 | RAD50 | RAD50 | RAD50 | 10917 | 0.0032 | 0.24 | NO |
| 48 | SP1 | SP1 | SP1 | 11371 | -0.0029 | 0.22 | NO |
| 49 | HNRNPC | HNRNPC | HNRNPC | 11479 | -0.0043 | 0.21 | NO |
| 50 | TERF2 | TERF2 | TERF2 | 11563 | -0.0054 | 0.21 | NO |
| 51 | ZNFX1 | ZNFX1 | ZNFX1 | 11635 | -0.0066 | 0.21 | NO |
| 52 | SAP18 | SAP18 | SAP18 | 12010 | -0.012 | 0.19 | NO |
| 53 | PTGES3 | PTGES3 | PTGES3 | 12348 | -0.017 | 0.17 | NO |
| 54 | IFNAR2 | IFNAR2 | IFNAR2 | 12351 | -0.017 | 0.17 | NO |
| 55 | MAPK3 | MAPK3 | MAPK3 | 12736 | -0.023 | 0.15 | NO |
| 56 | TINF2 | TINF2 | TINF2 | 12819 | -0.025 | 0.15 | NO |
| 57 | HUS1 | HUS1 | HUS1 | 12925 | -0.027 | 0.15 | NO |
| 58 | NFKB1 | NFKB1 | NFKB1 | 13189 | -0.031 | 0.14 | NO |
| 59 | YWHAE | YWHAE | YWHAE | 13424 | -0.036 | 0.13 | NO |
| 60 | ACD | ACD | ACD | 13800 | -0.044 | 0.12 | NO |
| 61 | FOS | FOS | FOS | 13848 | -0.045 | 0.12 | NO |
| 62 | PINX1 | PINX1 | PINX1 | 13893 | -0.046 | 0.13 | NO |
| 63 | TGFB1 | TGFB1 | TGFB1 | 14565 | -0.064 | 0.1 | NO |
| 64 | AKT1 | AKT1 | AKT1 | 14735 | -0.07 | 0.1 | NO |
| 65 | JUN | JUN | JUN | 14997 | -0.078 | 0.1 | NO |
| 66 | MXD1 | MXD1 | MXD1 | 15005 | -0.078 | 0.11 | NO |
| 67 | SAP30 | SAP30 | SAP30 | 15505 | -0.1 | 0.1 | NO |
Figure S1. Get High-res Image This plot shows mRNAseq_cNMF expression data heatmap (on the left) a RunningEnrichmentScore(RES) plot (on the top right) and a Signal2Noise(S2N) plot (on the bottom right) of genes in the pathway: KEGG N GLYCAN BIOSYNTHESIS.
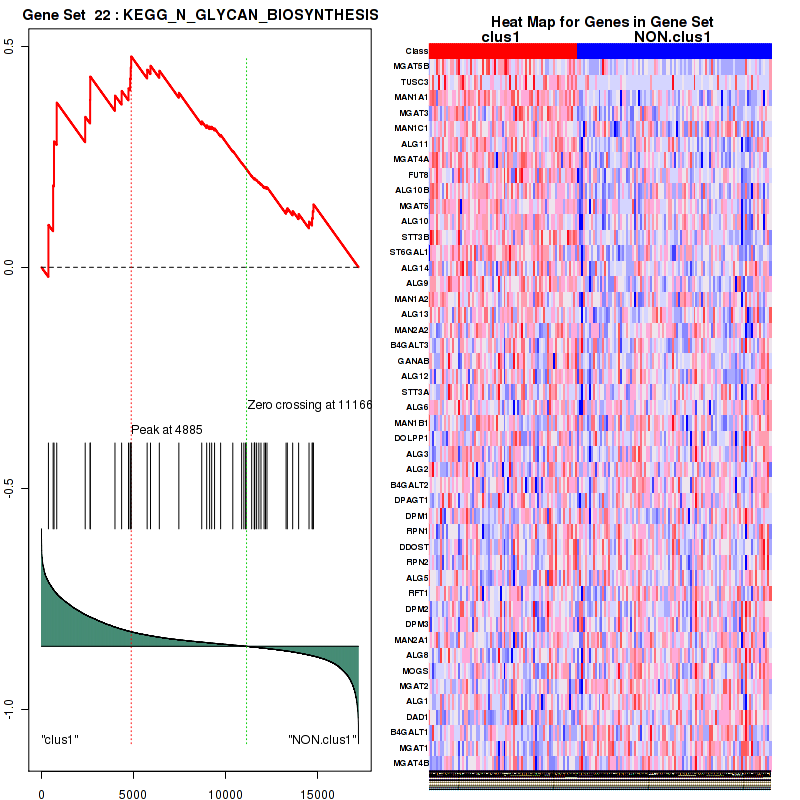
Figure S2. Get High-res Image For the top 5 core enriched genes in the pathway: KEGG N GLYCAN BIOSYNTHESIS, this volcano plot shows how much they are up/down-regulated and significant. The significance was calculated by empirical bayesian fit

Table S2. Get Full Table This table shows a Running Enrichment Score (RES) of each gene in this pathway, that is, the enrichment score at this point in the ranked list of genes. All genes are ranked by Signal-to-Noise (S2N), a measure of similarity as default and are used to obtain ES matrix of all genes. In this way, GSEA tool uses expression pattern of not only overlapped genes but also not-overlapped genes to produce ES matrix.
| Rank | GENE | SYMBOL | DESC | LIST.LOC | S2N | RES | CORE_ENRICHMENT |
|---|---|---|---|---|---|---|---|
| 1 | CCND1 | CCND1 | CCND1 | 63 | 0.61 | 0.1 | YES |
| 2 | CDH1 | CDH1 | CDH1 | 140 | 0.56 | 0.2 | YES |
| 3 | EGFR | EGFR | EGFR | 177 | 0.54 | 0.29 | YES |
| 4 | EGF | EGF | EGF | 253 | 0.51 | 0.38 | YES |
| 5 | LEF1 | LEF1 | LEF1 | 642 | 0.42 | 0.43 | YES |
| 6 | TCF7 | TCF7 | TCF7 | 1589 | 0.3 | 0.42 | YES |
| 7 | AXIN2 | AXIN2 | AXIN2 | 1885 | 0.27 | 0.45 | YES |
| 8 | AKT3 | AKT3 | AKT3 | 2347 | 0.24 | 0.47 | YES |
| 9 | PIK3R3 | PIK3R3 | PIK3R3 | 2395 | 0.23 | 0.51 | YES |
| 10 | ERBB2 | ERBB2 | ERBB2 | 2526 | 0.22 | 0.54 | YES |
| 11 | CTNNA3 | CTNNA3 | CTNNA3 | 3921 | 0.14 | 0.48 | NO |
| 12 | PIK3CA | PIK3CA | PIK3CA | 5255 | 0.095 | 0.42 | NO |
| 13 | MYC | MYC | MYC | 5427 | 0.09 | 0.43 | NO |
| 14 | FOXO3 | FOXO3 | FOXO3 | 5514 | 0.088 | 0.44 | NO |
| 15 | SOS1 | SOS1 | SOS1 | 5782 | 0.081 | 0.44 | NO |
| 16 | BRAF | BRAF | BRAF | 6025 | 0.075 | 0.44 | NO |
| 17 | TCF7L2 | TCF7L2 | TCF7L2 | 6035 | 0.075 | 0.45 | NO |
| 18 | PIK3R1 | PIK3R1 | PIK3R1 | 6522 | 0.065 | 0.43 | NO |
| 19 | APC | APC | APC | 8151 | 0.038 | 0.34 | NO |
| 20 | NRAS | NRAS | NRAS | 8475 | 0.034 | 0.33 | NO |
| 21 | AXIN1 | AXIN1 | AXIN1 | 8762 | 0.03 | 0.32 | NO |
| 22 | PTEN | PTEN | PTEN | 8964 | 0.028 | 0.31 | NO |
| 23 | PIK3CG | PIK3CG | PIK3CG | 9829 | 0.017 | 0.26 | NO |
| 24 | GSK3B | GSK3B | GSK3B | 10065 | 0.014 | 0.25 | NO |
| 25 | MAPK1 | MAPK1 | MAPK1 | 10305 | 0.011 | 0.24 | NO |
| 26 | MAP2K2 | MAP2K2 | MAP2K2 | 10714 | 0.0058 | 0.22 | NO |
| 27 | AKT2 | AKT2 | AKT2 | 11099 | 0.0008 | 0.2 | NO |
| 28 | MLH1 | MLH1 | MLH1 | 11261 | -0.0013 | 0.19 | NO |
| 29 | PIK3CD | PIK3CD | PIK3CD | 11292 | -0.0018 | 0.19 | NO |
| 30 | RAF1 | RAF1 | RAF1 | 11328 | -0.0022 | 0.18 | NO |
| 31 | ELK1 | ELK1 | ELK1 | 11412 | -0.0034 | 0.18 | NO |
| 32 | PDPK1 | PDPK1 | PDPK1 | 11511 | -0.0048 | 0.18 | NO |
| 33 | KRAS | KRAS | KRAS | 11523 | -0.0049 | 0.18 | NO |
| 34 | APC2 | APC2 | APC2 | 11737 | -0.008 | 0.16 | NO |
| 35 | TP53 | TP53 | TP53 | 11867 | -0.0098 | 0.16 | NO |
| 36 | SOS2 | SOS2 | SOS2 | 12356 | -0.017 | 0.13 | NO |
| 37 | CTNNB1 | CTNNB1 | CTNNB1 | 12367 | -0.018 | 0.14 | NO |
| 38 | MAPK3 | MAPK3 | MAPK3 | 12736 | -0.023 | 0.12 | NO |
| 39 | ARAF | ARAF | ARAF | 12866 | -0.026 | 0.12 | NO |
| 40 | PIK3R2 | PIK3R2 | PIK3R2 | 12876 | -0.026 | 0.12 | NO |
| 41 | TCF7L1 | TCF7L1 | TCF7L1 | 13041 | -0.028 | 0.12 | NO |
| 42 | HRAS | HRAS | HRAS | 14457 | -0.061 | 0.044 | NO |
| 43 | BAD | BAD | BAD | 14488 | -0.062 | 0.053 | NO |
| 44 | PIK3CB | PIK3CB | PIK3CB | 14720 | -0.069 | 0.052 | NO |
| 45 | AKT1 | AKT1 | AKT1 | 14735 | -0.07 | 0.063 | NO |
| 46 | PIK3R5 | PIK3R5 | PIK3R5 | 14762 | -0.07 | 0.074 | NO |
| 47 | GRB2 | GRB2 | GRB2 | 14763 | -0.07 | 0.086 | NO |
| 48 | MAP2K1 | MAP2K1 | MAP2K1 | 14788 | -0.071 | 0.097 | NO |
| 49 | CASP9 | CASP9 | CASP9 | 14790 | -0.072 | 0.11 | NO |
| 50 | ILK | ILK | ILK | 14911 | -0.075 | 0.12 | NO |
| 51 | CTNNA1 | CTNNA1 | CTNNA1 | 15811 | -0.12 | 0.084 | NO |
Figure S3. Get High-res Image This plot shows mRNAseq_cNMF expression data heatmap (on the left) a RunningEnrichmentScore(RES) plot (on the top right) and a Signal2Noise(S2N) plot (on the bottom right) of genes in the pathway: KEGG MTOR SIGNALING PATHWAY.
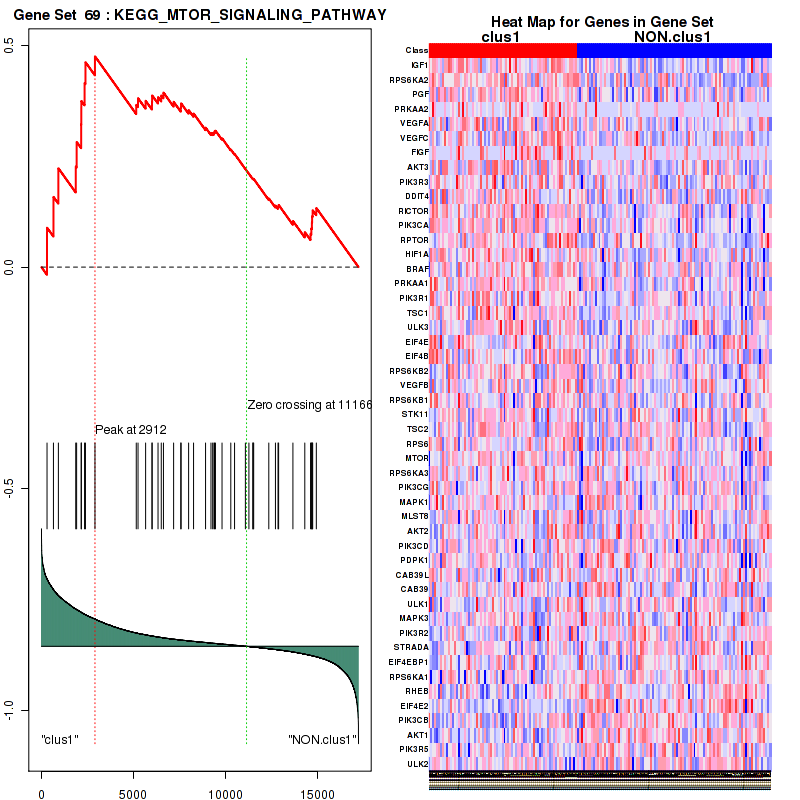
Figure S4. Get High-res Image For the top 5 core enriched genes in the pathway: KEGG MTOR SIGNALING PATHWAY, this volcano plot shows how much they are up/down-regulated and significant. The significance was calculated by empirical bayesian fit
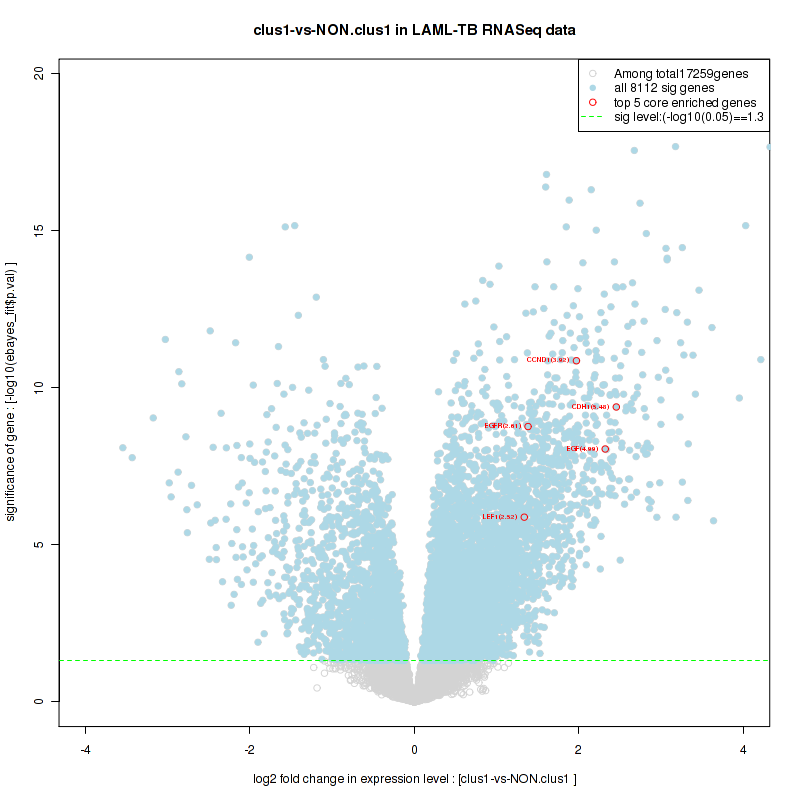
Table S3. Get Full Table This table shows a Running Enrichment Score (RES) of each gene in this pathway, that is, the enrichment score at this point in the ranked list of genes. All genes are ranked by Signal-to-Noise (S2N), a measure of similarity as default and are used to obtain ES matrix of all genes. In this way, GSEA tool uses expression pattern of not only overlapped genes but also not-overlapped genes to produce ES matrix.
| Rank | GENE | SYMBOL | DESC | LIST.LOC | S2N | RES | CORE_ENRICHMENT |
|---|---|---|---|---|---|---|---|
| 1 | MGAT5B | MGAT5B | MGAT5B | 379 | 0.48 | 0.096 | YES |
| 2 | TUSC3 | TUSC3 | TUSC3 | 635 | 0.42 | 0.18 | YES |
| 3 | MAN1A1 | MAN1A1 | MAN1A1 | 683 | 0.41 | 0.28 | YES |
| 4 | MGAT3 | MGAT3 | MGAT3 | 830 | 0.39 | 0.37 | YES |
| 5 | MAN1C1 | MAN1C1 | MAN1C1 | 2381 | 0.23 | 0.34 | YES |
| 6 | ALG11 | ALG11 | ALG11 | 2649 | 0.22 | 0.38 | YES |
| 7 | MGAT4A | MGAT4A | MGAT4A | 2656 | 0.22 | 0.43 | YES |
| 8 | FUT8 | FUT8 | FUT8 | 4002 | 0.14 | 0.39 | YES |
| 9 | ALG10B | ALG10B | ALG10B | 4364 | 0.13 | 0.4 | YES |
| 10 | MGAT5 | MGAT5 | MGAT5 | 4738 | 0.11 | 0.4 | YES |
| 11 | ALG10 | ALG10 | ALG10 | 4828 | 0.11 | 0.43 | YES |
| 12 | STT3B | STT3B | STT3B | 4859 | 0.11 | 0.45 | YES |
| 13 | ST6GAL1 | ST6GAL1 | ST6GAL1 | 4885 | 0.11 | 0.48 | YES |
| 14 | ALG14 | ALG14 | ALG14 | 5754 | 0.082 | 0.45 | NO |
| 15 | ALG9 | ALG9 | ALG9 | 5935 | 0.078 | 0.46 | NO |
| 16 | MAN1A2 | MAN1A2 | MAN1A2 | 6416 | 0.067 | 0.44 | NO |
| 17 | ALG13 | ALG13 | ALG13 | 7480 | 0.048 | 0.4 | NO |
| 18 | MAN2A2 | MAN2A2 | MAN2A2 | 8725 | 0.031 | 0.33 | NO |
| 19 | B4GALT3 | B4GALT3 | B4GALT3 | 8994 | 0.027 | 0.32 | NO |
| 20 | GANAB | GANAB | GANAB | 9154 | 0.025 | 0.32 | NO |
| 21 | ALG12 | ALG12 | ALG12 | 9264 | 0.024 | 0.32 | NO |
| 22 | STT3A | STT3A | STT3A | 9421 | 0.022 | 0.31 | NO |
| 23 | ALG6 | ALG6 | ALG6 | 9753 | 0.018 | 0.3 | NO |
| 24 | MAN1B1 | MAN1B1 | MAN1B1 | 10415 | 0.0093 | 0.26 | NO |
| 25 | DOLPP1 | DOLPP1 | DOLPP1 | 10894 | 0.0034 | 0.24 | NO |
| 26 | ALG3 | ALG3 | ALG3 | 11016 | 0.0019 | 0.23 | NO |
| 27 | ALG2 | ALG2 | ALG2 | 11114 | 0.00064 | 0.22 | NO |
| 28 | B4GALT2 | B4GALT2 | B4GALT2 | 11144 | 0.00024 | 0.22 | NO |
| 29 | DPAGT1 | DPAGT1 | DPAGT1 | 11443 | -0.0038 | 0.21 | NO |
| 30 | DPM1 | DPM1 | DPM1 | 11584 | -0.0057 | 0.2 | NO |
| 31 | RPN1 | RPN1 | RPN1 | 11601 | -0.006 | 0.2 | NO |
| 32 | DDOST | DDOST | DDOST | 11611 | -0.0062 | 0.2 | NO |
| 33 | RPN2 | RPN2 | RPN2 | 11711 | -0.0077 | 0.2 | NO |
| 34 | ALG5 | ALG5 | ALG5 | 11834 | -0.0095 | 0.19 | NO |
| 35 | RFT1 | RFT1 | RFT1 | 11950 | -0.011 | 0.19 | NO |
| 36 | DPM2 | DPM2 | DPM2 | 12120 | -0.014 | 0.18 | NO |
| 37 | DPM3 | DPM3 | DPM3 | 12196 | -0.015 | 0.18 | NO |
| 38 | MAN2A1 | MAN2A1 | MAN2A1 | 12276 | -0.016 | 0.18 | NO |
| 39 | ALG8 | ALG8 | ALG8 | 13317 | -0.033 | 0.13 | NO |
| 40 | MOGS | MOGS | MOGS | 13384 | -0.035 | 0.13 | NO |
| 41 | MGAT2 | MGAT2 | MGAT2 | 13674 | -0.041 | 0.13 | NO |
| 42 | ALG1 | ALG1 | ALG1 | 13998 | -0.048 | 0.12 | NO |
| 43 | DAD1 | DAD1 | DAD1 | 14564 | -0.064 | 0.1 | NO |
| 44 | B4GALT1 | B4GALT1 | B4GALT1 | 14731 | -0.069 | 0.11 | NO |
| 45 | MGAT1 | MGAT1 | MGAT1 | 14769 | -0.071 | 0.13 | NO |
| 46 | MGAT4B | MGAT4B | MGAT4B | 14806 | -0.072 | 0.14 | NO |
Figure S5. Get High-res Image This plot shows mRNAseq_cNMF expression data heatmap (on the left) a RunningEnrichmentScore(RES) plot (on the top right) and a Signal2Noise(S2N) plot (on the bottom right) of genes in the pathway: KEGG ADHERENS JUNCTION.

Figure S6. Get High-res Image For the top 5 core enriched genes in the pathway: KEGG ADHERENS JUNCTION, this volcano plot shows how much they are up/down-regulated and significant. The significance was calculated by empirical bayesian fit
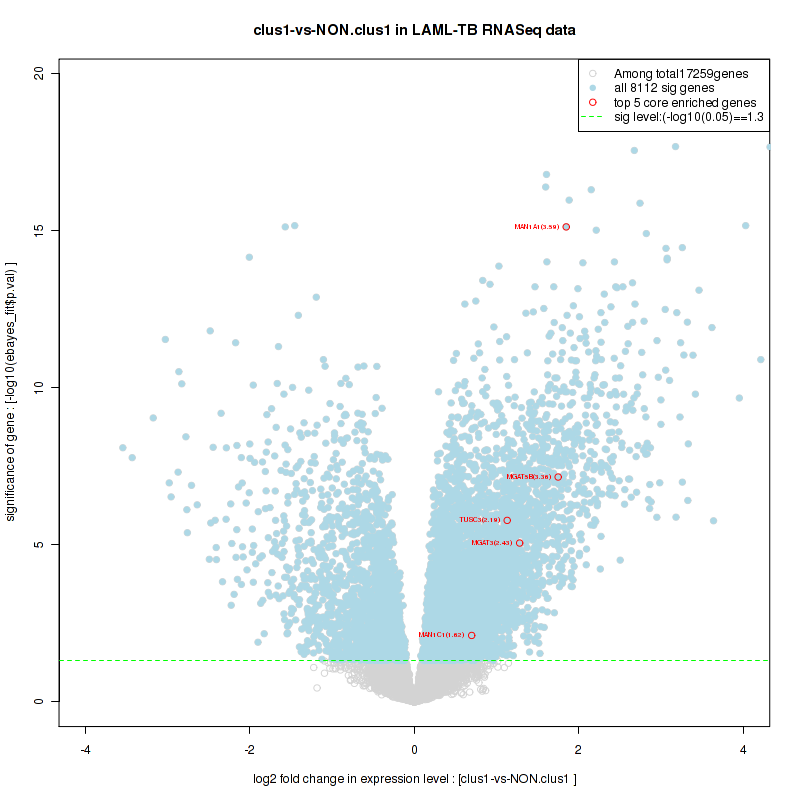
Table S4. Get Full Table This table shows a Running Enrichment Score (RES) of each gene in this pathway, that is, the enrichment score at this point in the ranked list of genes. All genes are ranked by Signal-to-Noise (S2N), a measure of similarity as default and are used to obtain ES matrix of all genes. In this way, GSEA tool uses expression pattern of not only overlapped genes but also not-overlapped genes to produce ES matrix.
| Rank | GENE | SYMBOL | DESC | LIST.LOC | S2N | RES | CORE_ENRICHMENT |
|---|---|---|---|---|---|---|---|
| 1 | EFNA1 | EFNA1 | EFNA1 | 97 | 0.58 | 0.076 | YES |
| 2 | CDH1 | CDH1 | CDH1 | 140 | 0.56 | 0.15 | YES |
| 3 | EGFR | EGFR | EGFR | 177 | 0.54 | 0.22 | YES |
| 4 | EGF | EGF | EGF | 253 | 0.51 | 0.29 | YES |
| 5 | NCKAP1 | NCKAP1 | NCKAP1 | 279 | 0.5 | 0.36 | YES |
| 6 | IGF1 | IGF1 | IGF1 | 303 | 0.49 | 0.43 | YES |
| 7 | MET | MET | MET | 676 | 0.41 | 0.46 | YES |
| 8 | MGAT3 | MGAT3 | MGAT3 | 830 | 0.39 | 0.51 | YES |
| 9 | EPHA2 | EPHA2 | EPHA2 | 846 | 0.38 | 0.56 | YES |
| 10 | IGF1R | IGF1R | IGF1R | 1338 | 0.32 | 0.58 | YES |
| 11 | MLLT4 | MLLT4 | MLLT4 | 1552 | 0.3 | 0.61 | YES |
| 12 | ENAH | ENAH | ENAH | 1569 | 0.3 | 0.65 | YES |
| 13 | MYO6 | MYO6 | MYO6 | 1895 | 0.27 | 0.67 | YES |
| 14 | HGF | HGF | HGF | 1998 | 0.26 | 0.7 | YES |
| 15 | CYFIP2 | CYFIP2 | CYFIP2 | 3423 | 0.17 | 0.64 | NO |
| 16 | LIMA1 | LIMA1 | LIMA1 | 4705 | 0.11 | 0.58 | NO |
| 17 | NCK1 | NCK1 | NCK1 | 5874 | 0.079 | 0.52 | NO |
| 18 | PVRL2 | PVRL2 | PVRL2 | 5898 | 0.078 | 0.53 | NO |
| 19 | VCL | VCL | VCL | 7723 | 0.044 | 0.43 | NO |
| 20 | KIFC3 | KIFC3 | KIFC3 | 9476 | 0.021 | 0.33 | NO |
| 21 | GIT1 | GIT1 | GIT1 | 9582 | 0.02 | 0.33 | NO |
| 22 | ABI1 | ABI1 | ABI1 | 10350 | 0.01 | 0.29 | NO |
| 23 | ROCK1 | ROCK1 | ROCK1 | 10445 | 0.0089 | 0.28 | NO |
| 24 | CTNND1 | CTNND1 | CTNND1 | 11596 | -0.0059 | 0.22 | NO |
| 25 | DIAPH1 | DIAPH1 | DIAPH1 | 11675 | -0.0072 | 0.21 | NO |
| 26 | EXOC4 | EXOC4 | EXOC4 | 12044 | -0.013 | 0.19 | NO |
| 27 | ACTN1 | ACTN1 | ACTN1 | 12073 | -0.013 | 0.19 | NO |
| 28 | CTNNB1 | CTNNB1 | CTNNB1 | 12367 | -0.018 | 0.18 | NO |
| 29 | EXOC3 | EXOC3 | EXOC3 | 12836 | -0.025 | 0.16 | NO |
| 30 | PIP5K1C | PIP5K1C | PIP5K1C | 13328 | -0.034 | 0.13 | NO |
| 31 | AQP3 | AQP3 | AQP3 | 13411 | -0.036 | 0.13 | NO |
| 32 | STX4 | STX4 | STX4 | 13984 | -0.048 | 0.1 | NO |
| 33 | RHOA | RHOA | RHOA | 14076 | -0.05 | 0.11 | NO |
| 34 | ARF6 | ARF6 | ARF6 | 14406 | -0.06 | 0.096 | NO |
| 35 | LPP | LPP | LPP | 14440 | -0.06 | 0.1 | NO |
| 36 | VASP | VASP | VASP | 14643 | -0.066 | 0.1 | NO |
| 37 | ZYX | ZYX | ZYX | 15455 | -0.097 | 0.066 | NO |
| 38 | CTNNA1 | CTNNA1 | CTNNA1 | 15811 | -0.12 | 0.062 | NO |
| 39 | PLEKHA7 | PLEKHA7 | PLEKHA7 | 16259 | -0.16 | 0.058 | NO |
Figure S7. Get High-res Image This plot shows mRNAseq_cNMF expression data heatmap (on the left) a RunningEnrichmentScore(RES) plot (on the top right) and a Signal2Noise(S2N) plot (on the bottom right) of genes in the pathway: KEGG RENAL CELL CARCINOMA.
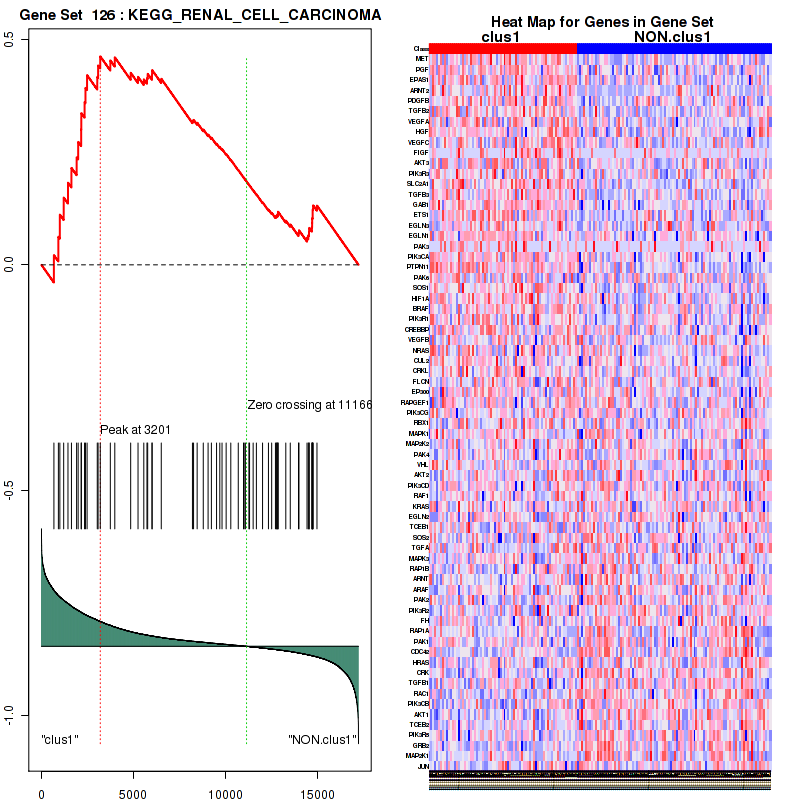
Figure S8. Get High-res Image For the top 5 core enriched genes in the pathway: KEGG RENAL CELL CARCINOMA, this volcano plot shows how much they are up/down-regulated and significant. The significance was calculated by empirical bayesian fit

Table S5. Get Full Table This table shows a Running Enrichment Score (RES) of each gene in this pathway, that is, the enrichment score at this point in the ranked list of genes. All genes are ranked by Signal-to-Noise (S2N), a measure of similarity as default and are used to obtain ES matrix of all genes. In this way, GSEA tool uses expression pattern of not only overlapped genes but also not-overlapped genes to produce ES matrix.
| Rank | GENE | SYMBOL | DESC | LIST.LOC | S2N | RES | CORE_ENRICHMENT |
|---|---|---|---|---|---|---|---|
| 1 | FLT4 | FLT4 | FLT4 | 114 | 0.58 | 0.16 | YES |
| 2 | KDR | KDR | KDR | 437 | 0.46 | 0.28 | YES |
| 3 | PTK2 | PTK2 | PTK2 | 483 | 0.45 | 0.41 | YES |
| 4 | FLT1 | FLT1 | FLT1 | 624 | 0.42 | 0.53 | YES |
| 5 | PLCG1 | PLCG1 | PLCG1 | 686 | 0.41 | 0.65 | YES |
| 6 | VEGFA | VEGFA | VEGFA | 1915 | 0.27 | 0.66 | YES |
| 7 | NOS3 | NOS3 | NOS3 | 3357 | 0.17 | 0.62 | NO |
| 8 | PIK3CA | PIK3CA | PIK3CA | 5255 | 0.095 | 0.54 | NO |
| 9 | HIF1A | HIF1A | HIF1A | 6016 | 0.076 | 0.52 | NO |
| 10 | PIK3R1 | PIK3R1 | PIK3R1 | 6522 | 0.065 | 0.51 | NO |
| 11 | PRKCB | PRKCB | PRKCB | 7241 | 0.052 | 0.48 | NO |
| 12 | EIF1AX | EIF1AX | EIF1AX | 8181 | 0.038 | 0.44 | NO |
| 13 | EIF2S1 | EIF2S1 | EIF2S1 | 8669 | 0.032 | 0.42 | NO |
| 14 | ELAVL1 | ELAVL1 | ELAVL1 | 9051 | 0.027 | 0.41 | NO |
| 15 | PXN | PXN | PXN | 9697 | 0.018 | 0.38 | NO |
| 16 | PIK3CG | PIK3CG | PIK3CG | 9829 | 0.017 | 0.37 | NO |
| 17 | EIF2B5 | EIF2B5 | EIF2B5 | 10791 | 0.0047 | 0.32 | NO |
| 18 | SHC1 | SHC1 | SHC1 | 10856 | 0.0039 | 0.32 | NO |
| 19 | EIF2B3 | EIF2B3 | EIF2B3 | 11005 | 0.0021 | 0.31 | NO |
| 20 | VHL | VHL | VHL | 11033 | 0.0017 | 0.31 | NO |
| 21 | EIF2S3 | EIF2S3 | EIF2S3 | 11203 | -0.00066 | 0.3 | NO |
| 22 | PRKCA | PRKCA | PRKCA | 11637 | -0.0066 | 0.27 | NO |
| 23 | EIF2S2 | EIF2S2 | EIF2S2 | 11692 | -0.0074 | 0.27 | NO |
| 24 | EIF2B4 | EIF2B4 | EIF2B4 | 11756 | -0.0082 | 0.27 | NO |
| 25 | EIF2B1 | EIF2B1 | EIF2B1 | 12294 | -0.016 | 0.25 | NO |
| 26 | EIF2B2 | EIF2B2 | EIF2B2 | 12737 | -0.023 | 0.23 | NO |
| 27 | ARNT | ARNT | ARNT | 12811 | -0.024 | 0.23 | NO |
| 28 | EIF1 | EIF1 | EIF1 | 13335 | -0.034 | 0.21 | NO |
| 29 | HRAS | HRAS | HRAS | 14457 | -0.061 | 0.16 | NO |
Figure S9. Get High-res Image This plot shows mRNAseq_cNMF expression data heatmap (on the left) a RunningEnrichmentScore(RES) plot (on the top right) and a Signal2Noise(S2N) plot (on the bottom right) of genes in the pathway: KEGG PANCREATIC CANCER.
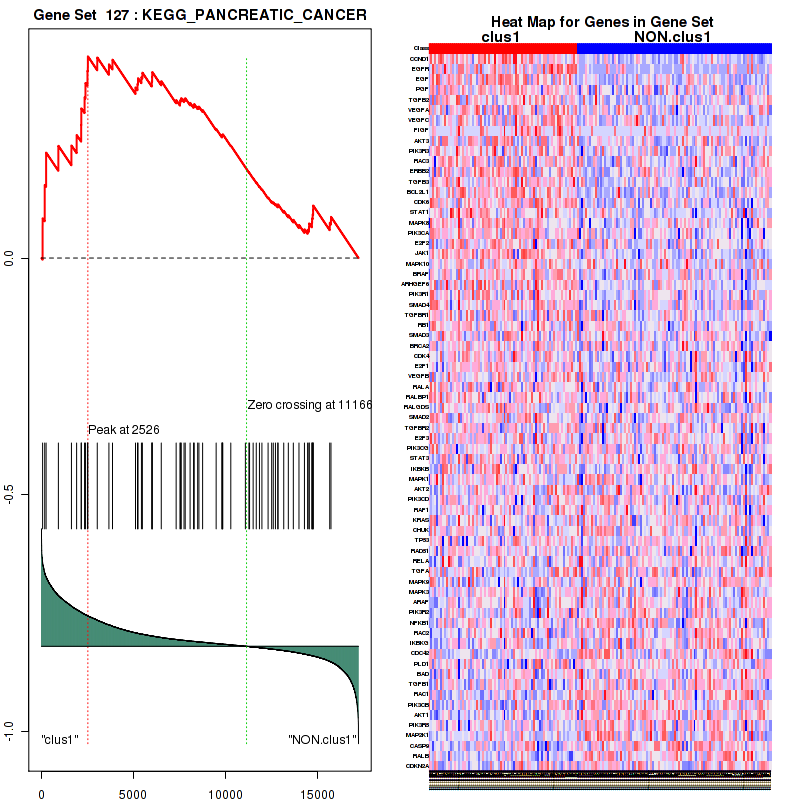
Figure S10. Get High-res Image For the top 5 core enriched genes in the pathway: KEGG PANCREATIC CANCER, this volcano plot shows how much they are up/down-regulated and significant. The significance was calculated by empirical bayesian fit

Table S6. Get Full Table This table shows a Running Enrichment Score (RES) of each gene in this pathway, that is, the enrichment score at this point in the ranked list of genes. All genes are ranked by Signal-to-Noise (S2N), a measure of similarity as default and are used to obtain ES matrix of all genes. In this way, GSEA tool uses expression pattern of not only overlapped genes but also not-overlapped genes to produce ES matrix.
| Rank | GENE | SYMBOL | DESC | LIST.LOC | S2N | RES | CORE_ENRICHMENT |
|---|---|---|---|---|---|---|---|
| 1 | CCND1 | CCND1 | CCND1 | 63 | 0.61 | 0.056 | YES |
| 2 | EGFR | EGFR | EGFR | 177 | 0.54 | 0.1 | YES |
| 3 | EGF | EGF | EGF | 253 | 0.51 | 0.15 | YES |
| 4 | IGF1 | IGF1 | IGF1 | 303 | 0.49 | 0.19 | YES |
| 5 | FGFR2 | FGFR2 | FGFR2 | 509 | 0.44 | 0.22 | YES |
| 6 | LEF1 | LEF1 | LEF1 | 642 | 0.42 | 0.26 | YES |
| 7 | PDGFRA | PDGFRA | PDGFRA | 718 | 0.4 | 0.29 | YES |
| 8 | FGFR1 | FGFR1 | FGFR1 | 776 | 0.4 | 0.32 | YES |
| 9 | IGF1R | IGF1R | IGF1R | 1338 | 0.32 | 0.32 | YES |
| 10 | PDGFB | PDGFB | PDGFB | 1444 | 0.31 | 0.35 | YES |
| 11 | PDGFRB | PDGFRB | PDGFRB | 1498 | 0.31 | 0.37 | YES |
| 12 | FOXO1 | FOXO1 | FOXO1 | 1581 | 0.3 | 0.4 | YES |
| 13 | TCF7 | TCF7 | TCF7 | 1589 | 0.3 | 0.43 | YES |
| 14 | CREB3L3 | CREB3L3 | CREB3L3 | 1888 | 0.27 | 0.44 | YES |
| 15 | AR | AR | AR | 2130 | 0.25 | 0.45 | YES |
| 16 | AKT3 | AKT3 | AKT3 | 2347 | 0.24 | 0.46 | YES |
| 17 | PIK3R3 | PIK3R3 | PIK3R3 | 2395 | 0.23 | 0.48 | YES |
| 18 | ERBB2 | ERBB2 | ERBB2 | 2526 | 0.22 | 0.49 | YES |
| 19 | PDGFC | PDGFC | PDGFC | 2757 | 0.21 | 0.5 | YES |
| 20 | PDGFA | PDGFA | PDGFA | 3008 | 0.19 | 0.5 | YES |
| 21 | CREB3L1 | CREB3L1 | CREB3L1 | 3380 | 0.17 | 0.5 | NO |
| 22 | BCL2 | BCL2 | BCL2 | 3993 | 0.14 | 0.47 | NO |
| 23 | CREB3L4 | CREB3L4 | CREB3L4 | 4227 | 0.13 | 0.47 | NO |
| 24 | PIK3CA | PIK3CA | PIK3CA | 5255 | 0.095 | 0.42 | NO |
| 25 | E2F2 | E2F2 | E2F2 | 5441 | 0.09 | 0.42 | NO |
| 26 | SRD5A2 | SRD5A2 | SRD5A2 | 5723 | 0.083 | 0.41 | NO |
| 27 | SOS1 | SOS1 | SOS1 | 5782 | 0.081 | 0.42 | NO |
| 28 | BRAF | BRAF | BRAF | 6025 | 0.075 | 0.41 | NO |
| 29 | TCF7L2 | TCF7L2 | TCF7L2 | 6035 | 0.075 | 0.42 | NO |
| 30 | CCNE2 | CCNE2 | CCNE2 | 6124 | 0.073 | 0.42 | NO |
| 31 | CCNE1 | CCNE1 | CCNE1 | 6133 | 0.073 | 0.42 | NO |
| 32 | PIK3R1 | PIK3R1 | PIK3R1 | 6522 | 0.065 | 0.41 | NO |
| 33 | RB1 | RB1 | RB1 | 7562 | 0.047 | 0.35 | NO |
| 34 | CREB1 | CREB1 | CREB1 | 7684 | 0.045 | 0.35 | NO |
| 35 | E2F1 | E2F1 | E2F1 | 8092 | 0.039 | 0.33 | NO |
| 36 | CREBBP | CREBBP | CREBBP | 8220 | 0.037 | 0.33 | NO |
| 37 | NRAS | NRAS | NRAS | 8475 | 0.034 | 0.32 | NO |
| 38 | CREB3L2 | CREB3L2 | CREB3L2 | 8600 | 0.032 | 0.31 | NO |
| 39 | PTEN | PTEN | PTEN | 8964 | 0.028 | 0.29 | NO |
| 40 | CDK2 | CDK2 | CDK2 | 9134 | 0.025 | 0.28 | NO |
| 41 | HSP90AB1 | HSP90AB1 | HSP90AB1 | 9180 | 0.025 | 0.28 | NO |
| 42 | MTOR | MTOR | MTOR | 9420 | 0.022 | 0.27 | NO |
| 43 | EP300 | EP300 | EP300 | 9530 | 0.02 | 0.27 | NO |
| 44 | E2F3 | E2F3 | E2F3 | 9827 | 0.017 | 0.25 | NO |
| 45 | PIK3CG | PIK3CG | PIK3CG | 9829 | 0.017 | 0.25 | NO |
| 46 | IKBKB | IKBKB | IKBKB | 9869 | 0.016 | 0.25 | NO |
| 47 | GSK3B | GSK3B | GSK3B | 10065 | 0.014 | 0.24 | NO |
| 48 | ATF4 | ATF4 | ATF4 | 10071 | 0.014 | 0.24 | NO |
| 49 | HSP90B1 | HSP90B1 | HSP90B1 | 10267 | 0.011 | 0.24 | NO |
| 50 | MAPK1 | MAPK1 | MAPK1 | 10305 | 0.011 | 0.23 | NO |
| 51 | INSRR | INSRR | INSRR | 10609 | 0.007 | 0.22 | NO |
| 52 | CDKN1B | CDKN1B | CDKN1B | 10668 | 0.0064 | 0.21 | NO |
| 53 | MAP2K2 | MAP2K2 | MAP2K2 | 10714 | 0.0058 | 0.21 | NO |
| 54 | HSP90AA1 | HSP90AA1 | HSP90AA1 | 10748 | 0.0052 | 0.21 | NO |
| 55 | AKT2 | AKT2 | AKT2 | 11099 | 0.0008 | 0.19 | NO |
| 56 | NKX3-1 | NKX3-1 | NKX3-1 | 11234 | -0.001 | 0.18 | NO |
| 57 | PIK3CD | PIK3CD | PIK3CD | 11292 | -0.0018 | 0.18 | NO |
| 58 | RAF1 | RAF1 | RAF1 | 11328 | -0.0022 | 0.18 | NO |
| 59 | PDPK1 | PDPK1 | PDPK1 | 11511 | -0.0048 | 0.17 | NO |
| 60 | KRAS | KRAS | KRAS | 11523 | -0.0049 | 0.17 | NO |
| 61 | CHUK | CHUK | CHUK | 11693 | -0.0075 | 0.16 | NO |
| 62 | TP53 | TP53 | TP53 | 11867 | -0.0098 | 0.15 | NO |
| 63 | RELA | RELA | RELA | 12337 | -0.017 | 0.12 | NO |
| 64 | SOS2 | SOS2 | SOS2 | 12356 | -0.017 | 0.12 | NO |
| 65 | CTNNB1 | CTNNB1 | CTNNB1 | 12367 | -0.018 | 0.12 | NO |
| 66 | TGFA | TGFA | TGFA | 12532 | -0.02 | 0.12 | NO |
| 67 | MAPK3 | MAPK3 | MAPK3 | 12736 | -0.023 | 0.11 | NO |
| 68 | ARAF | ARAF | ARAF | 12866 | -0.026 | 0.1 | NO |
| 69 | PIK3R2 | PIK3R2 | PIK3R2 | 12876 | -0.026 | 0.1 | NO |
| 70 | TCF7L1 | TCF7L1 | TCF7L1 | 13041 | -0.028 | 0.098 | NO |
| 71 | NFKB1 | NFKB1 | NFKB1 | 13189 | -0.031 | 0.092 | NO |
| 72 | CREB3 | CREB3 | CREB3 | 13260 | -0.033 | 0.091 | NO |
| 73 | GSTP1 | GSTP1 | GSTP1 | 13655 | -0.041 | 0.072 | NO |
| 74 | IKBKG | IKBKG | IKBKG | 13709 | -0.042 | 0.073 | NO |
| 75 | NFKBIA | NFKBIA | NFKBIA | 13967 | -0.048 | 0.063 | NO |
| 76 | HRAS | HRAS | HRAS | 14457 | -0.061 | 0.04 | NO |
| 77 | BAD | BAD | BAD | 14488 | -0.062 | 0.044 | NO |
| 78 | PIK3CB | PIK3CB | PIK3CB | 14720 | -0.069 | 0.038 | NO |
| 79 | AKT1 | AKT1 | AKT1 | 14735 | -0.07 | 0.044 | NO |
| 80 | PIK3R5 | PIK3R5 | PIK3R5 | 14762 | -0.07 | 0.049 | NO |
| 81 | GRB2 | GRB2 | GRB2 | 14763 | -0.07 | 0.056 | NO |
| 82 | MAP2K1 | MAP2K1 | MAP2K1 | 14788 | -0.071 | 0.061 | NO |
| 83 | CASP9 | CASP9 | CASP9 | 14790 | -0.072 | 0.068 | NO |
| 84 | MDM2 | MDM2 | MDM2 | 15207 | -0.086 | 0.052 | NO |
| 85 | PDGFD | PDGFD | PDGFD | 16598 | -0.2 | -0.0091 | NO |
| 86 | CREB5 | CREB5 | CREB5 | 16768 | -0.24 | 0.004 | NO |
| 87 | CDKN1A | CDKN1A | CDKN1A | 16840 | -0.25 | 0.024 | NO |
Figure S11. Get High-res Image This plot shows mRNAseq_cNMF expression data heatmap (on the left) a RunningEnrichmentScore(RES) plot (on the top right) and a Signal2Noise(S2N) plot (on the bottom right) of genes in the pathway: KEGG ENDOMETRIAL CANCER.
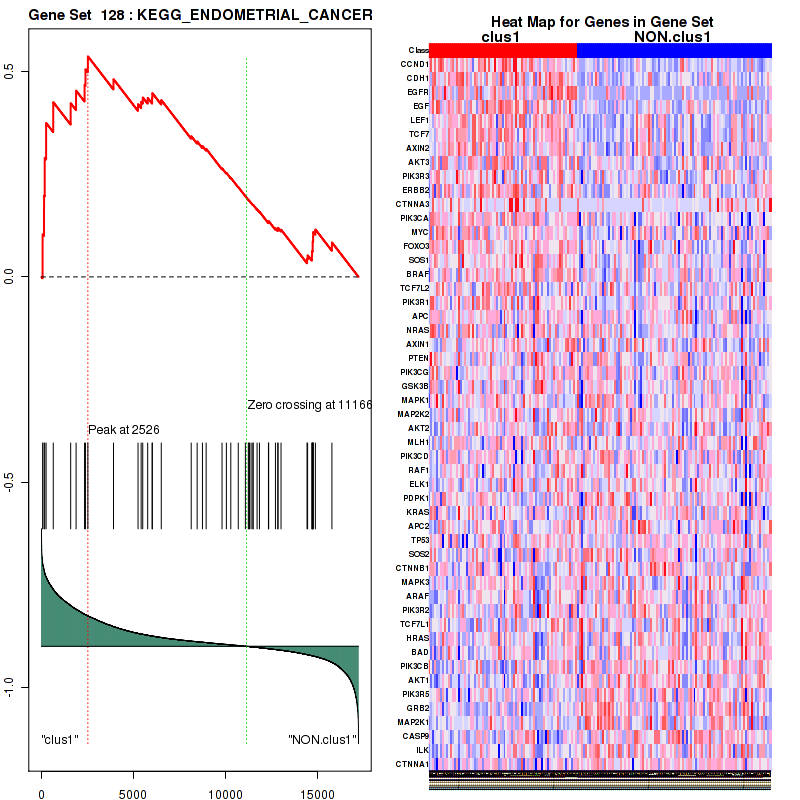
Figure S12. Get High-res Image For the top 5 core enriched genes in the pathway: KEGG ENDOMETRIAL CANCER, this volcano plot shows how much they are up/down-regulated and significant. The significance was calculated by empirical bayesian fit

Table S7. Get Full Table This table shows a Running Enrichment Score (RES) of each gene in this pathway, that is, the enrichment score at this point in the ranked list of genes. All genes are ranked by Signal-to-Noise (S2N), a measure of similarity as default and are used to obtain ES matrix of all genes. In this way, GSEA tool uses expression pattern of not only overlapped genes but also not-overlapped genes to produce ES matrix.
| Rank | GENE | SYMBOL | DESC | LIST.LOC | S2N | RES | CORE_ENRICHMENT |
|---|---|---|---|---|---|---|---|
| 1 | HEY2 | HEY2 | HEY2 | 99 | 0.58 | 0.14 | YES |
| 2 | MAMLD1 | MAMLD1 | MAMLD1 | 278 | 0.5 | 0.24 | YES |
| 3 | HES1 | HES1 | HES1 | 617 | 0.42 | 0.33 | YES |
| 4 | HES5 | HES5 | HES5 | 1048 | 0.36 | 0.39 | YES |
| 5 | TLE2 | TLE2 | TLE2 | 1503 | 0.31 | 0.44 | YES |
| 6 | MAML2 | MAML2 | MAML2 | 1689 | 0.29 | 0.5 | YES |
| 7 | HEY1 | HEY1 | HEY1 | 2862 | 0.2 | 0.48 | NO |
| 8 | CDK8 | CDK8 | CDK8 | 5176 | 0.098 | 0.36 | NO |
| 9 | MYC | MYC | MYC | 5427 | 0.09 | 0.37 | NO |
| 10 | HDAC7 | HDAC7 | HDAC7 | 5712 | 0.083 | 0.38 | NO |
| 11 | HIF1A | HIF1A | HIF1A | 6016 | 0.076 | 0.38 | NO |
| 12 | CUL1 | CUL1 | CUL1 | 6296 | 0.07 | 0.38 | NO |
| 13 | FBXW7 | FBXW7 | FBXW7 | 6399 | 0.067 | 0.39 | NO |
| 14 | TBL1XR1 | TBL1XR1 | TBL1XR1 | 6863 | 0.058 | 0.37 | NO |
| 15 | CCNC | CCNC | CCNC | 7382 | 0.049 | 0.36 | NO |
| 16 | HDAC2 | HDAC2 | HDAC2 | 7479 | 0.048 | 0.36 | NO |
| 17 | CREBBP | CREBBP | CREBBP | 8220 | 0.037 | 0.33 | NO |
| 18 | HDAC6 | HDAC6 | HDAC6 | 8295 | 0.036 | 0.33 | NO |
| 19 | HDAC1 | HDAC1 | HDAC1 | 8625 | 0.032 | 0.32 | NO |
| 20 | KAT2B | KAT2B | KAT2B | 9079 | 0.026 | 0.3 | NO |
| 21 | HDAC8 | HDAC8 | HDAC8 | 9460 | 0.021 | 0.28 | NO |
| 22 | EP300 | EP300 | EP300 | 9530 | 0.02 | 0.28 | NO |
| 23 | RPS27A | RPS27A | RPS27A | 9596 | 0.019 | 0.29 | NO |
| 24 | TLE3 | TLE3 | TLE3 | 10001 | 0.015 | 0.27 | NO |
| 25 | MAML3 | MAML3 | MAML3 | 10014 | 0.014 | 0.27 | NO |
| 26 | KAT2A | KAT2A | KAT2A | 10048 | 0.014 | 0.27 | NO |
| 27 | RBX1 | RBX1 | RBX1 | 10054 | 0.014 | 0.27 | NO |
| 28 | HEYL | HEYL | HEYL | 10070 | 0.014 | 0.28 | NO |
| 29 | HDAC9 | HDAC9 | HDAC9 | 10240 | 0.012 | 0.27 | NO |
| 30 | MAML1 | MAML1 | MAML1 | 10694 | 0.006 | 0.24 | NO |
| 31 | SNW1 | SNW1 | SNW1 | 11150 | 0.0002 | 0.22 | NO |
| 32 | NCOR1 | NCOR1 | NCOR1 | 11391 | -0.0031 | 0.2 | NO |
| 33 | HDAC5 | HDAC5 | HDAC5 | 11489 | -0.0044 | 0.2 | NO |
| 34 | NCOR2 | NCOR2 | NCOR2 | 11644 | -0.0067 | 0.19 | NO |
| 35 | UBA52 | UBA52 | UBA52 | 11762 | -0.0084 | 0.19 | NO |
| 36 | RBPJ | RBPJ | RBPJ | 12492 | -0.02 | 0.15 | NO |
| 37 | SKP1 | SKP1 | SKP1 | 13004 | -0.028 | 0.13 | NO |
| 38 | HDAC3 | HDAC3 | HDAC3 | 13428 | -0.036 | 0.11 | NO |
| 39 | TLE4 | TLE4 | TLE4 | 13532 | -0.038 | 0.11 | NO |
| 40 | HDAC10 | HDAC10 | HDAC10 | 14187 | -0.053 | 0.089 | NO |
| 41 | TBL1X | TBL1X | TBL1X | 14360 | -0.058 | 0.093 | NO |
| 42 | HDAC11 | HDAC11 | HDAC11 | 14921 | -0.075 | 0.078 | NO |
| 43 | HDAC4 | HDAC4 | HDAC4 | 15729 | -0.11 | 0.059 | NO |
| 44 | TLE1 | TLE1 | TLE1 | 15915 | -0.13 | 0.078 | NO |
Figure S13. Get High-res Image This plot shows mRNAseq_cNMF expression data heatmap (on the left) a RunningEnrichmentScore(RES) plot (on the top right) and a Signal2Noise(S2N) plot (on the bottom right) of genes in the pathway: KEGG PROSTATE CANCER.
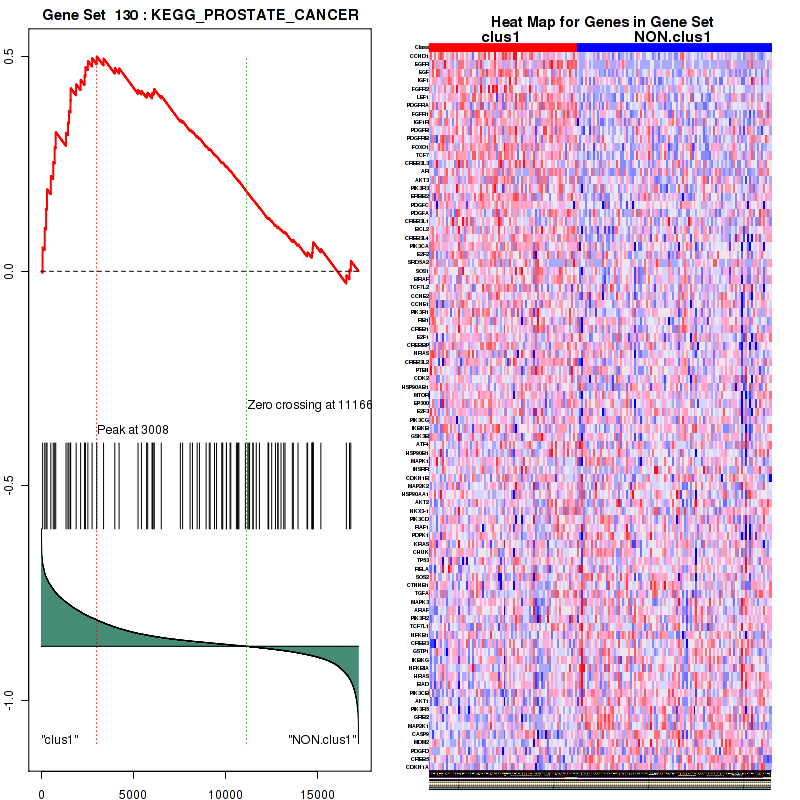
Figure S14. Get High-res Image For the top 5 core enriched genes in the pathway: KEGG PROSTATE CANCER, this volcano plot shows how much they are up/down-regulated and significant. The significance was calculated by empirical bayesian fit
Table S8. Get Full Table This table shows a Running Enrichment Score (RES) of each gene in this pathway, that is, the enrichment score at this point in the ranked list of genes. All genes are ranked by Signal-to-Noise (S2N), a measure of similarity as default and are used to obtain ES matrix of all genes. In this way, GSEA tool uses expression pattern of not only overlapped genes but also not-overlapped genes to produce ES matrix.
| Rank | GENE | SYMBOL | DESC | LIST.LOC | S2N | RES | CORE_ENRICHMENT |
|---|---|---|---|---|---|---|---|
| 1 | SORBS1 | SORBS1 | SORBS1 | 50 | 0.63 | 0.058 | YES |
| 2 | CDH1 | CDH1 | CDH1 | 140 | 0.56 | 0.11 | YES |
| 3 | EGFR | EGFR | EGFR | 177 | 0.54 | 0.16 | YES |
| 4 | SNAI2 | SNAI2 | SNAI2 | 409 | 0.46 | 0.19 | YES |
| 5 | TJP1 | TJP1 | TJP1 | 475 | 0.45 | 0.23 | YES |
| 6 | LEF1 | LEF1 | LEF1 | 642 | 0.42 | 0.26 | YES |
| 7 | MET | MET | MET | 676 | 0.41 | 0.3 | YES |
| 8 | FGFR1 | FGFR1 | FGFR1 | 776 | 0.4 | 0.33 | YES |
| 9 | WASF1 | WASF1 | WASF1 | 894 | 0.38 | 0.36 | YES |
| 10 | PTPRB | PTPRB | PTPRB | 941 | 0.37 | 0.39 | YES |
| 11 | WASF3 | WASF3 | WASF3 | 980 | 0.36 | 0.42 | YES |
| 12 | PVRL3 | PVRL3 | PVRL3 | 1224 | 0.34 | 0.44 | YES |
| 13 | PTPRM | PTPRM | PTPRM | 1299 | 0.33 | 0.47 | YES |
| 14 | IGF1R | IGF1R | IGF1R | 1338 | 0.32 | 0.5 | YES |
| 15 | PARD3 | PARD3 | PARD3 | 1378 | 0.32 | 0.53 | YES |
| 16 | MLLT4 | MLLT4 | MLLT4 | 1552 | 0.3 | 0.55 | YES |
| 17 | TCF7 | TCF7 | TCF7 | 1589 | 0.3 | 0.57 | YES |
| 18 | RAC3 | RAC3 | RAC3 | 2504 | 0.22 | 0.54 | NO |
| 19 | ERBB2 | ERBB2 | ERBB2 | 2526 | 0.22 | 0.56 | NO |
| 20 | LMO7 | LMO7 | LMO7 | 3470 | 0.17 | 0.52 | NO |
| 21 | SNAI1 | SNAI1 | SNAI1 | 3820 | 0.15 | 0.52 | NO |
| 22 | CTNNA3 | CTNNA3 | CTNNA3 | 3921 | 0.14 | 0.52 | NO |
| 23 | YES1 | YES1 | YES1 | 4089 | 0.14 | 0.53 | NO |
| 24 | PVRL2 | PVRL2 | PVRL2 | 5898 | 0.078 | 0.43 | NO |
| 25 | TCF7L2 | TCF7L2 | TCF7L2 | 6035 | 0.075 | 0.43 | NO |
| 26 | CSNK2A1 | CSNK2A1 | CSNK2A1 | 6943 | 0.056 | 0.38 | NO |
| 27 | CSNK2A2 | CSNK2A2 | CSNK2A2 | 7040 | 0.055 | 0.38 | NO |
| 28 | ACP1 | ACP1 | ACP1 | 7085 | 0.054 | 0.38 | NO |
| 29 | MAP3K7 | MAP3K7 | MAP3K7 | 7290 | 0.051 | 0.38 | NO |
| 30 | SMAD4 | SMAD4 | SMAD4 | 7333 | 0.05 | 0.38 | NO |
| 31 | TGFBR1 | TGFBR1 | TGFBR1 | 7542 | 0.047 | 0.37 | NO |
| 32 | SMAD3 | SMAD3 | SMAD3 | 7609 | 0.046 | 0.37 | NO |
| 33 | PVRL1 | PVRL1 | PVRL1 | 7704 | 0.045 | 0.37 | NO |
| 34 | VCL | VCL | VCL | 7723 | 0.044 | 0.38 | NO |
| 35 | CREBBP | CREBBP | CREBBP | 8220 | 0.037 | 0.35 | NO |
| 36 | SMAD2 | SMAD2 | SMAD2 | 8772 | 0.03 | 0.32 | NO |
| 37 | WASL | WASL | WASL | 8782 | 0.03 | 0.32 | NO |
| 38 | FYN | FYN | FYN | 8850 | 0.029 | 0.32 | NO |
| 39 | NLK | NLK | NLK | 8852 | 0.029 | 0.32 | NO |
| 40 | WASF2 | WASF2 | WASF2 | 9261 | 0.024 | 0.3 | NO |
| 41 | ACTN3 | ACTN3 | ACTN3 | 9390 | 0.022 | 0.3 | NO |
| 42 | FARP2 | FARP2 | FARP2 | 9413 | 0.022 | 0.3 | NO |
| 43 | TGFBR2 | TGFBR2 | TGFBR2 | 9510 | 0.02 | 0.3 | NO |
| 44 | PTPRF | PTPRF | PTPRF | 9520 | 0.02 | 0.3 | NO |
| 45 | EP300 | EP300 | EP300 | 9530 | 0.02 | 0.3 | NO |
| 46 | BAIAP2 | BAIAP2 | BAIAP2 | 9676 | 0.019 | 0.29 | NO |
| 47 | MAPK1 | MAPK1 | MAPK1 | 10305 | 0.011 | 0.26 | NO |
| 48 | ACTN2 | ACTN2 | ACTN2 | 11532 | -0.005 | 0.18 | NO |
| 49 | CTNND1 | CTNND1 | CTNND1 | 11596 | -0.0059 | 0.18 | NO |
| 50 | FER | FER | FER | 11748 | -0.0081 | 0.17 | NO |
| 51 | ACTN1 | ACTN1 | ACTN1 | 12073 | -0.013 | 0.16 | NO |
| 52 | CTNNB1 | CTNNB1 | CTNNB1 | 12367 | -0.018 | 0.14 | NO |
| 53 | PTPN1 | PTPN1 | PTPN1 | 12373 | -0.018 | 0.14 | NO |
| 54 | CSNK2B | CSNK2B | CSNK2B | 12513 | -0.02 | 0.14 | NO |
| 55 | MAPK3 | MAPK3 | MAPK3 | 12736 | -0.023 | 0.12 | NO |
| 56 | TCF7L1 | TCF7L1 | TCF7L1 | 13041 | -0.028 | 0.11 | NO |
| 57 | RAC2 | RAC2 | RAC2 | 13438 | -0.036 | 0.091 | NO |
| 58 | ACTB | ACTB | ACTB | 13587 | -0.039 | 0.086 | NO |
| 59 | ACTG1 | ACTG1 | ACTG1 | 13649 | -0.041 | 0.086 | NO |
| 60 | ACTN4 | ACTN4 | ACTN4 | 13712 | -0.042 | 0.087 | NO |
| 61 | CDC42 | CDC42 | CDC42 | 14018 | -0.049 | 0.074 | NO |
| 62 | INSR | INSR | INSR | 14031 | -0.049 | 0.078 | NO |
| 63 | RHOA | RHOA | RHOA | 14076 | -0.05 | 0.08 | NO |
| 64 | IQGAP1 | IQGAP1 | IQGAP1 | 14182 | -0.053 | 0.079 | NO |
| 65 | SSX2IP | SSX2IP | SSX2IP | 14210 | -0.054 | 0.082 | NO |
| 66 | RAC1 | RAC1 | RAC1 | 14572 | -0.064 | 0.068 | NO |
| 67 | SRC | SRC | SRC | 15443 | -0.096 | 0.026 | NO |
| 68 | WAS | WAS | WAS | 15453 | -0.097 | 0.035 | NO |
| 69 | PTPRJ | PTPRJ | PTPRJ | 15756 | -0.12 | 0.029 | NO |
| 70 | CTNNA1 | CTNNA1 | CTNNA1 | 15811 | -0.12 | 0.037 | NO |
| 71 | PTPN6 | PTPN6 | PTPN6 | 16139 | -0.14 | 0.032 | NO |
| 72 | PVRL4 | PVRL4 | PVRL4 | 17081 | -0.35 | 0.01 | NO |
Figure S15. Get High-res Image This plot shows mRNAseq_cNMF expression data heatmap (on the left) a RunningEnrichmentScore(RES) plot (on the top right) and a Signal2Noise(S2N) plot (on the bottom right) of genes in the pathway: KEGG THYROID CANCER.
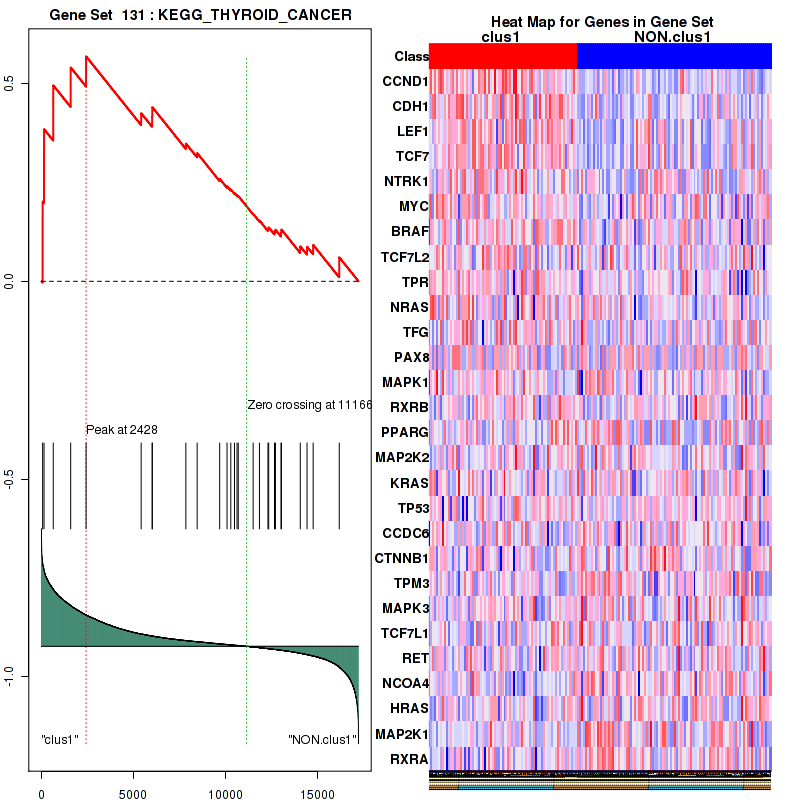
Figure S16. Get High-res Image For the top 5 core enriched genes in the pathway: KEGG THYROID CANCER, this volcano plot shows how much they are up/down-regulated and significant. The significance was calculated by empirical bayesian fit

Table S9. Get Full Table This table shows a Running Enrichment Score (RES) of each gene in this pathway, that is, the enrichment score at this point in the ranked list of genes. All genes are ranked by Signal-to-Noise (S2N), a measure of similarity as default and are used to obtain ES matrix of all genes. In this way, GSEA tool uses expression pattern of not only overlapped genes but also not-overlapped genes to produce ES matrix.
| Rank | GENE | SYMBOL | DESC | LIST.LOC | S2N | RES | CORE_ENRICHMENT |
|---|---|---|---|---|---|---|---|
| 1 | CCND1 | CCND1 | CCND1 | 63 | 0.61 | 0.12 | YES |
| 2 | EGFR | EGFR | EGFR | 177 | 0.54 | 0.22 | YES |
| 3 | EGF | EGF | EGF | 253 | 0.51 | 0.32 | YES |
| 4 | PLCG1 | PLCG1 | PLCG1 | 686 | 0.41 | 0.37 | YES |
| 5 | FHIT | FHIT | FHIT | 2256 | 0.24 | 0.33 | YES |
| 6 | AKT3 | AKT3 | AKT3 | 2347 | 0.24 | 0.37 | YES |
| 7 | PIK3R3 | PIK3R3 | PIK3R3 | 2395 | 0.23 | 0.42 | YES |
| 8 | ERBB2 | ERBB2 | ERBB2 | 2526 | 0.22 | 0.45 | YES |
| 9 | CDK6 | CDK6 | CDK6 | 3866 | 0.15 | 0.4 | NO |
| 10 | PIK3CA | PIK3CA | PIK3CA | 5255 | 0.095 | 0.34 | NO |
| 11 | E2F2 | E2F2 | E2F2 | 5441 | 0.09 | 0.35 | NO |
| 12 | FOXO3 | FOXO3 | FOXO3 | 5514 | 0.088 | 0.36 | NO |
| 13 | SOS1 | SOS1 | SOS1 | 5782 | 0.081 | 0.36 | NO |
| 14 | BRAF | BRAF | BRAF | 6025 | 0.075 | 0.36 | NO |
| 15 | PIK3R1 | PIK3R1 | PIK3R1 | 6522 | 0.065 | 0.35 | NO |
| 16 | PRKCB | PRKCB | PRKCB | 7241 | 0.052 | 0.32 | NO |
| 17 | RARB | RARB | RARB | 7281 | 0.051 | 0.32 | NO |
| 18 | RB1 | RB1 | RB1 | 7562 | 0.047 | 0.32 | NO |
| 19 | CDK4 | CDK4 | CDK4 | 7826 | 0.043 | 0.31 | NO |
| 20 | E2F1 | E2F1 | E2F1 | 8092 | 0.039 | 0.3 | NO |
| 21 | NRAS | NRAS | NRAS | 8475 | 0.034 | 0.29 | NO |
| 22 | PLCG2 | PLCG2 | PLCG2 | 8675 | 0.032 | 0.28 | NO |
| 23 | E2F3 | E2F3 | E2F3 | 9827 | 0.017 | 0.22 | NO |
| 24 | PIK3CG | PIK3CG | PIK3CG | 9829 | 0.017 | 0.22 | NO |
| 25 | MAPK1 | MAPK1 | MAPK1 | 10305 | 0.011 | 0.2 | NO |
| 26 | RXRB | RXRB | RXRB | 10507 | 0.0082 | 0.19 | NO |
| 27 | MAP2K2 | MAP2K2 | MAP2K2 | 10714 | 0.0058 | 0.18 | NO |
| 28 | RASSF1 | RASSF1 | RASSF1 | 11085 | 0.001 | 0.15 | NO |
| 29 | AKT2 | AKT2 | AKT2 | 11099 | 0.0008 | 0.15 | NO |
| 30 | PIK3CD | PIK3CD | PIK3CD | 11292 | -0.0018 | 0.14 | NO |
| 31 | RAF1 | RAF1 | RAF1 | 11328 | -0.0022 | 0.14 | NO |
| 32 | PDPK1 | PDPK1 | PDPK1 | 11511 | -0.0048 | 0.13 | NO |
| 33 | KRAS | KRAS | KRAS | 11523 | -0.0049 | 0.13 | NO |
| 34 | PRKCA | PRKCA | PRKCA | 11637 | -0.0066 | 0.13 | NO |
| 35 | TP53 | TP53 | TP53 | 11867 | -0.0098 | 0.12 | NO |
| 36 | PRKCG | PRKCG | PRKCG | 12322 | -0.017 | 0.092 | NO |
| 37 | STK4 | STK4 | STK4 | 12335 | -0.017 | 0.095 | NO |
| 38 | SOS2 | SOS2 | SOS2 | 12356 | -0.017 | 0.097 | NO |
| 39 | TGFA | TGFA | TGFA | 12532 | -0.02 | 0.091 | NO |
| 40 | MAPK3 | MAPK3 | MAPK3 | 12736 | -0.023 | 0.084 | NO |
| 41 | ARAF | ARAF | ARAF | 12866 | -0.026 | 0.082 | NO |
| 42 | PIK3R2 | PIK3R2 | PIK3R2 | 12876 | -0.026 | 0.086 | NO |
| 43 | RASSF5 | RASSF5 | RASSF5 | 13131 | -0.03 | 0.078 | NO |
| 44 | HRAS | HRAS | HRAS | 14457 | -0.061 | 0.013 | NO |
| 45 | BAD | BAD | BAD | 14488 | -0.062 | 0.023 | NO |
| 46 | PIK3CB | PIK3CB | PIK3CB | 14720 | -0.069 | 0.024 | NO |
| 47 | AKT1 | AKT1 | AKT1 | 14735 | -0.07 | 0.037 | NO |
| 48 | PIK3R5 | PIK3R5 | PIK3R5 | 14762 | -0.07 | 0.049 | NO |
| 49 | GRB2 | GRB2 | GRB2 | 14763 | -0.07 | 0.063 | NO |
| 50 | MAP2K1 | MAP2K1 | MAP2K1 | 14788 | -0.071 | 0.076 | NO |
| 51 | CASP9 | CASP9 | CASP9 | 14790 | -0.072 | 0.09 | NO |
| 52 | CDKN2A | CDKN2A | CDKN2A | 15760 | -0.12 | 0.057 | NO |
| 53 | RXRA | RXRA | RXRA | 16210 | -0.15 | 0.061 | NO |
Figure S17. Get High-res Image This plot shows mRNAseq_cNMF expression data heatmap (on the left) a RunningEnrichmentScore(RES) plot (on the top right) and a Signal2Noise(S2N) plot (on the bottom right) of genes in the pathway: KEGG MELANOMA.
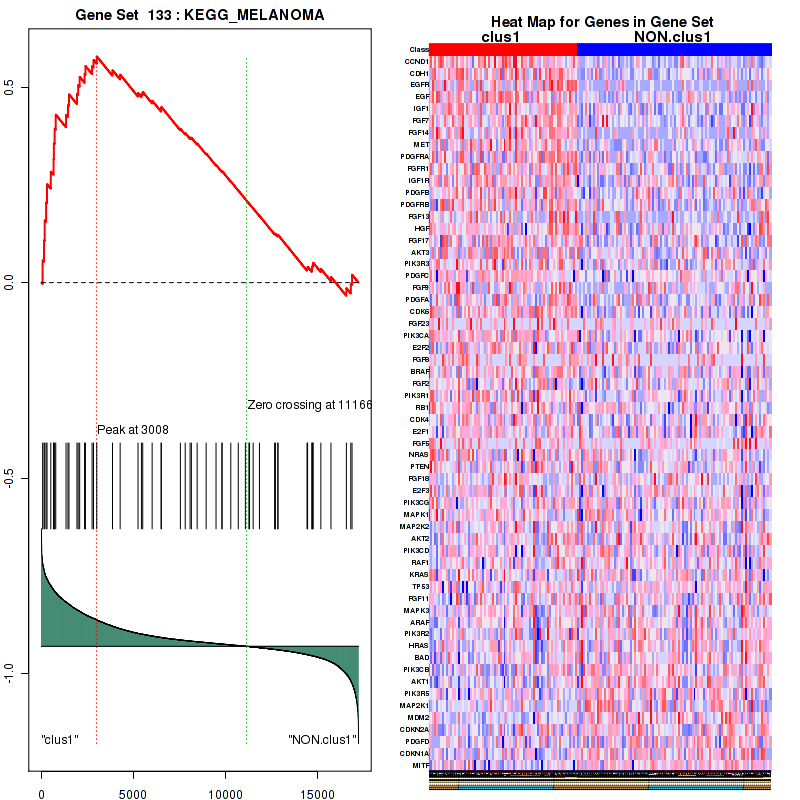
Figure S18. Get High-res Image For the top 5 core enriched genes in the pathway: KEGG MELANOMA, this volcano plot shows how much they are up/down-regulated and significant. The significance was calculated by empirical bayesian fit
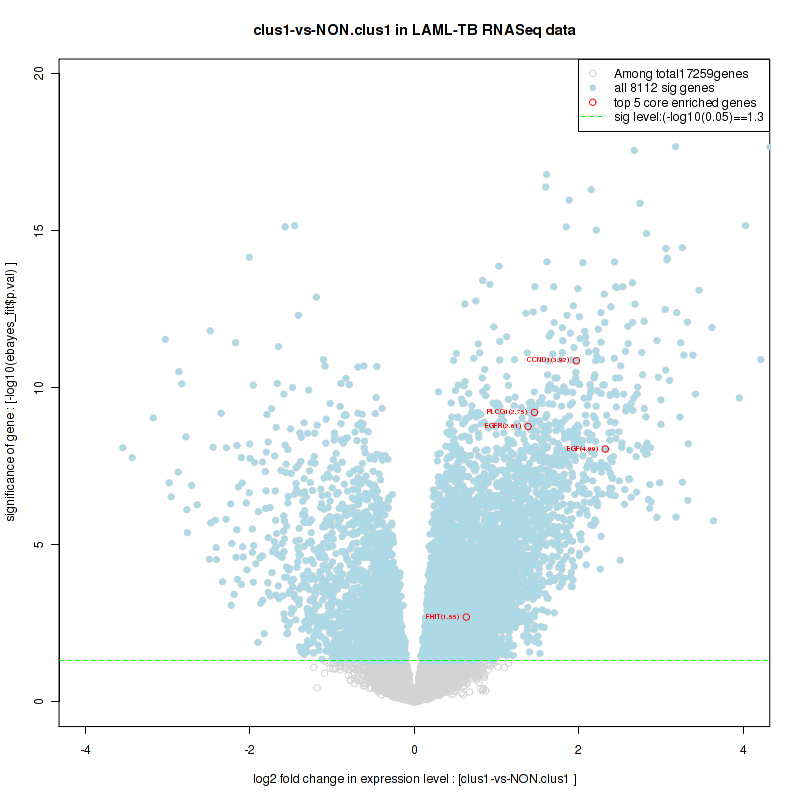
Table S10. Get Full Table This table shows a Running Enrichment Score (RES) of each gene in this pathway, that is, the enrichment score at this point in the ranked list of genes. All genes are ranked by Signal-to-Noise (S2N), a measure of similarity as default and are used to obtain ES matrix of all genes. In this way, GSEA tool uses expression pattern of not only overlapped genes but also not-overlapped genes to produce ES matrix.
| Rank | GENE | SYMBOL | DESC | LIST.LOC | S2N | RES | CORE_ENRICHMENT |
|---|---|---|---|---|---|---|---|
| 1 | CCND1 | CCND1 | CCND1 | 63 | 0.61 | 0.084 | YES |
| 2 | EGFR | EGFR | EGFR | 177 | 0.54 | 0.16 | YES |
| 3 | EGF | EGF | EGF | 253 | 0.51 | 0.22 | YES |
| 4 | PGF | PGF | PGF | 920 | 0.37 | 0.24 | YES |
| 5 | TGFB2 | TGFB2 | TGFB2 | 1632 | 0.3 | 0.24 | YES |
| 6 | VEGFA | VEGFA | VEGFA | 1915 | 0.27 | 0.26 | YES |
| 7 | VEGFC | VEGFC | VEGFC | 2162 | 0.25 | 0.28 | YES |
| 8 | FIGF | FIGF | FIGF | 2170 | 0.25 | 0.32 | YES |
| 9 | AKT3 | AKT3 | AKT3 | 2347 | 0.24 | 0.34 | YES |
| 10 | PIK3R3 | PIK3R3 | PIK3R3 | 2395 | 0.23 | 0.37 | YES |
| 11 | RAC3 | RAC3 | RAC3 | 2504 | 0.22 | 0.4 | YES |
| 12 | ERBB2 | ERBB2 | ERBB2 | 2526 | 0.22 | 0.43 | YES |
| 13 | TGFB3 | TGFB3 | TGFB3 | 3038 | 0.19 | 0.42 | NO |
| 14 | BCL2L1 | BCL2L1 | BCL2L1 | 3673 | 0.16 | 0.41 | NO |
| 15 | CDK6 | CDK6 | CDK6 | 3866 | 0.15 | 0.42 | NO |
| 16 | STAT1 | STAT1 | STAT1 | 5119 | 0.099 | 0.36 | NO |
| 17 | MAPK8 | MAPK8 | MAPK8 | 5228 | 0.096 | 0.37 | NO |
| 18 | PIK3CA | PIK3CA | PIK3CA | 5255 | 0.095 | 0.38 | NO |
| 19 | E2F2 | E2F2 | E2F2 | 5441 | 0.09 | 0.38 | NO |
| 20 | JAK1 | JAK1 | JAK1 | 5494 | 0.089 | 0.39 | NO |
| 21 | MAPK10 | MAPK10 | MAPK10 | 6004 | 0.076 | 0.37 | NO |
| 22 | BRAF | BRAF | BRAF | 6025 | 0.075 | 0.38 | NO |
| 23 | ARHGEF6 | ARHGEF6 | ARHGEF6 | 6032 | 0.075 | 0.39 | NO |
| 24 | PIK3R1 | PIK3R1 | PIK3R1 | 6522 | 0.065 | 0.37 | NO |
| 25 | SMAD4 | SMAD4 | SMAD4 | 7333 | 0.05 | 0.33 | NO |
| 26 | TGFBR1 | TGFBR1 | TGFBR1 | 7542 | 0.047 | 0.33 | NO |
| 27 | RB1 | RB1 | RB1 | 7562 | 0.047 | 0.33 | NO |
| 28 | SMAD3 | SMAD3 | SMAD3 | 7609 | 0.046 | 0.34 | NO |
| 29 | BRCA2 | BRCA2 | BRCA2 | 7761 | 0.044 | 0.34 | NO |
| 30 | CDK4 | CDK4 | CDK4 | 7826 | 0.043 | 0.34 | NO |
| 31 | E2F1 | E2F1 | E2F1 | 8092 | 0.039 | 0.33 | NO |
| 32 | VEGFB | VEGFB | VEGFB | 8280 | 0.036 | 0.32 | NO |
| 33 | RALA | RALA | RALA | 8314 | 0.036 | 0.33 | NO |
| 34 | RALBP1 | RALBP1 | RALBP1 | 8502 | 0.034 | 0.32 | NO |
| 35 | RALGDS | RALGDS | RALGDS | 8570 | 0.033 | 0.32 | NO |
| 36 | SMAD2 | SMAD2 | SMAD2 | 8772 | 0.03 | 0.31 | NO |
| 37 | TGFBR2 | TGFBR2 | TGFBR2 | 9510 | 0.02 | 0.27 | NO |
| 38 | E2F3 | E2F3 | E2F3 | 9827 | 0.017 | 0.26 | NO |
| 39 | PIK3CG | PIK3CG | PIK3CG | 9829 | 0.017 | 0.26 | NO |
| 40 | STAT3 | STAT3 | STAT3 | 9858 | 0.016 | 0.26 | NO |
| 41 | IKBKB | IKBKB | IKBKB | 9869 | 0.016 | 0.26 | NO |
| 42 | MAPK1 | MAPK1 | MAPK1 | 10305 | 0.011 | 0.24 | NO |
| 43 | AKT2 | AKT2 | AKT2 | 11099 | 0.0008 | 0.19 | NO |
| 44 | PIK3CD | PIK3CD | PIK3CD | 11292 | -0.0018 | 0.18 | NO |
| 45 | RAF1 | RAF1 | RAF1 | 11328 | -0.0022 | 0.18 | NO |
| 46 | KRAS | KRAS | KRAS | 11523 | -0.0049 | 0.17 | NO |
| 47 | CHUK | CHUK | CHUK | 11693 | -0.0075 | 0.16 | NO |
| 48 | TP53 | TP53 | TP53 | 11867 | -0.0098 | 0.15 | NO |
| 49 | RAD51 | RAD51 | RAD51 | 12001 | -0.012 | 0.14 | NO |
| 50 | RELA | RELA | RELA | 12337 | -0.017 | 0.13 | NO |
| 51 | TGFA | TGFA | TGFA | 12532 | -0.02 | 0.12 | NO |
| 52 | MAPK9 | MAPK9 | MAPK9 | 12618 | -0.022 | 0.12 | NO |
| 53 | MAPK3 | MAPK3 | MAPK3 | 12736 | -0.023 | 0.11 | NO |
| 54 | ARAF | ARAF | ARAF | 12866 | -0.026 | 0.11 | NO |
| 55 | PIK3R2 | PIK3R2 | PIK3R2 | 12876 | -0.026 | 0.11 | NO |
| 56 | NFKB1 | NFKB1 | NFKB1 | 13189 | -0.031 | 0.1 | NO |
| 57 | RAC2 | RAC2 | RAC2 | 13438 | -0.036 | 0.091 | NO |
| 58 | IKBKG | IKBKG | IKBKG | 13709 | -0.042 | 0.081 | NO |
| 59 | CDC42 | CDC42 | CDC42 | 14018 | -0.049 | 0.07 | NO |
| 60 | PLD1 | PLD1 | PLD1 | 14316 | -0.057 | 0.061 | NO |
| 61 | BAD | BAD | BAD | 14488 | -0.062 | 0.06 | NO |
| 62 | TGFB1 | TGFB1 | TGFB1 | 14565 | -0.064 | 0.065 | NO |
| 63 | RAC1 | RAC1 | RAC1 | 14572 | -0.064 | 0.073 | NO |
| 64 | PIK3CB | PIK3CB | PIK3CB | 14720 | -0.069 | 0.075 | NO |
| 65 | AKT1 | AKT1 | AKT1 | 14735 | -0.07 | 0.084 | NO |
| 66 | PIK3R5 | PIK3R5 | PIK3R5 | 14762 | -0.07 | 0.092 | NO |
| 67 | MAP2K1 | MAP2K1 | MAP2K1 | 14788 | -0.071 | 0.1 | NO |
| 68 | CASP9 | CASP9 | CASP9 | 14790 | -0.072 | 0.11 | NO |
| 69 | RALB | RALB | RALB | 15693 | -0.11 | 0.075 | NO |
| 70 | CDKN2A | CDKN2A | CDKN2A | 15760 | -0.12 | 0.087 | NO |
Figure S19. Get High-res Image This plot shows mRNAseq_cNMF expression data heatmap (on the left) a RunningEnrichmentScore(RES) plot (on the top right) and a Signal2Noise(S2N) plot (on the bottom right) of genes in the pathway: KEGG NON SMALL CELL LUNG CANCER.
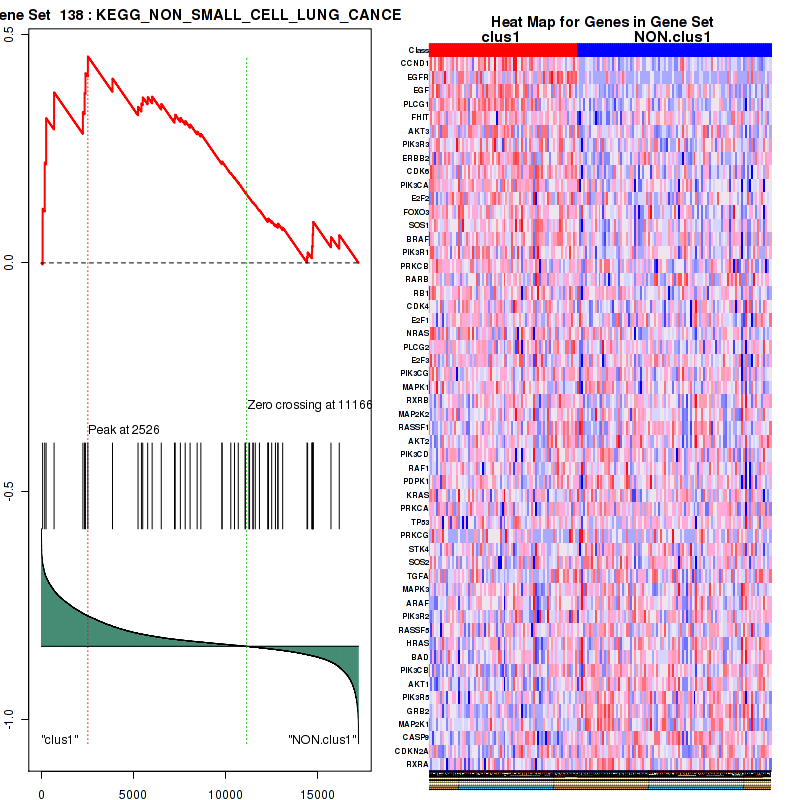
Figure S20. Get High-res Image For the top 5 core enriched genes in the pathway: KEGG NON SMALL CELL LUNG CANCER, this volcano plot shows how much they are up/down-regulated and significant. The significance was calculated by empirical bayesian fit

For the top enriched genes, if you want to check whether they are
-
up-regulated, please check the list of up-regulated genes
-
down-regulated, please check the list of down-regulated genes
For the top enriched genes, if you want to check whether they are
-
highly expressed genes, please check the list of high (top 30%) expressed genes
-
low expressed genes, please check the list of low (bottom 30%) expressed genes
An expression pattern of top(30%)/middle(30%)/low(30%) in this subtype against other subtypes is available in a heatmap
For the top enriched genes, if you want to check whether they are
-
significantly differently expressed genes by eBayes lm fit, please check the list of significant genes
Table 4. Get Full Table This table shows top 10 pathways which are significantly enriched in cluster clus2. It displays only significant gene sets satisfying nom.p.val.threshold (-1), fwer.p.val.threshold (-1) , fdr.q.val.threshold (0.25) and the default table is sorted by Normalized Enrichment Score (NES). Further details on NES statistics, please visit The Broad GSEA website.
| GeneSet(GS) | Size(#genes) | genes.ES.table | ES | NES | NOM.p.val | FDR.q.val | FWER.p.val | Tag.. | Gene.. | Signal | FDR..median. | glob.p.val |
|---|---|---|---|---|---|---|---|---|---|---|---|---|
| KEGG LYSOSOME | 118 | genes.ES.table | 0.55 | 1.8 | 0.002 | 0.39 | 0.46 | 0.45 | 0.14 | 0.39 | 0 | 0.093 |
| KEGG FC GAMMA R MEDIATED PHAGOCYTOSIS | 92 | genes.ES.table | 0.54 | 1.8 | 0 | 0.32 | 0.59 | 0.42 | 0.16 | 0.36 | 0.1 | 0.079 |
| BIOCARTA HIVNEF PATHWAY | 58 | genes.ES.table | 0.42 | 1.8 | 0.0099 | 0.37 | 0.5 | 0.41 | 0.19 | 0.34 | 0 | 0.091 |
| BIOCARTA PYK2 PATHWAY | 28 | genes.ES.table | 0.54 | 1.7 | 0.016 | 0.32 | 0.63 | 0.64 | 0.23 | 0.5 | 0.12 | 0.086 |
| BIOCARTA TOLL PATHWAY | 37 | genes.ES.table | 0.62 | 1.8 | 0.0096 | 0.38 | 0.53 | 0.49 | 0.18 | 0.4 | 0.097 | 0.097 |
| ST TUMOR NECROSIS FACTOR PATHWAY | 28 | genes.ES.table | 0.54 | 1.7 | 0.029 | 0.32 | 0.7 | 0.5 | 0.22 | 0.39 | 0.12 | 0.084 |
| PID IL1PATHWAY | 34 | genes.ES.table | 0.57 | 1.8 | 0.0098 | 0.35 | 0.57 | 0.38 | 0.17 | 0.32 | 0.098 | 0.087 |
| PID IFNGPATHWAY | 40 | genes.ES.table | 0.53 | 1.7 | 0.02 | 0.32 | 0.66 | 0.55 | 0.25 | 0.41 | 0.12 | 0.086 |
| PID IL8CXCR2 PATHWAY | 34 | genes.ES.table | 0.6 | 1.7 | 0.01 | 0.31 | 0.67 | 0.59 | 0.2 | 0.47 | 0.12 | 0.08 |
| PID MAPKTRKPATHWAY | 32 | genes.ES.table | 0.6 | 2 | 0 | 0.39 | 0.1 | 0.59 | 0.23 | 0.46 | 0 | 0.075 |
Table S11. Get Full Table This table shows a Running Enrichment Score (RES) of each gene in this pathway, that is, the enrichment score at this point in the ranked list of genes. All genes are ranked by Signal-to-Noise (S2N), a measure of similarity as default and are used to obtain ES matrix of all genes. In this way, GSEA tool uses expression pattern of not only overlapped genes but also not-overlapped genes to produce ES matrix.
| Rank | GENE | SYMBOL | DESC | LIST.LOC | S2N | RES | CORE_ENRICHMENT |
|---|---|---|---|---|---|---|---|
| 1 | EHD4 | EHD4 | EHD4 | 492 | 0.4 | 0.098 | YES |
| 2 | PRKCD | PRKCD | PRKCD | 906 | 0.27 | 0.16 | YES |
| 3 | MAPK7 | MAPK7 | MAPK7 | 925 | 0.26 | 0.24 | YES |
| 4 | MAP2K6 | MAP2K6 | MAP2K6 | 1062 | 0.24 | 0.31 | YES |
| 5 | MAP2K1 | MAP2K1 | MAP2K1 | 1187 | 0.22 | 0.37 | YES |
| 6 | FOS | FOS | FOS | 1620 | 0.16 | 0.4 | YES |
| 7 | CDK5 | CDK5 | CDK5 | 1630 | 0.16 | 0.45 | YES |
| 8 | MEF2C | MEF2C | MEF2C | 1850 | 0.14 | 0.48 | YES |
| 9 | RAP1A | RAP1A | RAP1A | 1908 | 0.14 | 0.52 | YES |
| 10 | MAP2K3 | MAP2K3 | MAP2K3 | 2376 | 0.1 | 0.53 | YES |
| 11 | EGR1 | EGR1 | EGR1 | 2873 | 0.079 | 0.52 | YES |
| 12 | MAPK3 | MAPK3 | MAPK3 | 2933 | 0.076 | 0.54 | YES |
| 13 | RPS6KA1 | RPS6KA1 | RPS6KA1 | 3013 | 0.072 | 0.56 | YES |
| 14 | RIT1 | RIT1 | RIT1 | 3192 | 0.066 | 0.57 | YES |
| 15 | MAPKAPK2 | MAPKAPK2 | MAPKAPK2 | 3527 | 0.054 | 0.57 | YES |
| 16 | MAP3K2 | MAP3K2 | MAP3K2 | 3598 | 0.051 | 0.58 | YES |
| 17 | MAPK14 | MAPK14 | MAPK14 | 3883 | 0.043 | 0.58 | YES |
| 18 | RAP1B | RAP1B | RAP1B | 3933 | 0.042 | 0.59 | YES |
| 19 | MAPK1 | MAPK1 | MAPK1 | 3962 | 0.041 | 0.6 | YES |
| 20 | RUSC1 | RUSC1 | RUSC1 | 4236 | 0.034 | 0.6 | NO |
| 21 | RAF1 | RAF1 | RAF1 | 4606 | 0.025 | 0.58 | NO |
| 22 | RPS6KA5 | RPS6KA5 | RPS6KA5 | 5244 | 0.012 | 0.55 | NO |
| 23 | KRAS | KRAS | KRAS | 5734 | 0.0021 | 0.52 | NO |
| 24 | SRF | SRF | SRF | 5822 | 0.00036 | 0.52 | NO |
| 25 | NRAS | NRAS | NRAS | 6219 | -0.0071 | 0.5 | NO |
| 26 | CDK5R1 | CDK5R1 | CDK5R1 | 7384 | -0.028 | 0.44 | NO |
| 27 | CREB1 | CREB1 | CREB1 | 7723 | -0.033 | 0.43 | NO |
| 28 | HRAS | HRAS | HRAS | 7785 | -0.034 | 0.44 | NO |
| 29 | ELK1 | ELK1 | ELK1 | 7912 | -0.036 | 0.44 | NO |
| 30 | MAP2K5 | MAP2K5 | MAP2K5 | 8859 | -0.052 | 0.4 | NO |
| 31 | BRAF | BRAF | BRAF | 10291 | -0.079 | 0.34 | NO |
| 32 | TRPV1 | TRPV1 | TRPV1 | 13783 | -0.19 | 0.2 | NO |
Figure S21. Get High-res Image This plot shows mRNAseq_cNMF expression data heatmap (on the left) a RunningEnrichmentScore(RES) plot (on the top right) and a Signal2Noise(S2N) plot (on the bottom right) of genes in the pathway: KEGG LYSOSOME.
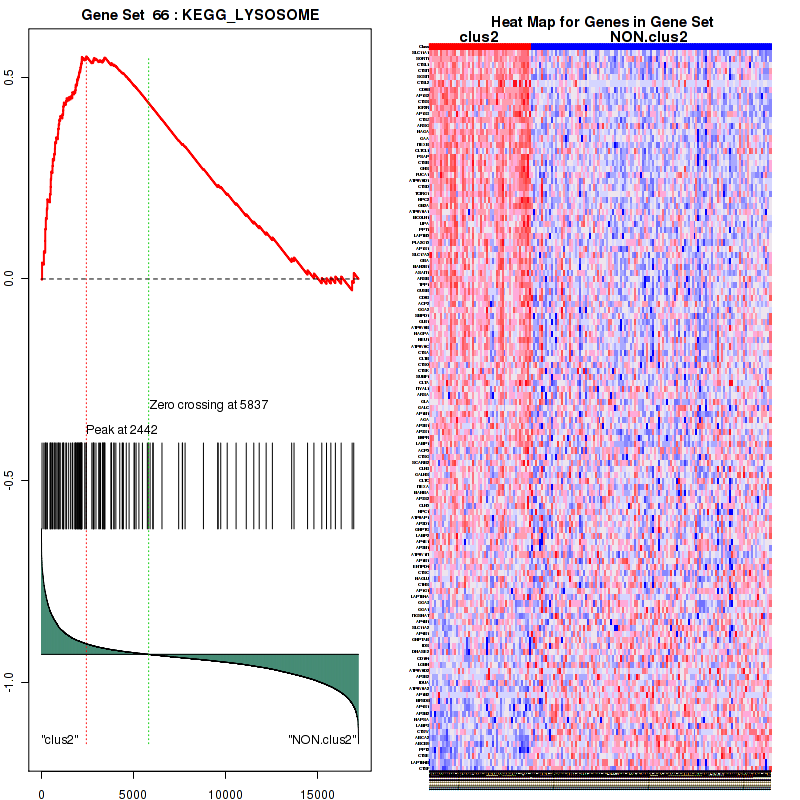
Figure S22. Get High-res Image For the top 5 core enriched genes in the pathway: KEGG LYSOSOME, this volcano plot shows how much they are up/down-regulated and significant. The significance was calculated by empirical bayesian fit
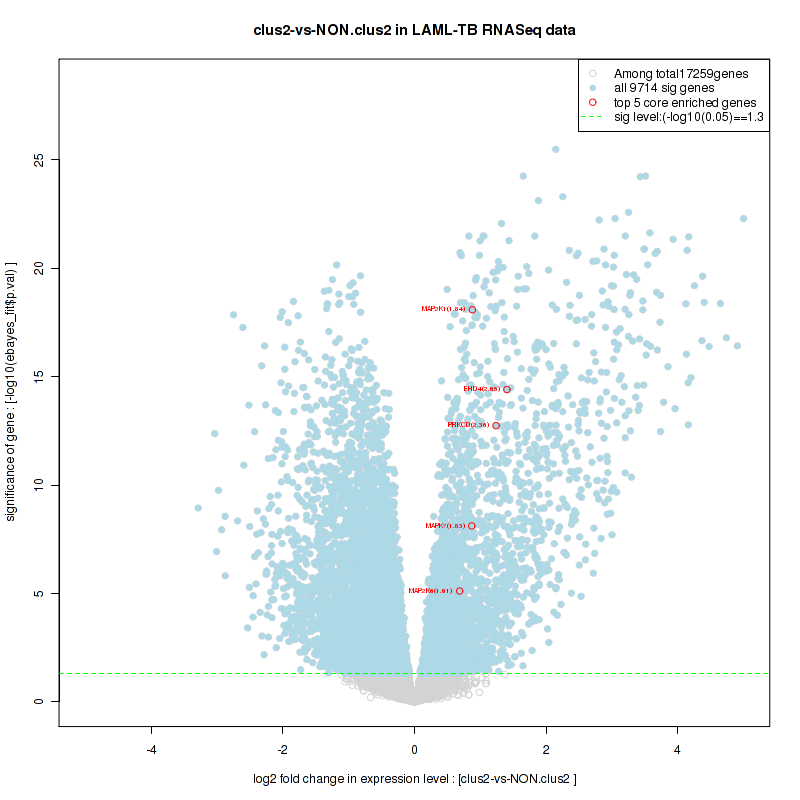
Table S12. Get Full Table This table shows a Running Enrichment Score (RES) of each gene in this pathway, that is, the enrichment score at this point in the ranked list of genes. All genes are ranked by Signal-to-Noise (S2N), a measure of similarity as default and are used to obtain ES matrix of all genes. In this way, GSEA tool uses expression pattern of not only overlapped genes but also not-overlapped genes to produce ES matrix.
| Rank | GENE | SYMBOL | DESC | LIST.LOC | S2N | RES | CORE_ENRICHMENT |
|---|---|---|---|---|---|---|---|
| 1 | TLR8 | TLR8 | TLR8 | 15 | 0.92 | 0.048 | YES |
| 2 | TLR5 | TLR5 | TLR5 | 16 | 0.92 | 0.097 | YES |
| 3 | CD14 | CD14 | CD14 | 36 | 0.84 | 0.14 | YES |
| 4 | S100A12 | S100A12 | S100A12 | 55 | 0.8 | 0.18 | YES |
| 5 | TLR7 | TLR7 | TLR7 | 60 | 0.79 | 0.22 | YES |
| 6 | LY86 | LY86 | LY86 | 112 | 0.7 | 0.26 | YES |
| 7 | TICAM2 | TICAM2 | TICAM2 | 118 | 0.69 | 0.29 | YES |
| 8 | LY96 | LY96 | LY96 | 135 | 0.67 | 0.33 | YES |
| 9 | NOD2 | NOD2 | NOD2 | 166 | 0.63 | 0.36 | YES |
| 10 | CTSL1 | CTSL1 | CTSL1 | 205 | 0.59 | 0.39 | YES |
| 11 | TLR4 | TLR4 | TLR4 | 270 | 0.54 | 0.41 | YES |
| 12 | CD180 | CD180 | CD180 | 286 | 0.52 | 0.44 | YES |
| 13 | CTSS | CTSS | CTSS | 499 | 0.4 | 0.45 | YES |
| 14 | PELI3 | PELI3 | PELI3 | 518 | 0.39 | 0.47 | YES |
| 15 | TLR6 | TLR6 | TLR6 | 584 | 0.37 | 0.48 | YES |
| 16 | TLR2 | TLR2 | TLR2 | 656 | 0.34 | 0.5 | YES |
| 17 | TLR1 | TLR1 | TLR1 | 700 | 0.33 | 0.51 | YES |
| 18 | DUSP6 | DUSP6 | DUSP6 | 702 | 0.33 | 0.53 | YES |
| 19 | UNC93B1 | UNC93B1 | UNC93B1 | 807 | 0.3 | 0.54 | YES |
| 20 | CTSB | CTSB | CTSB | 911 | 0.27 | 0.55 | YES |
| 21 | MAPK7 | MAPK7 | MAPK7 | 925 | 0.26 | 0.56 | YES |
| 22 | PELI1 | PELI1 | PELI1 | 1031 | 0.24 | 0.57 | YES |
| 23 | MAP2K6 | MAP2K6 | MAP2K6 | 1062 | 0.24 | 0.58 | YES |
| 24 | MAP2K1 | MAP2K1 | MAP2K1 | 1187 | 0.22 | 0.58 | YES |
| 25 | MYD88 | MYD88 | MYD88 | 1291 | 0.2 | 0.59 | YES |
| 26 | FOS | FOS | FOS | 1620 | 0.16 | 0.58 | YES |
| 27 | NFKB2 | NFKB2 | NFKB2 | 1695 | 0.15 | 0.58 | YES |
| 28 | MEF2C | MEF2C | MEF2C | 1850 | 0.14 | 0.58 | YES |
| 29 | TIRAP | TIRAP | TIRAP | 1963 | 0.13 | 0.58 | YES |
| 30 | TICAM1 | TICAM1 | TICAM1 | 1992 | 0.13 | 0.58 | YES |
| 31 | IRAK3 | IRAK3 | IRAK3 | 2010 | 0.13 | 0.59 | YES |
| 32 | EEA1 | EEA1 | EEA1 | 2117 | 0.12 | 0.59 | YES |
| 33 | MAP2K3 | MAP2K3 | MAP2K3 | 2376 | 0.1 | 0.58 | NO |
| 34 | CTSK | CTSK | CTSK | 2442 | 0.1 | 0.58 | NO |
| 35 | DUSP7 | DUSP7 | DUSP7 | 2585 | 0.093 | 0.58 | NO |
| 36 | NFKBIA | NFKBIA | NFKBIA | 2653 | 0.09 | 0.58 | NO |
| 37 | CNPY3 | CNPY3 | CNPY3 | 2691 | 0.088 | 0.58 | NO |
| 38 | CHUK | CHUK | CHUK | 2910 | 0.078 | 0.57 | NO |
| 39 | TLR10 | TLR10 | TLR10 | 2919 | 0.077 | 0.58 | NO |
| 40 | MAPK3 | MAPK3 | MAPK3 | 2933 | 0.076 | 0.58 | NO |
| 41 | IKBKG | IKBKG | IKBKG | 2970 | 0.074 | 0.58 | NO |
| 42 | RPS6KA1 | RPS6KA1 | RPS6KA1 | 3013 | 0.072 | 0.58 | NO |
| 43 | TBK1 | TBK1 | TBK1 | 3306 | 0.062 | 0.57 | NO |
| 44 | IRAK4 | IRAK4 | IRAK4 | 3430 | 0.058 | 0.57 | NO |
| 45 | TMEM189-UBE2V1 | TMEM189-UBE2V1 | TMEM189-UBE2V1 | 3481 | 0.056 | 0.57 | NO |
| 46 | MAPKAPK2 | MAPKAPK2 | MAPKAPK2 | 3527 | 0.054 | 0.57 | NO |
| 47 | PPP2CA | PPP2CA | PPP2CA | 3533 | 0.054 | 0.57 | NO |
| 48 | MAP3K1 | MAP3K1 | MAP3K1 | 3562 | 0.052 | 0.57 | NO |
| 49 | TRAF3 | TRAF3 | TRAF3 | 3575 | 0.052 | 0.57 | NO |
| 50 | IRAK1 | IRAK1 | IRAK1 | 3643 | 0.05 | 0.57 | NO |
| 51 | JUN | JUN | JUN | 3719 | 0.048 | 0.57 | NO |
| 52 | IRF7 | IRF7 | IRF7 | 3829 | 0.045 | 0.56 | NO |
| 53 | MAPK14 | MAPK14 | MAPK14 | 3883 | 0.043 | 0.56 | NO |
| 54 | MAPK1 | MAPK1 | MAPK1 | 3962 | 0.041 | 0.56 | NO |
| 55 | ATF1 | ATF1 | ATF1 | 3964 | 0.041 | 0.56 | NO |
| 56 | DUSP3 | DUSP3 | DUSP3 | 4256 | 0.033 | 0.55 | NO |
| 57 | UBE2N | UBE2N | UBE2N | 4444 | 0.028 | 0.54 | NO |
| 58 | RPS6KA3 | RPS6KA3 | RPS6KA3 | 4467 | 0.028 | 0.54 | NO |
| 59 | MAP2K4 | MAP2K4 | MAP2K4 | 4595 | 0.025 | 0.53 | NO |
| 60 | RIPK2 | RIPK2 | RIPK2 | 4619 | 0.025 | 0.53 | NO |
| 61 | BTK | BTK | BTK | 4725 | 0.022 | 0.53 | NO |
| 62 | NFKBIB | NFKBIB | NFKBIB | 4784 | 0.021 | 0.53 | NO |
| 63 | MAPK9 | MAPK9 | MAPK9 | 5022 | 0.016 | 0.51 | NO |
| 64 | MAPKAPK3 | MAPKAPK3 | MAPKAPK3 | 5165 | 0.013 | 0.51 | NO |
| 65 | DNM2 | DNM2 | DNM2 | 5193 | 0.013 | 0.5 | NO |
| 66 | RPS6KA5 | RPS6KA5 | RPS6KA5 | 5244 | 0.012 | 0.5 | NO |
| 67 | PPP2CB | PPP2CB | PPP2CB | 5384 | 0.0088 | 0.5 | NO |
| 68 | IKBKE | IKBKE | IKBKE | 5516 | 0.0063 | 0.49 | NO |
| 69 | MAP2K2 | MAP2K2 | MAP2K2 | 5602 | 0.0045 | 0.48 | NO |
| 70 | HSP90B1 | HSP90B1 | HSP90B1 | 5658 | 0.0033 | 0.48 | NO |
| 71 | CDK1 | CDK1 | CDK1 | 5829 | 0.00029 | 0.47 | NO |
| 72 | MEF2A | MEF2A | MEF2A | 5888 | -0.0011 | 0.47 | NO |
| 73 | PLCG2 | PLCG2 | PLCG2 | 5915 | -0.0015 | 0.46 | NO |
| 74 | RELA | RELA | RELA | 6026 | -0.0035 | 0.46 | NO |
| 75 | PPP2R1A | PPP2R1A | PPP2R1A | 6098 | -0.0048 | 0.46 | NO |
| 76 | UBA52 | UBA52 | UBA52 | 6462 | -0.012 | 0.43 | NO |
| 77 | PPP2R1B | PPP2R1B | PPP2R1B | 6548 | -0.013 | 0.43 | NO |
| 78 | PIK3R4 | PIK3R4 | PIK3R4 | 6617 | -0.014 | 0.43 | NO |
| 79 | MAPK10 | MAPK10 | MAPK10 | 6625 | -0.014 | 0.43 | NO |
| 80 | RIPK1 | RIPK1 | RIPK1 | 6771 | -0.017 | 0.42 | NO |
| 81 | IRF3 | IRF3 | IRF3 | 7002 | -0.021 | 0.41 | NO |
| 82 | PPP2R5D | PPP2R5D | PPP2R5D | 7028 | -0.022 | 0.41 | NO |
| 83 | TAB2 | TAB2 | TAB2 | 7098 | -0.023 | 0.4 | NO |
| 84 | IKBKB | IKBKB | IKBKB | 7288 | -0.026 | 0.39 | NO |
| 85 | ECSIT | ECSIT | ECSIT | 7296 | -0.026 | 0.4 | NO |
| 86 | MAP3K7 | MAP3K7 | MAP3K7 | 7426 | -0.028 | 0.39 | NO |
| 87 | CREB1 | CREB1 | CREB1 | 7723 | -0.033 | 0.37 | NO |
| 88 | MAP2K7 | MAP2K7 | MAP2K7 | 7853 | -0.035 | 0.37 | NO |
| 89 | ELK1 | ELK1 | ELK1 | 7912 | -0.036 | 0.37 | NO |
| 90 | HMGB1 | HMGB1 | HMGB1 | 8037 | -0.039 | 0.36 | NO |
| 91 | S100B | S100B | S100B | 8093 | -0.04 | 0.36 | NO |
| 92 | AGER | AGER | AGER | 8162 | -0.041 | 0.36 | NO |
| 93 | ZFYVE20 | ZFYVE20 | ZFYVE20 | 8501 | -0.046 | 0.34 | NO |
| 94 | TRAF6 | TRAF6 | TRAF6 | 8541 | -0.047 | 0.34 | NO |
| 95 | TAB1 | TAB1 | TAB1 | 8543 | -0.047 | 0.34 | NO |
| 96 | NOD1 | NOD1 | NOD1 | 8872 | -0.053 | 0.33 | NO |
| 97 | SIGIRR | SIGIRR | SIGIRR | 8907 | -0.053 | 0.33 | NO |
| 98 | TAB3 | TAB3 | TAB3 | 8990 | -0.054 | 0.33 | NO |
| 99 | RPS27A | RPS27A | RPS27A | 9037 | -0.055 | 0.33 | NO |
| 100 | PELI2 | PELI2 | PELI2 | 9054 | -0.056 | 0.33 | NO |
| 101 | ATF2 | ATF2 | ATF2 | 9567 | -0.066 | 0.3 | NO |
| 102 | PIK3C3 | PIK3C3 | PIK3C3 | 9661 | -0.068 | 0.3 | NO |
| 103 | LGMN | LGMN | LGMN | 10111 | -0.076 | 0.28 | NO |
| 104 | IRAK2 | IRAK2 | IRAK2 | 10996 | -0.095 | 0.23 | NO |
| 105 | TLR9 | TLR9 | TLR9 | 11686 | -0.11 | 0.2 | NO |
| 106 | DUSP4 | DUSP4 | DUSP4 | 12626 | -0.14 | 0.15 | NO |
| 107 | MAPK8 | MAPK8 | MAPK8 | 12703 | -0.15 | 0.15 | NO |
| 108 | RPS6KA2 | RPS6KA2 | RPS6KA2 | 13091 | -0.16 | 0.14 | NO |
| 109 | APP | APP | APP | 15575 | -0.29 | 0.011 | NO |
| 110 | LBP | LBP | LBP | 16040 | -0.33 | 0.0014 | NO |
| 111 | DNM1 | DNM1 | DNM1 | 16384 | -0.37 | 0.001 | NO |
| 112 | TLR3 | TLR3 | TLR3 | 16390 | -0.37 | 0.02 | NO |
| 113 | MAPK11 | MAPK11 | MAPK11 | 17156 | -0.57 | 0.006 | NO |
Figure S23. Get High-res Image This plot shows mRNAseq_cNMF expression data heatmap (on the left) a RunningEnrichmentScore(RES) plot (on the top right) and a Signal2Noise(S2N) plot (on the bottom right) of genes in the pathway: KEGG FC GAMMA R MEDIATED PHAGOCYTOSIS.
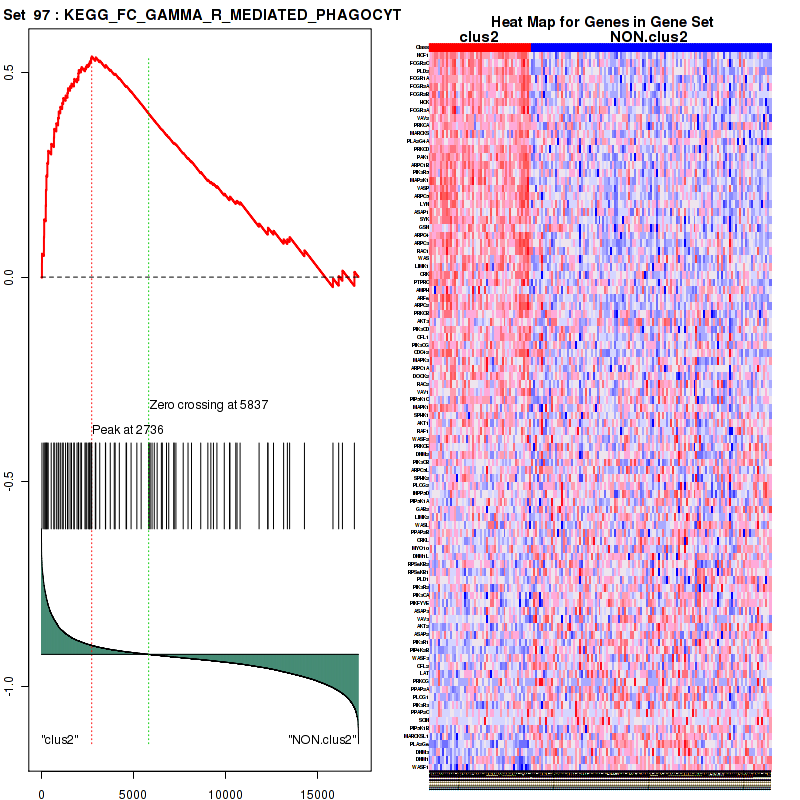
Figure S24. Get High-res Image For the top 5 core enriched genes in the pathway: KEGG FC GAMMA R MEDIATED PHAGOCYTOSIS, this volcano plot shows how much they are up/down-regulated and significant. The significance was calculated by empirical bayesian fit

Table S13. Get Full Table This table shows a Running Enrichment Score (RES) of each gene in this pathway, that is, the enrichment score at this point in the ranked list of genes. All genes are ranked by Signal-to-Noise (S2N), a measure of similarity as default and are used to obtain ES matrix of all genes. In this way, GSEA tool uses expression pattern of not only overlapped genes but also not-overlapped genes to produce ES matrix.
| Rank | GENE | SYMBOL | DESC | LIST.LOC | S2N | RES | CORE_ENRICHMENT |
|---|---|---|---|---|---|---|---|
| 1 | CD14 | CD14 | CD14 | 36 | 0.84 | 0.067 | YES |
| 2 | S100A12 | S100A12 | S100A12 | 55 | 0.8 | 0.13 | YES |
| 3 | TICAM2 | TICAM2 | TICAM2 | 118 | 0.69 | 0.19 | YES |
| 4 | LY96 | LY96 | LY96 | 135 | 0.67 | 0.24 | YES |
| 5 | NOD2 | NOD2 | NOD2 | 166 | 0.63 | 0.29 | YES |
| 6 | TLR4 | TLR4 | TLR4 | 270 | 0.54 | 0.33 | YES |
| 7 | PELI3 | PELI3 | PELI3 | 518 | 0.39 | 0.35 | YES |
| 8 | TLR6 | TLR6 | TLR6 | 584 | 0.37 | 0.37 | YES |
| 9 | TLR2 | TLR2 | TLR2 | 656 | 0.34 | 0.4 | YES |
| 10 | TLR1 | TLR1 | TLR1 | 700 | 0.33 | 0.42 | YES |
| 11 | DUSP6 | DUSP6 | DUSP6 | 702 | 0.33 | 0.45 | YES |
| 12 | MAPK7 | MAPK7 | MAPK7 | 925 | 0.26 | 0.46 | YES |
| 13 | PELI1 | PELI1 | PELI1 | 1031 | 0.24 | 0.47 | YES |
| 14 | MAP2K6 | MAP2K6 | MAP2K6 | 1062 | 0.24 | 0.49 | YES |
| 15 | MAP2K1 | MAP2K1 | MAP2K1 | 1187 | 0.22 | 0.5 | YES |
| 16 | MYD88 | MYD88 | MYD88 | 1291 | 0.2 | 0.51 | YES |
| 17 | FOS | FOS | FOS | 1620 | 0.16 | 0.51 | YES |
| 18 | NFKB2 | NFKB2 | NFKB2 | 1695 | 0.15 | 0.52 | YES |
| 19 | MEF2C | MEF2C | MEF2C | 1850 | 0.14 | 0.52 | YES |
| 20 | TIRAP | TIRAP | TIRAP | 1963 | 0.13 | 0.52 | YES |
| 21 | TICAM1 | TICAM1 | TICAM1 | 1992 | 0.13 | 0.53 | YES |
| 22 | IRAK3 | IRAK3 | IRAK3 | 2010 | 0.13 | 0.54 | YES |
| 23 | MAP2K3 | MAP2K3 | MAP2K3 | 2376 | 0.1 | 0.53 | NO |
| 24 | DUSP7 | DUSP7 | DUSP7 | 2585 | 0.093 | 0.52 | NO |
| 25 | NFKBIA | NFKBIA | NFKBIA | 2653 | 0.09 | 0.53 | NO |
| 26 | CHUK | CHUK | CHUK | 2910 | 0.078 | 0.52 | NO |
| 27 | MAPK3 | MAPK3 | MAPK3 | 2933 | 0.076 | 0.52 | NO |
| 28 | IKBKG | IKBKG | IKBKG | 2970 | 0.074 | 0.53 | NO |
| 29 | RPS6KA1 | RPS6KA1 | RPS6KA1 | 3013 | 0.072 | 0.53 | NO |
| 30 | TBK1 | TBK1 | TBK1 | 3306 | 0.062 | 0.52 | NO |
| 31 | IRAK4 | IRAK4 | IRAK4 | 3430 | 0.058 | 0.52 | NO |
| 32 | TMEM189-UBE2V1 | TMEM189-UBE2V1 | TMEM189-UBE2V1 | 3481 | 0.056 | 0.52 | NO |
| 33 | MAPKAPK2 | MAPKAPK2 | MAPKAPK2 | 3527 | 0.054 | 0.52 | NO |
| 34 | PPP2CA | PPP2CA | PPP2CA | 3533 | 0.054 | 0.52 | NO |
| 35 | MAP3K1 | MAP3K1 | MAP3K1 | 3562 | 0.052 | 0.53 | NO |
| 36 | TRAF3 | TRAF3 | TRAF3 | 3575 | 0.052 | 0.53 | NO |
| 37 | IRAK1 | IRAK1 | IRAK1 | 3643 | 0.05 | 0.53 | NO |
| 38 | JUN | JUN | JUN | 3719 | 0.048 | 0.53 | NO |
| 39 | IRF7 | IRF7 | IRF7 | 3829 | 0.045 | 0.53 | NO |
| 40 | MAPK14 | MAPK14 | MAPK14 | 3883 | 0.043 | 0.53 | NO |
| 41 | MAPK1 | MAPK1 | MAPK1 | 3962 | 0.041 | 0.53 | NO |
| 42 | ATF1 | ATF1 | ATF1 | 3964 | 0.041 | 0.53 | NO |
| 43 | DUSP3 | DUSP3 | DUSP3 | 4256 | 0.033 | 0.52 | NO |
| 44 | UBE2N | UBE2N | UBE2N | 4444 | 0.028 | 0.51 | NO |
| 45 | RPS6KA3 | RPS6KA3 | RPS6KA3 | 4467 | 0.028 | 0.51 | NO |
| 46 | MAP2K4 | MAP2K4 | MAP2K4 | 4595 | 0.025 | 0.5 | NO |
| 47 | RIPK2 | RIPK2 | RIPK2 | 4619 | 0.025 | 0.5 | NO |
| 48 | BTK | BTK | BTK | 4725 | 0.022 | 0.5 | NO |
| 49 | NFKBIB | NFKBIB | NFKBIB | 4784 | 0.021 | 0.5 | NO |
| 50 | MAPK9 | MAPK9 | MAPK9 | 5022 | 0.016 | 0.49 | NO |
| 51 | MAPKAPK3 | MAPKAPK3 | MAPKAPK3 | 5165 | 0.013 | 0.48 | NO |
| 52 | RPS6KA5 | RPS6KA5 | RPS6KA5 | 5244 | 0.012 | 0.48 | NO |
| 53 | PPP2CB | PPP2CB | PPP2CB | 5384 | 0.0088 | 0.47 | NO |
| 54 | IKBKE | IKBKE | IKBKE | 5516 | 0.0063 | 0.46 | NO |
| 55 | MAP2K2 | MAP2K2 | MAP2K2 | 5602 | 0.0045 | 0.46 | NO |
| 56 | CDK1 | CDK1 | CDK1 | 5829 | 0.00029 | 0.44 | NO |
| 57 | MEF2A | MEF2A | MEF2A | 5888 | -0.0011 | 0.44 | NO |
| 58 | RELA | RELA | RELA | 6026 | -0.0035 | 0.43 | NO |
| 59 | PPP2R1A | PPP2R1A | PPP2R1A | 6098 | -0.0048 | 0.43 | NO |
| 60 | UBA52 | UBA52 | UBA52 | 6462 | -0.012 | 0.41 | NO |
| 61 | PPP2R1B | PPP2R1B | PPP2R1B | 6548 | -0.013 | 0.4 | NO |
| 62 | MAPK10 | MAPK10 | MAPK10 | 6625 | -0.014 | 0.4 | NO |
| 63 | RIPK1 | RIPK1 | RIPK1 | 6771 | -0.017 | 0.4 | NO |
| 64 | IRF3 | IRF3 | IRF3 | 7002 | -0.021 | 0.38 | NO |
| 65 | PPP2R5D | PPP2R5D | PPP2R5D | 7028 | -0.022 | 0.38 | NO |
| 66 | TAB2 | TAB2 | TAB2 | 7098 | -0.023 | 0.38 | NO |
| 67 | IKBKB | IKBKB | IKBKB | 7288 | -0.026 | 0.37 | NO |
| 68 | ECSIT | ECSIT | ECSIT | 7296 | -0.026 | 0.37 | NO |
| 69 | MAP3K7 | MAP3K7 | MAP3K7 | 7426 | -0.028 | 0.37 | NO |
| 70 | CREB1 | CREB1 | CREB1 | 7723 | -0.033 | 0.36 | NO |
| 71 | MAP2K7 | MAP2K7 | MAP2K7 | 7853 | -0.035 | 0.35 | NO |
| 72 | ELK1 | ELK1 | ELK1 | 7912 | -0.036 | 0.35 | NO |
| 73 | HMGB1 | HMGB1 | HMGB1 | 8037 | -0.039 | 0.35 | NO |
| 74 | S100B | S100B | S100B | 8093 | -0.04 | 0.35 | NO |
| 75 | AGER | AGER | AGER | 8162 | -0.041 | 0.34 | NO |
| 76 | TRAF6 | TRAF6 | TRAF6 | 8541 | -0.047 | 0.33 | NO |
| 77 | TAB1 | TAB1 | TAB1 | 8543 | -0.047 | 0.33 | NO |
| 78 | NOD1 | NOD1 | NOD1 | 8872 | -0.053 | 0.32 | NO |
| 79 | SIGIRR | SIGIRR | SIGIRR | 8907 | -0.053 | 0.32 | NO |
| 80 | TAB3 | TAB3 | TAB3 | 8990 | -0.054 | 0.32 | NO |
| 81 | RPS27A | RPS27A | RPS27A | 9037 | -0.055 | 0.32 | NO |
| 82 | PELI2 | PELI2 | PELI2 | 9054 | -0.056 | 0.32 | NO |
| 83 | ATF2 | ATF2 | ATF2 | 9567 | -0.066 | 0.3 | NO |
| 84 | IRAK2 | IRAK2 | IRAK2 | 10996 | -0.095 | 0.22 | NO |
| 85 | DUSP4 | DUSP4 | DUSP4 | 12626 | -0.14 | 0.14 | NO |
| 86 | MAPK8 | MAPK8 | MAPK8 | 12703 | -0.15 | 0.15 | NO |
| 87 | RPS6KA2 | RPS6KA2 | RPS6KA2 | 13091 | -0.16 | 0.14 | NO |
| 88 | APP | APP | APP | 15575 | -0.29 | 0.02 | NO |
| 89 | TLR3 | TLR3 | TLR3 | 16390 | -0.37 | 0.0033 | NO |
| 90 | MAPK11 | MAPK11 | MAPK11 | 17156 | -0.57 | 0.006 | NO |
Figure S25. Get High-res Image This plot shows mRNAseq_cNMF expression data heatmap (on the left) a RunningEnrichmentScore(RES) plot (on the top right) and a Signal2Noise(S2N) plot (on the bottom right) of genes in the pathway: BIOCARTA HIVNEF PATHWAY.
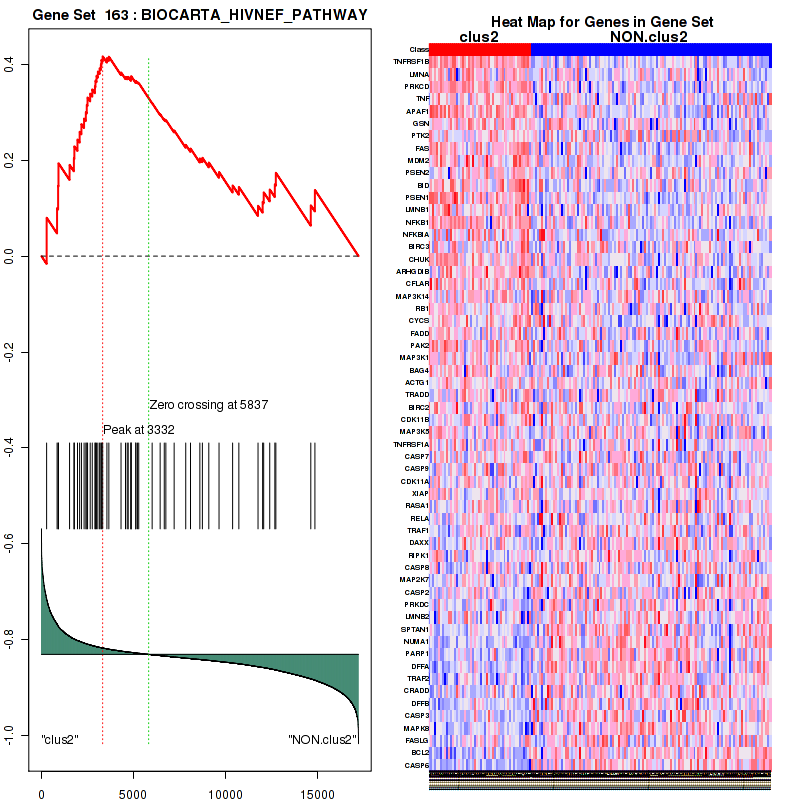
Figure S26. Get High-res Image For the top 5 core enriched genes in the pathway: BIOCARTA HIVNEF PATHWAY, this volcano plot shows how much they are up/down-regulated and significant. The significance was calculated by empirical bayesian fit
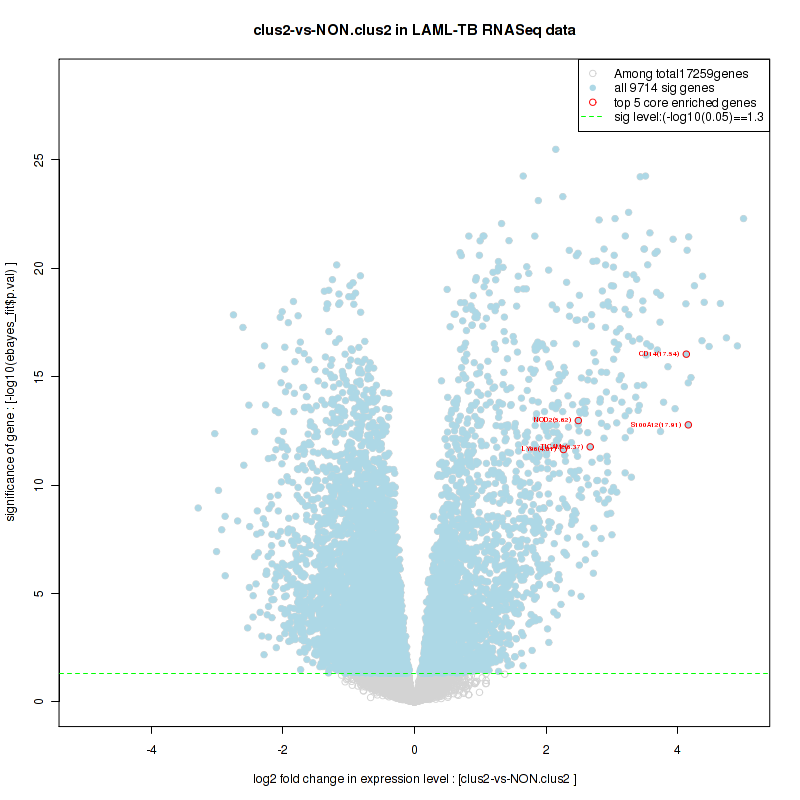
Table S14. Get Full Table This table shows a Running Enrichment Score (RES) of each gene in this pathway, that is, the enrichment score at this point in the ranked list of genes. All genes are ranked by Signal-to-Noise (S2N), a measure of similarity as default and are used to obtain ES matrix of all genes. In this way, GSEA tool uses expression pattern of not only overlapped genes but also not-overlapped genes to produce ES matrix.
| Rank | GENE | SYMBOL | DESC | LIST.LOC | S2N | RES | CORE_ENRICHMENT |
|---|---|---|---|---|---|---|---|
| 1 | S100A12 | S100A12 | S100A12 | 55 | 0.8 | 0.078 | YES |
| 2 | LY96 | LY96 | LY96 | 135 | 0.67 | 0.14 | YES |
| 3 | NOD2 | NOD2 | NOD2 | 166 | 0.63 | 0.2 | YES |
| 4 | TLR4 | TLR4 | TLR4 | 270 | 0.54 | 0.25 | YES |
| 5 | PELI3 | PELI3 | PELI3 | 518 | 0.39 | 0.28 | YES |
| 6 | TLR6 | TLR6 | TLR6 | 584 | 0.37 | 0.31 | YES |
| 7 | TLR2 | TLR2 | TLR2 | 656 | 0.34 | 0.34 | YES |
| 8 | TLR1 | TLR1 | TLR1 | 700 | 0.33 | 0.37 | YES |
| 9 | DUSP6 | DUSP6 | DUSP6 | 702 | 0.33 | 0.41 | YES |
| 10 | MAPK7 | MAPK7 | MAPK7 | 925 | 0.26 | 0.42 | YES |
| 11 | PELI1 | PELI1 | PELI1 | 1031 | 0.24 | 0.44 | YES |
| 12 | MAP2K6 | MAP2K6 | MAP2K6 | 1062 | 0.24 | 0.46 | YES |
| 13 | MAP2K1 | MAP2K1 | MAP2K1 | 1187 | 0.22 | 0.48 | YES |
| 14 | MYD88 | MYD88 | MYD88 | 1291 | 0.2 | 0.49 | YES |
| 15 | FOS | FOS | FOS | 1620 | 0.16 | 0.49 | YES |
| 16 | NFKB2 | NFKB2 | NFKB2 | 1695 | 0.15 | 0.5 | YES |
| 17 | MEF2C | MEF2C | MEF2C | 1850 | 0.14 | 0.5 | YES |
| 18 | TIRAP | TIRAP | TIRAP | 1963 | 0.13 | 0.51 | YES |
| 19 | IRAK3 | IRAK3 | IRAK3 | 2010 | 0.13 | 0.52 | YES |
| 20 | MAP2K3 | MAP2K3 | MAP2K3 | 2376 | 0.1 | 0.51 | YES |
| 21 | DUSP7 | DUSP7 | DUSP7 | 2585 | 0.093 | 0.51 | YES |
| 22 | NFKBIA | NFKBIA | NFKBIA | 2653 | 0.09 | 0.51 | YES |
| 23 | CHUK | CHUK | CHUK | 2910 | 0.078 | 0.51 | YES |
| 24 | MAPK3 | MAPK3 | MAPK3 | 2933 | 0.076 | 0.51 | YES |
| 25 | IKBKG | IKBKG | IKBKG | 2970 | 0.074 | 0.52 | YES |
| 26 | RPS6KA1 | RPS6KA1 | RPS6KA1 | 3013 | 0.072 | 0.52 | YES |
| 27 | IRAK4 | IRAK4 | IRAK4 | 3430 | 0.058 | 0.5 | NO |
| 28 | TMEM189-UBE2V1 | TMEM189-UBE2V1 | TMEM189-UBE2V1 | 3481 | 0.056 | 0.51 | NO |
| 29 | MAPKAPK2 | MAPKAPK2 | MAPKAPK2 | 3527 | 0.054 | 0.51 | NO |
| 30 | PPP2CA | PPP2CA | PPP2CA | 3533 | 0.054 | 0.52 | NO |
| 31 | MAP3K1 | MAP3K1 | MAP3K1 | 3562 | 0.052 | 0.52 | NO |
| 32 | IRAK1 | IRAK1 | IRAK1 | 3643 | 0.05 | 0.52 | NO |
| 33 | JUN | JUN | JUN | 3719 | 0.048 | 0.52 | NO |
| 34 | MAPK14 | MAPK14 | MAPK14 | 3883 | 0.043 | 0.52 | NO |
| 35 | MAPK1 | MAPK1 | MAPK1 | 3962 | 0.041 | 0.52 | NO |
| 36 | ATF1 | ATF1 | ATF1 | 3964 | 0.041 | 0.52 | NO |
| 37 | DUSP3 | DUSP3 | DUSP3 | 4256 | 0.033 | 0.51 | NO |
| 38 | UBE2N | UBE2N | UBE2N | 4444 | 0.028 | 0.5 | NO |
| 39 | RPS6KA3 | RPS6KA3 | RPS6KA3 | 4467 | 0.028 | 0.5 | NO |
| 40 | MAP2K4 | MAP2K4 | MAP2K4 | 4595 | 0.025 | 0.49 | NO |
| 41 | RIPK2 | RIPK2 | RIPK2 | 4619 | 0.025 | 0.5 | NO |
| 42 | BTK | BTK | BTK | 4725 | 0.022 | 0.49 | NO |
| 43 | NFKBIB | NFKBIB | NFKBIB | 4784 | 0.021 | 0.49 | NO |
| 44 | MAPK9 | MAPK9 | MAPK9 | 5022 | 0.016 | 0.48 | NO |
| 45 | MAPKAPK3 | MAPKAPK3 | MAPKAPK3 | 5165 | 0.013 | 0.47 | NO |
| 46 | RPS6KA5 | RPS6KA5 | RPS6KA5 | 5244 | 0.012 | 0.47 | NO |
| 47 | PPP2CB | PPP2CB | PPP2CB | 5384 | 0.0088 | 0.46 | NO |
| 48 | MAP2K2 | MAP2K2 | MAP2K2 | 5602 | 0.0045 | 0.45 | NO |
| 49 | CDK1 | CDK1 | CDK1 | 5829 | 0.00029 | 0.44 | NO |
| 50 | MEF2A | MEF2A | MEF2A | 5888 | -0.0011 | 0.43 | NO |
| 51 | RELA | RELA | RELA | 6026 | -0.0035 | 0.42 | NO |
| 52 | PPP2R1A | PPP2R1A | PPP2R1A | 6098 | -0.0048 | 0.42 | NO |
| 53 | UBA52 | UBA52 | UBA52 | 6462 | -0.012 | 0.4 | NO |
| 54 | PPP2R1B | PPP2R1B | PPP2R1B | 6548 | -0.013 | 0.4 | NO |
| 55 | MAPK10 | MAPK10 | MAPK10 | 6625 | -0.014 | 0.4 | NO |
| 56 | PPP2R5D | PPP2R5D | PPP2R5D | 7028 | -0.022 | 0.37 | NO |
| 57 | TAB2 | TAB2 | TAB2 | 7098 | -0.023 | 0.37 | NO |
| 58 | IKBKB | IKBKB | IKBKB | 7288 | -0.026 | 0.36 | NO |
| 59 | ECSIT | ECSIT | ECSIT | 7296 | -0.026 | 0.37 | NO |
| 60 | MAP3K7 | MAP3K7 | MAP3K7 | 7426 | -0.028 | 0.36 | NO |
| 61 | CREB1 | CREB1 | CREB1 | 7723 | -0.033 | 0.35 | NO |
| 62 | MAP2K7 | MAP2K7 | MAP2K7 | 7853 | -0.035 | 0.34 | NO |
| 63 | ELK1 | ELK1 | ELK1 | 7912 | -0.036 | 0.34 | NO |
| 64 | HMGB1 | HMGB1 | HMGB1 | 8037 | -0.039 | 0.34 | NO |
| 65 | S100B | S100B | S100B | 8093 | -0.04 | 0.34 | NO |
| 66 | AGER | AGER | AGER | 8162 | -0.041 | 0.34 | NO |
| 67 | TRAF6 | TRAF6 | TRAF6 | 8541 | -0.047 | 0.32 | NO |
| 68 | TAB1 | TAB1 | TAB1 | 8543 | -0.047 | 0.33 | NO |
| 69 | NOD1 | NOD1 | NOD1 | 8872 | -0.053 | 0.32 | NO |
| 70 | SIGIRR | SIGIRR | SIGIRR | 8907 | -0.053 | 0.32 | NO |
| 71 | TAB3 | TAB3 | TAB3 | 8990 | -0.054 | 0.32 | NO |
| 72 | RPS27A | RPS27A | RPS27A | 9037 | -0.055 | 0.32 | NO |
| 73 | PELI2 | PELI2 | PELI2 | 9054 | -0.056 | 0.33 | NO |
| 74 | ATF2 | ATF2 | ATF2 | 9567 | -0.066 | 0.3 | NO |
| 75 | IRAK2 | IRAK2 | IRAK2 | 10996 | -0.095 | 0.23 | NO |
| 76 | DUSP4 | DUSP4 | DUSP4 | 12626 | -0.14 | 0.15 | NO |
| 77 | MAPK8 | MAPK8 | MAPK8 | 12703 | -0.15 | 0.16 | NO |
| 78 | RPS6KA2 | RPS6KA2 | RPS6KA2 | 13091 | -0.16 | 0.16 | NO |
| 79 | APP | APP | APP | 15575 | -0.29 | 0.04 | NO |
| 80 | MAPK11 | MAPK11 | MAPK11 | 17156 | -0.57 | 0.006 | NO |
Figure S27. Get High-res Image This plot shows mRNAseq_cNMF expression data heatmap (on the left) a RunningEnrichmentScore(RES) plot (on the top right) and a Signal2Noise(S2N) plot (on the bottom right) of genes in the pathway: BIOCARTA PYK2 PATHWAY.
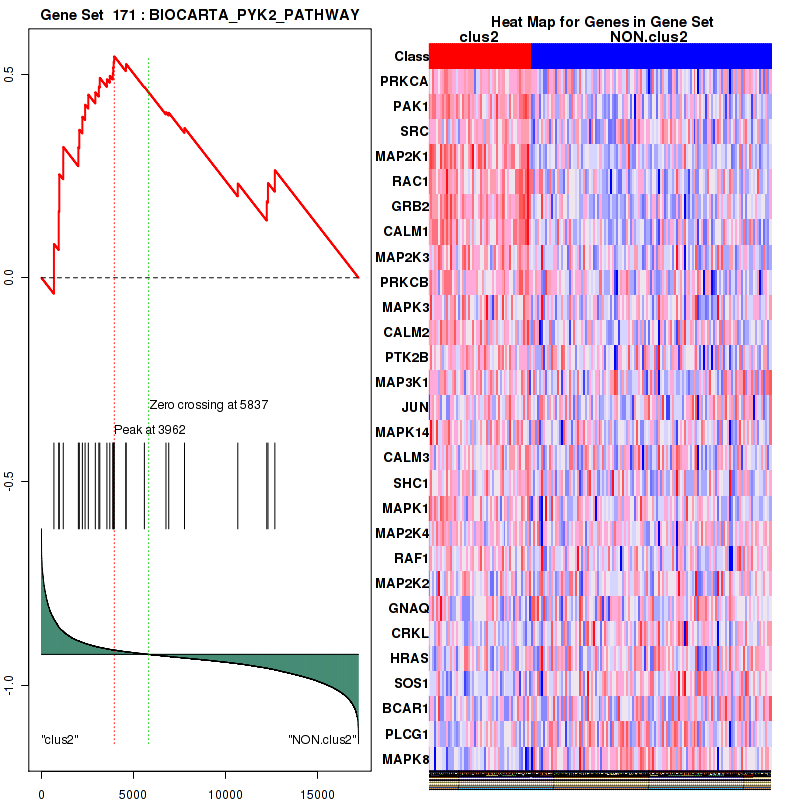
Figure S28. Get High-res Image For the top 5 core enriched genes in the pathway: BIOCARTA PYK2 PATHWAY, this volcano plot shows how much they are up/down-regulated and significant. The significance was calculated by empirical bayesian fit
Table S15. Get Full Table This table shows a Running Enrichment Score (RES) of each gene in this pathway, that is, the enrichment score at this point in the ranked list of genes. All genes are ranked by Signal-to-Noise (S2N), a measure of similarity as default and are used to obtain ES matrix of all genes. In this way, GSEA tool uses expression pattern of not only overlapped genes but also not-overlapped genes to produce ES matrix.
| Rank | GENE | SYMBOL | DESC | LIST.LOC | S2N | RES | CORE_ENRICHMENT |
|---|---|---|---|---|---|---|---|
| 1 | MEFV | MEFV | MEFV | 12 | 0.93 | 0.026 | YES |
| 2 | TLR8 | TLR8 | TLR8 | 15 | 0.92 | 0.053 | YES |
| 3 | TLR5 | TLR5 | TLR5 | 16 | 0.92 | 0.08 | YES |
| 4 | CD14 | CD14 | CD14 | 36 | 0.84 | 0.1 | YES |
| 5 | S100A12 | S100A12 | S100A12 | 55 | 0.8 | 0.12 | YES |
| 6 | TLR7 | TLR7 | TLR7 | 60 | 0.79 | 0.15 | YES |
| 7 | NLRC4 | NLRC4 | NLRC4 | 66 | 0.78 | 0.17 | YES |
| 8 | CCR2 | CCR2 | CCR2 | 98 | 0.72 | 0.19 | YES |
| 9 | LGALS3 | LGALS3 | LGALS3 | 110 | 0.7 | 0.21 | YES |
| 10 | LY86 | LY86 | LY86 | 112 | 0.7 | 0.23 | YES |
| 11 | TICAM2 | TICAM2 | TICAM2 | 118 | 0.69 | 0.25 | YES |
| 12 | LY96 | LY96 | LY96 | 135 | 0.67 | 0.27 | YES |
| 13 | NOD2 | NOD2 | NOD2 | 166 | 0.63 | 0.28 | YES |
| 14 | CTSL1 | CTSL1 | CTSL1 | 205 | 0.59 | 0.3 | YES |
| 15 | CR1 | CR1 | CR1 | 246 | 0.56 | 0.31 | YES |
| 16 | C3 | C3 | C3 | 257 | 0.55 | 0.33 | YES |
| 17 | AIM2 | AIM2 | AIM2 | 263 | 0.54 | 0.34 | YES |
| 18 | C2 | C2 | C2 | 266 | 0.54 | 0.36 | YES |
| 19 | TLR4 | TLR4 | TLR4 | 270 | 0.54 | 0.37 | YES |
| 20 | CD180 | CD180 | CD180 | 286 | 0.52 | 0.39 | YES |
| 21 | CD4 | CD4 | CD4 | 353 | 0.48 | 0.4 | YES |
| 22 | P2RX7 | P2RX7 | P2RX7 | 475 | 0.41 | 0.4 | YES |
| 23 | CTSS | CTSS | CTSS | 499 | 0.4 | 0.41 | YES |
| 24 | PELI3 | PELI3 | PELI3 | 518 | 0.39 | 0.42 | YES |
| 25 | CASP1 | CASP1 | CASP1 | 578 | 0.37 | 0.43 | YES |
| 26 | NLRP3 | NLRP3 | NLRP3 | 580 | 0.37 | 0.44 | YES |
| 27 | TLR6 | TLR6 | TLR6 | 584 | 0.37 | 0.45 | YES |
| 28 | TLR2 | TLR2 | TLR2 | 656 | 0.34 | 0.46 | YES |
| 29 | CFB | CFB | CFB | 697 | 0.33 | 0.46 | YES |
| 30 | TLR1 | TLR1 | TLR1 | 700 | 0.33 | 0.47 | YES |
| 31 | DUSP6 | DUSP6 | DUSP6 | 702 | 0.33 | 0.48 | YES |
| 32 | CARD9 | CARD9 | CARD9 | 735 | 0.32 | 0.49 | YES |
| 33 | UNC93B1 | UNC93B1 | UNC93B1 | 807 | 0.3 | 0.49 | YES |
| 34 | NLRP1 | NLRP1 | NLRP1 | 845 | 0.29 | 0.5 | YES |
| 35 | C1QA | C1QA | C1QA | 851 | 0.29 | 0.51 | YES |
| 36 | UBE2D1 | UBE2D1 | UBE2D1 | 904 | 0.27 | 0.51 | YES |
| 37 | CTSB | CTSB | CTSB | 911 | 0.27 | 0.52 | YES |
| 38 | PSTPIP1 | PSTPIP1 | PSTPIP1 | 912 | 0.27 | 0.53 | YES |
| 39 | MAPK7 | MAPK7 | MAPK7 | 925 | 0.26 | 0.54 | YES |
| 40 | PELI1 | PELI1 | PELI1 | 1031 | 0.24 | 0.54 | YES |
| 41 | MAP2K6 | MAP2K6 | MAP2K6 | 1062 | 0.24 | 0.54 | YES |
| 42 | DEFB1 | DEFB1 | DEFB1 | 1065 | 0.24 | 0.55 | YES |
| 43 | CFD | CFD | CFD | 1128 | 0.23 | 0.55 | YES |
| 44 | PYCARD | PYCARD | PYCARD | 1182 | 0.22 | 0.55 | YES |
| 45 | MAP2K1 | MAP2K1 | MAP2K1 | 1187 | 0.22 | 0.56 | YES |
| 46 | MYD88 | MYD88 | MYD88 | 1291 | 0.2 | 0.56 | YES |
| 47 | RNF135 | RNF135 | RNF135 | 1337 | 0.2 | 0.56 | YES |
| 48 | FOS | FOS | FOS | 1620 | 0.16 | 0.55 | YES |
| 49 | C4BPA | C4BPA | C4BPA | 1646 | 0.16 | 0.56 | YES |
| 50 | NFKB2 | NFKB2 | NFKB2 | 1695 | 0.15 | 0.56 | YES |
| 51 | CAPZA2 | CAPZA2 | CAPZA2 | 1716 | 0.15 | 0.56 | YES |
| 52 | MEF2C | MEF2C | MEF2C | 1850 | 0.14 | 0.56 | YES |
| 53 | RIPK3 | RIPK3 | RIPK3 | 1910 | 0.14 | 0.56 | YES |
| 54 | TIRAP | TIRAP | TIRAP | 1963 | 0.13 | 0.56 | YES |
| 55 | TICAM1 | TICAM1 | TICAM1 | 1992 | 0.13 | 0.56 | YES |
| 56 | IRAK3 | IRAK3 | IRAK3 | 2010 | 0.13 | 0.56 | YES |
| 57 | EEA1 | EEA1 | EEA1 | 2117 | 0.12 | 0.56 | YES |
| 58 | C1QC | C1QC | C1QC | 2168 | 0.12 | 0.56 | YES |
| 59 | C5 | C5 | C5 | 2285 | 0.11 | 0.56 | YES |
| 60 | IRF2 | IRF2 | IRF2 | 2345 | 0.11 | 0.56 | YES |
| 61 | CD55 | CD55 | CD55 | 2370 | 0.1 | 0.56 | YES |
| 62 | MAP2K3 | MAP2K3 | MAP2K3 | 2376 | 0.1 | 0.56 | YES |
| 63 | CAPZA1 | CAPZA1 | CAPZA1 | 2385 | 0.1 | 0.56 | YES |
| 64 | CTSK | CTSK | CTSK | 2442 | 0.1 | 0.56 | YES |
| 65 | C1QB | C1QB | C1QB | 2455 | 0.1 | 0.56 | YES |
| 66 | TANK | TANK | TANK | 2539 | 0.096 | 0.56 | YES |
| 67 | DUSP7 | DUSP7 | DUSP7 | 2585 | 0.093 | 0.56 | YES |
| 68 | MAPK13 | MAPK13 | MAPK13 | 2590 | 0.093 | 0.56 | YES |
| 69 | NFKBIA | NFKBIA | NFKBIA | 2653 | 0.09 | 0.56 | NO |
| 70 | CNPY3 | CNPY3 | CNPY3 | 2691 | 0.088 | 0.56 | NO |
| 71 | BIRC3 | BIRC3 | BIRC3 | 2767 | 0.084 | 0.56 | NO |
| 72 | DEFA4 | DEFA4 | DEFA4 | 2782 | 0.083 | 0.56 | NO |
| 73 | TXNIP | TXNIP | TXNIP | 2867 | 0.079 | 0.56 | NO |
| 74 | CHUK | CHUK | CHUK | 2910 | 0.078 | 0.56 | NO |
| 75 | TLR10 | TLR10 | TLR10 | 2919 | 0.077 | 0.56 | NO |
| 76 | MAPK3 | MAPK3 | MAPK3 | 2933 | 0.076 | 0.56 | NO |
| 77 | IKBKG | IKBKG | IKBKG | 2970 | 0.074 | 0.56 | NO |
| 78 | RPS6KA1 | RPS6KA1 | RPS6KA1 | 3013 | 0.072 | 0.56 | NO |
| 79 | ZBP1 | ZBP1 | ZBP1 | 3067 | 0.071 | 0.56 | NO |
| 80 | PANX1 | PANX1 | PANX1 | 3089 | 0.07 | 0.56 | NO |
| 81 | TNFAIP3 | TNFAIP3 | TNFAIP3 | 3174 | 0.066 | 0.56 | NO |
| 82 | FADD | FADD | FADD | 3265 | 0.063 | 0.56 | NO |
| 83 | TBK1 | TBK1 | TBK1 | 3306 | 0.062 | 0.56 | NO |
| 84 | IRAK4 | IRAK4 | IRAK4 | 3430 | 0.058 | 0.55 | NO |
| 85 | TMEM189-UBE2V1 | TMEM189-UBE2V1 | TMEM189-UBE2V1 | 3481 | 0.056 | 0.55 | NO |
| 86 | MAPKAPK2 | MAPKAPK2 | MAPKAPK2 | 3527 | 0.054 | 0.55 | NO |
| 87 | PPP2CA | PPP2CA | PPP2CA | 3533 | 0.054 | 0.55 | NO |
| 88 | MAP3K1 | MAP3K1 | MAP3K1 | 3562 | 0.052 | 0.55 | NO |
| 89 | TRAF3 | TRAF3 | TRAF3 | 3575 | 0.052 | 0.55 | NO |
| 90 | IRAK1 | IRAK1 | IRAK1 | 3643 | 0.05 | 0.55 | NO |
| 91 | JUN | JUN | JUN | 3719 | 0.048 | 0.55 | NO |
| 92 | IRF7 | IRF7 | IRF7 | 3829 | 0.045 | 0.54 | NO |
| 93 | TRIM25 | TRIM25 | TRIM25 | 3872 | 0.043 | 0.54 | NO |
| 94 | MAPK14 | MAPK14 | MAPK14 | 3883 | 0.043 | 0.54 | NO |
| 95 | MAPK1 | MAPK1 | MAPK1 | 3962 | 0.041 | 0.54 | NO |
| 96 | ATF1 | ATF1 | ATF1 | 3964 | 0.041 | 0.54 | NO |
| 97 | HERC5 | HERC5 | HERC5 | 4120 | 0.037 | 0.53 | NO |
| 98 | DUSP3 | DUSP3 | DUSP3 | 4256 | 0.033 | 0.52 | NO |
| 99 | ISG15 | ISG15 | ISG15 | 4259 | 0.033 | 0.52 | NO |
| 100 | IRF1 | IRF1 | IRF1 | 4276 | 0.033 | 0.52 | NO |
| 101 | CD46 | CD46 | CD46 | 4286 | 0.032 | 0.52 | NO |
| 102 | TAX1BP1 | TAX1BP1 | TAX1BP1 | 4399 | 0.03 | 0.52 | NO |
| 103 | UBE2N | UBE2N | UBE2N | 4444 | 0.028 | 0.52 | NO |
| 104 | RPS6KA3 | RPS6KA3 | RPS6KA3 | 4467 | 0.028 | 0.52 | NO |
| 105 | ATG5 | ATG5 | ATG5 | 4561 | 0.026 | 0.51 | NO |
| 106 | MAP2K4 | MAP2K4 | MAP2K4 | 4595 | 0.025 | 0.51 | NO |
| 107 | RIPK2 | RIPK2 | RIPK2 | 4619 | 0.025 | 0.51 | NO |
| 108 | CASP10 | CASP10 | CASP10 | 4628 | 0.025 | 0.51 | NO |
| 109 | DAK | DAK | DAK | 4650 | 0.024 | 0.51 | NO |
| 110 | BIRC2 | BIRC2 | BIRC2 | 4666 | 0.024 | 0.51 | NO |
| 111 | BTK | BTK | BTK | 4725 | 0.022 | 0.51 | NO |
| 112 | NFKBIB | NFKBIB | NFKBIB | 4784 | 0.021 | 0.5 | NO |
| 113 | UBE2D3 | UBE2D3 | UBE2D3 | 4844 | 0.02 | 0.5 | NO |
| 114 | CREBBP | CREBBP | CREBBP | 4926 | 0.018 | 0.5 | NO |
| 115 | MAPK9 | MAPK9 | MAPK9 | 5022 | 0.016 | 0.49 | NO |
| 116 | EP300 | EP300 | EP300 | 5126 | 0.014 | 0.48 | NO |
| 117 | CASP9 | CASP9 | CASP9 | 5131 | 0.014 | 0.48 | NO |
| 118 | MAPKAPK3 | MAPKAPK3 | MAPKAPK3 | 5165 | 0.013 | 0.48 | NO |
| 119 | NLRC5 | NLRC5 | NLRC5 | 5188 | 0.013 | 0.48 | NO |
| 120 | DNM2 | DNM2 | DNM2 | 5193 | 0.013 | 0.48 | NO |
| 121 | RPS6KA5 | RPS6KA5 | RPS6KA5 | 5244 | 0.012 | 0.48 | NO |
| 122 | PPP2CB | PPP2CB | PPP2CB | 5384 | 0.0088 | 0.47 | NO |
| 123 | DDOST | DDOST | DDOST | 5391 | 0.0087 | 0.47 | NO |
| 124 | ATG12 | ATG12 | ATG12 | 5452 | 0.0076 | 0.47 | NO |
| 125 | DEFA1B | DEFA1B | DEFA1B | 5496 | 0.0067 | 0.47 | NO |
| 126 | IKBKE | IKBKE | IKBKE | 5516 | 0.0063 | 0.47 | NO |
| 127 | UBE2D2 | UBE2D2 | UBE2D2 | 5579 | 0.0049 | 0.46 | NO |
| 128 | MAP2K2 | MAP2K2 | MAP2K2 | 5602 | 0.0045 | 0.46 | NO |
| 129 | HSP90B1 | HSP90B1 | HSP90B1 | 5658 | 0.0033 | 0.46 | NO |
| 130 | DDX58 | DDX58 | DDX58 | 5685 | 0.0028 | 0.46 | NO |
| 131 | CASP4 | CASP4 | CASP4 | 5765 | 0.0015 | 0.45 | NO |
| 132 | CDK1 | CDK1 | CDK1 | 5829 | 0.00029 | 0.45 | NO |
| 133 | MEF2A | MEF2A | MEF2A | 5888 | -0.0011 | 0.44 | NO |
| 134 | PLCG2 | PLCG2 | PLCG2 | 5915 | -0.0015 | 0.44 | NO |
| 135 | NLRX1 | NLRX1 | NLRX1 | 5958 | -0.0022 | 0.44 | NO |
| 136 | RELA | RELA | RELA | 6026 | -0.0035 | 0.44 | NO |
| 137 | PPP2R1A | PPP2R1A | PPP2R1A | 6098 | -0.0048 | 0.43 | NO |
| 138 | C4BPB | C4BPB | C4BPB | 6283 | -0.0079 | 0.42 | NO |
| 139 | UBE2K | UBE2K | UBE2K | 6422 | -0.011 | 0.42 | NO |
| 140 | UBA52 | UBA52 | UBA52 | 6462 | -0.012 | 0.41 | NO |
| 141 | DHX58 | DHX58 | DHX58 | 6490 | -0.012 | 0.41 | NO |
| 142 | PPP2R1B | PPP2R1B | PPP2R1B | 6548 | -0.013 | 0.41 | NO |
| 143 | PIK3R4 | PIK3R4 | PIK3R4 | 6617 | -0.014 | 0.4 | NO |
| 144 | PCBP2 | PCBP2 | PCBP2 | 6622 | -0.014 | 0.4 | NO |
| 145 | MAPK10 | MAPK10 | MAPK10 | 6625 | -0.014 | 0.4 | NO |
| 146 | RIPK1 | RIPK1 | RIPK1 | 6771 | -0.017 | 0.4 | NO |
| 147 | IRF3 | IRF3 | IRF3 | 7002 | -0.021 | 0.38 | NO |
| 148 | PPP2R5D | PPP2R5D | PPP2R5D | 7028 | -0.022 | 0.38 | NO |
| 149 | TAB2 | TAB2 | TAB2 | 7098 | -0.023 | 0.38 | NO |
| 150 | CASP8 | CASP8 | CASP8 | 7222 | -0.025 | 0.37 | NO |
| 151 | IKBKB | IKBKB | IKBKB | 7288 | -0.026 | 0.37 | NO |
| 152 | ECSIT | ECSIT | ECSIT | 7296 | -0.026 | 0.37 | NO |
| 153 | MAP3K7 | MAP3K7 | MAP3K7 | 7426 | -0.028 | 0.36 | NO |
| 154 | CYLD | CYLD | CYLD | 7531 | -0.03 | 0.36 | NO |
| 155 | CREB1 | CREB1 | CREB1 | 7723 | -0.033 | 0.35 | NO |
| 156 | UBA7 | UBA7 | UBA7 | 7772 | -0.034 | 0.35 | NO |
| 157 | PRKCSH | PRKCSH | PRKCSH | 7822 | -0.035 | 0.34 | NO |
| 158 | MAP2K7 | MAP2K7 | MAP2K7 | 7853 | -0.035 | 0.34 | NO |
| 159 | ELK1 | ELK1 | ELK1 | 7912 | -0.036 | 0.34 | NO |
| 160 | MAVS | MAVS | MAVS | 7974 | -0.038 | 0.34 | NO |
| 161 | HMGB1 | HMGB1 | HMGB1 | 8037 | -0.039 | 0.34 | NO |
| 162 | OTUD5 | OTUD5 | OTUD5 | 8088 | -0.04 | 0.34 | NO |
| 163 | S100B | S100B | S100B | 8093 | -0.04 | 0.34 | NO |
| 164 | CASP2 | CASP2 | CASP2 | 8112 | -0.04 | 0.34 | NO |
| 165 | PIN1 | PIN1 | PIN1 | 8117 | -0.04 | 0.34 | NO |
| 166 | AGER | AGER | AGER | 8162 | -0.041 | 0.34 | NO |
| 167 | IFIH1 | IFIH1 | IFIH1 | 8214 | -0.042 | 0.33 | NO |
| 168 | UBE2L6 | UBE2L6 | UBE2L6 | 8337 | -0.044 | 0.33 | NO |
| 169 | SIKE1 | SIKE1 | SIKE1 | 8391 | -0.045 | 0.33 | NO |
| 170 | ZFYVE20 | ZFYVE20 | ZFYVE20 | 8501 | -0.046 | 0.32 | NO |
| 171 | TRAF6 | TRAF6 | TRAF6 | 8541 | -0.047 | 0.32 | NO |
| 172 | TAB1 | TAB1 | TAB1 | 8543 | -0.047 | 0.32 | NO |
| 173 | TXN | TXN | TXN | 8768 | -0.051 | 0.31 | NO |
| 174 | NOD1 | NOD1 | NOD1 | 8872 | -0.053 | 0.3 | NO |
| 175 | SIGIRR | SIGIRR | SIGIRR | 8907 | -0.053 | 0.3 | NO |
| 176 | TAB3 | TAB3 | TAB3 | 8990 | -0.054 | 0.3 | NO |
| 177 | RPS27A | RPS27A | RPS27A | 9037 | -0.055 | 0.3 | NO |
| 178 | PELI2 | PELI2 | PELI2 | 9054 | -0.056 | 0.3 | NO |
| 179 | ATF2 | ATF2 | ATF2 | 9567 | -0.066 | 0.27 | NO |
| 180 | PIK3C3 | PIK3C3 | PIK3C3 | 9661 | -0.068 | 0.27 | NO |
| 181 | LGMN | LGMN | LGMN | 10111 | -0.076 | 0.25 | NO |
| 182 | HSP90AB1 | HSP90AB1 | HSP90AB1 | 10218 | -0.078 | 0.24 | NO |
| 183 | IRAK2 | IRAK2 | IRAK2 | 10996 | -0.095 | 0.2 | NO |
| 184 | ART1 | ART1 | ART1 | 11130 | -0.099 | 0.19 | NO |
| 185 | C4A | C4A | C4A | 11397 | -0.11 | 0.18 | NO |
| 186 | TLR9 | TLR9 | TLR9 | 11686 | -0.11 | 0.17 | NO |
| 187 | TRAF2 | TRAF2 | TRAF2 | 11789 | -0.12 | 0.16 | NO |
| 188 | CCR6 | CCR6 | CCR6 | 11935 | -0.12 | 0.16 | NO |
| 189 | PROS1 | PROS1 | PROS1 | 12123 | -0.13 | 0.15 | NO |
| 190 | MASP2 | MASP2 | MASP2 | 12471 | -0.14 | 0.14 | NO |
| 191 | C7 | C7 | C7 | 12599 | -0.14 | 0.13 | NO |
| 192 | DUSP4 | DUSP4 | DUSP4 | 12626 | -0.14 | 0.14 | NO |
| 193 | MAPK8 | MAPK8 | MAPK8 | 12703 | -0.15 | 0.14 | NO |
| 194 | RNF125 | RNF125 | RNF125 | 12704 | -0.15 | 0.14 | NO |
| 195 | RPS6KA2 | RPS6KA2 | RPS6KA2 | 13091 | -0.16 | 0.12 | NO |
| 196 | C8G | C8G | C8G | 13288 | -0.17 | 0.12 | NO |
| 197 | BCL2L1 | BCL2L1 | BCL2L1 | 13818 | -0.19 | 0.09 | NO |
| 198 | BCL2 | BCL2 | BCL2 | 14661 | -0.23 | 0.047 | NO |
| 199 | CFI | CFI | CFI | 14719 | -0.24 | 0.051 | NO |
| 200 | IFNA21 | IFNA21 | IFNA21 | 15133 | -0.26 | 0.034 | NO |
| 201 | CFH | CFH | CFH | 15423 | -0.28 | 0.025 | NO |
| 202 | MAPK12 | MAPK12 | MAPK12 | 15521 | -0.29 | 0.028 | NO |
| 203 | APP | APP | APP | 15575 | -0.29 | 0.033 | NO |
| 204 | C1S | C1S | C1S | 15615 | -0.3 | 0.04 | NO |
| 205 | IFNB1 | IFNB1 | IFNB1 | 15680 | -0.3 | 0.045 | NO |
| 206 | LBP | LBP | LBP | 16040 | -0.33 | 0.033 | NO |
| 207 | DNM1 | DNM1 | DNM1 | 16384 | -0.37 | 0.024 | NO |
| 208 | TLR3 | TLR3 | TLR3 | 16390 | -0.37 | 0.034 | NO |
| 209 | MAPK11 | MAPK11 | MAPK11 | 17156 | -0.57 | 0.006 | NO |
Figure S29. Get High-res Image This plot shows mRNAseq_cNMF expression data heatmap (on the left) a RunningEnrichmentScore(RES) plot (on the top right) and a Signal2Noise(S2N) plot (on the bottom right) of genes in the pathway: BIOCARTA TOLL PATHWAY.
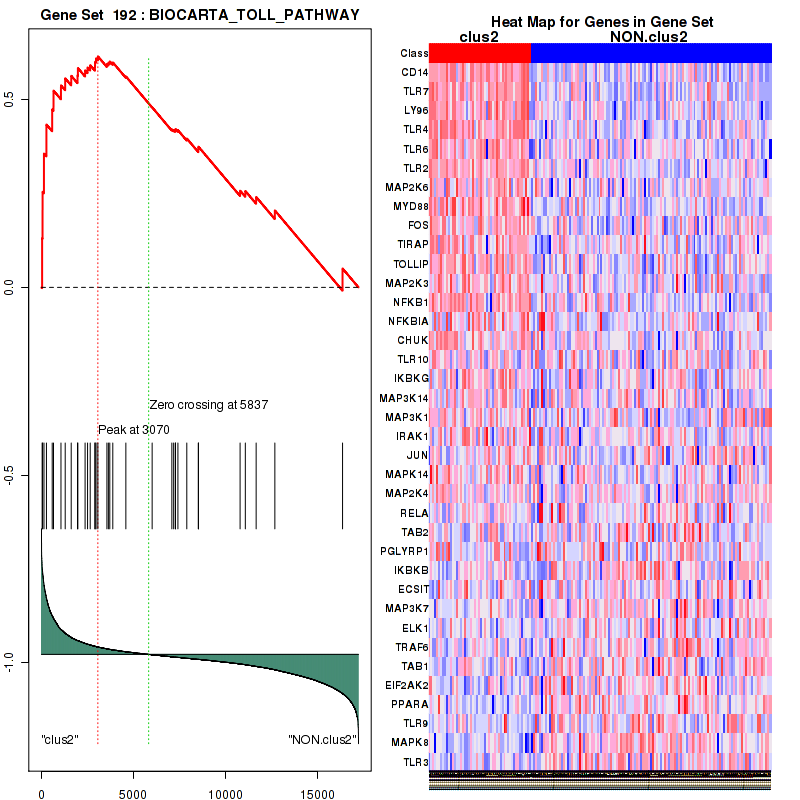
Figure S30. Get High-res Image For the top 5 core enriched genes in the pathway: BIOCARTA TOLL PATHWAY, this volcano plot shows how much they are up/down-regulated and significant. The significance was calculated by empirical bayesian fit
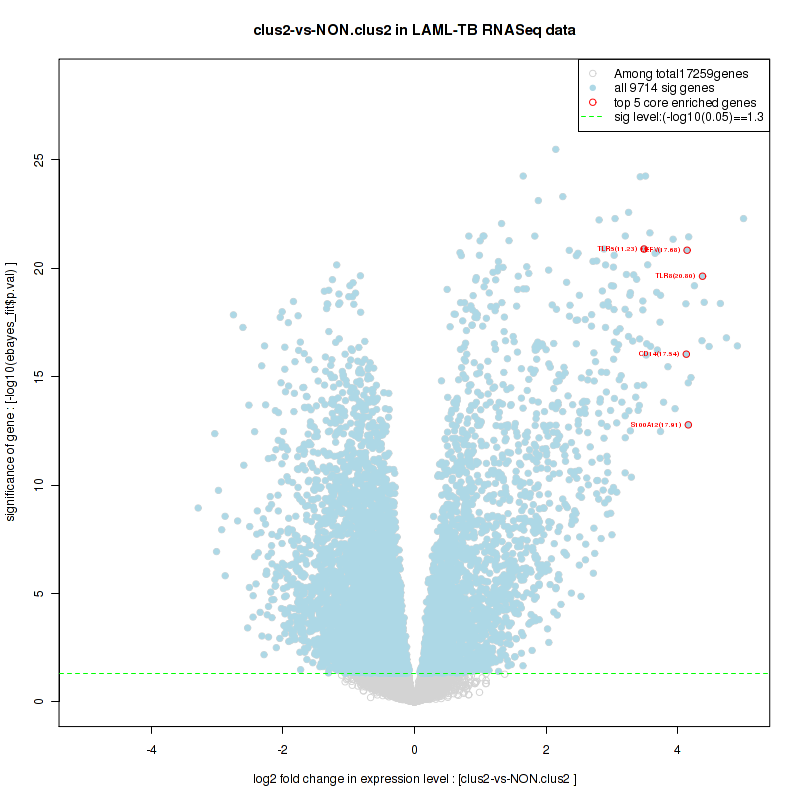
Table S16. Get Full Table This table shows a Running Enrichment Score (RES) of each gene in this pathway, that is, the enrichment score at this point in the ranked list of genes. All genes are ranked by Signal-to-Noise (S2N), a measure of similarity as default and are used to obtain ES matrix of all genes. In this way, GSEA tool uses expression pattern of not only overlapped genes but also not-overlapped genes to produce ES matrix.
| Rank | GENE | SYMBOL | DESC | LIST.LOC | S2N | RES | CORE_ENRICHMENT |
|---|---|---|---|---|---|---|---|
| 1 | TLR8 | TLR8 | TLR8 | 15 | 0.92 | 0.1 | YES |
| 2 | S100A12 | S100A12 | S100A12 | 55 | 0.8 | 0.19 | YES |
| 3 | TLR7 | TLR7 | TLR7 | 60 | 0.79 | 0.27 | YES |
| 4 | NOD2 | NOD2 | NOD2 | 166 | 0.63 | 0.34 | YES |
| 5 | PELI3 | PELI3 | PELI3 | 518 | 0.39 | 0.36 | YES |
| 6 | DUSP6 | DUSP6 | DUSP6 | 702 | 0.33 | 0.38 | YES |
| 7 | MAPK7 | MAPK7 | MAPK7 | 925 | 0.26 | 0.4 | YES |
| 8 | PELI1 | PELI1 | PELI1 | 1031 | 0.24 | 0.42 | YES |
| 9 | MAP2K6 | MAP2K6 | MAP2K6 | 1062 | 0.24 | 0.45 | YES |
| 10 | MAP2K1 | MAP2K1 | MAP2K1 | 1187 | 0.22 | 0.46 | YES |
| 11 | MYD88 | MYD88 | MYD88 | 1291 | 0.2 | 0.48 | YES |
| 12 | FOS | FOS | FOS | 1620 | 0.16 | 0.48 | YES |
| 13 | NFKB2 | NFKB2 | NFKB2 | 1695 | 0.15 | 0.49 | YES |
| 14 | MEF2C | MEF2C | MEF2C | 1850 | 0.14 | 0.5 | YES |
| 15 | MAP2K3 | MAP2K3 | MAP2K3 | 2376 | 0.1 | 0.48 | NO |
| 16 | DUSP7 | DUSP7 | DUSP7 | 2585 | 0.093 | 0.48 | NO |
| 17 | NFKBIA | NFKBIA | NFKBIA | 2653 | 0.09 | 0.48 | NO |
| 18 | CHUK | CHUK | CHUK | 2910 | 0.078 | 0.48 | NO |
| 19 | MAPK3 | MAPK3 | MAPK3 | 2933 | 0.076 | 0.48 | NO |
| 20 | IKBKG | IKBKG | IKBKG | 2970 | 0.074 | 0.49 | NO |
| 21 | RPS6KA1 | RPS6KA1 | RPS6KA1 | 3013 | 0.072 | 0.49 | NO |
| 22 | IRAK4 | IRAK4 | IRAK4 | 3430 | 0.058 | 0.48 | NO |
| 23 | TMEM189-UBE2V1 | TMEM189-UBE2V1 | TMEM189-UBE2V1 | 3481 | 0.056 | 0.48 | NO |
| 24 | MAPKAPK2 | MAPKAPK2 | MAPKAPK2 | 3527 | 0.054 | 0.48 | NO |
| 25 | PPP2CA | PPP2CA | PPP2CA | 3533 | 0.054 | 0.49 | NO |
| 26 | MAP3K1 | MAP3K1 | MAP3K1 | 3562 | 0.052 | 0.49 | NO |
| 27 | IRAK1 | IRAK1 | IRAK1 | 3643 | 0.05 | 0.49 | NO |
| 28 | JUN | JUN | JUN | 3719 | 0.048 | 0.49 | NO |
| 29 | MAPK14 | MAPK14 | MAPK14 | 3883 | 0.043 | 0.49 | NO |
| 30 | MAPK1 | MAPK1 | MAPK1 | 3962 | 0.041 | 0.49 | NO |
| 31 | ATF1 | ATF1 | ATF1 | 3964 | 0.041 | 0.49 | NO |
| 32 | DUSP3 | DUSP3 | DUSP3 | 4256 | 0.033 | 0.48 | NO |
| 33 | UBE2N | UBE2N | UBE2N | 4444 | 0.028 | 0.47 | NO |
| 34 | RPS6KA3 | RPS6KA3 | RPS6KA3 | 4467 | 0.028 | 0.48 | NO |
| 35 | MAP2K4 | MAP2K4 | MAP2K4 | 4595 | 0.025 | 0.47 | NO |
| 36 | RIPK2 | RIPK2 | RIPK2 | 4619 | 0.025 | 0.47 | NO |
| 37 | NFKBIB | NFKBIB | NFKBIB | 4784 | 0.021 | 0.46 | NO |
| 38 | MAPK9 | MAPK9 | MAPK9 | 5022 | 0.016 | 0.45 | NO |
| 39 | MAPKAPK3 | MAPKAPK3 | MAPKAPK3 | 5165 | 0.013 | 0.45 | NO |
| 40 | RPS6KA5 | RPS6KA5 | RPS6KA5 | 5244 | 0.012 | 0.44 | NO |
| 41 | PPP2CB | PPP2CB | PPP2CB | 5384 | 0.0088 | 0.44 | NO |
| 42 | MAP2K2 | MAP2K2 | MAP2K2 | 5602 | 0.0045 | 0.42 | NO |
| 43 | CDK1 | CDK1 | CDK1 | 5829 | 0.00029 | 0.41 | NO |
| 44 | MEF2A | MEF2A | MEF2A | 5888 | -0.0011 | 0.41 | NO |
| 45 | RELA | RELA | RELA | 6026 | -0.0035 | 0.4 | NO |
| 46 | PPP2R1A | PPP2R1A | PPP2R1A | 6098 | -0.0048 | 0.4 | NO |
| 47 | UBA52 | UBA52 | UBA52 | 6462 | -0.012 | 0.38 | NO |
| 48 | PPP2R1B | PPP2R1B | PPP2R1B | 6548 | -0.013 | 0.37 | NO |
| 49 | MAPK10 | MAPK10 | MAPK10 | 6625 | -0.014 | 0.37 | NO |
| 50 | PPP2R5D | PPP2R5D | PPP2R5D | 7028 | -0.022 | 0.35 | NO |
| 51 | TAB2 | TAB2 | TAB2 | 7098 | -0.023 | 0.35 | NO |
| 52 | IKBKB | IKBKB | IKBKB | 7288 | -0.026 | 0.34 | NO |
| 53 | ECSIT | ECSIT | ECSIT | 7296 | -0.026 | 0.34 | NO |
| 54 | MAP3K7 | MAP3K7 | MAP3K7 | 7426 | -0.028 | 0.34 | NO |
| 55 | CREB1 | CREB1 | CREB1 | 7723 | -0.033 | 0.32 | NO |
| 56 | MAP2K7 | MAP2K7 | MAP2K7 | 7853 | -0.035 | 0.32 | NO |
| 57 | ELK1 | ELK1 | ELK1 | 7912 | -0.036 | 0.32 | NO |
| 58 | HMGB1 | HMGB1 | HMGB1 | 8037 | -0.039 | 0.32 | NO |
| 59 | S100B | S100B | S100B | 8093 | -0.04 | 0.32 | NO |
| 60 | AGER | AGER | AGER | 8162 | -0.041 | 0.32 | NO |
| 61 | TRAF6 | TRAF6 | TRAF6 | 8541 | -0.047 | 0.3 | NO |
| 62 | TAB1 | TAB1 | TAB1 | 8543 | -0.047 | 0.31 | NO |
| 63 | NOD1 | NOD1 | NOD1 | 8872 | -0.053 | 0.29 | NO |
| 64 | TAB3 | TAB3 | TAB3 | 8990 | -0.054 | 0.29 | NO |
| 65 | RPS27A | RPS27A | RPS27A | 9037 | -0.055 | 0.3 | NO |
| 66 | PELI2 | PELI2 | PELI2 | 9054 | -0.056 | 0.3 | NO |
| 67 | ATF2 | ATF2 | ATF2 | 9567 | -0.066 | 0.28 | NO |
| 68 | IRAK2 | IRAK2 | IRAK2 | 10996 | -0.095 | 0.21 | NO |
| 69 | TLR9 | TLR9 | TLR9 | 11686 | -0.11 | 0.18 | NO |
| 70 | DUSP4 | DUSP4 | DUSP4 | 12626 | -0.14 | 0.14 | NO |
| 71 | MAPK8 | MAPK8 | MAPK8 | 12703 | -0.15 | 0.15 | NO |
| 72 | RPS6KA2 | RPS6KA2 | RPS6KA2 | 13091 | -0.16 | 0.15 | NO |
| 73 | APP | APP | APP | 15575 | -0.29 | 0.035 | NO |
| 74 | MAPK11 | MAPK11 | MAPK11 | 17156 | -0.57 | 0.006 | NO |
Figure S31. Get High-res Image This plot shows mRNAseq_cNMF expression data heatmap (on the left) a RunningEnrichmentScore(RES) plot (on the top right) and a Signal2Noise(S2N) plot (on the bottom right) of genes in the pathway: ST TUMOR NECROSIS FACTOR PATHWAY.

Figure S32. Get High-res Image For the top 5 core enriched genes in the pathway: ST TUMOR NECROSIS FACTOR PATHWAY, this volcano plot shows how much they are up/down-regulated and significant. The significance was calculated by empirical bayesian fit
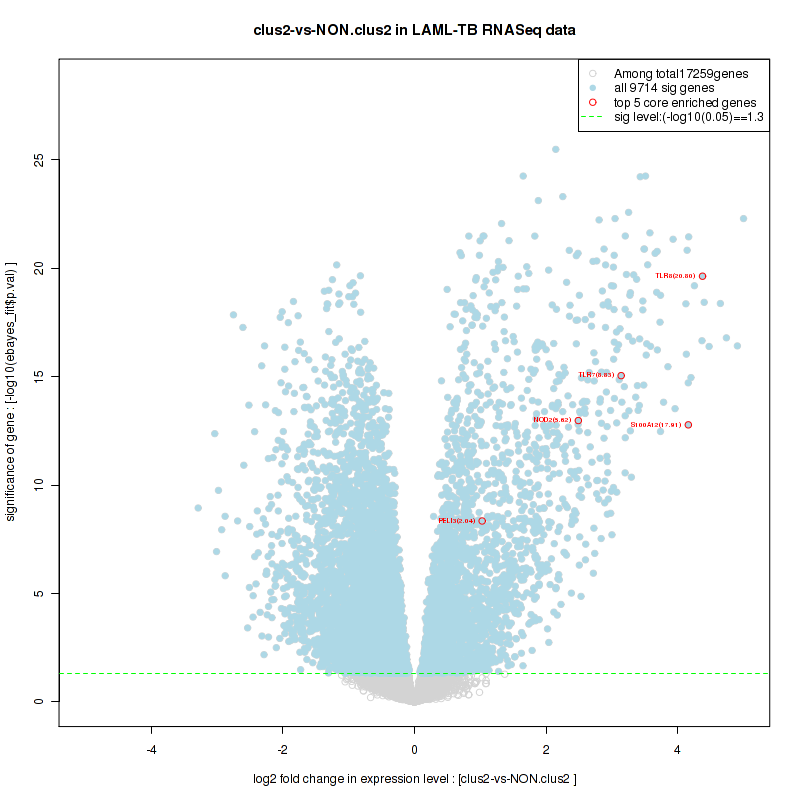
Table S17. Get Full Table This table shows a Running Enrichment Score (RES) of each gene in this pathway, that is, the enrichment score at this point in the ranked list of genes. All genes are ranked by Signal-to-Noise (S2N), a measure of similarity as default and are used to obtain ES matrix of all genes. In this way, GSEA tool uses expression pattern of not only overlapped genes but also not-overlapped genes to produce ES matrix.
| Rank | GENE | SYMBOL | DESC | LIST.LOC | S2N | RES | CORE_ENRICHMENT |
|---|---|---|---|---|---|---|---|
| 1 | SLC11A1 | SLC11A1 | SLC11A1 | 32 | 0.85 | 0.041 | YES |
| 2 | SORT1 | SORT1 | SORT1 | 131 | 0.67 | 0.069 | YES |
| 3 | CTSL1 | CTSL1 | CTSL1 | 205 | 0.59 | 0.095 | YES |
| 4 | CTSH | CTSH | CTSH | 207 | 0.59 | 0.12 | YES |
| 5 | SGSH | SGSH | SGSH | 239 | 0.56 | 0.15 | YES |
| 6 | CTSL2 | CTSL2 | CTSL2 | 291 | 0.52 | 0.18 | YES |
| 7 | CD68 | CD68 | CD68 | 321 | 0.5 | 0.2 | YES |
| 8 | AP1S2 | AP1S2 | AP1S2 | 462 | 0.42 | 0.21 | YES |
| 9 | CTSS | CTSS | CTSS | 499 | 0.4 | 0.23 | YES |
| 10 | IGF2R | IGF2R | IGF2R | 506 | 0.4 | 0.25 | YES |
| 11 | AP1S3 | AP1S3 | AP1S3 | 531 | 0.39 | 0.27 | YES |
| 12 | CTSZ | CTSZ | CTSZ | 601 | 0.36 | 0.28 | YES |
| 13 | ARSG | ARSG | ARSG | 616 | 0.36 | 0.3 | YES |
| 14 | NAGA | NAGA | NAGA | 689 | 0.33 | 0.31 | YES |
| 15 | GAA | GAA | GAA | 731 | 0.32 | 0.32 | YES |
| 16 | HEXB | HEXB | HEXB | 742 | 0.32 | 0.34 | YES |
| 17 | CLTCL1 | CLTCL1 | CLTCL1 | 802 | 0.3 | 0.35 | YES |
| 18 | PSAP | PSAP | PSAP | 894 | 0.28 | 0.36 | YES |
| 19 | CTSB | CTSB | CTSB | 911 | 0.27 | 0.37 | YES |
| 20 | GNS | GNS | GNS | 940 | 0.26 | 0.38 | YES |
| 21 | FUCA1 | FUCA1 | FUCA1 | 969 | 0.25 | 0.4 | YES |
| 22 | ATP6V0D1 | ATP6V0D1 | ATP6V0D1 | 1024 | 0.24 | 0.4 | YES |
| 23 | CTSD | CTSD | CTSD | 1140 | 0.23 | 0.41 | YES |
| 24 | TCIRG1 | TCIRG1 | TCIRG1 | 1181 | 0.22 | 0.42 | YES |
| 25 | NPC2 | NPC2 | NPC2 | 1190 | 0.22 | 0.43 | YES |
| 26 | GM2A | GM2A | GM2A | 1216 | 0.21 | 0.44 | YES |
| 27 | ATP6V0A1 | ATP6V0A1 | ATP6V0A1 | 1327 | 0.2 | 0.44 | YES |
| 28 | MCOLN1 | MCOLN1 | MCOLN1 | 1368 | 0.19 | 0.45 | YES |
| 29 | LIPA | LIPA | LIPA | 1481 | 0.18 | 0.45 | YES |
| 30 | PPT1 | PPT1 | PPT1 | 1586 | 0.17 | 0.45 | YES |
| 31 | LAPTM5 | LAPTM5 | LAPTM5 | 1680 | 0.16 | 0.46 | YES |
| 32 | PLA2G15 | PLA2G15 | PLA2G15 | 1682 | 0.16 | 0.46 | YES |
| 33 | AP1S1 | AP1S1 | AP1S1 | 1782 | 0.15 | 0.46 | YES |
| 34 | SLC17A5 | SLC17A5 | SLC17A5 | 1844 | 0.14 | 0.47 | YES |
| 35 | GBA | GBA | GBA | 1859 | 0.14 | 0.48 | YES |
| 36 | MAN2B1 | MAN2B1 | MAN2B1 | 1861 | 0.14 | 0.48 | YES |
| 37 | ASAH1 | ASAH1 | ASAH1 | 1918 | 0.14 | 0.48 | YES |
| 38 | ARSB | ARSB | ARSB | 1947 | 0.13 | 0.49 | YES |
| 39 | TPP1 | TPP1 | TPP1 | 1955 | 0.13 | 0.5 | YES |
| 40 | GUSB | GUSB | GUSB | 1998 | 0.13 | 0.5 | YES |
| 41 | CD63 | CD63 | CD63 | 2027 | 0.13 | 0.5 | YES |
| 42 | ACP2 | ACP2 | ACP2 | 2049 | 0.13 | 0.51 | YES |
| 43 | GGA2 | GGA2 | GGA2 | 2071 | 0.12 | 0.52 | YES |
| 44 | SMPD1 | SMPD1 | SMPD1 | 2116 | 0.12 | 0.52 | YES |
| 45 | GLB1 | GLB1 | GLB1 | 2122 | 0.12 | 0.52 | YES |
| 46 | ATP6V0B | ATP6V0B | ATP6V0B | 2147 | 0.12 | 0.53 | YES |
| 47 | NAGPA | NAGPA | NAGPA | 2167 | 0.12 | 0.54 | YES |
| 48 | NEU1 | NEU1 | NEU1 | 2189 | 0.12 | 0.54 | YES |
| 49 | ATP6V0C | ATP6V0C | ATP6V0C | 2193 | 0.12 | 0.55 | YES |
| 50 | CTSA | CTSA | CTSA | 2197 | 0.12 | 0.55 | YES |
| 51 | CLTB | CLTB | CLTB | 2355 | 0.11 | 0.55 | YES |
| 52 | CTSO | CTSO | CTSO | 2427 | 0.1 | 0.55 | YES |
| 53 | CTSK | CTSK | CTSK | 2442 | 0.1 | 0.55 | YES |
| 54 | SUMF1 | SUMF1 | SUMF1 | 2744 | 0.086 | 0.54 | NO |
| 55 | CLTA | CLTA | CLTA | 2809 | 0.082 | 0.54 | NO |
| 56 | HYAL1 | HYAL1 | HYAL1 | 2831 | 0.081 | 0.54 | NO |
| 57 | ARSA | ARSA | ARSA | 2837 | 0.081 | 0.55 | NO |
| 58 | GLA | GLA | GLA | 2866 | 0.079 | 0.55 | NO |
| 59 | GALC | GALC | GALC | 2966 | 0.075 | 0.55 | NO |
| 60 | AP1M1 | AP1M1 | AP1M1 | 3119 | 0.068 | 0.54 | NO |
| 61 | AGA | AGA | AGA | 3153 | 0.067 | 0.54 | NO |
| 62 | AP3B1 | AP3B1 | AP3B1 | 3215 | 0.065 | 0.54 | NO |
| 63 | AP3S1 | AP3S1 | AP3S1 | 3317 | 0.061 | 0.54 | NO |
| 64 | M6PR | M6PR | M6PR | 3338 | 0.061 | 0.54 | NO |
| 65 | LAMP1 | LAMP1 | LAMP1 | 3356 | 0.06 | 0.54 | NO |
| 66 | ACP5 | ACP5 | ACP5 | 3402 | 0.059 | 0.54 | NO |
| 67 | CTSG | CTSG | CTSG | 3416 | 0.058 | 0.55 | NO |
| 68 | SCARB2 | SCARB2 | SCARB2 | 3417 | 0.058 | 0.55 | NO |
| 69 | CLN3 | CLN3 | CLN3 | 3458 | 0.056 | 0.55 | NO |
| 70 | GALNS | GALNS | GALNS | 3791 | 0.046 | 0.53 | NO |
| 71 | CLTC | CLTC | CLTC | 3792 | 0.046 | 0.53 | NO |
| 72 | HEXA | HEXA | HEXA | 3817 | 0.045 | 0.54 | NO |
| 73 | MANBA | MANBA | MANBA | 3942 | 0.042 | 0.53 | NO |
| 74 | AP3S2 | AP3S2 | AP3S2 | 3952 | 0.041 | 0.53 | NO |
| 75 | CLN5 | CLN5 | CLN5 | 4050 | 0.039 | 0.53 | NO |
| 76 | NPC1 | NPC1 | NPC1 | 4261 | 0.033 | 0.52 | NO |
| 77 | ATP6AP1 | ATP6AP1 | ATP6AP1 | 4396 | 0.03 | 0.51 | NO |
| 78 | AP3D1 | AP3D1 | AP3D1 | 4411 | 0.029 | 0.51 | NO |
| 79 | GNPTG | GNPTG | GNPTG | 4460 | 0.028 | 0.51 | NO |
| 80 | LAMP2 | LAMP2 | LAMP2 | 4617 | 0.025 | 0.5 | NO |
| 81 | AP4E1 | AP4E1 | AP4E1 | 4770 | 0.022 | 0.5 | NO |
| 82 | AP3M1 | AP3M1 | AP3M1 | 5038 | 0.016 | 0.48 | NO |
| 83 | ATP6V1H | ATP6V1H | ATP6V1H | 5073 | 0.015 | 0.48 | NO |
| 84 | AP1B1 | AP1B1 | AP1B1 | 5152 | 0.014 | 0.48 | NO |
| 85 | ENTPD4 | ENTPD4 | ENTPD4 | 5303 | 0.01 | 0.47 | NO |
| 86 | CTSC | CTSC | CTSC | 5497 | 0.0067 | 0.46 | NO |
| 87 | NAGLU | NAGLU | NAGLU | 5761 | 0.0016 | 0.44 | NO |
| 88 | CTNS | CTNS | CTNS | 5812 | 0.0005 | 0.44 | NO |
| 89 | AP1G1 | AP1G1 | AP1G1 | 5914 | -0.0015 | 0.43 | NO |
| 90 | LAPTM4A | LAPTM4A | LAPTM4A | 6061 | -0.0041 | 0.42 | NO |
| 91 | GGA3 | GGA3 | GGA3 | 6083 | -0.0046 | 0.42 | NO |
| 92 | GGA1 | GGA1 | GGA1 | 6561 | -0.013 | 0.4 | NO |
| 93 | HGSNAT | HGSNAT | HGSNAT | 7469 | -0.029 | 0.34 | NO |
| 94 | AP4M1 | AP4M1 | AP4M1 | 7668 | -0.032 | 0.33 | NO |
| 95 | SLC11A2 | SLC11A2 | SLC11A2 | 7679 | -0.032 | 0.34 | NO |
| 96 | AP4B1 | AP4B1 | AP4B1 | 7819 | -0.035 | 0.33 | NO |
| 97 | GNPTAB | GNPTAB | GNPTAB | 8818 | -0.052 | 0.27 | NO |
| 98 | IDS | IDS | IDS | 9595 | -0.066 | 0.23 | NO |
| 99 | DNASE2 | DNASE2 | DNASE2 | 9617 | -0.067 | 0.23 | NO |
| 100 | CD164 | CD164 | CD164 | 9758 | -0.069 | 0.23 | NO |
| 101 | LGMN | LGMN | LGMN | 10111 | -0.076 | 0.21 | NO |
| 102 | ATP6V0D2 | ATP6V0D2 | ATP6V0D2 | 10596 | -0.086 | 0.19 | NO |
| 103 | AP3B2 | AP3B2 | AP3B2 | 11149 | -0.1 | 0.16 | NO |
| 104 | IDUA | IDUA | IDUA | 11557 | -0.11 | 0.14 | NO |
| 105 | ATP6V0A2 | ATP6V0A2 | ATP6V0A2 | 11852 | -0.12 | 0.13 | NO |
| 106 | AP1M2 | AP1M2 | AP1M2 | 12231 | -0.13 | 0.12 | NO |
| 107 | MFSD8 | MFSD8 | MFSD8 | 12569 | -0.14 | 0.1 | NO |
| 108 | AP4S1 | AP4S1 | AP4S1 | 13620 | -0.18 | 0.051 | NO |
| 109 | AP3M2 | AP3M2 | AP3M2 | 13748 | -0.19 | 0.054 | NO |
| 110 | NAPSA | NAPSA | NAPSA | 14485 | -0.22 | 0.022 | NO |
| 111 | LAMP3 | LAMP3 | LAMP3 | 14832 | -0.24 | 0.014 | NO |
| 112 | CTSW | CTSW | CTSW | 15259 | -0.27 | 0.0027 | NO |
| 113 | ABCA2 | ABCA2 | ABCA2 | 15517 | -0.29 | 0.0023 | NO |
| 114 | ABCB9 | ABCB9 | ABCB9 | 15752 | -0.31 | 0.0041 | NO |
| 115 | PPT2 | PPT2 | PPT2 | 15999 | -0.33 | 0.0064 | NO |
| 116 | CTSE | CTSE | CTSE | 16315 | -0.36 | 0.0063 | NO |
| 117 | LAPTM4B | LAPTM4B | LAPTM4B | 16911 | -0.47 | -0.0048 | NO |
| 118 | CTSF | CTSF | CTSF | 17000 | -0.5 | 0.015 | NO |
Figure S33. Get High-res Image This plot shows mRNAseq_cNMF expression data heatmap (on the left) a RunningEnrichmentScore(RES) plot (on the top right) and a Signal2Noise(S2N) plot (on the bottom right) of genes in the pathway: PID IL1PATHWAY.
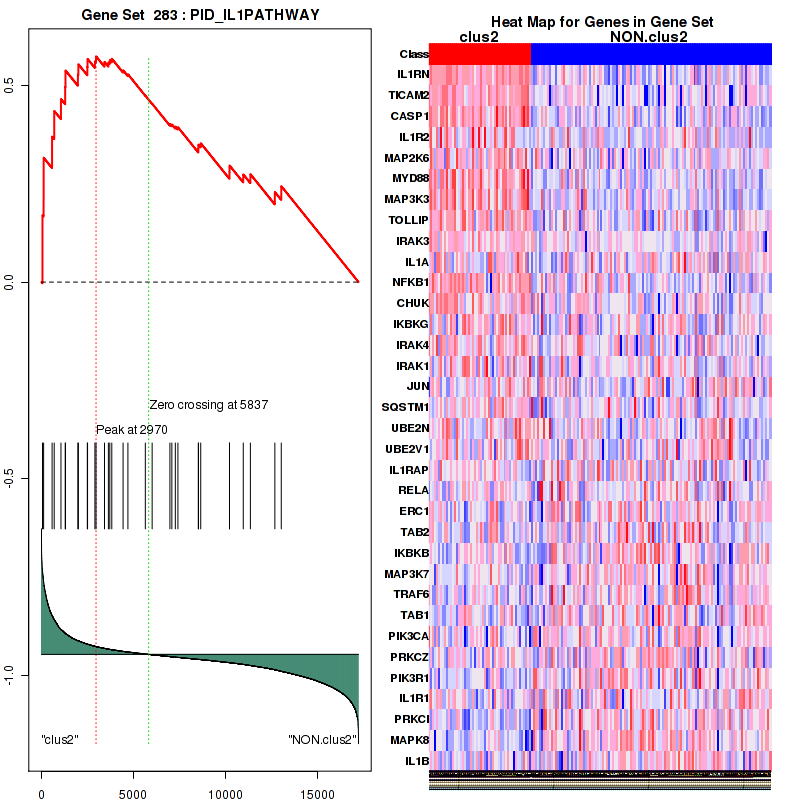
Figure S34. Get High-res Image For the top 5 core enriched genes in the pathway: PID IL1PATHWAY, this volcano plot shows how much they are up/down-regulated and significant. The significance was calculated by empirical bayesian fit
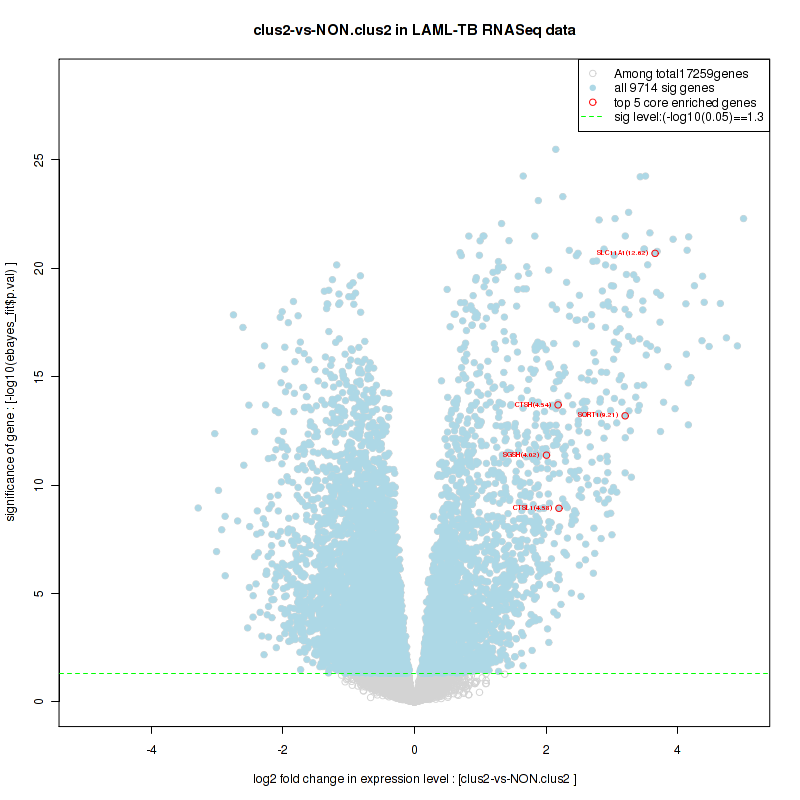
Table S18. Get Full Table This table shows a Running Enrichment Score (RES) of each gene in this pathway, that is, the enrichment score at this point in the ranked list of genes. All genes are ranked by Signal-to-Noise (S2N), a measure of similarity as default and are used to obtain ES matrix of all genes. In this way, GSEA tool uses expression pattern of not only overlapped genes but also not-overlapped genes to produce ES matrix.
| Rank | GENE | SYMBOL | DESC | LIST.LOC | S2N | RES | CORE_ENRICHMENT |
|---|---|---|---|---|---|---|---|
| 1 | TNFRSF1B | TNFRSF1B | TNFRSF1B | 282 | 0.53 | 0.08 | YES |
| 2 | LMNA | LMNA | LMNA | 850 | 0.29 | 0.1 | YES |
| 3 | PRKCD | PRKCD | PRKCD | 906 | 0.27 | 0.15 | YES |
| 4 | TNF | TNF | TNF | 927 | 0.26 | 0.19 | YES |
| 5 | APAF1 | APAF1 | APAF1 | 1530 | 0.17 | 0.19 | YES |
| 6 | GSN | GSN | GSN | 1765 | 0.15 | 0.2 | YES |
| 7 | PTK2 | PTK2 | PTK2 | 1791 | 0.14 | 0.23 | YES |
| 8 | FAS | FAS | FAS | 1961 | 0.13 | 0.24 | YES |
| 9 | MDM2 | MDM2 | MDM2 | 2078 | 0.12 | 0.26 | YES |
| 10 | PSEN2 | PSEN2 | PSEN2 | 2175 | 0.12 | 0.28 | YES |
| 11 | BID | BID | BID | 2320 | 0.11 | 0.29 | YES |
| 12 | PSEN1 | PSEN1 | PSEN1 | 2415 | 0.1 | 0.3 | YES |
| 13 | LMNB1 | LMNB1 | LMNB1 | 2466 | 0.099 | 0.32 | YES |
| 14 | NFKB1 | NFKB1 | NFKB1 | 2508 | 0.097 | 0.33 | YES |
| 15 | NFKBIA | NFKBIA | NFKBIA | 2653 | 0.09 | 0.34 | YES |
| 16 | BIRC3 | BIRC3 | BIRC3 | 2767 | 0.084 | 0.35 | YES |
| 17 | CHUK | CHUK | CHUK | 2910 | 0.078 | 0.35 | YES |
| 18 | ARHGDIB | ARHGDIB | ARHGDIB | 2939 | 0.076 | 0.37 | YES |
| 19 | CFLAR | CFLAR | CFLAR | 2998 | 0.073 | 0.38 | YES |
| 20 | MAP3K14 | MAP3K14 | MAP3K14 | 3070 | 0.07 | 0.38 | YES |
| 21 | RB1 | RB1 | RB1 | 3166 | 0.067 | 0.39 | YES |
| 22 | CYCS | CYCS | CYCS | 3233 | 0.064 | 0.4 | YES |
| 23 | FADD | FADD | FADD | 3265 | 0.063 | 0.41 | YES |
| 24 | PAK2 | PAK2 | PAK2 | 3332 | 0.061 | 0.42 | YES |
| 25 | MAP3K1 | MAP3K1 | MAP3K1 | 3562 | 0.052 | 0.41 | NO |
| 26 | BAG4 | BAG4 | BAG4 | 3667 | 0.049 | 0.42 | NO |
| 27 | ACTG1 | ACTG1 | ACTG1 | 4331 | 0.032 | 0.38 | NO |
| 28 | TRADD | TRADD | TRADD | 4575 | 0.026 | 0.37 | NO |
| 29 | BIRC2 | BIRC2 | BIRC2 | 4666 | 0.024 | 0.37 | NO |
| 30 | CDK11B | CDK11B | CDK11B | 4722 | 0.023 | 0.37 | NO |
| 31 | MAP3K5 | MAP3K5 | MAP3K5 | 4872 | 0.019 | 0.37 | NO |
| 32 | TNFRSF1A | TNFRSF1A | TNFRSF1A | 4873 | 0.019 | 0.37 | NO |
| 33 | CASP7 | CASP7 | CASP7 | 4882 | 0.019 | 0.38 | NO |
| 34 | CASP9 | CASP9 | CASP9 | 5131 | 0.014 | 0.36 | NO |
| 35 | CDK11A | CDK11A | CDK11A | 5140 | 0.014 | 0.37 | NO |
| 36 | XIAP | XIAP | XIAP | 5226 | 0.012 | 0.36 | NO |
| 37 | RASA1 | RASA1 | RASA1 | 5295 | 0.011 | 0.36 | NO |
| 38 | RELA | RELA | RELA | 6026 | -0.0035 | 0.32 | NO |
| 39 | TRAF1 | TRAF1 | TRAF1 | 6461 | -0.011 | 0.3 | NO |
| 40 | DAXX | DAXX | DAXX | 6685 | -0.015 | 0.29 | NO |
| 41 | RIPK1 | RIPK1 | RIPK1 | 6771 | -0.017 | 0.28 | NO |
| 42 | CASP8 | CASP8 | CASP8 | 7222 | -0.025 | 0.26 | NO |
| 43 | MAP2K7 | MAP2K7 | MAP2K7 | 7853 | -0.035 | 0.23 | NO |
| 44 | CASP2 | CASP2 | CASP2 | 8112 | -0.04 | 0.22 | NO |
| 45 | PRKDC | PRKDC | PRKDC | 8621 | -0.049 | 0.2 | NO |
| 46 | LMNB2 | LMNB2 | LMNB2 | 8760 | -0.051 | 0.2 | NO |
| 47 | SPTAN1 | SPTAN1 | SPTAN1 | 9110 | -0.057 | 0.2 | NO |
| 48 | NUMA1 | NUMA1 | NUMA1 | 9665 | -0.068 | 0.18 | NO |
| 49 | PARP1 | PARP1 | PARP1 | 10406 | -0.082 | 0.15 | NO |
| 50 | DFFA | DFFA | DFFA | 10744 | -0.09 | 0.14 | NO |
| 51 | TRAF2 | TRAF2 | TRAF2 | 11789 | -0.12 | 0.1 | NO |
| 52 | CRADD | CRADD | CRADD | 12040 | -0.12 | 0.11 | NO |
| 53 | DFFB | DFFB | DFFB | 12097 | -0.13 | 0.13 | NO |
| 54 | CASP3 | CASP3 | CASP3 | 12426 | -0.14 | 0.14 | NO |
| 55 | MAPK8 | MAPK8 | MAPK8 | 12703 | -0.15 | 0.15 | NO |
| 56 | FASLG | FASLG | FASLG | 12758 | -0.15 | 0.17 | NO |
| 57 | BCL2 | BCL2 | BCL2 | 14661 | -0.23 | 0.11 | NO |
| 58 | CASP6 | CASP6 | CASP6 | 14885 | -0.24 | 0.14 | NO |
Figure S35. Get High-res Image This plot shows mRNAseq_cNMF expression data heatmap (on the left) a RunningEnrichmentScore(RES) plot (on the top right) and a Signal2Noise(S2N) plot (on the bottom right) of genes in the pathway: PID IFNGPATHWAY.
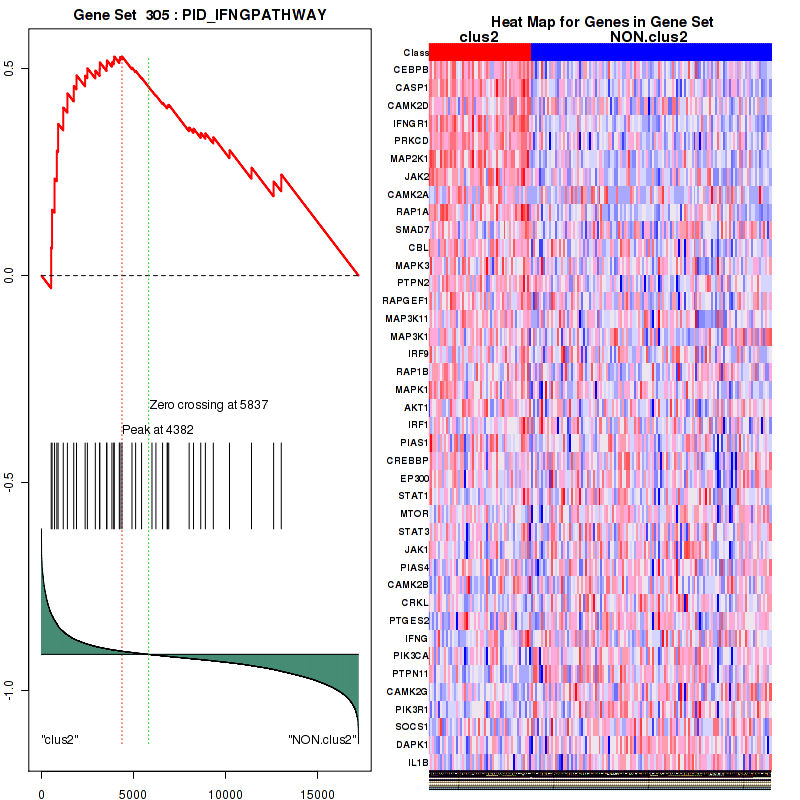
Figure S36. Get High-res Image For the top 5 core enriched genes in the pathway: PID IFNGPATHWAY, this volcano plot shows how much they are up/down-regulated and significant. The significance was calculated by empirical bayesian fit
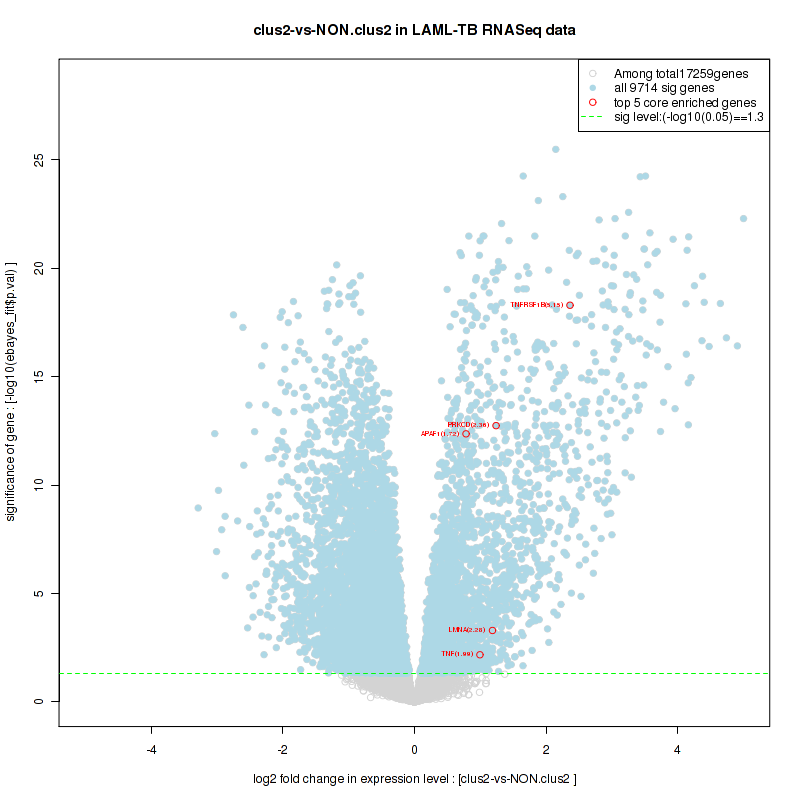
Table S19. Get Full Table This table shows a Running Enrichment Score (RES) of each gene in this pathway, that is, the enrichment score at this point in the ranked list of genes. All genes are ranked by Signal-to-Noise (S2N), a measure of similarity as default and are used to obtain ES matrix of all genes. In this way, GSEA tool uses expression pattern of not only overlapped genes but also not-overlapped genes to produce ES matrix.
| Rank | GENE | SYMBOL | DESC | LIST.LOC | S2N | RES | CORE_ENRICHMENT |
|---|---|---|---|---|---|---|---|
| 1 | CD14 | CD14 | CD14 | 36 | 0.84 | 0.13 | YES |
| 2 | TLR7 | TLR7 | TLR7 | 60 | 0.79 | 0.26 | YES |
| 3 | LY96 | LY96 | LY96 | 135 | 0.67 | 0.36 | YES |
| 4 | TLR4 | TLR4 | TLR4 | 270 | 0.54 | 0.43 | YES |
| 5 | TLR6 | TLR6 | TLR6 | 584 | 0.37 | 0.47 | YES |
| 6 | TLR2 | TLR2 | TLR2 | 656 | 0.34 | 0.52 | YES |
| 7 | MAP2K6 | MAP2K6 | MAP2K6 | 1062 | 0.24 | 0.54 | YES |
| 8 | MYD88 | MYD88 | MYD88 | 1291 | 0.2 | 0.56 | YES |
| 9 | FOS | FOS | FOS | 1620 | 0.16 | 0.56 | YES |
| 10 | TIRAP | TIRAP | TIRAP | 1963 | 0.13 | 0.56 | YES |
| 11 | TOLLIP | TOLLIP | TOLLIP | 1982 | 0.13 | 0.58 | YES |
| 12 | MAP2K3 | MAP2K3 | MAP2K3 | 2376 | 0.1 | 0.58 | YES |
| 13 | NFKB1 | NFKB1 | NFKB1 | 2508 | 0.097 | 0.59 | YES |
| 14 | NFKBIA | NFKBIA | NFKBIA | 2653 | 0.09 | 0.59 | YES |
| 15 | CHUK | CHUK | CHUK | 2910 | 0.078 | 0.59 | YES |
| 16 | TLR10 | TLR10 | TLR10 | 2919 | 0.077 | 0.6 | YES |
| 17 | IKBKG | IKBKG | IKBKG | 2970 | 0.074 | 0.61 | YES |
| 18 | MAP3K14 | MAP3K14 | MAP3K14 | 3070 | 0.07 | 0.62 | YES |
| 19 | MAP3K1 | MAP3K1 | MAP3K1 | 3562 | 0.052 | 0.6 | NO |
| 20 | IRAK1 | IRAK1 | IRAK1 | 3643 | 0.05 | 0.6 | NO |
| 21 | JUN | JUN | JUN | 3719 | 0.048 | 0.6 | NO |
| 22 | MAPK14 | MAPK14 | MAPK14 | 3883 | 0.043 | 0.6 | NO |
| 23 | MAP2K4 | MAP2K4 | MAP2K4 | 4595 | 0.025 | 0.56 | NO |
| 24 | RELA | RELA | RELA | 6026 | -0.0035 | 0.48 | NO |
| 25 | TAB2 | TAB2 | TAB2 | 7098 | -0.023 | 0.42 | NO |
| 26 | PGLYRP1 | PGLYRP1 | PGLYRP1 | 7198 | -0.024 | 0.42 | NO |
| 27 | IKBKB | IKBKB | IKBKB | 7288 | -0.026 | 0.42 | NO |
| 28 | ECSIT | ECSIT | ECSIT | 7296 | -0.026 | 0.42 | NO |
| 29 | MAP3K7 | MAP3K7 | MAP3K7 | 7426 | -0.028 | 0.42 | NO |
| 30 | ELK1 | ELK1 | ELK1 | 7912 | -0.036 | 0.4 | NO |
| 31 | TRAF6 | TRAF6 | TRAF6 | 8541 | -0.047 | 0.37 | NO |
| 32 | TAB1 | TAB1 | TAB1 | 8543 | -0.047 | 0.38 | NO |
| 33 | EIF2AK2 | EIF2AK2 | EIF2AK2 | 10813 | -0.091 | 0.26 | NO |
| 34 | PPARA | PPARA | PPARA | 11097 | -0.098 | 0.26 | NO |
| 35 | TLR9 | TLR9 | TLR9 | 11686 | -0.11 | 0.24 | NO |
| 36 | MAPK8 | MAPK8 | MAPK8 | 12703 | -0.15 | 0.2 | NO |
| 37 | TLR3 | TLR3 | TLR3 | 16390 | -0.37 | 0.05 | NO |
Figure S37. Get High-res Image This plot shows mRNAseq_cNMF expression data heatmap (on the left) a RunningEnrichmentScore(RES) plot (on the top right) and a Signal2Noise(S2N) plot (on the bottom right) of genes in the pathway: PID IL8CXCR2 PATHWAY.
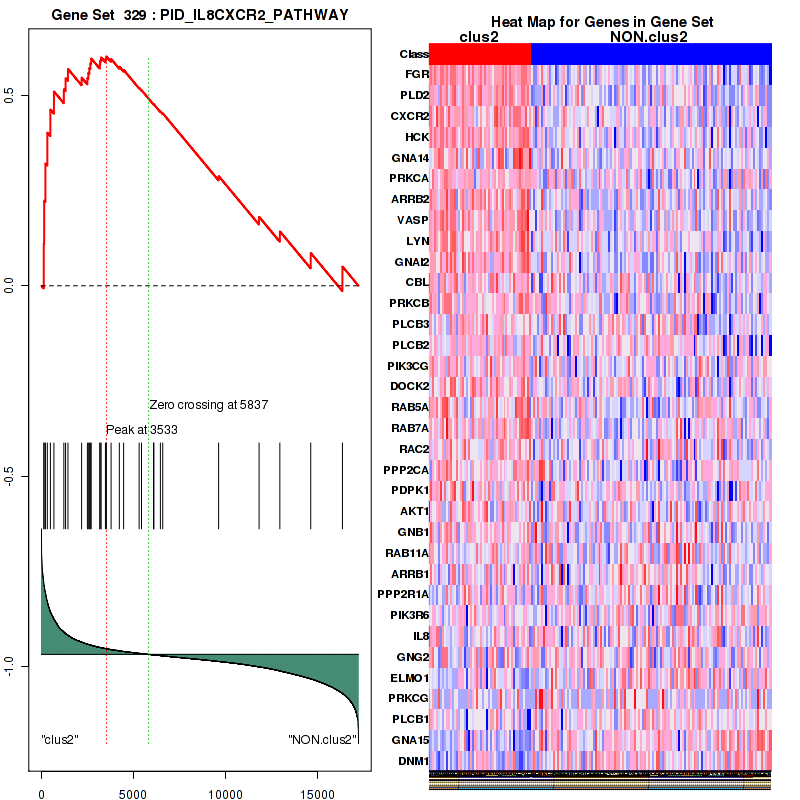
Figure S38. Get High-res Image For the top 5 core enriched genes in the pathway: PID IL8CXCR2 PATHWAY, this volcano plot shows how much they are up/down-regulated and significant. The significance was calculated by empirical bayesian fit
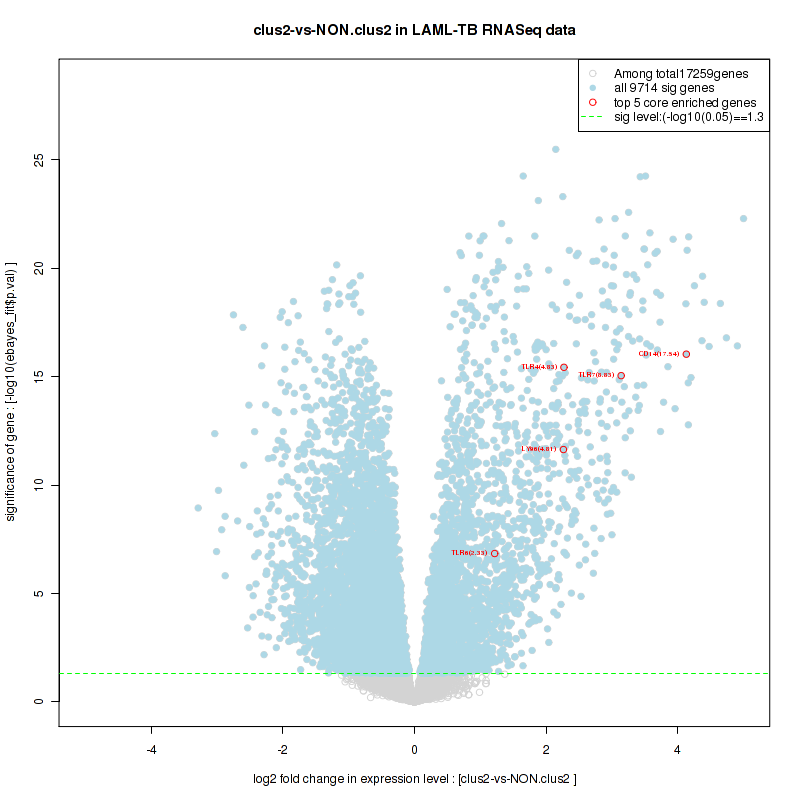
Table S20. Get Full Table This table shows a Running Enrichment Score (RES) of each gene in this pathway, that is, the enrichment score at this point in the ranked list of genes. All genes are ranked by Signal-to-Noise (S2N), a measure of similarity as default and are used to obtain ES matrix of all genes. In this way, GSEA tool uses expression pattern of not only overlapped genes but also not-overlapped genes to produce ES matrix.
| Rank | GENE | SYMBOL | DESC | LIST.LOC | S2N | RES | CORE_ENRICHMENT |
|---|---|---|---|---|---|---|---|
| 1 | IL1RN | IL1RN | IL1RN | 56 | 0.8 | 0.16 | YES |
| 2 | NOD2 | NOD2 | NOD2 | 166 | 0.63 | 0.28 | YES |
| 3 | PELI3 | PELI3 | PELI3 | 518 | 0.39 | 0.34 | YES |
| 4 | IL1R2 | IL1R2 | IL1R2 | 695 | 0.33 | 0.4 | YES |
| 5 | PELI1 | PELI1 | PELI1 | 1031 | 0.24 | 0.42 | YES |
| 6 | MAP2K6 | MAP2K6 | MAP2K6 | 1062 | 0.24 | 0.47 | YES |
| 7 | MAP2K1 | MAP2K1 | MAP2K1 | 1187 | 0.22 | 0.51 | YES |
| 8 | MYD88 | MYD88 | MYD88 | 1291 | 0.2 | 0.54 | YES |
| 9 | MAP3K3 | MAP3K3 | MAP3K3 | 1307 | 0.2 | 0.58 | YES |
| 10 | TOLLIP | TOLLIP | TOLLIP | 1982 | 0.13 | 0.57 | YES |
| 11 | IRAK3 | IRAK3 | IRAK3 | 2010 | 0.13 | 0.59 | YES |
| 12 | IL1A | IL1A | IL1A | 2498 | 0.098 | 0.58 | YES |
| 13 | CHUK | CHUK | CHUK | 2910 | 0.078 | 0.58 | YES |
| 14 | IKBKG | IKBKG | IKBKG | 2970 | 0.074 | 0.59 | YES |
| 15 | IRAK4 | IRAK4 | IRAK4 | 3430 | 0.058 | 0.57 | YES |
| 16 | TMEM189-UBE2V1 | TMEM189-UBE2V1 | TMEM189-UBE2V1 | 3481 | 0.056 | 0.58 | YES |
| 17 | TNIP2 | TNIP2 | TNIP2 | 3516 | 0.054 | 0.59 | YES |
| 18 | IRAK1 | IRAK1 | IRAK1 | 3643 | 0.05 | 0.59 | YES |
| 19 | SQSTM1 | SQSTM1 | SQSTM1 | 3828 | 0.045 | 0.59 | NO |
| 20 | UBE2N | UBE2N | UBE2N | 4444 | 0.028 | 0.56 | NO |
| 21 | MAP2K4 | MAP2K4 | MAP2K4 | 4595 | 0.025 | 0.56 | NO |
| 22 | RIPK2 | RIPK2 | RIPK2 | 4619 | 0.025 | 0.56 | NO |
| 23 | CUL1 | CUL1 | CUL1 | 5409 | 0.0083 | 0.52 | NO |
| 24 | RBX1 | RBX1 | RBX1 | 5641 | 0.0035 | 0.51 | NO |
| 25 | IL1RAP | IL1RAP | IL1RAP | 5654 | 0.0033 | 0.51 | NO |
| 26 | MAP3K8 | MAP3K8 | MAP3K8 | 6162 | -0.006 | 0.48 | NO |
| 27 | SKP1 | SKP1 | SKP1 | 6594 | -0.013 | 0.46 | NO |
| 28 | TAB2 | TAB2 | TAB2 | 7098 | -0.023 | 0.43 | NO |
| 29 | IKBKB | IKBKB | IKBKB | 7288 | -0.026 | 0.42 | NO |
| 30 | MAP3K7 | MAP3K7 | MAP3K7 | 7426 | -0.028 | 0.42 | NO |
| 31 | TRAF6 | TRAF6 | TRAF6 | 8541 | -0.047 | 0.37 | NO |
| 32 | TAB1 | TAB1 | TAB1 | 8543 | -0.047 | 0.38 | NO |
| 33 | NOD1 | NOD1 | NOD1 | 8872 | -0.053 | 0.37 | NO |
| 34 | TAB3 | TAB3 | TAB3 | 8990 | -0.054 | 0.37 | NO |
| 35 | PELI2 | PELI2 | PELI2 | 9054 | -0.056 | 0.38 | NO |
| 36 | IL1R1 | IL1R1 | IL1R1 | 10985 | -0.095 | 0.29 | NO |
| 37 | IRAK2 | IRAK2 | IRAK2 | 10996 | -0.095 | 0.31 | NO |
| 38 | BTRC | BTRC | BTRC | 11931 | -0.12 | 0.28 | NO |
| 39 | IL1B | IL1B | IL1B | 13055 | -0.16 | 0.24 | NO |
Figure S39. Get High-res Image This plot shows mRNAseq_cNMF expression data heatmap (on the left) a RunningEnrichmentScore(RES) plot (on the top right) and a Signal2Noise(S2N) plot (on the bottom right) of genes in the pathway: PID MAPKTRKPATHWAY.
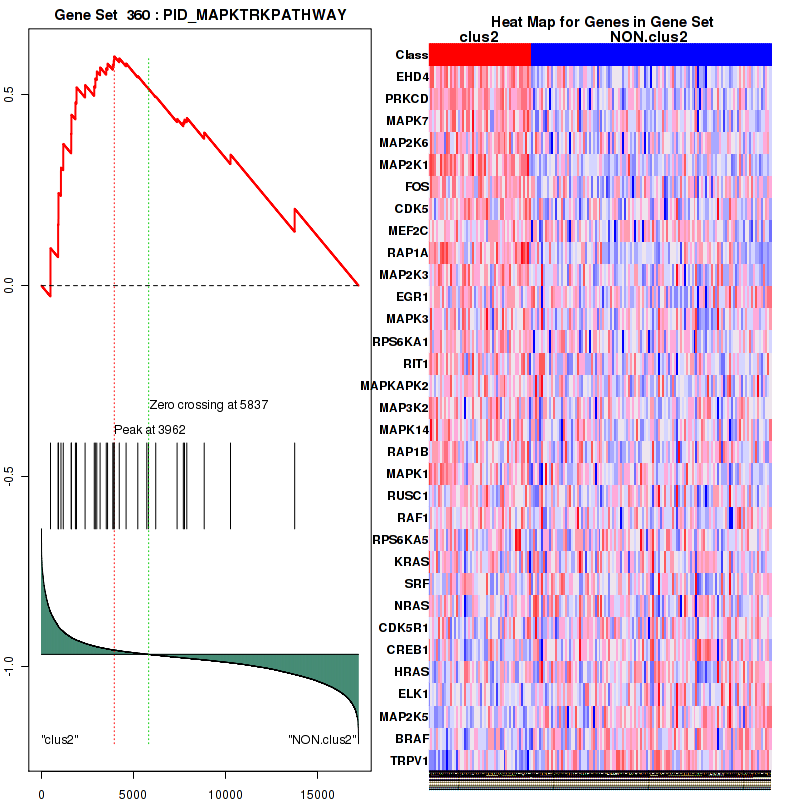
Figure S40. Get High-res Image For the top 5 core enriched genes in the pathway: PID MAPKTRKPATHWAY, this volcano plot shows how much they are up/down-regulated and significant. The significance was calculated by empirical bayesian fit

For the top enriched genes, if you want to check whether they are
-
up-regulated, please check the list of up-regulated genes
-
down-regulated, please check the list of down-regulated genes
For the top enriched genes, if you want to check whether they are
-
highly expressed genes, please check the list of high (top 30%) expressed genes
-
low expressed genes, please check the list of low (bottom 30%) expressed genes
An expression pattern of top(30%)/middle(30%)/low(30%) in this subtype against other subtypes is available in a heatmap
For the top enriched genes, if you want to check whether they are
-
significantly differently expressed genes by eBayes lm fit, please check the list of significant genes
Table 5. Get Full Table This table shows top 10 pathways which are significantly enriched in cluster clus3. It displays only significant gene sets satisfying nom.p.val.threshold (-1), fwer.p.val.threshold (-1) , fdr.q.val.threshold (0.25) and the default table is sorted by Normalized Enrichment Score (NES). Further details on NES statistics, please visit The Broad GSEA website.
| GeneSet(GS) | Size(#genes) | genes.ES.table | ES | NES | NOM.p.val | FDR.q.val | FWER.p.val | Tag.. | Gene.. | Signal | FDR..median. | glob.p.val |
|---|---|---|---|---|---|---|---|---|---|---|---|---|
| KEGG GLYCOSYLPHOSPHATIDYLINOSITOL GPI ANCHOR BIOSYNTHESIS | 25 | genes.ES.table | 0.54 | 1.8 | 0.0076 | 0.3 | 0.47 | 0.64 | 0.37 | 0.4 | 0 | 0.068 |
| KEGG AMINOACYL TRNA BIOSYNTHESIS | 41 | genes.ES.table | 0.36 | 1.2 | 0.26 | 1 | 1 | 0.51 | 0.36 | 0.33 | 0.89 | 0.43 |
| KEGG RIBOSOME | 85 | genes.ES.table | 0.54 | 1.4 | 0.21 | 1 | 0.98 | 0.89 | 0.4 | 0.54 | 0.89 | 0.44 |
| KEGG RNA POLYMERASE | 29 | genes.ES.table | 0.5 | 1.7 | 0.035 | 0.6 | 0.77 | 0.69 | 0.41 | 0.41 | 0.25 | 0.17 |
| PID MYC PATHWAY | 25 | genes.ES.table | 0.5 | 1.9 | 0.0019 | 0.36 | 0.33 | 0.48 | 0.31 | 0.33 | 0 | 0.075 |
| REACTOME TRANSLATION | 146 | genes.ES.table | 0.41 | 1.4 | 0.25 | 1 | 0.98 | 0.62 | 0.39 | 0.38 | 0.82 | 0.4 |
| REACTOME FORMATION OF THE TERNARY COMPLEX AND SUBSEQUENTLY THE 43S COMPLEX | 49 | genes.ES.table | 0.4 | 1.2 | 0.34 | 1 | 1 | 0.71 | 0.41 | 0.42 | 0.99 | 0.49 |
| REACTOME SRP DEPENDENT COTRANSLATIONAL PROTEIN TARGETING TO MEMBRANE | 109 | genes.ES.table | 0.44 | 1.3 | 0.27 | 1 | 0.99 | 0.73 | 0.39 | 0.45 | 0.79 | 0.38 |
| REACTOME ACTIVATION OF THE MRNA UPON BINDING OF THE CAP BINDING COMPLEX AND EIFS AND SUBSEQUENT BINDING TO 43S | 57 | genes.ES.table | 0.4 | 1.2 | 0.32 | 0.99 | 1 | 0.67 | 0.41 | 0.4 | 0.84 | 0.39 |
| REACTOME PEPTIDE CHAIN ELONGATION | 85 | genes.ES.table | 0.49 | 1.3 | 0.26 | 0.97 | 0.99 | 0.88 | 0.39 | 0.54 | 0.76 | 0.36 |
Table S21. Get Full Table This table shows a Running Enrichment Score (RES) of each gene in this pathway, that is, the enrichment score at this point in the ranked list of genes. All genes are ranked by Signal-to-Noise (S2N), a measure of similarity as default and are used to obtain ES matrix of all genes. In this way, GSEA tool uses expression pattern of not only overlapped genes but also not-overlapped genes to produce ES matrix.
| Rank | GENE | SYMBOL | DESC | LIST.LOC | S2N | RES | CORE_ENRICHMENT |
|---|---|---|---|---|---|---|---|
| 1 | KAT2A | KAT2A | KAT2A | 1829 | 0.14 | 0.02 | YES |
| 2 | SUPT3H | SUPT3H | SUPT3H | 2229 | 0.12 | 0.1 | YES |
| 3 | MYC | MYC | MYC | 2347 | 0.12 | 0.2 | YES |
| 4 | RUVBL2 | RUVBL2 | RUVBL2 | 3226 | 0.085 | 0.23 | YES |
| 5 | RUVBL1 | RUVBL1 | RUVBL1 | 3821 | 0.07 | 0.25 | YES |
| 6 | CDKN2A | CDKN2A | CDKN2A | 3831 | 0.07 | 0.31 | YES |
| 7 | PIN1 | PIN1 | PIN1 | 3923 | 0.067 | 0.37 | YES |
| 8 | PML | PML | PML | 4520 | 0.055 | 0.38 | YES |
| 9 | SUPT7L | SUPT7L | SUPT7L | 4705 | 0.052 | 0.42 | YES |
| 10 | ZBTB17 | ZBTB17 | ZBTB17 | 4717 | 0.052 | 0.46 | YES |
| 11 | MAX | MAX | MAX | 5246 | 0.043 | 0.47 | YES |
| 12 | TAF9 | TAF9 | TAF9 | 5330 | 0.041 | 0.5 | YES |
| 13 | TAF12 | TAF12 | TAF12 | 7198 | 0.018 | 0.41 | NO |
| 14 | AXIN1 | AXIN1 | AXIN1 | 7426 | 0.014 | 0.41 | NO |
| 15 | ACTL6A | ACTL6A | ACTL6A | 8467 | 0.002 | 0.35 | NO |
| 16 | PPP2CA | PPP2CA | PPP2CA | 8501 | 0.0016 | 0.35 | NO |
| 17 | SKP2 | SKP2 | SKP2 | 8715 | -0.0011 | 0.34 | NO |
| 18 | TAF10 | TAF10 | TAF10 | 8824 | -0.0024 | 0.34 | NO |
| 19 | KAT5 | KAT5 | KAT5 | 8891 | -0.0031 | 0.33 | NO |
| 20 | HBP1 | HBP1 | HBP1 | 9076 | -0.0053 | 0.33 | NO |
| 21 | GSK3B | GSK3B | GSK3B | 9919 | -0.016 | 0.29 | NO |
| 22 | TRRAP | TRRAP | TRRAP | 10202 | -0.02 | 0.3 | NO |
| 23 | PAK2 | PAK2 | PAK2 | 11101 | -0.034 | 0.27 | NO |
| 24 | PPP2R5A | PPP2R5A | PPP2R5A | 11244 | -0.036 | 0.3 | NO |
| 25 | FBXW7 | FBXW7 | FBXW7 | 12239 | -0.059 | 0.29 | NO |
Figure S41. Get High-res Image This plot shows mRNAseq_cNMF expression data heatmap (on the left) a RunningEnrichmentScore(RES) plot (on the top right) and a Signal2Noise(S2N) plot (on the bottom right) of genes in the pathway: KEGG GLYCOSYLPHOSPHATIDYLINOSITOL GPI ANCHOR BIOSYNTHESIS.
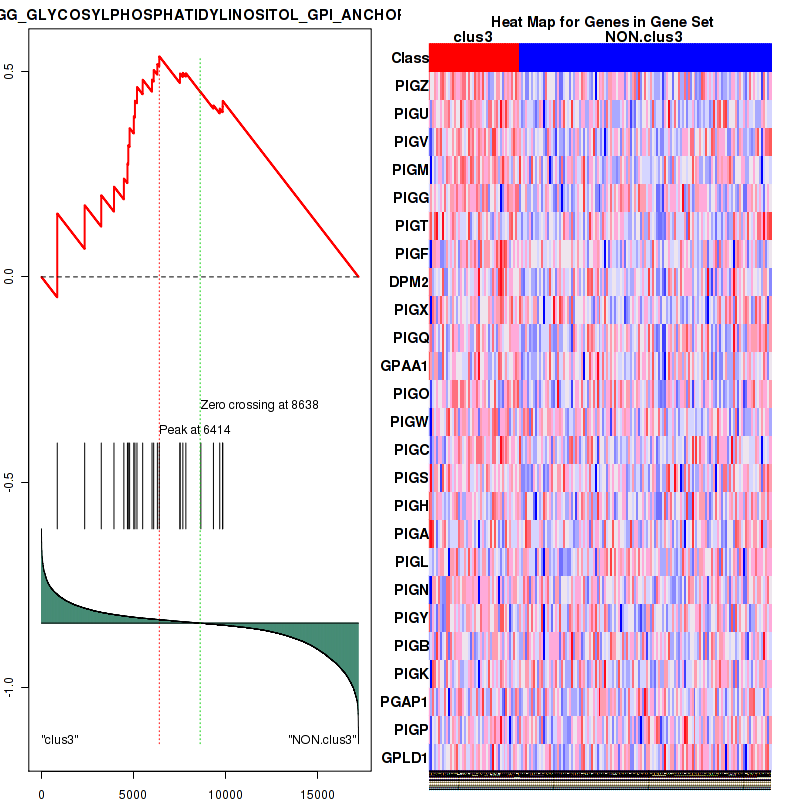
Figure S42. Get High-res Image For the top 5 core enriched genes in the pathway: KEGG GLYCOSYLPHOSPHATIDYLINOSITOL GPI ANCHOR BIOSYNTHESIS, this volcano plot shows how much they are up/down-regulated and significant. The significance was calculated by empirical bayesian fit

Table S22. Get Full Table This table shows a Running Enrichment Score (RES) of each gene in this pathway, that is, the enrichment score at this point in the ranked list of genes. All genes are ranked by Signal-to-Noise (S2N), a measure of similarity as default and are used to obtain ES matrix of all genes. In this way, GSEA tool uses expression pattern of not only overlapped genes but also not-overlapped genes to produce ES matrix.
| Rank | GENE | SYMBOL | DESC | LIST.LOC | S2N | RES | CORE_ENRICHMENT |
|---|---|---|---|---|---|---|---|
| 1 | PIGZ | PIGZ | PIGZ | 860 | 0.22 | 0.16 | YES |
| 2 | PIGU | PIGU | PIGU | 2351 | 0.12 | 0.18 | YES |
| 3 | PIGV | PIGV | PIGV | 3255 | 0.084 | 0.2 | YES |
| 4 | PIGM | PIGM | PIGM | 3948 | 0.067 | 0.22 | YES |
| 5 | PIGG | PIGG | PIGG | 4486 | 0.056 | 0.24 | YES |
| 6 | PIGT | PIGT | PIGT | 4681 | 0.052 | 0.28 | YES |
| 7 | PIGF | PIGF | PIGF | 4726 | 0.052 | 0.32 | YES |
| 8 | DPM2 | DPM2 | DPM2 | 4798 | 0.05 | 0.36 | YES |
| 9 | PIGX | PIGX | PIGX | 5027 | 0.046 | 0.39 | YES |
| 10 | PIGQ | PIGQ | PIGQ | 5088 | 0.045 | 0.43 | YES |
| 11 | GPAA1 | GPAA1 | GPAA1 | 5200 | 0.043 | 0.46 | YES |
| 12 | PIGO | PIGO | PIGO | 5510 | 0.039 | 0.48 | YES |
| 13 | PIGW | PIGW | PIGW | 6018 | 0.032 | 0.48 | YES |
| 14 | PIGC | PIGC | PIGC | 6109 | 0.031 | 0.5 | YES |
| 15 | PIGS | PIGS | PIGS | 6309 | 0.028 | 0.52 | YES |
| 16 | PIGH | PIGH | PIGH | 6414 | 0.027 | 0.54 | YES |
| 17 | PIGA | PIGA | PIGA | 7540 | 0.013 | 0.48 | NO |
| 18 | PIGL | PIGL | PIGL | 7544 | 0.013 | 0.5 | NO |
| 19 | PIGN | PIGN | PIGN | 7696 | 0.011 | 0.5 | NO |
| 20 | PIGY | PIGY | PIGY | 7860 | 0.0093 | 0.5 | NO |
| 21 | PIGB | PIGB | PIGB | 8676 | -0.00063 | 0.45 | NO |
| 22 | PIGK | PIGK | PIGK | 9363 | -0.0088 | 0.42 | NO |
| 23 | PGAP1 | PGAP1 | PGAP1 | 9704 | -0.013 | 0.41 | NO |
| 24 | PIGP | PIGP | PIGP | 9863 | -0.015 | 0.42 | NO |
| 25 | GPLD1 | GPLD1 | GPLD1 | 9865 | -0.015 | 0.43 | NO |
Figure S43. Get High-res Image This plot shows mRNAseq_cNMF expression data heatmap (on the left) a RunningEnrichmentScore(RES) plot (on the top right) and a Signal2Noise(S2N) plot (on the bottom right) of genes in the pathway: KEGG AMINOACYL TRNA BIOSYNTHESIS.
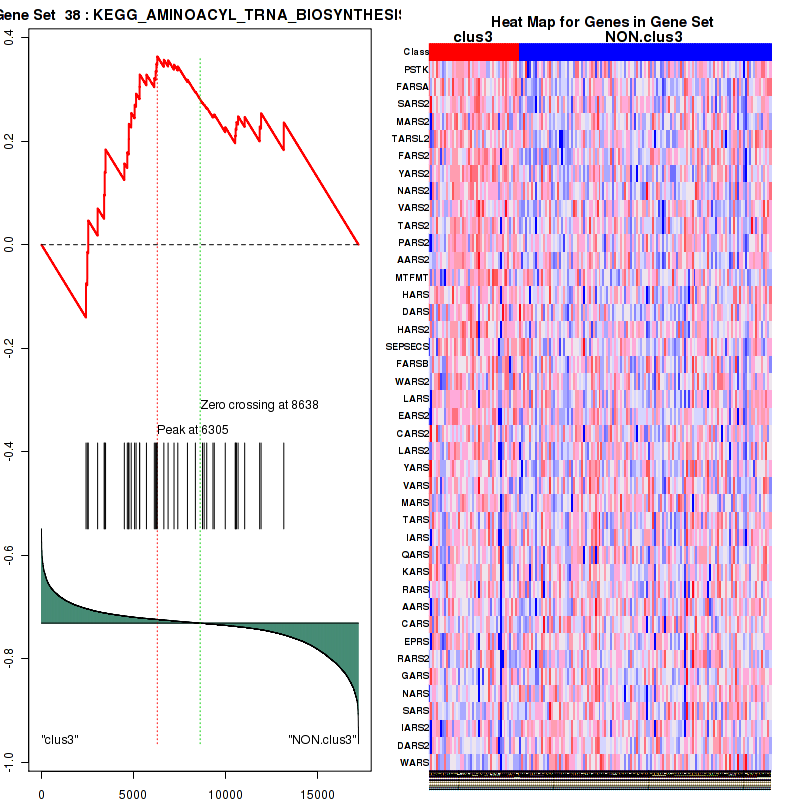
Figure S44. Get High-res Image For the top 5 core enriched genes in the pathway: KEGG AMINOACYL TRNA BIOSYNTHESIS, this volcano plot shows how much they are up/down-regulated and significant. The significance was calculated by empirical bayesian fit
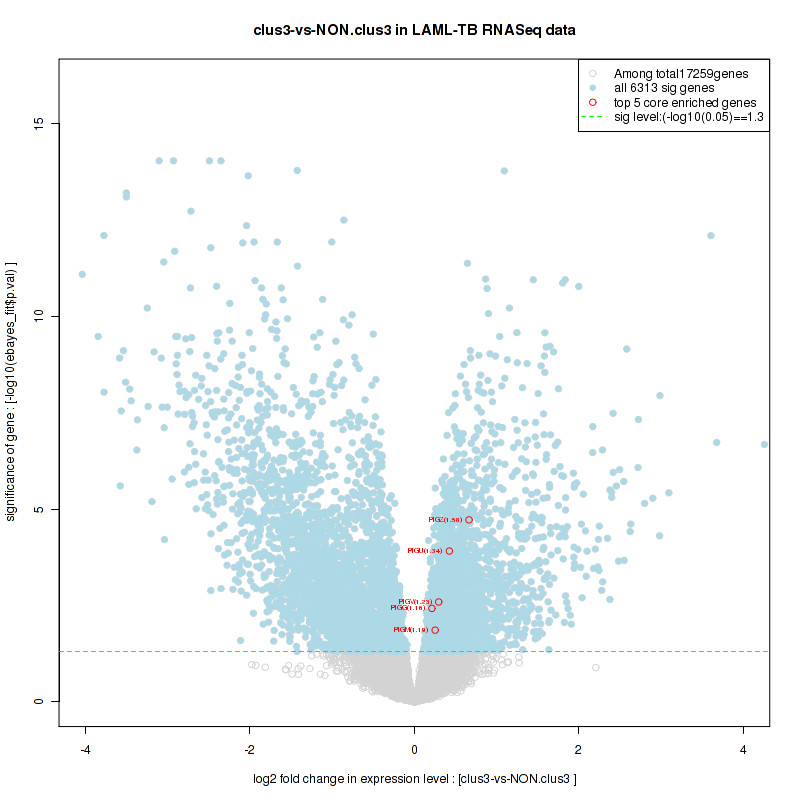
Table S23. Get Full Table This table shows a Running Enrichment Score (RES) of each gene in this pathway, that is, the enrichment score at this point in the ranked list of genes. All genes are ranked by Signal-to-Noise (S2N), a measure of similarity as default and are used to obtain ES matrix of all genes. In this way, GSEA tool uses expression pattern of not only overlapped genes but also not-overlapped genes to produce ES matrix.
| Rank | GENE | SYMBOL | DESC | LIST.LOC | S2N | RES | CORE_ENRICHMENT |
|---|---|---|---|---|---|---|---|
| 1 | POLR3G | POLR3G | POLR3G | 1925 | 0.14 | -0.01 | YES |
| 2 | POLR2H | POLR2H | POLR2H | 1990 | 0.13 | 0.086 | YES |
| 3 | POLR1C | POLR1C | POLR1C | 2057 | 0.13 | 0.18 | YES |
| 4 | POLR2I | POLR2I | POLR2I | 2124 | 0.13 | 0.27 | YES |
| 5 | ZNRD1 | ZNRD1 | ZNRD1 | 2336 | 0.12 | 0.34 | YES |
| 6 | POLR2F | POLR2F | POLR2F | 3781 | 0.071 | 0.31 | YES |
| 7 | POLR2J3 | POLR2J3 | POLR2J3 | 3790 | 0.07 | 0.37 | YES |
| 8 | POLR2J2 | POLR2J2 | POLR2J2 | 4082 | 0.064 | 0.4 | YES |
| 9 | POLR3H | POLR3H | POLR3H | 4835 | 0.049 | 0.39 | YES |
| 10 | POLR3B | POLR3B | POLR3B | 5158 | 0.044 | 0.4 | YES |
| 11 | POLR3D | POLR3D | POLR3D | 5235 | 0.043 | 0.43 | YES |
| 12 | POLR2L | POLR2L | POLR2L | 5300 | 0.042 | 0.46 | YES |
| 13 | POLR1D | POLR1D | POLR1D | 5685 | 0.036 | 0.46 | YES |
| 14 | POLR2A | POLR2A | POLR2A | 5779 | 0.035 | 0.48 | YES |
| 15 | POLR3K | POLR3K | POLR3K | 6559 | 0.025 | 0.46 | YES |
| 16 | POLR2D | POLR2D | POLR2D | 6756 | 0.023 | 0.46 | YES |
| 17 | POLR2J | POLR2J | POLR2J | 6798 | 0.022 | 0.48 | YES |
| 18 | POLR1B | POLR1B | POLR1B | 7004 | 0.02 | 0.48 | YES |
| 19 | POLR3F | POLR3F | POLR3F | 7023 | 0.02 | 0.5 | YES |
| 20 | POLR1E | POLR1E | POLR1E | 7128 | 0.018 | 0.5 | YES |
| 21 | POLR2C | POLR2C | POLR2C | 7765 | 0.01 | 0.47 | NO |
| 22 | POLR2G | POLR2G | POLR2G | 7844 | 0.0095 | 0.48 | NO |
| 23 | POLR1A | POLR1A | POLR1A | 8227 | 0.0048 | 0.46 | NO |
| 24 | POLR3GL | POLR3GL | POLR3GL | 8621 | 0.00018 | 0.44 | NO |
| 25 | POLR2E | POLR2E | POLR2E | 9135 | -0.0061 | 0.41 | NO |
| 26 | POLR3A | POLR3A | POLR3A | 10138 | -0.019 | 0.37 | NO |
| 27 | POLR3C | POLR3C | POLR3C | 10249 | -0.02 | 0.38 | NO |
| 28 | POLR2B | POLR2B | POLR2B | 10287 | -0.021 | 0.39 | NO |
| 29 | POLR2K | POLR2K | POLR2K | 10313 | -0.021 | 0.4 | NO |
Figure S45. Get High-res Image This plot shows mRNAseq_cNMF expression data heatmap (on the left) a RunningEnrichmentScore(RES) plot (on the top right) and a Signal2Noise(S2N) plot (on the bottom right) of genes in the pathway: KEGG RIBOSOME.
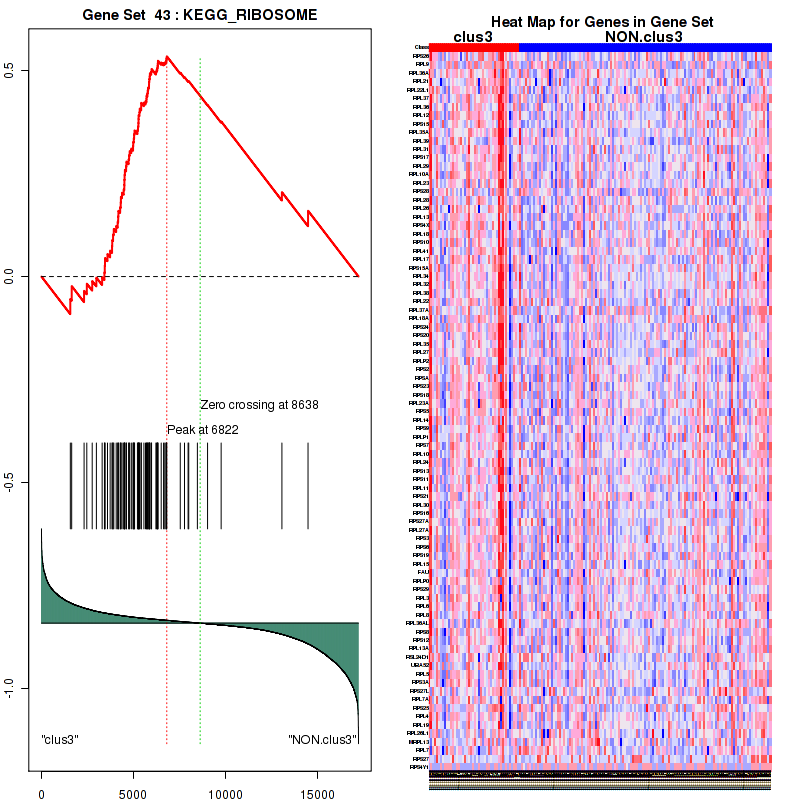
Figure S46. Get High-res Image For the top 5 core enriched genes in the pathway: KEGG RIBOSOME, this volcano plot shows how much they are up/down-regulated and significant. The significance was calculated by empirical bayesian fit

Table S24. Get Full Table This table shows a Running Enrichment Score (RES) of each gene in this pathway, that is, the enrichment score at this point in the ranked list of genes. All genes are ranked by Signal-to-Noise (S2N), a measure of similarity as default and are used to obtain ES matrix of all genes. In this way, GSEA tool uses expression pattern of not only overlapped genes but also not-overlapped genes to produce ES matrix.
| Rank | GENE | SYMBOL | DESC | LIST.LOC | S2N | RES | CORE_ENRICHMENT |
|---|---|---|---|---|---|---|---|
| 1 | LZTS1 | LZTS1 | LZTS1 | 1965 | 0.14 | -0.0096 | YES |
| 2 | POLR2H | POLR2H | POLR2H | 1990 | 0.13 | 0.092 | YES |
| 3 | POLR1C | POLR1C | POLR1C | 2057 | 0.13 | 0.19 | YES |
| 4 | SNAPC4 | SNAPC4 | SNAPC4 | 2736 | 0.1 | 0.23 | YES |
| 5 | POLR3E | POLR3E | POLR3E | 3755 | 0.071 | 0.22 | YES |
| 6 | POLR2F | POLR2F | POLR2F | 3781 | 0.071 | 0.28 | YES |
| 7 | SNAPC1 | SNAPC1 | SNAPC1 | 4359 | 0.058 | 0.29 | YES |
| 8 | POLR3H | POLR3H | POLR3H | 4835 | 0.049 | 0.3 | YES |
| 9 | POLR3B | POLR3B | POLR3B | 5158 | 0.044 | 0.32 | YES |
| 10 | POLR3D | POLR3D | POLR3D | 5235 | 0.043 | 0.34 | YES |
| 11 | SNAPC2 | SNAPC2 | SNAPC2 | 5269 | 0.042 | 0.38 | YES |
| 12 | POLR2L | POLR2L | POLR2L | 5300 | 0.042 | 0.41 | YES |
| 13 | POLR1D | POLR1D | POLR1D | 5685 | 0.036 | 0.41 | YES |
| 14 | POLR3K | POLR3K | POLR3K | 6559 | 0.025 | 0.38 | YES |
| 15 | BRF2 | BRF2 | BRF2 | 6586 | 0.025 | 0.4 | YES |
| 16 | POU2F1 | POU2F1 | POU2F1 | 6597 | 0.025 | 0.42 | YES |
| 17 | POLR3F | POLR3F | POLR3F | 7023 | 0.02 | 0.41 | NO |
| 18 | TBP | TBP | TBP | 8175 | 0.0056 | 0.35 | NO |
| 19 | POLR3GL | POLR3GL | POLR3GL | 8621 | 0.00018 | 0.32 | NO |
| 20 | POLR2E | POLR2E | POLR2E | 9135 | -0.0061 | 0.3 | NO |
| 21 | POLR3A | POLR3A | POLR3A | 10138 | -0.019 | 0.25 | NO |
| 22 | POLR3C | POLR3C | POLR3C | 10249 | -0.02 | 0.26 | NO |
| 23 | POLR2K | POLR2K | POLR2K | 10313 | -0.021 | 0.27 | NO |
| 24 | SNAPC5 | SNAPC5 | SNAPC5 | 11477 | -0.041 | 0.24 | NO |
| 25 | SNAPC3 | SNAPC3 | SNAPC3 | 11727 | -0.046 | 0.26 | NO |
| 26 | ZNF143 | ZNF143 | ZNF143 | 12863 | -0.079 | 0.26 | NO |
Figure S47. Get High-res Image This plot shows mRNAseq_cNMF expression data heatmap (on the left) a RunningEnrichmentScore(RES) plot (on the top right) and a Signal2Noise(S2N) plot (on the bottom right) of genes in the pathway: KEGG RNA POLYMERASE.
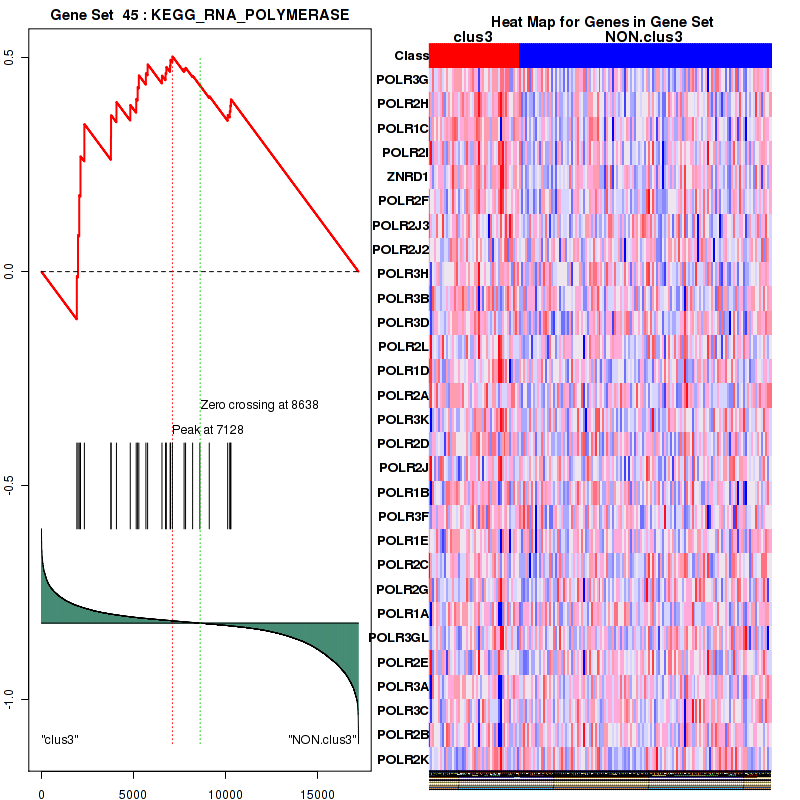
Figure S48. Get High-res Image For the top 5 core enriched genes in the pathway: KEGG RNA POLYMERASE, this volcano plot shows how much they are up/down-regulated and significant. The significance was calculated by empirical bayesian fit
Table S25. Get Full Table This table shows a Running Enrichment Score (RES) of each gene in this pathway, that is, the enrichment score at this point in the ranked list of genes. All genes are ranked by Signal-to-Noise (S2N), a measure of similarity as default and are used to obtain ES matrix of all genes. In this way, GSEA tool uses expression pattern of not only overlapped genes but also not-overlapped genes to produce ES matrix.
| Rank | GENE | SYMBOL | DESC | LIST.LOC | S2N | RES | CORE_ENRICHMENT |
|---|---|---|---|---|---|---|---|
| 1 | RPSAP9 | RPSAP9 | RPSAP9 | 981 | 0.21 | -0.017 | YES |
| 2 | RPS26 | RPS26 | RPS26 | 1570 | 0.16 | -0.02 | YES |
| 3 | RPL9 | RPL9 | RPL9 | 1646 | 0.15 | 0.0049 | YES |
| 4 | RPL36A | RPL36A | RPL36A | 2319 | 0.12 | -0.011 | YES |
| 5 | RPL21 | RPL21 | RPL21 | 2469 | 0.11 | 0.0017 | YES |
| 6 | RPL37 | RPL37 | RPL37 | 2989 | 0.092 | -0.011 | YES |
| 7 | GSPT2 | GSPT2 | GSPT2 | 3108 | 0.088 | -0.00035 | YES |
| 8 | RPL36 | RPL36 | RPL36 | 3302 | 0.083 | 0.0044 | YES |
| 9 | RPL12 | RPL12 | RPL12 | 3427 | 0.079 | 0.013 | YES |
| 10 | RPS15 | RPS15 | RPS15 | 3447 | 0.079 | 0.027 | YES |
| 11 | RPL35A | RPL35A | RPL35A | 3459 | 0.079 | 0.042 | YES |
| 12 | RPL39 | RPL39 | RPL39 | 3594 | 0.075 | 0.048 | YES |
| 13 | UPF3A | UPF3A | UPF3A | 3665 | 0.073 | 0.058 | YES |
| 14 | RPL31 | RPL31 | RPL31 | 3739 | 0.072 | 0.068 | YES |
| 15 | RPS17 | RPS17 | RPS17 | 3843 | 0.069 | 0.076 | YES |
| 16 | RPL29 | RPL29 | RPL29 | 3854 | 0.069 | 0.088 | YES |
| 17 | RPL10A | RPL10A | RPL10A | 3899 | 0.068 | 0.099 | YES |
| 18 | RPL23 | RPL23 | RPL23 | 3936 | 0.067 | 0.11 | YES |
| 19 | RPS28 | RPS28 | RPS28 | 4069 | 0.064 | 0.12 | YES |
| 20 | NCBP2 | NCBP2 | NCBP2 | 4102 | 0.064 | 0.12 | YES |
| 21 | RPL28 | RPL28 | RPL28 | 4148 | 0.063 | 0.14 | YES |
| 22 | RPL26 | RPL26 | RPL26 | 4178 | 0.062 | 0.14 | YES |
| 23 | RPL13 | RPL13 | RPL13 | 4188 | 0.062 | 0.16 | YES |
| 24 | RPS4X | RPS4X | RPS4X | 4284 | 0.06 | 0.16 | YES |
| 25 | RPL18 | RPL18 | RPL18 | 4314 | 0.059 | 0.17 | YES |
| 26 | RPS10 | RPS10 | RPS10 | 4324 | 0.059 | 0.18 | YES |
| 27 | RPL41 | RPL41 | RPL41 | 4385 | 0.058 | 0.19 | YES |
| 28 | RPL17 | RPL17 | RPL17 | 4475 | 0.056 | 0.2 | YES |
| 29 | RPS15A | RPS15A | RPS15A | 4511 | 0.055 | 0.2 | YES |
| 30 | RPL34 | RPL34 | RPL34 | 4515 | 0.055 | 0.22 | YES |
| 31 | RPL32 | RPL32 | RPL32 | 4525 | 0.055 | 0.23 | YES |
| 32 | RPL38 | RPL38 | RPL38 | 4542 | 0.055 | 0.24 | YES |
| 33 | UPF3B | UPF3B | UPF3B | 4602 | 0.054 | 0.24 | YES |
| 34 | RPL22 | RPL22 | RPL22 | 4610 | 0.053 | 0.25 | YES |
| 35 | RPL37A | RPL37A | RPL37A | 4626 | 0.053 | 0.26 | YES |
| 36 | RPL18A | RPL18A | RPL18A | 4743 | 0.051 | 0.26 | YES |
| 37 | RPS14 | RPS14 | RPS14 | 4763 | 0.051 | 0.27 | YES |
| 38 | RPS24 | RPS24 | RPS24 | 4772 | 0.051 | 0.28 | YES |
| 39 | RPS20 | RPS20 | RPS20 | 4802 | 0.05 | 0.29 | YES |
| 40 | RPL35 | RPL35 | RPL35 | 4891 | 0.048 | 0.3 | YES |
| 41 | RPL27 | RPL27 | RPL27 | 4987 | 0.047 | 0.3 | YES |
| 42 | RPLP2 | RPLP2 | RPLP2 | 4996 | 0.047 | 0.31 | YES |
| 43 | RPS2 | RPS2 | RPS2 | 5025 | 0.046 | 0.32 | YES |
| 44 | RPSA | RPSA | RPSA | 5045 | 0.046 | 0.32 | YES |
| 45 | RPS23 | RPS23 | RPS23 | 5068 | 0.045 | 0.33 | YES |
| 46 | RPS18 | RPS18 | RPS18 | 5225 | 0.043 | 0.33 | YES |
| 47 | RPL23A | RPL23A | RPL23A | 5256 | 0.043 | 0.34 | YES |
| 48 | RPS5 | RPS5 | RPS5 | 5278 | 0.042 | 0.34 | YES |
| 49 | RPL14 | RPL14 | RPL14 | 5284 | 0.042 | 0.35 | YES |
| 50 | RPS9 | RPS9 | RPS9 | 5288 | 0.042 | 0.36 | YES |
| 51 | RPLP1 | RPLP1 | RPLP1 | 5334 | 0.041 | 0.36 | YES |
| 52 | RPS7 | RPS7 | RPS7 | 5348 | 0.041 | 0.37 | YES |
| 53 | RNPS1 | RNPS1 | RNPS1 | 5407 | 0.04 | 0.38 | YES |
| 54 | RPL10 | RPL10 | RPL10 | 5428 | 0.04 | 0.38 | YES |
| 55 | RPL24 | RPL24 | RPL24 | 5429 | 0.04 | 0.39 | YES |
| 56 | RPS13 | RPS13 | RPS13 | 5577 | 0.038 | 0.39 | YES |
| 57 | RPS11 | RPS11 | RPS11 | 5664 | 0.037 | 0.39 | YES |
| 58 | RPL11 | RPL11 | RPL11 | 5717 | 0.036 | 0.4 | YES |
| 59 | RPS21 | RPS21 | RPS21 | 5720 | 0.036 | 0.4 | YES |
| 60 | RPL30 | RPL30 | RPL30 | 5769 | 0.035 | 0.41 | YES |
| 61 | RPS16 | RPS16 | RPS16 | 5783 | 0.035 | 0.41 | YES |
| 62 | RPS27A | RPS27A | RPS27A | 5809 | 0.035 | 0.42 | YES |
| 63 | RPL27A | RPL27A | RPL27A | 5854 | 0.034 | 0.42 | YES |
| 64 | RPS3 | RPS3 | RPS3 | 5858 | 0.034 | 0.43 | YES |
| 65 | RPS6 | RPS6 | RPS6 | 5872 | 0.034 | 0.44 | YES |
| 66 | RPS19 | RPS19 | RPS19 | 5890 | 0.034 | 0.44 | YES |
| 67 | RPL15 | RPL15 | RPL15 | 5903 | 0.034 | 0.45 | YES |
| 68 | FAU | FAU | FAU | 5975 | 0.033 | 0.45 | YES |
| 69 | RPLP0 | RPLP0 | RPLP0 | 5994 | 0.033 | 0.45 | YES |
| 70 | RPS29 | RPS29 | RPS29 | 6231 | 0.03 | 0.45 | YES |
| 71 | RPL3 | RPL3 | RPL3 | 6266 | 0.029 | 0.45 | YES |
| 72 | RPL6 | RPL6 | RPL6 | 6307 | 0.028 | 0.45 | YES |
| 73 | RPL8 | RPL8 | RPL8 | 6322 | 0.028 | 0.46 | YES |
| 74 | RPS8 | RPS8 | RPS8 | 6342 | 0.028 | 0.46 | YES |
| 75 | PPP2R2A | PPP2R2A | PPP2R2A | 6399 | 0.027 | 0.46 | YES |
| 76 | ETF1 | ETF1 | ETF1 | 6410 | 0.027 | 0.47 | YES |
| 77 | RPS12 | RPS12 | RPS12 | 6519 | 0.026 | 0.47 | YES |
| 78 | SMG6 | SMG6 | SMG6 | 6621 | 0.025 | 0.47 | YES |
| 79 | RPL13A | RPL13A | RPL13A | 6646 | 0.024 | 0.47 | YES |
| 80 | UBA52 | UBA52 | UBA52 | 6773 | 0.023 | 0.47 | YES |
| 81 | RPL5 | RPL5 | RPL5 | 6803 | 0.022 | 0.47 | YES |
| 82 | RPS3A | RPS3A | RPS3A | 6807 | 0.022 | 0.47 | YES |
| 83 | MAGOH | MAGOH | MAGOH | 6858 | 0.022 | 0.47 | YES |
| 84 | CASC3 | CASC3 | CASC3 | 7461 | 0.014 | 0.44 | NO |
| 85 | RBM8A | RBM8A | RBM8A | 7521 | 0.013 | 0.44 | NO |
| 86 | RPL7A | RPL7A | RPL7A | 7555 | 0.013 | 0.44 | NO |
| 87 | SMG5 | SMG5 | SMG5 | 7595 | 0.012 | 0.44 | NO |
| 88 | RPS25 | RPS25 | RPS25 | 7786 | 0.01 | 0.43 | NO |
| 89 | RPL4 | RPL4 | RPL4 | 7983 | 0.0078 | 0.42 | NO |
| 90 | RPL19 | RPL19 | RPL19 | 8017 | 0.0073 | 0.42 | NO |
| 91 | RPL26L1 | RPL26L1 | RPL26L1 | 8488 | 0.0017 | 0.4 | NO |
| 92 | PPP2CA | PPP2CA | PPP2CA | 8501 | 0.0016 | 0.4 | NO |
| 93 | PPP2R1A | PPP2R1A | PPP2R1A | 9151 | -0.0063 | 0.36 | NO |
| 94 | SMG1 | SMG1 | SMG1 | 9390 | -0.0092 | 0.35 | NO |
| 95 | PABPC1 | PABPC1 | PABPC1 | 9502 | -0.011 | 0.34 | NO |
| 96 | EIF4A3 | EIF4A3 | EIF4A3 | 9572 | -0.012 | 0.34 | NO |
| 97 | SMG7 | SMG7 | SMG7 | 9673 | -0.013 | 0.34 | NO |
| 98 | EIF4G1 | EIF4G1 | EIF4G1 | 9722 | -0.014 | 0.34 | NO |
| 99 | RPL7 | RPL7 | RPL7 | 9782 | -0.014 | 0.34 | NO |
| 100 | UPF2 | UPF2 | UPF2 | 10331 | -0.022 | 0.31 | NO |
| 101 | NCBP1 | NCBP1 | NCBP1 | 10966 | -0.032 | 0.28 | NO |
| 102 | RPS27 | RPS27 | RPS27 | 13088 | -0.088 | 0.17 | NO |
| 103 | RPS4Y1 | RPS4Y1 | RPS4Y1 | 14512 | -0.16 | 0.12 | NO |
| 104 | FAM153A | FAM153A | FAM153A | 15115 | -0.21 | 0.12 | NO |
Figure S49. Get High-res Image This plot shows mRNAseq_cNMF expression data heatmap (on the left) a RunningEnrichmentScore(RES) plot (on the top right) and a Signal2Noise(S2N) plot (on the bottom right) of genes in the pathway: PID MYC PATHWAY.
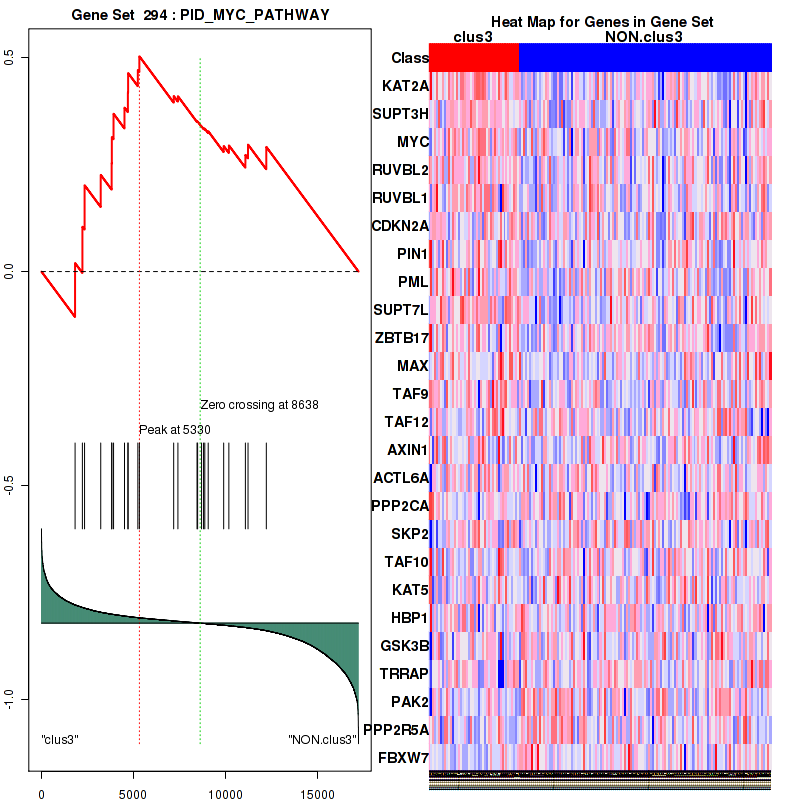
Figure S50. Get High-res Image For the top 5 core enriched genes in the pathway: PID MYC PATHWAY, this volcano plot shows how much they are up/down-regulated and significant. The significance was calculated by empirical bayesian fit
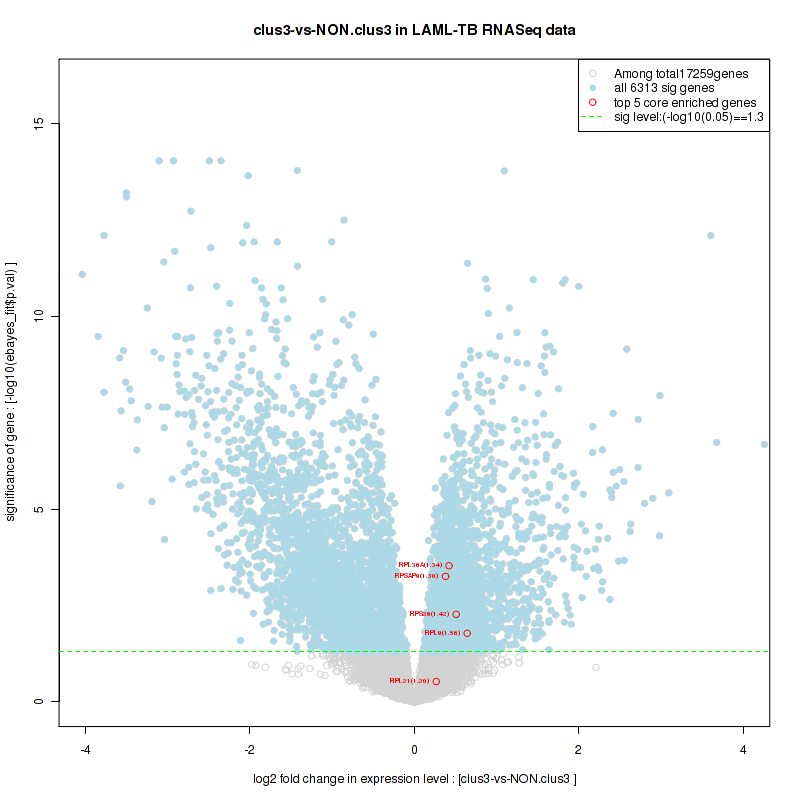
Table S26. Get Full Table This table shows a Running Enrichment Score (RES) of each gene in this pathway, that is, the enrichment score at this point in the ranked list of genes. All genes are ranked by Signal-to-Noise (S2N), a measure of similarity as default and are used to obtain ES matrix of all genes. In this way, GSEA tool uses expression pattern of not only overlapped genes but also not-overlapped genes to produce ES matrix.
| Rank | GENE | SYMBOL | DESC | LIST.LOC | S2N | RES | CORE_ENRICHMENT |
|---|---|---|---|---|---|---|---|
| 1 | RPSAP9 | RPSAP9 | RPSAP9 | 981 | 0.21 | -0.017 | YES |
| 2 | RPS26 | RPS26 | RPS26 | 1570 | 0.16 | -0.021 | YES |
| 3 | RPL9 | RPL9 | RPL9 | 1646 | 0.15 | 0.0037 | YES |
| 4 | POLR2H | POLR2H | POLR2H | 1990 | 0.13 | 0.0093 | YES |
| 5 | POLR2I | POLR2I | POLR2I | 2124 | 0.13 | 0.026 | YES |
| 6 | RPL36A | RPL36A | RPL36A | 2319 | 0.12 | 0.037 | YES |
| 7 | RPL21 | RPL21 | RPL21 | 2469 | 0.11 | 0.05 | YES |
| 8 | RPL37 | RPL37 | RPL37 | 2989 | 0.092 | 0.037 | YES |
| 9 | RPL36 | RPL36 | RPL36 | 3302 | 0.083 | 0.035 | YES |
| 10 | RPL12 | RPL12 | RPL12 | 3427 | 0.079 | 0.043 | YES |
| 11 | RPS15 | RPS15 | RPS15 | 3447 | 0.079 | 0.057 | YES |
| 12 | RPL35A | RPL35A | RPL35A | 3459 | 0.079 | 0.071 | YES |
| 13 | RPL39 | RPL39 | RPL39 | 3594 | 0.075 | 0.078 | YES |
| 14 | RPL31 | RPL31 | RPL31 | 3739 | 0.072 | 0.083 | YES |
| 15 | POLR2F | POLR2F | POLR2F | 3781 | 0.071 | 0.094 | YES |
| 16 | RPS17 | RPS17 | RPS17 | 3843 | 0.069 | 0.1 | YES |
| 17 | RPL29 | RPL29 | RPL29 | 3854 | 0.069 | 0.12 | YES |
| 18 | RPL10A | RPL10A | RPL10A | 3899 | 0.068 | 0.13 | YES |
| 19 | RPL23 | RPL23 | RPL23 | 3936 | 0.067 | 0.14 | YES |
| 20 | RPS28 | RPS28 | RPS28 | 4069 | 0.064 | 0.14 | YES |
| 21 | RPL28 | RPL28 | RPL28 | 4148 | 0.063 | 0.15 | YES |
| 22 | RPL26 | RPL26 | RPL26 | 4178 | 0.062 | 0.16 | YES |
| 23 | RPL13 | RPL13 | RPL13 | 4188 | 0.062 | 0.17 | YES |
| 24 | RPS4X | RPS4X | RPS4X | 4284 | 0.06 | 0.18 | YES |
| 25 | RPL18 | RPL18 | RPL18 | 4314 | 0.059 | 0.19 | YES |
| 26 | RPS10 | RPS10 | RPS10 | 4324 | 0.059 | 0.2 | YES |
| 27 | RPL41 | RPL41 | RPL41 | 4385 | 0.058 | 0.21 | YES |
| 28 | RPL17 | RPL17 | RPL17 | 4475 | 0.056 | 0.21 | YES |
| 29 | RPS15A | RPS15A | RPS15A | 4511 | 0.055 | 0.22 | YES |
| 30 | RPL34 | RPL34 | RPL34 | 4515 | 0.055 | 0.23 | YES |
| 31 | RPL32 | RPL32 | RPL32 | 4525 | 0.055 | 0.24 | YES |
| 32 | RPL38 | RPL38 | RPL38 | 4542 | 0.055 | 0.25 | YES |
| 33 | RPL22 | RPL22 | RPL22 | 4610 | 0.053 | 0.26 | YES |
| 34 | RPL37A | RPL37A | RPL37A | 4626 | 0.053 | 0.26 | YES |
| 35 | GTF2F1 | GTF2F1 | GTF2F1 | 4704 | 0.052 | 0.27 | YES |
| 36 | RPL18A | RPL18A | RPL18A | 4743 | 0.051 | 0.28 | YES |
| 37 | RPS14 | RPS14 | RPS14 | 4763 | 0.051 | 0.29 | YES |
| 38 | RPS24 | RPS24 | RPS24 | 4772 | 0.051 | 0.3 | YES |
| 39 | RPS20 | RPS20 | RPS20 | 4802 | 0.05 | 0.3 | YES |
| 40 | RPL35 | RPL35 | RPL35 | 4891 | 0.048 | 0.31 | YES |
| 41 | RPL27 | RPL27 | RPL27 | 4987 | 0.047 | 0.31 | YES |
| 42 | RPLP2 | RPLP2 | RPLP2 | 4996 | 0.047 | 0.32 | YES |
| 43 | RPS2 | RPS2 | RPS2 | 5025 | 0.046 | 0.33 | YES |
| 44 | RPSA | RPSA | RPSA | 5045 | 0.046 | 0.34 | YES |
| 45 | RPS23 | RPS23 | RPS23 | 5068 | 0.045 | 0.34 | YES |
| 46 | RPS18 | RPS18 | RPS18 | 5225 | 0.043 | 0.34 | YES |
| 47 | RPL23A | RPL23A | RPL23A | 5256 | 0.043 | 0.35 | YES |
| 48 | RPS5 | RPS5 | RPS5 | 5278 | 0.042 | 0.36 | YES |
| 49 | RPL14 | RPL14 | RPL14 | 5284 | 0.042 | 0.36 | YES |
| 50 | RPS9 | RPS9 | RPS9 | 5288 | 0.042 | 0.37 | YES |
| 51 | POLR2L | POLR2L | POLR2L | 5300 | 0.042 | 0.38 | YES |
| 52 | RPLP1 | RPLP1 | RPLP1 | 5334 | 0.041 | 0.38 | YES |
| 53 | RPS7 | RPS7 | RPS7 | 5348 | 0.041 | 0.39 | YES |
| 54 | RPL10 | RPL10 | RPL10 | 5428 | 0.04 | 0.4 | YES |
| 55 | RPL24 | RPL24 | RPL24 | 5429 | 0.04 | 0.4 | YES |
| 56 | RPS13 | RPS13 | RPS13 | 5577 | 0.038 | 0.4 | YES |
| 57 | RPS11 | RPS11 | RPS11 | 5664 | 0.037 | 0.4 | YES |
| 58 | RPL11 | RPL11 | RPL11 | 5717 | 0.036 | 0.41 | YES |
| 59 | RPS21 | RPS21 | RPS21 | 5720 | 0.036 | 0.41 | YES |
| 60 | RPL30 | RPL30 | RPL30 | 5769 | 0.035 | 0.42 | YES |
| 61 | POLR2A | POLR2A | POLR2A | 5779 | 0.035 | 0.42 | YES |
| 62 | RPS16 | RPS16 | RPS16 | 5783 | 0.035 | 0.43 | YES |
| 63 | RPS27A | RPS27A | RPS27A | 5809 | 0.035 | 0.44 | YES |
| 64 | RPL27A | RPL27A | RPL27A | 5854 | 0.034 | 0.44 | YES |
| 65 | RPS3 | RPS3 | RPS3 | 5858 | 0.034 | 0.45 | YES |
| 66 | RPS6 | RPS6 | RPS6 | 5872 | 0.034 | 0.45 | YES |
| 67 | RPS19 | RPS19 | RPS19 | 5890 | 0.034 | 0.46 | YES |
| 68 | RPL15 | RPL15 | RPL15 | 5903 | 0.034 | 0.46 | YES |
| 69 | FAU | FAU | FAU | 5975 | 0.033 | 0.46 | YES |
| 70 | RPLP0 | RPLP0 | RPLP0 | 5994 | 0.033 | 0.47 | YES |
| 71 | RPS29 | RPS29 | RPS29 | 6231 | 0.03 | 0.46 | YES |
| 72 | RPL3 | RPL3 | RPL3 | 6266 | 0.029 | 0.47 | YES |
| 73 | RPL6 | RPL6 | RPL6 | 6307 | 0.028 | 0.47 | YES |
| 74 | RPL8 | RPL8 | RPL8 | 6322 | 0.028 | 0.47 | YES |
| 75 | RPS8 | RPS8 | RPS8 | 6342 | 0.028 | 0.48 | YES |
| 76 | RPS12 | RPS12 | RPS12 | 6519 | 0.026 | 0.47 | YES |
| 77 | RPL13A | RPL13A | RPL13A | 6646 | 0.024 | 0.47 | YES |
| 78 | POLR2D | POLR2D | POLR2D | 6756 | 0.023 | 0.47 | YES |
| 79 | UBA52 | UBA52 | UBA52 | 6773 | 0.023 | 0.47 | YES |
| 80 | POLR2J | POLR2J | POLR2J | 6798 | 0.022 | 0.47 | YES |
| 81 | RPL5 | RPL5 | RPL5 | 6803 | 0.022 | 0.48 | YES |
| 82 | RPS3A | RPS3A | RPS3A | 6807 | 0.022 | 0.48 | YES |
| 83 | HSP90AA1 | HSP90AA1 | HSP90AA1 | 7134 | 0.018 | 0.47 | NO |
| 84 | RPL7A | RPL7A | RPL7A | 7555 | 0.013 | 0.44 | NO |
| 85 | POLR2C | POLR2C | POLR2C | 7765 | 0.01 | 0.44 | NO |
| 86 | RPS25 | RPS25 | RPS25 | 7786 | 0.01 | 0.44 | NO |
| 87 | POLR2G | POLR2G | POLR2G | 7844 | 0.0095 | 0.43 | NO |
| 88 | RPL4 | RPL4 | RPL4 | 7983 | 0.0078 | 0.43 | NO |
| 89 | RPL19 | RPL19 | RPL19 | 8017 | 0.0073 | 0.43 | NO |
| 90 | GRSF1 | GRSF1 | GRSF1 | 8480 | 0.0018 | 0.4 | NO |
| 91 | RPL26L1 | RPL26L1 | RPL26L1 | 8488 | 0.0017 | 0.4 | NO |
| 92 | IPO5 | IPO5 | IPO5 | 8737 | -0.0013 | 0.39 | NO |
| 93 | POLR2E | POLR2E | POLR2E | 9135 | -0.0061 | 0.36 | NO |
| 94 | RPL7 | RPL7 | RPL7 | 9782 | -0.014 | 0.33 | NO |
| 95 | GTF2F2 | GTF2F2 | GTF2F2 | 9819 | -0.015 | 0.33 | NO |
| 96 | POLR2B | POLR2B | POLR2B | 10287 | -0.021 | 0.31 | NO |
| 97 | POLR2K | POLR2K | POLR2K | 10313 | -0.021 | 0.31 | NO |
| 98 | DNAJC3 | DNAJC3 | DNAJC3 | 11174 | -0.035 | 0.27 | NO |
| 99 | RPS27 | RPS27 | RPS27 | 13088 | -0.088 | 0.17 | NO |
| 100 | RPS4Y1 | RPS4Y1 | RPS4Y1 | 14512 | -0.16 | 0.12 | NO |
| 101 | FAM153A | FAM153A | FAM153A | 15115 | -0.21 | 0.12 | NO |
Figure S51. Get High-res Image This plot shows mRNAseq_cNMF expression data heatmap (on the left) a RunningEnrichmentScore(RES) plot (on the top right) and a Signal2Noise(S2N) plot (on the bottom right) of genes in the pathway: REACTOME TRANSLATION.
Figure S52. Get High-res Image For the top 5 core enriched genes in the pathway: REACTOME TRANSLATION, this volcano plot shows how much they are up/down-regulated and significant. The significance was calculated by empirical bayesian fit
Table S27. Get Full Table This table shows a Running Enrichment Score (RES) of each gene in this pathway, that is, the enrichment score at this point in the ranked list of genes. All genes are ranked by Signal-to-Noise (S2N), a measure of similarity as default and are used to obtain ES matrix of all genes. In this way, GSEA tool uses expression pattern of not only overlapped genes but also not-overlapped genes to produce ES matrix.
| Rank | GENE | SYMBOL | DESC | LIST.LOC | S2N | RES | CORE_ENRICHMENT |
|---|---|---|---|---|---|---|---|
| 1 | RPS26 | RPS26 | RPS26 | 1570 | 0.16 | -0.054 | YES |
| 2 | RPL9 | RPL9 | RPL9 | 1646 | 0.15 | -0.023 | YES |
| 3 | RPL36A | RPL36A | RPL36A | 2319 | 0.12 | -0.035 | YES |
| 4 | RPL21 | RPL21 | RPL21 | 2469 | 0.11 | -0.017 | YES |
| 5 | RPL22L1 | RPL22L1 | RPL22L1 | 2763 | 0.1 | -0.011 | YES |
| 6 | RPL37 | RPL37 | RPL37 | 2989 | 0.092 | -0.0024 | YES |
| 7 | RPL36 | RPL36 | RPL36 | 3302 | 0.083 | -0.0013 | YES |
| 8 | RPL12 | RPL12 | RPL12 | 3427 | 0.079 | 0.01 | YES |
| 9 | RPS15 | RPS15 | RPS15 | 3447 | 0.079 | 0.027 | YES |
| 10 | RPL35A | RPL35A | RPL35A | 3459 | 0.079 | 0.045 | YES |
| 11 | RPL39 | RPL39 | RPL39 | 3594 | 0.075 | 0.055 | YES |
| 12 | RPL31 | RPL31 | RPL31 | 3739 | 0.072 | 0.063 | YES |
| 13 | RPS17 | RPS17 | RPS17 | 3843 | 0.069 | 0.073 | YES |
| 14 | RPL29 | RPL29 | RPL29 | 3854 | 0.069 | 0.089 | YES |
| 15 | RPL10A | RPL10A | RPL10A | 3899 | 0.068 | 0.1 | YES |
| 16 | RPL23 | RPL23 | RPL23 | 3936 | 0.067 | 0.12 | YES |
| 17 | RPS28 | RPS28 | RPS28 | 4069 | 0.064 | 0.12 | YES |
| 18 | RPL28 | RPL28 | RPL28 | 4148 | 0.063 | 0.13 | YES |
| 19 | RPL26 | RPL26 | RPL26 | 4178 | 0.062 | 0.15 | YES |
| 20 | RPL13 | RPL13 | RPL13 | 4188 | 0.062 | 0.16 | YES |
| 21 | RPS4X | RPS4X | RPS4X | 4284 | 0.06 | 0.17 | YES |
| 22 | RPL18 | RPL18 | RPL18 | 4314 | 0.059 | 0.18 | YES |
| 23 | RPS10 | RPS10 | RPS10 | 4324 | 0.059 | 0.19 | YES |
| 24 | RPL41 | RPL41 | RPL41 | 4385 | 0.058 | 0.2 | YES |
| 25 | RPL17 | RPL17 | RPL17 | 4475 | 0.056 | 0.21 | YES |
| 26 | RPS15A | RPS15A | RPS15A | 4511 | 0.055 | 0.22 | YES |
| 27 | RPL34 | RPL34 | RPL34 | 4515 | 0.055 | 0.24 | YES |
| 28 | RPL32 | RPL32 | RPL32 | 4525 | 0.055 | 0.25 | YES |
| 29 | RPL38 | RPL38 | RPL38 | 4542 | 0.055 | 0.26 | YES |
| 30 | RPL22 | RPL22 | RPL22 | 4610 | 0.053 | 0.27 | YES |
| 31 | RPL37A | RPL37A | RPL37A | 4626 | 0.053 | 0.28 | YES |
| 32 | RPL18A | RPL18A | RPL18A | 4743 | 0.051 | 0.28 | YES |
| 33 | RPS24 | RPS24 | RPS24 | 4772 | 0.051 | 0.3 | YES |
| 34 | RPS20 | RPS20 | RPS20 | 4802 | 0.05 | 0.3 | YES |
| 35 | RPL35 | RPL35 | RPL35 | 4891 | 0.048 | 0.31 | YES |
| 36 | RPL27 | RPL27 | RPL27 | 4987 | 0.047 | 0.32 | YES |
| 37 | RPLP2 | RPLP2 | RPLP2 | 4996 | 0.047 | 0.33 | YES |
| 38 | RPS2 | RPS2 | RPS2 | 5025 | 0.046 | 0.34 | YES |
| 39 | RPSA | RPSA | RPSA | 5045 | 0.046 | 0.35 | YES |
| 40 | RPS23 | RPS23 | RPS23 | 5068 | 0.045 | 0.36 | YES |
| 41 | RPS18 | RPS18 | RPS18 | 5225 | 0.043 | 0.36 | YES |
| 42 | RPL23A | RPL23A | RPL23A | 5256 | 0.043 | 0.36 | YES |
| 43 | RPS5 | RPS5 | RPS5 | 5278 | 0.042 | 0.37 | YES |
| 44 | RPL14 | RPL14 | RPL14 | 5284 | 0.042 | 0.38 | YES |
| 45 | RPS9 | RPS9 | RPS9 | 5288 | 0.042 | 0.39 | YES |
| 46 | RPLP1 | RPLP1 | RPLP1 | 5334 | 0.041 | 0.4 | YES |
| 47 | RPS7 | RPS7 | RPS7 | 5348 | 0.041 | 0.41 | YES |
| 48 | RPL10 | RPL10 | RPL10 | 5428 | 0.04 | 0.41 | YES |
| 49 | RPL24 | RPL24 | RPL24 | 5429 | 0.04 | 0.42 | YES |
| 50 | RPS13 | RPS13 | RPS13 | 5577 | 0.038 | 0.42 | YES |
| 51 | RPS11 | RPS11 | RPS11 | 5664 | 0.037 | 0.43 | YES |
| 52 | RPL11 | RPL11 | RPL11 | 5717 | 0.036 | 0.43 | YES |
| 53 | RPS21 | RPS21 | RPS21 | 5720 | 0.036 | 0.44 | YES |
| 54 | RPL30 | RPL30 | RPL30 | 5769 | 0.035 | 0.44 | YES |
| 55 | RPS16 | RPS16 | RPS16 | 5783 | 0.035 | 0.45 | YES |
| 56 | RPS27A | RPS27A | RPS27A | 5809 | 0.035 | 0.46 | YES |
| 57 | RPL27A | RPL27A | RPL27A | 5854 | 0.034 | 0.46 | YES |
| 58 | RPS3 | RPS3 | RPS3 | 5858 | 0.034 | 0.47 | YES |
| 59 | RPS6 | RPS6 | RPS6 | 5872 | 0.034 | 0.48 | YES |
| 60 | RPS19 | RPS19 | RPS19 | 5890 | 0.034 | 0.49 | YES |
| 61 | RPL15 | RPL15 | RPL15 | 5903 | 0.034 | 0.49 | YES |
| 62 | FAU | FAU | FAU | 5975 | 0.033 | 0.5 | YES |
| 63 | RPLP0 | RPLP0 | RPLP0 | 5994 | 0.033 | 0.5 | YES |
| 64 | RPS29 | RPS29 | RPS29 | 6231 | 0.03 | 0.5 | YES |
| 65 | RPL3 | RPL3 | RPL3 | 6266 | 0.029 | 0.5 | YES |
| 66 | RPL6 | RPL6 | RPL6 | 6307 | 0.028 | 0.51 | YES |
| 67 | RPL8 | RPL8 | RPL8 | 6322 | 0.028 | 0.51 | YES |
| 68 | RPL36AL | RPL36AL | RPL36AL | 6332 | 0.028 | 0.52 | YES |
| 69 | RPS8 | RPS8 | RPS8 | 6342 | 0.028 | 0.52 | YES |
| 70 | RPS12 | RPS12 | RPS12 | 6519 | 0.026 | 0.52 | YES |
| 71 | RPL13A | RPL13A | RPL13A | 6646 | 0.024 | 0.52 | YES |
| 72 | RSL24D1 | RSL24D1 | RSL24D1 | 6713 | 0.024 | 0.52 | YES |
| 73 | UBA52 | UBA52 | UBA52 | 6773 | 0.023 | 0.52 | YES |
| 74 | RPL5 | RPL5 | RPL5 | 6803 | 0.022 | 0.53 | YES |
| 75 | RPS3A | RPS3A | RPS3A | 6807 | 0.022 | 0.53 | YES |
| 76 | RPS27L | RPS27L | RPS27L | 6822 | 0.022 | 0.54 | YES |
| 77 | RPL7A | RPL7A | RPL7A | 7555 | 0.013 | 0.5 | NO |
| 78 | RPS25 | RPS25 | RPS25 | 7786 | 0.01 | 0.48 | NO |
| 79 | RPL4 | RPL4 | RPL4 | 7983 | 0.0078 | 0.48 | NO |
| 80 | RPL19 | RPL19 | RPL19 | 8017 | 0.0073 | 0.48 | NO |
| 81 | RPL26L1 | RPL26L1 | RPL26L1 | 8488 | 0.0017 | 0.45 | NO |
| 82 | MRPL13 | MRPL13 | MRPL13 | 9041 | -0.0048 | 0.42 | NO |
| 83 | RPL7 | RPL7 | RPL7 | 9782 | -0.014 | 0.38 | NO |
| 84 | RPS27 | RPS27 | RPS27 | 13088 | -0.088 | 0.2 | NO |
| 85 | RPS4Y1 | RPS4Y1 | RPS4Y1 | 14512 | -0.16 | 0.16 | NO |
Figure S53. Get High-res Image This plot shows mRNAseq_cNMF expression data heatmap (on the left) a RunningEnrichmentScore(RES) plot (on the top right) and a Signal2Noise(S2N) plot (on the bottom right) of genes in the pathway: REACTOME FORMATION OF THE TERNARY COMPLEX AND SUBSEQUENTLY THE 43S COMPLEX.
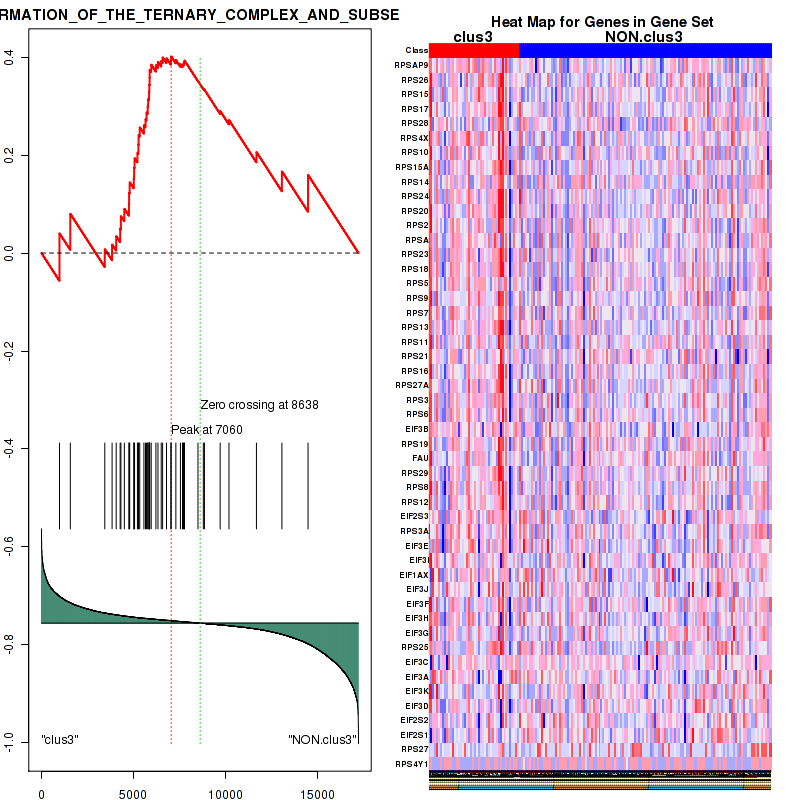
Figure S54. Get High-res Image For the top 5 core enriched genes in the pathway: REACTOME FORMATION OF THE TERNARY COMPLEX AND SUBSEQUENTLY THE 43S COMPLEX, this volcano plot shows how much they are up/down-regulated and significant. The significance was calculated by empirical bayesian fit
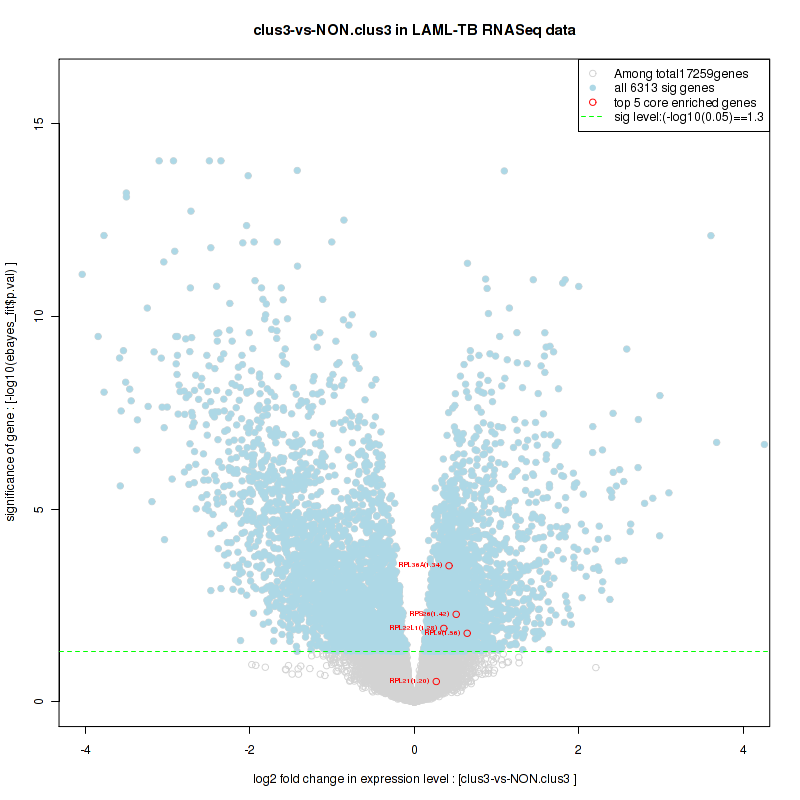
Table S28. Get Full Table This table shows a Running Enrichment Score (RES) of each gene in this pathway, that is, the enrichment score at this point in the ranked list of genes. All genes are ranked by Signal-to-Noise (S2N), a measure of similarity as default and are used to obtain ES matrix of all genes. In this way, GSEA tool uses expression pattern of not only overlapped genes but also not-overlapped genes to produce ES matrix.
| Rank | GENE | SYMBOL | DESC | LIST.LOC | S2N | RES | CORE_ENRICHMENT |
|---|---|---|---|---|---|---|---|
| 1 | RPSAP9 | RPSAP9 | RPSAP9 | 981 | 0.21 | -0.024 | YES |
| 2 | RPS26 | RPS26 | RPS26 | 1570 | 0.16 | -0.032 | YES |
| 3 | RPL9 | RPL9 | RPL9 | 1646 | 0.15 | -0.012 | YES |
| 4 | POLR2H | POLR2H | POLR2H | 1990 | 0.13 | -0.01 | YES |
| 5 | POLR2I | POLR2I | POLR2I | 2124 | 0.13 | 0.0024 | YES |
| 6 | RPL36A | RPL36A | RPL36A | 2319 | 0.12 | 0.01 | YES |
| 7 | RPL21 | RPL21 | RPL21 | 2469 | 0.11 | 0.02 | YES |
| 8 | CALR | CALR | CALR | 2851 | 0.096 | 0.013 | YES |
| 9 | RPL37 | RPL37 | RPL37 | 2989 | 0.092 | 0.02 | YES |
| 10 | RPL36 | RPL36 | RPL36 | 3302 | 0.083 | 0.015 | YES |
| 11 | RPL12 | RPL12 | RPL12 | 3427 | 0.079 | 0.021 | YES |
| 12 | RPS15 | RPS15 | RPS15 | 3447 | 0.079 | 0.032 | YES |
| 13 | RPL35A | RPL35A | RPL35A | 3459 | 0.079 | 0.044 | YES |
| 14 | RPL39 | RPL39 | RPL39 | 3594 | 0.075 | 0.049 | YES |
| 15 | RPL31 | RPL31 | RPL31 | 3739 | 0.072 | 0.052 | YES |
| 16 | POLR2F | POLR2F | POLR2F | 3781 | 0.071 | 0.061 | YES |
| 17 | RPS17 | RPS17 | RPS17 | 3843 | 0.069 | 0.069 | YES |
| 18 | RPL29 | RPL29 | RPL29 | 3854 | 0.069 | 0.079 | YES |
| 19 | RPL10A | RPL10A | RPL10A | 3899 | 0.068 | 0.088 | YES |
| 20 | RPL23 | RPL23 | RPL23 | 3936 | 0.067 | 0.096 | YES |
| 21 | RPS28 | RPS28 | RPS28 | 4069 | 0.064 | 0.099 | YES |
| 22 | RPL28 | RPL28 | RPL28 | 4148 | 0.063 | 0.1 | YES |
| 23 | RPL26 | RPL26 | RPL26 | 4178 | 0.062 | 0.11 | YES |
| 24 | RPL13 | RPL13 | RPL13 | 4188 | 0.062 | 0.12 | YES |
| 25 | HSPA1B | HSPA1B | HSPA1B | 4224 | 0.061 | 0.13 | YES |
| 26 | RPS4X | RPS4X | RPS4X | 4284 | 0.06 | 0.14 | YES |
| 27 | RPL18 | RPL18 | RPL18 | 4314 | 0.059 | 0.14 | YES |
| 28 | RPS10 | RPS10 | RPS10 | 4324 | 0.059 | 0.15 | YES |
| 29 | RPL41 | RPL41 | RPL41 | 4385 | 0.058 | 0.16 | YES |
| 30 | RPL17 | RPL17 | RPL17 | 4475 | 0.056 | 0.16 | YES |
| 31 | RPS15A | RPS15A | RPS15A | 4511 | 0.055 | 0.17 | YES |
| 32 | RPL34 | RPL34 | RPL34 | 4515 | 0.055 | 0.18 | YES |
| 33 | RPL32 | RPL32 | RPL32 | 4525 | 0.055 | 0.19 | YES |
| 34 | RPL38 | RPL38 | RPL38 | 4542 | 0.055 | 0.2 | YES |
| 35 | RPL22 | RPL22 | RPL22 | 4610 | 0.053 | 0.2 | YES |
| 36 | RPL37A | RPL37A | RPL37A | 4626 | 0.053 | 0.21 | YES |
| 37 | GTF2F1 | GTF2F1 | GTF2F1 | 4704 | 0.052 | 0.21 | YES |
| 38 | RPL18A | RPL18A | RPL18A | 4743 | 0.051 | 0.22 | YES |
| 39 | RPS14 | RPS14 | RPS14 | 4763 | 0.051 | 0.22 | YES |
| 40 | RPS24 | RPS24 | RPS24 | 4772 | 0.051 | 0.23 | YES |
| 41 | RPS20 | RPS20 | RPS20 | 4802 | 0.05 | 0.24 | YES |
| 42 | RPL35 | RPL35 | RPL35 | 4891 | 0.048 | 0.24 | YES |
| 43 | RPL27 | RPL27 | RPL27 | 4987 | 0.047 | 0.24 | YES |
| 44 | RPLP2 | RPLP2 | RPLP2 | 4996 | 0.047 | 0.25 | YES |
| 45 | RPS2 | RPS2 | RPS2 | 5025 | 0.046 | 0.26 | YES |
| 46 | RPSA | RPSA | RPSA | 5045 | 0.046 | 0.26 | YES |
| 47 | RPS23 | RPS23 | RPS23 | 5068 | 0.045 | 0.27 | YES |
| 48 | RPS18 | RPS18 | RPS18 | 5225 | 0.043 | 0.27 | YES |
| 49 | RPL23A | RPL23A | RPL23A | 5256 | 0.043 | 0.27 | YES |
| 50 | RPS5 | RPS5 | RPS5 | 5278 | 0.042 | 0.28 | YES |
| 51 | RPL14 | RPL14 | RPL14 | 5284 | 0.042 | 0.28 | YES |
| 52 | AAAS | AAAS | AAAS | 5285 | 0.042 | 0.29 | YES |
| 53 | RPS9 | RPS9 | RPS9 | 5288 | 0.042 | 0.3 | YES |
| 54 | POLR2L | POLR2L | POLR2L | 5300 | 0.042 | 0.3 | YES |
| 55 | RPLP1 | RPLP1 | RPLP1 | 5334 | 0.041 | 0.31 | YES |
| 56 | RPS7 | RPS7 | RPS7 | 5348 | 0.041 | 0.32 | YES |
| 57 | RPL10 | RPL10 | RPL10 | 5428 | 0.04 | 0.32 | YES |
| 58 | RPL24 | RPL24 | RPL24 | 5429 | 0.04 | 0.32 | YES |
| 59 | RPS13 | RPS13 | RPS13 | 5577 | 0.038 | 0.32 | YES |
| 60 | RPS11 | RPS11 | RPS11 | 5664 | 0.037 | 0.32 | YES |
| 61 | RPL11 | RPL11 | RPL11 | 5717 | 0.036 | 0.32 | YES |
| 62 | RPS21 | RPS21 | RPS21 | 5720 | 0.036 | 0.33 | YES |
| 63 | RPL30 | RPL30 | RPL30 | 5769 | 0.035 | 0.33 | YES |
| 64 | POLR2A | POLR2A | POLR2A | 5779 | 0.035 | 0.34 | YES |
| 65 | POM121 | POM121 | POM121 | 5781 | 0.035 | 0.34 | YES |
| 66 | RPS16 | RPS16 | RPS16 | 5783 | 0.035 | 0.35 | YES |
| 67 | RPS27A | RPS27A | RPS27A | 5809 | 0.035 | 0.35 | YES |
| 68 | RPL27A | RPL27A | RPL27A | 5854 | 0.034 | 0.36 | YES |
| 69 | RPS3 | RPS3 | RPS3 | 5858 | 0.034 | 0.36 | YES |
| 70 | RPS6 | RPS6 | RPS6 | 5872 | 0.034 | 0.37 | YES |
| 71 | RPS19 | RPS19 | RPS19 | 5890 | 0.034 | 0.37 | YES |
| 72 | RPL15 | RPL15 | RPL15 | 5903 | 0.034 | 0.38 | YES |
| 73 | FAU | FAU | FAU | 5975 | 0.033 | 0.38 | YES |
| 74 | RPLP0 | RPLP0 | RPLP0 | 5994 | 0.033 | 0.38 | YES |
| 75 | RPS29 | RPS29 | RPS29 | 6231 | 0.03 | 0.37 | YES |
| 76 | RPL3 | RPL3 | RPL3 | 6266 | 0.029 | 0.38 | YES |
| 77 | RPL6 | RPL6 | RPL6 | 6307 | 0.028 | 0.38 | YES |
| 78 | RPL8 | RPL8 | RPL8 | 6322 | 0.028 | 0.38 | YES |
| 79 | RPS8 | RPS8 | RPS8 | 6342 | 0.028 | 0.38 | YES |
| 80 | RPS12 | RPS12 | RPS12 | 6519 | 0.026 | 0.38 | YES |
| 81 | RAN | RAN | RAN | 6539 | 0.026 | 0.38 | YES |
| 82 | NUP188 | NUP188 | NUP188 | 6590 | 0.025 | 0.38 | YES |
| 83 | RPL13A | RPL13A | RPL13A | 6646 | 0.024 | 0.38 | YES |
| 84 | RAE1 | RAE1 | RAE1 | 6726 | 0.023 | 0.38 | YES |
| 85 | POLR2D | POLR2D | POLR2D | 6756 | 0.023 | 0.38 | YES |
| 86 | UBA52 | UBA52 | UBA52 | 6773 | 0.023 | 0.39 | YES |
| 87 | SEH1L | SEH1L | SEH1L | 6777 | 0.023 | 0.39 | YES |
| 88 | NUP214 | NUP214 | NUP214 | 6792 | 0.023 | 0.39 | YES |
| 89 | POLR2J | POLR2J | POLR2J | 6798 | 0.022 | 0.4 | YES |
| 90 | RPL5 | RPL5 | RPL5 | 6803 | 0.022 | 0.4 | YES |
| 91 | RPS3A | RPS3A | RPS3A | 6807 | 0.022 | 0.4 | YES |
| 92 | NUP85 | NUP85 | NUP85 | 7033 | 0.02 | 0.39 | NO |
| 93 | HSP90AA1 | HSP90AA1 | HSP90AA1 | 7134 | 0.018 | 0.39 | NO |
| 94 | RPL7A | RPL7A | RPL7A | 7555 | 0.013 | 0.37 | NO |
| 95 | NUP107 | NUP107 | NUP107 | 7609 | 0.012 | 0.37 | NO |
| 96 | POLR2C | POLR2C | POLR2C | 7765 | 0.01 | 0.36 | NO |
| 97 | NUP54 | NUP54 | NUP54 | 7773 | 0.01 | 0.36 | NO |
| 98 | RPS25 | RPS25 | RPS25 | 7786 | 0.01 | 0.36 | NO |
| 99 | NUP153 | NUP153 | NUP153 | 7800 | 0.01 | 0.36 | NO |
| 100 | POLR2G | POLR2G | POLR2G | 7844 | 0.0095 | 0.36 | NO |
| 101 | XPO1 | XPO1 | XPO1 | 7854 | 0.0093 | 0.36 | NO |
| 102 | NUP35 | NUP35 | NUP35 | 7961 | 0.008 | 0.36 | NO |
| 103 | RPL4 | RPL4 | RPL4 | 7983 | 0.0078 | 0.36 | NO |
| 104 | RPL19 | RPL19 | RPL19 | 8017 | 0.0073 | 0.36 | NO |
| 105 | NUPL2 | NUPL2 | NUPL2 | 8384 | 0.003 | 0.34 | NO |
| 106 | GRSF1 | GRSF1 | GRSF1 | 8480 | 0.0018 | 0.33 | NO |
| 107 | RPL26L1 | RPL26L1 | RPL26L1 | 8488 | 0.0017 | 0.33 | NO |
| 108 | IPO5 | IPO5 | IPO5 | 8737 | -0.0013 | 0.32 | NO |
| 109 | NUP88 | NUP88 | NUP88 | 9031 | -0.0047 | 0.3 | NO |
| 110 | POLR2E | POLR2E | POLR2E | 9135 | -0.0061 | 0.3 | NO |
| 111 | NUP43 | NUP43 | NUP43 | 9251 | -0.0074 | 0.29 | NO |
| 112 | NUP62 | NUP62 | NUP62 | 9261 | -0.0076 | 0.29 | NO |
| 113 | CLTA | CLTA | CLTA | 9539 | -0.011 | 0.28 | NO |
| 114 | KPNB1 | KPNB1 | KPNB1 | 9551 | -0.011 | 0.28 | NO |
| 115 | CANX | CANX | CANX | 9634 | -0.012 | 0.28 | NO |
| 116 | RPL7 | RPL7 | RPL7 | 9782 | -0.014 | 0.27 | NO |
| 117 | GTF2F2 | GTF2F2 | GTF2F2 | 9819 | -0.015 | 0.27 | NO |
| 118 | NUP93 | NUP93 | NUP93 | 9857 | -0.015 | 0.27 | NO |
| 119 | NUP205 | NUP205 | NUP205 | 9905 | -0.016 | 0.27 | NO |
| 120 | NUP133 | NUP133 | NUP133 | 10258 | -0.021 | 0.25 | NO |
| 121 | POLR2B | POLR2B | POLR2B | 10287 | -0.021 | 0.25 | NO |
| 122 | POLR2K | POLR2K | POLR2K | 10313 | -0.021 | 0.26 | NO |
| 123 | NUP37 | NUP37 | NUP37 | 10623 | -0.026 | 0.24 | NO |
| 124 | TPR | TPR | TPR | 10637 | -0.027 | 0.25 | NO |
| 125 | DNAJC3 | DNAJC3 | DNAJC3 | 11174 | -0.035 | 0.22 | NO |
| 126 | KPNA1 | KPNA1 | KPNA1 | 11259 | -0.037 | 0.22 | NO |
| 127 | NUP210 | NUP210 | NUP210 | 11480 | -0.041 | 0.22 | NO |
| 128 | RANBP2 | RANBP2 | RANBP2 | 11779 | -0.048 | 0.2 | NO |
| 129 | NUP50 | NUP50 | NUP50 | 11823 | -0.048 | 0.21 | NO |
| 130 | NUPL1 | NUPL1 | NUPL1 | 12304 | -0.061 | 0.19 | NO |
| 131 | NUP155 | NUP155 | NUP155 | 12495 | -0.066 | 0.19 | NO |
| 132 | CLTC | CLTC | CLTC | 12602 | -0.07 | 0.2 | NO |
| 133 | RPS27 | RPS27 | RPS27 | 13088 | -0.088 | 0.18 | NO |
| 134 | RPS4Y1 | RPS4Y1 | RPS4Y1 | 14512 | -0.16 | 0.13 | NO |
| 135 | FAM153A | FAM153A | FAM153A | 15115 | -0.21 | 0.12 | NO |
Figure S55. Get High-res Image This plot shows mRNAseq_cNMF expression data heatmap (on the left) a RunningEnrichmentScore(RES) plot (on the top right) and a Signal2Noise(S2N) plot (on the bottom right) of genes in the pathway: REACTOME SRP DEPENDENT COTRANSLATIONAL PROTEIN TARGETING TO MEMBRANE.
Figure S56. Get High-res Image For the top 5 core enriched genes in the pathway: REACTOME SRP DEPENDENT COTRANSLATIONAL PROTEIN TARGETING TO MEMBRANE, this volcano plot shows how much they are up/down-regulated and significant. The significance was calculated by empirical bayesian fit

Table S29. Get Full Table This table shows a Running Enrichment Score (RES) of each gene in this pathway, that is, the enrichment score at this point in the ranked list of genes. All genes are ranked by Signal-to-Noise (S2N), a measure of similarity as default and are used to obtain ES matrix of all genes. In this way, GSEA tool uses expression pattern of not only overlapped genes but also not-overlapped genes to produce ES matrix.
| Rank | GENE | SYMBOL | DESC | LIST.LOC | S2N | RES | CORE_ENRICHMENT |
|---|---|---|---|---|---|---|---|
| 1 | RPSAP9 | RPSAP9 | RPSAP9 | 981 | 0.21 | -0.022 | YES |
| 2 | RPS26 | RPS26 | RPS26 | 1570 | 0.16 | -0.03 | YES |
| 3 | RPL9 | RPL9 | RPL9 | 1646 | 0.15 | -0.0089 | YES |
| 4 | RPL36A | RPL36A | RPL36A | 2319 | 0.12 | -0.028 | YES |
| 5 | RPL21 | RPL21 | RPL21 | 2469 | 0.11 | -0.018 | YES |
| 6 | RPL37 | RPL37 | RPL37 | 2989 | 0.092 | -0.033 | YES |
| 7 | GSPT2 | GSPT2 | GSPT2 | 3108 | 0.088 | -0.025 | YES |
| 8 | RPL36 | RPL36 | RPL36 | 3302 | 0.083 | -0.023 | YES |
| 9 | RPL12 | RPL12 | RPL12 | 3427 | 0.079 | -0.016 | YES |
| 10 | RPS15 | RPS15 | RPS15 | 3447 | 0.079 | -0.0044 | YES |
| 11 | RPL35A | RPL35A | RPL35A | 3459 | 0.079 | 0.0082 | YES |
| 12 | RPL39 | RPL39 | RPL39 | 3594 | 0.075 | 0.013 | YES |
| 13 | RPL31 | RPL31 | RPL31 | 3739 | 0.072 | 0.017 | YES |
| 14 | RPS17 | RPS17 | RPS17 | 3843 | 0.069 | 0.022 | YES |
| 15 | RPL29 | RPL29 | RPL29 | 3854 | 0.069 | 0.033 | YES |
| 16 | RPL10A | RPL10A | RPL10A | 3899 | 0.068 | 0.042 | YES |
| 17 | RPL23 | RPL23 | RPL23 | 3936 | 0.067 | 0.051 | YES |
| 18 | RPS28 | RPS28 | RPS28 | 4069 | 0.064 | 0.054 | YES |
| 19 | SEC61A2 | SEC61A2 | SEC61A2 | 4075 | 0.064 | 0.065 | YES |
| 20 | RPL28 | RPL28 | RPL28 | 4148 | 0.063 | 0.071 | YES |
| 21 | RPL26 | RPL26 | RPL26 | 4178 | 0.062 | 0.08 | YES |
| 22 | RPL13 | RPL13 | RPL13 | 4188 | 0.062 | 0.09 | YES |
| 23 | EIF4EBP1 | EIF4EBP1 | EIF4EBP1 | 4232 | 0.061 | 0.097 | YES |
| 24 | RPS4X | RPS4X | RPS4X | 4284 | 0.06 | 0.1 | YES |
| 25 | RPL18 | RPL18 | RPL18 | 4314 | 0.059 | 0.11 | YES |
| 26 | RPS10 | RPS10 | RPS10 | 4324 | 0.059 | 0.12 | YES |
| 27 | RPL41 | RPL41 | RPL41 | 4385 | 0.058 | 0.13 | YES |
| 28 | RPL17 | RPL17 | RPL17 | 4475 | 0.056 | 0.13 | YES |
| 29 | SRPRB | SRPRB | SRPRB | 4478 | 0.056 | 0.14 | YES |
| 30 | RPS15A | RPS15A | RPS15A | 4511 | 0.055 | 0.15 | YES |
| 31 | RPL34 | RPL34 | RPL34 | 4515 | 0.055 | 0.16 | YES |
| 32 | RPL32 | RPL32 | RPL32 | 4525 | 0.055 | 0.17 | YES |
| 33 | RPL38 | RPL38 | RPL38 | 4542 | 0.055 | 0.18 | YES |
| 34 | EEF1B2 | EEF1B2 | EEF1B2 | 4595 | 0.054 | 0.18 | YES |
| 35 | RPL22 | RPL22 | RPL22 | 4610 | 0.053 | 0.19 | YES |
| 36 | RPL37A | RPL37A | RPL37A | 4626 | 0.053 | 0.2 | YES |
| 37 | EIF2B4 | EIF2B4 | EIF2B4 | 4668 | 0.052 | 0.2 | YES |
| 38 | EIF4A2 | EIF4A2 | EIF4A2 | 4714 | 0.052 | 0.21 | YES |
| 39 | RPL18A | RPL18A | RPL18A | 4743 | 0.051 | 0.22 | YES |
| 40 | RPS14 | RPS14 | RPS14 | 4763 | 0.051 | 0.22 | YES |
| 41 | RPS24 | RPS24 | RPS24 | 4772 | 0.051 | 0.23 | YES |
| 42 | RPS20 | RPS20 | RPS20 | 4802 | 0.05 | 0.24 | YES |
| 43 | RPL35 | RPL35 | RPL35 | 4891 | 0.048 | 0.24 | YES |
| 44 | RPL27 | RPL27 | RPL27 | 4987 | 0.047 | 0.24 | YES |
| 45 | RPLP2 | RPLP2 | RPLP2 | 4996 | 0.047 | 0.25 | YES |
| 46 | RPS2 | RPS2 | RPS2 | 5025 | 0.046 | 0.26 | YES |
| 47 | RPSA | RPSA | RPSA | 5045 | 0.046 | 0.26 | YES |
| 48 | RPS23 | RPS23 | RPS23 | 5068 | 0.045 | 0.27 | YES |
| 49 | RPS18 | RPS18 | RPS18 | 5225 | 0.043 | 0.27 | YES |
| 50 | RPL23A | RPL23A | RPL23A | 5256 | 0.043 | 0.27 | YES |
| 51 | RPS5 | RPS5 | RPS5 | 5278 | 0.042 | 0.28 | YES |
| 52 | RPL14 | RPL14 | RPL14 | 5284 | 0.042 | 0.29 | YES |
| 53 | RPS9 | RPS9 | RPS9 | 5288 | 0.042 | 0.29 | YES |
| 54 | RPLP1 | RPLP1 | RPLP1 | 5334 | 0.041 | 0.3 | YES |
| 55 | RPS7 | RPS7 | RPS7 | 5348 | 0.041 | 0.3 | YES |
| 56 | RPL10 | RPL10 | RPL10 | 5428 | 0.04 | 0.31 | YES |
| 57 | RPL24 | RPL24 | RPL24 | 5429 | 0.04 | 0.31 | YES |
| 58 | RPS13 | RPS13 | RPS13 | 5577 | 0.038 | 0.31 | YES |
| 59 | RPS11 | RPS11 | RPS11 | 5664 | 0.037 | 0.31 | YES |
| 60 | RPL11 | RPL11 | RPL11 | 5717 | 0.036 | 0.32 | YES |
| 61 | RPS21 | RPS21 | RPS21 | 5720 | 0.036 | 0.32 | YES |
| 62 | RPL30 | RPL30 | RPL30 | 5769 | 0.035 | 0.32 | YES |
| 63 | RPS16 | RPS16 | RPS16 | 5783 | 0.035 | 0.33 | YES |
| 64 | RPS27A | RPS27A | RPS27A | 5809 | 0.035 | 0.33 | YES |
| 65 | EIF5 | EIF5 | EIF5 | 5812 | 0.035 | 0.34 | YES |
| 66 | RPL27A | RPL27A | RPL27A | 5854 | 0.034 | 0.34 | YES |
| 67 | RPS3 | RPS3 | RPS3 | 5858 | 0.034 | 0.35 | YES |
| 68 | RPS6 | RPS6 | RPS6 | 5872 | 0.034 | 0.35 | YES |
| 69 | SEC61G | SEC61G | SEC61G | 5882 | 0.034 | 0.36 | YES |
| 70 | EIF3B | EIF3B | EIF3B | 5887 | 0.034 | 0.36 | YES |
| 71 | RPS19 | RPS19 | RPS19 | 5890 | 0.034 | 0.37 | YES |
| 72 | RPL15 | RPL15 | RPL15 | 5903 | 0.034 | 0.38 | YES |
| 73 | FAU | FAU | FAU | 5975 | 0.033 | 0.38 | YES |
| 74 | RPLP0 | RPLP0 | RPLP0 | 5994 | 0.033 | 0.38 | YES |
| 75 | RPS29 | RPS29 | RPS29 | 6231 | 0.03 | 0.37 | YES |
| 76 | SSR4 | SSR4 | SSR4 | 6264 | 0.029 | 0.38 | YES |
| 77 | RPL3 | RPL3 | RPL3 | 6266 | 0.029 | 0.38 | YES |
| 78 | RPL6 | RPL6 | RPL6 | 6307 | 0.028 | 0.38 | YES |
| 79 | RPL8 | RPL8 | RPL8 | 6322 | 0.028 | 0.39 | YES |
| 80 | SEC61B | SEC61B | SEC61B | 6339 | 0.028 | 0.39 | YES |
| 81 | RPS8 | RPS8 | RPS8 | 6342 | 0.028 | 0.39 | YES |
| 82 | ETF1 | ETF1 | ETF1 | 6410 | 0.027 | 0.4 | YES |
| 83 | SPCS1 | SPCS1 | SPCS1 | 6431 | 0.027 | 0.4 | YES |
| 84 | RPS12 | RPS12 | RPS12 | 6519 | 0.026 | 0.4 | YES |
| 85 | EIF2S3 | EIF2S3 | EIF2S3 | 6596 | 0.025 | 0.4 | YES |
| 86 | RPL13A | RPL13A | RPL13A | 6646 | 0.024 | 0.4 | YES |
| 87 | EIF4A1 | EIF4A1 | EIF4A1 | 6651 | 0.024 | 0.4 | YES |
| 88 | UBA52 | UBA52 | UBA52 | 6773 | 0.023 | 0.4 | YES |
| 89 | EEF2 | EEF2 | EEF2 | 6781 | 0.023 | 0.4 | YES |
| 90 | RPL5 | RPL5 | RPL5 | 6803 | 0.022 | 0.4 | YES |
| 91 | RPS3A | RPS3A | RPS3A | 6807 | 0.022 | 0.41 | YES |
| 92 | EIF2B5 | EIF2B5 | EIF2B5 | 7000 | 0.02 | 0.4 | NO |
| 93 | SSR2 | SSR2 | SSR2 | 7043 | 0.02 | 0.4 | NO |
| 94 | EIF3E | EIF3E | EIF3E | 7047 | 0.02 | 0.4 | NO |
| 95 | EIF3I | EIF3I | EIF3I | 7060 | 0.019 | 0.41 | NO |
| 96 | EIF1AX | EIF1AX | EIF1AX | 7314 | 0.016 | 0.4 | NO |
| 97 | EEF1D | EEF1D | EEF1D | 7412 | 0.014 | 0.39 | NO |
| 98 | SRP14 | SRP14 | SRP14 | 7519 | 0.013 | 0.39 | NO |
| 99 | RPL7A | RPL7A | RPL7A | 7555 | 0.013 | 0.39 | NO |
| 100 | EIF3J | EIF3J | EIF3J | 7564 | 0.013 | 0.39 | NO |
| 101 | EIF4E | EIF4E | EIF4E | 7590 | 0.012 | 0.39 | NO |
| 102 | EIF3F | EIF3F | EIF3F | 7677 | 0.012 | 0.39 | NO |
| 103 | EIF3H | EIF3H | EIF3H | 7733 | 0.011 | 0.39 | NO |
| 104 | EIF3G | EIF3G | EIF3G | 7762 | 0.01 | 0.39 | NO |
| 105 | RPS25 | RPS25 | RPS25 | 7786 | 0.01 | 0.39 | NO |
| 106 | EEF1A1 | EEF1A1 | EEF1A1 | 7810 | 0.0099 | 0.39 | NO |
| 107 | EEF1G | EEF1G | EEF1G | 7916 | 0.0086 | 0.38 | NO |
| 108 | RPL4 | RPL4 | RPL4 | 7983 | 0.0078 | 0.38 | NO |
| 109 | RPL19 | RPL19 | RPL19 | 8017 | 0.0073 | 0.38 | NO |
| 110 | EIF4H | EIF4H | EIF4H | 8270 | 0.0044 | 0.36 | NO |
| 111 | EIF2B2 | EIF2B2 | EIF2B2 | 8318 | 0.0038 | 0.36 | NO |
| 112 | SEC11C | SEC11C | SEC11C | 8373 | 0.0032 | 0.36 | NO |
| 113 | RPL26L1 | RPL26L1 | RPL26L1 | 8488 | 0.0017 | 0.35 | NO |
| 114 | RPN2 | RPN2 | RPN2 | 8505 | 0.0015 | 0.35 | NO |
| 115 | EIF3C | EIF3C | EIF3C | 8519 | 0.0014 | 0.35 | NO |
| 116 | SEC61A1 | SEC61A1 | SEC61A1 | 8673 | -0.00061 | 0.34 | NO |
| 117 | EIF2B3 | EIF2B3 | EIF2B3 | 8726 | -0.0012 | 0.34 | NO |
| 118 | DDOST | DDOST | DDOST | 8762 | -0.0016 | 0.34 | NO |
| 119 | EIF3A | EIF3A | EIF3A | 8812 | -0.0022 | 0.34 | NO |
| 120 | EIF3K | EIF3K | EIF3K | 8873 | -0.0029 | 0.33 | NO |
| 121 | SRP19 | SRP19 | SRP19 | 8951 | -0.0037 | 0.33 | NO |
| 122 | EIF2B1 | EIF2B1 | EIF2B1 | 9012 | -0.0044 | 0.33 | NO |
| 123 | EIF5B | EIF5B | EIF5B | 9099 | -0.0056 | 0.32 | NO |
| 124 | SRP72 | SRP72 | SRP72 | 9228 | -0.0072 | 0.32 | NO |
| 125 | EIF4B | EIF4B | EIF4B | 9319 | -0.0082 | 0.31 | NO |
| 126 | TRAM1 | TRAM1 | TRAM1 | 9397 | -0.0092 | 0.31 | NO |
| 127 | SRP68 | SRP68 | SRP68 | 9450 | -0.01 | 0.31 | NO |
| 128 | PABPC1 | PABPC1 | PABPC1 | 9502 | -0.011 | 0.31 | NO |
| 129 | SRP9 | SRP9 | SRP9 | 9640 | -0.012 | 0.3 | NO |
| 130 | EIF4G1 | EIF4G1 | EIF4G1 | 9722 | -0.014 | 0.3 | NO |
| 131 | EIF3D | EIF3D | EIF3D | 9728 | -0.014 | 0.3 | NO |
| 132 | RPL7 | RPL7 | RPL7 | 9782 | -0.014 | 0.3 | NO |
| 133 | RPN1 | RPN1 | RPN1 | 9967 | -0.017 | 0.29 | NO |
| 134 | SRPR | SRPR | SRPR | 9999 | -0.017 | 0.29 | NO |
| 135 | EIF2S2 | EIF2S2 | EIF2S2 | 10207 | -0.02 | 0.28 | NO |
| 136 | SSR3 | SSR3 | SSR3 | 10486 | -0.024 | 0.27 | NO |
| 137 | SPCS3 | SPCS3 | SPCS3 | 10664 | -0.027 | 0.27 | NO |
| 138 | LOC653566 | LOC653566 | LOC653566 | 10887 | -0.03 | 0.26 | NO |
| 139 | SPCS2 | SPCS2 | SPCS2 | 10943 | -0.031 | 0.26 | NO |
| 140 | SEC11A | SEC11A | SEC11A | 11625 | -0.044 | 0.23 | NO |
| 141 | SRP54 | SRP54 | SRP54 | 11644 | -0.045 | 0.24 | NO |
| 142 | EIF2S1 | EIF2S1 | EIF2S1 | 11703 | -0.046 | 0.24 | NO |
| 143 | SSR1 | SSR1 | SSR1 | 11875 | -0.049 | 0.24 | NO |
| 144 | RPS27 | RPS27 | RPS27 | 13088 | -0.088 | 0.18 | NO |
| 145 | RPS4Y1 | RPS4Y1 | RPS4Y1 | 14512 | -0.16 | 0.12 | NO |
| 146 | FAM153A | FAM153A | FAM153A | 15115 | -0.21 | 0.12 | NO |
Figure S57. Get High-res Image This plot shows mRNAseq_cNMF expression data heatmap (on the left) a RunningEnrichmentScore(RES) plot (on the top right) and a Signal2Noise(S2N) plot (on the bottom right) of genes in the pathway: REACTOME ACTIVATION OF THE MRNA UPON BINDING OF THE CAP BINDING COMPLEX AND EIFS AND SUBSEQUENT BINDING TO 43S.
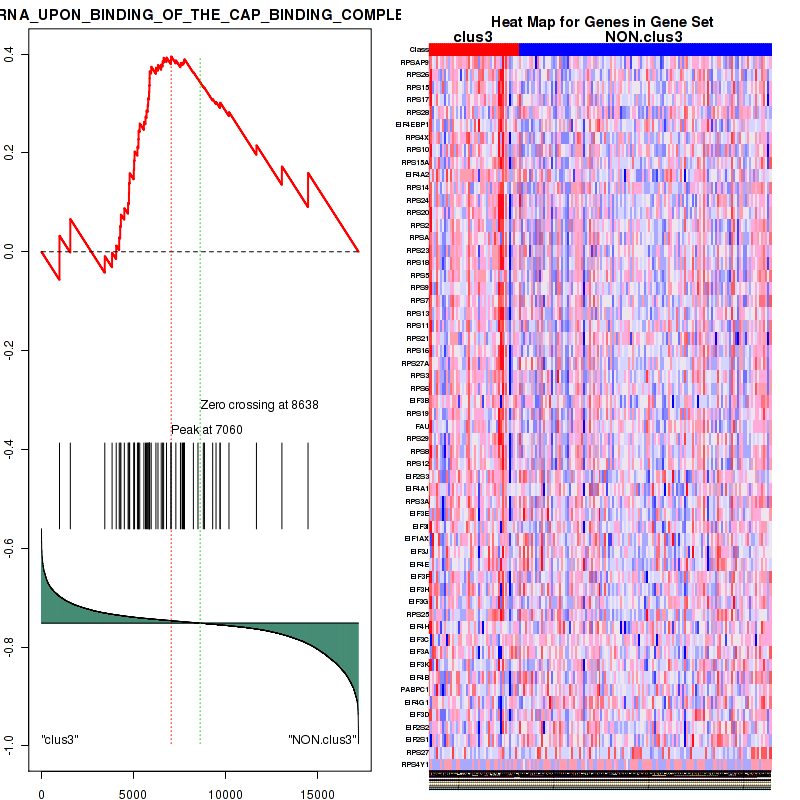
Figure S58. Get High-res Image For the top 5 core enriched genes in the pathway: REACTOME ACTIVATION OF THE MRNA UPON BINDING OF THE CAP BINDING COMPLEX AND EIFS AND SUBSEQUENT BINDING TO 43S, this volcano plot shows how much they are up/down-regulated and significant. The significance was calculated by empirical bayesian fit
Table S30. Get Full Table This table shows a Running Enrichment Score (RES) of each gene in this pathway, that is, the enrichment score at this point in the ranked list of genes. All genes are ranked by Signal-to-Noise (S2N), a measure of similarity as default and are used to obtain ES matrix of all genes. In this way, GSEA tool uses expression pattern of not only overlapped genes but also not-overlapped genes to produce ES matrix.
| Rank | GENE | SYMBOL | DESC | LIST.LOC | S2N | RES | CORE_ENRICHMENT |
|---|---|---|---|---|---|---|---|
| 1 | RPSAP9 | RPSAP9 | RPSAP9 | 981 | 0.21 | -0.015 | YES |
| 2 | RPS26 | RPS26 | RPS26 | 1570 | 0.16 | -0.017 | YES |
| 3 | RPL9 | RPL9 | RPL9 | 1646 | 0.15 | 0.0092 | YES |
| 4 | RPL36A | RPL36A | RPL36A | 2319 | 0.12 | -0.006 | YES |
| 5 | RPL21 | RPL21 | RPL21 | 2469 | 0.11 | 0.0078 | YES |
| 6 | RPL37 | RPL37 | RPL37 | 2989 | 0.092 | -0.0038 | YES |
| 7 | RPL36 | RPL36 | RPL36 | 3302 | 0.083 | -0.0052 | YES |
| 8 | RPL12 | RPL12 | RPL12 | 3427 | 0.079 | 0.0036 | YES |
| 9 | RPS15 | RPS15 | RPS15 | 3447 | 0.079 | 0.018 | YES |
| 10 | RPL35A | RPL35A | RPL35A | 3459 | 0.079 | 0.034 | YES |
| 11 | RPL39 | RPL39 | RPL39 | 3594 | 0.075 | 0.041 | YES |
| 12 | RPL31 | RPL31 | RPL31 | 3739 | 0.072 | 0.047 | YES |
| 13 | RPS17 | RPS17 | RPS17 | 3843 | 0.069 | 0.055 | YES |
| 14 | RPL29 | RPL29 | RPL29 | 3854 | 0.069 | 0.069 | YES |
| 15 | RPL10A | RPL10A | RPL10A | 3899 | 0.068 | 0.08 | YES |
| 16 | RPL23 | RPL23 | RPL23 | 3936 | 0.067 | 0.091 | YES |
| 17 | RPS28 | RPS28 | RPS28 | 4069 | 0.064 | 0.096 | YES |
| 18 | RPL28 | RPL28 | RPL28 | 4148 | 0.063 | 0.1 | YES |
| 19 | RPL26 | RPL26 | RPL26 | 4178 | 0.062 | 0.12 | YES |
| 20 | RPL13 | RPL13 | RPL13 | 4188 | 0.062 | 0.13 | YES |
| 21 | RPS4X | RPS4X | RPS4X | 4284 | 0.06 | 0.13 | YES |
| 22 | RPL18 | RPL18 | RPL18 | 4314 | 0.059 | 0.14 | YES |
| 23 | RPS10 | RPS10 | RPS10 | 4324 | 0.059 | 0.16 | YES |
| 24 | RPL41 | RPL41 | RPL41 | 4385 | 0.058 | 0.16 | YES |
| 25 | RPL17 | RPL17 | RPL17 | 4475 | 0.056 | 0.17 | YES |
| 26 | RPS15A | RPS15A | RPS15A | 4511 | 0.055 | 0.18 | YES |
| 27 | RPL34 | RPL34 | RPL34 | 4515 | 0.055 | 0.19 | YES |
| 28 | RPL32 | RPL32 | RPL32 | 4525 | 0.055 | 0.2 | YES |
| 29 | RPL38 | RPL38 | RPL38 | 4542 | 0.055 | 0.21 | YES |
| 30 | RPL22 | RPL22 | RPL22 | 4610 | 0.053 | 0.22 | YES |
| 31 | RPL37A | RPL37A | RPL37A | 4626 | 0.053 | 0.23 | YES |
| 32 | EIF4A2 | EIF4A2 | EIF4A2 | 4714 | 0.052 | 0.23 | YES |
| 33 | RPL18A | RPL18A | RPL18A | 4743 | 0.051 | 0.24 | YES |
| 34 | RPS14 | RPS14 | RPS14 | 4763 | 0.051 | 0.25 | YES |
| 35 | RPS24 | RPS24 | RPS24 | 4772 | 0.051 | 0.26 | YES |
| 36 | RPS20 | RPS20 | RPS20 | 4802 | 0.05 | 0.27 | YES |
| 37 | RPL35 | RPL35 | RPL35 | 4891 | 0.048 | 0.27 | YES |
| 38 | RPL27 | RPL27 | RPL27 | 4987 | 0.047 | 0.28 | YES |
| 39 | RPLP2 | RPLP2 | RPLP2 | 4996 | 0.047 | 0.29 | YES |
| 40 | RPS2 | RPS2 | RPS2 | 5025 | 0.046 | 0.3 | YES |
| 41 | RPSA | RPSA | RPSA | 5045 | 0.046 | 0.3 | YES |
| 42 | RPS23 | RPS23 | RPS23 | 5068 | 0.045 | 0.31 | YES |
| 43 | RPS18 | RPS18 | RPS18 | 5225 | 0.043 | 0.31 | YES |
| 44 | RPL23A | RPL23A | RPL23A | 5256 | 0.043 | 0.32 | YES |
| 45 | RPS5 | RPS5 | RPS5 | 5278 | 0.042 | 0.32 | YES |
| 46 | RPL14 | RPL14 | RPL14 | 5284 | 0.042 | 0.33 | YES |
| 47 | RPS9 | RPS9 | RPS9 | 5288 | 0.042 | 0.34 | YES |
| 48 | RPLP1 | RPLP1 | RPLP1 | 5334 | 0.041 | 0.35 | YES |
| 49 | RPS7 | RPS7 | RPS7 | 5348 | 0.041 | 0.36 | YES |
| 50 | RPL10 | RPL10 | RPL10 | 5428 | 0.04 | 0.36 | YES |
| 51 | RPL24 | RPL24 | RPL24 | 5429 | 0.04 | 0.37 | YES |
| 52 | RPS13 | RPS13 | RPS13 | 5577 | 0.038 | 0.36 | YES |
| 53 | RPS11 | RPS11 | RPS11 | 5664 | 0.037 | 0.37 | YES |
| 54 | RPL11 | RPL11 | RPL11 | 5717 | 0.036 | 0.37 | YES |
| 55 | RPS21 | RPS21 | RPS21 | 5720 | 0.036 | 0.38 | YES |
| 56 | RPL30 | RPL30 | RPL30 | 5769 | 0.035 | 0.38 | YES |
| 57 | RPS16 | RPS16 | RPS16 | 5783 | 0.035 | 0.39 | YES |
| 58 | RPS27A | RPS27A | RPS27A | 5809 | 0.035 | 0.4 | YES |
| 59 | RPL27A | RPL27A | RPL27A | 5854 | 0.034 | 0.4 | YES |
| 60 | RPS3 | RPS3 | RPS3 | 5858 | 0.034 | 0.41 | YES |
| 61 | RPS6 | RPS6 | RPS6 | 5872 | 0.034 | 0.41 | YES |
| 62 | EIF3B | EIF3B | EIF3B | 5887 | 0.034 | 0.42 | YES |
| 63 | RPS19 | RPS19 | RPS19 | 5890 | 0.034 | 0.43 | YES |
| 64 | RPL15 | RPL15 | RPL15 | 5903 | 0.034 | 0.43 | YES |
| 65 | FAU | FAU | FAU | 5975 | 0.033 | 0.43 | YES |
| 66 | RPLP0 | RPLP0 | RPLP0 | 5994 | 0.033 | 0.44 | YES |
| 67 | RPS29 | RPS29 | RPS29 | 6231 | 0.03 | 0.43 | YES |
| 68 | RPL3 | RPL3 | RPL3 | 6266 | 0.029 | 0.44 | YES |
| 69 | RPL6 | RPL6 | RPL6 | 6307 | 0.028 | 0.44 | YES |
| 70 | RPL8 | RPL8 | RPL8 | 6322 | 0.028 | 0.44 | YES |
| 71 | RPS8 | RPS8 | RPS8 | 6342 | 0.028 | 0.45 | YES |
| 72 | RPS12 | RPS12 | RPS12 | 6519 | 0.026 | 0.44 | YES |
| 73 | EIF2S3 | EIF2S3 | EIF2S3 | 6596 | 0.025 | 0.44 | YES |
| 74 | RPL13A | RPL13A | RPL13A | 6646 | 0.024 | 0.45 | YES |
| 75 | EIF4A1 | EIF4A1 | EIF4A1 | 6651 | 0.024 | 0.45 | YES |
| 76 | UBA52 | UBA52 | UBA52 | 6773 | 0.023 | 0.45 | YES |
| 77 | RPL5 | RPL5 | RPL5 | 6803 | 0.022 | 0.45 | YES |
| 78 | RPS3A | RPS3A | RPS3A | 6807 | 0.022 | 0.46 | YES |
| 79 | EIF3E | EIF3E | EIF3E | 7047 | 0.02 | 0.45 | NO |
| 80 | EIF3I | EIF3I | EIF3I | 7060 | 0.019 | 0.45 | NO |
| 81 | EIF1AX | EIF1AX | EIF1AX | 7314 | 0.016 | 0.44 | NO |
| 82 | RPL7A | RPL7A | RPL7A | 7555 | 0.013 | 0.43 | NO |
| 83 | EIF3J | EIF3J | EIF3J | 7564 | 0.013 | 0.43 | NO |
| 84 | EIF4E | EIF4E | EIF4E | 7590 | 0.012 | 0.43 | NO |
| 85 | EIF3F | EIF3F | EIF3F | 7677 | 0.012 | 0.43 | NO |
| 86 | EIF3H | EIF3H | EIF3H | 7733 | 0.011 | 0.43 | NO |
| 87 | EIF3G | EIF3G | EIF3G | 7762 | 0.01 | 0.43 | NO |
| 88 | RPS25 | RPS25 | RPS25 | 7786 | 0.01 | 0.43 | NO |
| 89 | RPL4 | RPL4 | RPL4 | 7983 | 0.0078 | 0.42 | NO |
| 90 | RPL19 | RPL19 | RPL19 | 8017 | 0.0073 | 0.42 | NO |
| 91 | EIF4H | EIF4H | EIF4H | 8270 | 0.0044 | 0.4 | NO |
| 92 | RPL26L1 | RPL26L1 | RPL26L1 | 8488 | 0.0017 | 0.39 | NO |
| 93 | EIF3C | EIF3C | EIF3C | 8519 | 0.0014 | 0.39 | NO |
| 94 | EIF3A | EIF3A | EIF3A | 8812 | -0.0022 | 0.37 | NO |
| 95 | EIF3K | EIF3K | EIF3K | 8873 | -0.0029 | 0.37 | NO |
| 96 | EIF4B | EIF4B | EIF4B | 9319 | -0.0082 | 0.34 | NO |
| 97 | PABPC1 | PABPC1 | PABPC1 | 9502 | -0.011 | 0.34 | NO |
| 98 | EIF4G1 | EIF4G1 | EIF4G1 | 9722 | -0.014 | 0.33 | NO |
| 99 | EIF3D | EIF3D | EIF3D | 9728 | -0.014 | 0.33 | NO |
| 100 | RPL7 | RPL7 | RPL7 | 9782 | -0.014 | 0.33 | NO |
| 101 | EIF2S2 | EIF2S2 | EIF2S2 | 10207 | -0.02 | 0.31 | NO |
| 102 | EIF2S1 | EIF2S1 | EIF2S1 | 11703 | -0.046 | 0.23 | NO |
| 103 | RPS27 | RPS27 | RPS27 | 13088 | -0.088 | 0.17 | NO |
| 104 | RPS4Y1 | RPS4Y1 | RPS4Y1 | 14512 | -0.16 | 0.12 | NO |
| 105 | FAM153A | FAM153A | FAM153A | 15115 | -0.21 | 0.12 | NO |
Figure S59. Get High-res Image This plot shows mRNAseq_cNMF expression data heatmap (on the left) a RunningEnrichmentScore(RES) plot (on the top right) and a Signal2Noise(S2N) plot (on the bottom right) of genes in the pathway: REACTOME PEPTIDE CHAIN ELONGATION.
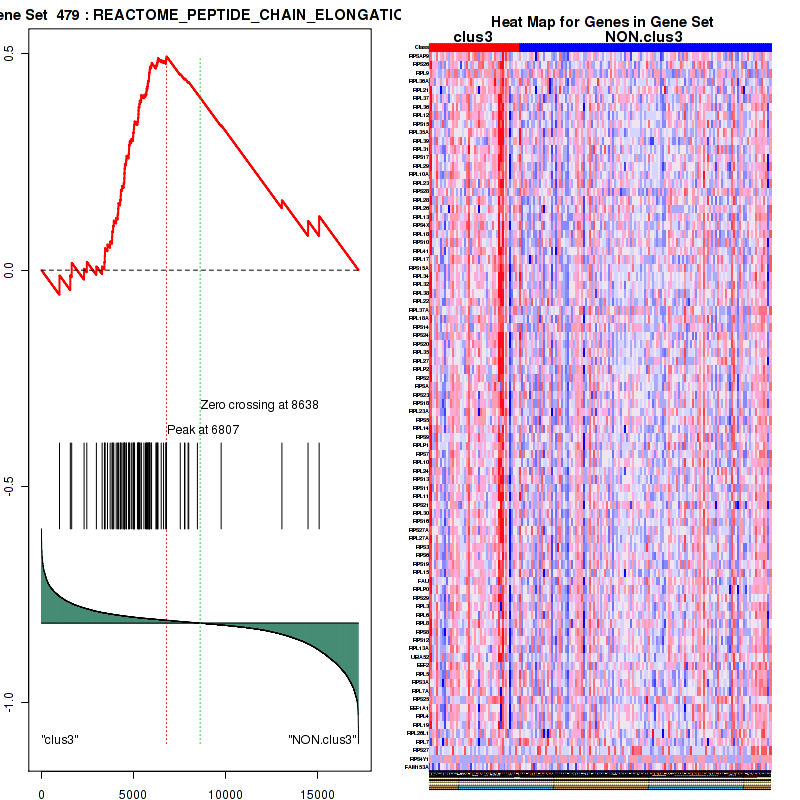
Figure S60. Get High-res Image For the top 5 core enriched genes in the pathway: REACTOME PEPTIDE CHAIN ELONGATION, this volcano plot shows how much they are up/down-regulated and significant. The significance was calculated by empirical bayesian fit
For the top enriched genes, if you want to check whether they are
-
up-regulated, please check the list of up-regulated genes
-
down-regulated, please check the list of down-regulated genes
For the top enriched genes, if you want to check whether they are
-
highly expressed genes, please check the list of high (top 30%) expressed genes
-
low expressed genes, please check the list of low (bottom 30%) expressed genes
An expression pattern of top(30%)/middle(30%)/low(30%) in this subtype against other subtypes is available in a heatmap
For the top enriched genes, if you want to check whether they are
-
significantly differently expressed genes by eBayes lm fit, please check the list of significant genes
-
Gene set database = c2.cp.v4.0.symbols.gmt
-
Expression data file = LAML-TB.uncv2.mRNAseq_RSEM_normalized_log2.txt
-
Phenotype data file = LAML-TB.mergedcluster.txt
For the Gene Set Enrichment Analysis (GSEA), Broad GSEA-P-R.1.0 version is used with class2: canonical pathways geneses from MSigDB. Further details about statistics are available inThe Broad GSEA website.
In addition to the links below, the full results of the analysis summarized in this report can also be downloaded programmatically using firehose_get, or interactively from either the Broad GDAC website or TCGA Data Coordination Center Portal.