This pipeline performs Gene Set Enrichment Analysis (GSEA) using The Broad Institute GSEA tool with MSigDB - Class2: Canonical Pathways gene sets. For a given phenotype subtype, it shows what pathways are significantly enriched in each subtype by comparing gene expression profiles between subtypes. Here, the phenotype is mRNAseq_cNMF subtypes having more than three samples and the input expression file "LUAD-TP.uncv2.mRNAseq_RSEM_normalized_log2.txt" is generated in the pipeline mRNAseq_Preprocess in the stddata run. This pipeline has the following features:
-
For each subtype, calculates enrichment scores (ES) using signal to noise (S2N) that checks similarity between subtypes in expression level then calculates p values through permutation test.
-
Lists pathways significantly enriched in each phenotype subtype and their enrichment scores (ES).
-
Lists top 20 core genes enriched in each significant gene set and their enrichment scores (ES).
-
Checks if the top core genes are up-regulated or down-regulated.
-
Checks if the top core genes are high expressed or low expressed.
-
Checks if the top core genes are significantly differently expressed genes.
Table 1. Get Full Table basic data info
| basic data info |
|---|
| Number of Gene Sets: 714 |
| Number of samples: 515 |
| Original number of Gene Sets: 1320 |
| Maximum gene set size: 933 |
Table 2. Get Full Table pheno data info
| phenotype info |
|---|
| pheno.type: 1 - 5 :[ clus1 ] 132 |
| pheno.type: 2 - 5 :[ clus2 ] 120 |
| pheno.type: 3 - 5 :[ clus3 ] 90 |
| pheno.type: 4 - 5 :[ clus4 ] 115 |
| pheno.type: 5 - 5 :[ clus5 ] 58 |
For the expression subtypes of 18319 genes in 516 samples, GSEA found enriched gene sets in each cluster using 515 gene sets in MSigDB canonical pathways. Top enriched gene sets are listed as below.
-
clus1
-
Top enriched gene sets are KEGG DNA REPLICATION, KEGG CELL CYCLE, KEGG PATHOGENIC ESCHERICHIA COLI INFECTION, BIOCARTA FAS PATHWAY, BIOCARTA VEGF PATHWAY, PID HDAC CLASSII PATHWAY, PID AVB3 OPN PATHWAY, PID ILK PATHWAY, PID TCPTP PATHWAY, PID TELOMERASEPATHWAY
-
And common core enriched genes are GRB2, CDK1, MAPK11, MAPK13, MAPK14, MAPKAPK2, MAPKAPK3, NGF, NRAS, NTRK1
-
clus2
-
Top enriched gene sets are KEGG FATTY ACID METABOLISM, KEGG VALINE LEUCINE AND ISOLEUCINE DEGRADATION, KEGG ARACHIDONIC ACID METABOLISM, KEGG PROPANOATE METABOLISM, KEGG ALDOSTERONE REGULATED SODIUM REABSORPTION, KEGG VASOPRESSIN REGULATED WATER REABSORPTION, KEGG VIRAL MYOCARDITIS, BIOCARTA FCER1 PATHWAY, ST ADRENERGIC, ST WNT BETA CATENIN PATHWAY
-
And common core enriched genes are NEDD4L, ARRB2, ADCY9, AQP2, AQP3, AQP4, AVPR2, CREB3L1, DYNC2H1, VAMP2
-
clus3
-
Top enriched gene sets are KEGG DNA REPLICATION, KEGG SPLICEOSOME, KEGG PROTEASOME, KEGG NUCLEOTIDE EXCISION REPAIR, KEGG CELL CYCLE, KEGG P53 SIGNALING PATHWAY, KEGG UBIQUITIN MEDIATED PROTEOLYSIS, BIOCARTA G1 PATHWAY, BIOCARTA HIVNEF PATHWAY, BIOCARTA PROTEASOME PATHWAY
-
And common core enriched genes are PSMA1, PSMA2, PSMA3, PSMA4, PSMA5, PSMA8, PSMB1, PSMB10, PSMB2, PSMB3
-
clus4
-
Top enriched gene sets are KEGG AMINOACYL TRNA BIOSYNTHESIS, KEGG RNA DEGRADATION, REACTOME METABOLISM OF NON CODING RNA, REACTOME CELL CYCLE, REACTOME MITOCHONDRIAL PROTEIN IMPORT, REACTOME PROCESSING OF CAPPED INTRON CONTAINING PRE MRNA, REACTOME TRANSPORT OF MATURE TRANSCRIPT TO CYTOPLASM, REACTOME RNA POL II TRANSCRIPTION, REACTOME RNA POL III TRANSCRIPTION, REACTOME RECRUITMENT OF MITOTIC CENTROSOME PROTEINS AND COMPLEXES
-
And common core enriched genes are PAPOLA, LSM2, CPSF1, CPSF2, CPSF3, CPSF7, CSTF1, CSTF2, CSTF3, GTF2F2
-
clus5
-
Top enriched gene sets are KEGG GLYCOLYSIS GLUCONEOGENESIS, KEGG FATTY ACID METABOLISM, KEGG STEROID HORMONE BIOSYNTHESIS, KEGG TYROSINE METABOLISM, KEGG GLUTATHIONE METABOLISM, KEGG STARCH AND SUCROSE METABOLISM, KEGG GLYCEROPHOSPHOLIPID METABOLISM, KEGG LINOLEIC ACID METABOLISM, KEGG SPHINGOLIPID METABOLISM, KEGG RETINOL METABOLISM
-
And common core enriched genes are NRG1, NRG2, DNAH1, DNAH2, DNAH3, DNAI1, DNAI2, DNALI1, GRM5, PLCB4
Table 3. Get Full Table This table shows top 10 pathways which are significantly enriched in cluster clus1. It displays only significant gene sets satisfying nom.p.val.threshold (-1), fwer.p.val.threshold (-1) , fdr.q.val.threshold (0.25) and the default table is sorted by Normalized Enrichment Score (NES). Further details on NES statistics, please visit The Broad GSEA website.
| GeneSet(GS) | Size(#genes) | genes.ES.table | ES | NES | NOM.p.val | FDR.q.val | FWER.p.val | Tag.. | Gene.. | Signal | FDR..median. | glob.p.val |
|---|---|---|---|---|---|---|---|---|---|---|---|---|
| KEGG DNA REPLICATION | 36 | genes.ES.table | 0.62 | 1.5 | 0.1 | 1 | 0.98 | 0.56 | 0.27 | 0.41 | 1 | 0.59 |
| KEGG CELL CYCLE | 118 | genes.ES.table | 0.5 | 1.5 | 0.12 | 1 | 0.98 | 0.35 | 0.2 | 0.28 | 1 | 0.5 |
| KEGG PATHOGENIC ESCHERICHIA COLI INFECTION | 53 | genes.ES.table | 0.4 | 1.5 | 0.031 | 1 | 0.98 | 0.43 | 0.27 | 0.32 | 1 | 0.56 |
| BIOCARTA FAS PATHWAY | 30 | genes.ES.table | 0.44 | 1.6 | 0.089 | 1 | 0.96 | 0.57 | 0.33 | 0.38 | 1 | 0.68 |
| BIOCARTA VEGF PATHWAY | 29 | genes.ES.table | 0.44 | 1.6 | 0.074 | 1 | 0.96 | 0.14 | 0.1 | 0.12 | 1 | 0.6 |
| PID HDAC CLASSII PATHWAY | 34 | genes.ES.table | 0.4 | 1.5 | 0.072 | 1 | 0.98 | 0.12 | 0.13 | 0.1 | 1 | 0.54 |
| PID AVB3 OPN PATHWAY | 31 | genes.ES.table | 0.51 | 1.6 | 0.057 | 1 | 0.96 | 0.19 | 0.13 | 0.17 | 1 | 0.71 |
| PID ILK PATHWAY | 45 | genes.ES.table | 0.39 | 1.5 | 0.074 | 1 | 0.97 | 0.56 | 0.4 | 0.33 | 1 | 0.58 |
| PID TCPTP PATHWAY | 42 | genes.ES.table | 0.46 | 1.6 | 0.064 | 1 | 0.92 | 0.38 | 0.28 | 0.27 | 1 | 0.64 |
| PID TELOMERASEPATHWAY | 68 | genes.ES.table | 0.35 | 1.5 | 0.083 | 1 | 0.98 | 0.26 | 0.24 | 0.2 | 0.91 | 0.47 |
Table S1. Get Full Table This table shows a Running Enrichment Score (RES) of each gene in this pathway, that is, the enrichment score at this point in the ranked list of genes. All genes are ranked by Signal-to-Noise (S2N), a measure of similarity as default and are used to obtain ES matrix of all genes. In this way, GSEA tool uses expression pattern of not only overlapped genes but also not-overlapped genes to produce ES matrix.
| Rank | GENE | SYMBOL | DESC | LIST.LOC | S2N | RES | CORE_ENRICHMENT |
|---|---|---|---|---|---|---|---|
| 1 | NGF | NGF | NGF | 163 | 0.31 | 0.18 | YES |
| 2 | SHC3 | SHC3 | SHC3 | 1658 | 0.13 | 0.18 | YES |
| 3 | BRAF | BRAF | BRAF | 2150 | 0.11 | 0.22 | YES |
| 4 | CDK1 | CDK1 | CDK1 | 2261 | 0.1 | 0.27 | YES |
| 5 | NTRK1 | NTRK1 | NTRK1 | 2465 | 0.095 | 0.32 | YES |
| 6 | MAPKAPK3 | MAPKAPK3 | MAPKAPK3 | 2473 | 0.095 | 0.38 | YES |
| 7 | SHC2 | SHC2 | SHC2 | 2918 | 0.082 | 0.41 | YES |
| 8 | RALB | RALB | RALB | 3801 | 0.061 | 0.4 | YES |
| 9 | RALA | RALA | RALA | 3868 | 0.06 | 0.43 | YES |
| 10 | NRAS | NRAS | NRAS | 4334 | 0.052 | 0.44 | YES |
| 11 | GRB2 | GRB2 | GRB2 | 4560 | 0.048 | 0.45 | YES |
| 12 | RAP1A | RAP1A | RAP1A | 4622 | 0.047 | 0.48 | YES |
| 13 | MAPKAPK2 | MAPKAPK2 | MAPKAPK2 | 4790 | 0.044 | 0.5 | YES |
| 14 | MAPK13 | MAPK13 | MAPK13 | 5337 | 0.036 | 0.49 | YES |
| 15 | RALGDS | RALGDS | RALGDS | 6003 | 0.028 | 0.47 | YES |
| 16 | FRS2 | FRS2 | FRS2 | 6028 | 0.028 | 0.49 | YES |
| 17 | MAPK14 | MAPK14 | MAPK14 | 6043 | 0.028 | 0.5 | YES |
| 18 | MAPK11 | MAPK11 | MAPK11 | 6228 | 0.026 | 0.51 | YES |
| 19 | RIT1 | RIT1 | RIT1 | 6648 | 0.022 | 0.5 | NO |
| 20 | MAP2K2 | MAP2K2 | MAP2K2 | 7480 | 0.014 | 0.46 | NO |
| 21 | MAPK12 | MAPK12 | MAPK12 | 7734 | 0.011 | 0.46 | NO |
| 22 | MAPK3 | MAPK3 | MAPK3 | 7882 | 0.01 | 0.45 | NO |
| 23 | MAPK1 | MAPK1 | MAPK1 | 7915 | 0.0098 | 0.46 | NO |
| 24 | SHC1 | SHC1 | SHC1 | 8487 | 0.0046 | 0.43 | NO |
| 25 | KIDINS220 | KIDINS220 | KIDINS220 | 8718 | 0.0025 | 0.42 | NO |
| 26 | PLCG1 | PLCG1 | PLCG1 | 8734 | 0.0023 | 0.42 | NO |
| 27 | RAF1 | RAF1 | RAF1 | 8970 | 0.00017 | 0.4 | NO |
| 28 | KRAS | KRAS | KRAS | 9343 | -0.0032 | 0.39 | NO |
| 29 | YWHAB | YWHAB | YWHAB | 9372 | -0.0035 | 0.39 | NO |
| 30 | SOS1 | SOS1 | SOS1 | 10189 | -0.011 | 0.35 | NO |
| 31 | SRC | SRC | SRC | 10532 | -0.014 | 0.34 | NO |
| 32 | MAP2K1 | MAP2K1 | MAP2K1 | 10661 | -0.015 | 0.34 | NO |
| 33 | RAPGEF1 | RAPGEF1 | RAPGEF1 | 12741 | -0.037 | 0.25 | NO |
| 34 | CRK | CRK | CRK | 12778 | -0.037 | 0.27 | NO |
| 35 | HRAS | HRAS | HRAS | 13555 | -0.049 | 0.26 | NO |
Figure S1. Get High-res Image This plot shows mRNAseq_cNMF expression data heatmap (on the left) a RunningEnrichmentScore(RES) plot (on the top right) and a Signal2Noise(S2N) plot (on the bottom right) of genes in the pathway: KEGG DNA REPLICATION.
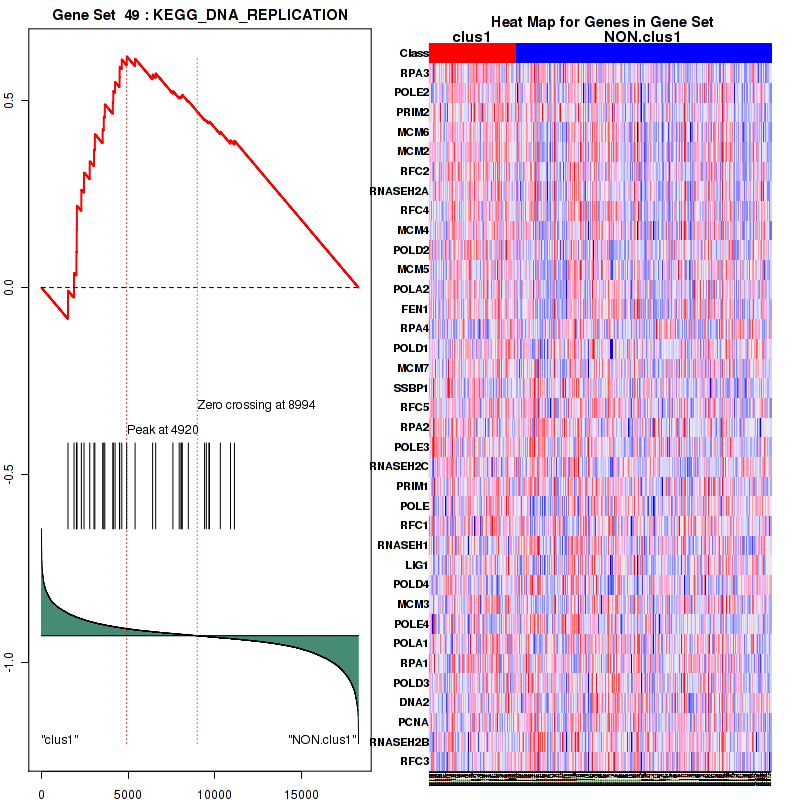
Figure S2. Get High-res Image For the top 5 core enriched genes in the pathway: KEGG DNA REPLICATION, this volcano plot shows how much they are up/down-regulated and significant. The significance was calculated by empirical bayesian fit
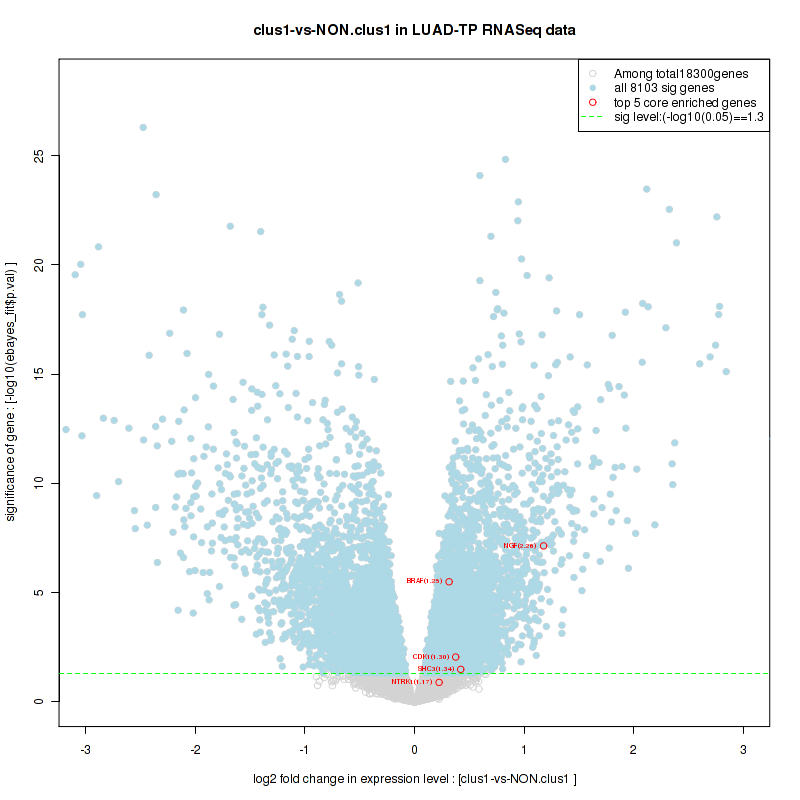
Table S2. Get Full Table This table shows a Running Enrichment Score (RES) of each gene in this pathway, that is, the enrichment score at this point in the ranked list of genes. All genes are ranked by Signal-to-Noise (S2N), a measure of similarity as default and are used to obtain ES matrix of all genes. In this way, GSEA tool uses expression pattern of not only overlapped genes but also not-overlapped genes to produce ES matrix.
| Rank | GENE | SYMBOL | DESC | LIST.LOC | S2N | RES | CORE_ENRICHMENT |
|---|---|---|---|---|---|---|---|
| 1 | NGF | NGF | NGF | 163 | 0.31 | 0.22 | YES |
| 2 | SHC3 | SHC3 | SHC3 | 1658 | 0.13 | 0.23 | YES |
| 3 | CDK1 | CDK1 | CDK1 | 2261 | 0.1 | 0.28 | YES |
| 4 | NTRK1 | NTRK1 | NTRK1 | 2465 | 0.095 | 0.34 | YES |
| 5 | MAPKAPK3 | MAPKAPK3 | MAPKAPK3 | 2473 | 0.095 | 0.41 | YES |
| 6 | SHC2 | SHC2 | SHC2 | 2918 | 0.082 | 0.45 | YES |
| 7 | RALB | RALB | RALB | 3801 | 0.061 | 0.44 | YES |
| 8 | RALA | RALA | RALA | 3868 | 0.06 | 0.48 | YES |
| 9 | NRAS | NRAS | NRAS | 4334 | 0.052 | 0.5 | YES |
| 10 | GRB2 | GRB2 | GRB2 | 4560 | 0.048 | 0.52 | YES |
| 11 | MAPKAPK2 | MAPKAPK2 | MAPKAPK2 | 4790 | 0.044 | 0.54 | YES |
| 12 | MAPK13 | MAPK13 | MAPK13 | 5337 | 0.036 | 0.54 | YES |
| 13 | RALGDS | RALGDS | RALGDS | 6003 | 0.028 | 0.52 | YES |
| 14 | MAPK14 | MAPK14 | MAPK14 | 6043 | 0.028 | 0.54 | YES |
| 15 | MAPK11 | MAPK11 | MAPK11 | 6228 | 0.026 | 0.55 | YES |
| 16 | MAP2K2 | MAP2K2 | MAP2K2 | 7480 | 0.014 | 0.49 | NO |
| 17 | MAPK12 | MAPK12 | MAPK12 | 7734 | 0.011 | 0.49 | NO |
| 18 | MAPK3 | MAPK3 | MAPK3 | 7882 | 0.01 | 0.49 | NO |
| 19 | MAPK1 | MAPK1 | MAPK1 | 7915 | 0.0098 | 0.49 | NO |
| 20 | SHC1 | SHC1 | SHC1 | 8487 | 0.0046 | 0.46 | NO |
| 21 | RAF1 | RAF1 | RAF1 | 8970 | 0.00017 | 0.44 | NO |
| 22 | KRAS | KRAS | KRAS | 9343 | -0.0032 | 0.42 | NO |
| 23 | YWHAB | YWHAB | YWHAB | 9372 | -0.0035 | 0.42 | NO |
| 24 | SOS1 | SOS1 | SOS1 | 10189 | -0.011 | 0.38 | NO |
| 25 | SRC | SRC | SRC | 10532 | -0.014 | 0.38 | NO |
| 26 | MAP2K1 | MAP2K1 | MAP2K1 | 10661 | -0.015 | 0.38 | NO |
| 27 | HRAS | HRAS | HRAS | 13555 | -0.049 | 0.26 | NO |
Figure S3. Get High-res Image This plot shows mRNAseq_cNMF expression data heatmap (on the left) a RunningEnrichmentScore(RES) plot (on the top right) and a Signal2Noise(S2N) plot (on the bottom right) of genes in the pathway: KEGG CELL CYCLE.
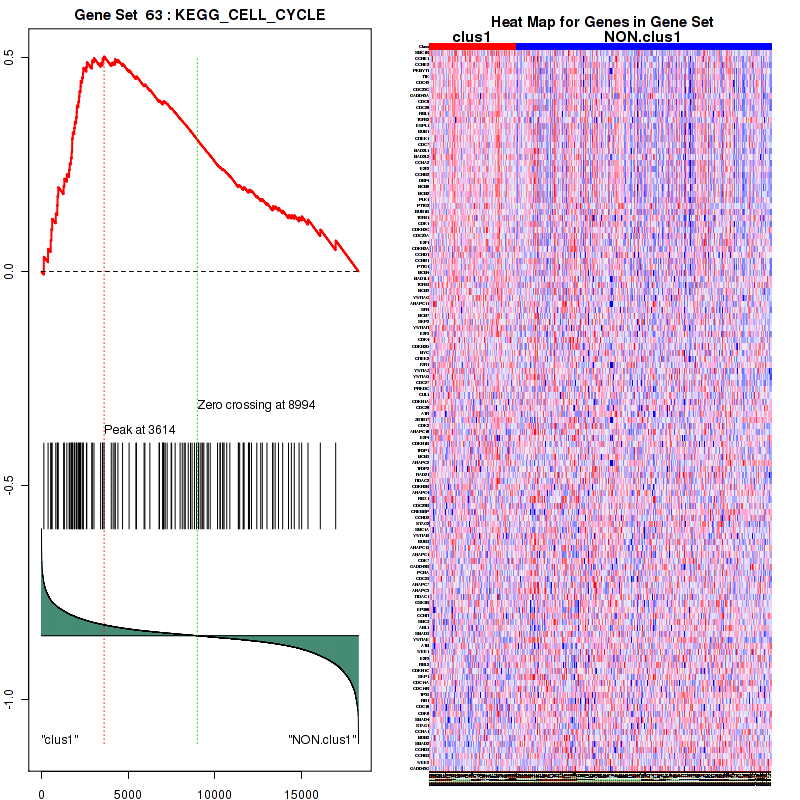
Figure S4. Get High-res Image For the top 5 core enriched genes in the pathway: KEGG CELL CYCLE, this volcano plot shows how much they are up/down-regulated and significant. The significance was calculated by empirical bayesian fit
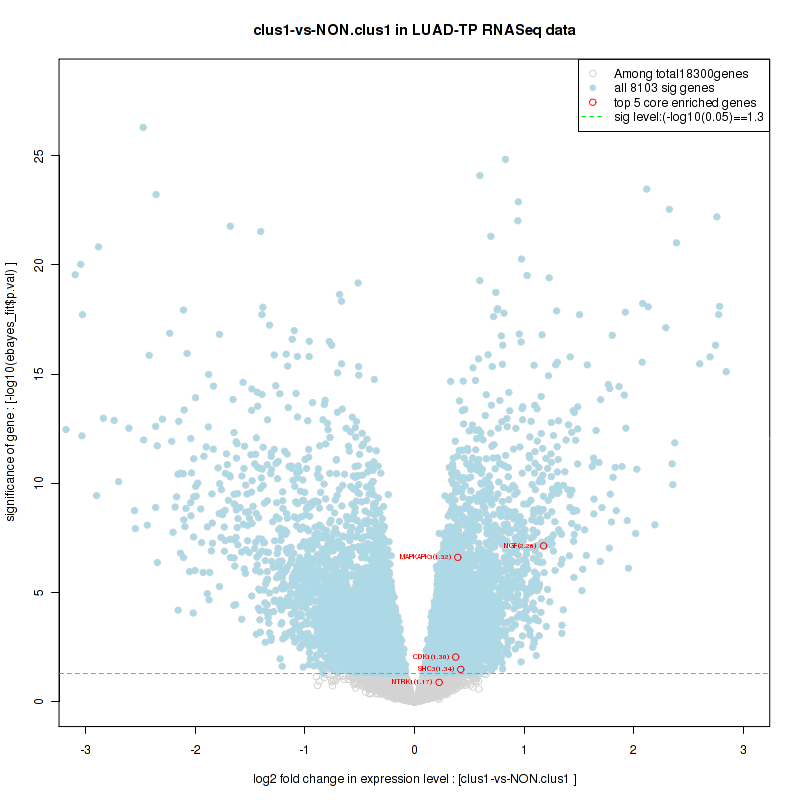
Table S3. Get Full Table This table shows a Running Enrichment Score (RES) of each gene in this pathway, that is, the enrichment score at this point in the ranked list of genes. All genes are ranked by Signal-to-Noise (S2N), a measure of similarity as default and are used to obtain ES matrix of all genes. In this way, GSEA tool uses expression pattern of not only overlapped genes but also not-overlapped genes to produce ES matrix.
| Rank | GENE | SYMBOL | DESC | LIST.LOC | S2N | RES | CORE_ENRICHMENT |
|---|---|---|---|---|---|---|---|
| 1 | FCGR1A | FCGR1A | FCGR1A | 415 | 0.24 | 0.0077 | YES |
| 2 | ICAM1 | ICAM1 | ICAM1 | 428 | 0.23 | 0.037 | YES |
| 3 | FCGR1B | FCGR1B | FCGR1B | 433 | 0.23 | 0.067 | YES |
| 4 | IRF5 | IRF5 | IRF5 | 713 | 0.19 | 0.076 | YES |
| 5 | VCAM1 | VCAM1 | VCAM1 | 717 | 0.19 | 0.1 | YES |
| 6 | GBP6 | GBP6 | GBP6 | 737 | 0.19 | 0.12 | YES |
| 7 | IFIT1 | IFIT1 | IFIT1 | 1020 | 0.17 | 0.13 | YES |
| 8 | PTAFR | PTAFR | PTAFR | 1084 | 0.16 | 0.15 | YES |
| 9 | IFNB1 | IFNB1 | IFNB1 | 1133 | 0.16 | 0.17 | YES |
| 10 | HLA-DQA2 | HLA-DQA2 | HLA-DQA2 | 1176 | 0.16 | 0.18 | YES |
| 11 | ISG15 | ISG15 | ISG15 | 1198 | 0.16 | 0.2 | YES |
| 12 | IFNAR2 | IFNAR2 | IFNAR2 | 1249 | 0.15 | 0.22 | YES |
| 13 | HLA-DRB5 | HLA-DRB5 | HLA-DRB5 | 1612 | 0.13 | 0.22 | YES |
| 14 | HERC5 | HERC5 | HERC5 | 1766 | 0.12 | 0.22 | YES |
| 15 | GBP1 | GBP1 | GBP1 | 1865 | 0.12 | 0.23 | YES |
| 16 | KPNA2 | KPNA2 | KPNA2 | 1972 | 0.11 | 0.24 | YES |
| 17 | NUP155 | NUP155 | NUP155 | 1999 | 0.11 | 0.26 | YES |
| 18 | HLA-G | HLA-G | HLA-G | 2010 | 0.11 | 0.27 | YES |
| 19 | NUPL2 | NUPL2 | NUPL2 | 2072 | 0.11 | 0.28 | YES |
| 20 | MX2 | MX2 | MX2 | 2201 | 0.1 | 0.29 | YES |
| 21 | IFI27 | IFI27 | IFI27 | 2226 | 0.1 | 0.3 | YES |
| 22 | IFIT2 | IFIT2 | IFIT2 | 2235 | 0.1 | 0.31 | YES |
| 23 | GBP5 | GBP5 | GBP5 | 2324 | 0.1 | 0.32 | YES |
| 24 | HLA-DQA1 | HLA-DQA1 | HLA-DQA1 | 2332 | 0.1 | 0.33 | YES |
| 25 | IFNG | IFNG | IFNG | 2351 | 0.1 | 0.34 | YES |
| 26 | GBP2 | GBP2 | GBP2 | 2463 | 0.095 | 0.35 | YES |
| 27 | MT2A | MT2A | MT2A | 2468 | 0.095 | 0.36 | YES |
| 28 | MX1 | MX1 | MX1 | 2508 | 0.094 | 0.37 | YES |
| 29 | IFIT3 | IFIT3 | IFIT3 | 2751 | 0.087 | 0.37 | YES |
| 30 | HLA-DRB1 | HLA-DRB1 | HLA-DRB1 | 2783 | 0.086 | 0.38 | YES |
| 31 | SOCS1 | SOCS1 | SOCS1 | 2821 | 0.084 | 0.39 | YES |
| 32 | IFI35 | IFI35 | IFI35 | 2839 | 0.084 | 0.4 | YES |
| 33 | IFNGR2 | IFNGR2 | IFNGR2 | 2946 | 0.081 | 0.4 | YES |
| 34 | HLA-DPA1 | HLA-DPA1 | HLA-DPA1 | 2956 | 0.081 | 0.41 | YES |
| 35 | IFI6 | IFI6 | IFI6 | 3080 | 0.078 | 0.42 | YES |
| 36 | EIF2AK2 | EIF2AK2 | EIF2AK2 | 3132 | 0.076 | 0.42 | YES |
| 37 | IRF7 | IRF7 | IRF7 | 3189 | 0.075 | 0.43 | YES |
| 38 | CIITA | CIITA | CIITA | 3201 | 0.074 | 0.44 | YES |
| 39 | OASL | OASL | OASL | 3233 | 0.074 | 0.44 | YES |
| 40 | DDX58 | DDX58 | DDX58 | 3284 | 0.072 | 0.45 | YES |
| 41 | NUP85 | NUP85 | NUP85 | 3500 | 0.068 | 0.45 | YES |
| 42 | NEDD4 | NEDD4 | NEDD4 | 3576 | 0.066 | 0.45 | YES |
| 43 | GBP7 | GBP7 | GBP7 | 3632 | 0.065 | 0.46 | YES |
| 44 | UBE2L6 | UBE2L6 | UBE2L6 | 3812 | 0.061 | 0.46 | YES |
| 45 | NUP205 | NUP205 | NUP205 | 3903 | 0.059 | 0.46 | YES |
| 46 | HLA-DPB1 | HLA-DPB1 | HLA-DPB1 | 3925 | 0.059 | 0.47 | YES |
| 47 | HLA-B | HLA-B | HLA-B | 4309 | 0.052 | 0.45 | YES |
| 48 | OAS3 | OAS3 | OAS3 | 4317 | 0.052 | 0.46 | YES |
| 49 | IFNAR1 | IFNAR1 | IFNAR1 | 4355 | 0.051 | 0.46 | YES |
| 50 | XAF1 | XAF1 | XAF1 | 4430 | 0.05 | 0.46 | YES |
| 51 | OAS2 | OAS2 | OAS2 | 4432 | 0.05 | 0.47 | YES |
| 52 | PML | PML | PML | 4502 | 0.049 | 0.47 | YES |
| 53 | USP18 | USP18 | USP18 | 4626 | 0.047 | 0.47 | YES |
| 54 | NUP210 | NUP210 | NUP210 | 4702 | 0.045 | 0.47 | YES |
| 55 | STAT1 | STAT1 | STAT1 | 4772 | 0.044 | 0.48 | YES |
| 56 | UBA7 | UBA7 | UBA7 | 4821 | 0.044 | 0.48 | YES |
| 57 | NUP62 | NUP62 | NUP62 | 4862 | 0.043 | 0.48 | YES |
| 58 | CD44 | CD44 | CD44 | 4865 | 0.043 | 0.49 | YES |
| 59 | POM121 | POM121 | POM121 | 4870 | 0.043 | 0.49 | YES |
| 60 | TYK2 | TYK2 | TYK2 | 5567 | 0.033 | 0.46 | NO |
| 61 | HLA-A | HLA-A | HLA-A | 5633 | 0.032 | 0.46 | NO |
| 62 | HLA-F | HLA-F | HLA-F | 5697 | 0.032 | 0.46 | NO |
| 63 | HLA-C | HLA-C | HLA-C | 5712 | 0.032 | 0.46 | NO |
| 64 | PSMB8 | PSMB8 | PSMB8 | 5775 | 0.031 | 0.46 | NO |
| 65 | NUP54 | NUP54 | NUP54 | 5945 | 0.029 | 0.46 | NO |
| 66 | OAS1 | OAS1 | OAS1 | 6119 | 0.027 | 0.45 | NO |
| 67 | CAMK2D | CAMK2D | CAMK2D | 6202 | 0.026 | 0.45 | NO |
| 68 | KPNA4 | KPNA4 | KPNA4 | 6287 | 0.026 | 0.45 | NO |
| 69 | IRF9 | IRF9 | IRF9 | 6288 | 0.026 | 0.45 | NO |
| 70 | IFNGR1 | IFNGR1 | IFNGR1 | 6297 | 0.026 | 0.46 | NO |
| 71 | EIF4A3 | EIF4A3 | EIF4A3 | 6462 | 0.024 | 0.45 | NO |
| 72 | EIF4E | EIF4E | EIF4E | 6726 | 0.021 | 0.44 | NO |
| 73 | JAK2 | JAK2 | JAK2 | 6794 | 0.02 | 0.44 | NO |
| 74 | IRF1 | IRF1 | IRF1 | 6861 | 0.019 | 0.44 | NO |
| 75 | NUP93 | NUP93 | NUP93 | 6901 | 0.019 | 0.44 | NO |
| 76 | PTPN1 | PTPN1 | PTPN1 | 6931 | 0.019 | 0.44 | NO |
| 77 | ADAR | ADAR | ADAR | 6947 | 0.019 | 0.44 | NO |
| 78 | NUP107 | NUP107 | NUP107 | 7088 | 0.017 | 0.43 | NO |
| 79 | STAT2 | STAT2 | STAT2 | 7185 | 0.016 | 0.43 | NO |
| 80 | IRF3 | IRF3 | IRF3 | 7466 | 0.014 | 0.42 | NO |
| 81 | EIF4G1 | EIF4G1 | EIF4G1 | 7540 | 0.013 | 0.41 | NO |
| 82 | NUP188 | NUP188 | NUP188 | 7639 | 0.012 | 0.41 | NO |
| 83 | KPNB1 | KPNB1 | KPNB1 | 7816 | 0.011 | 0.4 | NO |
| 84 | EGR1 | EGR1 | EGR1 | 7850 | 0.01 | 0.4 | NO |
| 85 | MAPK3 | MAPK3 | MAPK3 | 7882 | 0.01 | 0.4 | NO |
| 86 | NUP43 | NUP43 | NUP43 | 7901 | 0.0099 | 0.4 | NO |
| 87 | UBE2E1 | UBE2E1 | UBE2E1 | 8107 | 0.0081 | 0.39 | NO |
| 88 | SP100 | SP100 | SP100 | 8195 | 0.0072 | 0.39 | NO |
| 89 | B2M | B2M | B2M | 8341 | 0.0059 | 0.38 | NO |
| 90 | EIF4G3 | EIF4G3 | EIF4G3 | 8549 | 0.004 | 0.37 | NO |
| 91 | KPNA1 | KPNA1 | KPNA1 | 8634 | 0.0032 | 0.36 | NO |
| 92 | FLNB | FLNB | FLNB | 8717 | 0.0025 | 0.36 | NO |
| 93 | PLCG1 | PLCG1 | PLCG1 | 8734 | 0.0023 | 0.36 | NO |
| 94 | NUP37 | NUP37 | NUP37 | 8792 | 0.0017 | 0.36 | NO |
| 95 | RNASEL | RNASEL | RNASEL | 8805 | 0.0015 | 0.36 | NO |
| 96 | NUP214 | NUP214 | NUP214 | 8843 | 0.0012 | 0.36 | NO |
| 97 | PTPN6 | PTPN6 | PTPN6 | 8844 | 0.0012 | 0.36 | NO |
| 98 | JAK1 | JAK1 | JAK1 | 8877 | 0.00094 | 0.35 | NO |
| 99 | GBP4 | GBP4 | GBP4 | 9017 | -0.00015 | 0.35 | NO |
| 100 | IFITM3 | IFITM3 | IFITM3 | 9115 | -0.00098 | 0.34 | NO |
| 101 | PRKCD | PRKCD | PRKCD | 9118 | -0.00098 | 0.34 | NO |
| 102 | PIN1 | PIN1 | PIN1 | 9138 | -0.0012 | 0.34 | NO |
| 103 | SUMO1 | SUMO1 | SUMO1 | 9445 | -0.0042 | 0.32 | NO |
| 104 | SOCS3 | SOCS3 | SOCS3 | 9446 | -0.0042 | 0.32 | NO |
| 105 | SEH1L | SEH1L | SEH1L | 9454 | -0.0042 | 0.32 | NO |
| 106 | CAMK2A | CAMK2A | CAMK2A | 9461 | -0.0043 | 0.32 | NO |
| 107 | RAE1 | RAE1 | RAE1 | 9481 | -0.0045 | 0.32 | NO |
| 108 | TPR | TPR | TPR | 9488 | -0.0046 | 0.32 | NO |
| 109 | EIF4G2 | EIF4G2 | EIF4G2 | 9494 | -0.0046 | 0.32 | NO |
| 110 | UBA52 | UBA52 | UBA52 | 9657 | -0.006 | 0.32 | NO |
| 111 | EIF4A2 | EIF4A2 | EIF4A2 | 9708 | -0.0065 | 0.32 | NO |
| 112 | TRIM25 | TRIM25 | TRIM25 | 9734 | -0.0068 | 0.31 | NO |
| 113 | PTPN2 | PTPN2 | PTPN2 | 9793 | -0.0073 | 0.31 | NO |
| 114 | IRF2 | IRF2 | IRF2 | 10184 | -0.011 | 0.29 | NO |
| 115 | EIF4A1 | EIF4A1 | EIF4A1 | 10334 | -0.012 | 0.28 | NO |
| 116 | IFITM1 | IFITM1 | IFITM1 | 10576 | -0.014 | 0.27 | NO |
| 117 | IRF8 | IRF8 | IRF8 | 11009 | -0.018 | 0.25 | NO |
| 118 | IP6K2 | IP6K2 | IP6K2 | 11181 | -0.02 | 0.24 | NO |
| 119 | NUP153 | NUP153 | NUP153 | 11254 | -0.021 | 0.24 | NO |
| 120 | EIF4E2 | EIF4E2 | EIF4E2 | 11451 | -0.023 | 0.24 | NO |
| 121 | RPS27A | RPS27A | RPS27A | 11655 | -0.025 | 0.23 | NO |
| 122 | UBE2N | UBE2N | UBE2N | 11657 | -0.025 | 0.23 | NO |
| 123 | EIF4E3 | EIF4E3 | EIF4E3 | 11745 | -0.026 | 0.23 | NO |
| 124 | PPM1B | PPM1B | PPM1B | 11850 | -0.027 | 0.23 | NO |
| 125 | NUP35 | NUP35 | NUP35 | 11963 | -0.028 | 0.22 | NO |
| 126 | NUPL1 | NUPL1 | NUPL1 | 12028 | -0.029 | 0.22 | NO |
| 127 | IFITM2 | IFITM2 | IFITM2 | 12307 | -0.032 | 0.21 | NO |
| 128 | KPNA3 | KPNA3 | KPNA3 | 12324 | -0.032 | 0.22 | NO |
| 129 | NUP133 | NUP133 | NUP133 | 12355 | -0.032 | 0.22 | NO |
| 130 | NUP50 | NUP50 | NUP50 | 12560 | -0.035 | 0.21 | NO |
| 131 | RANBP2 | RANBP2 | RANBP2 | 12793 | -0.038 | 0.2 | NO |
| 132 | IRF4 | IRF4 | IRF4 | 12825 | -0.038 | 0.21 | NO |
| 133 | AAAS | AAAS | AAAS | 13592 | -0.05 | 0.17 | NO |
| 134 | NUP88 | NUP88 | NUP88 | 13722 | -0.052 | 0.17 | NO |
| 135 | IRF6 | IRF6 | IRF6 | 13837 | -0.054 | 0.17 | NO |
| 136 | ARIH1 | ARIH1 | ARIH1 | 14058 | -0.058 | 0.17 | NO |
| 137 | CAMK2B | CAMK2B | CAMK2B | 14167 | -0.06 | 0.17 | NO |
| 138 | PIAS1 | PIAS1 | PIAS1 | 14542 | -0.068 | 0.16 | NO |
| 139 | KPNA5 | KPNA5 | KPNA5 | 16040 | -0.12 | 0.091 | NO |
| 140 | NCAM1 | NCAM1 | NCAM1 | 16154 | -0.12 | 0.1 | NO |
| 141 | ISG20 | ISG20 | ISG20 | 16409 | -0.14 | 0.1 | NO |
Figure S5. Get High-res Image This plot shows mRNAseq_cNMF expression data heatmap (on the left) a RunningEnrichmentScore(RES) plot (on the top right) and a Signal2Noise(S2N) plot (on the bottom right) of genes in the pathway: KEGG PATHOGENIC ESCHERICHIA COLI INFECTION.
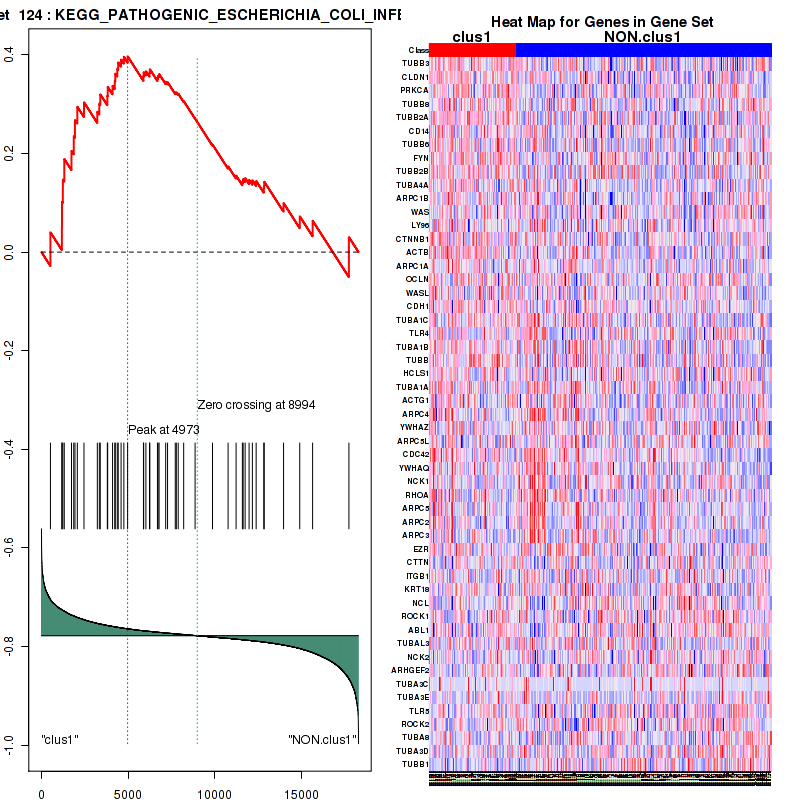
Figure S6. Get High-res Image For the top 5 core enriched genes in the pathway: KEGG PATHOGENIC ESCHERICHIA COLI INFECTION, this volcano plot shows how much they are up/down-regulated and significant. The significance was calculated by empirical bayesian fit
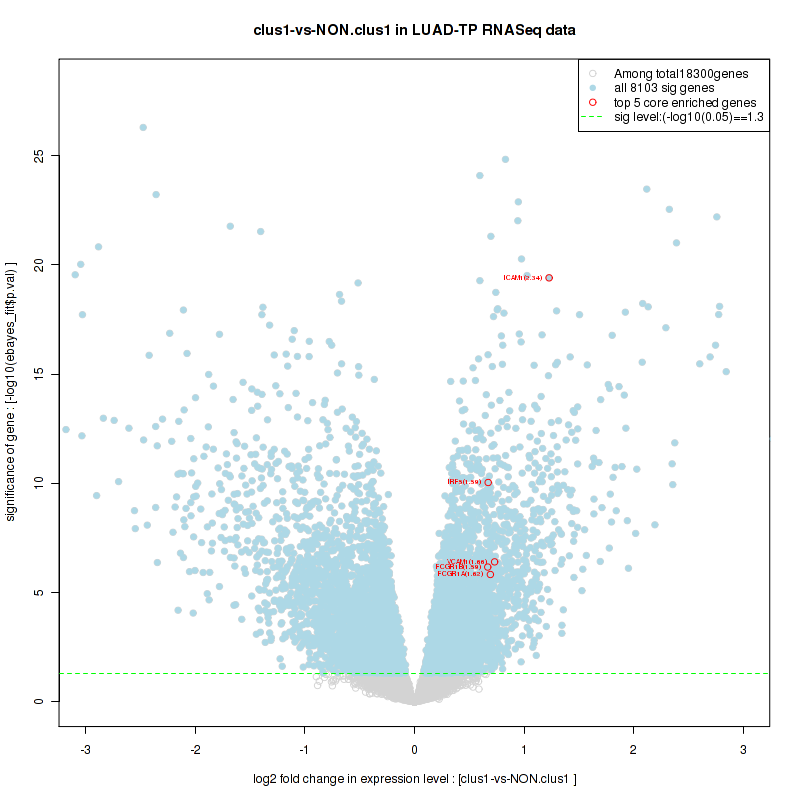
Table S4. Get Full Table This table shows a Running Enrichment Score (RES) of each gene in this pathway, that is, the enrichment score at this point in the ranked list of genes. All genes are ranked by Signal-to-Noise (S2N), a measure of similarity as default and are used to obtain ES matrix of all genes. In this way, GSEA tool uses expression pattern of not only overlapped genes but also not-overlapped genes to produce ES matrix.
| Rank | GENE | SYMBOL | DESC | LIST.LOC | S2N | RES | CORE_ENRICHMENT |
|---|---|---|---|---|---|---|---|
| 1 | MET | MET | MET | 179 | 0.3 | 0.11 | YES |
| 2 | EGFR | EGFR | EGFR | 458 | 0.23 | 0.19 | YES |
| 3 | CSF1 | CSF1 | CSF1 | 700 | 0.19 | 0.26 | YES |
| 4 | VEGFA | VEGFA | VEGFA | 1081 | 0.16 | 0.3 | YES |
| 5 | KDR | KDR | KDR | 1113 | 0.16 | 0.37 | YES |
| 6 | CSF1R | CSF1R | CSF1R | 1770 | 0.12 | 0.38 | YES |
| 7 | KPNA2 | KPNA2 | KPNA2 | 1972 | 0.11 | 0.42 | YES |
| 8 | PIK3CD | PIK3CD | PIK3CD | 2257 | 0.1 | 0.44 | YES |
| 9 | JAK3 | JAK3 | JAK3 | 3094 | 0.078 | 0.43 | YES |
| 10 | EIF2AK2 | EIF2AK2 | EIF2AK2 | 3132 | 0.076 | 0.46 | YES |
| 11 | EGF | EGF | EGF | 3785 | 0.061 | 0.45 | YES |
| 12 | PIK3R2 | PIK3R2 | PIK3R2 | 4559 | 0.048 | 0.42 | YES |
| 13 | GRB2 | GRB2 | GRB2 | 4560 | 0.048 | 0.44 | YES |
| 14 | STAT1 | STAT1 | STAT1 | 4772 | 0.044 | 0.45 | YES |
| 15 | GAB1 | GAB1 | GAB1 | 5144 | 0.039 | 0.44 | YES |
| 16 | STAT5A | STAT5A | STAT5A | 5179 | 0.038 | 0.46 | YES |
| 17 | PDGFRB | PDGFRB | PDGFRB | 6380 | 0.024 | 0.4 | NO |
| 18 | PIK3CB | PIK3CB | PIK3CB | 6757 | 0.02 | 0.39 | NO |
| 19 | PTPN1 | PTPN1 | PTPN1 | 6931 | 0.019 | 0.39 | NO |
| 20 | PIK3CA | PIK3CA | PIK3CA | 7037 | 0.018 | 0.39 | NO |
| 21 | ATR | ATR | ATR | 7071 | 0.017 | 0.4 | NO |
| 22 | PIK3R1 | PIK3R1 | PIK3R1 | 7356 | 0.015 | 0.39 | NO |
| 23 | KPNB1 | KPNB1 | KPNB1 | 7816 | 0.011 | 0.37 | NO |
| 24 | SHC1 | SHC1 | SHC1 | 8487 | 0.0046 | 0.33 | NO |
| 25 | JAK1 | JAK1 | JAK1 | 8877 | 0.00094 | 0.31 | NO |
| 26 | CREBBP | CREBBP | CREBBP | 9078 | -0.00065 | 0.3 | NO |
| 27 | PDGFB | PDGFB | PDGFB | 9740 | -0.0069 | 0.27 | NO |
| 28 | PTPN2 | PTPN2 | PTPN2 | 9793 | -0.0073 | 0.27 | NO |
| 29 | ITGB1 | ITGB1 | ITGB1 | 9872 | -0.0081 | 0.26 | NO |
| 30 | PIK3R3 | PIK3R3 | PIK3R3 | 10062 | -0.0098 | 0.26 | NO |
| 31 | SOS1 | SOS1 | SOS1 | 10189 | -0.011 | 0.26 | NO |
| 32 | ITGA1 | ITGA1 | ITGA1 | 10276 | -0.012 | 0.26 | NO |
| 33 | SRC | SRC | SRC | 10532 | -0.014 | 0.25 | NO |
| 34 | STAT5B | STAT5B | STAT5B | 11010 | -0.018 | 0.23 | NO |
| 35 | LMAN1 | LMAN1 | LMAN1 | 11396 | -0.022 | 0.22 | NO |
| 36 | STAT3 | STAT3 | STAT3 | 11794 | -0.026 | 0.21 | NO |
| 37 | EIF2A | EIF2A | EIF2A | 12569 | -0.035 | 0.18 | NO |
| 38 | STAT6 | STAT6 | STAT6 | 12679 | -0.036 | 0.19 | NO |
| 39 | INSR | INSR | INSR | 14331 | -0.063 | 0.12 | NO |
| 40 | PIAS1 | PIAS1 | PIAS1 | 14542 | -0.068 | 0.14 | NO |
| 41 | RAB4A | RAB4A | RAB4A | 14978 | -0.079 | 0.15 | NO |
| 42 | HGF | HGF | HGF | 15130 | -0.084 | 0.17 | NO |
Figure S7. Get High-res Image This plot shows mRNAseq_cNMF expression data heatmap (on the left) a RunningEnrichmentScore(RES) plot (on the top right) and a Signal2Noise(S2N) plot (on the bottom right) of genes in the pathway: BIOCARTA FAS PATHWAY.
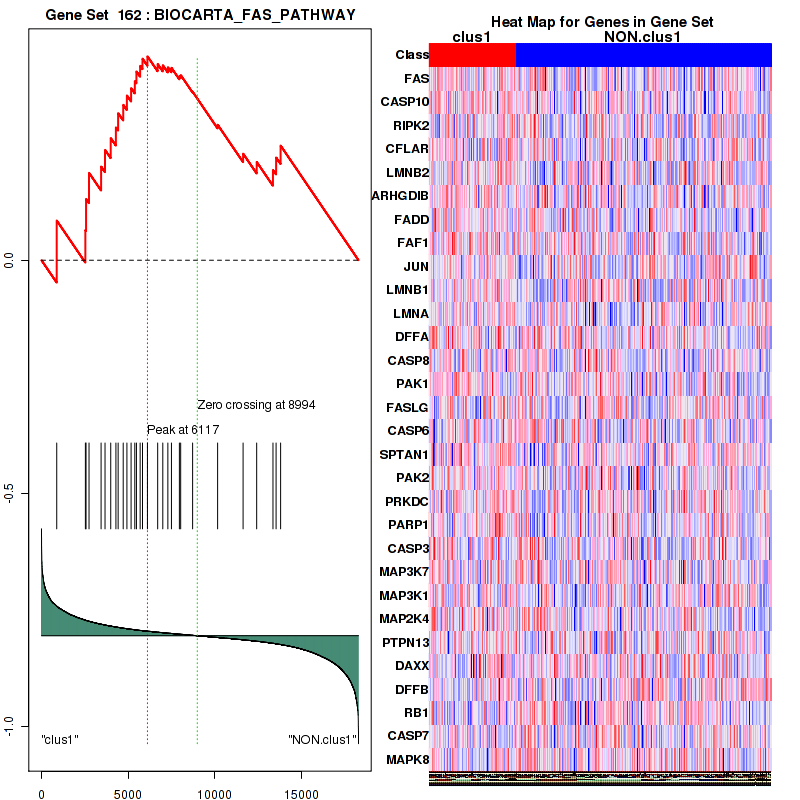
Figure S8. Get High-res Image For the top 5 core enriched genes in the pathway: BIOCARTA FAS PATHWAY, this volcano plot shows how much they are up/down-regulated and significant. The significance was calculated by empirical bayesian fit
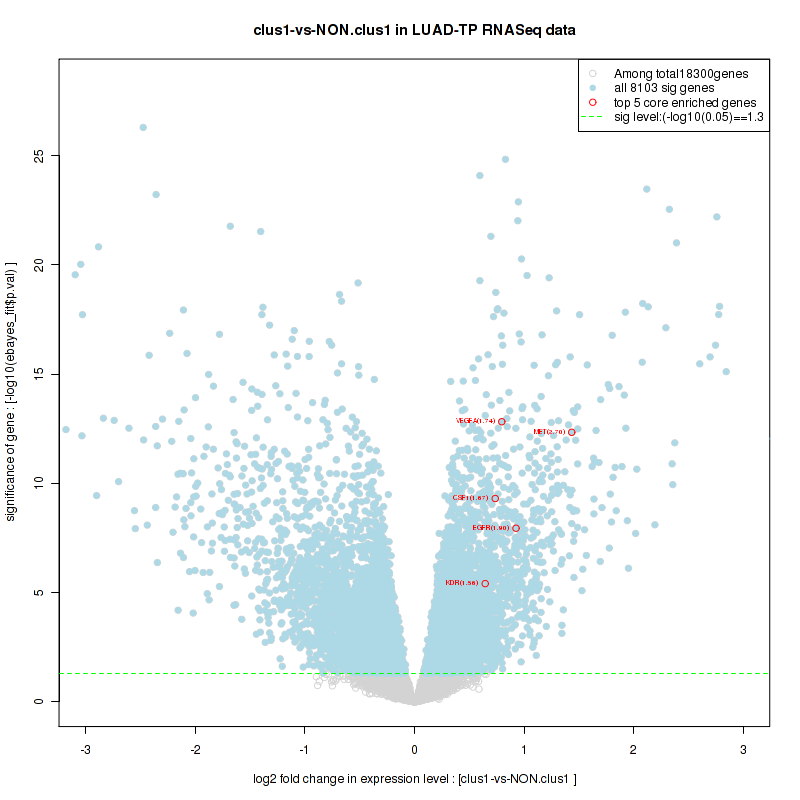
Table S5. Get Full Table This table shows a Running Enrichment Score (RES) of each gene in this pathway, that is, the enrichment score at this point in the ranked list of genes. All genes are ranked by Signal-to-Noise (S2N), a measure of similarity as default and are used to obtain ES matrix of all genes. In this way, GSEA tool uses expression pattern of not only overlapped genes but also not-overlapped genes to produce ES matrix.
| Rank | GENE | SYMBOL | DESC | LIST.LOC | S2N | RES | CORE_ENRICHMENT |
|---|---|---|---|---|---|---|---|
| 1 | PLAU | PLAU | PLAU | 115 | 0.33 | 0.16 | YES |
| 2 | ITGB3 | ITGB3 | ITGB3 | 171 | 0.3 | 0.3 | YES |
| 3 | SPP1 | SPP1 | SPP1 | 369 | 0.24 | 0.41 | YES |
| 4 | MMP9 | MMP9 | MMP9 | 695 | 0.19 | 0.49 | YES |
| 5 | ITGAV | ITGAV | ITGAV | 1623 | 0.13 | 0.5 | YES |
| 6 | MMP2 | MMP2 | MMP2 | 2382 | 0.099 | 0.51 | YES |
| 7 | RAC1 | RAC1 | RAC1 | 3468 | 0.068 | 0.48 | NO |
| 8 | JUN | JUN | JUN | 4426 | 0.05 | 0.45 | NO |
| 9 | VAV3 | VAV3 | VAV3 | 4467 | 0.049 | 0.48 | NO |
| 10 | CD44 | CD44 | CD44 | 4865 | 0.043 | 0.48 | NO |
| 11 | PIP5K1A | PIP5K1A | PIP5K1A | 5369 | 0.036 | 0.46 | NO |
| 12 | RELA | RELA | RELA | 6428 | 0.024 | 0.42 | NO |
| 13 | CDC42 | CDC42 | CDC42 | 6733 | 0.021 | 0.41 | NO |
| 14 | PIK3CA | PIK3CA | PIK3CA | 7037 | 0.018 | 0.4 | NO |
| 15 | RHOA | RHOA | RHOA | 7278 | 0.016 | 0.4 | NO |
| 16 | PIK3R1 | PIK3R1 | PIK3R1 | 7356 | 0.015 | 0.4 | NO |
| 17 | NFKBIA | NFKBIA | NFKBIA | 7409 | 0.014 | 0.41 | NO |
| 18 | GSN | GSN | GSN | 7713 | 0.012 | 0.4 | NO |
| 19 | MAPK3 | MAPK3 | MAPK3 | 7882 | 0.01 | 0.39 | NO |
| 20 | MAPK1 | MAPK1 | MAPK1 | 7915 | 0.0098 | 0.39 | NO |
| 21 | MAP3K1 | MAP3K1 | MAP3K1 | 8036 | 0.0086 | 0.39 | NO |
| 22 | SYK | SYK | SYK | 9045 | -0.00033 | 0.34 | NO |
| 23 | MAP3K14 | MAP3K14 | MAP3K14 | 9416 | -0.0038 | 0.32 | NO |
| 24 | ILK | ILK | ILK | 9430 | -0.004 | 0.32 | NO |
| 25 | NFKB1 | NFKB1 | NFKB1 | 9623 | -0.0058 | 0.31 | NO |
| 26 | BCAR1 | BCAR1 | BCAR1 | 10581 | -0.014 | 0.27 | NO |
| 27 | CHUK | CHUK | CHUK | 12649 | -0.036 | 0.17 | NO |
| 28 | PTK2B | PTK2B | PTK2B | 13794 | -0.053 | 0.13 | NO |
| 29 | MAPK8 | MAPK8 | MAPK8 | 13802 | -0.053 | 0.16 | NO |
| 30 | ROCK2 | ROCK2 | ROCK2 | 13972 | -0.056 | 0.18 | NO |
| 31 | FOS | FOS | FOS | 16082 | -0.12 | 0.12 | NO |
Figure S9. Get High-res Image This plot shows mRNAseq_cNMF expression data heatmap (on the left) a RunningEnrichmentScore(RES) plot (on the top right) and a Signal2Noise(S2N) plot (on the bottom right) of genes in the pathway: BIOCARTA VEGF PATHWAY.
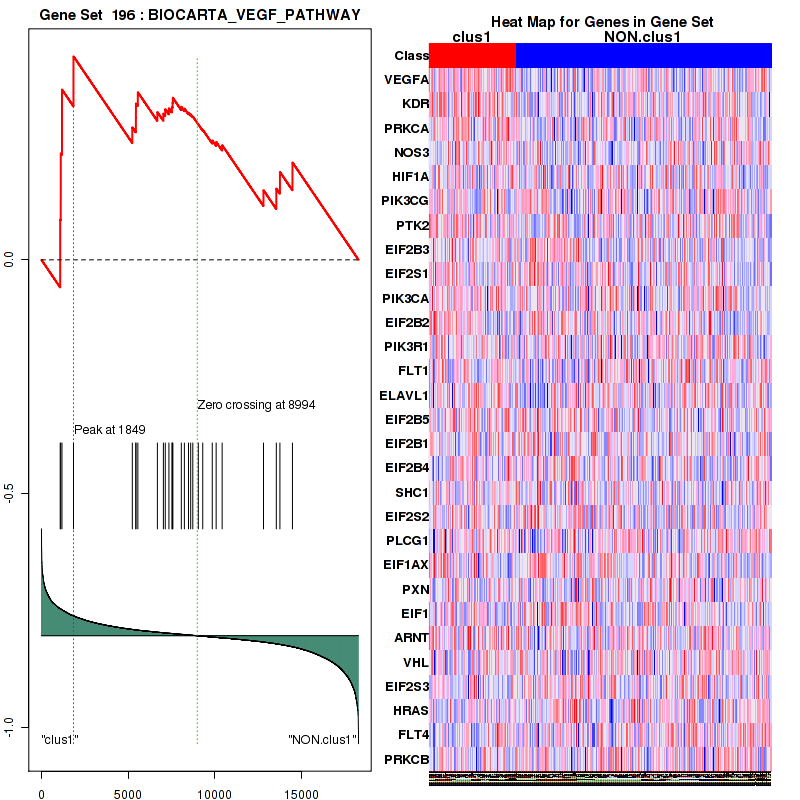
Figure S10. Get High-res Image For the top 5 core enriched genes in the pathway: BIOCARTA VEGF PATHWAY, this volcano plot shows how much they are up/down-regulated and significant. The significance was calculated by empirical bayesian fit
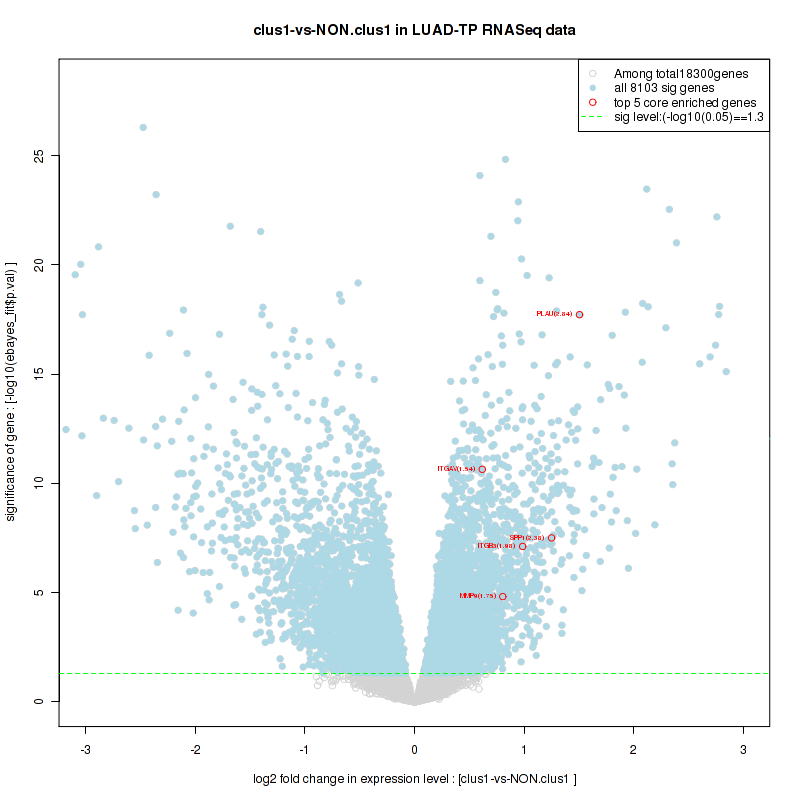
Table S6. Get Full Table This table shows a Running Enrichment Score (RES) of each gene in this pathway, that is, the enrichment score at this point in the ranked list of genes. All genes are ranked by Signal-to-Noise (S2N), a measure of similarity as default and are used to obtain ES matrix of all genes. In this way, GSEA tool uses expression pattern of not only overlapped genes but also not-overlapped genes to produce ES matrix.
| Rank | GENE | SYMBOL | DESC | LIST.LOC | S2N | RES | CORE_ENRICHMENT |
|---|---|---|---|---|---|---|---|
| 1 | FAS | FAS | FAS | 880 | 0.18 | 0.085 | YES |
| 2 | CASP10 | CASP10 | CASP10 | 2534 | 0.093 | 0.065 | YES |
| 3 | RIPK2 | RIPK2 | RIPK2 | 2574 | 0.092 | 0.13 | YES |
| 4 | CFLAR | CFLAR | CFLAR | 2745 | 0.087 | 0.19 | YES |
| 5 | LMNB2 | LMNB2 | LMNB2 | 3443 | 0.069 | 0.2 | YES |
| 6 | ARHGDIB | ARHGDIB | ARHGDIB | 3669 | 0.064 | 0.24 | YES |
| 7 | FADD | FADD | FADD | 3997 | 0.058 | 0.26 | YES |
| 8 | FAF1 | FAF1 | FAF1 | 4297 | 0.052 | 0.28 | YES |
| 9 | JUN | JUN | JUN | 4426 | 0.05 | 0.32 | YES |
| 10 | LMNB1 | LMNB1 | LMNB1 | 4719 | 0.045 | 0.33 | YES |
| 11 | LMNA | LMNA | LMNA | 4931 | 0.042 | 0.35 | YES |
| 12 | DFFA | DFFA | DFFA | 5174 | 0.039 | 0.37 | YES |
| 13 | CASP8 | CASP8 | CASP8 | 5388 | 0.036 | 0.38 | YES |
| 14 | PAK1 | PAK1 | PAK1 | 5481 | 0.034 | 0.4 | YES |
| 15 | FASLG | FASLG | FASLG | 5696 | 0.032 | 0.42 | YES |
| 16 | CASP6 | CASP6 | CASP6 | 5832 | 0.03 | 0.43 | YES |
| 17 | SPTAN1 | SPTAN1 | SPTAN1 | 6117 | 0.027 | 0.44 | YES |
| 18 | PAK2 | PAK2 | PAK2 | 6707 | 0.021 | 0.42 | NO |
| 19 | PRKDC | PRKDC | PRKDC | 7002 | 0.018 | 0.42 | NO |
| 20 | PARP1 | PARP1 | PARP1 | 7295 | 0.015 | 0.41 | NO |
| 21 | CASP3 | CASP3 | CASP3 | 7501 | 0.013 | 0.41 | NO |
| 22 | MAP3K7 | MAP3K7 | MAP3K7 | 7960 | 0.0093 | 0.4 | NO |
| 23 | MAP3K1 | MAP3K1 | MAP3K1 | 8036 | 0.0086 | 0.4 | NO |
| 24 | MAP2K4 | MAP2K4 | MAP2K4 | 8724 | 0.0024 | 0.36 | NO |
| 25 | PTPN13 | PTPN13 | PTPN13 | 10168 | -0.011 | 0.29 | NO |
| 26 | DAXX | DAXX | DAXX | 11639 | -0.024 | 0.23 | NO |
| 27 | DFFB | DFFB | DFFB | 12423 | -0.033 | 0.21 | NO |
| 28 | RB1 | RB1 | RB1 | 13362 | -0.046 | 0.19 | NO |
| 29 | CASP7 | CASP7 | CASP7 | 13543 | -0.049 | 0.22 | NO |
| 30 | MAPK8 | MAPK8 | MAPK8 | 13802 | -0.053 | 0.25 | NO |
Figure S11. Get High-res Image This plot shows mRNAseq_cNMF expression data heatmap (on the left) a RunningEnrichmentScore(RES) plot (on the top right) and a Signal2Noise(S2N) plot (on the bottom right) of genes in the pathway: PID HDAC CLASSII PATHWAY.
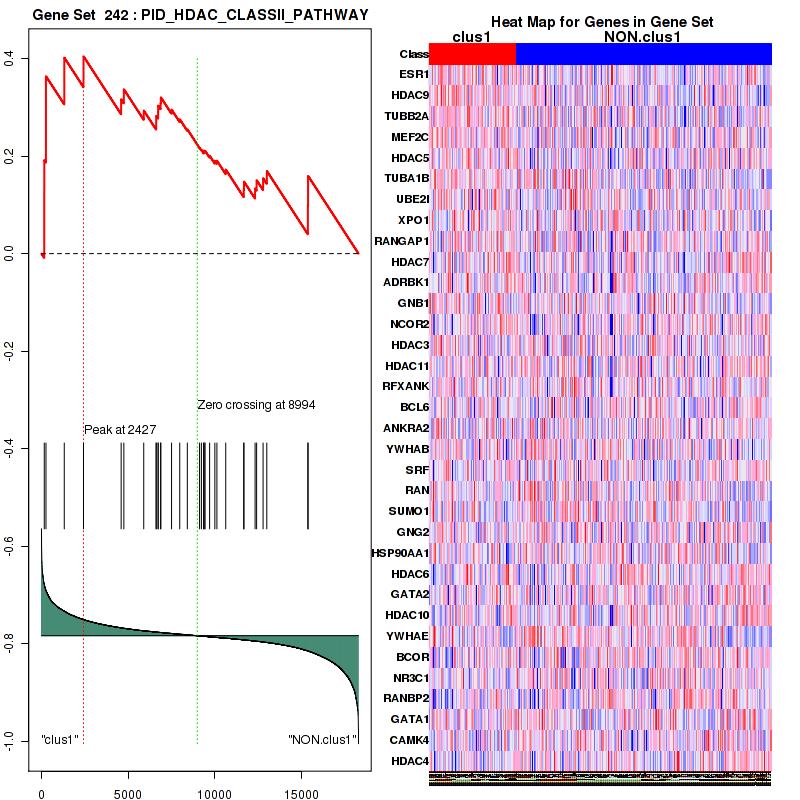
Figure S12. Get High-res Image For the top 5 core enriched genes in the pathway: PID HDAC CLASSII PATHWAY, this volcano plot shows how much they are up/down-regulated and significant. The significance was calculated by empirical bayesian fit
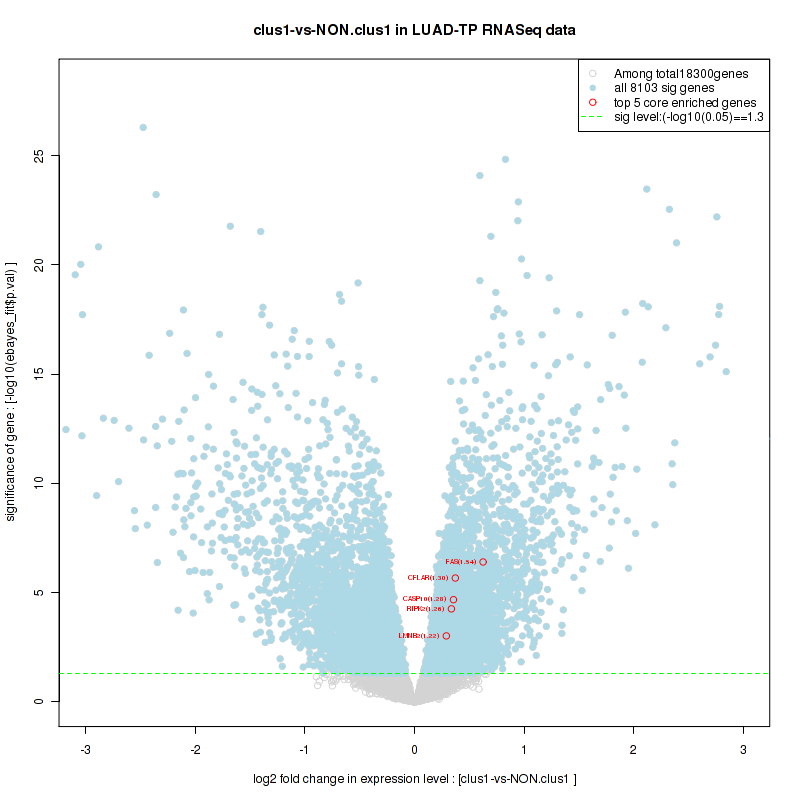
Table S7. Get Full Table This table shows a Running Enrichment Score (RES) of each gene in this pathway, that is, the enrichment score at this point in the ranked list of genes. All genes are ranked by Signal-to-Noise (S2N), a measure of similarity as default and are used to obtain ES matrix of all genes. In this way, GSEA tool uses expression pattern of not only overlapped genes but also not-overlapped genes to produce ES matrix.
| Rank | GENE | SYMBOL | DESC | LIST.LOC | S2N | RES | CORE_ENRICHMENT |
|---|---|---|---|---|---|---|---|
| 1 | ISG15 | ISG15 | ISG15 | 1198 | 0.16 | 0.064 | YES |
| 2 | HERC5 | HERC5 | HERC5 | 1766 | 0.12 | 0.14 | YES |
| 3 | IKBKE | IKBKE | IKBKE | 2668 | 0.089 | 0.16 | YES |
| 4 | IFIH1 | IFIH1 | IFIH1 | 2734 | 0.087 | 0.23 | YES |
| 5 | RNF135 | RNF135 | RNF135 | 2845 | 0.084 | 0.29 | YES |
| 6 | DDX58 | DDX58 | DDX58 | 3284 | 0.072 | 0.33 | YES |
| 7 | TAX1BP1 | TAX1BP1 | TAX1BP1 | 3388 | 0.07 | 0.38 | YES |
| 8 | UBE2L6 | UBE2L6 | UBE2L6 | 3812 | 0.061 | 0.41 | YES |
| 9 | NLRC5 | NLRC5 | NLRC5 | 4451 | 0.05 | 0.42 | YES |
| 10 | UBA7 | UBA7 | UBA7 | 4821 | 0.044 | 0.43 | YES |
| 11 | UBE2D1 | UBE2D1 | UBE2D1 | 4929 | 0.042 | 0.46 | YES |
| 12 | NLRX1 | NLRX1 | NLRX1 | 5652 | 0.032 | 0.45 | NO |
| 13 | UBE2K | UBE2K | UBE2K | 7096 | 0.017 | 0.38 | NO |
| 14 | IRF3 | IRF3 | IRF3 | 7466 | 0.014 | 0.38 | NO |
| 15 | TRAF3 | TRAF3 | TRAF3 | 8249 | 0.0067 | 0.34 | NO |
| 16 | ATG5 | ATG5 | ATG5 | 8553 | 0.004 | 0.33 | NO |
| 17 | OTUD5 | OTUD5 | OTUD5 | 8747 | 0.0022 | 0.32 | NO |
| 18 | PIN1 | PIN1 | PIN1 | 9138 | -0.0012 | 0.3 | NO |
| 19 | UBE2D3 | UBE2D3 | UBE2D3 | 9236 | -0.0021 | 0.29 | NO |
| 20 | ATG12 | ATG12 | ATG12 | 9635 | -0.0059 | 0.28 | NO |
| 21 | UBA52 | UBA52 | UBA52 | 9657 | -0.006 | 0.28 | NO |
| 22 | TRIM25 | TRIM25 | TRIM25 | 9734 | -0.0068 | 0.28 | NO |
| 23 | TNFAIP3 | TNFAIP3 | TNFAIP3 | 9805 | -0.0075 | 0.28 | NO |
| 24 | CYLD | CYLD | CYLD | 9831 | -0.0077 | 0.29 | NO |
| 25 | TBK1 | TBK1 | TBK1 | 10108 | -0.01 | 0.28 | NO |
| 26 | UBE2D2 | UBE2D2 | UBE2D2 | 10575 | -0.014 | 0.27 | NO |
| 27 | RPS27A | RPS27A | RPS27A | 11655 | -0.025 | 0.23 | NO |
| 28 | PCBP2 | PCBP2 | PCBP2 | 12897 | -0.039 | 0.2 | NO |
| 29 | RNF125 | RNF125 | RNF125 | 13947 | -0.056 | 0.18 | NO |
| 30 | MAVS | MAVS | MAVS | 14362 | -0.064 | 0.22 | NO |
Figure S13. Get High-res Image This plot shows mRNAseq_cNMF expression data heatmap (on the left) a RunningEnrichmentScore(RES) plot (on the top right) and a Signal2Noise(S2N) plot (on the bottom right) of genes in the pathway: PID AVB3 OPN PATHWAY.
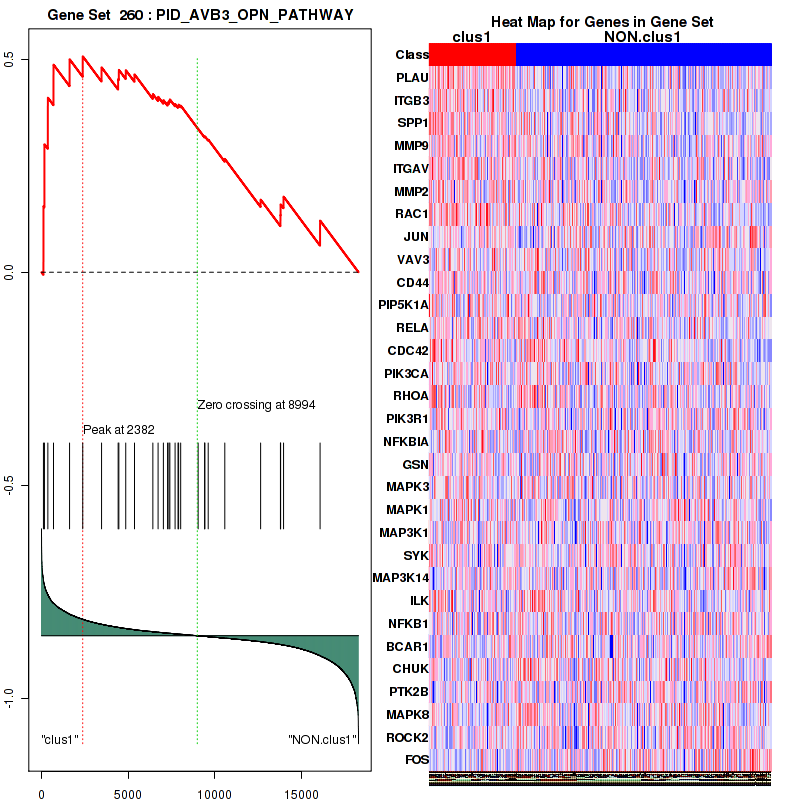
Figure S14. Get High-res Image For the top 5 core enriched genes in the pathway: PID AVB3 OPN PATHWAY, this volcano plot shows how much they are up/down-regulated and significant. The significance was calculated by empirical bayesian fit
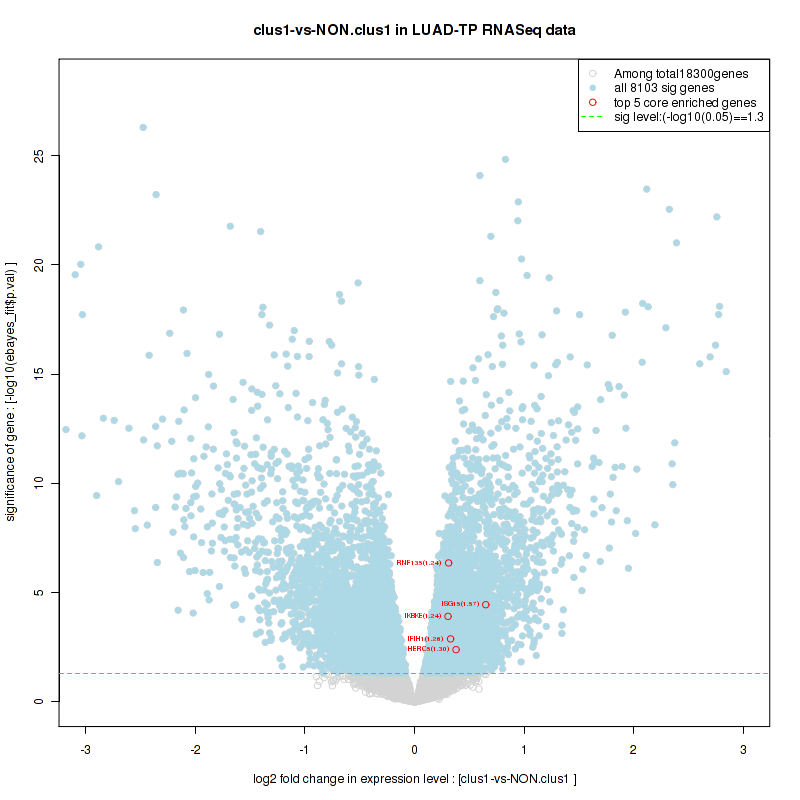
Table S8. Get Full Table This table shows a Running Enrichment Score (RES) of each gene in this pathway, that is, the enrichment score at this point in the ranked list of genes. All genes are ranked by Signal-to-Noise (S2N), a measure of similarity as default and are used to obtain ES matrix of all genes. In this way, GSEA tool uses expression pattern of not only overlapped genes but also not-overlapped genes to produce ES matrix.
| Rank | GENE | SYMBOL | DESC | LIST.LOC | S2N | RES | CORE_ENRICHMENT |
|---|---|---|---|---|---|---|---|
| 1 | VEGFA | VEGFA | VEGFA | 1081 | 0.16 | 0.086 | YES |
| 2 | KDR | KDR | KDR | 1113 | 0.16 | 0.23 | YES |
| 3 | PRKCA | PRKCA | PRKCA | 1185 | 0.16 | 0.36 | YES |
| 4 | NOS3 | NOS3 | NOS3 | 1849 | 0.12 | 0.44 | YES |
| 5 | HIF1A | HIF1A | HIF1A | 5244 | 0.038 | 0.28 | NO |
| 6 | PIK3CG | PIK3CG | PIK3CG | 5449 | 0.035 | 0.3 | NO |
| 7 | PTK2 | PTK2 | PTK2 | 5452 | 0.035 | 0.34 | NO |
| 8 | EIF2B3 | EIF2B3 | EIF2B3 | 5562 | 0.033 | 0.36 | NO |
| 9 | EIF2S1 | EIF2S1 | EIF2S1 | 6689 | 0.021 | 0.32 | NO |
| 10 | PIK3CA | PIK3CA | PIK3CA | 7037 | 0.018 | 0.31 | NO |
| 11 | EIF2B2 | EIF2B2 | EIF2B2 | 7144 | 0.017 | 0.32 | NO |
| 12 | PIK3R1 | PIK3R1 | PIK3R1 | 7356 | 0.015 | 0.32 | NO |
| 13 | FLT1 | FLT1 | FLT1 | 7528 | 0.013 | 0.33 | NO |
| 14 | ELAVL1 | ELAVL1 | ELAVL1 | 7569 | 0.013 | 0.34 | NO |
| 15 | EIF2B5 | EIF2B5 | EIF2B5 | 7579 | 0.013 | 0.35 | NO |
| 16 | EIF2B1 | EIF2B1 | EIF2B1 | 8071 | 0.0083 | 0.33 | NO |
| 17 | EIF2B4 | EIF2B4 | EIF2B4 | 8250 | 0.0067 | 0.32 | NO |
| 18 | SHC1 | SHC1 | SHC1 | 8487 | 0.0046 | 0.32 | NO |
| 19 | EIF2S2 | EIF2S2 | EIF2S2 | 8612 | 0.0034 | 0.31 | NO |
| 20 | PLCG1 | PLCG1 | PLCG1 | 8734 | 0.0023 | 0.31 | NO |
| 21 | EIF1AX | EIF1AX | EIF1AX | 9055 | -0.00044 | 0.29 | NO |
| 22 | PXN | PXN | PXN | 9307 | -0.0028 | 0.28 | NO |
| 23 | EIF1 | EIF1 | EIF1 | 9860 | -0.008 | 0.26 | NO |
| 24 | ARNT | ARNT | ARNT | 10083 | -0.01 | 0.25 | NO |
| 25 | VHL | VHL | VHL | 10430 | -0.013 | 0.25 | NO |
| 26 | EIF2S3 | EIF2S3 | EIF2S3 | 12814 | -0.038 | 0.15 | NO |
| 27 | HRAS | HRAS | HRAS | 13555 | -0.049 | 0.15 | NO |
| 28 | FLT4 | FLT4 | FLT4 | 13764 | -0.052 | 0.19 | NO |
| 29 | PRKCB | PRKCB | PRKCB | 14487 | -0.066 | 0.21 | NO |
Figure S15. Get High-res Image This plot shows mRNAseq_cNMF expression data heatmap (on the left) a RunningEnrichmentScore(RES) plot (on the top right) and a Signal2Noise(S2N) plot (on the bottom right) of genes in the pathway: PID ILK PATHWAY.
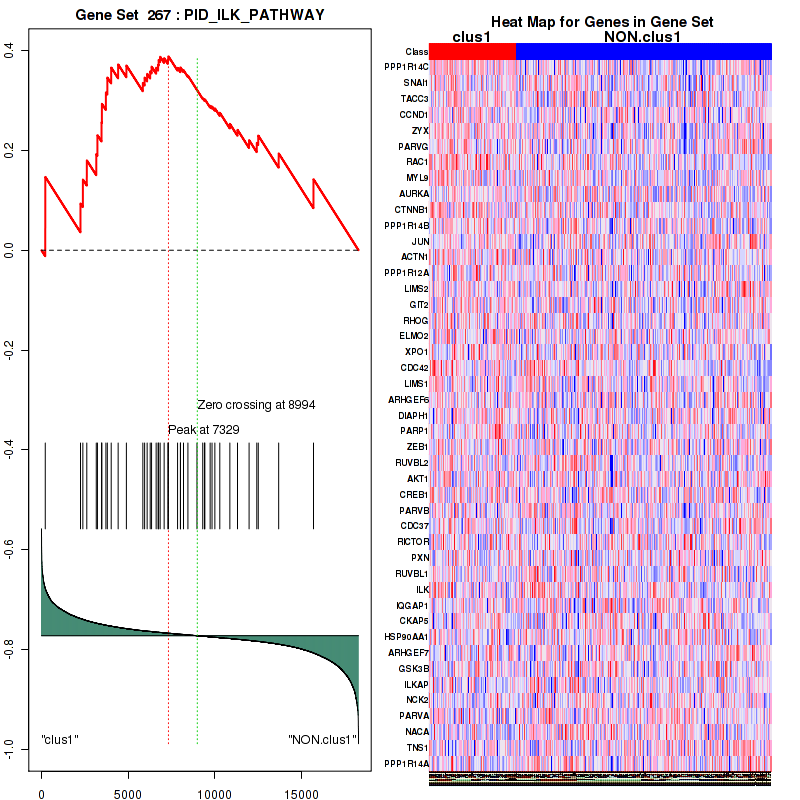
Figure S16. Get High-res Image For the top 5 core enriched genes in the pathway: PID ILK PATHWAY, this volcano plot shows how much they are up/down-regulated and significant. The significance was calculated by empirical bayesian fit

Table S9. Get Full Table This table shows a Running Enrichment Score (RES) of each gene in this pathway, that is, the enrichment score at this point in the ranked list of genes. All genes are ranked by Signal-to-Noise (S2N), a measure of similarity as default and are used to obtain ES matrix of all genes. In this way, GSEA tool uses expression pattern of not only overlapped genes but also not-overlapped genes to produce ES matrix.
| Rank | GENE | SYMBOL | DESC | LIST.LOC | S2N | RES | CORE_ENRICHMENT |
|---|---|---|---|---|---|---|---|
| 1 | IFIT1 | IFIT1 | IFIT1 | 1020 | 0.17 | 0.0095 | YES |
| 2 | ISG15 | ISG15 | ISG15 | 1198 | 0.16 | 0.061 | YES |
| 3 | HERC5 | HERC5 | HERC5 | 1766 | 0.12 | 0.078 | YES |
| 4 | KPNA2 | KPNA2 | KPNA2 | 1972 | 0.11 | 0.11 | YES |
| 5 | NUP155 | NUP155 | NUP155 | 1999 | 0.11 | 0.15 | YES |
| 6 | NUPL2 | NUPL2 | NUPL2 | 2072 | 0.11 | 0.19 | YES |
| 7 | MX2 | MX2 | MX2 | 2201 | 0.1 | 0.23 | YES |
| 8 | MX1 | MX1 | MX1 | 2508 | 0.094 | 0.25 | YES |
| 9 | EIF2AK2 | EIF2AK2 | EIF2AK2 | 3132 | 0.076 | 0.24 | YES |
| 10 | DDX58 | DDX58 | DDX58 | 3284 | 0.072 | 0.26 | YES |
| 11 | NUP85 | NUP85 | NUP85 | 3500 | 0.068 | 0.28 | YES |
| 12 | NEDD4 | NEDD4 | NEDD4 | 3576 | 0.066 | 0.3 | YES |
| 13 | UBE2L6 | UBE2L6 | UBE2L6 | 3812 | 0.061 | 0.31 | YES |
| 14 | NUP205 | NUP205 | NUP205 | 3903 | 0.059 | 0.33 | YES |
| 15 | USP18 | USP18 | USP18 | 4626 | 0.047 | 0.31 | YES |
| 16 | NUP210 | NUP210 | NUP210 | 4702 | 0.045 | 0.32 | YES |
| 17 | STAT1 | STAT1 | STAT1 | 4772 | 0.044 | 0.34 | YES |
| 18 | UBA7 | UBA7 | UBA7 | 4821 | 0.044 | 0.35 | YES |
| 19 | NUP62 | NUP62 | NUP62 | 4862 | 0.043 | 0.36 | YES |
| 20 | POM121 | POM121 | POM121 | 4870 | 0.043 | 0.38 | YES |
| 21 | NUP54 | NUP54 | NUP54 | 5945 | 0.029 | 0.33 | NO |
| 22 | KPNA4 | KPNA4 | KPNA4 | 6287 | 0.026 | 0.33 | NO |
| 23 | EIF4A3 | EIF4A3 | EIF4A3 | 6462 | 0.024 | 0.32 | NO |
| 24 | EIF4E | EIF4E | EIF4E | 6726 | 0.021 | 0.32 | NO |
| 25 | NUP93 | NUP93 | NUP93 | 6901 | 0.019 | 0.32 | NO |
| 26 | NUP107 | NUP107 | NUP107 | 7088 | 0.017 | 0.31 | NO |
| 27 | IRF3 | IRF3 | IRF3 | 7466 | 0.014 | 0.3 | NO |
| 28 | EIF4G1 | EIF4G1 | EIF4G1 | 7540 | 0.013 | 0.3 | NO |
| 29 | NUP188 | NUP188 | NUP188 | 7639 | 0.012 | 0.3 | NO |
| 30 | KPNB1 | KPNB1 | KPNB1 | 7816 | 0.011 | 0.29 | NO |
| 31 | MAPK3 | MAPK3 | MAPK3 | 7882 | 0.01 | 0.29 | NO |
| 32 | NUP43 | NUP43 | NUP43 | 7901 | 0.0099 | 0.3 | NO |
| 33 | UBE2E1 | UBE2E1 | UBE2E1 | 8107 | 0.0081 | 0.29 | NO |
| 34 | EIF4G3 | EIF4G3 | EIF4G3 | 8549 | 0.004 | 0.27 | NO |
| 35 | KPNA1 | KPNA1 | KPNA1 | 8634 | 0.0032 | 0.26 | NO |
| 36 | FLNB | FLNB | FLNB | 8717 | 0.0025 | 0.26 | NO |
| 37 | PLCG1 | PLCG1 | PLCG1 | 8734 | 0.0023 | 0.26 | NO |
| 38 | NUP37 | NUP37 | NUP37 | 8792 | 0.0017 | 0.26 | NO |
| 39 | NUP214 | NUP214 | NUP214 | 8843 | 0.0012 | 0.26 | NO |
| 40 | JAK1 | JAK1 | JAK1 | 8877 | 0.00094 | 0.25 | NO |
| 41 | PIN1 | PIN1 | PIN1 | 9138 | -0.0012 | 0.24 | NO |
| 42 | SEH1L | SEH1L | SEH1L | 9454 | -0.0042 | 0.22 | NO |
| 43 | RAE1 | RAE1 | RAE1 | 9481 | -0.0045 | 0.22 | NO |
| 44 | TPR | TPR | TPR | 9488 | -0.0046 | 0.23 | NO |
| 45 | EIF4G2 | EIF4G2 | EIF4G2 | 9494 | -0.0046 | 0.23 | NO |
| 46 | UBA52 | UBA52 | UBA52 | 9657 | -0.006 | 0.22 | NO |
| 47 | EIF4A2 | EIF4A2 | EIF4A2 | 9708 | -0.0065 | 0.22 | NO |
| 48 | TRIM25 | TRIM25 | TRIM25 | 9734 | -0.0068 | 0.22 | NO |
| 49 | EIF4A1 | EIF4A1 | EIF4A1 | 10334 | -0.012 | 0.19 | NO |
| 50 | NUP153 | NUP153 | NUP153 | 11254 | -0.021 | 0.15 | NO |
| 51 | EIF4E2 | EIF4E2 | EIF4E2 | 11451 | -0.023 | 0.15 | NO |
| 52 | RPS27A | RPS27A | RPS27A | 11655 | -0.025 | 0.15 | NO |
| 53 | UBE2N | UBE2N | UBE2N | 11657 | -0.025 | 0.16 | NO |
| 54 | EIF4E3 | EIF4E3 | EIF4E3 | 11745 | -0.026 | 0.16 | NO |
| 55 | PPM1B | PPM1B | PPM1B | 11850 | -0.027 | 0.17 | NO |
| 56 | NUP35 | NUP35 | NUP35 | 11963 | -0.028 | 0.17 | NO |
| 57 | NUPL1 | NUPL1 | NUPL1 | 12028 | -0.029 | 0.18 | NO |
| 58 | KPNA3 | KPNA3 | KPNA3 | 12324 | -0.032 | 0.18 | NO |
| 59 | NUP133 | NUP133 | NUP133 | 12355 | -0.032 | 0.19 | NO |
| 60 | NUP50 | NUP50 | NUP50 | 12560 | -0.035 | 0.19 | NO |
| 61 | RANBP2 | RANBP2 | RANBP2 | 12793 | -0.038 | 0.19 | NO |
| 62 | AAAS | AAAS | AAAS | 13592 | -0.05 | 0.17 | NO |
| 63 | NUP88 | NUP88 | NUP88 | 13722 | -0.052 | 0.18 | NO |
| 64 | ARIH1 | ARIH1 | ARIH1 | 14058 | -0.058 | 0.19 | NO |
| 65 | KPNA5 | KPNA5 | KPNA5 | 16040 | -0.12 | 0.12 | NO |
Figure S17. Get High-res Image This plot shows mRNAseq_cNMF expression data heatmap (on the left) a RunningEnrichmentScore(RES) plot (on the top right) and a Signal2Noise(S2N) plot (on the bottom right) of genes in the pathway: PID TCPTP PATHWAY.
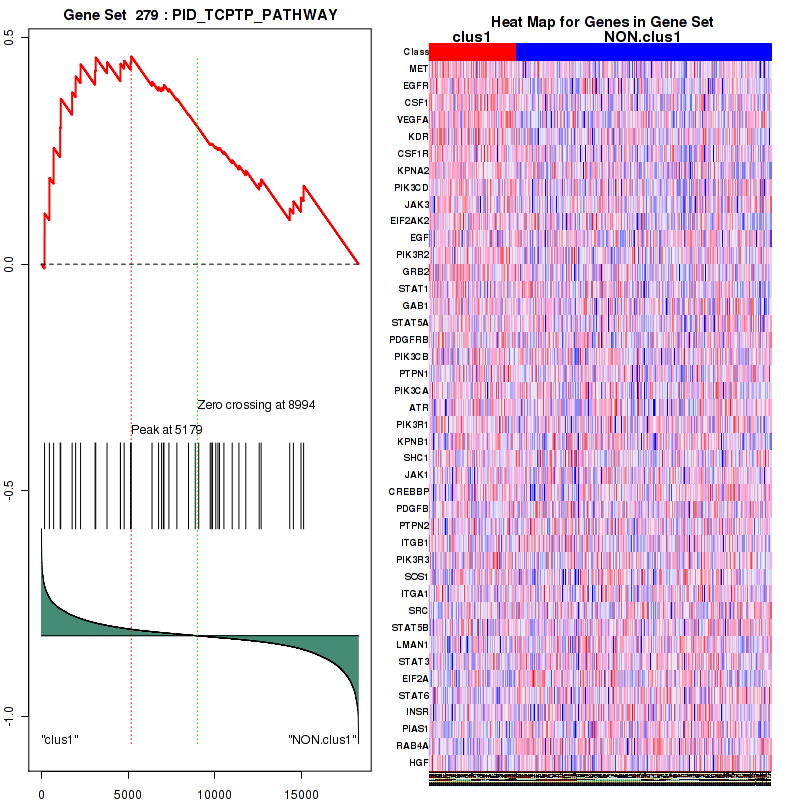
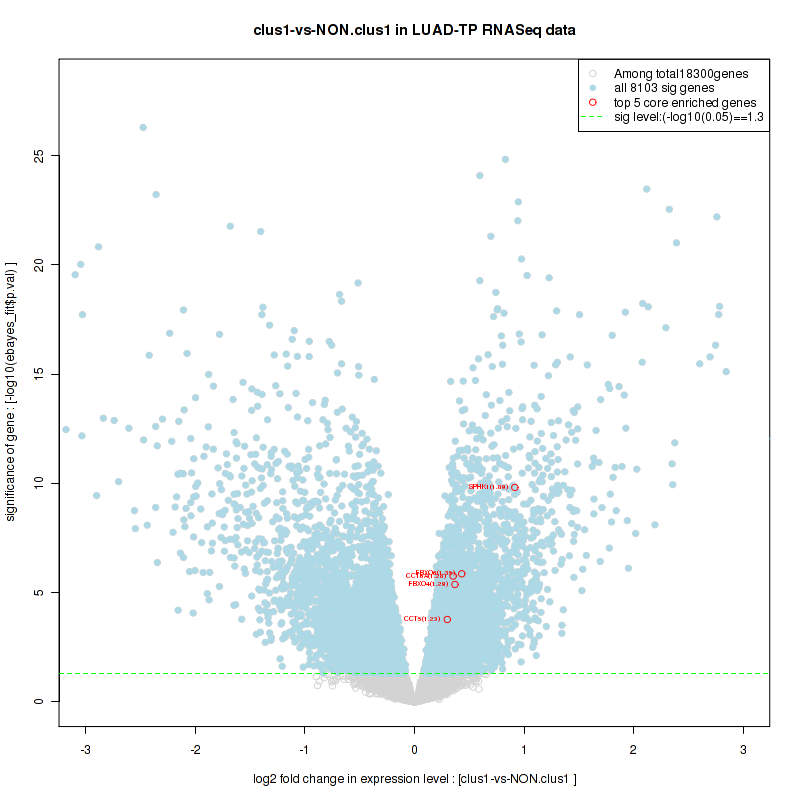
Figure S18. Get High-res Image For the top 5 core enriched genes in the pathway: PID TCPTP PATHWAY, this volcano plot shows how much they are up/down-regulated and significant. The significance was calculated by empirical bayesian fit
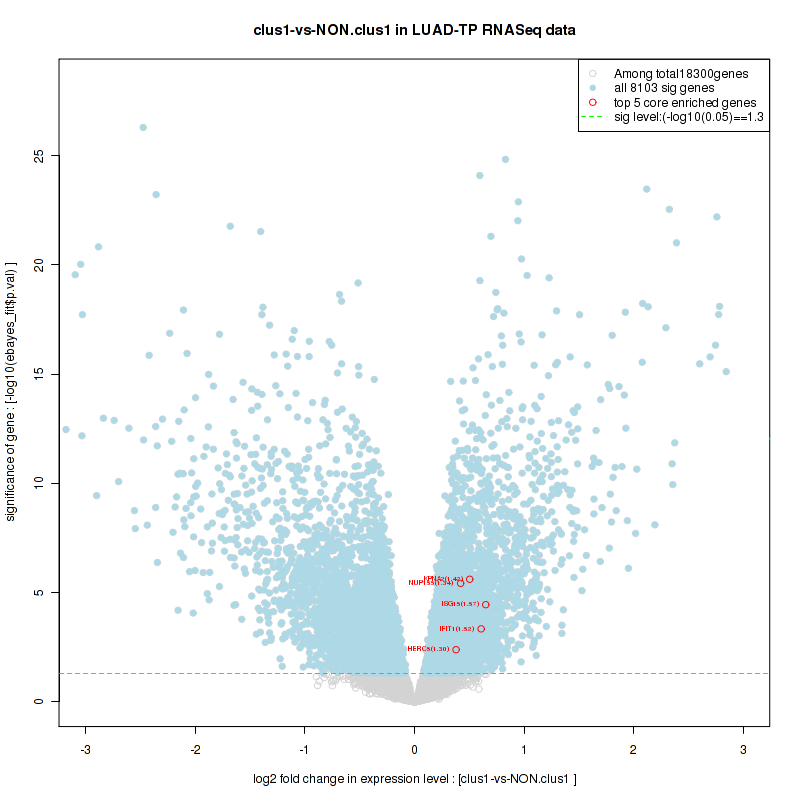
Table S10. Get Full Table This table shows a Running Enrichment Score (RES) of each gene in this pathway, that is, the enrichment score at this point in the ranked list of genes. All genes are ranked by Signal-to-Noise (S2N), a measure of similarity as default and are used to obtain ES matrix of all genes. In this way, GSEA tool uses expression pattern of not only overlapped genes but also not-overlapped genes to produce ES matrix.
| Rank | GENE | SYMBOL | DESC | LIST.LOC | S2N | RES | CORE_ENRICHMENT |
|---|---|---|---|---|---|---|---|
| 1 | SPHK1 | SPHK1 | SPHK1 | 205 | 0.29 | 0.25 | YES |
| 2 | FBXO6 | FBXO6 | FBXO6 | 1847 | 0.12 | 0.26 | YES |
| 3 | FBXO4 | FBXO4 | FBXO4 | 1932 | 0.12 | 0.36 | YES |
| 4 | CCT6A | CCT6A | CCT6A | 3268 | 0.073 | 0.35 | YES |
| 5 | CCT5 | CCT5 | CCT5 | 3853 | 0.06 | 0.38 | YES |
| 6 | KIF13A | KIF13A | KIF13A | 5220 | 0.038 | 0.34 | NO |
| 7 | CCT4 | CCT4 | CCT4 | 6077 | 0.028 | 0.31 | NO |
| 8 | CCT8 | CCT8 | CCT8 | 6994 | 0.018 | 0.28 | NO |
| 9 | CCT3 | CCT3 | CCT3 | 7415 | 0.014 | 0.27 | NO |
| 10 | CCT7 | CCT7 | CCT7 | 7822 | 0.011 | 0.26 | NO |
| 11 | FBXW7 | FBXW7 | FBXW7 | 8157 | 0.0076 | 0.24 | NO |
| 12 | FKBP9 | FKBP9 | FKBP9 | 8319 | 0.0061 | 0.24 | NO |
| 13 | FBXL3 | FBXL3 | FBXL3 | 9165 | -0.0014 | 0.2 | NO |
| 14 | CCT2 | CCT2 | CCT2 | 9672 | -0.0062 | 0.17 | NO |
| 15 | TCP1 | TCP1 | TCP1 | 9834 | -0.0077 | 0.17 | NO |
| 16 | KIFC3 | KIFC3 | KIFC3 | 10622 | -0.015 | 0.14 | NO |
| 17 | FBXL5 | FBXL5 | FBXL5 | 10645 | -0.015 | 0.15 | NO |
| 18 | AP3M1 | AP3M1 | AP3M1 | 10739 | -0.016 | 0.16 | NO |
| 19 | FBXW2 | FBXW2 | FBXW2 | 11319 | -0.022 | 0.15 | NO |
| 20 | ARFGEF2 | ARFGEF2 | ARFGEF2 | 11549 | -0.024 | 0.16 | NO |
| 21 | USP11 | USP11 | USP11 | 11768 | -0.026 | 0.17 | NO |
| 22 | LONP2 | LONP2 | LONP2 | 11958 | -0.028 | 0.18 | NO |
| 23 | FBXW5 | FBXW5 | FBXW5 | 12837 | -0.038 | 0.17 | NO |
| 24 | NOP56 | NOP56 | NOP56 | 13147 | -0.042 | 0.19 | NO |
| 25 | XRN2 | XRN2 | XRN2 | 13404 | -0.046 | 0.22 | NO |
| 26 | FBXW4 | FBXW4 | FBXW4 | 13916 | -0.055 | 0.24 | NO |
Figure S19. Get High-res Image This plot shows mRNAseq_cNMF expression data heatmap (on the left) a RunningEnrichmentScore(RES) plot (on the top right) and a Signal2Noise(S2N) plot (on the bottom right) of genes in the pathway: PID TELOMERASEPATHWAY.
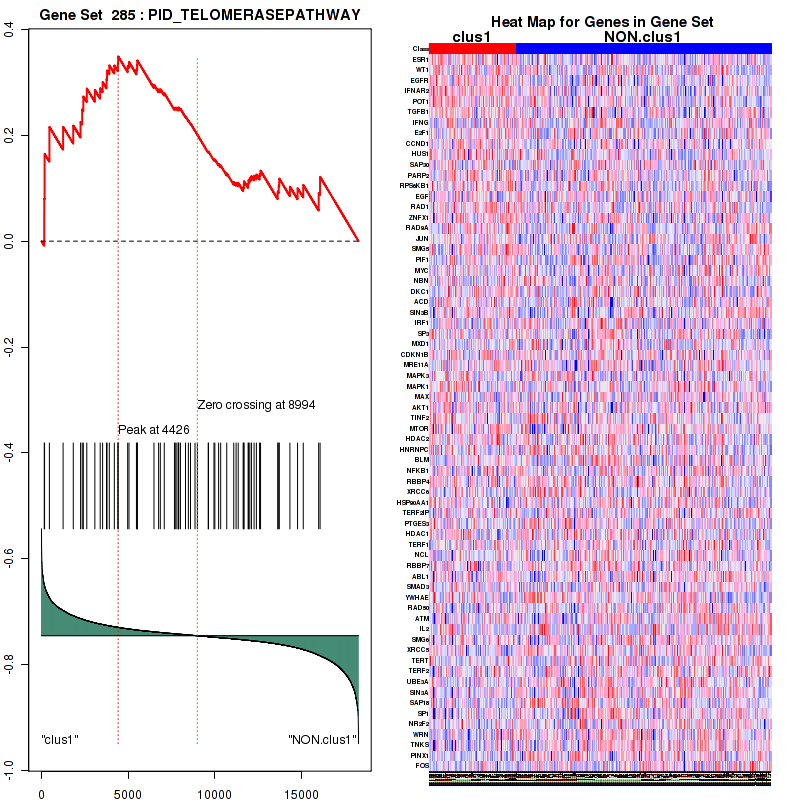
Figure S20. Get High-res Image For the top 5 core enriched genes in the pathway: PID TELOMERASEPATHWAY, this volcano plot shows how much they are up/down-regulated and significant. The significance was calculated by empirical bayesian fit
For the top enriched genes, if you want to check whether they are
-
up-regulated, please check the list of up-regulated genes
-
down-regulated, please check the list of down-regulated genes
For the top enriched genes, if you want to check whether they are
-
highly expressed genes, please check the list of high (top 30%) expressed genes
-
low expressed genes, please check the list of low (bottom 30%) expressed genes
An expression pattern of top(30%)/middle(30%)/low(30%) in this subtype against other subtypes is available in a heatmap
For the top enriched genes, if you want to check whether they are
-
significantly differently expressed genes by eBayes lm fit, please check the list of significant genes
Table 4. Get Full Table This table shows top 10 pathways which are significantly enriched in cluster clus2. It displays only significant gene sets satisfying nom.p.val.threshold (-1), fwer.p.val.threshold (-1) , fdr.q.val.threshold (0.25) and the default table is sorted by Normalized Enrichment Score (NES). Further details on NES statistics, please visit The Broad GSEA website.
| GeneSet(GS) | Size(#genes) | genes.ES.table | ES | NES | NOM.p.val | FDR.q.val | FWER.p.val | Tag.. | Gene.. | Signal | FDR..median. | glob.p.val |
|---|---|---|---|---|---|---|---|---|---|---|---|---|
| KEGG FATTY ACID METABOLISM | 40 | genes.ES.table | 0.52 | 1.5 | 0.047 | 1 | 0.98 | 0.48 | 0.25 | 0.36 | 0.93 | 0.48 |
| KEGG VALINE LEUCINE AND ISOLEUCINE DEGRADATION | 44 | genes.ES.table | 0.48 | 1.7 | 0.038 | 1 | 0.84 | 0.61 | 0.28 | 0.44 | 1 | 0.62 |
| KEGG ARACHIDONIC ACID METABOLISM | 52 | genes.ES.table | 0.62 | 1.5 | 0.0083 | 1 | 0.98 | 0.44 | 0.18 | 0.36 | 0.98 | 0.5 |
| KEGG PROPANOATE METABOLISM | 32 | genes.ES.table | 0.46 | 1.5 | 0.076 | 1 | 0.98 | 0.44 | 0.22 | 0.34 | 0.9 | 0.46 |
| KEGG ALDOSTERONE REGULATED SODIUM REABSORPTION | 40 | genes.ES.table | 0.55 | 1.6 | 0.019 | 1 | 0.96 | 0.5 | 0.25 | 0.38 | 1 | 0.6 |
| KEGG VASOPRESSIN REGULATED WATER REABSORPTION | 42 | genes.ES.table | 0.51 | 1.9 | 0.0021 | 1 | 0.3 | 0.19 | 0.12 | 0.17 | 0 | 0.22 |
| KEGG VIRAL MYOCARDITIS | 66 | genes.ES.table | 0.55 | 1.5 | 0.079 | 1 | 0.98 | 0.46 | 0.2 | 0.36 | 0.91 | 0.47 |
| BIOCARTA FCER1 PATHWAY | 38 | genes.ES.table | 0.47 | 1.6 | 0.075 | 1 | 0.97 | 0.34 | 0.25 | 0.26 | 1 | 0.57 |
| ST ADRENERGIC | 35 | genes.ES.table | 0.53 | 1.5 | 0.037 | 1 | 0.98 | 0.37 | 0.18 | 0.3 | 1 | 0.51 |
| ST WNT BETA CATENIN PATHWAY | 31 | genes.ES.table | 0.51 | 1.5 | 0.086 | 1 | 0.99 | 0.32 | 0.2 | 0.26 | 0.89 | 0.46 |
Table S11. Get Full Table This table shows a Running Enrichment Score (RES) of each gene in this pathway, that is, the enrichment score at this point in the ranked list of genes. All genes are ranked by Signal-to-Noise (S2N), a measure of similarity as default and are used to obtain ES matrix of all genes. In this way, GSEA tool uses expression pattern of not only overlapped genes but also not-overlapped genes to produce ES matrix.
| Rank | GENE | SYMBOL | DESC | LIST.LOC | S2N | RES | CORE_ENRICHMENT |
|---|---|---|---|---|---|---|---|
| 1 | AQP4 | AQP4 | AQP4 | 79 | 0.52 | 0.16 | YES |
| 2 | AQP2 | AQP2 | AQP2 | 506 | 0.33 | 0.23 | YES |
| 3 | AQP3 | AQP3 | AQP3 | 524 | 0.32 | 0.33 | YES |
| 4 | ADCY9 | ADCY9 | ADCY9 | 1364 | 0.2 | 0.35 | YES |
| 5 | AVPR2 | AVPR2 | AVPR2 | 1499 | 0.19 | 0.4 | YES |
| 6 | CREB3L1 | CREB3L1 | CREB3L1 | 1749 | 0.17 | 0.44 | YES |
| 7 | DYNC2H1 | DYNC2H1 | DYNC2H1 | 2129 | 0.15 | 0.46 | YES |
| 8 | VAMP2 | VAMP2 | VAMP2 | 2141 | 0.15 | 0.51 | YES |
| 9 | ARHGDIB | ARHGDIB | ARHGDIB | 2876 | 0.12 | 0.5 | NO |
| 10 | ADCY6 | ADCY6 | ADCY6 | 4417 | 0.071 | 0.44 | NO |
| 11 | DCTN4 | DCTN4 | DCTN4 | 4806 | 0.062 | 0.44 | NO |
| 12 | DYNC2LI1 | DYNC2LI1 | DYNC2LI1 | 5089 | 0.056 | 0.44 | NO |
| 13 | DYNC1LI2 | DYNC1LI2 | DYNC1LI2 | 5642 | 0.047 | 0.43 | NO |
| 14 | DYNLL2 | DYNLL2 | DYNLL2 | 5795 | 0.044 | 0.43 | NO |
| 15 | DCTN6 | DCTN6 | DCTN6 | 6523 | 0.033 | 0.4 | NO |
| 16 | DCTN1 | DCTN1 | DCTN1 | 6600 | 0.032 | 0.41 | NO |
| 17 | RAB11B | RAB11B | RAB11B | 6774 | 0.03 | 0.41 | NO |
| 18 | RAB5B | RAB5B | RAB5B | 7050 | 0.026 | 0.4 | NO |
| 19 | CREB1 | CREB1 | CREB1 | 7272 | 0.023 | 0.4 | NO |
| 20 | CREB3L4 | CREB3L4 | CREB3L4 | 7482 | 0.02 | 0.39 | NO |
| 21 | PRKACB | PRKACB | PRKACB | 7964 | 0.014 | 0.37 | NO |
| 22 | PRKACA | PRKACA | PRKACA | 8279 | 0.0097 | 0.35 | NO |
| 23 | RAB5A | RAB5A | RAB5A | 8631 | 0.0054 | 0.34 | NO |
| 24 | CREB5 | CREB5 | CREB5 | 9207 | -0.0016 | 0.3 | NO |
| 25 | DCTN5 | DCTN5 | DCTN5 | 9677 | -0.0076 | 0.28 | NO |
| 26 | DYNC1LI1 | DYNC1LI1 | DYNC1LI1 | 9728 | -0.0082 | 0.28 | NO |
| 27 | RAB11A | RAB11A | RAB11A | 9961 | -0.011 | 0.27 | NO |
| 28 | CREB3 | CREB3 | CREB3 | 10066 | -0.012 | 0.27 | NO |
| 29 | PRKX | PRKX | PRKX | 10141 | -0.013 | 0.27 | NO |
| 30 | DYNC1H1 | DYNC1H1 | DYNC1H1 | 10239 | -0.014 | 0.27 | NO |
| 31 | RAB5C | RAB5C | RAB5C | 10248 | -0.014 | 0.27 | NO |
| 32 | STX4 | STX4 | STX4 | 10401 | -0.016 | 0.27 | NO |
| 33 | GNAS | GNAS | GNAS | 10936 | -0.023 | 0.25 | NO |
| 34 | CREB3L2 | CREB3L2 | CREB3L2 | 10973 | -0.024 | 0.25 | NO |
| 35 | DYNC1I2 | DYNC1I2 | DYNC1I2 | 11148 | -0.026 | 0.25 | NO |
| 36 | ARHGDIA | ARHGDIA | ARHGDIA | 11193 | -0.027 | 0.26 | NO |
| 37 | NSF | NSF | NSF | 11365 | -0.029 | 0.26 | NO |
| 38 | CREB3L3 | CREB3L3 | CREB3L3 | 11523 | -0.031 | 0.26 | NO |
| 39 | DCTN2 | DCTN2 | DCTN2 | 12173 | -0.039 | 0.23 | NO |
| 40 | ADCY3 | ADCY3 | ADCY3 | 13820 | -0.068 | 0.16 | NO |
| 41 | DYNLL1 | DYNLL1 | DYNLL1 | 15347 | -0.11 | 0.11 | NO |
| 42 | DYNC1I1 | DYNC1I1 | DYNC1I1 | 16417 | -0.16 | 0.1 | NO |
Figure S21. Get High-res Image This plot shows mRNAseq_cNMF expression data heatmap (on the left) a RunningEnrichmentScore(RES) plot (on the top right) and a Signal2Noise(S2N) plot (on the bottom right) of genes in the pathway: KEGG FATTY ACID METABOLISM.
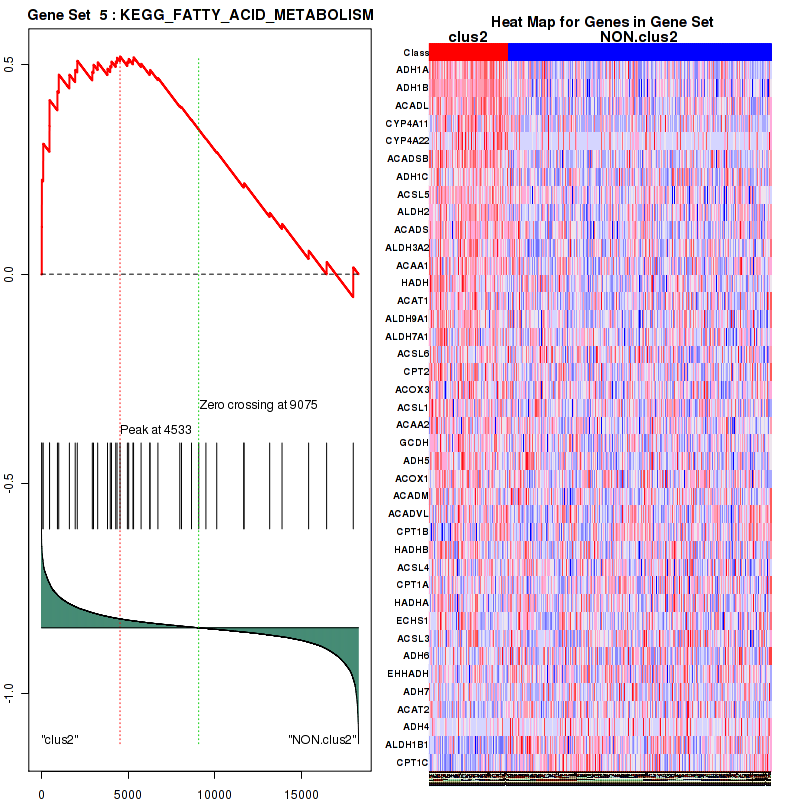
Figure S22. Get High-res Image For the top 5 core enriched genes in the pathway: KEGG FATTY ACID METABOLISM, this volcano plot shows how much they are up/down-regulated and significant. The significance was calculated by empirical bayesian fit

Table S12. Get Full Table This table shows a Running Enrichment Score (RES) of each gene in this pathway, that is, the enrichment score at this point in the ranked list of genes. All genes are ranked by Signal-to-Noise (S2N), a measure of similarity as default and are used to obtain ES matrix of all genes. In this way, GSEA tool uses expression pattern of not only overlapped genes but also not-overlapped genes to produce ES matrix.
| Rank | GENE | SYMBOL | DESC | LIST.LOC | S2N | RES | CORE_ENRICHMENT |
|---|---|---|---|---|---|---|---|
| 1 | ACADSB | ACADSB | ACADSB | 922 | 0.25 | 0.0074 | YES |
| 2 | PCCA | PCCA | PCCA | 1223 | 0.22 | 0.041 | YES |
| 3 | HMGCS2 | HMGCS2 | HMGCS2 | 1349 | 0.21 | 0.081 | YES |
| 4 | ALDH6A1 | ALDH6A1 | ALDH6A1 | 1558 | 0.19 | 0.11 | YES |
| 5 | ABAT | ABAT | ABAT | 1637 | 0.18 | 0.15 | YES |
| 6 | IVD | IVD | IVD | 1674 | 0.18 | 0.19 | YES |
| 7 | ACAD8 | ACAD8 | ACAD8 | 1845 | 0.17 | 0.22 | YES |
| 8 | ALDH2 | ALDH2 | ALDH2 | 1947 | 0.16 | 0.25 | YES |
| 9 | ACADS | ACADS | ACADS | 2068 | 0.16 | 0.28 | YES |
| 10 | MCEE | MCEE | MCEE | 2349 | 0.14 | 0.3 | YES |
| 11 | AOX1 | AOX1 | AOX1 | 2812 | 0.12 | 0.3 | YES |
| 12 | ALDH3A2 | ALDH3A2 | ALDH3A2 | 2934 | 0.12 | 0.32 | YES |
| 13 | BCKDHA | BCKDHA | BCKDHA | 2992 | 0.11 | 0.34 | YES |
| 14 | ACAA1 | ACAA1 | ACAA1 | 3004 | 0.11 | 0.37 | YES |
| 15 | BCAT1 | BCAT1 | BCAT1 | 3027 | 0.11 | 0.39 | YES |
| 16 | HADH | HADH | HADH | 3246 | 0.1 | 0.4 | YES |
| 17 | MCCC1 | MCCC1 | MCCC1 | 3641 | 0.091 | 0.4 | YES |
| 18 | AUH | AUH | AUH | 3705 | 0.09 | 0.42 | YES |
| 19 | ACAT1 | ACAT1 | ACAT1 | 3811 | 0.086 | 0.44 | YES |
| 20 | ALDH9A1 | ALDH9A1 | ALDH9A1 | 3970 | 0.082 | 0.44 | YES |
| 21 | BCAT2 | BCAT2 | BCAT2 | 4019 | 0.081 | 0.46 | YES |
| 22 | ALDH7A1 | ALDH7A1 | ALDH7A1 | 4041 | 0.08 | 0.48 | YES |
| 23 | DBT | DBT | DBT | 4732 | 0.064 | 0.46 | YES |
| 24 | HIBCH | HIBCH | HIBCH | 4890 | 0.061 | 0.46 | YES |
| 25 | BCKDHB | BCKDHB | BCKDHB | 4892 | 0.061 | 0.48 | YES |
| 26 | ACAA2 | ACAA2 | ACAA2 | 5033 | 0.058 | 0.48 | YES |
| 27 | HMGCL | HMGCL | HMGCL | 5186 | 0.055 | 0.48 | YES |
| 28 | ACADM | ACADM | ACADM | 6252 | 0.037 | 0.44 | NO |
| 29 | MUT | MUT | MUT | 6257 | 0.037 | 0.44 | NO |
| 30 | MCCC2 | MCCC2 | MCCC2 | 6406 | 0.035 | 0.44 | NO |
| 31 | OXCT2 | OXCT2 | OXCT2 | 7007 | 0.026 | 0.42 | NO |
| 32 | HADHB | HADHB | HADHB | 7983 | 0.014 | 0.37 | NO |
| 33 | HADHA | HADHA | HADHA | 9076 | -0.000046 | 0.31 | NO |
| 34 | ECHS1 | ECHS1 | ECHS1 | 9492 | -0.0052 | 0.28 | NO |
| 35 | PCCB | PCCB | PCCB | 11392 | -0.029 | 0.19 | NO |
| 36 | EHHADH | EHHADH | EHHADH | 11696 | -0.033 | 0.18 | NO |
| 37 | HIBADH | HIBADH | HIBADH | 13168 | -0.056 | 0.11 | NO |
| 38 | DLD | DLD | DLD | 13270 | -0.058 | 0.12 | NO |
| 39 | HMGCS1 | HMGCS1 | HMGCS1 | 13739 | -0.066 | 0.11 | NO |
| 40 | ACAT2 | ACAT2 | ACAT2 | 13886 | -0.069 | 0.12 | NO |
| 41 | HSD17B10 | HSD17B10 | HSD17B10 | 13928 | -0.07 | 0.13 | NO |
| 42 | OXCT1 | OXCT1 | OXCT1 | 14295 | -0.078 | 0.13 | NO |
| 43 | ALDH1B1 | ALDH1B1 | ALDH1B1 | 16459 | -0.16 | 0.046 | NO |
| 44 | IL4I1 | IL4I1 | IL4I1 | 17246 | -0.24 | 0.058 | NO |
Figure S23. Get High-res Image This plot shows mRNAseq_cNMF expression data heatmap (on the left) a RunningEnrichmentScore(RES) plot (on the top right) and a Signal2Noise(S2N) plot (on the bottom right) of genes in the pathway: KEGG VALINE LEUCINE AND ISOLEUCINE DEGRADATION.
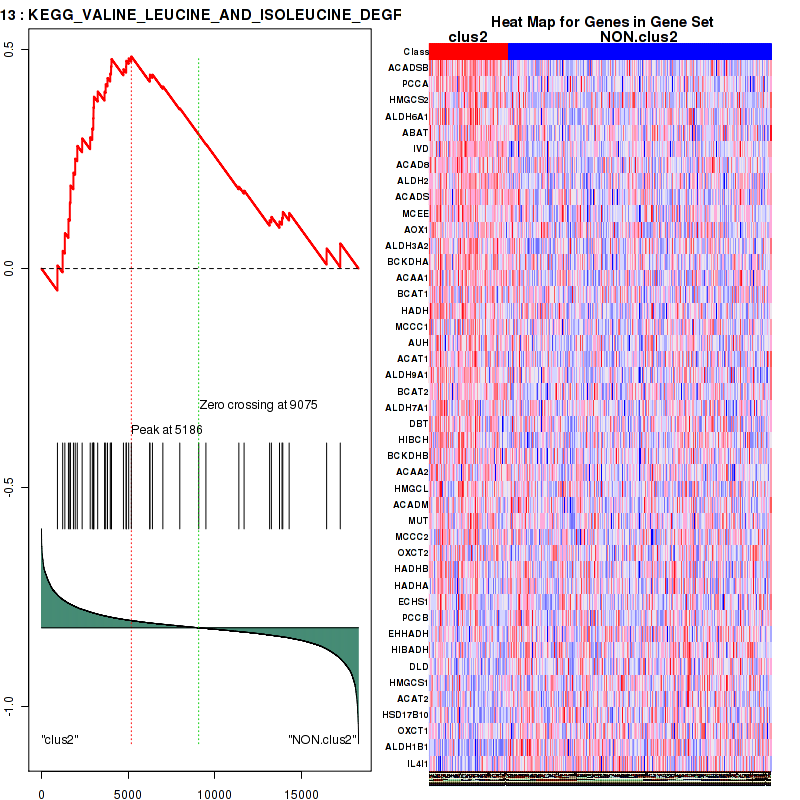
Figure S24. Get High-res Image For the top 5 core enriched genes in the pathway: KEGG VALINE LEUCINE AND ISOLEUCINE DEGRADATION, this volcano plot shows how much they are up/down-regulated and significant. The significance was calculated by empirical bayesian fit

Table S13. Get Full Table This table shows a Running Enrichment Score (RES) of each gene in this pathway, that is, the enrichment score at this point in the ranked list of genes. All genes are ranked by Signal-to-Noise (S2N), a measure of similarity as default and are used to obtain ES matrix of all genes. In this way, GSEA tool uses expression pattern of not only overlapped genes but also not-overlapped genes to produce ES matrix.
| Rank | GENE | SYMBOL | DESC | LIST.LOC | S2N | RES | CORE_ENRICHMENT |
|---|---|---|---|---|---|---|---|
| 1 | RASGRF1 | RASGRF1 | RASGRF1 | 107 | 0.49 | 0.097 | YES |
| 2 | SHC3 | SHC3 | SHC3 | 485 | 0.34 | 0.15 | YES |
| 3 | NTRK3 | NTRK3 | NTRK3 | 540 | 0.32 | 0.21 | YES |
| 4 | NTRK2 | NTRK2 | NTRK2 | 688 | 0.29 | 0.26 | YES |
| 5 | NTF4 | NTF4 | NTF4 | 1035 | 0.24 | 0.29 | YES |
| 6 | NGFR | NGFR | NGFR | 1343 | 0.21 | 0.32 | YES |
| 7 | ELMO1 | ELMO1 | ELMO1 | 1838 | 0.17 | 0.33 | YES |
| 8 | BDNF | BDNF | BDNF | 1923 | 0.16 | 0.36 | YES |
| 9 | NTRK1 | NTRK1 | NTRK1 | 1928 | 0.16 | 0.39 | YES |
| 10 | NEDD4L | NEDD4L | NEDD4L | 2095 | 0.15 | 0.41 | YES |
| 11 | PRKCZ | PRKCZ | PRKCZ | 2352 | 0.14 | 0.43 | YES |
| 12 | PIK3R1 | PIK3R1 | PIK3R1 | 2685 | 0.13 | 0.44 | YES |
| 13 | GAB1 | GAB1 | GAB1 | 2902 | 0.12 | 0.45 | YES |
| 14 | SHC2 | SHC2 | SHC2 | 3404 | 0.099 | 0.44 | NO |
| 15 | FRS3 | FRS3 | FRS3 | 3978 | 0.082 | 0.43 | NO |
| 16 | MATK | MATK | MATK | 4154 | 0.077 | 0.44 | NO |
| 17 | GAB2 | GAB2 | GAB2 | 4403 | 0.071 | 0.44 | NO |
| 18 | SH2B1 | SH2B1 | SH2B1 | 4638 | 0.066 | 0.44 | NO |
| 19 | MCF2L | MCF2L | MCF2L | 5062 | 0.057 | 0.43 | NO |
| 20 | RASA1 | RASA1 | RASA1 | 5588 | 0.048 | 0.41 | NO |
| 21 | SQSTM1 | SQSTM1 | SQSTM1 | 5952 | 0.042 | 0.4 | NO |
| 22 | RAP1A | RAP1A | RAP1A | 6214 | 0.038 | 0.39 | NO |
| 23 | STAT3 | STAT3 | STAT3 | 6233 | 0.037 | 0.4 | NO |
| 24 | DOCK1 | DOCK1 | DOCK1 | 6253 | 0.037 | 0.4 | NO |
| 25 | CRK | CRK | CRK | 6269 | 0.037 | 0.41 | NO |
| 26 | CCND1 | CCND1 | CCND1 | 6387 | 0.035 | 0.41 | NO |
| 27 | TIAM1 | TIAM1 | TIAM1 | 6995 | 0.026 | 0.38 | NO |
| 28 | FRS2 | FRS2 | FRS2 | 7411 | 0.021 | 0.37 | NO |
| 29 | MAPK1 | MAPK1 | MAPK1 | 7445 | 0.021 | 0.37 | NO |
| 30 | RIT1 | RIT1 | RIT1 | 7821 | 0.016 | 0.35 | NO |
| 31 | PRKCI | PRKCI | PRKCI | 7853 | 0.016 | 0.35 | NO |
| 32 | CDC42 | CDC42 | CDC42 | 7902 | 0.015 | 0.35 | NO |
| 33 | EHD4 | EHD4 | EHD4 | 7955 | 0.014 | 0.35 | NO |
| 34 | RHOA | RHOA | RHOA | 8060 | 0.013 | 0.35 | NO |
| 35 | ARHGAP32 | ARHGAP32 | ARHGAP32 | 8891 | 0.0019 | 0.3 | NO |
| 36 | ABL1 | ABL1 | ABL1 | 8986 | 0.00084 | 0.3 | NO |
| 37 | GIPC1 | GIPC1 | GIPC1 | 9100 | -0.00033 | 0.29 | NO |
| 38 | RAPGEF1 | RAPGEF1 | RAPGEF1 | 9145 | -0.0009 | 0.29 | NO |
| 39 | PLCG1 | PLCG1 | PLCG1 | 9210 | -0.0017 | 0.29 | NO |
| 40 | RHOG | RHOG | RHOG | 9353 | -0.0034 | 0.28 | NO |
| 41 | MAPK3 | MAPK3 | MAPK3 | 9401 | -0.004 | 0.28 | NO |
| 42 | DNAJA3 | DNAJA3 | DNAJA3 | 9726 | -0.0082 | 0.26 | NO |
| 43 | MAP2K1 | MAP2K1 | MAP2K1 | 9896 | -0.01 | 0.26 | NO |
| 44 | MAGED1 | MAGED1 | MAGED1 | 10358 | -0.016 | 0.24 | NO |
| 45 | FAIM | FAIM | FAIM | 10432 | -0.017 | 0.23 | NO |
| 46 | SOS1 | SOS1 | SOS1 | 10648 | -0.019 | 0.23 | NO |
| 47 | CRKL | CRKL | CRKL | 10695 | -0.02 | 0.23 | NO |
| 48 | NTF3 | NTF3 | NTF3 | 10794 | -0.021 | 0.23 | NO |
| 49 | RGS19 | RGS19 | RGS19 | 10828 | -0.022 | 0.23 | NO |
| 50 | GRB2 | GRB2 | GRB2 | 11001 | -0.024 | 0.23 | NO |
| 51 | DYNLT1 | DYNLT1 | DYNLT1 | 11398 | -0.029 | 0.21 | NO |
| 52 | SHC1 | SHC1 | SHC1 | 11983 | -0.037 | 0.19 | NO |
| 53 | RAP1B | RAP1B | RAP1B | 12091 | -0.038 | 0.19 | NO |
| 54 | PTPN11 | PTPN11 | PTPN11 | 12972 | -0.053 | 0.15 | NO |
| 55 | RAC1 | RAC1 | RAC1 | 13061 | -0.054 | 0.16 | NO |
| 56 | PIK3CA | PIK3CA | PIK3CA | 13281 | -0.058 | 0.16 | NO |
| 57 | HRAS | HRAS | HRAS | 13324 | -0.059 | 0.17 | NO |
| 58 | KRAS | KRAS | KRAS | 13496 | -0.062 | 0.17 | NO |
| 59 | NGF | NGF | NGF | 14428 | -0.081 | 0.14 | NO |
| 60 | NRAS | NRAS | NRAS | 15067 | -0.098 | 0.12 | NO |
| 61 | DNM1 | DNM1 | DNM1 | 17432 | -0.26 | 0.048 | NO |
Figure S25. Get High-res Image This plot shows mRNAseq_cNMF expression data heatmap (on the left) a RunningEnrichmentScore(RES) plot (on the top right) and a Signal2Noise(S2N) plot (on the bottom right) of genes in the pathway: KEGG ARACHIDONIC ACID METABOLISM.
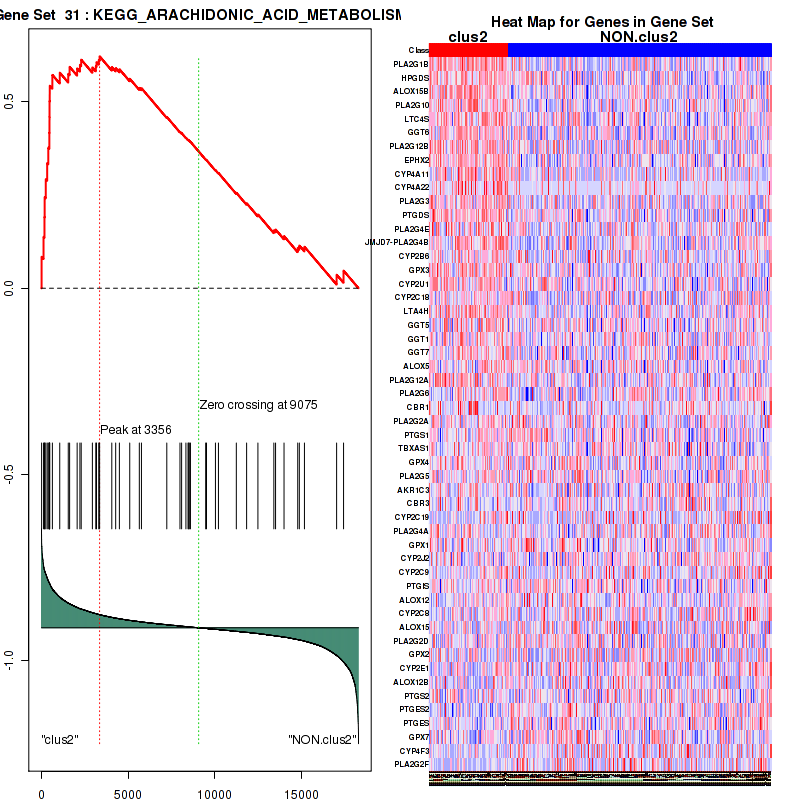
Figure S26. Get High-res Image For the top 5 core enriched genes in the pathway: KEGG ARACHIDONIC ACID METABOLISM, this volcano plot shows how much they are up/down-regulated and significant. The significance was calculated by empirical bayesian fit
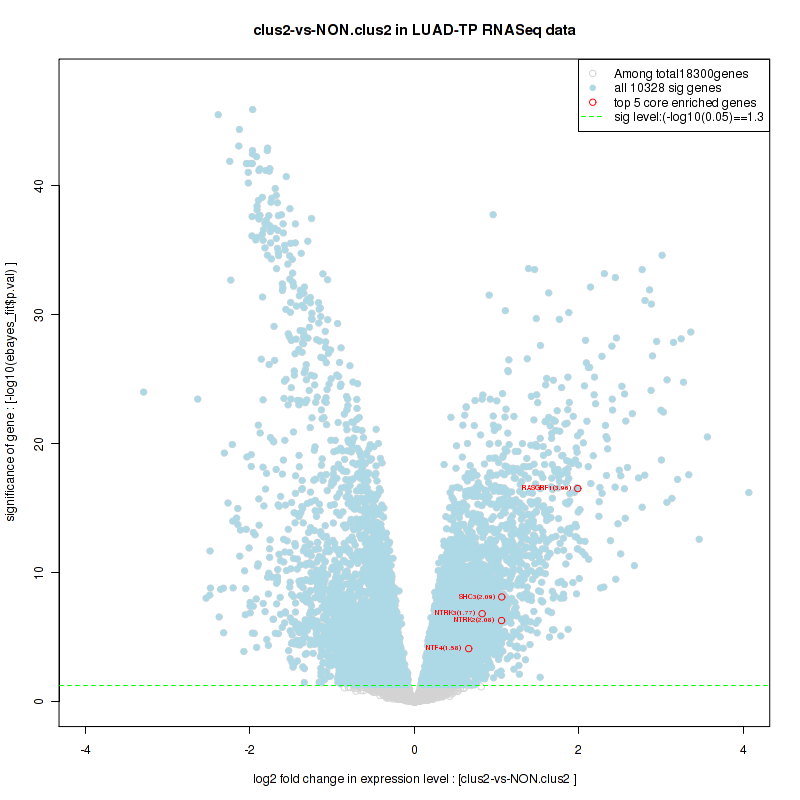
Table S14. Get Full Table This table shows a Running Enrichment Score (RES) of each gene in this pathway, that is, the enrichment score at this point in the ranked list of genes. All genes are ranked by Signal-to-Noise (S2N), a measure of similarity as default and are used to obtain ES matrix of all genes. In this way, GSEA tool uses expression pattern of not only overlapped genes but also not-overlapped genes to produce ES matrix.
| Rank | GENE | SYMBOL | DESC | LIST.LOC | S2N | RES | CORE_ENRICHMENT |
|---|---|---|---|---|---|---|---|
| 1 | ADRB2 | ADRB2 | ADRB2 | 218 | 0.42 | 0.13 | YES |
| 2 | HGF | HGF | HGF | 921 | 0.25 | 0.18 | YES |
| 3 | GNA14 | GNA14 | GNA14 | 1540 | 0.19 | 0.2 | YES |
| 4 | AGTR1 | AGTR1 | AGTR1 | 1647 | 0.18 | 0.26 | YES |
| 5 | LHCGR | LHCGR | LHCGR | 1690 | 0.18 | 0.32 | YES |
| 6 | IPCEF1 | IPCEF1 | IPCEF1 | 1713 | 0.18 | 0.37 | YES |
| 7 | ARRB1 | ARRB1 | ARRB1 | 2190 | 0.15 | 0.4 | YES |
| 8 | CYTH3 | CYTH3 | CYTH3 | 3053 | 0.11 | 0.39 | YES |
| 9 | GNAQ | GNAQ | GNAQ | 3277 | 0.1 | 0.41 | YES |
| 10 | EPHA2 | EPHA2 | EPHA2 | 3415 | 0.098 | 0.44 | YES |
| 11 | EFNA1 | EFNA1 | EFNA1 | 3807 | 0.086 | 0.44 | YES |
| 12 | ARAP2 | ARAP2 | ARAP2 | 4086 | 0.079 | 0.45 | YES |
| 13 | KIF13B | KIF13B | KIF13B | 4252 | 0.075 | 0.47 | YES |
| 14 | EGF | EGF | EGF | 4648 | 0.066 | 0.47 | YES |
| 15 | IQSEC1 | IQSEC1 | IQSEC1 | 4746 | 0.063 | 0.49 | YES |
| 16 | FBXO8 | FBXO8 | FBXO8 | 4815 | 0.062 | 0.5 | YES |
| 17 | ACAP1 | ACAP1 | ACAP1 | 5073 | 0.057 | 0.51 | YES |
| 18 | ARRB2 | ARRB2 | ARRB2 | 5153 | 0.056 | 0.52 | YES |
| 19 | EGFR | EGFR | EGFR | 5225 | 0.054 | 0.54 | YES |
| 20 | GNA11 | GNA11 | GNA11 | 7116 | 0.025 | 0.44 | NO |
| 21 | CYTH2 | CYTH2 | CYTH2 | 7222 | 0.024 | 0.44 | NO |
| 22 | MET | MET | MET | 7745 | 0.017 | 0.42 | NO |
| 23 | ITGB3 | ITGB3 | ITGB3 | 8104 | 0.012 | 0.4 | NO |
| 24 | GNA15 | GNA15 | GNA15 | 8179 | 0.011 | 0.4 | NO |
| 25 | ADAP1 | ADAP1 | ADAP1 | 9355 | -0.0034 | 0.34 | NO |
| 26 | TSHR | TSHR | TSHR | 10735 | -0.02 | 0.27 | NO |
| 27 | PXN | PXN | PXN | 10939 | -0.023 | 0.27 | NO |
| 28 | USP6 | USP6 | USP6 | 11413 | -0.029 | 0.25 | NO |
| 29 | ACAP2 | ACAP2 | ACAP2 | 11665 | -0.033 | 0.25 | NO |
| 30 | ITGA2B | ITGA2B | ITGA2B | 11847 | -0.035 | 0.25 | NO |
| 31 | SRC | SRC | SRC | 12221 | -0.04 | 0.24 | NO |
| 32 | ARF6 | ARF6 | ARF6 | 12544 | -0.045 | 0.24 | NO |
| 33 | NCK1 | NCK1 | NCK1 | 13802 | -0.068 | 0.2 | NO |
| 34 | GIT1 | GIT1 | GIT1 | 14113 | -0.073 | 0.2 | NO |
| 35 | GULP1 | GULP1 | GULP1 | 14242 | -0.076 | 0.22 | NO |
Figure S27. Get High-res Image This plot shows mRNAseq_cNMF expression data heatmap (on the left) a RunningEnrichmentScore(RES) plot (on the top right) and a Signal2Noise(S2N) plot (on the bottom right) of genes in the pathway: KEGG PROPANOATE METABOLISM.
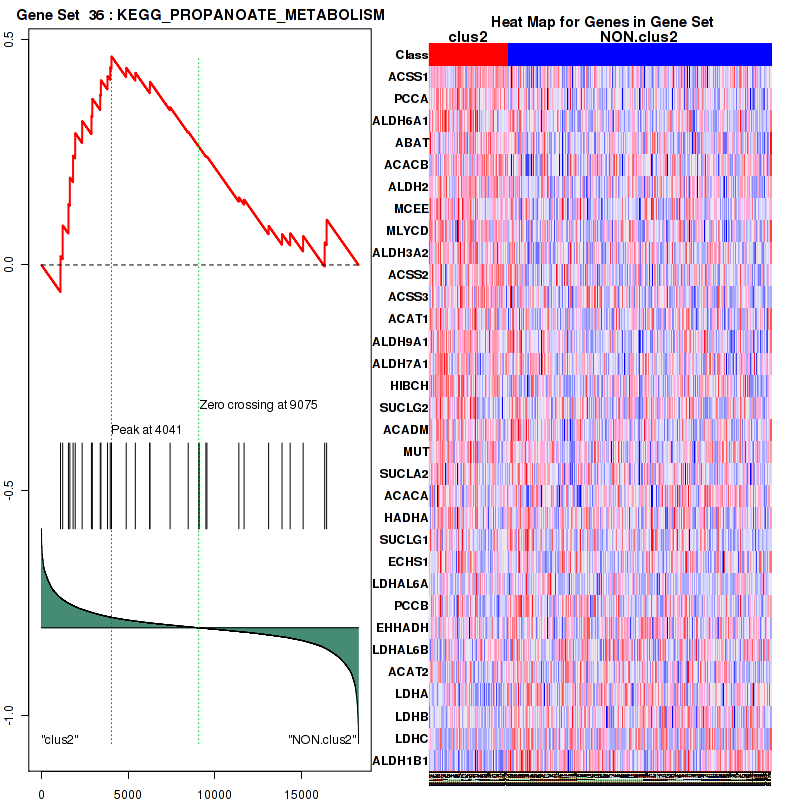
Figure S28. Get High-res Image For the top 5 core enriched genes in the pathway: KEGG PROPANOATE METABOLISM, this volcano plot shows how much they are up/down-regulated and significant. The significance was calculated by empirical bayesian fit

Table S15. Get Full Table This table shows a Running Enrichment Score (RES) of each gene in this pathway, that is, the enrichment score at this point in the ranked list of genes. All genes are ranked by Signal-to-Noise (S2N), a measure of similarity as default and are used to obtain ES matrix of all genes. In this way, GSEA tool uses expression pattern of not only overlapped genes but also not-overlapped genes to produce ES matrix.
| Rank | GENE | SYMBOL | DESC | LIST.LOC | S2N | RES | CORE_ENRICHMENT |
|---|---|---|---|---|---|---|---|
| 1 | TGFBR3 | TGFBR3 | TGFBR3 | 666 | 0.29 | 0.051 | YES |
| 2 | CAMK2A | CAMK2A | CAMK2A | 827 | 0.27 | 0.12 | YES |
| 3 | OCLN | OCLN | OCLN | 1512 | 0.19 | 0.14 | YES |
| 4 | NEDD4L | NEDD4L | NEDD4L | 2095 | 0.15 | 0.16 | YES |
| 5 | CAV1 | CAV1 | CAV1 | 2185 | 0.15 | 0.2 | YES |
| 6 | DACT2 | DACT2 | DACT2 | 2187 | 0.15 | 0.24 | YES |
| 7 | TGFBR2 | TGFBR2 | TGFBR2 | 2348 | 0.14 | 0.28 | YES |
| 8 | YAP1 | YAP1 | YAP1 | 3583 | 0.093 | 0.24 | YES |
| 9 | DAB2 | DAB2 | DAB2 | 3682 | 0.09 | 0.26 | YES |
| 10 | TGFB2 | TGFB2 | TGFB2 | 3741 | 0.088 | 0.28 | YES |
| 11 | PDPK1 | PDPK1 | PDPK1 | 3824 | 0.086 | 0.3 | YES |
| 12 | ZFYVE9 | ZFYVE9 | ZFYVE9 | 3846 | 0.085 | 0.33 | YES |
| 13 | SMAD7 | SMAD7 | SMAD7 | 4111 | 0.078 | 0.34 | YES |
| 14 | PPP2CB | PPP2CB | PPP2CB | 4236 | 0.075 | 0.35 | YES |
| 15 | PPP1R15A | PPP1R15A | PPP1R15A | 4421 | 0.071 | 0.36 | YES |
| 16 | BAMBI | BAMBI | BAMBI | 4835 | 0.062 | 0.36 | YES |
| 17 | ARRB2 | ARRB2 | ARRB2 | 5153 | 0.056 | 0.36 | YES |
| 18 | TGFB1 | TGFB1 | TGFB1 | 5305 | 0.053 | 0.37 | YES |
| 19 | ZFYVE16 | ZFYVE16 | ZFYVE16 | 5499 | 0.05 | 0.37 | YES |
| 20 | SPTBN1 | SPTBN1 | SPTBN1 | 5714 | 0.046 | 0.37 | YES |
| 21 | SMAD4 | SMAD4 | SMAD4 | 5868 | 0.043 | 0.38 | YES |
| 22 | TAB1 | TAB1 | TAB1 | 5885 | 0.043 | 0.39 | YES |
| 23 | PPP2R2A | PPP2R2A | PPP2R2A | 5970 | 0.042 | 0.4 | YES |
| 24 | SMURF2 | SMURF2 | SMURF2 | 6304 | 0.036 | 0.39 | NO |
| 25 | XIAP | XIAP | XIAP | 6527 | 0.033 | 0.39 | NO |
| 26 | RNF111 | RNF111 | RNF111 | 6783 | 0.03 | 0.38 | NO |
| 27 | CTGF | CTGF | CTGF | 6881 | 0.028 | 0.38 | NO |
| 28 | SMAD2 | SMAD2 | SMAD2 | 7077 | 0.026 | 0.38 | NO |
| 29 | PARD6A | PARD6A | PARD6A | 7797 | 0.016 | 0.35 | NO |
| 30 | RHOA | RHOA | RHOA | 8060 | 0.013 | 0.34 | NO |
| 31 | CTNNB1 | CTNNB1 | CTNNB1 | 8455 | 0.0075 | 0.32 | NO |
| 32 | WWP1 | WWP1 | WWP1 | 8508 | 0.0069 | 0.32 | NO |
| 33 | TGFBRAP1 | TGFBRAP1 | TGFBRAP1 | 8741 | 0.0039 | 0.31 | NO |
| 34 | DAXX | DAXX | DAXX | 8776 | 0.0034 | 0.3 | NO |
| 35 | SMURF1 | SMURF1 | SMURF1 | 9269 | -0.0024 | 0.28 | NO |
| 36 | EIF2A | EIF2A | EIF2A | 9742 | -0.0083 | 0.26 | NO |
| 37 | PML | PML | PML | 10059 | -0.012 | 0.24 | NO |
| 38 | AXIN1 | AXIN1 | AXIN1 | 10292 | -0.015 | 0.23 | NO |
| 39 | YWHAE | YWHAE | YWHAE | 10478 | -0.017 | 0.23 | NO |
| 40 | FKBP1A | FKBP1A | FKBP1A | 10615 | -0.019 | 0.23 | NO |
| 41 | SOS1 | SOS1 | SOS1 | 10648 | -0.019 | 0.23 | NO |
| 42 | SMAD3 | SMAD3 | SMAD3 | 10745 | -0.021 | 0.23 | NO |
| 43 | TAB2 | TAB2 | TAB2 | 10797 | -0.021 | 0.24 | NO |
| 44 | PPP2CA | PPP2CA | PPP2CA | 10835 | -0.022 | 0.24 | NO |
| 45 | DYNLRB1 | DYNLRB1 | DYNLRB1 | 10932 | -0.023 | 0.24 | NO |
| 46 | GRB2 | GRB2 | GRB2 | 11001 | -0.024 | 0.24 | NO |
| 47 | PPP1CA | PPP1CA | PPP1CA | 11042 | -0.025 | 0.25 | NO |
| 48 | TGFBR1 | TGFBR1 | TGFBR1 | 11404 | -0.029 | 0.24 | NO |
| 49 | ITCH | ITCH | ITCH | 11951 | -0.036 | 0.22 | NO |
| 50 | SHC1 | SHC1 | SHC1 | 11983 | -0.037 | 0.23 | NO |
| 51 | MAP3K7 | MAP3K7 | MAP3K7 | 12348 | -0.042 | 0.22 | NO |
| 52 | TGFB3 | TGFB3 | TGFB3 | 13748 | -0.066 | 0.17 | NO |
| 53 | RPS6KB1 | RPS6KB1 | RPS6KB1 | 14011 | -0.071 | 0.17 | NO |
| 54 | SKIL | SKIL | SKIL | 14815 | -0.091 | 0.16 | NO |
| 55 | STRAP | STRAP | STRAP | 15516 | -0.12 | 0.15 | NO |
Figure S29. Get High-res Image This plot shows mRNAseq_cNMF expression data heatmap (on the left) a RunningEnrichmentScore(RES) plot (on the top right) and a Signal2Noise(S2N) plot (on the bottom right) of genes in the pathway: KEGG ALDOSTERONE REGULATED SODIUM REABSORPTION.
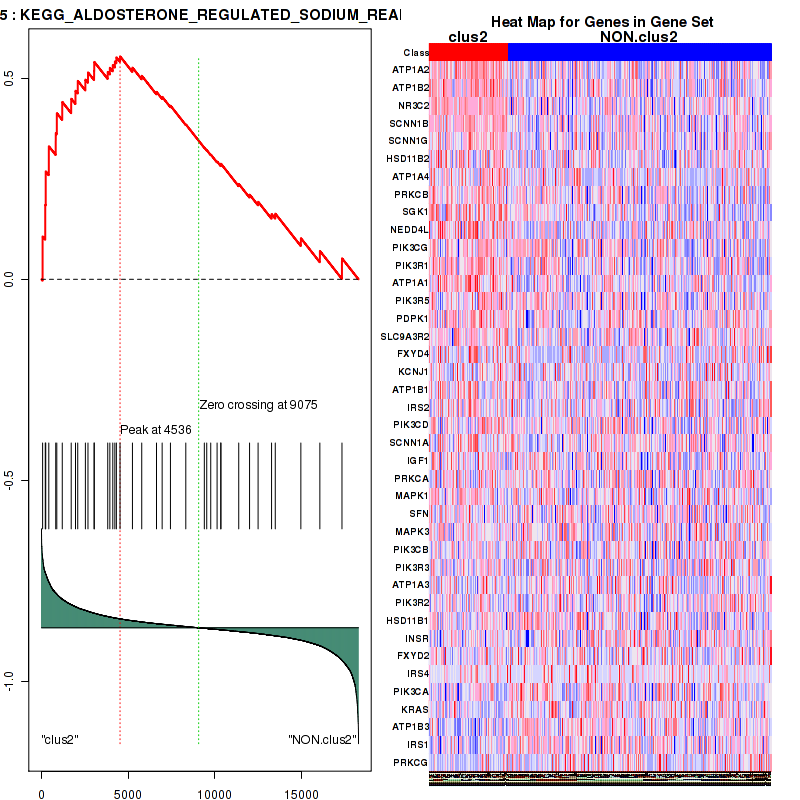
Figure S30. Get High-res Image For the top 5 core enriched genes in the pathway: KEGG ALDOSTERONE REGULATED SODIUM REABSORPTION, this volcano plot shows how much they are up/down-regulated and significant. The significance was calculated by empirical bayesian fit
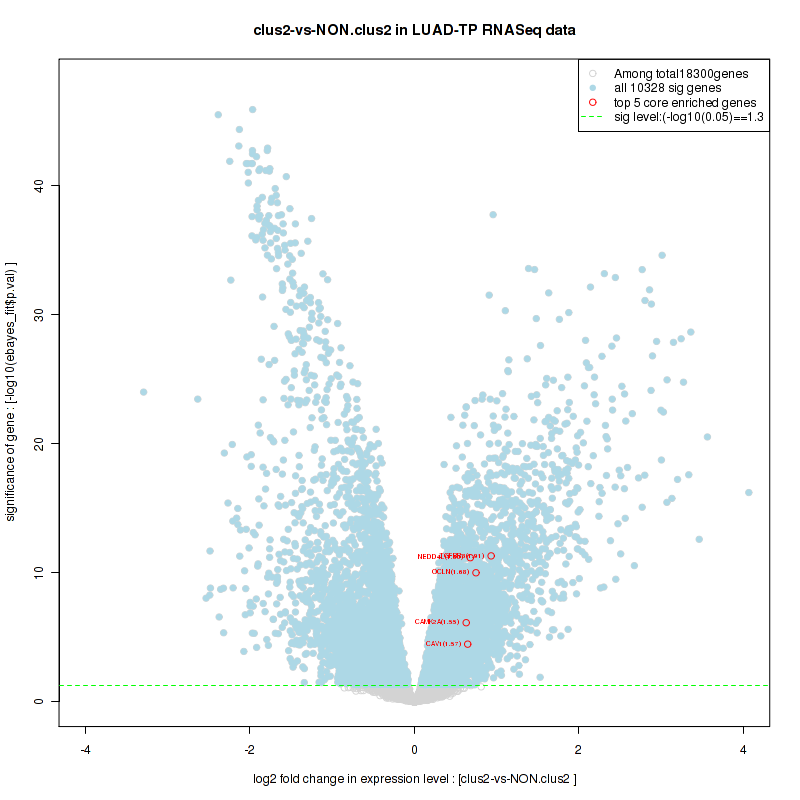
Table S16. Get Full Table This table shows a Running Enrichment Score (RES) of each gene in this pathway, that is, the enrichment score at this point in the ranked list of genes. All genes are ranked by Signal-to-Noise (S2N), a measure of similarity as default and are used to obtain ES matrix of all genes. In this way, GSEA tool uses expression pattern of not only overlapped genes but also not-overlapped genes to produce ES matrix.
| Rank | GENE | SYMBOL | DESC | LIST.LOC | S2N | RES | CORE_ENRICHMENT |
|---|---|---|---|---|---|---|---|
| 1 | MAPK10 | MAPK10 | MAPK10 | 117 | 0.48 | 0.16 | YES |
| 2 | C4BPA | C4BPA | C4BPA | 184 | 0.44 | 0.32 | YES |
| 3 | CD40LG | CD40LG | CD40LG | 215 | 0.42 | 0.47 | YES |
| 4 | FCAMR | FCAMR | FCAMR | 813 | 0.27 | 0.53 | YES |
| 5 | MAP3K1 | MAP3K1 | MAP3K1 | 3757 | 0.088 | 0.4 | NO |
| 6 | JUN | JUN | JUN | 4470 | 0.069 | 0.38 | NO |
| 7 | MAPK9 | MAPK9 | MAPK9 | 4552 | 0.068 | 0.4 | NO |
| 8 | TRAF6 | TRAF6 | TRAF6 | 4863 | 0.061 | 0.41 | NO |
| 9 | MAP3K14 | MAP3K14 | MAP3K14 | 5106 | 0.056 | 0.42 | NO |
| 10 | NFKB1 | NFKB1 | NFKB1 | 5307 | 0.053 | 0.42 | NO |
| 11 | STAT5A | STAT5A | STAT5A | 5721 | 0.046 | 0.42 | NO |
| 12 | TRAF1 | TRAF1 | TRAF1 | 5761 | 0.045 | 0.43 | NO |
| 13 | NFKBIA | NFKBIA | NFKBIA | 5999 | 0.041 | 0.43 | NO |
| 14 | CD40 | CD40 | CD40 | 6868 | 0.028 | 0.4 | NO |
| 15 | MAPK14 | MAPK14 | MAPK14 | 7504 | 0.02 | 0.37 | NO |
| 16 | MAP2K4 | MAP2K4 | MAP2K4 | 8160 | 0.012 | 0.34 | NO |
| 17 | AKT1 | AKT1 | AKT1 | 8292 | 0.0095 | 0.33 | NO |
| 18 | BIRC3 | BIRC3 | BIRC3 | 8703 | 0.0044 | 0.31 | NO |
| 19 | MAPK11 | MAPK11 | MAPK11 | 9849 | -0.0096 | 0.25 | NO |
| 20 | BCL2L1 | BCL2L1 | BCL2L1 | 9949 | -0.011 | 0.25 | NO |
| 21 | TDP2 | TDP2 | TDP2 | 10213 | -0.014 | 0.24 | NO |
| 22 | RELA | RELA | RELA | 11219 | -0.027 | 0.2 | NO |
| 23 | BIRC2 | BIRC2 | BIRC2 | 11467 | -0.03 | 0.19 | NO |
| 24 | TNFAIP3 | TNFAIP3 | TNFAIP3 | 12418 | -0.043 | 0.16 | NO |
| 25 | TRAF3 | TRAF3 | TRAF3 | 13765 | -0.067 | 0.11 | NO |
| 26 | CBLB | CBLB | CBLB | 13809 | -0.068 | 0.13 | NO |
| 27 | JAK3 | JAK3 | JAK3 | 13871 | -0.069 | 0.15 | NO |
| 28 | TRAF2 | TRAF2 | TRAF2 | 14365 | -0.08 | 0.15 | NO |
| 29 | MAPK8 | MAPK8 | MAPK8 | 14729 | -0.089 | 0.16 | NO |
| 30 | MYC | MYC | MYC | 14768 | -0.09 | 0.19 | NO |
Figure S31. Get High-res Image This plot shows mRNAseq_cNMF expression data heatmap (on the left) a RunningEnrichmentScore(RES) plot (on the top right) and a Signal2Noise(S2N) plot (on the bottom right) of genes in the pathway: KEGG VASOPRESSIN REGULATED WATER REABSORPTION.
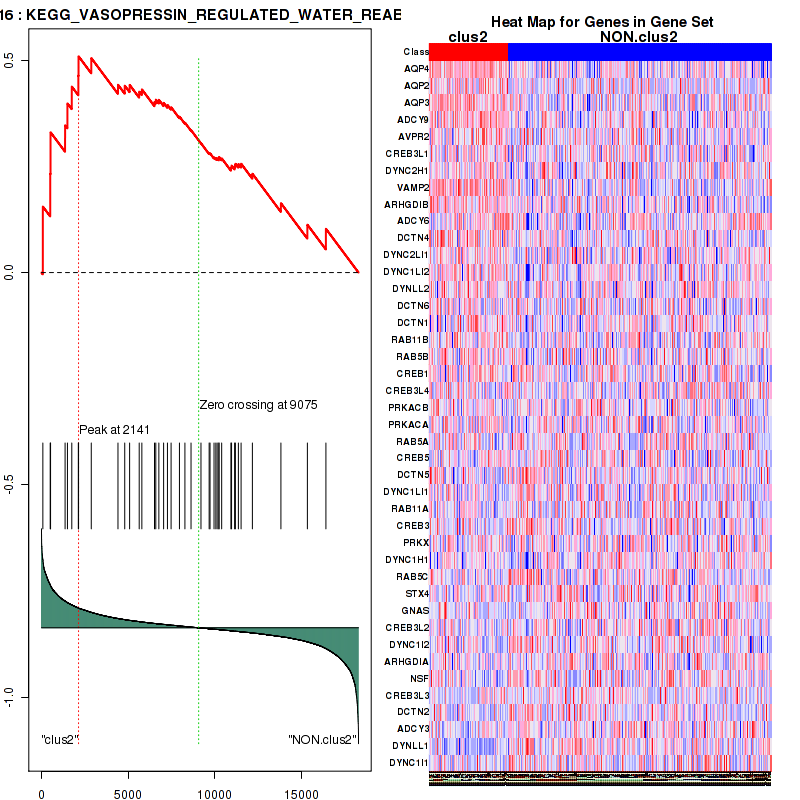
Figure S32. Get High-res Image For the top 5 core enriched genes in the pathway: KEGG VASOPRESSIN REGULATED WATER REABSORPTION, this volcano plot shows how much they are up/down-regulated and significant. The significance was calculated by empirical bayesian fit

Table S17. Get Full Table This table shows a Running Enrichment Score (RES) of each gene in this pathway, that is, the enrichment score at this point in the ranked list of genes. All genes are ranked by Signal-to-Noise (S2N), a measure of similarity as default and are used to obtain ES matrix of all genes. In this way, GSEA tool uses expression pattern of not only overlapped genes but also not-overlapped genes to produce ES matrix.
| Rank | GENE | SYMBOL | DESC | LIST.LOC | S2N | RES | CORE_ENRICHMENT |
|---|---|---|---|---|---|---|---|
| 1 | AQP5 | AQP5 | AQP5 | 392 | 0.36 | 0.11 | YES |
| 2 | AQP3 | AQP3 | AQP3 | 524 | 0.32 | 0.22 | YES |
| 3 | HGF | HGF | HGF | 921 | 0.25 | 0.3 | YES |
| 4 | CYFIP2 | CYFIP2 | CYFIP2 | 991 | 0.24 | 0.38 | YES |
| 5 | MGAT3 | MGAT3 | MGAT3 | 1232 | 0.22 | 0.45 | YES |
| 6 | EPHA2 | EPHA2 | EPHA2 | 3415 | 0.098 | 0.36 | NO |
| 7 | PLEKHA7 | PLEKHA7 | PLEKHA7 | 3789 | 0.087 | 0.38 | NO |
| 8 | EFNA1 | EFNA1 | EFNA1 | 3807 | 0.086 | 0.41 | NO |
| 9 | EGF | EGF | EGF | 4648 | 0.066 | 0.39 | NO |
| 10 | MYO6 | MYO6 | MYO6 | 5169 | 0.055 | 0.38 | NO |
| 11 | EGFR | EGFR | EGFR | 5225 | 0.054 | 0.4 | NO |
| 12 | CTNNA1 | CTNNA1 | CTNNA1 | 6342 | 0.036 | 0.35 | NO |
| 13 | IGF1 | IGF1 | IGF1 | 6639 | 0.032 | 0.34 | NO |
| 14 | MLLT4 | MLLT4 | MLLT4 | 7091 | 0.025 | 0.33 | NO |
| 15 | KIFC3 | KIFC3 | KIFC3 | 7490 | 0.02 | 0.31 | NO |
| 16 | MET | MET | MET | 7745 | 0.017 | 0.31 | NO |
| 17 | CTNND1 | CTNND1 | CTNND1 | 7805 | 0.016 | 0.31 | NO |
| 18 | RHOA | RHOA | RHOA | 8060 | 0.013 | 0.3 | NO |
| 19 | DIAPH1 | DIAPH1 | DIAPH1 | 8074 | 0.013 | 0.3 | NO |
| 20 | LIMA1 | LIMA1 | LIMA1 | 8194 | 0.011 | 0.3 | NO |
| 21 | PIP5K1C | PIP5K1C | PIP5K1C | 8452 | 0.0075 | 0.29 | NO |
| 22 | CTNNB1 | CTNNB1 | CTNNB1 | 8455 | 0.0075 | 0.29 | NO |
| 23 | ROCK1 | ROCK1 | ROCK1 | 8479 | 0.0072 | 0.29 | NO |
| 24 | CDH1 | CDH1 | CDH1 | 8712 | 0.0043 | 0.28 | NO |
| 25 | LPP | LPP | LPP | 9889 | -0.01 | 0.22 | NO |
| 26 | EXOC3 | EXOC3 | EXOC3 | 10167 | -0.013 | 0.21 | NO |
| 27 | MYL2 | MYL2 | MYL2 | 10205 | -0.014 | 0.22 | NO |
| 28 | STX4 | STX4 | STX4 | 10401 | -0.016 | 0.21 | NO |
| 29 | VCL | VCL | VCL | 10429 | -0.017 | 0.22 | NO |
| 30 | EXOC4 | EXOC4 | EXOC4 | 10954 | -0.023 | 0.2 | NO |
| 31 | IGF1R | IGF1R | IGF1R | 11070 | -0.025 | 0.2 | NO |
| 32 | ABI1 | ABI1 | ABI1 | 11537 | -0.031 | 0.18 | NO |
| 33 | VASP | VASP | VASP | 11596 | -0.032 | 0.19 | NO |
| 34 | NCKAP1 | NCKAP1 | NCKAP1 | 11608 | -0.032 | 0.2 | NO |
| 35 | ZYX | ZYX | ZYX | 11759 | -0.034 | 0.21 | NO |
| 36 | ENAH | ENAH | ENAH | 12182 | -0.04 | 0.2 | NO |
| 37 | ARF6 | ARF6 | ARF6 | 12544 | -0.045 | 0.2 | NO |
| 38 | PVRL2 | PVRL2 | PVRL2 | 13554 | -0.063 | 0.16 | NO |
| 39 | NCK1 | NCK1 | NCK1 | 13802 | -0.068 | 0.18 | NO |
| 40 | GIT1 | GIT1 | GIT1 | 14113 | -0.073 | 0.19 | NO |
| 41 | ACTN1 | ACTN1 | ACTN1 | 15558 | -0.12 | 0.15 | NO |
Figure S33. Get High-res Image This plot shows mRNAseq_cNMF expression data heatmap (on the left) a RunningEnrichmentScore(RES) plot (on the top right) and a Signal2Noise(S2N) plot (on the bottom right) of genes in the pathway: KEGG VIRAL MYOCARDITIS.
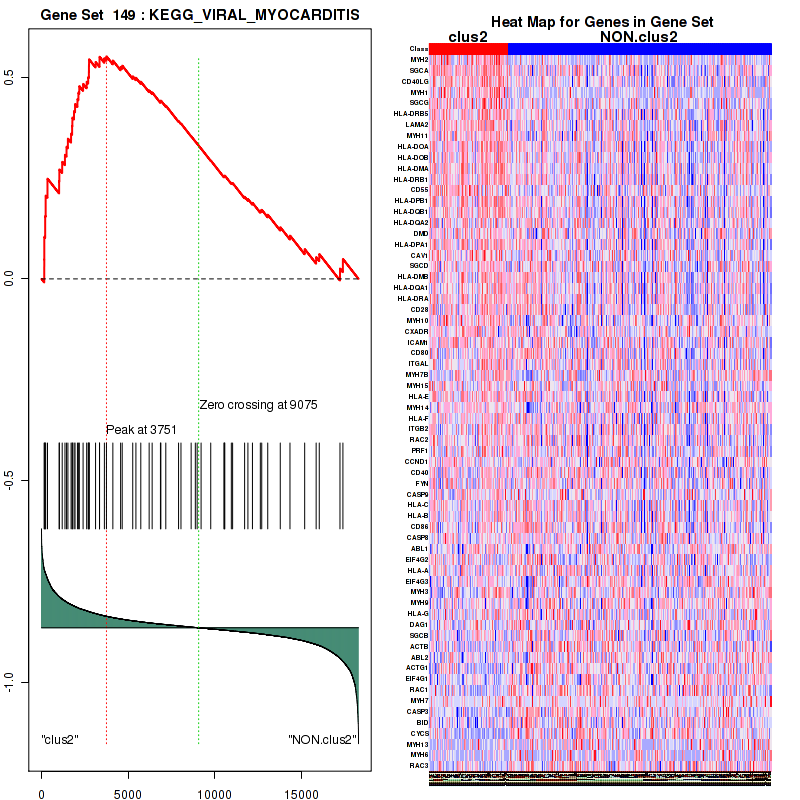
Figure S34. Get High-res Image For the top 5 core enriched genes in the pathway: KEGG VIRAL MYOCARDITIS, this volcano plot shows how much they are up/down-regulated and significant. The significance was calculated by empirical bayesian fit

Table S18. Get Full Table This table shows a Running Enrichment Score (RES) of each gene in this pathway, that is, the enrichment score at this point in the ranked list of genes. All genes are ranked by Signal-to-Noise (S2N), a measure of similarity as default and are used to obtain ES matrix of all genes. In this way, GSEA tool uses expression pattern of not only overlapped genes but also not-overlapped genes to produce ES matrix.
| Rank | GENE | SYMBOL | DESC | LIST.LOC | S2N | RES | CORE_ENRICHMENT |
|---|---|---|---|---|---|---|---|
| 1 | ATP1A2 | ATP1A2 | ATP1A2 | 65 | 0.54 | 0.11 | YES |
| 2 | ATP1B2 | ATP1B2 | ATP1B2 | 219 | 0.42 | 0.18 | YES |
| 3 | NR3C2 | NR3C2 | NR3C2 | 245 | 0.41 | 0.27 | YES |
| 4 | SCNN1B | SCNN1B | SCNN1B | 424 | 0.35 | 0.33 | YES |
| 5 | SCNN1G | SCNN1G | SCNN1G | 824 | 0.27 | 0.36 | YES |
| 6 | HSD11B2 | HSD11B2 | HSD11B2 | 886 | 0.26 | 0.41 | YES |
| 7 | ATP1A4 | ATP1A4 | ATP1A4 | 1200 | 0.22 | 0.44 | YES |
| 8 | PRKCB | PRKCB | PRKCB | 1717 | 0.18 | 0.45 | YES |
| 9 | SGK1 | SGK1 | SGK1 | 1963 | 0.16 | 0.47 | YES |
| 10 | NEDD4L | NEDD4L | NEDD4L | 2095 | 0.15 | 0.49 | YES |
| 11 | PIK3CG | PIK3CG | PIK3CG | 2535 | 0.13 | 0.5 | YES |
| 12 | PIK3R1 | PIK3R1 | PIK3R1 | 2685 | 0.13 | 0.52 | YES |
| 13 | ATP1A1 | ATP1A1 | ATP1A1 | 3038 | 0.11 | 0.52 | YES |
| 14 | PIK3R5 | PIK3R5 | PIK3R5 | 3046 | 0.11 | 0.54 | YES |
| 15 | PDPK1 | PDPK1 | PDPK1 | 3824 | 0.086 | 0.52 | YES |
| 16 | SLC9A3R2 | SLC9A3R2 | SLC9A3R2 | 3947 | 0.082 | 0.53 | YES |
| 17 | FXYD4 | FXYD4 | FXYD4 | 4116 | 0.078 | 0.53 | YES |
| 18 | KCNJ1 | KCNJ1 | KCNJ1 | 4237 | 0.075 | 0.54 | YES |
| 19 | ATP1B1 | ATP1B1 | ATP1B1 | 4325 | 0.073 | 0.55 | YES |
| 20 | IRS2 | IRS2 | IRS2 | 4536 | 0.068 | 0.55 | YES |
| 21 | PIK3CD | PIK3CD | PIK3CD | 5250 | 0.054 | 0.53 | NO |
| 22 | SCNN1A | SCNN1A | SCNN1A | 5789 | 0.045 | 0.51 | NO |
| 23 | IGF1 | IGF1 | IGF1 | 6639 | 0.032 | 0.47 | NO |
| 24 | PRKCA | PRKCA | PRKCA | 6967 | 0.027 | 0.45 | NO |
| 25 | MAPK1 | MAPK1 | MAPK1 | 7445 | 0.021 | 0.43 | NO |
| 26 | SFN | SFN | SFN | 8331 | 0.009 | 0.38 | NO |
| 27 | MAPK3 | MAPK3 | MAPK3 | 9401 | -0.004 | 0.33 | NO |
| 28 | PIK3CB | PIK3CB | PIK3CB | 9538 | -0.0058 | 0.32 | NO |
| 29 | PIK3R3 | PIK3R3 | PIK3R3 | 9771 | -0.0086 | 0.31 | NO |
| 30 | ATP1A3 | ATP1A3 | ATP1A3 | 10136 | -0.013 | 0.29 | NO |
| 31 | PIK3R2 | PIK3R2 | PIK3R2 | 10350 | -0.016 | 0.28 | NO |
| 32 | HSD11B1 | HSD11B1 | HSD11B1 | 10357 | -0.016 | 0.29 | NO |
| 33 | INSR | INSR | INSR | 11385 | -0.029 | 0.24 | NO |
| 34 | FXYD2 | FXYD2 | FXYD2 | 12012 | -0.037 | 0.21 | NO |
| 35 | IRS4 | IRS4 | IRS4 | 12504 | -0.044 | 0.19 | NO |
| 36 | PIK3CA | PIK3CA | PIK3CA | 13281 | -0.058 | 0.16 | NO |
| 37 | KRAS | KRAS | KRAS | 13496 | -0.062 | 0.16 | NO |
| 38 | ATP1B3 | ATP1B3 | ATP1B3 | 14972 | -0.096 | 0.1 | NO |
| 39 | IRS1 | IRS1 | IRS1 | 16069 | -0.14 | 0.071 | NO |
| 40 | PRKCG | PRKCG | PRKCG | 17345 | -0.25 | 0.052 | NO |
Figure S35. Get High-res Image This plot shows mRNAseq_cNMF expression data heatmap (on the left) a RunningEnrichmentScore(RES) plot (on the top right) and a Signal2Noise(S2N) plot (on the bottom right) of genes in the pathway: BIOCARTA FCER1 PATHWAY.
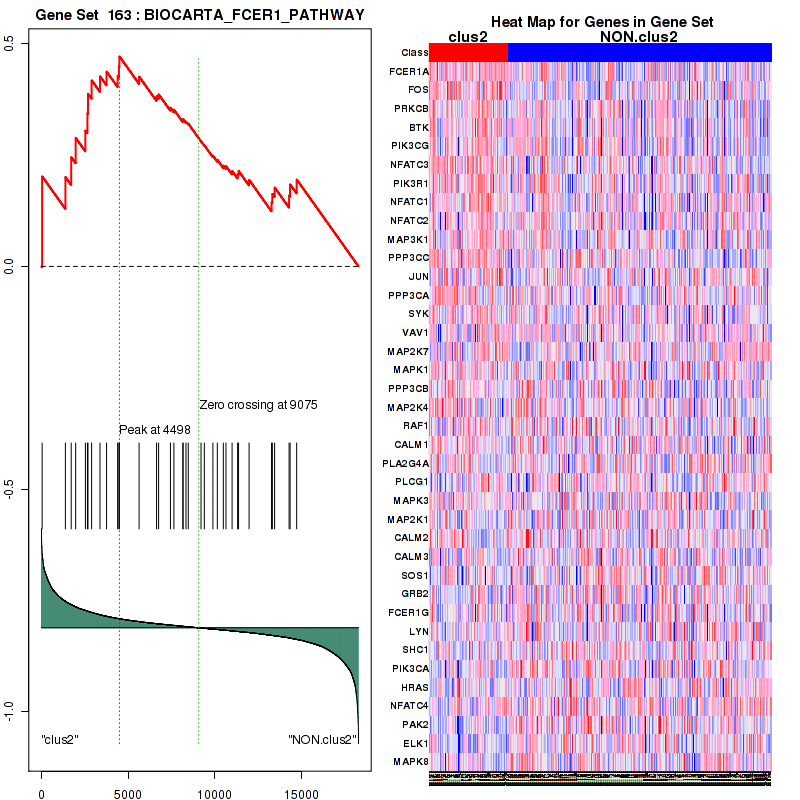
Figure S36. Get High-res Image For the top 5 core enriched genes in the pathway: BIOCARTA FCER1 PATHWAY, this volcano plot shows how much they are up/down-regulated and significant. The significance was calculated by empirical bayesian fit

Table S19. Get Full Table This table shows a Running Enrichment Score (RES) of each gene in this pathway, that is, the enrichment score at this point in the ranked list of genes. All genes are ranked by Signal-to-Noise (S2N), a measure of similarity as default and are used to obtain ES matrix of all genes. In this way, GSEA tool uses expression pattern of not only overlapped genes but also not-overlapped genes to produce ES matrix.
| Rank | GENE | SYMBOL | DESC | LIST.LOC | S2N | RES | CORE_ENRICHMENT |
|---|---|---|---|---|---|---|---|
| 1 | FCER1A | FCER1A | FCER1A | 38 | 0.57 | 0.2 | YES |
| 2 | FOS | FOS | FOS | 1382 | 0.2 | 0.2 | YES |
| 3 | PRKCB | PRKCB | PRKCB | 1717 | 0.18 | 0.24 | YES |
| 4 | BTK | BTK | BTK | 1973 | 0.16 | 0.29 | YES |
| 5 | PIK3CG | PIK3CG | PIK3CG | 2535 | 0.13 | 0.31 | YES |
| 6 | NFATC3 | NFATC3 | NFATC3 | 2654 | 0.13 | 0.34 | YES |
| 7 | PIK3R1 | PIK3R1 | PIK3R1 | 2685 | 0.13 | 0.39 | YES |
| 8 | NFATC1 | NFATC1 | NFATC1 | 2894 | 0.12 | 0.42 | YES |
| 9 | NFATC2 | NFATC2 | NFATC2 | 3378 | 0.099 | 0.43 | YES |
| 10 | MAP3K1 | MAP3K1 | MAP3K1 | 3757 | 0.088 | 0.44 | YES |
| 11 | PPP3CC | PPP3CC | PPP3CC | 4397 | 0.071 | 0.43 | YES |
| 12 | JUN | JUN | JUN | 4470 | 0.069 | 0.45 | YES |
| 13 | PPP3CA | PPP3CA | PPP3CA | 4498 | 0.069 | 0.47 | YES |
| 14 | SYK | SYK | SYK | 5636 | 0.047 | 0.43 | NO |
| 15 | VAV1 | VAV1 | VAV1 | 6642 | 0.031 | 0.38 | NO |
| 16 | MAP2K7 | MAP2K7 | MAP2K7 | 6763 | 0.03 | 0.39 | NO |
| 17 | MAPK1 | MAPK1 | MAPK1 | 7445 | 0.021 | 0.36 | NO |
| 18 | PPP3CB | PPP3CB | PPP3CB | 7646 | 0.018 | 0.35 | NO |
| 19 | MAP2K4 | MAP2K4 | MAP2K4 | 8160 | 0.012 | 0.33 | NO |
| 20 | RAF1 | RAF1 | RAF1 | 8175 | 0.011 | 0.33 | NO |
| 21 | CALM1 | CALM1 | CALM1 | 8342 | 0.0089 | 0.32 | NO |
| 22 | PLA2G4A | PLA2G4A | PLA2G4A | 8473 | 0.0073 | 0.32 | NO |
| 23 | PLCG1 | PLCG1 | PLCG1 | 9210 | -0.0017 | 0.28 | NO |
| 24 | MAPK3 | MAPK3 | MAPK3 | 9401 | -0.004 | 0.27 | NO |
| 25 | MAP2K1 | MAP2K1 | MAP2K1 | 9896 | -0.01 | 0.25 | NO |
| 26 | CALM2 | CALM2 | CALM2 | 10151 | -0.013 | 0.24 | NO |
| 27 | CALM3 | CALM3 | CALM3 | 10496 | -0.017 | 0.23 | NO |
| 28 | SOS1 | SOS1 | SOS1 | 10648 | -0.019 | 0.23 | NO |
| 29 | GRB2 | GRB2 | GRB2 | 11001 | -0.024 | 0.22 | NO |
| 30 | FCER1G | FCER1G | FCER1G | 11321 | -0.028 | 0.21 | NO |
| 31 | LYN | LYN | LYN | 11377 | -0.029 | 0.22 | NO |
| 32 | SHC1 | SHC1 | SHC1 | 11983 | -0.037 | 0.2 | NO |
| 33 | PIK3CA | PIK3CA | PIK3CA | 13281 | -0.058 | 0.14 | NO |
| 34 | HRAS | HRAS | HRAS | 13324 | -0.059 | 0.16 | NO |
| 35 | NFATC4 | NFATC4 | NFATC4 | 13458 | -0.061 | 0.18 | NO |
| 36 | PAK2 | PAK2 | PAK2 | 14293 | -0.078 | 0.16 | NO |
| 37 | ELK1 | ELK1 | ELK1 | 14349 | -0.079 | 0.18 | NO |
| 38 | MAPK8 | MAPK8 | MAPK8 | 14729 | -0.089 | 0.2 | NO |
Figure S37. Get High-res Image This plot shows mRNAseq_cNMF expression data heatmap (on the left) a RunningEnrichmentScore(RES) plot (on the top right) and a Signal2Noise(S2N) plot (on the bottom right) of genes in the pathway: ST ADRENERGIC.
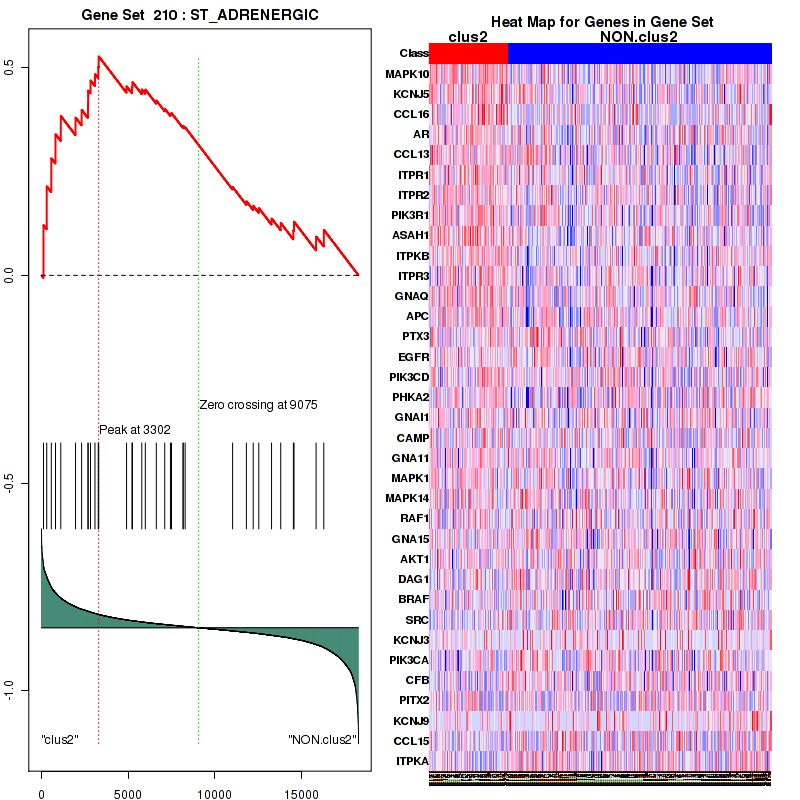
Figure S38. Get High-res Image For the top 5 core enriched genes in the pathway: ST ADRENERGIC, this volcano plot shows how much they are up/down-regulated and significant. The significance was calculated by empirical bayesian fit
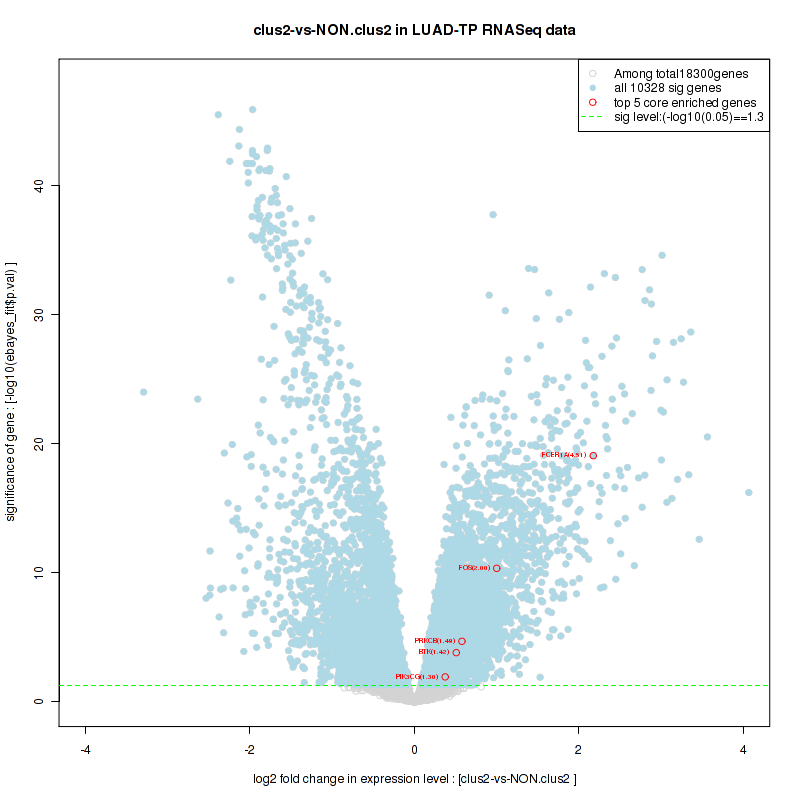
Table S20. Get Full Table This table shows a Running Enrichment Score (RES) of each gene in this pathway, that is, the enrichment score at this point in the ranked list of genes. All genes are ranked by Signal-to-Noise (S2N), a measure of similarity as default and are used to obtain ES matrix of all genes. In this way, GSEA tool uses expression pattern of not only overlapped genes but also not-overlapped genes to produce ES matrix.
| Rank | GENE | SYMBOL | DESC | LIST.LOC | S2N | RES | CORE_ENRICHMENT |
|---|---|---|---|---|---|---|---|
| 1 | MAPK10 | MAPK10 | MAPK10 | 117 | 0.48 | 0.23 | YES |
| 2 | TRPC6 | TRPC6 | TRPC6 | 614 | 0.3 | 0.35 | YES |
| 3 | PRKCZ | PRKCZ | PRKCZ | 2352 | 0.14 | 0.33 | YES |
| 4 | PIK3R1 | PIK3R1 | PIK3R1 | 2685 | 0.13 | 0.37 | YES |
| 5 | KIRREL | KIRREL | KIRREL | 2988 | 0.11 | 0.41 | YES |
| 6 | JUN | JUN | JUN | 4470 | 0.069 | 0.37 | YES |
| 7 | MAPK9 | MAPK9 | MAPK9 | 4552 | 0.068 | 0.4 | YES |
| 8 | ARRB2 | ARRB2 | ARRB2 | 5153 | 0.056 | 0.39 | YES |
| 9 | PIK3CD | PIK3CD | PIK3CD | 5250 | 0.054 | 0.41 | YES |
| 10 | F2RL2 | F2RL2 | F2RL2 | 5340 | 0.052 | 0.43 | YES |
| 11 | TJP1 | TJP1 | TJP1 | 5430 | 0.051 | 0.45 | YES |
| 12 | FYN | FYN | FYN | 6891 | 0.028 | 0.39 | NO |
| 13 | PARD6A | PARD6A | PARD6A | 7797 | 0.016 | 0.35 | NO |
| 14 | PRKCI | PRKCI | PRKCI | 7853 | 0.016 | 0.35 | NO |
| 15 | MAP2K4 | MAP2K4 | MAP2K4 | 8160 | 0.012 | 0.34 | NO |
| 16 | NPHS1 | NPHS1 | NPHS1 | 8172 | 0.011 | 0.34 | NO |
| 17 | BAD | BAD | BAD | 8268 | 0.0099 | 0.34 | NO |
| 18 | AKT1 | AKT1 | AKT1 | 8292 | 0.0095 | 0.35 | NO |
| 19 | PLCG1 | PLCG1 | PLCG1 | 9210 | -0.0017 | 0.3 | NO |
| 20 | PIK3CB | PIK3CB | PIK3CB | 9538 | -0.0058 | 0.28 | NO |
| 21 | PIK3R3 | PIK3R3 | PIK3R3 | 9771 | -0.0086 | 0.28 | NO |
| 22 | PIK3R2 | PIK3R2 | PIK3R2 | 10350 | -0.016 | 0.25 | NO |
| 23 | WASL | WASL | WASL | 10677 | -0.02 | 0.24 | NO |
| 24 | CD2AP | CD2AP | CD2AP | 10944 | -0.023 | 0.24 | NO |
| 25 | GRB2 | GRB2 | GRB2 | 11001 | -0.024 | 0.25 | NO |
| 26 | NCK2 | NCK2 | NCK2 | 11762 | -0.034 | 0.22 | NO |
| 27 | RAC1 | RAC1 | RAC1 | 13061 | -0.054 | 0.18 | NO |
| 28 | PIK3CA | PIK3CA | PIK3CA | 13281 | -0.058 | 0.2 | NO |
| 29 | NCK1 | NCK1 | NCK1 | 13802 | -0.068 | 0.2 | NO |
| 30 | MAPK8 | MAPK8 | MAPK8 | 14729 | -0.089 | 0.2 | NO |
Figure S39. Get High-res Image This plot shows mRNAseq_cNMF expression data heatmap (on the left) a RunningEnrichmentScore(RES) plot (on the top right) and a Signal2Noise(S2N) plot (on the bottom right) of genes in the pathway: ST WNT BETA CATENIN PATHWAY.
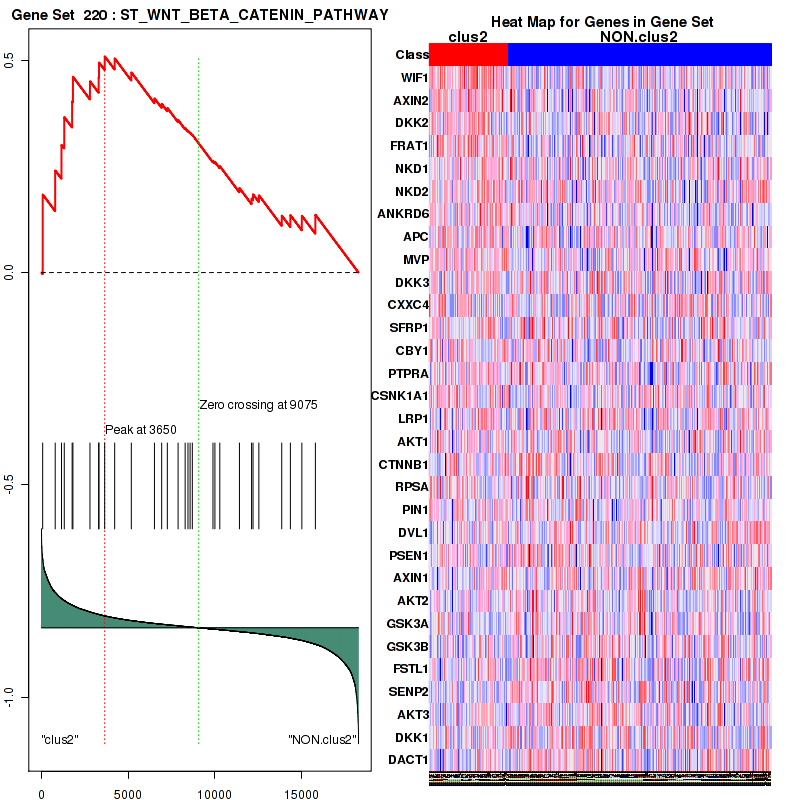
Figure S40. Get High-res Image For the top 5 core enriched genes in the pathway: ST WNT BETA CATENIN PATHWAY, this volcano plot shows how much they are up/down-regulated and significant. The significance was calculated by empirical bayesian fit

For the top enriched genes, if you want to check whether they are
-
up-regulated, please check the list of up-regulated genes
-
down-regulated, please check the list of down-regulated genes
For the top enriched genes, if you want to check whether they are
-
highly expressed genes, please check the list of high (top 30%) expressed genes
-
low expressed genes, please check the list of low (bottom 30%) expressed genes
An expression pattern of top(30%)/middle(30%)/low(30%) in this subtype against other subtypes is available in a heatmap
For the top enriched genes, if you want to check whether they are
-
significantly differently expressed genes by eBayes lm fit, please check the list of significant genes
Table 5. Get Full Table This table shows top 10 pathways which are significantly enriched in cluster clus3. It displays only significant gene sets satisfying nom.p.val.threshold (-1), fwer.p.val.threshold (-1) , fdr.q.val.threshold (0.25) and the default table is sorted by Normalized Enrichment Score (NES). Further details on NES statistics, please visit The Broad GSEA website.
| GeneSet(GS) | Size(#genes) | genes.ES.table | ES | NES | NOM.p.val | FDR.q.val | FWER.p.val | Tag.. | Gene.. | Signal | FDR..median. | glob.p.val |
|---|---|---|---|---|---|---|---|---|---|---|---|---|
| KEGG DNA REPLICATION | 36 | genes.ES.table | 0.62 | 1.6 | 0.097 | 0.25 | 0.96 | 0.64 | 0.24 | 0.48 | 0.15 | 0.031 |
| KEGG SPLICEOSOME | 114 | genes.ES.table | 0.4 | 1.6 | 0.094 | 0.25 | 0.96 | 0.71 | 0.41 | 0.42 | 0.15 | 0.031 |
| KEGG PROTEASOME | 43 | genes.ES.table | 0.63 | 1.8 | 0.018 | 0.14 | 0.61 | 0.67 | 0.27 | 0.49 | 0.049 | 0.028 |
| KEGG NUCLEOTIDE EXCISION REPAIR | 44 | genes.ES.table | 0.47 | 1.7 | 0.041 | 0.19 | 0.84 | 0.48 | 0.3 | 0.34 | 0.088 | 0.029 |
| KEGG CELL CYCLE | 118 | genes.ES.table | 0.59 | 1.8 | 0.023 | 0.15 | 0.66 | 0.42 | 0.2 | 0.34 | 0.055 | 0.028 |
| KEGG P53 SIGNALING PATHWAY | 67 | genes.ES.table | 0.46 | 1.6 | 0.029 | 0.22 | 0.93 | 0.33 | 0.15 | 0.28 | 0.12 | 0.028 |
| KEGG UBIQUITIN MEDIATED PROTEOLYSIS | 133 | genes.ES.table | 0.28 | 1.7 | 0.036 | 0.19 | 0.87 | 0.26 | 0.22 | 0.21 | 0.096 | 0.026 |
| BIOCARTA G1 PATHWAY | 28 | genes.ES.table | 0.64 | 1.8 | 0.0062 | 0.17 | 0.47 | 0.39 | 0.17 | 0.33 | 0 | 0.033 |
| BIOCARTA HIVNEF PATHWAY | 58 | genes.ES.table | 0.35 | 1.6 | 0.065 | 0.24 | 0.96 | 0.47 | 0.29 | 0.33 | 0.14 | 0.031 |
| BIOCARTA PROTEASOME PATHWAY | 28 | genes.ES.table | 0.62 | 1.6 | 0.033 | 0.23 | 0.93 | 0.86 | 0.34 | 0.57 | 0.12 | 0.028 |
Table S21. Get Full Table This table shows a Running Enrichment Score (RES) of each gene in this pathway, that is, the enrichment score at this point in the ranked list of genes. All genes are ranked by Signal-to-Noise (S2N), a measure of similarity as default and are used to obtain ES matrix of all genes. In this way, GSEA tool uses expression pattern of not only overlapped genes but also not-overlapped genes to produce ES matrix.
| Rank | GENE | SYMBOL | DESC | LIST.LOC | S2N | RES | CORE_ENRICHMENT |
|---|---|---|---|---|---|---|---|
| 1 | PSMB9 | PSMB9 | PSMB9 | 1360 | 0.16 | -0.029 | YES |
| 2 | PSMD14 | PSMD14 | PSMD14 | 2349 | 0.1 | -0.054 | YES |
| 3 | PSMB8 | PSMB8 | PSMB8 | 2351 | 0.1 | -0.026 | YES |
| 4 | TNPO1 | TNPO1 | TNPO1 | 2437 | 0.097 | -0.0025 | YES |
| 5 | PSMA5 | PSMA5 | PSMA5 | 2588 | 0.091 | 0.015 | YES |
| 6 | PSMB7 | PSMB7 | PSMB7 | 2657 | 0.088 | 0.037 | YES |
| 7 | PSMB10 | PSMB10 | PSMB10 | 2660 | 0.088 | 0.062 | YES |
| 8 | PSMA4 | PSMA4 | PSMA4 | 2827 | 0.083 | 0.077 | YES |
| 9 | PSMC4 | PSMC4 | PSMC4 | 2908 | 0.081 | 0.096 | YES |
| 10 | HSPA1B | HSPA1B | HSPA1B | 2922 | 0.08 | 0.12 | YES |
| 11 | PSMD12 | PSMD12 | PSMD12 | 3054 | 0.076 | 0.13 | YES |
| 12 | PSMD11 | PSMD11 | PSMD11 | 3083 | 0.076 | 0.15 | YES |
| 13 | PSMD1 | PSMD1 | PSMD1 | 3100 | 0.075 | 0.17 | YES |
| 14 | EXOSC8 | EXOSC8 | EXOSC8 | 3150 | 0.074 | 0.19 | YES |
| 15 | PSMD2 | PSMD2 | PSMD2 | 3170 | 0.073 | 0.21 | YES |
| 16 | PSMA8 | PSMA8 | PSMA8 | 3186 | 0.073 | 0.23 | YES |
| 17 | PSME2 | PSME2 | PSME2 | 3329 | 0.069 | 0.24 | YES |
| 18 | PSMD9 | PSMD9 | PSMD9 | 3448 | 0.067 | 0.26 | YES |
| 19 | PSMD7 | PSMD7 | PSMD7 | 3492 | 0.066 | 0.27 | YES |
| 20 | PRKCA | PRKCA | PRKCA | 3565 | 0.064 | 0.29 | YES |
| 21 | ANP32A | ANP32A | ANP32A | 3663 | 0.062 | 0.3 | YES |
| 22 | YWHAZ | YWHAZ | YWHAZ | 3672 | 0.062 | 0.32 | YES |
| 23 | EIF4G1 | EIF4G1 | EIF4G1 | 3941 | 0.056 | 0.32 | YES |
| 24 | PSMA2 | PSMA2 | PSMA2 | 3993 | 0.055 | 0.33 | YES |
| 25 | PSMA3 | PSMA3 | PSMA3 | 4111 | 0.052 | 0.34 | YES |
| 26 | DIS3 | DIS3 | DIS3 | 4164 | 0.052 | 0.35 | YES |
| 27 | PSMD8 | PSMD8 | PSMD8 | 4205 | 0.051 | 0.37 | YES |
| 28 | YWHAB | YWHAB | YWHAB | 4223 | 0.051 | 0.38 | YES |
| 29 | PSMB6 | PSMB6 | PSMB6 | 4256 | 0.05 | 0.39 | YES |
| 30 | PSMB3 | PSMB3 | PSMB3 | 4713 | 0.043 | 0.38 | YES |
| 31 | PSMA1 | PSMA1 | PSMA1 | 4724 | 0.043 | 0.39 | YES |
| 32 | XPO1 | XPO1 | XPO1 | 4746 | 0.042 | 0.4 | YES |
| 33 | MAPK11 | MAPK11 | MAPK11 | 4753 | 0.042 | 0.41 | YES |
| 34 | PSMB5 | PSMB5 | PSMB5 | 4849 | 0.04 | 0.42 | YES |
| 35 | PSMB2 | PSMB2 | PSMB2 | 4879 | 0.04 | 0.43 | YES |
| 36 | PSMB1 | PSMB1 | PSMB1 | 4892 | 0.04 | 0.44 | YES |
| 37 | PSMC2 | PSMC2 | PSMC2 | 4943 | 0.039 | 0.45 | YES |
| 38 | XRN1 | XRN1 | XRN1 | 4979 | 0.038 | 0.46 | YES |
| 39 | EXOSC3 | EXOSC3 | EXOSC3 | 5113 | 0.036 | 0.46 | YES |
| 40 | PSMC5 | PSMC5 | PSMC5 | 5259 | 0.034 | 0.46 | YES |
| 41 | HSPA8 | HSPA8 | HSPA8 | 5286 | 0.034 | 0.47 | YES |
| 42 | RPS27A | RPS27A | RPS27A | 5329 | 0.033 | 0.48 | YES |
| 43 | EXOSC1 | EXOSC1 | EXOSC1 | 5346 | 0.033 | 0.49 | YES |
| 44 | EXOSC9 | EXOSC9 | EXOSC9 | 5359 | 0.033 | 0.5 | YES |
| 45 | EXOSC2 | EXOSC2 | EXOSC2 | 5461 | 0.032 | 0.5 | YES |
| 46 | PSMD6 | PSMD6 | PSMD6 | 5603 | 0.029 | 0.5 | YES |
| 47 | ZFP36 | ZFP36 | ZFP36 | 5690 | 0.028 | 0.5 | YES |
| 48 | PSMC1 | PSMC1 | PSMC1 | 5752 | 0.027 | 0.51 | YES |
| 49 | PSMA7 | PSMA7 | PSMA7 | 5871 | 0.026 | 0.51 | YES |
| 50 | PSMC6 | PSMC6 | PSMC6 | 6214 | 0.021 | 0.5 | NO |
| 51 | PSMD13 | PSMD13 | PSMD13 | 6478 | 0.017 | 0.49 | NO |
| 52 | PSME1 | PSME1 | PSME1 | 6509 | 0.017 | 0.49 | NO |
| 53 | HNRNPD | HNRNPD | HNRNPD | 6533 | 0.017 | 0.49 | NO |
| 54 | KHSRP | KHSRP | KHSRP | 6573 | 0.016 | 0.5 | NO |
| 55 | PSMD4 | PSMD4 | PSMD4 | 6627 | 0.016 | 0.5 | NO |
| 56 | PSME4 | PSME4 | PSME4 | 6775 | 0.014 | 0.49 | NO |
| 57 | PSMC3 | PSMC3 | PSMC3 | 6800 | 0.014 | 0.5 | NO |
| 58 | UBA52 | UBA52 | UBA52 | 6969 | 0.012 | 0.49 | NO |
| 59 | MAPK14 | MAPK14 | MAPK14 | 7241 | 0.0082 | 0.48 | NO |
| 60 | PSMD5 | PSMD5 | PSMD5 | 7246 | 0.0082 | 0.48 | NO |
| 61 | PSMD3 | PSMD3 | PSMD3 | 7386 | 0.0066 | 0.47 | NO |
| 62 | PABPC1 | PABPC1 | PABPC1 | 7508 | 0.0051 | 0.47 | NO |
| 63 | EXOSC7 | EXOSC7 | EXOSC7 | 7574 | 0.0043 | 0.47 | NO |
| 64 | PSMF1 | PSMF1 | PSMF1 | 7692 | 0.0029 | 0.46 | NO |
| 65 | PSMB4 | PSMB4 | PSMB4 | 7784 | 0.0016 | 0.46 | NO |
| 66 | EXOSC5 | EXOSC5 | EXOSC5 | 7846 | 0.001 | 0.45 | NO |
| 67 | PSMD10 | PSMD10 | PSMD10 | 8017 | -0.0012 | 0.44 | NO |
| 68 | DCP1A | DCP1A | DCP1A | 8047 | -0.0016 | 0.44 | NO |
| 69 | ELAVL1 | ELAVL1 | ELAVL1 | 8050 | -0.0016 | 0.44 | NO |
| 70 | EXOSC6 | EXOSC6 | EXOSC6 | 8176 | -0.0034 | 0.44 | NO |
| 71 | NUP214 | NUP214 | NUP214 | 8674 | -0.0097 | 0.41 | NO |
| 72 | PSMA6 | PSMA6 | PSMA6 | 9209 | -0.017 | 0.39 | NO |
| 73 | MAPKAPK2 | MAPKAPK2 | MAPKAPK2 | 9330 | -0.018 | 0.39 | NO |
| 74 | EXOSC4 | EXOSC4 | EXOSC4 | 9463 | -0.02 | 0.39 | NO |
| 75 | PARN | PARN | PARN | 9526 | -0.021 | 0.39 | NO |
| 76 | AKT1 | AKT1 | AKT1 | 10169 | -0.03 | 0.36 | NO |
| 77 | DCP2 | DCP2 | DCP2 | 10290 | -0.032 | 0.36 | NO |
| 78 | HSPB1 | HSPB1 | HSPB1 | 10907 | -0.041 | 0.34 | NO |
| 79 | TNFSF13 | TNFSF13 | TNFSF13 | 12231 | -0.063 | 0.29 | NO |
| 80 | ZFP36L1 | ZFP36L1 | ZFP36L1 | 12763 | -0.075 | 0.28 | NO |
| 81 | PRKCD | PRKCD | PRKCD | 13062 | -0.081 | 0.29 | NO |
Figure S41. Get High-res Image This plot shows mRNAseq_cNMF expression data heatmap (on the left) a RunningEnrichmentScore(RES) plot (on the top right) and a Signal2Noise(S2N) plot (on the bottom right) of genes in the pathway: KEGG DNA REPLICATION.
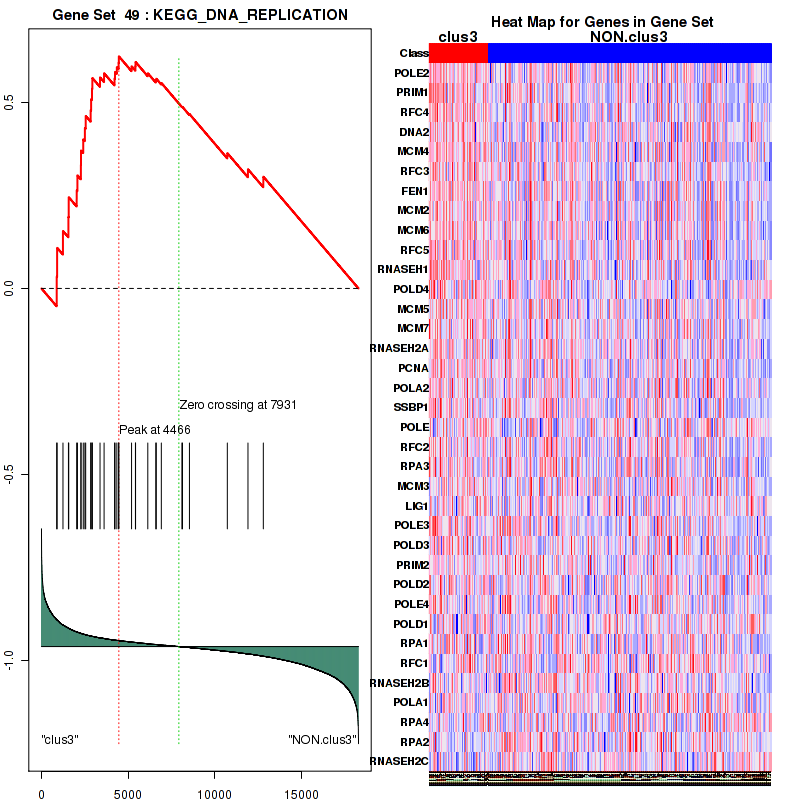
Figure S42. Get High-res Image For the top 5 core enriched genes in the pathway: KEGG DNA REPLICATION, this volcano plot shows how much they are up/down-regulated and significant. The significance was calculated by empirical bayesian fit
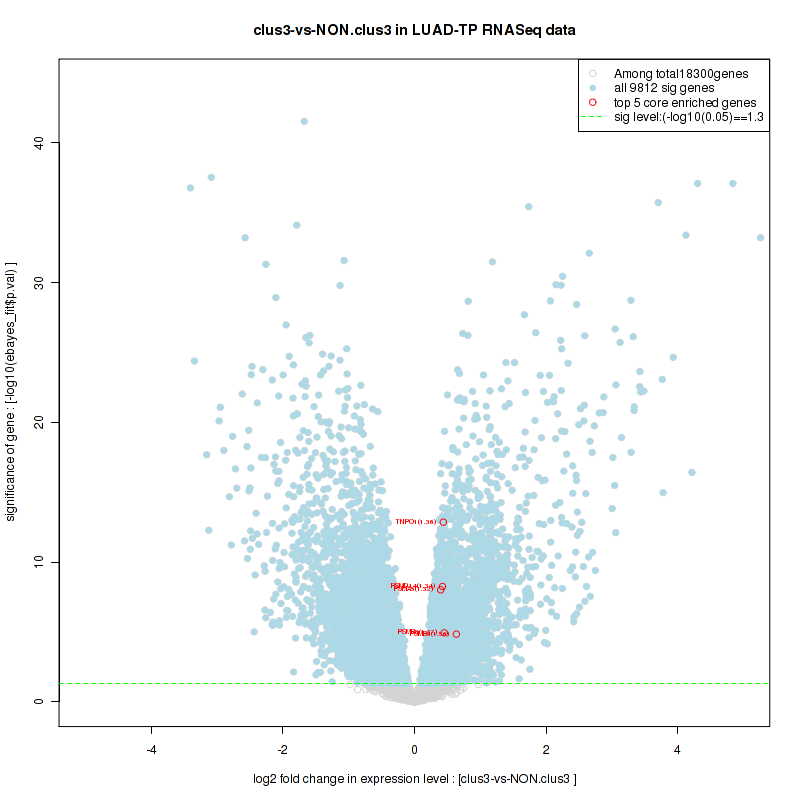
Table S22. Get Full Table This table shows a Running Enrichment Score (RES) of each gene in this pathway, that is, the enrichment score at this point in the ranked list of genes. All genes are ranked by Signal-to-Noise (S2N), a measure of similarity as default and are used to obtain ES matrix of all genes. In this way, GSEA tool uses expression pattern of not only overlapped genes but also not-overlapped genes to produce ES matrix.
| Rank | GENE | SYMBOL | DESC | LIST.LOC | S2N | RES | CORE_ENRICHMENT |
|---|---|---|---|---|---|---|---|
| 1 | DSG3 | DSG3 | DSG3 | 76 | 0.49 | 0.042 | YES |
| 2 | GZMB | GZMB | GZMB | 261 | 0.35 | 0.065 | YES |
| 3 | HIST1H1E | HIST1H1E | HIST1H1E | 363 | 0.32 | 0.089 | YES |
| 4 | HIST1H1D | HIST1H1D | HIST1H1D | 542 | 0.27 | 0.1 | YES |
| 5 | UNC5A | UNC5A | UNC5A | 615 | 0.26 | 0.12 | YES |
| 6 | DSG2 | DSG2 | DSG2 | 920 | 0.21 | 0.13 | YES |
| 7 | HIST1H1B | HIST1H1B | HIST1H1B | 944 | 0.2 | 0.15 | YES |
| 8 | FASLG | FASLG | FASLG | 1186 | 0.17 | 0.15 | YES |
| 9 | DSG1 | DSG1 | DSG1 | 1286 | 0.16 | 0.16 | YES |
| 10 | DSP | DSP | DSP | 1318 | 0.16 | 0.17 | YES |
| 11 | PLEC | PLEC | PLEC | 1321 | 0.16 | 0.19 | YES |
| 12 | PSMB9 | PSMB9 | PSMB9 | 1360 | 0.16 | 0.2 | YES |
| 13 | PMAIP1 | PMAIP1 | PMAIP1 | 1560 | 0.14 | 0.2 | YES |
| 14 | ARHGAP10 | ARHGAP10 | ARHGAP10 | 1809 | 0.13 | 0.2 | YES |
| 15 | DNM1L | DNM1L | DNM1L | 1910 | 0.12 | 0.21 | YES |
| 16 | LMNB1 | LMNB1 | LMNB1 | 1972 | 0.12 | 0.22 | YES |
| 17 | BID | BID | BID | 1995 | 0.12 | 0.22 | YES |
| 18 | HIST1H1C | HIST1H1C | HIST1H1C | 2042 | 0.12 | 0.23 | YES |
| 19 | STK24 | STK24 | STK24 | 2133 | 0.11 | 0.24 | YES |
| 20 | TNFRSF1A | TNFRSF1A | TNFRSF1A | 2322 | 0.1 | 0.24 | YES |
| 21 | PSMD14 | PSMD14 | PSMD14 | 2349 | 0.1 | 0.25 | YES |
| 22 | PSMB8 | PSMB8 | PSMB8 | 2351 | 0.1 | 0.26 | YES |
| 23 | CASP9 | CASP9 | CASP9 | 2429 | 0.097 | 0.26 | YES |
| 24 | PAK2 | PAK2 | PAK2 | 2537 | 0.093 | 0.26 | YES |
| 25 | CYCS | CYCS | CYCS | 2545 | 0.092 | 0.27 | YES |
| 26 | BAK1 | BAK1 | BAK1 | 2573 | 0.092 | 0.28 | YES |
| 27 | PSMA5 | PSMA5 | PSMA5 | 2588 | 0.091 | 0.29 | YES |
| 28 | PSMB7 | PSMB7 | PSMB7 | 2657 | 0.088 | 0.29 | YES |
| 29 | PSMB10 | PSMB10 | PSMB10 | 2660 | 0.088 | 0.3 | YES |
| 30 | FAS | FAS | FAS | 2764 | 0.085 | 0.3 | YES |
| 31 | FADD | FADD | FADD | 2795 | 0.084 | 0.31 | YES |
| 32 | PSMA4 | PSMA4 | PSMA4 | 2827 | 0.083 | 0.31 | YES |
| 33 | PSMC4 | PSMC4 | PSMC4 | 2908 | 0.081 | 0.32 | YES |
| 34 | TNFRSF10B | TNFRSF10B | TNFRSF10B | 3015 | 0.078 | 0.32 | YES |
| 35 | BCL2L1 | BCL2L1 | BCL2L1 | 3016 | 0.078 | 0.33 | YES |
| 36 | DYNLL1 | DYNLL1 | DYNLL1 | 3019 | 0.078 | 0.33 | YES |
| 37 | PSMD12 | PSMD12 | PSMD12 | 3054 | 0.076 | 0.34 | YES |
| 38 | PSMD11 | PSMD11 | PSMD11 | 3083 | 0.076 | 0.34 | YES |
| 39 | PSMD1 | PSMD1 | PSMD1 | 3100 | 0.075 | 0.35 | YES |
| 40 | PSMD2 | PSMD2 | PSMD2 | 3170 | 0.073 | 0.35 | YES |
| 41 | PSMA8 | PSMA8 | PSMA8 | 3186 | 0.073 | 0.36 | YES |
| 42 | PRKCQ | PRKCQ | PRKCQ | 3262 | 0.07 | 0.36 | YES |
| 43 | MST4 | MST4 | MST4 | 3326 | 0.069 | 0.36 | YES |
| 44 | PSME2 | PSME2 | PSME2 | 3329 | 0.069 | 0.37 | YES |
| 45 | KPNA1 | KPNA1 | KPNA1 | 3376 | 0.068 | 0.38 | YES |
| 46 | PSMD9 | PSMD9 | PSMD9 | 3448 | 0.067 | 0.38 | YES |
| 47 | PSMD7 | PSMD7 | PSMD7 | 3492 | 0.066 | 0.38 | YES |
| 48 | BIRC2 | BIRC2 | BIRC2 | 3497 | 0.066 | 0.39 | YES |
| 49 | TRAF2 | TRAF2 | TRAF2 | 3610 | 0.063 | 0.39 | YES |
| 50 | E2F1 | E2F1 | E2F1 | 3670 | 0.062 | 0.39 | YES |
| 51 | TJP2 | TJP2 | TJP2 | 3864 | 0.057 | 0.38 | YES |
| 52 | KPNB1 | KPNB1 | KPNB1 | 3924 | 0.056 | 0.39 | YES |
| 53 | PSMA2 | PSMA2 | PSMA2 | 3993 | 0.055 | 0.39 | YES |
| 54 | TJP1 | TJP1 | TJP1 | 4033 | 0.054 | 0.39 | YES |
| 55 | PSMA3 | PSMA3 | PSMA3 | 4111 | 0.052 | 0.39 | YES |
| 56 | PSMD8 | PSMD8 | PSMD8 | 4205 | 0.051 | 0.39 | YES |
| 57 | YWHAB | YWHAB | YWHAB | 4223 | 0.051 | 0.4 | YES |
| 58 | BCL2L11 | BCL2L11 | BCL2L11 | 4232 | 0.05 | 0.4 | YES |
| 59 | PSMB6 | PSMB6 | PSMB6 | 4256 | 0.05 | 0.4 | YES |
| 60 | DIABLO | DIABLO | DIABLO | 4286 | 0.05 | 0.41 | YES |
| 61 | MAPK8 | MAPK8 | MAPK8 | 4312 | 0.049 | 0.41 | YES |
| 62 | PPP3R1 | PPP3R1 | PPP3R1 | 4426 | 0.047 | 0.41 | YES |
| 63 | CASP3 | CASP3 | CASP3 | 4505 | 0.046 | 0.41 | YES |
| 64 | CASP8 | CASP8 | CASP8 | 4670 | 0.043 | 0.4 | YES |
| 65 | PSMB3 | PSMB3 | PSMB3 | 4713 | 0.043 | 0.4 | YES |
| 66 | PSMA1 | PSMA1 | PSMA1 | 4724 | 0.043 | 0.41 | YES |
| 67 | LMNA | LMNA | LMNA | 4763 | 0.042 | 0.41 | YES |
| 68 | PSMB5 | PSMB5 | PSMB5 | 4849 | 0.04 | 0.41 | YES |
| 69 | PSMB2 | PSMB2 | PSMB2 | 4879 | 0.04 | 0.41 | YES |
| 70 | PSMB1 | PSMB1 | PSMB1 | 4892 | 0.04 | 0.41 | YES |
| 71 | HMGB1 | HMGB1 | HMGB1 | 4901 | 0.04 | 0.42 | YES |
| 72 | PSMC2 | PSMC2 | PSMC2 | 4943 | 0.039 | 0.42 | YES |
| 73 | TFDP1 | TFDP1 | TFDP1 | 5154 | 0.036 | 0.41 | NO |
| 74 | GAS2 | GAS2 | GAS2 | 5208 | 0.035 | 0.41 | NO |
| 75 | PSMC5 | PSMC5 | PSMC5 | 5259 | 0.034 | 0.41 | NO |
| 76 | CASP7 | CASP7 | CASP7 | 5299 | 0.034 | 0.41 | NO |
| 77 | RPS27A | RPS27A | RPS27A | 5329 | 0.033 | 0.41 | NO |
| 78 | FNTA | FNTA | FNTA | 5467 | 0.031 | 0.41 | NO |
| 79 | PSMD6 | PSMD6 | PSMD6 | 5603 | 0.029 | 0.4 | NO |
| 80 | TNFSF10 | TNFSF10 | TNFSF10 | 5623 | 0.029 | 0.41 | NO |
| 81 | PSMC1 | PSMC1 | PSMC1 | 5752 | 0.027 | 0.4 | NO |
| 82 | NMT1 | NMT1 | NMT1 | 5798 | 0.026 | 0.4 | NO |
| 83 | CFLAR | CFLAR | CFLAR | 5828 | 0.026 | 0.4 | NO |
| 84 | PSMA7 | PSMA7 | PSMA7 | 5871 | 0.026 | 0.4 | NO |
| 85 | PKP1 | PKP1 | PKP1 | 5892 | 0.025 | 0.4 | NO |
| 86 | UNC5B | UNC5B | UNC5B | 5922 | 0.025 | 0.4 | NO |
| 87 | HMGB2 | HMGB2 | HMGB2 | 5975 | 0.024 | 0.4 | NO |
| 88 | CASP6 | CASP6 | CASP6 | 6145 | 0.022 | 0.4 | NO |
| 89 | PSMC6 | PSMC6 | PSMC6 | 6214 | 0.021 | 0.4 | NO |
| 90 | BCAP31 | BCAP31 | BCAP31 | 6365 | 0.019 | 0.39 | NO |
| 91 | PSMD13 | PSMD13 | PSMD13 | 6478 | 0.017 | 0.38 | NO |
| 92 | PSME1 | PSME1 | PSME1 | 6509 | 0.017 | 0.38 | NO |
| 93 | PSMD4 | PSMD4 | PSMD4 | 6627 | 0.016 | 0.38 | NO |
| 94 | LOC647859 | LOC647859 | LOC647859 | 6699 | 0.015 | 0.38 | NO |
| 95 | PSME4 | PSME4 | PSME4 | 6775 | 0.014 | 0.37 | NO |
| 96 | PSMC3 | PSMC3 | PSMC3 | 6800 | 0.014 | 0.37 | NO |
| 97 | UBA52 | UBA52 | UBA52 | 6969 | 0.012 | 0.37 | NO |
| 98 | BAX | BAX | BAX | 7213 | 0.0086 | 0.35 | NO |
| 99 | PSMD5 | PSMD5 | PSMD5 | 7246 | 0.0082 | 0.35 | NO |
| 100 | ROCK1 | ROCK1 | ROCK1 | 7258 | 0.0081 | 0.35 | NO |
| 101 | PSMD3 | PSMD3 | PSMD3 | 7386 | 0.0066 | 0.35 | NO |
| 102 | SPTAN1 | SPTAN1 | SPTAN1 | 7487 | 0.0054 | 0.34 | NO |
| 103 | ADD1 | ADD1 | ADD1 | 7520 | 0.0049 | 0.34 | NO |
| 104 | PSMF1 | PSMF1 | PSMF1 | 7692 | 0.0029 | 0.33 | NO |
| 105 | PSMB4 | PSMB4 | PSMB4 | 7784 | 0.0016 | 0.33 | NO |
| 106 | PSMD10 | PSMD10 | PSMD10 | 8017 | -0.0012 | 0.31 | NO |
| 107 | DCC | DCC | DCC | 8127 | -0.0028 | 0.31 | NO |
| 108 | DAPK3 | DAPK3 | DAPK3 | 8137 | -0.0029 | 0.31 | NO |
| 109 | RIPK1 | RIPK1 | RIPK1 | 8188 | -0.0035 | 0.3 | NO |
| 110 | VIM | VIM | VIM | 8675 | -0.0097 | 0.28 | NO |
| 111 | APAF1 | APAF1 | APAF1 | 8831 | -0.012 | 0.27 | NO |
| 112 | PSMA6 | PSMA6 | PSMA6 | 9209 | -0.017 | 0.25 | NO |
| 113 | DBNL | DBNL | DBNL | 9388 | -0.019 | 0.24 | NO |
| 114 | TRADD | TRADD | TRADD | 9428 | -0.02 | 0.24 | NO |
| 115 | XIAP | XIAP | XIAP | 9555 | -0.021 | 0.24 | NO |
| 116 | H1F0 | H1F0 | H1F0 | 9558 | -0.021 | 0.24 | NO |
| 117 | APC | APC | APC | 9749 | -0.024 | 0.23 | NO |
| 118 | DFFA | DFFA | DFFA | 9827 | -0.025 | 0.23 | NO |
| 119 | TNF | TNF | TNF | 9944 | -0.027 | 0.23 | NO |
| 120 | AKT1 | AKT1 | AKT1 | 10169 | -0.03 | 0.22 | NO |
| 121 | CTNNB1 | CTNNB1 | CTNNB1 | 10259 | -0.031 | 0.22 | NO |
| 122 | GSN | GSN | GSN | 10346 | -0.032 | 0.21 | NO |
| 123 | CDH1 | CDH1 | CDH1 | 10368 | -0.033 | 0.22 | NO |
| 124 | DAPK1 | DAPK1 | DAPK1 | 10390 | -0.033 | 0.22 | NO |
| 125 | ACIN1 | ACIN1 | ACIN1 | 10416 | -0.034 | 0.22 | NO |
| 126 | TP53 | TP53 | TP53 | 10613 | -0.036 | 0.21 | NO |
| 127 | APPL1 | APPL1 | APPL1 | 10657 | -0.037 | 0.21 | NO |
| 128 | SATB1 | SATB1 | SATB1 | 10797 | -0.039 | 0.21 | NO |
| 129 | DYNLL2 | DYNLL2 | DYNLL2 | 12085 | -0.06 | 0.14 | NO |
| 130 | PTK2 | PTK2 | PTK2 | 12349 | -0.066 | 0.14 | NO |
| 131 | MAGED1 | MAGED1 | MAGED1 | 12405 | -0.067 | 0.14 | NO |
| 132 | CASP10 | CASP10 | CASP10 | 12716 | -0.074 | 0.13 | NO |
| 133 | BBC3 | BBC3 | BBC3 | 12795 | -0.075 | 0.13 | NO |
| 134 | BAD | BAD | BAD | 13007 | -0.08 | 0.13 | NO |
| 135 | PRKCD | PRKCD | PRKCD | 13062 | -0.081 | 0.13 | NO |
| 136 | DFFB | DFFB | DFFB | 13348 | -0.088 | 0.12 | NO |
| 137 | BMX | BMX | BMX | 15002 | -0.14 | 0.047 | NO |
| 138 | BMF | BMF | BMF | 15923 | -0.18 | 0.014 | NO |
| 139 | BCL2 | BCL2 | BCL2 | 16172 | -0.2 | 0.018 | NO |
| 140 | OCLN | OCLN | OCLN | 16851 | -0.24 | 0.0035 | NO |
| 141 | MAPT | MAPT | MAPT | 17943 | -0.39 | -0.02 | NO |
| 142 | DAPK2 | DAPK2 | DAPK2 | 18052 | -0.42 | 0.014 | NO |
Figure S43. Get High-res Image This plot shows mRNAseq_cNMF expression data heatmap (on the left) a RunningEnrichmentScore(RES) plot (on the top right) and a Signal2Noise(S2N) plot (on the bottom right) of genes in the pathway: KEGG SPLICEOSOME.
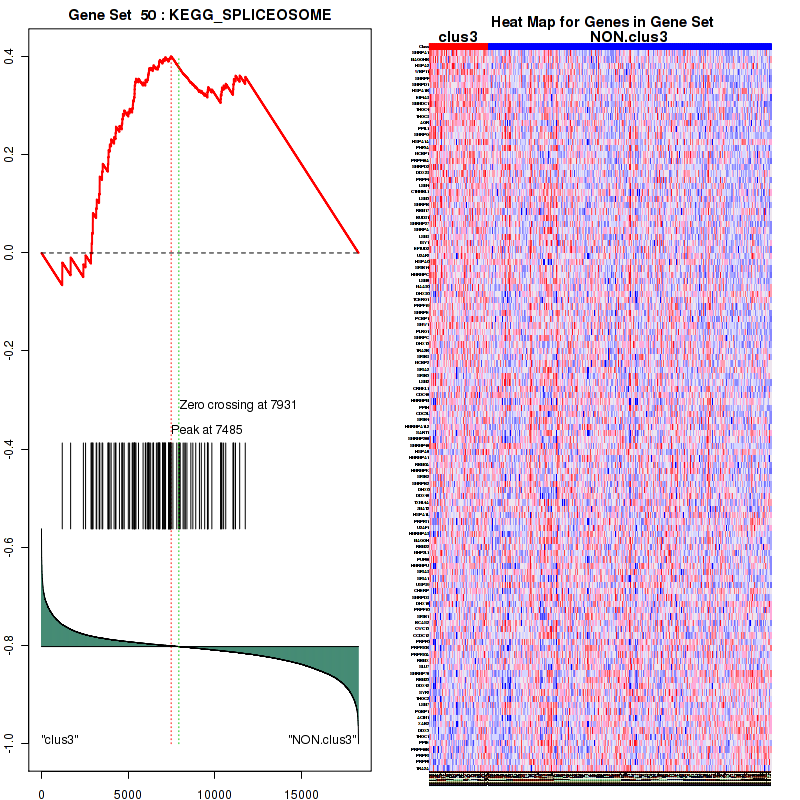
Figure S44. Get High-res Image For the top 5 core enriched genes in the pathway: KEGG SPLICEOSOME, this volcano plot shows how much they are up/down-regulated and significant. The significance was calculated by empirical bayesian fit
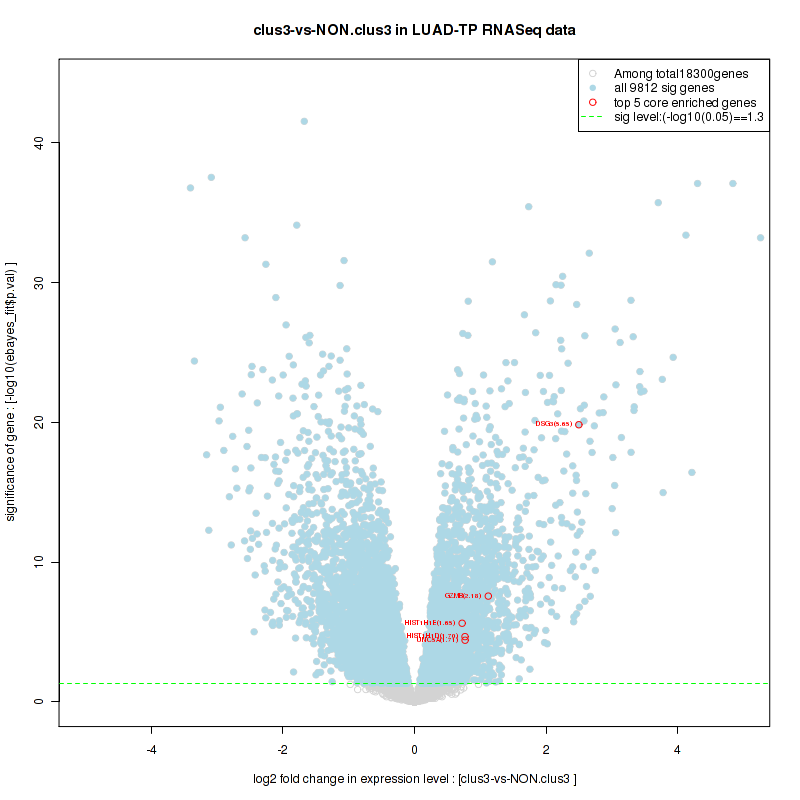
Table S23. Get Full Table This table shows a Running Enrichment Score (RES) of each gene in this pathway, that is, the enrichment score at this point in the ranked list of genes. All genes are ranked by Signal-to-Noise (S2N), a measure of similarity as default and are used to obtain ES matrix of all genes. In this way, GSEA tool uses expression pattern of not only overlapped genes but also not-overlapped genes to produce ES matrix.
| Rank | GENE | SYMBOL | DESC | LIST.LOC | S2N | RES | CORE_ENRICHMENT |
|---|---|---|---|---|---|---|---|
| 1 | GJB3 | GJB3 | GJB3 | 3 | 0.88 | 0.11 | YES |
| 2 | GJB4 | GJB4 | GJB4 | 36 | 0.57 | 0.17 | YES |
| 3 | GJB5 | GJB5 | GJB5 | 66 | 0.5 | 0.23 | YES |
| 4 | GJB2 | GJB2 | GJB2 | 75 | 0.49 | 0.29 | YES |
| 5 | TPD52L1 | TPD52L1 | TPD52L1 | 946 | 0.2 | 0.27 | YES |
| 6 | CLTB | CLTB | CLTB | 1176 | 0.17 | 0.28 | YES |
| 7 | GJB6 | GJB6 | GJB6 | 1243 | 0.17 | 0.29 | YES |
| 8 | GJA3 | GJA3 | GJA3 | 1332 | 0.16 | 0.31 | YES |
| 9 | TFRC | TFRC | TFRC | 1729 | 0.13 | 0.3 | YES |
| 10 | STAM | STAM | STAM | 2057 | 0.11 | 0.3 | YES |
| 11 | GJC2 | GJC2 | GJC2 | 2370 | 0.099 | 0.29 | YES |
| 12 | GJA1 | GJA1 | GJA1 | 2627 | 0.089 | 0.29 | YES |
| 13 | AP4E1 | AP4E1 | AP4E1 | 2682 | 0.088 | 0.3 | YES |
| 14 | SNX9 | SNX9 | SNX9 | 2785 | 0.084 | 0.3 | YES |
| 15 | AP3S1 | AP3S1 | AP3S1 | 2891 | 0.081 | 0.31 | YES |
| 16 | GJA9 | GJA9 | GJA9 | 2960 | 0.079 | 0.31 | YES |
| 17 | AP1S1 | AP1S1 | AP1S1 | 3092 | 0.075 | 0.31 | YES |
| 18 | VTA1 | VTA1 | VTA1 | 3198 | 0.073 | 0.32 | YES |
| 19 | AP2M1 | AP2M1 | AP2M1 | 3261 | 0.07 | 0.32 | YES |
| 20 | COPZ1 | COPZ1 | COPZ1 | 3325 | 0.069 | 0.33 | YES |
| 21 | M6PR | M6PR | M6PR | 3443 | 0.067 | 0.33 | YES |
| 22 | NECAP1 | NECAP1 | NECAP1 | 3455 | 0.067 | 0.34 | YES |
| 23 | CPD | CPD | CPD | 3512 | 0.065 | 0.34 | YES |
| 24 | CNO | CNO | CNO | 3538 | 0.065 | 0.35 | YES |
| 25 | CHMP2B | CHMP2B | CHMP2B | 3606 | 0.063 | 0.35 | YES |
| 26 | SNF8 | SNF8 | SNF8 | 3653 | 0.062 | 0.36 | YES |
| 27 | SNAP23 | SNAP23 | SNAP23 | 3798 | 0.059 | 0.36 | YES |
| 28 | SEC23A | SEC23A | SEC23A | 3848 | 0.057 | 0.36 | YES |
| 29 | TJP1 | TJP1 | TJP1 | 4033 | 0.054 | 0.36 | YES |
| 30 | CHMP4C | CHMP4C | CHMP4C | 4145 | 0.052 | 0.36 | YES |
| 31 | DNM1 | DNM1 | DNM1 | 4165 | 0.052 | 0.36 | YES |
| 32 | GJC1 | GJC1 | GJC1 | 4243 | 0.05 | 0.36 | YES |
| 33 | SRC | SRC | SRC | 4339 | 0.049 | 0.36 | YES |
| 34 | VPS37B | VPS37B | VPS37B | 4354 | 0.048 | 0.37 | YES |
| 35 | VPS4B | VPS4B | VPS4B | 4429 | 0.047 | 0.37 | YES |
| 36 | PICALM | PICALM | PICALM | 4597 | 0.045 | 0.37 | YES |
| 37 | PLDN | PLDN | PLDN | 4750 | 0.042 | 0.36 | YES |
| 38 | BLOC1S1 | BLOC1S1 | BLOC1S1 | 4825 | 0.041 | 0.36 | YES |
| 39 | AP3B1 | AP3B1 | AP3B1 | 4856 | 0.04 | 0.37 | YES |
| 40 | COPB2 | COPB2 | COPB2 | 4948 | 0.039 | 0.37 | YES |
| 41 | CHMP5 | CHMP5 | CHMP5 | 4995 | 0.038 | 0.37 | YES |
| 42 | GBF1 | GBF1 | GBF1 | 5011 | 0.038 | 0.37 | YES |
| 43 | HGS | HGS | HGS | 5150 | 0.036 | 0.37 | YES |
| 44 | DAB2 | DAB2 | DAB2 | 5162 | 0.036 | 0.37 | YES |
| 45 | YIPF6 | YIPF6 | YIPF6 | 5242 | 0.035 | 0.37 | YES |
| 46 | COPG | COPG | COPG | 5265 | 0.034 | 0.38 | YES |
| 47 | HSPA8 | HSPA8 | HSPA8 | 5286 | 0.034 | 0.38 | YES |
| 48 | RPS27A | RPS27A | RPS27A | 5329 | 0.033 | 0.38 | YES |
| 49 | PREB | PREB | PREB | 5497 | 0.031 | 0.38 | NO |
| 50 | TSG101 | TSG101 | TSG101 | 5529 | 0.03 | 0.38 | NO |
| 51 | SEC13 | SEC13 | SEC13 | 5655 | 0.028 | 0.37 | NO |
| 52 | TGOLN2 | TGOLN2 | TGOLN2 | 5822 | 0.026 | 0.37 | NO |
| 53 | FTL | FTL | FTL | 5872 | 0.026 | 0.37 | NO |
| 54 | GAK | GAK | GAK | 6036 | 0.023 | 0.36 | NO |
| 55 | VPS25 | VPS25 | VPS25 | 6047 | 0.023 | 0.36 | NO |
| 56 | FTH1 | FTH1 | FTH1 | 6127 | 0.022 | 0.36 | NO |
| 57 | BLOC1S3 | BLOC1S3 | BLOC1S3 | 6270 | 0.02 | 0.36 | NO |
| 58 | CHMP2A | CHMP2A | CHMP2A | 6355 | 0.019 | 0.36 | NO |
| 59 | COPB1 | COPB1 | COPB1 | 6389 | 0.018 | 0.36 | NO |
| 60 | VPS37A | VPS37A | VPS37A | 6553 | 0.016 | 0.35 | NO |
| 61 | CHMP7 | CHMP7 | CHMP7 | 6601 | 0.016 | 0.35 | NO |
| 62 | SEC24B | SEC24B | SEC24B | 6714 | 0.015 | 0.34 | NO |
| 63 | AP1G1 | AP1G1 | AP1G1 | 6788 | 0.014 | 0.34 | NO |
| 64 | OCRL | OCRL | OCRL | 6801 | 0.014 | 0.34 | NO |
| 65 | VPS36 | VPS36 | VPS36 | 6834 | 0.013 | 0.34 | NO |
| 66 | COPE | COPE | COPE | 6860 | 0.013 | 0.34 | NO |
| 67 | DNM2 | DNM2 | DNM2 | 6888 | 0.012 | 0.34 | NO |
| 68 | ARCN1 | ARCN1 | ARCN1 | 6922 | 0.012 | 0.34 | NO |
| 69 | UBA52 | UBA52 | UBA52 | 6969 | 0.012 | 0.34 | NO |
| 70 | RAB5C | RAB5C | RAB5C | 6991 | 0.011 | 0.34 | NO |
| 71 | VPS4A | VPS4A | VPS4A | 7141 | 0.0096 | 0.33 | NO |
| 72 | VAMP7 | VAMP7 | VAMP7 | 7219 | 0.0086 | 0.33 | NO |
| 73 | SAR1B | SAR1B | SAR1B | 7347 | 0.007 | 0.32 | NO |
| 74 | GNS | GNS | GNS | 7412 | 0.0063 | 0.32 | NO |
| 75 | SEC31A | SEC31A | SEC31A | 7436 | 0.006 | 0.32 | NO |
| 76 | STAM2 | STAM2 | STAM2 | 7455 | 0.0058 | 0.32 | NO |
| 77 | CLTA | CLTA | CLTA | 7506 | 0.0051 | 0.32 | NO |
| 78 | ARF1 | ARF1 | ARF1 | 7605 | 0.0039 | 0.31 | NO |
| 79 | SH3D19 | SH3D19 | SH3D19 | 7634 | 0.0036 | 0.31 | NO |
| 80 | CLTC | CLTC | CLTC | 7783 | 0.0016 | 0.3 | NO |
| 81 | COPA | COPA | COPA | 7841 | 0.001 | 0.3 | NO |
| 82 | IGF2R | IGF2R | IGF2R | 7948 | -0.00026 | 0.3 | NO |
| 83 | CHMP4B | CHMP4B | CHMP4B | 7971 | -0.00057 | 0.29 | NO |
| 84 | CLTCL1 | CLTCL1 | CLTCL1 | 7975 | -0.0006 | 0.29 | NO |
| 85 | STX4 | STX4 | STX4 | 7998 | -0.00092 | 0.29 | NO |
| 86 | GJA5 | GJA5 | GJA5 | 8210 | -0.0037 | 0.28 | NO |
| 87 | SEC24C | SEC24C | SEC24C | 8516 | -0.0077 | 0.27 | NO |
| 88 | TXNDC5 | TXNDC5 | TXNDC5 | 8683 | -0.0098 | 0.26 | NO |
| 89 | AP1B1 | AP1B1 | AP1B1 | 8717 | -0.01 | 0.26 | NO |
| 90 | CHMP4A | CHMP4A | CHMP4A | 8768 | -0.011 | 0.26 | NO |
| 91 | SNX2 | SNX2 | SNX2 | 8811 | -0.011 | 0.26 | NO |
| 92 | SEC24D | SEC24D | SEC24D | 8897 | -0.012 | 0.25 | NO |
| 93 | ARFGAP1 | ARFGAP1 | ARFGAP1 | 9267 | -0.017 | 0.23 | NO |
| 94 | GJD4 | GJD4 | GJD4 | 9291 | -0.018 | 0.24 | NO |
| 95 | VPS28 | VPS28 | VPS28 | 9381 | -0.019 | 0.23 | NO |
| 96 | SNX5 | SNX5 | SNX5 | 9424 | -0.02 | 0.23 | NO |
| 97 | PUM1 | PUM1 | PUM1 | 9746 | -0.024 | 0.22 | NO |
| 98 | GJB7 | GJB7 | GJB7 | 9778 | -0.024 | 0.22 | NO |
| 99 | PIK3C2A | PIK3C2A | PIK3C2A | 9798 | -0.025 | 0.22 | NO |
| 100 | TPD52 | TPD52 | TPD52 | 9808 | -0.025 | 0.22 | NO |
| 101 | VPS37C | VPS37C | VPS37C | 9816 | -0.025 | 0.23 | NO |
| 102 | NAPA | NAPA | NAPA | 9845 | -0.026 | 0.23 | NO |
| 103 | DNASE2 | DNASE2 | DNASE2 | 10054 | -0.029 | 0.22 | NO |
| 104 | AP1M1 | AP1M1 | AP1M1 | 10546 | -0.036 | 0.2 | NO |
| 105 | AP1M2 | AP1M2 | AP1M2 | 10707 | -0.038 | 0.19 | NO |
| 106 | VAMP8 | VAMP8 | VAMP8 | 11355 | -0.048 | 0.16 | NO |
| 107 | HIP1R | HIP1R | HIP1R | 11437 | -0.049 | 0.16 | NO |
| 108 | SNAPIN | SNAPIN | SNAPIN | 11621 | -0.052 | 0.16 | NO |
| 109 | CTSZ | CTSZ | CTSZ | 11695 | -0.054 | 0.16 | NO |
| 110 | AP1S2 | AP1S2 | AP1S2 | 12074 | -0.06 | 0.15 | NO |
| 111 | GJA4 | GJA4 | GJA4 | 12075 | -0.06 | 0.16 | NO |
| 112 | CHMP6 | CHMP6 | CHMP6 | 12195 | -0.062 | 0.16 | NO |
| 113 | TBC1D8B | TBC1D8B | TBC1D8B | 12694 | -0.073 | 0.14 | NO |
| 114 | AP4B1 | AP4B1 | AP4B1 | 12781 | -0.075 | 0.14 | NO |
| 115 | VAMP2 | VAMP2 | VAMP2 | 13697 | -0.097 | 0.1 | NO |
| 116 | GJB1 | GJB1 | GJB1 | 13975 | -0.1 | 0.1 | NO |
| 117 | DNAJC6 | DNAJC6 | DNAJC6 | 14121 | -0.11 | 0.11 | NO |
| 118 | SORT1 | SORT1 | SORT1 | 14213 | -0.11 | 0.12 | NO |
| 119 | DTNBP1 | DTNBP1 | DTNBP1 | 14435 | -0.12 | 0.12 | NO |
| 120 | SH3GL2 | SH3GL2 | SH3GL2 | 14842 | -0.13 | 0.11 | NO |
| 121 | MYO6 | MYO6 | MYO6 | 15025 | -0.14 | 0.12 | NO |
| 122 | ARRB1 | ARRB1 | ARRB1 | 16891 | -0.24 | 0.045 | NO |
| 123 | VPS37D | VPS37D | VPS37D | 17190 | -0.27 | 0.061 | NO |
Figure S45. Get High-res Image This plot shows mRNAseq_cNMF expression data heatmap (on the left) a RunningEnrichmentScore(RES) plot (on the top right) and a Signal2Noise(S2N) plot (on the bottom right) of genes in the pathway: KEGG PROTEASOME.
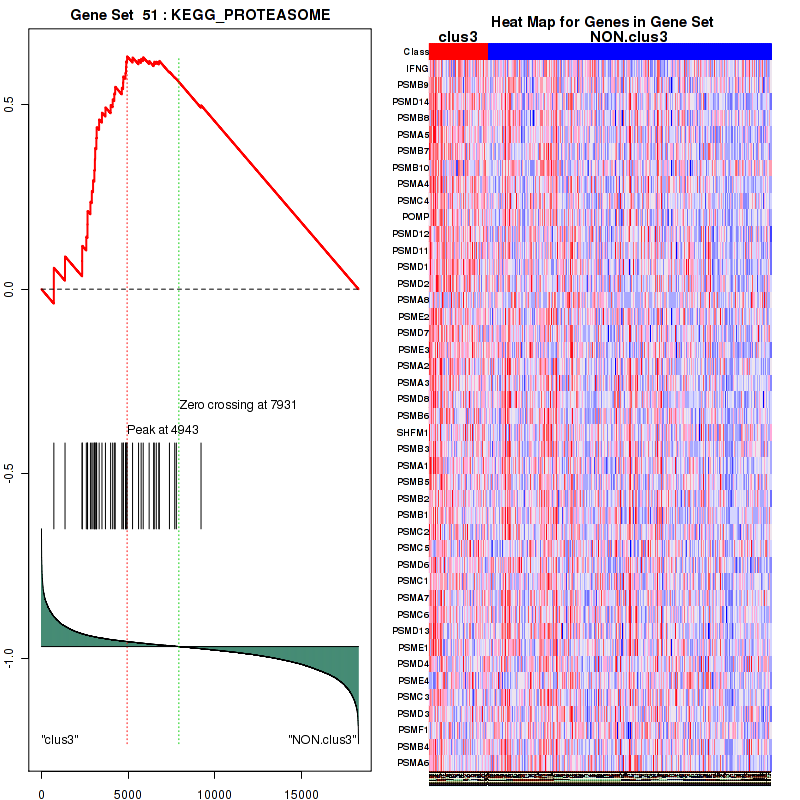
Figure S46. Get High-res Image For the top 5 core enriched genes in the pathway: KEGG PROTEASOME, this volcano plot shows how much they are up/down-regulated and significant. The significance was calculated by empirical bayesian fit
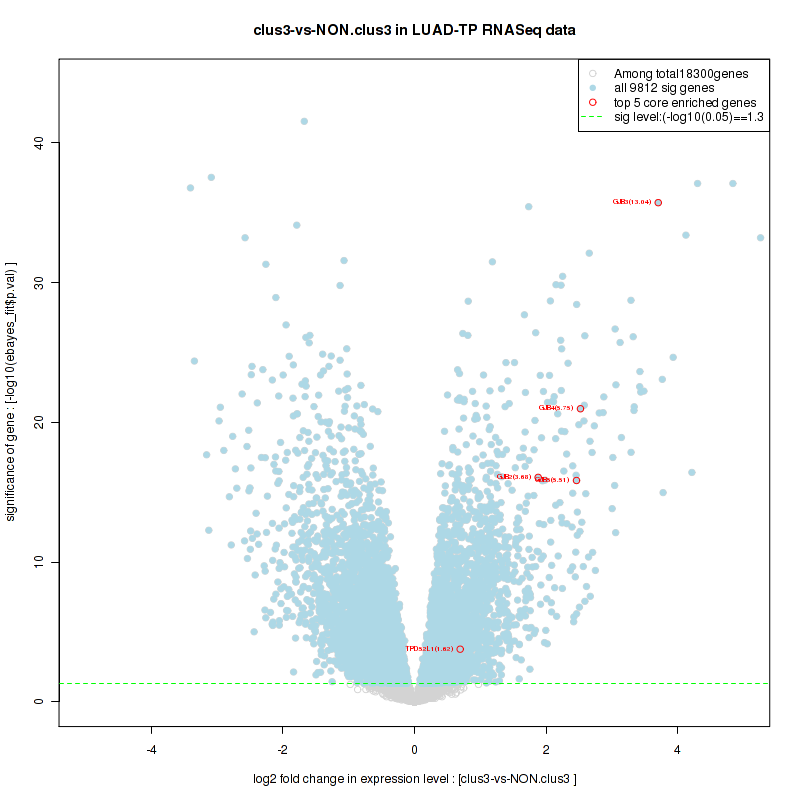
Table S24. Get Full Table This table shows a Running Enrichment Score (RES) of each gene in this pathway, that is, the enrichment score at this point in the ranked list of genes. All genes are ranked by Signal-to-Noise (S2N), a measure of similarity as default and are used to obtain ES matrix of all genes. In this way, GSEA tool uses expression pattern of not only overlapped genes but also not-overlapped genes to produce ES matrix.
| Rank | GENE | SYMBOL | DESC | LIST.LOC | S2N | RES | CORE_ENRICHMENT |
|---|---|---|---|---|---|---|---|
| 1 | PSMB9 | PSMB9 | PSMB9 | 1360 | 0.16 | -0.039 | YES |
| 2 | TRIB3 | TRIB3 | TRIB3 | 1611 | 0.14 | -0.022 | YES |
| 3 | PSMD14 | PSMD14 | PSMD14 | 2349 | 0.1 | -0.04 | YES |
| 4 | PSMB8 | PSMB8 | PSMB8 | 2351 | 0.1 | -0.018 | YES |
| 5 | CARD11 | CARD11 | CARD11 | 2367 | 0.099 | 0.003 | YES |
| 6 | CASP9 | CASP9 | CASP9 | 2429 | 0.097 | 0.021 | YES |
| 7 | PSMA5 | PSMA5 | PSMA5 | 2588 | 0.091 | 0.033 | YES |
| 8 | CDKN1A | CDKN1A | CDKN1A | 2656 | 0.088 | 0.049 | YES |
| 9 | PSMB7 | PSMB7 | PSMB7 | 2657 | 0.088 | 0.068 | YES |
| 10 | PSMB10 | PSMB10 | PSMB10 | 2660 | 0.088 | 0.088 | YES |
| 11 | AKT1S1 | AKT1S1 | AKT1S1 | 2782 | 0.084 | 0.1 | YES |
| 12 | PSMA4 | PSMA4 | PSMA4 | 2827 | 0.083 | 0.12 | YES |
| 13 | PSMC4 | PSMC4 | PSMC4 | 2908 | 0.081 | 0.13 | YES |
| 14 | PSMD12 | PSMD12 | PSMD12 | 3054 | 0.076 | 0.14 | YES |
| 15 | PSMD11 | PSMD11 | PSMD11 | 3083 | 0.076 | 0.15 | YES |
| 16 | PSMD1 | PSMD1 | PSMD1 | 3100 | 0.075 | 0.17 | YES |
| 17 | PSMD2 | PSMD2 | PSMD2 | 3170 | 0.073 | 0.18 | YES |
| 18 | PSMA8 | PSMA8 | PSMA8 | 3186 | 0.073 | 0.2 | YES |
| 19 | NRAS | NRAS | NRAS | 3302 | 0.07 | 0.21 | YES |
| 20 | PSME2 | PSME2 | PSME2 | 3329 | 0.069 | 0.22 | YES |
| 21 | PSMD9 | PSMD9 | PSMD9 | 3448 | 0.067 | 0.23 | YES |
| 22 | BCL10 | BCL10 | BCL10 | 3479 | 0.066 | 0.24 | YES |
| 23 | PSMD7 | PSMD7 | PSMD7 | 3492 | 0.066 | 0.26 | YES |
| 24 | FOXO1 | FOXO1 | FOXO1 | 3617 | 0.063 | 0.26 | YES |
| 25 | MDM2 | MDM2 | MDM2 | 3671 | 0.062 | 0.27 | YES |
| 26 | NFKBIB | NFKBIB | NFKBIB | 3681 | 0.061 | 0.29 | YES |
| 27 | KRAS | KRAS | KRAS | 3750 | 0.06 | 0.3 | YES |
| 28 | PSMA2 | PSMA2 | PSMA2 | 3993 | 0.055 | 0.3 | YES |
| 29 | MAP3K7 | MAP3K7 | MAP3K7 | 4070 | 0.053 | 0.3 | YES |
| 30 | NFKBIE | NFKBIE | NFKBIE | 4096 | 0.053 | 0.31 | YES |
| 31 | PSMA3 | PSMA3 | PSMA3 | 4111 | 0.052 | 0.32 | YES |
| 32 | GSK3A | GSK3A | GSK3A | 4142 | 0.052 | 0.33 | YES |
| 33 | PSMD8 | PSMD8 | PSMD8 | 4205 | 0.051 | 0.34 | YES |
| 34 | PSMB6 | PSMB6 | PSMB6 | 4256 | 0.05 | 0.35 | YES |
| 35 | CHUK | CHUK | CHUK | 4388 | 0.048 | 0.35 | YES |
| 36 | PSMB3 | PSMB3 | PSMB3 | 4713 | 0.043 | 0.34 | YES |
| 37 | PSMA1 | PSMA1 | PSMA1 | 4724 | 0.043 | 0.35 | YES |
| 38 | PSMB5 | PSMB5 | PSMB5 | 4849 | 0.04 | 0.36 | YES |
| 39 | PSMB2 | PSMB2 | PSMB2 | 4879 | 0.04 | 0.36 | YES |
| 40 | PSMB1 | PSMB1 | PSMB1 | 4892 | 0.04 | 0.37 | YES |
| 41 | PSMC2 | PSMC2 | PSMC2 | 4943 | 0.039 | 0.38 | YES |
| 42 | HRAS | HRAS | HRAS | 4997 | 0.038 | 0.38 | YES |
| 43 | PSMC5 | PSMC5 | PSMC5 | 5259 | 0.034 | 0.38 | YES |
| 44 | RPS27A | RPS27A | RPS27A | 5329 | 0.033 | 0.38 | YES |
| 45 | AKT3 | AKT3 | AKT3 | 5490 | 0.031 | 0.38 | YES |
| 46 | PSMD6 | PSMD6 | PSMD6 | 5603 | 0.029 | 0.38 | YES |
| 47 | PTEN | PTEN | PTEN | 5631 | 0.029 | 0.38 | YES |
| 48 | AKT2 | AKT2 | AKT2 | 5639 | 0.029 | 0.39 | YES |
| 49 | PSMC1 | PSMC1 | PSMC1 | 5752 | 0.027 | 0.39 | NO |
| 50 | PSMA7 | PSMA7 | PSMA7 | 5871 | 0.026 | 0.39 | NO |
| 51 | PSMC6 | PSMC6 | PSMC6 | 6214 | 0.021 | 0.37 | NO |
| 52 | RELA | RELA | RELA | 6435 | 0.018 | 0.37 | NO |
| 53 | PSMD13 | PSMD13 | PSMD13 | 6478 | 0.017 | 0.37 | NO |
| 54 | PSME1 | PSME1 | PSME1 | 6509 | 0.017 | 0.37 | NO |
| 55 | PSMD4 | PSMD4 | PSMD4 | 6627 | 0.016 | 0.37 | NO |
| 56 | BTRC | BTRC | BTRC | 6657 | 0.015 | 0.37 | NO |
| 57 | RICTOR | RICTOR | RICTOR | 6673 | 0.015 | 0.37 | NO |
| 58 | CUL1 | CUL1 | CUL1 | 6690 | 0.015 | 0.37 | NO |
| 59 | PSME4 | PSME4 | PSME4 | 6775 | 0.014 | 0.37 | NO |
| 60 | PSMC3 | PSMC3 | PSMC3 | 6800 | 0.014 | 0.37 | NO |
| 61 | MAPKAP1 | MAPKAP1 | MAPKAP1 | 6820 | 0.013 | 0.38 | NO |
| 62 | RASGRP3 | RASGRP3 | RASGRP3 | 6950 | 0.012 | 0.37 | NO |
| 63 | UBA52 | UBA52 | UBA52 | 6969 | 0.012 | 0.37 | NO |
| 64 | MLST8 | MLST8 | MLST8 | 7169 | 0.0092 | 0.36 | NO |
| 65 | CDKN1B | CDKN1B | CDKN1B | 7228 | 0.0084 | 0.36 | NO |
| 66 | PSMD5 | PSMD5 | PSMD5 | 7246 | 0.0082 | 0.36 | NO |
| 67 | PSMD3 | PSMD3 | PSMD3 | 7386 | 0.0066 | 0.36 | NO |
| 68 | SKP1 | SKP1 | SKP1 | 7573 | 0.0043 | 0.35 | NO |
| 69 | PSMF1 | PSMF1 | PSMF1 | 7692 | 0.0029 | 0.34 | NO |
| 70 | PSMB4 | PSMB4 | PSMB4 | 7784 | 0.0016 | 0.34 | NO |
| 71 | MTOR | MTOR | MTOR | 7912 | 0.0002 | 0.33 | NO |
| 72 | PSMD10 | PSMD10 | PSMD10 | 8017 | -0.0012 | 0.32 | NO |
| 73 | IKBKG | IKBKG | IKBKG | 8114 | -0.0026 | 0.32 | NO |
| 74 | THEM4 | THEM4 | THEM4 | 8849 | -0.012 | 0.28 | NO |
| 75 | FOXO3 | FOXO3 | FOXO3 | 8916 | -0.013 | 0.28 | NO |
| 76 | PSMA6 | PSMA6 | PSMA6 | 9209 | -0.017 | 0.27 | NO |
| 77 | RASGRP1 | RASGRP1 | RASGRP1 | 9358 | -0.019 | 0.27 | NO |
| 78 | MALT1 | MALT1 | MALT1 | 9382 | -0.019 | 0.27 | NO |
| 79 | RPS6KB2 | RPS6KB2 | RPS6KB2 | 9642 | -0.023 | 0.26 | NO |
| 80 | CREB1 | CREB1 | CREB1 | 10145 | -0.03 | 0.24 | NO |
| 81 | AKT1 | AKT1 | AKT1 | 10169 | -0.03 | 0.24 | NO |
| 82 | NR4A1 | NR4A1 | NR4A1 | 10867 | -0.04 | 0.22 | NO |
| 83 | FBXW11 | FBXW11 | FBXW11 | 10922 | -0.041 | 0.22 | NO |
| 84 | PDPK1 | PDPK1 | PDPK1 | 11876 | -0.057 | 0.18 | NO |
| 85 | PHLPP1 | PHLPP1 | PHLPP1 | 12305 | -0.065 | 0.17 | NO |
| 86 | BAD | BAD | BAD | 13007 | -0.08 | 0.15 | NO |
| 87 | FOXO4 | FOXO4 | FOXO4 | 13016 | -0.08 | 0.17 | NO |
| 88 | NFKBIA | NFKBIA | NFKBIA | 13256 | -0.086 | 0.17 | NO |
| 89 | TSC2 | TSC2 | TSC2 | 13268 | -0.086 | 0.19 | NO |
| 90 | PRKCB | PRKCB | PRKCB | 13990 | -0.11 | 0.18 | NO |
| 91 | IKBKB | IKBKB | IKBKB | 14811 | -0.13 | 0.16 | NO |
| 92 | REL | REL | REL | 14984 | -0.14 | 0.18 | NO |
Figure S47. Get High-res Image This plot shows mRNAseq_cNMF expression data heatmap (on the left) a RunningEnrichmentScore(RES) plot (on the top right) and a Signal2Noise(S2N) plot (on the bottom right) of genes in the pathway: KEGG NUCLEOTIDE EXCISION REPAIR.
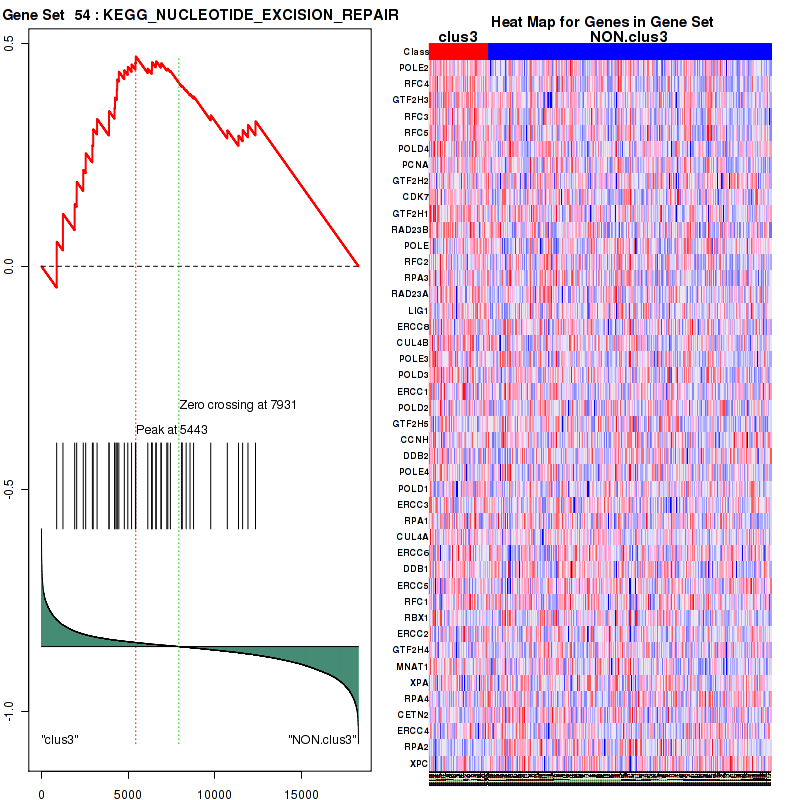
Figure S48. Get High-res Image For the top 5 core enriched genes in the pathway: KEGG NUCLEOTIDE EXCISION REPAIR, this volcano plot shows how much they are up/down-regulated and significant. The significance was calculated by empirical bayesian fit

Table S25. Get Full Table This table shows a Running Enrichment Score (RES) of each gene in this pathway, that is, the enrichment score at this point in the ranked list of genes. All genes are ranked by Signal-to-Noise (S2N), a measure of similarity as default and are used to obtain ES matrix of all genes. In this way, GSEA tool uses expression pattern of not only overlapped genes but also not-overlapped genes to produce ES matrix.
| Rank | GENE | SYMBOL | DESC | LIST.LOC | S2N | RES | CORE_ENRICHMENT |
|---|---|---|---|---|---|---|---|
| 1 | CCNA2 | CCNA2 | CCNA2 | 310 | 0.34 | 0.065 | YES |
| 2 | CDC6 | CDC6 | CDC6 | 371 | 0.31 | 0.14 | YES |
| 3 | CDT1 | CDT1 | CDT1 | 714 | 0.23 | 0.18 | YES |
| 4 | PSMB9 | PSMB9 | PSMB9 | 1360 | 0.16 | 0.18 | YES |
| 5 | MCM4 | MCM4 | MCM4 | 1573 | 0.14 | 0.2 | YES |
| 6 | CCNA1 | CCNA1 | CCNA1 | 1651 | 0.14 | 0.23 | YES |
| 7 | MCM8 | MCM8 | MCM8 | 2077 | 0.11 | 0.24 | YES |
| 8 | CDK2 | CDK2 | CDK2 | 2140 | 0.11 | 0.26 | YES |
| 9 | MCM2 | MCM2 | MCM2 | 2276 | 0.1 | 0.28 | YES |
| 10 | MCM6 | MCM6 | MCM6 | 2283 | 0.1 | 0.3 | YES |
| 11 | PSMD14 | PSMD14 | PSMD14 | 2349 | 0.1 | 0.32 | YES |
| 12 | PSMB8 | PSMB8 | PSMB8 | 2351 | 0.1 | 0.35 | YES |
| 13 | PSMA5 | PSMA5 | PSMA5 | 2588 | 0.091 | 0.36 | YES |
| 14 | CDKN1A | CDKN1A | CDKN1A | 2656 | 0.088 | 0.38 | YES |
| 15 | PSMB7 | PSMB7 | PSMB7 | 2657 | 0.088 | 0.4 | YES |
| 16 | PSMB10 | PSMB10 | PSMB10 | 2660 | 0.088 | 0.42 | YES |
| 17 | PSMA4 | PSMA4 | PSMA4 | 2827 | 0.083 | 0.43 | YES |
| 18 | MCM5 | MCM5 | MCM5 | 2839 | 0.083 | 0.45 | YES |
| 19 | MCM7 | MCM7 | MCM7 | 2866 | 0.082 | 0.47 | YES |
| 20 | PSMC4 | PSMC4 | PSMC4 | 2908 | 0.081 | 0.49 | YES |
| 21 | PSMD12 | PSMD12 | PSMD12 | 3054 | 0.076 | 0.5 | YES |
| 22 | PSMD11 | PSMD11 | PSMD11 | 3083 | 0.076 | 0.51 | YES |
| 23 | PSMD1 | PSMD1 | PSMD1 | 3100 | 0.075 | 0.53 | YES |
| 24 | RB1 | RB1 | RB1 | 3126 | 0.074 | 0.55 | YES |
| 25 | PSMD2 | PSMD2 | PSMD2 | 3170 | 0.073 | 0.56 | YES |
| 26 | PSMA8 | PSMA8 | PSMA8 | 3186 | 0.073 | 0.58 | YES |
| 27 | PSME2 | PSME2 | PSME2 | 3329 | 0.069 | 0.59 | YES |
| 28 | PSMD9 | PSMD9 | PSMD9 | 3448 | 0.067 | 0.6 | YES |
| 29 | PSMD7 | PSMD7 | PSMD7 | 3492 | 0.066 | 0.61 | YES |
| 30 | PSMA2 | PSMA2 | PSMA2 | 3993 | 0.055 | 0.6 | YES |
| 31 | PSMA3 | PSMA3 | PSMA3 | 4111 | 0.052 | 0.61 | YES |
| 32 | PSMD8 | PSMD8 | PSMD8 | 4205 | 0.051 | 0.61 | YES |
| 33 | PSMB6 | PSMB6 | PSMB6 | 4256 | 0.05 | 0.62 | YES |
| 34 | MCM3 | MCM3 | MCM3 | 4452 | 0.047 | 0.62 | YES |
| 35 | PSMB3 | PSMB3 | PSMB3 | 4713 | 0.043 | 0.62 | YES |
| 36 | PSMA1 | PSMA1 | PSMA1 | 4724 | 0.043 | 0.63 | YES |
| 37 | PSMB5 | PSMB5 | PSMB5 | 4849 | 0.04 | 0.63 | YES |
| 38 | PSMB2 | PSMB2 | PSMB2 | 4879 | 0.04 | 0.64 | YES |
| 39 | PSMB1 | PSMB1 | PSMB1 | 4892 | 0.04 | 0.65 | YES |
| 40 | PSMC2 | PSMC2 | PSMC2 | 4943 | 0.039 | 0.66 | YES |
| 41 | PSMC5 | PSMC5 | PSMC5 | 5259 | 0.034 | 0.65 | NO |
| 42 | RPS27A | RPS27A | RPS27A | 5329 | 0.033 | 0.65 | NO |
| 43 | PSMD6 | PSMD6 | PSMD6 | 5603 | 0.029 | 0.64 | NO |
| 44 | PSMC1 | PSMC1 | PSMC1 | 5752 | 0.027 | 0.64 | NO |
| 45 | PSMA7 | PSMA7 | PSMA7 | 5871 | 0.026 | 0.64 | NO |
| 46 | PSMC6 | PSMC6 | PSMC6 | 6214 | 0.021 | 0.63 | NO |
| 47 | PSMD13 | PSMD13 | PSMD13 | 6478 | 0.017 | 0.62 | NO |
| 48 | PSME1 | PSME1 | PSME1 | 6509 | 0.017 | 0.62 | NO |
| 49 | PSMD4 | PSMD4 | PSMD4 | 6627 | 0.016 | 0.62 | NO |
| 50 | PSME4 | PSME4 | PSME4 | 6775 | 0.014 | 0.61 | NO |
| 51 | PSMC3 | PSMC3 | PSMC3 | 6800 | 0.014 | 0.62 | NO |
| 52 | UBA52 | UBA52 | UBA52 | 6969 | 0.012 | 0.61 | NO |
| 53 | CDKN1B | CDKN1B | CDKN1B | 7228 | 0.0084 | 0.6 | NO |
| 54 | PSMD5 | PSMD5 | PSMD5 | 7246 | 0.0082 | 0.6 | NO |
| 55 | PSMD3 | PSMD3 | PSMD3 | 7386 | 0.0066 | 0.59 | NO |
| 56 | PSMF1 | PSMF1 | PSMF1 | 7692 | 0.0029 | 0.58 | NO |
| 57 | PSMB4 | PSMB4 | PSMB4 | 7784 | 0.0016 | 0.57 | NO |
| 58 | PSMD10 | PSMD10 | PSMD10 | 8017 | -0.0012 | 0.56 | NO |
| 59 | PSMA6 | PSMA6 | PSMA6 | 9209 | -0.017 | 0.5 | NO |
Figure S49. Get High-res Image This plot shows mRNAseq_cNMF expression data heatmap (on the left) a RunningEnrichmentScore(RES) plot (on the top right) and a Signal2Noise(S2N) plot (on the bottom right) of genes in the pathway: KEGG CELL CYCLE.
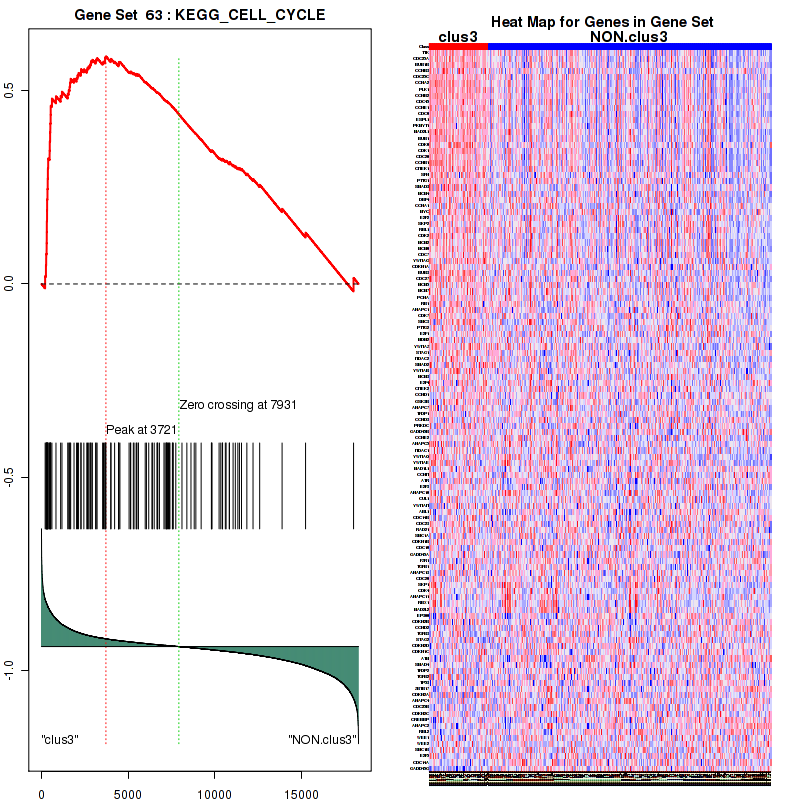
Figure S50. Get High-res Image For the top 5 core enriched genes in the pathway: KEGG CELL CYCLE, this volcano plot shows how much they are up/down-regulated and significant. The significance was calculated by empirical bayesian fit
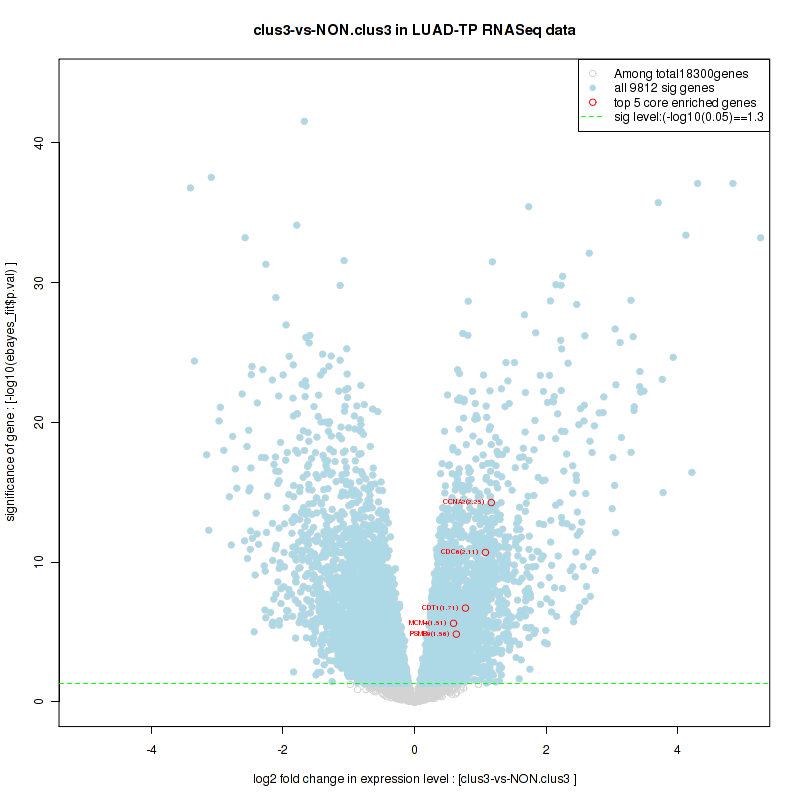
Table S26. Get Full Table This table shows a Running Enrichment Score (RES) of each gene in this pathway, that is, the enrichment score at this point in the ranked list of genes. All genes are ranked by Signal-to-Noise (S2N), a measure of similarity as default and are used to obtain ES matrix of all genes. In this way, GSEA tool uses expression pattern of not only overlapped genes but also not-overlapped genes to produce ES matrix.
| Rank | GENE | SYMBOL | DESC | LIST.LOC | S2N | RES | CORE_ENRICHMENT |
|---|---|---|---|---|---|---|---|
| 1 | TAP1 | TAP1 | TAP1 | 1184 | 0.17 | -0.0073 | YES |
| 2 | TAP2 | TAP2 | TAP2 | 1331 | 0.16 | 0.038 | YES |
| 3 | PSMB9 | PSMB9 | PSMB9 | 1360 | 0.16 | 0.09 | YES |
| 4 | HLA-G | HLA-G | HLA-G | 1789 | 0.13 | 0.11 | YES |
| 5 | PSMD14 | PSMD14 | PSMD14 | 2349 | 0.1 | 0.11 | YES |
| 6 | PSMB8 | PSMB8 | PSMB8 | 2351 | 0.1 | 0.14 | YES |
| 7 | PSMA5 | PSMA5 | PSMA5 | 2588 | 0.091 | 0.16 | YES |
| 8 | PSMB7 | PSMB7 | PSMB7 | 2657 | 0.088 | 0.19 | YES |
| 9 | PSMB10 | PSMB10 | PSMB10 | 2660 | 0.088 | 0.22 | YES |
| 10 | PSMA4 | PSMA4 | PSMA4 | 2827 | 0.083 | 0.24 | YES |
| 11 | HLA-F | HLA-F | HLA-F | 2874 | 0.082 | 0.26 | YES |
| 12 | PSMC4 | PSMC4 | PSMC4 | 2908 | 0.081 | 0.29 | YES |
| 13 | PSMD12 | PSMD12 | PSMD12 | 3054 | 0.076 | 0.3 | YES |
| 14 | PSMD11 | PSMD11 | PSMD11 | 3083 | 0.076 | 0.33 | YES |
| 15 | PSMD1 | PSMD1 | PSMD1 | 3100 | 0.075 | 0.35 | YES |
| 16 | PSMD2 | PSMD2 | PSMD2 | 3170 | 0.073 | 0.37 | YES |
| 17 | PSMA8 | PSMA8 | PSMA8 | 3186 | 0.073 | 0.4 | YES |
| 18 | PSME2 | PSME2 | PSME2 | 3329 | 0.069 | 0.41 | YES |
| 19 | PSMD9 | PSMD9 | PSMD9 | 3448 | 0.067 | 0.43 | YES |
| 20 | PSMD7 | PSMD7 | PSMD7 | 3492 | 0.066 | 0.45 | YES |
| 21 | SEC61G | SEC61G | SEC61G | 3577 | 0.064 | 0.46 | YES |
| 22 | B2M | B2M | B2M | 3696 | 0.061 | 0.48 | YES |
| 23 | PSMA2 | PSMA2 | PSMA2 | 3993 | 0.055 | 0.48 | YES |
| 24 | PSMA3 | PSMA3 | PSMA3 | 4111 | 0.052 | 0.49 | YES |
| 25 | PSMD8 | PSMD8 | PSMD8 | 4205 | 0.051 | 0.5 | YES |
| 26 | PSMB6 | PSMB6 | PSMB6 | 4256 | 0.05 | 0.52 | YES |
| 27 | PSMB3 | PSMB3 | PSMB3 | 4713 | 0.043 | 0.5 | YES |
| 28 | PSMA1 | PSMA1 | PSMA1 | 4724 | 0.043 | 0.52 | YES |
| 29 | PSMB5 | PSMB5 | PSMB5 | 4849 | 0.04 | 0.52 | YES |
| 30 | PSMB2 | PSMB2 | PSMB2 | 4879 | 0.04 | 0.54 | YES |
| 31 | PSMB1 | PSMB1 | PSMB1 | 4892 | 0.04 | 0.55 | YES |
| 32 | SEC61A1 | SEC61A1 | SEC61A1 | 4927 | 0.039 | 0.56 | YES |
| 33 | PSMC2 | PSMC2 | PSMC2 | 4943 | 0.039 | 0.57 | YES |
| 34 | PDIA3 | PDIA3 | PDIA3 | 4954 | 0.039 | 0.58 | YES |
| 35 | HLA-B | HLA-B | HLA-B | 5122 | 0.036 | 0.59 | YES |
| 36 | SEC61B | SEC61B | SEC61B | 5226 | 0.035 | 0.59 | YES |
| 37 | PSMC5 | PSMC5 | PSMC5 | 5259 | 0.034 | 0.6 | YES |
| 38 | HLA-A | HLA-A | HLA-A | 5303 | 0.034 | 0.61 | YES |
| 39 | RPS27A | RPS27A | RPS27A | 5329 | 0.033 | 0.62 | YES |
| 40 | PSMD6 | PSMD6 | PSMD6 | 5603 | 0.029 | 0.62 | NO |
| 41 | PSMC1 | PSMC1 | PSMC1 | 5752 | 0.027 | 0.62 | NO |
| 42 | PSMA7 | PSMA7 | PSMA7 | 5871 | 0.026 | 0.62 | NO |
| 43 | HLA-C | HLA-C | HLA-C | 5985 | 0.024 | 0.62 | NO |
| 44 | PSMC6 | PSMC6 | PSMC6 | 6214 | 0.021 | 0.62 | NO |
| 45 | PSMD13 | PSMD13 | PSMD13 | 6478 | 0.017 | 0.61 | NO |
| 46 | PSME1 | PSME1 | PSME1 | 6509 | 0.017 | 0.61 | NO |
| 47 | PSMD4 | PSMD4 | PSMD4 | 6627 | 0.016 | 0.61 | NO |
| 48 | PSME4 | PSME4 | PSME4 | 6775 | 0.014 | 0.61 | NO |
| 49 | PSMC3 | PSMC3 | PSMC3 | 6800 | 0.014 | 0.61 | NO |
| 50 | UBA52 | UBA52 | UBA52 | 6969 | 0.012 | 0.6 | NO |
| 51 | PSMD5 | PSMD5 | PSMD5 | 7246 | 0.0082 | 0.59 | NO |
| 52 | PSMD3 | PSMD3 | PSMD3 | 7386 | 0.0066 | 0.59 | NO |
| 53 | PSMF1 | PSMF1 | PSMF1 | 7692 | 0.0029 | 0.57 | NO |
| 54 | PSMB4 | PSMB4 | PSMB4 | 7784 | 0.0016 | 0.57 | NO |
| 55 | PSMD10 | PSMD10 | PSMD10 | 8017 | -0.0012 | 0.55 | NO |
| 56 | CALR | CALR | CALR | 8124 | -0.0028 | 0.55 | NO |
| 57 | SEC61A2 | SEC61A2 | SEC61A2 | 8638 | -0.0093 | 0.52 | NO |
| 58 | PSMA6 | PSMA6 | PSMA6 | 9209 | -0.017 | 0.5 | NO |
Figure S51. Get High-res Image This plot shows mRNAseq_cNMF expression data heatmap (on the left) a RunningEnrichmentScore(RES) plot (on the top right) and a Signal2Noise(S2N) plot (on the bottom right) of genes in the pathway: KEGG P53 SIGNALING PATHWAY.
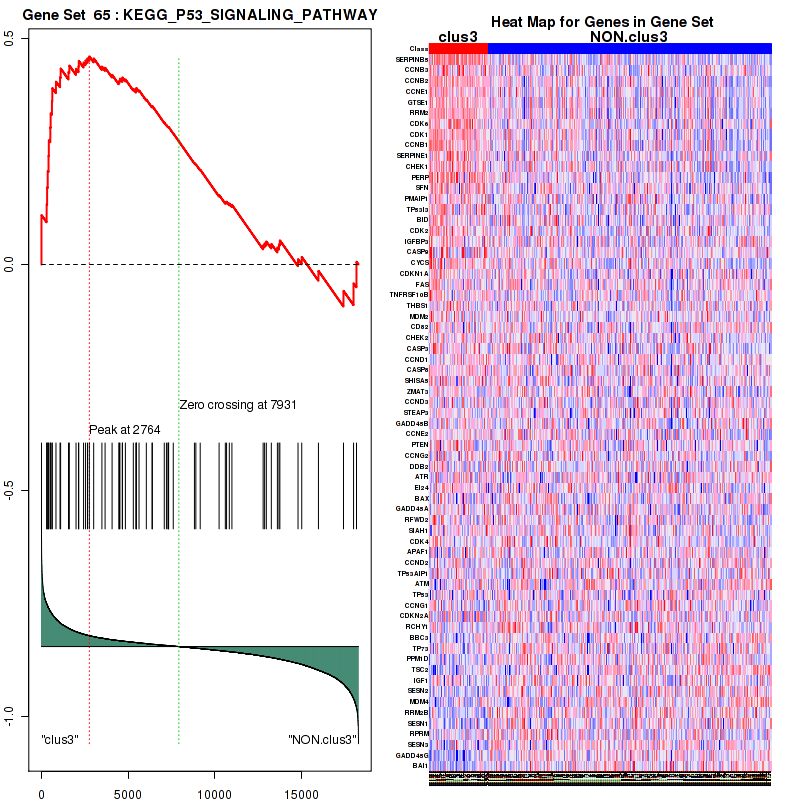
Figure S52. Get High-res Image For the top 5 core enriched genes in the pathway: KEGG P53 SIGNALING PATHWAY, this volcano plot shows how much they are up/down-regulated and significant. The significance was calculated by empirical bayesian fit

Table S27. Get Full Table This table shows a Running Enrichment Score (RES) of each gene in this pathway, that is, the enrichment score at this point in the ranked list of genes. All genes are ranked by Signal-to-Noise (S2N), a measure of similarity as default and are used to obtain ES matrix of all genes. In this way, GSEA tool uses expression pattern of not only overlapped genes but also not-overlapped genes to produce ES matrix.
| Rank | GENE | SYMBOL | DESC | LIST.LOC | S2N | RES | CORE_ENRICHMENT |
|---|---|---|---|---|---|---|---|
| 1 | NEDD4 | NEDD4 | NEDD4 | 1036 | 0.19 | 0.0017 | YES |
| 2 | NUP37 | NUP37 | NUP37 | 1297 | 0.16 | 0.038 | YES |
| 3 | KPNA2 | KPNA2 | KPNA2 | 1623 | 0.14 | 0.063 | YES |
| 4 | STAT1 | STAT1 | STAT1 | 1742 | 0.13 | 0.096 | YES |
| 5 | EIF2AK2 | EIF2AK2 | EIF2AK2 | 2159 | 0.11 | 0.11 | YES |
| 6 | ISG15 | ISG15 | ISG15 | 2179 | 0.11 | 0.14 | YES |
| 7 | KPNA4 | KPNA4 | KPNA4 | 2736 | 0.086 | 0.14 | YES |
| 8 | UBE2L6 | UBE2L6 | UBE2L6 | 2741 | 0.086 | 0.16 | YES |
| 9 | MX1 | MX1 | MX1 | 2820 | 0.083 | 0.18 | YES |
| 10 | NUP107 | NUP107 | NUP107 | 2822 | 0.083 | 0.21 | YES |
| 11 | DDX58 | DDX58 | DDX58 | 2890 | 0.081 | 0.23 | YES |
| 12 | EIF4A3 | EIF4A3 | EIF4A3 | 2966 | 0.079 | 0.25 | YES |
| 13 | KPNA3 | KPNA3 | KPNA3 | 3213 | 0.072 | 0.26 | YES |
| 14 | FLNB | FLNB | FLNB | 3288 | 0.07 | 0.28 | YES |
| 15 | KPNA1 | KPNA1 | KPNA1 | 3376 | 0.068 | 0.29 | YES |
| 16 | NUP205 | NUP205 | NUP205 | 3673 | 0.061 | 0.29 | YES |
| 17 | IFIT1 | IFIT1 | IFIT1 | 3866 | 0.057 | 0.3 | YES |
| 18 | KPNB1 | KPNB1 | KPNB1 | 3924 | 0.056 | 0.31 | YES |
| 19 | EIF4G1 | EIF4G1 | EIF4G1 | 3941 | 0.056 | 0.33 | YES |
| 20 | JAK1 | JAK1 | JAK1 | 4043 | 0.054 | 0.34 | YES |
| 21 | NUP54 | NUP54 | NUP54 | 4077 | 0.053 | 0.36 | YES |
| 22 | NUP50 | NUP50 | NUP50 | 4125 | 0.052 | 0.37 | YES |
| 23 | AAAS | AAAS | AAAS | 4185 | 0.051 | 0.38 | YES |
| 24 | EIF4E | EIF4E | EIF4E | 4242 | 0.05 | 0.39 | YES |
| 25 | ARIH1 | ARIH1 | ARIH1 | 4270 | 0.05 | 0.41 | YES |
| 26 | TRIM25 | TRIM25 | TRIM25 | 4311 | 0.049 | 0.42 | YES |
| 27 | NUP62 | NUP62 | NUP62 | 4400 | 0.048 | 0.43 | YES |
| 28 | EIF4A1 | EIF4A1 | EIF4A1 | 4439 | 0.047 | 0.44 | YES |
| 29 | UBE2N | UBE2N | UBE2N | 4464 | 0.047 | 0.46 | YES |
| 30 | NUP35 | NUP35 | NUP35 | 4567 | 0.045 | 0.46 | YES |
| 31 | NUP153 | NUP153 | NUP153 | 4574 | 0.045 | 0.48 | YES |
| 32 | NUP155 | NUP155 | NUP155 | 4778 | 0.042 | 0.48 | YES |
| 33 | NUP93 | NUP93 | NUP93 | 5270 | 0.034 | 0.46 | YES |
| 34 | RPS27A | RPS27A | RPS27A | 5329 | 0.033 | 0.47 | YES |
| 35 | USP18 | USP18 | USP18 | 5339 | 0.033 | 0.48 | YES |
| 36 | HERC5 | HERC5 | HERC5 | 5463 | 0.032 | 0.48 | YES |
| 37 | UBE2E1 | UBE2E1 | UBE2E1 | 5756 | 0.027 | 0.48 | NO |
| 38 | EIF4A2 | EIF4A2 | EIF4A2 | 6027 | 0.023 | 0.47 | NO |
| 39 | EIF4E2 | EIF4E2 | EIF4E2 | 6419 | 0.018 | 0.45 | NO |
| 40 | RAE1 | RAE1 | RAE1 | 6505 | 0.017 | 0.45 | NO |
| 41 | MAPK3 | MAPK3 | MAPK3 | 6757 | 0.014 | 0.44 | NO |
| 42 | NUP85 | NUP85 | NUP85 | 6822 | 0.013 | 0.44 | NO |
| 43 | UBA52 | UBA52 | UBA52 | 6969 | 0.012 | 0.44 | NO |
| 44 | NUP88 | NUP88 | NUP88 | 7032 | 0.011 | 0.44 | NO |
| 45 | EIF4G2 | EIF4G2 | EIF4G2 | 7159 | 0.0093 | 0.43 | NO |
| 46 | EIF4G3 | EIF4G3 | EIF4G3 | 7315 | 0.0074 | 0.43 | NO |
| 47 | SEH1L | SEH1L | SEH1L | 7542 | 0.0047 | 0.42 | NO |
| 48 | NUP43 | NUP43 | NUP43 | 7597 | 0.004 | 0.42 | NO |
| 49 | NUPL1 | NUPL1 | NUPL1 | 7902 | 0.00034 | 0.4 | NO |
| 50 | NUP188 | NUP188 | NUP188 | 8036 | -0.0015 | 0.39 | NO |
| 51 | NUP214 | NUP214 | NUP214 | 8674 | -0.0097 | 0.36 | NO |
| 52 | POM121 | POM121 | POM121 | 8731 | -0.01 | 0.36 | NO |
| 53 | RANBP2 | RANBP2 | RANBP2 | 8797 | -0.011 | 0.36 | NO |
| 54 | TPR | TPR | TPR | 8814 | -0.012 | 0.36 | NO |
| 55 | IRF3 | IRF3 | IRF3 | 8967 | -0.013 | 0.36 | NO |
| 56 | PPM1B | PPM1B | PPM1B | 9017 | -0.014 | 0.36 | NO |
| 57 | NUP133 | NUP133 | NUP133 | 9919 | -0.026 | 0.32 | NO |
| 58 | NUP210 | NUP210 | NUP210 | 9933 | -0.027 | 0.33 | NO |
| 59 | PIN1 | PIN1 | PIN1 | 10210 | -0.03 | 0.32 | NO |
| 60 | NUPL2 | NUPL2 | NUPL2 | 10596 | -0.036 | 0.31 | NO |
| 61 | MX2 | MX2 | MX2 | 11049 | -0.043 | 0.3 | NO |
| 62 | UBA7 | UBA7 | UBA7 | 11134 | -0.044 | 0.31 | NO |
| 63 | EIF4E3 | EIF4E3 | EIF4E3 | 12805 | -0.076 | 0.24 | NO |
| 64 | KPNA5 | KPNA5 | KPNA5 | 13578 | -0.094 | 0.23 | NO |
| 65 | PLCG1 | PLCG1 | PLCG1 | 14103 | -0.11 | 0.23 | NO |
Figure S53. Get High-res Image This plot shows mRNAseq_cNMF expression data heatmap (on the left) a RunningEnrichmentScore(RES) plot (on the top right) and a Signal2Noise(S2N) plot (on the bottom right) of genes in the pathway: KEGG UBIQUITIN MEDIATED PROTEOLYSIS.
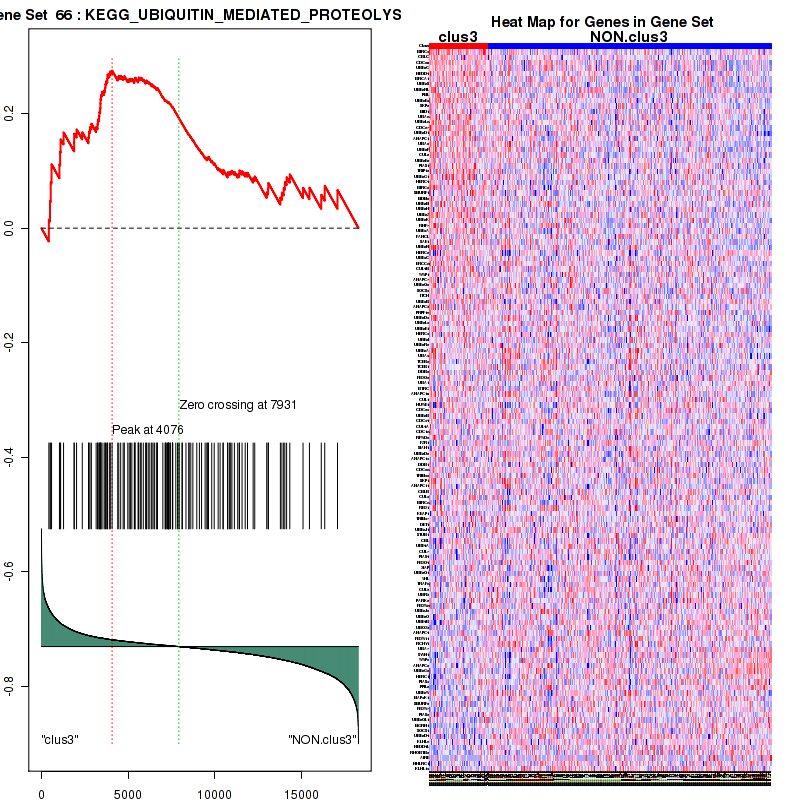
Figure S54. Get High-res Image For the top 5 core enriched genes in the pathway: KEGG UBIQUITIN MEDIATED PROTEOLYSIS, this volcano plot shows how much they are up/down-regulated and significant. The significance was calculated by empirical bayesian fit
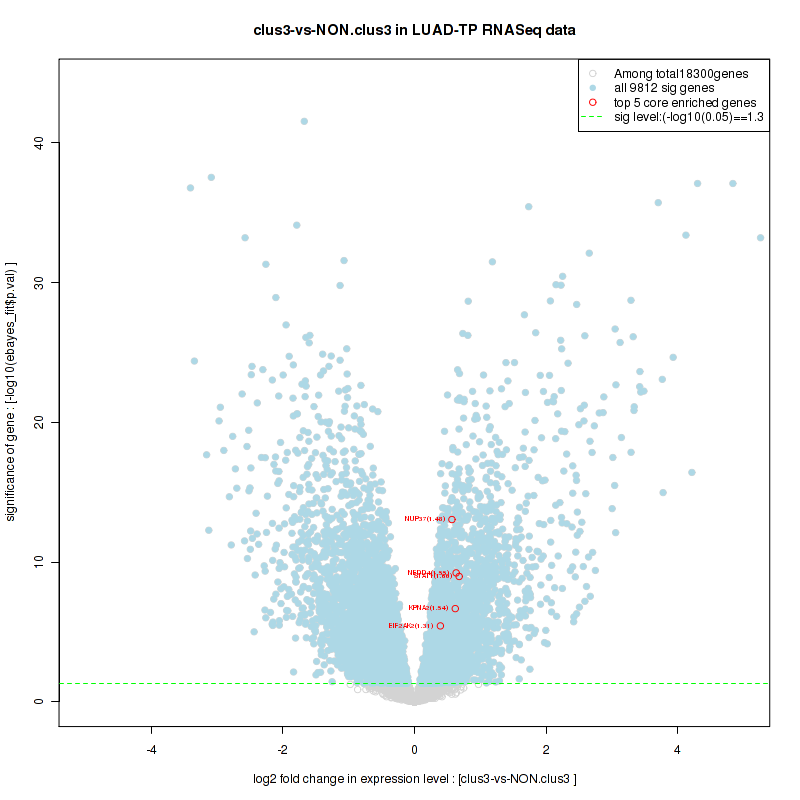
Table S28. Get Full Table This table shows a Running Enrichment Score (RES) of each gene in this pathway, that is, the enrichment score at this point in the ranked list of genes. All genes are ranked by Signal-to-Noise (S2N), a measure of similarity as default and are used to obtain ES matrix of all genes. In this way, GSEA tool uses expression pattern of not only overlapped genes but also not-overlapped genes to produce ES matrix.
| Rank | GENE | SYMBOL | DESC | LIST.LOC | S2N | RES | CORE_ENRICHMENT |
|---|---|---|---|---|---|---|---|
| 1 | HMGA1 | HMGA1 | HMGA1 | 705 | 0.24 | 0.0021 | YES |
| 2 | NUP37 | NUP37 | NUP37 | 1297 | 0.16 | -0.002 | YES |
| 3 | PSMB9 | PSMB9 | PSMB9 | 1360 | 0.16 | 0.022 | YES |
| 4 | RAN | RAN | RAN | 1996 | 0.12 | 0.0072 | YES |
| 5 | PSMD14 | PSMD14 | PSMD14 | 2349 | 0.1 | 0.0051 | YES |
| 6 | PSMB8 | PSMB8 | PSMB8 | 2351 | 0.1 | 0.022 | YES |
| 7 | CCNT1 | CCNT1 | CCNT1 | 2462 | 0.096 | 0.033 | YES |
| 8 | AP2S1 | AP2S1 | AP2S1 | 2527 | 0.093 | 0.045 | YES |
| 9 | PAK2 | PAK2 | PAK2 | 2537 | 0.093 | 0.061 | YES |
| 10 | PSMA5 | PSMA5 | PSMA5 | 2588 | 0.091 | 0.074 | YES |
| 11 | PSMB7 | PSMB7 | PSMB7 | 2657 | 0.088 | 0.085 | YES |
| 12 | PSMB10 | PSMB10 | PSMB10 | 2660 | 0.088 | 0.1 | YES |
| 13 | CD8B | CD8B | CD8B | 2750 | 0.086 | 0.11 | YES |
| 14 | NUP107 | NUP107 | NUP107 | 2822 | 0.083 | 0.12 | YES |
| 15 | PSMA4 | PSMA4 | PSMA4 | 2827 | 0.083 | 0.14 | YES |
| 16 | PSMC4 | PSMC4 | PSMC4 | 2908 | 0.081 | 0.14 | YES |
| 17 | PSMD12 | PSMD12 | PSMD12 | 3054 | 0.076 | 0.15 | YES |
| 18 | CD247 | CD247 | CD247 | 3062 | 0.076 | 0.16 | YES |
| 19 | PSMD11 | PSMD11 | PSMD11 | 3083 | 0.076 | 0.17 | YES |
| 20 | AP1S1 | AP1S1 | AP1S1 | 3092 | 0.075 | 0.19 | YES |
| 21 | PSMD1 | PSMD1 | PSMD1 | 3100 | 0.075 | 0.2 | YES |
| 22 | PSMD2 | PSMD2 | PSMD2 | 3170 | 0.073 | 0.21 | YES |
| 23 | PSMA8 | PSMA8 | PSMA8 | 3186 | 0.073 | 0.22 | YES |
| 24 | AP2M1 | AP2M1 | AP2M1 | 3261 | 0.07 | 0.23 | YES |
| 25 | PSME2 | PSME2 | PSME2 | 3329 | 0.069 | 0.24 | YES |
| 26 | KPNA1 | KPNA1 | KPNA1 | 3376 | 0.068 | 0.25 | YES |
| 27 | PSMD9 | PSMD9 | PSMD9 | 3448 | 0.067 | 0.25 | YES |
| 28 | PSMD7 | PSMD7 | PSMD7 | 3492 | 0.066 | 0.26 | YES |
| 29 | AP2A1 | AP2A1 | AP2A1 | 3505 | 0.066 | 0.27 | YES |
| 30 | RANBP1 | RANBP1 | RANBP1 | 3585 | 0.064 | 0.28 | YES |
| 31 | APOBEC3G | APOBEC3G | APOBEC3G | 3586 | 0.064 | 0.29 | YES |
| 32 | NUP205 | NUP205 | NUP205 | 3673 | 0.061 | 0.3 | YES |
| 33 | B2M | B2M | B2M | 3696 | 0.061 | 0.31 | YES |
| 34 | RANGAP1 | RANGAP1 | RANGAP1 | 3747 | 0.06 | 0.31 | YES |
| 35 | LCK | LCK | LCK | 3765 | 0.059 | 0.32 | YES |
| 36 | KPNB1 | KPNB1 | KPNB1 | 3924 | 0.056 | 0.32 | YES |
| 37 | PSMA2 | PSMA2 | PSMA2 | 3993 | 0.055 | 0.33 | YES |
| 38 | PACS1 | PACS1 | PACS1 | 4032 | 0.054 | 0.34 | YES |
| 39 | NUP54 | NUP54 | NUP54 | 4077 | 0.053 | 0.34 | YES |
| 40 | PSMA3 | PSMA3 | PSMA3 | 4111 | 0.052 | 0.35 | YES |
| 41 | NUP50 | NUP50 | NUP50 | 4125 | 0.052 | 0.36 | YES |
| 42 | AAAS | AAAS | AAAS | 4185 | 0.051 | 0.36 | YES |
| 43 | PSMD8 | PSMD8 | PSMD8 | 4205 | 0.051 | 0.37 | YES |
| 44 | PSMB6 | PSMB6 | PSMB6 | 4256 | 0.05 | 0.38 | YES |
| 45 | RAC1 | RAC1 | RAC1 | 4337 | 0.049 | 0.38 | YES |
| 46 | NUP62 | NUP62 | NUP62 | 4400 | 0.048 | 0.39 | YES |
| 47 | NUP35 | NUP35 | NUP35 | 4567 | 0.045 | 0.39 | YES |
| 48 | NPM1 | NPM1 | NPM1 | 4568 | 0.045 | 0.39 | YES |
| 49 | NUP153 | NUP153 | NUP153 | 4574 | 0.045 | 0.4 | YES |
| 50 | PSMB3 | PSMB3 | PSMB3 | 4713 | 0.043 | 0.4 | YES |
| 51 | PSMA1 | PSMA1 | PSMA1 | 4724 | 0.043 | 0.41 | YES |
| 52 | XPO1 | XPO1 | XPO1 | 4746 | 0.042 | 0.41 | YES |
| 53 | NUP155 | NUP155 | NUP155 | 4778 | 0.042 | 0.42 | YES |
| 54 | RCC1 | RCC1 | RCC1 | 4827 | 0.041 | 0.42 | YES |
| 55 | PSMB5 | PSMB5 | PSMB5 | 4849 | 0.04 | 0.43 | YES |
| 56 | PSMB2 | PSMB2 | PSMB2 | 4879 | 0.04 | 0.44 | YES |
| 57 | PSMB1 | PSMB1 | PSMB1 | 4892 | 0.04 | 0.44 | YES |
| 58 | PSMC2 | PSMC2 | PSMC2 | 4943 | 0.039 | 0.44 | YES |
| 59 | PSMC5 | PSMC5 | PSMC5 | 5259 | 0.034 | 0.43 | YES |
| 60 | NUP93 | NUP93 | NUP93 | 5270 | 0.034 | 0.44 | YES |
| 61 | HLA-A | HLA-A | HLA-A | 5303 | 0.034 | 0.44 | YES |
| 62 | RPS27A | RPS27A | RPS27A | 5329 | 0.033 | 0.45 | YES |
| 63 | AP2B1 | AP2B1 | AP2B1 | 5367 | 0.033 | 0.45 | YES |
| 64 | PPIA | PPIA | PPIA | 5546 | 0.03 | 0.45 | NO |
| 65 | PSMD6 | PSMD6 | PSMD6 | 5603 | 0.029 | 0.45 | NO |
| 66 | PSMC1 | PSMC1 | PSMC1 | 5752 | 0.027 | 0.44 | NO |
| 67 | BANF1 | BANF1 | BANF1 | 5764 | 0.027 | 0.45 | NO |
| 68 | PSMA7 | PSMA7 | PSMA7 | 5871 | 0.026 | 0.45 | NO |
| 69 | SLC25A5 | SLC25A5 | SLC25A5 | 5998 | 0.024 | 0.44 | NO |
| 70 | PSMC6 | PSMC6 | PSMC6 | 6214 | 0.021 | 0.44 | NO |
| 71 | TCEB2 | TCEB2 | TCEB2 | 6254 | 0.02 | 0.44 | NO |
| 72 | TCEB1 | TCEB1 | TCEB1 | 6364 | 0.019 | 0.44 | NO |
| 73 | PSMD13 | PSMD13 | PSMD13 | 6478 | 0.017 | 0.43 | NO |
| 74 | RAE1 | RAE1 | RAE1 | 6505 | 0.017 | 0.43 | NO |
| 75 | PSME1 | PSME1 | PSME1 | 6509 | 0.017 | 0.44 | NO |
| 76 | PSMD4 | PSMD4 | PSMD4 | 6627 | 0.016 | 0.43 | NO |
| 77 | BTRC | BTRC | BTRC | 6657 | 0.015 | 0.43 | NO |
| 78 | PSME4 | PSME4 | PSME4 | 6775 | 0.014 | 0.43 | NO |
| 79 | AP1G1 | AP1G1 | AP1G1 | 6788 | 0.014 | 0.43 | NO |
| 80 | PSMC3 | PSMC3 | PSMC3 | 6800 | 0.014 | 0.43 | NO |
| 81 | NUP85 | NUP85 | NUP85 | 6822 | 0.013 | 0.43 | NO |
| 82 | UBA52 | UBA52 | UBA52 | 6969 | 0.012 | 0.43 | NO |
| 83 | NUP88 | NUP88 | NUP88 | 7032 | 0.011 | 0.43 | NO |
| 84 | PSMD5 | PSMD5 | PSMD5 | 7246 | 0.0082 | 0.42 | NO |
| 85 | PSMD3 | PSMD3 | PSMD3 | 7386 | 0.0066 | 0.41 | NO |
| 86 | SLC25A6 | SLC25A6 | SLC25A6 | 7489 | 0.0054 | 0.4 | NO |
| 87 | SEH1L | SEH1L | SEH1L | 7542 | 0.0047 | 0.4 | NO |
| 88 | SKP1 | SKP1 | SKP1 | 7573 | 0.0043 | 0.4 | NO |
| 89 | NUP43 | NUP43 | NUP43 | 7597 | 0.004 | 0.4 | NO |
| 90 | ARF1 | ARF1 | ARF1 | 7605 | 0.0039 | 0.4 | NO |
| 91 | PSMF1 | PSMF1 | PSMF1 | 7692 | 0.0029 | 0.4 | NO |
| 92 | PSMB4 | PSMB4 | PSMB4 | 7784 | 0.0016 | 0.39 | NO |
| 93 | NUPL1 | NUPL1 | NUPL1 | 7902 | 0.00034 | 0.39 | NO |
| 94 | PSMD10 | PSMD10 | PSMD10 | 8017 | -0.0012 | 0.38 | NO |
| 95 | NUP188 | NUP188 | NUP188 | 8036 | -0.0015 | 0.38 | NO |
| 96 | RBX1 | RBX1 | RBX1 | 8110 | -0.0026 | 0.38 | NO |
| 97 | CDK9 | CDK9 | CDK9 | 8457 | -0.0071 | 0.36 | NO |
| 98 | NUP214 | NUP214 | NUP214 | 8674 | -0.0097 | 0.35 | NO |
| 99 | AP1B1 | AP1B1 | AP1B1 | 8717 | -0.01 | 0.35 | NO |
| 100 | POM121 | POM121 | POM121 | 8731 | -0.01 | 0.35 | NO |
| 101 | RANBP2 | RANBP2 | RANBP2 | 8797 | -0.011 | 0.35 | NO |
| 102 | TPR | TPR | TPR | 8814 | -0.012 | 0.35 | NO |
| 103 | PSMA6 | PSMA6 | PSMA6 | 9209 | -0.017 | 0.33 | NO |
| 104 | HCK | HCK | HCK | 9566 | -0.021 | 0.31 | NO |
| 105 | CUL5 | CUL5 | CUL5 | 9829 | -0.025 | 0.3 | NO |
| 106 | NUP133 | NUP133 | NUP133 | 9919 | -0.026 | 0.3 | NO |
| 107 | NUP210 | NUP210 | NUP210 | 9933 | -0.027 | 0.31 | NO |
| 108 | ATP6V1H | ATP6V1H | ATP6V1H | 10102 | -0.029 | 0.3 | NO |
| 109 | CD4 | CD4 | CD4 | 10117 | -0.029 | 0.31 | NO |
| 110 | AP1M1 | AP1M1 | AP1M1 | 10546 | -0.036 | 0.29 | NO |
| 111 | NUPL2 | NUPL2 | NUPL2 | 10596 | -0.036 | 0.29 | NO |
| 112 | AP1M2 | AP1M2 | AP1M2 | 10707 | -0.038 | 0.29 | NO |
| 113 | DOCK2 | DOCK2 | DOCK2 | 10772 | -0.039 | 0.3 | NO |
| 114 | AP2A2 | AP2A2 | AP2A2 | 11512 | -0.05 | 0.26 | NO |
| 115 | PSIP1 | PSIP1 | PSIP1 | 11832 | -0.056 | 0.26 | NO |
| 116 | AP1S2 | AP1S2 | AP1S2 | 12074 | -0.06 | 0.25 | NO |
| 117 | CD28 | CD28 | CD28 | 12787 | -0.075 | 0.23 | NO |
| 118 | ELMO1 | ELMO1 | ELMO1 | 14453 | -0.12 | 0.16 | NO |
| 119 | FYN | FYN | FYN | 14796 | -0.13 | 0.16 | NO |
| 120 | SLC25A4 | SLC25A4 | SLC25A4 | 15922 | -0.18 | 0.13 | NO |
Figure S55. Get High-res Image This plot shows mRNAseq_cNMF expression data heatmap (on the left) a RunningEnrichmentScore(RES) plot (on the top right) and a Signal2Noise(S2N) plot (on the bottom right) of genes in the pathway: BIOCARTA G1 PATHWAY.
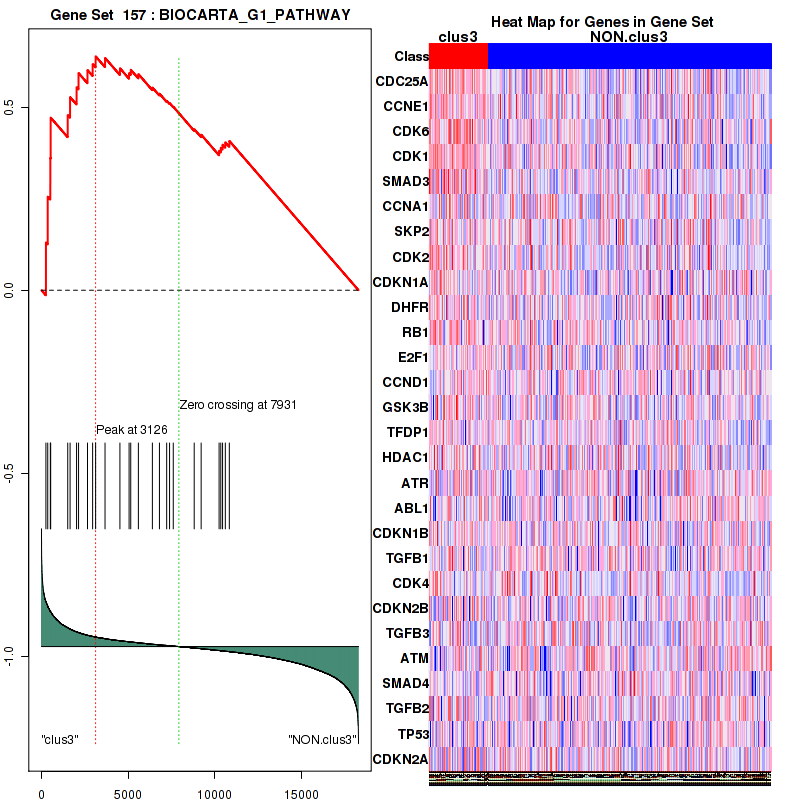
Figure S56. Get High-res Image For the top 5 core enriched genes in the pathway: BIOCARTA G1 PATHWAY, this volcano plot shows how much they are up/down-regulated and significant. The significance was calculated by empirical bayesian fit
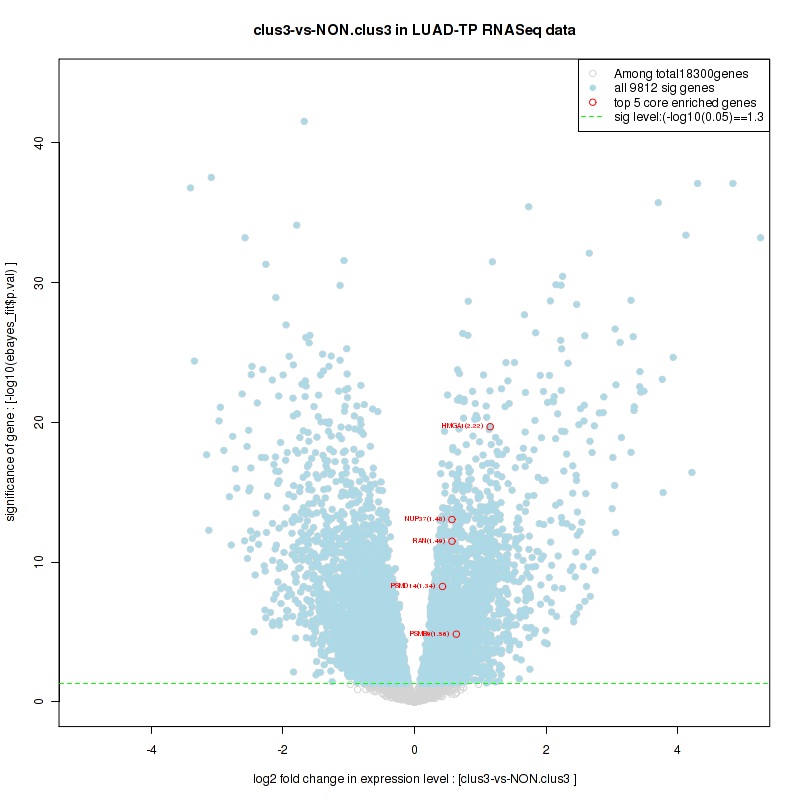
Table S29. Get Full Table This table shows a Running Enrichment Score (RES) of each gene in this pathway, that is, the enrichment score at this point in the ranked list of genes. All genes are ranked by Signal-to-Noise (S2N), a measure of similarity as default and are used to obtain ES matrix of all genes. In this way, GSEA tool uses expression pattern of not only overlapped genes but also not-overlapped genes to produce ES matrix.
| Rank | GENE | SYMBOL | DESC | LIST.LOC | S2N | RES | CORE_ENRICHMENT |
|---|---|---|---|---|---|---|---|
| 1 | CCNE1 | CCNE1 | CCNE1 | 361 | 0.32 | 0.094 | YES |
| 2 | PSMB9 | PSMB9 | PSMB9 | 1360 | 0.16 | 0.096 | YES |
| 3 | CDK2 | CDK2 | CDK2 | 2140 | 0.11 | 0.092 | YES |
| 4 | PSMD14 | PSMD14 | PSMD14 | 2349 | 0.1 | 0.12 | YES |
| 5 | PSMB8 | PSMB8 | PSMB8 | 2351 | 0.1 | 0.15 | YES |
| 6 | PSMA5 | PSMA5 | PSMA5 | 2588 | 0.091 | 0.17 | YES |
| 7 | CDKN1A | CDKN1A | CDKN1A | 2656 | 0.088 | 0.2 | YES |
| 8 | PSMB7 | PSMB7 | PSMB7 | 2657 | 0.088 | 0.23 | YES |
| 9 | PSMB10 | PSMB10 | PSMB10 | 2660 | 0.088 | 0.26 | YES |
| 10 | PSMA4 | PSMA4 | PSMA4 | 2827 | 0.083 | 0.28 | YES |
| 11 | PSMC4 | PSMC4 | PSMC4 | 2908 | 0.081 | 0.31 | YES |
| 12 | PSMD12 | PSMD12 | PSMD12 | 3054 | 0.076 | 0.33 | YES |
| 13 | PSMD11 | PSMD11 | PSMD11 | 3083 | 0.076 | 0.35 | YES |
| 14 | PSMD1 | PSMD1 | PSMD1 | 3100 | 0.075 | 0.38 | YES |
| 15 | PSMD2 | PSMD2 | PSMD2 | 3170 | 0.073 | 0.4 | YES |
| 16 | PSMA8 | PSMA8 | PSMA8 | 3186 | 0.073 | 0.42 | YES |
| 17 | PSME2 | PSME2 | PSME2 | 3329 | 0.069 | 0.44 | YES |
| 18 | PSMD9 | PSMD9 | PSMD9 | 3448 | 0.067 | 0.46 | YES |
| 19 | PSMD7 | PSMD7 | PSMD7 | 3492 | 0.066 | 0.48 | YES |
| 20 | MDM2 | MDM2 | MDM2 | 3671 | 0.062 | 0.49 | YES |
| 21 | PSMA2 | PSMA2 | PSMA2 | 3993 | 0.055 | 0.49 | YES |
| 22 | PSMA3 | PSMA3 | PSMA3 | 4111 | 0.052 | 0.51 | YES |
| 23 | PSMD8 | PSMD8 | PSMD8 | 4205 | 0.051 | 0.52 | YES |
| 24 | PSMB6 | PSMB6 | PSMB6 | 4256 | 0.05 | 0.53 | YES |
| 25 | PSMB3 | PSMB3 | PSMB3 | 4713 | 0.043 | 0.52 | YES |
| 26 | PSMA1 | PSMA1 | PSMA1 | 4724 | 0.043 | 0.54 | YES |
| 27 | PSMB5 | PSMB5 | PSMB5 | 4849 | 0.04 | 0.55 | YES |
| 28 | PSMB2 | PSMB2 | PSMB2 | 4879 | 0.04 | 0.56 | YES |
| 29 | PSMB1 | PSMB1 | PSMB1 | 4892 | 0.04 | 0.57 | YES |
| 30 | PSMC2 | PSMC2 | PSMC2 | 4943 | 0.039 | 0.58 | YES |
| 31 | PSMC5 | PSMC5 | PSMC5 | 5259 | 0.034 | 0.58 | YES |
| 32 | RPS27A | RPS27A | RPS27A | 5329 | 0.033 | 0.59 | YES |
| 33 | CCNE2 | CCNE2 | CCNE2 | 5474 | 0.031 | 0.59 | YES |
| 34 | PSMD6 | PSMD6 | PSMD6 | 5603 | 0.029 | 0.59 | YES |
| 35 | PSMC1 | PSMC1 | PSMC1 | 5752 | 0.027 | 0.6 | YES |
| 36 | PSMA7 | PSMA7 | PSMA7 | 5871 | 0.026 | 0.6 | YES |
| 37 | PSMC6 | PSMC6 | PSMC6 | 6214 | 0.021 | 0.59 | NO |
| 38 | PSMD13 | PSMD13 | PSMD13 | 6478 | 0.017 | 0.58 | NO |
| 39 | PSME1 | PSME1 | PSME1 | 6509 | 0.017 | 0.58 | NO |
| 40 | PSMD4 | PSMD4 | PSMD4 | 6627 | 0.016 | 0.58 | NO |
| 41 | PSME4 | PSME4 | PSME4 | 6775 | 0.014 | 0.58 | NO |
| 42 | PSMC3 | PSMC3 | PSMC3 | 6800 | 0.014 | 0.58 | NO |
| 43 | UBA52 | UBA52 | UBA52 | 6969 | 0.012 | 0.58 | NO |
| 44 | CDKN1B | CDKN1B | CDKN1B | 7228 | 0.0084 | 0.57 | NO |
| 45 | PSMD5 | PSMD5 | PSMD5 | 7246 | 0.0082 | 0.57 | NO |
| 46 | RFWD2 | RFWD2 | RFWD2 | 7318 | 0.0074 | 0.57 | NO |
| 47 | PSMD3 | PSMD3 | PSMD3 | 7386 | 0.0066 | 0.57 | NO |
| 48 | PSMF1 | PSMF1 | PSMF1 | 7692 | 0.0029 | 0.55 | NO |
| 49 | PSMB4 | PSMB4 | PSMB4 | 7784 | 0.0016 | 0.55 | NO |
| 50 | PSMD10 | PSMD10 | PSMD10 | 8017 | -0.0012 | 0.53 | NO |
| 51 | PSMA6 | PSMA6 | PSMA6 | 9209 | -0.017 | 0.47 | NO |
| 52 | ATM | ATM | ATM | 10254 | -0.031 | 0.43 | NO |
| 53 | TP53 | TP53 | TP53 | 10613 | -0.036 | 0.42 | NO |
Figure S57. Get High-res Image This plot shows mRNAseq_cNMF expression data heatmap (on the left) a RunningEnrichmentScore(RES) plot (on the top right) and a Signal2Noise(S2N) plot (on the bottom right) of genes in the pathway: BIOCARTA HIVNEF PATHWAY.
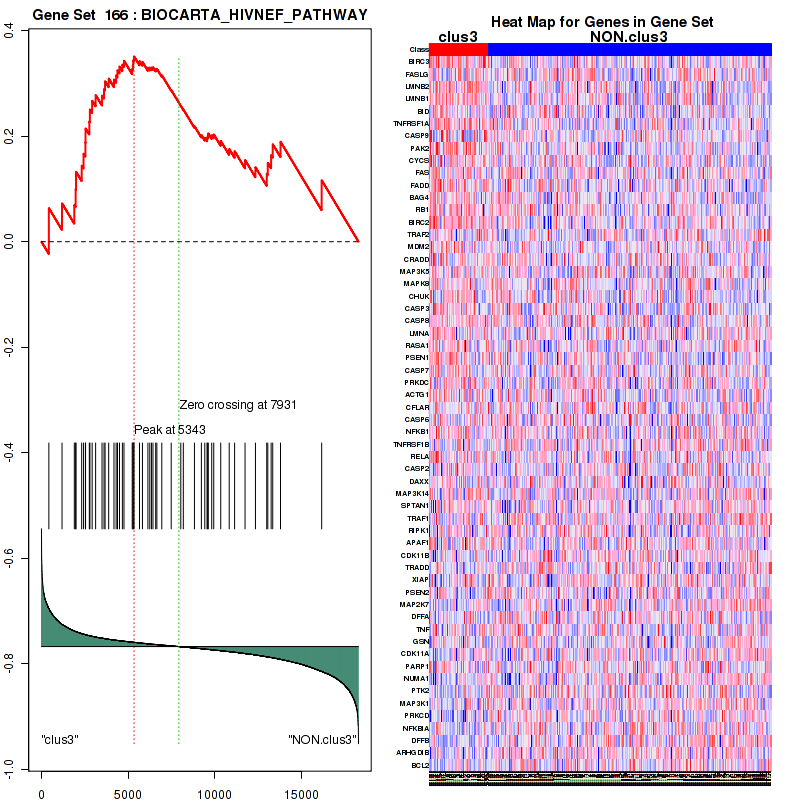
Figure S58. Get High-res Image For the top 5 core enriched genes in the pathway: BIOCARTA HIVNEF PATHWAY, this volcano plot shows how much they are up/down-regulated and significant. The significance was calculated by empirical bayesian fit

Table S30. Get Full Table This table shows a Running Enrichment Score (RES) of each gene in this pathway, that is, the enrichment score at this point in the ranked list of genes. All genes are ranked by Signal-to-Noise (S2N), a measure of similarity as default and are used to obtain ES matrix of all genes. In this way, GSEA tool uses expression pattern of not only overlapped genes but also not-overlapped genes to produce ES matrix.
| Rank | GENE | SYMBOL | DESC | LIST.LOC | S2N | RES | CORE_ENRICHMENT |
|---|---|---|---|---|---|---|---|
| 1 | CDC25A | CDC25A | CDC25A | 258 | 0.35 | 0.066 | YES |
| 2 | CCNA2 | CCNA2 | CCNA2 | 310 | 0.34 | 0.14 | YES |
| 3 | CCNE1 | CCNE1 | CCNE1 | 361 | 0.32 | 0.21 | YES |
| 4 | PKMYT1 | PKMYT1 | PKMYT1 | 471 | 0.29 | 0.27 | YES |
| 5 | CKS1B | CKS1B | CKS1B | 1230 | 0.17 | 0.27 | YES |
| 6 | PSMB9 | PSMB9 | PSMB9 | 1360 | 0.16 | 0.3 | YES |
| 7 | CCNA1 | CCNA1 | CCNA1 | 1651 | 0.14 | 0.31 | YES |
| 8 | MYC | MYC | MYC | 1686 | 0.14 | 0.34 | YES |
| 9 | SKP2 | SKP2 | SKP2 | 2027 | 0.12 | 0.35 | YES |
| 10 | CDK2 | CDK2 | CDK2 | 2140 | 0.11 | 0.37 | YES |
| 11 | PSMD14 | PSMD14 | PSMD14 | 2349 | 0.1 | 0.38 | YES |
| 12 | PSMB8 | PSMB8 | PSMB8 | 2351 | 0.1 | 0.4 | YES |
| 13 | PSMA5 | PSMA5 | PSMA5 | 2588 | 0.091 | 0.41 | YES |
| 14 | CDKN1A | CDKN1A | CDKN1A | 2656 | 0.088 | 0.42 | YES |
| 15 | PSMB7 | PSMB7 | PSMB7 | 2657 | 0.088 | 0.44 | YES |
| 16 | PSMB10 | PSMB10 | PSMB10 | 2660 | 0.088 | 0.47 | YES |
| 17 | PSMA4 | PSMA4 | PSMA4 | 2827 | 0.083 | 0.48 | YES |
| 18 | PSMC4 | PSMC4 | PSMC4 | 2908 | 0.081 | 0.49 | YES |
| 19 | PSMD12 | PSMD12 | PSMD12 | 3054 | 0.076 | 0.5 | YES |
| 20 | PSMD11 | PSMD11 | PSMD11 | 3083 | 0.076 | 0.52 | YES |
| 21 | PSMD1 | PSMD1 | PSMD1 | 3100 | 0.075 | 0.53 | YES |
| 22 | RB1 | RB1 | RB1 | 3126 | 0.074 | 0.55 | YES |
| 23 | PSMD2 | PSMD2 | PSMD2 | 3170 | 0.073 | 0.56 | YES |
| 24 | CDK7 | CDK7 | CDK7 | 3209 | 0.072 | 0.57 | YES |
| 25 | PSME2 | PSME2 | PSME2 | 3329 | 0.069 | 0.58 | YES |
| 26 | PSMD9 | PSMD9 | PSMD9 | 3448 | 0.067 | 0.59 | YES |
| 27 | PSMD7 | PSMD7 | PSMD7 | 3492 | 0.066 | 0.61 | YES |
| 28 | PSMA2 | PSMA2 | PSMA2 | 3993 | 0.055 | 0.59 | YES |
| 29 | PSMA3 | PSMA3 | PSMA3 | 4111 | 0.052 | 0.6 | YES |
| 30 | PSMD8 | PSMD8 | PSMD8 | 4205 | 0.051 | 0.6 | YES |
| 31 | PSMB6 | PSMB6 | PSMB6 | 4256 | 0.05 | 0.61 | YES |
| 32 | PSMB3 | PSMB3 | PSMB3 | 4713 | 0.043 | 0.6 | YES |
| 33 | PSMA1 | PSMA1 | PSMA1 | 4724 | 0.043 | 0.61 | YES |
| 34 | PSMB5 | PSMB5 | PSMB5 | 4849 | 0.04 | 0.61 | YES |
| 35 | PSMB2 | PSMB2 | PSMB2 | 4879 | 0.04 | 0.62 | YES |
| 36 | PSMB1 | PSMB1 | PSMB1 | 4892 | 0.04 | 0.62 | YES |
| 37 | PSMC2 | PSMC2 | PSMC2 | 4943 | 0.039 | 0.63 | YES |
| 38 | PSMC5 | PSMC5 | PSMC5 | 5259 | 0.034 | 0.62 | NO |
| 39 | RPS27A | RPS27A | RPS27A | 5329 | 0.033 | 0.62 | NO |
| 40 | CCNE2 | CCNE2 | CCNE2 | 5474 | 0.031 | 0.62 | NO |
| 41 | PSMD6 | PSMD6 | PSMD6 | 5603 | 0.029 | 0.62 | NO |
| 42 | PSMC1 | PSMC1 | PSMC1 | 5752 | 0.027 | 0.62 | NO |
| 43 | PSMA7 | PSMA7 | PSMA7 | 5871 | 0.026 | 0.62 | NO |
| 44 | PSMC6 | PSMC6 | PSMC6 | 6214 | 0.021 | 0.61 | NO |
| 45 | CCNH | CCNH | CCNH | 6378 | 0.018 | 0.6 | NO |
| 46 | PSMD13 | PSMD13 | PSMD13 | 6478 | 0.017 | 0.6 | NO |
| 47 | PSME1 | PSME1 | PSME1 | 6509 | 0.017 | 0.6 | NO |
| 48 | PSMD4 | PSMD4 | PSMD4 | 6627 | 0.016 | 0.6 | NO |
| 49 | CUL1 | CUL1 | CUL1 | 6690 | 0.015 | 0.6 | NO |
| 50 | PSMC3 | PSMC3 | PSMC3 | 6800 | 0.014 | 0.6 | NO |
| 51 | MAX | MAX | MAX | 6906 | 0.012 | 0.6 | NO |
| 52 | UBA52 | UBA52 | UBA52 | 6969 | 0.012 | 0.59 | NO |
| 53 | CDKN1B | CDKN1B | CDKN1B | 7228 | 0.0084 | 0.58 | NO |
| 54 | PSMD5 | PSMD5 | PSMD5 | 7246 | 0.0082 | 0.58 | NO |
| 55 | PSMD3 | PSMD3 | PSMD3 | 7386 | 0.0066 | 0.58 | NO |
| 56 | SKP1 | SKP1 | SKP1 | 7573 | 0.0043 | 0.57 | NO |
| 57 | PSMF1 | PSMF1 | PSMF1 | 7692 | 0.0029 | 0.56 | NO |
| 58 | PSMB4 | PSMB4 | PSMB4 | 7784 | 0.0016 | 0.56 | NO |
| 59 | PSMD10 | PSMD10 | PSMD10 | 8017 | -0.0012 | 0.54 | NO |
| 60 | MNAT1 | MNAT1 | MNAT1 | 8780 | -0.011 | 0.5 | NO |
| 61 | PSMA6 | PSMA6 | PSMA6 | 9209 | -0.017 | 0.48 | NO |
| 62 | WEE1 | WEE1 | WEE1 | 11855 | -0.056 | 0.35 | NO |
Figure S59. Get High-res Image This plot shows mRNAseq_cNMF expression data heatmap (on the left) a RunningEnrichmentScore(RES) plot (on the top right) and a Signal2Noise(S2N) plot (on the bottom right) of genes in the pathway: BIOCARTA PROTEASOME PATHWAY.
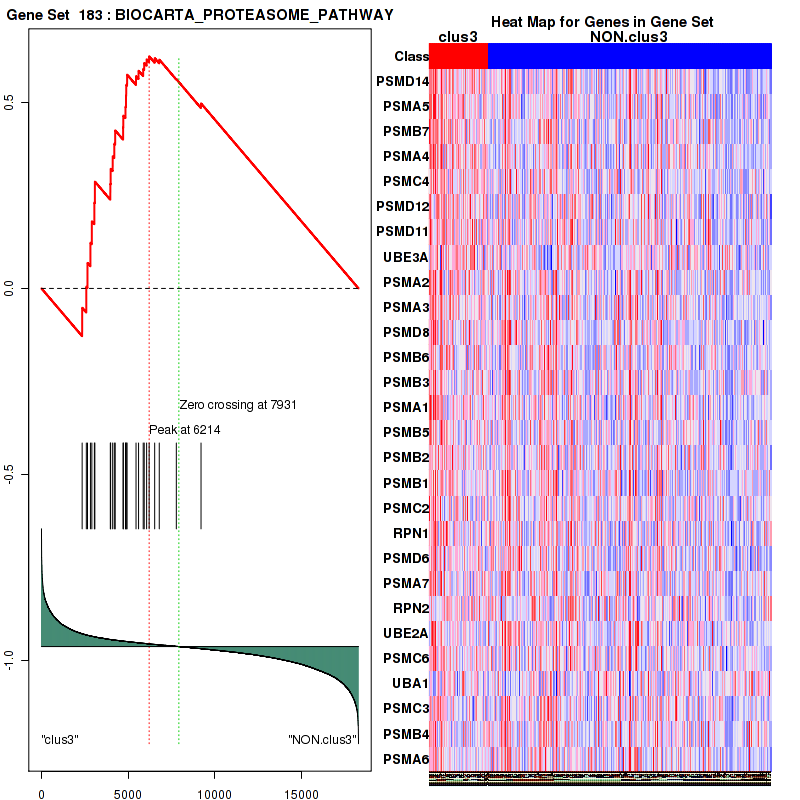
Figure S60. Get High-res Image For the top 5 core enriched genes in the pathway: BIOCARTA PROTEASOME PATHWAY, this volcano plot shows how much they are up/down-regulated and significant. The significance was calculated by empirical bayesian fit
For the top enriched genes, if you want to check whether they are
-
up-regulated, please check the list of up-regulated genes
-
down-regulated, please check the list of down-regulated genes
For the top enriched genes, if you want to check whether they are
-
highly expressed genes, please check the list of high (top 30%) expressed genes
-
low expressed genes, please check the list of low (bottom 30%) expressed genes
An expression pattern of top(30%)/middle(30%)/low(30%) in this subtype against other subtypes is available in a heatmap
For the top enriched genes, if you want to check whether they are
-
significantly differently expressed genes by eBayes lm fit, please check the list of significant genes
Table 6. Get Full Table This table shows top 10 pathways which are significantly enriched in cluster clus4. It displays only significant gene sets satisfying nom.p.val.threshold (-1), fwer.p.val.threshold (-1) , fdr.q.val.threshold (0.25) and the default table is sorted by Normalized Enrichment Score (NES). Further details on NES statistics, please visit The Broad GSEA website.
| GeneSet(GS) | Size(#genes) | genes.ES.table | ES | NES | NOM.p.val | FDR.q.val | FWER.p.val | Tag.. | Gene.. | Signal | FDR..median. | glob.p.val |
|---|---|---|---|---|---|---|---|---|---|---|---|---|
| KEGG AMINOACYL TRNA BIOSYNTHESIS | 41 | genes.ES.table | 0.51 | 1.9 | 0.024 | 0.21 | 0.45 | 0.66 | 0.37 | 0.41 | 0 | 0.043 |
| KEGG RNA DEGRADATION | 57 | genes.ES.table | 0.51 | 2.1 | 0.004 | 0.13 | 0.074 | 0.49 | 0.33 | 0.33 | 0 | 0.039 |
| REACTOME METABOLISM OF NON CODING RNA | 47 | genes.ES.table | 0.53 | 1.8 | 0.032 | 0.22 | 0.68 | 0.6 | 0.33 | 0.4 | 0.074 | 0.042 |
| REACTOME CELL CYCLE | 379 | genes.ES.table | 0.54 | 1.7 | 0.043 | 0.24 | 0.77 | 0.47 | 0.25 | 0.36 | 0.1 | 0.044 |
| REACTOME MITOCHONDRIAL PROTEIN IMPORT | 49 | genes.ES.table | 0.55 | 1.8 | 0.044 | 0.23 | 0.67 | 0.63 | 0.32 | 0.43 | 0.074 | 0.044 |
| REACTOME PROCESSING OF CAPPED INTRON CONTAINING PRE MRNA | 126 | genes.ES.table | 0.52 | 2 | 0.0061 | 0.11 | 0.16 | 0.79 | 0.43 | 0.46 | 0 | 0.021 |
| REACTOME TRANSPORT OF MATURE TRANSCRIPT TO CYTOPLASM | 44 | genes.ES.table | 0.53 | 1.8 | 0.029 | 0.24 | 0.59 | 0.8 | 0.42 | 0.46 | 0.067 | 0.047 |
| REACTOME RNA POL II TRANSCRIPTION | 93 | genes.ES.table | 0.45 | 2 | 0.01 | 0.15 | 0.26 | 0.63 | 0.39 | 0.39 | 0 | 0.035 |
| REACTOME RNA POL III TRANSCRIPTION | 33 | genes.ES.table | 0.47 | 1.8 | 0.025 | 0.22 | 0.52 | 0.73 | 0.35 | 0.48 | 0.061 | 0.045 |
| REACTOME RECRUITMENT OF MITOTIC CENTROSOME PROTEINS AND COMPLEXES | 59 | genes.ES.table | 0.46 | 1.7 | 0.051 | 0.22 | 0.72 | 0.64 | 0.4 | 0.38 | 0.08 | 0.039 |
Table S31. Get Full Table This table shows a Running Enrichment Score (RES) of each gene in this pathway, that is, the enrichment score at this point in the ranked list of genes. All genes are ranked by Signal-to-Noise (S2N), a measure of similarity as default and are used to obtain ES matrix of all genes. In this way, GSEA tool uses expression pattern of not only overlapped genes but also not-overlapped genes to produce ES matrix.
| Rank | GENE | SYMBOL | DESC | LIST.LOC | S2N | RES | CORE_ENRICHMENT |
|---|---|---|---|---|---|---|---|
| 1 | ENO3 | ENO3 | ENO3 | 2 | 0.81 | 0.25 | YES |
| 2 | PNPT1 | PNPT1 | PNPT1 | 2227 | 0.13 | 0.16 | YES |
| 3 | PAPOLB | PAPOLB | PAPOLB | 2301 | 0.12 | 0.2 | YES |
| 4 | HSPD1 | HSPD1 | HSPD1 | 2341 | 0.12 | 0.23 | YES |
| 5 | PAPOLA | PAPOLA | PAPOLA | 2455 | 0.12 | 0.26 | YES |
| 6 | EXOSC3 | EXOSC3 | EXOSC3 | 2505 | 0.11 | 0.29 | YES |
| 7 | LSM1 | LSM1 | LSM1 | 2849 | 0.1 | 0.3 | YES |
| 8 | EXOSC8 | EXOSC8 | EXOSC8 | 2921 | 0.099 | 0.33 | YES |
| 9 | EXOSC4 | EXOSC4 | EXOSC4 | 3052 | 0.095 | 0.35 | YES |
| 10 | CNOT7 | CNOT7 | CNOT7 | 3258 | 0.089 | 0.37 | YES |
| 11 | LSM2 | LSM2 | LSM2 | 3629 | 0.08 | 0.37 | YES |
| 12 | ZCCHC7 | ZCCHC7 | ZCCHC7 | 3954 | 0.072 | 0.38 | YES |
| 13 | HSPA9 | HSPA9 | HSPA9 | 4236 | 0.065 | 0.38 | YES |
| 14 | CNOT2 | CNOT2 | CNOT2 | 4462 | 0.061 | 0.39 | YES |
| 15 | EXOSC2 | EXOSC2 | EXOSC2 | 4481 | 0.061 | 0.4 | YES |
| 16 | CNOT3 | CNOT3 | CNOT3 | 4505 | 0.061 | 0.42 | YES |
| 17 | EXOSC1 | EXOSC1 | EXOSC1 | 4660 | 0.058 | 0.43 | YES |
| 18 | MPHOSPH6 | MPHOSPH6 | MPHOSPH6 | 4703 | 0.058 | 0.45 | YES |
| 19 | LSM7 | LSM7 | LSM7 | 4811 | 0.056 | 0.46 | YES |
| 20 | NAA38 | NAA38 | NAA38 | 4926 | 0.054 | 0.47 | YES |
| 21 | EXOSC6 | EXOSC6 | EXOSC6 | 5025 | 0.052 | 0.48 | YES |
| 22 | RQCD1 | RQCD1 | RQCD1 | 5041 | 0.052 | 0.49 | YES |
| 23 | EXOSC5 | EXOSC5 | EXOSC5 | 5319 | 0.047 | 0.49 | YES |
| 24 | PAPD7 | PAPD7 | PAPD7 | 5447 | 0.045 | 0.5 | YES |
| 25 | LSM4 | LSM4 | LSM4 | 5602 | 0.043 | 0.5 | YES |
| 26 | EDC4 | EDC4 | EDC4 | 5839 | 0.04 | 0.5 | YES |
| 27 | XRN2 | XRN2 | XRN2 | 5940 | 0.038 | 0.51 | YES |
| 28 | PATL1 | PATL1 | PATL1 | 6080 | 0.036 | 0.51 | YES |
| 29 | DCPS | DCPS | DCPS | 7094 | 0.024 | 0.46 | NO |
| 30 | EDC3 | EDC3 | EDC3 | 7214 | 0.022 | 0.46 | NO |
| 31 | ENO2 | ENO2 | ENO2 | 7472 | 0.019 | 0.46 | NO |
| 32 | C1D | C1D | C1D | 7517 | 0.018 | 0.46 | NO |
| 33 | LSM5 | LSM5 | LSM5 | 7552 | 0.018 | 0.46 | NO |
| 34 | WDR61 | WDR61 | WDR61 | 7603 | 0.017 | 0.46 | NO |
| 35 | LSM3 | LSM3 | LSM3 | 7764 | 0.015 | 0.46 | NO |
| 36 | CNOT10 | CNOT10 | CNOT10 | 7842 | 0.014 | 0.46 | NO |
| 37 | EXOSC9 | EXOSC9 | EXOSC9 | 7914 | 0.013 | 0.46 | NO |
| 38 | EXOSC10 | EXOSC10 | EXOSC10 | 7928 | 0.013 | 0.46 | NO |
| 39 | EXOSC7 | EXOSC7 | EXOSC7 | 8250 | 0.0091 | 0.45 | NO |
| 40 | SKIV2L | SKIV2L | SKIV2L | 8299 | 0.0085 | 0.45 | NO |
| 41 | DDX6 | DDX6 | DDX6 | 8425 | 0.0067 | 0.44 | NO |
| 42 | PAPOLG | PAPOLG | PAPOLG | 8718 | 0.003 | 0.43 | NO |
| 43 | TTC37 | TTC37 | TTC37 | 8725 | 0.0029 | 0.43 | NO |
| 44 | CNOT1 | CNOT1 | CNOT1 | 8821 | 0.0018 | 0.43 | NO |
| 45 | DCP1A | DCP1A | DCP1A | 8935 | 0.00017 | 0.42 | NO |
| 46 | XRN1 | XRN1 | XRN1 | 9137 | -0.0027 | 0.41 | NO |
| 47 | CNOT6 | CNOT6 | CNOT6 | 9495 | -0.0072 | 0.39 | NO |
| 48 | SKIV2L2 | SKIV2L2 | SKIV2L2 | 9514 | -0.0074 | 0.39 | NO |
| 49 | DCP1B | DCP1B | DCP1B | 9957 | -0.014 | 0.37 | NO |
| 50 | CNOT6L | CNOT6L | CNOT6L | 10298 | -0.019 | 0.36 | NO |
| 51 | DCP2 | DCP2 | DCP2 | 10488 | -0.022 | 0.36 | NO |
| 52 | LSM6 | LSM6 | LSM6 | 10685 | -0.025 | 0.35 | NO |
| 53 | ENO1 | ENO1 | ENO1 | 10814 | -0.027 | 0.35 | NO |
| 54 | CNOT4 | CNOT4 | CNOT4 | 10948 | -0.03 | 0.36 | NO |
| 55 | PARN | PARN | PARN | 11036 | -0.031 | 0.36 | NO |
| 56 | DIS3 | DIS3 | DIS3 | 11402 | -0.038 | 0.35 | NO |
| 57 | CNOT8 | CNOT8 | CNOT8 | 13539 | -0.086 | 0.26 | NO |
Figure S61. Get High-res Image This plot shows mRNAseq_cNMF expression data heatmap (on the left) a RunningEnrichmentScore(RES) plot (on the top right) and a Signal2Noise(S2N) plot (on the bottom right) of genes in the pathway: KEGG AMINOACYL TRNA BIOSYNTHESIS.
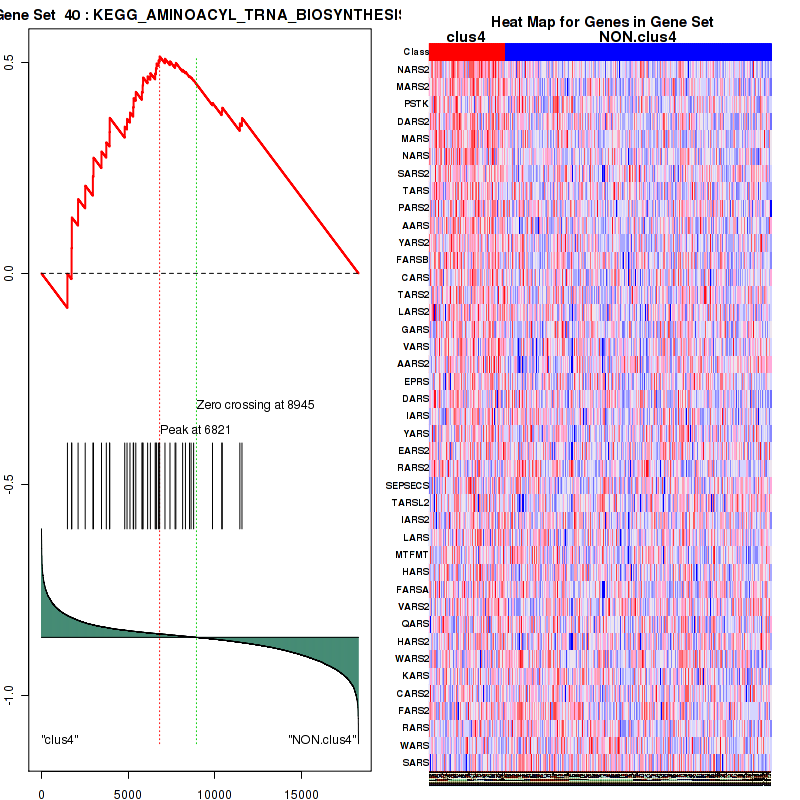
Figure S62. Get High-res Image For the top 5 core enriched genes in the pathway: KEGG AMINOACYL TRNA BIOSYNTHESIS, this volcano plot shows how much they are up/down-regulated and significant. The significance was calculated by empirical bayesian fit
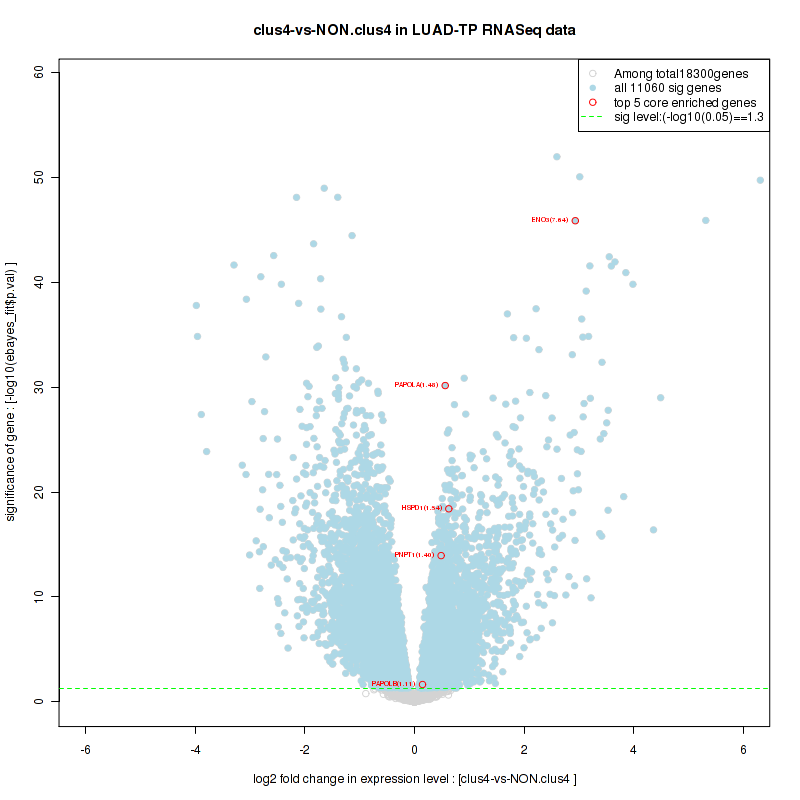
Table S32. Get Full Table This table shows a Running Enrichment Score (RES) of each gene in this pathway, that is, the enrichment score at this point in the ranked list of genes. All genes are ranked by Signal-to-Noise (S2N), a measure of similarity as default and are used to obtain ES matrix of all genes. In this way, GSEA tool uses expression pattern of not only overlapped genes but also not-overlapped genes to produce ES matrix.
| Rank | GENE | SYMBOL | DESC | LIST.LOC | S2N | RES | CORE_ENRICHMENT |
|---|---|---|---|---|---|---|---|
| 1 | SNRPF | SNRPF | SNRPF | 1656 | 0.16 | -0.066 | YES |
| 2 | SNRPD1 | SNRPD1 | SNRPD1 | 1999 | 0.14 | -0.063 | YES |
| 3 | NUP210 | NUP210 | NUP210 | 2104 | 0.13 | -0.048 | YES |
| 4 | TXNL4A | TXNL4A | TXNL4A | 2119 | 0.13 | -0.028 | YES |
| 5 | RAE1 | RAE1 | RAE1 | 2317 | 0.12 | -0.019 | YES |
| 6 | SNRPA1 | SNRPA1 | SNRPA1 | 2352 | 0.12 | -0.0024 | YES |
| 7 | MNAT1 | MNAT1 | MNAT1 | 2369 | 0.12 | 0.016 | YES |
| 8 | UPF3B | UPF3B | UPF3B | 2435 | 0.12 | 0.03 | YES |
| 9 | PAPOLA | PAPOLA | PAPOLA | 2455 | 0.12 | 0.048 | YES |
| 10 | SNRPB | SNRPB | SNRPB | 2500 | 0.11 | 0.063 | YES |
| 11 | METTL3 | METTL3 | METTL3 | 2507 | 0.11 | 0.081 | YES |
| 12 | NUP107 | NUP107 | NUP107 | 2671 | 0.11 | 0.089 | YES |
| 13 | SEH1L | SEH1L | SEH1L | 2878 | 0.1 | 0.093 | YES |
| 14 | PABPN1 | PABPN1 | PABPN1 | 2912 | 0.099 | 0.11 | YES |
| 15 | SNRPE | SNRPE | SNRPE | 2987 | 0.097 | 0.12 | YES |
| 16 | SNRPG | SNRPG | SNRPG | 3205 | 0.09 | 0.12 | YES |
| 17 | CCAR1 | CCAR1 | CCAR1 | 3245 | 0.089 | 0.13 | YES |
| 18 | CPSF1 | CPSF1 | CPSF1 | 3275 | 0.088 | 0.14 | YES |
| 19 | NUP35 | NUP35 | NUP35 | 3412 | 0.085 | 0.15 | YES |
| 20 | CSTF3 | CSTF3 | CSTF3 | 3510 | 0.082 | 0.16 | YES |
| 21 | CSTF1 | CSTF1 | CSTF1 | 3511 | 0.082 | 0.17 | YES |
| 22 | LSM2 | LSM2 | LSM2 | 3629 | 0.08 | 0.18 | YES |
| 23 | POLR2H | POLR2H | POLR2H | 3699 | 0.078 | 0.18 | YES |
| 24 | NUP37 | NUP37 | NUP37 | 3765 | 0.076 | 0.19 | YES |
| 25 | SNRPB2 | SNRPB2 | SNRPB2 | 3811 | 0.075 | 0.2 | YES |
| 26 | POLR2K | POLR2K | POLR2K | 3815 | 0.075 | 0.22 | YES |
| 27 | NUP88 | NUP88 | NUP88 | 3981 | 0.071 | 0.22 | YES |
| 28 | HNRNPA0 | HNRNPA0 | HNRNPA0 | 4309 | 0.064 | 0.21 | YES |
| 29 | CPSF3 | CPSF3 | CPSF3 | 4333 | 0.063 | 0.22 | YES |
| 30 | NUP155 | NUP155 | NUP155 | 4369 | 0.063 | 0.22 | YES |
| 31 | SMC1A | SMC1A | SMC1A | 4457 | 0.061 | 0.23 | YES |
| 32 | AAAS | AAAS | AAAS | 4474 | 0.061 | 0.24 | YES |
| 33 | PCBP2 | PCBP2 | PCBP2 | 4650 | 0.058 | 0.24 | YES |
| 34 | MAGOH | MAGOH | MAGOH | 4670 | 0.058 | 0.25 | YES |
| 35 | GTF2H4 | GTF2H4 | GTF2H4 | 4710 | 0.058 | 0.25 | YES |
| 36 | THOC4 | THOC4 | THOC4 | 4766 | 0.056 | 0.26 | YES |
| 37 | U2AF2 | U2AF2 | U2AF2 | 4778 | 0.056 | 0.27 | YES |
| 38 | HNRNPA3 | HNRNPA3 | HNRNPA3 | 4941 | 0.054 | 0.27 | YES |
| 39 | POLR2F | POLR2F | POLR2F | 4989 | 0.053 | 0.27 | YES |
| 40 | SNRPA | SNRPA | SNRPA | 5051 | 0.052 | 0.28 | YES |
| 41 | ZNF473 | ZNF473 | ZNF473 | 5088 | 0.051 | 0.28 | YES |
| 42 | GTF2F2 | GTF2F2 | GTF2F2 | 5104 | 0.051 | 0.29 | YES |
| 43 | FUS | FUS | FUS | 5151 | 0.05 | 0.3 | YES |
| 44 | CSTF2 | CSTF2 | CSTF2 | 5181 | 0.049 | 0.3 | YES |
| 45 | POLR2D | POLR2D | POLR2D | 5262 | 0.048 | 0.3 | YES |
| 46 | NUP133 | NUP133 | NUP133 | 5279 | 0.048 | 0.31 | YES |
| 47 | NUP85 | NUP85 | NUP85 | 5360 | 0.047 | 0.32 | YES |
| 48 | NUP153 | NUP153 | NUP153 | 5396 | 0.046 | 0.32 | YES |
| 49 | NFX1 | NFX1 | NFX1 | 5397 | 0.046 | 0.33 | YES |
| 50 | NCBP1 | NCBP1 | NCBP1 | 5468 | 0.045 | 0.33 | YES |
| 51 | POLR2G | POLR2G | POLR2G | 5544 | 0.044 | 0.33 | YES |
| 52 | PRPF4 | PRPF4 | PRPF4 | 5591 | 0.043 | 0.34 | YES |
| 53 | NUP43 | NUP43 | NUP43 | 5618 | 0.043 | 0.34 | YES |
| 54 | HNRNPL | HNRNPL | HNRNPL | 5622 | 0.043 | 0.35 | YES |
| 55 | SNRNP200 | SNRNP200 | SNRNP200 | 5643 | 0.043 | 0.36 | YES |
| 56 | SLBP | SLBP | SLBP | 5663 | 0.042 | 0.36 | YES |
| 57 | RBMX | RBMX | RBMX | 5679 | 0.042 | 0.37 | YES |
| 58 | CPSF7 | CPSF7 | CPSF7 | 5702 | 0.042 | 0.37 | YES |
| 59 | DHX9 | DHX9 | DHX9 | 5725 | 0.041 | 0.38 | YES |
| 60 | SNRPD3 | SNRPD3 | SNRPD3 | 5767 | 0.041 | 0.38 | YES |
| 61 | POLR2J | POLR2J | POLR2J | 5856 | 0.04 | 0.38 | YES |
| 62 | HNRNPD | HNRNPD | HNRNPD | 5961 | 0.038 | 0.38 | YES |
| 63 | HNRNPR | HNRNPR | HNRNPR | 5965 | 0.038 | 0.39 | YES |
| 64 | NUP205 | NUP205 | NUP205 | 5975 | 0.038 | 0.39 | YES |
| 65 | HNRNPA1 | HNRNPA1 | HNRNPA1 | 5978 | 0.038 | 0.4 | YES |
| 66 | RNMT | RNMT | RNMT | 6048 | 0.037 | 0.4 | YES |
| 67 | DDX23 | DDX23 | DDX23 | 6072 | 0.037 | 0.41 | YES |
| 68 | CPSF2 | CPSF2 | CPSF2 | 6172 | 0.035 | 0.41 | YES |
| 69 | SF3B3 | SF3B3 | SF3B3 | 6254 | 0.034 | 0.41 | YES |
| 70 | SF3B4 | SF3B4 | SF3B4 | 6309 | 0.034 | 0.41 | YES |
| 71 | HNRNPC | HNRNPC | HNRNPC | 6318 | 0.033 | 0.41 | YES |
| 72 | GTF2H2B | GTF2H2B | GTF2H2B | 6340 | 0.033 | 0.42 | YES |
| 73 | SF3B1 | SF3B1 | SF3B1 | 6341 | 0.033 | 0.42 | YES |
| 74 | RANBP2 | RANBP2 | RANBP2 | 6372 | 0.033 | 0.43 | YES |
| 75 | SNRNP70 | SNRNP70 | SNRNP70 | 6436 | 0.032 | 0.43 | YES |
| 76 | PRPF6 | PRPF6 | PRPF6 | 6457 | 0.032 | 0.43 | YES |
| 77 | NUP188 | NUP188 | NUP188 | 6474 | 0.032 | 0.44 | YES |
| 78 | POLR2B | POLR2B | POLR2B | 6570 | 0.03 | 0.44 | YES |
| 79 | SF3B2 | SF3B2 | SF3B2 | 6586 | 0.03 | 0.44 | YES |
| 80 | ERCC3 | ERCC3 | ERCC3 | 6596 | 0.03 | 0.44 | YES |
| 81 | HNRNPH2 | HNRNPH2 | HNRNPH2 | 6601 | 0.03 | 0.45 | YES |
| 82 | HNRNPM | HNRNPM | HNRNPM | 6613 | 0.03 | 0.45 | YES |
| 83 | SF3B14 | SF3B14 | SF3B14 | 6618 | 0.03 | 0.46 | YES |
| 84 | PCBP1 | PCBP1 | PCBP1 | 6671 | 0.029 | 0.46 | YES |
| 85 | SNRPD2 | SNRPD2 | SNRPD2 | 6733 | 0.028 | 0.46 | YES |
| 86 | HNRNPA2B1 | HNRNPA2B1 | HNRNPA2B1 | 6781 | 0.028 | 0.46 | YES |
| 87 | HNRNPU | HNRNPU | HNRNPU | 6921 | 0.026 | 0.46 | YES |
| 88 | RBM8A | RBM8A | RBM8A | 6995 | 0.025 | 0.46 | YES |
| 89 | HNRNPF | HNRNPF | HNRNPF | 7004 | 0.025 | 0.46 | YES |
| 90 | POLR2I | POLR2I | POLR2I | 7031 | 0.025 | 0.46 | YES |
| 91 | SF3B5 | SF3B5 | SF3B5 | 7108 | 0.024 | 0.46 | YES |
| 92 | POLR2A | POLR2A | POLR2A | 7216 | 0.022 | 0.46 | YES |
| 93 | YBX1 | YBX1 | YBX1 | 7281 | 0.022 | 0.46 | YES |
| 94 | EFTUD2 | EFTUD2 | EFTUD2 | 7347 | 0.021 | 0.46 | YES |
| 95 | PCF11 | PCF11 | PCF11 | 7489 | 0.019 | 0.46 | YES |
| 96 | NUP50 | NUP50 | NUP50 | 7494 | 0.019 | 0.46 | YES |
| 97 | NCBP2 | NCBP2 | NCBP2 | 7507 | 0.019 | 0.46 | YES |
| 98 | HNRNPK | HNRNPK | HNRNPK | 7509 | 0.018 | 0.46 | YES |
| 99 | NXF1 | NXF1 | NXF1 | 7568 | 0.018 | 0.46 | YES |
| 100 | TPR | TPR | TPR | 7586 | 0.018 | 0.46 | YES |
| 101 | NUP93 | NUP93 | NUP93 | 7587 | 0.018 | 0.47 | YES |
| 102 | RNPS1 | RNPS1 | RNPS1 | 7646 | 0.017 | 0.47 | YES |
| 103 | NUPL2 | NUPL2 | NUPL2 | 7712 | 0.016 | 0.47 | YES |
| 104 | RNGTT | RNGTT | RNGTT | 7724 | 0.016 | 0.47 | YES |
| 105 | NUP214 | NUP214 | NUP214 | 7770 | 0.015 | 0.47 | YES |
| 106 | PTBP1 | PTBP1 | PTBP1 | 7780 | 0.015 | 0.47 | YES |
| 107 | PRPF8 | PRPF8 | PRPF8 | 7791 | 0.015 | 0.47 | YES |
| 108 | SF3A3 | SF3A3 | SF3A3 | 7850 | 0.014 | 0.47 | NO |
| 109 | CLP1 | CLP1 | CLP1 | 8022 | 0.012 | 0.46 | NO |
| 110 | HNRNPH1 | HNRNPH1 | HNRNPH1 | 8291 | 0.0086 | 0.45 | NO |
| 111 | SF3A2 | SF3A2 | SF3A2 | 8332 | 0.0081 | 0.45 | NO |
| 112 | GTF2H2 | GTF2H2 | GTF2H2 | 8466 | 0.0062 | 0.44 | NO |
| 113 | RBM5 | RBM5 | RBM5 | 8500 | 0.0056 | 0.44 | NO |
| 114 | CD2BP2 | CD2BP2 | CD2BP2 | 8513 | 0.0055 | 0.44 | NO |
| 115 | U2AF1 | U2AF1 | U2AF1 | 8520 | 0.0055 | 0.44 | NO |
| 116 | GTF2H1 | GTF2H1 | GTF2H1 | 8644 | 0.004 | 0.44 | NO |
| 117 | NUDT21 | NUDT21 | NUDT21 | 8655 | 0.0037 | 0.44 | NO |
| 118 | EIF4E | EIF4E | EIF4E | 8706 | 0.0031 | 0.43 | NO |
| 119 | ADAR | ADAR | ADAR | 8714 | 0.003 | 0.43 | NO |
| 120 | GTF2H3 | GTF2H3 | GTF2H3 | 8881 | 0.00085 | 0.42 | NO |
| 121 | HNRNPUL1 | HNRNPUL1 | HNRNPUL1 | 8947 | -0.000025 | 0.42 | NO |
| 122 | PHF5A | PHF5A | PHF5A | 8985 | -0.00057 | 0.42 | NO |
| 123 | SRRM1 | SRRM1 | SRRM1 | 9011 | -0.001 | 0.42 | NO |
| 124 | POLR2E | POLR2E | POLR2E | 9031 | -0.0013 | 0.42 | NO |
| 125 | SNRNP40 | SNRNP40 | SNRNP40 | 9150 | -0.0028 | 0.41 | NO |
| 126 | DHX38 | DHX38 | DHX38 | 9378 | -0.0056 | 0.4 | NO |
| 127 | NHP2L1 | NHP2L1 | NHP2L1 | 9440 | -0.0064 | 0.4 | NO |
| 128 | SUPT5H | SUPT5H | SUPT5H | 9526 | -0.0075 | 0.39 | NO |
| 129 | POM121 | POM121 | POM121 | 9740 | -0.011 | 0.38 | NO |
| 130 | DNAJC8 | DNAJC8 | DNAJC8 | 9763 | -0.011 | 0.38 | NO |
| 131 | NUP62 | NUP62 | NUP62 | 9825 | -0.012 | 0.38 | NO |
| 132 | NUP54 | NUP54 | NUP54 | 9855 | -0.012 | 0.38 | NO |
| 133 | POLR2C | POLR2C | POLR2C | 9921 | -0.013 | 0.38 | NO |
| 134 | LSM10 | LSM10 | LSM10 | 10066 | -0.015 | 0.38 | NO |
| 135 | CDK7 | CDK7 | CDK7 | 10133 | -0.016 | 0.38 | NO |
| 136 | ERCC2 | ERCC2 | ERCC2 | 10137 | -0.016 | 0.38 | NO |
| 137 | SF3A1 | SF3A1 | SF3A1 | 10245 | -0.018 | 0.37 | NO |
| 138 | CDC40 | CDC40 | CDC40 | 10478 | -0.022 | 0.36 | NO |
| 139 | NUPL1 | NUPL1 | NUPL1 | 10874 | -0.028 | 0.35 | NO |
| 140 | LSM11 | LSM11 | LSM11 | 11125 | -0.032 | 0.34 | NO |
| 141 | GTF2F1 | GTF2F1 | GTF2F1 | 11709 | -0.043 | 0.31 | NO |
| 142 | POLR2L | POLR2L | POLR2L | 11833 | -0.046 | 0.31 | NO |
| 143 | CCNH | CCNH | CCNH | 12287 | -0.055 | 0.3 | NO |
| 144 | APOBEC1 | APOBEC1 | APOBEC1 | 13557 | -0.086 | 0.24 | NO |
| 145 | ADARB1 | ADARB1 | ADARB1 | 14747 | -0.13 | 0.2 | NO |
Figure S63. Get High-res Image This plot shows mRNAseq_cNMF expression data heatmap (on the left) a RunningEnrichmentScore(RES) plot (on the top right) and a Signal2Noise(S2N) plot (on the bottom right) of genes in the pathway: KEGG RNA DEGRADATION.
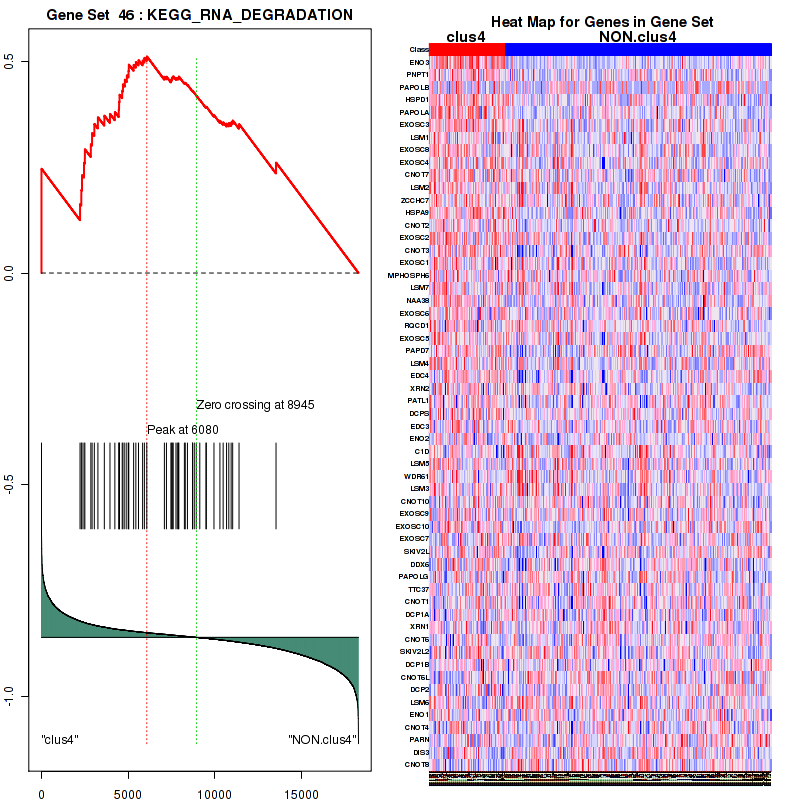
Figure S64. Get High-res Image For the top 5 core enriched genes in the pathway: KEGG RNA DEGRADATION, this volcano plot shows how much they are up/down-regulated and significant. The significance was calculated by empirical bayesian fit

Table S33. Get Full Table This table shows a Running Enrichment Score (RES) of each gene in this pathway, that is, the enrichment score at this point in the ranked list of genes. All genes are ranked by Signal-to-Noise (S2N), a measure of similarity as default and are used to obtain ES matrix of all genes. In this way, GSEA tool uses expression pattern of not only overlapped genes but also not-overlapped genes to produce ES matrix.
| Rank | GENE | SYMBOL | DESC | LIST.LOC | S2N | RES | CORE_ENRICHMENT |
|---|---|---|---|---|---|---|---|
| 1 | SNRPF | SNRPF | SNRPF | 1656 | 0.16 | -0.063 | YES |
| 2 | SNRPD1 | SNRPD1 | SNRPD1 | 1999 | 0.14 | -0.057 | YES |
| 3 | NUP210 | NUP210 | NUP210 | 2104 | 0.13 | -0.039 | YES |
| 4 | TXNL4A | TXNL4A | TXNL4A | 2119 | 0.13 | -0.016 | YES |
| 5 | RAE1 | RAE1 | RAE1 | 2317 | 0.12 | -0.0057 | YES |
| 6 | SNRPA1 | SNRPA1 | SNRPA1 | 2352 | 0.12 | 0.014 | YES |
| 7 | UPF3B | UPF3B | UPF3B | 2435 | 0.12 | 0.03 | YES |
| 8 | PAPOLA | PAPOLA | PAPOLA | 2455 | 0.12 | 0.05 | YES |
| 9 | SNRPB | SNRPB | SNRPB | 2500 | 0.11 | 0.067 | YES |
| 10 | METTL3 | METTL3 | METTL3 | 2507 | 0.11 | 0.087 | YES |
| 11 | NUP107 | NUP107 | NUP107 | 2671 | 0.11 | 0.097 | YES |
| 12 | SEH1L | SEH1L | SEH1L | 2878 | 0.1 | 0.1 | YES |
| 13 | PABPN1 | PABPN1 | PABPN1 | 2912 | 0.099 | 0.12 | YES |
| 14 | SNRPE | SNRPE | SNRPE | 2987 | 0.097 | 0.13 | YES |
| 15 | SNRPG | SNRPG | SNRPG | 3205 | 0.09 | 0.14 | YES |
| 16 | CCAR1 | CCAR1 | CCAR1 | 3245 | 0.089 | 0.15 | YES |
| 17 | CPSF1 | CPSF1 | CPSF1 | 3275 | 0.088 | 0.16 | YES |
| 18 | NUP35 | NUP35 | NUP35 | 3412 | 0.085 | 0.17 | YES |
| 19 | CSTF3 | CSTF3 | CSTF3 | 3510 | 0.082 | 0.18 | YES |
| 20 | CSTF1 | CSTF1 | CSTF1 | 3511 | 0.082 | 0.2 | YES |
| 21 | LSM2 | LSM2 | LSM2 | 3629 | 0.08 | 0.2 | YES |
| 22 | POLR2H | POLR2H | POLR2H | 3699 | 0.078 | 0.21 | YES |
| 23 | NUP37 | NUP37 | NUP37 | 3765 | 0.076 | 0.22 | YES |
| 24 | SNRPB2 | SNRPB2 | SNRPB2 | 3811 | 0.075 | 0.23 | YES |
| 25 | POLR2K | POLR2K | POLR2K | 3815 | 0.075 | 0.25 | YES |
| 26 | NUP88 | NUP88 | NUP88 | 3981 | 0.071 | 0.25 | YES |
| 27 | HNRNPA0 | HNRNPA0 | HNRNPA0 | 4309 | 0.064 | 0.24 | YES |
| 28 | CPSF3 | CPSF3 | CPSF3 | 4333 | 0.063 | 0.25 | YES |
| 29 | NUP155 | NUP155 | NUP155 | 4369 | 0.063 | 0.26 | YES |
| 30 | SMC1A | SMC1A | SMC1A | 4457 | 0.061 | 0.27 | YES |
| 31 | AAAS | AAAS | AAAS | 4474 | 0.061 | 0.28 | YES |
| 32 | PCBP2 | PCBP2 | PCBP2 | 4650 | 0.058 | 0.28 | YES |
| 33 | MAGOH | MAGOH | MAGOH | 4670 | 0.058 | 0.29 | YES |
| 34 | THOC4 | THOC4 | THOC4 | 4766 | 0.056 | 0.29 | YES |
| 35 | U2AF2 | U2AF2 | U2AF2 | 4778 | 0.056 | 0.3 | YES |
| 36 | HNRNPA3 | HNRNPA3 | HNRNPA3 | 4941 | 0.054 | 0.3 | YES |
| 37 | POLR2F | POLR2F | POLR2F | 4989 | 0.053 | 0.31 | YES |
| 38 | SNRPA | SNRPA | SNRPA | 5051 | 0.052 | 0.32 | YES |
| 39 | GTF2F2 | GTF2F2 | GTF2F2 | 5104 | 0.051 | 0.32 | YES |
| 40 | FUS | FUS | FUS | 5151 | 0.05 | 0.33 | YES |
| 41 | CSTF2 | CSTF2 | CSTF2 | 5181 | 0.049 | 0.34 | YES |
| 42 | POLR2D | POLR2D | POLR2D | 5262 | 0.048 | 0.34 | YES |
| 43 | NUP133 | NUP133 | NUP133 | 5279 | 0.048 | 0.35 | YES |
| 44 | NUP85 | NUP85 | NUP85 | 5360 | 0.047 | 0.35 | YES |
| 45 | NUP153 | NUP153 | NUP153 | 5396 | 0.046 | 0.36 | YES |
| 46 | NFX1 | NFX1 | NFX1 | 5397 | 0.046 | 0.37 | YES |
| 47 | NCBP1 | NCBP1 | NCBP1 | 5468 | 0.045 | 0.37 | YES |
| 48 | POLR2G | POLR2G | POLR2G | 5544 | 0.044 | 0.37 | YES |
| 49 | PRPF4 | PRPF4 | PRPF4 | 5591 | 0.043 | 0.38 | YES |
| 50 | NUP43 | NUP43 | NUP43 | 5618 | 0.043 | 0.38 | YES |
| 51 | HNRNPL | HNRNPL | HNRNPL | 5622 | 0.043 | 0.39 | YES |
| 52 | SNRNP200 | SNRNP200 | SNRNP200 | 5643 | 0.043 | 0.4 | YES |
| 53 | SLBP | SLBP | SLBP | 5663 | 0.042 | 0.4 | YES |
| 54 | RBMX | RBMX | RBMX | 5679 | 0.042 | 0.41 | YES |
| 55 | CPSF7 | CPSF7 | CPSF7 | 5702 | 0.042 | 0.42 | YES |
| 56 | DHX9 | DHX9 | DHX9 | 5725 | 0.041 | 0.42 | YES |
| 57 | SNRPD3 | SNRPD3 | SNRPD3 | 5767 | 0.041 | 0.43 | YES |
| 58 | POLR2J | POLR2J | POLR2J | 5856 | 0.04 | 0.43 | YES |
| 59 | HNRNPD | HNRNPD | HNRNPD | 5961 | 0.038 | 0.43 | YES |
| 60 | HNRNPR | HNRNPR | HNRNPR | 5965 | 0.038 | 0.44 | YES |
| 61 | NUP205 | NUP205 | NUP205 | 5975 | 0.038 | 0.44 | YES |
| 62 | HNRNPA1 | HNRNPA1 | HNRNPA1 | 5978 | 0.038 | 0.45 | YES |
| 63 | DDX23 | DDX23 | DDX23 | 6072 | 0.037 | 0.45 | YES |
| 64 | CPSF2 | CPSF2 | CPSF2 | 6172 | 0.035 | 0.45 | YES |
| 65 | SF3B3 | SF3B3 | SF3B3 | 6254 | 0.034 | 0.46 | YES |
| 66 | SF3B4 | SF3B4 | SF3B4 | 6309 | 0.034 | 0.46 | YES |
| 67 | HNRNPC | HNRNPC | HNRNPC | 6318 | 0.033 | 0.46 | YES |
| 68 | SF3B1 | SF3B1 | SF3B1 | 6341 | 0.033 | 0.47 | YES |
| 69 | RANBP2 | RANBP2 | RANBP2 | 6372 | 0.033 | 0.47 | YES |
| 70 | SNRNP70 | SNRNP70 | SNRNP70 | 6436 | 0.032 | 0.47 | YES |
| 71 | PRPF6 | PRPF6 | PRPF6 | 6457 | 0.032 | 0.48 | YES |
| 72 | NUP188 | NUP188 | NUP188 | 6474 | 0.032 | 0.48 | YES |
| 73 | POLR2B | POLR2B | POLR2B | 6570 | 0.03 | 0.48 | YES |
| 74 | SF3B2 | SF3B2 | SF3B2 | 6586 | 0.03 | 0.49 | YES |
| 75 | HNRNPH2 | HNRNPH2 | HNRNPH2 | 6601 | 0.03 | 0.49 | YES |
| 76 | HNRNPM | HNRNPM | HNRNPM | 6613 | 0.03 | 0.5 | YES |
| 77 | SF3B14 | SF3B14 | SF3B14 | 6618 | 0.03 | 0.5 | YES |
| 78 | PCBP1 | PCBP1 | PCBP1 | 6671 | 0.029 | 0.5 | YES |
| 79 | SNRPD2 | SNRPD2 | SNRPD2 | 6733 | 0.028 | 0.51 | YES |
| 80 | HNRNPA2B1 | HNRNPA2B1 | HNRNPA2B1 | 6781 | 0.028 | 0.51 | YES |
| 81 | HNRNPU | HNRNPU | HNRNPU | 6921 | 0.026 | 0.5 | YES |
| 82 | RBM8A | RBM8A | RBM8A | 6995 | 0.025 | 0.51 | YES |
| 83 | HNRNPF | HNRNPF | HNRNPF | 7004 | 0.025 | 0.51 | YES |
| 84 | POLR2I | POLR2I | POLR2I | 7031 | 0.025 | 0.51 | YES |
| 85 | SF3B5 | SF3B5 | SF3B5 | 7108 | 0.024 | 0.51 | YES |
| 86 | POLR2A | POLR2A | POLR2A | 7216 | 0.022 | 0.51 | YES |
| 87 | YBX1 | YBX1 | YBX1 | 7281 | 0.022 | 0.51 | YES |
| 88 | EFTUD2 | EFTUD2 | EFTUD2 | 7347 | 0.021 | 0.51 | YES |
| 89 | PCF11 | PCF11 | PCF11 | 7489 | 0.019 | 0.51 | YES |
| 90 | NUP50 | NUP50 | NUP50 | 7494 | 0.019 | 0.51 | YES |
| 91 | NCBP2 | NCBP2 | NCBP2 | 7507 | 0.019 | 0.51 | YES |
| 92 | HNRNPK | HNRNPK | HNRNPK | 7509 | 0.018 | 0.52 | YES |
| 93 | NXF1 | NXF1 | NXF1 | 7568 | 0.018 | 0.52 | YES |
| 94 | TPR | TPR | TPR | 7586 | 0.018 | 0.52 | YES |
| 95 | NUP93 | NUP93 | NUP93 | 7587 | 0.018 | 0.52 | YES |
| 96 | RNPS1 | RNPS1 | RNPS1 | 7646 | 0.017 | 0.52 | YES |
| 97 | NUPL2 | NUPL2 | NUPL2 | 7712 | 0.016 | 0.52 | YES |
| 98 | NUP214 | NUP214 | NUP214 | 7770 | 0.015 | 0.52 | YES |
| 99 | PTBP1 | PTBP1 | PTBP1 | 7780 | 0.015 | 0.52 | YES |
| 100 | PRPF8 | PRPF8 | PRPF8 | 7791 | 0.015 | 0.52 | YES |
| 101 | SF3A3 | SF3A3 | SF3A3 | 7850 | 0.014 | 0.52 | NO |
| 102 | CLP1 | CLP1 | CLP1 | 8022 | 0.012 | 0.52 | NO |
| 103 | HNRNPH1 | HNRNPH1 | HNRNPH1 | 8291 | 0.0086 | 0.5 | NO |
| 104 | SF3A2 | SF3A2 | SF3A2 | 8332 | 0.0081 | 0.5 | NO |
| 105 | RBM5 | RBM5 | RBM5 | 8500 | 0.0056 | 0.49 | NO |
| 106 | CD2BP2 | CD2BP2 | CD2BP2 | 8513 | 0.0055 | 0.49 | NO |
| 107 | U2AF1 | U2AF1 | U2AF1 | 8520 | 0.0055 | 0.5 | NO |
| 108 | NUDT21 | NUDT21 | NUDT21 | 8655 | 0.0037 | 0.49 | NO |
| 109 | EIF4E | EIF4E | EIF4E | 8706 | 0.0031 | 0.49 | NO |
| 110 | HNRNPUL1 | HNRNPUL1 | HNRNPUL1 | 8947 | -0.000025 | 0.47 | NO |
| 111 | PHF5A | PHF5A | PHF5A | 8985 | -0.00057 | 0.47 | NO |
| 112 | SRRM1 | SRRM1 | SRRM1 | 9011 | -0.001 | 0.47 | NO |
| 113 | POLR2E | POLR2E | POLR2E | 9031 | -0.0013 | 0.47 | NO |
| 114 | SNRNP40 | SNRNP40 | SNRNP40 | 9150 | -0.0028 | 0.46 | NO |
| 115 | DHX38 | DHX38 | DHX38 | 9378 | -0.0056 | 0.45 | NO |
| 116 | NHP2L1 | NHP2L1 | NHP2L1 | 9440 | -0.0064 | 0.45 | NO |
| 117 | POM121 | POM121 | POM121 | 9740 | -0.011 | 0.43 | NO |
| 118 | DNAJC8 | DNAJC8 | DNAJC8 | 9763 | -0.011 | 0.44 | NO |
| 119 | NUP62 | NUP62 | NUP62 | 9825 | -0.012 | 0.43 | NO |
| 120 | NUP54 | NUP54 | NUP54 | 9855 | -0.012 | 0.43 | NO |
| 121 | POLR2C | POLR2C | POLR2C | 9921 | -0.013 | 0.43 | NO |
| 122 | SF3A1 | SF3A1 | SF3A1 | 10245 | -0.018 | 0.42 | NO |
| 123 | CDC40 | CDC40 | CDC40 | 10478 | -0.022 | 0.41 | NO |
| 124 | NUPL1 | NUPL1 | NUPL1 | 10874 | -0.028 | 0.39 | NO |
| 125 | GTF2F1 | GTF2F1 | GTF2F1 | 11709 | -0.043 | 0.36 | NO |
| 126 | POLR2L | POLR2L | POLR2L | 11833 | -0.046 | 0.36 | NO |
Figure S65. Get High-res Image This plot shows mRNAseq_cNMF expression data heatmap (on the left) a RunningEnrichmentScore(RES) plot (on the top right) and a Signal2Noise(S2N) plot (on the bottom right) of genes in the pathway: REACTOME METABOLISM OF NON CODING RNA.
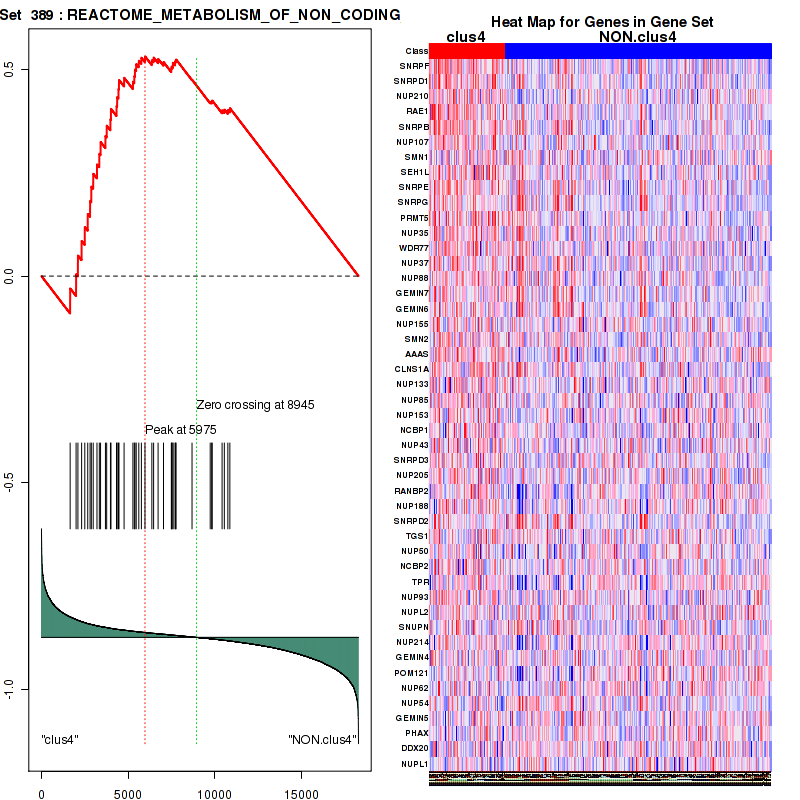
Figure S66. Get High-res Image For the top 5 core enriched genes in the pathway: REACTOME METABOLISM OF NON CODING RNA, this volcano plot shows how much they are up/down-regulated and significant. The significance was calculated by empirical bayesian fit

Table S34. Get Full Table This table shows a Running Enrichment Score (RES) of each gene in this pathway, that is, the enrichment score at this point in the ranked list of genes. All genes are ranked by Signal-to-Noise (S2N), a measure of similarity as default and are used to obtain ES matrix of all genes. In this way, GSEA tool uses expression pattern of not only overlapped genes but also not-overlapped genes to produce ES matrix.
| Rank | GENE | SYMBOL | DESC | LIST.LOC | S2N | RES | CORE_ENRICHMENT |
|---|---|---|---|---|---|---|---|
| 1 | SNRPF | SNRPF | SNRPF | 1656 | 0.16 | -0.055 | YES |
| 2 | TAF5 | TAF5 | TAF5 | 1705 | 0.16 | -0.022 | YES |
| 3 | TH1L | TH1L | TH1L | 1898 | 0.14 | -0.00022 | YES |
| 4 | TAF4 | TAF4 | TAF4 | 2165 | 0.13 | 0.014 | YES |
| 5 | TCEB1 | TCEB1 | TCEB1 | 2220 | 0.13 | 0.04 | YES |
| 6 | MNAT1 | MNAT1 | MNAT1 | 2369 | 0.12 | 0.059 | YES |
| 7 | UPF3B | UPF3B | UPF3B | 2435 | 0.12 | 0.082 | YES |
| 8 | PAPOLA | PAPOLA | PAPOLA | 2455 | 0.12 | 0.11 | YES |
| 9 | SNRPB | SNRPB | SNRPB | 2500 | 0.11 | 0.13 | YES |
| 10 | PABPN1 | PABPN1 | PABPN1 | 2912 | 0.099 | 0.13 | YES |
| 11 | TAF11 | TAF11 | TAF11 | 2929 | 0.099 | 0.15 | YES |
| 12 | SNRPE | SNRPE | SNRPE | 2987 | 0.097 | 0.17 | YES |
| 13 | SNRPG | SNRPG | SNRPG | 3205 | 0.09 | 0.18 | YES |
| 14 | CPSF1 | CPSF1 | CPSF1 | 3275 | 0.088 | 0.2 | YES |
| 15 | CSTF3 | CSTF3 | CSTF3 | 3510 | 0.082 | 0.2 | YES |
| 16 | CSTF1 | CSTF1 | CSTF1 | 3511 | 0.082 | 0.22 | YES |
| 17 | POLR2H | POLR2H | POLR2H | 3699 | 0.078 | 0.23 | YES |
| 18 | POLR2K | POLR2K | POLR2K | 3815 | 0.075 | 0.24 | YES |
| 19 | TBP | TBP | TBP | 4009 | 0.07 | 0.24 | YES |
| 20 | CPSF3 | CPSF3 | CPSF3 | 4333 | 0.063 | 0.24 | YES |
| 21 | SSRP1 | SSRP1 | SSRP1 | 4442 | 0.062 | 0.25 | YES |
| 22 | SUPT16H | SUPT16H | SUPT16H | 4453 | 0.062 | 0.26 | YES |
| 23 | GTF2A1 | GTF2A1 | GTF2A1 | 4593 | 0.059 | 0.27 | YES |
| 24 | MAGOH | MAGOH | MAGOH | 4670 | 0.058 | 0.28 | YES |
| 25 | GTF2H4 | GTF2H4 | GTF2H4 | 4710 | 0.058 | 0.28 | YES |
| 26 | THOC4 | THOC4 | THOC4 | 4766 | 0.056 | 0.3 | YES |
| 27 | U2AF2 | U2AF2 | U2AF2 | 4778 | 0.056 | 0.31 | YES |
| 28 | POLR2F | POLR2F | POLR2F | 4989 | 0.053 | 0.31 | YES |
| 29 | TCEA1 | TCEA1 | TCEA1 | 5009 | 0.052 | 0.32 | YES |
| 30 | GTF2A2 | GTF2A2 | GTF2A2 | 5064 | 0.052 | 0.33 | YES |
| 31 | ZNF473 | ZNF473 | ZNF473 | 5088 | 0.051 | 0.34 | YES |
| 32 | GTF2F2 | GTF2F2 | GTF2F2 | 5104 | 0.051 | 0.35 | YES |
| 33 | CSTF2 | CSTF2 | CSTF2 | 5181 | 0.049 | 0.36 | YES |
| 34 | GTF2E2 | GTF2E2 | GTF2E2 | 5252 | 0.048 | 0.36 | YES |
| 35 | POLR2D | POLR2D | POLR2D | 5262 | 0.048 | 0.37 | YES |
| 36 | NFX1 | NFX1 | NFX1 | 5397 | 0.046 | 0.38 | YES |
| 37 | TAF6 | TAF6 | TAF6 | 5422 | 0.046 | 0.38 | YES |
| 38 | NCBP1 | NCBP1 | NCBP1 | 5468 | 0.045 | 0.39 | YES |
| 39 | POLR2G | POLR2G | POLR2G | 5544 | 0.044 | 0.4 | YES |
| 40 | WHSC2 | WHSC2 | WHSC2 | 5630 | 0.043 | 0.4 | YES |
| 41 | SLBP | SLBP | SLBP | 5663 | 0.042 | 0.41 | YES |
| 42 | CPSF7 | CPSF7 | CPSF7 | 5702 | 0.042 | 0.42 | YES |
| 43 | SNRPD3 | SNRPD3 | SNRPD3 | 5767 | 0.041 | 0.42 | YES |
| 44 | POLR2J | POLR2J | POLR2J | 5856 | 0.04 | 0.43 | YES |
| 45 | RNMT | RNMT | RNMT | 6048 | 0.037 | 0.42 | YES |
| 46 | CPSF2 | CPSF2 | CPSF2 | 6172 | 0.035 | 0.43 | YES |
| 47 | GTF2H2B | GTF2H2B | GTF2H2B | 6340 | 0.033 | 0.42 | YES |
| 48 | TAF10 | TAF10 | TAF10 | 6347 | 0.033 | 0.43 | YES |
| 49 | GTF2E1 | GTF2E1 | GTF2E1 | 6390 | 0.032 | 0.44 | YES |
| 50 | TAF9 | TAF9 | TAF9 | 6540 | 0.031 | 0.44 | YES |
| 51 | POLR2B | POLR2B | POLR2B | 6570 | 0.03 | 0.44 | YES |
| 52 | ERCC3 | ERCC3 | ERCC3 | 6596 | 0.03 | 0.45 | YES |
| 53 | RDBP | RDBP | RDBP | 6712 | 0.028 | 0.45 | YES |
| 54 | CCNT2 | CCNT2 | CCNT2 | 6833 | 0.027 | 0.45 | YES |
| 55 | RBM8A | RBM8A | RBM8A | 6995 | 0.025 | 0.44 | YES |
| 56 | POLR2I | POLR2I | POLR2I | 7031 | 0.025 | 0.45 | YES |
| 57 | CTDP1 | CTDP1 | CTDP1 | 7047 | 0.025 | 0.45 | YES |
| 58 | TAF4B | TAF4B | TAF4B | 7176 | 0.023 | 0.45 | YES |
| 59 | POLR2A | POLR2A | POLR2A | 7216 | 0.022 | 0.45 | YES |
| 60 | PCF11 | PCF11 | PCF11 | 7489 | 0.019 | 0.44 | NO |
| 61 | NCBP2 | NCBP2 | NCBP2 | 7507 | 0.019 | 0.44 | NO |
| 62 | CCNT1 | CCNT1 | CCNT1 | 7564 | 0.018 | 0.45 | NO |
| 63 | RNPS1 | RNPS1 | RNPS1 | 7646 | 0.017 | 0.44 | NO |
| 64 | RNGTT | RNGTT | RNGTT | 7724 | 0.016 | 0.44 | NO |
| 65 | CLP1 | CLP1 | CLP1 | 8022 | 0.012 | 0.43 | NO |
| 66 | TAF1 | TAF1 | TAF1 | 8383 | 0.0074 | 0.41 | NO |
| 67 | GTF2H2 | GTF2H2 | GTF2H2 | 8466 | 0.0062 | 0.41 | NO |
| 68 | U2AF1 | U2AF1 | U2AF1 | 8520 | 0.0055 | 0.41 | NO |
| 69 | GTF2H1 | GTF2H1 | GTF2H1 | 8644 | 0.004 | 0.4 | NO |
| 70 | NUDT21 | NUDT21 | NUDT21 | 8655 | 0.0037 | 0.4 | NO |
| 71 | GTF2H3 | GTF2H3 | GTF2H3 | 8881 | 0.00085 | 0.39 | NO |
| 72 | SRRM1 | SRRM1 | SRRM1 | 9011 | -0.001 | 0.38 | NO |
| 73 | POLR2E | POLR2E | POLR2E | 9031 | -0.0013 | 0.38 | NO |
| 74 | DHX38 | DHX38 | DHX38 | 9378 | -0.0056 | 0.36 | NO |
| 75 | TCEB3 | TCEB3 | TCEB3 | 9426 | -0.0063 | 0.36 | NO |
| 76 | SUPT5H | SUPT5H | SUPT5H | 9526 | -0.0075 | 0.36 | NO |
| 77 | COBRA1 | COBRA1 | COBRA1 | 9837 | -0.012 | 0.35 | NO |
| 78 | POLR2C | POLR2C | POLR2C | 9921 | -0.013 | 0.34 | NO |
| 79 | LSM10 | LSM10 | LSM10 | 10066 | -0.015 | 0.34 | NO |
| 80 | CDK7 | CDK7 | CDK7 | 10133 | -0.016 | 0.34 | NO |
| 81 | ERCC2 | ERCC2 | ERCC2 | 10137 | -0.016 | 0.34 | NO |
| 82 | CDC40 | CDC40 | CDC40 | 10478 | -0.022 | 0.33 | NO |
| 83 | CDK9 | CDK9 | CDK9 | 10530 | -0.022 | 0.33 | NO |
| 84 | SUPT4H1 | SUPT4H1 | SUPT4H1 | 10609 | -0.023 | 0.33 | NO |
| 85 | GTF2B | GTF2B | GTF2B | 10716 | -0.025 | 0.33 | NO |
| 86 | TAF12 | TAF12 | TAF12 | 10933 | -0.029 | 0.33 | NO |
| 87 | LSM11 | LSM11 | LSM11 | 11125 | -0.032 | 0.32 | NO |
| 88 | TCEB2 | TCEB2 | TCEB2 | 11218 | -0.034 | 0.33 | NO |
| 89 | GTF2F1 | GTF2F1 | GTF2F1 | 11709 | -0.043 | 0.31 | NO |
| 90 | POLR2L | POLR2L | POLR2L | 11833 | -0.046 | 0.31 | NO |
| 91 | CCNH | CCNH | CCNH | 12287 | -0.055 | 0.3 | NO |
| 92 | TAF13 | TAF13 | TAF13 | 12718 | -0.065 | 0.29 | NO |
| 93 | ELL | ELL | ELL | 12841 | -0.068 | 0.3 | NO |
Figure S67. Get High-res Image This plot shows mRNAseq_cNMF expression data heatmap (on the left) a RunningEnrichmentScore(RES) plot (on the top right) and a Signal2Noise(S2N) plot (on the bottom right) of genes in the pathway: REACTOME CELL CYCLE.
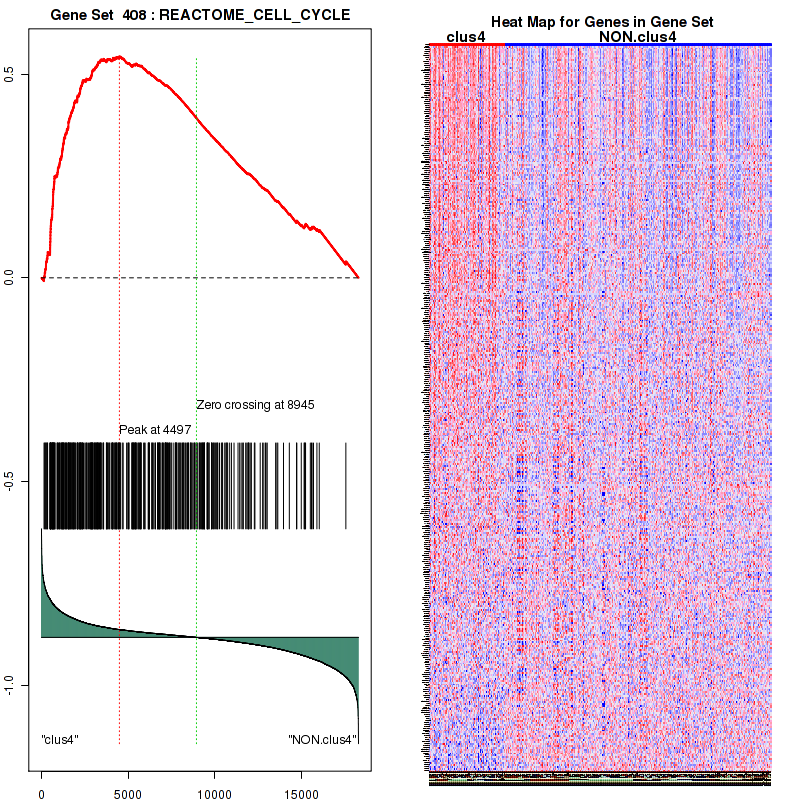
Figure S68. Get High-res Image For the top 5 core enriched genes in the pathway: REACTOME CELL CYCLE, this volcano plot shows how much they are up/down-regulated and significant. The significance was calculated by empirical bayesian fit
Table S35. Get Full Table This table shows a Running Enrichment Score (RES) of each gene in this pathway, that is, the enrichment score at this point in the ranked list of genes. All genes are ranked by Signal-to-Noise (S2N), a measure of similarity as default and are used to obtain ES matrix of all genes. In this way, GSEA tool uses expression pattern of not only overlapped genes but also not-overlapped genes to produce ES matrix.
| Rank | GENE | SYMBOL | DESC | LIST.LOC | S2N | RES | CORE_ENRICHMENT |
|---|---|---|---|---|---|---|---|
| 1 | SNRPF | SNRPF | SNRPF | 1656 | 0.16 | -0.053 | YES |
| 2 | SNRPD1 | SNRPD1 | SNRPD1 | 1999 | 0.14 | -0.039 | YES |
| 3 | TXNL4A | TXNL4A | TXNL4A | 2119 | 0.13 | -0.014 | YES |
| 4 | SNRPA1 | SNRPA1 | SNRPA1 | 2352 | 0.12 | 0.0017 | YES |
| 5 | UPF3B | UPF3B | UPF3B | 2435 | 0.12 | 0.025 | YES |
| 6 | PAPOLA | PAPOLA | PAPOLA | 2455 | 0.12 | 0.052 | YES |
| 7 | SNRPB | SNRPB | SNRPB | 2500 | 0.11 | 0.076 | YES |
| 8 | PABPN1 | PABPN1 | PABPN1 | 2912 | 0.099 | 0.077 | YES |
| 9 | SNRPE | SNRPE | SNRPE | 2987 | 0.097 | 0.096 | YES |
| 10 | SNRPG | SNRPG | SNRPG | 3205 | 0.09 | 0.1 | YES |
| 11 | CCAR1 | CCAR1 | CCAR1 | 3245 | 0.089 | 0.12 | YES |
| 12 | CPSF1 | CPSF1 | CPSF1 | 3275 | 0.088 | 0.14 | YES |
| 13 | CSTF3 | CSTF3 | CSTF3 | 3510 | 0.082 | 0.15 | YES |
| 14 | CSTF1 | CSTF1 | CSTF1 | 3511 | 0.082 | 0.17 | YES |
| 15 | LSM2 | LSM2 | LSM2 | 3629 | 0.08 | 0.18 | YES |
| 16 | POLR2H | POLR2H | POLR2H | 3699 | 0.078 | 0.2 | YES |
| 17 | SNRPB2 | SNRPB2 | SNRPB2 | 3811 | 0.075 | 0.21 | YES |
| 18 | POLR2K | POLR2K | POLR2K | 3815 | 0.075 | 0.23 | YES |
| 19 | HNRNPA0 | HNRNPA0 | HNRNPA0 | 4309 | 0.064 | 0.21 | YES |
| 20 | CPSF3 | CPSF3 | CPSF3 | 4333 | 0.063 | 0.23 | YES |
| 21 | SMC1A | SMC1A | SMC1A | 4457 | 0.061 | 0.24 | YES |
| 22 | PCBP2 | PCBP2 | PCBP2 | 4650 | 0.058 | 0.24 | YES |
| 23 | MAGOH | MAGOH | MAGOH | 4670 | 0.058 | 0.25 | YES |
| 24 | THOC4 | THOC4 | THOC4 | 4766 | 0.056 | 0.26 | YES |
| 25 | U2AF2 | U2AF2 | U2AF2 | 4778 | 0.056 | 0.27 | YES |
| 26 | HNRNPA3 | HNRNPA3 | HNRNPA3 | 4941 | 0.054 | 0.28 | YES |
| 27 | POLR2F | POLR2F | POLR2F | 4989 | 0.053 | 0.29 | YES |
| 28 | SNRPA | SNRPA | SNRPA | 5051 | 0.052 | 0.3 | YES |
| 29 | GTF2F2 | GTF2F2 | GTF2F2 | 5104 | 0.051 | 0.3 | YES |
| 30 | FUS | FUS | FUS | 5151 | 0.05 | 0.31 | YES |
| 31 | CSTF2 | CSTF2 | CSTF2 | 5181 | 0.049 | 0.32 | YES |
| 32 | POLR2D | POLR2D | POLR2D | 5262 | 0.048 | 0.33 | YES |
| 33 | NFX1 | NFX1 | NFX1 | 5397 | 0.046 | 0.33 | YES |
| 34 | NCBP1 | NCBP1 | NCBP1 | 5468 | 0.045 | 0.34 | YES |
| 35 | POLR2G | POLR2G | POLR2G | 5544 | 0.044 | 0.35 | YES |
| 36 | PRPF4 | PRPF4 | PRPF4 | 5591 | 0.043 | 0.36 | YES |
| 37 | HNRNPL | HNRNPL | HNRNPL | 5622 | 0.043 | 0.36 | YES |
| 38 | SNRNP200 | SNRNP200 | SNRNP200 | 5643 | 0.043 | 0.37 | YES |
| 39 | RBMX | RBMX | RBMX | 5679 | 0.042 | 0.38 | YES |
| 40 | CPSF7 | CPSF7 | CPSF7 | 5702 | 0.042 | 0.39 | YES |
| 41 | DHX9 | DHX9 | DHX9 | 5725 | 0.041 | 0.4 | YES |
| 42 | SNRPD3 | SNRPD3 | SNRPD3 | 5767 | 0.041 | 0.4 | YES |
| 43 | POLR2J | POLR2J | POLR2J | 5856 | 0.04 | 0.41 | YES |
| 44 | HNRNPD | HNRNPD | HNRNPD | 5961 | 0.038 | 0.41 | YES |
| 45 | HNRNPR | HNRNPR | HNRNPR | 5965 | 0.038 | 0.42 | YES |
| 46 | HNRNPA1 | HNRNPA1 | HNRNPA1 | 5978 | 0.038 | 0.43 | YES |
| 47 | DDX23 | DDX23 | DDX23 | 6072 | 0.037 | 0.43 | YES |
| 48 | CPSF2 | CPSF2 | CPSF2 | 6172 | 0.035 | 0.44 | YES |
| 49 | SF3B3 | SF3B3 | SF3B3 | 6254 | 0.034 | 0.44 | YES |
| 50 | SF3B4 | SF3B4 | SF3B4 | 6309 | 0.034 | 0.44 | YES |
| 51 | HNRNPC | HNRNPC | HNRNPC | 6318 | 0.033 | 0.45 | YES |
| 52 | SF3B1 | SF3B1 | SF3B1 | 6341 | 0.033 | 0.46 | YES |
| 53 | SNRNP70 | SNRNP70 | SNRNP70 | 6436 | 0.032 | 0.46 | YES |
| 54 | PRPF6 | PRPF6 | PRPF6 | 6457 | 0.032 | 0.47 | YES |
| 55 | POLR2B | POLR2B | POLR2B | 6570 | 0.03 | 0.47 | YES |
| 56 | SF3B2 | SF3B2 | SF3B2 | 6586 | 0.03 | 0.48 | YES |
| 57 | HNRNPH2 | HNRNPH2 | HNRNPH2 | 6601 | 0.03 | 0.48 | YES |
| 58 | HNRNPM | HNRNPM | HNRNPM | 6613 | 0.03 | 0.49 | YES |
| 59 | SF3B14 | SF3B14 | SF3B14 | 6618 | 0.03 | 0.5 | YES |
| 60 | PCBP1 | PCBP1 | PCBP1 | 6671 | 0.029 | 0.5 | YES |
| 61 | SNRPD2 | SNRPD2 | SNRPD2 | 6733 | 0.028 | 0.5 | YES |
| 62 | HNRNPA2B1 | HNRNPA2B1 | HNRNPA2B1 | 6781 | 0.028 | 0.51 | YES |
| 63 | HNRNPU | HNRNPU | HNRNPU | 6921 | 0.026 | 0.5 | YES |
| 64 | RBM8A | RBM8A | RBM8A | 6995 | 0.025 | 0.51 | YES |
| 65 | HNRNPF | HNRNPF | HNRNPF | 7004 | 0.025 | 0.51 | YES |
| 66 | POLR2I | POLR2I | POLR2I | 7031 | 0.025 | 0.52 | YES |
| 67 | SF3B5 | SF3B5 | SF3B5 | 7108 | 0.024 | 0.52 | YES |
| 68 | POLR2A | POLR2A | POLR2A | 7216 | 0.022 | 0.52 | YES |
| 69 | YBX1 | YBX1 | YBX1 | 7281 | 0.022 | 0.52 | YES |
| 70 | EFTUD2 | EFTUD2 | EFTUD2 | 7347 | 0.021 | 0.52 | YES |
| 71 | PCF11 | PCF11 | PCF11 | 7489 | 0.019 | 0.52 | YES |
| 72 | NCBP2 | NCBP2 | NCBP2 | 7507 | 0.019 | 0.52 | YES |
| 73 | HNRNPK | HNRNPK | HNRNPK | 7509 | 0.018 | 0.52 | YES |
| 74 | RNPS1 | RNPS1 | RNPS1 | 7646 | 0.017 | 0.52 | NO |
| 75 | PTBP1 | PTBP1 | PTBP1 | 7780 | 0.015 | 0.52 | NO |
| 76 | PRPF8 | PRPF8 | PRPF8 | 7791 | 0.015 | 0.52 | NO |
| 77 | SF3A3 | SF3A3 | SF3A3 | 7850 | 0.014 | 0.52 | NO |
| 78 | CLP1 | CLP1 | CLP1 | 8022 | 0.012 | 0.51 | NO |
| 79 | HNRNPH1 | HNRNPH1 | HNRNPH1 | 8291 | 0.0086 | 0.5 | NO |
| 80 | SF3A2 | SF3A2 | SF3A2 | 8332 | 0.0081 | 0.5 | NO |
| 81 | RBM5 | RBM5 | RBM5 | 8500 | 0.0056 | 0.49 | NO |
| 82 | CD2BP2 | CD2BP2 | CD2BP2 | 8513 | 0.0055 | 0.49 | NO |
| 83 | U2AF1 | U2AF1 | U2AF1 | 8520 | 0.0055 | 0.5 | NO |
| 84 | NUDT21 | NUDT21 | NUDT21 | 8655 | 0.0037 | 0.49 | NO |
| 85 | HNRNPUL1 | HNRNPUL1 | HNRNPUL1 | 8947 | -0.000025 | 0.47 | NO |
| 86 | PHF5A | PHF5A | PHF5A | 8985 | -0.00057 | 0.47 | NO |
| 87 | SRRM1 | SRRM1 | SRRM1 | 9011 | -0.001 | 0.47 | NO |
| 88 | POLR2E | POLR2E | POLR2E | 9031 | -0.0013 | 0.47 | NO |
| 89 | SNRNP40 | SNRNP40 | SNRNP40 | 9150 | -0.0028 | 0.46 | NO |
| 90 | DHX38 | DHX38 | DHX38 | 9378 | -0.0056 | 0.45 | NO |
| 91 | NHP2L1 | NHP2L1 | NHP2L1 | 9440 | -0.0064 | 0.45 | NO |
| 92 | DNAJC8 | DNAJC8 | DNAJC8 | 9763 | -0.011 | 0.44 | NO |
| 93 | POLR2C | POLR2C | POLR2C | 9921 | -0.013 | 0.43 | NO |
| 94 | SF3A1 | SF3A1 | SF3A1 | 10245 | -0.018 | 0.42 | NO |
| 95 | CDC40 | CDC40 | CDC40 | 10478 | -0.022 | 0.41 | NO |
| 96 | GTF2F1 | GTF2F1 | GTF2F1 | 11709 | -0.043 | 0.35 | NO |
| 97 | POLR2L | POLR2L | POLR2L | 11833 | -0.046 | 0.36 | NO |
Figure S69. Get High-res Image This plot shows mRNAseq_cNMF expression data heatmap (on the left) a RunningEnrichmentScore(RES) plot (on the top right) and a Signal2Noise(S2N) plot (on the bottom right) of genes in the pathway: REACTOME MITOCHONDRIAL PROTEIN IMPORT.
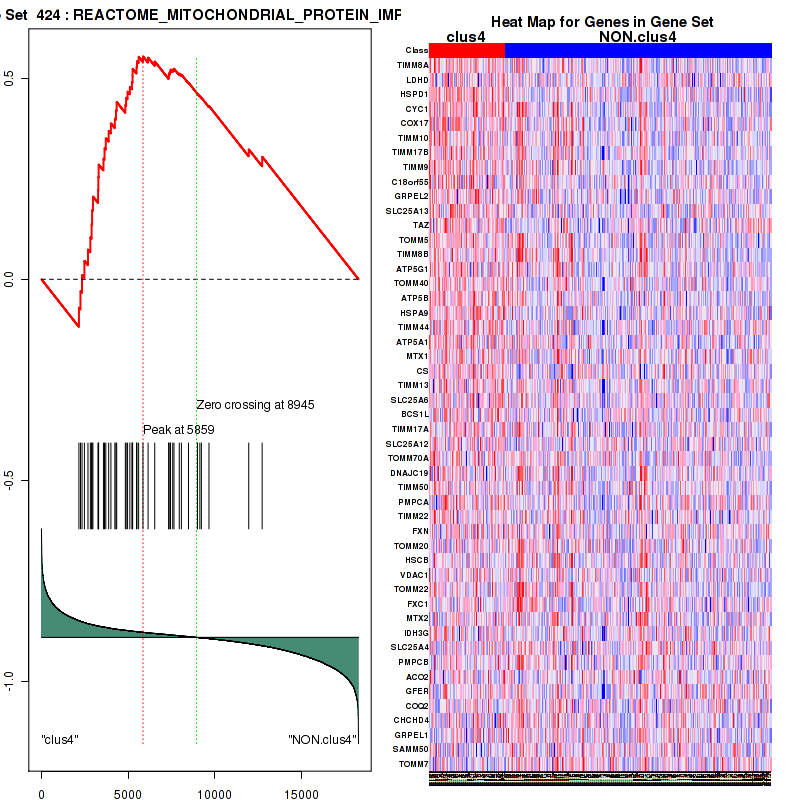
Figure S70. Get High-res Image For the top 5 core enriched genes in the pathway: REACTOME MITOCHONDRIAL PROTEIN IMPORT, this volcano plot shows how much they are up/down-regulated and significant. The significance was calculated by empirical bayesian fit
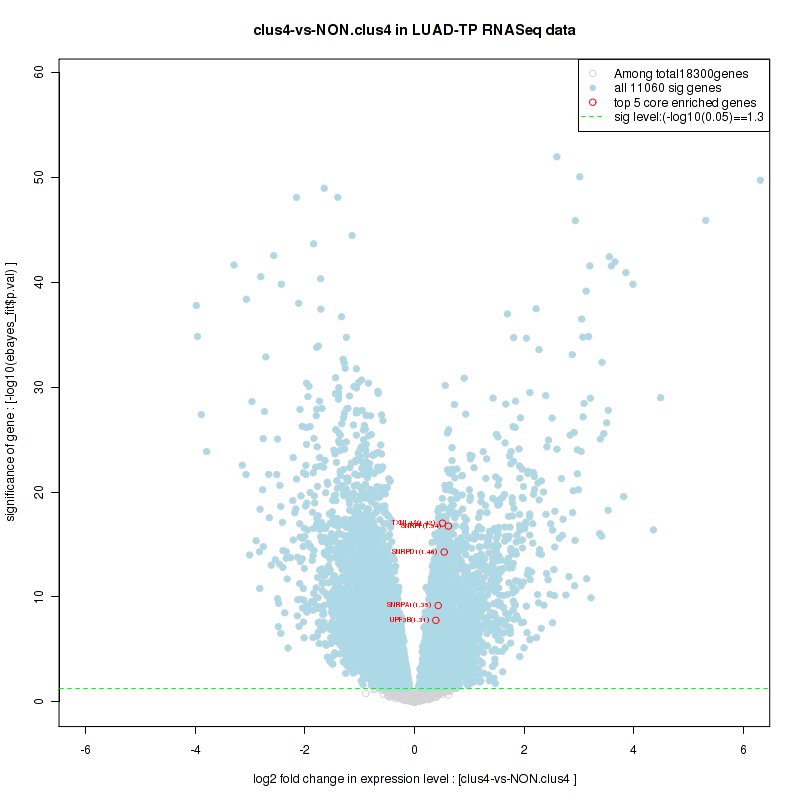
Table S36. Get Full Table This table shows a Running Enrichment Score (RES) of each gene in this pathway, that is, the enrichment score at this point in the ranked list of genes. All genes are ranked by Signal-to-Noise (S2N), a measure of similarity as default and are used to obtain ES matrix of all genes. In this way, GSEA tool uses expression pattern of not only overlapped genes but also not-overlapped genes to produce ES matrix.
| Rank | GENE | SYMBOL | DESC | LIST.LOC | S2N | RES | CORE_ENRICHMENT |
|---|---|---|---|---|---|---|---|
| 1 | SNRPF | SNRPF | SNRPF | 1656 | 0.16 | -0.0024 | YES |
| 2 | UPF3B | UPF3B | UPF3B | 2435 | 0.12 | 0.02 | YES |
| 3 | PAPOLA | PAPOLA | PAPOLA | 2455 | 0.12 | 0.083 | YES |
| 4 | SNRPB | SNRPB | SNRPB | 2500 | 0.11 | 0.14 | YES |
| 5 | PABPN1 | PABPN1 | PABPN1 | 2912 | 0.099 | 0.18 | YES |
| 6 | SNRPE | SNRPE | SNRPE | 2987 | 0.097 | 0.23 | YES |
| 7 | SNRPG | SNRPG | SNRPG | 3205 | 0.09 | 0.26 | YES |
| 8 | CPSF1 | CPSF1 | CPSF1 | 3275 | 0.088 | 0.31 | YES |
| 9 | CSTF3 | CSTF3 | CSTF3 | 3510 | 0.082 | 0.34 | YES |
| 10 | CSTF1 | CSTF1 | CSTF1 | 3511 | 0.082 | 0.39 | YES |
| 11 | CPSF3 | CPSF3 | CPSF3 | 4333 | 0.063 | 0.38 | YES |
| 12 | MAGOH | MAGOH | MAGOH | 4670 | 0.058 | 0.39 | YES |
| 13 | THOC4 | THOC4 | THOC4 | 4766 | 0.056 | 0.42 | YES |
| 14 | U2AF2 | U2AF2 | U2AF2 | 4778 | 0.056 | 0.45 | YES |
| 15 | ZNF473 | ZNF473 | ZNF473 | 5088 | 0.051 | 0.46 | YES |
| 16 | CSTF2 | CSTF2 | CSTF2 | 5181 | 0.049 | 0.48 | YES |
| 17 | NFX1 | NFX1 | NFX1 | 5397 | 0.046 | 0.5 | YES |
| 18 | NCBP1 | NCBP1 | NCBP1 | 5468 | 0.045 | 0.52 | YES |
| 19 | SLBP | SLBP | SLBP | 5663 | 0.042 | 0.53 | YES |
| 20 | CPSF7 | CPSF7 | CPSF7 | 5702 | 0.042 | 0.55 | YES |
| 21 | SNRPD3 | SNRPD3 | SNRPD3 | 5767 | 0.041 | 0.57 | YES |
| 22 | CPSF2 | CPSF2 | CPSF2 | 6172 | 0.035 | 0.57 | NO |
| 23 | RBM8A | RBM8A | RBM8A | 6995 | 0.025 | 0.54 | NO |
| 24 | PCF11 | PCF11 | PCF11 | 7489 | 0.019 | 0.52 | NO |
| 25 | NCBP2 | NCBP2 | NCBP2 | 7507 | 0.019 | 0.53 | NO |
| 26 | RNPS1 | RNPS1 | RNPS1 | 7646 | 0.017 | 0.53 | NO |
| 27 | CLP1 | CLP1 | CLP1 | 8022 | 0.012 | 0.52 | NO |
| 28 | U2AF1 | U2AF1 | U2AF1 | 8520 | 0.0055 | 0.49 | NO |
| 29 | NUDT21 | NUDT21 | NUDT21 | 8655 | 0.0037 | 0.49 | NO |
| 30 | SRRM1 | SRRM1 | SRRM1 | 9011 | -0.001 | 0.47 | NO |
| 31 | DHX38 | DHX38 | DHX38 | 9378 | -0.0056 | 0.45 | NO |
| 32 | LSM10 | LSM10 | LSM10 | 10066 | -0.015 | 0.42 | NO |
| 33 | CDC40 | CDC40 | CDC40 | 10478 | -0.022 | 0.41 | NO |
| 34 | LSM11 | LSM11 | LSM11 | 11125 | -0.032 | 0.39 | NO |
Figure S71. Get High-res Image This plot shows mRNAseq_cNMF expression data heatmap (on the left) a RunningEnrichmentScore(RES) plot (on the top right) and a Signal2Noise(S2N) plot (on the bottom right) of genes in the pathway: REACTOME PROCESSING OF CAPPED INTRON CONTAINING PRE MRNA.
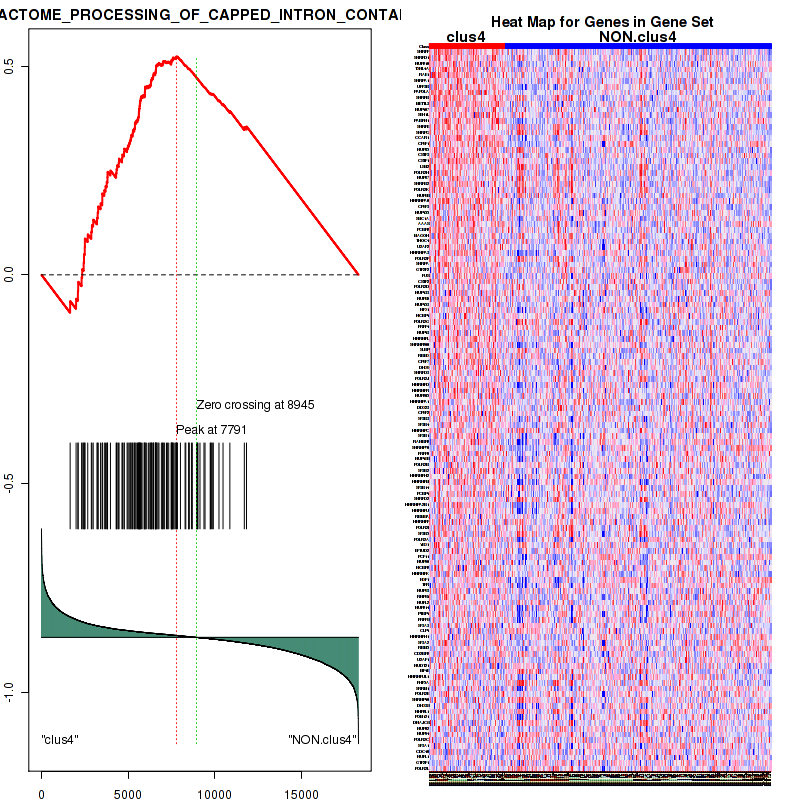
Figure S72. Get High-res Image For the top 5 core enriched genes in the pathway: REACTOME PROCESSING OF CAPPED INTRON CONTAINING PRE MRNA, this volcano plot shows how much they are up/down-regulated and significant. The significance was calculated by empirical bayesian fit
Table S37. Get Full Table This table shows a Running Enrichment Score (RES) of each gene in this pathway, that is, the enrichment score at this point in the ranked list of genes. All genes are ranked by Signal-to-Noise (S2N), a measure of similarity as default and are used to obtain ES matrix of all genes. In this way, GSEA tool uses expression pattern of not only overlapped genes but also not-overlapped genes to produce ES matrix.
| Rank | GENE | SYMBOL | DESC | LIST.LOC | S2N | RES | CORE_ENRICHMENT |
|---|---|---|---|---|---|---|---|
| 1 | NARS2 | NARS2 | NARS2 | 1499 | 0.17 | -0.00064 | YES |
| 2 | MARS2 | MARS2 | MARS2 | 1738 | 0.15 | 0.06 | YES |
| 3 | PSTK | PSTK | PSTK | 1752 | 0.15 | 0.13 | YES |
| 4 | DARS2 | DARS2 | DARS2 | 2114 | 0.13 | 0.18 | YES |
| 5 | MARS | MARS | MARS | 2526 | 0.11 | 0.21 | YES |
| 6 | NARS | NARS | NARS | 2969 | 0.097 | 0.23 | YES |
| 7 | SARS2 | SARS2 | SARS2 | 3003 | 0.096 | 0.28 | YES |
| 8 | TARS | TARS | TARS | 3464 | 0.083 | 0.29 | YES |
| 9 | PARS2 | PARS2 | PARS2 | 3742 | 0.077 | 0.31 | YES |
| 10 | AARS | AARS | AARS | 3932 | 0.072 | 0.34 | YES |
| 11 | YARS2 | YARS2 | YARS2 | 3939 | 0.072 | 0.37 | YES |
| 12 | FARSB | FARSB | FARSB | 4806 | 0.056 | 0.35 | YES |
| 13 | CARS | CARS | CARS | 4939 | 0.054 | 0.37 | YES |
| 14 | TARS2 | TARS2 | TARS2 | 5109 | 0.051 | 0.38 | YES |
| 15 | LARS2 | LARS2 | LARS2 | 5297 | 0.048 | 0.39 | YES |
| 16 | GARS | GARS | GARS | 5318 | 0.047 | 0.42 | YES |
| 17 | VARS | VARS | VARS | 5443 | 0.045 | 0.43 | YES |
| 18 | AARS2 | AARS2 | AARS2 | 5797 | 0.04 | 0.43 | YES |
| 19 | EPRS | EPRS | EPRS | 5842 | 0.04 | 0.45 | YES |
| 20 | DARS | DARS | DARS | 5864 | 0.039 | 0.46 | YES |
| 21 | IARS | IARS | IARS | 6127 | 0.036 | 0.47 | YES |
| 22 | YARS | YARS | YARS | 6286 | 0.034 | 0.48 | YES |
| 23 | EARS2 | EARS2 | EARS2 | 6564 | 0.03 | 0.47 | YES |
| 24 | RARS2 | RARS2 | RARS2 | 6607 | 0.03 | 0.49 | YES |
| 25 | SEPSECS | SEPSECS | SEPSECS | 6646 | 0.029 | 0.5 | YES |
| 26 | TARSL2 | TARSL2 | TARSL2 | 6759 | 0.028 | 0.5 | YES |
| 27 | IARS2 | IARS2 | IARS2 | 6821 | 0.027 | 0.51 | YES |
| 28 | LARS | LARS | LARS | 7129 | 0.024 | 0.51 | NO |
| 29 | MTFMT | MTFMT | MTFMT | 7416 | 0.02 | 0.5 | NO |
| 30 | HARS | HARS | HARS | 7714 | 0.016 | 0.49 | NO |
| 31 | FARSA | FARSA | FARSA | 7756 | 0.015 | 0.5 | NO |
| 32 | VARS2 | VARS2 | VARS2 | 8147 | 0.01 | 0.48 | NO |
| 33 | QARS | QARS | QARS | 8311 | 0.0084 | 0.48 | NO |
| 34 | HARS2 | HARS2 | HARS2 | 8545 | 0.0052 | 0.47 | NO |
| 35 | WARS2 | WARS2 | WARS2 | 8635 | 0.0041 | 0.46 | NO |
| 36 | KARS | KARS | KARS | 8783 | 0.0023 | 0.46 | NO |
| 37 | CARS2 | CARS2 | CARS2 | 9872 | -0.012 | 0.4 | NO |
| 38 | FARS2 | FARS2 | FARS2 | 10406 | -0.02 | 0.38 | NO |
| 39 | RARS | RARS | RARS | 10434 | -0.021 | 0.39 | NO |
| 40 | WARS | WARS | WARS | 11449 | -0.038 | 0.36 | NO |
| 41 | SARS | SARS | SARS | 11573 | -0.041 | 0.37 | NO |
Figure S73. Get High-res Image This plot shows mRNAseq_cNMF expression data heatmap (on the left) a RunningEnrichmentScore(RES) plot (on the top right) and a Signal2Noise(S2N) plot (on the bottom right) of genes in the pathway: REACTOME TRANSPORT OF MATURE TRANSCRIPT TO CYTOPLASM.
Figure S74. Get High-res Image For the top 5 core enriched genes in the pathway: REACTOME TRANSPORT OF MATURE TRANSCRIPT TO CYTOPLASM, this volcano plot shows how much they are up/down-regulated and significant. The significance was calculated by empirical bayesian fit

Table S38. Get Full Table This table shows a Running Enrichment Score (RES) of each gene in this pathway, that is, the enrichment score at this point in the ranked list of genes. All genes are ranked by Signal-to-Noise (S2N), a measure of similarity as default and are used to obtain ES matrix of all genes. In this way, GSEA tool uses expression pattern of not only overlapped genes but also not-overlapped genes to produce ES matrix.
| Rank | GENE | SYMBOL | DESC | LIST.LOC | S2N | RES | CORE_ENRICHMENT |
|---|---|---|---|---|---|---|---|
| 1 | PRKAA2 | PRKAA2 | PRKAA2 | 230 | 0.38 | 0.2 | YES |
| 2 | PDE3B | PDE3B | PDE3B | 464 | 0.3 | 0.36 | YES |
| 3 | EIF4EBP1 | EIF4EBP1 | EIF4EBP1 | 1074 | 0.2 | 0.45 | YES |
| 4 | PRKAB2 | PRKAB2 | PRKAB2 | 4398 | 0.062 | 0.3 | NO |
| 5 | PRKAB1 | PRKAB1 | PRKAB1 | 4436 | 0.062 | 0.34 | NO |
| 6 | PRKAG1 | PRKAG1 | PRKAG1 | 5126 | 0.05 | 0.33 | NO |
| 7 | PPM1A | PPM1A | PPM1A | 5322 | 0.047 | 0.34 | NO |
| 8 | RHEB | RHEB | RHEB | 5503 | 0.045 | 0.36 | NO |
| 9 | TSC1 | TSC1 | TSC1 | 6082 | 0.036 | 0.35 | NO |
| 10 | PRKAA1 | PRKAA1 | PRKAA1 | 6942 | 0.026 | 0.32 | NO |
| 11 | RPTOR | RPTOR | RPTOR | 7234 | 0.022 | 0.31 | NO |
| 12 | RPS6 | RPS6 | RPS6 | 7411 | 0.02 | 0.32 | NO |
| 13 | EIF4B | EIF4B | EIF4B | 7495 | 0.019 | 0.32 | NO |
| 14 | RPS6KB1 | RPS6KB1 | RPS6KB1 | 7541 | 0.018 | 0.33 | NO |
| 15 | MLST8 | MLST8 | MLST8 | 7607 | 0.017 | 0.34 | NO |
| 16 | MTOR | MTOR | MTOR | 7630 | 0.017 | 0.34 | NO |
| 17 | EIF4G1 | EIF4G1 | EIF4G1 | 8461 | 0.0063 | 0.3 | NO |
| 18 | TSC2 | TSC2 | TSC2 | 8502 | 0.0056 | 0.3 | NO |
| 19 | PRKAG2 | PRKAG2 | PRKAG2 | 8508 | 0.0056 | 0.31 | NO |
| 20 | EIF4E | EIF4E | EIF4E | 8706 | 0.0031 | 0.3 | NO |
| 21 | AKT2 | AKT2 | AKT2 | 8914 | 0.00036 | 0.29 | NO |
| 22 | EEF2K | EEF2K | EEF2K | 9859 | -0.012 | 0.24 | NO |
| 23 | STRADA | STRADA | STRADA | 12263 | -0.054 | 0.14 | NO |
| 24 | STRADB | STRADB | STRADB | 12526 | -0.06 | 0.16 | NO |
| 25 | CAB39L | CAB39L | CAB39L | 13091 | -0.073 | 0.17 | NO |
| 26 | CAB39 | CAB39 | CAB39 | 13665 | -0.089 | 0.19 | NO |
| 27 | STK11 | STK11 | STK11 | 14262 | -0.11 | 0.22 | NO |
Figure S75. Get High-res Image This plot shows mRNAseq_cNMF expression data heatmap (on the left) a RunningEnrichmentScore(RES) plot (on the top right) and a Signal2Noise(S2N) plot (on the bottom right) of genes in the pathway: REACTOME RNA POL II TRANSCRIPTION.
Figure S76. Get High-res Image For the top 5 core enriched genes in the pathway: REACTOME RNA POL II TRANSCRIPTION, this volcano plot shows how much they are up/down-regulated and significant. The significance was calculated by empirical bayesian fit

Table S39. Get Full Table This table shows a Running Enrichment Score (RES) of each gene in this pathway, that is, the enrichment score at this point in the ranked list of genes. All genes are ranked by Signal-to-Noise (S2N), a measure of similarity as default and are used to obtain ES matrix of all genes. In this way, GSEA tool uses expression pattern of not only overlapped genes but also not-overlapped genes to produce ES matrix.
| Rank | GENE | SYMBOL | DESC | LIST.LOC | S2N | RES | CORE_ENRICHMENT |
|---|---|---|---|---|---|---|---|
| 1 | POU2F1 | POU2F1 | POU2F1 | 1021 | 0.21 | 0.048 | YES |
| 2 | POLR3F | POLR3F | POLR3F | 2473 | 0.12 | 0.025 | YES |
| 3 | NFIB | NFIB | NFIB | 2808 | 0.1 | 0.057 | YES |
| 4 | POLR3A | POLR3A | POLR3A | 3008 | 0.096 | 0.094 | YES |
| 5 | BRF2 | BRF2 | BRF2 | 3356 | 0.086 | 0.12 | YES |
| 6 | POLR2H | POLR2H | POLR2H | 3699 | 0.078 | 0.14 | YES |
| 7 | SSB | SSB | SSB | 3735 | 0.077 | 0.17 | YES |
| 8 | BRF1 | BRF1 | BRF1 | 3758 | 0.076 | 0.21 | YES |
| 9 | POLR2K | POLR2K | POLR2K | 3815 | 0.075 | 0.24 | YES |
| 10 | TBP | TBP | TBP | 4009 | 0.07 | 0.27 | YES |
| 11 | POLR1C | POLR1C | POLR1C | 4096 | 0.068 | 0.3 | YES |
| 12 | GTF3C5 | GTF3C5 | GTF3C5 | 4286 | 0.064 | 0.32 | YES |
| 13 | POLR3B | POLR3B | POLR3B | 4942 | 0.054 | 0.31 | YES |
| 14 | POLR2F | POLR2F | POLR2F | 4989 | 0.053 | 0.33 | YES |
| 15 | SNAPC3 | SNAPC3 | SNAPC3 | 4993 | 0.053 | 0.36 | YES |
| 16 | SNAPC4 | SNAPC4 | SNAPC4 | 4997 | 0.053 | 0.38 | YES |
| 17 | POLR3D | POLR3D | POLR3D | 5036 | 0.052 | 0.4 | YES |
| 18 | POLR3E | POLR3E | POLR3E | 5320 | 0.047 | 0.41 | YES |
| 19 | GTF3C3 | GTF3C3 | GTF3C3 | 5457 | 0.045 | 0.43 | YES |
| 20 | POLR1D | POLR1D | POLR1D | 5746 | 0.041 | 0.43 | YES |
| 21 | LZTS1 | LZTS1 | LZTS1 | 5844 | 0.04 | 0.45 | YES |
| 22 | GTF3C2 | GTF3C2 | GTF3C2 | 6142 | 0.036 | 0.45 | YES |
| 23 | POLR3K | POLR3K | POLR3K | 6174 | 0.035 | 0.46 | YES |
| 24 | SNAPC5 | SNAPC5 | SNAPC5 | 6336 | 0.033 | 0.47 | YES |
| 25 | POLR3H | POLR3H | POLR3H | 7083 | 0.024 | 0.44 | NO |
| 26 | ZNF143 | ZNF143 | ZNF143 | 7248 | 0.022 | 0.44 | NO |
| 27 | SNAPC1 | SNAPC1 | SNAPC1 | 8347 | 0.0079 | 0.39 | NO |
| 28 | POLR3C | POLR3C | POLR3C | 8358 | 0.0077 | 0.39 | NO |
| 29 | POLR2E | POLR2E | POLR2E | 9031 | -0.0013 | 0.35 | NO |
| 30 | GTF3C4 | GTF3C4 | GTF3C4 | 9237 | -0.0038 | 0.34 | NO |
| 31 | POLR2L | POLR2L | POLR2L | 11833 | -0.046 | 0.22 | NO |
| 32 | SNAPC2 | SNAPC2 | SNAPC2 | 14726 | -0.12 | 0.13 | NO |
| 33 | POLR3GL | POLR3GL | POLR3GL | 15038 | -0.14 | 0.18 | NO |
Figure S77. Get High-res Image This plot shows mRNAseq_cNMF expression data heatmap (on the left) a RunningEnrichmentScore(RES) plot (on the top right) and a Signal2Noise(S2N) plot (on the bottom right) of genes in the pathway: REACTOME RNA POL III TRANSCRIPTION.
Figure S78. Get High-res Image For the top 5 core enriched genes in the pathway: REACTOME RNA POL III TRANSCRIPTION, this volcano plot shows how much they are up/down-regulated and significant. The significance was calculated by empirical bayesian fit
Table S40. Get Full Table This table shows a Running Enrichment Score (RES) of each gene in this pathway, that is, the enrichment score at this point in the ranked list of genes. All genes are ranked by Signal-to-Noise (S2N), a measure of similarity as default and are used to obtain ES matrix of all genes. In this way, GSEA tool uses expression pattern of not only overlapped genes but also not-overlapped genes to produce ES matrix.
| Rank | GENE | SYMBOL | DESC | LIST.LOC | S2N | RES | CORE_ENRICHMENT |
|---|---|---|---|---|---|---|---|
| 1 | NUP210 | NUP210 | NUP210 | 2104 | 0.13 | -0.048 | YES |
| 2 | RAE1 | RAE1 | RAE1 | 2317 | 0.12 | 0.0026 | YES |
| 3 | UPF3B | UPF3B | UPF3B | 2435 | 0.12 | 0.056 | YES |
| 4 | NUP107 | NUP107 | NUP107 | 2671 | 0.11 | 0.097 | YES |
| 5 | SEH1L | SEH1L | SEH1L | 2878 | 0.1 | 0.14 | YES |
| 6 | CPSF1 | CPSF1 | CPSF1 | 3275 | 0.088 | 0.16 | YES |
| 7 | NUP35 | NUP35 | NUP35 | 3412 | 0.085 | 0.2 | YES |
| 8 | NUP37 | NUP37 | NUP37 | 3765 | 0.076 | 0.21 | YES |
| 9 | NUP88 | NUP88 | NUP88 | 3981 | 0.071 | 0.24 | YES |
| 10 | CPSF3 | CPSF3 | CPSF3 | 4333 | 0.063 | 0.25 | YES |
| 11 | NUP155 | NUP155 | NUP155 | 4369 | 0.063 | 0.28 | YES |
| 12 | AAAS | AAAS | AAAS | 4474 | 0.061 | 0.31 | YES |
| 13 | MAGOH | MAGOH | MAGOH | 4670 | 0.058 | 0.32 | YES |
| 14 | THOC4 | THOC4 | THOC4 | 4766 | 0.056 | 0.35 | YES |
| 15 | U2AF2 | U2AF2 | U2AF2 | 4778 | 0.056 | 0.38 | YES |
| 16 | NUP133 | NUP133 | NUP133 | 5279 | 0.048 | 0.37 | YES |
| 17 | NUP85 | NUP85 | NUP85 | 5360 | 0.047 | 0.39 | YES |
| 18 | NUP153 | NUP153 | NUP153 | 5396 | 0.046 | 0.41 | YES |
| 19 | NFX1 | NFX1 | NFX1 | 5397 | 0.046 | 0.44 | YES |
| 20 | NCBP1 | NCBP1 | NCBP1 | 5468 | 0.045 | 0.46 | YES |
| 21 | NUP43 | NUP43 | NUP43 | 5618 | 0.043 | 0.47 | YES |
| 22 | SLBP | SLBP | SLBP | 5663 | 0.042 | 0.49 | YES |
| 23 | NUP205 | NUP205 | NUP205 | 5975 | 0.038 | 0.49 | YES |
| 24 | CPSF2 | CPSF2 | CPSF2 | 6172 | 0.035 | 0.5 | YES |
| 25 | RANBP2 | RANBP2 | RANBP2 | 6372 | 0.033 | 0.5 | YES |
| 26 | NUP188 | NUP188 | NUP188 | 6474 | 0.032 | 0.51 | YES |
| 27 | RBM8A | RBM8A | RBM8A | 6995 | 0.025 | 0.5 | YES |
| 28 | NUP50 | NUP50 | NUP50 | 7494 | 0.019 | 0.48 | YES |
| 29 | NCBP2 | NCBP2 | NCBP2 | 7507 | 0.019 | 0.49 | YES |
| 30 | NXF1 | NXF1 | NXF1 | 7568 | 0.018 | 0.5 | YES |
| 31 | TPR | TPR | TPR | 7586 | 0.018 | 0.5 | YES |
| 32 | NUP93 | NUP93 | NUP93 | 7587 | 0.018 | 0.51 | YES |
| 33 | RNPS1 | RNPS1 | RNPS1 | 7646 | 0.017 | 0.52 | YES |
| 34 | NUPL2 | NUPL2 | NUPL2 | 7712 | 0.016 | 0.52 | YES |
| 35 | NUP214 | NUP214 | NUP214 | 7770 | 0.015 | 0.53 | YES |
| 36 | U2AF1 | U2AF1 | U2AF1 | 8520 | 0.0055 | 0.49 | NO |
| 37 | EIF4E | EIF4E | EIF4E | 8706 | 0.0031 | 0.48 | NO |
| 38 | SRRM1 | SRRM1 | SRRM1 | 9011 | -0.001 | 0.46 | NO |
| 39 | DHX38 | DHX38 | DHX38 | 9378 | -0.0056 | 0.45 | NO |
| 40 | POM121 | POM121 | POM121 | 9740 | -0.011 | 0.43 | NO |
| 41 | NUP62 | NUP62 | NUP62 | 9825 | -0.012 | 0.43 | NO |
| 42 | NUP54 | NUP54 | NUP54 | 9855 | -0.012 | 0.44 | NO |
| 43 | CDC40 | CDC40 | CDC40 | 10478 | -0.022 | 0.41 | NO |
| 44 | NUPL1 | NUPL1 | NUPL1 | 10874 | -0.028 | 0.41 | NO |
Figure S79. Get High-res Image This plot shows mRNAseq_cNMF expression data heatmap (on the left) a RunningEnrichmentScore(RES) plot (on the top right) and a Signal2Noise(S2N) plot (on the bottom right) of genes in the pathway: REACTOME RECRUITMENT OF MITOTIC CENTROSOME PROTEINS AND COMPLEXES.
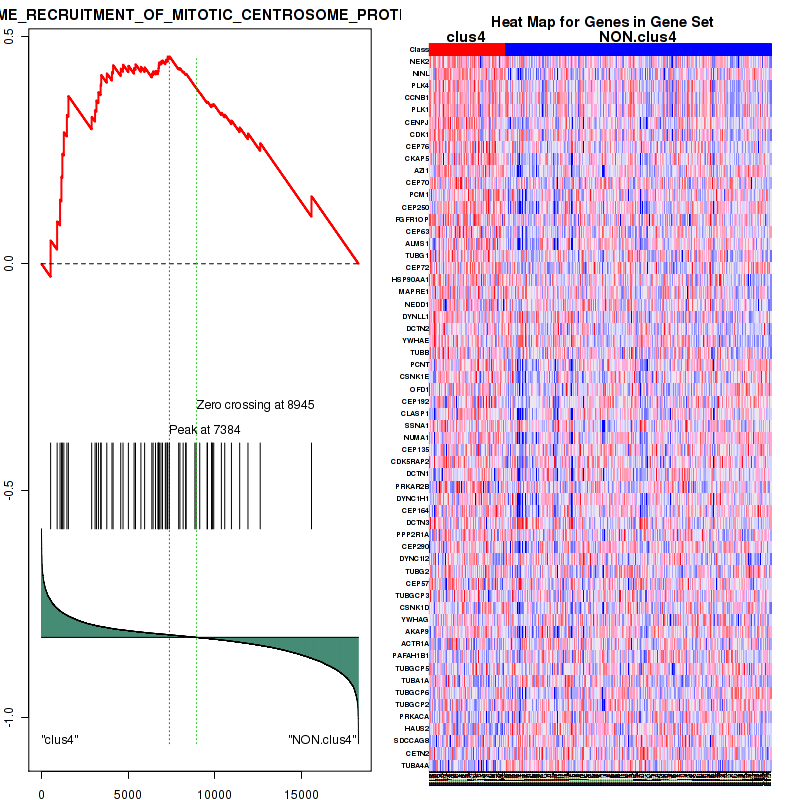
Figure S80. Get High-res Image For the top 5 core enriched genes in the pathway: REACTOME RECRUITMENT OF MITOTIC CENTROSOME PROTEINS AND COMPLEXES, this volcano plot shows how much they are up/down-regulated and significant. The significance was calculated by empirical bayesian fit
For the top enriched genes, if you want to check whether they are
-
up-regulated, please check the list of up-regulated genes
-
down-regulated, please check the list of down-regulated genes
For the top enriched genes, if you want to check whether they are
-
highly expressed genes, please check the list of high (top 30%) expressed genes
-
low expressed genes, please check the list of low (bottom 30%) expressed genes
An expression pattern of top(30%)/middle(30%)/low(30%) in this subtype against other subtypes is available in a heatmap
For the top enriched genes, if you want to check whether they are
-
significantly differently expressed genes by eBayes lm fit, please check the list of significant genes
Table 7. Get Full Table This table shows top 10 pathways which are significantly enriched in cluster clus5. It displays only significant gene sets satisfying nom.p.val.threshold (-1), fwer.p.val.threshold (-1) , fdr.q.val.threshold (0.25) and the default table is sorted by Normalized Enrichment Score (NES). Further details on NES statistics, please visit The Broad GSEA website.
| GeneSet(GS) | Size(#genes) | genes.ES.table | ES | NES | NOM.p.val | FDR.q.val | FWER.p.val | Tag.. | Gene.. | Signal | FDR..median. | glob.p.val |
|---|---|---|---|---|---|---|---|---|---|---|---|---|
| KEGG GLYCOLYSIS GLUCONEOGENESIS | 60 | genes.ES.table | 0.49 | 1.6 | 0.016 | 0.24 | 0.9 | 0.15 | 0.085 | 0.14 | 0.13 | 0.04 |
| KEGG FATTY ACID METABOLISM | 40 | genes.ES.table | 0.67 | 1.9 | 0 | 0.33 | 0.34 | 0.15 | 0.041 | 0.14 | 0 | 0.086 |
| KEGG STEROID HORMONE BIOSYNTHESIS | 45 | genes.ES.table | 0.58 | 1.4 | 0.059 | 0.24 | 1 | 0.47 | 0.23 | 0.36 | 0.18 | 0.002 |
| KEGG TYROSINE METABOLISM | 41 | genes.ES.table | 0.63 | 1.7 | 0.002 | 0.23 | 0.82 | 0.32 | 0.17 | 0.26 | 0.11 | 0.041 |
| KEGG GLUTATHIONE METABOLISM | 48 | genes.ES.table | 0.49 | 1.5 | 0.061 | 0.23 | 0.99 | 0.1 | 0.046 | 0.1 | 0.15 | 0.01 |
| KEGG STARCH AND SUCROSE METABOLISM | 41 | genes.ES.table | 0.57 | 1.5 | 0.02 | 0.23 | 0.98 | 0.27 | 0.13 | 0.24 | 0.15 | 0.02 |
| KEGG GLYCEROPHOSPHOLIPID METABOLISM | 73 | genes.ES.table | 0.43 | 1.6 | 0.011 | 0.21 | 0.96 | 0.22 | 0.21 | 0.17 | 0.13 | 0.02 |
| KEGG LINOLEIC ACID METABOLISM | 26 | genes.ES.table | 0.67 | 1.5 | 0.051 | 0.23 | 0.99 | 0.54 | 0.18 | 0.44 | 0.16 | 0.005 |
| KEGG SPHINGOLIPID METABOLISM | 38 | genes.ES.table | 0.42 | 1.4 | 0.1 | 0.25 | 1 | 0.4 | 0.34 | 0.26 | 0.19 | 0.001 |
| KEGG RETINOL METABOLISM | 56 | genes.ES.table | 0.66 | 1.6 | 0.014 | 0.22 | 0.94 | 0.55 | 0.23 | 0.43 | 0.13 | 0.031 |
Table S41. Get Full Table This table shows a Running Enrichment Score (RES) of each gene in this pathway, that is, the enrichment score at this point in the ranked list of genes. All genes are ranked by Signal-to-Noise (S2N), a measure of similarity as default and are used to obtain ES matrix of all genes. In this way, GSEA tool uses expression pattern of not only overlapped genes but also not-overlapped genes to produce ES matrix.
| Rank | GENE | SYMBOL | DESC | LIST.LOC | S2N | RES | CORE_ENRICHMENT |
|---|---|---|---|---|---|---|---|
| 1 | DNAI2 | DNAI2 | DNAI2 | 10 | 1.5 | 0.13 | YES |
| 2 | DNAI1 | DNAI1 | DNAI1 | 42 | 1.4 | 0.25 | YES |
| 3 | DNAH3 | DNAH3 | DNAH3 | 204 | 0.93 | 0.32 | YES |
| 4 | DNAH1 | DNAH1 | DNAH1 | 511 | 0.45 | 0.34 | YES |
| 5 | DNAH2 | DNAH2 | DNAH2 | 635 | 0.4 | 0.37 | YES |
| 6 | PLCB4 | PLCB4 | PLCB4 | 689 | 0.38 | 0.4 | YES |
| 7 | DNALI1 | DNALI1 | DNALI1 | 872 | 0.34 | 0.42 | YES |
| 8 | GRM5 | GRM5 | GRM5 | 881 | 0.33 | 0.45 | YES |
| 9 | COX4I2 | COX4I2 | COX4I2 | 1801 | 0.22 | 0.42 | NO |
| 10 | COX6B2 | COX6B2 | COX6B2 | 2053 | 0.2 | 0.42 | NO |
| 11 | COX7A1 | COX7A1 | COX7A1 | 2285 | 0.19 | 0.42 | NO |
| 12 | IFT57 | IFT57 | IFT57 | 2363 | 0.18 | 0.44 | NO |
| 13 | DNAL1 | DNAL1 | DNAL1 | 2577 | 0.17 | 0.44 | NO |
| 14 | DNAL4 | DNAL4 | DNAL4 | 4231 | 0.11 | 0.36 | NO |
| 15 | DLG4 | DLG4 | DLG4 | 4555 | 0.098 | 0.35 | NO |
| 16 | PLCB2 | PLCB2 | PLCB2 | 4633 | 0.096 | 0.35 | NO |
| 17 | CREB5 | CREB5 | CREB5 | 4765 | 0.093 | 0.35 | NO |
| 18 | BBC3 | BBC3 | BBC3 | 4902 | 0.089 | 0.35 | NO |
| 19 | TGM2 | TGM2 | TGM2 | 4925 | 0.089 | 0.36 | NO |
| 20 | PPARG | PPARG | PPARG | 5004 | 0.087 | 0.36 | NO |
| 21 | POLR2J2 | POLR2J2 | POLR2J2 | 6517 | 0.056 | 0.29 | NO |
| 22 | ITPR1 | ITPR1 | ITPR1 | 6518 | 0.056 | 0.29 | NO |
| 23 | CREB3L1 | CREB3L1 | CREB3L1 | 6677 | 0.053 | 0.29 | NO |
| 24 | PPARGC1A | PPARGC1A | PPARGC1A | 6791 | 0.051 | 0.28 | NO |
| 25 | CLTB | CLTB | CLTB | 7381 | 0.042 | 0.26 | NO |
| 26 | NDUFS7 | NDUFS7 | NDUFS7 | 7449 | 0.041 | 0.26 | NO |
| 27 | NDUFA4L2 | NDUFA4L2 | NDUFA4L2 | 7774 | 0.036 | 0.24 | NO |
| 28 | COX8C | COX8C | COX8C | 7900 | 0.034 | 0.24 | NO |
| 29 | NRF1 | NRF1 | NRF1 | 7942 | 0.034 | 0.24 | NO |
| 30 | GNAQ | GNAQ | GNAQ | 8001 | 0.033 | 0.24 | NO |
| 31 | HIP1 | HIP1 | HIP1 | 8129 | 0.032 | 0.23 | NO |
| 32 | BAX | BAX | BAX | 8242 | 0.03 | 0.23 | NO |
| 33 | BDNF | BDNF | BDNF | 8418 | 0.028 | 0.22 | NO |
| 34 | REST | REST | REST | 8521 | 0.026 | 0.22 | NO |
| 35 | TAF4B | TAF4B | TAF4B | 8751 | 0.024 | 0.21 | NO |
| 36 | SLC25A4 | SLC25A4 | SLC25A4 | 8860 | 0.023 | 0.2 | NO |
| 37 | TP53 | TP53 | TP53 | 9046 | 0.021 | 0.2 | NO |
| 38 | GPX1 | GPX1 | GPX1 | 9079 | 0.02 | 0.2 | NO |
| 39 | POLR2E | POLR2E | POLR2E | 9132 | 0.02 | 0.2 | NO |
| 40 | AP2B1 | AP2B1 | AP2B1 | 9317 | 0.018 | 0.19 | NO |
| 41 | NDUFB7 | NDUFB7 | NDUFB7 | 9452 | 0.016 | 0.18 | NO |
| 42 | EP300 | EP300 | EP300 | 9497 | 0.016 | 0.18 | NO |
| 43 | POLR2L | POLR2L | POLR2L | 9799 | 0.013 | 0.16 | NO |
| 44 | AP2A1 | AP2A1 | AP2A1 | 9885 | 0.012 | 0.16 | NO |
| 45 | CASP9 | CASP9 | CASP9 | 9891 | 0.012 | 0.16 | NO |
| 46 | TBPL1 | TBPL1 | TBPL1 | 9893 | 0.012 | 0.16 | NO |
| 47 | UQCR10 | UQCR10 | UQCR10 | 10046 | 0.011 | 0.16 | NO |
| 48 | POLR2J3 | POLR2J3 | POLR2J3 | 10207 | 0.0097 | 0.15 | NO |
| 49 | ATP5D | ATP5D | ATP5D | 10309 | 0.0089 | 0.14 | NO |
| 50 | DCTN1 | DCTN1 | DCTN1 | 10388 | 0.0083 | 0.14 | NO |
| 51 | CREBBP | CREBBP | CREBBP | 10445 | 0.0077 | 0.14 | NO |
| 52 | POLR2I | POLR2I | POLR2I | 10450 | 0.0077 | 0.14 | NO |
| 53 | CREB3 | CREB3 | CREB3 | 10515 | 0.0071 | 0.13 | NO |
| 54 | UQCR11 | UQCR11 | UQCR11 | 10659 | 0.0058 | 0.13 | NO |
| 55 | CLTCL1 | CLTCL1 | CLTCL1 | 10752 | 0.0049 | 0.12 | NO |
| 56 | NDUFA6 | NDUFA6 | NDUFA6 | 10815 | 0.0043 | 0.12 | NO |
| 57 | APAF1 | APAF1 | APAF1 | 10901 | 0.0036 | 0.11 | NO |
| 58 | SIN3A | SIN3A | SIN3A | 10923 | 0.0035 | 0.11 | NO |
| 59 | CREB1 | CREB1 | CREB1 | 10961 | 0.0032 | 0.11 | NO |
| 60 | HTT | HTT | HTT | 11018 | 0.0026 | 0.11 | NO |
| 61 | NDUFA5 | NDUFA5 | NDUFA5 | 11052 | 0.0024 | 0.11 | NO |
| 62 | COX4I1 | COX4I1 | COX4I1 | 11267 | 0.00049 | 0.095 | NO |
| 63 | AP2A2 | AP2A2 | AP2A2 | 11275 | 0.00046 | 0.095 | NO |
| 64 | POLR2A | POLR2A | POLR2A | 11305 | 0.00022 | 0.093 | NO |
| 65 | SOD2 | SOD2 | SOD2 | 11325 | 0.000094 | 0.092 | NO |
| 66 | NDUFA3 | NDUFA3 | NDUFA3 | 11379 | -0.0004 | 0.089 | NO |
| 67 | CREB3L3 | CREB3L3 | CREB3L3 | 11381 | -0.00041 | 0.089 | NO |
| 68 | NDUFB2 | NDUFB2 | NDUFB2 | 11573 | -0.0021 | 0.079 | NO |
| 69 | AP2M1 | AP2M1 | AP2M1 | 11658 | -0.0028 | 0.074 | NO |
| 70 | CLTA | CLTA | CLTA | 11850 | -0.0044 | 0.064 | NO |
| 71 | SLC25A6 | SLC25A6 | SLC25A6 | 11851 | -0.0044 | 0.065 | NO |
| 72 | ATP5O | ATP5O | ATP5O | 11854 | -0.0044 | 0.065 | NO |
| 73 | NDUFA2 | NDUFA2 | NDUFA2 | 11944 | -0.0051 | 0.061 | NO |
| 74 | PPID | PPID | PPID | 11951 | -0.0051 | 0.061 | NO |
| 75 | CASP8 | CASP8 | CASP8 | 11972 | -0.0054 | 0.06 | NO |
| 76 | HAP1 | HAP1 | HAP1 | 12004 | -0.0057 | 0.059 | NO |
| 77 | NDUFA7 | NDUFA7 | NDUFA7 | 12184 | -0.0072 | 0.05 | NO |
| 78 | NDUFB10 | NDUFB10 | NDUFB10 | 12231 | -0.0076 | 0.048 | NO |
| 79 | NDUFV1 | NDUFV1 | NDUFV1 | 12384 | -0.0089 | 0.04 | NO |
| 80 | AP2S1 | AP2S1 | AP2S1 | 12480 | -0.0098 | 0.036 | NO |
| 81 | CASP3 | CASP3 | CASP3 | 12529 | -0.01 | 0.034 | NO |
| 82 | NDUFA10 | NDUFA10 | NDUFA10 | 12598 | -0.011 | 0.031 | NO |
| 83 | CREB3L2 | CREB3L2 | CREB3L2 | 12623 | -0.011 | 0.031 | NO |
| 84 | NDUFS3 | NDUFS3 | NDUFS3 | 12655 | -0.011 | 0.03 | NO |
| 85 | NDUFB1 | NDUFB1 | NDUFB1 | 12801 | -0.013 | 0.023 | NO |
| 86 | SP1 | SP1 | SP1 | 12842 | -0.013 | 0.022 | NO |
| 87 | POLR2F | POLR2F | POLR2F | 12848 | -0.013 | 0.023 | NO |
| 88 | ATP5E | ATP5E | ATP5E | 12866 | -0.013 | 0.023 | NO |
| 89 | PLCB3 | PLCB3 | PLCB3 | 12912 | -0.014 | 0.022 | NO |
| 90 | ATP5A1 | ATP5A1 | ATP5A1 | 12926 | -0.014 | 0.022 | NO |
| 91 | ATP5F1 | ATP5F1 | ATP5F1 | 12945 | -0.014 | 0.022 | NO |
| 92 | NDUFC2 | NDUFC2 | NDUFC2 | 13158 | -0.016 | 0.012 | NO |
| 93 | UQCRC2 | UQCRC2 | UQCRC2 | 13193 | -0.016 | 0.012 | NO |
| 94 | NDUFS8 | NDUFS8 | NDUFS8 | 13310 | -0.017 | 0.0068 | NO |
| 95 | CREB3L4 | CREB3L4 | CREB3L4 | 13353 | -0.017 | 0.006 | NO |
| 96 | SDHD | SDHD | SDHD | 13359 | -0.017 | 0.0072 | NO |
| 97 | CLTC | CLTC | CLTC | 13374 | -0.017 | 0.0079 | NO |
| 98 | NDUFS4 | NDUFS4 | NDUFS4 | 13504 | -0.019 | 0.0024 | NO |
| 99 | NDUFS5 | NDUFS5 | NDUFS5 | 13608 | -0.019 | -0.0016 | NO |
| 100 | POLR2G | POLR2G | POLR2G | 13623 | -0.02 | -0.00065 | NO |
| 101 | DCTN4 | DCTN4 | DCTN4 | 13721 | -0.02 | -0.0042 | NO |
| 102 | NDUFB5 | NDUFB5 | NDUFB5 | 13759 | -0.021 | -0.0045 | NO |
| 103 | POLR2C | POLR2C | POLR2C | 13774 | -0.021 | -0.0034 | NO |
| 104 | VDAC3 | VDAC3 | VDAC3 | 13800 | -0.021 | -0.003 | NO |
| 105 | SOD1 | SOD1 | SOD1 | 13818 | -0.021 | -0.002 | NO |
| 106 | GRIN1 | GRIN1 | GRIN1 | 13857 | -0.022 | -0.0023 | NO |
| 107 | NDUFAB1 | NDUFAB1 | NDUFAB1 | 13945 | -0.022 | -0.0051 | NO |
| 108 | POLR2B | POLR2B | POLR2B | 14088 | -0.024 | -0.011 | NO |
| 109 | NDUFC1 | NDUFC1 | NDUFC1 | 14144 | -0.024 | -0.012 | NO |
| 110 | ATP5G2 | ATP5G2 | ATP5G2 | 14157 | -0.024 | -0.01 | NO |
| 111 | SDHA | SDHA | SDHA | 14163 | -0.024 | -0.0084 | NO |
| 112 | COX8A | COX8A | COX8A | 14219 | -0.025 | -0.0093 | NO |
| 113 | COX7C | COX7C | COX7C | 14226 | -0.025 | -0.0074 | NO |
| 114 | HDAC1 | HDAC1 | HDAC1 | 14242 | -0.025 | -0.0061 | NO |
| 115 | ATP5J | ATP5J | ATP5J | 14249 | -0.025 | -0.0042 | NO |
| 116 | NDUFA1 | NDUFA1 | NDUFA1 | 14281 | -0.026 | -0.0037 | NO |
| 117 | NDUFB6 | NDUFB6 | NDUFB6 | 14383 | -0.026 | -0.007 | NO |
| 118 | UQCRC1 | UQCRC1 | UQCRC1 | 14485 | -0.028 | -0.01 | NO |
| 119 | NDUFA8 | NDUFA8 | NDUFA8 | 14558 | -0.028 | -0.012 | NO |
| 120 | DCTN2 | DCTN2 | DCTN2 | 14562 | -0.028 | -0.0093 | NO |
| 121 | NDUFB8 | NDUFB8 | NDUFB8 | 14585 | -0.029 | -0.008 | NO |
| 122 | NDUFV3 | NDUFV3 | NDUFV3 | 14599 | -0.029 | -0.0062 | NO |
| 123 | TBP | TBP | TBP | 14845 | -0.032 | -0.017 | NO |
| 124 | NDUFA4 | NDUFA4 | NDUFA4 | 14876 | -0.032 | -0.016 | NO |
| 125 | NDUFB3 | NDUFB3 | NDUFB3 | 15059 | -0.034 | -0.023 | NO |
| 126 | NDUFS2 | NDUFS2 | NDUFS2 | 15246 | -0.036 | -0.03 | NO |
| 127 | NDUFB4 | NDUFB4 | NDUFB4 | 15276 | -0.037 | -0.028 | NO |
| 128 | COX7B | COX7B | COX7B | 15291 | -0.037 | -0.026 | NO |
| 129 | POLR2J | POLR2J | POLR2J | 15293 | -0.037 | -0.023 | NO |
| 130 | NDUFS6 | NDUFS6 | NDUFS6 | 15305 | -0.037 | -0.02 | NO |
| 131 | COX6B1 | COX6B1 | COX6B1 | 15327 | -0.037 | -0.018 | NO |
| 132 | RCOR1 | RCOR1 | RCOR1 | 15405 | -0.038 | -0.019 | NO |
| 133 | SLC25A5 | SLC25A5 | SLC25A5 | 15417 | -0.038 | -0.016 | NO |
| 134 | UQCRQ | UQCRQ | UQCRQ | 15435 | -0.039 | -0.014 | NO |
| 135 | SDHB | SDHB | SDHB | 15458 | -0.039 | -0.012 | NO |
| 136 | ATP5H | ATP5H | ATP5H | 15653 | -0.041 | -0.019 | NO |
| 137 | NDUFA9 | NDUFA9 | NDUFA9 | 15665 | -0.042 | -0.016 | NO |
| 138 | UQCRFS1 | UQCRFS1 | UQCRFS1 | 15674 | -0.042 | -0.013 | NO |
| 139 | COX7A2L | COX7A2L | COX7A2L | 15710 | -0.042 | -0.011 | NO |
| 140 | UQCRB | UQCRB | UQCRB | 15747 | -0.043 | -0.0091 | NO |
| 141 | SDHC | SDHC | SDHC | 15781 | -0.043 | -0.0072 | NO |
| 142 | COX5B | COX5B | COX5B | 15903 | -0.045 | -0.0099 | NO |
| 143 | NDUFV2 | NDUFV2 | NDUFV2 | 15917 | -0.046 | -0.0066 | NO |
| 144 | HDAC2 | HDAC2 | HDAC2 | 15998 | -0.047 | -0.007 | NO |
| 145 | ATP5B | ATP5B | ATP5B | 16220 | -0.051 | -0.015 | NO |
| 146 | VDAC1 | VDAC1 | VDAC1 | 16241 | -0.051 | -0.011 | NO |
| 147 | ATP5G3 | ATP5G3 | ATP5G3 | 16254 | -0.051 | -0.0076 | NO |
| 148 | ATP5G1 | ATP5G1 | ATP5G1 | 16256 | -0.051 | -0.0032 | NO |
| 149 | COX5A | COX5A | COX5A | 16377 | -0.054 | -0.0051 | NO |
| 150 | ATP5C1 | ATP5C1 | ATP5C1 | 16395 | -0.054 | -0.0013 | NO |
| 151 | POLR2H | POLR2H | POLR2H | 16607 | -0.06 | -0.0078 | NO |
| 152 | NDUFB9 | NDUFB9 | NDUFB9 | 16661 | -0.061 | -0.0054 | NO |
| 153 | UQCRH | UQCRH | UQCRH | 16690 | -0.062 | -0.0015 | NO |
| 154 | VDAC2 | VDAC2 | VDAC2 | 16692 | -0.062 | 0.0038 | NO |
| 155 | NDUFS1 | NDUFS1 | NDUFS1 | 16757 | -0.064 | 0.0059 | NO |
| 156 | COX6C | COX6C | COX6C | 16849 | -0.067 | 0.0067 | NO |
| 157 | COX6A1 | COX6A1 | COX6A1 | 16877 | -0.068 | 0.011 | NO |
| 158 | TFAM | TFAM | TFAM | 16910 | -0.069 | 0.015 | NO |
| 159 | TAF4 | TAF4 | TAF4 | 16922 | -0.07 | 0.021 | NO |
| 160 | POLR2D | POLR2D | POLR2D | 16931 | -0.07 | 0.026 | NO |
| 161 | CYCS | CYCS | CYCS | 16970 | -0.071 | 0.03 | NO |
| 162 | COX7A2 | COX7A2 | COX7A2 | 17008 | -0.072 | 0.035 | NO |
| 163 | POLR2K | POLR2K | POLR2K | 17044 | -0.073 | 0.039 | NO |
| 164 | UQCRHL | UQCRHL | UQCRHL | 17279 | -0.085 | 0.034 | NO |
| 165 | CYC1 | CYC1 | CYC1 | 17424 | -0.094 | 0.034 | NO |
| 166 | PLCB1 | PLCB1 | PLCB1 | 17988 | -0.16 | 0.017 | NO |
Figure S81. Get High-res Image This plot shows mRNAseq_cNMF expression data heatmap (on the left) a RunningEnrichmentScore(RES) plot (on the top right) and a Signal2Noise(S2N) plot (on the bottom right) of genes in the pathway: KEGG GLYCOLYSIS GLUCONEOGENESIS.
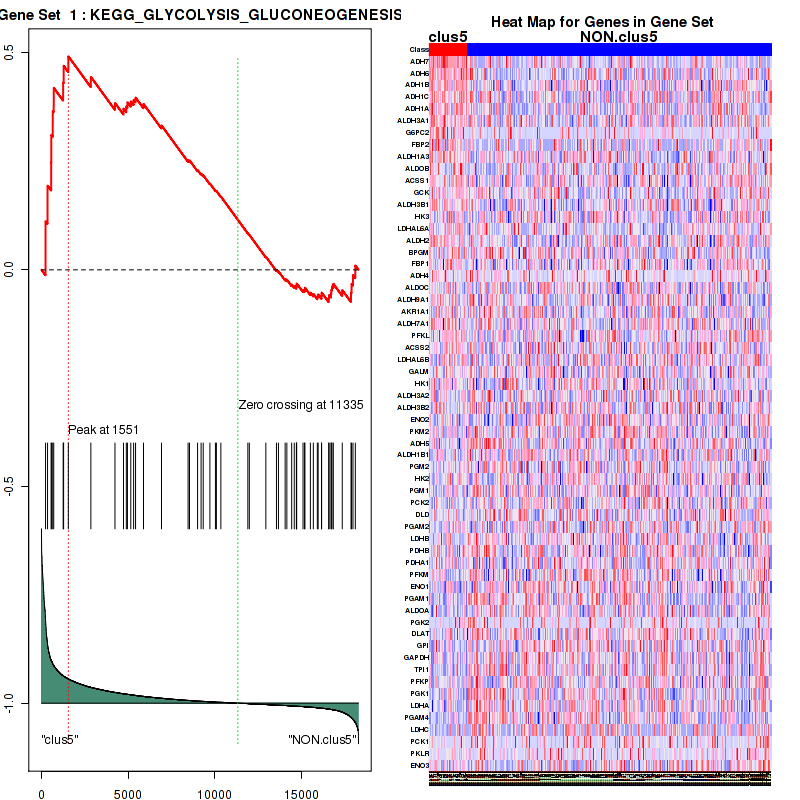
Figure S82. Get High-res Image For the top 5 core enriched genes in the pathway: KEGG GLYCOLYSIS GLUCONEOGENESIS, this volcano plot shows how much they are up/down-regulated and significant. The significance was calculated by empirical bayesian fit

Table S42. Get Full Table This table shows a Running Enrichment Score (RES) of each gene in this pathway, that is, the enrichment score at this point in the ranked list of genes. All genes are ranked by Signal-to-Noise (S2N), a measure of similarity as default and are used to obtain ES matrix of all genes. In this way, GSEA tool uses expression pattern of not only overlapped genes but also not-overlapped genes to produce ES matrix.
| Rank | GENE | SYMBOL | DESC | LIST.LOC | S2N | RES | CORE_ENRICHMENT |
|---|---|---|---|---|---|---|---|
| 1 | MAPK10 | MAPK10 | MAPK10 | 396 | 0.54 | 0.18 | YES |
| 2 | NRG2 | NRG2 | NRG2 | 489 | 0.46 | 0.35 | YES |
| 3 | NRG1 | NRG1 | NRG1 | 1641 | 0.23 | 0.38 | YES |
| 4 | JAK2 | JAK2 | JAK2 | 3827 | 0.12 | 0.3 | YES |
| 5 | PIK3CD | PIK3CD | PIK3CD | 4010 | 0.11 | 0.34 | YES |
| 6 | CHRNE | CHRNE | CHRNE | 4159 | 0.11 | 0.37 | YES |
| 7 | PIK3R1 | PIK3R1 | PIK3R1 | 4307 | 0.1 | 0.4 | YES |
| 8 | FOS | FOS | FOS | 4682 | 0.095 | 0.41 | YES |
| 9 | PIK3R3 | PIK3R3 | PIK3R3 | 4996 | 0.087 | 0.43 | YES |
| 10 | CHRNA1 | CHRNA1 | CHRNA1 | 5229 | 0.082 | 0.45 | YES |
| 11 | JUN | JUN | JUN | 5243 | 0.082 | 0.48 | YES |
| 12 | BAD | BAD | BAD | 7126 | 0.046 | 0.39 | NO |
| 13 | ERBB2 | ERBB2 | ERBB2 | 8828 | 0.023 | 0.31 | NO |
| 14 | PRKACA | PRKACA | PRKACA | 8885 | 0.023 | 0.31 | NO |
| 15 | PIK3R2 | PIK3R2 | PIK3R2 | 9252 | 0.019 | 0.3 | NO |
| 16 | DOCK7 | DOCK7 | DOCK7 | 9444 | 0.016 | 0.3 | NO |
| 17 | MAPK3 | MAPK3 | MAPK3 | 9791 | 0.013 | 0.28 | NO |
| 18 | STAT3 | STAT3 | STAT3 | 10375 | 0.0085 | 0.25 | NO |
| 19 | MAPK1 | MAPK1 | MAPK1 | 10665 | 0.0057 | 0.24 | NO |
| 20 | NF2 | NF2 | NF2 | 10891 | 0.0037 | 0.23 | NO |
| 21 | CDC42 | CDC42 | CDC42 | 11071 | 0.0022 | 0.22 | NO |
| 22 | MAP2K2 | MAP2K2 | MAP2K2 | 11159 | 0.0014 | 0.22 | NO |
| 23 | USP8 | USP8 | USP8 | 11161 | 0.0013 | 0.22 | NO |
| 24 | HRAS | HRAS | HRAS | 11188 | 0.0011 | 0.22 | NO |
| 25 | PIK3CA | PIK3CA | PIK3CA | 11272 | 0.00046 | 0.21 | NO |
| 26 | GRB2 | GRB2 | GRB2 | 11536 | -0.0017 | 0.2 | NO |
| 27 | AKT1 | AKT1 | AKT1 | 11648 | -0.0027 | 0.19 | NO |
| 28 | PPP3CB | PPP3CB | PPP3CB | 11715 | -0.0033 | 0.19 | NO |
| 29 | MTOR | MTOR | MTOR | 12043 | -0.006 | 0.17 | NO |
| 30 | RAC1 | RAC1 | RAC1 | 12142 | -0.0068 | 0.17 | NO |
| 31 | SOS1 | SOS1 | SOS1 | 12264 | -0.0079 | 0.17 | NO |
| 32 | ERBB3 | ERBB3 | ERBB3 | 12550 | -0.01 | 0.16 | NO |
| 33 | RAF1 | RAF1 | RAF1 | 12900 | -0.013 | 0.14 | NO |
| 34 | SRC | SRC | SRC | 13054 | -0.015 | 0.14 | NO |
| 35 | PIK3CB | PIK3CB | PIK3CB | 13151 | -0.016 | 0.14 | NO |
| 36 | RNF41 | RNF41 | RNF41 | 13624 | -0.02 | 0.12 | NO |
| 37 | NFATC4 | NFATC4 | NFATC4 | 14109 | -0.024 | 0.1 | NO |
| 38 | MAPK9 | MAPK9 | MAPK9 | 14301 | -0.026 | 0.1 | NO |
| 39 | SHC1 | SHC1 | SHC1 | 15471 | -0.039 | 0.053 | NO |
| 40 | MAP2K1 | MAP2K1 | MAP2K1 | 16014 | -0.047 | 0.041 | NO |
| 41 | PTPN11 | PTPN11 | PTPN11 | 16211 | -0.05 | 0.049 | NO |
| 42 | KRAS | KRAS | KRAS | 16283 | -0.052 | 0.065 | NO |
| 43 | NRAS | NRAS | NRAS | 16504 | -0.057 | 0.074 | NO |
| 44 | MAPK8 | MAPK8 | MAPK8 | 16773 | -0.064 | 0.084 | NO |
Figure S83. Get High-res Image This plot shows mRNAseq_cNMF expression data heatmap (on the left) a RunningEnrichmentScore(RES) plot (on the top right) and a Signal2Noise(S2N) plot (on the bottom right) of genes in the pathway: KEGG FATTY ACID METABOLISM.
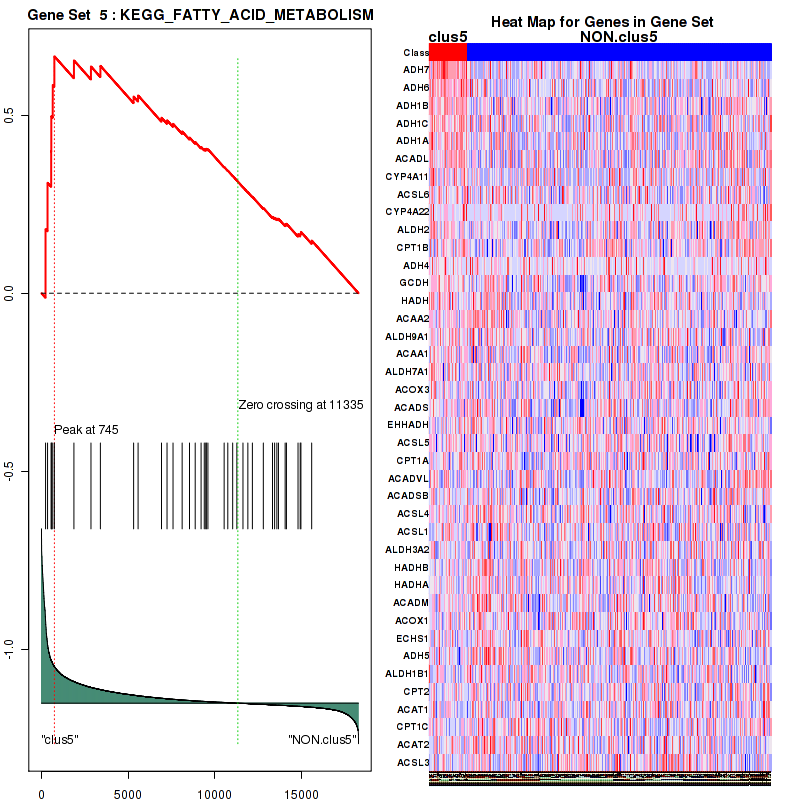
Figure S84. Get High-res Image For the top 5 core enriched genes in the pathway: KEGG FATTY ACID METABOLISM, this volcano plot shows how much they are up/down-regulated and significant. The significance was calculated by empirical bayesian fit
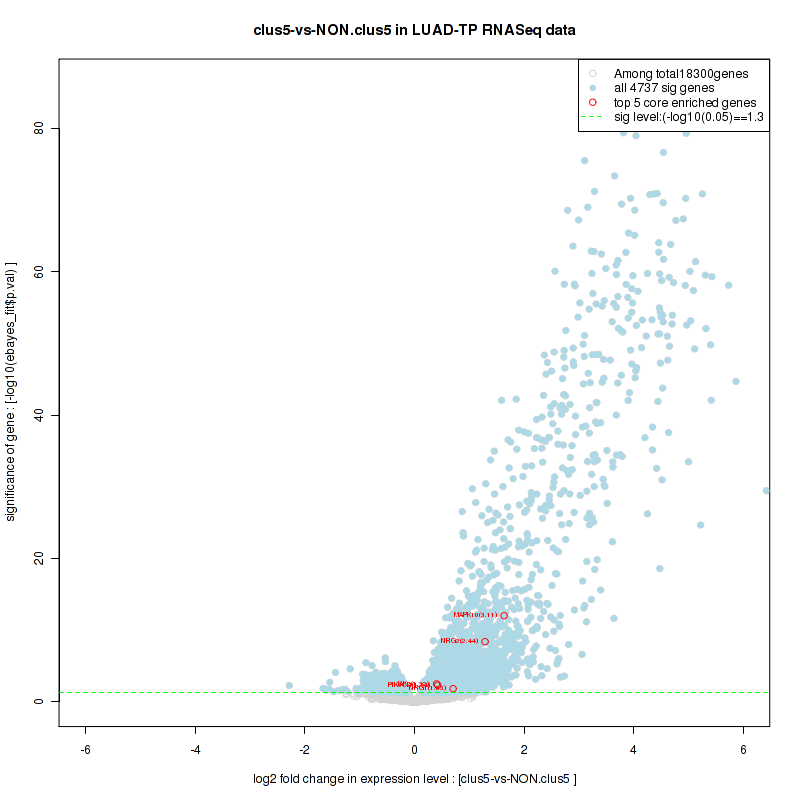
Table S43. Get Full Table This table shows a Running Enrichment Score (RES) of each gene in this pathway, that is, the enrichment score at this point in the ranked list of genes. All genes are ranked by Signal-to-Noise (S2N), a measure of similarity as default and are used to obtain ES matrix of all genes. In this way, GSEA tool uses expression pattern of not only overlapped genes but also not-overlapped genes to produce ES matrix.
| Rank | GENE | SYMBOL | DESC | LIST.LOC | S2N | RES | CORE_ENRICHMENT |
|---|---|---|---|---|---|---|---|
| 1 | NGFR | NGFR | NGFR | 332 | 0.62 | 0.11 | YES |
| 2 | NTRK3 | NTRK3 | NTRK3 | 436 | 0.5 | 0.21 | YES |
| 3 | NTF4 | NTF4 | NTF4 | 698 | 0.38 | 0.27 | YES |
| 4 | NTF3 | NTF3 | NTF3 | 735 | 0.37 | 0.34 | YES |
| 5 | NTRK2 | NTRK2 | NTRK2 | 761 | 0.36 | 0.42 | YES |
| 6 | RASGRF1 | RASGRF1 | RASGRF1 | 1397 | 0.26 | 0.43 | YES |
| 7 | MATK | MATK | MATK | 1746 | 0.22 | 0.46 | YES |
| 8 | NTRK1 | NTRK1 | NTRK1 | 1774 | 0.22 | 0.5 | YES |
| 9 | SHC3 | SHC3 | SHC3 | 2552 | 0.17 | 0.5 | YES |
| 10 | TIAM1 | TIAM1 | TIAM1 | 2584 | 0.17 | 0.53 | YES |
| 11 | SHC2 | SHC2 | SHC2 | 3236 | 0.14 | 0.52 | NO |
| 12 | PIK3R1 | PIK3R1 | PIK3R1 | 4307 | 0.1 | 0.49 | NO |
| 13 | SH2B1 | SH2B1 | SH2B1 | 5271 | 0.081 | 0.45 | NO |
| 14 | FAIM | FAIM | FAIM | 5281 | 0.081 | 0.47 | NO |
| 15 | DNM1 | DNM1 | DNM1 | 5615 | 0.072 | 0.46 | NO |
| 16 | ELMO1 | ELMO1 | ELMO1 | 5994 | 0.065 | 0.46 | NO |
| 17 | RGS19 | RGS19 | RGS19 | 6110 | 0.063 | 0.46 | NO |
| 18 | EHD4 | EHD4 | EHD4 | 6298 | 0.059 | 0.47 | NO |
| 19 | GAB1 | GAB1 | GAB1 | 6891 | 0.049 | 0.44 | NO |
| 20 | RAPGEF1 | RAPGEF1 | RAPGEF1 | 6944 | 0.049 | 0.45 | NO |
| 21 | GIPC1 | GIPC1 | GIPC1 | 6989 | 0.048 | 0.46 | NO |
| 22 | ARHGAP32 | ARHGAP32 | ARHGAP32 | 7220 | 0.044 | 0.46 | NO |
| 23 | PLCG1 | PLCG1 | PLCG1 | 7836 | 0.035 | 0.43 | NO |
| 24 | RHOG | RHOG | RHOG | 8018 | 0.033 | 0.42 | NO |
| 25 | BDNF | BDNF | BDNF | 8418 | 0.028 | 0.41 | NO |
| 26 | MCF2L | MCF2L | MCF2L | 8623 | 0.025 | 0.4 | NO |
| 27 | RAP1A | RAP1A | RAP1A | 9107 | 0.02 | 0.38 | NO |
| 28 | PRKCZ | PRKCZ | PRKCZ | 9294 | 0.018 | 0.37 | NO |
| 29 | DYNLT1 | DYNLT1 | DYNLT1 | 9698 | 0.014 | 0.36 | NO |
| 30 | MAPK3 | MAPK3 | MAPK3 | 9791 | 0.013 | 0.35 | NO |
| 31 | CCND1 | CCND1 | CCND1 | 9981 | 0.012 | 0.34 | NO |
| 32 | NEDD4L | NEDD4L | NEDD4L | 10152 | 0.01 | 0.34 | NO |
| 33 | RASA1 | RASA1 | RASA1 | 10277 | 0.0092 | 0.33 | NO |
| 34 | STAT3 | STAT3 | STAT3 | 10375 | 0.0085 | 0.33 | NO |
| 35 | NGF | NGF | NGF | 10431 | 0.0078 | 0.33 | NO |
| 36 | FRS3 | FRS3 | FRS3 | 10580 | 0.0065 | 0.32 | NO |
| 37 | ABL1 | ABL1 | ABL1 | 10598 | 0.0064 | 0.32 | NO |
| 38 | MAPK1 | MAPK1 | MAPK1 | 10665 | 0.0057 | 0.32 | NO |
| 39 | CDC42 | CDC42 | CDC42 | 11071 | 0.0022 | 0.3 | NO |
| 40 | HRAS | HRAS | HRAS | 11188 | 0.0011 | 0.29 | NO |
| 41 | PRKCI | PRKCI | PRKCI | 11220 | 0.00086 | 0.29 | NO |
| 42 | PIK3CA | PIK3CA | PIK3CA | 11272 | 0.00046 | 0.29 | NO |
| 43 | MAGED1 | MAGED1 | MAGED1 | 11279 | 0.00043 | 0.29 | NO |
| 44 | GRB2 | GRB2 | GRB2 | 11536 | -0.0017 | 0.27 | NO |
| 45 | RHOA | RHOA | RHOA | 11860 | -0.0044 | 0.26 | NO |
| 46 | CRKL | CRKL | CRKL | 11864 | -0.0044 | 0.26 | NO |
| 47 | RAC1 | RAC1 | RAC1 | 12142 | -0.0068 | 0.24 | NO |
| 48 | RAP1B | RAP1B | RAP1B | 12191 | -0.0073 | 0.24 | NO |
| 49 | SOS1 | SOS1 | SOS1 | 12264 | -0.0079 | 0.24 | NO |
| 50 | DOCK1 | DOCK1 | DOCK1 | 12265 | -0.0079 | 0.24 | NO |
| 51 | SQSTM1 | SQSTM1 | SQSTM1 | 13061 | -0.015 | 0.2 | NO |
| 52 | GAB2 | GAB2 | GAB2 | 13085 | -0.015 | 0.2 | NO |
| 53 | CRK | CRK | CRK | 13423 | -0.018 | 0.19 | NO |
| 54 | SHC1 | SHC1 | SHC1 | 15471 | -0.039 | 0.083 | NO |
| 55 | FRS2 | FRS2 | FRS2 | 15485 | -0.039 | 0.091 | NO |
| 56 | MAP2K1 | MAP2K1 | MAP2K1 | 16014 | -0.047 | 0.072 | NO |
| 57 | DNAJA3 | DNAJA3 | DNAJA3 | 16090 | -0.048 | 0.078 | NO |
| 58 | PTPN11 | PTPN11 | PTPN11 | 16211 | -0.05 | 0.081 | NO |
| 59 | RIT1 | RIT1 | RIT1 | 16260 | -0.052 | 0.089 | NO |
| 60 | KRAS | KRAS | KRAS | 16283 | -0.052 | 0.099 | NO |
| 61 | NRAS | NRAS | NRAS | 16504 | -0.057 | 0.098 | NO |
Figure S85. Get High-res Image This plot shows mRNAseq_cNMF expression data heatmap (on the left) a RunningEnrichmentScore(RES) plot (on the top right) and a Signal2Noise(S2N) plot (on the bottom right) of genes in the pathway: KEGG STEROID HORMONE BIOSYNTHESIS.
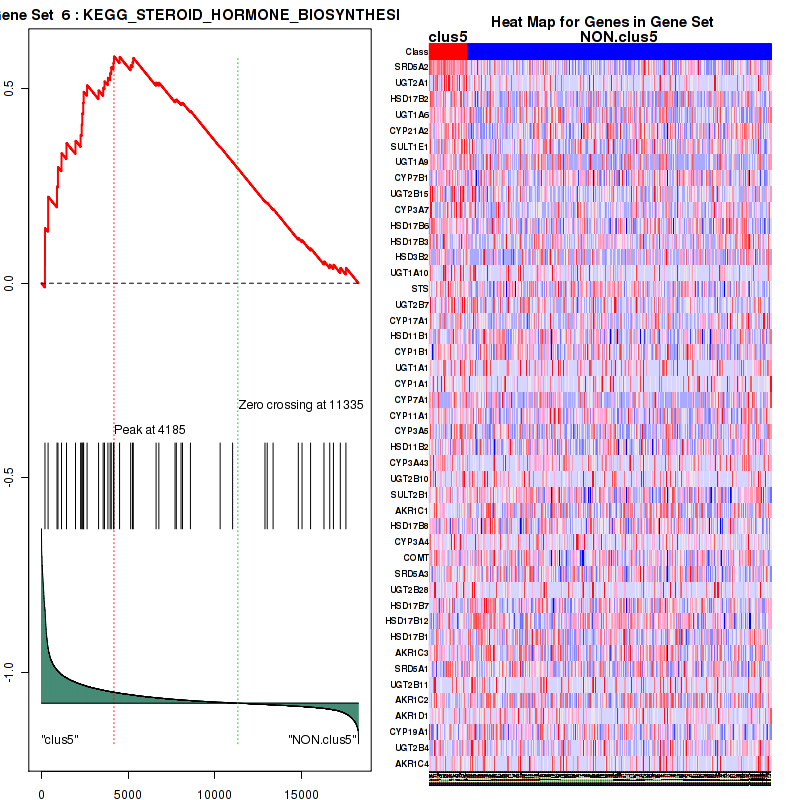
Figure S86. Get High-res Image For the top 5 core enriched genes in the pathway: KEGG STEROID HORMONE BIOSYNTHESIS, this volcano plot shows how much they are up/down-regulated and significant. The significance was calculated by empirical bayesian fit

Table S44. Get Full Table This table shows a Running Enrichment Score (RES) of each gene in this pathway, that is, the enrichment score at this point in the ranked list of genes. All genes are ranked by Signal-to-Noise (S2N), a measure of similarity as default and are used to obtain ES matrix of all genes. In this way, GSEA tool uses expression pattern of not only overlapped genes but also not-overlapped genes to produce ES matrix.
| Rank | GENE | SYMBOL | DESC | LIST.LOC | S2N | RES | CORE_ENRICHMENT |
|---|---|---|---|---|---|---|---|
| 1 | ERBB4 | ERBB4 | ERBB4 | 373 | 0.56 | 0.18 | YES |
| 2 | NRG2 | NRG2 | NRG2 | 489 | 0.46 | 0.34 | YES |
| 3 | NRG4 | NRG4 | NRG4 | 1495 | 0.25 | 0.38 | YES |
| 4 | BTC | BTC | BTC | 1556 | 0.24 | 0.46 | YES |
| 5 | NRG1 | NRG1 | NRG1 | 1641 | 0.23 | 0.55 | YES |
| 6 | PIK3R1 | PIK3R1 | PIK3R1 | 4307 | 0.1 | 0.44 | NO |
| 7 | FOXO1 | FOXO1 | FOXO1 | 5112 | 0.085 | 0.42 | NO |
| 8 | CDKN1A | CDKN1A | CDKN1A | 5422 | 0.077 | 0.44 | NO |
| 9 | FOXO3 | FOXO3 | FOXO3 | 6434 | 0.057 | 0.4 | NO |
| 10 | HBEGF | HBEGF | HBEGF | 6923 | 0.049 | 0.39 | NO |
| 11 | BAD | BAD | BAD | 7126 | 0.046 | 0.4 | NO |
| 12 | NR4A1 | NR4A1 | NR4A1 | 7163 | 0.045 | 0.41 | NO |
| 13 | AKT3 | AKT3 | AKT3 | 8092 | 0.032 | 0.37 | NO |
| 14 | FOXO4 | FOXO4 | FOXO4 | 8182 | 0.031 | 0.38 | NO |
| 15 | PHLPP1 | PHLPP1 | PHLPP1 | 8221 | 0.03 | 0.39 | NO |
| 16 | EREG | EREG | EREG | 8464 | 0.027 | 0.39 | NO |
| 17 | PDPK1 | PDPK1 | PDPK1 | 8581 | 0.026 | 0.39 | NO |
| 18 | PTEN | PTEN | PTEN | 9153 | 0.02 | 0.36 | NO |
| 19 | CDKN1B | CDKN1B | CDKN1B | 9870 | 0.013 | 0.33 | NO |
| 20 | CASP9 | CASP9 | CASP9 | 9891 | 0.012 | 0.33 | NO |
| 21 | TSC2 | TSC2 | TSC2 | 10471 | 0.0075 | 0.3 | NO |
| 22 | AKT2 | AKT2 | AKT2 | 10811 | 0.0044 | 0.29 | NO |
| 23 | CREB1 | CREB1 | CREB1 | 10961 | 0.0032 | 0.28 | NO |
| 24 | PIK3CA | PIK3CA | PIK3CA | 11272 | 0.00046 | 0.26 | NO |
| 25 | AKT1 | AKT1 | AKT1 | 11648 | -0.0027 | 0.24 | NO |
| 26 | MTOR | MTOR | MTOR | 12043 | -0.006 | 0.22 | NO |
| 27 | AKT1S1 | AKT1S1 | AKT1S1 | 12311 | -0.0082 | 0.21 | NO |
| 28 | MAPKAP1 | MAPKAP1 | MAPKAP1 | 12906 | -0.014 | 0.19 | NO |
| 29 | RICTOR | RICTOR | RICTOR | 13248 | -0.016 | 0.17 | NO |
| 30 | MDM2 | MDM2 | MDM2 | 13355 | -0.017 | 0.17 | NO |
| 31 | GSK3A | GSK3A | GSK3A | 13362 | -0.017 | 0.18 | NO |
| 32 | MLST8 | MLST8 | MLST8 | 14221 | -0.025 | 0.14 | NO |
| 33 | THEM4 | THEM4 | THEM4 | 14423 | -0.027 | 0.14 | NO |
| 34 | RPS6KB2 | RPS6KB2 | RPS6KB2 | 14701 | -0.03 | 0.14 | NO |
| 35 | CHUK | CHUK | CHUK | 16088 | -0.048 | 0.078 | NO |
| 36 | TRIB3 | TRIB3 | TRIB3 | 17685 | -0.12 | 0.034 | NO |
Figure S87. Get High-res Image This plot shows mRNAseq_cNMF expression data heatmap (on the left) a RunningEnrichmentScore(RES) plot (on the top right) and a Signal2Noise(S2N) plot (on the bottom right) of genes in the pathway: KEGG TYROSINE METABOLISM.
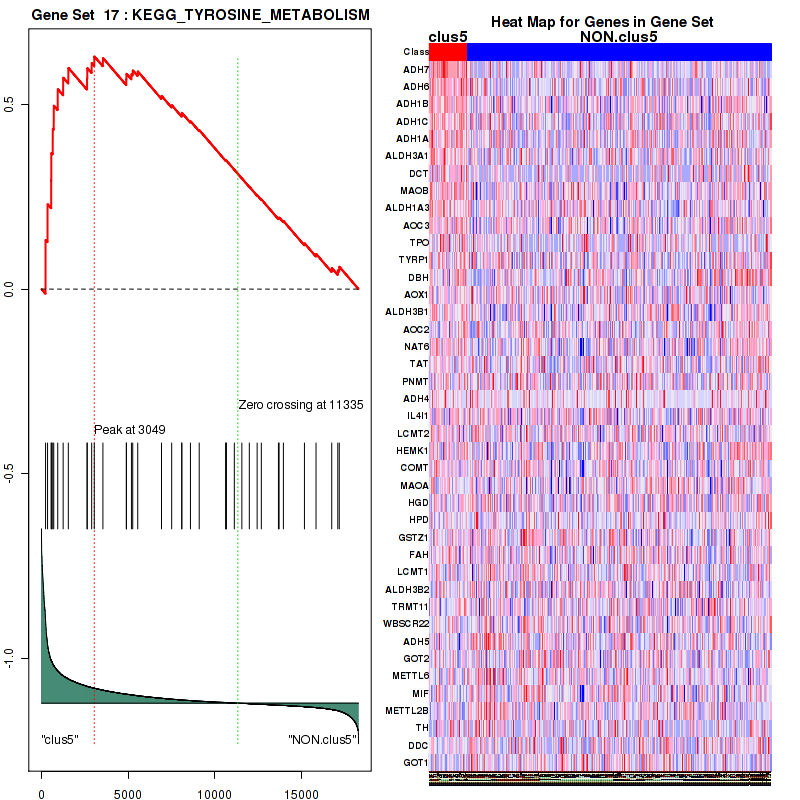
Figure S88. Get High-res Image For the top 5 core enriched genes in the pathway: KEGG TYROSINE METABOLISM, this volcano plot shows how much they are up/down-regulated and significant. The significance was calculated by empirical bayesian fit

Table S45. Get Full Table This table shows a Running Enrichment Score (RES) of each gene in this pathway, that is, the enrichment score at this point in the ranked list of genes. All genes are ranked by Signal-to-Noise (S2N), a measure of similarity as default and are used to obtain ES matrix of all genes. In this way, GSEA tool uses expression pattern of not only overlapped genes but also not-overlapped genes to produce ES matrix.
| Rank | GENE | SYMBOL | DESC | LIST.LOC | S2N | RES | CORE_ENRICHMENT |
|---|---|---|---|---|---|---|---|
| 1 | ADH7 | ADH7 | ADH7 | 236 | 0.82 | 0.18 | YES |
| 2 | ADH6 | ADH6 | ADH6 | 351 | 0.58 | 0.31 | YES |
| 3 | ADH1B | ADH1B | ADH1B | 562 | 0.43 | 0.4 | YES |
| 4 | ADH1C | ADH1C | ADH1C | 568 | 0.42 | 0.5 | YES |
| 5 | ADH1A | ADH1A | ADH1A | 651 | 0.39 | 0.58 | YES |
| 6 | ACADL | ACADL | ACADL | 745 | 0.37 | 0.67 | YES |
| 7 | CYP4A11 | CYP4A11 | CYP4A11 | 1874 | 0.22 | 0.65 | NO |
| 8 | ACSL6 | ACSL6 | ACSL6 | 2856 | 0.16 | 0.64 | NO |
| 9 | CYP4A22 | CYP4A22 | CYP4A22 | 3402 | 0.14 | 0.64 | NO |
| 10 | ALDH2 | ALDH2 | ALDH2 | 5318 | 0.08 | 0.55 | NO |
| 11 | CPT1B | CPT1B | CPT1B | 5577 | 0.073 | 0.56 | NO |
| 12 | ADH4 | ADH4 | ADH4 | 6927 | 0.049 | 0.49 | NO |
| 13 | GCDH | GCDH | GCDH | 7248 | 0.044 | 0.49 | NO |
| 14 | HADH | HADH | HADH | 7592 | 0.038 | 0.48 | NO |
| 15 | ACAA2 | ACAA2 | ACAA2 | 8120 | 0.032 | 0.46 | NO |
| 16 | ALDH9A1 | ALDH9A1 | ALDH9A1 | 8546 | 0.026 | 0.44 | NO |
| 17 | ACAA1 | ACAA1 | ACAA1 | 8875 | 0.023 | 0.42 | NO |
| 18 | ALDH7A1 | ALDH7A1 | ALDH7A1 | 9213 | 0.019 | 0.41 | NO |
| 19 | ACOX3 | ACOX3 | ACOX3 | 9396 | 0.017 | 0.4 | NO |
| 20 | ACADS | ACADS | ACADS | 9485 | 0.016 | 0.4 | NO |
| 21 | EHHADH | EHHADH | EHHADH | 9515 | 0.016 | 0.41 | NO |
| 22 | ACSL5 | ACSL5 | ACSL5 | 9606 | 0.015 | 0.4 | NO |
| 23 | CPT1A | CPT1A | CPT1A | 10546 | 0.0068 | 0.36 | NO |
| 24 | ACADVL | ACADVL | ACADVL | 10753 | 0.0049 | 0.34 | NO |
| 25 | ACADSB | ACADSB | ACADSB | 11037 | 0.0025 | 0.33 | NO |
| 26 | ACSL4 | ACSL4 | ACSL4 | 11278 | 0.00044 | 0.32 | NO |
| 27 | ACSL1 | ACSL1 | ACSL1 | 11629 | -0.0025 | 0.3 | NO |
| 28 | ALDH3A2 | ALDH3A2 | ALDH3A2 | 11911 | -0.0047 | 0.28 | NO |
| 29 | HADHB | HADHB | HADHB | 12173 | -0.0071 | 0.27 | NO |
| 30 | HADHA | HADHA | HADHA | 12806 | -0.013 | 0.24 | NO |
| 31 | ACADM | ACADM | ACADM | 13334 | -0.017 | 0.22 | NO |
| 32 | ACOX1 | ACOX1 | ACOX1 | 13458 | -0.018 | 0.21 | NO |
| 33 | ECHS1 | ECHS1 | ECHS1 | 13585 | -0.019 | 0.21 | NO |
| 34 | ADH5 | ADH5 | ADH5 | 13678 | -0.02 | 0.21 | NO |
| 35 | ALDH1B1 | ALDH1B1 | ALDH1B1 | 14066 | -0.024 | 0.19 | NO |
| 36 | CPT2 | CPT2 | CPT2 | 14141 | -0.024 | 0.2 | NO |
| 37 | ACAT1 | ACAT1 | ACAT1 | 14810 | -0.031 | 0.17 | NO |
| 38 | CPT1C | CPT1C | CPT1C | 14934 | -0.032 | 0.17 | NO |
| 39 | ACAT2 | ACAT2 | ACAT2 | 14976 | -0.033 | 0.17 | NO |
| 40 | ACSL3 | ACSL3 | ACSL3 | 15596 | -0.041 | 0.15 | NO |
Figure S89. Get High-res Image This plot shows mRNAseq_cNMF expression data heatmap (on the left) a RunningEnrichmentScore(RES) plot (on the top right) and a Signal2Noise(S2N) plot (on the bottom right) of genes in the pathway: KEGG GLUTATHIONE METABOLISM.
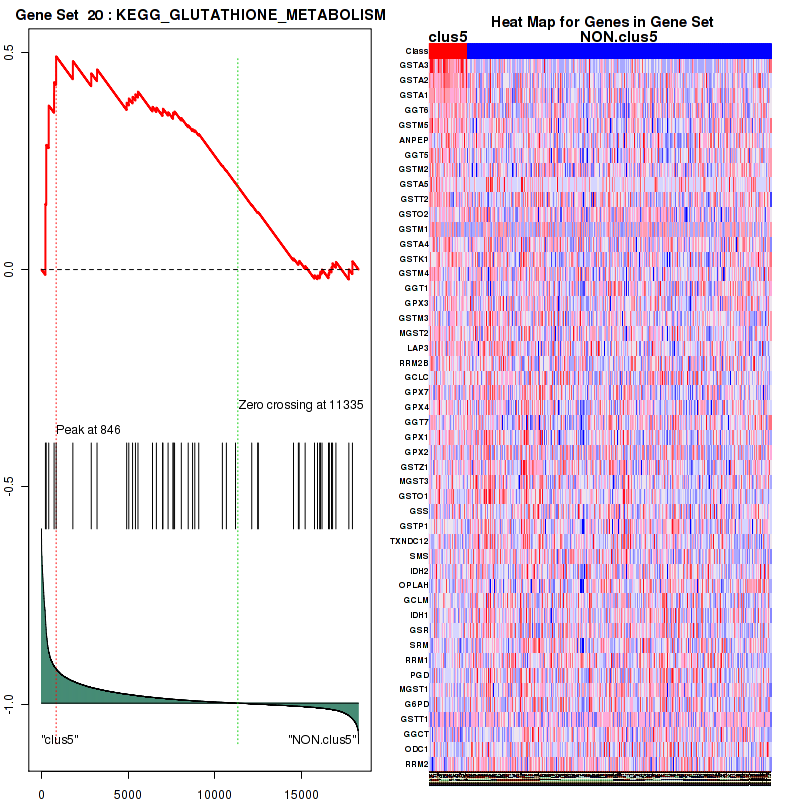
Figure S90. Get High-res Image For the top 5 core enriched genes in the pathway: KEGG GLUTATHIONE METABOLISM, this volcano plot shows how much they are up/down-regulated and significant. The significance was calculated by empirical bayesian fit

Table S46. Get Full Table This table shows a Running Enrichment Score (RES) of each gene in this pathway, that is, the enrichment score at this point in the ranked list of genes. All genes are ranked by Signal-to-Noise (S2N), a measure of similarity as default and are used to obtain ES matrix of all genes. In this way, GSEA tool uses expression pattern of not only overlapped genes but also not-overlapped genes to produce ES matrix.
| Rank | GENE | SYMBOL | DESC | LIST.LOC | S2N | RES | CORE_ENRICHMENT |
|---|---|---|---|---|---|---|---|
| 1 | ERBB4 | ERBB4 | ERBB4 | 373 | 0.56 | 0.064 | YES |
| 2 | MAPK10 | MAPK10 | MAPK10 | 396 | 0.54 | 0.14 | YES |
| 3 | NRG2 | NRG2 | NRG2 | 489 | 0.46 | 0.21 | YES |
| 4 | SHC4 | SHC4 | SHC4 | 812 | 0.35 | 0.24 | YES |
| 5 | PAK7 | PAK7 | PAK7 | 1099 | 0.29 | 0.27 | YES |
| 6 | NRG4 | NRG4 | NRG4 | 1495 | 0.25 | 0.29 | YES |
| 7 | BTC | BTC | BTC | 1556 | 0.24 | 0.32 | YES |
| 8 | PRKCB | PRKCB | PRKCB | 1559 | 0.24 | 0.36 | YES |
| 9 | NRG1 | NRG1 | NRG1 | 1641 | 0.23 | 0.39 | YES |
| 10 | NRG3 | NRG3 | NRG3 | 1818 | 0.22 | 0.41 | YES |
| 11 | PIK3CG | PIK3CG | PIK3CG | 2409 | 0.18 | 0.41 | YES |
| 12 | SHC3 | SHC3 | SHC3 | 2552 | 0.17 | 0.43 | YES |
| 13 | CAMK2A | CAMK2A | CAMK2A | 2700 | 0.16 | 0.44 | YES |
| 14 | PLCG2 | PLCG2 | PLCG2 | 2805 | 0.16 | 0.46 | YES |
| 15 | PIK3R5 | PIK3R5 | PIK3R5 | 2835 | 0.16 | 0.48 | YES |
| 16 | SHC2 | SHC2 | SHC2 | 3236 | 0.14 | 0.48 | NO |
| 17 | STAT5A | STAT5A | STAT5A | 3872 | 0.12 | 0.47 | NO |
| 18 | PIK3CD | PIK3CD | PIK3CD | 4010 | 0.11 | 0.48 | NO |
| 19 | PIK3R1 | PIK3R1 | PIK3R1 | 4307 | 0.1 | 0.48 | NO |
| 20 | PIK3R3 | PIK3R3 | PIK3R3 | 4996 | 0.087 | 0.45 | NO |
| 21 | JUN | JUN | JUN | 5243 | 0.082 | 0.45 | NO |
| 22 | CDKN1A | CDKN1A | CDKN1A | 5422 | 0.077 | 0.45 | NO |
| 23 | PRKCA | PRKCA | PRKCA | 5769 | 0.07 | 0.44 | NO |
| 24 | CBLB | CBLB | CBLB | 6821 | 0.051 | 0.39 | NO |
| 25 | GAB1 | GAB1 | GAB1 | 6891 | 0.049 | 0.4 | NO |
| 26 | HBEGF | HBEGF | HBEGF | 6923 | 0.049 | 0.4 | NO |
| 27 | NCK2 | NCK2 | NCK2 | 6950 | 0.049 | 0.41 | NO |
| 28 | BAD | BAD | BAD | 7126 | 0.046 | 0.41 | NO |
| 29 | CAMK2D | CAMK2D | CAMK2D | 7187 | 0.045 | 0.41 | NO |
| 30 | TGFA | TGFA | TGFA | 7736 | 0.037 | 0.38 | NO |
| 31 | PLCG1 | PLCG1 | PLCG1 | 7836 | 0.035 | 0.38 | NO |
| 32 | PRKCG | PRKCG | PRKCG | 7902 | 0.034 | 0.39 | NO |
| 33 | PAK6 | PAK6 | PAK6 | 8011 | 0.033 | 0.39 | NO |
| 34 | AKT3 | AKT3 | AKT3 | 8092 | 0.032 | 0.39 | NO |
| 35 | AREG | AREG | AREG | 8110 | 0.032 | 0.39 | NO |
| 36 | STAT5B | STAT5B | STAT5B | 8195 | 0.031 | 0.39 | NO |
| 37 | EREG | EREG | EREG | 8464 | 0.027 | 0.38 | NO |
| 38 | CBL | CBL | CBL | 8714 | 0.024 | 0.37 | NO |
| 39 | MAP2K7 | MAP2K7 | MAP2K7 | 8788 | 0.024 | 0.37 | NO |
| 40 | ERBB2 | ERBB2 | ERBB2 | 8828 | 0.023 | 0.37 | NO |
| 41 | PAK1 | PAK1 | PAK1 | 8861 | 0.023 | 0.37 | NO |
| 42 | EGFR | EGFR | EGFR | 9007 | 0.021 | 0.37 | NO |
| 43 | PIK3R2 | PIK3R2 | PIK3R2 | 9252 | 0.019 | 0.36 | NO |
| 44 | ARAF | ARAF | ARAF | 9578 | 0.015 | 0.34 | NO |
| 45 | SOS2 | SOS2 | SOS2 | 9741 | 0.014 | 0.33 | NO |
| 46 | MAPK3 | MAPK3 | MAPK3 | 9791 | 0.013 | 0.33 | NO |
| 47 | CDKN1B | CDKN1B | CDKN1B | 9870 | 0.013 | 0.33 | NO |
| 48 | ABL1 | ABL1 | ABL1 | 10598 | 0.0064 | 0.29 | NO |
| 49 | MAPK1 | MAPK1 | MAPK1 | 10665 | 0.0057 | 0.29 | NO |
| 50 | AKT2 | AKT2 | AKT2 | 10811 | 0.0044 | 0.28 | NO |
| 51 | CAMK2G | CAMK2G | CAMK2G | 10984 | 0.0029 | 0.27 | NO |
| 52 | MAP2K2 | MAP2K2 | MAP2K2 | 11159 | 0.0014 | 0.26 | NO |
| 53 | HRAS | HRAS | HRAS | 11188 | 0.0011 | 0.26 | NO |
| 54 | PAK3 | PAK3 | PAK3 | 11197 | 0.001 | 0.26 | NO |
| 55 | PIK3CA | PIK3CA | PIK3CA | 11272 | 0.00046 | 0.26 | NO |
| 56 | NCK1 | NCK1 | NCK1 | 11453 | -0.0011 | 0.25 | NO |
| 57 | GRB2 | GRB2 | GRB2 | 11536 | -0.0017 | 0.24 | NO |
| 58 | AKT1 | AKT1 | AKT1 | 11648 | -0.0027 | 0.24 | NO |
| 59 | CRKL | CRKL | CRKL | 11864 | -0.0044 | 0.23 | NO |
| 60 | MTOR | MTOR | MTOR | 12043 | -0.006 | 0.22 | NO |
| 61 | MAP2K4 | MAP2K4 | MAP2K4 | 12082 | -0.0063 | 0.22 | NO |
| 62 | CAMK2B | CAMK2B | CAMK2B | 12236 | -0.0076 | 0.21 | NO |
| 63 | SOS1 | SOS1 | SOS1 | 12264 | -0.0079 | 0.21 | NO |
| 64 | ELK1 | ELK1 | ELK1 | 12380 | -0.0088 | 0.2 | NO |
| 65 | PAK2 | PAK2 | PAK2 | 12429 | -0.0093 | 0.2 | NO |
| 66 | ERBB3 | ERBB3 | ERBB3 | 12550 | -0.01 | 0.2 | NO |
| 67 | PAK4 | PAK4 | PAK4 | 12860 | -0.013 | 0.18 | NO |
| 68 | RAF1 | RAF1 | RAF1 | 12900 | -0.013 | 0.18 | NO |
| 69 | SRC | SRC | SRC | 13054 | -0.015 | 0.18 | NO |
| 70 | ABL2 | ABL2 | ABL2 | 13098 | -0.015 | 0.18 | NO |
| 71 | PIK3CB | PIK3CB | PIK3CB | 13151 | -0.016 | 0.18 | NO |
| 72 | CBLC | CBLC | CBLC | 13267 | -0.017 | 0.17 | NO |
| 73 | MYC | MYC | MYC | 13317 | -0.017 | 0.17 | NO |
| 74 | CRK | CRK | CRK | 13423 | -0.018 | 0.17 | NO |
| 75 | RPS6KB1 | RPS6KB1 | RPS6KB1 | 13891 | -0.022 | 0.15 | NO |
| 76 | GSK3B | GSK3B | GSK3B | 14067 | -0.024 | 0.14 | NO |
| 77 | MAPK9 | MAPK9 | MAPK9 | 14301 | -0.026 | 0.13 | NO |
| 78 | RPS6KB2 | RPS6KB2 | RPS6KB2 | 14701 | -0.03 | 0.12 | NO |
| 79 | PTK2 | PTK2 | PTK2 | 14778 | -0.031 | 0.12 | NO |
| 80 | SHC1 | SHC1 | SHC1 | 15471 | -0.039 | 0.084 | NO |
| 81 | MAP2K1 | MAP2K1 | MAP2K1 | 16014 | -0.047 | 0.061 | NO |
| 82 | KRAS | KRAS | KRAS | 16283 | -0.052 | 0.054 | NO |
| 83 | NRAS | NRAS | NRAS | 16504 | -0.057 | 0.051 | NO |
| 84 | MAPK8 | MAPK8 | MAPK8 | 16773 | -0.064 | 0.046 | NO |
| 85 | BRAF | BRAF | BRAF | 17135 | -0.076 | 0.038 | NO |
| 86 | EGF | EGF | EGF | 17255 | -0.083 | 0.044 | NO |
| 87 | EIF4EBP1 | EIF4EBP1 | EIF4EBP1 | 17372 | -0.09 | 0.051 | NO |
Figure S91. Get High-res Image This plot shows mRNAseq_cNMF expression data heatmap (on the left) a RunningEnrichmentScore(RES) plot (on the top right) and a Signal2Noise(S2N) plot (on the bottom right) of genes in the pathway: KEGG STARCH AND SUCROSE METABOLISM.
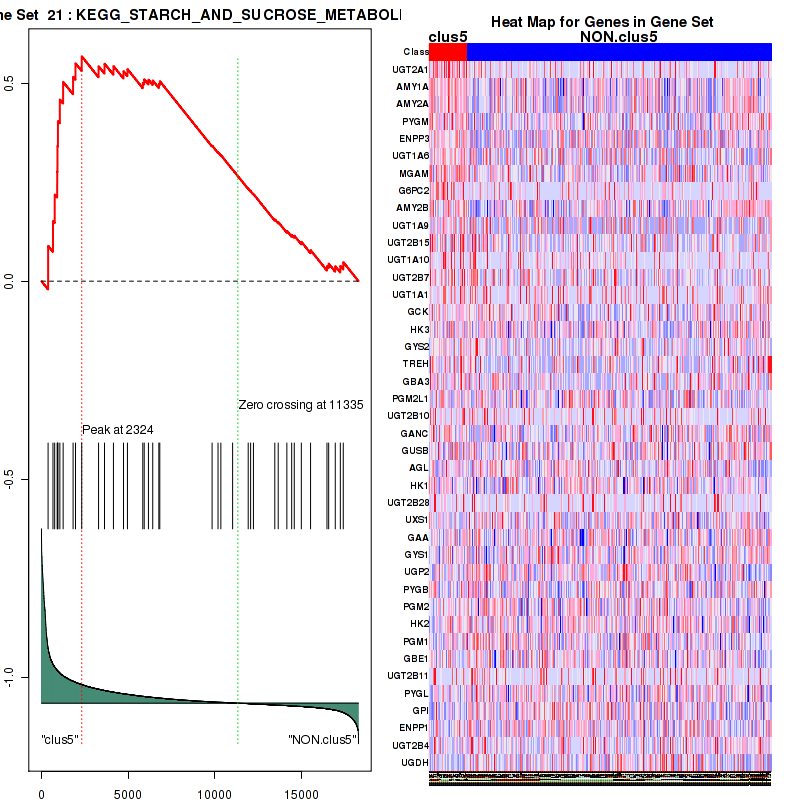
Figure S92. Get High-res Image For the top 5 core enriched genes in the pathway: KEGG STARCH AND SUCROSE METABOLISM, this volcano plot shows how much they are up/down-regulated and significant. The significance was calculated by empirical bayesian fit

Table S47. Get Full Table This table shows a Running Enrichment Score (RES) of each gene in this pathway, that is, the enrichment score at this point in the ranked list of genes. All genes are ranked by Signal-to-Noise (S2N), a measure of similarity as default and are used to obtain ES matrix of all genes. In this way, GSEA tool uses expression pattern of not only overlapped genes but also not-overlapped genes to produce ES matrix.
| Rank | GENE | SYMBOL | DESC | LIST.LOC | S2N | RES | CORE_ENRICHMENT |
|---|---|---|---|---|---|---|---|
| 1 | GLI1 | GLI1 | GLI1 | 939 | 0.32 | 0.051 | YES |
| 2 | IFT172 | IFT172 | IFT172 | 1161 | 0.28 | 0.13 | YES |
| 3 | GNAO1 | GNAO1 | GNAO1 | 1422 | 0.25 | 0.2 | YES |
| 4 | GNAZ | GNAZ | GNAZ | 2246 | 0.19 | 0.21 | YES |
| 5 | IFT88 | IFT88 | IFT88 | 2398 | 0.18 | 0.26 | YES |
| 6 | SHH | SHH | SHH | 2479 | 0.18 | 0.31 | YES |
| 7 | FOXA2 | FOXA2 | FOXA2 | 2576 | 0.17 | 0.36 | YES |
| 8 | SMO | SMO | SMO | 3117 | 0.15 | 0.38 | YES |
| 9 | PTCH1 | PTCH1 | PTCH1 | 3391 | 0.14 | 0.4 | YES |
| 10 | GLI3 | GLI3 | GLI3 | 3896 | 0.12 | 0.42 | YES |
| 11 | GNG2 | GNG2 | GNG2 | 4206 | 0.11 | 0.43 | YES |
| 12 | SSPO | SSPO | SSPO | 4536 | 0.098 | 0.44 | YES |
| 13 | GLI2 | GLI2 | GLI2 | 4543 | 0.098 | 0.48 | YES |
| 14 | STK36 | STK36 | STK36 | 4609 | 0.096 | 0.5 | YES |
| 15 | KIF3A | KIF3A | KIF3A | 4793 | 0.092 | 0.52 | YES |
| 16 | SUFU | SUFU | SUFU | 6801 | 0.051 | 0.43 | NO |
| 17 | LGALS3 | LGALS3 | LGALS3 | 6967 | 0.048 | 0.44 | NO |
| 18 | CSNK1G2 | CSNK1G2 | CSNK1G2 | 7300 | 0.043 | 0.43 | NO |
| 19 | GNAI2 | GNAI2 | GNAI2 | 7543 | 0.039 | 0.43 | NO |
| 20 | ARRB2 | ARRB2 | ARRB2 | 8006 | 0.033 | 0.42 | NO |
| 21 | PIAS1 | PIAS1 | PIAS1 | 8394 | 0.028 | 0.4 | NO |
| 22 | SAP30 | SAP30 | SAP30 | 8855 | 0.023 | 0.38 | NO |
| 23 | PRKACA | PRKACA | PRKACA | 8885 | 0.023 | 0.39 | NO |
| 24 | SIN3B | SIN3B | SIN3B | 8932 | 0.022 | 0.39 | NO |
| 25 | PRKCD | PRKCD | PRKCD | 9014 | 0.021 | 0.4 | NO |
| 26 | RAB23 | RAB23 | RAB23 | 9528 | 0.016 | 0.37 | NO |
| 27 | FBXW11 | FBXW11 | FBXW11 | 9862 | 0.013 | 0.36 | NO |
| 28 | CSNK1A1 | CSNK1A1 | CSNK1A1 | 10084 | 0.011 | 0.35 | NO |
| 29 | MTSS1 | MTSS1 | MTSS1 | 10231 | 0.0095 | 0.35 | NO |
| 30 | CREBBP | CREBBP | CREBBP | 10445 | 0.0077 | 0.34 | NO |
| 31 | SPOP | SPOP | SPOP | 10701 | 0.0054 | 0.32 | NO |
| 32 | SIN3A | SIN3A | SIN3A | 10923 | 0.0035 | 0.31 | NO |
| 33 | CSNK1G3 | CSNK1G3 | CSNK1G3 | 11129 | 0.0016 | 0.3 | NO |
| 34 | GNAI1 | GNAI1 | GNAI1 | 11155 | 0.0014 | 0.3 | NO |
| 35 | AKT1 | AKT1 | AKT1 | 11648 | -0.0027 | 0.28 | NO |
| 36 | CSNK1E | CSNK1E | CSNK1E | 11746 | -0.0036 | 0.27 | NO |
| 37 | CSNK1G1 | CSNK1G1 | CSNK1G1 | 11822 | -0.0041 | 0.27 | NO |
| 38 | CSNK1D | CSNK1D | CSNK1D | 11993 | -0.0056 | 0.26 | NO |
| 39 | GNAI3 | GNAI3 | GNAI3 | 12123 | -0.0067 | 0.26 | NO |
| 40 | SAP18 | SAP18 | SAP18 | 12873 | -0.013 | 0.22 | NO |
| 41 | GNB1 | GNB1 | GNB1 | 13130 | -0.016 | 0.21 | NO |
| 42 | GSK3B | GSK3B | GSK3B | 14067 | -0.024 | 0.17 | NO |
| 43 | HDAC1 | HDAC1 | HDAC1 | 14242 | -0.025 | 0.16 | NO |
| 44 | RBBP7 | RBBP7 | RBBP7 | 14243 | -0.025 | 0.17 | NO |
| 45 | RBBP4 | RBBP4 | RBBP4 | 14274 | -0.026 | 0.18 | NO |
| 46 | XPO1 | XPO1 | XPO1 | 15201 | -0.036 | 0.14 | NO |
| 47 | HDAC2 | HDAC2 | HDAC2 | 15998 | -0.047 | 0.11 | NO |
| 48 | MAP2K1 | MAP2K1 | MAP2K1 | 16014 | -0.047 | 0.12 | NO |
Figure S93. Get High-res Image This plot shows mRNAseq_cNMF expression data heatmap (on the left) a RunningEnrichmentScore(RES) plot (on the top right) and a Signal2Noise(S2N) plot (on the bottom right) of genes in the pathway: KEGG GLYCEROPHOSPHOLIPID METABOLISM.
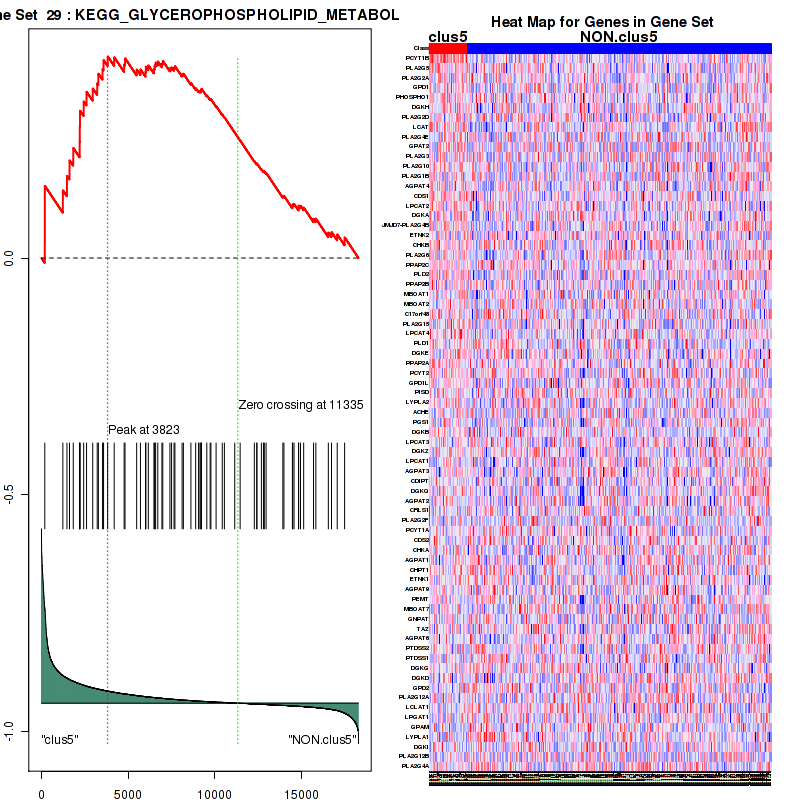
Figure S94. Get High-res Image For the top 5 core enriched genes in the pathway: KEGG GLYCEROPHOSPHOLIPID METABOLISM, this volcano plot shows how much they are up/down-regulated and significant. The significance was calculated by empirical bayesian fit

Table S48. Get Full Table This table shows a Running Enrichment Score (RES) of each gene in this pathway, that is, the enrichment score at this point in the ranked list of genes. All genes are ranked by Signal-to-Noise (S2N), a measure of similarity as default and are used to obtain ES matrix of all genes. In this way, GSEA tool uses expression pattern of not only overlapped genes but also not-overlapped genes to produce ES matrix.
| Rank | GENE | SYMBOL | DESC | LIST.LOC | S2N | RES | CORE_ENRICHMENT |
|---|---|---|---|---|---|---|---|
| 1 | NGFR | NGFR | NGFR | 332 | 0.62 | 0.046 | YES |
| 2 | TP73 | TP73 | TP73 | 345 | 0.59 | 0.11 | YES |
| 3 | MAPK10 | MAPK10 | MAPK10 | 396 | 0.54 | 0.16 | YES |
| 4 | NTRK3 | NTRK3 | NTRK3 | 436 | 0.5 | 0.21 | YES |
| 5 | NTF4 | NTF4 | NTF4 | 698 | 0.38 | 0.24 | YES |
| 6 | NTF3 | NTF3 | NTF3 | 735 | 0.37 | 0.27 | YES |
| 7 | NTRK2 | NTRK2 | NTRK2 | 761 | 0.36 | 0.31 | YES |
| 8 | SHC4 | SHC4 | SHC4 | 812 | 0.35 | 0.34 | YES |
| 9 | IRS4 | IRS4 | IRS4 | 1234 | 0.28 | 0.35 | YES |
| 10 | CAMK4 | CAMK4 | CAMK4 | 1614 | 0.24 | 0.35 | YES |
| 11 | NTRK1 | NTRK1 | NTRK1 | 1774 | 0.22 | 0.36 | YES |
| 12 | PIK3CG | PIK3CG | PIK3CG | 2409 | 0.18 | 0.35 | YES |
| 13 | MAPK11 | MAPK11 | MAPK11 | 2438 | 0.18 | 0.36 | YES |
| 14 | SHC3 | SHC3 | SHC3 | 2552 | 0.17 | 0.38 | YES |
| 15 | CAMK2A | CAMK2A | CAMK2A | 2700 | 0.16 | 0.39 | YES |
| 16 | RPS6KA5 | RPS6KA5 | RPS6KA5 | 2747 | 0.16 | 0.4 | YES |
| 17 | BCL2 | BCL2 | BCL2 | 2756 | 0.16 | 0.42 | YES |
| 18 | PLCG2 | PLCG2 | PLCG2 | 2805 | 0.16 | 0.43 | YES |
| 19 | PIK3R5 | PIK3R5 | PIK3R5 | 2835 | 0.16 | 0.44 | YES |
| 20 | SHC2 | SHC2 | SHC2 | 3236 | 0.14 | 0.44 | NO |
| 21 | IRAK3 | IRAK3 | IRAK3 | 3481 | 0.13 | 0.44 | NO |
| 22 | PIK3CD | PIK3CD | PIK3CD | 4010 | 0.11 | 0.42 | NO |
| 23 | CALML6 | CALML6 | CALML6 | 4276 | 0.11 | 0.42 | NO |
| 24 | PIK3R1 | PIK3R1 | PIK3R1 | 4307 | 0.1 | 0.43 | NO |
| 25 | PIK3R3 | PIK3R3 | PIK3R3 | 4996 | 0.087 | 0.4 | NO |
| 26 | MAP3K5 | MAP3K5 | MAP3K5 | 5001 | 0.087 | 0.41 | NO |
| 27 | MAP3K3 | MAP3K3 | MAP3K3 | 5057 | 0.086 | 0.41 | NO |
| 28 | SH2B3 | SH2B3 | SH2B3 | 5088 | 0.085 | 0.42 | NO |
| 29 | JUN | JUN | JUN | 5243 | 0.082 | 0.42 | NO |
| 30 | SH2B1 | SH2B1 | SH2B1 | 5271 | 0.081 | 0.43 | NO |
| 31 | FASLG | FASLG | FASLG | 5468 | 0.076 | 0.42 | NO |
| 32 | ARHGDIB | ARHGDIB | ARHGDIB | 5894 | 0.067 | 0.41 | NO |
| 33 | RPS6KA6 | RPS6KA6 | RPS6KA6 | 6023 | 0.064 | 0.41 | NO |
| 34 | NFKBIE | NFKBIE | NFKBIE | 6137 | 0.063 | 0.41 | NO |
| 35 | FOXO3 | FOXO3 | FOXO3 | 6434 | 0.057 | 0.4 | NO |
| 36 | CALML3 | CALML3 | CALML3 | 6460 | 0.057 | 0.4 | NO |
| 37 | CALM1 | CALM1 | CALM1 | 6471 | 0.056 | 0.41 | NO |
| 38 | MAP3K1 | MAP3K1 | MAP3K1 | 6482 | 0.056 | 0.41 | NO |
| 39 | CALML5 | CALML5 | CALML5 | 6822 | 0.051 | 0.4 | NO |
| 40 | GAB1 | GAB1 | GAB1 | 6891 | 0.049 | 0.4 | NO |
| 41 | RAPGEF1 | RAPGEF1 | RAPGEF1 | 6944 | 0.049 | 0.4 | NO |
| 42 | BAD | BAD | BAD | 7126 | 0.046 | 0.4 | NO |
| 43 | MAPK12 | MAPK12 | MAPK12 | 7180 | 0.045 | 0.4 | NO |
| 44 | CAMK2D | CAMK2D | CAMK2D | 7187 | 0.045 | 0.4 | NO |
| 45 | RPS6KA1 | RPS6KA1 | RPS6KA1 | 7201 | 0.044 | 0.41 | NO |
| 46 | IRS1 | IRS1 | IRS1 | 7341 | 0.042 | 0.4 | NO |
| 47 | NFKB1 | NFKB1 | NFKB1 | 7484 | 0.04 | 0.4 | NO |
| 48 | IKBKB | IKBKB | IKBKB | 7754 | 0.036 | 0.39 | NO |
| 49 | PLCG1 | PLCG1 | PLCG1 | 7836 | 0.035 | 0.39 | NO |
| 50 | SORT1 | SORT1 | SORT1 | 7877 | 0.035 | 0.39 | NO |
| 51 | AKT3 | AKT3 | AKT3 | 8092 | 0.032 | 0.38 | NO |
| 52 | CSK | CSK | CSK | 8142 | 0.031 | 0.38 | NO |
| 53 | TRAF6 | TRAF6 | TRAF6 | 8151 | 0.031 | 0.38 | NO |
| 54 | MAP2K5 | MAP2K5 | MAP2K5 | 8203 | 0.031 | 0.38 | NO |
| 55 | IRAK4 | IRAK4 | IRAK4 | 8234 | 0.03 | 0.39 | NO |
| 56 | BAX | BAX | BAX | 8242 | 0.03 | 0.39 | NO |
| 57 | BDNF | BDNF | BDNF | 8418 | 0.028 | 0.38 | NO |
| 58 | YWHAH | YWHAH | YWHAH | 8484 | 0.027 | 0.38 | NO |
| 59 | RPS6KA4 | RPS6KA4 | RPS6KA4 | 8731 | 0.024 | 0.37 | NO |
| 60 | MAP2K7 | MAP2K7 | MAP2K7 | 8788 | 0.024 | 0.37 | NO |
| 61 | RPS6KA2 | RPS6KA2 | RPS6KA2 | 8846 | 0.023 | 0.37 | NO |
| 62 | MAPK7 | MAPK7 | MAPK7 | 8964 | 0.022 | 0.36 | NO |
| 63 | PRKCD | PRKCD | PRKCD | 9014 | 0.021 | 0.36 | NO |
| 64 | TP53 | TP53 | TP53 | 9046 | 0.021 | 0.36 | NO |
| 65 | RAP1A | RAP1A | RAP1A | 9107 | 0.02 | 0.36 | NO |
| 66 | RPS6KA3 | RPS6KA3 | RPS6KA3 | 9233 | 0.019 | 0.36 | NO |
| 67 | PIK3R2 | PIK3R2 | PIK3R2 | 9252 | 0.019 | 0.36 | NO |
| 68 | IRAK2 | IRAK2 | IRAK2 | 9323 | 0.018 | 0.36 | NO |
| 69 | SH2B2 | SH2B2 | SH2B2 | 9333 | 0.018 | 0.36 | NO |
| 70 | SOS2 | SOS2 | SOS2 | 9741 | 0.014 | 0.34 | NO |
| 71 | MAPK3 | MAPK3 | MAPK3 | 9791 | 0.013 | 0.34 | NO |
| 72 | KIDINS220 | KIDINS220 | KIDINS220 | 10032 | 0.011 | 0.32 | NO |
| 73 | CALM3 | CALM3 | CALM3 | 10422 | 0.0079 | 0.3 | NO |
| 74 | NGF | NGF | NGF | 10431 | 0.0078 | 0.3 | NO |
| 75 | ABL1 | ABL1 | ABL1 | 10598 | 0.0064 | 0.3 | NO |
| 76 | MAPK1 | MAPK1 | MAPK1 | 10665 | 0.0057 | 0.29 | NO |
| 77 | AKT2 | AKT2 | AKT2 | 10811 | 0.0044 | 0.29 | NO |
| 78 | CAMK2G | CAMK2G | CAMK2G | 10984 | 0.0029 | 0.28 | NO |
| 79 | ARHGDIA | ARHGDIA | ARHGDIA | 11055 | 0.0024 | 0.27 | NO |
| 80 | CDC42 | CDC42 | CDC42 | 11071 | 0.0022 | 0.27 | NO |
| 81 | YWHAB | YWHAB | YWHAB | 11090 | 0.002 | 0.27 | NO |
| 82 | MAP2K2 | MAP2K2 | MAP2K2 | 11159 | 0.0014 | 0.27 | NO |
| 83 | NGFRAP1 | NGFRAP1 | NGFRAP1 | 11176 | 0.0012 | 0.27 | NO |
| 84 | HRAS | HRAS | HRAS | 11188 | 0.0011 | 0.27 | NO |
| 85 | NFKBIB | NFKBIB | NFKBIB | 11231 | 0.00076 | 0.26 | NO |
| 86 | PIK3CA | PIK3CA | PIK3CA | 11272 | 0.00046 | 0.26 | NO |
| 87 | MAPKAPK2 | MAPKAPK2 | MAPKAPK2 | 11273 | 0.00046 | 0.26 | NO |
| 88 | MAGED1 | MAGED1 | MAGED1 | 11279 | 0.00043 | 0.26 | NO |
| 89 | GRB2 | GRB2 | GRB2 | 11536 | -0.0017 | 0.25 | NO |
| 90 | CALM2 | CALM2 | CALM2 | 11546 | -0.0018 | 0.25 | NO |
| 91 | AKT1 | AKT1 | AKT1 | 11648 | -0.0027 | 0.24 | NO |
| 92 | MAPK14 | MAPK14 | MAPK14 | 11777 | -0.0038 | 0.24 | NO |
| 93 | RHOA | RHOA | RHOA | 11860 | -0.0044 | 0.23 | NO |
| 94 | CRKL | CRKL | CRKL | 11864 | -0.0044 | 0.23 | NO |
| 95 | NFKBIA | NFKBIA | NFKBIA | 12119 | -0.0066 | 0.22 | NO |
| 96 | RAC1 | RAC1 | RAC1 | 12142 | -0.0068 | 0.22 | NO |
| 97 | RAP1B | RAP1B | RAP1B | 12191 | -0.0073 | 0.22 | NO |
| 98 | CAMK2B | CAMK2B | CAMK2B | 12236 | -0.0076 | 0.22 | NO |
| 99 | SOS1 | SOS1 | SOS1 | 12264 | -0.0079 | 0.21 | NO |
| 100 | RELA | RELA | RELA | 12536 | -0.01 | 0.2 | NO |
| 101 | RAF1 | RAF1 | RAF1 | 12900 | -0.013 | 0.18 | NO |
| 102 | PIK3CB | PIK3CB | PIK3CB | 13151 | -0.016 | 0.17 | NO |
| 103 | PSEN1 | PSEN1 | PSEN1 | 13321 | -0.017 | 0.16 | NO |
| 104 | CRK | CRK | CRK | 13423 | -0.018 | 0.16 | NO |
| 105 | YWHAE | YWHAE | YWHAE | 13824 | -0.021 | 0.14 | NO |
| 106 | GSK3B | GSK3B | GSK3B | 14067 | -0.024 | 0.13 | NO |
| 107 | ZNF274 | ZNF274 | ZNF274 | 14090 | -0.024 | 0.13 | NO |
| 108 | MAPK9 | MAPK9 | MAPK9 | 14301 | -0.026 | 0.12 | NO |
| 109 | PRDM4 | PRDM4 | PRDM4 | 14313 | -0.026 | 0.12 | NO |
| 110 | ATF4 | ATF4 | ATF4 | 14327 | -0.026 | 0.12 | NO |
| 111 | YWHAQ | YWHAQ | YWHAQ | 15302 | -0.037 | 0.074 | NO |
| 112 | SHC1 | SHC1 | SHC1 | 15471 | -0.039 | 0.069 | NO |
| 113 | FRS2 | FRS2 | FRS2 | 15485 | -0.039 | 0.073 | NO |
| 114 | YWHAG | YWHAG | YWHAG | 15915 | -0.046 | 0.054 | NO |
| 115 | MAP2K1 | MAP2K1 | MAP2K1 | 16014 | -0.047 | 0.053 | NO |
| 116 | PTPN11 | PTPN11 | PTPN11 | 16211 | -0.05 | 0.048 | NO |
| 117 | KRAS | KRAS | KRAS | 16283 | -0.052 | 0.049 | NO |
| 118 | IRAK1 | IRAK1 | IRAK1 | 16311 | -0.053 | 0.053 | NO |
| 119 | YWHAZ | YWHAZ | YWHAZ | 16329 | -0.053 | 0.058 | NO |
| 120 | NRAS | NRAS | NRAS | 16504 | -0.057 | 0.054 | NO |
| 121 | MAPK13 | MAPK13 | MAPK13 | 16507 | -0.057 | 0.06 | NO |
| 122 | RIPK2 | RIPK2 | RIPK2 | 16511 | -0.057 | 0.066 | NO |
| 123 | MAPK8 | MAPK8 | MAPK8 | 16773 | -0.064 | 0.058 | NO |
| 124 | PDK1 | PDK1 | PDK1 | 16867 | -0.068 | 0.06 | NO |
| 125 | BRAF | BRAF | BRAF | 17135 | -0.076 | 0.053 | NO |
| 126 | IRS2 | IRS2 | IRS2 | 17527 | -0.1 | 0.042 | NO |
Figure S95. Get High-res Image This plot shows mRNAseq_cNMF expression data heatmap (on the left) a RunningEnrichmentScore(RES) plot (on the top right) and a Signal2Noise(S2N) plot (on the bottom right) of genes in the pathway: KEGG LINOLEIC ACID METABOLISM.
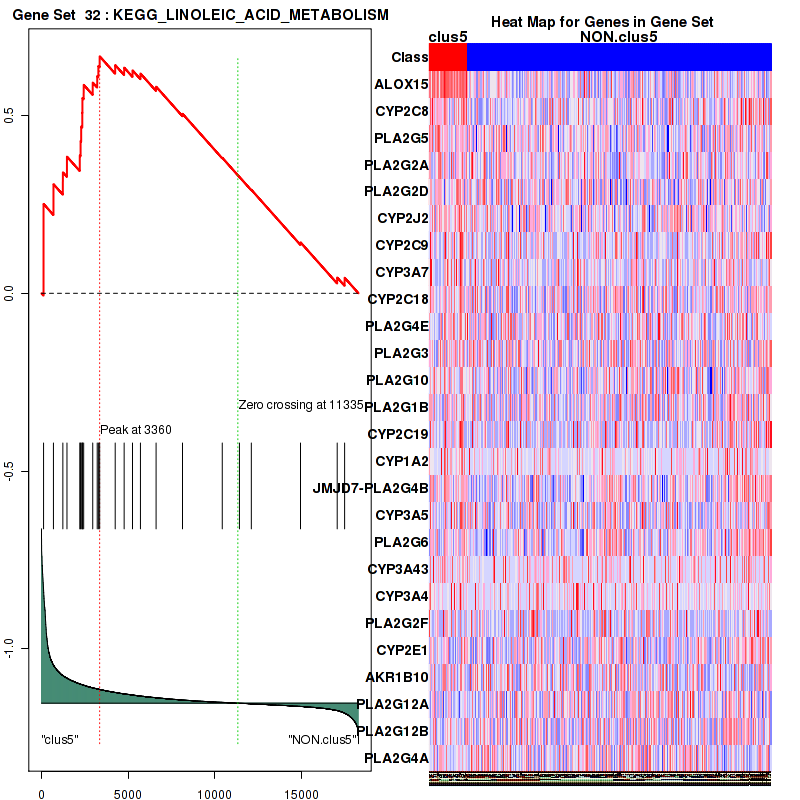
Figure S96. Get High-res Image For the top 5 core enriched genes in the pathway: KEGG LINOLEIC ACID METABOLISM, this volcano plot shows how much they are up/down-regulated and significant. The significance was calculated by empirical bayesian fit
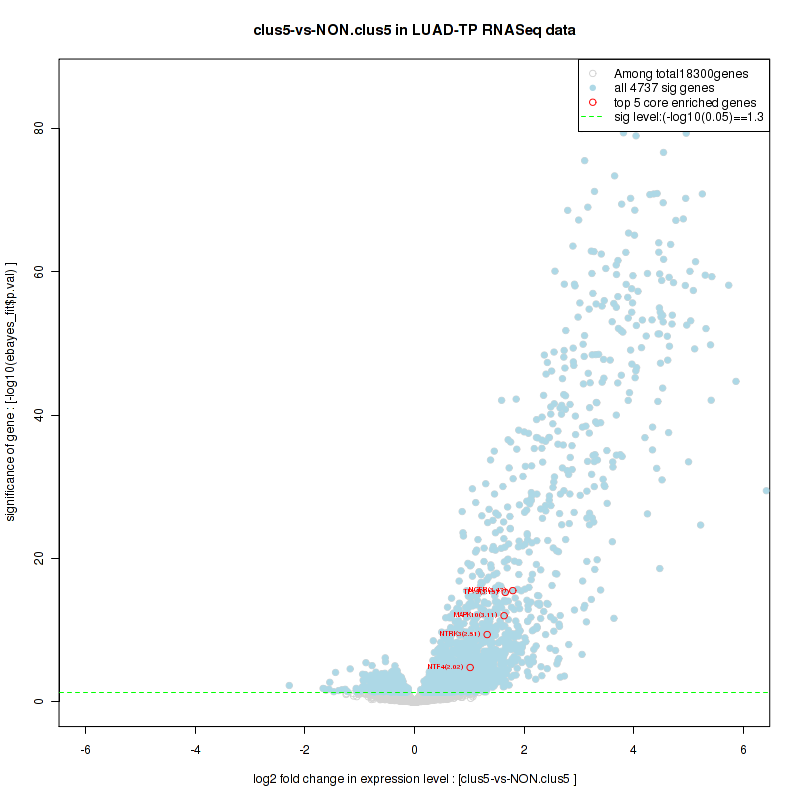
Table S49. Get Full Table This table shows a Running Enrichment Score (RES) of each gene in this pathway, that is, the enrichment score at this point in the ranked list of genes. All genes are ranked by Signal-to-Noise (S2N), a measure of similarity as default and are used to obtain ES matrix of all genes. In this way, GSEA tool uses expression pattern of not only overlapped genes but also not-overlapped genes to produce ES matrix.
| Rank | GENE | SYMBOL | DESC | LIST.LOC | S2N | RES | CORE_ENRICHMENT |
|---|---|---|---|---|---|---|---|
| 1 | CLDN16 | CLDN16 | CLDN16 | 242 | 0.8 | 0.063 | YES |
| 2 | CLDN8 | CLDN8 | CLDN8 | 400 | 0.53 | 0.1 | YES |
| 3 | ACTN2 | ACTN2 | ACTN2 | 704 | 0.37 | 0.12 | YES |
| 4 | CLDN9 | CLDN9 | CLDN9 | 1147 | 0.29 | 0.13 | YES |
| 5 | VAV3 | VAV3 | VAV3 | 1292 | 0.27 | 0.14 | YES |
| 6 | TXK | TXK | TXK | 1554 | 0.24 | 0.15 | YES |
| 7 | PRKCB | PRKCB | PRKCB | 1559 | 0.24 | 0.18 | YES |
| 8 | JAM2 | JAM2 | JAM2 | 1580 | 0.24 | 0.2 | YES |
| 9 | CLDN18 | CLDN18 | CLDN18 | 1601 | 0.24 | 0.22 | YES |
| 10 | ITK | ITK | ITK | 1671 | 0.23 | 0.24 | YES |
| 11 | CLDN10 | CLDN10 | CLDN10 | 2044 | 0.2 | 0.23 | YES |
| 12 | MYL2 | MYL2 | MYL2 | 2239 | 0.19 | 0.24 | YES |
| 13 | CLDN1 | CLDN1 | CLDN1 | 2332 | 0.18 | 0.25 | YES |
| 14 | PIK3CG | PIK3CG | PIK3CG | 2409 | 0.18 | 0.27 | YES |
| 15 | CLDN19 | CLDN19 | CLDN19 | 2420 | 0.18 | 0.28 | YES |
| 16 | MAPK11 | MAPK11 | MAPK11 | 2438 | 0.18 | 0.3 | YES |
| 17 | NOX1 | NOX1 | NOX1 | 2501 | 0.18 | 0.31 | YES |
| 18 | CXCL12 | CXCL12 | CXCL12 | 2581 | 0.17 | 0.32 | YES |
| 19 | CLDN2 | CLDN2 | CLDN2 | 2658 | 0.17 | 0.34 | YES |
| 20 | CTNNA2 | CTNNA2 | CTNNA2 | 2680 | 0.16 | 0.35 | YES |
| 21 | CLDN5 | CLDN5 | CLDN5 | 2750 | 0.16 | 0.36 | YES |
| 22 | PLCG2 | PLCG2 | PLCG2 | 2805 | 0.16 | 0.37 | YES |
| 23 | PIK3R5 | PIK3R5 | PIK3R5 | 2835 | 0.16 | 0.39 | YES |
| 24 | ITGAL | ITGAL | ITGAL | 2954 | 0.15 | 0.4 | YES |
| 25 | CLDN11 | CLDN11 | CLDN11 | 2969 | 0.15 | 0.41 | YES |
| 26 | NCF1 | NCF1 | NCF1 | 3006 | 0.15 | 0.42 | YES |
| 27 | NCF4 | NCF4 | NCF4 | 3059 | 0.15 | 0.43 | YES |
| 28 | VAV1 | VAV1 | VAV1 | 3216 | 0.14 | 0.44 | YES |
| 29 | CLDN20 | CLDN20 | CLDN20 | 3312 | 0.14 | 0.44 | YES |
| 30 | RHOH | RHOH | RHOH | 3396 | 0.14 | 0.45 | YES |
| 31 | PTK2B | PTK2B | PTK2B | 3669 | 0.12 | 0.45 | YES |
| 32 | MYL9 | MYL9 | MYL9 | 3869 | 0.12 | 0.45 | YES |
| 33 | RAPGEF3 | RAPGEF3 | RAPGEF3 | 3874 | 0.12 | 0.46 | YES |
| 34 | ITGAM | ITGAM | ITGAM | 3928 | 0.12 | 0.47 | YES |
| 35 | ITGA4 | ITGA4 | ITGA4 | 3949 | 0.12 | 0.48 | YES |
| 36 | JAM3 | JAM3 | JAM3 | 3959 | 0.12 | 0.49 | YES |
| 37 | PIK3CD | PIK3CD | PIK3CD | 4010 | 0.11 | 0.5 | YES |
| 38 | MMP2 | MMP2 | MMP2 | 4089 | 0.11 | 0.5 | YES |
| 39 | VCAM1 | VCAM1 | VCAM1 | 4152 | 0.11 | 0.51 | YES |
| 40 | MMP9 | MMP9 | MMP9 | 4233 | 0.11 | 0.52 | YES |
| 41 | CXCR4 | CXCR4 | CXCR4 | 4284 | 0.11 | 0.52 | YES |
| 42 | PIK3R1 | PIK3R1 | PIK3R1 | 4307 | 0.1 | 0.53 | YES |
| 43 | NCF2 | NCF2 | NCF2 | 4381 | 0.1 | 0.54 | YES |
| 44 | RASSF5 | RASSF5 | RASSF5 | 4706 | 0.094 | 0.53 | YES |
| 45 | ITGB2 | ITGB2 | ITGB2 | 4768 | 0.093 | 0.54 | YES |
| 46 | CYBB | CYBB | CYBB | 4865 | 0.09 | 0.54 | YES |
| 47 | RAPGEF4 | RAPGEF4 | RAPGEF4 | 4879 | 0.09 | 0.55 | YES |
| 48 | PIK3R3 | PIK3R3 | PIK3R3 | 4996 | 0.087 | 0.55 | YES |
| 49 | RAC2 | RAC2 | RAC2 | 5129 | 0.084 | 0.55 | YES |
| 50 | ESAM | ESAM | ESAM | 5177 | 0.083 | 0.55 | YES |
| 51 | MYLPF | MYLPF | MYLPF | 5226 | 0.082 | 0.56 | YES |
| 52 | CDH5 | CDH5 | CDH5 | 5401 | 0.078 | 0.56 | YES |
| 53 | PECAM1 | PECAM1 | PECAM1 | 5545 | 0.074 | 0.56 | YES |
| 54 | CLDN15 | CLDN15 | CLDN15 | 5585 | 0.073 | 0.56 | YES |
| 55 | MYL5 | MYL5 | MYL5 | 5720 | 0.071 | 0.56 | YES |
| 56 | PRKCA | PRKCA | PRKCA | 5769 | 0.07 | 0.56 | YES |
| 57 | ICAM1 | ICAM1 | ICAM1 | 6330 | 0.059 | 0.54 | NO |
| 58 | EZR | EZR | EZR | 6724 | 0.052 | 0.52 | NO |
| 59 | CLDN23 | CLDN23 | CLDN23 | 6825 | 0.051 | 0.52 | NO |
| 60 | CLDN3 | CLDN3 | CLDN3 | 7003 | 0.048 | 0.52 | NO |
| 61 | MAPK12 | MAPK12 | MAPK12 | 7180 | 0.045 | 0.51 | NO |
| 62 | SIPA1 | SIPA1 | SIPA1 | 7403 | 0.041 | 0.5 | NO |
| 63 | GNAI2 | GNAI2 | GNAI2 | 7543 | 0.039 | 0.5 | NO |
| 64 | MLLT4 | MLLT4 | MLLT4 | 7583 | 0.039 | 0.5 | NO |
| 65 | BCAR1 | BCAR1 | BCAR1 | 7597 | 0.038 | 0.5 | NO |
| 66 | CLDN4 | CLDN4 | CLDN4 | 7624 | 0.038 | 0.5 | NO |
| 67 | CYBA | CYBA | CYBA | 7756 | 0.036 | 0.5 | NO |
| 68 | PLCG1 | PLCG1 | PLCG1 | 7836 | 0.035 | 0.5 | NO |
| 69 | PRKCG | PRKCG | PRKCG | 7902 | 0.034 | 0.5 | NO |
| 70 | ACTN1 | ACTN1 | ACTN1 | 8323 | 0.029 | 0.48 | NO |
| 71 | PXN | PXN | PXN | 8326 | 0.029 | 0.48 | NO |
| 72 | VCL | VCL | VCL | 8769 | 0.024 | 0.46 | NO |
| 73 | VASP | VASP | VASP | 8777 | 0.024 | 0.46 | NO |
| 74 | RAP1A | RAP1A | RAP1A | 9107 | 0.02 | 0.45 | NO |
| 75 | PIK3R2 | PIK3R2 | PIK3R2 | 9252 | 0.019 | 0.44 | NO |
| 76 | THY1 | THY1 | THY1 | 9391 | 0.017 | 0.43 | NO |
| 77 | ACTN4 | ACTN4 | ACTN4 | 9466 | 0.016 | 0.43 | NO |
| 78 | CD99 | CD99 | CD99 | 9718 | 0.014 | 0.42 | NO |
| 79 | CTNNA1 | CTNNA1 | CTNNA1 | 9850 | 0.013 | 0.41 | NO |
| 80 | MSN | MSN | MSN | 9914 | 0.012 | 0.41 | NO |
| 81 | ACTB | ACTB | ACTB | 10034 | 0.011 | 0.4 | NO |
| 82 | MYL12A | MYL12A | MYL12A | 10566 | 0.0066 | 0.38 | NO |
| 83 | F11R | F11R | F11R | 10962 | 0.0032 | 0.36 | NO |
| 84 | MYL12B | MYL12B | MYL12B | 10974 | 0.0031 | 0.36 | NO |
| 85 | CTNNB1 | CTNNB1 | CTNNB1 | 10977 | 0.003 | 0.36 | NO |
| 86 | CDC42 | CDC42 | CDC42 | 11071 | 0.0022 | 0.35 | NO |
| 87 | GNAI1 | GNAI1 | GNAI1 | 11155 | 0.0014 | 0.35 | NO |
| 88 | PIK3CA | PIK3CA | PIK3CA | 11272 | 0.00046 | 0.34 | NO |
| 89 | ROCK1 | ROCK1 | ROCK1 | 11418 | -0.00072 | 0.33 | NO |
| 90 | MAPK14 | MAPK14 | MAPK14 | 11777 | -0.0038 | 0.31 | NO |
| 91 | RHOA | RHOA | RHOA | 11860 | -0.0044 | 0.31 | NO |
| 92 | ACTG1 | ACTG1 | ACTG1 | 11966 | -0.0053 | 0.3 | NO |
| 93 | GNAI3 | GNAI3 | GNAI3 | 12123 | -0.0067 | 0.3 | NO |
| 94 | RAC1 | RAC1 | RAC1 | 12142 | -0.0068 | 0.3 | NO |
| 95 | RAP1B | RAP1B | RAP1B | 12191 | -0.0073 | 0.29 | NO |
| 96 | CTNND1 | CTNND1 | CTNND1 | 12352 | -0.0086 | 0.28 | NO |
| 97 | OCLN | OCLN | OCLN | 12455 | -0.0096 | 0.28 | NO |
| 98 | VAV2 | VAV2 | VAV2 | 12726 | -0.012 | 0.27 | NO |
| 99 | CTNNA3 | CTNNA3 | CTNNA3 | 13112 | -0.015 | 0.25 | NO |
| 100 | PIK3CB | PIK3CB | PIK3CB | 13151 | -0.016 | 0.25 | NO |
| 101 | ROCK2 | ROCK2 | ROCK2 | 13196 | -0.016 | 0.24 | NO |
| 102 | CLDN7 | CLDN7 | CLDN7 | 13856 | -0.022 | 0.21 | NO |
| 103 | PTK2 | PTK2 | PTK2 | 14778 | -0.031 | 0.16 | NO |
| 104 | CLDN6 | CLDN6 | CLDN6 | 15294 | -0.037 | 0.14 | NO |
| 105 | ACTN3 | ACTN3 | ACTN3 | 15311 | -0.037 | 0.14 | NO |
| 106 | ITGB1 | ITGB1 | ITGB1 | 15341 | -0.038 | 0.14 | NO |
| 107 | ARHGAP5 | ARHGAP5 | ARHGAP5 | 15345 | -0.038 | 0.15 | NO |
| 108 | PTPN11 | PTPN11 | PTPN11 | 16211 | -0.05 | 0.1 | NO |
| 109 | MAPK13 | MAPK13 | MAPK13 | 16507 | -0.057 | 0.093 | NO |
| 110 | CLDN14 | CLDN14 | CLDN14 | 16687 | -0.062 | 0.089 | NO |
Figure S97. Get High-res Image This plot shows mRNAseq_cNMF expression data heatmap (on the left) a RunningEnrichmentScore(RES) plot (on the top right) and a Signal2Noise(S2N) plot (on the bottom right) of genes in the pathway: KEGG SPHINGOLIPID METABOLISM.
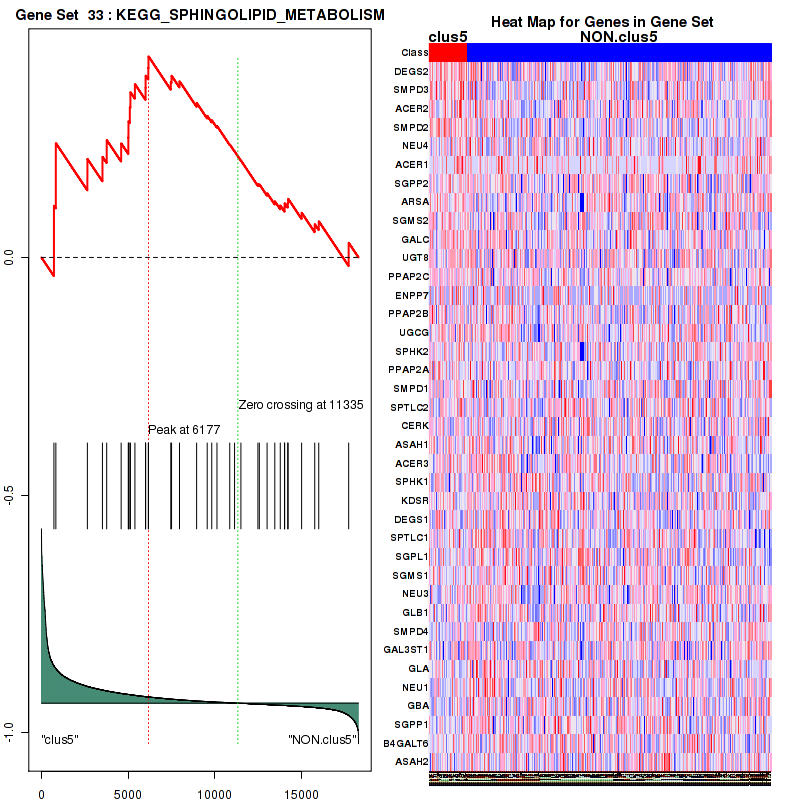
Figure S98. Get High-res Image For the top 5 core enriched genes in the pathway: KEGG SPHINGOLIPID METABOLISM, this volcano plot shows how much they are up/down-regulated and significant. The significance was calculated by empirical bayesian fit
Table S50. Get Full Table This table shows a Running Enrichment Score (RES) of each gene in this pathway, that is, the enrichment score at this point in the ranked list of genes. All genes are ranked by Signal-to-Noise (S2N), a measure of similarity as default and are used to obtain ES matrix of all genes. In this way, GSEA tool uses expression pattern of not only overlapped genes but also not-overlapped genes to produce ES matrix.
| Rank | GENE | SYMBOL | DESC | LIST.LOC | S2N | RES | CORE_ENRICHMENT |
|---|---|---|---|---|---|---|---|
| 1 | ERBB4 | ERBB4 | ERBB4 | 373 | 0.56 | 0.072 | YES |
| 2 | ADCY2 | ADCY2 | ADCY2 | 401 | 0.53 | 0.16 | YES |
| 3 | NRG2 | NRG2 | NRG2 | 489 | 0.46 | 0.23 | YES |
| 4 | NRG4 | NRG4 | NRG4 | 1495 | 0.25 | 0.22 | YES |
| 5 | ADCY5 | ADCY5 | ADCY5 | 1518 | 0.24 | 0.26 | YES |
| 6 | BTC | BTC | BTC | 1556 | 0.24 | 0.3 | YES |
| 7 | CAMK4 | CAMK4 | CAMK4 | 1614 | 0.24 | 0.33 | YES |
| 8 | NRG1 | NRG1 | NRG1 | 1641 | 0.23 | 0.37 | YES |
| 9 | MATK | MATK | MATK | 1746 | 0.22 | 0.4 | YES |
| 10 | PDE1B | PDE1B | PDE1B | 2126 | 0.2 | 0.41 | YES |
| 11 | ADCY4 | ADCY4 | ADCY4 | 2271 | 0.19 | 0.44 | YES |
| 12 | PRKCE | PRKCE | PRKCE | 3760 | 0.12 | 0.38 | NO |
| 13 | PIK3R1 | PIK3R1 | PIK3R1 | 4307 | 0.1 | 0.36 | NO |
| 14 | PDE1A | PDE1A | PDE1A | 4482 | 0.1 | 0.37 | NO |
| 15 | ADCY9 | ADCY9 | ADCY9 | 4657 | 0.095 | 0.38 | NO |
| 16 | FOXO1 | FOXO1 | FOXO1 | 5112 | 0.085 | 0.36 | NO |
| 17 | PRKAR2B | PRKAR2B | PRKAR2B | 5123 | 0.084 | 0.38 | NO |
| 18 | CDKN1A | CDKN1A | CDKN1A | 5422 | 0.077 | 0.38 | NO |
| 19 | PRKCA | PRKCA | PRKCA | 5769 | 0.07 | 0.37 | NO |
| 20 | FOXO3 | FOXO3 | FOXO3 | 6434 | 0.057 | 0.34 | NO |
| 21 | CALM1 | CALM1 | CALM1 | 6471 | 0.056 | 0.35 | NO |
| 22 | FYN | FYN | FYN | 6857 | 0.05 | 0.34 | NO |
| 23 | GAB1 | GAB1 | GAB1 | 6891 | 0.049 | 0.34 | NO |
| 24 | HBEGF | HBEGF | HBEGF | 6923 | 0.049 | 0.35 | NO |
| 25 | BAD | BAD | BAD | 7126 | 0.046 | 0.34 | NO |
| 26 | NR4A1 | NR4A1 | NR4A1 | 7163 | 0.045 | 0.35 | NO |
| 27 | PRKACB | PRKACB | PRKACB | 7439 | 0.041 | 0.34 | NO |
| 28 | ITPR2 | ITPR2 | ITPR2 | 7589 | 0.038 | 0.34 | NO |
| 29 | PLCG1 | PLCG1 | PLCG1 | 7836 | 0.035 | 0.33 | NO |
| 30 | PRKCG | PRKCG | PRKCG | 7902 | 0.034 | 0.34 | NO |
| 31 | AKT3 | AKT3 | AKT3 | 8092 | 0.032 | 0.33 | NO |
| 32 | FOXO4 | FOXO4 | FOXO4 | 8182 | 0.031 | 0.33 | NO |
| 33 | PHLPP1 | PHLPP1 | PHLPP1 | 8221 | 0.03 | 0.33 | NO |
| 34 | EREG | EREG | EREG | 8464 | 0.027 | 0.32 | NO |
| 35 | PDPK1 | PDPK1 | PDPK1 | 8581 | 0.026 | 0.32 | NO |
| 36 | PRKAR1B | PRKAR1B | PRKAR1B | 8663 | 0.025 | 0.32 | NO |
| 37 | ERBB2 | ERBB2 | ERBB2 | 8828 | 0.023 | 0.32 | NO |
| 38 | PRKACA | PRKACA | PRKACA | 8885 | 0.023 | 0.32 | NO |
| 39 | EGFR | EGFR | EGFR | 9007 | 0.021 | 0.32 | NO |
| 40 | PRKCD | PRKCD | PRKCD | 9014 | 0.021 | 0.32 | NO |
| 41 | PTEN | PTEN | PTEN | 9153 | 0.02 | 0.31 | NO |
| 42 | ADCY6 | ADCY6 | ADCY6 | 9229 | 0.019 | 0.31 | NO |
| 43 | PRKAR1A | PRKAR1A | PRKAR1A | 9406 | 0.017 | 0.31 | NO |
| 44 | MAPK3 | MAPK3 | MAPK3 | 9791 | 0.013 | 0.29 | NO |
| 45 | STUB1 | STUB1 | STUB1 | 9795 | 0.013 | 0.29 | NO |
| 46 | CDKN1B | CDKN1B | CDKN1B | 9870 | 0.013 | 0.29 | NO |
| 47 | CASP9 | CASP9 | CASP9 | 9891 | 0.012 | 0.29 | NO |
| 48 | CDC37 | CDC37 | CDC37 | 10002 | 0.012 | 0.28 | NO |
| 49 | ITPR3 | ITPR3 | ITPR3 | 10159 | 0.01 | 0.28 | NO |
| 50 | CALM3 | CALM3 | CALM3 | 10422 | 0.0079 | 0.26 | NO |
| 51 | TSC2 | TSC2 | TSC2 | 10471 | 0.0075 | 0.26 | NO |
| 52 | MAPK1 | MAPK1 | MAPK1 | 10665 | 0.0057 | 0.25 | NO |
| 53 | UBA52 | UBA52 | UBA52 | 10806 | 0.0044 | 0.25 | NO |
| 54 | AKT2 | AKT2 | AKT2 | 10811 | 0.0044 | 0.25 | NO |
| 55 | CREB1 | CREB1 | CREB1 | 10961 | 0.0032 | 0.24 | NO |
| 56 | ADRBK1 | ADRBK1 | ADRBK1 | 10969 | 0.0031 | 0.24 | NO |
| 57 | YWHAB | YWHAB | YWHAB | 11090 | 0.002 | 0.23 | NO |
| 58 | MAP2K2 | MAP2K2 | MAP2K2 | 11159 | 0.0014 | 0.23 | NO |
| 59 | USP8 | USP8 | USP8 | 11161 | 0.0013 | 0.23 | NO |
| 60 | HRAS | HRAS | HRAS | 11188 | 0.0011 | 0.23 | NO |
| 61 | PIK3CA | PIK3CA | PIK3CA | 11272 | 0.00046 | 0.22 | NO |
| 62 | HSP90AA1 | HSP90AA1 | HSP90AA1 | 11409 | -0.00068 | 0.22 | NO |
| 63 | GRB2 | GRB2 | GRB2 | 11536 | -0.0017 | 0.21 | NO |
| 64 | CALM2 | CALM2 | CALM2 | 11546 | -0.0018 | 0.21 | NO |
| 65 | AKT1 | AKT1 | AKT1 | 11648 | -0.0027 | 0.2 | NO |
| 66 | ADCY8 | ADCY8 | ADCY8 | 11931 | -0.005 | 0.19 | NO |
| 67 | MTOR | MTOR | MTOR | 12043 | -0.006 | 0.18 | NO |
| 68 | SOS1 | SOS1 | SOS1 | 12264 | -0.0079 | 0.17 | NO |
| 69 | GRB7 | GRB7 | GRB7 | 12295 | -0.0081 | 0.17 | NO |
| 70 | AKT1S1 | AKT1S1 | AKT1S1 | 12311 | -0.0082 | 0.17 | NO |
| 71 | ADCY7 | ADCY7 | ADCY7 | 12387 | -0.0089 | 0.17 | NO |
| 72 | ADCY3 | ADCY3 | ADCY3 | 12394 | -0.009 | 0.17 | NO |
| 73 | PRKAR2A | PRKAR2A | PRKAR2A | 12490 | -0.0098 | 0.17 | NO |
| 74 | ERBB3 | ERBB3 | ERBB3 | 12550 | -0.01 | 0.17 | NO |
| 75 | CUL5 | CUL5 | CUL5 | 12672 | -0.011 | 0.16 | NO |
| 76 | RAF1 | RAF1 | RAF1 | 12900 | -0.013 | 0.15 | NO |
| 77 | MAPKAP1 | MAPKAP1 | MAPKAP1 | 12906 | -0.014 | 0.15 | NO |
| 78 | RPS27A | RPS27A | RPS27A | 12981 | -0.014 | 0.15 | NO |
| 79 | ADCY1 | ADCY1 | ADCY1 | 13032 | -0.015 | 0.15 | NO |
| 80 | SRC | SRC | SRC | 13054 | -0.015 | 0.15 | NO |
| 81 | RICTOR | RICTOR | RICTOR | 13248 | -0.016 | 0.15 | NO |
| 82 | MDM2 | MDM2 | MDM2 | 13355 | -0.017 | 0.14 | NO |
| 83 | GSK3A | GSK3A | GSK3A | 13362 | -0.017 | 0.14 | NO |
| 84 | RNF41 | RNF41 | RNF41 | 13624 | -0.02 | 0.13 | NO |
| 85 | MLST8 | MLST8 | MLST8 | 14221 | -0.025 | 0.11 | NO |
| 86 | THEM4 | THEM4 | THEM4 | 14423 | -0.027 | 0.099 | NO |
| 87 | RPS6KB2 | RPS6KB2 | RPS6KB2 | 14701 | -0.03 | 0.089 | NO |
| 88 | SHC1 | SHC1 | SHC1 | 15471 | -0.039 | 0.053 | NO |
| 89 | MAP2K1 | MAP2K1 | MAP2K1 | 16014 | -0.047 | 0.031 | NO |
| 90 | YES1 | YES1 | YES1 | 16080 | -0.048 | 0.036 | NO |
| 91 | CHUK | CHUK | CHUK | 16088 | -0.048 | 0.044 | NO |
| 92 | KRAS | KRAS | KRAS | 16283 | -0.052 | 0.042 | NO |
| 93 | NRAS | NRAS | NRAS | 16504 | -0.057 | 0.039 | NO |
| 94 | EGF | EGF | EGF | 17255 | -0.083 | 0.012 | NO |
| 95 | TRIB3 | TRIB3 | TRIB3 | 17685 | -0.12 | 0.0078 | NO |
| 96 | CDK1 | CDK1 | CDK1 | 17940 | -0.16 | 0.02 | NO |
Figure S99. Get High-res Image This plot shows mRNAseq_cNMF expression data heatmap (on the left) a RunningEnrichmentScore(RES) plot (on the top right) and a Signal2Noise(S2N) plot (on the bottom right) of genes in the pathway: KEGG RETINOL METABOLISM.
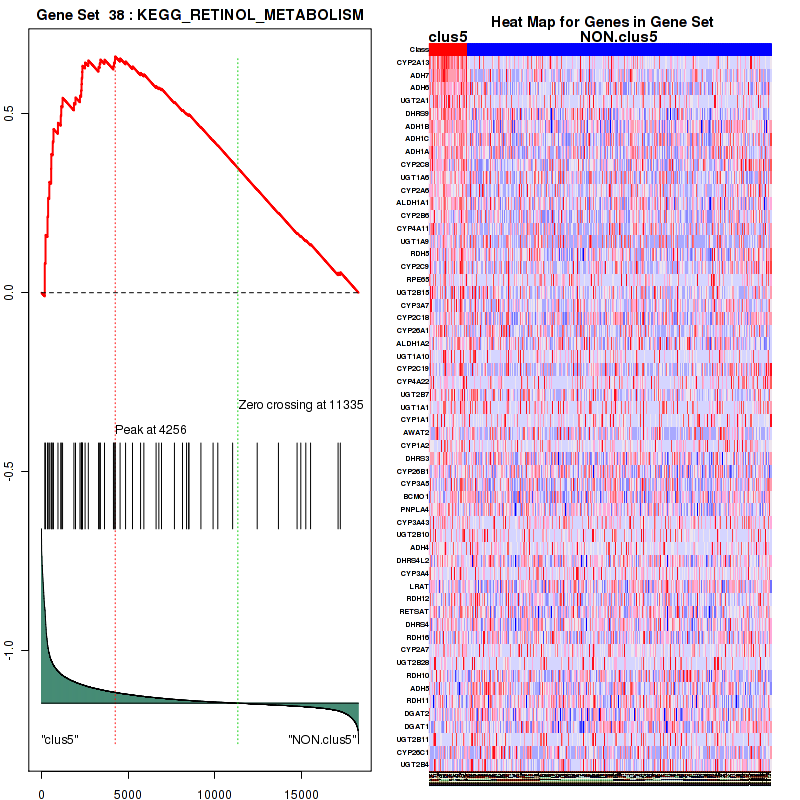
Figure S100. Get High-res Image For the top 5 core enriched genes in the pathway: KEGG RETINOL METABOLISM, this volcano plot shows how much they are up/down-regulated and significant. The significance was calculated by empirical bayesian fit

For the top enriched genes, if you want to check whether they are
-
up-regulated, please check the list of up-regulated genes
-
down-regulated, please check the list of down-regulated genes
For the top enriched genes, if you want to check whether they are
-
highly expressed genes, please check the list of high (top 30%) expressed genes
-
low expressed genes, please check the list of low (bottom 30%) expressed genes
An expression pattern of top(30%)/middle(30%)/low(30%) in this subtype against other subtypes is available in a heatmap
For the top enriched genes, if you want to check whether they are
-
significantly differently expressed genes by eBayes lm fit, please check the list of significant genes
-
Gene set database = c2.cp.v4.0.symbols.gmt
-
Expression data file = LUAD-TP.uncv2.mRNAseq_RSEM_normalized_log2.txt
-
Phenotype data file = LUAD-TP.mergedcluster.txt
For the Gene Set Enrichment Analysis (GSEA), Broad GSEA-P-R.1.0 version is used with class2: canonical pathways geneses from MSigDB. Further details about statistics are available inThe Broad GSEA website.
In addition to the links below, the full results of the analysis summarized in this report can also be downloaded programmatically using firehose_get, or interactively from either the Broad GDAC website or TCGA Data Coordination Center Portal.